The Chilean market for financial services is highly competitive. We compete with other private sector Chilean and non-Chilean banks, with Banco del Estado de Chile, the principal government-owned sector bank, with department stores and with larger supermarket chains that make consumer loans and sell other financial products to a large portion of the Chilean population. The lower to middle-income segments of the Chilean population and the small- and mid- sized corporate segments have become the target markets of several banks and competition in these segments may increase. In addition, there has been a trend towards consolidation in the Chilean banking industry in recent years, which has created larger and stronger banks with which we must now compete.There can be no assurance that this increased competition will not adversely affect our growth prospects, and therefore our operations. We also face competition from non-bank (such as department stores, insurance companies,cajas de compensaciónandcooperativas) and non-finance competitors (principally department stores, auto-lenders and larger supermarket chains) with respect to some of our credit products, such as credit cards, consumer loans and insurance brokerage. In addition, we face competition from non-bank finance competitors, such as leasing, factoring and automobile finance companies, with respect to credit products, and from mutual funds, pension funds and insurance companies with respect to savings products.
Non-traditional providers of banking services, such as internet based e-commerce providers, mobile telephone companies and internet search engines may offer and/or increase their offerings of financial products and services directly to customers. These non-traditional providers of banking services currently have an advantage over traditional providers because they are not subject to banking regulation. Several of these competitors may have long operating histories, large customer bases, strong brand recognition and significant financial, marketing and other resources. They may adopt more aggressive pricing and rates and devote more resources to technology, infrastructure and marketing.
New competitors may enter the market or existing competitors may adjust their services with unique product or service offerings or approaches to providing banking services. If we are unable to successfully compete with current and new competitors, or if we are unable to anticipate and adapt our offerings to changing banking industry trends, including technological changes, our business may be adversely affected. In addition, our failure to effectively anticipate or adapt to emerging technologies or changes in customer behavior, including among younger customers, could delay or prevent our access to new digital-based markets, which would in turn have an adverse effect on our competitive position and business. Furthermore, the widespread adoption of new technologies, including cryptocurrencies and payment systems, could require substantial expenditures to modify or adapt our existing products and services as we continue to grow our internet and mobile banking capabilities. Our customers may choose to conduct business or offer products in areas that may be considered speculative or risky. Such new technologies could negatively impact our investments in bank premises, equipment and personnel for our branch network.
The persistence or acceleration of this shift in demand towards internet and mobile banking may necessitate changes to our retail distribution strategy, which may include closing and/or selling certain branches and restructuring our remaining branches and work force. These actions could lead to losses on these assets and may lead to increased expenditures to renovate, reconfigure or close a number of our remaining branches or to otherwise reform our retail distribution channel. Furthermore, our failure to swiftly and effectively implement such changes to our distribution strategy could have an adverse effect our competitive position.
Increasing competition could also require that we increase the rates offered on deposits or lower the rates we charge on loans, which could also have a material adverse effect on us, including our profitability. It may also negatively affect our business results and prospects by, among other things, limiting our ability to increase our customer base and expand our operations and increasing competition for investment opportunities.
If our customer service levels were perceived by the market to be materially below those of our competitor financial institutions, we could lose existing and potential business. If we are not successful in retaining and strengthening customer relationships, we may lose market share, incur losses on some or all of our activities or fail to attract new deposits or retain existing deposits, which could have a material adverse effect on our operating results, financial condition and prospects.
Our ability to maintain our competitive position depends, in part, on the success of new products and services we offer our clients and our ability to continue offering products and services from third parties, and we may not be able to manage various risks we face as we expand our range of products and services that could have a material adverse effect on us.
The success of our operations and our profitability depends, in part, on the success of new products and services we offer our clients and our ability to continue offering products and services from third parties. However, we cannot guarantee that our new products and services will be responsive to client demands, or that they will be successful. In addition, our clients’ needs or desires may change over time, and such changes may render our products and services obsolete, outdated or unattractive and we may not be able to develop new products that meet our clients’ changing needs. Our success is also dependent on our ability to anticipate and leverage new and existing technologies that may have an impact on products and services in the banking industry. Technological changes may further intensify and complicate the competitive landscape and influence client behavior. If we cannot respond in a timely fashion to the changing needs of our clients, we may lose clients, which could in turn materially and adversely affect us.
As we expand the range of our products and services, some of which may be at an early stage of development in the markets of certain regions where we operate, we will be exposed to new and potentially increasingly complex risks and development expenses in those markets, with respect to which our experience and the experience of our partners may not be sufficient. Our employees and our risk management systems may not be sufficient to enable us to properly manage such risks. In addition, the cost of developing products that are not launched is likely to affect our results of operations. Any or all of these factors, individually or collectively, could have a material adverse effect on us.
Our strong position in the credit card market is in part due to our credit card co-branding agreement with Chile’s largest airline. This agreement was renewed in January 2019 for seven more years. Once this agreement expires, no assurance can be given that it will be renewed, which may materially and adversely affect our results of operations and financial condition in the credit card business.
The financial problems faced by our customers could adversely affect us.
Market turmoil and economic recession could materially and adversely affect the liquidity, credit ratings, businesses and/or financial conditions of our borrowers, which could in turn increase our non-performing loan ratios, impair our loan and other financial assets and result in decreased demand for borrowings in general. In addition, our customers may further significantly decrease their risk tolerance to non-deposit investments such as stocks, bonds and mutual funds, which would adversely affect our fee and commission income. We may also be adversely affected by the negative effects of the heightened regulatory environment on our customers due to the high costs associated with regulatory compliance and proceedings. Any of the conditions described above could have a material adverse effect on our business, financial condition and results of operations.
We may generate lower revenues from fee and commission based businesses.
The fees and commissions that we earn from the different banking and other financial services that we provide represent a significant source of our revenues. Our customers may significantly decrease their risk tolerance to non-deposit investments such as stocks, bonds and mutual funds for a number of reasons, including a market downturn, which would adversely affect us, including our fee and commission income.
Banco Santander Chile sold its asset management business in 2013 and signed a management service agreement for a 10 year-period with the acquirer of this business in which we sell asset management funds on their behalf. Therefore, even in the absence of a market downturn, below-market performance by the mutual funds of the firm we broker for may result in a reduction in revenue we receive from selling asset management funds and adversely affect our results of operations.
Market conditions have resulted, and could result, in material changes to the estimated fair values of our financial assets. Negative fair value adjustments could have a material adverse effect on our operating results, financial condition and prospects.
In the recent past, financial markets have been subject to significant stress resulting in steep falls in perceived or actual financial asset values, particularly due to volatility in global financial markets and the resulting widening of credit spreads.spreads, including as a result of the COVID-19 pandemic. We have material exposures to securities, loans and other investments that are recorded at fair value and are therefore exposed to potential negative fair value adjustments. Asset valuations in future periods, reflecting then-prevailing market conditions, may result in negative changes in the fair values of our financial assets and these may also translate into increased impairments. In addition, the value ultimately realized by us on disposal may be lower than the current fair value. Any of these factors could require us to record negative fair value adjustments, which may have a material adverse effect on our operating results, financial condition or prospects.
In addition, to the extent that fair values are determined using financial valuation models, such values may be inaccurate or subject to change, as the data used by such models may not be available or may become unavailable due to changes in market conditions, particularly for illiquid assets, and particularly in times of economic instability. In such circumstances, our valuation methodologies require us to make assumptions, judgmentsjudgements and estimates in order to establish fair value, and reliable assumptions are difficult to make and are inherently uncertain and valuation models are complex, making them inherently imperfect predictors of actual results. Any consequential impairments or write-downs could have a material adverse effect on our operating results, financial condition and prospects.
The credit quality of our loan portfolio may deteriorate and our loan loss reserves could be insufficient to cover our actual loan losses, which could have a material adverse effect on us.
Risks arising from changes in credit quality and the recoverability of loans and amounts due from counterparties are inherent in a wide range of our businesses. Non-performing or low credit quality loans have in the past negatively impacted our results of operations and could do so in the future. In particular, the amount of our reported non-performing loans may increase in the future as a result of growth in our total loan portfolio, including as a result of loan portfolios that we may acquire in the future (the credit quality of which may turn out to be worse than we had anticipated), or factors beyond our control, such as adverse changes in the credit quality of our borrowers and counterparties or a general deterioration in economic conditions in Chile or in global economic and political conditions. If we were unable to control the level of our non-performing or poor credit quality loans, this could have a material adverse effect on us.
As of December 31, 2018, our non-performing loans were Ch$631,649 million, and the ratio of our non-performing loans to total loans was 2.1%. As of December 31, 2018, our allowance for loan losses was Ch$882,450 million, and the ratio of our allowance for loan losses to total loans was 2.9 %. For additional information on our asset quality, see “Item 5. Operating and Financial Review and Prospects—C. Selected Statistical Information—Classification of Loan Portfolio Based on the Borrower’s Payment Performance.”
Our allowance for loan losses is based on our current assessment of and expectations concerning various factors affecting us, including the quality of our loan portfolio. These factors include, among other things, our borrowers’ financial condition, repayment abilities and repayment intentions, the realizable value of any collateral, the prospects for support from any guarantor, Chile’s economy, government macroeconomic policies, interest rates and the legal and regulatory environment. As the 2008 financial crisis has demonstrated, many of these factors are beyond our control. In addition, as these factors evolve, the models we use to determine the appropriate level of allowance for loan losses and other assets require recalibration, which can lead to increased provision expense. See “Item 5. Operating and Financial Review and Prospects—A. Operating Results–Results of Operations for the Years ended December 31, 2018, 2017 and 2016—Provision for loan losses, net of recoveries.”
As a result, there is no precise method for predicting loan and credit losses, and we cannot assure you that our allowance for loan losses will be sufficient in the future to cover actual loan and credit losses. If our assessment of and expectations concerning the above-mentioned factors differ from actual developments, if the quality of our total loan portfolio deteriorates, for any reason, including the increase in lending to individuals and small and medium enterprises, the volume increase in the consumer loan portfolio and the introduction of new products, or if the future actual losses exceed our estimates of incurred losses, we may be required to increase our provisions and allowance for loan losses, which may adversely affect us. If we are unable to control or reduce the level of our non-performing or poor credit quality loans, this could have a material adverse effect on us.
The value of the collateral securing our loans may not be sufficient, and we may be unable to realize the full value of the collateral securing our loan portfolio.
The value of the collateral securing our loan portfolio may fluctuate or decline due to factors beyond our control, including as a result of the COVID-19 pandemic and macroeconomic factors affecting Chile’s economy. The value of the collateral securing our loan portfolio may be adversely affected by force majeure events, such as natural disasters, particularly in locations where a significant portion of our loan portfolio is composed of real estate loans. Natural disasters such as earthquakes and floods may cause widespread damage, which could impair the asset quality of our loan portfolio and could have an adverse impact on Chile’s economy. The real estate market is particularly vulnerable in the current economic climate and this may affect us, as real estate represents a significant portion of the collateral securing our residential mortgage loan portfolio. We may also not have sufficiently recent information on the value of collateral, which may result in an inaccurate assessment for impairment losses of our loans secured by such collateral. If any of the above were to occur, we may need to make additional provisions to cover actual impairment losses of our loans, which may materially and adversely affect our results of operations and financial condition.
At December 31, 2020, 44% of our loans and advances to customers have property collateral while 21% have other types of collateral (securities, pledges and others).
In addition, auto industry technology changes, accelerated by environmental rules, could affect our auto consumer business in Chile, particularly residual values of leased vehicles, which could have a material adverse effect on our operating results, financial condition and prospects.
The growthcredit quality of our loan portfolio may expose usdeteriorate, and our loan loss reserves could be insufficient to increasedcover our loan losses. Our exposurelosses, which could have a material adverse effect on us.
Risks arising from changes in credit quality and the recoverability of loans and amounts due from counterparties are inherent to individualsa wide range of our businesses. Non-performing or low credit quality loans have in the past negatively impacted our results of operations and smallcould do so in the future. In particular, the amount of our reported non-performing loans may increase in the future as a result of growth in our total loan portfolio, including as a result of loan portfolios that we may acquire in the future (the credit quality of which may turn out to be worse than we had anticipated), or factors beyond our control, such as adverse changes in the credit quality of our borrowers and mid-sized businessescounterparties or a general deterioration in economic conditions in Chile or in global economic and political conditions, including as a result of the COVID-19 pandemic. In response to the COVID-19 pandemic, with the purpose of helping our customers from the credit perspective and foster their economic resilience, we have
25
implemented several actions, including (i) providing liquidity and credit facilities to customers facing hardship; (ii) granting BBpayment deferrals in outstanding loans under the EBA Guidelines on moratoria; (iii) focus credit risk management on those economic sectors more affected by the pandemic; (iv) focus on the collections & recoveries readiness across the Group; and (v) quantifying the provisions overlay on the expected credit losses as a result of the macroeconomic shock. If we were unable to control the level of our non-performing or poor credit quality loans, this could leadhave a material adverse effect on us.
As of December 31, 2020, our non-performing loans were Ch$486,435 million, and the ratio of our non-performing loans to higher levelstotal loans was 1.4%. As of past due loans, allowancesDecember 31, 2020, our allowance for loan losses was Ch$1,036,793 million, and charge-offs.
The further expansionthe ratio of our loan portfolio (particularly in the consumer, small- and mid-sized companies and real estate segments) can be expected to expose us to a higher level ofallowance for loan losses and require us to establish higher levels of provisions for loan losses. See “Note 9—Loans and Account Receivable at Amortized Cost – under IFRS 9” and “Note 10—Loans and Account Receivable at Fair Value through Other Comprehensive Income – under IFRS 9” intotal loans was 3.0%. For additional information on our Audited Consolidated Financial Statements for a description and presentation of our loan portfolio as well asasset quality, see “Item 5. Operating and Financial Review and Prospects—C. Selected Statistical Information—Classification of Loan Portfolio.Portfolio Based on the Borrower’s Payment Performance.”
Retail customers represent 68.8%Our loan loss reserves are based on our current assessment of and expectations concerning various factors affecting the quality of our loan portfolio. These factors include, among other things, our borrowers’ financial condition, repayment abilities and repayment intentions, the realizable value of any collateral, the prospects for support from any guarantor, Chile’s economy, government macroeconomic policies, interest rates and the legal and regulatory environment. Because many of these factors are beyond our control and there is no infallible method for predicting loan and credit losses, we cannot assure you that our current or future loan loss and reserves will be sufficient to cover actual losses. If our assessment of and expectations concerning the above-mentioned factors differ from actual developments, if the quality of our total loan portfolio at amortized cost asdeteriorates, for any reason, or if the future actual losses exceed our estimates of December 31, 2018. As part of our business strategy,expected losses, we seekmay be required to increase lendingour loan loss reserves, which may adversely affect us. Additionally, in calculating our loan loss reserves, we employ qualitative tools and other services to retail clients,statistical models which may not be reliable in all circumstances and which are more likely todependent upon data that may not be adversely affected by downturns in the Chilean economy. In addition, as of December 31, 2018, our residential mortgage loan portfolio totaled Ch$10,150,981 million, representing 33.6% of our total loans. See “Note 9— Loans and Account Receivable at Amortized Cost – under IFRS 9” in our Audited Consolidated Financial Statements for a description and presentation of our residential mortgage loan portfolio. If the economy and real estate market in Chile experience a significant downturn, this could materially adversely affect the liquidity, businesses and financial conditions of our customers, which may in turn cause us to experience higher levels of past-due loans, thereby resulting in higher provisions for loan losses and subsequent charge-offs. This may materially and adversely affect our asset quality, results of operations and financial condition.
The growth rate of our loan portfolio may be affected by economic turmoil, which could also lead to a contraction in our loan portfolio.
There can be no assurance that our loan portfolio will continue to grow at similar rates to historical growth rates. A reversal of the rate of growth of the Chilean economy, a slowdown in the growth of customer demand, an increase in market competition or changes in governmental regulations could adversely affect the rate of growth of our loan portfolio and our risk index and, accordingly, increase our required allowances for loan losses. Economic turmoil could materially adversely affect the liquidity, businesses and financial condition of our customers as well as lead to a general decline in consumer spending and a rise in unemployment. All this could in turn lead to decreased demand for borrowings in general.complete.
Our financial results are constantly exposed to market risk. We are subject to fluctuations in interest rates and other market risks, which may materially and adversely affect us and our profitability.
The COVID-19 pandemic has caused high market volatility, which may materially and adversely affect us and our trading and banking book.
Market risk refers to the probability of variations in our net interest income / (charge) or in the market value of our assets and liabilities due to volatility of interest rate, inflation, exchange rate or equity price. Changes in interest rates affect the following areas, among others, of our business:
| the volume of loans originated; |
| credit spreads; |
| the market value of our securities holdings; |
| the value of our loans and deposits; and |
| the value of our derivatives transactions. |
Interest rates are sensitive to many factors beyond our control, including increased regulation of the financial sector, the reserve policies of the Central Bank, deregulation of the financial sector in Chile, monetary policies and domestic and international economic and political conditions. Variations in interest rates could affect the interest earned on our assets and the interest paid on our borrowings, thereby affecting our net interest income / (charges), which comprises the majority of our revenue, reducing our growth rate and potentially resulting in losses. InterestIn addition, costs we incur as we implement strategies to reduce interest rate variationsexposure could adversely affect us, includingincrease in the future (which, in turn, will impact our net interest income, reducing our growth rate or even resulting in losses. When interest rates rise, we may be required to pay higher interest on our floating-rate borrowings while interest earned on our predominately fixed-rate assets may not rise as quickly, which could cause profits to grow at a reduced rate or decline in some parts of our portfolio.results).
Increases in interest rates may reduce the volume of loans we originate. Sustained high interest rates have historically discouraged customers from borrowing and have resulted in increased delinquencies in outstanding loans and deterioration in the quality of assets. Increases in interest rates may reduce the value of our financial assets and may reduce gains or require us to record losses on sales of our loans or securities.
If26
While it would likely decrease funding costs, if interest rates decrease, although this is likely to decrease our funding costs, it is likely to adversely impact the income we receive from our investments in securities as well asand loans with similar maturities.maturities could be adversely affected. In addition, we may also experience increased delinquencies in a low interest rate environment when such an environment is accompanied by high unemployment and recessionary conditions. “See Item 11. Quantitative and Qualitative Disclosure About Market Risks—E. Market Risks—Impact of Interest Rates.”
The market value of a security with a fixed interest rate generally decreases when the prevailing interest rates rise, which may have an adverse effect on our earnings and financial condition. In addition, we may incur costs as we implement strategies to reduce interest rate exposure in the future (which, in turn, will impact our results). The market value of an obligation with a floating interest rate can be adversely affected when interest rates increase, due to a lag in the implementation of repricing terms or an inability to refinance at lower rates.
High levels of inflation in Chile could adversely affect the Chilean economy and our business, financial condition and results of operations. Any change in the methodology of how the CPI index or the UF are calculated could also adversely affect our business, financial condition and results of operations. Extended periods of deflation could also have an adverse effect on our business, financial condition and results of operations. The UF is revalued in monthly cycles. On each day in the period beginning on the tenth day of any given month through the ninth day of the succeeding month, the nominal peso value of the UF is indexed up (or down in the event of deflation) in order to reflect a proportionate amount of the change in the Chilean Consumer Price Index during the prior calendar month. For more information regarding the UF, see “Item 5. Operating and Financial Review and Prospects—A. Operating Results—Impact of Inflation.” Although we benefit from inflation in Chile due to the current structure of our assets and liabilities (i.e., a significant portion of our loans are indexed to the inflation rate, but there are no corresponding features in deposits, or other funding sources that would increase the size of our funding base), there can be no assurance that our business, financial condition and result of operations in the future will not be adversely affected by changing levels of inflation, including from extended periods of inflation that adversely affect economic growth or periods of deflation. “See Item 11. Quantitative and Qualitative Disclosure About Market Risks—E. Market Risks—Impact of Inflation,”
We are also exposed to foreign exchange rate risk as a result of mismatches between assets and liabilities denominated in different currencies. Fluctuations in the exchange rate between currencies may negatively affect our earnings and value of our assets and securities. Therefore, while the Bank seeks to avoid significant mismatches between assets and liabilities due to foreign currency exposure, from time to time, we may have mismatches. The Chilean peso has been subject to large devaluations and appreciations in the past and could be subject to significant fluctuations in the future. Our results of operations may be affected by fluctuations in the exchange rates between the peso and the dollar despite our policy and Chilean regulations relating to the general avoidance of material exchange rate exposure. In order to avoid material exchange rate exposure, we enter into forward exchange transactions. We may decide to change our policy regarding exchange rate exposure. Regulations that limit such exposures may also be amended or eliminated. Greater exchange rate risk will increase our exposure to the devaluation of the peso, and any such devaluation may impair our capacity to service foreign currency obligations and may, therefore, materially and adversely affect our financial condition and results of operations. Notwithstanding the existence of general policies and regulations that limit material exchange rate exposures, the economic policies of the Chilean government, new foreign currency regulations by the Central Bank and any future fluctuations of the peso against the dollar could affect our financial condition and results of operations. “See Item 11. Quantitative and Qualitative Disclosure About Market Risks—E. Market Risks—Foreign exchange fluctuations.”
We are also exposed to equity price risk in our investments in equity securities in the banking book and in the trading portfolio. The performance of financial markets may cause changes in the value of our investment and trading portfolios. The volatility of world equity markets due to the continued economic uncertainty and sovereign debt crisis has had a particularly strong impact on the financial sector. Continued volatility may affect the value of our investments in equity securities and, depending on their fair value and future recovery expectations, could become a permanent impairment which would be subject to write-offs against our results. To the extentIf any of these risks were to materialize, our interest income / (charges) or the market value of our assets and liabilities could be materially adversely affected.
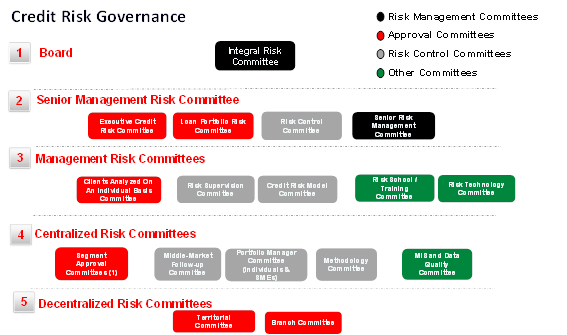
Failure to successfully implement and continue to improve our risk management policies, procedures and methods, including our credit risk management system, could materially and adversely affect us, and we may be exposed to unidentified or unanticipated risks.
The management of risk is an integral part of our activities. We seek to monitor and manage our risk exposure through a variety of separate but complementary financial, credit, market, operational, compliance and legal reporting systems. While we employ a broad and diversified set of risk monitoring and risk mitigation techniques, such techniques and strategies may not be fully effective in mitigating our risk exposure in all economic market environments or against all types of risk, including risks that we fail to identify or anticipate.
Some of our qualitative tools and metrics for managing risk are based upon our use of observed historical market behavior. We apply statistical and other tools to these observations to arrive at quantifications of our risk exposures. These qualitative tools and metrics may fail to predict future risk exposures. These risk exposures could, for example, arise from factors we did not anticipate or correctly evaluate in our statistical models. This would limit our ability to manage our risks. Our losses thus could be significantly greater than the historical measures indicate. In addition, our quantified modeling does not take all risks into account. Our more qualitative approach to managing those risks could prove insufficient, exposing us to material unanticipated losses. We could face adverse consequences as a result of decisions, which may lead to actions by management, based on models that are poorly developed, implemented or used, or as a result of the modelled outcome being misunderstood or the use of such information for purposes for which it was not designed. In addition, if existing or potential customers or counterparties believe our risk management is inadequate, they could take their business elsewhere or seek to limit their transactions with us. This could havesuffer a material adverse effect on our reputation, operating results, financial condition and prospects.impact.
27
As a commercial bank, one of the main types of risks inherent in our business is credit risk. For example, an important feature of our credit risk management system is to employ an internal credit rating system to assess the particular risk profile of a customer. As this process involves detailed analyses of the customer, taking into account both quantitative and qualitative factors, it is
We are subject to human or IT systems errors. In exercising their judgment on current or future credit risk behavior ofmarket, operational and other related risks associated with our customers, our employees may not always be able to assign an accurate credit rating, which may result in our exposure to higher credit risks than indicated by our risk rating system.
Failure to effectively implement, consistently monitor or continuously refine our credit risk management system may result in an increase in the level of non-performing loans and a higher risk exposure for us, whichderivative transactions that could have a material adverse effect on us.
The effectivenessWe enter into derivative transactions for trading purposes as well as for hedging purposes. We are subject to market, credit and operational risks associated with these transactions, including basis risk (the risk of ourloss associated with variations in the spread between the asset yield and the funding and/or hedge cost) and credit or default risk management is affected by(the risk of insolvency or other inability of the quality and scope of information available in Chile.counterparty to a particular transaction to perform its obligations thereunder, including providing sufficient collateral).
In assessing customers’ creditworthiness, we rely largely on the credit information available from our own internal databases, the SBIF, Directorio de Información Comercial (Dicom) en Capital, a Chilean nationwide credit bureau,Market practices and other sources. Due to limitations in the availability of information and the developing information infrastructuredocumentation for derivative transactions in Chile our assessment of credit risk associated with a particular customermay differ from those in other countries. For example, documentation may not be based on complete, accurate or reliable information.incorporate terms and conditions of derivatives transactions as commonly understood in other countries. In addition, although we have been improving our credit scoring systems to better assess borrowers’ credit risk profiles, we cannot assure you that our credit scoring systems will collect complete or accurate information reflecting the actual behaviorexecution and performance of customers or that their credit risk can be assessed correctly. Without complete, accurate and reliable information, we will have to relythese transactions depend on other publicly available resources and our internal resources, which may not be effective. As a result, our ability to effectively managemaintain adequate control and administration systems. Moreover, our ability to adequately monitor, analyze and report derivative transactions continues to depend, largely, on our information technology systems. These factors further increase the risks associated with these transactions and could have a material adverse effect on us.
At December 31, 2020, the notional value of the trading derivatives in our books amounted to Ch$377,131,597 million (with a market value of Ch$8,148,608 million of debit balance and Ch$7,390,654 million of credit balance).
At December 31, 2020, the nominal value of the hedging derivatives in our books within our financial risk management strategy and with the aim of reducing asymmetries in the accounting treatment of our operations amounted to Ch$363,668,609 million (with market value of Ch$9,032,085 million in assets and Ch$9,018,660 million in liabilities).
We are subject to counterparty risk in our banking business.
We are exposed to counterparty risk in addition to credit risks associated with lending activities. Counterparty risk may arise from, for example, investing in securities of third parties, entering into derivative contracts under which counterparties have obligations to make payments to us or executing securities, futures, currency or commodity trades from proprietary trading activities that fail to settle at the required time due to non-delivery by the counterparty or systems failure by clearing agents, clearing houses or other financial intermediaries.
We routinely transact with counterparties in the financial services industry, including brokers and dealers, commercial banks, investment banks, mutual funds, hedge funds and other institutional clients. Defaults by, and even rumors or questions about the solvency of, certain financial institutions and the financial services industry generally have led to market-wide liquidity problems and could lead to losses or defaults by other institutions. Many of the routine transactions we enter into expose us to significant credit risk and subsequentlyin the event of default by one of our loan loss allowances may be materially adversely affected.significant counterparties.
Liquidity and funding risks are inherent in our business and could have a material adverse effect on us.
Liquidity risk is the risk that we either do not have available sufficient financial resources to meet our obligations as they fall due or can secure them only at excessive cost. This risk is inherent in any retail and commercial banking business and can be heightened by a number of enterprise-specific factors, including over-reliance on a particular source of funding, changes in credit ratings or market-wide phenomena such as market dislocation.dislocation, including as a result of the COVID-19 pandemic. While we implementhave in place liquidity management processes to seek to mitigate and control these risks, unforeseen systemic market factors make it difficult to eliminate completely these risks. Continued constraintsConstraints in the supply of liquidity, including in inter-bank lending, has affected and maycould materially and adversely affect the cost of funding of our business, and extreme liquidity constraints may affect our current operations and our ability to fulfill regulatory liquidity requirements, as well as limit growth possibilities.
Increases inOur cost of obtaining funding is directly related to prevailing market interest rates and to our credit spreads. Increases in interest rates and/or in our credit spreads can significantly increase the cost of our funding. Changes in our creditCredit spreads variations are market-driven and may be influenced by market perceptions of our creditworthiness. Changes to interest rates and our credit spreads occur continuously and may be unpredictable and highly volatile.
We rely, and will continue to rely, primarily on commercialretail deposits to fund lending activities. The ongoing availability of this type of funding is sensitive to a variety of factors outsidebeyond our control, such as general economic conditions and the confidence of commercialretail depositors in the economy and in the financial services industry, and the availability and extent of deposit guarantees, as well as competition for deposits between banks or with other products, such as mutual funds, for deposits.funds. Any of these factors could significantly increase the amount of commercialretail deposit withdrawals in a short period of time, thereby reducing our ability to access commercialretail deposit funding on appropriate terms, or at all, in the future. If these circumstances were to arise, this could have a material adverse effect on our operating results, financial condition and prospects.
28
We anticipate that our customers will continue, in the near future, to make short-term deposits (particularly demand deposits and short-term time deposits), and we intend to maintain our emphasis on the use of banking deposits as a source of funds. As of December 31, 2018, 98.8%2020, 99.1% of our customer deposits had remaining maturities of one year or less or were payable on demand. A significant portion of our assets have longer maturities, resulting in a mismatch between the maturities of liabilities and the maturities of assets. Historically, one of our principal sources of funds has been time deposits. Time deposits represented 33.4%19.0% and 33.3%28.0% of our total liabilities and equity as of December 31, 20182020 and 2017,2019, respectively. The Chilean time deposit market is concentrated given the importance in size of various large institutional investors such as pension funds and corporations relative to the total size of the economy. As of December 31, 2018,2020, the Bank’s top 20 time deposits represented 19.7%25.1% of total time deposits, or 6.6%4.8% of total liabilities and equity, and totaled U.S.$3.7 billion. No assurance can be given that future economic stability in the Chilean market will not negatively affect our ability to continue funding our business or to maintain our current levels of funding without incurring increased funding costs, a reduction in the term of funding instruments or the liquidation of certain assets. If this were to happen, we could be materially adversely affected.
The short-term nature of this funding source could cause liquidity problems for us in the future if deposits are not made in the volumes we expect or are not renewed. If a substantial number of our depositors withdraw their demand deposits or do not roll over their time deposits upon maturity, we may be materially and adversely affected.
Central banks have taken extraordinary measures to increase liquidity in the financial markets as a response to the financial crisis.crisis and the COVID-19 pandemic. If current facilities were rapidly removed or significantly reduced, this could have an adverse effect on our ability to access liquidity and on our funding costs.
In response to the COVID-19 pandemic, the Chilean Central Bank has made available two lines of credit to banks to reinforce their liquidity. These lines of credit bear interest at the Central Bank’s MPR, which was 0.5% as of December 31, 2020. Pursuant to these lines of credit, a bank may borrow up to 3% of the aggregate amount of its consumer and commercial loan portfolios as of February 29, 2020 and may borrow up to an additional 12% if it uses the funds to provide loans to companies and individuals. The first line of credit is a facility available conditionally on loan growth (the “FCIC”) to ensure that banks continue to finance households and businesses in Chile. Loans provided by this line of credit may have maturities of up to 4 years and must be secured by government bonds, corporate bonds or highly rated large commercial loans as collateral. In stages 1 and 2, the Board of the Central Bank had allocated a total of US$ 40 billion to this facility, of which approximately US$30 billion has been disbursed. The Central Bank in its Monetary Policy Meeting held on January 27, 2021 announced the beginning of a third stage of this instrument (FCIC3) commencing on March 1, 20201. Loans provided under the second line of credit, the LCL, are unsecured and may have maturities of up to 2 years. In addition, borrowings by a bank under the LCL are limited to the aggregate amount of the liquidity reserve requirements of such bank. Ultimately, these lines of credit are intended to ensure banks have ample liquidity to enable them to continue financing companies and individuals. As of December 31, 2020, we had borrowed Ch$4,959,260 billion (US$7 billion) under both these lines of credit.
Additionally, our activities could be adversely impacted by liquidity tensions arising from generalized drawdowns of committed credit lines to our customers.
We cannot assure that in the event of a sudden or unexpected shortage of funds in the banking system, we will be able to maintain levels of funding without incurring high funding costs, a reduction in the term of funding instruments or the liquidation of certain assets. If this were to happen, we could be materially adversely affected.
Finally,29
Changes to the implementation of internationally accepted liquidity ratios might require changes in business practices thatpension fund system may affect our profitability. liquidity levels and/or funding costs
The liquidity coverage ratio (“LCR”) is a liquidity standard that measures if banks have sufficient high-quality liquid assetscurrent pension fund system dates from the 1980s when pensions went from being state-funded to cover expected net cash outflows over a 30-day liquidity stress period. Atprivately-funded, which requires Chilean employees to set aside 10% of their wages. As of December 31, 2018, our LCR ratio was 151.6%, above2020, the 100%Chilean pension fund management companies (Administradora de Fondos de Pensión, or “AFPs”) had U.S.$5 billion invested in the Bank via equity, deposits and fixed income. The demographics of Chilean society have changed, resulting in a need to modify the system. In January 2020, the Chilean government presented a proposal for pension reform to Congress for discussion. These changes include increasing minimum requirement.pensions and introducing a social insurance scheme for events such as longevity. The net stable funding ratio (NSFR) providesamount each worker must set aside is also expected to increase from the current 10% of wages to 16%. The additional 6% would be gradually introduced over 12 years and would be a sustainable maturity structure of assets and liabilities such that banks maintain a stable funding profile in relation to their activities. The final definitioncost of the NSFR approvedemployer, thus potentially raising personnel expenses. The additional 6% would not be managed by the Basel Committee in October 2014, has not yet come into effect. The Basel requirement still needs to be written intoAFPs, but by a new government pension entity. Although the CRR, whichbill is currently being discussed and widely expected to be publishedapproved, we are unable to predict the final content of the law. The potential adverse effect of the proposed law on our financial condition and results of operations cannot yet be ascertained.
Moreover, in 2019.2020, and as a result of the COVID-19 pandemic, two extraordinary withdrawals were permitted from pension funds. In total, at year-end 2020, US$31.3 billion had been withdrawn from the pension fund system. In order to avoid strong swings in asset prices, the Central Bank introduced a series of measures to ensure healthy liquidity levels including the direct purchase of bank instruments and the acquisition of government bonds in the secondary market supported by the FCIC and LCL lines available to banks as described above. The potential adverse effect of these and future withdrawals on our financial condition, liquidity levels, the ability to obtain funding from the AFPs and results of our operations cannot yet be ascertained.
Chilean regulations also impose a series of restrictions on how Chilean AFPs may allocate their assets. In the particular case of financial issuers’ there are three restrictions, each involving different assets and different limits determined by the amount of assets in each fund and the market and book value of the issuer’s equity. As a consequence, limits vary within funds of AFPs and issuers. According to our estimates in December 2020, the AFPs still had the possibility of being able to invest another U.S.$8.8 billion in the Bank via equity, deposits and fixed income. If the exposure of any AFP to Santander-Chile exceeds the regulatory limits, if the regulatory limits are reduced or the amount of funds available in the pension funds falls significantly, we would need to seek alternative sources of funding, which could be more expensive and, as a consequence, may have a material adverse effect on our financial condition and results of operations.
Legal and Regulatory Risks
We are subject to regulatory capital and liquidity requirements that could limit our operations, and changes to these requirements may further limit and adversely affect our operating results, financial condition and prospects.
Chilean banks are required by the General Banking Law to maintain regulatory capital of at least 8% of risk-weighted assets, net of required loan loss allowance and deductions, and paid-in capital and reserves (“core capital”) of at least 3% of total assets, net of required loan loss allowances. As we are the result of the merger between two predecessors with a relevant market share in the Chilean market, we are currently required to maintain a minimum regulatory capital to risk-weighted assets ratio of 11%. As of December 31, 2018,2020, the ratio of our regulatory capital to risk-weighted assets, net of loan loss allowance and deductions, was 13.4%15.4% and our core capital ratio was 10.6%10.7%. Certain developments could affect our ability to continue to satisfy the current capital adequacy requirements applicable to us, including:
| the increase of risk-weighted assets as a result of the expansion of our business or regulatory changes; |
| the failure to increase our capital correspondingly; |
| losses resulting from a deterioration in our asset quality; |
| declines in the value of our investment instrument portfolio; |
| changes in accounting standards; |
| changes in provisioning guidelines that are charged directly against our equity or net income; and |
| changes in the guidelines regarding the calculation of the capital adequacy ratios of banks in Chile. |
On January 19, 2019, the Chilean government passed a law that amends, among others, the General Banking Law (the General Banking Law, as amended, is referred to herein as the “New General Banking Law”) and establishesestablished new capital regulation for banks in Chile in line with Basel III standards and the merger of the banking regulator with the FMC, withtransferring all current SBIF attributions being transferred to the FMC. The FMC was created by Law 21,000 in 2017 and started operations December 14, 2017 (eliminating the Superintendency of Securities and Insurance as of January 15, 2018). As of June 1, 2019, the SBIF merged into the FMC.
30
This will lead to
Therefore, the FMC becominghas become the sole supervisor for the Chilean financial system overseeing insurance companies, companies with publicly traded securities, credit unions, credit card and prepaid card issuers, and banks. This commissionCommission is responsible for the proper functioning, development and stability of the financial market, facilitating the participation of market agents and defending public faith in the financial markets. To do so, it must maintain a general and systemic vision of the market, considering the interests of investors and policyholders. It is also responsible for ensuring that the persons or entities audited, from their initiation until the end of their liquidation, comply with the laws, regulations, statutes and other provisions that govern them.
The Commission will beis in charge of a Council, which will beis composed of five members, who are appointed and are subject to the following rules:
| A Commissioner appointed by the President of Chile, of recognized professional or academic prestige in matters related to the financial system, which will have the character of President of the Commission. |
| Four commissioners appointed by the President of Chile, from among persons of recognized professional or academic prestige in matters related to the financial system, by supreme decree issued through the Ministry of Finance, after ratification of the Senate by the four sevenths of its members in exercise, in session specially convened for that purpose. |
The Council’s responsibilities include regulation, sanctioning and the definition of general supervision policies. In addition, there is a prosecutor in charge of investigations and the Chairman is responsible for supervision. The FMC acts in coordination with the Chilean Central Bank (BCCh)Bank.
On October 9, 2020, the FMC published the final new regulations on regulatory capital to comply with effective net worth rules in accordance with Basel III and the New General Banking Law. The new regulation will be effective on December 1, 2021 and will be gradually implemented and adjusted to be fully effective by December 1, 2025. Pursuant to the proposed regulation, there will be three levels of capital: ordinary capital level 1 or CET1 (basic capital), additional capital level 1 or AT1 (perpetual bonds and preferred stock) and capital level 2 or T2 (subordinated bonds and voluntary provisions). Regulatory capital will be composed of the sum of CET1, AT and T2 after making some deductions, mainly for intangible assets, hybrid securities issued by foreign subsidiaries, partial deduction for deferred taxes and some reserve and profit accounts.
Under the New General Banking Law, minimum capital requirements have increased in terms of amount and quality. Total Regulatory Capital remains at 8% of risk-weighted assets which includes credit, market and operational risk. Minimum Tier 1 capital increased from 4.5% to 6% of risk-weighted assets, of which up to 1.5% may be Additional Tier 1 (AT1), either in the form of preferred shares or perpetual bonds, both of which may be convertible to common equity. The FMC will now establishalso establishes the conditions and requirements for the issuance of perpetual bonds and preferred equity. Tier 2 capital is now set at 2% of risk-weighted assets.
Additional capital demands are incorporated through a Conservation Buffer of 2.5% of risk-weighted assets, setting a Total Equity Requirement of 10.5% of risk-weighted assets. The BCChCentral Bank may set an additional Counter Cyclical Buffer of up to 2.5% of risk-weighted assets within agreement fromwith the FMC. Both buffers must be comprised of core capital.
On November 2, 2020 the FMC publishing the final guidelines regarding the identification and core capital charge for those banks considered Systemically Important Banks (“SIB”). The FMC, in with agreement from the BCCh, may imposeCentral Bank, also imposed additional capital requirements for Systemically Important Banks (“SIB”)SIBs of between 1-3.5% of risk-weighted assets. Notably,This additional capital requirement will be gradually phased in by 25% each year beginning on December 2021 until December 2025. With the BCChimplementation of additional capital requirements for SIBs, the requirement imposed on Banco Santander Chile to have a minimum regulatory capital ratio of 11% compared to the 8% limit for most other banks in Chile will be gradually phased out and replaced by the new regulatory requirements for a SIB.
31
There is a total of four factors that are then weighted to reach a market share:
| 1. | Size (weighted at 30%): Includes total assets consolidated in the domestic market. |
| 2. | Domestic interconnection (weighted at 30%): Includes assets and liabilities with financial institutions (banks and non-banks) and assets in circulation in the Chilean financial market (equity and fixed income). |
| 3. | Domestic substitution (weighted at 20%): Includes the share in local payments, assets in custody, deposits and loans. |
| 4. | Complexity (weighted at 20%): Includes factors that could lead to greater difficulties regarding costs and/ or time for the orderly resolution of the Bank. These include the notional amount of OTC derivatives, inter-jurisdictional assets and liabilities and available-for-sale assets. |
The minimum amount of the sum of the factors to be considered systemic is 1000 bp, equivalent to a weighted participation of 10% of all four factors. The core capital additional charge depends on the size of the total factor, as set out in the table below:
| Systemic Level | Range (bp) | Core capital additional charge (% of risk-weighted assets) |
| I | 1000-1300 | 1.0%-1.25% |
| II | 1300-1800 | 1.25%-1.75% |
| III | 1800-2000 | 1.75%-2.5% |
| IV | >=2000 | 2.5%-3.5% |
The Central Bank may require:also require for a SIB: (1) the addition of up to 2% to the core capital to a bank’s total assets ratios; (2) a reduction in the technical reserve requirement trigger from 2.5 times the regulatory capital to 1.5 times the regulatory capital; and/or (3) a reduction in the interbank loan limit to 20% of the regulatory capital of any SIB. While the FMC has not yet established the criteria to assess
The first calculation of which bankslevel a SIB will be considered SIBs,included in will be published in March 2021 using a bank’s balance sheet figures as of year-end 2020. Given our size and market share, it is probablelikely that we will be classified an SIB.as a SIB either in Level II or III.
The following table sets forth a comparison between the current regulatory capital demands, and those under the New General Banking Law.
| Capital requirements: Basel III, current General Banking Law and New General Banking Law | ||||
| Capital categories | Current General Banking Law | New General Banking Law | ||
| (% over risk weighted assets) | ||||
| (1) Total Tier 1 Capital (2+3) | 4.5 | 6 | ||
| (2) Basic Capital | 4.5 | 4.5 | ||
| (3) Additional Tier 1 Capital (AT1) | — | 1.5 | ||
| (4) Tier 2 Capital | 3.5 | 2 | ||
| (5) Total Regulatory Capital (1+4) | 8 | 8 | ||
| (6) Conservation Buffer | 2% over regulatory capital in order to be classified in Category A solvency. | 2.5 | ||
| (7) Total Equity Requirement (5+6) | 8 | 10.5 | ||
| (8) Counter Cyclical Buffer | — | up to 2.5 | ||
| (9) SIB* Requirement | Up to 6% in case of a merger | Between 1 - 3.5 | ||
* Systemically Important Banks
According to initial estimates of the impact of market risk on regulatory capital, published by the SBIF for informational purposes only, our ratio of regulatory capital to risk-weighted assets, net of loan loss allowance and deductions, including an initial estimate of the adjustments for market risk was 12.0% as of December 31, 2018. No assurance can be given that the adoption of the Basel III capital requirements will not have a material impact on our capitalization ratio.
The billLaw also incorporates Pillar II capital requirements with the objective of assuring an adequate management of risk. The objective of this pillar is to ensure that banks maintain capital levels that are consistent with their risk profile and business model and encourages the development and use of appropriate processes to monitor and manage their risks. Pillar 2 also established an attribution for regulators to impose greater capital requirements as a result of deficient evaluations of a bank’s internal capital adequacy assessment process (ICAAP), which should consider a bank’s risk profile and a strategy to sustain adequate level of capital, even under stress scenarios. Pillar 2 also focuses on risks not considered in Pillar 1 such as reputational risks, concentration risks, liquidity risks and interest rate risk of the banking book. The FMC, with at least four votes from the Commission,Council of the FMC, will have the power to impose additional regulatory capital demands of up to 4% of risk-weighted assets, either Tier I or Tier II, if it determines that the previous capital levels and buffers are not enough for a particular financial institution.
The FMC will be responsible for establishing weightings for risk-weighted assets asfollowing table sets forth a separate regulation based oncomparison between the implementation of standard models, subject to agreement from the BCCh. The FMC will have until December 31, 2020 to establish the weightings. Until the FMC absorbs the SBIF (which is expected to take place on June 1, 2019) and the new weightings for risk-weighted assets are approved, banks must maintain regulatory capital demands under the previous law, and those under the New General Banking Law:
Minimum capital requirements: Basel III, previous GBL and new requirements | ||||
Capital categories | Previous Law | New General Banking Law | ||
| (% over risk weighted assets) | ||||
| (1) Shareholders’ Equity | 4.5 | 4.5 | ||
| (2) Additional Tier 1 Capital (AT1) | — | 1.5 | ||
| (3) Total Tier 1 Capital (1+2) | 4.5 | 6 | ||
| (4) Tier 2 Capital | 3.5 | 2 | ||
| (5) Total Regulatory Capital (3+4) | 8 | 8 | ||
| (6) Conservation Buffer | 2.5 CET1 | |||
| (7) Total Equity Requirement (5+6) | 8 | 10.5 | ||
| (8) Counter Cyclical Buffer | — | up to 2.5 CET1 | ||
| (9) SIB* Requirement | Up to 6% in case of a merger | Between 1 - 3.5 CET1 | ||
| (10) Pillar 2 | 2% over regulatory capital in order to be classified in Category A solvency. | Up to 4% CET1 or Tier 2 | ||
____________________
* Systemically Important Banks
32
We may also be requiredbelieve our current capital levels are adequate, but we cannot rule out having to raise additional capital in the future in order to maintain our capital adequacy ratios above the minimum required levels.by the FMC. Our ability to raise additional capital may be limited by numerous factors, including: our future financial condition, results of operations and cash flows; any necessary government regulatory approvals; our credit ratings; general market conditions for capital raising activities by commercial banks and other financial institutions; and domestic and international economic, political and other conditions. If we require additional capital in the future, we cannot assure you that we will be able to obtain such capital on favorable terms, in a timely manner or at all. Furthermore, the FMC may increase the minimum capital adequacy requirements applicable to us. Accordingly, although we currently meet the applicable capital adequacy requirements, we may face difficulties in meeting these requirements in the future. If we fail to meet the capital adequacy requirements, we may be required to take corrective actions. These measures could materially and adversely affect our business reputation, financial condition and results of operations. In addition, if we are unable to raise sufficientenough capital in a timely manner, the growth of our loan portfolio and other risk-weighted assets may be restricted, and we may face significant challenges in implementing our business strategy. As a result, our prospects, results of operations and financial condition could be materially and adversely affected.
We are subject to liquidity requirements that could limit our operations, and changes to these requirements may further limit and adversely affect our operating results, financial condition and prospects.
The SBIF (now the FMC) and the Central Bank published new liquidity standards in 2015 and ratios that must be implemented and calculated by all banks. These will eventually replace the current regulatory limits imposed by the SBIF and the Central Bank described above. These new liquidity standards are in line with those established in Basel III. The most important liquidity ratios that will eventually behave been adopted by Chilean banks are:
| Liquidity coverage ratio (LCR), which measures the percentage of liquid |
| Net Stable Funding Ratio (NSFR) which will measure a bank’s available stable funding relative to its required stable funding. Both concepts are also defined in the new regulations. |
Beginning on March 30, 2016,The implementation of internationally accepted liquidity ratios might require changes in business practices that affect our profitability. The LCR is a liquidity standard that measures if banks began reporting these ratioshave enough high-quality liquid assets to cover expected net cash outflows over a 30-day liquidity stress period. At December 31, 2020, our LCR ratio was 142% under Chilean regulations, which is above the Central Bank80% minimum requirement for 2020. The net stable funding ratio (NSFR) provides a sustainable maturity structure of assets and the SBIF.liabilities such that banks maintain a stable funding profile in relation to their activities. The final limits and resultsChilean regulator has not yet defined a calendar of implementation for the LCR were published in May 2018, with minimum LCR of 60% starting from January 1, 2019, gradually increasing by 10% until reaching 100%. The initial limits banks must meet in order to comply with the other liquidity ratios have not been published yet. For this reason, we cannot yet determine the effect that the implementation of these models will have on our business. Such effectlocal NSFR. This could be material and adverse if it materially increasesincrease the liquidity we are required to maintain.maintain on our balance sheet.
33
We are subject to regulatory risk, or the risk of not being able to meet all of the applicable regulatory requirements and guidelines.
As a financial institution, we are subject to extensive regulation, inspections, examinations, inquiries, audits and other regulatory requirements by Chilean regulatory authorities, which materially affect our businesses. We cannot assure you that we will be able to meet all of the applicable regulatory requirements and guidelines, or that we will not be subject to sanctions, fines, restrictions on our business or other penalties in the future as a result of noncompliance. If sanctions, fines, restrictions on our business or other penalties are imposed on us for failure to comply with applicable requirements, guidelines or regulations, our business, financial condition, results of operations and our reputation and ability to engage in business may be materially and adversely affected.
In their supervisory roles, the regulators seek to maintain the safety and soundness of financial institutions with the aim of strengthening the protection of customers and the financial system. The supervisors’ continuing supervision of financial institutions is conducted through a variety of regulatory tools, including the collection of information by way of prudential returns, reports obtained from skilled persons, visits to firms and regular meetings with management to discuss issues such as performance, risk management and strategy. In general, these regulators have a more outcome-focused regulatory approach that involves more proactive enforcement and more punitive penalties for infringement. As a result, we face increased supervisory scrutiny (resulting in increasing internal compliance costs and supervision fees), and in the event of a breach of our regulatory obligations we are likely to face more stringent regulatory fines.
Changes in regulations may also cause us to face increased compliance costs and limitations on our ability to pursue certain business opportunities and provide certain products and services. As some of the banking laws and regulations have been recently adopted, the manner in whichway those laws and related regulations are applied to the operations of financial institutions is still evolving. Moreover, to the extent these recently adopted regulations are implemented inconsistently in the various jurisdictions in which we operate, itwe may face higher compliance costs.
A draft bill currently in Congress, (the “Market Agents Bill”) proposes, among other initiatives, to regulate the banks’ ability to sell insurance tied to loans related to contingencies such as fire, earthquake, unemployment insurance etc. This bill would require financial institutions to pay half of the insurance premiums associated with loans. Additionally, it would prohibit banks from selling insurance policies underwritten by a related party. This initiative after being approved in the Chamber of Deputies, was rejected in a Mixed Congressional Committee. In its place members of Congress introduced a bill to prohibit the charging of interest over interest on overdue loans. We currently, cannot estimate an impact of these bills, if ever approved, could have on our business, but no assurance can be given that they will not have a material impact on future income.
Another bill currently in Congress proposes to regulate prepayment commissions. This bill eliminates the prepayment fee for all interest-bearing loans, permitting the debtor to pay off capital and the interests accrued at any moment during the duration of the loan, unless otherwise expressly specified in the contract. This bill would also prohibits grace periods to accrue interest. This bill is still in the early phases of congressional discussion so we cannot estimate an impact, bur no assurance can be given that this will not have a material impact on future income.
No assurance can be given generally that laws or regulations will be adopted, enforced or interpreted in a manner that will not have a material adverse effect on our business and results of operations.
Modifications to reserve requirements may affect our business.
Deposits are subject to a reserve requirement of 9.0% for demand deposits and 3.6% for time deposits (with terms of less than one year). The Central Bank has statutory authority to require banks to maintain reserves of up to an average of 40.0% for demand deposits and up to 20.0% for time deposits (irrespective, in each case, of the currency in which these deposits are denominated) to implement monetary policy. In addition, to the extent that the aggregate amount of the following types of liabilities exceeds 2.5 times the amount of a bank’s regulatory capital, a bank must maintain a 100% reserve against them: demand deposits, deposits in checking accounts, obligations payable on sight incurred in the ordinary course of business and, in general, all deposits unconditionally payable immediately. The New General Banking Law also states that the FMC, with the approval from the Central Bank, may lower the amount of a bank’s regulatory capital over which a SIB must maintain a 100% reserve,this threshold from 2.5 times to 1.5 times. If the Central Bank weretimes a bank’s regulatory capital for a bank considered to increase reserve requirements, thisbe a SIB. This could lead to lower loan growth and have a negative effect on our business.
34
Our business could be affected if its capital is not managed effectively or if changes limiting our ability to manage our capital position are adopted.
Changes to the pension fund system may affect the funding mix of the Bank
The current pension fund system dates from the 1980s when pensions went from being state-funded to privately-funded, which requires Chilean employees to set aside 10% of their wages. While the system is widely regarded as a success, the demographics of the Chilean society have changed and there have been some modifications to the system. As of December 31, 2018, the Chilean pension fund management companies (Administradora de Fondos de Pensión, or “AFPs”) had U.S.$6,473 million invested in the Bank via equity, deposits and fixed income. In November 2018, the Chilean government presented a proposal for pension reform to Congress for discussion. The proposed bill includes measures to open the pension fund management industry to new actors, lower entrance barriers to the industry, enhance the powers of the Superintendency of Pensions and introduce the FMC as a supervisory entity, among other reforms. The current proposal includes a reduction of the reserve requirement for AFPs, which typically consist of assets that the AFPs must maintain in order to cover the loss of value of the pension funds if profitability is less than the minimum amount required, from 1% to 0.5% of the value of each of the managed pension funds. Although the bill is currently in its first stage of discussions and widely expected to be approved, we are unable to predict the final content of the law. The potential adverse effect of the proposed law on our financial condition and results of operations cannot yet be ascertained.
The legal restrictions on the exposure of Chilean pension funds to different asset classes may affect our access to funding.
Chilean regulations impose a series of restrictions on how Chilean pension fund management companies (Administradora de Fondos de Pensión, or “AFPs”) may allocate their assets. In the particular case of financial issuers’ there are three restrictions, each involving different assets and different limits determined by the amount of assets in each fund and the market and book value of the issuer’s equity. As a consequence, limits vary within funds of AFPs and issuers. According to our estimates in December 2018, the AFPs still had the possibility of being able to invest another U.S.$11,781 million in the Bank via equity, deposits and fixed income. If the exposure of any AFP to Santander-Chile exceeds the regulatory limits or the regulatory limits are reduced, we would need to seek alternative sources of funding, which could be more expensive and, as a consequence, may have a material adverse effect on our financial condition and results of operations.
Our financial statements are based in part on assumptions and estimates which, if inaccurate, could cause material misstatement of the results of our operations and financial position.
The preparation of financial statements requires management to make judgments, estimates and assumptions that affect the reported amounts of assets, liabilities, income and expenses. Due to the inherent uncertainty in making estimates, actual results reported in future periods may be based upon amounts which differ from those estimates. Estimates, judgments and assumptions are continually evaluated and are based on historical experience and other factors, including expectations of future events that are believed to be reasonable under the circumstances. Revisions to accounting estimates are recognized in the period in which the estimate is revised and in any future periods affected. The accounting policies deemed critical to our results and financial position, based upon materiality and significant judgments and estimates, include impairment of loans, valuation of financial instruments, valuation of derivatives, impairment of available-for-sale financial assets, deferred tax assets and liabilities and provisions -contingent liabilities.
If the judgment, estimates and assumptions we use in preparing our consolidated financial statements are subsequently found to be incorrect, there could be a material effect on our results of operations and a corresponding effect on our funding requirements and capital ratios.
Changes in accounting standards could impact reported earnings.
The accounting standard setters and other regulatory bodies periodically change the financial accounting and reporting standards that govern the preparation of our consolidated financial statements. For example, IFRS 9 was adopted as of January 1, 2018, establishing a new impairment model of expected loss and make changes to the classification and measurement requirements for financial assets and liabilities. In addition, the Bank adopted IFRS 16 as of January 1, 2019, requiring new standards for recognition, measurement, presentation and disclosure of leases. This led to approximately Ch$154,284 million of assets for the right of use and lease liabilities for the same amount as of the date of adoption of IFRS 16. Changes made to accounting standards can materially impact how we record and report our financial condition and results of operations. In some cases, we could be required to apply a new or revised standard retroactively, resulting in the restatement of prior period financial statements. For further information about developments in financial accounting and reporting standards, see Note 1 to our Audited Consolidated Financial Statements.
We are subject to review by taxing authorities, and an incorrect interpretation by us of tax laws and regulations may have a material adverse effect on us.
The preparation of our tax returns requires the use of estimates and interpretations of complex tax laws and regulations and is subject to review by taxing authorities.
We are subject to the income tax laws of Chile and certain foreign countries. These tax laws are complex and subject to different interpretations by the taxpayer and relevant governmental taxing authorities, which are sometimes subject to prolonged evaluation periods until a final resolution is reached. In establishing a provision for income tax expense and filing returns, we must make judgments and interpretations about the application of these inherently complex tax laws.
If the judgment, estimates and assumptions we use in preparing our tax returns are subsequently found to be incorrect, there could be a material adverse effect on our results of operations. In some jurisdictions, the interpretations of the taxing authorities are unpredictable and frequently involve litigation, which introduces further uncertainty and risk as to tax expense.
Disclosure controls and procedures over financial reporting may not prevent or detect all errors or acts of fraud.
Disclosure controls and procedures, including internal controls, over financial reporting are designed to provide reasonable assurance that information required to be disclosed by the company in reports filed or submitted under the Securities Exchange Act of 1934 is accumulated and communicated to management, and recorded, processed, summarized and reported within the time periods specified in the SEC’s rules and forms.
These disclosure controls and procedures have inherent limitations, which include the possibility that judgments in decision-making can be faulty and that breakdowns can occur because of errors or mistakes. Additionally, controls can be circumvented by any unauthorized override of the controls. Consequently, our businesses are exposed to risk from potential non-compliance with policies, employee misconduct or negligence and fraud, which could result in regulatory sanctions, civil claims and serious reputational or financial harm. In recent years, a number of multinational financial institutions have suffered material losses due to the actions of ‘rogue traders’ or other employees. It is not always possible to deter employee misconduct and the precautions we take to prevent and detect this activity may not always be effective. Accordingly, because of the inherent limitations in the control system, misstatements due to error or fraud may occur and not be detected.
We engage in transactions with related parties that others may not consider to be on an arm’s-length basis.
We and our affiliates have entered into a number of services agreements pursuant to which we render services, such as administrative, accounting, finance, treasury, legal services and others.
Chilean law applicable to public companies and financial groups and institutions and our by-laws provide for several procedures designed to ensure that the transactions entered into with or among our financial subsidiaries and/or affiliates do not deviate from prevailing market conditions for those types of transactions, including the requirement that our board of directors approve such transactions. Furthermore, all significant related party transactions must be approved by the Audit Committee and the Board. These significant transactions are also reported in our annual shareholders meeting. Please see Note 36 of our Audited Consolidated Financial Statements and “Item 7. Major Shareholders and Related Party Transactions.”
We are likely to continue to engage in transactions with our affiliates. Future conflicts of interests between us and any of affiliates, or among our affiliates, may arise, which conflicts are not required to be and may not be resolved in our favor.
We may not effectively manage risks associated with the replacement of benchmark indices.
Interest rate, equity, foreign exchange rate and other types of indices which are deemed to be “benchmarks” are the subject of increased regulatory scrutiny. For example, in 2017, the FCA announced that it will no longer persuade or compel banks to submit rates for the calculation of the London interbank offered rate (“LIBOR”) benchmark after 2021. This announcement indicates that the continuation of LIBOR on the current basis cannot and will not be guaranteed after 2021, and it appears likely that LIBOR will be discontinued or modified by 2021. This and other reforms may cause benchmarks to reform differently than in the past, or to disappear entirely, or have other consequences which cannot be fully anticipated which introduces a number of risks for the business. These risks include (i) legal risks arising from potential changes required to documentation for new and existing transactions; (ii) financial risks arising from any changes in the valuation of financial instruments linked to benchmark rates; (iii) pricing risks arising from how changes to benchmark indices could impact pricing mechanisms on some instruments; (iv) operational risks arising from the potential requirement to adapt IT systems, trade reporting infrastructure and operational processes; and (v) conduct risks arising from the potential impact of communication with customers and engagement during the transition period. The replacement benchmarks, and the timing of and mechanisms for implementation have not yet been confirmed by central banks. Although we currently do not have any bonds maturing after 2021 that use a LIBOR benchmark, it is not currently possible to determine whether, or to what extent, any such changes would affect us. However, the implementation of alternative benchmark rates may have a material adverse effect on our business, results of operations, financial condition and prospects.
Any failure to effectively improve or upgrade our information technology infrastructure and management information systems in a timely manner or any failure to successfully implement new IT regulations could have a material adverse effect on us.
Our ability to remain competitive depends in part on our ability to upgrade our information technology on a timely and cost-effective basis. We must continually make significant investments and improvements in our information technology infrastructure in order to remain competitive. We cannot assure you that in the future we will be able to maintain the level of capital expenditures necessary to support the improvement or upgrading of our information technology infrastructure. Any failure to effectively improve or upgrade our information technology infrastructure and management information systems in a timely manner could have a material adverse effect on us.
In addition, several new regulations are defining how to manage cyber risks and technology risks, how to report a data breach, and how the supervisory process should work, among others. These regulations are quite fragmented in terms of definitions, scope and applicability. A failure to successfully implement all or some of these new global and local regulations, that in some cases have severe sanctions regimes, could have a material adverse effect on us.
Risks relating to data collection, processing and storage systems and security are inherent in our business.
Like other financial institutions, we manage and hold confidential personal information of customers in the conduct of our banking operations, as well as a large number of assets. Accordingly, our business depends on the ability to process a large number of transactions efficiently and accurately, and on our ability to rely on our digital technologies, computer and email services, software and networks, as well as on the secure processing, storage and transmission of confidential sensitive personal data and other information using our computer systems and networks. The proper functioning of financial control, accounting or other data collection and processing systems is critical to our businesses and to our ability to compete effectively. Losses can result from inadequate personnel, inadequate or failed internal control processes and systems, or from external events that interrupt normal business operations. We also face the risk that the design of our controls and procedures prove to be inadequate or are circumvented such that our data and/or client records are incomplete, not recoverable or not securely stored. Although we work with our clients, vendors, service providers, counterparties and other third parties to develop secure data and information processing, storage and transmission capabilities to prevent against information security risk, we routinely manage personal, confidential and proprietary information by electronic means, and we may be the target of attempted cyber-attack. If we cannot maintain an effective and secure electronic data and information, management and processing system or we fail to maintain complete physical and electronic records, this could result in regulatory sanctions and serious reputational or financial harm to us.
We take protective measures and continuously monitor and develop our systems to protect our technology infrastructure, data and information from misappropriation or corruption, but our systems, software and networks nevertheless may be vulnerable to unauthorized access, misuse, computer viruses or other malicious code and other events that could have a security impact. An interception, misuse or mishandling of personal, confidential or proprietary information sent to or received from a client, vendor, service provider, counterparty or third party could result in legal liability, regulatory action, reputational harm and financial loss. There can be no absolute assurance that we will not suffer material losses from operational risk in the future, including those relating to any security breaches.
We have seen in recent years computer systems of companies and organizations being targeted, not only by cyber criminals, but also by activists and rogue states. We have been and continue to be subject to a range of cyber-attacks, such as denial of service, malware and phishing. Cyber-attacks could give rise to the loss of significant amounts of customer data and other sensitive information, as well as significant levels of liquid assets (including cash). In addition, cyber-attacks could disrupt our electronic systems used to service our customers. As attempted attacks continue to evolve in scope and sophistication, we may incur significant costs in order to modify or enhance our protective measures against such attacks, or to investigate or remediate any vulnerability or resulting breach, or in communicating cyber-attacks to our customers. If we fail to effectively manage our cyber security risk, e.g. by failing to update our systems and processes in response to new threats, this could harm our reputation and adversely affect our operating results, financial condition and prospects through the payment of customer compensation, regulatory penalties and fines and/or through the loss of assets. In addition, we may also be impacted by cyber-attacks against national critical infrastructures of the countries where we operate; for example, the telecommunications network. Our information technology systems are dependent on such national critical infrastructure and any cyber-attack against such critical infrastructure could negatively affect our ability to service our customers. As we do not operate such national critical infrastructure, we have limited ability to protect our information technology systems from the adverse effects of such a cyber-attack. For further information see “Item 11. Quantitative and Qualitative Disclosures about Market Risk—2. Non-financial risks—Cyber-security and data security plans.”
Although we have procedures and controls to safeguard personal information in our possession, unauthorized disclosures could subject us to legal actions and administrative sanctions as well as damages and reputational harm that could materially and adversely affect our operating results, financial condition and prospects. Further, our business is exposed to risk from potential non-compliance with policies, employee misconduct or negligence and fraud, which could result in regulatory sanctions and serious reputational or financial harm. It is not always possible to deter or prevent employee misconduct, and the precautions we take to detect and prevent this activity may not always be effective. In addition, we may be required to report events related to information security issues (including any cyber security issues), events where customer information may be compromised, unauthorized access and other security breaches, to the relevant regulatory authorities. Any material disruption or slowdown of our systems could cause information, including data related to customer requests, to be lost or to be delivered to our clients with delays or errors, which could reduce demand for our services and products, could produce customer claims and could materially and adversely affect us.
The Chilean Congress is currently discussing modifications to Law 20,009, which defines the scope of responsibility for users and issuers when a client’s cards and/or online payment or transfer user information are lost, stolen or fraudulently used (including through hacking and cloning). Cardholders are obligated to notify the bank through an easily accessible channel when their cards have been lost, stolen, or fraudulently used. Some members of Congress are proposing that for those transactions realized prior to the notice of loss or theft of a credit card, the cardholder must also notify the issuer of all of the unauthorized transactions in the same notice or up to five business days following the original notification. In cases of fraud, the user will not be responsible for the transactions that they did not authorize and which were made prior to the fraud notification within the 30 calendar days following the issuance of said notice. In these cases, some members of Congress are seeking that the issuer be responsible for assuming these costs or must demonstrate that the transaction was in fact authorized by the owner or user of the credit card. The law also considers increasing fines and jail time for those committing theft or fraud with credit cards, which must be legally pursued by the card issuer.
In light of these developments, we are trying to limit the exposure of our clients to credit card fraud through education, insurance coverage, marketing campaigns, daily transfer amount limits, chip technology, improved ATM software, and other technological improvements, but we cannot assure that this law will not increase the financial costs related to cybercrime and credit card fraud.
We rely on third parties and affiliates for important products and services.
Third party vendors and certain affiliated companies provide key components of our business infrastructure such as loan and deposit servicing systems, back office and business process support, information technology production and support, internet connections and network access. Relying on these third parties and affiliated companies can be a source of operational and regulatory risk to us, including with respect to security breaches affecting such parties. We are also subject to risk with respect to security breaches affecting the vendors and other parties that interact with these service providers. As our interconnectivity with these third parties and affiliated companies increases, we increasingly face the risk of operational failure with respect to their systems. We may be required to take steps to protect the integrity of our operational systems, thereby increasing our operational costs and potentially decreasing customer satisfaction. In addition, any problems caused by these third parties or affiliated companies, including as a result of them not providing us their services for any reason, or performing their services poorly, could adversely affect our ability to deliver products and services to customers and otherwise conduct our business, which could lead to reputational damage and regulatory investigations and intervention. Replacing these third party vendors could also entail significant delays and expense. Further, the operational and regulatory risk we face as a result of these arrangements may be increased to the extent that we restructure such arrangements. Any restructuring could involve significant expense to us and entail significant delivery and execution risk which could have a material adverse effect on our business, operations and financial condition.
Damage to our reputation could cause harm to our business prospects.
Maintaining a positive reputation is critical to protect our brand, attract and retain customers, investors and employees and conduct business transactions with counterparties. Damage to our reputation can therefore cause significant harm to our business and prospects. Harm to our reputation can arise from numerous sources, including, among others, employee misconduct, including the possibility of fraud perpetrated by our employees, litigation or regulatory enforcement, failure to deliver minimum standards of service and quality, compliance failures, unethical behavior, and the activities of customers and counterparties. Further, negative publicity regarding us may result in harm to our prospects.
Actions by the financial services industry generally or by certain members of, or individuals in, the industry can also affect our reputation. For example, the role played by financial services firms in the financial crisis and the seeming shift toward increasing regulatory supervision and enforcement has caused public perception of us and others in the financial services industry to decline.
We could suffer significant reputational harm if we fail to identify and manage potential conflicts of interest properly. The failure, or perceived failure, to adequately address conflicts of interest could affect the willingness of clients to deal with us, or give rise to litigation or enforcement actions against us. Therefore, there can be no assurance that conflicts of interest will not arise in the future that could cause material harm to us.
We may be the subject of misinformation and misrepresentations deliberately propagated to harm our reputation or for other deceitful purposes, or by profiteering short sellers seeking to gain an illegal market advantage by spreading false information about us. There can be no assurance that we will effectively neutralize and contain a false information that may be propagated regarding the business, which could have an adverse effect on our operating results, financial condition and prospects.
We rely on recruiting, retaining and developing appropriate senior management and skilled personnel.
Our continued success depends in part on the continued service of key members of our senior executive team and other key employees. The ability to continue to attract, train, motivate and retain highly qualified and talented professionals is a key element of our strategy. The successful implementation of our strategy and culture depends on the availability of skilled and appropriate management, both at our head office and at each of our business units. If we or one of our business units or other functions fails to staff its operations appropriately or loses one or more of its key senior executives or other key employees and fails to replace them in a satisfactory and timely manner, our business, financial condition and results of operations, including control and operational risks, may be adversely affected.
In addition, the financial industry has and may continue to experience more stringent regulation of employee compensation, which could have an adverse effect on our ability to hire or retain the most qualified employees. If we fail or are unable to attract and appropriately train, motivate and retain qualified professionals, our business may also be adversely affected.
We may not be able to detect or prevent money laundering and other financial crime activities fully or on a timely basis, which could expose us to additional liability and could have a material adverse effect on us.
We are required to comply with applicable anti-money laundering (“AML”), anti-terrorism, anti-bribery and corruption, sanctions and other laws and regulations applicable to us. These laws and regulations require us, among other things, to conduct full customer due diligence (including sanctions and politically-exposed person screening), keep our customer, account and transaction information up to date and have implemented financial crime policies and procedures detailing what is required from those responsible. We are also required to conduct AML training for our employees and to report suspicious transactions and activity to appropriate law enforcement following full investigation by our AML team.
Financial crime has become the subject of enhanced regulatory scrutiny and supervision by regulators globally. AML, anti-bribery and corruption and sanctions laws and regulations are increasingly complex and detailed. The Basel Committee is now introducing guidelines to strengthen the interaction and cooperation between prudential and AML/CFT supervisors. Compliance with these laws and regulations requires automated systems, sophisticated monitoring and skilled compliance personnel.
We have developedmaintain updated policies and procedures aimed at detecting and preventing the use of our banking network for money laundering and other financial crime related activities. However, emerging technologies, such as cryptocurrencies and blockchain, could limit our ability to track the movement of funds. Our ability to comply with the legal requirements depends on our ability to improve detection and reporting capabilities and reduce variation in control processes and oversight accountability. These require implementation and embedding within our business effective controls and monitoring, which in turn requires on-going changes to systems and operational activities. Financial crime is continually evolving and as noted is subject to increasingly stringent regulatory oversight and focus. This requires proactive and adaptable responses from us so that we are able to deter threats and criminality effectively. Even known threats can never be fully eliminated, and there will be instances where we may be used by other parties to engage in money laundering and other illegal or improper activities. In addition, we rely heavily on our employees to assist us by spotting such activities and reporting them, and our employees have varying degrees of experience in recognizing criminal tactics and understanding the level of sophistication of criminal organizations. Where we outsource any of our customer due diligence, customer screening or anti financial crime operations, we remain responsible and accountable for full compliance and any breaches. If we are unable to apply the necessary scrutiny and oversight of third parties to whom we outsource certain tasks and processes, there remains a risk of regulatory breach.
If we are unable to fully comply with applicable laws, regulations and expectations, our regulators and relevant law enforcement agencies have the ability and authority to impose significant fines and other penalties on us, including requiring a complete review of our business systems, day-to-day supervision by external consultants and ultimately the revocation of our banking license.
The reputational damage to our business and global brand would be severe if we were found to have breached AML, anti-bribery and corruption or sanctions requirements. Our reputation could also suffer if we are unable to protect our customers’ bank products and services from being used by criminals for illegal or improper purposes.
In addition, while we review our relevant counterparties’ internal policies and procedures with respect to such matters, we, to a large degree, rely upon our relevant counterparties to maintain and properly apply their own appropriate compliance procedures and internal policies. Such measures, procedures and internal policies may not be completely effective in preventing third parties from using our (and our relevant counterparties’) services as a conduit for illicit purposes (including illegal cash operations) without our (and our relevant counterparties’) knowledge. If we are associated with, or even accused of being associated with, breaches of AML, anti-terrorism or sanctions requirements, our reputation could suffer and/or we could become subject to fines, sanctions and/or legal enforcement (including being added to “black lists” that would prohibit certain parties from engaging in transactions with us), any one of which could have a material adverse effect on our operating results, financial condition and prospects.
Any such risks could have a material adverse effect on our operating results, financial condition and prospects.
35
We are subject to extensive regulation and regulatory and governmental oversight which could adversely affect our business, operations and financial condition.
As a financial institution, we are subject to extensive regulation, inspections, examinations, inquiries, audits and other regulatory requirements by Chilean regulatory authorities, which materially affect our businesses. We cannot assure you that we will be able to meet all of the applicable regulatory requirements and guidelines, or that we will not be subject to sanctions, fines, restrictions on our business or other penalties in the future as a result of noncompliance. If sanctions, fines, restrictions on our business, higher capital requirement or other penalties are imposed on us for failure to comply with applicable requirements, guidelines or regulations, our business, financial condition, results of operations and our reputation and ability to engage in business may be materially and adversely affected.
In their supervisory roles, the regulators seek to maintain the safety and soundness of financial institutions with the aim of strengthening the protection of customers and the financial system. The supervisors’ continuing supervision of financial institutions is conducted through a variety of regulatory tools, including the collection of information by way of prudential returns, reports obtained from skilled persons, visits to firms and regular meetings with management to discuss issues such as performance, risk management and strategy. In general, these regulators have a more outcome-focused regulatory approach that involves more proactive enforcement and more punitive penalties for infringement. As a result, we face increased supervisory scrutiny (resulting in increasing internal compliance costs and supervision fees), and in the event of a breach of our regulatory obligations we are likely to face more stringent regulatory fines.
Changes in regulations may also cause us to face increased compliance costs and limitations on our ability to pursue certain business opportunities and provide certain products and services. As some of the banking laws and regulations have been recently adopted, the manner in which those laws and related regulations are applied to the operations of financial institutions is still evolving. Moreover, to the extent these recently adopted regulations are implemented inconsistently in the various jurisdictions in which we operate, we may face higher compliance costs. No assurance can be given generally that laws or regulations will be adopted, enforced or interpreted in a manner that will not have a material adverse effect on our business and results of operations.
The main regulations and regulatory and governmental oversight that can adversely impact us include but are not limited to the following (see more details on “Item 4. Information on the Company—B. Business Overview—Regulation and Supervision”):
We are subject to regulation by the FMC and by the Central Bank with regard to certain matters, including reserve requirements, interest rates, foreign exchange mismatches and market risks. Chilean laws, regulations, policies and interpretations of laws relating to the banking sector and financial institutions are continually evolving and changing. Any new reforms could result in increased competition in the industry and thus may have a material adverse effect on our financial condition and results of operations.
Pursuant to the New General Banking Law, all Chilean banks may, subject to the approval of the FMC, engage in certain businesses other than commercial banking depending on the risk associated with such business and their financial strength. Such additional businesses include securities brokerage, mutual fund management, securitization, insurance brokerage, leasing, factoring, financial advisory, custody and transportation of securities, loan collection and financial services. The New General Banking Law also applies to the Chilean banking system a modified version of the capital adequacy guidelines issued by the Basel Committee on Banking Regulation and Supervisory Practices and limits the discretion of the FMC to deny new banking licenses. There can be no assurance that regulators will not in the future impose more restrictive limitations on the activities of banks, including us. Any such change could have a material adverse effect on our financial condition or results of operations.
Historically, Chilean banks have not paid interest on amounts deposited in checking accounts. We have begun to pay interest on some checking accounts under certain conditions. If competition or other factors lead us to pay higher interest rates on checking accounts, to relax the conditions under which we pay interest or to increase the number of checking accounts on which we pay interest, any such change could have a material adverse effect on our financial condition or results of operations.
36
The changes in the way banking institutions with economic difficulties should be treated shifts the focus from solving to anticipating potential adverse situations that may affect a bank or the banking system or that implies the dissolution and liquidation of a bank. To that extent banks will be obliged to inform the FMC whenever they are in any of a certain number of situations specified in the proposed bill and present an Early Regularization Plan for approval by the FMC. Banks in such situations will be able to undertake a preventive capital increase or receive a three-year term loan from another bank, which will be considered as capital. The creditors agreement considered in the current banking law is eliminated. In case the Regularization Plan fails or is not presented by the bank, the FMC will appoint a delegated inspector or eventually a Provisional Administrator. We cannot assure you that we will not incur in such situations in the future, which could have a material adverse impact on you.
We are exposed to risk of loss from legal and regulatory proceedings.
We face risk of loss from legal and regulatory proceedings, including tax proceedings, that could subject us to monetary judgments,judgements, regulatory enforcement actions, fines and penalties. The current regulatory and tax enforcement environment in the jurisdictions in which we operate reflects an increased supervisory focus on enforcement, combined with uncertainty about the evolution of the regulatory regime, and may lead to material operational and compliance costs.
We are from time to time subject to certain regulatory investigations and civil and tax claims, and party to certain legal proceedings incidental to the normal course of our business, including in connection with conflicts of interest, lending securities and derivatives activities, relationships with our employees and other commercial or tax matters. In view of the inherent difficulty of predicting the outcome of legal matters, particularly where the claimants seek very large or indeterminate damages, or where the cases present novel legal theories, involve a large number of parties or are in the early stages of investigation or discovery, we cannot state with confidencecertainty what the eventual outcome of these pending matters will be or what the eventual loss, fines or penalties related to each pending matter may be.
The amount of our reserves in respect of these matters is substantially less than the total amount of the claims asserted against us, and, in light of the uncertainties involved in such claims and proceedings, there is no assurance that the ultimate resolution of these matters will not significantly exceed the reserves currently accrued by us. As a result, the outcome of a particular matter may be material to our operating results for a particular period. At December 31, 2018,2020, we had provisions for legal contingencies of Ch$9231,024 million.
We are subject to market, operational and other related risks associated with our derivative transactions that could have a material adverse effect on us.RISK FACTORS IN RESPECT OF CHILE
We enter into derivative transactions for trading purposesPolitical, legal, regulatory and economic uncertainty arising from social unrest and the resulting social reforms, as well as for hedging purposes. Wethe referendum on Chile’s constitution could adversely impact the Bank’s business
During October 2019, growing public concern over perceived social inequality led to a rise in social unrest. There are subjectnumerous demands by the population, related to market, creditmore economic inclusion and operational risks associated with these transactions, including basis risk (the riskfairer social relationships. Important political and social actors claim that the social unrest reflects the desire of loss associated with variationsa new constitution, as Chile’s current constitution dates back to 1980. When the government announced the possibility of enacting a new constitution, there was increased volatility in the spread between the asset yieldChilean stock market and the funding and/or hedge cost) and credit or default risk (the risk of insolvency or other inabilityexchange rate fluctuations that resulted in a weakening of the counterpartyChilean peso against the U.S. dollar. The share prices on local banks and bond spreads, including Santander Chile, suffered significant declines in the market as social protests continued in the country. Seventy of the Bank’s branches suffered different levels of damages during this period but most of these costs were covered by insurance. There was also a rise in early non-performance levels among SMEs, mortgage and consumer loans due to a particular transaction to perform its obligations thereunder, including providing sufficient collateral).reduced working hours in the economy.
Market practicesIn November 2020, a referendum was held to vote on two matters: (i) whether a new constitution should be enacted and documentation(ii) if so, whether a constituent convention should be comprised of an elected mixed assembly of current Congress members and newly elected persons or entirely comprised of newly-elected citizens. This referendum resulted in ample support for derivative transactionsconvening a fully elected Constitutional Convention to draft Chile’s new constitution. The election of the members of this convention will be held in Chile may differ from thoseApril 2021. Each new article of the Constitution would have to be approved by two thirds of the convention. The Constitutional Convention will have approximately one year, starting in other countries. For example, documentation may not incorporate terms and conditionsApril 2021, to complete the draft of derivatives transactions as commonly understood in other countries. In addition, the execution and performance of these transactions depend on our abilityconstitution. An exit referendum with compulsory participation will then be held to maintain adequate control and administration systems. Moreover, our ability to adequately monitor, analyze and report derivative transactions continues to depend, largely, on our information technology systems. These factors further increaseratify the risks associated with these transactions and could have a material adverse effect on us.new constitution.
We are subject to counterparty risk in our banking business.
We are exposed to counterparty risk in addition to credit risks associated with lending activities. Counterparty risk may arise from, for example, investing in securities of third parties, entering into derivative contracts under which counterparties have obligations to make payments to us or executing securities, futures or currency trades that fail to settle at the required time due to non-delivery by the counterparty or systems failure by clearing agents, clearing houses or other financial intermediaries.
We routinely transact with counterparties in the financial services industry, including brokers and dealers, commercial banks, investment banks, mutual funds, hedge funds and other institutional clients. Defaults by, and even rumors or questions about the solvency of, certain financial institutions and the financial services industry generally have led to market-wide liquidity problems and could lead to losses or defaults by other institutions. ManyNews of the routine transactions we enter into expose usreferendum calmed markets and unrest levels have improved since then. The long-term effects of this social unrest are hard to significant credit risk in the event of default by one of our significant counterparties.
Our loan and investment portfolios are subject to risk of prepayment,predict, but could include slower economic growth, which could have a material adverse effect on us.
Our fixed rate loan and investment portfolios are subject to prepayment risk, which results fromadversely affect the ability of a borrower or issuer to pay a debt obligation prior to maturity. Generally, in a declining interest rate environment, prepayment activity increases, which reduces the weighted average lives of our earning assets and could have a material adverse effect on us. We would also be required to amortize net premiums into income over a shorter period of time, thereby reducing the corresponding asset yield and net interest income. Prepayment risk also has a significant adverse impact on credit card and collateralized mortgage loans, since prepayments could shorten the weighted average life of these assets, which may result in a mismatch in our funding obligations and reinvestment at lower yields. Prepayment risk is inherent to our commercial activity and an increase in prepayments or a reduction in prepayment fees could have a material adverse effect on us. The current administration is presently analyzing an initiative to reduce or limit prepayment fees and the Bank does not yet have an estimate of the potential impact of such initiatives. We cannot assure you that this change or any future regulatory changes related to prepayment fees will not have a material impact on our business.
A significant deterioration in economic conditions may make it more difficult for us to continue funding our business on favorable terms with institutional investors.
Large denominations of funding from time deposits, interbank loans or commercial paper from institutional investors may, under some circumstances, be a less stable source of funding than savings and bonds, such as during periods of significant changes in market interest rates for these types of deposit products and any resulting increased competition for such funds. As of December 31, 2018, short-term funding from institutional investors as defined by our Asset and Liability Committee totaled U.S.$2,747 billion or 4.9% of total liabilities and equity. Significant future market instability in global markets, specifically the Eurozone and the U.S., may negatively affect our ability to continue funding our business or maintain our current levels of funding without incurring higher funding costs or having to liquidate certain assets.
If we are unable to manage the growth of our operations, this could have an adverse impact on our profitability.
We allocate management and planning resources to develop strategic plans for organic growth, and to identify possible acquisitions and disposals and areas for restructuring our businesses. From time to time, we evaluate acquisition and partnership opportunities that we believe offer additional value to our shareholders and are consistent with our business strategy. However, we may not be able to identify suitable acquisition or partnership candidates, and our ability to benefit from any such acquisitions and partnerships will depend in part on our successful integration of those businesses. Any such integration entails significant risks such as unforeseen difficulties in integrating operations and systems and unexpected liabilities or contingencies relating to the acquired businesses, including legal claims. We can give no assurances that our expectations with regard to integration and synergies will materialize. We also cannot provide assurance that we will, in all cases, be able to manage our growth effectively or deliver our strategic growth objectives. Challenges that may result from our strategic growth decisions include our ability to:
Any failure to manage growth effectively could have a material adverse effect on our operating results, financial conditionBank’s profitability and prospects.
In addition, any acquisition or venture could result in the loss37
Table of key employees and inconsistencies in standards, controls, procedures and policies.Contents
Moreover, the success of the acquisition or venture will at least in part be subject to a number of political, economic and other factors that are beyond our control. Any of these factors, individually or collectively, could have a material adverse effect on us.
Risks Relating to Chile
Our growth, asset quality and profitability may be adversely affected by macroeconomic and political conditions in Chile.
A substantial number of our loans are to borrowers doing business in Chile. Chile’s economy has experienced significant volatility in recent decades, characterized, in some cases, by slow or regressive growth and declining investment and hyperinflation.investment. This volatility resulted in fluctuations in the levels of deposits and in the relative economic strength of various segments of the economies to which we lend. The Chilean economy may not continue to grow at similar rates as in the past or future developments may negatively affect Chile’s overall levels of economic activity.
Negative and fluctuating economic conditions, such as slowing or negative growth and a changing interest rate and inflationary environment, impact our profitability by causing lending margins to decrease and credit quality to decline and leading to decreased demand for higher margin products and services. Negative and fluctuating economic conditions in Chile could also result in government defaults on public debt. This could affect us in two ways: directly, through portfolio losses, and indirectly, through instabilities that a default in public debt could cause to the banking system as a whole, particularly since commercial banks’ exposure to government debt is high in Chile.
Our revenues are also subject to risk of loss from unfavorable political and diplomatic developments, social instability, and changes in governmental policies, including expropriation, nationalization, international ownership legislation, interest-rate caps and tax policies.
Any future fluctuation in oil prices may give rise to volatility in the global financial markets and further economic instability in oil-dependent regions, such as Chile. In addition, the ability of borrowers in or exposed to the oil sector has been and may be further adversely affected by such price fluctuations.
Our growth, asset quality and profitability may be adversely affected by volatile macroeconomic and political conditions in Chile.
Any material change to United States trade policy with respect to Chile could have a material adverse effect on the economy, which could in turn materially harm our financial condition and results of operations.
Portions of our loan portfolio are subject to risks relating to force majeure events and any such event could materially adversely affect our operating results.
Chile lies on the Nazca tectonic plate, making it one of the world’s most seismically active regions. Our financial and operating performance may be adversely affected by force majeure events, such as natural disasters, particularly in locations where a significant portion of our loan portfolio is composed of real estate loans. Natural disasters such as earthquakes and floods may cause widespread damage which could impair the asset quality of our loan portfolio and could have an adverse impact on the economy of the affected region.
Changes in taxes, including the corporate tax rate, in Chile may have an adverse effect on us and our clients.
The Chilean Government enacted various tax reforms in 2014, 2016 and again in 2016 a reform to the tax and other assessment regimes to which we are subject2020 in order to finance greater expenditure in education.social expenditures. The most relevant change was the rise inof the corporate tax rate to 27% by 2018 and the introductionin 2018. There is currently discussion of two corporate taxation regimes (Sistema Parcialmente Integrado(SIP or Semi-Integrated Regime) and theSistema de Renta Atribuida(Attributed Income Regime). However, a corporation such as Banco Santander-Chile with a majority of shareholders that are incorporated entities is obliged to adhere to the Semi-Integrated Regime. The statutory tax rate rose to 27% in 2018, with personal and withholding taxes imposed on a cash basis (when dividends are distributed), therefore retaining some benefits for shareholders of companies that reinvest profits.
Furthermore, on August 23, 2018, the President of Chile sent to the National Congress Bill No. 107-366 containing the Tax Modernization Project. Among its changes, this bill proposes a single, fully integrated tax regime with a Corporate Income Tax (“CIT”) rate of 27% and under which CIT paid would be fully creditable against tax imposed on the shareholder. If this bill becomes effective, the Attributed Income Regime (Sistema de Renta Atribuida) and the Semi-Integrated Regime (Sistema Parcialmente Integrado) introduced by the previousanother tax reform would be repealed. This bill is still under consideration beforeto finance the Chilean National Congress and, thus, the proposed reforms are not currently in force.
growing deficit. We cannot predict at this time if these reforms will have a material impact on our business or clients or if further tax reforms will be implemented in the future. Banco Santander Chile’s effective corporate tax rate could rise in the future, which may have an adverse impact on our results of operations. Please see “Item 10—Additional information—E. Taxation” for more information regarding the impacts of this tax reform on ADR holders.
Developments in other countries may affect us, including the prices for our securities.
The prices of securities issued by Chilean companies, including banks, are influenced to varying degrees by economic and market considerations in other countries. We cannot assure you that future developments in or affecting the Chilean economy, including consequences of economic difficulties in other markets, will not materially and adversely affect our business, financial condition or results of operations.
38
We are exposed to risks related to the weakness and volatility of the economic and political situation in Asia, the United States, Europe (including Spain, where Santander Spain, our controlling shareholder, is based), Brazil, Argentina and other nations. Although economic conditions in Europe and the United States may differ significantly from economic conditions in Chile, investors’ reactions to developments in these other countries may have an adverse effect on the market value of securities of Chilean issuers. In particular, investor perceptions of the risks associated with our securities may be affected by perception of risk conditions in Spain.
If these, or other nations’ economic conditions deteriorate, the economy in Chile, as both a neighboring country and a trading partner, could also be affected and could experience slower growth than in recent years, with possible adverse impact on our borrowers and counterparties. If this were to occur, we would potentially need to increase our allowances for loan losses, thus affecting our financial results, our results of operations and the price of our securities.securities As of December 31, 2018, approximately 2.6%2020, the Bank’s foreign exposure, including counterparty risk in the derivative instruments’ portfolio, was US$ 2,309 million or 3.7% of our assets were held abroad.total assets. There can be no assurance that the ongoing effects of a global financial crisis will not negatively impact growth, consumption, unemployment, investment and the price of exports in Chile. Crises and political uncertainties in other Latin American countries could also have an adverse effect on Chile, the price of our securities or our business.
Chile has considerable economic ties with China, the United States and Europe. In 2018,2020, approximately 32.2%37.2% of Chile’s exports went to China, mainly copper. China’s economy has grown at a strong pace in recent times, but a slowdown in economic activity in China may affect Chile’s GDP and export growth as well as the price of copper, which is Chile’s main export. Chile exported approximately 14.6%14.0% of total exports to the United States and 14.6%8.8% to Europe in 2018.2020.
Chile was recently involved in international litigation with Bolivia regarding maritime borders. We cannot assure you that crises and political uncertainty in other Latin American countries will not have an adverse effect on Chile, the price of our securities or our business.
Fluctuations in the rate of inflation may affect our results of operations.
High levels of inflation in Chile could adversely affect the Chilean economy and have an adverse effect on our business, financial condition and results of operations. Extended periods of deflation could also have an adverse effect on our business, financial condition and results of operations. In 2009, Chile experienced deflation of 1.4% as the global economy contracted. In 2018, CPI inflation was 2.6% compared to 2.3% in 2017.
Our assets and liabilities are denominated in Chilean pesos, UF and foreign currencies. The UF is revalued in monthly cycles. On each day in the period beginning on the tenth day of any given month through the ninth day of the succeeding month, the nominal peso value of the UF is indexed up (or down in the event of deflation) in order to reflect a proportionate amount of the change in the Chilean Consumer Price Index during the prior calendar month. For more information regarding the UF, see “Item 5. Operating and Financial Review and Prospects—A. Operating Results—Impact of Inflation.” Although we benefit from inflation in Chile due to the current structure of our assets and liabilities (i.e., a significant portion of our loans are indexed to the inflation rate, but there are no corresponding features in deposits, or other funding sources that would increase the size of our funding base), there can be no assurance that our business, financial condition and result of operations in the future will not be adversely affected by changing levels of inflation, including from extended periods of inflation that adversely affect economic growth or periods of deflation.
Any change in the methodology of how the CPI index or the UF is calculated could also adversely affect our business, financial condition and results of operations.
Currency fluctuations could adversely affect our financial condition and results of operations and the value of our securities.
Any future changes in the value of the Chilean peso against the U.S. dollar will affect the U.S. dollar value of our securities. The Chilean peso has been subject to large devaluations and appreciations in the past and could be subject to significant fluctuations in the future. Our results of operations may be affected by fluctuations in the exchange rates between the peso and the dollar despite our policy and Chilean regulations relating to the general avoidance of material exchange rate exposure. In order to avoid material exchange rate exposure, we enter into forward exchange transactions. The following table shows the value of the Chilean peso relative to the U.S. dollar as reported by the Central Bank at year end for the last five years and the devaluation or appreciation of the peso relative to the U.S. dollar in each of those years.
| Year | Exchange rate (Ch$) at year end | Devaluation (Appreciation) (%) | |||||
| 2015 | 707.34 | 16.5 | |||||
| 2016 | 667.29 | (5.7 | ) | ||||
| 2017 | 615.22 | (7.8 | ) | ||||
| 2018 | 695.69 | 13.1 | |||||
| 2019 (through March 19, 2019) | 667.21 | (4.0 | ) | ||||
Source: Central Bank.
We may decide to change our policy regarding exchange rate exposure. Regulations that limit such exposures may also be amended or eliminated. Greater exchange rate risk will increase our exposure to the devaluation of the peso, and any such devaluation may impair our capacity to service foreign currency obligations and may, therefore, materially and adversely affect our financial condition and results of operations. Notwithstanding the existence of general policies and regulations that limit material exchange rate exposures, the economic policies of the Chilean government and any future fluctuations of the peso against the dollar could affect our financial condition and results of operations.
We are subject to substantial regulation and regulatory and governmental oversight which could adversely affect our business, operations and financial condition.
As a financial institution, we are subject to extensive regulation, which materially affects our businesses. Therefore, the statutes, regulations and policies to which we are subject may be changed at any time. In addition, the interpretation and the application by regulators of the laws and regulations to which we are subject may also change from time to time. In the wake of the global financial crisis of 2008, the financial services industry continues to experience significant financial regulatory reform in jurisdictions outside of Chile that directly or indirectly affect our business, including Spain, the UK, the European Union, the United States, Latin America and other jurisdictions. Changes to current legislation and their implementation through regulation (including additional capital, leverage, funding, liquidity and tax requirements), policies (including fiscal and monetary policies established by central banks and financial regulators, and changes to global trade policies), and other legal and regulatory actions may impose additional regulatory burden on Santander Group, including Santander-Chile, in these jurisdictions. The manner in which these laws and related regulations are applied to the operations of financial institutions is still evolving. Moreover, to the extent these recently adopted regulations are implemented inconsistently in the various jurisdictions in which we operate we may face higher compliance costs.
Any legislative or regulatory actions and any required changes to our business operations resulting from such legislation and regulations, as well as any deficiencies in our compliance with such legislation and regulation, could result in significant loss of revenue, limit our ability to pursue business opportunities in which we might otherwise consider engaging and provide certain products and services, affect the value of assets that we hold, require us to increase our prices and therefore reduce demand for our products, impose additional compliance and other costs on us or otherwise adversely affect our businesses. In particular, legislative or regulatory actions resulting in enhanced prudential standards, in particular with respect to capital and liquidity, could impose a significant regulatory burden on the Bank or on its bank subsidiaries and could limit the bank subsidiaries’ ability to distribute capital and liquidity to the Bank, thereby negatively impacting the Bank. Future liquidity standards could require the Bank to maintain a greater proportion of its assets in highly-liquid but lower-yielding financial instruments, which would negatively affect its net interest margin. Moreover, the Bank’s regulatory authorities, as part of their supervisory function, periodically review the Bank’s allowance for loan losses. Such regulators may require the Bank to increase its allowance for loan losses or to recognize further losses. Any such additional provisions for loan losses, as required by these regulatory agencies, whose views may differ from those of the Bank’s management, could have an adverse effect on the Bank’s earnings and financial condition. Accordingly, there can be no assurance that future changes in regulations or in their interpretation or application will not adversely affect us.
The wide range of regulations, actions and proposals which most significantly affect the Bank, or which could most significantly affect the Bank in the future, relate to capital requirements, funding and liquidity and regulatory reforms in Chile, and are discussed in further detail below. These and other regulatory reforms adopted or proposed in the wake of the financial crisis have increased and may continue to materially increase our operating costs and negatively impact our business model. Furthermore, regulatory authorities have substantial discretion in how to regulate banks, and this discretion, and the means available to the regulators, have been increasing during recent years. Regulation may be imposed on an ad hoc basis by governments and regulators in response to a crisis. In addition, the volume, granularity, frequency and scale of regulatory and other reporting requirements necessitate a clear data strategy to enable consistent data aggregation, reporting and management. Inadequate management information systems or processes, including those relating to risk data aggregation and risk reporting, could lead to a failure to meet regulatory reporting requirements or other internal or external information demands and we may face supervisory measures as a result.
The main regulations and regulatory and governmental oversight that can adversely impact us include but are not limited to the following (see more details on “Item 4. Information on the Company—B. Business Overview—Regulation and Supervision”):
We are subject to regulation by the SBIF and by the Central Bank with regard to certain matters, including reserve requirements, interest rates, foreign exchange mismatches and market risks. Chilean laws, regulations, policies and interpretations of laws relating to the banking sector and financial institutions are continually evolving and changing. Any new reforms could result in increased competition in the industry and thus may have a material adverse effect on our financial condition and results of operations.
Pursuant to the General Banking Law, all Chilean banks may, subject to the approval of the FMC, engage in certain businesses other than commercial banking depending on the risk associated with such business and their financial strength. Such additional businesses include securities brokerage, mutual fund management, securitization, insurance brokerage, leasing, factoring, financial advisory, custody and transportation of securities, loan collection and financial services. The General Banking Law also limits the discretion of the FMC to deny new banking licenses. There can be no assurance that regulators will not in the future impose more restrictive limitations on the activities of banks, including us. Any such change could have a material adverse effect on our financial condition or results of operations.
Historically, Chilean banks have not paid interest on amounts deposited in checking accounts. We have begun to pay interest on some checking accounts under certain conditions. If competition or other factors lead us to pay higher interest rates on checking accounts, to relax the conditions under which we pay interest or to increase the number of checking accounts on which we pay interest, any such change could have a material adverse effect on our financial condition or results of operations.
On November 20, 2013, the Chilean Congress approved new legislation to reduce the maximum rates that can be charged on loans. This new legislation is aimed at loans of less than UF50 (U.S.$1,975) and between UF50 and UF200 (U.S.$7,901) and with a term of more than 90 days, and thus includes consumer loans in installments, lines of credit and credit card lines. Previously, the maximum interest rate for loans of less than UF200 and with a term of more than 90 days was calculated as the average rate of all transactions undertaken within the banking industry over the previous month of loans of less than UF200 and with a term of more than 90 days, multiplied by a factor of 1.5. The objective was to lower the maximum rate to a level closer to the average interest rate for loans between UF200 (U.S.$7,901) to UF5,000 (U.S.$197,531) plus 14%, unless the flow of new loans in the industry decreases by 10%-20%, in which case the reduction will be partially or completely suspended until the next period. The average and maximum rates are published daily by the SBIF. By year-end 2018, the maximum rate for loans equal or lower than UF50 (U.S.$1,975) was 35.58%. The maximum rate for loans between UF50 (U.S.$1,975) and UF200 (U.S.$7,901) was 28.58%.
In January 2019, the New General Banking Law was passed by the Chilean government. Among other things, the New General Banking Law provides new minimum capital requirements in line with Basel III regulations, new regulations regarding the SBIF’s corporate governance and its absorption by the FMC, FMC and new rules regarding bank liquidation. The rules governing the functioning of Banks and the regulatory oversight of banks will pass from the SBIF to the FMC under the rules of the New General Banking Law. The absorption of the SBIF by the FMC is expected to take place on June 1, 2019.
A change in labor laws in Chile or a worsening of labor relations in the Bank could impact our business.
As of December 31, 2018,2020 on a consolidated basis, we had 11,305 employees. We have traditionally enjoyed good relations with our10,470 employees, and their unions. Of the total headcount of us and our subsidiaries, 8,487 or 75.1%which 73.4% were unionized as of December 31, 2018.unionized. In February 2018,2021, a new collective bargaining agreement was signed with the main unions ahead of schedule, which becamewill be effective on September 1, 20182021 and expires on AugustDecember 31, 2021, though it may2024.
There is currently a new labor reform being discussed in Congress, which, among other items, shortens the work week from 45 hours to 40 hours, excluding the lunch break. There is also be renegotiated ahead of schedule withdiscussion to increase minimum wage currently set at Ch$301,000/month (US$415/month) by up to 50%. At Santander Chile, the consent of management andweekly working hours agreed under the union. We generally apply the terms of our collective bargaining agreement to unionizedare 40 hours, excluding lunch, and non-unionized employees. We have traditionally had good relations with our employees and their unions, butminimum wage is set above the legal minimum. Despite this, we cannot assure youat this time that in the future, a strengthening of cross-industrynew labor movementsreform will not materially and adversely affect our business, financial condition or results of operations.
Congress passed a new labor law in 2016 that became effective April 1, 2017. The main points included in this law are:
The Bank currently has a high unionization level and good labor relations. At this time, we are unable to estimate thehave material impact these new regulations will have on labor relations and costs. The Chilean Congress is currently considering new labor and pension law reforms, which were designed to flexibilize the labor market and to increase employers’ contribution to pension savings. Such new legislation could have an adverse effect on our business, results of operation or financial condition in the future.expenses.
These and any additional legislative or regulatory actions in Chile, Spain, the European Union, the United States or other countries, and any required changes to our business operations resulting from such legislation and regulations, could result in reduced capital availability, significant loss of revenue, limit our ability to continue organic growth (including increased lending), pursue business opportunities in which we might otherwise consider engaging and provide certain products and services, affect the value of assets that we hold, require us to increase our prices and therefore reduce demand for our products, impose additional costs on us or otherwise adversely affect our businesses. Accordingly, we cannot provide assurance that any such new legislation or regulations would not have an adverse effect on our business, results of operations or financial condition in the future.
39
Our corporate disclosure may differ from disclosure regularly published by issuers of securities in other countries, including the United States.
Issuers of securities in Chile are required to make public disclosures that are different from, and that may be reported under presentations that are not consistent with, disclosures required in other countries, including the United States. In particular, as a Chilean regulated financial institution, we are required to submit to the SBIFFMC on a monthly basis unaudited consolidated balance sheets and income statements, excluding any note disclosure, prepared in accordance with Chilean Bank GAAP as issued by the SBIF.FMC. This disclosure differs in a number of significant respects from generally accepted accounting principles in the United States and information generally available in the United States with respect to U.S. financial institutions or IFRS. In addition, as a foreign private issuer, we are not subject to the same disclosure requirements in the United States as a domestic U.S. registrant under the Exchange Act, including the requirements to prepare and issue quarterly reports, the proxy rules applicable to domestic U.S. registrants under Section 14 of the Exchange Act or the insider reporting and short-swing profit rules under Section 16 of the Exchange Act. Accordingly, the information about us available to you will not be the same as the information available to shareholders of a U.S. company and may be reported in a manner that you are not familiar with.
Chile imposes controls on foreign investmentRisks FACTORS IN RESPECT OF Our Controlling Shareholder and repatriation of investments that may affect your investment in, and earnings from, our ADSs.
Equity investments in Chile by persons who are not Chilean residents have generally been subject to various exchange control regulations, which restrict the repatriation of the investments and earnings therefrom. In April 2001, the Central Bank eliminated the regulations that affected foreign investors, except that investors are still required to provide the Central Bank with information relating to equity investments and conduct such operations within Chile’s Formal Exchange Market. The ADSs are subject to a contract, dated May 17, 1994, among the Depositary, us and the Central Bank (the “Foreign Investment Contract”) that remains in full force and effect. The ADSs continue to be governed by the provisions of the Foreign Investment Contract subject to the regulations in existence prior to April 2001. The Foreign Investment Contract grants the Depositary and the holders of the ADSs access to the Formal Exchange Market, which permits the Depositary to remit dividends it receives from us to the holders of the ADSs. The Foreign Investment Contract also permits ADS holders to repatriate the proceeds from the sale of shares of our common stock withdrawn from the ADR facility, or that have been received free of payment as a consequence of spin offs, mergers, capital increases, wind ups, share dividends or preemptive rights transfers, enabling them to acquire the foreign currency necessary to repatriate earnings from such investments. Pursuant to Chilean law, the Foreign Investment Contract cannot be amended unilaterally by the Central Bank, and there are judicial precedents (although not binding with respect to future judicial decisions) indicating that contracts of this type may not be abrogated by future legislative changes or resolutions of the Advisory Council of the Central Bank. Holders of shares of our common stock, except for shares of our common stock withdrawn from the ADS facility or received in the manner described above, are not entitled to the benefits of the Foreign Investment Contract, may not have access to the Formal Exchange Market, and may have restrictions on their ability to repatriate investments in shares of our common stock and earnings therefrom.
Holders of ADSs are entitled to receive dividends on the underlying shares to the same extent as the holders of shares. Dividends received by holders of ADSs will be paid net of foreign currency exchange fees and expenses of the Depositary and will be subject to Chilean withholding tax, currently imposed at a rate of 35.0% (subject to credits in certain cases). If for any reason, including changes in Chilean law, the Depositary were unable to convert Chilean pesos to U.S. dollars, investors would receive dividends and other distributions, if any, in Chilean pesos.
We cannot assure you that additional Chilean restrictions applicable to holders of our ADSs the disposition of the shares underlying them or the repatriation of the proceeds from such disposition or the payment of dividends will not be imposed in the future, nor can we advise you as to the duration or impact of such restrictions if imposed.
Investors may find it difficult to enforce civil liabilities against us or our directors, officers and controlling persons.
We are a Chilean corporation. None of our directors are residents of the United States and most of our executive officers reside outside of the United States. In addition, all or a substantial portion of our assets and the assets of our directors and executive officers are located outside of the United States. Although we have appointed an agent for service of process in any action against us in the United States with respect to our ADSs, none of our directors, officers or controlling persons has consented to service of process in the United States or to the jurisdiction of any United States court. As a result, it may be difficult for investors to effect service of process within the United States on such persons.
It may also be difficult for ADS holders to enforce in the United States or in Chilean courts money judgments obtained in United States courts against us or our directors and executive officers based on civil liability provisions of the U.S. federal securities laws. If a U.S. court grants a final money judgment in an action based on the civil liability provisions of the federal securities laws of the United States, enforceability of this money judgment in Chile will be subject to the obtaining of the relevant “exequatur” (i.e.(i.e., recognition and enforcement of the foreign judgment) according to Chilean civil procedure law currently in force, and consequently, subject to the satisfaction of certain factors. The most important of these factors are the existence of reciprocity, the absence of a conflicting judgment by a Chilean court relating to the same parties and arising from the same facts and circumstances and the Chilean courts’ determination that the U.S. courts had jurisdiction, that process was appropriately served on the defendant and that enforcement would not violate Chilean public policy. Failure to satisfy any of such requirements may result in non-enforcement of your rights.
Risks Relating to Our Controlling Shareholder and our ADSs
Our controlling shareholder has a great deal of influence over our business and its interests could conflict with yours.
Santander Spain our controlling shareholder, controls Santander-Chile through its holdings in Teatinos Siglo XXI Inversiones S.A. and Santander Chile Holding S.A., which are controlled subsidiaries. Santander Spain has control over 67.18% of our shares and actual participation, excluding non-controlling shareholders that participate in Santander Chile Holding, S.A. of 67.12%.
Due to its share ownership, our controlling shareholder has the ability to control us and our subsidiaries, including the ability to:
| elect the majority of the directors and exercise control over our company and subsidiaries; |
| cause the appointment of our principal officers; |
40
| declare the payment of any dividends; |
| agree to sell or otherwise transfer its controlling stake in us; and |
| determine the outcome of substantially all actions requiring shareholder approval, including amendments of our by-laws, transactions with related parties, corporate reorganizations, acquisitions and disposals of assets and issuance of additional equity securities, if any. |
In December 2012, primarily in response to the requirements of the European Banking Authority, the Bank of Spain and regulators in various jurisdictions, Santander Spain adopted a corporate governance framework (Marco de Gobierno Interno del Grupo Santander). The purpose of the framework is to organize and standardize the corporate governance practices of Santander Spain and its most significant subsidiaries, including us. Our Board of Directors approved the adoption of this corporate governance framework in July 2013, subject to certain overarching principles, such as the precedence of applicable laws and regulations over the framework to the extent they are in conflict. See “Item 16G. Corporate Governance.” Our adoption of this framework may increase Santander Spain’s control over us.
We operate as a stand-alone subsidiary within the Santander Group. Our controlling shareholder has no liability for our banking operations, except for the amount of its holdings of our capital stock. The interests of Santander Spain may differ from the interests of our other shareholders, and the concentration of control in Santander Spain may differ from the interests of our other shareholders, and the concentration of control in Santander Spain will limit other shareholders’ ability to influence corporate matters. As a result, we may take actions that our other shareholders do not view as beneficial.
Our status as a controlled company and a foreign private issuer exempts us from certain of the corporate governance standards of the New York Stock Exchange (“NYSE”), limiting the protections afforded to investors.
We are a “controlled company” and a “foreign private issuer” within the meaning of the NYSE corporate governance standards. Under the NYSE rules, a controlled company is exempt from certain NYSE corporate governance requirements. In addition, a foreign private issuer may elect to comply with the practice of its home country and not to comply with certain NYSE corporate governance requirements, including the requirements that (1) a majority of the board of directors consist of independent directors, (2) a nominating and corporate governance committee be established that is composed entirely of independent directors and has a written charter addressing the committee’s purpose and responsibilities, (3) a compensation committee be established that is composed entirely of independent directors and has a written charter addressing the committee’s purpose and responsibilities and (4) an annual performance evaluation of the nominating and corporate governance and compensation committees be undertaken. Although we have similar practices, they do not entirely conform to the NYSE requirements for U.S. issuers; therefore, we currently use these exemptions and intend to continue using them. Accordingly, you will not have the same protections afforded to shareholders of companies that are subject to all NYSE corporate governance requirements.
There may be a lack of liquidity and market for our shares and ADSs.
Our ADSs are listed and traded on the NYSE (under the ticker “BSAC”). Our common stock is listed and traded on the Santiago Stock Exchange (under the ticker “BSANTANDER”), which we refer to as the Chilean Stock Exchange, although the trading market for the common stock is small by international standards. At December 31, 2018,2020, we had 188,446,126,794 shares of common stock outstanding. The Chilean securities markets are substantially smaller, less liquid and more volatile than major securities markets in the United States. According to Article 14 of the Ley de Mercado de Valores, Ley No. 18,045, or the Chilean Securities Market Law, FMC may suspend the offer, quotation or trading of shares of any company listed on one or more Chilean stock exchanges for up to 30 days if, in its opinion, such suspension is necessary to protect investors or is justified for reasons of public interest. Such suspension may be extended for up to 120 days. If, at the expiration of the extension, the circumstances giving rise to the original suspension have not changed, the FMC will then cancel the relevant listing in the registry of securities. In addition, the Santiago Stock Exchange may inquire as to any movement in the price of any securities in excess of 10% and suspend trading in such securities for a day if it deems necessary.
Although our common stock is traded on the Chilean Stock Exchange, there can be no assurance that a liquid trading market for our common stock will continue to exist. Approximately 33.0% of our outstanding common stock is held by the public (i.e., shareholders other than Santander Spain and its affiliates), including our shares that are represented by ADSs trading on the NYSE. A limited trading market in general and our concentrated ownership in particular may impair the ability of an ADS holder to sell in the Chilean market shares of common stock obtained upon withdrawal of such shares from the ADR facility in the amount and at the price and time such holder desires, and could increase the volatility of the price of the ADSs.
41
Chile imposes controls on foreign investment and repatriation of investments that may affect your investment in, and earnings from, our ADSs.
Equity investments in Chile by persons who are not Chilean residents have generally been subject to various exchange control regulations, which restrict the repatriation of the investments and earnings therefrom. In April 2001, the Central Bank eliminated the regulations that affected foreign investors, except that investors are still required to provide the Central Bank with information relating to equity investments and conduct such operations within Chile’s Formal Exchange Market. The ADSs are subject to a contract, dated May 17, 1994, among the Depositary, us and the Central Bank (the “Foreign Investment Contract”) that remains in full force and effect. The ADSs continue to be governed by the provisions of the Foreign Investment Contract subject to the regulations in existence prior to April 2001. The Foreign Investment Contract grants the Depositary and the holders of the ADSs access to the Formal Exchange Market, which permits the Depositary to remit dividends it receives from us to the holders of the ADSs. The Foreign Investment Contract also permits ADS holders to repatriate the proceeds from the sale of shares of our common stock withdrawn from the ADR facility, or that have been received free of payment as a consequence of spin offs, mergers, capital increases, wind ups, share dividends or preemptive rights transfers, enabling them to acquire the foreign currency necessary to repatriate earnings from such investments. Pursuant to Chilean law, the Foreign Investment Contract cannot be amended unilaterally by the Central Bank, and there are judicial precedents (although not binding with respect to future judicial decisions) indicating that contracts of this type may not be abrogated by future legislative changes or resolutions of the Advisory Council of the Central Bank. Holders of shares of our common stock, except for shares of our common stock withdrawn from the ADS facility or received in the manner described above, are not entitled to the benefits of the Foreign Investment Contract, may not have access to the Formal Exchange Market, and may have restrictions on their ability to repatriate investments in shares of our common stock and earnings therefrom.
Holders of ADSs are entitled to receive dividends on the underlying shares to the same extent as the holders of shares. Dividends received by holders of ADSs will be paid net of foreign currency exchange fees and expenses of the Depositary and will be subject to Chilean withholding tax, currently imposed at a rate of 35.0% (subject to credits in certain cases). If for any reason, including changes in Chilean law, the Depositary were unable to convert Chilean pesos to U.S. dollars, investors would receive dividends and other distributions, if any, in Chilean pesos.
We cannot assure you that additional Chilean restrictions applicable to holders of our ADSs, the disposition of the shares underlying them or the repatriation of the proceeds from such disposition or the payment of dividends will not be imposed in the future, nor can we advise you as to the duration or impact of such restrictions if imposed.
You may be unable to exercise preemptive rights.
TheLey Sobre Sociedades Anónimas, Ley No. 18,046 and theReglamento de Sociedades Anónimas, which we refer to collectively as the Chilean Companies Law, and applicable regulations require that whenever we issue new common stock for cash, we grant preemptive rights to all of our shareholders (including holders of ADSs), giving them the right to purchase a sufficient number of shares to maintain their existing ownership percentage. Such an offering would not be possible in the United States unless a registration statement under the U.S. Securities Act of 1933 (“Securities Act”), as amended, were effective with respect to such rights and common stock or an exemption from the registration requirements thereunder were available.
Since we are not obligated to make a registration statement available with respect to such rights and the common stock, you may not be able to exercise your preemptive rights in the United States. If a registration statement is not filed or an applicable exemption is not available under U.S. securities law, the Depositary will sell such holders’ preemptive rights and distribute the proceeds thereof if a premium can be recognized over the cost of any such sale.
As a holder of ADSs you will have different shareholders’ rights than in the United States and certain other jurisdictions.
Our corporate affairs are governed by our estatutos, or by-laws, and the laws of Chile, which may differ from the legal principles that would apply if we were incorporated in a jurisdiction in the United States or in certain other jurisdictions outside Chile. Under Chilean corporate law, you may have fewer and less well-defined rights to protect your interests than under the laws of other jurisdictions outside Chile. For example, under legislation applicable to Chilean banks, our shareholders would not be entitled to appraisal rights in the event of a merger or other business combination undertaken by us.
Although Chilean corporate law imposes restrictions on insider trading and price manipulation, the form of these regulations and the manner of their enforcement may differ from that in the U.S. securities markets or markets in certain other jurisdictions. In addition, in Chile, self-dealing and the preservation of shareholder interests may be regulated differently, which could potentially disadvantage you as a holder of the shares underlying ADSs.
42
Holders of ADSs may find it difficult to exercise voting rights at our shareholders’ meetings.
Holders of ADSs will not be our direct shareholders and will be unable to enforce directly the rights of shareholders under our by-laws and the laws of Chile. Holders of ADSs may exercise voting rights with respect to the common stock represented by ADSs only in accordance with the deposit agreement governing the ADSs. Holders of ADSs will face practical limitations in exercising their voting rights because of the additional steps involved in our communications with ADS holders. Holders of our common stock will be able to exercise their voting rights by attending a shareholders’ meeting in person or voting by proxy. By contrast, holders of ADSs will receive notice of a shareholders’ meeting by mail from the Depositary following our notice to the Depositary requesting the Depository to do so. To exercise their voting rights, holders of ADSs must instruct the Depositary on a timely basis on how they wish to vote. This voting process necessarily will take longer for holders of ADSs than for holders of our common stock. If the Depositary fails to receive timely voting instructions for all or part of the ADSs, the Depositary will assume that the holders of those ADSs are instructing it to give a discretionary proxy to a person designated by us to vote their ADSs, except in limited circumstances.
Holders of ADSs also may not receive the voting materials in time to instruct the Depositary to vote the common stock underlying their ADSs. In addition, the Depositary and its agents are not responsible for failing to carry out voting instructions of the holders of ADSs or for the manner of carrying out those voting instructions. Accordingly, holders of ADSs may not be able to exercise voting rights, and they will have little, if any, recourse if the common stocks underlying their ADSs are not voted as requested.
ADS holders may be subject to additional risks related to holding ADSs rather than shares.
Because ADS holders do not hold their shares directly, they are subject to the following additional risks, among others:
| as an ADS holder, you may not be able to exercise the same shareholder rights as a direct holder of ordinary shares; |
| we and the Depositary may amend or terminate the deposit agreement without the ADS holders’ consent in a manner that could prejudice ADS holders or that could affect the ability of ADS holders to transfer ADSs; and |
| the Depositary may take or be required to take actions under the Deposit Agreement that may have adverse consequences for some ADS holders in their particular circumstances. |
GENERAL RISK FACTORS
Disclosure controls and procedures over financial reporting may not prevent or detect all errors or acts of fraud.
Disclosure controls and procedures, including internal controls, over financial reporting are designed to provide reasonable assurance that information required to be disclosed by the company in reports filed or submitted under the Securities Exchange Act of 1934 (the “Exchange Act”) is accumulated and communicated to management, and recorded, processed, summarized and reported within the time periods specified in the SEC’s US Securities and Exchange Commission’s rules and forms.
These disclosure controls and procedures have inherent limitations, which include the possibility that judgements in decision-making can be faulty and that breakdowns can occur because of errors or mistakes. Additionally, controls can be circumvented by any unauthorized override of the controls. Consequently, our businesses are exposed to risk from potential non-compliance with policies, employee misconduct or negligence and fraud, which could result in regulatory sanctions, civil claims and serious reputational or financial harm. In recent years, a number of multinational financial institutions have suffered material losses due to the actions of ‘rogue traders’ or other employees. It is not always possible to deter employee misconduct and the precautions we take to prevent and detect this activity may not always be effective. Accordingly, because of the inherent limitations in the control system, misstatements due to error or fraud may occur and not be detected.
43
Our financial statements are based in part on assumptions and estimates which, if inaccurate, could cause material misstatement of the results of our operations and financial position.
The preparation of financial statements requires management to make judgements, estimates and assumptions that affect the reported amounts of assets, liabilities, income and expenses. Due to the inherent uncertainty in making estimates, actual results reported in future periods may be based upon amounts which differ from those estimates. Estimates, judgements and assumptions are continually evaluated and are based on historical experience and other factors, including expectations of future events that are believed to be reasonable under the circumstances. Revisions to accounting estimates are recognized in the period in which the estimate is revised and in any future periods affected. The accounting policies deemed critical to our results and financial position, based upon materiality and significant judgements and estimates, include impairment of loans and advances, good will impairment, valuation of financial instruments, deferred tax assets –provisions and pension obligations for liabilities.
If the judgement, estimates and assumptions we use in preparing our consolidated financial statements are subsequently found to be incorrect, there could be a material effect on our results of operations and a corresponding effect on our funding requirements and capital ratios.
Changes in accounting standards could impact reported earnings.
The accounting standard setters and other regulatory bodies periodically change the financial accounting and reporting standards that govern the preparation of our consolidated financial statements. For example, IFRS 9 was adopted as of January 1, 2018, establishing a new impairment model of expected loss and make changes to the classification and measurement requirements for financial assets and liabilities. In addition, the Bank adopted IFRS 16 as of January 1, 2019, requiring new standards for recognition, measurement, presentation and disclosure of leases. This led to approximately Ch$154,284 million of assets for the right of use and lease liabilities for the same amount as of the date of adoption of IFRS 16. Changes made to accounting standards can materially impact how we record and report our financial condition and results of operations, as well as affect the calculation of our capital ratios. In some cases, we could be required to apply a new or revised standard retroactively, resulting in the restatement of prior period financial statements. Various amendments were made to financial and accounting standards in 2020 for implementation in future periods without an impact in 2020. The Bank’s management is still evaluating the potential impact of these new standards. For further information about developments in financial accounting and reporting standards, see Note 1 to our Audited Consolidated Financial Statements.
We rely on recruiting, retaining and developing appropriate senior management and skilled personnel.
Our continued success depends in part on the continued service of key members of our senior executive team and other key employees. The ability to continue to attract, train, motivate and retain highly qualified and talented professionals is a key element of our strategy. The successful implementation of our strategy and culture depends on the availability of skilled and appropriate management, both at our head office and in each of our business units. If we or one of our business units or other functions fails to staff its operations appropriately, or loses one or more of its key senior executives or other key employees and fails to replace them in a satisfactory and timely manner, our business, financial condition and results of operations, including control and operational risks, may be adversely affected.
In addition, the financial industry has and may continue to experience more stringent regulation of employee compensation, which could have an adverse effect on our ability to hire or retain the most qualified employees. If we fail or are unable to attract and appropriately train, motivate and retain qualified professionals, our business may also be adversely affected.
44
Our business could be affected if its capital is not managed effectively or if changes limiting our ability to manage our capital position are adopted.
Effective management of our capital position is important to our ability to operate our business, to continue to grow organically and to pursue our business strategy. However, in response to the global financial crisis, a number of changes to the regulatory capital framework have been adopted or continue to be considered. As these and other changes are implemented or future changes are considered or adopted that limit our ability to manage our balance sheet and capital resources effectively or to access funding on commercially acceptable terms, we may experience a material adverse effect on our financial condition and regulatory capital position.
We are subject to review by tax authorities, and an incorrect interpretation by us of tax laws and regulations may have a material adverse effect on us.
The preparation of our tax returns requires the use of estimates and interpretations of complex tax laws and regulations and is subject to review by tax authorities.
We are subject to the income tax laws of Chile and certain foreign countries. These tax laws are complex and subject to different interpretations by the taxpayer and relevant governmental tax authorities, which are sometimes subject to prolonged evaluation periods until a final resolution is reached. In establishing a provision for income tax expense and filing returns, we must make judgements and interpretations about the application of these inherently complex tax laws.
If the judgement, estimates and assumptions we use in preparing our tax returns are subsequently found to be incorrect, there could be a material adverse effect on our results of operations. In some jurisdictions, the interpretations of the tax authorities are unpredictable and frequently involve litigation, which introduces further uncertainty and risk as to tax expense.
We engage in transactions with related parties that others may not consider to be on an arm’s-length basis.
We and our affiliates have entered into a number of services agreements pursuant to which we render services, such as administrative, accounting, finance, treasury, legal services and others.
Chilean law applicable to public companies and financial groups and institutions and our by-laws provide for several procedures designed to ensure that the transactions entered into with or among our financial subsidiaries and/or affiliates do not deviate from prevailing market conditions for those types of transactions, including the requirement that our board of directors approve such transactions. Furthermore, all significant related party transactions must be approved by the Audit Committee and the Board. These significant transactions are also reported in our annual shareholders meeting. Please see Note 36 of our Audited Consolidated Financial Statements and “Item 7. Major Shareholders and Related Party Transactions.”
We are likely to continue to engage in transactions with our affiliates. Future conflicts of interests between us and any of affiliates, or among our affiliates, may arise, which conflicts are not required to be and may not be resolved in our favor.
ITEM 4. INFORMATION ON THE COMPANY
A. History and Development of the Company
Overview
We are the largest bank in the Chilean market in terms of loans (excluding loans held by subsidiaries of Chilean banks abroad) and the second largest bank in terms of total assets and loans.deposits (excluding deposits held by subsidiaries of Chilean banks aboard). As of December 31, 2018,2020, we had total assets of Ch$39,132,51255,703,223 million (U.S.$56,083 78,183 million), outstanding loans at amortized cost, net of allowances for loan losses of Ch$ 29,331,00133,303,100 million (U.S.$42,036 46,743 million), total deposits of Ch$21,809,236 25,142,684 million (U.S.$ 31,25635,289 million) and shareholders’ equity of Ch$3,245,459 3,620,091 million (U.S.$4,652 5,081 million). As of December 31, 2018,2020, we employed 11,30510,470 people. We have a leading presence in all the major business segments in Chile, and a large distribution network with national coverage spanning across all the country. We offer unique transaction capabilities to clients through our 380358 branches and 9101,199 ATMs. Our headquarters are located in Santiago and we operate in every major region of Chile.
45
We provide a broad range of commercial and retail banking services to our customers, including Chilean peso and foreign currency denominated loans to finance a variety of commercial transactions, trade, foreign currency forward contracts and credit lines and a variety of retail banking services, including mortgage financing. We seek to offer our customers a wide range of products while providing high levels of service. In addition to our traditional banking operations, we offer a variety of financial services, including financial leasing, financial advisory services, mutual fund management, securities brokerage, insurance brokerage and investment management.
The legal predecessor of Santander-Chile was Banco Santiago (“Santiago”). Old Santander-Chile was established as a subsidiary of Santander Spain in 1978. On August 1, 2002, Santiago and Old Santander Chile merged, whereby the latter ceased to exist and Santander-Chile (formerly known as Santiago) being the surviving entity.
Our principal executive offices are located at Bandera 140, 20th floor, Santiago, Chile. Our telephone number is +562-320-2000 and our website is www.santander.cl. None of the information contained on our website is incorporated by reference into, or forms part of, this Annual Report. Our agent for service of process in the United States is Puglisi & Associates, 850 Library Ave., Suite 204, Newark, DE 19711. The SEC maintains a website on the Internet at http://www.sec.gov that contains reports and information statements and other information about us. The reports (including this annual report) and information statements and other information about us can be downloaded from the SEC’s websitewww.sec.gov website or our investor relations websitewww.santandercl.gcs-web.com. www.santandercl.gcs-web.com. None of the information contained on our website, or any website referred to in this Annual Report, is incorporated by reference into, or forms part of, this Annual Report.
Relationship with Grupo Santander Spain
We believe that our relationship with our controlling shareholder, Santander Spain, offers us a significant competitive advantage over our peer Chilean banks. Grupo Santander, Spain, our parent company, is one of the largest financial groups in Brazil and the rest of Latin America, in terms of total assets measured on a regional basis. It is the largest financial group in Spain and is a major player elsewhere in Europe, including the United Kingdom, Poland and Portugal, where it is the third-largest banking group.Portugal. Through Santander Consumer, it also operates a leading consumer finance franchise in the United States, as well as in Germany, Italy, Spain, and several other European countries.
Our relationship with Santander Spain provides us with access to the group’s client base, while its multinational focus allows us to offer international solutions to our clients’ financial needs. We also have the benefit of selectively borrowing from Santander Spain’s product offerings in other countries, as well as of its know-how in systems management. We believe that our relationship with Santander Spain will also enhance our ability to manage credit and market risks by adopting policies and knowledge developed by Santander Spain. In addition, our internal auditing function has been strengthened as a result of the addition of an internal auditing department that concurrently reports directly to our Audit Committee and the audit committee of Santander Spain. We believe that this structure leads to improved monitoring and control of our exposure to operational risks.
Santander Spain’sGrupo Santander’s support of Santander-Chile includes the assignment of managerial personnel to key supervisory areas of Santander-Chile, such as risks, auditing, accounting and financial control. Santander-Chile does not pay any management fees to Santander Spain in connection with these support services.
B. Business Overview
We have 380 total358 branches, 266220 of which are operated under the Santander brand name, with the remaining branches under certain specialty brand names, including 4619 under the Select brand name, 732 specialized branches for the Middle Market and 2128 as auxiliary and payment centers. During 2018,2020, we also opened 206 Santander Workcafés, reaching a total of 4059 Workcafés across all regions of Chile. We provide a full range of financial services to corporate and individual customers. We divide our clients into the following groups: (i) Retail banking, (ii) Middle-market, (iii) Corporate Investment Banking and (iv) Corporate Activities (“Other”).
The Bank has the reportable segments noted below (see “Segmentation Criteria” for further information):
46
Retail Banking
ConsistsThis segment consists of individuals and small to medium-sized entities (SMEs) with annual sales less than Ch$1,2002,000 million (U.S.$1.72.8 million). This segment gives customers a variety of services, including consumer loans, credit cards, auto loans, commercial loans, foreign exchange, mortgage loans, debit cards, checking accounts, savings products, mutual funds, stock brokerage, and insurance brokerage. Additionally, the SME clients are offered government-guaranteed loans, foreign trade services, leasing and factoring.
Middle-market
This segment serves companies and large corporations with annual sales exceeding Ch$1,2002,000 million (U.S.$1.72.8 million). It also serves institutions such as universities, government entities, local and regional governments and companies engaged in the real estate industry who carry out projects to sell properties to third parties and annual sales exceeding Ch$800 million (U.S.$1.1 million) with no upper limit. The companies within this segment have access to many products including commercial loans, leasing, factoring, foreign trade, credit cards, mortgage loans, checking accounts, transactional services, treasury services, financial consulting, savings products, mutual funds, and insurance brokerage. Also, companies in the real estate industry are offered specialized services to finance projects, chiefly residential, with the aim of expanding sales of mortgage loans.
Corporate Investment Banking
This segment consists of foreign and domestic multinational companies with sales over Ch$10,000 million (U.S.$14.314.0 million). The companies within this segment have access to many products including commercial loans, leasing, factoring, foreign trade, project finance, credit cards, mortgage loans, checking accounts, transactional services, treasury services, financial consulting, investments, savings products, mutual funds and insurance brokerage.
This segment also consists of a Treasury Division which provides sophisticated financial products, mainly to companies in the Middle-market segment and Corporate Investment Banking. These include products such as short-term financing and fund raising, brokerage services, foreign exchange services, derivatives, securitization and other tailor-made products. The Treasury Division may act as broker to transactions and also manages the Bank’s trading fixed income portfolio.
Corporate Activities (“Other”)
This segment mainly includes our Financial Management Division, which develops global management functions, including managing inflation rate risk, foreign currency gaps, interest rate risk and liquidity risk. Liquidity risk is managed mainly through wholesale deposits, debt issuances and the Bank’s available-for-sale portfolio. This segment also manages capital allocation by unit. These activities, with the exception of our inflation gap, usually result in a negative contribution to income.
In addition, this segment encompasses all the intra-segment income and all the activities not assigned to a given segment or product with customers.
The segments’ accounting policies are those described in the summary of accounting policies. The Bank earns most of its income in the form of interest income, fee and commission income and income from financial operations. To evaluate a segment’s financial performance and make decisions regarding the resources to be assigned to segments, the Chief Operating Decision Maker (CODM) bases his or her assessment on the segment’s interest income, fee and commission income, and expenses.
The tables below show the Bank’s results by reporting segment for the year ended December 31, 2018,2020, in addition to the corresponding balances of loans and accounts receivable from customers:
47
| For the year ended December 31, 2018 | ||||||||||||||||||||||||||||
Loans and accounts receivable at amortized (1) | Net interest income | Net fee and commission income |
Financial transactions, net (2) | Provision for loan losses | Support expenses (3) | Segment`s net contribution | ||||||||||||||||||||||
| (in millions of Ch$) | ||||||||||||||||||||||||||||
| Retail Banking | 20,786,637 | 949,764 | 220,532 | 19,694 | (287,739 | ) | (553,157 | ) | 349,094 | |||||||||||||||||||
| Middle-market | 7,690,380 | 272,912 | 36,746 | 16,848 | (26,314 | ) | (92,377 | ) | 207,815 | |||||||||||||||||||
| Corporate Investment Banking | 1,613,088 | 96,722 | 35,064 | 57,340 | 2,339 | (64,913 | ) | 126,552 | ||||||||||||||||||||
| Other | 123,309 | 94,970 | (1,457 | ) | 11,200 | (5.694 | ) | (11,486 | ) | 87,533 | ||||||||||||||||||
| Total | 30,213,414 | 1,414,368 | 290,885 | 105,082 | (317,408 | ) | (721,933 | ) | 770,994 | |||||||||||||||||||
| Other operating income | 23,129 | |||||||||||||||||||||||||||
| Other operating expenses and impairment | (32,381 | ) | ||||||||||||||||||||||||||
| Income from investments in associates and other companies | 5,095 | |||||||||||||||||||||||||||
| Income tax expense | (167,144 | ) | ||||||||||||||||||||||||||
| Net income for the year | 599,693 | |||||||||||||||||||||||||||
(1) Corresponds to loans and accounts receivable at amortized cost under IFRS 9, without deducting their allowances for loan losses.
(2) Corresponds to the sumTable of the net income from financial operations and the foreign exchange profit or loss. Contents
(3) Corresponds to the sum of personnel salaries and expenses, administrative expenses, depreciation and amortization.
| For the year ended December 31, 2020 | ||||||||||||||||||||||||||||
| Loans and accounts receivable at amortized cost (1) | Net interest income | Net fee and commission income | Financial transactions, net (2) | Provision for loan losses | Support expenses (3) | Segment’s net contribution | ||||||||||||||||||||||
| (in millions of Ch$) | ||||||||||||||||||||||||||||
| Retail Banking | 24,279,248 | 1,049,543 | 213,431 | 28,577 | (317,050 | ) | (596,464 | ) | 378,038 | |||||||||||||||||||
| Middle-market | 8,136,402 | 346,225 | 38,335 | 21,859 | (109,999 | ) | (91,132 | ) | 205,287 | |||||||||||||||||||
| Corporate Investment Banking | 1,635,217 | 114,229 | 23,180 | 82,303 | (51,097 | ) | (72,715 | ) | 95,900 | |||||||||||||||||||
| Other | 289,026 | 83,851 | (7,668 | ) | 17,058 | (118 | ) | (8,235 | ) | 84,888 | ||||||||||||||||||
| Total | 34,339,893 | 1,593,848 | 267,278 | 149,797 | (478,264 | ) | (768,546 | ) | 764,113 | |||||||||||||||||||
| Other operating income | 8,206 | |||||||||||||||||||||||||||
| Other operating expenses and impairment | (78,444 | ) | ||||||||||||||||||||||||||
| Income from investments in associates and other companies | 1,388 | |||||||||||||||||||||||||||
| Income tax expense | (142,533 | ) | ||||||||||||||||||||||||||
| Result of continuous operations | 552,730 | |||||||||||||||||||||||||||
| Result of discontinued operations | - | |||||||||||||||||||||||||||
| Net income for the year | 552,730 | |||||||||||||||||||||||||||
____________________
| (1) | Corresponds to loans and accounts receivable at amortized cost under IFRS 9, without deducting their allowances for loan losses. |
| (2) | Corresponds to the sum of the net income from financial operations and the foreign exchange profit or loss. |
| (3) | Corresponds to the sum of personnel salaries and expenses, administrative expenses, depreciation and amortization. |
Operations through Subsidiaries
Today, theThe New General Banking Law permits us to directly provide the leasing and financial advisory services that we could formerly offer only through our subsidiaries, to offer investment advisory services outside of Chile and to undertake activities that we could not formerly offer directly or through subsidiaries, such as factoring, securitization, foreign investment funds, custody and transport of securities and insurance brokerage services. For the twelve–month period ended December 31, 2018,2020, our subsidiaries collectively accounted for 0.6%1.9% of our total consolidated assets.
Percent ownership share as of December 31, | ||||||||||||||||||||||||||||||||||||||
2020 | 2019 | 2018 | ||||||||||||||||||||||||||||||||||||
Name of the Subsidiary | Main activity | Direct | Indirect | Total | Direct | Indirect | Total | Direct | Indirect | Total | ||||||||||||||||||||||||||||
| (in %) | ||||||||||||||||||||||||||||||||||||||
| Santander Corredora de Seguros Limitada | Insurance brokerage | 99.75 | 0.01 | 99.76 | 99.75 | 0.01 | 99.76 | 99.75 | 0.01 | 99.76 | ||||||||||||||||||||||||||||
| Santander Corredores de Bolsa Limitada | Financial instruments brokerage | 50.59 | 0.41 | 51.00 | 50.59 | 0.41 | 51.00 | 50.59 | 0.41 | 51.00 | ||||||||||||||||||||||||||||
| Santander Asesorias Financieras Limitada | Financial advisory | 99.03 | — | 99.03 | 99.03 | — | 99.03 | 99.03 | — | 99.03 | ||||||||||||||||||||||||||||
| Santander S.A. Sociedad Securitizadora | Purchase of credits and issuance of debt instruments | 99.64 | — | 99.64 | 99.64 | — | 99.64 | 99.64 | — | 99.64 | ||||||||||||||||||||||||||||
| Klare Corredora de Seguros S.A. | Insurance brokerage | 50.10 | — | 50.10 | 50.10 | — | 50.10 | — | — | — | ||||||||||||||||||||||||||||
| Santander Consumer Chile S.A. | Financing | 51.00 | — | 51.00 | 51.00 | — | 51.00 | — | — | — | ||||||||||||||||||||||||||||
| Sociedad operadora de Tarjetas de Pago Santander Getnet Chile S.A. | Card operator | 99.99 | 0.01 | 100.00 | — | — | — | — | — | — | ||||||||||||||||||||||||||||
48
On July 6, 2020, we registered “Sociedad Operadora de Tarjeta de Pago Santander Getnet Chile S.A” as a new subsidiary and support company. On January 7, 2021, at the Extraordinary Shareholders’ Meeting of the “Sociedad Operadora de Tarjetas de Pago Santander Getnet Chile S.A.” the members agreed to pay total the subscribed and unpaid capital. Accordingly, “Santander Asesorías Financieras Limitada” will pay Ch$0,8 milllion in cash and Banco Santander Chile should pay Ch$37 million in cash plus assets whose appraisal determined by the Board were Ch$3,689 million, thus the shareholders will have paid 100% of the company’s capital. On January 29, 2021, the FMC through Resolution Exempt N°704 authorized the operation of “Sociedad Operadora de Tarjetas de Pago Santander Getnet Chile S.A.” as a banking support company and its registration in the Payment Card Operator Registry, thus authorizing its commercial activities.
| Percent ownership share as of December 31, | ||||||||||||||||||||||||||||||||||||||
| 2018 | 2017 | 2016 | ||||||||||||||||||||||||||||||||||||
| Name of the Subsidiary | Main activity | Direct | Indirect | Total | Direct | Indirect | Total | Direct | Indirect | Total | ||||||||||||||||||||||||||||
| % | % | % | % | % | % | % | % | % | ||||||||||||||||||||||||||||||
| Santander Corredora de Seguros Limitada | Insurance brokerage | 99.75 | 0.01 | 99.76 | 99.75 | 0.01 | 99.76 | 99.75 | 0.01 | 99.76 | ||||||||||||||||||||||||||||
| Santander Corredores de Bolsa Limitada | Financial instruments brokerage | 50.59 | 0.41 | 51.00 | 50.59 | 0.41 | 51.00 | 50.59 | 0.41 | 51.00 | ||||||||||||||||||||||||||||
| Santander Agente de Valores Limitada(*) | Securities brokerage | 99.03 | — | 99.03 | 99.03 | — | 99.03 | 99.03 | — | 99.03 | ||||||||||||||||||||||||||||
| Santander S.A. Sociedad Securitizadora | Purchase of credits and issuance of debt instruments | 99.64 | — | 99.64 | 99.64 | — | 99.64 | 99.64 | — | 99.64 | ||||||||||||||||||||||||||||
(*) On July 25, 2018, thisAs of December 18, 2019, changes were made to the company ceased conducting foreign currency purchasename and sale operations, which are now carried out directlyobjective of Santander Agente de Valores Limitada, becoming Santander Asesorias Financieras Limitada.
As of October 19, 2019 Klare Corredores de Seguros S.A. was established as a digital insurance brokerage and is a banking subsidiary subject to banking regulations. The Bank owns 50.1% of the company’s capital share.
As of November 15, 2019 the FMC approved the acquisition of 51% of Santander Consumer Chile S.A. by the Bank. This acquisition had been previously approved in the extraordinary shareholders’ meeting held on July 20, 2019 where it was agreed that the Bank would acquire the ownership held by SK Bergé Financiamiento S.A. and a further 2% held by the Santander Group. The total payment for the total 51% was Ch$62,136 million.
The following companies have been consolidated based on the determination that they are controlled by the Bank, in accordance with IFRS 10 Consolidated Financial Statements:
| Santander Gestión de Recaudación y Cobranza Limitada (collection services) |
| Bansa Santander S.A. (management of repossessed assets and leasing of properties) |
| · | Multiplica SpA (management of co-branding agreements) |
In September 2017,
As of December 2019 the Bank no longer directly consolidates Bansa Santander S.A. celebrated, however it is indirectly consolidated through Santander Consumer Chile S.A. Bansa has developed a legal cessionnew line of business, therefore, based on IFRS 10 Consolidated Financial Statement, the Bank has ceased to exercise control, since the Bank is not exposed, or has rights, which generated an incometo variable returns from its involvement with the investee.
On October 4, 2019 the company Multiplica SpA was created as a banking business support company. In accordance with IFRS 10 Consolidated Financial Statement, the Bank controls the entity, since the relevant activities are addressed by the Bank, and the Bank is exposed, or has rights, to variable returns from its involvement with the investee.
49
The Bank also has significant influence over the following entities:
| Percentage of ownership share as of December 31, | ||||||||||||||||
| 2020 | 2019 | 2018 | ||||||||||||||
| Associates | Main activity | Place of Incorporation and operation | (in %) | |||||||||||||
| Centro de Compensación Automatizado | Electronic fund transfer and compensation services | Santiago, Chile | 33.33 | 33.33 | 33.33 | |||||||||||
| Sociedad Interbancaria de Depósito de Valores S.A. | Delivery of securities on public offer | Santiago, Chile | 29.29 | 29.29 | 29.29 | |||||||||||
| Cámara Compensación de Alto Valor S.A. | Payments clearing | Santiago, Chile | 15.00 | 15.00 | 15.00 | |||||||||||
| Administrador Financiero del Transantiago S.A. | Administration of boarding passes for public transportation | Santiago, Chile | 20.00 | 20.00 | 20.00 | |||||||||||
| Servicios de Infraestructura de Mercado OTC S.A. | Administration of the infrastructure for the financial market of derivative instruments | Santiago, Chile | 12.48 | 12.48 | 12.48 | |||||||||||
| Percentage of ownership share | ||||||||||||||||
| As of December 31, | ||||||||||||||||
| Place of | 2018 | 2017 | 2016 | |||||||||||||
| Associates | Main activity | Incorporation and operation | % | % | % | |||||||||||
| Redbanc S.A. | ATM services | Santiago, Chile | 33.43 | 33.43 | 33.43 | |||||||||||
| Transbank S.A. (1) | Debit and credit card services | Santiago, Chile | 25.00 | 25.00 | 25.00 | |||||||||||
| Centro de Compensación Automatizado | Electronic fund transfer and compensation services | Santiago, Chile | 33.33 | 33.33 | 33.33 | |||||||||||
| Sociedad Interbancaria de Depósito de Valores S.A. | Delivery of securities on public offer | Santiago, Chile | 29.29 | 29.29 | 29.29 | |||||||||||
| Cámara Compensación de Alto Valor S.A. | Payments clearing | Santiago, Chile | 15.00 | 15.00 | 14.93 | |||||||||||
| Administrador Financiero del Transantiago S.A. | Administration of boarding passes to public transportation | Santiago, Chile | 20.00 | 20.00 | 20.00 | |||||||||||
| Sociedad Nexus S.A. | Credit card processor | Santiago, Chile | 12.90 | 12.90 | 12.90 | |||||||||||
| Servicios de Infraestructura de Mercado OTC S.A. | Administration of the infrastructure for the financial market of derivative instruments | Santiago, Chile | 12.48 | 12.48 | 12.07 | |||||||||||
(1) TheIn the case of Cámara Compensación de Pagos Alto Valor S.A., Banco Santander-Chile has a representative on the Board of Directors. As per the definition of associates, the Bank has given a mandate to a third party to exercise the Bank’s rights as a shareholder in Transbank.concluded that it exerts significant influence over this entity.
Significant influence is defined here asIn the power to participatecase of Servicios de Infraestructura de Mercado OTC S.A., the Bank actively participates, through its executives, in the financialadministration and operating policy decisionsin the process of organization, which is why the investee without exercising control, whether singularly or jointly,Administration has concluded that it exerts significant influence over such policies. An investment in an associate is accounted for using the equity method from the date on which the investee becomes an associate.it.
The Bank classifies the following entities as Assets Held for Sale and Discontinued Operations:
| Percentage of ownership share as of December 31, | ||||||||||||||||
| 2020 | 2019 | 2018 | ||||||||||||||
| Associates | Main activity | Place of Incorporation and operation | (in %) | |||||||||||||
| Sociedad Nexus S.A. | Credit card processor | Santiago, Chile | — | 1.94 | 12.90 | |||||||||||
| Redbanc S.A. | ATM services | Santiago, Chile | — | 33.43 | 33.43 | |||||||||||
| Transbank S.A. | Debit and credit card services | Santiago, Chile | — | 25.00 | 25.00 | |||||||||||
As of December 18, 2018,31, 2020, the Bank announced the decisionis in process to sell its investment inshare participation on Redbanc S.A. and Transbank S.A. The expected date of completiontherefore it has been classified in accordance to IFRS 5 “Non-current Assets Held for Sale and Discontinued Operations” as investment available for sale. Given the facts and circumstances arising from the social contingency in Chile and the COVID-19 pandemic (situations beyond the control of the Bank), the process of sale is stillof the shares has taken a longer time than initially estimated. However, the Bank continues committed to be determined.the sale plan for these assets, actively seeking for potential buyers and continuing its plans to develop its own acquiring network, as evidenced by the recent creation of a payment card operating company. The Bank sold its stake in Sociedad Nexus S.A. in October 2019 and January 2020. See Note 38 of our Audited Consolidated Financial Statements.
50
Competition
Overview
The Chilean financial services market consists of a variety of largely distinct sectors. The most important sector, commercial banking, includes a number of privately-owned banks and one public-sector bank, Banco del Estado de Chile (which operates within the same legal and regulatory framework as the private sector banks). The private-sector banks include local banks and a number of foreign-owned banks operating in Chile. The Chilean banking system is comprised of 1918 banks, including one public-sector bank. The six largest banks accounted for 87.5%87.2% of all outstanding loans by Chilean financial institutions as of December 31, 20182020 (excluding assets held abroad by Chilean banks). In July 2018, Scotiabank Chile acquired BBVA Chile, becoming the third largest bank in terms of loans in the Chilean market. Furthermore, in the last quarter of 2018, BCI acquired the credit card financing business of Walmart Chile and the credit card of CMR Falabella was integrated into Banco Falabella. This represented an increase of total credit cards in the banking system of approximately 6%.
The Chilean banking system has experienced increased competition in recent years, largely due to consolidation in the industry and new legislation. We also face competition from non-bank and non-finance competitors, principally department stores, credit unions andcajas de compensación (private, non-profitable corporations whose aim is to administer social welfare benefits, including payroll loans, to their members) with respect to some of our credit products, such as credit cards, consumer loans and insurance brokerage. In addition, we face competition from non-bank finance competitors, such as leasing, factoring and automobile finance companies, with respect to credit products, and mutual funds, pension funds and insurance companies, with respect to savings products. Currently, banks continue to be the main suppliers of leasing, factoring and mutual funds, and the insurance sales business has grown rapidly.
All the competition data in the following sections is based on Chilean Bank GAAP.
The following tables set out certain statistics comparing our market position to that of our peer group, defined as the fivesix largest banks in Chile in terms of total loans as of December 31, 20182020 (excluding assets held by Chilean banks abroad).
| As of December 31, 2020, unless otherwise noted | ||||||||
| Market Share | Rank | |||||||
| Commercial loans | 16.5 | % | 2 | |||||
| Consumer loans | 21.6 | % | 1 | |||||
| Residential mortgage loans | 21.5 | % | 1 | |||||
| Total loans | 18.6 | % | 1 | |||||
| Deposits | 17.4 | % | 2 | |||||
| Credit card usage(1) | 25.0 | % | 1 | |||||
| Checking accounts(2) | 25.3 | % | 1 | |||||
| Branches(2) | 19.0 | % | 2 | |||||
____________________
| As of December 31, 2018, unless otherwise noted | ||||||||
| Market Share | Rank | |||||||
| Commercial loans | 16.9 | % | 2 | |||||
| Consumer loans | 19.6 | % | 1 | |||||
| Residential mortgage loans | 21.1 | % | 1 | |||||
| Total loans | 18.6 | % | 1 | |||||
| Deposits | 17.9 | % | 2 | |||||
| Credit card issued(1) | 15.6 | % | 1 | |||||
| Checking accounts(1) | 21.3 | % | 1 | |||||
| Branches | 18.1 | % | 3 | |||||
Source: SBIFSource: FMC
| (1) | As of |
| (2) | As of November 2020, according to the latest publicly available information |
51
Loans
As of December 31, 2018,2020, our loan portfolio was the largest among Chilean banks. Our loan portfolio, including interbank loans, represented 18.6% of the market for loans in the Chilean financial system as of such date. The following table sets forth our and our peer group’s market shares in terms of loans (excluding assets held by Chilean banks abroad).
| As of December 31, 2020 (Chilean Bank GAAP) | ||||||||||||
| Loans | Ch$ million | U.S.$ million | Market Share | |||||||||
| Santander-Chile | 34,409,170 | 48,296 | 18.6 | % | ||||||||
| Banco de Chile | 31,496,591 | 44,208 | 17.0 | % | ||||||||
| Banco de Crédito e Inversiones | 26,451,150 | 37,126 | 14.3 | % | ||||||||
| Banco del Estado de Chile | 25,936,163 | 36,403 | 14.0 | % | ||||||||
| Scotiabank Chile | 25,430,916 | 35,694 | 13.7 | % | ||||||||
| Itaú Corpbanca | 17,625,148 | 24,738 | 9.5 | % | ||||||||
| Others | 23,742,744 | 33,325 | 12.8 | % | ||||||||
| Chilean financial system | 185,091,882 | 259,789 | 100.0 | % | ||||||||
| As of December 31, 2018 (Chilean Bank GAAP) | ||||||||||||
| Loans | Ch$ million | U.S.$ million | Market Share | |||||||||
| Santander-Chile | 30,282,023 | 43,399 | 18.6 | % | ||||||||
| Banco de Chile | 28,308,887 | 40,571 | 17.4 | % | ||||||||
| Scotiabank Chile | 22,826,129 | 32,713 | 14.0 | % | ||||||||
| Banco del Estado de Chile | 22,667,427 | 32,486 | 13.9 | % | ||||||||
| Banco de Crédito e Inversiones | 22,200,629 | 31,817 | 13.6 | % | ||||||||
| Itaú Corpbanca | 16,273,212 | 23,322 | 10.0 | % | ||||||||
| Others | 20,510,612 | 29,395 | 12.6 | % | ||||||||
| Chilean financial system | 163,068,919 | 233,703 | 100.0 | % | ||||||||
____________________
Source: SBIF.Source: FMC.
Deposits
We had a 17.9%17.4% market share in deposits, ranking second among banks in Chile as of December 31, 2018.2020. Deposit market share is based on total time and demand deposits as of the respective dates. The following table sets forth our and our peer group’s market shares in terms of deposits (excluding assets held by Chilean banks abroad).
| As of December 31, 2020 (Chilean Bank GAAP) | ||||||||||||
| Deposits | Ch$ million | U.S.$ million | Market Share | |||||||||
| Banco del Estado de Chile | 30,696,893 | 43,085 | 21.3 | % | ||||||||
| Santander-Chile | 25,142,684 | 35,289 | 17.4 | % | ||||||||
| Banco de Chile | 24,066,770 | 33,779 | 16.7 | % | ||||||||
| Banco de Crédito e Inversiones | 18,671,533 | 26,207 | 12.9 | % | ||||||||
| Scotiabank Chile | 15,645,249 | 21,959 | 10.8 | % | ||||||||
| Itaú Corpbanca | 12,489,172 | 17,529 | 8.6 | % | ||||||||
| Others | 17,709,952 | 24,857 | 12.3 | % | ||||||||
| Chilean financial system | 144,422,253 | 202,706 | 100.0 | % | ||||||||
| As of December 31, 2018 (Chilean Bank GAAP) | ||||||||||||
| Deposits | Ch$ million | U.S.$ million | Market Share | |||||||||
| Banco del Estado de Chile | 22,713,927 | 32,553 | 18.7 | % | ||||||||
| Santander-Chile | 21,809,236 | 31,256 | 17.9 | % | ||||||||
| Banco de Chile | 20,240,662 | 29,008 | 16.6 | % | ||||||||
| Banco de Crédito e Inversiones | 15,612,197 | 22,375 | 12.8 | % | ||||||||
| Scotiabank Chile | 14,927,861 | 21,394 | 12.3 | % | ||||||||
| Itaú Corpbanca | 10,151,012 | 14,548 | 8.3 | % | ||||||||
| Others | 16,287,206 | 23,342 | 13.4 | % | ||||||||
| Chilean financial system | 121,742,101 | 174,476 | 100.0 | % | ||||||||
____________________
Source: SBIF.Source: FMC.
Total equityEquity
With Ch$3,458,3633,567,916 million (U.S.$4,956 5,008 million) in equity in Chilean Bank GAAP as of December 31, 2018,2020, we were the fourththird largest commercial bank in Chile in terms of shareholders’ equity. The following table sets forth our and our peer group’s shareholders’ equity.
| As of December 31, 2018 (Chilean Bank GAAP) | As of December 31, 2020 (Chilean Bank GAAP) | |||||||||||||||||||||||
| Total Equity | Ch$ million | U.S.$ million | Market Share | Ch$ million | U.S.$ million | Market Share | ||||||||||||||||||
| Itaú Corpbanca | 3,547,612 | 5,084 | 17.5 | % | ||||||||||||||||||||
| Banco de Crédito e Inversiones | 3,458,363 | 4,956 | 17.1 | % | 3,893,620 | 5,465 | 17.9 | % | ||||||||||||||||
| Banco de Chile | 3,304,153 | 4,735 | 16.3 | % | 3,726,267 | 5,230 | 17.2 | % | ||||||||||||||||
| Santander-Chile | 3,285,709 | 4,709 | 16.2 | % | 3,567,916 | 5,008 | 16.4 | % | ||||||||||||||||
| Scotiabank Chile | 2,109,953 | 3,024 | 10.4 | % | 2,398,357 | 3,366 | 11.0 | % | ||||||||||||||||
| Itaú Corpbanca | 2,315,411 | 3,250 | 10.7 | % | ||||||||||||||||||||
| Banco del Estado de Chile | 1,713,584 | 2,456 | 8.5 | % | 2,011,964 | 2,824 | 9.3 | % | ||||||||||||||||
| Others | 2,809,411 | 4,026 | 13.9 | % | 17,382,019 | 24,397 | 80.1 | % | ||||||||||||||||
| Chilean financial system | 20,228,785 | 28,991 | 100.0 | % | 21,709,394 | 30,471 | 100.0 | % | ||||||||||||||||
| Chilean financial system | 3,547,612 | 5,084 | 17.5 | % | ||||||||||||||||||||
____________________
Source: SBIF.Source: FMC.
52
Efficiency
As of December 31, 2018,2020, we were the most efficient bank in our peer group. The following table sets forth our and our peer group’s efficiency ratio (defined as operating expenses as a percentage of operating revenue, which is the aggregate of net interest income, fees and income from services (net), net gains from mark-to-market and trading, exchange differences (net) and other operating income (net)) in each case under Chilean Bank GAAP.
| Efficiency ratio as defined by the | As of December 31, | ||||
| Santander-Chile | % | ||||
| Banco de Chile | % | ||||
| Scotiabank Chile | % | ||||
| Banco de Crédito e Inversiones | % | ||||
| Banco del Estado de Chile | % | ||||
| Itaú Corpbanca | % | ||||
| Chilean financial system | % | ||||
____________________
Source: SBIF.Source: FMC.
Net incomeIncome for the period attributablePeriod Attributable to equity holdersEquity Holders
In 2018,2020, we were the second largest bank in Chile in terms of net income attributable to shareholders, ofwhich was equivalent to Ch$591,902 517,447 million (U.S.$848726 million) measured under Chilean Bank GAAP. The following table sets forth our and our peer group’s net income.
| As of December 31, 2018 (Chilean Bank GAAP) | As of December 31, 2020 (Chilean Bank GAAP) | |||||||||||||||||||||||
| Net income attributable to equity holders | Ch$ million | U.S.$ million | Market Share | Ch$ million | U.S.$ million | Market Share | ||||||||||||||||||
| Santander-Chile | 517,447 | 726 | 43.9 | % | ||||||||||||||||||||
| Banco de Chile | 594,872 | 853 | 25.3 | % | 463,108 | 650 | 39.3 | % | ||||||||||||||||
| Santander-Chile | 591,902 | 848 | 25.2 | % | ||||||||||||||||||||
| Banco de Crédito e Inversiones | 395,794 | 567 | 16.9 | % | 317,454 | 446 | 26.9 | % | ||||||||||||||||
| Scotiabank Chile | 275,419 | 387 | 23.4 | % | ||||||||||||||||||||
| Banco del Estado de Chile | 142,595 | 200 | 12.1 | % | ||||||||||||||||||||
| Itaú Corpbanca | 172,047 | 247 | 7.3 | % | (925,479 | ) | (1,299 | ) | - | |||||||||||||||
| Chile Banco del Estado de Chile | 165,951 | 238 | 7.1 | % | ||||||||||||||||||||
| Scotiabank Chile | 108,120 | 155 | 4.6 | % | ||||||||||||||||||||
| Others | 318,538 | 457 | 13.6 | % | 388,771 | 546 | 33.0 | % | ||||||||||||||||
| Chilean financial system | 2,347,224 | 3,365 | 100.0 | % | 1,179,315 | 1,655 | 100.0 | % | ||||||||||||||||
____________________
Source: SBIF. FMC.
Return on equity
As of December 31, 2018,2020, we were the most profitable bank in our peer group (as measured by return on period-end equity under Chilean Bank GAAP) and the thirdsecond most capitalized bank as measured by the Chilean BIS ratio. The following table sets forth our and our peer group’s return on average equity and BIS ratio.
| Return on period-end equity as of December 31, 2018 (Chilean Bank GAAP) | BIS Ratio as of December 31, 2018 (Chilean Bank GAAP) | Return on period-end equity as of December 31, 2020 (Chilean Bank GAAP) | BIS Ratio as of November 30, 2020(Chilean Bank GAAP) | |||||||||||||
| Santander-Chile | 18.1 | % | 13.2 | % | 14.3 | % | 14.7 | % | ||||||||
| Banco de Chile | 18.0 | % | 13.9 | % | 12.4 | % | 15.6 | % | ||||||||
| Scotiabank Chile | 11.4 | % | 12.9 | % | ||||||||||||
| Banco de Crédito e Inversiones | 11.4 | % | 12.8 | % | 8.2 | % | 13.1 | % | ||||||||
| Banco del Estado de Chile | 10.5 | % | 11.1 | % | 7.7 | % | 12.7 | % | ||||||||
| Itaú Corpbanca | 5.0 | % | 14.6 | % | -38.9 | % | 13.3 | % | ||||||||
| Scotiabank Chile | 6.0 | % | 11.4 | % | ||||||||||||
| Chilean financial system | 11.5 | % | 13.3 | % | 5.6 | % | 14.3 | % | ||||||||
____________________
Source: SBIF.Source: FMC.
53
Asset Quality
As of December 31, 2018,2020, we had the second-highestthird lowest non-performing loan to loan ratio in our peer group. The following table sets forth our and our peer group’s non-performing loan ratio as defined by the SBIFFMC as of December 31, 2018.2020.
Non-performing loans / total | |||||
| Banco de Chile | % | ||||
| Banco de Crédito e Inversiones | 1.2 | % | |||
| Santander-Chile | 1.4 | % | |||
| Scotiabank Chile | 1.4 | % | |||
| Itaú Corpbanca | 2.3 | % | |||
| Banco del Estado de Chile | |||||
| % | |||||
| Chilean financial system | % | ||||
____________________
Source: SBIF.Source: FMC
| (1) | Excluding interbank loans. |
Regulation and Supervision
General
In Chile, only banks may maintain checking accounts for their customers, conduct foreign trade operations, and, together with non-banking financial institutions, accept time deposits. The principal authorities that regulate financial institutions in Chile are the SBIF, which is expected to be absorbed by the FMC on June 1, 2019, and the Central Bank. Chilean banks are primarily subject to the General Banking Law, and secondarily subject, to the extent not inconsistent with this statute, to the provisions of the Chilean Companies Law governing public corporations, except for certain provisions which arethat expressly excluded.
The modern Chilean banking system dates from 1925 and has been characterized by periods of substantial regulation and state intervention, as well as periods of deregulation. The most recent period of deregulation commenced in 1975 and culminated in the adoption of a series of amendments to General Banking Law. That law was amended in 2001 to grant additional powers to banks, including general underwriting powers for new issues of certain debt and equity securities and the power to create subsidiaries to engage in activities related to banking, such as brokerage, investment advisory and mutual fund services, administration of investment funds, factoring, securitization products and financial leasing services. The most recent amendment to the General Banking Law was introduced by law 21,130, passed in January 2019, which modernizes Chile’s banking legislation.legislation by adopting capital and resolution standards in line with the requirements of the Basel Committee.
The Central Bank
The Central Bank is an autonomous legal entity created by the Chilean Constitution. It is subject to the Chilean Constitution and its ownley orgánica constitucional, or organic constitutional law. To the extent not inconsistent with the Chilean Constitution or the Central Bank’s organic constitutional law, the Central Bank is also subject to private sector laws (but in no event is it subject to the laws applicable to the public sector). It is directed and administered by a Board of Directors composed of five members designated by the President of Chile, subject to the approval of the Chilean Senate.
54
The legal purpose of the Central Bank is to maintain the stability of the Chilean peso and the orderly functioning of Chile’s internal and external payment systems. The Central Bank’s powers include setting reserve requirements, regulating the amount of money and credit in circulation, establishing regulations and guidelines regarding finance companies, foreign exchange (including the Formal Exchange Market) and banks’ deposit-taking activities.
The SBIF
Banks are supervised and controlled by the SBIF, an independent Chilean governmental agency. The SBIF authorizes the creation of new banks and has broad powers to interpret and enforce legal and regulatory requirements applicable to banks and financial companies. Furthermore, in cases of noncompliance with such legal and regulatory requirements, the SBIF has the ability to impose sanctions. In extreme cases, it can appoint, with the prior approval of the Board of Directors of the Central Bank, a provisional administrator to manage a bank. It must also approve any amendment to a bank’s by-laws or any increase in its capital.
The SBIF examines all banks from time to time, generally at least once a year. Banks are also required to submit their financial statements monthly to the SBIF, and a bank’s financial statements are published at least four times a year in a newspaper with countrywide coverage. In addition, banks are required to provide extensive information regarding their operations at various periodic intervals to the SBIF. A bank’s annual financial statements and the opinion of its independent auditors must also be submitted to the SBIF.
Any person wishing to acquire, directly or indirectly, 10.0% or more of the share capital of a bank must obtain the prior approval of the SBIF. Absent such approval, the acquirer of shares so acquired will not have the right to vote. The SBIF may only refuse to grant its approval, based on specific grounds set forth in the General Banking Law.
According to Article 35bis of the New General Banking Law, the prior authorization of the regulator is required for:
The intended purchase, merger or expansion may be denied by the regulator with an accompanying resolution recording the specific reasons for denial and with agreement of a majority of the Board of Directors of the Central Bank.
Pursuant to the regulations of the SBIF, the following ownership disclosures are required:
Pursuant to Law 21,130 which modernizes banking legislation, the SBIF is scheduled to merge with the FMC on June 1, 2019. Thereafter, the position of the “Superintendent” will be eliminated and replaced by a council comprised of four commissioners and one president.
Financial Market Commission
In 2017, Law 21,000 created theComisión para el Mercado Financiero or Financial Market Commission (FMC). This law became a Law of the Republic in January 2018. The FMC is now the sole supervisor for the Chilean financial system overseeing insurance companies, companies with publicly traded securities, credit unions, credit card and prepaid card issuers, and, eventuallyas of June 1, 2019, banks. It is the responsibility of this commission to ensure the proper functioning, development and stability of the financial market, facilitating the participation of market agents and defending public faith in the financial markets. To do so, it must maintain a general and systemic vision of the market, considering the interests of investors and policyholders. Likewise, it shall be responsible for ensuring that the persons or entities audited, from their initiation until the end of their liquidation, comply with the laws, regulations, statutes and other provisions that govern them.
The Commission is in charge of a Council, which is composed of five members, who are appointed and are subject to the following rules:
| A |
| Four commissioners appointed by the President of Chile, from among persons of recognized professional or academic prestige in matters related to the financial system, by supreme decree issued through the Ministry of Finance, after ratification of the Senate by the four sevenths of its members in exercise, in session specially convened for that purpose. |
The Council’s responsibilities include regulation, sanctioning and the definition of general supervision policies. In addition, there will be a prosecutor in charge of investigations and the Chairman will be responsible for supervision. The FMC will act in coordination with the Chilean Central Bank (BCCh).
The date of entry into operation of the Commission for the Financial Market was December 14, 2017. The Superintendency of Securities and Insurance was eliminated on January 15, 2018 and all functions of this Superintendency were absorbed by the FMC.
In January 2019, Law 21,130, which modernizesmodernized the banking legislation contained in the General Banking Law and amendsamended Law 21,000 (among others), was published in the Official Gazette. The law intends to modernizemodernizes Chilean banking regulation in order to comply with Basel III practices and provisions. The law provides for stronger banking capital and reserves requirements in accordance with Basel III guidelines. The law also modernizes the corporate governance function of the FMC and, importantly, transfers the SBIF functions to the domain of the FMC. The FMC now has the faculty to determine the risk weighting of assets through a standardized model to be approved by the FMC or banks can implement their own methodology, subject to approval by the FMC. The law also imposes limitations on dividend distributions and puts in place intervention mechanisms in the event of insolvency.
The regulator examines all banks from time to time, generally at least once a year. Banks are also required to submit their financial statements monthly to the FMC, and the banks’ financial statements are published at least four times a year in a newspaper with countrywide coverage. In addition, banks are required to provide extensive information regarding their operations at various periodic intervals to the FMC. A bank’s annual financial statements and the opinion of its independent auditors must also be submitted to the FMC.
Any person wishing to acquire, directly or indirectly, 10.0% or more of the share capital of a bank must obtain the prior approval of the FMC. Absent such approval, the acquirer of shares so acquired will not have the right to vote. The FMC may only refuse to grant its approval, based on specific grounds set forth in the General Banking Law.
55
According to Article 35bis of the New General Banking Law, the prior authorization of the regulator is required for:
| · | the merger of two or more banks; |
| · | the acquisition of all or a substantial portion of a bank’s assets and liabilities by another bank; |
| · | the control by the same person, or controlling group, of two or more banks; or |
| · | a substantial increase in the existing control of a bank by a controlling shareholder of that bank. |
The intended purchase, merger or expansion may be denied by the regulator with an accompanying resolution recording the specific reasons for denial and with agreement of a majority of the Board of Directors of the Central Bank.
Pursuant to the regulations of the FMC, the following ownership disclosures are required:
| · | a bank is required to inform the FMC of the identity of any person owning, directly or indirectly, 5.0% or more of such banks’ shares; |
| · | holders of ADSs must disclose to the Depositary the identity of beneficial owners of ADSs registered under such holders’ names; |
| · | the Depositary is required to notify the bank as to the identity of beneficial owners of ADSs which such Depositary has registered and the bank, in turn, is required to notify the FMC as to the identity of the beneficial owners of the ADSs representing 5.0% or more of such banks’ shares; and |
| · | bank shareholders who individually hold 10.0% or more of a bank’s capital stock and who are controlling shareholders must periodically inform the FMC of their financial condition. |
Limitations on Types of Activities
Chilean banks can only conduct those activities allowed by the General Banking Law: making loans, accepting deposits and, subject to limitations, making investments and performing financial services. Investments are restricted to real estate for the bank’s own use, gold, foreign exchange and debt securities. Through subsidiaries, banks may also engage in other specific financial service activities such as securities brokerage services, equity investments, securities, mutual fund management, investment fund management, financial advisory and leasing activities. Subject to specific limitations and the prior approval of the SBIFFMC and the Central Bank, Chilean banks may own majority or non-controlling interests in foreign banks.
Since June 1, 2002, Chilean banks are allowed to offer a new checking account product that pays interest. The SBIF also stated that these accounts may be subject to minimum balance limits and different interest rates depending on average balances held in the account and that banks may also charge fees for the use of this new product. For banks with a solvency score of less than A, the Central Bank has also imposed additional caps to the interest rate that can be paid.
On June 5, 2007, pursuant to Law 20.190, new regulations became effective authorizing banks to enter into transactions involving a wider range of derivatives, such as futures, options, swaps, forwards and other derivative instruments or contracts subject to specific limitations established by the Central Bank of Chile. Previously, banks were able to enter into transactions involving derivatives, but subject to more restrictive guidelines.
Deposit Insurance
The Chilean government guarantees certain time and demand deposits and savings accounts held by natural persons with a maximum value of UF400 per person (Ch$11,026,316 11,628,132 or U.S.$15,802 16,349 as of December 31, 2018)2020) per calendar year in the entire financial system.system and a maximum of UF200 per person per bank.
Reserve Requirements
Deposits are subject to a reserve requirement of 9.0% for demand deposits and 3.6% for time deposits (with terms of less than one year). For purposes of calculating the reserve obligation, banks are authorized to deduct daily from their foreign currency denominated liabilities, the balance in foreign currency of certain loans and financial investments held outside of Chile, the most relevant of which include:
| cash clearance account, which should be deducted from demand deposit for calculating reserve requirement; |
| certain payment orders issued by pension providers; and |
| the amount set aside for “technical reserve” (as described below), which can be deducted from reserve requirement. |
56
The Central Bank has statutory authority to require banks to maintain reserves of up to an average of 40.0% for demand deposits and up to 20.0% for time deposits (irrespective, in each case, of the currency in which they are denominated) to implement monetary policy. In addition, to the extent that the aggregate amount of the following types of liabilities exceeds 2.5 times the amount of a bank’s regulatory capital, a bank must maintain a 100.0% “technical reserve” against them: demand deposits, deposits in checking accounts, or obligations payable on sight incurred in the ordinary course of business, and in general all deposits unconditionally payable immediately but excluding interbank demand deposits.
Minimum Capital
Capital Adequacy Requirements under BIS I
Under the General Banking Law, a bank is required to have a minimum of UF800,000 (approximately Ch$22,05323,256 million or U.S.$31.6.32.7 million as of December 31, 2018)2020) of paid-in capital and reserves, calculated in accordance with Chilean Bank GAAP, regulatory capital of at least 8.0% of its risk weighted assets, net of required allowances, and paid in capital and reserves of at least 3.0% of its total assets, net of required allowances, as calculated in accordance with Chilean Bank GAAP. Under the New General Banking Law, total regulatory capital remains at 8% of risk-weighted assets which includes credit, market and operational risk, while Minimum Tier 1 capital increases from 4.5% to 6% of risk-weighted assets.
Regulatory capital is defined as the aggregate of:
| a bank’s paid-in capital and reserves, excluding capital attributable to subsidiaries and foreign branches orcapital básico; |
| its subordinated bonds, valued at their placement price (but decreasing by 20.0% for each year during the period commencing six years prior to maturity), for an amount up to 50.0% of its core capital; and |
| its voluntary allowances for loan losses for an amount of up to 1.25% of risk weighted-assets. |
Capital Adequacy Requirements
According to the General Banking Law, eacha bank shouldis required to have regulatory capital of at least 8.0% of its risk-weighted assets, net of required loan loss allowances, and paid-in capital and reserves (i.e., core capital) of at least 3.0% of its total assets, net of required loan loss allowances. The calculationFor these purposes, the regulatory capital of a bank is the sum of: (1) the bank’s core capital; (2) subordinated bonds issued by the bank valued at their placement price for an amount up to 50.0% of its core capital, provided that the value of the bonds is required to be decreased by 20.0% for each year that elapses during the period commencing six years prior to their maturity; and (3) its voluntary allowances for loan losses, for an amount of up to 1.25% of its risk-weighted assets. Santander-Chile does not have goodwill, but if it did, this value would be required to be deducted from regulatory capital. When calculating risk weighted assets, is basedwe also include off-balance sheet contingent loans. The merger of Old Santander Chile and Santiago on August 1, 2002 required a five-categoryspecial regulatory pre-approval of the SBIF (predecessor of the FMC), which was granted on May 16, 2002. The resolution granting this pre-approval imposed a regulatory capital to risk classification systemweighted assets ratio of 12.0% for bankthe merged bank. This requirement was reduced to 11.0% by the SBIF (now the FMC) effective January 1, 2005. For purposes of weighing the risk of a bank’s assets, that isthe General Banking Law considers five different categories of assets, based on the nature of the issuer, the availability of funds, and the nature of the assets and the existence of collateral securing such assets.
As of December 31, 2020 our ratio of regulatory capital to risk weighted assets was 15.4%.
New Capital Adequacy Requirements under the New Banking Law
On October 9, 2020, the FMC published the final regulations on regulatory capital to comply with effective net worth rules in accordance with Basel Committee recommendations. III and the New General Banking Law. The new regulation will become effective on December 1, 2021 and will be gradually implemented and adjusted to be fully in place by December 1, 2025. Pursuant to the proposed regulation, there will be three levels of capital: ordinary capital level 1 or CET1 (basic capital), additional capital level 1 or AT1 (perpetual bonds and preferred stock) and capital level 2 or T2 (subordinated bonds and voluntary provisions). Regulatory capital will be composed of the sum of CET1, AT and T2 after making some deductions, mainly for intangible assets, hybrid securities issued by foreign subsidiaries, partial deduction for deferred taxes and some reserve and profit accounts.
57
Under the New General Banking Law, following the guidelines of Basel III, minimum capital requirements have increased in terms of amount and quality. Total Regulatory Capital remains at 8% of risk-weighted assets which includes credit, market and operational risk. Minimum Tier 1 capital increasesincreased from 4.5% to 6% of risk-weighted assets, of which up to 1.5% may be Additional Tier 1 (“AT1”)(AT1), either in the form of preferred shares or perpetual bonds, both of which may be convertible to common equity. The FMC will now establishalso establishes the conditions and requirements for the issuance of perpetual bonds and preferred equity. Tier 2 capital is now set at 2% of risk-weighted assets.
Additional capital demands are incorporated through a Conservation Buffer of 2.5% of risk-weighted assets, setting a Total Equity Requirement of 10.5% of risk-weighted assets. Furthermore, the BCChThe Central Bank may set an additional Counter Cyclical Buffer of up to 2.5% of risk-weighted assets with thein agreement ofwith the FMC. Both buffers must be comprised of core capital.
On November 2, 2020 the FMC published the final guidelines regarding the identification and core capital charge for banks considered SIBs. The FMC, agreement with agreement from the BCCh, mayCentral Bank, also imposeimposed additional capital requirements for Systemically Important Banks (“SIB”)SIBs of between 1-3.5% of risk-weighted assets. This additional capital requirement will be gradually phased in by 25% beginning on December 2021 until December 2025. With the implementation of additional capital requirements for SIBs, the requirement imposed on Banco Santander Chile to have a minimum regulatory capital ratio of 11% compared to the 8% limit for most other banks in Chile will be gradually phased out and replaced by the new regulatory requirements for a SIB.
There are a total of four factors that are weighted to reach a market share:
| 5. | Size (weighted at 30%): Includes total assets consolidated in the domestic market. |
| 6. | Domestic interconnection (weighted at 30%): Includes assets and liabilities with financial institutions (banks and non-banks) and assets in circulation in the Chilean financial market (equity and fixed income). |
| 7. | Domestic substitution (weighted at 20%): Includes the share in local payments, assets in custody, deposits and loans. |
| 8. | Complexity (weighted at 20%): Includes factors that could lead to greater difficulties regarding costs and/ or time for the orderly resolution of the Bank. These include the notional amount of OTC derivatives, inter-jurisdictional assets and liabilities and available-for-sale assets. |
The FMCminimum amount of the sum of the factors to be considered systemic is 1000 bp, equivalent to a weighted participation of 10% of all four factors. The core capital additional charge depends on the size of the total factor, as set out in the table below:
| Systemic Level | Range (bp) | Core capital additional charge (% of risk-weighted assets) |
| I | 1000-1300 | 1.0%-1.25% |
| II | 1300-1800 | 1.25%-1.75% |
| III | 1800-2000 | 1.75%-2.5% |
| IV | >=2000 | 2.5%-3.5% |
The Central Bank may also require for a SIB: (1) the addition of up to 2% to the core capital to a bank’s total assets ratios; (2) a reduction in the technical reserve requirement trigger from 2.5 times regulatory capital to 1.5 times regulatory capital; and/or (3) a reduction in the interbank loan limit to 20% of regulatory capital of any SIB.
The initial systemic level calculation for Chilean banks will establishbe published in March 2021 using a criteria to assess which banks are considered SIBs. Itbank’s balance sheet figures as of year-end 2020. Given our size and market share, it is probablelikely that we will be classified anas level II or III SIB.
58
The New General Banking Law also incorporates Pillar II capital requirements with the objective of assuring an adequate management of risk. The objective of this pillar is to ensure that banks maintain capital levels that are consistent with their risk profile and business model and encourages the development and use of appropriate processes to monitor and manage their risks. Pillar 2 also granted the regulators the power to impose greater capital requirements as a result of deficient evaluations of a bank’s internal capital adequacy assessment process (ICAAP), which should consider a bank’s risk profile and a strategy to sustain adequate levels of capital, even under stress scenarios. Pillar 2 also focuses on risks not considered in Pillar 1 such as reputational risks, concentration risks, liquidity risks and interest rate risks. The FMC, with at least four votes from the Council of the FMC, will have the power to impose additional regulatory capital demands of up to 4% of risk-weighted assets, either Tier I or Tier II, if it determines that the previous capital levels and buffers are not enough for a particular financial institution.
The following table sets forth a comparison between the regulatory capital demands under the previous law, and those under the New General Banking Law:
Minimum capital requirements: Basel III, previous GBL and new requirements | ||||
Capital categories | Previous Law | New General Banking Law | ||
| (% over risk weighted assets) | ||||
| (1) Shareholders’ Equity | 4.5 | 4.5 | ||
| (2) Additional Tier 1 Capital (AT1) | — | 1.5 | ||
| (3) Total Tier 1 Capital (1+2) | 4.5 | 6 | ||
| (4) Tier 2 Capital | 3.5 | 2 | ||
| (5) Total Regulatory Capital (3+4) | 8 | 8 | ||
| (6) Conservation Buffer | 2.5 CET1 | |||
| (7) Total Equity Requirement (5+6) | 8 | 10.5 | ||
| (8) Counter Cyclical Buffer | — | up to 2.5 CET1 | ||
| (9) SIB* Requirement | Up to 6% in case of a merger | Between 1 - 3.5 CET1 | ||
| (10) Pillar 2 | 2% over regulatory capital in order to be classified in Category A solvency. | Up to 4% CET1 or Tier 2 | ||
____________________
* Systemically Important Banks
59
Risk Weightings
On December 1, 2020 the FMC published the final regulations to establishing risk weightings for calculating capital adequacy ratios under the New Banking Law.
The Basel Committee on Banking Supervision (BCBS) defines credit risk (CR) as the risk that a debtor or bank counterparty does not meet its obligations in accordance with the agreed terms. Credit risk is the most relevant in the Chilean banking industry. The mechanism in force today estimates Risk Weighted Assets by Credit Risk (RWCR) using a methodology based on the Basel I standard. The proposed standard method with Basel III standards is more advanced, since it has categories that depend on the type of counterparty and different risk factors. These categories are not based on accounting criteria, but rather on the underlying risk. Thus, all exposures that have mortgage guarantees, for example mortgage loans for housing, have a different treatment from those exposures not guaranteed by a mortgage. Additionally, in the case of mortgage-backed exposures, there will be different types of treatment depending on the type of real estate and whether the obligations are paid with income generated by the property itself. The new framework will also allow the use of internal methodologies, subject to compliance with minimum requirements. The standard in consultation includes the possibility of reducing RWCR when considering credit risk mitigators, such as compensation agreements, guarantees and other compensations.
The Basel Committee on Banking Supervision (BCBS) defines operational risk (OR) as the risk of loss resulting from inadequate or failed internal processes, people and systems or from external events. This definition includes legal risk but excludes strategic and reputational that a debtor or bank counterparty does not meet its obligations in accordance with the agreed terms. In order to estimate the operational risk coefficient, two factors are considered:
| 1. | The business indicator component (BIC): A component that considers interest income, interest earning assets, dividend income, financial transactions, fees, and other operational income and expenses. These are then multiplied by a marginal coefficient. |
| 2. | Internal Loss Multiplier (ILM): This component is based on 10 years of historical operational losses, or at least five years in some special cases. |
BCBS defines market risk (MR) as the risk of losses arising from movements in market prices. The risks subject to market risk capital requirements mainly includes: interest rate risk, credit spread risk, equity risk, foreign exchange (FX) risk and commodities risk for trading book instruments; and FX risk and commodities risk for banking book instruments. The FMC will not permit banks to use internal models for calculating MRWA and instead has published standardized models that all banks must use.
60
The regulations for calculating RWA under the new guidelines must be implemented by December 1, 2021. We believe our current capital levels are adequate, but we cannot rule out having to raise additional capital in the future in order to maintain our capital adequacy ratios above the minimum required by the FMC.
Lending Limits
Under the General Banking Law, Chilean banks are subject to certain lending limits, including the following material limits:
| A bank may not extend to any entity or individual (or any one group of related entities), except for another financial institution, directly or indirectly, unsecured credit in an amount that exceeds 10.0% of the bank’s regulatory capital, or in an amount that exceeds 30.0% of its regulatory capital if the excess over 10.0% is secured by certain assets with a value equal to or higher than such excess. |
| a bank may not extend loans to another financial institution subject to the General Banking Law in an aggregate amount exceeding 30.0% of its regulatory capital; |
| a bank may not grant loans to a single business group, as defined in Title XV of Law 18.045, that exceeds 30% of the Bank’s regulatory capital. This limit excludes interbank loans. |
| · | if a bank originates a loan in excess of these limits, a fine equivalent to 10% of the excess will be applied to the bank. |
| · | a bank may not directly or indirectly grant a loan whose purpose is to allow an individual or entity to acquire shares of the lender bank; |
| a bank may not lend, directly or indirectly, to a director or any other person who has the power to act on behalf of the bank; and |
| a bank may not grant loans to related parties (including holders of more than 1.0% of its shares) on more favorable terms than those generally offered to non-related parties. Loans granted to related parties are subject to the limitations described in the first bullet point above. In addition, the aggregate amount of loans to related parties may not exceed a bank’s regulatory capital. |
In addition, the General Banking Law limits the aggregate amount of loans that a bank may grant to its employees to 1.5% of its regulatory capital, and provides that no individual employee may receive loans in excess of 10.0% of this 1.5% limit. Notwithstanding these limitations, a bank may grant to each of its employees a single residential mortgage loan for personal use during such employee’s term of employment.
Allowance for Loan Losses under Chilean Bank GAAP
Chilean banks are required to provide to the SBIFFMC detailed information regarding their loan portfolio on a monthly basis. The SBIFFMC examines and evaluates each financial institution’s credit management process, including its compliance with the loan classification guidelines. Banks are classified into four categories: 1, 2, 3 and 4. Each bank’s category depends on the models and methods used by the bank to classify its loan portfolio, as determined by the SBIF.FMC. Category 1 banks are those banks whose methods and models are satisfactory to the SBIF.FMC. Category 1 banks will be entitled to continue using the same methods and models they currently have in place. A bank classified as a category 2 bank will have to maintain the minimum levels of reserves established by the SBIFFMC while its Board of Directors will be made aware of the problems detected by the SBIFFMC and required to take steps to correct them. Banks classified as categories 3 and 4 will have to maintain the minimum levels of reserves established by the SBIFFMC until they are authorized by the SBIFFMC to do otherwise. Santander-Chile is categorized as a “Category 1” bank.
61
Differences between IFRS and Chilean Bank GAAP
As stated above, Chilean Bank GAAP, as prescribed by the Compendium of Accounting Standards (the “Compendium”), differs in certain respects from IFRS. The main differences that should be considered by an investor are the following:
Suspension of Income Recognition on Accrual Basis
In accordance with the Compendium, financial institutions must suspend recognition of income on an accrual basis in their statements of income for certain loans included in the impaired portfolio. IFRS 9 and IAS 39 did not allow the suspension of accrual of interest on financial assets for which an impairment loss has been determined. As of January 1, 2018, the Bank adopted IFRS 9. Under IFRS 9, interest income is calculated by applying the effective interest rate to the gross carrying amount of financial assets, except for financial assets that have subsequently become credit-impaired (or “Stage 3”), for which interest revenue is calculated by applying the effective interest rate to their amortized cost (i.e., net of ECL provision). Off-balance interests are recorded as interest income only if the Bank receives the related payments. This difference does not materially impact our Audited Consolidated Financial Statements.
Charge-offs and Accounts Receivable
The Compendium requires companies to establish deadlines for the charge-off of loans and accounts receivable. IFRS does not require any such deadline for charge-offs. A charge-off due to impairment would be recorded, if and only if, all efforts at collection of the loan or account receivable had been exhausted. Accordingly, this difference does not materially impact our Audited Consolidated Financial Statements.
Assets Received Inin Lieu of Payment
The Compendium requires that the initial value of assets received in lieu of payment be the value agreed upon with a debtor as a result of the loan settlement or the value awarded in an auction, as applicable. These assets are required to be written off one year after their acquisition, if the assets have not been previously disposed of. IFRS requires that assets received in lieu of payment be initially accounted for at fair value. Subsequently, asset valuation depends on the classification provided by the entity for that type of asset. No deadline is established for charging-off an asset. The Bank has adjusted the Audited Consolidated Financial Statements accordingly.
Loan loss allowancesLoss Allowances
Prior to the adoption of IFRS 9 on January 1, 2018, the Bank calculated loan loss allowances in accordance with IAS 39. The main difference between Chilean Bank GAAP and IFRS 9 and IAS 39 regarding loan loss allowances is that loan loss allowances under Chilean GAAP are calculated using expected loss models based on specific guidelines set by the SBIF,FMC, which in turn are based on an expected losses approach while IAS 39 used an incurred loss approach. According to both Chilean Bank GAAP and IFRS, loan loss allowances are calculated using expected loss models. The models adopted with IFRS 9 used an expected loss approach, however these are not in accordance with specific guidelines under Chilean Bank GAAP given by the SBIF.FMC. The SBIFFMC has not yet adopted IFRS 9 and therefore the Bank has adjusted the Audited Consolidated Financial Statements to fully comply with IFRS standards. The most significant impact of IFRS 9 on the Bank’s financial statements arises from the new impairment requirements. Impairment losses will increase and become more volatile for financial instruments in the scope of the IFRS 9 impairment model. Based on the assessment made the total impact (net of tax) of the adoption of IFRS 9 on the opening balance on the Bank’s equity at 1 January 2018 iswas Ch$82,454 million (net of tax).
Provisions for country riskCountry Risk and for contingent loan riskContingent Loan Risk
Under Chilean Bank GAAP, the Bank provisions for country risk to cover the risk taken when holding or committing resources with any foreign country. These allowances are established according to country risk classifications established by the SBIFFMC and therefore are not in accordance with IFRS as issued by the IASB. Our Audited Consolidated Financial Statements have been adjusted accordingly.
62
Also under Chilean Bank GAAP, the Bank has established allowances related to the undrawn available credit lines and contingent loans in accordance with the SBIF.FMC. Prior to the adoption of IFRS 9, IAS 39 only permitted allowances following internal models based on incurred debt. With the adoption of IFRS 9, provisions for contingent loans are calculated based on expected credit loss. The Bank has adjusted the Audited Consolidated Financial Statements accordingly.
These differences do not materially impact our financial statements.
Equity instrument at FVOCI
Under IFRS 9, the Bank may make an irrevocable election to present subsequent changes in the fair value of the equity instrument in other comprehensive income. Gains or losses on derecognition of these equity instruments are not transferred to profit or loss. Under Chilean GAAP, the Bank can apply IAS 39 and accordingly, account those equity instruments at cost. The Bank’s Audited Consolidated Financial Statements have been adjusted accordingly.
Loans at FVOCI
The Bank has determined to classify a small portion of its portfolio loans as fair value through other comprehensive income, when management expects to sell if market conditions are favorable, or when the Financial Risk Committee authorizes an operation to be sold entirely or in part. For IFRS 9 purposes, the Bank reclassifies those loans into a separate portfolio and determines its fair value. Under Chilean GAAP, those loans are accounted at amortized cost.
Deferred taxes
The Bank records, when appropriate, deferred tax assets and liabilities for the estimated future tax effects attributable to differences between the carrying amount of assets and liabilities and their tax bases. Due to the adjustments made to the consolidated financial statements, we adjust deferred taxes accordingly.
Provision for mandatory dividendsMandatory Dividends
This provision is made in accordance with the Bank’s internal policy and Article 79 of the Chilean Companies Law, pursuant to which at least 30% of net income for the period is distributed, except in the case of a contrary resolution adopted at the respective shareholders’ meeting by unanimous vote of the outstanding shares. While the Bank uses the same policy under Chilean Bank GAAP and IFRS, the net income used to calculate the provision is adjusted in accordance with IFRS principles, howeverprinciples. However, for the distribution of dividends, the Bank uses the net income according to Chilean Bank GAAP.
Capital Markets
Under the General Banking Law, banks in Chile may purchase, sell, place, underwrite and act as paying agents with respect to certain debt securities. Likewise, banks in Chile may place and underwrite certain equity securities. Bank subsidiaries may also engage in debt placement and dealing, equity issuance advice and securities brokerage, as well as in financial leasing, mutual fund and investment fund administration, investment advisory services and merger and acquisition services. These subsidiaries are regulated by the SBIF and, in some cases, also by the FMC, the regulator of the Chilean securities market, open-stock corporations and insurance companies. The absorption of the SBIF by the FMC is expected to take place on June 1, 2019.FMC.
Legal Provisions Regarding Banking Institutions with Economic Difficulties
Article 112 of the New General Banking Law provides that if specified adverse economic circumstances exist at any bank, its Board of Directors must approve a financing plan to correct the situation and present it to the FMC. In its proposal, the bank must state the scheduled time within which the plan will be completed, which may not exceed 6 months. If one of the measures contained in the financing plan is to increase the capital of the bank by the amount necessary to return the bank to financial stability, the Board of Directors must call a special shareholders’ meeting to the capital increase. If the shareholders reject the capital increase, the FMC may apply one or more of the restrictions stated in Article 116 of the New General Banking Law for a period not exceeding 6 months, which may be renewed once for the same period. These restrictions include limiting the bank’s ability to grant loans to any person or legal entity linked (directly or through third parties) to the property or management of the bank, limiting loan renewals for more than 180 days, limiting security documents governing existing loans, among others.
63
If the approval of shareholders is required for a different measure included in the plan, the Board of Directors must call the shareholders’ meeting within 15 days. The General Banking Law provides that the bank may receive a three-year term loan from one or more banking institutions. The terms and conditions of such a loan must be approved by the directors of both banks, as well as by the FMC, but need not be submitted to any institution’s shareholders for their approval. In any event, a creditor bank cannot grant interbank loans to an insolvent bank in an amount exceeding 25.0% of the creditor bank’s regulatory capital. If the bank is unable to pay the loan to its creditors, article 115 of the General Banking Law provides that a bank’s unpaid debt may be: (i) capitalized in a merger between the bank and creditor bank, where the creditor bank may establish the terms and conditions of the merger provided such terms and conditions are approved by the FMC; (ii) used to complete a capital increase agreed by the bank, provided that the shares are issued by a third party; and (iii) to subscribe and pay a capital increase. The shares acquired by the creditor bank must be sold within a period of 180 days, which can be extended by the FMC for a further 180 days.
Dissolution and Liquidation of Banks
The SBIFFMC may establish that a bank should be liquidated for the benefit of its depositors or other creditors when such bank does not have the necessary solvency to continue its operations. In such case, the SBIFFMC must revoke a bank’s authorization to exist and order its mandatory liquidation, subject to agreement by the Central Bank. The SBIFFMC must also revoke a bank’s authorization if the reorganization plan of such bank has been rejected twice. The resolution by the SBIFFMC must state the reason for ordering the liquidation and must name a liquidator, unless the SBIFFMC assumes this responsibility. When a liquidation is declared, all checking accounts and other demand deposits received in the ordinary course of business, are required to be paid by using existing funds of the bank, its deposits with the Central Bank or its investments in instruments that represent its reserves. If these funds are insufficient to pay these obligations, the liquidator may seize the rest of the bank’s assets, as needed. If necessary and in specified circumstances, the Central Bank will lend the bank the funds necessary to pay these obligations. Any such loans are preferential to any claims of other creditors of the liquidated bank.
On January 12, 2019, Law No. 21,130 was published in the Official Gazette of Chile. The law modernizes banking legislation including the General Banking Law by, among other things, transferring the supervisory powers of the SBIF to the FMC, updating the capital and risk management requirements applicable to banking companies in accordance with the BaselaBasel III standards, and introducing measures for the early regularization and intervention of banking companies that are at risk of insolvency.
With respect to measures for early regularization, Law No. 21,130 establishes an obligation on banks to inform the FMC if any of the regulatory non-compliance situations listed in Article 112 of the New General Banking Law arise or if it has detected any event indicative of financial instability or deficient administration. Within five days of notifying the FMC, the bank must present a regularization plan approved by its board of directors containing concrete measures that shall remedy the relevant situation and ensure the bank’s normal performance. The bank must comply with the regularization plan within 6 months of the resolution approving it. During the implementation of the plan, the bank must also submit periodic reports on its progress to the FMC, and the FMC may require the implementation of additional measures and/or prohibitions it deems necessary for the plan’s success.
Article 161 of the New General Banking Law provides that directors, managers, administrators and attorneys-in-fact who, without written authorization from the FMC, agree to, perform or cause the execution of any of the acts prohibited under Article 116 of the New General Banking Law shall be sanctioned with ordinary imprisonmentimprisoned for a term within the medium to maximum range. If a bank fails to submit the regularization plan, the plan is rejected by the FMC, the bank fails to comply with any of the measures set out in the plan, the bank repeatedly breaches the plan’s terms or is subject to fines, or if any serious event occurs that raises concerns for the bank’s financial stability, the FMC may appoint a delegated inspector, who shall have powers to, among other things, suspend any agreement of the board of directors or act of the attorneys-in-fact of the institution, and/or a provisional administrator, who shall have all the ordinary faculties that the law and the by-laws provide for the board of directors, or whoever acts in its place, and for the general manager.
Other amendments incorporated by Law No. 21,130 include the elimination of creditors’ agreements as a mechanism for regularizing a bank’s financial situation, the incorporation of modifications to financial system capitalization and preventive capitalization, and the incorporation of further requirements for bank directors.
64
Obligations Denominated in Foreign Currencies
Santander-Chile must also comply with various regulatory and internal limits regarding exposure to movements in foreign exchange rates (See “Item 11. Quantitative and Qualitative Disclosures About Market Risk”).
Loans and Investments in Foreign Securities
Under current Chilean banking regulations, banks in Chile may grant loans to foreign individuals and entities and invest in certain securities of foreign issuers. Banks may grant commercial loans and foreign trade loans, and can buy loans granted by banks abroad. Banks in Chile may also invest in debt securities traded in formal secondary markets. Such debt securities must be (1) securities issued or guaranteed by foreign sovereign states or their central banks or other foreign or international financial entities, and (2) bonds issued by foreign companies. If the sum of investment in foreign securities and loans granted outside of Chile surpasses 70.0% of regulatory capital, the amount that exceeds 70.0% is subject to a mandatory reserve of 100.0%.
Table 1
| Rating Agency | Short Term | Long Term | ||
| Moody’s | P2 | Baa3 | ||
| Standard and Poor’s | A3 | BBB- | ||
| Fitch | F2 | BBB- | ||
| Dominion Bond Rating (DBRS) | R-2 | BBB (low) |
In the event that the sum of: (a) loans granted abroad that are not to subsidiaries of Chilean companies, and that have a rating of BB- or less and do not trade on a foreign stock exchange, and (b) the investments in foreign securities which have a rating that is below that indicated in Table 1 above, but is equal to or exceeds the ratings mentioned in the Table 2 below and exceeds 20.0% (and 30.0% for banks with a BIS ratio equal or exceeding 10% of the regulatory capital of such bank), the excess is subject to a mandatory reserve of 100.0%.
Table 2
| Rating Agency | Short Term | Long Term | ||
| Moody’s | P2 | Ba3 | ||
| Standard and Poor’s | A-2 | BB- | ||
| Fitch | F2 | BB- | ||
| Dominion Bond Rating (DBRS) | R-2 | BB (low) |
In addition, banks may invest in foreign securities whose ratings are equal or exceedsexceed those mentioned in Table 3 below for an additional amount equal to 70% of their regulatory capital. This limit constitutes an additional margin and is not subject to the 100% mandatory reserve.
Additionally, a Chilean bank may invest in foreign securities whose rating is equal to or exceeds those mentioned in Table 3 below in: (i) demand deposits with foreign banks, including overnight deposits in a single entity; and (ii) securities issued or guaranteed by sovereign states or their central banks or securities issued or guaranteed by foreign entities within the Chilean State, though investment will be subject to the limits by issuer up to 30.0% and 50.0%, respectively, of the regulatory capital of the Chilean bank that makes the investment. If these foreign securities do not have a rating, the individual limit will be 10.0% of regulatory capital.
Table 3
| Rating Agency | Short Term | Long Term | ||
| Moody’s | P1 | Aa3 | ||
| Standard and Poor’s | A1+ | AA- | ||
| Fitch | F1+ | AA- | ||
| DBRS | R-1 (high) | AA(low) |
65
Moreover, the sum of all demand deposits with foreign banks, including overnight deposits to related parties, as defined by the Central Bank and the FMC cannot surpass 25.0% of a bank’s regulatory capital. This limit excludes foreign branches of Chilean banks or their subsidiaries, but must include amounts deposited by these entities in related parties abroad.
Chilean banks may only invest in equity securities of foreign banks and certain other foreign companies which may be affiliates of the bank or which would be complementary to the bank’s business if such companies were incorporated in Chile.
United States Supervision and Regulation
Financial Regulatory Reform
Banking statutes and regulations are continually under review by the United States Congress. In addition to laws and regulations, the U.S. bank regulatory agencies may issue policy statements, interpretive letters and similar written guidance. Many changes have occurred as a result of the 2010 Dodd-Frank Act and its implementing regulations, most of which are now in place. More recently, there have been several statutory and regulatory initiatives aimed at providing relief for the President of the United States issued an executive order in 2017 that sets forth principles for financial regulatory and legislative reform.services industry. In May 2018 the United States Congress passed, and President Trump signed into lawgovernment enacted the Economic Growth, Regulatory Relief, and Consumer Protection Act (“EGRRCPA”), which, exempts bank holding companies with less than $100 billion inamong other things, revised the thresholds for total consolidated assets fromat which certain enhanced prudential standards and may exemptapply to bank holding companies with between $100 billion and $250 billion in total consolidated assets from certain enhanced prudential standards in 2019 at the Federal Reserve’s discretion.companies. EGRRCPA made clear that the Board of Governors of the Federal Reserve retainedSystem (the “Federal Reserve Board”) retains the right to apply enhanced prudential standards to FBOsforeign banking organizations (“FBOs”) with greater than $100 billion in global total consolidated assets, such as Santander Spain, butSpain.
In October 2019, the Federal Reserve has not yet proposed regulationsfederal banking agencies issued final rules that, pursuant to implement EGRRCPA, for FBOs. Whileadjust the final form of regulations implementing EGRRCPA for FBOs is unclear, it is possible that EGRRCPA and its implementing regulations will leave in place mostthresholds at which certain enhanced prudential standards applicableand capital and liquidity requirements apply to certain banking organizations, including large FBOs such as Santander Spain. As a result, Santander Spain is now generally subject to less restrictive enhanced prudential standards and capital and liquidity requirements than under previously applicable regulations.
In November 2020 the United States held national elections and a new administration is now in place. We believe that it is likely that there will be further material changes in the way major financial institutions are regulated in the United States. Although it remains difficult to predict the exact impact these changes will have little direct impact on Santander-Chile.Santander Spain’s U.S. operations, the new administration is expected to increase the regulatory requirements on large financial institutions compared to the previous administration.
Volcker Rule
Section 13 of the U.S. Bank Holding Company Act of 1956, as amended, and its implementing rules (collectively, the “Volcker Rule”) prohibit “banking entities” from engaging in certain forms of proprietary trading or from sponsoring or investing in “covered funds,” in each case subject to certain exceptions. The Volcker Rule also limits the ability of banking entities and their affiliates to enter into certain transactions with covered funds with which they or their affiliates have certain relationships. Banking entities such as Santander-Chile and Santander Spain were required to bring their activities and investments into compliance with the requirements of the Volcker Rule by the end of the conformance period applicable to each requirement. Santander Spain has assessed how the Volcker Rule affects its businesses and subsidiaries, including Santander-Chile, and has brought its activities into compliance. The Group has adopted processes to establish, maintain, enforce, review and test the compliance program designed to achieve and maintain compliance with the Volcker Rule. The Volcker Rule contains exclusions and certain exemptions for market-making, hedging, underwriting, trading in U.S. government and agency obligations, as well as certain foreign government obligations, and trading solely outside the United States, and also permits certain ownership interests in certain types of funds to be retained. Santander Spain’s non-U.S. banking organization subsidiaries, including Santander-Chile, are largely able to continue their activities outside the United States in reliance on the “solely outside the U.S.” exemptions from the Volcker Rule. Those exemptions generally exempt proprietary trading, and sponsoring or investing in covered funds if, among other restrictions, the essential actions take place outside the United States and any transactions are not with U.S. persons.
66
On July 21, 2017 the five regulatory agencies charged with implementing the Volcker Rule announced the coordination of reviews of the treatment of certain foreign funds that are investment funds organized and offered outside of the United States and that are excluded from the definition of covered fund under the agencies’ implementing regulations. Also, in July 2017, the Federal Reserve issued guidelines for banking entities seeking an extension to conform certain “seeding” investments in covered funds to the requirements of the Volcker Rule.
In May 2018,As of October 2019, the five regulatory agencies charged with implementing the Volcker Rule released proposedfinalized amendments to the current Volcker Rule regulations. The proposal wouldRule. These amendments tailor the Volcker Rule’s compliance requirements to the amount of a firm’s trading activity, revise the definition of a trading account, clarify certain key provisions in the Volcker Rule, and simplifymodify the information that covered entitiescompanies are required to provide to regulatorythe federal agencies. If adopted, the proposed changes regarding the definition of trading account would likely expand the scope of investing and trading activities subject to the Volcker Rule’s restrictions, although Santander-Chile wouldwill still largely rely on the “solely outside the U.S. exemption” to conduct its trading activities.
In June 2020, the five federal agencies finalized additional amendments to the Volcker Rule related to the restrictions on ownership interests in and relationships with covered funds. These amendments became effective on October 1, 2020 with no impact on Santander Chile. Santander Spain will continue to monitor Volcker Rule-related developments and assess their impact on its operations, including those of Santander-Chile, as necessary.
U.S. Anti-Money Laundering, Anti-Terrorist Financing, and Foreign Corrupt Practices Act Regulations
Santander-Chile, as a foreign private issuer whose securities are registered under the U.S. Securities Exchange Act of 1934, is subject to the U.S. Foreign Corrupt Practices Act (the “FCPA”). The FCPA generally prohibits such issuers and their directors, officers, employees and agents from using any means or instrumentality of U.S. interstate commerce in furtherance of any offer or payment of money to any foreign official or political party for the purpose of influencing a decision of such person in order to obtain or retain business. It also requires that the issuer maintain books and records and a system of internal accounting controls sufficient to provide reasonable assurance that accountability of assets is maintained, and accurate financial statements can be prepared. Penalties, fines and imprisonment of Santander-Chile’s officers and/or directors can be imposed for violations of the FCPA.
Furthermore, Santander-Chile is subject to a variety of U.S. anti-money laundering and anti-terrorist financing laws and regulations, such as the Bank Secrecy Act of 1970, as amended, and the USA PATRIOT Act of 2001, as amended, and a violation of such laws and regulations may result in substantial penalties, fines and imprisonment of Santander-Chile’s officers and/or directors.
The Anti-Money Laundering Act of 2020 (“AML Act”), enacted on January 1, 2021 as part of the National Defense Authorization Act, does not directly impose new requirements on banks, but requires the U.S. Treasury Department to issue National Anti-Money Laundering and Countering the Financing of Terrorism Priorities, and conduct studies and issue regulations that may, over the next few years, significantly alter some of the due diligence, recordkeeping and reporting requirements that the Bank Secrecy Act and Patriot Act impose on banks. The AML Act also contains provisions that promote increased information-sharing and use of technology, and increases penalties for violations of the Bank Secrecy Act and includes whistleblower incentives, both of which could increase the prospect of regulatory enforcement.
Disclosure pursuant to Section 219 of the Iran threat reduction and Syria human rights act
Pursuant to Section 219 of the Iran Threat Reduction and Syria Human Rights Act of 2012, which added Section 13(r) to the Securities Exchange Act of 1934, as amended (the “Exchange Act”), an issuer is required to disclose in its annual or quarterly reports, as applicable, whether it or any of its affiliates knowingly engaged in certain activities, transactions or dealings relating to Iran or with individuals or entities designated pursuant to certain Executive Orders. Disclosure is generally required even where the activities, transactions or dealings were conducted in compliance with applicable law.
As we are part of the Santander Group, we must also disclose the exposure of other entities of the Santander Group to Iran. The following activities are disclosed in response to Section 13(r) with respect to the Santander Group and its affiliates. During the period covered by this annual report:
| a) | Santander UK holds five blocked accounts for three customers, with the first customer holding one GBP savings account and one GBP current account, the second customer holding one GBP savings account, and the third customer holding two GBP current accounts. All three customers, who are resident in the UK, are currently designated by the US under the Specially Designated Global Terrorist (SDGT) sanctions program. Revenues and profits generated by Santander UK on these accounts in the year ended December 31, 2020 were negligible relative to the overall profits of Banco Santander S.A. |
(a) Santander UK holds two savings accounts and one current account for two customers. Both
67
(b) During the period covered by this annual report, Santander UK held one savings account with a balance of £1.24, and one current account with a balance of £1,884.53 for another customer resident in the UK who is currently designated by the US under the SDGT sanctions program. The customer relationship pre-dates the designations of the customer under these sanctions. The United Nations and European Union removed this customer from their equivalent sanctions lists in 2008. Santander UK determined to put a block on these accounts and the accounts were subsequently closed on January 14, 2019. Revenues and profits generated by Santander UK on these accounts in the year ended December 31, 2018 were negligible relative to the overall profits of Banco Santander SA.
| b) | Santander UK holds two frozen current accounts for two UK nationals who are designated by the US under the SDGT sanctions program. The accounts held by one customer were fully inaccessible at the time of the US designation and were blocked at the time of the account going into a debit balance. The accounts held by the second customer were blocked immediately following the US designation and have remained frozen throughout 2020. These accounts are frozen in order to comply with Articles 2, 3 and 7 of Council Regulation (EC) No 881/2002 imposing certain specific restrictive measures directed against certain persons and entities associated with the Al-Qaeda network, by virtue of Commission Implementing Regulation (EU) 2015/1815. The accounts are in arrears (£1,844.73 in debit combined) and are currently being managed by Santander UK Collections & Recoveries department. No revenues or profits were generated by Santander UK on these accounts in the year ended December 31, 2020. |
(c) Santander UK holds two frozen current accounts for two UK nationals who are designated by the US under the SDGT sanctions program. The accounts held by each customer have been frozen since their designation and have remained frozen through 2018. The accounts are in arrears (£1,844.73 in debit combined) and are currently being managed by Santander UK Collections & Recoveries department. No revenues or profits were generated by Santander UK on these accounts in the year ended December 31, 2018.
| c) | Santander Consumer Bank, S.A. holds seven blocked correspondent accounts for Bank Melli. Three USD accounts and four EUR accounts. The accounts have been blocked since 2008. Bank Melli is currently designated by the US under the Specially Designated Global Terrorist (SDGT) sanctions program. No revenues or profits were generated by Santander Consumer Bank, S.A. on these accounts in the year ended December 31, 2020. |
(d) The Group also has certain legacy performance guarantees for the benefit of Bank Sepah and Bank Mellat (stand-by letters of credit to guarantee the obligations – either under tender documents or under contracting agreements – of contractors who participated in public bids in Iran) that were in place prior to April 27, 2007.
| d) | The Santander Group also has certain legacy performance guarantees for the benefit of Bank Mellat (stand-by letters of credit to guarantee the obligations – either under tender documents or under contracting agreements – of contractors who participated in public bids in Iran) that were in place prior to April 27, 2007. |
In the aggregate, all of the transactions described above resulted in gross revenues and net profits in the year ended December 31, 2018,2020, which were negligible relative to the overall revenues and profits of Banco Santander, S.A. The Santander Group has undertaken significant steps to withdraw from the Iranian market such as closing its representative office in Iran and ceasing all banking activities therein, including correspondent relationships, deposit taking from Iranian entities and issuing export letters of credit, except for the legacy transactions described above. The Santander Group is not contractually permitted to cancel these arrangements without either (i) paying the guaranteed amount (in the case of the performance guarantees), or (ii) forfeiting the outstanding amounts due to it (in the case of the export credits). Therefore,As such, the Santander Group intends to continue to provide the guarantees and hold these assets in accordance with company policy and applicable laws.
C. Organizational Structure
Santander Spain controls Santander-Chile through its holdings in Teatinos Siglo XXI Inversiones S.A. and Santander Chile Holding S.A. which are controlled subsidiaries. Santander Spain control over 67.18% of our shares and actual participation when excluding non-controlling interests participating in Santander Chile Holding S.A. of 67.12%.
| Shareholder | Number of Shares | Percentage | ||||||
| Santander Chile Holding S.A. | 66,822,519,695 | 35.46 | ||||||
| Teatinos Siglo XXI Inversiones S.A. | 59,770,481,573 | 31.72 | ||||||
68
| Shareholder | Number of Shares | Percentage | ||||||
| Santander Chile Holding S.A. | 66,822,519,695 | 35.46 | ||||||
| Teatinos Siglo XXI Inversiones S.A. | 59,770,481,573 | 31.72 | ||||||
The chart below sets forth the names and areas of responsibility of our senior managers as of March 15, 2019.the date of the filing of this annual report:
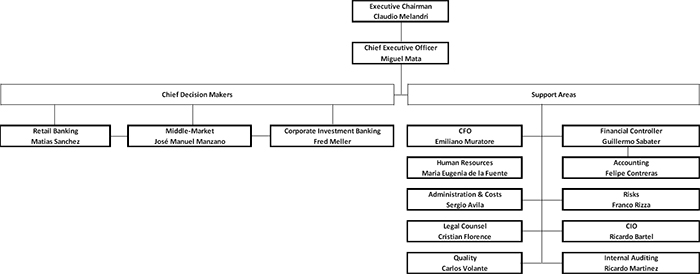
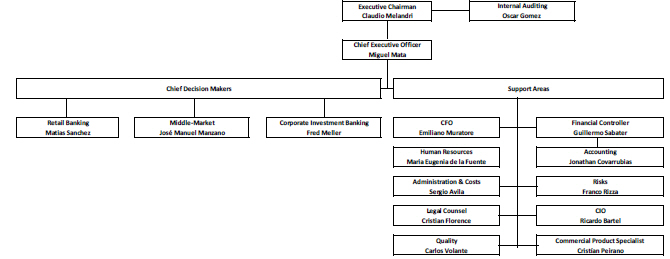
D. Property, Plantplants and Equipmentequipment
We are domiciled in Chile and own our principal executive offices located at Bandera 140, 20th20th floor, Santiago, Chile. At December 31, 2018,2020, we owned the locations at which 25.2%35.7% of our branches were located. The remaining branches operate at rented locations. We believe that our existing physical facilities are adequate for our needs.
Main | Number | ||||
| Central Offices | |||||
| Owned | 4 | ||||
| Rented | 5 | ||||
| Total | 9 | ||||
| Branches | |||||
| Owned | |||||
| Rented | |||||
| Total | |||||
| Other | |||||
| Owned | |||||
| Rented | 5 | ||||
| Total | |||||
____________________
(1) Consists mainly of parking lots, mini-branches and property owned by our subsidiaries.
ITEM 4A. UNRESOLVED STAFF COMMENTS
None.
ITEM 5. OPERATING AND FINANCIAL REVIEW AND PROSPECTS
Accounting Standards Applied in 20182020
Santander-Chile is a Chilean bank and maintains its financial books and records in Chilean pesos and prepares its consolidated financial statements in accordance with IFRS as issued by the IASB in order to comply with requirements of the SEC. As required by the General Banking Law, which subjects Chilean banks to the regulatory supervision of the FMC, and which mandates that Chilean banks abide by the accounting standards stipulated by the FMC, our locally-filed consolidated financial statements have been prepared in accordance with Chilean Bank GAAP as issued by the FMC. The accounting principles issued by the FMC are substantially similar to IFRS but there are some exceptions, as described in Item 4. Therefore, our locally-filed consolidated financial statements have been adjusted according to IFRS as issued by the IASB.
69
Critical Accounting Policies
Our consolidated financial statements include various estimates and assumptions, including but not limited to the adequacy of the allowance for loan losses, estimates of the fair value of certain financial instruments and the selection of useful lives of certain assets.
We evaluate these estimates and assumptions on an ongoing basis. Management bases its estimates and assumptions on historical experience and on various other factors that it believes to be reasonable under the circumstances. Actual results in future periods could differ from those estimates and assumptions, and if these differences were significant enough, our reported results of operations would be affected materially. We believe that the following are the most critical judgment areas or involve a higher degree of complexity in the application of the accounting policies that currently affect our financial condition and results of operations.
Adoption of IFRS 9 in 2018: Allowance for loan lossesLoan Losses
Since January 2018, the Bank has replaced the “incurred loss” model in IAS 39 with the “expected credit loss (ECL)” model of IFRS 9. See “Note 2—Accounting Changes—IFRS 9 Adoption – Transition Disclosure”Changes” of our Audited Consolidated Financial Statements.
The new single impairment model applies to all financial assets measured at amortizedcost and fair value through other comprehensive income (“FVOCI”), including loan commitments and contingent loans. The Bank accounted the ECL related to financial assets measured at amortized cost and FVOCI as a loss allowance in the statement of financial position and the carrying amount of these assets is stated net of the loss allowance. The ECL related to contingent loans are accounted as a provision in the statement of financial position. For financial assets that are measured at fair value through other comprehensive income, the loss allowance is recognized in other comprehensive income and does not reduce the carrying amount of the financial asset in the statement of financial position. The new model uses a dual measurement approach, under which the loss allowance is measured as either: (a) 12-month expected credit losses or (b) lifetime expected credit losseslosses.
Based on changes in credit quality since initial recognition, IFRS 9 outlines a “three-stage” impairment model as illustrated by the following chart:
  Change in credit quality since initial recognition Change in credit quality since initial recognition   | ||
| Stage 1 | Stage 2 | Stage 3 |
| Initial recognition | Significant increase in credit risk since initial recognition | Credit impaired assets |
| 12-month expected credit losses | Lifetime expected credit losses | Lifetime expected credit losses |
The Bank, at the end of each reporting period, evaluates whether a financial instrument’s credit risk has increased since initial recognition, and consequently classifies the financial instrument in the relevant stage:
| Stage 1: At initial recognition of a loan or when there has been an improved credit risk following a significant increase or impairment of assets, the Bank recognizes an allowance based on 12 months ECL. |
| Stage 2: When a loan has shown a significant increase in credit risk since origination, the Bank records an allowance for the lifetime ECL. Stage 2 loans also include loans where the credit risk has improved following a Stage 3 classification. |
| Stage 3: Loans considered credit-impaired. The Bank records an allowance for the lifetime ECL, setting the probability of default at 100%. |
The Bank considers reasonable and verifiable information available without undue cost or effort to it that may affect the credit risk on a financial instrument, including forward-looking information to determine whether there is or has been a significant increase in credit risk since initial recognition of a loan. Forward-looking information includes past events that affect future performance, current conditions and forecasts of future economic conditions.
70
Expected credit loss measurement
The expected credit losses is the probability-weighted estimate of credit losses,i.e., the present value of all cash shortfalls. A cash shortfall is the difference between the cash flows that are due to an entity in accordance with the contract and the cash flows that the entity expects to receive. The three main components in measuring expected credit losses are:
| PD: The probability of default is an estimate of the likelihood of default over a given time period. A default may only happen at a certain time over the assessed period, if the facility has not been previously de-recognized and is still in the portfolio. |
| LGD: The loss given default is an estimate of the loss arising after a specific default. It is based on the difference between the contractual cash flows due and those that the lender would expect to receive, including from the realization of any collateral. |
| EAD: The exposure at default is an estimate of the exposure at a future default date, taking into account expected changes in the exposure after the reporting date, including repayments of principal and interest, whether scheduled by contract or otherwise, expected drawdown on committed facilities and accrued interest from missed payments. |
For measuring 12-month and lifetime expected credit losses, cash shortfalls are identified as follows:
| 12-month expected credit losses: the portion of lifetime expected credit losses that represents the expected credit losses that result from default events on the financial instruments that are possible within the 12 months after the reporting date. |
| Lifetime expected credit losses: the expected credit losses that result from all possible default events over the expected life of the financial instrument. |
Forward-looking information
The ECL model includes a broad range of forward-looking information as economic inputs, such as:
| GDP growth; |
| Unemployment rates; |
| Central Bank interest rates; and |
| Real estate prices. |
Interbank loans
According to the new balance presentation required under IFRS 9, the Bank has grouped interbank loans with loans and accounts receivable since both are measured at amortized cost and are evaluated together for impairment purposes.
Contingent loans
The Bank enters into various irrevocable loan commitments and contingent liabilities. Even though these obligations may not be recognized on the statement of financial position, they contain credit risk and, therefore, form part of the overall risk of the Bank. When the Bank estimates the ECLfor contingent loan commitments and letters of credit, it estimates the expected portion of the loan commitment that will be drawn down over its expected life.
71
Loans and account receivable measured at fair value through other comprehensive income
When the Bank enters into arrangements with its major customers for project finance and syndicated loans, the amount requested sometimes exceeds the Bank’s limit for single client exposure under credit risk policy, so these operations are approved under the condition that a portion of the loans be sold in the near term. The Bank also has loans that it expects to sell if market conditions are favorable to the Bank. These loans are measured at fair value through other comprehensive income and are subject to impairment requirements.
The following table reconciles the prior period’s closing impairment allowance measured in accordance with the IAS 39 incurred loss model to the new impairment model under IFRS 9.
| Loans loss allowance under IAS 39 | Reclassification | Remeasurement | Loans loss allowance under IFRS 9 | |||||||||||||
| MCh$ | MCh$ | MCh$ | MCh$ | |||||||||||||
| Loans and receivable (IAS 39)/ Financial assets at amortised cost (IFRS 9) | ||||||||||||||||
| Interbank loans | 472 | (472 | ) | — | — | |||||||||||
| Loans and account receivable from customers | 790,685 | 84 | 97,322 | 888,091 | ||||||||||||
| Total loans and account receivable at amortised cost | 791,157 | (388 | ) | 97,322 | 888,091 | |||||||||||
| Available for sale investment (IAS39)/Financial assets at FVOCI (IFRS 9) | ||||||||||||||||
| Loans and account receivable from customer – at FVOCI | — | 388 | (291 | ) | 97 | |||||||||||
| Total financial assets at FVOCI | — | 388 | (291 | ) | 97 | |||||||||||
| Other credit- related commitments | ||||||||||||||||
| Contingent liabilities | 8,404 | — | (3,767 | ) | 4,637 | |||||||||||
| Loan commitments | — | — | 19,124 | 19,124 | ||||||||||||
| Total contingents | 8,404 | — | 15,357 | 23,761 | ||||||||||||
| Total provision for loan losses | 799,561 | — | 112,388 | 911,949 | ||||||||||||
Allowance for loan losses prior to 2018
The Bank records its allowances following its internal models for the recording of incurred losses. These models have been approved by the Board. To establish impairment losses, the Bank carries out an evaluation of outstanding loans and accounts receivable from customers, as detailed below:
Valuation of financial instrumentsFinancial Instruments
Fair value is the price that would be received to sell an asset or that would be paid to transfer a liability in an orderly transaction between market participants at the measurement date. IFRS 13 provides a hierarchy that separates the inputs and/or valuation technique assumptions used to measure the fair value of financial instruments. The hierarchy reflects the significance of the inputs used in making the measurement.
The hierarchy gives the highest priority to (unadjusted) quoted prices in active markets for identical assets or liabilities and the lowest priority to unobservable inputs. The Bank uses valuation techniques appropriate in the circumstances and for which sufficient data are available to measure fair value, maximizing the use of relevant observable inputs and minimizing the use of unobservable inputs.
For financial instruments with no available market prices, fair values are estimated using recent transactions in analogous instruments, and in the absence thereof, the present values or other valuation techniques based on mathematical valuation models sufficiently accepted by the international financial community. In the use of these models, consideration is given to the specific particularities of the asset or liability to be valued, and especially to the different kinds of risks associated with the asset or liability.
These techniques are significantly influenced by the assumptions used, including the discount rate, the estimates of future cash flows and prepayment expectations. See “Note 38—Fair Value of Financial Assets and Liabilities” in our Audited Consolidated Financial Statements.
Derivative activitiesActivities
Derivatives are measured at fair value on the statement of financial position and the net unrealized gain (loss) on derivatives is classified as a separate line item within the income statement. Under IFRS, banks must mark-to-market derivatives. Within the fair value of derivatives are included Credit Valuation Adjustment (“CVA”) and Debit Valuation Adjustment (“DVA”), all with the objective that the fair value of each instrument includes the credit risk of its counterparty and the Bank’s own risk. The CVA is a valuation adjustment to OTC derivatives as a result of the risk associated with the credit exposure assumed by each counterparty in each future period. The DVA is a valuation adjustment similar to the CVA but, in this case, it arises as a result of the Bank’s own risk assumed by its counterparties. The following inputs are used to calculate the CVA and DVA:
| Expected exposure: Including for each transaction the mark-to-market (MtM) value plus an add-on for the potential future exposure for each period. Mitigating factors such as collateral and netting agreements are taken into account, as well as a temporary impairment factor for derivatives with interim payments. |
| LGD: percentage of final loss assumed in a counterparty credit event/default. |
| Probability of default: for cases where there is no market information, proxies based on comparable companies in the same industry and with the same external rating as the counterparty, are used. |
| Discount factor curve. |
Impairment of available-for-sale financial assets priorAvailable-for-Sale Financial Assets Prior to 2018
Available for sale financial assets are evaluated for impairment throughout the year and at each reporting date in order to assess whether events or changes in circumstances indicate that these assets are impaired, such as an adverse change in business climate or observable market data, indicate that these assets may be impaired. If there is objective evidence of an impairment of an asset, an impairment test is performed by comparing the investments’ recoverable amount, which is the higher of its value in use and fair value less costs to sell, with its carrying amount.
72
The Bank evaluates available for sale financial assets with unrealized losses as of the end of each period and concludes if these were impaired. This review consists of evaluating the economic reasons for any declines, the credit ratings of the securities’ issuers, and the Bank’s intention and ability to hold the securities until the unrealized loss is recovered. See “Note 12— Debt Instruments at Fair Value through Other Comprehensive Income” in our Audited Consolidated Financial Statements.
Deferred tax assetsTax Assets and liabilitiesLiabilities
The Bank records, when appropriate, deferred tax assets and liabilities for the estimated future tax effects attributable to differences between the carrying amount of assets and liabilities and their tax bases. The measurement of deferred tax assets and liabilities is based on the tax rate, in accordance with the applicable tax laws, using the tax rate that applies to the period when the deferred asset and liability will be settled. The future effects of changes in tax legislation or tax rates are recorded in deferred taxes beginning on the date on which the law is enacted or substantially enacted. See “Note 16—Current and Deferred Taxes” of our Audited Consolidated Financial Statements.
Provisions - contingent liabilities– Contingent Liabilities
Provisions related to contingencies associated to pending signature of contracts, potential clients and other administrative claims, operational risk arise from financial transactions, potential property tax associated to leasing contracts are quantified using the best available information of uncertain future events that are not wholly within control of the Bank. These are reviewed and adjusted at each reporting date. See “Note 22—Provisions and Contingent Provisions” of our Audited Consolidated Financial Statements.
Adoption of IFRS 16 Leases
On January 1, 2019, IFRS 16 Leases has become effective; this standard sets out the principles for the recognition, measurement, presentation and disclosure of leases. The objective is to ensure that lessees and lessors provide relevant information in a manner that faithfully represents those transactions. IFRS 16 introduces a single lessee accounting model and requires a lessee to recognize assets and liabilities for all leases with a term of more than 12 months, unless the underlying asset is of low value. Athus a lessee is required to recognize a right-of-use asset representing its right to use the underlying leased asset and a lease liability representing its obligation to make lease payments. Lessor accounting however remains largely unchanged and the distinction between operating and finance leases is retained.
The Bank has establishedelected to adopt IFRS 16 using a team that has reviewed the Bank’s lease agreements in light of the new lease accounting guidelines in IFRS 16. The standard mainly affects the accounting of the Bank’s operating leases. To date, the Bank has non-cancellable operating lease commitments and short-term leases, which are recognized in the straight line as lease expenses in the results. For lease commitments that are within the scope of this standard, the Bank will recognize, as of January 1, 2019, right-of-use assets of approximately Ch$154,248 million and lease liabilities for the same amount, since themodified retrospective approach to the transition has been correctly defined simplified in which no corporate information is restated in its place, the cumulative effect of the application of the rule is given as an adjustment to the initial balance of the retained earnings for the years prior toat the date of its initial application.application, therefore, it has recognized a right-of-use asset for an amount equal to the lease liability, which amounted to Ch$154,284 million. For more details, see Note 14 of our Audited Consolidated Financial Statements.
Covid-19 Support Measures
The Bank will adopt IFRS 16has conducted an exhaustive analysis of the measures implemented as a result of January 1, 2019COVID-19, under the perspective of modified assets. The payment holiday program granted to our consumer loan portfolio included 3-month grace periods and applymodified terms and installments, and allowed modified interest rates, to the simplified transition approach.current lower market rate, and was considered a substantial modification of the original contractual conditions. Therefore, these consumer loans were accounted for as the termination of the original loan and the recognition of a new financial asset. In line with our internal guide, these modifications are classified as modifications for commercial reasons, because they are not attributable to the financial difficulty of the debtor, and a new loan operation has been originated under current market conditions.
For the mortgage loan portfolio, original contractual conditions were not modified, instead, the clients signed an addendum for the postponed installments, and a complementary operation was generated, with the mortgage guarantee covering both operations. Neither the monthly installments nor the rates were modified. This measure was granted only to clients with less than 30 days past due, and we have observed, once the postponed periods have ended, that 98% of our clients are meeting their obligations in a timely manner. In line with our internal guide, we have concluded that the modifications granted to customers with no past due days were classified as modifications for commercial reasons, while clients with any past due or that have had some restructuring (marked special risk), were classified as modifications for the financial difficulty of the debtor, and the Bank will not restatehas calculated the comparative amounts fordifference between the year prior to adoption. The right-of-use assets for property leases are measured ingross carrying amount and the transition as the new rules would have always applied. All other assets for right-of-use are measured in the amountpresent value of the liability formodified loans discounted at the lease on adoption (adjusted for any lease expense paid in advance or accrued).original effective interest rate. The amount was not material to the Bank.
73
A. Operating Results
Chilean Economy
All of our operations and substantially all of our customers are located in Chile. Accordingly, our financial condition and results of operations are substantially dependent upon economic conditions prevailing in Chile. In 2018, the Chilean economy grew approximately 4.0% comparedWhile during 2019 the Chilean economy only grew 1.1% due to 1.5%lower global growth, which was affected by the China-U.S. trade dispute and the social unrest that affected Chile in 2017 and 1.3%the last quarter of the year. In 2020, the Chilean economy suffered due to the COVID-19 pandemic with extensive lockdowns in 2016. In the same period, the Central Bank of Chile reported that internal demand increased 4.9% comparedplace, which led to an increaseeconomic contraction of 3.1%approximately 6.0% in 2017 and an increase of 1.3%2020. Chilean GDP is expected to grow around 4.5% in 2016. The growth of internal demand was led by growth of 6.3% in investment as business activity increased in the year and a 3.8% growth in private consumption.2021.
As of December 2018,2020, the average unemployment rate for 2020 was 7.0%10.2%, compared to 6.4%7.1% in 2017 and 6.1% in 2016.the same period of 2019. The higher unemployment rate in 20182020 was due to a large increasethe loss of person seeking to enterjobs during the workforce in light of enhanced domestic economic growth. lockdowns caused by the pandemic.
The exchange rate appreciated by 4.5% in 2020 and depreciated by 7.0% in 2018 by 13.1%2019. After a strong depreciation in the last months of 2019 after the social unrest, the peso began to appreciate once more at the beginning of 2020. However, as the COVID-19 pandemic began to spread around the world, the uncertainty and lower economic expectations made the exchange rate depreciate more than 14% and reach Ch$860 in April. In the following months, the exchange rate began to appreciate once more as quarantines began to be lifted and China improved its growth expectations. The Central Bank also actively intervened in the exchange rate market in order to regulate the peso and push it towards historical levels, and the pension fund withdrawals forced pension funds to liquidate international equities, further appreciating the peso.
CPI inflation remained at 3.0% in 2020. The Central Bank continued to relax monetary policy throughout much of 2020 given the contraction of the economy in 2020 from the pandemic and an inflation rate consistently at or below the Central Bank’s target of 3%. The current Monetary Policy Rate is 0.5% compared to an appreciation of 7.8% in 2017. Greater economic activity throughout 2018 resulted in CPI inflation reaching 2.6% in 2018 compared to 2.3% in 2017 and 2.7% in 2016. Given the slower economic growth in 2016 and the lower inflation rate, the Central Bank reduced its mandatory policy rate to 2.5% during 2017. In October 2018, the Central Bank increased this rate by 25bps to 2.75% with a further increase in January 2019 of 25bps to 3.00%. Domestic economic growth is expected to increase by approximately 3.5% in 2019, driven by a further rise in investment and a growing world economy.1.75% at year-end 2019.
The growth of the Chilean banking sector evolved in line with overall economic developments with an increase inand the volumeacquisition carried out by Chilean banks of loans and deposits.loan portfolios previously owned by non-banks. Total loans as of December 31, 20182020, in the Chilean financial system, were Ch$163,068,919 million (U.S.$234 billion), excluding loans held abroad by subsidiaries of Chilean banks, abroad, grew 11.5% in 2018.2.8% year-over-year. Total customer deposits (defined as time deposits plus checking accounts), excluding depositsamounts held by subsidiaries of Chilean banks abroad, grew 6.7% in 2018 and totaled Ch$121,742,101 million (U.S.$174 billion)increased 7.1% year-over-year as of December 31, 2018.2020. The non-performing loanloans (defined as loans with an installment that is at least 90 days past-due) to total loans ratio remained stabledecreased from 1.9% at year end for both 2018 and 2017year-end 2019 to 1.6% at 1.9%.year-end 2020. This decrease occurred due to the high liquidity levels in the system after the government approved various initiatives to help the population during the COVID-19 pandemic.
Impact of inflationInflation
Our assets and liabilities are denominated in Chilean pesos, Unidades de Fomento (UF) and foreign currencies. Inflation impacts our results of operations as some loan and deposit products are contracted in UF. The UF is revalued in monthly cycles. Each day in the period beginning on the tenth day of the current month through the ninth day of the succeeding month, the nominal peso value of the UF is indexed up (or down in the event of deflation) in order to reflect a proportionate amount of the change in the Chilean Consumer Price Index during the prior calendar month. One UF equaled Ch$29,070.33 at December 2020, Ch$28,309.94 at December 31, 2019 and Ch$27,565.79 at December 31, 2018, Ch$26,798.14 at December 31, 2017 and Ch$26,347.98 at December 31, 2016.2018. High levels of inflation in Chile could adversely affect the Chilean economy and could have an adverse effect on our business, financial condition and results of operations. Negative inflation rates also negatively impact our results. Inflation measured as the annual variation of the UF was 2.7% in 2020, 2.7% in 2019 and 2.9% in 2018, 1.7% in 2017 and 2.8% in 2016.2018. There can be no assurance that Chilean inflation will not change significantly from the current level. Although we currently benefit from moderate levels of inflation, due to the current structure of our assets and liabilities (i.e., a significant portion of our loans are indexed to the inflation rate, but there are significantly less features in deposits and other funding sources that would increase the size of our funding base), there can be no assurance that our business, financial condition and result of operations in the future will not be adversely affected by changing levels of inflation. In summary:
74
| UF-denominated assets and |
| Inflation and interest rate |
| The financial impact of the gap between our interest earning assets and liabilities denominated in |
| As of December 31, | % Change | % Change | ||||||||||||||||||
| Impact of inflation on net interest income | 2018 | 2017 | 2016 | 2018/2017 | 2017/2016 | |||||||||||||||
| (in millions of Ch$) | ||||||||||||||||||||
| Results from UF GAP (1) | 126,260 | 73,050 | 133,702 | 72.8 | % | (45.4 | %) | |||||||||||||
| Annual UF inflation | 2.9 | % | 1.7 | % | 2.8 | % | ||||||||||||||
| As of December 31, | % Change | |||||||||||||||||||
| Impact of inflation on net interest income | 2020 | 2019 | 2018 | 2020/2019 | 2019/2018 | |||||||||||||||
| (in millions of Ch$) | ||||||||||||||||||||
| Results from UF GAP(1) | 173,668 | 114,340 | 126,260 | 51.9 | % | (9.4 | %) | |||||||||||||
| Annual UF inflation | 2.7 | % | 2.7 | % | 2.9 | % | ||||||||||||||
____________________
| (1) | UF GAP is net interest income from asset and liabilities denominated in UFs and include the results from hedging the size of this gap via interest rate swaps. |
| Peso-denominated assets and |
75
Interest Rates
Interest rates earned and paid on our assets and liabilities reflect, to a certain degree, inflation, expectations regarding inflation, changes in short term interest rates set by the Central Bank and movements in long term real rates. The Central Bank manages short term interest rates based on its objectives of balancing low inflation and economic growth. Because our liabilities are generally re-priced sooner than our assets, changes in the rate of inflation or short-term rates in the economy are reflected in the rates of interest paid by us on our liabilities before such changes are reflected in the rates of interest earned by us on our assets. Therefore, when short term interest rates fall, our net interest margin is positively impacted, but when short term rates increase, our interest margin is negatively affected. At the same time, our net interest margin tends to be adversely affected in the short term by a decrease in inflation rates since generally our UF-denominated assets exceed our UF-denominated liabilities. See “Item 5. Operating and Financial Review and Prospects—A. Operating Results—Impact of Inflation—Peso-denominated assets and liabilities.” An increase in long term rates has a positive effect on our net interest margin, because our interest earning assets generally have longer terms than our interest-bearing liabilities. A flattening of the yield curve (i.e. long-term rates falling quicker than short-term rates) negatively affects our margins by lowering loan yields at a greater pace than deposits costs. In addition, because our peso-denominated liabilities have relatively short re-pricing periods, they are generally more responsive to changes in inflation or short-term rates than our UF-denominated liabilities. As a result, during periods when or expected inflation exceeds the previous period’s inflation, customers often switch funds from UF-denominated deposits to peso-denominated deposits, which generally bear higher interest rates, thereby adversely affecting our net interest margin.
Foreign Exchange Fluctuations
The Chilean government’s economic policies and any future changes in the value of the Chilean peso against the U.S. dollar could adversely affect our financial condition and results of operations. The Chilean peso has been subject to significant devaluation in the past and may be subject to significant fluctuations in the future. The Central Bank exchange rate appreciated 4.5% in 2020 and depreciated 13.1%7.0% in 2018 and appreciated 7.8% in 2017. See “Item 3. Key Information—A. Selected Financial Data—Exchange Rates.”2019. A significant portion of our assets and liabilities are denominated in foreign currencies, principally the U.S. dollar, and we historically have maintained and may continue to maintain material gaps between the balances of such assets and liabilities. Our current strategy is not to maintain a significant difference between the balances of our assets and liabilities in foreign currencies. In 2018, 20172020 and 2016,2019, the Bank usuallyheld significant short-term assets in US$ overnight deposits in order to maintain strong liquidity levels in this currency due to the social unrest and then the pandemic. In 2018, the Bank, in its spot position, usually held more liabilities than assets in foreign currencies, mainly the U.S. dollar, as a result of an ample supply of U.S. dollar deposits from companies that receive export revenues, foreign correspondent bank loans and bonds issued abroad. This difference isIn either case, any differences are usually hedged using forwards and cross-currency swaps. Including derivatives, the Bank seeks to run no foreign currency risk in its non-trading balance sheet. Because such assets and liabilities, as well as interest earned or paid on such assets and liabilities, and gains and losses realized upon the sale of such assets, are translated to Chilean pesos in preparing our financial statements, our reported income is affected by changes in the value of the Chilean peso relative to foreign currencies (principally the U.S. dollar). The translation gain or loss over assets and liabilities (excluding derivatives held for trading) and derivatives accounted under hedge accounting standards are included as foreign exchange transactions in the income statement. The translation and mark-to-market of foreign currency derivatives held for trading is recognized as a gain or loss in the net results from mark-to-market and trading. See “Item 11. Quantitative and Qualitative Disclosures About Market Risk—E. Market Risks—Foreign exchange fluctuations” for more detail on the Bank’s exposure to foreign currency.
The Bank also uses a sensitivity analysis with both internal limits and regulatory limits to seek to manage the potential loss in net interest income resulting from fluctuations of interest rates on U.S. dollar denominated assets and liabilities and a VaR model to limit foreign currency trading risk.
We also set an absolute limit on the size of Santander-Chile’s consolidated net foreign currency trading position. As of December 31, 2018, the net difference between assets and liabilities in foreign currency was a net asset position of U.S.$ 8.2 million. The average gap, be it a net asset or liability position in foreign currency, in 2018 was U.S.$ 21.5 million. Both figures include derivatives used to hedge foreign currency risk. See “Item 11. Quantitative and Qualitative Disclosures About Market Risk—Volume limits.” The limitE. Market Risks—Foreign exchange fluctuations” for more detail on the size of the netBank’s exposure to foreign currency position is determined by the Asset and Liability Committee and is calculated and monitored by our Market Risk and Control Department.currency.
Segmentation criteriaCriteria
The accounting policies used to determine the Bank’s income and expenses by reporting segment are the same as those described in the summary of accounting policies in “Note 1—Summary of Significant Accounting Policies” of the Bank’s Consolidated Financial Statements and are customized to meet the needs of the Bank’s management. The Bank earns most of its income in the form of interest income, fee and commission income and income from financial operations.
76
To evaluate a segment’s financial performance and make decisions regarding the resources to be assigned to segments, the Chief Operating Decision Maker (CODM) bases his or her assessment on the segment’s interest income, fee and commission income, and expenses. The Bank’s reporting segments have three Chief Operating Decision Makers: (i) the Director of Retail banking, (ii) the Director of the Middle-market segment and (iii) the Director of Corporate Investment Banking, each of which report to our Chief Executive Officer. All reporting segment information is presented following this structure.
Under IFRS 8, the Bank has aggregated operating segments with similar economic characteristics according to the aggregation criteria specified in the standard. A reporting segment consists of clients that are offered differentiated but, considering how their performance is measured, homogenous services based on IFRS 8 aggregation criteria, thus they form part of the same reporting segment. The clients included in each business segment are constantly revised and reclassified if a client no longer meets the criteria for the segment they are in and transferred to a different CODM. Therefore, variations of loan volumes and profit and loss items reflect business trends as well as client migration effects. Overall, this aggregation has no significant impact on the understanding of the nature and effects of the Bank’s business activities and the economic environment.
The Bank’s reportable segments are (i) Retail banking, (ii) Middle-market, (iii) Corporate Investment Banking and (iv) Corporate Activities (“Other”). See “Note 4—Reporting Segments” of our Audited Consolidated Financial Statements for more information.
77
Results of Operations for the Years Ended December 31, 2020 and 2019
In this section, we discuss the results of our operations for the year ended December 31, 2020 compared to the year ended December 31, 2019. For a discussion of the results of our operations for the year ended December 31, 2019 compared to the year ended December 31, 2018, 2017 and 2016please refer to “Item 5. – A. Operating Results – Results of Operations for the Year Ended December 31, 2098 Compared to the Year Ended December 31, 2018” in our Annual Report on Form 20-F for the year ended December 31, 2019.
The following discussion is based upon and should be read in conjunction with the Audited Consolidated Financial Statements. The Audited Consolidated Financial Statements have been prepared in accordance with IFRS as issued by the IASB. The following table sets forth the principal components of our net income for the years ended December 31, 2018, 20172020 and 2016.
| 2018 | 2018 | 2017 | 2016 | |||||||||||||||||||||
| CONSOLIDATED INCOME STATEMENT DATA | (U.S.$)(1) | (Ch$ million) | % Change 2018/2017 | % Change 2017/2016 | ||||||||||||||||||||
| IFRS: | ||||||||||||||||||||||||
| Interest income and expense | ||||||||||||||||||||||||
| Interest income | 3,216,460 | 2,244,317 | 2,058,446 | 2,137,044 | 9.0 | % | (3.7 | %) | ||||||||||||||||
| Interest expense | (1,189,448 | ) | (829,949 | ) | (731,755 | ) | (855,678 | ) | 13.4 | % | (14.5 | %) | ||||||||||||
| Net interest income | 2,027,012 | 1,414,368 | 1,326,691 | 1,281,366 | 6.6 | % | 3.5 | % | ||||||||||||||||
| Fees and income from services | ||||||||||||||||||||||||
| Fees and commission income | 694,312 | 484,463 | 455,558 | 431,184 | 6.3 | % | 5.7 | % | ||||||||||||||||
| Fees and commission expense | (277,428 | ) | (193,578 | ) | (176,495 | ) | (176,760 | ) | 9.7 | % | (0.1 | %) | ||||||||||||
| Total net fees and commission income | 416,884 | 290,885 | 279,063 | 254,424 | 4.2 | % | 9.7 | % | ||||||||||||||||
| Financial transactions, net | ||||||||||||||||||||||||
| Net income (expense) from financial operations | 76,207 | 53,174 | 2,796 | (367,034 | ) | 1,801.8 | % | (100.8 | %) | |||||||||||||||
| Net foreign exchange gain | 74,392 | 51,908 | 126,956 | 507,392 | (59.1 | %) | (75.0 | %) | ||||||||||||||||
| Financial transactions, net | 150,599 | 105,082 | 129,752 | 140,358 | (19.0 | %) | (7.6 | %) | ||||||||||||||||
| Other operating income | 33,148 | 23,129 | 62,016 | 6,427 | (62.7 | %) | 864.9 | % | ||||||||||||||||
| Net operating profit before provision for loan losses | 2,627,643 | 1,833,464 | 1,797,522 | 1,682,575 | 2.0 | % | 6.8 | % | ||||||||||||||||
| Provision for loan losses | (454,896 | ) | (317,408 | ) | (302,255 | ) | (342,083 | ) | 5.0 | % | (11.6 | %) | ||||||||||||
| Net operating profit | 2,172,747 | 1,516,056 | 1,495,267 | 1,340,492 | 1.4 | % | 11.5 | % | ||||||||||||||||
| Operating expenses | ||||||||||||||||||||||||
| Personnel salaries and expenses | (569,772 | ) | (397,564 | ) | (396,967 | ) | (395,133 | ) | 0.2 | % | 0.5 | % | ||||||||||||
| Administrative expenses | (351,251 | ) | (245,089 | ) | (230,103 | ) | (226,413 | ) | 6.5 | % | 1.6 | % | ||||||||||||
| Depreciation and amortization | (113,621 | ) | (79,280 | ) | (77,823 | ) | (65,359 | ) | 1.9 | % | 19.1 | % | ||||||||||||
| Impairment of property, plant and equipment | (56 | ) | (39 | ) | (5,644 | ) | (234 | ) | (99.3 | %) | 2312.0 | % | ||||||||||||
| Other operating expenses | (46,351 | ) | (32,342 | ) | (68,413 | ) | (68,902 | ) | (52.7 | %) | (0.7 | %) | ||||||||||||
| Total operating expenses | (1,081,051 | ) | (754,314 | ) | (778,950 | ) | (756,041 | ) | (3.2 | %) | 3.0 | % | ||||||||||||
| Net Operating income | 1,091,696 | 761,742 | 716,317 | 584,451 | 6.3 | % | 22.6 | % | ||||||||||||||||
| Income from investments in associates and other companies | 7,302 | 5,095 | 3,963 | 3,012 | 28.6 | % | 31.6 | % | ||||||||||||||||
| Income before tax | 1,098,998 | 766,837 | 720,280 | 587,463 | 6.5 | % | 22.6 | % | ||||||||||||||||
| Income tax expense | (239,544 | ) | (167,144 | ) | (145,031 | ) | (109,031 | ) | 15.2 | % | 33.0 | % | ||||||||||||
| Consolidated Net income for the year | 859,455 | 599,693 | 575,249 | 478,432 | 4.2 | % | 20.2 | % | ||||||||||||||||
| Net income for the year attributable to: | ||||||||||||||||||||||||
| Equity holders of the Bank | 853,206 | 595,333 | 562,801 | 476,067 | 5.8 | % | 18.2 | % | ||||||||||||||||
| Non-controlling interests | 6,249 | 4,360 | 12,448 | 2,365 | (65.0 | %) | 426.3 | % | ||||||||||||||||
2019.
Consolidated Income Statement Data IFRS
| 2020 | 2020 | 2019 | % Change 2020/2019 | |||||||||||||
| (U.S.$ thousands)(1) | (Ch$ million) | |||||||||||||||
| Interest income and expense | ||||||||||||||||
| Interest income | 3,133,222 | 2,232,327 | 2,321,381 | (3.8 | %) | |||||||||||
| Interest expense | (896,149 | ) | (638,479 | ) | (904,417 | ) | (29.4 | %) | ||||||||
| Net interest income | 2,237,074 | 1,593,848 | 1,416,964 | 12.5 | % | |||||||||||
| Fees and income from services | ||||||||||||||||
| Fees and commission income | 633,236 | 451,162 | 498,658 | (9.5 | %) | |||||||||||
| Fees and commission expense | (258,094 | ) | (183,884 | ) | (211,572 | ) | (13.1 | %) | ||||||||
| Total net fees and commission income | 375,143 | 267,278 | 287,086 | (6.9 | %) | |||||||||||
| Financial transactions, net | ||||||||||||||||
| Net income (expense) from financial operations | 127,444 | 90,800 | (78,165 | ) | (216.2 | %) | ||||||||||
| Net foreign exchange gain | 82,807 | 58,997 | 279,857 | (78.9 | %) | |||||||||||
| Financial transactions, net | 210,251 | 149,797 | 201,692 | (25.7 | %) | |||||||||||
| Other operating income | 11,518 | 8,206 | 13,001 | (36.9 | %) | |||||||||||
| Net operating profit before provision for loan losses | 2,833,985 | 2,019,129 | 1,918,743 | 5.2 | % | |||||||||||
| Provision for loan losses | (671,276 | ) | (478,264 | ) | (323,311 | ) | 47.9 | % | ||||||||
| Net operating profit | 2,162,709 | 1,540,865 | 1,595,432 | (3.4 | %) | |||||||||||
| Operating expenses | ||||||||||||||||
| Personnel salaries and expenses | (573,596 | ) | (408,670 | ) | (410,157 | ) | (0.4 | %) | ||||||||
| Administrative expenses | (351,524 | ) | (250,450 | ) | (233,612 | ) | 7.2 | % | ||||||||
| Depreciation and amortization | (153,587 | ) | (109,426 | ) | (106,092 | ) | 3.1 | % | ||||||||
| Impairment of property, plant and equipment | (895 | ) | (638 | ) | (2,726 | ) | (76.6 | %) | ||||||||
| Other operating expenses | (109,206 | ) | (77,806 | ) | (49,303 | ) | 57.8 | % | ||||||||
| Total operating expenses | (1,188,808 | ) | (846,990 | ) | (801,890 | ) | 5.6 | % | ||||||||
| Net Operating income | 973,901 | 693,875 | 793,542 | (12.6 | %) | |||||||||||
| Income from investments in associates and other companies (2) | 1,948 | 1,388 | 1,146 | 21.1 | % | |||||||||||
| Income before tax | 975,849 | 695,263 | 794,688 | (12.5 | %) | |||||||||||
| Income tax expense | (200,055 | ) | (142,533 | ) | (175,074 | ) | (18.6 | %) | ||||||||
| Income from continuous operations | 775,794 | 552,730 | 619,614 | (10.8 | %) | |||||||||||
| Income from discontinued operations (2) | 0 | 0 | 1,699 | (100.0 | %) | |||||||||||
| Consolidated net income for the year | 775,794 | 552,730 | 621,313 | (11.0 | %) | |||||||||||
| Net income for the year attributable to: | ||||||||||||||||
| Equity holders of the Bank | 768,613 | 547,614 | 619,091 | (11.5 | %) | |||||||||||
| Non-controlling interests | 7,181 | 5,116 | 2,222 | 130.2 | % | |||||||||||
____________________
| (1) | Amounts stated in U.S. dollars at and for the year ended December 31, |
| (2) | As of December 31, 2020, the Bank is in process of selling its share participation on Redbanc S.A. and Transbank S.A. and has classified its participation as an investment available for sale in accordance with IFRS 5 “Non-current Assets Held for Sale and Discontinued Operations”. The Bank sold its stake in Sociedad Nexus S.A. in October 2019 and January 2020. See Note 38 of our Audited Consolidated Financial Statements. |
78
Results of operationsOperations for the years endedYears Ended December 31, 20182020 and 2017. Consolidated net2019
Net income for the year ended December 31, 2018, increased 4.2%attributable to equity holders of the Bank decreased 11.5% in 2020 compared to 2019 and totaled Ch$599,693547,614 million. Our return on annualized average equity was 18.4%14.8% in 20182020 compared to 19.2%18.0% in 2017.2019.
In 2018,2020, net operating profit before loan losses was Ch$1,833,4642,019,129 million, an increase of 2.0%5.2% compared to 2017.2019. Ournet interest income increased 6.6%12.5% in 20182020 compared to 2017.2019. This was mainly driven by loan growth, especially commercialhigher gains from inflation-indexed assets and mortgage loans. Higher inflation ledlower cost of funds due to higher returns on most mortgage loansthe high liquidity in the market and some commercial loans denominated in UF, but these returns were partially offset by a lower yielding loan mix and an increase in the cost of funding as a higher rate paid on UF denominated liabilities.environment. Overall, our net interest margin remained stable at 4.3%declined to 3.8% in 2018 compared to 2017.
2020 from 4.0% in 2019.
Net fees and commission income increased 4.2% decreased 6.9% to Ch$290,885267,278 million in the twelve-month period ended December 31, 20182020 compared to the same period in 2017.2019. Lower consumption in the economy and a higher saving rate negatively affected fees from lines of credit. Fees from retail banking increased 6.8%collections decreased 30.3% in 20182020 compared to 2017. Total retail clients2019. This line item includes, among other items, fees collected on behalf of insurance companies for insurance that is sold with some loan products, especially mortgage loans. Lower loan origination due to the pandemic lowered this fee item. Insurance brokerage fees and fees from checking accounts also declined after a checking accountlaw was passed that increased 6.4% to 953,075. In 2018,banks liability for cyber fraud and prohibited the Bank continued to experience positive client base and product usage growth that drove fee growthsale of insurance for various products. Fee growth for retail clients has been driventhis item. This was partially offset by the userise in fees from credit, debit and ATM cards which increased 35.3% in 2020. The switch to the four-part pricing model, which uses the international interchange fees set by the main card brands (i.e. MasterCard, Visa, AMEX), and out of cards, insurance brokerages, brokerage of asset management products and checking accounts driventhe pricing model set by digital innovations, which led to an increase of retail digital clients of 6.2%Chile’s main credit card acquirer (Transbank) resulted in 2018. Fees from the Corporate Investment banking segment increased 26.9% in 2018 compared to 2017, mainly due to cash management services, financial advisory and investment banking fees.a lower fee expenses.
Total financial transactions, net,, which is the sum of net income from financial operations and foreign exchange gain (loss), totaled Ch$105,082149,797 million in the year ended December 31, 2018,2020, a decrease of 19.0%25.7% compared to the same period in 2017.2019. These results include the results of our Treasury Division’s transactions with customers, as well as the results of our non-client treasury operations, mainly the Financial Management Division. Client treasury services totaled Ch$95,188145,222 million, an increase of 16.0%4.7% compared to 2017. The results from client treasury products and market-making mainly include the results from the sale of derivatives, foreign exchange and fixed income instruments to our client base. In 2018, the results from client treasury products increased 20.9%.2019. The higher market volatility and depreciation ofdue to the peso in the second half of 2018COVID-19 pandemic led to higher demand for hedging from our Corporate and Middle-market clients. The results from market-making with client services increased 1.9% in 2018, mainly due an improvement in business volumes of tailor-made treasury services and cash management sold to specific corporate clients. These results may vary year-to-year as some large operations with corporate clients may not be repeated in subsequent years.
The results from non-client treasury income decreased 79.3%92.7% to a gain of Ch$9,8944,576 million in 20182020 compared to Ch$47,713 million in 2017. These results include the income from sale of loans, including charged-off loans,2019. This lower result was mainly due to the results from CVA over our derivative portfolio and the results from our Financial Management Division. In 2018, income fromof the Bank’s Financial Management Division that decreased 56.2% to Ch$12,441 million from Ch$45,01827,918 million in 2017.2020 compared to 2019 and the results from CVA which totaled a loss of Ch$23,216 million. The growth of the Bank’s derivative portfolio and the increase in counterparty risk drove the rise in CVA adjustment loss in 2020.
Total other operating income decreased by 36.9% in 2020 compared to 2019, totaling a gain of Ch$8,206 million. This decrease was mainly due to lower resultsincome from liability management operations and lower realized gains from the sale of debt instruments at fair value through other comprehensive income.
Other operating income decreased by 62.7% in 2018 compared to 2017 and totaled a gain of Ch$23,129 million mainlyinsurance compensation due to a decreasedamages since in the extraordinary income from the sale of repossessed assets by Bansa S.A, which amounted to Ch$2,122 million for 2018 as compared to Ch$20,663 million in 2017. Bansa is a company that is consolidated by2019 the Bank duereceived compensation for the damages to controlour branches during the social unrest that affected Chile in accordance with IFRS 10. For the purposesOctober- December of consolidation, this one-time income forms part of the net income attributable to non-controlling interest and has no impact on net income attributable to shareholders or shareholders’ equity. The decrease in other operating income this year was offset by an increase in income from assets received in lieu of payment, totaling a gain of Ch$7,106 million, and less reversal of provisions for non-credit contingencies compared to 2017.2019.
For the year ended December 31, 2018provisions for loan losses totaled Ch$317,408 million in accordance with the adoption of IFRS 9. The changes in accounting policies resulting from the adoption of IFRS 9 were applied retrospectively adjusting the opening balance as of January 1, 2018, applying the transition exemption that allows the Bank not to restate comparative information for prior periods. Therefore, this figure is not entirely comparable to the amount of loan loss provisions recognized in 2017, which was calculated according to an incurred loss provision model under IAS 39. The bulk of provision expenses in 2018 were due to: (i) provisions for individually analyzed commercial loans, which mainly corresponds to larger SMEs that are marked for legal action and classified in Stage 3 and (ii)2020 provisions for expected credit losses for consumer loans, whichloss totaled a charge of Ch$186,938478,264 million for the year ended December 31, 2018and increased 47.9% compared to 2019. This rise was mainly due to provisions for consumer loansgrowth of our loan book and an increase in Stage 3. This was partially offsetexpected losses driven by the release of provisions for expected credit losses for mortgage loans, which totaled Ch$14,119 million for the year ended December 31, 2018. This is mainlyeconomic slowdown due to stricter admission requirements and a strategy of targeting the higher income segments that tend to be less risky.COVID-19 pandemic.
As a result of the factors mentioned above,net operating profit increased 1.4% decreased 3.4% in 20182020 compared to 20172019 and totaled Ch$1,516,0561,540,865 million.
Operating expenses in the year ended December 31, 2018 decreased 3.2%2020 increased 5.6% compared to the corresponding period in 2017.2019. The efficiency ratio was 41.1%41.9% in 2018, 43.3%2020 and 41.8% in 2017 and 44.9% in 2016.2019.
The 0.2% increase0.4% decrease in personnel salaries and expenses was below the CPI inflation of 2.6%, even though all salaries are indexed to inflation pursuant to the collective bargaining agreement. This was despite an increase in headcount of 2.1% to a total of 11,305 employees. This decrease in expenses is mainly due to a decrease in variable incentives, severance payments, training and other benefits that decreased 6.9%, while salary costs only grew by 1.9%. Headcount decreased 6.5% in 2020, ending the Bank’s strategyyear at 10,470 employees in the Bank.
79
Administrative expenses increased 6.5%7.2% in the year ended December 31, 20182020 compared to the corresponding period in 2017,2019, mainly due to the continued investment in technology aimed to transform the Bank’s digital platformshigher IT and the branch network. During 2018, we continued to reduce the ATM network, focusing on extending the network withincommunications costs, as many of our branches or places with increased security measures. As of December 31, 2018, we had a total of 380 branchesemployees worked from home and 910 ATMs.new systems that would work remotely were implemented.
Depreciation and amortization expense increased 1.9%3.1% in 20182020 compared to 2017 and2019. This increase was mainly due to a higher depreciation of fixed assets in the period.
In 2020, impairment expenses totaled Ch$79,280 million. This expense is in line with continued investments in software, hardware and other equipment that the Bank has invested in as it continues to modernize its branch network and systems. Impairment charges decreased to Ch$39638 million, in 2018a 76.6% decrease compared to Ch$5,644 million in 2017 mainly related to lessthe previous year as there was a strong impairment for obsoleteof fixed assets and technologyin 2019 as a result of the social unrest that totaled Ch$5,290 millionaffected Chile in 2017.October – December 2019.
Other operating expenses were Ch$32,34277,806 million in 2018, a 52.7% decrease2020, an increase of 57.8% compared to 2017.2019. This was mainly due to lower expenses relatedhigher provisions for contingencies due to lifethe effects of the COVID-19 pandemic and generala rise in cyber fraud insurance policies for the Bank. See “Note 35—Other Operating Income and Expenses” to our Audited Consolidated Financial Statements for more details.costs.
Total income tax expense by the Bank in 2018 totaled2020 was Ch$167,144142,533 million, a 15.2% increase18.6% decrease compared to 2017. The Bank paid an effective tax rate of 21.88%2019, mainly driven by the 8.9% decrease in 2018 compared to 20.1% in 2017. The higher effective tax rate was mainly due to the fact that the statutory corporate tax rate increased from 25.5% in 2017 to 27.0% in 2018.net income before taxes.
Net interest incomeInterest Income
| Year ended December 31, | % Change | |||||||||||
| 2020 | 2019 | 2020/2019 | ||||||||||
| (in millions of Ch$, except percentages) | ||||||||||||
| Retail banking | 1,049,543 | 960,361 | 9.3 | % | ||||||||
| Middle-market | 346,225 | 298,587 | 16.0 | % | ||||||||
| Corporate Investment banking | 114,229 | 98,154 | 16.4 | % | ||||||||
| Total reporting segments | 1,509,997 | 1,357,102 | 11.3 | % | ||||||||
| Other(1) | 83,851 | 59,862 | 40.1 | % | ||||||||
| Net interest income | 1,593,848 | 1,416,964 | 12.5 | % | ||||||||
| Average interest-earning assets | 42,239,387 | 35,850,253 | 17.8 | % | ||||||||
| Average non-interest-bearing demand deposits | 10,403,347 | 7,466,991 | 39.3 | % | ||||||||
| Net interest margin(2) | 3.77 | % | 3.95 | % | ||||||||
| Average shareholders’ equity and average non-interest-bearing demand deposits to total average interest-earning assets | 33.5 | % | 30.5 | % | ||||||||
| Year ended December 31, | % Change | |||||||||||||||||||
| 2018 | 2017 | 2016 | 2018/2017 | 2017/2016 | ||||||||||||||||
| (in millions of Ch$, except percentages) | ||||||||||||||||||||
| Retail banking | 949,764 | 970,332 | 931,105 | (2.1 | %) | 4.2 | % | |||||||||||||
| Middle-market | 272,912 | 264,663 | 244,960 | 3.1 | % | 8.0 | % | |||||||||||||
| Total commercial banking | 1,222,676 | 1,234,995 | 1,176,065 | (1.0 | %) | 5.0 | % | |||||||||||||
| Corporate Investment banking | 96,722 | 100,808 | 95,105 | (4.1 | %) | 6.0 | % | |||||||||||||
| Total reporting segments | 1,319,398 | 1,335,803 | 1,271,170 | (1.2 | %) | 5.1 | % | |||||||||||||
| Other (1) | 94,970 | (9,112 | ) | 10,196 | (1142.3 | %) | (189.4 | %) | ||||||||||||
| Net interest income | 1,414,368 | 1,326,691 | 1,281,366 | 6.6 | % | 3.5 | % | |||||||||||||
| Average interest-earning assets | 32,760,203 | 30,595,059 | 29,671,311 | 7.1 | % | 3.1 | % | |||||||||||||
| Average non-interest-bearing demand deposits | 6,763,546 | 6,117,644 | 5,753,622 | 10.6 | % | 6.3 | % | |||||||||||||
| Net interest margin (2) | 4.32 | % | 4.34 | % | 4.32 | % | ||||||||||||||
| Average shareholders’ equity and average non-interest-bearing demand deposits to total average interest-earning assets | 30.6 | % | 29.8 | % | 29.0 | % | ||||||||||||||
____________________
| (1) | Consists mainly of net interest income from the Financial Management Division, including the inflation gap, and the cost of funding our financial assets held for trading. Each segment obtains funding from its clients. Any surplus deposits are transferred to the Financial Management Division, which in turn makes such excess available to other areas that need funding. The Financial Management Division also sells the funds it obtains in the institutional funding market at a transfer price equal to the market price of the funds. This segment also includes intra-segment income and activities not assigned to a given segment or product line. |
| (2) | Net interest margin is net interest income divided by average interest-earning assets. |
For the yearsyear ended December 31, 2018 and 20172020 our net interest income totaled Ch$1,414,3681,593,848 million and increased 12.5% from Ch$1,416,964 million in the year ended December 31, 2018, an increase of 6.6% from Ch$1,326,691 million in 2017 and average2019. Average interest earning assets increased 7.1%17.8% in the same period. During 2018,2020, the loan portfolio grew 9.0% with greater economic activity leading to more loan growth,5.1%, but mainly in lower yielding commercial and mortgage loans. The nominal yield earned on peso-denominated consumer loans also declined due to a lower rate environment for most of 2018 and continued focus on growing among high income earners that obtain a lower yield, but who also have a lower risk profile. The average nominal interest rate forhigher growth from interest earning assets denominatedcame from short-term assets as the Bank invested the higher liquidity in pesos decreased from 9.6%the system in 2017 to 8.6% in 2018.low-risk and low-yielding assets. This lower yielding loan mix was compensated by higher UF inflation in 2018. The higher inflation rate in 2018 compared to 2017 caused ourthe average nominal interest rate earned on interest earning assets indexed to the UF to increasedecrease from 5.4%5.9% in 20172019 to 5.2% in 2020, despite similar levels of UF inflation in both years. The nominal yield earned on peso-denominated interest earning assets also declined from 8.2% in 2019 to 6.2% in 2018.2020 due to a lower rate environment for most of 2020 and growth in low-yielding and low risk peso denominated assets. All the factors mentioned above led to a decline in the overall average interest earned over interest earning assets from 6.5% in 2019 to 5.3% in 2020.
| Average nominal interest rate earned on interest earning assets | 2020 | 2019 | ||||||
| Ch$ | 6.2 | % | 8.2 | % | ||||
| UF | 5.2 | % | 5.9 | % | ||||
| Foreign currencies | 2.7 | % | 3.4 | % | ||||
| Total | 5.3 | % | 6.5 | % | ||||
80
| Average nominal interest rate earned on interest earning assets | 2018 | 2017 | 2016 | |||||||||
| Ch$ | 8.6 | % | 9.6 | % | 9.9 | % | ||||||
| UF | 6.2 | % | 5.4 | % | 6.6 | % | ||||||
| Foreign currencies | 3.4 | % | 2.7 | % | 2.1 | % | ||||||
| Total | 6.9 | % | 6.7 | % | 7.2 | % | ||||||
The average rate paid on our interest bearing liabilities increaseddecreased to 3.6%2.2% in 20182020 from 3.3%3.5% in 2017.2019. This was mainly due to a higherlower rate environment in 2020 triggered by the Central Bank’s relaxation of monetary policy due to lower than expected economic growth. This especially reduced the nominal rate paid on UFCh$ denominated liabilities as a resulttime deposits. The nominal rate paid over the average balance of these deposits fell from 3.3% in 2019 to 1.3% in 2020. The Central Bank also gave liquidity lines to the banks at the Monetary Policy Rate, which was set at 0.5% for most of the higher UF inflation in the year which increasedwith a maturity of these lines of up to 5.4% in 2018 compared to 4.4% in 2017.four years. The decrease in the average rate paid on peso denominated liabilities was due to deposit price discipline andforeign currencies also declined as the lower average short-term interestexchange rate environment in 2018 compared to 2017.appreciated.
| Average nominal interest rate paid on interest bearing liabilities | 2018 | 2017 | 2016 | 2020 | 2019 | |||||||||||||||
| Ch$ | 3.3 | % | 3.6 | % | 4.7 | % | 1.3 | % | 3.3 | % | ||||||||||
| UF | 5.4 | % | 4.4 | % | 5.6 | % | 5.4 | % | 5.1 | % | ||||||||||
| Foreign currencies | 2.2 | % | 1.5 | % | 1.1 | % | 1.5 | % | 2.3 | % | ||||||||||
| Total | 3.6 | % | 3.3 | % | 3.9 | % | 2.2 | % | 3.5 | % | ||||||||||
Additionally, in 2018,2020, average non-interest bearing demand deposits increased 10.6% and the ratio of these deposits plus average shareholders’ equity over interest earning assets improved 80 bps39.3%, which helped to 30.6%.lower total funding costs as well.
In summary, the higher inflation coupled with lower peso deposit costs and larger average balancegrowth of non-interest bearing demand deposits, offset the lower yielding assetassets partially offset by a cheaper funding cost and mix, leadingled to a decline in our net interest margin that remained stable at 4.3%to 3.77% in 20182020 compared to 2017.3.95% in 2019.
Net interest income from our reporting segments totaled Ch$1,319,3981,509,997 million and decreased 1.2%increased 11.3% compared to 2017.2019. This decreaserise was mainly due to the growth of the loan book, which grew 5.1% in 2020 and the improved funding mix driven by lower time deposit costs and a lower yield earned by each segment on theirgreater amount of non-interest bearing demand deposits in line with lower average interest rates.deposits. The changes in net interest income by segment in 20182020 as compared to 20172019 were as follows:
| Net interest income from Retail banking |
| Net interest income from the Middle-market segment increased |
| Net interest income from the Corporate Investment Banking segment |
| Other net interest income consists mainly of net interest income from the Bank’s ALCO, which includes the net interest income from the Bank’s debt instruments recorded at fair value through other comprehensive income, deposits in the Central Bank, and the financial cost of supporting our cash position and financial investments held for trading (the interest income from which is recognized as net income from financial operations and not interest income). The result of the Bank’s inflation gap is also included in this line. The net interest income included as “other” increased |
The following table shows our balances of loans and accounts receivable from customers and interbank loans by segment at the dates indicated.
| At December 31, | % Change | |||||||||||||||||||
2018 (1) | 2017 | 2016 | 2018/2017 | 2017/2016 | ||||||||||||||||
| (in millions of Ch$, except percentages) | ||||||||||||||||||||
| Retail banking | 20,786,637 | 19,233,169 | 18,604,936 | 8.1 | % | 3.4 | % | |||||||||||||
| Middle-market | 7,690,380 | 6,775,734 | 6,396,376 | 13.5 | % | 5.9 | % | |||||||||||||
| Corporate Investment banking | 1,613,088 | 1,633,796 | 2,121,513 | (1.3 | %) | (23.0 | %) | |||||||||||||
| Other (2) | 123,309 | 83,215 | 83,606 | 48.2 | % | (0.5 | %) | |||||||||||||
| Total loans | 30,213,414 | 27,725,914 | 27,206,431 | 9.0 | % | 1.9 | % | |||||||||||||
81
| At December 31, | % Change | |||||||||||
| 2020 | 2019 | 2020/2019 | ||||||||||
| (in millions of Ch) | ||||||||||||
| Retail banking | 24,279,248 | 22,926,377 | 5.9 | % | ||||||||
| Middle-market | 8,136,402 | 8,093,496 | 0.5 | % | ||||||||
| Corporate Investment banking | 1,635,217 | 1,603,633 | 2.0 | % | ||||||||
| Other (1) | 289,026 | 48,009 | 502.0 | % | ||||||||
| Total loans | 34,339,893 | 32,671,515 | 5.1 | % | ||||||||
____________________
| (1) |
| Includes interbank loans. |
As of January 1, 2018 the Bank adopted IFRS 9. The following table shows interest income of financial assets by valuation as of December 31, 2018.2020 and 2019.
| At December 31, | % Change | |||||||||||
| 2020 | 2019 | 2020/2019 | ||||||||||
| (in millions of Ch$) | ||||||||||||
| Financial assets measured at amortized cost(1) | 2,114,620 | 2,195,339 | (3.7 | %) | ||||||||
| Financial assets measured al FVOCI(2) | 105,417 | 97,319 | 8.3 | % | ||||||||
| Other interest | 13,586 | 21,979 | (38.2 | %) | ||||||||
| Interest income not including income from hedge accounting | 2,233,623 | 2,314,637 | (3.5 | %) | ||||||||
____________________
| (1) | ||||
| Financial assets measured at amortized cost | ||||
(1) Financial assets measured at amortized cost include loans measured at amortized cost as described above and investments under resale agreements. Theat amortized cost as described above and investments under resale agreements. The effective interest method is used in the calculation of the amortized cost of the financial asset and in the allocation and recognition of the interest revenue over the relevant period.
(2) Financial assets measured at fair value through other comprehensive income include the interest income from debt instruments. These mainly consisted of securities and bonds of the Chilean Central Bank that contain contractual terms that give rise on specific dates to cash flows that are solely payments of principal and interest (SPPI), and are measured at FVOCI.
For the years ended December 31, 2017 and 2016 our net interest income totaled Ch$1,326,691 million in the year ended December 31, 2017, an increase of 3.5% from Ch$1,281,366 million in 2016. Average interest earning assets increased 3.1% in the same period, driven mainly by lending in the Retail banking and Middle-market segments. While net interest income from our reporting segments grew 5.1% during 2017 driven by loan growth, a higher yielding loan mix and cheaper funding mix, the total net interest margin remained stable at 4.3% due to the lower UF inflation in 2017. Because the Bank has more interest earning assets indexed to the UF than interest bearing liabilities, any decline in inflation adversely affects our net interest margin. The lower inflation rate in 2017 compared to 2016 caused our average nominal interest rate earned on interest earning assets indexed to the UF to decrease from 6.6% in 2016 to 5.4% in 2017.
The average nominal interest rate for interest earning assets denominated in pesos decreased from 9.9% in 2016 to 9.6% in 2017 due to the decrease in the Central Bank’s short-term rate during the year which also led to a lower cost of funding with the average nominal rate for interest bearing liabilities denominated in pesos decreasing from 4.7% in 2016 to 3.6% in 2017.
The average rate paid on our interest bearing liabilities decreased to 3.3% in 2017 from 3.9% in 2016. This was mainly due to a lower rate paid on UF denominated liabilities as a result of the lower UF inflation in the year, which decreased to 4.4% in 2017 compared to 5.6% in 2016. This partially offset the negative impact of inflation on the interest earning assets. The decrease in the average rate paid on interest bearing liabilities was also due to the effect of the decrease in the short term central bank rates on peso denominated liabilities.
The changes in net interest income by segment in 2017 as compared to 2016 were as follows:
Fee and commission incomeCommission Income
For the years ended December 31, 2018 and 2017 netNet fees and commission income increased 4.2%decreased 6.9% to Ch$290,885267,278 million in the twelve-month period ended December 31, 20182020 compared to the same period in 2017.2019. The following table sets forth certain components of our income from services (net of fees paid to third parties directly connected to providing those services, principally fees relating to credit card processing and ATM network administration) in the years ended December 31, 2018, 20172020 and 2016.2019.
| Year ended December 31, | % Change | Year ended December 31, | % Change | |||||||||||||||||||||||||||||
| 2018 | 2017 | 2016 | 2018/2017 | 2017/2016 | 2020 | 2019 | 2020/2019 | |||||||||||||||||||||||||
| (in millions of Ch$) | (in millions of Ch$) | |||||||||||||||||||||||||||||||
| Credit, debit and ATM cards | 55,109 | 51,982 | 52,057 | 6.0 | % | (0.1 | %) | 73,297 | 54,189 | 35.3 | % | |||||||||||||||||||||
| Collections | 40,077 | 44,312 | 31,376 | (9.6 | %) | 41.2 | % | 23,242 | 33,355 | (30.3 | %) | |||||||||||||||||||||
| Insurance brokerage | 39,949 | 36,430 | 40,882 | 9.7 | % | (10.9 | %) | 39,764 | 49,664 | (19.9 | %) | |||||||||||||||||||||
| Letters of credit | 33,654 | 33,882 | 35,911 | (0.7 | %) | (5.7 | %) | 36,277 | 35,039 | 3.5 | % | |||||||||||||||||||||
| Checking accounts | 33,865 | 31,901 | 31,540 | 6.2 | % | 1.1 | % | 34,825 | 35,949 | (3.1 | %) | |||||||||||||||||||||
| Custody and brokerage services | 9,211 | 9,232 | 8,358 | (0.2 | %) | 10.5 | % | 10,376 | 9,154 | 13.3 | % | |||||||||||||||||||||
| Lines of credit | 6,624 | 7,413 | 5,754 | (10.6 | %) | 28.8 | % | 7,428 | 10,314 | (28.0 | %) | |||||||||||||||||||||
| Others | 72,396 | 63,911 | 48,546 | 13.3 | % | 31.7 | % | 42,069 | 59,422 | (29.2 | %) | |||||||||||||||||||||
| Total fees and commission income, net | 290,885 | 279,063 | 254,424 | 4.2 | % | 9.7 | % | 267,278 | 287,086 | (6.9 | %) | |||||||||||||||||||||
Fees from credit, debit and ATM cards increased 6.0%35.3% in 2018. In 2018 we continued2020. The switch to reduce our ATM network, seeking better locations with less security-related expenses, leading tothe four-part pricing model, which uses the international interchange fees set by the main card brands (i.e. MasterCard, Visa, AMEX), and out of the pricing model set by Chile’s main credit card acquirer (Transbank) drove this result mainly via a 28.0% decreasereduction in commissions from debit and ATM cardscard expenses. We also increased the number of ATMs during the period. This was offset by a 29.0% increaseyear, from 1,088 in commissions2019 to 1,199 in 2020, giving us higher fees from credit cards as clients increased the usagefrom other banks and financial institutions using our machines.
82
Fees from collections decreased 9.6%30.3% in 20182020 compared to 2017.2019. This line item includes, among other items, feescredit-related insurance collected on behalf of insurance companies, forsuch as fire and earthquake insurance that are mandatory with mortgage loans. During 2018, a higher level2020 the lower origination of pre-payment of mortgage loans led to a modification of the estimate of amount of refunds to be paid to clients for insurance premiums already collected.negatively affected this line item.
Insurance brokerage fees increased 9.7%decreased 19.9% due to higher brokeragelower demand as a result of by the pandemic. Brokerage of fraud insurance also declined after a law was passed that made banks liable for cyber fraud and prohibited the sale of insurance for this item. This was partially offset by the increase in sales of car and life insurance policies as advances in our digital platforms have enabled clients to search for and purchase these products online.
Fees from letters of credit and other contingent operations decreased 0.7%increased 3.5% in 2018.2020. This line corresponds to international and foreign trade financing business with clients. The lowBusiness growth reflects strong price competitiondrove this revenue line in this product2020 as export growth remained solid in 2018.2020, driven by higher commodity prices and demand from China.
Fees from checking accounts increased 6.2%decreased 3.1% in 20182020 compared to 2017.2019. This was mainly due to athe effects of the cyber fraud law, where some checking account plan prices had to be readjusted due to the elimination of components of fraud insurance for checking accounts. This was partially offset by the rise in the Bank’s checking account base. The number of retail clients with a checking accountaccounts increased 6.4%29.2% to 953,075. Also, our1,378,539 driven by digital onboarding platforms such as Santander Life. Our corporate cash management services also continued to boost fee growth in this product.
Brokerage and custody fees decreased 0.2%increased 13.3% in 20182020 as compared to 20172019 due to more volatilityhigher volumes in the markets during 2018, dampening the growth we experienced in 2017.our brokerage business, custody fees, and bond issuances for our clients.
Fees from lines of credit decreased 10.6%28.0% due to less cross-sellinga decrease of this product among checking account holdersusage of these lines as clients have preferred other short term financing such as credit cardsa result of the fall in consumption, the greater access to liquidity due to the withdrawal of pension fund savings and installment loans.the rise in household savings rate during the pandemic.
The rise29.2% decrease in other fee income of 13.3% in 20182020 compared to 20172019 was mainly due to higherlower fees earned by our Corporate Investment Banking segment for investment banking and advisory services, in line with the slowdown of economic growth. Fees from the brokerage of asset management servicesmutual funds also decreased 6.9% in 2020 compared to 2019 and totaled Ch$44,072 million. As rates decreased, especially those earned by money market funds, average fees gained from our Corporate Investment Banking segment.charged over these funds fell in tandem. In December 2013, our Asset Management business was sold. The Bank is no longer in the asset management business,sold, but serveswe continue to serve as an exclusive broker for Santander Asset Management, the acquirer of our asset management business. In 2018, asset management brokerage fees totaled Ch$45,793 million and increased 5.7% compared to 2017. Other fees from our Corporate Investment banking segment include financial advisory and investment banking.
The following table sets forth, for the periods indicated our fee income broken down by segment for the periods indicated:
| Year ended December 31, | % Change | % Change | Year ended December 31, | % Change | ||||||||||||||||||||||||||||
| 2018 | 2017 | 2016 | 2018/2017 | 2017/2016 | 2020 | 2019 | 2020/2019 | |||||||||||||||||||||||||
| (in millions of Ch$) | (in millions of Ch$) | |||||||||||||||||||||||||||||||
| Retail banking | 220,532 | 206,449 | 196,845 | 6.8 | % | 4.9 | % | 213,431 | 230,627 | (7.5 | %) | |||||||||||||||||||||
| Middle-market | 36,746 | 36,280 | 30,851 | 1.3 | % | 17.6 | % | 38,335 | 38,712 | (1.0 | %) | |||||||||||||||||||||
| Corporate Investment banking | 35,064 | 27,626 | 25,077 | 26.9 | % | 10.2 | % | 23,180 | 29,103 | (20.4 | %) | |||||||||||||||||||||
| Other | (1,457 | ) | 8,708 | 1,651 | (116.7 | %) | 427.4 | % | (7,668 | ) | (11,356 | ) | (32.5 | %) | ||||||||||||||||||
| Total fees and commission income, net | 290,885 | 279,063 | 254,424 | 4.2 | % | 9.7 | % | 267,278 | 287,086 | (8.1 | %) | |||||||||||||||||||||
Fees from Retail banking increased 6.8%decreased 7.5% in 20182020 compared to 2017. Total2019. Lower product usage due to the pandemic and the economic slowdown drove this decline in retail clientsfees along with athe negative impact of the new regulations regarding cyber fraud on insurance brokerage and checking account increased 6.4% to 953,075. In 2018,fees. This was offset by the Bank continued to experience positive client base and product growth that drove fee growth in various products. Internally, we measure the quantity of products that a client uses and identify themcard fees as a loyal customer when they meet certain internal criteria for their segment (clients with more than four products plus minimum usage and profitability levels). Client loyalty continues to rise in retail banking, especially among high income earners, which was the area we continued to focus on growing. Loyal individual customers in the high-income segment grew 8.3% during 2018. As the economy expanded, we also started opening up more to increasing our middle-income client base through our new Santander Life products. Loyal individual customers in the middle-income segment increased 8.2% during 2018. This has led to high fee growth among retail bank clients, especially cards, insurance brokerage, brokerage of asset management products and checking accounts. This has also been driven by digital innovations leading to an increase of retail digital clients of 6.2% in 2018.mentioned above.
The 1.3% increase1.0% decrease in fees from the Middle-market segment was mainly due to lower economic activity due to the positive expansion of business volumes in this segment from a greater client base. Total clients in this segment increased 3.2% during the year with clients that actively use our products increasing 2.7%.pandemic.
Fees from the Corporate Investment banking segment increased 26.9%decreased 20.4% in 20182020 compared to 2017,2019, mainly due to cash management services, financial advisory andlower investment banking fees.fees as a result of lower economic growth.
83
Fees in Other decreased from a gainloss of Ch$8,70811,356 million in 20172019 to an expensea loss of Ch$1,4577,668 million in 2018. In this line item we included the impact of the higher level of pre-payment of mortgage loans which led to a modification of the estimate of amount of refunds of fees for insurance premiums already collected. As this was not assigned to any segment, it is presented in Other.
For the years ended December 31, 2017 and 2016. Net fees and commission income increased 9.7% to Ch$279,063 million in the twelve-month period ended December 31, 2017 compared to the same period in 2016.
Fees from credit, debit and ATM cards decreased slightly by 0.1% in 2017, reflecting the reductions made to the ATM network during the period. This was partially offset by the positive growth of the usage of the Bank’s credit and debit cards. Active credit cards totaled 1.9 million by year-end 2017 with monetary purchases increasing by 6.8% in the year.
Fees from collections increased by 41.2% in 2017 compared to 2016 due to a growth in loan volumes, particularly in mortgage loans. This line item includes, among other items, fees collected on behalf of insurance companies for fire and earthquake insurance that are mandatory with mortgage loans for which we negotiated better terms with the insurance providers during the year.
Insurance brokerage fees decreased 10.9% due to more competition and a slower economy.
Fees from letters of credit and other contingent operations decreased 5.7% in 2017,2020 mainly due to less international and foreign trade financing business with clients during the year.
Fees from checking accounts increased 1.1% in 2017 comparedlower insurance fees paid to 2016. This was mainly due to a rise in the Bank’s checking account base. The number of clients with a checking account increased 5.6% to 896,144. Combined with this an increase in corporate cash management services also boosted fee growth in this product.
Brokerage and custody fees increased 10.5% in 2017 as compared to 2016 due to higher trading volumes in local equity market during 2017.
Fees from lines of credit increased 28.8% due to greater cross-selling of this product among checking account holders.
The rise in other fee income of 31.7% in 2017 compared to 2016 was mainly due to higher fees from the brokerage of asset management services. In December 2013,Zurich, our Asset Management business was sold. The Bank is no longer in the asset management business, but serves as an exclusive broker for Santander Asset Management, the acquirer of our asset management business. In 2017, asset management brokerage fees totaled Ch$43,331 million and increased 13.3% compared to 2016. Other fees also include fees from our Corporate Investment banking segment, which include financial advisory and investment banking.
Fees from Retail banking increased 4.9% in 2017 compared to 2016. Total retail clients with a checking account increased 5.6% to 896,144. In 2017, the Bank continued to experience positive client base and product growth that drove fee growth in various products. Internally, we measure the quantity of products that a client uses and identify them as a loyal customer when they meet certain internal criteria for their segment. Client loyalty continues to rise in retail banking, especially among high income earners, which was the area we focused on growing given the low growth environment. Loyal individual customers (clients with more than 4 products plus minimum usage and profitability levels) in the high-income segment grew 9.5% during 2017. This has led to high fee growth among retail bank clients, especially cards, insurance brokerage, brokerage of asset management products and checking accounts.partner.
The 17.6% increase in fees from the Middle-market segment was mainly due to the positive expansion of business volumes in this segment from greater client loyalty and product usage. Loyal SME and Middle market companies, defined by client size using a point system that depends on the number of products, usage of products and income net of risk, rose 3.9% in 2017. This segment’s client base also grew as SME clients graduated into this segment.
Fees from the Corporate Investment banking segment increased 10.2% in 2017 compared to 2016, mainly due to cash management services, financial advisory and investment banking fees.
Fees in Other increased 427.4% from Ch$1,651 million in 2016 to Ch$8,708 million in 2017 due to a higher rebate paid by the insurance company we broker for after a successful renegotiation of terms and conditions with them.
Financial transactions, netTransactions, Net
The following table sets forth information regarding our income (loss) from financial transactions for the years ended December 31, 2018, 20172020 and 2016.2019.
| Year ended December 31, | % Change | % Change | Year ended December 31, | % Change | ||||||||||||||||||||||||||||
| 2018 | 2017 | 2016 | 2018/2017 | 2017/2016 | 2020 | 2019 | 2020/2019 | |||||||||||||||||||||||||
| (in millions of Ch$) | (in millions of Ch$) | |||||||||||||||||||||||||||||||
| Net income from financial operations | 53,174 | 2,796 | (367,034 | ) | 1,801.8 | % | 100.8 | % | 90,800 | (78,165 | ) | --% | ||||||||||||||||||||
| Foreign exchange gain, net | 51,908 | 126,956 | 507,392 | (59.1 | %) | (75.0 | %) | 58,997 | 279,857 | (78.9 | %) | |||||||||||||||||||||
| Total financial transactions, net | 105,082 | 129,752 | 140,358 | (19.0 | %) | (7.6 | %) | 149,797 | 201,692 | (25.7 | %) | |||||||||||||||||||||
For the years ended December 31, 2018 and 2017.Total financial transactions, net, which is the sum of net income from financial operations and foreign exchange gain, totaled Ch$105,082149,797 million in the year ended December 31, 2018,2020, a decrease of 19.0%25.7% compared to the same period in 2017.2019. These results include the results of our Treasury Division’s trading business and financial transactions with customers, as well as the results of our Financial Management Division.
Internal Bank policy does not allow significant foreign currency mismatches and requires that the results included in Total financial transactions, net include not only the market-to-market of our foreign currency spot position, but also the results of the derivatives used to hedge currency risk. The mark-to-market of our spot position is included in the line item Foreign exchange gain, net along with the effect of those derivatives accounted for under hedge accounting rules. The derivatives used to hedge foreign currency risk, but which are classified as trading are included in the line item Net income from financial operations. For more details regarding our management and exposure to foreign currency risk, see “Item 11. Quantitative and Qualitative Disclosures About Market Risk—E. Market Risks—Market risk management— Market risk – local and foreign financial management.”
The results from net income (loss) from financial operations totaled a gain of Ch$53,17490,800 million in 20182020 compared to a loss of Ch$2,79678,165 million in 2017. As the Bank adopted IFRS 9 on January 1, 2018, its new disclosure requirements were addressed and no comparable information was prepared as provided for by the transitional provisions of IFRS 9.2019.
| ||||
| For the year ended December 31, | % Change | |||||||||||
| 2020 | 2019 | 2020/2019 | ||||||||||
| (in millions of Ch$) | ||||||||||||
| Net (loss) gains on trading derivatives | 42,704 | (162,183 | ) | --% | ||||||||
| Net gains on financial assets at fair value through profit or loss | 1,671 | 11,878 | (85.9 | %) | ||||||||
| Net gains on derecognition of financial assets measured at amortized cost | 80,679 | 63,672 | 26.7 | % | ||||||||
| Sale of loans and accounts receivables from customers | (62 | ) | 3,310 | (101.9 | %) | |||||||
| Current portfolio | 48 | 63 | (23.4 | %) | ||||||||
| Charged-off portfolio | (110 | ) | 3,248 | (103.4 | %) | |||||||
| Repurchase of issued bonds | 1,848 | 3,265 | (43.4 | %) | ||||||||
| Other income (expense) from financial operations | (36,039 | ) | 1,893 | (2004.8 | %) | |||||||
| Total income (expense) | 90,800 | (78,165 | ) | (216.2 | %) | |||||||
The incomegain from financial operations in 2018 consisted of:2020 compared to a gain in 2019 was mainly due to:
| (i) |
84
| (ii) | The 26.7% increase in the gains on the derecognition of financial assets measured at amortized cost, which totaled Ch$80,679 million. This increase was mainly due a decline in local interest rates as yields came down along the whole nominal and UF peso yield curve, that increased the realized gain from these investments, especially in the second quarter of |
This was partially offset by:
| (iii) | Lower gains from financial assets at fair value through profit or |
| (iv) | In |
| (v) | The net loss of Ch$36,039 million in the sub-line item others was mainly due to a larger loss from credit value adjustment of our derivative portfolio that is included in this line item. The growth of the Bank’s derivative portfolio and the increase in counterparty risk, caused by the pandemic drove the rise in CVA loss in |
The net result from foreign exchange transactions totaled a gain of Ch$51,90858,997 million in 20182020 compared to Ch$126,956279,857 million in 2017.2019.
| Year ended December 31, | % Change | % Change | Year ended December 31, | % Change | ||||||||||||||||||||||||||||
| 2018 | 2017 | 2016 | 2018/2017 | 2017/2016 | 2020 | 2019 | 2020/2019 | |||||||||||||||||||||||||
| (in millions of Ch$) | (in millions of Ch$) | |||||||||||||||||||||||||||||||
| Net profit or loss from foreign currency exchange differences | (212,618 | ) | 113,115 | 116,117 | (288.0 | %) | (2.6 | %) | 90,133 | (89,893 | ) | (200.3 | %) | |||||||||||||||||||
| Hedge-accounting derivatives | 252,275 | 22,933 | 399,875 | 1,000.1 | % | (94.3 | %) | (27,624 | ) | 362,374 | (107.6 | %) | ||||||||||||||||||||
| Translation gains and losses over assets and liabilities indexed to foreign currencies, net | 12,251 | (9,092 | ) | (8,600 | ) | 234.7 | % | 5.7 | % | (3,512 | ) | 7,376 | (147.6 | %) | ||||||||||||||||||
| Net results from foreign exchange gain | 51,908 | 126,956 | 507,392 | (59.1 | %) | (75.0 | %) | 58,997 | 279,857 | (78.9 | %) | |||||||||||||||||||||
Included in these results is the sub-item Net profit or loss from foreign currency exchange differences which includes the mark-to-market of the Bank’s spot position and results from our client foreign currency business, such as currency transactions. The Central Bank exchange rate appreciated 4.5% in 2020 and depreciated 13.1%7.0% in 2018 and appreciated 7.8% in 2017,2019, which reflects the loss formgain from our net liability spot position in 2018.2020 versus a net loss for 2019. This is offset by the results from hedge-accounting derivatives and the results from derivatives classified as trading.
85
Results from the sub-item hedge-accounting derivative are mainly comprised of the mark-to-market of derivatives that are used to mainly hedge the foreign currency risk of our long-term foreign currency funding. Therefore, we generally have a net foreign currency asset position in our hedge-accounting derivatives. These are mainly cross-currency swaps that are accounted under hedge accounting rules. These derivatives produced a gainloss of Ch$252,2753,512 million in 2018, significantly higher than 20172020, due to the depreciationappreciation of the peso in the second half of 2018.2020.
Finally, the Bank has some assets and liabilities that are in Chilean pesos, but indexed to foreign currency. This position produced a translation gainloss in 20182020 of Ch$12,2513,512 million.
In order to more easily compare the results from financial transactions, net, we present the following table that separates the results by lines of business for 2018, 20172020 and 2016.2019.
| Year ended December 31, | % Change | Year ended December 31, | % Change | |||||||||||||||||||||||||||||
| 2018 | 2017 | 2016 | 2018/2017 | 2017/2016 | 2020 | 2019 | 2020/2019 | |||||||||||||||||||||||||
| (in millions of Ch$) | (in millions of Ch$) | |||||||||||||||||||||||||||||||
| Client treasury products | 73,912 | 61,156 | 62,404 | 20.9 | % | (2.0 | %) | 107,538 | 101,519 | 5.9 | % | |||||||||||||||||||||
| Market-making with clients | 21,276 | 20,883 | 27,382 | 1.9 | % | (23.7 | %) | 37,703 | 37,129 | 1.5 | % | |||||||||||||||||||||
| Client treasury services | 95,188 | 82,039 | 89,786 | 16.0 | % | (8.6 | %) | 145,222 | 138,648 | 4.7 | % | |||||||||||||||||||||
| Sale of loans and charged-off loans | 198 | 6,040 | 4,190 | (96.7 | %) | 44.2 | % | (126 | ) | 3,310 | (103.8 | %) | ||||||||||||||||||||
| CVA adjustments | (2,745 | ) | (3,345 | ) | (94 | ) | (17.9 | %) | 3458.3 | % | (23,216 | ) | (3,957 | ) | 486.7 | % | ||||||||||||||||
| Financial Management Division and others (1) | 12,441 | 45,018 | 46,475 | (72.4 | %) | (3.1 | %) | |||||||||||||||||||||||||
| Financial Management Division and others(1) | 27,918 | 63,691 | (56.2 | %) | ||||||||||||||||||||||||||||
| Non-client treasury income (loss) | 9,894 | 47,713 | 50,572 | (79.3 | %) | (5.7 | %) | 4,576 | 63,044 | (92.7 | %) | |||||||||||||||||||||
| Total financial transactions, net | 105,082 | 129,752 | 140,358 | (19.0 | %) | (7.6 | %) | 149,797 | 201,692 | (25.7 | %) | |||||||||||||||||||||
____________________
| (1) | The Financial Management Division manages the structural interest rate risk, the structural position in inflation-indexed assets and liabilities, capital requirements and liquidity levels. The aim of the Financial Management Division is to provide stability and continuity in our net interest income from commercial activities, and to ensure that we comply with internal and regulatory limits regarding liquidity, regulatory capital, reserve requirements and market risk. |
Client treasury services totaled Ch$95,188145,222 million, an increase of 19.0%4.7% compared to 2017.2019. The results from client treasury products and market-making mainly include the results from the sale of derivatives, foreign exchange and fixed income instruments to our client base. In 2018,2020, the results from client treasury products increased 20.9%5.9%. The higher market volatility and depreciation ofdue to the peso in the second semester of 2018COVID-19 pandemic led to higher demand for hedging from our Corporate and Middle-market clients. The results from market-making with client services increased 1.9%1.5% in 2018,2020, mainly due an improvement in business volumes of tailor-made treasury services and cash management sold to specific corporate clients.clients, even after a strong year in this line item in 2019. These results may vary year-to-year as some large operations with corporate clients may not be repeated in subsequent years.
The results from non-client treasury income decreased 92.7% to a gain of Ch$9,8944,576 million in 20182020 compared to Ch$47,713 million in 2017.2019. These results include the income from sale of loans, including charged-off loans, CVA adjustments and the results from our Financial Management Division. The results of the Bank’s Financial Management Division decreased 56.2% to Ch$27,918 million in 2020 compared to 2019. During 2020, the Bank prepaid various bonds and interbank borrowings in foreign currency as cheaper local funding became available from non-interest bearing deposits and Central Bank lines. These liability management exercises included the unwinding of the rate and currency hedges. In some instances, this resulted in an initial loss recognized in this line item, but a cheaper funding cost going forward. This was partially offset by higher results derived from gains on the derecognition of financial assets measured at amortized cost, which totaled Ch$80,679 million in 2020.
The results from the sale of loans totaled a loss of Ch$126 million in 2020 compared to a gain of Ch$1983,310 million in 2018, decreasing 96.7% from 20172019 due to decreasedlower demand for these sales of our loan portfolio compared to previous years.during the pandemic.
The results from CVAs totaled a loss of Ch$2,74523,216 million. This was mainly due to a loss from CVA adjustments of our derivative portfolio which is included in this line item, since the CVA generated by derivatives taken for hedging and on behalf of clients is not part of client income or part of Financial Management’s profit and loss.
In 2018, income from the Bank’s Financial Management Division decreased to Ch$12,441 million. This department manages the structural interest rate risk, the structural position in inflation-indexed assets and liabilities, capital requirements and liquidity levels. The aim of the Financial Management Division is to provide stability and continuity in our net interest income from commercial activities, and to ensure that we comply with internal and regulatory limits regarding liquidity, regulatory capital, reserve requirements and market risk. This decrease in results was mainly due to lower results from liability management transactions and lower realized gains from our investments in debt instruments at fair value through other comprehensive income. The results from Financial Management Division also include the offset of the foreign currency exposure hedging on provision expenses for loans denominated in U.S. dollars. As the peso depreciated against the dollar, this increased our provision expense for our loans in U.S. dollars and had a corresponding offset gain recognized by financial management in this line.
For the years ended December 31, 2017 and 2016. Total financial transactions, net, which is the sum of net income from financial operations and foreign exchange gain, totaled Ch$129,752 million in the year ended December 31, 2017, a decrease of 7.6% compared to the same period in 2016. These results include the results of our Treasury Division’s trading business and financial transactions with customers, as well as the results of our Financial Management Division.
Internal Bank policy does not allow significant foreign currency mismatches and requires that the results included in Total financial transactions, net include not only the market-to-market of our foreign currency spot position, but also the results of the derivatives used to hedge currency risk. The mark-to-market of our spot position is included in the line item Foreign exchange gain, net along with the effect of those derivatives accounted for under hedge accounting rules. The derivatives used to hedge foreign currency risk but which are classified as trading are included in the line item Net income from financial operations. For more details regarding our management and exposure to foreign currency risk, see “Item 11. Quantitative and Qualitative Disclosures About Market Risk—E. Market Risks—Market risk management—Market risk – local and foreign financial management.”
The results from net income (loss) from financial operations totaled a gain of Ch$2,796 million in 2016 compared to a loss of Ch$367,034 million in 2016.
| Year ended December 31, | % Change | |||||||||||
| 2017 | 2016 | 2017/2016 | ||||||||||
| (in millions of Ch$) | ||||||||||||
| Derivatives classified as trading | (18,974 | ) | (395,209 | ) | 95.2 | % | ||||||
| Trading investments | 10,008 | 18,229 | (45.1 | %) | ||||||||
| Sale of loans | 6,040 | 4,190 | 44.2 | % | ||||||||
| Realized gains (losses) Debt instruments at fair value through other comprehensive income / Available-for-sale instruments | 8,956 | 14,598 | (38.6 | %) | ||||||||
| Other results | (3,234 | ) | (8,842 | ) | 63.4 | % | ||||||
| Net income (loss) from financial operations | 2,796 | (367,034 | ) | 100.8 | % | |||||||
The income from financial operations in 2017 compared to a loss in 2016 was mainly due to:
The net result from foreign exchange transactions totaled a gain of Ch$126,956 million in 2017 compared to Ch$507,392 million in 2016.
Included in these results is the sub-item Net profit or loss from foreign currency exchange differences which totaled a gain of Ch$113,115 million in 2017 compared to Ch$116,117 million in 2016. This result includes the mark-to-marketgrowth of the Bank’s spot position and results from our client foreign currency business, such as currency transactions and market making. The lower market-making foreign currency transactionsderivative portfolio and the appreciationincrease in counterparty risk drove the rise in CVA adjustment loss in 2020.
86
Other Operating Income
| Year ended December 31, | % Change | |||||||||||
| 2020 | 2019 | 2020/2019 | ||||||||||
| (in millions of Ch$) | ||||||||||||
| Income from assets received in lieu of payment | �� | 5,934 | 5,613 | 5.7 | % | |||||||
| Release of contingencies provisions | 503 | - | --% | |||||||||
| Other income | 1,769 | 7,388 | (76.1 | %) | ||||||||
| Leases | - | - | --% | |||||||||
| Income from sale of property, plant and equipment | 865 | 2,456 | (64.8 | %) | ||||||||
| Compensation from insurance companies due to damages | 702 | 4,681 | (85.0 | %) | ||||||||
| Other | 202 | 251 | (19.5 | %) | ||||||||
| Total | 8,206 | 13,001 | (36.9 | %) | ||||||||
Results from the sub-item hedge-accounting derivative are mainly comprised of the mark-to-market of derivatives that are used to mainly hedge the foreign currency risk of our long-term foreign currency funding. Therefore, we generally have a net foreign currency positionTotal other operating income decreased by 36.9% in our hedge-accounting derivatives. These are mainly cross-currency swaps that are accounted under hedge accounting rules. These derivatives produced a gain of Ch$22,933 million in 2017. This gain was lower than in 2016 due to the appreciation of the peso in the fourth quarter of 2017.
Finally, the Bank has some assets and liabilities that are in Chilean pesos, but indexed to foreign currency. This position produced a translation loss in 2017 of Ch$9,092 million. This exposure is also hedged.
Client treasury services totaled Ch$82,039 million, a decrease of 8.6%2020 compared to 2016. The results from client treasury products and market-making mainly include the results from the sale of derivatives, foreign exchange and fixed income instruments to our client base. In 2017, the results from client treasury products decreased 2.0%. The appreciation of the peso and lower market volatility led to lower demand for hedging from our Corporate and Middle-market clients. The results from market-making with client services decreased 23.7% in 2017, mainly due to a decrease in business volumes of tailor-made treasury services and cash management sold to specific corporate clients. These results may vary year-to-year as some large operations with corporate clients may not be repeated in subsequent years.
The results from non-client treasury income decreased 5.7%2019 and totaled a gain of Ch$47,713 million in 2017 compared to Ch$50,572 million in 2016. These results include the income from sale of loans, including charged-off loans, proprietary trading and the results from our Financial Management Division.
The results from the sale of loans increased to Ch$6,040 million in 2017. The results from proprietary trading and CVAs totaled a loss of Ch$3,3458,206 million. This was mainly due to a higher losslower income from CVA adjustments of our derivative portfolio, which totaled Ch$2,821 million. This is included in this line item, since the CVA generated by derivatives taken for hedging and on behalf of clients is not part of client income or part of Financial Management’s profit and loss. Since year-end 2012,insurance compensation due to damages as the Bank no longer has a proprietary trading area andreceived compensation for the results from proprietary trading are from residual positionsdamages to our branches during the social unrest that are being closed.
In 2017, income from the Bank’s Financial Management Division decreased 3.1% to Ch$45,018 million. This department manages the structural interest rate risk, the structural positionaffected Chile in inflation-indexed assets and liabilities, capital requirements and liquidity levels. The aimOctober- December of the Financial Management Division is to provide stability and continuity in our net interest income from commercial activities, and to ensure that we comply with internal and regulatory limits regarding liquidity, regulatory capital, reserve requirements and market risk. This decrease in results was mainly due to lower realized gains from our available-for-sale portfolio. The results from Financial Management Division also include the offset of the foreign currency exposure hedging on provision expenses for loans denominated in U.S. dollars. As the peso appreciated against the dollar, this lowered the provision expense for our loans in U.S. dollars and had a corresponding offset loss recognized by financial management in this line.
Other operating income
Year ended December 31, | % Change | % Change | ||||||||||||||||||
| 2018 | 2017 | 2016 | 2018/2017 | 2017/2016 | ||||||||||||||||
| (In millions of Ch$) | ||||||||||||||||||||
| Income from assets received in lieu of payment | 7,106 | 3,330 | 1,663 | 113.4 | % | 100.2 | % | |||||||||||||
| Net results from sale of investment in other companies | — | — | — | — | % | — | % | |||||||||||||
| Operational leases (as lessor) | 222 | 264 | 519 | (15.9 | %) | (49.1 | %) | |||||||||||||
| Gain on sale of Bank property, plant and equipment | 2,490 | 23,229 | 2,017 | (89.3 | %) | 1051,7 | % | |||||||||||||
| Compensation from insurance companies due to damages | 144 | 1,237 | 1,530 | (88.4 | %) | (19.2 | %) | |||||||||||||
| Other | 13,167 | 33,956 | 698 | (61.2 | %) | 77.2 | % | |||||||||||||
| Sub-total other income | 16,023 | 58,686 | 4,764 | (72.7 | %) | 1,131.9 | % | |||||||||||||
| Total other operating income | 23,129 | 62,016 | 6,427 | (62.7 | %) | 864.9 | % | |||||||||||||
For the years ended December 31, 2018 and 2017. Total other operating income decreased by 62.7% in 2018 compared to 2017 and totaled a gain of Ch$23,129 million mainly due a decrease in the extraordinary income from the sale of repossessed assets by Bansa S.A. Bansa is a company that is consolidated by the Bank due to control in accordance with IFRS 10. For 2018 this amounted to Ch$2,122 million while for 2017 this concept amounted to Ch$20,663 million. For the purposes of consolidation, this one-time income forms part of the net income attributable to non-controlling interest and has no impact on net income attributable to shareholders or shareholders’ equity.2019. This was offsetslightly compensated by ana release of non-credit contingencies in 2020, and a 5.7% increase in income from assets received in lieu of payment, totaling a gain of Ch$7,106 million. Also in 2018 there was less reversal of provisions for non-credit contingencies compared to 2017.
For the years ended December 31, 2017 and 2016. Total other operating income increased by 864.9% in 2017 compared to 2016 and totaled a gain of Ch$62,016 million mainly due to (i) an increase in the income from the assets received in lieu of payment and the recovery of assets previously charged-off (ii) a reversal of provisions for non-credit contingencies and (iii) an extraordinary income from the sale of property for Ch$20,663 million from the sale of repossessed assets by Bansa S.A. Bansa is a company that is consolidated by the Bank due to control in accordance with IFRS 10.payment.
Expected credit loss allowance
For the years ended December 31, 2018(in accordance with IFRS 9 Financial Instruments adopted as of January 1, 2018)Credit Loss Allowance
The following table sets forth certain information relating to our provision for expected credit losses for the yearyears ended 2018.2020 and 2019.
| As of December 31, 2020 | ||||||||||||||||||||||||||||
| Stage 1 | Stage 2 | Stage 3 | ||||||||||||||||||||||||||
| Individual | Collective | Individual | Collective | Individual | Collective | Total | ||||||||||||||||||||||
| (in millions of Ch$) | ||||||||||||||||||||||||||||
| Commercial loans | (20,055 | ) | (9,617 | ) | (35,861 | ) | (23,410 | ) | (115,730 | ) | (86,016 | ) | (290,691 | ) | ||||||||||||||
| Mortgage loans | - | (16,603 | ) | - | 5,966 | - | (7,636 | ) | (18,273 | ) | ||||||||||||||||||
| Consumer loans | - | (19,024 | ) | - | 18,914 | - | (161,466 | ) | (161,576 | ) | ||||||||||||||||||
| Contingent loans | (1,335 | ) | 1,600 | (1,624 | ) | (4,023 | ) | 14 | (423 | ) | (5,789 | ) | ||||||||||||||||
| Loans and AR at FVOCI | (1,253 | ) | - | - | - | - | - | (1,253 | ) | |||||||||||||||||||
| Debt at FVOCI | - | (682 | ) | - | - | - | - | (682 | ) | |||||||||||||||||||
| Total Expected credit losses allowance | (22,643 | ) | (44,326 | ) | (37,485 | ) | (2,552 | ) | (115,716 | ) | (255,543 | ) | (478,264 | ) | ||||||||||||||
| As of December 31, 2019 | ||||||||||||||||||||||||||||
| Stage 1 | Stage 2 | Stage 3 | ||||||||||||||||||||||||||
| Individual | Collective | Individual | Collective | Individual | Collective | Total | ||||||||||||||||||||||
| (in millions of Ch$) | ||||||||||||||||||||||||||||
| Commercial loans | (3,002 | ) | (4,930 | ) | (10,469 | ) | (8,686 | ) | (79,501 | ) | (33,657 | ) | (140,245 | ) | ||||||||||||||
| Mortgage loans | - | (1,177 | ) | - | (4,998 | ) | - | (8,237 | ) | (14,412 | ) | |||||||||||||||||
| Consumer loans | - | (8,875 | ) | - | (15,280 | ) | - | (145,328 | ) | (169,483 | ) | |||||||||||||||||
| Contingent loans | 45 | 589 | 10 | 24 | 152 | 188 | 1,008 | |||||||||||||||||||||
| Loans and AR at FVOCI | 5 | - | - | - | - | - | 5 | |||||||||||||||||||||
| Debt at FVOCI | - | (184 | ) | - | - | - | - | (184 | ) | |||||||||||||||||||
| Total Expected credit losses allowance | (2,952 | ) | (14,577 | ) | (10,459 | ) | (28,940 | ) | (79,349 | ) | (187,034 | ) | (323,311 | ) | ||||||||||||||
| Stage 1 | Stage 2 | Stage 3 | Total | |||||||||||||||||||||||||
| (in millions of Ch$) | Individual | Collective | Individual | Collective | Individual | Collective | ||||||||||||||||||||||
| Commercial loans | 79 | 5,652 | (2,891 | ) | (1,533 | ) | (96,131 | ) | (47,959 | ) | (142,782 | ) | ||||||||||||||||
| Mortgage loans | — | 5,583 | — | 5,161 | — | 3,375 | 14,119 | |||||||||||||||||||||
| Consumer loans | — | 1,861 | — | 192 | — | (191,304 | ) | (189,251 | ) | |||||||||||||||||||
| Contingent loans | (90 | ) | 1,214 | 11 | (68 | ) | (225 | ) | (834 | ) | 9 | |||||||||||||||||
| Loans and AR at FVOCI | 363 | — | 68 | — | — | — | 431 | |||||||||||||||||||||
| Debt at FVOCI | — | 66 | — | — | — | — | 66 | |||||||||||||||||||||
| Total Expected credit losses allowance | 353 | 14,376 | (2,811 | ) | 3,752 | (96,356 | ) | (236,722 | ) | (317,408 | ) | |||||||||||||||||
87
For the year ended December 31, 20182020 provisions for expected credit loss totaled Ch$317,408478,264 million and increased 47.9% compared to 2019. This rise was mainly due to growth of our loan book and an increase in accordanceexpected losses driven by the economic slowdown as the COVID-19 pandemic forced many cities into lockdown. In April, the Bank completed a calibration of parameters, resulting in additional allowance for Ch$2,066 million. Additionally, with current COVID-19 infection rates having increased and continued high levels of uncertainty in the adoptionmacro-economic outlook and to address a potential lag in defaults, the Bank’s management has determined to recorded overlay or post-model adjustments overlays for an amount of IFRS 9.Ch$59,000 million, wherein Ch$29,000 million addressed macroeconomics’ variables and Ch$30,000 million associated to expected behavior of Fogape loans. The changes in accounting policies resulting from the adoption of IFRS 9 were applied retrospectively adjusting the opening balance as of January 1, 2018, applying the transition exemption that allows not to restate comparative information for prior periods.table below breaks down these results by main product item:
| Year ended December 31, | % Change | |||||||||||
| 2020 | 2019 | 2020/2019 | ||||||||||
| (in millions of Ch$) | ||||||||||||
| Commercial loans | (290,691 | ) | (140,245 | ) | 107.3 | % | ||||||
| Mortgage loans | (18,273 | ) | (14,412 | ) | 26.8 | % | ||||||
| Consumer loans | (161,576 | ) | (169,483 | ) | (4.7 | %) | ||||||
| Contingent loans | (5,789 | ) | 1,008 | --% | ||||||||
| Loans and AR at FVOCI | (1,253 | ) | 5 | --% | ||||||||
| Debt at FVOCI | (682 | ) | (184 | ) | 270.7 | % | ||||||
| Total Provision For Loan Losses | (478,264 | ) | (323,311 | ) | 47.9 | % | ||||||
Provisions for expected credit losses of our commercial loans totaled Ch$142,782290,691 million for the year ended December 31, 2018. In 2018,2020 and increased 107.3% compared to 2019. This segment has been the most affected by the lockdowns, increasing the risk of default and the transfer of clients to Stage 2. There was also a rise in write-offs of companies who were not able to withstand the effects of the pandemic. The strong growth in loan growth in commercial loans grew 10% with growthduring the year mainly comingcame from our Middle-market segmentFogape loans, which were state-guaranteed loans mainly given to SMEs in lineorder to help them cope with the re-activation of investment in the Chilean economy and representing the bulk of growth in Stage 1 loans. The growth of Stage 1 loans was alsolower economic activity due to the rise in commercialCovid-19 pandemic. The Bank decided to be prudent and increased provisioning for these loans disbursed to high income individuals. The positive evolutionwith an overlay of the economy and the focus on less risky loan clients led a reversal of Stage 1 loan loss allowances during the year.
In 2018, the Bank continued to remain selective in the SME (small to medium-sized entities) loan book included in the Commercial banking segment and originated few new assets among this sub-segment. At the same time, as this loan book aged, it represented the bulk of increase and transfers toCh$30,000 million specifically for these loans, under Stage 2 and Stage 3 loans. Provisions for individuallythose loans analyzed commercial loans mainly correspond to loans classified in Stage 3 for the year ended December 31, 2018 totaled Ch$96,131 million, this is mainly due to larger SMEs that are marked for legal action.on a collective basis.
Provisions for expected credit losses for mortgage loans totaled a releasean expense of Ch$14,11918,273 million for the year ended December 31, 20182020, compared to an expense of Ch$14,412 million in 2019. Mortgage loans increased 10.2% in 2020 compared to 2019. Mortgage loans had good payment behavior despite an increasethe pandemic, as at the peak almost half of 11.6%this portfolio was under a grace period. The lower economic growth increased provisions in the mortgage loan portfolio. This is mainlyall stages, except Stage 2, where provisions were released due to stricter admission requirementsthe healthy payment behavior. It is important to note that the majority of grace periods ended in October and a strategyNovember 2020, and almost all of targetingclients were back on track paying on time. In June 2020, the higher income segments that tendBank decided to be less risky. This has ledtake an overlay due to a portfolio with better payment behavior in general.the deterioration of macroeconomic variables, and assigned Ch$11,600 million under Stage 1.
The provisions for expected credit losses for consumer loans totaled a charge of Ch$189,251161,576 million forand decreased 4.7% in 2020 compared to 2019. Although the 3-month grace periods were given out at the beginning of the COVID-19 pandemic (the majority in April and May), around 12% of this loan book took advantage of this relief program. During the year, ended December 31, 2018 mainlyas these loans began repaying once again, there was no increase in overdue loans, and provisions from Stage 2 were released. It is important to note that the consumer portfolio also contracted in 2020, as there was lower demand for these types of products due to provisions for consumer loans in Stage 3.the high liquidity of households after the government approved various initiatives, including pension fund withdrawals. Regardless of other factors, if contractual payments are more than 30 days past due, the credit risk is deemed to have increased significantly since initial recognition and consumer loans are written off after 6 months. These positive trends in the risk of our consumer loan portfolio may reverse if the economy continues to decelerate and unemployment rises in 2021. In 2018, consumer loans grew 7.0% with growth mainly coming from our high income earnersJune 2020 the Bank decided to take an overlay due to the deterioration of macroeconomic variables, and assigned a continued decreasetotal of loans among low income earners.Ch$17,400 million to a specific group of operations in the following manner: Ch$10,700 million to specific operations under Stage 1 and $6,700 million to specific operations under Stage 2.
88
Recoveries on loans previously charged-off increased 5.9%decreased 9.4% in 20182020 compared to 2017. This was due to higher recoveries from charged-off mortgage loans mainly due to improved2019. The pandemic limited recovery efforts.efforts during 2020. The following table shows recoveries of loans previously charged-off by type of loan.
| Year ended December 31, | % Change | % Change | Year ended December 31, | % Change | ||||||||||||||||||||||||||||
| 2018 | 2017 | 2016 | 2018/2017 | 2017/2016 | 2020 | 2019 | 2020/2019 | |||||||||||||||||||||||||
| (in millions of Ch$) | (in millions of Ch$) | |||||||||||||||||||||||||||||||
| Recovery of loans previously charged-off | ||||||||||||||||||||||||||||||||
| Consumer loans | 40,180 | 39,972 | 41,072 | 0.5 | % | (2.7 | %) | 39,373 | 42,432 | (7.2 | %) | |||||||||||||||||||||
| Residential mortgage loans | 17,367 | 10,942 | 10,041 | 58.7 | % | 9.0 | % | 9,584 | 13,652 | (29.8 | %) | |||||||||||||||||||||
| Commercial loans | 30,934 | 32,613 | 27,185 | (5.1 | %) | 20.0 | % | 25,969 | 26,629 | (2.5 | %) | |||||||||||||||||||||
| Total recoveries | 88,481 | 83,527 | 78,298 | 5.9 | % | 6.7 | % | 74,926 | 82,713 | (9.4 | %) | |||||||||||||||||||||
In some instances, we will sell a portfolio of charged-off loans to a third party. Gain (loss) on these charged-off loans is recognized as net income from financial transactions as disclosed in “Note 29—Net Income (Expense) from Financial Operations” of our Audited Consolidated Financial Statements. The following table sets forth information about our sale of charged-off loans for the year ended December 31, 2018, 20172020 and 2016.2019.
| Year ended December 31, | % Change | % Change | ||||||||||||||||||
| 2018 | 2017 | 2016 | 2018/2017 | 2017/2016 | ||||||||||||||||
| (in millions of Ch$) | ||||||||||||||||||||
| Gains (losses) on sale of loans previously charged-off | 709 | 3,020 | 2,720 | (76.5 | %) | 11.0 | % | |||||||||||||
| Year ended December 31, | % Change | |||||||||||
| 2020 | 2019 | 2020/2019 | ||||||||||
| (in millions of Ch$) | ||||||||||||
| Gains (losses) on sale of loans previously charged-off | (110 | ) | 3,248 | (103.4 | %) | |||||||
The following table sets forth, for the periods indicated, our net provision expense broken down by business segment:
| Year ended December 31, | % Change | % Change | Year ended December 31, | % Change | ||||||||||||||||||||||||||||
| 2018 | 2017 | 2016 | 2018/2017 | 2017/2016 | 2020 | 2019 | 2020/2019 | |||||||||||||||||||||||||
| (in millions of Ch$) | (in millions of Ch$) | |||||||||||||||||||||||||||||||
| Retail banking | (287,739 | ) | (293,956 | ) | (323,888 | ) | (2.1 | %) | (9.2 | %) | (317,050 | ) | (279,969 | ) | 13.2 | % | ||||||||||||||||
| Middle-market | (26,314 | ) | (19,235 | ) | (26,748 | ) | 36.8 | % | (28.1 | %) | (109,999 | ) | (38,746 | ) | 183.9 | % | ||||||||||||||||
| Corporate Investment banking | 2,339 | 6,440 | 7,579 | (63.7 | %) | (15.0 | %) | (51,097 | ) | 224 | --% | |||||||||||||||||||||
| Other | (5,694 | ) | 4,496 | 974 | (226.6 | %) | 361.6 | % | (118 | ) | (4,820 | ) | (97.6 | %) | ||||||||||||||||||
| Total provisions, net | (317,408 | ) | (302,255 | ) | (342,083 | ) | 5.0 | % | (11.6 | %) | (478,264 | ) | (323,311 | ) | 47.9 | % | ||||||||||||||||
Net provisions for expected credit losses for the year ended December 31, 2018 are not comparableexpense from retail banking increased 13.2% in 2020 compared to net2019. This was mainly driven by higher provisions for previous yearSMEs due in part to the loan growth in this segment through FOGAPE loans and an increase in expected loss of this portfolio due to the adoptionpandemic and slower economic growth.
Net provision expense from the Middle-market segment increased 183.9% in 2020 due to the rise in the expected loss of IFRS 9this portfolio and the increase in write-offs of commercial loans in this segment as a result of January 1, 2018.the COVID-19 pandemic lockdowns and lower economic growth.
Net provision expense from Corporate Investment banking totaled an expense of Ch$51,097 million compared to a release of Ch$224 million in 2019. This is mainly due to the rise in the expected loss of this portfolio as a result of the COVID-19 pandemic lockdowns and lower economic growth.
Total provisions, net included in Others totaled an expense of Ch$118 million, 97.6% lower than in 2019. This difference is explained by a change in the way the effects of the exchange rate over provision expenses are recognized. In 2020, the impact of foreign currency movements on provision expenses and the corresponding hedge was included in Financial Transactions, net.
We believe that our loan loss allowances are currently adequate for all known and expected credit losses.
For the years ended December 31, 2017 and 2016(in accordance with IAS 39). Provisions for loan losses, net totaled Ch$302,255 million in 2017 and decreased 11.6% compared to the amount89
Table of provisions recorded in 2016.Contents
| Year ended December 31, | % Change | |||||||||||
| 2017 | 2016 | 2017/2016 | ||||||||||
| Provision for loan losses | (370,083 | ) | (409,159 | ) | (9.6 | %) | ||||||
| Charge-off of loans analyzed on an individual basis | (15,699 | ) | (11,222 | ) | 39.9 | % | ||||||
| Recoveries on loans previously charged-off | 83,527 | 78,298 | 6.7 | % | ||||||||
| Provision for loan losses, net | (302,255 | ) | (342,083 | ) | (11.6 | %) | ||||||
| Year end loans (1) | 27,725,914 | 27,206,431 | 1.9 | % | ||||||||
| Non-performing loans (2) | 633,461 | 564,131 | 12.3 | % | ||||||||
| Impaired loans (3) | 1,803,173 | 1,615,441 | 11.6 | % | ||||||||
| Allowance for loan losses (4) | 791,157 | 790,605 | 0.1 | % | ||||||||
| Impaired loans / Year end loans (5) | 6.50 | % | 5.94 | % | ||||||||
| Non-performing loans / Year end loans (2) | 2.28 | % | 2.07 | % | ||||||||
| Allowances for loan losses / Total loans | 2.85 | % | 2.91 | % | ||||||||
| Coverage ratio non-performing loans (5) | 124.89 | % | 140.15 | % | ||||||||
Provision for loan losses, which includes the full amount of provisions recognized as a result of loan growth and change in risk classification as well as the net result of provisions and charge-offs of loans analyzed on a group basis, totaled Ch$370,083 million in 2017 compared to Ch$409,159 million in 2016 and decreased 9.6%. The following table breaks down provision for loans losses by loan product for the years ended December 31, 2017 and 2016.
| Year ended December 31, | % Change | |||||||||||
| 2017 | 2016 | 2017/2016 | ||||||||||
| (in millions of Ch$) | ||||||||||||
| Interbank loans | 3,663 | (2,969 | ) | (223.4 | %) | |||||||
| Commercial loans | (136,923 | ) | (137,242 | ) | (0.2 | %) | ||||||
| Mortgage loans | (32,194 | ) | (16,646 | ) | 93.4 | % | ||||||
| Consumer loans | (205,949 | ) | (249,754 | ) | (17.5 | %) | ||||||
| Contingent loans | 1,320 | (2,548 | ) | — | % | |||||||
| Total(1) | (370,083 | ) | (409,159 | ) | (9.6 | %) | ||||||
The provision expense for loan loss for commercial loans decreased from Ch$137,242 million in 2016 to Ch$136,923 million in 2017. The non-performing loan ratio of commercial loans reached 2.6% in 2017 compared to 2.3% in 2016 and the impaired loan ratio increased from 6.7% in 2016 to 7.3% in 2017. This can be explained by the 23.0% decrease in loan volumes in GCB, which have practically no non-performing loans and also the negative effects of a low growth economic environment over commercial loans, especially in the SME portfolio.
At the same time during September 2017, and as part of the normal process of updating the provisioning model for loans analyzed on a group basis, the Bank calibrated these models, incorporating a greater historical depth, including a recession period, thus strengthening the parameters of probability of default and loss given default. This calibration resulted in an increase in provisions associated with commercial loans analyzed on group basis of Ch$9,040 million.
Provisions for mortgage loans increased by 93.4% to Ch$32,194 million in 2017 compared to Ch$16,646 million in 2016. The non-performing ratio for mortgage loans increased to 1.8% in 2015 from 1.7% in 2016, however, the impaired mortgage loans ratio went up from 4.6% in 2016 to 4.4% in 2017.
At the same time during September 2017, and as part of the normal process of updating the provisioning model for loans analyzed on a group basis, the Bank calibrated the provisioning model for mortgage loans, incorporating a greater historical depth, including a recession period, thus strengthening the parameters of probability of default and loss given default. This calibration resulted in an increase in provisions associated with mortgage loans of Ch$8,161 million.
The provision expense for consumer loans decreased 17.5%. During September 2017, and as part of the normal process of updating the provisioning model for loans analyzed on a group basis, the Bank recalibrated these models, resulting in a decrease in provisions associated with consumer loans in the amount of Ch$19,499 million. Excluding this, the decrease in provision expense from consumer loans was 9.7%. This reduction was mainly due to the continued process of lowering our exposure to Santander Banefe, the brand aimed at the lower end of the consumer market, and increasing exposure to high-income earners. This was partially offset by the negative impact of slower economic growth and rising unemployment on consumer asset quality. The consumer non-performing loans ratio was 2.3% in 2017 compared to 2.2% in 2016. The impaired consumer loan ratio increased from 6.5% in 2016 to 7.2% in 2017.
For a description of the provisions related to our consumer loans, residential mortgage loans and commercial loans analyzed on a group basis, please see “Item 5. Operating and Financial Review and Prospects—C. Selected Statistical Information—Classification of Loan Portfolio—Classification of Loan Portfolio—Loans analyzed on a group basis—Allowances for residential mortgage loans” and “—Loans analyzed on a group basis.”
Additionally, the provisions for interbank loans totaled a reversal of Ch$3,663 million. This was due to the decline in interbank loans in the year.
Recoveries on loans previously charged-off increased 6.7% in 2017 compared to 2016. This was due to higher recoveries from charged-off commercial loans mainly due to improved recovery efforts.
In some instances, we will sell a portfolio of charged-off loans to a third party. Gain (loss) on these charged-off loans is recognized as net income from financial transactions as disclosed in “Note 29—Net Income (Expense) from Financial Operations” of our Audited Consolidated Financial Statements.
Net provisions expense from retail banking decreased 9.2% in 2017 compared to 2016. This is in line with our strategy of focusing on higher income clients, net of risk for loans for individuals which has led to less provisions for loan losses and the reversal of provision due to the calibration of our consumer provisioning model described above. This was partially offset by the negative impact of slower economic growth and rising unemployment on consumer asset quality and the greater provision expense recognized in commercial loans analyzed on a group basis due to the recalibration of the provisioning model.
Net provision expense from the Middle-market segment decreased by 28.1% in 2017 due to the improvement in asset quality, compensated by an increase of 5.9% in the loan portfolio.
Net provision expense from Corporate Investment banking totaled a release of provisions of Ch$6,440 million, a 15.0% decrease from the release of provisions in 2016 due to a 23.0% decrease in the loan portfolio in this segment as the Bank focused on non-lending products, such as cash management, that generate a higher return than lending in this segment.
Total provisions, net included in Others reached a gain of Ch$4,496 million compared to Ch$974 million. In Other provision expense, we mainly include the impact of the fluctuation of the exchange rate on our provision expense. When the peso appreciates, the amount of provisions set aside for these loans translated to local currency decreases. In 2017 the average appreciation of the peso was 4.1%, compared to the depreciation in 2016 of 3.5%, leading to a greater release of provisions. This impact has a corresponding hedge recognized in the results from financial transactions and for this reason it is not assigned to any reporting segment.
We believe that our loan loss allowances are currently adequate for all known and estimated incurred losses.
Operating expensesExpenses
The following table sets forth information regarding our operating expenses in the years ended December 31, 2018, 20172020 and 2016.2019.
| Year ended December 31, | % Change | % Change | Year ended December 31, | % Change | ||||||||||||||||||||||||||||
| 2018 | 2017 | 2016 | 2018/2017 | 2017/2016 | 2020 | 2019 | 2020/2019 | |||||||||||||||||||||||||
| (in millions of Ch$) | (in millions of Ch$) | |||||||||||||||||||||||||||||||
| Personnel salaries and expenses | (397,564 | ) | (396,967 | ) | (395,133 | ) | 0.2 | % | 0.5 | % | (408,670 | ) | (410,157 | ) | (0.4 | %) | ||||||||||||||||
| Administrative expenses | (245,089 | ) | (230,103 | ) | (226,413 | ) | 6.5 | % | 1.6 | % | (250,450 | ) | (233,612 | ) | 7.2 | % | ||||||||||||||||
| Depreciation and amortization | (79,280 | ) | (77,823 | ) | (65,359 | ) | 1.9 | % | 19.1 | % | (109,426 | ) | (106,092 | ) | 3.1 | % | ||||||||||||||||
| Impairment | (39 | ) | (5,644 | ) | (234 | ) | (99.3 | %) | 2312.0 | % | (638 | ) | (2,726 | ) | (76.6 | %) | ||||||||||||||||
| Other operating expenses | (32,342 | ) | (68,413 | ) | (68,902 | ) | (52.7 | %) | (0.7 | %) | (77,806 | ) | (49,303 | ) | 57.8 | % | ||||||||||||||||
| Total operating expenses | (754,314 | ) | (778,950 | ) | (756,041 | ) | (3.2 | %) | 3.0 | % | (846,990 | ) | (801,890 | ) | 5.6 | % | ||||||||||||||||
| Efficiency ratio(1) | 41.1 | % | 43.3 | % | 44.9 | % | 41.9 | % | 41.8 | % | ||||||||||||||||||||||
____________________
| (1) | The efficiency ratio is the ratio of total operating expenses to total operating income. Total operating income consists of net interest income, fee income, financial transactions, net and other operating income. |
For the years ended December 31, 2018 and 2017. Operating expenses in the year ended December 31, 2018 decreased 3.2%2020 increased 5.6% compared to the corresponding period in 2017.2019. The efficiency ratio was 41.1%41.9% in 2018, 43.3%2020 and 41.8% in 2017 and 44.9% in 2016.2019.
The 0.2% increase0.4% decrease in personnel salaries and expenses was below the CPI inflation of 2.6%, even though all salaries are indexed to inflation pursuant to the collective bargaining agreement. This was despite an increase in headcount of 2.1% to a total of 11,305 employees. This decrease in expenses is mainly due to a decrease in variable incentives, severance payments, training and other benefits that decreased 6.9%, while salary costs only grew by 1.9%. Headcount decreased 6.5% in 2020, ending the Bank’s strategy of reducing mid-upper level management levels andyear at 10,470 employees in the sales force during 2017, which lowered variable compensation.Bank.
Administrative expenses increased 6.5%7.2% in the year ended December 31, 20182020 compared to the corresponding period in 2017,2019, mainly due to thehigher IT and communications costs, as many of our employees worked from home and new systems that would work remotely were implemented. The Bank also continued investmentto invest in technology transformingIT to develop the Bank’s digital platformsservices and back-office platform, which is allowing the branch networkBank to consolidate the branches and therefore creatingcreate efficiencies in the long term. In 2018, the Bank continuedlong-term. IT investments include: (i) SuperDigital, a mobile app, which provides non-banked clients access to roll-out our efficient Work Café spaces that are high tech / high touch branches with no human tellers or back offices, reaching a total of 40 by the end of the year. We also launched a new branch style for Select/Privatetransactional banking services with a teamdigital prepaid debit and credit card, (ii) Santander Life, a digital banking service that rewards clients for positive credit and saving behavior through the accumulation of investment experts“Merits”, which results in reduced interest rates on site to give personalized advice to our higher income clients. We also started to pilot ourloan products, (iii) Klare, a digital open platform being developed for selling insurances products, (iv) other digital processes for back office functions and (v) the opening and transformation of branches into the new WorkCafé 2.0 for smaller branches and incorporating artificial intelligence into interactions with clients. During 2018 we continued to reduceformat. As of December 31, 2020, the ATM network, focusing on extending the network within our branches or places with increased security measures. By the end of 2018 weBank had a total of 380358 branches, and 910 ATMs. In 2018, we also increased our cyber security expenditures59 of which totaled Ch$ 11,055 millionwere in 2018.the WorkCafé format. The table below provides a breakdown of the Bank’s branch network during the periods indicated.
| Year ended December 31, | % Change | Year ended December 31, | % Change | |||||||||||||||||||||
| 2018 | 2017 | 2018/2017 | 2020 | 2019 | 2020/2019 | |||||||||||||||||||
| Traditional branches | 287 | 307 | (6.5 | %) | 273 | 279 | (2.2 | %) | ||||||||||||||||
| Middle-market centers | 7 | 7 | — | % | 7 | 7 | 0.0 | % | ||||||||||||||||
| Santander Select | 46 | 51 | (9.8 | %) | 19 | 38 | (50.0 | %) | ||||||||||||||||
| Workcafés | 40 | 20 | 100.0 | % | ||||||||||||||||||||
| WorkCafés | 59 | 53 | 11.3 | % | ||||||||||||||||||||
| Total branches | 380 | 385 | (1.3 | %) | 358 | 377 | (5.0 | %) | ||||||||||||||||
| Total ATMs | 910 | 926 | (1.7 | %) | ||||||||||||||||||||
| Total ATMs (including depositary ATMs) | 1,199 | 1,088 | 10.2 | % | ||||||||||||||||||||
Depreciation and amortization expense increased 1.9%3.1% in 20182020 compared to 2017 and totaled Ch$79,280 million.2019. This expense is in line with continued greater investments in software, hardware and other equipment that the Bank has invested in as it continuedincrease was mainly due to innovate in its branch network and systems. Impairment charges decreased to Ch$39 million in 2018 compared to Ch$5,664 million in 2017 mainly related to less impairment associated to ATMs. In 2017, impairment expenses werea higher due greater impairments for obsolescencedepreciation of fixed assets in the period.
In 2020, impairment expenses totaled Ch$638 million, a 76.6% decrease compared to the previous year as there was a strong impairment of fixed assets as a result of the social unrest that affected Chile in October and technology projects of Ch$5,290 million.November 2019.
Other operating expenses were Ch$32,34277,806 million in 2018, a 52.7% decrease2020, an increase of 57.8% compared to 2017.2019. This was mainly due to lower operational charge-offs.higher provisions for contingencies due to the effects of COVID-19. This increase in other operating expenses also reflects the increase in insurance premiums the Bank must pay to cover for vandalism and cyber fraud losses. See “Note 35—Other Operating Income and Expenses” to our Audited Consolidated Financial Statements for more detail on Other operating expenses.
90
The following table sets forth, for the periods indicated, our personnel salaries, administrative and depreciation and amortization expenses broken down by business segment. These amounts exclude impairment and other operating expenses.
| Year ended December 31, | % Change | % Change | Year ended December 31, | % Change | ||||||||||||||||||||||||||||
| 2018 | 2017 | 2016 | 2018/2017 | 2017/2016 | 2020 | 2019 | 2020/2019 | |||||||||||||||||||||||||
| (in millions of Ch$) | (in millions of Ch$) | |||||||||||||||||||||||||||||||
| Retail banking | (553,157 | ) | (534,970 | ) | (529,909 | ) | 3.4 | % | 1.0 | % | (596,464 | ) | (575,511 | ) | 3.6 | % | ||||||||||||||||
| Middle-market | (92,377 | ) | (91,882 | ) | (83,412 | ) | 0.5 | % | 10.2 | % | (91,132 | ) | (97,054 | ) | (6.1 | %) | ||||||||||||||||
| Corporate Investment banking | (64,913 | ) | (62,685 | ) | (53,935 | ) | 3.6 | % | 16.2 | % | (72,715 | ) | (65,343 | ) | 11.3 | % | ||||||||||||||||
| Other | (11,486 | ) | (15,356 | ) | (19,649 | ) | (25.2 | %) | (21.8 | %) | (8,235 | ) | (11,953 | ) | (31.1 | %) | ||||||||||||||||
| Total personnel, administrative expenses, depreciation and amortization (1) | (721,933 | ) | (704,893 | ) | (686,905 | ) | 2.4 | % |
| 2.6 | % | |||||||||||||||||||||
| Total personnel, administrative expenses, depreciation and amortization(1) | (768,546 | ) | (749,861 | ) | 2.5 | % | ||||||||||||||||||||||||||
____________________
| (1) | Excludes impairment and other operating expenses. |
By business segment, the 2.4%2.5% increase in costs excluding impairment and other operating expenses in 20182020 compared to the corresponding period in 20172019 was mainly due to a rise in cost in the Retail and Corporate Investment Banking. CostsBanking segments. This rise in the Middle-market segment grew 0.5% in 2018 compared to 2017 due to higher spending in IT and 3.6% in the Corporate Investment Banking segment mainly due to transactional banking and cash management services that are intense in data processing.
Retail segment costs grew 3.4% in 2018 compared to 2017 due to higher spending in transforming branches to our new WorkCafé format, and investments in information technology for greater digital banking services.
Forwas driven by the years ended December 31, 2017 and 2016. Operating expenses in the year ended December 31, 2017 increased 3.0% compared to the corresponding period in 2016. The efficiency ratio was 43.3% in 2017, 44.9% in 2016 and 43.8% in 2015.
The 0.5% increase in personnel salaries andadministrative expenses was belowexplained above, which mainly impacted retail banking where the CPI inflationmajority of 2.3%, even though all salaries are indexed to inflation pursuant to the collective bargaining agreement. This was mainly due to the 2.5% reduction in headcount to 11,068 employees in December 2017, in line with the Bank’s strategy of reducing mid-upper level management levelsemployees work. Higher costs were also driven by higher IT investments across all business segments and the sales force.
Administrative expenses increased 1.6%costs of branch transformations in the year ended December 31, 2017 compared to the corresponding period in 2016, mainly due to IT investments to develop the Bank’s digital platform, which is allowing the Bank to consolidate the branches and create efficiencies in the long term. In 2016, the Bank began to transform the branch network, adopting two main formats (i) a multi-segment approach with smaller branches that are multi-segment with dedicated spaces for the different business segments (Select, SME Advance, Banefe, etc.) and (ii) our WorkCafé spaces that are high tech / high touch branches with no human tellers or back offices. This was also accompanied by the closure of less efficient branches, especially in the Santander Banefe network, which were completely eliminated by year-end 2017. This has led to a 11.3% decrease in the number of branches in the period. The Bank has also been reducing the ATM network from 1,295 to 926. This reduction has mainly been for ATMs outside of branches and is leading to less expenses for security and the transportation of cash by 17.7%.
Depreciation and amortization expense increased 19.1% in 2017 compared to 2016 and totaled Ch$77,823 million. This expense is in line with the greater investments in software, hardware and other equipment that the Bank has invested in as it modernizes its branch network and systems. This has also led to an increase in impairment charges to Ch$5,644 million in 2017 compared to Ch$234 million in 2016 mainly related to obsolete fixed asset in remodeled branches.
Other operating expenses were Ch$68,413 million in 2017, a 0.7% decrease compared to 2016. This was mainly due to lower operational charge-offs. See “Note 35—Other Operating Income and Expenses” to our Audited Consolidated Financial Statements for more detail on Other operating expenses.
By business segment, the 2.6% increase in costs excluding impairment and other operating expenses in 2017 compared to the corresponding period in 2016 was mainly due a rise in cost in the Middle-market and GCB. Costs in the Middle-market segment grew 10.2% in 2017 compared to 2016 and 16.2% in the Corporate Investment banking segment in line with business growth in this segment, especially in transactional banking and cash management services that are intense in data processing.
In Retail banking costs grew 1.0% due to lower average headcount and saving from the closure of branches and ATMs as well as efficiencies produced by greater digital banking services.banking.
Income tax
| Year ended December 31, | % Change | % Change | Year ended December 31, | % Change | ||||||||||||||||||||||||||||
| 2018 | 2017 | 2016 | 2018/2017 | 2017/2016 | 2020 | 2019 | 2020/2019 | |||||||||||||||||||||||||
| (in millions of Ch$) | (in millions of Ch$) | |||||||||||||||||||||||||||||||
| Net income before tax | 766,837 | 720,280 | 587,463 | 6.5 | % | 22.6 | % | 695,263 | 794,688 | (8.9 | %) | |||||||||||||||||||||
| Income tax expense | (167,144 | ) | (145,031 | ) | (109,031 | ) | 15.2 | % | 33.0 | % | (142,533 | ) | (175,074 | ) | (18.6 | %) | ||||||||||||||||
| Effective tax rate(1) | 21.8 | % | 20.1 | % | 18.6 | % | 20.5 | % | 22.0 | % | ||||||||||||||||||||||
____________________
| (1) | The effective tax rate is the income tax expense divided by net income before tax. |
For the years ended December 31, 2018 and 2017. Total income tax expense by the Bank in 2018 totaled2020 was Ch$167,144142,533 million, a 15.2% increasean 18.6% decrease compared to 2017.2019. Net income before tax decreased 8.9%. The Bank paid an effective tax rate of 21.8%20.5% in 20182020 compared to 20.1%22.0% in 2017.2019. The higherstatutory corporate tax rate in Chile in both 2020 and 2019 was 27%. The Bank usually pays a lower effective tax rate was mainly due to:
Forthan the years ended December 31, 2017statutory rate since in our Chilean tax books we must re-measure capital each year for the variation in CPI inflation and 2016. Total incomethis produces a tax expense byloss. In 2020 the Bank in 2017 totaled Ch$145,031 million,also booked a 33.0% increase compared to 2016. The Bank paid anlower effective tax rate of 20.1% in 2017 compared to 18.6% in 2016. The higher effective2019 due larger gains from the sale of Chilean Treasury instruments that are not subject to income tax. See “Note 16—Current and Deferred Taxes” of the Audited Consolidated Financial Statements for more detail on income tax rate was mainly due to:expense.
B. Liquidity and Capital Resources
Sources of Liquidity
Santander-Chile’s liquidity depends upon its (i) capital, (ii) reserves and (iii) financial investments, including investments in government securities. To cover any liquidity shortfalls and to augment its liquidity position, Santander-Chile has established lines of credit with foreign and domestic banks and also has access to Central Bank borrowings.
The following table sets forth our contractual obligations and commercial commitments by time remaining to maturity. As of the date of the filing of this Annual Report, the Bank does not have significant purchase obligations.
91
As of December 31, 2018,2020, the scheduled maturities of our contractual obligations and of other commercial commitments, including accrued interest, were as follows:
| Demand | Up to 1 month | Between 1 and 3 months | Between 3 and 12 months | Subtotal up to 1 year | Between 1 and 3 years | Between 3 and 5 years | More than 5 years | Subtotal after 1 year | Total | Demand | Up to 1 month | Between 1 and 3 months | Between 3 and 12 months | Subtotal up to 1 year | Between 1 and 3 years | Between 3 and 5 years | More than 5 years | Subtotal after 1 year | Total | |||||||||||||||||||||||||||||||||||||||||||||||||||
| As of December 31, 2018 | (in millions of Ch$) | |||||||||||||||||||||||||||||||||||||||||||||||||||||||||||||||||||||
| As of December 31, 2020 | (in millions of Ch$) | |||||||||||||||||||||||||||||||||||||||||||||||||||||||||||||||||||||
| Obligations under repurchase agreements | — | 48,545 | — | — | 48,545 | — | — | — | — | 48,545 | - | 969,808 | - | - | 969,808 | - | - | - | - | 969,808 | ||||||||||||||||||||||||||||||||||||||||||||||||||
| Checking accounts, time deposits and other time liabilities (1) | 9,027,434 | 5,248,418 | 4,108,556 | 3,326,199 | 21,710,607 | 191,547 | 6,137 | 63,988 | 261,672 | 21,972,279 | ||||||||||||||||||||||||||||||||||||||||||||||||||||||||||||
| Checking accounts, time deposits and other time liabilities(1) | 15,082,442 | 5,843,682 | 2,912,985 | 1,434,246 | 25,273,355 | 163,053 | 44,384 | 23,523 | 230,960 | 25,504,315 | ||||||||||||||||||||||||||||||||||||||||||||||||||||||||||||
| Financial derivatives contracts | — | 131,378 | 120,361 | 349,551 | 601,290 | 495,789 | 471,185 | 949,464 | 1,916,438 | 2,517,728 | - | 386,690 | 445,376 | 931,358 | 1,763,424 | 1,552,482 | 1,708,509 | 3,994,245 | 7,255,236 | 9,018,660 | ||||||||||||||||||||||||||||||||||||||||||||||||||
| Interbank borrowings | 39,378 | 16,310 | 404,575 | 1,188,692 | 1,648,955 | 139,671 | — | — | 139,671 | 1,788,626 | 16,832 | 238,414 | 222,992 | 855,434 | 1,333,672 | 1,140,426 | 3,854,501 | - | 4,994,927 | 6,328,599 | ||||||||||||||||||||||||||||||||||||||||||||||||||
| Issue debt instruments | — | 71,465 | 39,267 | 745,830 | 856,562 | 2,431,849 | 1,549,743 | 3,277,079 | 7,258,671 | 8,115,233 | - | 344,732 | 447,117 | 343,155 | 1,135,005 | 1,813,341 | 2,499,560 | 2,756,271 | 7,069,172 | 8,204,177 | ||||||||||||||||||||||||||||||||||||||||||||||||||
| Other financial liabilities (2) | 179,681 | 934 | 2,412 | 22,844 | 205,871 | 9,261 | 92 | 176 | 9,529 | 215,400 | ||||||||||||||||||||||||||||||||||||||||||||||||||||||||||||
| Obligations for lease agreements | - | - | - | 25,526 | 25,526 | 44,933 | 35,679 | 43,447 | 124,059 | 149,585 | ||||||||||||||||||||||||||||||||||||||||||||||||||||||||||||
| Other financial liabilities(2) | 144,478 | 38,148 | 1,375 | 27 | 184,028 | 89 | 105 | 96 | 290 | 184,318 | ||||||||||||||||||||||||||||||||||||||||||||||||||||||||||||
| Subtotal | 9,246,493 | 5,517,050 | 4,675,171 | 5,633,116 | 25,071,830 | 3,268,117 | 2,027,157 | 4,290,707 | 9,585,981 | 34,657,811 | 15,243,752 | 7,821,474 | 4,029,845 | 3,589,746 | 30,684,818 | 4,714,324 | 8,142,738 | 6,817,582 | 19,674,644 | 50,359,462 | ||||||||||||||||||||||||||||||||||||||||||||||||||
| Contractual interest payments (3) | 4,918 | 82,292 | 158,760 | 812,920 | 1,058,890 | 1,156,262 | 1,110,918 | 1,537,385 | 3,804,565 | 4,863,455 | ||||||||||||||||||||||||||||||||||||||||||||||||||||||||||||
| Contractual interest payments(3) | 86,195 | 18,938 | 72,710 | 242,462 | 420,305 | 143,531 | 137,902 | 25,676 | 307,109 | 727,413 | ||||||||||||||||||||||||||||||||||||||||||||||||||||||||||||
| Total | 9,251,411 | 5,599,342 | 4,833,931 | 6,446,036 | 26,130,720 | 4,424,379 | 3,138,075 | 5,828,092 | 13,390,546 | 39,521,266 | 15,329,947 | 7,840,412 | 4,102,555 | 3,832,209 | 31,105,122 | 4,857,855 | 8,280,640 | 6,843,258 | 19,981,753 | 51,086,875 | ||||||||||||||||||||||||||||||||||||||||||||||||||
____________________
(1) | Includes demand deposits and other demand liabilities, cash items in process of being cleared and time deposits and other time liabilities. |
| (2) | Mainly includes amounts owed to credit card processors and to the Chilean Production Development Corporation (Corporación de Fomento de la Producción de Chile), the state development agency. |
| (3) | The table above includes future cash interest payments. For variable rate obligations, we assume the same rate as the last rate known. Various of the payment obligations in the table above are variable debt instruments, since they are denominated in UF, for which we have estimated a long-term inflation rate equal to 3%, which is at the center of the Central Bank’s long-term inflation target. No exclusions requiring further explanation have been made in this table. |
Operational LeasesObligations for lease agreements
Certain bank premises and equipment are leased under various operating leases. Future minimum rental commitmentsand the scheduled maturities of obligations for lease agreements as of December 31, 2018 under non-cancelable leases are2020 were as follows:
| As of December 31, | ||||
| (in millions of Ch$) | ||||
| Due within 1 year | ||||
| Due after 1 year but within 2 years | ||||
| Due after 2 years but within 3 years | ||||
| Due after 3 years but within 4 years | ||||
| Due after 4 years but within 5 years | ||||
| Due after 5 years | ||||
| Total | ||||
Other Commercial Commitments
As of December 31, 2018,2020, the scheduled maturities of other commercial commitments, including accrued interest, were as follows:
| Up to 1 month | Between 1 and 3 months | Between 3 and 12 months | Between 1 and 5 years | More than 5 years | Total | |||||||||||||||||||
| Other Commercial Commitments | (in millions of Ch$) | |||||||||||||||||||||||
| Performance guarantee | 114,653 | 181,399 | 437,835 | 303,165 | 46,971 | 6,620 | ||||||||||||||||||
| Foreign letters of credit confirmed | 18,247 | 48,056 | 16,163 | 313 | — | — | ||||||||||||||||||
| Letters of credit issued | 42,089 | 83,764 | 36,201 | 3,065 | — | — | ||||||||||||||||||
| Personal guarantees | 33,588 | 29,958 | 367,164 | 10,798 | — | — | ||||||||||||||||||
| Total other commercial commitments | 208,577 | 343,177 | 857,363 | 317,341 | 46,971 | 6,620 | ||||||||||||||||||
| Other Commercial Commitments | Up to 1 month | Between 1 and 3 months | Between 3 and 12 months | Between 1 and 5 years | More than 5 years | Total | ||||||||||||||||||
| (in millions of Ch$) | ||||||||||||||||||||||||
| Performance guarantee | 663,642 | 188,147 | 905,554 | 163,506 | 33,356 | 1,954,205 | ||||||||||||||||||
| Foreign letters of credit confirmed | 3,842 | 9,128 | 33,177 | 10,891 | — | 57,038 | ||||||||||||||||||
| Letters of credit issued | 12,469 | 110,970 | 54,015 | 45,937 | 29 | 223,420 | ||||||||||||||||||
| Personal guarantees | 22,128 | 63,230 | 41,637 | 6,628 | — | 133,623 | ||||||||||||||||||
| Total other commercial commitments | 702,081 | 371,475 | 1,034,383 | 226,962 | 33,385 | 2,368,286 | ||||||||||||||||||
92
Risk-Weighted Assets and Regulatory Capital
We currently have regulatory capital in excess of the minimum requirement under the current Chilean regulations. According to the General Banking Law, a bank is required to have regulatory capital of at least 8.0% of its risk-weighted assets, net of required loan loss allowances, and paid-in capital and reserves (i.e.(i.e., core capital) of at least 3.0% of its total assets, net of required loan loss allowances. For these purposes, the regulatory capital of a bank is the sum of: (1) the bank’s core capital; (2) subordinated bonds issued by the bank valued at their placement price for an amount up to 50.0% of its core capital, provided that the value of the bonds is required to be decreased by 20.0% for each year that elapses during the period commencing six years prior to their maturity; and (3) its voluntary allowances for loan losses, for an amount of up to 1.25% of its risk-weighted assets. Santander-Chile does not have goodwill, but if it did, this value would be required to be deducted from regulatory capital. When calculating risk weighted assets, we also include off-balance sheet contingent loans. The merger of Old Santander Chile and Santiago on August 1, 2002 required a special regulatory pre-approval of the SBIF (predecessor of the FMC), which was granted on May 16, 2002. The resolution granting this pre-approval imposed a regulatory capital to risk weighted assets ratio of 12.0% for the merged bank. This requirement was reduced to 11.0% by the SBIF effective January 1, 2005. For purposes of weighing the risk of a bank’s assets, the General Banking Law considers five different categories of assets, based on the nature of the issuer, the availability of funds, and the nature of the assets and the existence of collateral securing such assets.
The following table sets forth our consolidated and risk-weighted assets and regulatory capital as of December 31, 20182020 and 20172019 as required by Chilean regulation.
| Consolidated assets as of | Risk-weighted assets(1) | Consolidated assets as of | Risk-weighted assets(1) | |||||||||||||||||||||||||||||
| December 31, 2018 | December 31, 2017 | December 31, 2018 | December 31, 2017 | December 31, 2020 | December 31, 2019 | December 31, 2020 | December 31, 2019 | |||||||||||||||||||||||||
| (Ch$ million) | (Ch$ million) | |||||||||||||||||||||||||||||||
| Asset Balance (Net of allowances) | ||||||||||||||||||||||||||||||||
| Cash and deposits in bank | 2,065,441 | 1,452,922 | — | — | 2,803,228 | 3,554,520 | — | — | ||||||||||||||||||||||||
| Unsettled transactions | 353,757 | 668,145 | 105,421 | 300,302 | 452,963 | 355,062 | 173,466 | 112,948 | ||||||||||||||||||||||||
| Trading investments | 77,041 | 485,736 | 10,704 | 25,031 | 133,718 | 270,204 | 14,655 | 26,825 | ||||||||||||||||||||||||
| Investments under resale agreements | — | — | — | — | — | — | — | — | ||||||||||||||||||||||||
| Financial derivative contracts(2) | 1,226,892 | 1,014,070 | 868,578 | 718,426 | ||||||||||||||||||||||||||||
| Financial derivative contracts(2) | 2,742,701 | 1,355,786 | 1,602,495 | 964,623 | ||||||||||||||||||||||||||||
| Interbank loans | 15,065 | 162,599 | 15,064 | 162,598 | 18,920 | 14,833 | 15,250 | 14,833 | ||||||||||||||||||||||||
| Loans and accounts receivables from customers | 29,470,370 | 26,747,542 | 25,403,426 | 23,102,177 | 33,413,429 | 31,823,735 | 26,651,340 | 27,316,050 | ||||||||||||||||||||||||
| Available-for-sale investments | 2,394,323 | 2,574,546 | 172,859 | 147,894 | 7,162,542 | 4,010,272 | 618,908 | 258,958 | ||||||||||||||||||||||||
| Investments in other companies | 32,293 | 27,585 | 32,293 | 27,585 | 10,770 | 10,467 | 10,770 | 10,467 | ||||||||||||||||||||||||
| Intangibles assets | 66,923 | 63,219 | 66,923 | 63,219 | 82,537 | 73,389 | 82,537 | 73,389 | ||||||||||||||||||||||||
| Property, plant and equipment | 253,586 | 242,547 | 253,586 | 242,547 | 187,240 | 197,833 | 187,240 | 197,833 | ||||||||||||||||||||||||
| 201,611 | 210,500 | 201,611 | 210,500 | |||||||||||||||||||||||||||||
| Current taxes | — | — | — | — | — | 11,648 | �� | 1,165 | ||||||||||||||||||||||||
| Deferred taxes | 382,934 | 385,608 | 38,293 | 38,561 | 538,118 | 462,867 | 53,812 | 46,287 | ||||||||||||||||||||||||
| Other assets | 984,988 | 755,184 | 983,299 | 722,617 | 1,236,376 | 1,434,308 | 1,233,016 | 1,421,361 | ||||||||||||||||||||||||
| Off-balance sheet assets | ||||||||||||||||||||||||||||||||
| Contingent loans | 4,624,073 | 4,133,897 | 2,649,730 | 2,360,877 | 4,378,214 | 4,938,194 | 2,615,644 | 2,823,713 | ||||||||||||||||||||||||
| Total | 41,947,686 | 38,713,600 | 30,600,176 | 27,911,834 | 53,362,428 | 48,723,618 | 33,460,744 | 33,478,952 | ||||||||||||||||||||||||
| Ratio | ||||||||||||||||
| December 31, 2020 | December 31, 2019 | December 31, 2020 | December 31, 2019 | |||||||||||||
| (Ch$ million) | (in %) | |||||||||||||||
| Core capital(3) | 3,567,916 | 3,390,823 | 6.69 | 6.96 | ||||||||||||
| Regulatory capital(4) | 5,134,843 | 4,304,401 | 15.37 | 12.86 | ||||||||||||
| Ratio | |||||||||||||||||
| December 31, 2018 | December 31, 2017 | December 31, 2018 | December 31, 2017 | ||||||||||||||
| (Ch$ million) | % | % | |||||||||||||||
| Core capital(3) | 3,239,546 | 3,066,180 | 7.72 | 7.92 | |||||||||||||
| Regulatory capital(4) | 4,101,664 | 3,881,252 | 13.40 | 13.91 | |||||||||||||
____________________
| (1) | As required by local regulations. |
| (2) | Derivatives are shown as required by Chapter 12-1 RAN of Chilean Bank GAAP guidelines |
| (3) | As a percentage of total assets. |
| (4) | As a percentage of risk weighted assets (BIS ratio). |
Under the New General Banking Law, minimum capital requirements have increased in terms93
The FMC, with agreement from the BCCh, may impose additional capital requirements for Systemically Important Banks (“SIB”) of between 1-3.5% of risk-weighted assets. Notably, the BCCh may require: (1) the addition of up to 2% to the core capital to total assets ratios; (2) a reduction in the technical reserve requirement trigger from 2.5 times regulatory capital to 1.5 times regulatory capital; and/or (3) a reduction in the interbank loan limit to 20% of regulatory capital of any SIB. While the FMC has not yet established the criteria to assess which banks will be considered SIBs, it is probable that we will be classified an SIB.
Financial Investments
As of January 1, 2018 the Bank adopted IFRS 9 as follows:
On initial recognition, financial assets and financial liabilities are measured at the transaction price, i.e. the fair value of the consideration given or received (IFRS 13). In the case of financial instruments not at fair value through profit or loss, transaction costs are directly attributable to the acquisition or issue of the financial asset or financial liability. After initial recognition, an entity shall measure a financial liability at amortized cost and an entity shall measure a financial asset at:
(a)Amortized costCost
Financial assets that are held in a business model to collect the contractual cash flows and contain contractual terms that give rise on specific dates to cash flows that are SPPI, are measured at amortized cost.
The effective interest method is used in the calculation of the amortized cost of a financial asset or a financial liability and in the allocation and recognition of the interest revenue or interest expense in profit or loss over the relevant period. The effective interest rate (“EIR”) is the rate that exactly discounts estimated future cash payments or receipts through the expected life of the financial asset or financial liability to the gross carrying amount of a financial asset or to the amortized cost of a financial liability.
(b)Fair valueValue through other comprehensive incomeOther Comprehensive Income (FVOCI)
Financial assets that are debt instruments held in a business model that is achieved by both collecting contractual cash flow and selling, and that contain contractual terms that give rise on specific dates to cash flows that are SPPI, are measured at FVOCI. They are subsequently remeasured at fair value and changes therein (except for those relating to impairment, interest income and foreign currency exchange gains and losses) are recognized in other comprehensive income, until the assets are sold. Upon disposal, the cumulative gain and losses in OCI are recognized in the income statement.
(c)Fair valueValue through profitProfit or lossLoss (FVTPL)
Financial assets that do not contain contractual terms that give rise on specified dates to cash flows that are SPPI, or if the financial assets, or if the financial asset is not held in a business model that is either (i) a business model to collect the contractual cash flows or (ii) a business model that is achieved by both collecting contractual cash flows and selling.
Financial assets held for trading are recognized at fair value through profit or loss, likewise derivatives contracts for trading purposes.
(d)Equity instrumentsInstruments
For certain equity instruments, the Bank may make an irrevocable election to present subsequent changes in the fair value of the instrument in other comprehensive income, except for dividend income which is recognized in profit or loss. Gains or losses on derecognition of these equity instruments are not transferred to profit or loss.
94
Prior to January 1, 2018 the Bank classified financial instruments in accordance with IAS 39 as follows:
Financial assets are classified into the following specified categories: trading investments at fair value through profit or loss (FVTPL), ‘held to maturity investments’, ‘available for sale investments (AFS)’ and ‘loans and accounts receivable from customers’. The classification depends on the nature and purpose of the financial assets and is determined at the time of initial recognition. All regular purchases or sales of financial assets are recognized and derecognized on a trade basis. Regular way purchases or sales of financial assets require delivery of the asset within the time frame established by regulation or convention in the marketplace.
Effective interest methodInterest Method
The effective interest method is a method of calculating the amortized cost of a debt instrument and of allocating interest income over the relevant period. The effective interest rate is the rate that exactly discounts estimated future cash receipts (including all fees and points paid or received that form an integral part of the effective interest rate, transaction costs and other premiums or discounts) through the expected life of the debt instrument, or, where appropriate, a shorter period, to the net carrying amount on initial recognition.
Income is recognized on an effective interest basis for debt instruments other than those financial assets classified as at fair value through profit or loss.
Financial assetsAssets at FVTPL — Trading investments
Financial assets are classified as at FVTPL when the financial asset is either held for trading or it is designated as at fair value through profit or loss.
A financial asset is classified as held for trading if:
| it has been acquired principally for the purpose of selling it in the near term; or |
| on initial recognition it is part of a portfolio of identified financial instruments that the Bank manages together and has a recent actual pattern of short-term profit-taking; or |
| it is a derivative that is not designated and effective as a hedging instrument. |
A financial asset other than a financial asset held for trading may be designated as at FVTPL upon initial recognition if:
| such designation eliminates or significantly reduces a measurement or recognition inconsistency that would otherwise arise; or |
| the financial asset forms part of a group of financial assets or financial liabilities or both, which is managed and its performance is evaluated on a fair value basis, in accordance with the Bank’s documented risk management or investment strategy, and information about the grouping is provided internally on that basis; or |
| it forms part of a contract containing one or more embedded derivatives, and IAS 39 permits the entire combined contract to be designated as at FVTPL. |
Financial assets at FVTPL are stated at fair value, with any gains or losses arising on remeasurement recognized in profit or loss. The net gain or loss recognized in profit or loss incorporates any dividend or interest earned on the financial asset and is included in the ‘net income (expense) from financial operations’ line item.
Held to maturity investmentsMaturity Investments
Held-to-maturity investments are non-derivative financial assets with fixed or determinable payments and fixed maturity dates that the Bank has the positive intent and ability to hold to maturity. Subsequent to initial recognition, held-to-maturity investments are measured at amortized cost using the effective interest method less any impairment.
Available-for-sale investments95
Available-for-Sale Investments (AFS investments)Investments)
AFS investments are non-derivatives that are either designated as AFS or are not classified as (a) loans and accounts receivable from customers, (b) held-to-maturity investments or (c) financial assets at fair value through profit or loss (trading investments).
Financial instruments held by the Bank that are traded in an active market are classified as AFS and are stated at fair value at the end of each reporting period. The Bank also has investments in financial instruments that are not traded in an active market but that are also classified as AFS investments and stated at fair value at the end of each reporting period (because the directors consider that fair value can be reliably measured). Changes in the carrying amount of AFS monetary financial assets relating to changes in foreign currency rates, interest income calculated using the effective interest method and dividends on AFS equity investments are recognized in profit or loss. Other changes in the carrying amount of available-for-sale investments are recognized in other comprehensive income and accumulated under the heading of Valuation Adjustment. When the investment is disposed of or is determined to be impaired, the cumulative gain or loss previously accumulated in the investments revaluation reserve is reclassified to profit or loss.
Dividends on AFS equity instruments are recognized in profit or loss when the Bank’s right to receive the dividends is established.
The fair value of AFS monetary financial assets denominated in a foreign currency is determined in that foreign currency and converted to Chilean pesos using the market rate. The foreign exchange gains and losses that are recognized in profit or loss are determined based on the amortized cost of the monetary asset.
AFS equity investments that do not have a quoted market price in an active market and whose fair value cannot be reliably measured and derivatives that are linked to and must be settled by delivery of such unquoted equity investments are measured at cost less any identified impairment losses at the end of each reporting period.
Detail regarding the financial investments discussed above is presented below.
a) Financial Assets Held For Trading / Trading Investments
| As of December 31, | ||||||||||||
| 2018 | 2017 | 2016 | ||||||||||
| (in millions of Ch$) | ||||||||||||
| Central Bank and Government Securities | ||||||||||||
| Chilean Central Bank bonds | 22,947 | 272,272 | 158,686 | |||||||||
| Other Chilean Central Bank and government securities | 48,211 | 209,370 | 237,325 | |||||||||
| Subtotal | 71,158 | 481,642 | 396,011 | |||||||||
| Other Chilean Securities | ||||||||||||
| Chilean corporate bonds | — | — | 976 | |||||||||
| Subtotal | — | — | 976 | |||||||||
| Foreign securities | ||||||||||||
| Other foreign financial instruments | 5,883 | — | — | |||||||||
| Subtotal | 5,883 | — | — | |||||||||
| Investments in mutual funds | — | 4,094 | — | |||||||||
| Subtotal | — | 4,094 | — | |||||||||
| Total | 77,041 | 485,736 | 396,987 | |||||||||
| As of December 31, | ||||||||||||
| 2020 | 2019 | 2018 | ||||||||||
| (in millions of Ch$) | ||||||||||||
| Central Bank and Government Securities | ||||||||||||
| Chilean Central Bank bonds | 419 | 1,952 | 22,947 | |||||||||
| Other Chilean Central Bank and government securities | — | 268,252 | 48,211 | |||||||||
| Subtotal | 131,827 | 270,204 | 71,158 | |||||||||
| Other Chilean Securities | ||||||||||||
| Chilean corporate bonds | 1,472 | — | — | |||||||||
| Subtotal | 1,472 | — | — | |||||||||
| Foreign securities | ||||||||||||
| Other foreign financial instruments | — | — | 5,883 | |||||||||
| Subtotal | — | — | 5,883 | |||||||||
| Investments in mutual funds | — | — | — | |||||||||
| Subtotal | — | — | — | |||||||||
| Total | 133,718 | 270,204 | 77,041 | |||||||||
b) Debt instruments at fair value through other comprehensive income (FVOCI) - under IFRS 9
As of December 31, 2020, 2019 and 2018, the debt instruments at fair value through other comprehensive income (FVOCI) in accordance with IFRS 9 isare as follows:
96
Available-for-sale Instruments – under IAS 39
For periods prior to January 1, 2018, the Bank valued available for sale instruments in accordance with IAS 39.
| As of December 31, | ||||||||
| 2017 | 2016 | |||||||
| (in millions of Ch$) | ||||||||
| Central Bank and Government Securities | ||||||||
| Chilean Central Bank bonds | 816,331 | 468,386 | ||||||
| Chilean Central Bank notes | 330,952 | 1,222,283 | ||||||
| Other Chilean Central Bank and government securities | 1,115,518 | 52,805 | ||||||
| Subtotal | 2,262,801 | 1,743,474 | ||||||
| As of December 31, | ||||||||
| 2017 | 2016 | |||||||
| (in millions of Ch$) | ||||||||
| Other Chilean Securities | ||||||||
| Time deposits in Chilean financial institutions | 2,361 | 893,000 | ||||||
| Mortgage bonds of Chilean financial institutions | 22,312 | 25,488 | ||||||
| Chilean financial institution bonds | — | — | ||||||
| Chilean corporate bonds | — | — | ||||||
| Other Chilean securities | 3,000 | — | ||||||
| Subtotal | 27,673 | 918,488 | ||||||
| Foreign Financial Securities | ||||||||
| Central Bank and Government Foreign Securities | 132,822 | 387,146 | ||||||
| Other Foreign financial securities | 151,250 | 339,798 | ||||||
| Subtotal | 284,072 | 726,944 | ||||||
| Total | 2,574,546 | 3,388,906 | ||||||
c) Held-to-maturity
No financial investments were classified as held-to-maturity asTable of December 31, 2017 and 2016.Contents
| As of December 31, | ||||||||||||
| 2020 | 2019 | 2018 | ||||||||||
| (in millions of Ch$) | ||||||||||||
| Chilean central bank and government securities | ||||||||||||
| Chilean central bank bonds | — | 272,802 | 657,096 | |||||||||
| Chilean central bank notes | 1,008,450 | 1,186,724 | 56,719 | |||||||||
| Other Chilean central bank and government securities | 5,344,910 | 1,908,031 | 1,207,221 | |||||||||
| Subtotal | 6,353,360 | 3,367,557 | 1,921,036 | |||||||||
| of which sold under repurchase agreement | 969,409 | 379,294 | 16,109 | |||||||||
| Other Chilean securities | ||||||||||||
| Time deposits in Chilean financial institutions | 299 | 398 | 2,693 | |||||||||
| Mortgage finance bonds of Chilean financial institutions | 14,022 | 16,748 | 19,227 | |||||||||
| Other instruments issued in the country | 2,410 | 2,410 | 2,907 | |||||||||
| Subtotal | 16,731 | 19,556 | 24,827 | |||||||||
| of which sold under repurchase agreement | 399 | 131 | 128 | |||||||||
| Foreign financial securities | ||||||||||||
| Foreign Central Banks and Government securities | 269,803 | 197,685 | 280,622 | |||||||||
| Other foreign financial securities | 522,648 | 425,474 | 167,838 | |||||||||
| Subtotal | 792,451 | 623,159 | 448,460 | |||||||||
| of which sold under repurchase agreement | — | — | — | |||||||||
| Total | 7,162,542 | 4,010,272 | 2,394,323 | |||||||||
Analysis of investments
The following table sets forth an analysis of our investments as of December 31, 20182020 by remaining maturity and the weighted average nominal rates of such investments.
| As of December 31, 2018 | Within one year | Weighted average Nominal Rate | After one year but within five years | Weighted average Nominal Rate | After five years but within ten years | Weighted average Nominal Rate | After ten years | Weighted average Nominal Rate | Total | Weighted average Nominal Rate | |||||||||||||||||||||||||||||||||||||||||||||||||||||||||||||
| (in millions of Ch$, except rates) | Within one year | Weighted average Nominal Rate | After one year but within five years | Weighted average Nominal Rate | After five years but within ten years | Weighted average Nominal Rate | After ten years | Weighted average Nominal Rate | Total | Weighted average Nominal Rate | |||||||||||||||||||||||||||||||||||||||||||||||||||||||||||||
| As of December 31, 2020 | (in millions of Ch$, except rates) | ||||||||||||||||||||||||||||||||||||||||||||||||||||||||||||||||||||||
| Financial Assets Held For Trading / Trading Investments | |||||||||||||||||||||||||||||||||||||||||||||||||||||||||||||||||||||||
| Central Bank and Government Securities | |||||||||||||||||||||||||||||||||||||||||||||||||||||||||||||||||||||||
| Central Bank bonds | 673 | 0.3 | 22,242 | 0.3 | — | — | 32 | 0.2 | 22,947 | 0.3 | 349 | 0.33 | 70 | 0.83 | — | — | — | — | 419 | 0.41 | |||||||||||||||||||||||||||||||||||||||||||||||||||
| Central Bank notes | — | — | — | — | — | — | — | — | — | — | — | — | — | — | — | — | — | — | — | — | |||||||||||||||||||||||||||||||||||||||||||||||||||
| Central Bank and government securities | 12,033 | 0.2 | 14,169 | 0.2 | 891 | 0.2 | 21,118 | 0.4 | 48,211 | 0.3 | 3,460 | 1.32 | 17,348 | 1.25 | 105,813 | 1.88 | 5,206 | 3.20 | 131,827 | 1.84 | |||||||||||||||||||||||||||||||||||||||||||||||||||
| Subtotal | 12,706 | 36,410 | 891 | 21,150 | 71,158 | 3,809 | 0.00 | 17,418 | 0.00 | 105,813 | 0.00 | 5,206 | 0.00 | 132,246 | 0.00 | ||||||||||||||||||||||||||||||||||||||||||||||||||||||||
| Other Chilean Securities | — | — | — | — | — | — | — | — | — | — | |||||||||||||||||||||||||||||||||||||||||||||||||||||||||||||
| Time deposits in Chilean financial institutions | — | — | — | — | — | — | — | — | — | — | — | — | — | — | — | — | — | — | — | — | |||||||||||||||||||||||||||||||||||||||||||||||||||
| Mortgage bonds of Chilean financial institutions | — | — | — | — | — | — | — | — | — | — | — | — | — | — | — | — | — | — | — | — | |||||||||||||||||||||||||||||||||||||||||||||||||||
| Chilean financial institutions bonds | — | — | — | — | — | — | — | — | — | — | — | — | — | — | — | — | — | — | — | — | |||||||||||||||||||||||||||||||||||||||||||||||||||
| Chilean corporate bonds | — | — | — | — | — | — | — | — | — | — | — | — | 1,472 | 3.50 | — | — | — | — | 1,472 | 3.50 | |||||||||||||||||||||||||||||||||||||||||||||||||||
| Other Chilean securities | — | — | — | — | — | — | — | — | — | — | — | — | — | — | — | — | — | — | — | — | |||||||||||||||||||||||||||||||||||||||||||||||||||
| Subtotal | — | — | — | — | — | — | — | 1,472 | — | — | — | — | — | 1,472 | — | ||||||||||||||||||||||||||||||||||||||||||||||||||||||||
| Foreign Financial Securities | — | — | — | — | — | — | — | — | — | — | |||||||||||||||||||||||||||||||||||||||||||||||||||||||||||||
| Other foreign financial instruments | — | — | — | — | 5,883 | 0.5 | — | — | 5,883 | 0.5 | — | — | — | — | — | — | — | — | — | — | |||||||||||||||||||||||||||||||||||||||||||||||||||
| Subtotal | — | — | 5,883 | — | 5,883 | ||||||||||||||||||||||||||||||||||||||||||||||||||||||||||||||||||
| Investment in mutual funds | |||||||||||||||||||||||||||||||||||||||||||||||||||||||||||||||||||||||
| Mutual funds administered by related parties | — | — | — | — | — | — | — | — | — | — | |||||||||||||||||||||||||||||||||||||||||||||||||||||||||||||
| Subtotal | — | — | — | — | — | ||||||||||||||||||||||||||||||||||||||||||||||||||||||||||||||||||
| Total | 12,706 | 36,410 | 6,774 | 21,150 | 77,041 | ||||||||||||||||||||||||||||||||||||||||||||||||||||||||||||||||||
97
| As of December 31, 2018 | Within one year | Weighted average Nominal Rate | After one year but within five years | Weighted average Nominal Rate | After five years but within ten years | Weighted average Nominal Rate | After ten years | Weighted average Nominal Rate | Total | Weighted average Nominal Rate | ||||||||||||||||||||||||||||||
| (in millions of Ch$, except rates) | ||||||||||||||||||||||||||||||||||||||||
| Debt instruments at FVOCI | ||||||||||||||||||||||||||||||||||||||||
| Central Bank and Government Securities | ||||||||||||||||||||||||||||||||||||||||
| Central Bank bonds | — | — | 657,096 | 2.3 | — | — | — | — | 657,096 | 2.3 | ||||||||||||||||||||||||||||||
| Central Bank notes | 56,719 | 0.3 | — | — | — | — | — | — | 56,719 | 0.3 | ||||||||||||||||||||||||||||||
| Central Bank and government securities | — | — | 622,294 | 2.9 | 365,424 | 4.1 | 219,503 | 4.0 | 1,207,221 | 3.5 | ||||||||||||||||||||||||||||||
| Subtotal | 56,719 | 1,279,390 | 365,424 | 219,503 | 1,921,036 | |||||||||||||||||||||||||||||||||||
| Other Chilean Securities | ||||||||||||||||||||||||||||||||||||||||
| Time deposits in Chilean financial institutions | 2,693 | — | — | — | — | — | — | — | 2,693 | 3.3 | ||||||||||||||||||||||||||||||
| Mortgage bonds of Chilean financial institutions | 40 | 3.9 | 2,711 | 4.0 | 13,377 | 3.5 | 3,100 | 3.9 | 19,227 | 3.7 | ||||||||||||||||||||||||||||||
| Chilean financial institutions bonds | — | — | — | — | — | — | — | — | — | — | ||||||||||||||||||||||||||||||
| Chilean corporate bonds | — | — | — | — | — | — | — | — | — | — | ||||||||||||||||||||||||||||||
| Other Chilean securities | — | — | — | — | — | — | 2,907 | — | 2,907 | — | ||||||||||||||||||||||||||||||
| Subtotal | 2,733 | 2,711 | 13,377 | 6,007 | 24,827 | |||||||||||||||||||||||||||||||||||
| Other financial securities | ||||||||||||||||||||||||||||||||||||||||
| Central Bank and Government Foreign Securities | — | — | 103,310 | — | 177,312 | — | — | — | 280,622 | — | ||||||||||||||||||||||||||||||
| Other Foreign financial securities | — | — | — | 2.8 | 167,838 | 3.1 | — | — | 167,838 | 3.1 | ||||||||||||||||||||||||||||||
| Subtotal | — | 103,310 | 345,150 | — | 448,460 | |||||||||||||||||||||||||||||||||||
| Total | 59,452 | 1,385,411 | 723,951 | 225,510 | 2,394,323 | |||||||||||||||||||||||||||||||||||
Within one year | Weighted average Nominal Rate | After one year but within five years | Weighted average Nominal Rate | After five years but within ten years | Weighted average Nominal Rate | After ten years | Weighted average Nominal Rate | Total | Weighted average Nominal Rate | |||||||||||||||||||||||||||||||
| As of December 31, 2020 | (in millions of Ch$, except rates) | |||||||||||||||||||||||||||||||||||||||
| Subtotal | — | — | — | — | — | — | — | — | — | — | ||||||||||||||||||||||||||||||
| Investment in mutual funds | — | — | — | — | — | — | — | — | — | — | ||||||||||||||||||||||||||||||
| Mutual funds administered by related parties | — | 0.03 | — | — | — | — | — | — | — | — | ||||||||||||||||||||||||||||||
| Subtotal | — | — | — | — | — | — | — | — | — | — | ||||||||||||||||||||||||||||||
| Total | — | — | — | — | — | — | — | — | — | — | ||||||||||||||||||||||||||||||
| Debt instruments at FVOCI | ||||||||||||||||||||||||||||||||||||||||
| Central Bank bonds | — | — | — | — | — | — | — | — | — | — | ||||||||||||||||||||||||||||||
| Central Bank notes | 1,008,450 | 0.02 | — | — | — | — | — | — | 1,008,450 | 0.02 | ||||||||||||||||||||||||||||||
| Central Bank and government securities | 92,295 | 0.43 | 2,332,326 | 1.18 | 2,920,289 | 1.67 | — | — | 5,344,910 | 1.44 | ||||||||||||||||||||||||||||||
| Subtotal | 1,100,744 | — | 2,332,326 | — | 2,920,289 | — | — | — | 6,353,360 | — | ||||||||||||||||||||||||||||||
| Other Chilean Securities | — | — | — | — | — | — | — | — | — | — | ||||||||||||||||||||||||||||||
| Time deposits in Chilean financial institutions | 299 | 0.24 | — | — | — | — | — | — | 299 | 0.24 | ||||||||||||||||||||||||||||||
| Mortgage bonds of Chilean financial institutions | 20 | 3.98 | 4,440 | 3.72 | 7,204 | 3.49 | 2,359 | 3.91 | 14,022 | 3.63 | ||||||||||||||||||||||||||||||
| Chilean financial institutions bonds | — | — | — | — | — | — | — | — | — | — | ||||||||||||||||||||||||||||||
| Chilean corporate bonds | — | — | — | — | — | — | — | — | — | — | ||||||||||||||||||||||||||||||
| Other Chilean securities | 193 | 0.05 | — | — | — | — | 2,217 | — | 2,410 | 0.05 | ||||||||||||||||||||||||||||||
| Subtotal | 512 | — | 4,440 | — | 7,204 | — | 4,576 | — | 16,731 | — | ||||||||||||||||||||||||||||||
| Other financial securities | — | — | — | — | — | — | — | — | — | — | ||||||||||||||||||||||||||||||
| Central Bank and Government Foreign Securities | — | — | — | — | 269,803 | — | — | — | 269,803 | — | ||||||||||||||||||||||||||||||
| Other Foreign financial securities | 94,122 | 0.20 | 248,001 | 2.45 | 180,525 | 2.60 | — | — | 522,648 | 2.27 | ||||||||||||||||||||||||||||||
| Subtotal | 94,122 | — | 248,001 | — | 450,328 | — | — | — | 792,451 | — | ||||||||||||||||||||||||||||||
| Total | 1,195,378 | — | 2,584,767 | — | 3,377,820 | — | 4,576 | — | 7,162,542 | — | ||||||||||||||||||||||||||||||
Working Capital
As a bank, we satisfy our working capital needs through general funding, the majority of which derives from deposits and other borrowings from the public. (See “Item 5. Operating and Financial Review and Prospects—B. Liquidity and Capital Resources—Deposits and Other Borrowings”). In our opinion, our working capital is sufficient for our present needs.
Liquidity Management
Liquidity management seeks to ensure that, even under adverse conditions, we have access to the funds necessary to cover client needs, maturing liabilities and capital requirements. Liquidity risk arises in the general funding for our financing, trading and investment activities. It includes the risk of unexpected increases in the cost of funding the portfolio of assets at appropriate maturities and rates, the risk of being unable to liquidate a position in a timely manner at a reasonable price and the risk that we will be required to repay liabilities earlier than anticipated.
The following table sets forth the balance of our liquidity portfolio managed by our Financial Management Division in the manner in which it is presented to the Asset and Liability Committee (ALCO) and the Board. The ALCO has determined that ournow uses as its liquidity portfolio must be comprised of cash plus assets that can be readily convertible into cash either throughthose defined by the FMC and the Chilean Central Bank, window, overnight deposits or instruments orwhich are in line with those established in BIS III. As of December 31, 2020, the local secondary market. The managementbreakdown of the Bank’s liquidity portfolio is performedliquid assets by levels was the Financial Management Division under rules determined by the ALCO and based on classifications by the SBIF and the Bank’s management.following:
98
| December 31, 2018 | December 31, 2017 | |||||||
| Ch$ million | ||||||||
| Balance as of: | ||||||||
| Trading Investments | 77,041 | 485,736 | ||||||
| Available-for-sale investments | 2,394,323 | 2,574,546 | ||||||
| Encumbered assets (net)(1) | (48,843 | ) | (268,330 | ) | ||||
| Net cash(2) | 149,321 | (37,628 | ) | |||||
| Net interbank deposits(3) | 967,095 | 768,595 | ||||||
| Total liquidity portfolio | 3,538,937 | 3,522,919 | ||||||
| December 31, 2020 | December 31, 2019 | |||||||
| (Ch$ million) | (Ch$ million) | |||||||
| Balance as of: | ||||||||
| Cash and cash equivalent | 988,320 | 1,305,534 | ||||||
| Level 1 liquid assets (1) | 2,490,810 | 2,452,599 | ||||||
| Level 2 liquid assets (2) | 12,681 | 15,105 | ||||||
| Total liquid assets | 3,491,811 | 3,773,238 | ||||||
____________________
| (1) | Includes instruments issued by the Central Bank of Chile or other central banks with a AAA rating, instruments issued by the Chilean government or other sovereign with a AAA rating and instruments issued by development banks with a AAA rating. Assets encumbered through repurchase agreements are deducted from the liquidity portfolio including those left as collateral under the FCIC funding program with the Central Bank of Chile. |
| (2) |
| December 31, 2020 | December 31, 2019 | |||||||
| (Ch$ million) | (Ch$ million) | |||||||
| Average balance as of: | ||||||||
| Cash and cash equivalent | 1,161,367 | 1,618,667 | ||||||
| Level 1 liquid assets (1) | 3,164,890 | 2,674,995 | ||||||
| Level 2 liquid assets (2) | 13,311 | 16,927 | ||||||
| Total liquid assets | 4,339,568 | 4,309,589 | ||||||
____________________
| December 31, 2018 | December 31, 2017 | |||||||
| Ch$ million | ||||||||
| Average balance as of: | ||||||||
| Financial investments for trading | 259,654 | 457,546 | ||||||
| Available-for-sale investments | 2,690,184 | 2,562,753 | ||||||
| Encumbered assets (net)(1) | (134,408 | ) | (254,563 | ) | ||||
| Net cash(2) | 109,757 | (49,425 | ) | |||||
| Net interbank deposits(3) | 613,259 | 1,025,280 | ||||||
| Total liquidity portfolio | 3,538,446 | 3,741,591 | ||||||
| (1) | Includes instruments issued by the Central Bank of Chile or other central banks with a AAA rating, instruments issued by the Chilean government or other sovereign with a AAA rating and instruments issued by development banks with a AAA rating. Assets encumbered through repurchase agreements are deducted from the liquidity portfolio including those left as collateral under the FCIC funding program with the Central Bank of Chile. |
| (2) |
| Includes |
Our general policy is to maintain liquidity adequate to ensure our ability to honor withdrawals of deposits, make repayments of other liabilities at maturity, extend loans and meet our own working capital needs. Our minimum amount of liquidity is determined by the statutory reserve requirements of the Central Bank. Deposits are subject to a statutory reserve requirement of 9.0% for demand deposits and 3.6% for Chilean peso-, UF- and foreign currency denominated time deposits with a term of less than a year. See “Item 4. Information on the Company—B. Business Overview—Competition—Regulation and Supervision.” The Central Bank has statutory authority to increase these percentages to up to 40.0% for demand deposits and up to 20.0% for time deposits. In addition, a 100.0% special reserve (reserva técnica) applies to demand deposits, deposits in checking accounts, other demand deposits received or obligations payable on sight and incurred in the ordinary course of business, other than deposits unconditionally payable immediately. This special reserve requirement applies to the amount by which the total of such deposits exceeds 2.5 times the amount of a bank’s regulatory capital. Interbank loans are deemed to have a maturity of more than 30 days, even if payable within the following 10 days.
The Central Bank also requires us to comply with the following liquidity limits:
| The sum of the liabilities with a maturity of less than 30 days may not exceed the sum of the assets with a maturity of less than 30 days by an amount greater than our Shareholders’ equity. This limit must be calculated in local currency and foreign currencies together as one gap. At December 31, |
| The sum of the liabilities in foreign currency with a maturity of less than 30 days may not exceed the sum of the assets in foreign currency with a maturity of less than 30 days by more than an amount greater than our Shareholders’ equity. At December 31, |
99
| The sum of the liabilities with a maturity of less than 90 days may not exceed the sum of the assets with a maturity of less than 90 days by more than 2 times our Shareholders’ equity. This limit must be calculated in local currency and foreign currencies together as one gap. At December 31, |
We have set other liquidity limits and ratios that minimize liquidity risk. See “Item 11. Quantitative and Qualitative Disclosures About Market Risk.”
Cash Flow
The tables below set forth our main sources of cash. The subsidiaries are not an important source of cash flow for us and therefore have no impact on our ability to meet our cash obligations. No legal or economic restrictions exist on the ability of subsidiaries to transfer funds to us in the form of loans or cash dividends as long as these subsidiaries abide by the regulations of theLey General de Bancos and theLey de Sociedad Anónimas regarding loans to related parties and minimum dividend payments. See our Consolidated Statements of Cash Flows in our Audited Consolidated Financial Statements for a detailed breakdown of the Bank’s cash flow.
| Year ended December 31, | ||||||||||||
| 2018 | 2017 | 2016 | ||||||||||
| Millions of Ch$ | ||||||||||||
| Net cash (used in) provided by operating activities | 1,022,522 | (416,357 | ) | 736,154 | ||||||||
| Year ended December 31, | ||||||||||||
| 2020 | 2019 | 2018 | ||||||||||
| Millions of Ch$ | ||||||||||||
| Net cash (used in) provided by operating activities | (819,993 | ) | 1,855,586 | 1,022,492 | ||||||||
Our operating activities used cash for Ch$819,993 million in 2020, mainly due to higher redemption of senior bonds and payments of interest and decrease of obligations with foreign banks as the Financial Management division was more active prepaying bonds as the Bank had access to cheaper funding through the Central Bank. There was also a decrease in time deposits and liabilities, which was partially offset by an increase of debits in customers checking accounts.
Our operating activities generated cash of Ch$1,022,5221,855,586 million in 2018,2019, mainly due to an increasethe rise in liquidity atdebits in customer checking accounts and the endissuance of 2018 particularly from time deposits.senior bonds. This was compensated by strong loanthe growth during the year.of loans and financial investments.
Our operating activities used cash of Ch$416,357 million in 2017. As loan growth was slower in 2017, we effectively managed our liabilities, decreasing our time deposits and other obligations with banks as well as partially repaying senior bonds, achieving a better cost of funding for the Bank.
| Year ended December 31, | ||||||||||||
| 2020 | 2019 | 2018 | ||||||||||
| Millions of Ch$ | ||||||||||||
| Net cash (used in) provided by investment activities | (70,105 | ) | (141,790 | ) | (91,565 | ) | ||||||
| Year ended December 31, | ||||||||||||
| 2018 | 2017 | 2016 | ||||||||||
| Millions of Ch$ | ||||||||||||
| Net cash (used in) provided by investment activities | (91,595 | ) | (73,458 | ) | (90,200 | ) | ||||||
In 2018,2020, the Bank’s investment activities consumed cash in an amount of Ch$91,59570,105 million mainly due to purchases of property, plant and equipment, as well as intangible assets. This was partly compensated by the acquisitionsale of some fixed assets.
In 2017,2019, the Bank’s investment activities consumed cash in an amount of Ch$73,458141,790 million mainly due to the purchase of Santander Consumer Finance S.A.
| Year ended December 31, | ||||||||||||
| 2020 | 2019 | 2018 | ||||||||||
| Millions of Ch$ | ||||||||||||
| Net cash provided by (used in) financing activities | 102,090 | (385,286 | ) | (423,611 | ) | |||||||
In 2020, net cash provided in financing activities was Ch$102,090 million due to the acquisitionplacement of fixed assetssubordinated bonds, which amounted to a cash increase of Ch$475,390 million. This was partially offset by the annual dividend payment. In 2019 and intangibles such as software.
| Year ended December 31, | ||||||||||||
| 2018 | 2017 | 2016 | ||||||||||
| Millions of Ch$ | ||||||||||||
| Net cash used in financing activities | (423,611 | ) | (330,645 | ) | (336,659 | ) | ||||||
In 2018, 2017 and 2016, the net cash used in financing activities can be explained by the Bank’s annual dividend payment each year.
100
Deposits and Other Borrowings
The following table sets forth our average balance of liabilities for the years ended December 31, 2018, 2017,2020, 2019 and 2016,2018, in each case together with the related average nominal interest rates paid thereon.
| 2018 | 2017 | 2016 | 2020 | 2019 | 2018 | |||||||||||||||||||||||||||||||||||||||||||||||||||||||||||||||||||
| Average Balance | % of Total Average Liabilities | Average Nominal Rate | Average Balance | % of Total Average Liabilities | Average Nominal Rate | Average Balance | % of Total Average Liabilities | Average Nominal Rate | Average Balance | % of Total Average Liabilities | Average Nominal Rate | Average Balance | % of Total Average Liabilities | Average Nominal Rate | Average Balance | % of Total Average Liabilities | Average Nominal Rate | |||||||||||||||||||||||||||||||||||||||||||||||||||||||
| (in millions of Ch$, except percentages) | (in millions of Ch$, except percentages) | |||||||||||||||||||||||||||||||||||||||||||||||||||||||||||||||||||||||
| Interest-bearing liabilities | ||||||||||||||||||||||||||||||||||||||||||||||||||||||||||||||||||||||||
| Savings accounts | 117,885 | 0.3 | % | 2.7 | % | 117,305 | 0.3 | % | 1.6 | % | 116,339 | 0.3 | % | 2.5 | % | 138,671 | 0.2 | % | 2.5 | % | 120,896 | 0.3 | % | 2.5 | % | 117,885 | 0.3 | % | 2.7 | % | ||||||||||||||||||||||||||||||||||||||||||
| Time deposits | 13,154,916 | 35.3 | % | 2.8 | % | 13,146,520 | 37.0 | % | 2.9 | % | 13,620,848 | 38.6 | % | 3.3 | % | 14,248,478 | 25.5 | % | 1.2 | % | 13,779,534 | 31.9 | % | 2.6 | % | 13,154,916 | 35.3 | % | 2.8 | % | ||||||||||||||||||||||||||||||||||||||||||
| Central Bank borrowings | 4 | 0.0 | % | 6.0 | % | 6 | 0.0 | % | 2.2 | % | 871 | — | 3.4 | % | 2,881,600 | 5.2 | % | 0.0 | % | - | 0.0 | % | 0.0 | % | 4 | 0.0 | % | 6.0 | % | |||||||||||||||||||||||||||||||||||||||||||
| Repurchase agreements | 291,913 | 0.8 | % | 2.3 | % | 294,368 | 0.8 | % | 2.3 | % | 121,875 | 0.3 | % | 2.4 | % | 243,280 | 0.4 | % | 0.8 | % | 414,951 | 1.0 | % | 2.5 | % | 291,913 | 0.8 | % | 2.3 | % | ||||||||||||||||||||||||||||||||||||||||||
| Mortgage finance bonds | 28,685 | 0.1 | % | 8.0 | % | 38,714 | 0.1 | % | 7.0 | % | 52,414 | 0.1 | % | 8.1 | % | 14,580 | 0.0 | % | 7.6 | % | 20,923 | 0.0 | % | 7.7 | % | 28,685 | 0.1 | % | 8.0 | % | ||||||||||||||||||||||||||||||||||||||||||
| Other interest bearing liabilities | 9,401,475 | 25.3 | % | 4.8 | % | 8,632,128 | 24.4 | % | 4.0 | % | 7,856,201 | 22.3 | % | 5.0 | % | 11,202,635 | 20.1 | % | 4.2 | % | 11,261,529 | 26.1 | % | 4.8 | % | 9,401,475 | 25.3 | % | 4.8 | % | ||||||||||||||||||||||||||||||||||||||||||
| Subtotal interest-bearing liabilities | 22,994,878 | 61.8 | % | 3.6 | % | 22,229,041 | 62.6 | % | 3.3 | % | 21,768,548 | 61.6 | % | 3.7 | % | 28,729,244 | 51.5 | % | 2.2 | % | 25,597,833 | 59.2 | % | 3.5 | % | 22,994,878 | 61.8 | % | 3.6 | % | ||||||||||||||||||||||||||||||||||||||||||
| Non-interest bearing liabilities | ||||||||||||||||||||||||||||||||||||||||||||||||||||||||||||||||||||||||
| Non-interest bearing deposits | 6,763,546 | 18.2 | % | 6,117,644 | 17.2 | % | 5,753,622 | 16.3 | % | 10,403,347 | 18.6 | % | 7,466,991 | 17.3 | % | 6,763,546 | 18.2 | % | ||||||||||||||||||||||||||||||||||||||||||||||||||||||
| Derivatives | 2,020,857 | 5.4 | % | 2,175,063 | 6.1 | % | 2,724,994 | 7.8 | % | 9,793,162 | 17.5 | % | 4,165,330 | 9.6 | % | 2,020,857 | 5.4 | % | ||||||||||||||||||||||||||||||||||||||||||||||||||||||
| Other non-interest bearing liabilities | 2,170,906 | 5.8 | % | 1,997,799 | 5.6 | % | 2,156,015 | 6.1 | % | 3,171,540 | 5.7 | % | 2,549,130 | 5.9 | % | 2,170,906 | 5.8 | % | ||||||||||||||||||||||||||||||||||||||||||||||||||||||
| Shareholders’ equity | 3,263,155 | 8.8 | % | 3,001,680 | 8.5 | % | 2,840,843 | 8.2 | % | 3,734,243 | 6.7 | % | 3,450,729 | 8.0 | % | 3,263,155 | 8.8 | % | ||||||||||||||||||||||||||||||||||||||||||||||||||||||
| Subtotal non-interest bearing liabilities | 14,218,464 | 38.2 | % | 13,292,186 | 37.4 | % | 13,475,474 | 38.4 | % | 27,102,291 | 48.5 | % | 17,632,180 | 40.8 | % | 14,218,464 | 38.2 | % | ||||||||||||||||||||||||||||||||||||||||||||||||||||||
| Total liabilities | 37,213,342 | 100.0 | % | 35,521,227 | 100.0 | % | 35,244,022 | 100.0 | % | 55,831,535 | 100.0 | % | 43,230,013 | 100.0 | % | 37,213,342 | 100.0 | % | ||||||||||||||||||||||||||||||||||||||||||||||||||||||
Our most important source of funding is our deposits. Average time deposits plus non-interest bearing demand deposits represented 53.5%44.2% of our average total liabilities and shareholders’ equity in 2018.2020. Our current funding strategy is to continue to utilize all sources of funding in accordance with their costs, their availability and our general asset and liability management strategy. Special emphasis is being placed on lengthening the maturities of funding with institutional clients, diversifying our bond holder base and broadening our core deposit funding. We believe that broadening our deposit base by increasing the number of account holders has created a more stable funding source.
Composition of Deposits
The following table sets forth the composition of our deposits and similar commitments at December 31, 2020, 2019, 2018, 2017 2016, 2015 and 2014.2016.
| 2018 | 2017 | 2016 | 2015 | 2014 | ||||||||||||||||
| (in millions of Ch$) | ||||||||||||||||||||
| Demand deposits and other demand obligations | ||||||||||||||||||||
| Current accounts | 6,794,132 | 6,272,656 | 6,144,688 | 5,875,992 | 5,131,130 | |||||||||||||||
| Other deposits and demand accounts | 709,711 | 590,221 | 564,966 | 577,077 | 554,785 | |||||||||||||||
| Other demand obligations | 1,237,574 | 905,289 | 829,661 | 903,052 | 794,582 | |||||||||||||||
| Subtotals | 8,741,417 | 7,768,166 | 7,539,315 | 7,356,121 | 6,480,497 | |||||||||||||||
| Time deposits and other time deposits | ||||||||||||||||||||
| Time deposits | 12,944,846 | 11,792,466 | 13,031,319 | 12,065,697 | 10,303,167 | |||||||||||||||
| Time saving accounts | 118,587 | 116,179 | 116,451 | 113,562 | 107,599 | |||||||||||||||
| Other time deposits | 4,386 | 5,300 | 3,939 | 3,508 | 3,174 | |||||||||||||||
| Subtotals | 13,067,819 | 11,913,945 | 13,151,709 | 12,182,767 | 10,413,940 | |||||||||||||||
| Total deposits and other commitments | 21,809,236 | 19,682,111 | 20,691,024 | 19,538,888 | 16,894,437 | |||||||||||||||
101
| 2020 | 2019 | 2018 | 2017 | 2016 | ||||||||||||||||
| (in millions of Ch$) | ||||||||||||||||||||
| Demand deposits and other demand obligations | ||||||||||||||||||||
| Current accounts | 11,342,648 | 8,093,108 | 6,794,132 | 6,272,656 | 6,144,688 | |||||||||||||||
| Other deposits and demand accounts | 1,583,183 | 741,103 | 709,711 | 590,221 | 564,966 | |||||||||||||||
| Other demand obligations | 1,635,062 | 1,463,221 | 1,237,574 | 905,289 | 829,661 | |||||||||||||||
| Subtotals | 14,560,893 | 10,297,432 | 8,741,417 | 7,768,166 | 7,539,315 | |||||||||||||||
| Time deposits and other time deposits | ||||||||||||||||||||
| Time deposits | 10,421,872 | 13,064,932 | 12,944,846 | 11,792,466 | 13,031,319 | |||||||||||||||
| Time saving accounts | 153,330 | 123,787 | 118,587 | 116,179 | 116,451 | |||||||||||||||
| Other time deposits | 6,589 | 4,098 | 4,386 | 5,300 | 3,939 | |||||||||||||||
| Subtotals | 10,581,791 | 13,192,817 | 13,067,819 | 11,913,945 | 13,151,709 | |||||||||||||||
| Total deposits and other commitments | 25,142,684 | 23,490,249 | 21,809,236 | 19,682,111 | 20,691,024 | |||||||||||||||
Maturity of Interest Bearing Deposits
The following table sets forth information regarding the currency and maturity of our interest bearing deposits as of December 31, 2018,2020, expressed in percentages of our total deposits in each currency category. UF-denominated deposits are similar to peso-denominated deposits in all respects, except that the principal is readjusted periodically based on variations in the Chilean consumer price index.
| Ch$ | UF | Foreign Currencies | Total | Ch$ | UF | Currencies | Total | |||||||||||||||||||||||||
| Demand deposits | 0.02 | % | 0.16 | % | 0.01 | % | 0.03 | % | 0.04 | % | 0.51 | % | 0.02 | % | 0.06 | % | ||||||||||||||||
| Savings accounts | 0.02 | % | 8.46 | % | 0.00 | % | 0.91 | % | 0.03 | % | 30.63 | % | 0.00 | % | 1.45 | % | ||||||||||||||||
| Time deposits: | ||||||||||||||||||||||||||||||||
| Maturing within 3 months | 74.47 | % | 33.50 | % | 90.55 | % | 71.47 | % | 80.88 | % | 20.14 | % | 93.46 | % | 80.03 | % | ||||||||||||||||
| Maturing after 3 but within 6 months | 18.50 | % | 28.66 | % | 7.68 | % | 18.68 | % | 14.79 | % | 1.74 | % | 5.54 | % | 12.73 | % | ||||||||||||||||
| Maturing after 6 but within 12 months | 6.55 | % | 13.97 | % | 1.38 | % | 6.90 | % | 3.80 | % | 7.84 | % | 0.97 | % | 3.55 | % | ||||||||||||||||
| Maturing after 12 months | 0.45 | % | 15.24 | % | 0.39 | % | 2.00 | % | 0.45 | % | 39.15 | % | 0.02 | % | 2.18 | % | ||||||||||||||||
| Total time deposits | 99.96 | % | 91.37 | % | 99.99 | % | 99.06 | % | 99.93 | % | 68.86 | % | 99.98 | % | 98.49 | % | ||||||||||||||||
| Total deposits | 100.00 | % | 100.00 | % | 100.00 | % | 100.00 | % | 100.00 | % | 100.00 | % | 100.00 | % | 100.00 | % | ||||||||||||||||
The following table sets forth information regarding the maturity of our outstanding time as of December 31, 2018.2020.
| Ch$ | UF | Foreign Currencies | Total | Ch$ | UF | Foreign Currencies | Total | |||||||||||||||||||||||||
| (in millions of Ch$) | (in millions of Ch$) | |||||||||||||||||||||||||||||||
| Time deposits: | Time deposits: | |||||||||||||||||||||||||||||||
| Maturing within 3 months | 7,903,478 | 461,744 | 974,233 | 9,339,455 | 6,820,331 | 99,144 | 1,548,819 | 8,468,294 | ||||||||||||||||||||||||
| Maturing after 3 but within 6 months | 1,963,659 | 395,139 | 82,634 | 2,441,432 | 1,247,178 | 8,549 | 91,729 | 1,347,456 | ||||||||||||||||||||||||
| Maturing after 6 but within 12 months | 694,858 | 192,629 | 14,799 | 902,286 | 320,437 | 38,588 | 16,135 | 375,160 | ||||||||||||||||||||||||
| Maturing after 12 months | 47,379 | 210,079 | 4,214 | 261,672 | 37,986 | 192,725 | 251 | 230,962 | ||||||||||||||||||||||||
| Total time deposits | 10,609,374 | 1,259,591 | 1,075,880 | 12,944,845 | 8,425,932 | 339,006 | 1,656,934 | 10,421,872 | ||||||||||||||||||||||||
Short-term Borrowings
The principal categories of our short-term borrowings are repurchase agreements and interbank borrowings. The table below presents the amounts outstanding at each year-end indicated and the weighted-average nominal interest rate for each such year by type of short-term borrowing.
| 2018 | 2017 | 2016 | ||||||||||||||||||||||
| Balance | Weighted-Average Nominal Interest Rate | Balance | Weighted-Average Nominal Interest Rate | Balance | Weighted-Average Nominal Interest Rate | |||||||||||||||||||
| (in millions of Ch$, except percentages) | ||||||||||||||||||||||||
| Obligations arising from repurchase agreements | 48,545 | 2.5 | % | 268,061 | 2.5 | % | 212,437 | 2.3 | % | |||||||||||||||
| Obligations with the Central Bank | — | — | 5 | 3.0 | % | 7 | 0.5 | % | ||||||||||||||||
| Loans from domestic financial institutions | — | — | 480 | — | 365,436 | — | ||||||||||||||||||
| Foreign obligations | 1,648,955 | 2.5 | % | 1,477,318 | 1.6 | % | 525,521 | 1.4 | % | |||||||||||||||
| Total short-term borrowings | 1,697,500 | 2.5 | % | 1,745,864 | 1.8 | % | 1,103,401 | 1.2 | % | |||||||||||||||
102
| 2020 | 2019 | 2018 | ||||||||||||||||||||||
| Balance | Weighted- Average Nominal Interest Rate | Balance | Weighted -Average Nominal Interest Rate | Balance | Weighted- Average Nominal Interest Rate | |||||||||||||||||||
| (in millions of Ch$, except percentages) | ||||||||||||||||||||||||
| Obligations arising from repurchase agreements | 969,808 | 0.9 | % | 380,055 | 2.4 | % | 48,545 | 2.5 | % | |||||||||||||||
| Obligations with the Central Bank | 4,959,260 | 0.5 | % | — | — | — | — | |||||||||||||||||
| Loans from domestic financial institutions | 217,102 | 1.0 | % | 143,865 | — | — | — | |||||||||||||||||
| Foreign obligations | 1,116,570 | 1.4 | % | 1,985,773 | 2.8 | % | 1,648,955 | 2.5 | % | |||||||||||||||
| Total short-term borrowings | 7,262,740 | 0.7 | % | 2,509,693 | 2.6 | % | 1,697,500 | 2.5 | % | |||||||||||||||
The following table shows the average balance and the average nominal rate for each short-term borrowing category for the years indicated.
| 2018 | 2017 | 2016 | 2020 | 2019 | 2018 | |||||||||||||||||||||||||||||||||||||||||||
| Average Balance | Average Nominal Interest Rate | Average Balance | Average Nominal Interest Rate | Average Balance | Average Nominal Interest Rate | Average Balance | Average Nominal Interest Rate | Average Balance | Average Nominal Interest Rate | Average Balance | Average Nominal Interest Rate | |||||||||||||||||||||||||||||||||||||
| (in millions of Ch$, except percentages) | (in millions of Ch$, except percentages) | |||||||||||||||||||||||||||||||||||||||||||||||
| Obligations arising from repurchase agreements | 291,913 | 2.3 | % | 294,368 | 2.3 | % | 121,875 | 2.4 | % | 243,280 | 0.8 | % | 414,951 | 2.5 | % | 291,913 | 2.3 | % | ||||||||||||||||||||||||||||||
| Obligations with the Central Bank | 4 | 6.0 | % | 6 | 2.2 | % | 871 | 3.4 | % | 2,881,600 | 0.0 | % | — | — | 4 | 6.0 | % | |||||||||||||||||||||||||||||||
| Loans from domestic financial institutions | 80 | — | 413 | — | 114,882 | 4.2 | % | 120,002 | 0.0 | % | 270 | — | 80 | — | ||||||||||||||||||||||||||||||||||
| Foreign obligations | 1,462,975 | 2.3 | % | 1,465,653 | 1.7 | % | 1,435,395 | 1.1 | % | 1,860,825 | 5.2 | % | 1,903,862 | 2.3 | % | 1,462,975 | 2.3 | % | ||||||||||||||||||||||||||||||
| Total short-term borrowings | 1,754,972 | 2.3 | % | 1,760,440 | 1.8 | % | 1,673,023 | 1.4 | % | 5,105,707 | 1.9 | % | 2,319,083 | 2.4 | % | 1,754,972 | 2.3 | % | ||||||||||||||||||||||||||||||
The following table presents the maximum month-end balances of our principal sources of short-term borrowings during the years indicated.
| Maximum 2018 Month-End Balance | Maximum 2017 Month-End Balance | Maximum 2016 Month-End Balance | Maximum 2020 Month-End Balance | Maximum 2019 Month-End Balance | Maximum 2018 Month-End Balance | |||||||||||||||||||
| (in millions of Ch$) | (in millions of Ch$) | |||||||||||||||||||||||
| Obligations arising from repurchase agreements | 345,927 | 526,826 | 212,437 | 969,808 | 527,836 | 345,927 | ||||||||||||||||||
| Obligations with the Central Bank | 5 | 6 | 22 | 4,974,125 | - | 5 | ||||||||||||||||||
| Loans from domestic financial institutions | 164,606 | 200,000 | 365,436 | 217,102 | 271,620 | 164,606 | ||||||||||||||||||
| Foreign obligations | 1,918,519 | 1,778,183 | 1,787,746 | 2,953,037 | 3,025,476 | 1,918,519 | ||||||||||||||||||
| Total short-term borrowings | 2,429,057 | 2,505,015 | 2,365,641 | 9,114,072 | 3,824,932 | 2,429,057 | ||||||||||||||||||
Total Borrowings
| As of December 31, 2018 | As of December 31, 2020 | |||||||||||||||||||||||
| Long-term | Short-term | Total | Long-term | Short-term | Total | |||||||||||||||||||
| (in millions of Ch$) | (in millions of Ch$) | |||||||||||||||||||||||
| Central Bank credit lines for renegotiations of loans (a) | — | — | — | 4,959,260 | — | 4,959,260 | ||||||||||||||||||
| Obligations under repurchase agreements | — | 48,545 | 48,545 | — | 969,808 | 969,808 | ||||||||||||||||||
| Mortgage finance bonds (b) | 18,660 | 6,830 | 25,490 | 78,870 | 5,465 | 84,335 | ||||||||||||||||||
| Senior bonds (c) | 6,353,967 | 844,898 | 7,198,865 | 5,625,431 | 1,124,558 | 6,749,989 | ||||||||||||||||||
| Mortgage bonds(d) | 90,088 | 4,833 | 94,921 | 5,137 | 84,787 | 89,924 | ||||||||||||||||||
| Subordinated bonds(e) | 795,956 | 1 | 795,957 | 1,357,539 | — | 1,357,539 | ||||||||||||||||||
| Borrowings from domestic financial institutions | — | — | — | 217,102 | — | 217,102 | ||||||||||||||||||
| Foreign borrowings(f) | 139,671 | 1,648,955 | 1,788,626 | 35,667 | 1,116,570 | 1,152,237 | ||||||||||||||||||
| Other obligations(g) | 9,529 | 205,871 | 215,400 | 290 | 184,028 | 184,318 | ||||||||||||||||||
| Total borrowings | 7,407,871 | 2,759,933 | 10,167,804 | 7,320,036 | 3,485,216 | 10,805,252 | ||||||||||||||||||
As of December 31, 2017 | ||||||||||||||||||||||||
Long-term | Short-term | Total | ||||||||||||||||||||||
| (in millions of Ch$) | ||||||||||||||||||||||||
| Central Bank credit lines for renegotiations of loans (a) | — | 5 | 5 | |||||||||||||||||||||
| Obligations under repurchase agreements | — | 268,061 | 268,061 | |||||||||||||||||||||
| Mortgage finance bonds (b) | 25,788 | 8,691 | 34,479 | |||||||||||||||||||||
| Senior bonds (c) | 5,849,594 | 337,166 | 6,186,760 | |||||||||||||||||||||
| Mortgage bonds(d) | 94,681 | 4,541 | 99,222 | |||||||||||||||||||||
| Subordinated bonds(e) | 773,189 | 3 | 773,192 | |||||||||||||||||||||
| Borrowings from domestic financial institutions | — | 480 | 480 | |||||||||||||||||||||
| Foreign borrowings(f) | 220,554 | 1,477,318 | 1,697,872 | |||||||||||||||||||||
| Other obligations(g) | 29,205 | 212,825 | 242,030 | |||||||||||||||||||||
| Total borrowings | 6,993,011 | 2,309,090 | 9,302,101 | |||||||||||||||||||||
As of December 31, 2016 | ||||||||||||||||||||||||
Long-term | Short-term | Total | ||||||||||||||||||||||
| (in millions of Ch$) | ||||||||||||||||||||||||
| Central Bank credit lines for renegotiations of loans (a) | — | 7 | 7 | |||||||||||||||||||||
| Obligations under repurchase agreements | — | 212,437 | 212,437 | |||||||||||||||||||||
| Mortgage finance bonds (b) | 35,015 | 11,236 | 46,251 | |||||||||||||||||||||
| Senior bonds (c) | 5,280,561 | 1,135,713 | 6,416,274 | |||||||||||||||||||||
| Mortgage bonds(d) | 99,864 | 4,318 | 104,182 | |||||||||||||||||||||
| Subordinated bonds(e) | 759,661 | 4 | 759,665 | |||||||||||||||||||||
| Borrowings from domestic financial institutions | — | 356,436 | 356,436 | |||||||||||||||||||||
| Foreign borrowings(f) | 1,025,404 | 525,521 | 1,550,925 | |||||||||||||||||||||
| Other obligations(g) | 81,528 | 158,488 | 240,016 | |||||||||||||||||||||
| Total borrowings | 7,282,033 | 2,404,160 | 9,686,193 | |||||||||||||||||||||
103
| As of December 31, 2019 | ||||||||||||
| Long-term | Short-term | Total | ||||||||||
| (in millions of Ch$) | ||||||||||||
| Central Bank credit lines for renegotiations of loans (a) | — | — | — | |||||||||
| Obligations under repurchase agreements | — | 380,055 | 380,055 | |||||||||
| Mortgage finance bonds (b) | 12,489 | 6,013 | 18,502 | |||||||||
| Senior bonds (c) | 6,496,011 | 2,078,202 | 8,574,213 | |||||||||
| Mortgage bonds(d) | 84,787 | 5,137 | 89,924 | |||||||||
| Subordinated bonds(e) | 818,084 | — | 818,084 | |||||||||
| Borrowings from domestic financial institutions | 127,748 | 158,855 | 286,603 | |||||||||
| Foreign borrowings(f) | 262,425 | 1,970,790 | 2,233,215 | |||||||||
| Other obligations(g) | 318 | 226,040 | 226,358 | |||||||||
| Total borrowings | 7,801,862 | 4,825,092 | 12,626,954 | |||||||||
| As of December 31, 2018 | ||||||||||||
| Long-term | Short-term | Total | ||||||||||
| (in millions of Ch$) | ||||||||||||
| Central Bank credit lines for renegotiations of loans (a) | — | — | — | |||||||||
| Obligations under repurchase agreements | — | 48,545 | 48,545 | |||||||||
| Mortgage finance bonds (b) | 18,660 | 6,830 | 25,490 | |||||||||
| Senior bonds (c) | 6,353,967 | 844,898 | 7,198,865 | |||||||||
| Mortgage bonds(d) | 90,088 | 4,833 | 94,921 | |||||||||
| Subordinated bonds(e) | 795,956 | 1 | 795,957 | |||||||||
| Borrowings from domestic financial institutions | — | — | — | |||||||||
| Foreign borrowings(f) | 139,671 | 1,648,955 | 1,788,626 | |||||||||
| Other obligations(g) | 9,529 | 205,871 | 215,400 | |||||||||
| Total borrowings | 7,407,871 | 2,759,933 | 10,167,804 | |||||||||
(a) CreditCentral Bank credit lines for renegotiations of loans
In response to the COVID-19 pandemic, the Chilean Central Bank borrowings includehas made two lines of credit available to banks to reinforce their liquidity and to fund loans for SMEs with government guarantees. These lines forof credit bear interest at the renegotiationsCentral Bank’s monetary policy rate (MPR), which was 0.5% as of loans and other Central Bank borrowings. The maturities of the outstanding amounts due are as follows:December 31, 2020.
| As of December 31, | |||||
| (in millions of Ch$) | |||||
| Due within 1 year | |||||
| Due after 1 year but within 2 years | |||||
| Due after 3 years but within 4 years | 3.854.501 | ||||
| Due after 4 years but within 5 years | - | ||||
| Due after 5 years | - | ||||
| Central Bank credit lines for renegotiations of loans | 4.959.260 | ||||
104
(b) Mortgage finance bonds
These bonds are used to finance mortgage loans. Their principal amounts are amortized on a quarterly basis. The range of maturities of these bonds is between five and twenty years. Loans are indexed to UF and pay a yearly interest rate.
| As of December 31, | ||||
| (in millions of Ch$) | ||||
| Due within 1 year | ||||
| Due after 1 year but within 2 years | ||||
| Due after 2 years but within 3 years | ||||
| Due after 3 years but within 4 years | ||||
| Due after 4 years but within 5 years | ||||
| Due after 5 years | ||||
| Total mortgage finance bonds | ||||
(c) Senior bonds
The following table sets forth, at the dates indicated, our issued senior bonds. The bonds are denominated principally in UFs or U.S. dollars, and are principally used to fund assets with similar durations.
| As of December 31, | As of December 31, | |||||||||||||||||||||||
| 2018 | 2017 | 2016 | 2020 | 2019 | 2018 | |||||||||||||||||||
| (in millions of Ch$) | (in millions of Ch$) | |||||||||||||||||||||||
| Senior Bonds in UF | 4,095,741 | 3,542,006 | 3,588,373 | 4,017,708 | 4,814,604 | 4,095,741 | ||||||||||||||||||
| Senior Bonds in U.S.$ | 1,094,267 | 1,045,465 | 909,354 | 1,263,714 | 1,649,238 | 1,094,267 | ||||||||||||||||||
| Senior Bonds in CHF | 386,979 | 268,281 | 568,549 | 466,738 | 499,485 | 386,979 | ||||||||||||||||||
| Senior Bonds in Ch$ | 1,291,900 | 1,135,527 | 1,037,515 | 639,489 | 1,242,633 | 1,291,900 | ||||||||||||||||||
| Current bonds in AUD | 24,954 | 14,534 | 60,890 | 125,781 | 124,748 | 24,954 | ||||||||||||||||||
| Santander bonds in JPY | 191,598 | 126,059 | 179,426 | 68,093 | 77,797 | 191,598 | ||||||||||||||||||
| Senior bonds in EUR | 113,426 | 54,888 | 72,167 | 168,466 | 165,708 | 113,426 | ||||||||||||||||||
| Total senior bonds | 7,198,865 | 6,186,760 | 6,416,274 | 6,749,989 | 8,574,213 | 7,198,865 | ||||||||||||||||||
The maturities of these bonds are as follows:
| As of December 31, | ||||
| (in millions of Ch$) | ||||
| Due within 1 year | ||||
| Due after 1 year but within 2 years | ||||
| Due after 2 years but within 3 years | ||||
| Due after 3 years but within 4 years | ||||
| Due after 4 years but within 5 years | ||||
| Due after 5 years | ||||
| Total bonds | ||||
In 2018,2020, the Bank issued bonds for UF 23,000,000; CLP 225,000,000,000;1,996,000 and USD 70,000,000, EUR 66,000,000, AUD 20,000,000, CHF 115,000,000 and JPY 7,000,000,000742,500,000 as detailed as follows:
| Series | Currency | Amount | Term | Issuance rate | Series approval date | Series maximum amount | Maturity date |
| T1 | UF | 4,000,000 | 2 | 2.20% | 01-02-2016 | 7,000,000 | 01-02-2020 |
| T4 | UF | 4,000,000 | 3 | 2.35% | 01-02-2016 | 8,000,000 | 01-08-2021 |
| T11 | UF | 5,000,000 | 7 | 2.65% | 01-02-2016 | 5,000,000 | 01-02-2025 |
| T12 | UF | 5,000,000 | 7 | 2.70% | 01-02-2016 | 5,000,000 | 01-08-2025 |
| T15 | UF | 5,000,000 | 11 | 3.00% | 01-02-2016 | 5,000,000 | 01-08-2028 |
| Total | UF | 23,000,000 | 30,000,000 | ||||
| P5 | CLP | 75,000,000,000 | 4 | 5.30% | 05-03-2015 | 150,000,000,000 | 01-03-2022 |
| U4 | CLP | 75,000,000,000 | 3 yr + 4m | ICP + 1.00% | 10-01-2017 | 75,000,000,000 | 10-01-2022 |
| U3 | CLP | 75,000,000,000 | 2 yr +7m | ICP + 1.00% | 11-06-2018 | 75,000,000,000 | 11-06-2021 |
| Total | CLP | 225,000,000,000 | 300,000,000,000 | ||||
| USD | USD | 50,000,000 | 10 | 4.17% | 10-10-2018 | 50,000,000 | 10-10-2028 |
| USD | USD | 20,000,000 | 2 | 0.0369% | 16-11-2018 | 20,000,000 | 16-11-2021 |
| Total | USD | 70,000,000 | 70,000,000 | ||||
| EUR | EUR | 26,000,000 | 7 | 1.00% | 04-05-2018 | 26,000,000 | 28-05-2025 |
| EUR | EUR | 40,000,000 | 12 | 1.78% | 08-06-2018 | 40,000,000 | 15-06-2030 |
| Total | EUR | 66,000,000 | 66,000,000 | ||||
| AUD | AUD | 20,000,000 | 5 | 3.56% | 13-11-2018 | 20,000,000 | 13-11.2023 |
| Total | AUD | 20,000,000 | 20,000,000 | ||||
| CHF | CHF | 115,000,000 | 5yr +3m | 0.441% | 21-09-2018 | 115,000,000 | 21-12-2023 |
| Total | CHF | 115,000,000 | 115,000,000 | ||||
| JPY | JPY | 4,000,000,000 | 10yr + 6m | 0.65% | 13-07-2018 | 4,000,000,000 | 13-01-2029 |
| JPY | JPY | 3,000,000,000 | 5 | 56% | 30-10-2018 | 3,000,000,000 | 30-10-2023 |
| Total | JPY | 7,000,000,000 | 7,000,000,000 |
Series | Currency | Amount | Term | Issuance rate | Series approval date | Series maximum amount | Maturity date | |||||||
W1 | UF | 1,996,000 | 5 yr. 3 months | 1.55% | 01-12-2019 | 2,000,000 | 01-06-2020 | |||||||
Total UF | 1,996,000 | 2,000,000 | ||||||||||||
USD Bond | USD | 742,500,000 | 5 yr. | 2.70% | 07-01-2020 | 750,000,000 | 07-01-2025 | |||||||
Total USD | 742,500,000 | 750,000,000 |
105
(d) Mortgage bonds
These bonds are used to finance mortgage loans with certain characteristics such as loan-to-value ratios below 80.0% and a debt servicing ratio of the client lower than 20.0%. All outstanding mortgage bonds are UF denominated.
The maturities of our mortgage bonds are as follows:
| As of December 31, | ||||||||||||||||
| 2018 | 2017 | As of December 31, | ||||||||||||||
| (in millions of Ch$) | 2020 | 2019 | ||||||||||||||
| (in millions of Ch$) | ||||||||||||||||
| Due within 1 year | 4,833 | 4,541 | 5,465 | 5,137 | ||||||||||||
| Due after 1 year but within 2 years | 7,758 | 7,291 | 8,773 | 8,248 | ||||||||||||
| Due after 2 year but within 3 years | 8,008 | 7,526 | 9,056 | 8,514 | ||||||||||||
| Due after 3 year but within 4 years | 8,267 | 7,769 | 9,348 | 8,788 | ||||||||||||
| Due after 4 year but within 5 years | 8,534 | 8,019 | 9,649 | 9,072 | ||||||||||||
| Due after 5 years | 57,521 | 64,076 | 42,044 | 50,165 | ||||||||||||
| Total mortgage bonds | 94,921 | 99,222 | 84,335 | 89,924 | ||||||||||||
During 2018,2020, the Bank hasdid not placedplace any mortgage bonds.
(e) Subordinated bonds
The following table sets forth, at the dates indicated, the balances of our subordinated bonds. The following table sets forth, at the dates indicated, our issued subordinated bonds. The bonds are denominated principally in UFs or U.S. dollars, and are principally used to fund the Bank’s mortgage portfolio and are considered to be a part of our regulatory capital.
| As of December 31, | As of December 31, | |||||||||||||||||||||||
| 2018 | 2017 | 2016 | 2020 | 2019 | 2018 | |||||||||||||||||||
| (in millions of Ch$) | (in millions of Ch$) | |||||||||||||||||||||||
| Subordinated bonds denominated in U.S.$ | — | — | — | |||||||||||||||||||||
| Subordinated bonds linked to the Ch$ | 1 | 3 | 4 | 202,634 | — | 1 | ||||||||||||||||||
| Subordinated bonds linked to the U.S.$ | — | — | — | |||||||||||||||||||||
| Subordinated bonds linked to the UF | 795,956 | 773,189 | 759,661 | 1,154,905 | 818,084 | 795,956 | ||||||||||||||||||
| Total subordinated bonds | 795,957 | 773,192 | 759,665 | 1,357,539 | 818,084 | 795,957 | ||||||||||||||||||
The maturities of these bonds, which are considered long-term, are as follows.
| As of December 31, | ||||
| (in millions of Ch$) | ||||
| Due within 1 year | ||||
| Due after 1 year but within 2 years | — | |||
| Due after 2 years but within 3 years | — | |||
| Due after 3 years but within 4 years | — | |||
| Due after 4 years but within 5 years | — | |||
| Due after 5 years | ||||
| Total subordinated bonds | ||||
During 2018,2020, the Bank did not issueissued the following subordinated bonds.
Series | Currency | Amount | Term | Issuance rate | Series approval date | Series maximum amount | Maturity date | |||||||
USD Bond | USD | 200,000,000 | 10 yr. | 3.79% | 21-01-220 | 200,000,000 | 21-01-2030 | |||||||
Total USD | 200,000,000 | 200,000,000 | ||||||||||||
USTDH20914 | UF | 3,000,000 | 14 yr. 5 months | 3.00% | 01-09-2014 | 3,000,000 | 01-09-2034 | |||||||
USTDH30914 | UF | 3,000,000 | 19 yr. 5 months | 3.15% | 01-09-2014 | 3,000,000 | 01-09-2039 | |||||||
| USTDW20320 | UF | 5,000,000 | 15 yr. 3 months | 3.50% | 01-03-2020 | 5,000,000 | 01-09-2035 | |||||||
| Total UF | 11,000,000 | 11,000,000 |
106
(f) Foreign borrowings
These are short-term and long-term borrowings from foreign banks used to fund our foreign trade business. The maturities of these borrowings are as follows.
| As of December 31, | ||||
| (in millions of Ch$) | ||||
| Due within 1 year | ||||
| Due after 1 year but within 2 years | ||||
| Due after 2 years but within 3 years | — | |||
| Due after 3 years but within 4 years | — | |||
| Due after 5 years | — | |||
| Total loans from foreign financial institutions | ||||
(g) Other obligations
Other obligations are summarized as follows:
| As of December 31, | ||||
| Ch$ millions | ||||
| Long term obligations | ||||
| Due after 1 years but within 2 years | ||||
| Due after 2 years but within 3 years | ||||
| Due after 3 years but within 4 years | ||||
| Due after 4 years but within 5 years | ||||
| Due after 5 years | ||||
| Long-term financial obligations subtotals | ||||
| Short term obligations: | ||||
| Amounts due to credit card operators | ||||
| Acceptance of letters of credit | ||||
| Other long-term financial obligations, short-term portion | ||||
| Short-term financial obligations subtotals | ||||
| Other financial obligations totals | ||||
Other Off-Balance Sheet Arrangements and Commitments
In the normal course of our business, we are party to transactions with off-balance sheet risk. These transactions expose us to credit risk in addition to amounts recognized in the consolidated financial statements. The most important off-balance sheet item is contingent loans. Contingent loans consist of guarantees granted by us in Ch$, UF and foreign currencies (principally U.S.$), unused letters of credit and commitments to extend credit such as overdraft protection and credit card lines of credit. Such commitments are agreements to lend to a customer at a future date, subject to the customer compliance with the contractual terms. Since a substantial portion of these commitments is expected to expire without being drawn upon, the total amount of commitments does not necessarily represent our actual future cash requirements. We use the same credit policies in making commitments to extend credit as we do for granting loans, therefore, in the opinion of our management, our outstanding commitments represent normal credit risk.
107
The following table presents the Bank’s outstanding contingent loans as of December 31, 2018, 20172020, 2019 and 2016:2018:
| As of December 31, | As of December 31, | |||||||||||||||||||||||
| 2018 | 2017 | 2016 | 2020 | 2019 | 2018 | |||||||||||||||||||
| (in millions of Ch$) | (in millions of Ch$) | |||||||||||||||||||||||
| Letters of credit issued | 223,420 | 201,699 | 158,800 | 165,119 | 140,572 | 223,420 | ||||||||||||||||||
| Foreign letters of credit confirmed | 57,038 | 75,499 | 57,686 | 82,779 | 70,192 | 57,038 | ||||||||||||||||||
| Performance guarantee | 1,954,205 | 1,823,793 | 1,752,610 | 1,090,643 | 1,929,894 | 1,954,205 | ||||||||||||||||||
| Personal guarantee | 133,623 | 81,577 | 125,050 | 441,508 | 451,950 | 133,623 | ||||||||||||||||||
| Total contingent liabilities | 2,368,286 | 2,182,568 | 2,094,146 | 1,780,049 | 2,592,608 | 2,368,286 | ||||||||||||||||||
| Lines of credit with immediate availability | 8,997,650 | 8,135,489 | 7,548,820 | 8,391,414 | 8,732,422 | 8,997,650 | ||||||||||||||||||
| Other irrevocable obligation | 327,297 | 260,691 | 260,266 | 406,234 | 485,991 | 327,297 | ||||||||||||||||||
| Total loan commitments | 9,324,947 | 8,396,180 | 7,809,086 | 10,577,697 | 9,218,413 | 9,324,947 | ||||||||||||||||||
| Totals | 11,693,233 | 10,578,748 | 9,903,232 | 8,797,648 | 11,811,021 | 11,693,233 | ||||||||||||||||||
Asset and Liability Management
Please refer to “Item 11. Quantitative and Qualitative Disclosures about Market Risk” for information regarding our policies with respect to asset and liability management.
Capital Expenditures
The following table reflects capital expenditures in each of the three years ended December 31, 2018, 20172020, 2019 and 2016:2018:
| Year Ended December 31, | ||||||||||||
| 2018 | 2017 | 2016 | ||||||||||
| (in millions of Ch$) | ||||||||||||
| Land and Buildings | 35,369 | 27,592 | 26,567 | |||||||||
| Machinery, Systems and Equipment | 28,438 | 26,278 | 30,965 | |||||||||
| Furniture, Vehicles, Other(1) | 4,522 | 4,902 | 4,823 | |||||||||
| Total | 68,329 | 58,772 | 62,355 | |||||||||
| Year Ended December 31, | ||||||||||||
| 2020 | 2019 | 2018 | ||||||||||
| (in millions of Ch$) | ||||||||||||
| Land and Buildings | 5,720 | 10,065 | 30,396 | |||||||||
| Machinery, Systems and Equipment | 25,237 | 33,302 | 27,697 | |||||||||
| Furniture, Vehicles, Other(1) | 7,586 | 7,602 | 8,646 | |||||||||
| Total | 38,543 | 50,969 | 66,739 | |||||||||
____________________
| (1) | Includes assets ceded under operating leases. |
The increasedecrease in capital expenditures in 2018 is2020 was due acquisition of propertyto lower fixed asset investments during the pandemic. We continued to invest in connection with our plans to extend our WorkCafé branch network. The closurethe digital transformation of the Banefefront and back offices, and new digital products and branch network in 2017 resulted in the 2017 reduction in capital expenditures.security measures.
C. Selected Statistical Information
The following information is included for analytical purposes and should be read in conjunction with our Audited Consolidated Financial Statements, as well as the discussion in this “Item 5. Operating and Financial Review and Prospects.” The UF is linked to, and is adjusted daily to reflect changes in, the previous month’s Chilean consumer price index. See “Item 5. Operating and Financial Review and Prospects—A. Operating Results—Impact of Inflation.”
Average Balances, Income Earned from Interest-Earning Assets and Interest Paid on Interest-Bearing Liabilities
The average balances for interest-earning assets and interest-bearing liabilities, including interest and readjustments received and paid, have been calculated on the basis of daily balances for us on an unconsolidated basis. Such average balances are presented in Chilean pesos, UFs and in foreign currencies (principally U.S. dollars). Figures from our subsidiaries have been calculated on the basis of monthly balances. The average balances of our subsidiaries, except Sociedad Operadora de Tarjetas de Pago Santander Getnet Chile S.A. Agente de Valores,, have not been categorized by currency. As such it is not possible to calculate average balances by currency for such subsidiaries on the basis of daily, weekly or monthly balances.
108
The nominal interest rate has been calculated by dividing the amount of interest and principal changes in the UF index (gain or loss) during the period by the related average balance, both amounts expressed in constant pesos.
Foreign exchange gains or losses on foreign currency-denominated assets and liabilities are not included in interest income or expense. When a financial asset becomes credit-impaired and is, therefore, regarded as “Stage 3”, the Bank suspends the interest income recognition in the income statement. Similarly, trading and mark-to-market gains or losses on investments are not included in interest income or expense. Interest is not recognized on non-performing loans. Non-performing loans that are past-due for 90 days or less have been included in each of the various categories of loans, and therefore affect the various averages. Non-performing loans consist of loans as to which either principal or interest is past-due (i.e., non-accrual loans) and restructured loans earning no interest.
Included in interbank deposits are checking accounts maintained in the Central Bank and foreign banks. Such assets have a distorting effect on the average interest rate earned on total interest-earning assets because currently balances maintained in Chilean peso amounts do not earn interest, and the only balances held in a foreign currency that earn interest are those maintained in U.S. dollars, but those only earn interest on the amounts that are legally required to be held for liquidity purposes. Additionally, this account includes interest earned by overnight investments. Consequently, the average interest earned on such assets is comparatively low. We maintain these deposits in these accounts to comply with statutory requirements and to facilitate international business, rather than to earn income. See Note 1—Summary of Significant Accounting Policies—(k) Recognizing Income and Expenses of our Audited Consolidated Financial Statements.
The following tables show, by currency of denomination, average balances and, where applicable, interest amounts and real rates for our assets and liabilities for the years ended December 31, 2018, 20172020, 2019 and 2016.2018.
| For the year ended December 31, | For the year ended December 31, | |||||||||||||||||||||||||||||||||||||||||||||||||||||||||||||||||||||||
| 2018 | 2017 | 2016 | 2020 | 2019 | 2018 | |||||||||||||||||||||||||||||||||||||||||||||||||||||||||||||||||||
| Average Balance | Interest Earned | Average Nominal Rate | Average Balance | Interest Earned | Average Nominal Rate | Average Balance | Interest Earned | Average Nominal Rate | Average Balance | Interest Earned | Average Nominal Rate | Average Balance | Interest Earned | Average Nominal Rate | Average Balance | Interest Earned | Ave rage Nominal Rate | |||||||||||||||||||||||||||||||||||||||||||||||||||||||
| Assets | ||||||||||||||||||||||||||||||||||||||||||||||||||||||||||||||||||||||||
| Interest earning assets | ||||||||||||||||||||||||||||||||||||||||||||||||||||||||||||||||||||||||
| Deposits in Central Bank | ||||||||||||||||||||||||||||||||||||||||||||||||||||||||||||||||||||||||
| Ch$ | 451,805 | 5,930 | 1.3 | % | 358,445 | 4,395 | 1.2 | % | 341,040 | 5,396 | 1.6 | % | 800,147 | 648 | 0.1 | % | 496,804 | 822 | 0.2 | % | 451,805 | 5,930 | 1.3 | % | ||||||||||||||||||||||||||||||||||||||||||||||||
| UF | — | — | — | % | — | — | — | % | — | — | — | % | — | — | —% | — | — | —% | — | — | —% | |||||||||||||||||||||||||||||||||||||||||||||||||||
| Foreign currency | — | — | — | % | — | — | — | % | — | — | — | % | — | — | —% | — | — | —% | — | — | —% | |||||||||||||||||||||||||||||||||||||||||||||||||||
| Total | 451,805 | 5,930 | 1.3 | % | 358,445 | 4,395 | 1.2 | % | 341,040 | 5,396 | 1.6 | % | 800,147 | 648 | 0.1 | % | 496,804 | 822 | 0.2 | % | 451,805 | 5,930 | 1.3 | % | ||||||||||||||||||||||||||||||||||||||||||||||||
| Financial investments (1) | ||||||||||||||||||||||||||||||||||||||||||||||||||||||||||||||||||||||||
| Ch$ | 1,490,010 | 64,839 | 4.4 | % | 1,626,073 | 91,945 | 5.7 | % | 1,553,848 | 78,410 | 5.0 | % | 3,181,194 | 55,005 | 1.7 | % | 1,571,480 | 36,695 | 2.3 | % | 1,490,010 | 64,839 | 4.4 | % | ||||||||||||||||||||||||||||||||||||||||||||||||
| UF | 826,333 | 35,573 | 4.3 | % | 250,729 | 8,894 | 3.5 | % | 108,646 | 4,727 | 4.4 | % | 1,246,124 | 33,941 | 2.7 | % | 877,872 | 17,547 | 2.0 | % | 826,333 | 35,573 | 4.3 | % | ||||||||||||||||||||||||||||||||||||||||||||||||
| Foreign currency | 677,343 | 10,616 | 1.6 | % | 919,711 | 13,077 | 1.4 | % | 1,106,205 | 14,452 | 1.3 | % | 1,735,842 | 18,099 | 1.0 | % | 958,466 | 10,519 | 1.1 | % | 677,343 | 10,616 | 1.6 | % | ||||||||||||||||||||||||||||||||||||||||||||||||
| Total | 2,993,686 | 111,028 | 3.7 | % | 2,796,513 | 113,916 | 4.1 | % | 2,768,699 | 97,589 | 3.5 | % | 6,163,159 | 107,044 | 1.7 | % | 3,407,818 | 64,761 | 1.9 | % | 2,993,686 | 111,028 | 3.7 | % | ||||||||||||||||||||||||||||||||||||||||||||||||
| Commercial Loans | ||||||||||||||||||||||||||||||||||||||||||||||||||||||||||||||||||||||||
| Ch$ | 6,651,575 | 461,343 | 6.9 | % | 6,117,872 | 468,181 | 7.7 | % | 5,848,483 | 532,675 | 9.1 | % | 7,484,216 | 414,119 | 5.5 | % | 6,668,248 | 459,659 | 6.9 | % | 6,651,575 | 461,343 | 6.9 | % | ||||||||||||||||||||||||||||||||||||||||||||||||
| UF | 5,553,732 | 357,932 | 6.4 | % | 5,074,723 | 284,831 | 5.6 | % | 4,786,383 | 329,402 | 6.9 | % | 6,625,490 | 368,774 | 5.6 | % | 6,075,706 | 374,361 | 6.2 | % | 5,553,732 | 357,932 | 6.4 | % | ||||||||||||||||||||||||||||||||||||||||||||||||
| Foreign currency | 2,852,514 | 116,991 | 4.1 | % | 2,937,416 | 94,914 | 3.2 | % | 3,254,913 | 87,735 | 2.7 | % | 3,239,259 | 131,554 | 4.1 | % | 2,974,697 | 134,925 | 4.5 | % | 2,852,514 | 116,991 | 4.1 | % | ||||||||||||||||||||||||||||||||||||||||||||||||
| Total | 15,057,821 | 936,266 | 6.2 | % | 14,130,010 | 847,926 | 6.0 | % | 13,889,779 | 949,812 | 6.8 | % | 17,348,965 | 914,447 | 5.3 | % | 15,718,651 | 968,945 | 6.2 | % | 15,057,821 | 936,266 | 6.2 | % | ||||||||||||||||||||||||||||||||||||||||||||||||
| Consumer loans | ||||||||||||||||||||||||||||||||||||||||||||||||||||||||||||||||||||||||
| Ch$ | 4,288,778 | 585,064 | 13.6 | % | 4,081,337 | 616,639 | 15.1 | % | 3,858,386 | 542,597 | 14.1 | % | 4,889,877 | 568,864 | 11.6 | % | 5,023,394 | 643,526 | 12.8 | % | 4,288,778 | 585,064 | 13.6 | % | ||||||||||||||||||||||||||||||||||||||||||||||||
| UF | 19,517 | 1,470 | 7.5 | % | 17,475 | 1,395 | 8.0 | % | 21,015 | 1,821 | 8.7 | % | 15,201 | 1,081 | 7.1 | % | 18,003 | 1,273 | 7.1 | % | 19,517 | 1,470 | 7.5 | % | ||||||||||||||||||||||||||||||||||||||||||||||||
| Foreign currency | 55,440 | 0 | 0.0 | % | 45,904 | — | — | % | 39,458 | — | — | % | 41,836 | — | —% | 65,880 | — | —% | 55,440 | — | —% | |||||||||||||||||||||||||||||||||||||||||||||||||||
| Total | 4,363,735 | 586,534 | 13.4 | % | 4,144,716 | 618,034 | 14.9 | % | 3,918,859 | 544,418 | 13.9 | % | 4,946,915 | 569,946 | 11.5 | % | 5,107,277 | 644,799 | 12.6 | % | 4,363,735 | 586,534 | 13.4 | % | ||||||||||||||||||||||||||||||||||||||||||||||||
| Mortgage loans | ||||||||||||||||||||||||||||||||||||||||||||||||||||||||||||||||||||||||
| Ch$ | 6,826 | 106 | 1.5 | % | 10,485 | 139 | 1.3 | % | 15,180 | 964 | 6.4 | % | 3,495 | 45 | 1.3 | % | 4,938 | 67 | 1.4 | % | 6,826 | 106 | 1.5 | % | ||||||||||||||||||||||||||||||||||||||||||||||||
| UF | 9,497,908 | 597,548 | 6.3 | % | 8,795,965 | 469,618 | 5.3 | % | 8,234,264 | 535,128 | 6.5 | % | 11,887,610 | 637,911 | 5.4 | % | 10,581,292 | 633,871 | 6.0 | % | 9,497,908 | 597,548 | 6.3 | % | ||||||||||||||||||||||||||||||||||||||||||||||||
| Foreign currency | — | — | 0.0 | % | — | — | — | % | — | — | — | % | — | — | —% | — | — | —% | — | — | —% | |||||||||||||||||||||||||||||||||||||||||||||||||||
| Total | 9,504,734 | 597,654 | 6.3 | % | 8,806,450 | 469,757 | 5.3 | % | 8,249,444 | 536,092 | 6.5 | % | 11,891,105 | 637,956 | 5.4 | % | 10,586,230 | 633,938 | 6.0 | % | 9,504,734 | 597,654 | 6.3 | % | ||||||||||||||||||||||||||||||||||||||||||||||||
| Interbank loans | ||||||||||||||||||||||||||||||||||||||||||||||||||||||||||||||||||||||||
| Ch$ | 35,178 | 897 | 2.6 | % | 37,188 | 969 | 2.6 | % | 8,291 | 295 | 3.6 | % | ||||||||||||||||||||||||||||||||||||||||||||||||||||||||||||
| UF | — | — | — | % | — | — | — | % | — | — | — | % | ||||||||||||||||||||||||||||||||||||||||||||||||||||||||||||
| Foreign currency | — | — | — | % | 1 | — | — | % | 2 | — | — | % | ||||||||||||||||||||||||||||||||||||||||||||||||||||||||||||
| Total | 35,178 | 897 | 2.6 | % | 37,189 | 969 | 2.6 | % | 8,293 | 295 | 3.6 | % | ||||||||||||||||||||||||||||||||||||||||||||||||||||||||||||
| Investment Agreements to resell | ||||||||||||||||||||||||||||||||||||||||||||||||||||||||||||||||||||||||
| Ch$ | 11,564 | 1,341 | 11.6 | % | 417 | 927 | 222.2 | % | 1,388 | 1,208 | 87.0 | % | ||||||||||||||||||||||||||||||||||||||||||||||||||||||||||||
| UF | 380 | — | — | % | 340 | 13 | 3.8 | % | — | 302 | — | % | ||||||||||||||||||||||||||||||||||||||||||||||||||||||||||||
| Foreign currency | — | — | — | % | — | — | — | % | — | 4 | — | % | ||||||||||||||||||||||||||||||||||||||||||||||||||||||||||||
| Total | 11,944 | 1,341 | 11.2 | % | 757 | 940 | 124.2 | % | 1,388 | 1,514 | 87.0 | % | ||||||||||||||||||||||||||||||||||||||||||||||||||||||||||||
| Threshold (2) | ||||||||||||||||||||||||||||||||||||||||||||||||||||||||||||||||||||||||
| Ch$ | 83,959 | 590 | 0.7 | % | 85,882 | 321 | 0.4 | % | 57,859 | 242 | 0.4 | % | ||||||||||||||||||||||||||||||||||||||||||||||||||||||||||||
| UF | 4 | — | — | % | 4 | — | — | % | 4 | — | — | % | ||||||||||||||||||||||||||||||||||||||||||||||||||||||||||||
| Foreign currency | 257,337 | 4,077 | 1.6 | % | 235,091 | 2,190 | 0.9 | % | 435,946 | 1,762 | 0.4 | % | ||||||||||||||||||||||||||||||||||||||||||||||||||||||||||||
| Total | 341,300 | 4,667 | 1.4 | % | 320,977 | 2,511 | 0.8 | % | 493,809 | 2,004 | 0.4 | % | ||||||||||||||||||||||||||||||||||||||||||||||||||||||||||||
| Total interest earning assets | ||||||||||||||||||||||||||||||||||||||||||||||||||||||||||||||||||||||||
| Ch$ | 13,019,695 | 1,120,110 | 8.6 | % | 12,317,700 | 1,183,515 | 9.6 | % | 11,684,475 | 1,161,787 | 9.9 | % | ||||||||||||||||||||||||||||||||||||||||||||||||||||||||||||
| UF | 15,897,874 | 992,523 | 6.2 | % | 14,139,235 | 764,750 | 5.4 | % | 13,150,312 | 871,380 | 6.6 | % | ||||||||||||||||||||||||||||||||||||||||||||||||||||||||||||
| Foreign currency | 3,842,64 | 131,684 | 3.4 | % | 4,138,124 | 110,181 | 2.7 | % | 4,836,524 | 103,953 | 2.1 | % | ||||||||||||||||||||||||||||||||||||||||||||||||||||||||||||
| Total | 32,760,203 | 2,244,317 | 6.9 | % | 30,595,059 | 2,058,446 | 6.7 | % | 29,671,311 | 2,137,120 | 7.2 | % | ||||||||||||||||||||||||||||||||||||||||||||||||||||||||||||
| Non-interest earning assets | ||||||||||||||||||||||||||||||||||||||||||||||||||||||||||||||||||||||||
| Cash | ||||||||||||||||||||||||||||||||||||||||||||||||||||||||||||||||||||||||
| Ch$ | 622,469 | 632,208 | 686,449 | |||||||||||||||||||||||||||||||||||||||||||||||||||||||||||||||||||||
| UF | — | — | — | |||||||||||||||||||||||||||||||||||||||||||||||||||||||||||||||||||||
| Foreign currency | 122,178 | 120,832 | 98,052 | |||||||||||||||||||||||||||||||||||||||||||||||||||||||||||||||||||||
| Total | 744,647 | 753,040 | 784,501 | |||||||||||||||||||||||||||||||||||||||||||||||||||||||||||||||||||||
| Allowance for loan losses | ||||||||||||||||||||||||||||||||||||||||||||||||||||||||||||||||||||||||
| Ch$ | (844,671 | ) | (841,415 | ) | (833,455 | ) | ||||||||||||||||||||||||||||||||||||||||||||||||||||||||||||||||||
| UF | — | — | — | |||||||||||||||||||||||||||||||||||||||||||||||||||||||||||||||||||||
| Foreign currency | (41 | ) | (118 | ) | (106 | ) | ||||||||||||||||||||||||||||||||||||||||||||||||||||||||||||||||||
| Total | (844,712 | ) | (841,533 | ) | (833,561 | ) | ||||||||||||||||||||||||||||||||||||||||||||||||||||||||||||||||||
| Fixed assets | ||||||||||||||||||||||||||||||||||||||||||||||||||||||||||||||||||||||||
| Ch$ | 225,115 | 237,409 | 220,919 | |||||||||||||||||||||||||||||||||||||||||||||||||||||||||||||||||||||
| UF | — | — | — | |||||||||||||||||||||||||||||||||||||||||||||||||||||||||||||||||||||
| Foreign currency | — | — | — | |||||||||||||||||||||||||||||||||||||||||||||||||||||||||||||||||||||
| Total | 225,115 | 237,409 | 220,919 | |||||||||||||||||||||||||||||||||||||||||||||||||||||||||||||||||||||
| Derivatives | ||||||||||||||||||||||||||||||||||||||||||||||||||||||||||||||||||||||||
| Ch$ | 2,186,596 | 2,360,426 | 2,940,584 | |||||||||||||||||||||||||||||||||||||||||||||||||||||||||||||||||||||
| UF | — | — | — | |||||||||||||||||||||||||||||||||||||||||||||||||||||||||||||||||||||
| Foreign currency | — | — | — | |||||||||||||||||||||||||||||||||||||||||||||||||||||||||||||||||||||
| Total | 2,186,596 | 2,360,426 | 2,940,584 | |||||||||||||||||||||||||||||||||||||||||||||||||||||||||||||||||||||
109
| For the year ended December 31, | ||||||||||||||||||||||||||||||||||||
| 2018 | 2017 | 2016 | ||||||||||||||||||||||||||||||||||
| Average Balance | Interest Earned | Average Nominal Rate | Average Balance | Interest Earned | Average Nominal Rate | Average Balance | Interest Earned | Average Nominal Rate | ||||||||||||||||||||||||||||
| Financial Investment (Trading) | ||||||||||||||||||||||||||||||||||||
| Ch$ | 167,090 | 231,878 | 177,617 | |||||||||||||||||||||||||||||||||
| UF | 92,164 | 260,526 | 122,113 | |||||||||||||||||||||||||||||||||
| Foreign currency | 49,520 | 18,173 | 32,496 | |||||||||||||||||||||||||||||||||
| Total | 308,774 | 510,577 | 332,226 | |||||||||||||||||||||||||||||||||
| Other assets | ||||||||||||||||||||||||||||||||||||
| Ch$ | 1,345,349 | 1,276,197 | 1,246,306 | |||||||||||||||||||||||||||||||||
| UF | 74,713 | 77,338 | 69,335 | |||||||||||||||||||||||||||||||||
| Foreign currency | 412,657 | 552,715 | 812,400 | |||||||||||||||||||||||||||||||||
| Total | 1,832,719 | 1,906,250 | 2,128,041 | |||||||||||||||||||||||||||||||||
| Total non-interest earning assets | ||||||||||||||||||||||||||||||||||||
| Ch$ | 3,701,948 | 3,896,703 | 4,438,420 | |||||||||||||||||||||||||||||||||
| UF | 166,877 | 337,864 | 191,448 | |||||||||||||||||||||||||||||||||
| Foreign currency | 584,314 | 691,602 | 942,842 | |||||||||||||||||||||||||||||||||
| Total | 4,453,139 | 4,926,169 | 5,572,710 | |||||||||||||||||||||||||||||||||
| Total assets | ||||||||||||||||||||||||||||||||||||
| Ch$ | 16,721,643 | 1,120,110 | 16,214,403 | 1,183,515 | 16,122,895 | 1,161,787 | ||||||||||||||||||||||||||||||
| UF | 16,064,751 | 992,523 | 14,477,099 | 764,750 | 13,341,760 | 871,380 | ||||||||||||||||||||||||||||||
| Foreign currency | 4,426,948 | 131,684 | 4,829,725 | 110,181 | 5,779,366 | 103,953 | ||||||||||||||||||||||||||||||
| Total | 37,213,342 | 2,244,317 | 35,521,227 | 2,058,446 | 35,244,021 | 2,137,120 | ||||||||||||||||||||||||||||||
| Liabilities And Share-Holders’ Equity | ||||||||||||||||||||||||||||||||||||
| Interest bearing liabilities | ||||||||||||||||||||||||||||||||||||
| Savings accounts | ||||||||||||||||||||||||||||||||||||
| Ch$ | 1,830 | 5 | 0.3 | % | 1,677 | 4 | 0.3 | % | 1,503 | 4 | 0.3 | % | ||||||||||||||||||||||||
| UF | 116,055 | 3,130 | 2.7 | % | 115,628 | 1,881 | 1.6 | % | 114,836 | 2,949 | 2.6 | % | ||||||||||||||||||||||||
| Foreign currency | — | — | — | % | — | — | — | % | — | — | — | % | ||||||||||||||||||||||||
| Total | 117,885 | 3,135 | 2.7 | % | 117,305 | 1,885 | 1.6 | % | 116,339 | 2,953 | 2.5 | % | ||||||||||||||||||||||||
| Time deposits | ||||||||||||||||||||||||||||||||||||
| Ch$ | 9,792,164 | 289,990 | 3.0 | % | 9,506,696 | 318,803 | 3.4 | % | 9,545,050 | 387,566 | 4.1 | % | ||||||||||||||||||||||||
| UF | 1,133,420 | 45,401 | 4.0 | % | 1,141,258 | 35,196 | 3.1 | % | 1,299,866 | 54,320 | 4.2 | % | ||||||||||||||||||||||||
| Foreign currency | 2,229,332 | 28,581 | 1.3 | % | 2,498,566 | 20,718 | 0.8 | % | 2,775,932 | 9,873 | 0.4 | % | ||||||||||||||||||||||||
| Total | 13,154,916 | 363,972 | 2.8 | % | 13,146,520 | 374,717 | 2.9 | % | 13,620,848 | 451,759 | 3.3 | % | ||||||||||||||||||||||||
| Central bank borrowings | ||||||||||||||||||||||||||||||||||||
| Ch$ | — | 114 | — | % | — | 64 | — | % | 858 | 29 | 3.4 | % | ||||||||||||||||||||||||
| UF | 4 | — | 6.0 | % | 6 | — | 2.2 | % | 14 | 1 | 3.9 | % | ||||||||||||||||||||||||
| Foreign currency | — | — | — | % | — | — | — | % | — | — | — | % | ||||||||||||||||||||||||
| Total | 4 | 114 | 6.0 | % | 6 | 64 | 2.2 | % | 871 | 29 | 3.4 | % | ||||||||||||||||||||||||
| Repurchase Agreements | ||||||||||||||||||||||||||||||||||||
| Ch$ | 184,458 | 4,632 | 2.5 | % | 254,006 | 5,676 | 2.2 | % | 108,902 | 2,812 | 2.6 | % | ||||||||||||||||||||||||
| UF | 2 | — | — | % | — | — | — | % | — | — | — | % | ||||||||||||||||||||||||
| Foreign currency | 107,453 | 2,036 | 1.9 | % | 40,362 | 1,076 | 2.7 | % | 12,973 | 58 | 0.4 | % | ||||||||||||||||||||||||
| Total | 291,913 | 6,668 | 2.3 | % | 294,368 | 6,752 | 2.3 | % | 121,875 | 2,870 | 2.4 | % | ||||||||||||||||||||||||
| Mortgage finance bonds | ||||||||||||||||||||||||||||||||||||
| Ch$ | — | — | — | % | — | — | — | % | — | — | — | % | ||||||||||||||||||||||||
| UF | 28,685 | 2,305 | 8.0 | % | 38,714 | 2,709 | 7.0 | % | 52,414 | 4,258 | 8.1 | % | ||||||||||||||||||||||||
| Foreign currency | — | — | — | % | — | — | — | % | — | — | — | % | ||||||||||||||||||||||||
| Total | 28,685 | 2,305 | 8.0 | % | 38,714 | 2,709 | 7.0 | % | 52,414 | 4,258 | 8.1 | % | ||||||||||||||||||||||||
| Other interest bearing liabilities | ||||||||||||||||||||||||||||||||||||
| Ch$ | 1,305,791 | 81,616 | 6.3 | % | 1,198,933 | 69,592 | 5.8 | % | 857,325 | 100,810 | 11.8 | % | ||||||||||||||||||||||||
| UF | 4,778,773 | 278,362 | 5.8 | % | 4,590,260 | 217,116 | 4.7 | % | 3,903,076 | 238,721 | 6.1 | % | ||||||||||||||||||||||||
| Foreign currency | 3,316,911 | 93,777 | 2.8 | % | 2,842,935 | 58,918 | 2.1 | % | 3,095,800 | 54,356 | 1.8 | % | ||||||||||||||||||||||||
| Total | 9,401,475 | 453,755 | 4.8 | % | 8,632,128 | 345,626 | 4.0 | % | 7,856,201 | 393,886 | 5.0 | % | ||||||||||||||||||||||||
| Total interest bearing liabilities | ||||||||||||||||||||||||||||||||||||
| Ch$ | 11,284,243 | 376,357 | 3.3 | % | 10,961,312 | 394,139 | 3.6 | % | 10,513,637 | 491,220 | 4.7 | % | ||||||||||||||||||||||||
| UF | 6,056,939 | 329,198 | 5.4 | % | 5,885,866 | 256,903 | 4.4 | % | 5,370,205 | 300,249 | 5.6 | % | ||||||||||||||||||||||||
| Foreign currency | 5,653,696 | 124,394 | 2.2 | % | 5,381,863 | 80,712 | 1.5 | % | 5,884,705 | 64,286 | 1.1 | % | ||||||||||||||||||||||||
| Total | 22,994,878 | 829,949 | 3.6 | % | 22,229,041 | 731,754 | 3.3 | % | 21,768,547 | 855,755 | 3.9 | % | ||||||||||||||||||||||||
| Non-interest bearing liabilities | ||||||||||||||||||||||||||||||||||||
| Non-interest bearing demand deposits | ||||||||||||||||||||||||||||||||||||
| Ch$ | 6,561,631 | 5,980,167 | 5,633,226 | |||||||||||||||||||||||||||||||||
| UF | 47,091 | 41,129 | 39,075 | |||||||||||||||||||||||||||||||||
| Foreign currency | 154,824 | 96,348 | 81,321 | |||||||||||||||||||||||||||||||||
| Total | 6,763,546 | 6,117,644 | 5,753,622 | |||||||||||||||||||||||||||||||||
| For the year ended December 31, | ||||||||||||||||||||||||||||||||||||
| 2020 | 2019 | 2018 | ||||||||||||||||||||||||||||||||||
| Average Balance | Interest Earned | Average Nominal Rate | Average Balance | Interest Earned | Average Nominal Rate | Average Balance | Interest Earned | Ave rage Nominal Rate | ||||||||||||||||||||||||||||
| Interbank loans | ||||||||||||||||||||||||||||||||||||
| Ch$ | 3,709 | 36 | 1.0 | % | 35,415 | 1,263 | 3.6 | % | 35,178 | 897 | 2.6 | % | ||||||||||||||||||||||||
| UF | — | — | —% | — | — | —% | — | — | —% | |||||||||||||||||||||||||||
| Foreign currency | — | — | —% | — | — | —% | — | — | —% | |||||||||||||||||||||||||||
| Total | 3,709 | 36 | 1.0 | % | 35,415 | 1,263 | 3.6 | % | 35,178 | 897 | 2.6 | % | ||||||||||||||||||||||||
| Investment agreements to resell | ||||||||||||||||||||||||||||||||||||
| Ch$ | (3,069 | ) | 290 | (9.5 | %) | 14,638 | 1,481 | 10.1 | % | 11,564 | 1,341 | 11.6 | % | |||||||||||||||||||||||
| UF | 342 | — | —% | 149 | 42 | 27.9 | % | 380 | — | —% | ||||||||||||||||||||||||||
| Foreign currency | 4,485 | — | —% | — | — | —% | — | — | —% | |||||||||||||||||||||||||||
| Total | 1,758 | 290 | 16.5 | % | 14,787 | 1,523 | 10.3 | % | 11,944 | 1,341 | 11.2 | % | ||||||||||||||||||||||||
| Threshold (2) | ||||||||||||||||||||||||||||||||||||
| Ch$ | 374,624 | 163 | 0.0 | % | 95,994 | 372 | 0.4 | % | 83,959 | 590 | 0.7 | % | ||||||||||||||||||||||||
| UF | 148,612 | — | —% | 4 | — | —% | 4 | — | —% | |||||||||||||||||||||||||||
| Foreign currency | 560,394 | 1,796 | 0.3 | % | 387,273 | 4,958 | 1.3 | % | 257,337 | 4,077 | 1.6 | % | ||||||||||||||||||||||||
| Total | 1,083,630 | 1,959 | 0.2 | % | 483,271 | 5,330 | 1.1 | % | 341,300 | 4,667 | 1.4 | % | ||||||||||||||||||||||||
| Total interest earning assets | ||||||||||||||||||||||||||||||||||||
| Ch$ | 16,734,192 | 1,039,172 | 6.2 | % | 13,910,911 | 1,143,885 | 8.2 | % | 13,019,695 | 1,120,110 | 8.6 | % | ||||||||||||||||||||||||
| UF | 19,923,379 | 1,041,707 | 5.2 | % | 17,553,026 | 1,027,094 | 5.9 | % | 15,897,874 | 992,523 | 6.2 | % | ||||||||||||||||||||||||
| Foreign currency | 5,581,816 | 151,448 | 2.7 | % | 4,386,316 | 150,402 | 3.4 | % | 3,842,64 | 131,684 | 3.4 | % | ||||||||||||||||||||||||
| Total | 42,239,387 | 2,232,327 | 5.3 | % | 35,850,253 | 2,321,381 | 6.5 | % | 32,760,203 | 2,244,317 | 6.9 | % | ||||||||||||||||||||||||
| Non-interest earning assets | ||||||||||||||||||||||||||||||||||||
| Cash | ||||||||||||||||||||||||||||||||||||
| Ch$ | 812,285 | 723,924 | 622,469 | |||||||||||||||||||||||||||||||||
| UF | — | — | — | |||||||||||||||||||||||||||||||||
| Foreign currency | 118,930 | 121,966 | 122,178 | |||||||||||||||||||||||||||||||||
| Total | 931,215 | 845,890 | 744,647 | |||||||||||||||||||||||||||||||||
| Allowance for loan losses | ||||||||||||||||||||||||||||||||||||
| Ch$ | (1,031,368 | ) | (848,776 | ) | (844,671 | ) | ||||||||||||||||||||||||||||||
| UF | — | — | — | |||||||||||||||||||||||||||||||||
| Foreign currency | (10 | ) | (17 | ) | (41 | ) | ||||||||||||||||||||||||||||||
| Total | (1,031,378 | ) | (848,793 | ) | (844,712 | ) | ||||||||||||||||||||||||||||||
| Fixed assets | ||||||||||||||||||||||||||||||||||||
| Ch$ | 205,251 | 90,157 | 225,115 | |||||||||||||||||||||||||||||||||
| UF | — | — | — | |||||||||||||||||||||||||||||||||
| Foreign currency | — | — | — | |||||||||||||||||||||||||||||||||
| Total | 205,251 | 90,157 | 225,115 | |||||||||||||||||||||||||||||||||
| Derivatives | ||||||||||||||||||||||||||||||||||||
| Ch$ | 10,474,854 | 4,617,101 | 2,186,596 | |||||||||||||||||||||||||||||||||
| UF | — | — | — | |||||||||||||||||||||||||||||||||
| Foreign currency | — | — | — | |||||||||||||||||||||||||||||||||
| Total | 10,474,854 | 4,617,101 | 2,186,596 | |||||||||||||||||||||||||||||||||
| Financial Investment (Trading) | ||||||||||||||||||||||||||||||||||||
| Ch$ | 260,368 | 133,743 | 167,090 | |||||||||||||||||||||||||||||||||
| UF | 90,303 | 75,187 | 92,164 | |||||||||||||||||||||||||||||||||
| Foreign currency | 101,224 | 114,922 | 49,520 | |||||||||||||||||||||||||||||||||
| Total | 451,895 | 323,852 | 308,774 | |||||||||||||||||||||||||||||||||
| Other assets | ||||||||||||||||||||||||||||||||||||
| Ch$ | 1,422,348 | 1,792,250 | 1,345,349 | |||||||||||||||||||||||||||||||||
| UF | 194,257 | 77,148 | 74,713 | |||||||||||||||||||||||||||||||||
| Foreign currency | 943,706 | 482,155 | 412,657 | |||||||||||||||||||||||||||||||||
| Total | 2,560,311 | 2,351,553 | 1,832,719 | |||||||||||||||||||||||||||||||||
110
| For the year ended December 31, | ||||||||||||||||||||||||||||||||||||
| 2018 | 2017 | 2016 | ||||||||||||||||||||||||||||||||||
| Average Balance | Interest Earned | Average Nominal Rate | Average Balance | Interest Earned | Average Nominal Rate | Average Balance | Interest Earned | Average Nominal Rate | ||||||||||||||||||||||||||||
| Derivatives | ||||||||||||||||||||||||||||||||||||
| Ch$ | 2,020,857 | 2,175,063 | 2,724,994 | |||||||||||||||||||||||||||||||||
| UF | — | — | — | |||||||||||||||||||||||||||||||||
| Foreign currency | — | — | — | |||||||||||||||||||||||||||||||||
| Total | 2,020,857 | 2,175,063 | 2,724,994 | |||||||||||||||||||||||||||||||||
| Other non-interest bearing liabilities | ||||||||||||||||||||||||||||||||||||
| Ch$ | 946,965 | 932,082 | 884,290 | |||||||||||||||||||||||||||||||||
| UF | 405,225 | 301,516 | 339,168 | |||||||||||||||||||||||||||||||||
| Foreign currency | 818,716 | 764,201 | 932,557 | |||||||||||||||||||||||||||||||||
| Total | 2,170,906 | 1,997,799 | 2,156,015 | |||||||||||||||||||||||||||||||||
| Shareholders’ equity | ||||||||||||||||||||||||||||||||||||
| Ch$ | 3,263,155 | 3,001,686 | 2,840,846 | |||||||||||||||||||||||||||||||||
| UF | — | — | — | |||||||||||||||||||||||||||||||||
| Foreign currency | — | (6 | ) | (4 | ) | |||||||||||||||||||||||||||||||
| Total | 3,263,155 | 3,001,680 | 2,840,843 | |||||||||||||||||||||||||||||||||
| Total non-interest bearing liabilities and shareholders’ equity | ||||||||||||||||||||||||||||||||||||
| Ch$ | 12,792,608 | 12,088,998 | 12,083,356 | |||||||||||||||||||||||||||||||||
| UF | 452,316 | 342,645 | 378,243 | |||||||||||||||||||||||||||||||||
| Foreign currency | 973,540 | 860,543 | 1,013,875 | |||||||||||||||||||||||||||||||||
| Total | 14,218,464 | 13,292,186 | 13,475,473 | |||||||||||||||||||||||||||||||||
| Total Liabilities and Share-Holders’ Equity | ||||||||||||||||||||||||||||||||||||
| Ch$ | 24,076,851 | 376,357 | 23,050,311 | 394,139 | 22,596,993 | 491,220 | ||||||||||||||||||||||||||||||
| UF | 6,509,255 | 329,198 | 6,228,511 | 256,903 | 5,748,447 | 300,249 | ||||||||||||||||||||||||||||||
| Foreign currency | 6,627,236 | 124,394 | 6,242,406 | 80,712 | 6,898,580 | 64,286 | ||||||||||||||||||||||||||||||
| Total | 37,213,342 | 829,949 | 35,521,228 | 731,754 | 35,244,021 | 855,755 | ||||||||||||||||||||||||||||||
| For the year ended December 31, | ||||||||||||||||||||||||||||||||||||
| 2020 | 2019 | 2018 | ||||||||||||||||||||||||||||||||||
| Average Balance | Interest Earned | Average Nominal Rate | Average Balance | Interest Earned | Average Nominal Rate | Average Balance | Interest Earned | Ave rage Nominal Rate | ||||||||||||||||||||||||||||
| Total non-interest earning assets | ||||||||||||||||||||||||||||||||||||
| Ch$ | 12,143,738 | 6,508,399 | 3,701,948 | |||||||||||||||||||||||||||||||||
| UF | 284,560 | 152,335 | 166,877 | |||||||||||||||||||||||||||||||||
| Foreign currency | 1,163,850 | 719,026 | 584,314 | |||||||||||||||||||||||||||||||||
| Total | 13,592,148 | 7,379,760 | 4,453,139 | |||||||||||||||||||||||||||||||||
| Total assets | ||||||||||||||||||||||||||||||||||||
| Ch$ | 28,877,930 | 1,039,172 | 20,419,310 | 1,143,772 | 16,721,643 | 1,120,110 | ||||||||||||||||||||||||||||||
| UF | 20,207,940 | 1,041,707 | 17,705,361 | 1,027,094 | 16,064,751 | 992,523 | ||||||||||||||||||||||||||||||
| Foreign currency | 6,745,666 | 151,448 | 5,105,342 | 150,402 | 4,426,948 | 131,684 | ||||||||||||||||||||||||||||||
| Total | 55,831,535 | 2,232,327 | 43,230,013 | 2,321,268 | 37,213,342 | 2,244,317 | ||||||||||||||||||||||||||||||
| For the year ended December 31, | ||||||||||||||||||||||||||||||||||||
| 2020 | 2019 | 2018 | ||||||||||||||||||||||||||||||||||
| Average Balance | Interest Earned | Average Nominal Rate | Average Balance | Interest Earned | Average Nominal Rate | Average Balance | Interest Earned | Ave rage Nominal Rate | ||||||||||||||||||||||||||||
| Liabilities And Shareholders’ Equity | ||||||||||||||||||||||||||||||||||||
| Interest bearing liabilities | ||||||||||||||||||||||||||||||||||||
| Savings accounts | ||||||||||||||||||||||||||||||||||||
| Ch$ | 2,224 | 6 | 0.3 | % | 1,874 | 5 | 0.3 | % | 1,830 | 5 | 0.3 | % | ||||||||||||||||||||||||
| UF | 136,447 | 3,438 | 2.5 | % | 119,022 | 3,043 | 2.6 | % | 116,055 | 3,130 | 2.7 | % | ||||||||||||||||||||||||
| Foreign currency | — | — | 0.0 | % | — | — | —% | — | — | —% | ||||||||||||||||||||||||||
| Total | 138,671 | 3,443 | 2.5 | % | 120,896 | 3,048 | 2.5 | % | 117,885 | 3,135 | 2.7 | % | ||||||||||||||||||||||||
| Time deposits | ||||||||||||||||||||||||||||||||||||
| Ch$ | 10,237,170 | 121,926 | 1.2 | % | 10,674,547 | 291,100 | 2.7 | % | 9,792,164 | 289,990 | 3.0 | % | ||||||||||||||||||||||||
| UF | 655,923 | 23,321 | 3.6 | % | 1,004,456 | 33,744 | 3.4 | % | 1,133,420 | 45,401 | 4.0 | % | ||||||||||||||||||||||||
| Foreign currency | 3,355,384 | 19,119 | 0.6 | % | 2,100,531 | 27,612 | 1.3 | % | 2,229,332 | 28,581 | 1.3 | % | ||||||||||||||||||||||||
| Total | 14,248,478 | 164,367 | 1.2 | % | 13,779,534 | 352,456 | 2.6 | % | 13,154,916 | 363,972 | 2.8 | % | ||||||||||||||||||||||||
| Central bank borrowings | ||||||||||||||||||||||||||||||||||||
| Ch$ | 2,881,600 | 21 | 0.0 | % | — | — | —% | — | 114 | —% | ||||||||||||||||||||||||||
| UF | — | — | —% | — | — | —% | 4 | — | 6.0 | % | ||||||||||||||||||||||||||
| Foreign currency | — | — | —% | — | — | —% | — | — | —% | |||||||||||||||||||||||||||
| Total | 2,881,600 | 21 | 0.0 | % | — | — | —% | 4 | 114 | 6.0 | % | |||||||||||||||||||||||||
| Repurchase Agreements | ||||||||||||||||||||||||||||||||||||
| Ch$ | 164,468 | 2,037 | 1.2 | % | 237,937 | 10,181 | 4.3 | % | 184,458 | 4,632 | 2.5 | % | ||||||||||||||||||||||||
| UF | - | 28 | 0.0 | % | — | 1 | —% | 2 | — | —% | ||||||||||||||||||||||||||
| Foreign currency | 78,812 | - | -% | 177,014 | 36 | —% | 107,453 | 2,036 | 1.9 | % | ||||||||||||||||||||||||||
| Total | 243,280 | 2,066 | 0.8 | % | 414,951 | 10,218 | 2.5 | % | 291,913 | 6,668 | 2.3 | % | ||||||||||||||||||||||||
| Mortgage finance bonds | ||||||||||||||||||||||||||||||||||||
| Ch$ | — | — | —% | — | — | —% | — | — | —% | |||||||||||||||||||||||||||
| UF | 14,580 | 1,112 | 7.6 | % | 20,923 | 1,611 | 7.7 | % | 28,685 | 2,305 | 8.0 | % | ||||||||||||||||||||||||
| Foreign currency | - | - | -% | — | — | —% | — | — | —% | |||||||||||||||||||||||||||
| Total | 14,580 | 1,112 | 7.6 | % | 20,923 | 1,611 | 7.7 | % | 28,685 | 2,305 | 8.0 | % | ||||||||||||||||||||||||
| Other interest bearing liabilities | ||||||||||||||||||||||||||||||||||||
| Ch$ | 1,364,789 | 71,351 | 5.2 | % | 1,718,861 | 115,923 | 6.7 | % | 1,305,791 | 81,616 | 6.3 | % | ||||||||||||||||||||||||
| UF | 5,197,993 | 295,984 | 5.7 | % | 5,503,352 | 302,825 | 5.5 | % | 4,778,773 | 278,362 | 5.8 | % | ||||||||||||||||||||||||
| Foreign currency | 4,639,853 | 100,135 | 2.2 | % | 4,039,316 | 118,336 | 2.9 | % | 3,316,911 | 93,777 | 2.8 | % | ||||||||||||||||||||||||
| Total | 11,202,635 | 467,471 | 4.2 | % | 11,261,529 | 537,084 | 4.8 | % | 9,401,475 | 453,755 | 4.8 | % | ||||||||||||||||||||||||
| Total interest bearing liabilities | ||||||||||||||||||||||||||||||||||||
| Ch$ | 14,650,251 | 195,342 | 1.3 | % | 12,633,219 | 417,209 | 3.3 | % | 11,284,243 | 376,357 | 3.3 | % | ||||||||||||||||||||||||
| UF | 6,004,944 | 323,882 | 5.4 | % | 6,647,753 | 341,224 | 5.1 | % | 6,056,939 | 329,198 | 5.4 | % | ||||||||||||||||||||||||
| Foreign currency | 8,074,049 | 119,255 | 1.5 | % | 6,316,861 | 145,984 | 2.3 | % | 5,653,696 | 124,394 | 2.2 | % | ||||||||||||||||||||||||
| Total | 28,729,244 | 638,479 | 2.2 | % | 25,597,833 | 904,417 | 3.5 | % | 22,994,878 | 829,949 | 3.6 | % | ||||||||||||||||||||||||
111
(1) For the period ending December 31, 2018 this line item includes debt instruments at fair value through other comprehensive income according to IFRS 9. For previous years, this line item consistsTable of available for sale instruments.Contents
| For the year ended December 31, | ||||||||||||||||||||||||||||||||||||
| 2020 | 2019 | 2018 | ||||||||||||||||||||||||||||||||||
| Average Balance | Interest Earned | Average Nominal Rate | Average Balance | Interest Earned | Average Nominal Rate | Average Balance | Interest Earned | Ave rage Nominal Rate | ||||||||||||||||||||||||||||
| Non-interest bearing liabilities | ||||||||||||||||||||||||||||||||||||
| Non-interest bearing demand deposits | ||||||||||||||||||||||||||||||||||||
| Ch$ | 10,066,738 | 7,282,508 | 6,561,631 | |||||||||||||||||||||||||||||||||
| UF | 56,330 | 56,262 | 47,091 | |||||||||||||||||||||||||||||||||
| Foreign currency | 280,280 | 128,221 | 154,824 | |||||||||||||||||||||||||||||||||
| Total | 10,403,347 | 7,466,991 | 6,763,546 | |||||||||||||||||||||||||||||||||
| Derivatives | ||||||||||||||||||||||||||||||||||||
| Ch$ | 9,793,162 | 4,165,330 | 2,020,857 | |||||||||||||||||||||||||||||||||
| UF | — | — | — | |||||||||||||||||||||||||||||||||
| Foreign currency | — | — | — | |||||||||||||||||||||||||||||||||
| Total | 9,793,162 | 4,165,330 | 2,020,857 | |||||||||||||||||||||||||||||||||
| Other non-interest bearing liabilities | ||||||||||||||||||||||||||||||||||||
| Ch$ | 1,181,832 | 1,115,058 | 946,965 | |||||||||||||||||||||||||||||||||
| UF | 586,273 | 447,362 | 405,225 | |||||||||||||||||||||||||||||||||
| Foreign currency | 1,403,435 | 986,710 | 818,716 | |||||||||||||||||||||||||||||||||
| Total | 3,171,540 | 2,549,130 | 2,170,906 | |||||||||||||||||||||||||||||||||
| Shareholders’ equity | ||||||||||||||||||||||||||||||||||||
| Ch$ | 3,734,243 | 3,450,729 | 3,263,155 | |||||||||||||||||||||||||||||||||
| UF | — | — | — | |||||||||||||||||||||||||||||||||
| Foreign currency | — | — | — | |||||||||||||||||||||||||||||||||
| Total | 3,734,243 | 3,450,729 | 3,263,155 | |||||||||||||||||||||||||||||||||
| Total non-interest bearing liabilities and shareholders’ equity | ||||||||||||||||||||||||||||||||||||
| Ch$ | 24,775,974 | 16,013,625 | 12,792,608 | |||||||||||||||||||||||||||||||||
| UF | 642,602 | 503,624 | 452,316 | |||||||||||||||||||||||||||||||||
| Foreign currency | 1,683,715 | �� | 1,114,931 | 973,540 | ||||||||||||||||||||||||||||||||
| Total | 27,102,291 | 17,632,180 | 14,218,464 | |||||||||||||||||||||||||||||||||
| Total Liabilities and Shareholders’ Equity | ||||||||||||||||||||||||||||||||||||
| Ch$ | 39,426,226 | 195,342 | 28,646,844 | 417,209 | 24,076,851 | 376,357 | ||||||||||||||||||||||||||||||
| UF | 6,647,546 | 323,882 | 7,151,377 | 341,224 | 6,509,255 | 329,198 | ||||||||||||||||||||||||||||||
| Foreign currency | 9,757,764 | 119,255 | 7,431,792 | 145,984 | 6,627,236 | 124,394 | ||||||||||||||||||||||||||||||
| Total | 55,831,535 | 638,479 | 43,230,013 | 904,417 | 37,213,342 | 829,949 | ||||||||||||||||||||||||||||||
____________________
| (1) | For the periods ending December 31, 2020, 2019 and 2018 this line item includes debt instruments at fair value through other comprehensive income according to IFRS 9. |
(2)
| (2) | Threshold is the asset generated when we post collateral for a derivative with a counterparty that has negative mark-to-market for us. Some Central Security Depository agreements permit this collateral to generate interest at the overnight rate and this is the source of interest income associated with this asset. |
112
Changes in Net Interest Revenue and Interest Expense: Volume and Rate Analysis
The following table allocates, by currency of denomination, changes in our net interest revenue and interest expense between changes in the average volume of interest-earning assets and interest-bearing liabilities and changes in their respective nominal interest rates for 20182020 compared to 20172019 and 2019 compared to 2016 and 2017 compared to 2016.2018. Volume and rate variances have been calculated based on movements in average balances over the period and changes in nominal interest rates on average interest-earning assets and average interest-bearing liabilities.
| Increase (Decrease) from 2017 to 2018 Due to Changes in | Increase (Decrease) from 2016 to 2017 Due to Changes in | Increase (Decrease) from 2019 to 2020 Due to Changes in | Increase (Decrease) from 2018 to 2019 Due to Changes in | |||||||||||||||||||||||||||||||||||||||||||||
| Volume | Rate | Net Change from 2017 to 2018 | Volume | Rate | Net Change from 2016 to 2017 | Volume | Rate | Net Change from 2019 to 2020 | Volume | Rate | Net Change from 2018 to 2019 | |||||||||||||||||||||||||||||||||||||
| Assets | ||||||||||||||||||||||||||||||||||||||||||||||||
| Interest earning assets | ||||||||||||||||||||||||||||||||||||||||||||||||
| Deposits in Central Bank | ||||||||||||||||||||||||||||||||||||||||||||||||
| Ch$ | 2,602 | (1,067 | ) | 1,535 | (125 | ) | (876 | ) | (1,001 | ) | (177 | ) | 3 | (174 | ) | (451 | ) | (4,657 | ) | (5,108 | ) | |||||||||||||||||||||||||||
| UF | — | — | — | — | — | — | 0 | 0 | 0 | — | — | — | ||||||||||||||||||||||||||||||||||||
| Foreign currency | — | — | — | — | — | — | 0 | 0 | 0 | — | — | — | ||||||||||||||||||||||||||||||||||||
| Subtotal | 2,602 | (1,067 | ) | 1,535 | (125 | ) | (876 | ) | (1,001 | ) | (177 | ) | 3 | (174 | ) | (451 | ) | (4,657 | ) | (5,108 | ) | |||||||||||||||||||||||||||
| Financial investments | ||||||||||||||||||||||||||||||||||||||||||||||||
| Ch$ | (5,103 | ) | (22,002 | ) | (27,105 | ) | 1,928 | 11,606 | 13,534 | 19,621 | (1,311 | ) | 18,310 | 1,315 | (29,459 | ) | (28,144 | ) | ||||||||||||||||||||||||||||||
| UF | 14,382 | 2,012 | 16,394 | 811 | (18,837 | ) | (18,026 | ) | ||||||||||||||||||||||||||||||||||||||||
| Foreign currency | 7,617 | (38 | ) | 7,580 | (111 | ) | 15 | (96 | ) | |||||||||||||||||||||||||||||||||||||||
| Subtotal | 41,620 | 663 | 42,283 | 2,015 | (48,281 | ) | (46,266 | ) | ||||||||||||||||||||||||||||||||||||||||
| Commercial loans | �� | |||||||||||||||||||||||||||||||||||||||||||||||
| Ch$ | (98,615 | ) | 53,076 | (45,539 | ) | 1,390 | (3,074 | ) | (1,684 | ) | ||||||||||||||||||||||||||||||||||||||
| UF | (8,234 | ) | 2,646 | (5,587 | ) | 129,183 | (112,754 | ) | 16,429 | |||||||||||||||||||||||||||||||||||||||
| Foreign currency | (4,214 | ) | 844 | (3,371 | ) | 10,461 | 7,472 | 17,933 | ||||||||||||||||||||||||||||||||||||||||
| Subtotal | (111,063 | ) | 56,565 | (54,497 | ) | 141,034 | (108,356 | ) | 32,678 | |||||||||||||||||||||||||||||||||||||||
| Consumer loans | ||||||||||||||||||||||||||||||||||||||||||||||||
| Ch$ | (30,668 | ) | (43,994 | ) | (74,662 | ) | 134,945 | (76,484 | ) | 58,461 | ||||||||||||||||||||||||||||||||||||||
| UF | (194 | ) | 2 | (192 | ) | (92 | ) | (103 | ) | (196 | ) | |||||||||||||||||||||||||||||||||||||
| Foreign currency | 0 | (0 | ) | 0 | — | — | — | |||||||||||||||||||||||||||||||||||||||||
| Subtotal | (30,862 | ) | (43,992 | ) | (74,854 | ) | 134,853 | (76,587 | ) | 58,265 | ||||||||||||||||||||||||||||||||||||||
| Mortgage loans | ||||||||||||||||||||||||||||||||||||||||||||||||
| Ch$ | (21 | ) | (0 | ) | (21 | ) | (94 | ) | 55 | (39 | ) | |||||||||||||||||||||||||||||||||||||
| UF | 5,435 | (1,395 | ) | 4,040 | 191,144 | (154,822 | ) | 36,322 | ||||||||||||||||||||||||||||||||||||||||
| Foreign currency | 0 | 0 | 0 | — | — | — | ||||||||||||||||||||||||||||||||||||||||||
| Subtotal | 5,413 | (1,395 | ) | 4,019 | 191,050 | (154,767 | ) | 36,283 | ||||||||||||||||||||||||||||||||||||||||
| Interbank loans | ||||||||||||||||||||||||||||||||||||||||||||||||
| Ch$ | (1,208 | ) | (19 | ) | (1,227 | ) | — | 366 | 366 | |||||||||||||||||||||||||||||||||||||||
| UF | — | — | — | — | — | — | ||||||||||||||||||||||||||||||||||||||||||
| Foreign currency | — | — | — | — | — | — | ||||||||||||||||||||||||||||||||||||||||||
| Subtotal | (1,208 | ) | (19 | ) | (1,227 | ) | — | 366 | 366 | |||||||||||||||||||||||||||||||||||||||
| Investment under agreement to resell | ||||||||||||||||||||||||||||||||||||||||||||||||
| Ch$ | (1,363 | ) | 172 | (1,191 | ) | 697 | (556 | ) | 140 | |||||||||||||||||||||||||||||||||||||||
| UF | 958 | (999 | ) | (42 | ) | 5 | 36 | 42 | ||||||||||||||||||||||||||||||||||||||||
| Foreign currency | 0 | 0 | 0 | — | — | — | ||||||||||||||||||||||||||||||||||||||||||
| Subtotal | (405 | ) | (827 | ) | (1,233 | ) | 702 | (520 | ) | 182 | ||||||||||||||||||||||||||||||||||||||
| Threshold | ||||||||||||||||||||||||||||||||||||||||||||||||
| Ch$ | (215 | ) | 6 | (209 | ) | (92 | ) | (126 | ) | (218 | ) | |||||||||||||||||||||||||||||||||||||
| UF | — | — | — | — | — | — | ||||||||||||||||||||||||||||||||||||||||||
| Foreign currency | (3,611 | ) | 449 | (3,162 | ) | 953 | (72 | ) | 881 | |||||||||||||||||||||||||||||||||||||||
| Subtotal | (3,826 | ) | 455 | (3,371 | ) | 861 | (198 | ) | 663 | |||||||||||||||||||||||||||||||||||||||
| Total interest earnings assets | ||||||||||||||||||||||||||||||||||||||||||||||||
| Ch$ | (112,646 | ) | 7,933 | (104,714 | ) | 137,710 | (113,935 | ) | 23,774 | |||||||||||||||||||||||||||||||||||||||
| UF | 12,347 | 2,266 | 14,613 | 321,051 | (286,480 | ) | 34,571 | |||||||||||||||||||||||||||||||||||||||||
| Foreign currency | (208 | ) | 1,255 | 1,047 | 11,303 | 7,415 | 18,718 | |||||||||||||||||||||||||||||||||||||||||
| Total | (100,508 | ) | 11,453 | (89,055 | ) | 470,064 | (393,000 | ) | 77,063 | |||||||||||||||||||||||||||||||||||||||
113
| Increase (Decrease) from 2017 to 2018 Due to Changes in | Increase (Decrease) from 2016 to 2017 Due to Changes in | |||||||||||||||||||||||
| Volume | Rate | Net Change from 2017 to 2018 | Volume | Rate | Net Change from 2016 to 2017 | |||||||||||||||||||
| UF | 14,259 | 12,420 | 26,679 | 37,086 | (32,919 | ) | 4,167 | |||||||||||||||||
| Foreign currency | (2,344 | ) | (117 | ) | (2,461 | ) | (1,274 | ) | (101 | ) | (1,375 | ) | ||||||||||||
| Subtotal | 6,812 | (9,699 | ) | (2,887 | ) | 37,740 | (21,414 | ) | 16,326 | |||||||||||||||
| Commercial loans | ||||||||||||||||||||||||
| Ch$ | 9,466 | (16,304 | ) | (6,838 | ) | 14,979 | (79,473 | ) | (64,494 | ) | ||||||||||||||
| UF | 18,497 | 54,603 | 73,101 | 9,905 | (54,476 | ) | (44,571 | ) | ||||||||||||||||
| Foreign currency | 4,021 | 18,057 | 22,077 | 3,908 | 3,271 | 7,179 | ||||||||||||||||||
| Subtotal | 31,984 | 56,356 | 88,340 | 28,792 | (130,678 | ) | (101,886 | ) | ||||||||||||||||
| Consumer loans | ||||||||||||||||||||||||
| Ch$ | 18,807 | (50,380 | ) | (31,574 | ) | 27,099 | 46,942 | 74,041 | ||||||||||||||||
| UF | 336 | (262 | ) | 74 | (269 | ) | (157 | ) | (426 | ) | ||||||||||||||
| Foreign currency | — | — | — | — | — | — | ||||||||||||||||||
| Subtotal | 19,143 | (50,642 | ) | (31,500 | ) | 26,830 | 46,785 | 73,615 | ||||||||||||||||
| Mortgage loans | ||||||||||||||||||||||||
| Ch$ | (23 | ) | (11 | ) | (33 | ) | (198 | ) | (627 | ) | (825 | ) | ||||||||||||
| UF | 24,165 | 103,766 | 127,930 | 16,697 | (82,207 | ) | (65,510 | ) | ||||||||||||||||
| Foreign currency | — | — | — | — | — | — | ||||||||||||||||||
| Subtotal | 24,142 | 103,755 | 127,897 | 16,499 | (82,834 | ) | (66,335 | ) | ||||||||||||||||
| Interbank loans | ||||||||||||||||||||||||
| Ch$ | (18 | ) | (53 | ) | (71 | ) | (1,391 | ) | 2,065 | 674 | ||||||||||||||
| UF | — | — | — | — | — | — | ||||||||||||||||||
| Foreign currency | — | — | — | — | — | — | ||||||||||||||||||
| Subtotal | (18 | ) | (53 | ) | (71 | ) | (1,391 | ) | 2,065 | 674 | ||||||||||||||
| Investment under agreement to resell | ||||||||||||||||||||||||
| Ch$ | (25,888 | ) | 26,302 | 414 | (961 | ) | 680 | (281 | ) | |||||||||||||||
| UF | 1 | (14 | ) | (13 | ) | — | (289 | ) | (289 | ) | ||||||||||||||
| Foreign currency | — | — | — | (2 | ) | (2 | ) | (4 | ) | |||||||||||||||
| Subtotal | (25,887 | ) | 26,288 | 401 | (963 | ) | 389 | (574 | ) | |||||||||||||||
| Threshold | ||||||||||||||||||||||||
| Ch$ | 31 | 238 | 269 | 74 | 5 | 79 | ||||||||||||||||||
| UF | — | — | — | — | — | — | ||||||||||||||||||
| Foreign currency | 15,592 | (13,705 | ) | 1,887 | 397 | 31 | 428 | |||||||||||||||||
| Subtotal | 15,623 | (13,467 | ) | 2,156 | 471 | 36 | 507 | |||||||||||||||||
| Total interest earnings assets | ||||||||||||||||||||||||
| Ch$ | (126 | ) | (63,279 | ) | (63,405 | ) | 41,405 | (19,678 | ) | 21,727 | ||||||||||||||
| UF | 57,259 | 170,514 | 227,773 | 63,419 | (170,048 | ) | (106,629 | ) | ||||||||||||||||
| Foreign currency | 17,268 | 4,235 | 21,503 | 3,030 | 3,198 | 6,228 | ||||||||||||||||||
| Total | 74,401 | 111,470 | 185,871 | 107,854 | (186,528 | ) | (78,674 | ) | ||||||||||||||||
| Liabilities and Shareholders’ Equity | ||||||||||||||||||||||||
| Interest bearing liabilities | ||||||||||||||||||||||||
| Savings accounts | ||||||||||||||||||||||||
| Ch$ | 1 | — | 1 | — | — | — | ||||||||||||||||||
| UF | (3 | ) | 1,252 | 1,249 | (1 | ) | (1,067 | ) | (1,068 | ) | ||||||||||||||
| Foreign currency | — | — | — | — | — | — | ||||||||||||||||||
| Subtotal | (2 | ) | 1,252 | 1,250 | (1 | ) | (1,067 | ) | (1,068 | ) | ||||||||||||||
| Time deposits | ||||||||||||||||||||||||
| Ch$ | 2,470 | (31,282 | ) | (28,812 | ) | (521 | ) | (68,242 | ) | (68,763 | ) | |||||||||||||
| UF | (61 | ) | 10,265 | 10,204 | (2,940 | ) | (16,183 | ) | (19,123 | ) | ||||||||||||||
| Foreign currency | 5,491 | 2,372 | 7,863 | 7,095 | 3,750 | 10,845 | ||||||||||||||||||
| Subtotal | 7,900 | (18,645 | ) | (10,745 | ) | 3,634 | (80,675 | ) | (77,041 | ) | ||||||||||||||
| Increase (Decrease) from 2017 to 2018 Due to Changes in | Increase (Decrease) from 2016 to 2017 Due to Changes in | Increase (Decrease) from 2019 to 2020 Due to Changes in | Increase (Decrease) from 2018 to 2019 Due to Changes in | |||||||||||||||||||||||||||||||||||||||||||||
| Volume | Rate | Net Change from 2017 to 2018 | Volume | Rate | Net Change from 2016 to 2017 | Volume | Rate | Net Change from 2019 to 2020 | Volume | Rate | Net Change from 2018 to 2019 | |||||||||||||||||||||||||||||||||||||
| Liabilities and Shareholders’ Equity | ||||||||||||||||||||||||||||||||||||||||||||||||
| Interest bearing liabilities | ||||||||||||||||||||||||||||||||||||||||||||||||
| Savings accounts | ||||||||||||||||||||||||||||||||||||||||||||||||
| Ch$ | 1 | — | 1 | — | — | — | ||||||||||||||||||||||||||||||||||||||||||
| UF | 401 | (6 | ) | 395 | 2 | (89 | ) | (87 | ) | |||||||||||||||||||||||||||||||||||||||
| Foreign currency | — | — | — | — | — | — | ||||||||||||||||||||||||||||||||||||||||||
| Subtotal | 402 | (6 | ) | 395 | 2 | (89 | ) | (87 | ) | |||||||||||||||||||||||||||||||||||||||
| Time deposits | ||||||||||||||||||||||||||||||||||||||||||||||||
| Ch$ | (57,222 | ) | (111,951 | ) | (169,173 | ) | (172 | ) | 1,282 | 1,110 | ||||||||||||||||||||||||||||||||||||||
| UF | (10,628 | ) | 205 | (10,423 | ) | (2,536 | ) | (9,120 | ) | (11,657 | ) | |||||||||||||||||||||||||||||||||||||
| Foreign currency | (9,226 | ) | 733 | (8,492 | ) | (1,015 | ) | 46 | (969 | ) | ||||||||||||||||||||||||||||||||||||||
| Subtotal | (77,077 | ) | (111,013 | ) | (188,089 | ) | (3,723 | ) | (7,793 | ) | (11,516 | ) | ||||||||||||||||||||||||||||||||||||
| Central bank borrowings | ||||||||||||||||||||||||||||||||||||||||||||||||
| Ch$ | 50 | — | 50 | 35 | — | 35 | — | 21 | 21 | — | (114 | ) | (114 | ) | ||||||||||||||||||||||||||||||||||
| UF | — | — | — | — | — | (1 | ) | — | — | — | — | — | — | |||||||||||||||||||||||||||||||||||
| Foreign currency | — | — | — | — | — | — | — | — | — | — | — | — | ||||||||||||||||||||||||||||||||||||
| Subtotal | 50 | — | 50 | 35 | — | 35 | — | 21 | 21 | — | (114 | ) | (114 | ) | ||||||||||||||||||||||||||||||||||
| Repurchase agreements | ||||||||||||||||||||||||||||||||||||||||||||||||
| Ch$ | (47 | ) | (997 | ) | (1,044 | ) | 488 | 2,376 | 2,864 | (6,089 | ) | (2,055 | ) | (8,144 | ) | (41 | ) | 5,590 | 5,549 | |||||||||||||||||||||||||||||
| UF | — | — | — | (1 | ) | — | (1 | ) | 0 | 27 | 27 | 1 | — | 1 | ||||||||||||||||||||||||||||||||||
| Foreign currency | 816 | 144 | 960 | 1,724 | (706 | ) | 1,018 | (35 | ) | (0 | ) | (35 | ) | (3,256 | ) | 1,255 | (2,001 | ) | ||||||||||||||||||||||||||||||
| Subtotal | 769 | (853 | ) | (84 | ) | 2,211 | 1,670 | 3,881 | (6,124 | ) | (2,028 | ) | (8,152 | ) | (3,295 | ) | 6,845 | 3,550 | ||||||||||||||||||||||||||||||
| Mortgage finance bonds | ||||||||||||||||||||||||||||||||||||||||||||||||
| Ch$ | — | — | — | — | — | — | — | — | — | — | — | — | ||||||||||||||||||||||||||||||||||||
| UF | (1,130 | ) | 726 | (404 | ) | (966 | ) | (583 | ) | (1,549 | ) | (496 | ) | (4 | ) | (499 | ) | (593 | ) | (101 | ) | (694 | ) | |||||||||||||||||||||||||
| Foreign currency | — | — | — | — | — | — | — | — | — | — | — | — | ||||||||||||||||||||||||||||||||||||
| Subtotal | (1,130 | ) | 726 | (404 | ) | (966 | ) | (583 | ) | (1,549 | ) | (496 | ) | (4 | ) | (499 | ) | (593 | ) | (101 | ) | (694 | ) | |||||||||||||||||||||||||
| Other interest bearing liabilities | ||||||||||||||||||||||||||||||||||||||||||||||||
| Ch$ | 4,659 | 7,366 | 12,025 | 22,760 | (53,978 | ) | (31,218 | ) | (35,543 | ) | (9,029 | ) | (44,572 | ) | 21,814 | 12,493 | 34,307 | |||||||||||||||||||||||||||||||
| UF | 4,868 | 56,376 | 61,244 | 12,059 | (33,663 | ) | (21,604 | ) | (8,060 | ) | 1,219 | (6,841 | ) | 107,121 | (82,658 | ) | 24,463 | |||||||||||||||||||||||||||||||
| Foreign currency | 115,986 | (81,127 | ) | 34,859 | 2,991 | 1,571 | 4,562 | (23,347 | ) | 5,146 | (18,201 | ) | 23,553 | 1,006 | 24,559 | |||||||||||||||||||||||||||||||||
| Subtotal | 125,513 | (17,385 | ) | 108,128 | 37,810 | (86,070 | ) | (48,260 | ) | (66,949 | ) | (2,664 | ) | (69,614 | ) | 152,488 | (69,159 | ) | 83,329 | |||||||||||||||||||||||||||||
| Total interest bearing liabilities | ||||||||||||||||||||||||||||||||||||||||||||||||
| Ch$ | 7,133 | (24,915 | ) | (17,782 | ) | 22,762 | (119,843 | ) | (97,081 | ) | (98,853 | ) | (123,014 | ) | (221,867 | ) | 21,601 | 19,251 | 40,852 | |||||||||||||||||||||||||||||
| UF | 3,676 | 68,619 | 72,295 | 8,151 | (51,496 | ) | (43,346 | ) | (18,783 | ) | 1,441 | (17,343 | ) | 103,995 | (91,969 | ) | 12,026 | |||||||||||||||||||||||||||||||
| Foreign currency | 122,293 | (78,611 | ) | 43,682 | 11,811 | 4,614 | 16,426 | (32,608 | ) | 5,879 | (26,729 | ) | 19,282 | 2,307 | 21,589 | |||||||||||||||||||||||||||||||||
| Total | 133,102 | (34,907 | ) | 98,195 | 42,724 | (166,725 | ) | (124,001 | ) | (150,244 | ) | (115,694 | ) | (265,938 | ) | 144,879 | (70,411 | ) | 74,468 | |||||||||||||||||||||||||||||
Interest-Earning Assets: Net Interest Margin
The following table analyzes, by currency of denomination, the levels of average interest-earning assets and net interest earned by Santander-Chile, and illustrates the comparative net interest margins obtained, for each of the years indicated in the table.
| Year ended December 31, | ||||||||||||
| 2018 | 2017 | 2016 | ||||||||||
| (in millions of Ch$) | ||||||||||||
| Total average interest-earning assets | ||||||||||||
| Ch$ | 13,019,695 | 12,317,700 | 11,684,475 | |||||||||
| UF | 15,897,874 | 14,139,235 | 13,150,312 | |||||||||
| Foreign currencies | 3,842,634 | 4,138,124 | 4,836,524 | |||||||||
| Total | 32,760,203 | 30,595,059 | 29,671,311 | |||||||||
| Net interest earned(1) | ||||||||||||
| Ch$ | 743,753 | 789,376 | 670,567 | |||||||||
| UF | 663,325 | 507,847 | 571,131 | |||||||||
| Foreign currencies | 7,290 | 29,469 | 39,667 | |||||||||
| Total | 1,414,368 | 1,326,692 | 1,281,365 | |||||||||
| Net interest margin(2) | ||||||||||||
| Ch$ | 5.7 | % | 6.4 | % | 5.7 | % | ||||||
| UF | 4.2 | % | 3.6 | % | 4.3 | % | ||||||
| Foreign currencies | 0.2 | % | 0.7 | % | 0.8 | % | ||||||
| Total | 4.3 | % | 4.3 | % | 4.3 | % | ||||||
114
| Year ended December 31, | ||||||||||||
| 2020 | 2019 | 2018 | ||||||||||
| (in millions of Ch$) | ||||||||||||
| Total average interest-earning assets | ||||||||||||
| Ch$ | 16,734,192 | 13,910,911 | 13,019,695 | |||||||||
| UF | 19,923,379 | 17,553,026 | 15,897,874 | |||||||||
| Foreign currencies | 5,581,816 | 4,386,316 | 3,842,634 | |||||||||
| Total | 42,239,387 | 35,850,253 | 32,760,203 | |||||||||
| Net interest earned (1) | ||||||||||||
| Ch$ | 843,830 | 726,676 | 743,753 | |||||||||
| UF | 717,824 | 685,870 | 663,325 | |||||||||
| Foreign currencies | 32,194 | 4,418 | 7,290 | |||||||||
| Total | 1,593,848 | 1,416,964 | 1,414,368 | |||||||||
| Net interest margin (2) | ||||||||||||
| Ch$ | 5.0 | % | 5.2 | % | 5.7 | % | ||||||
| UF | 3.6 | % | 3.9 | % | 4.2 | % | ||||||
| Foreign currencies | 0.6 | % | 0.1 | % | 0.2 | % | ||||||
| Total | 3.8 | % | 4.0 | % | 4.3 | % | ||||||
____________________
| (1) | Net interest earned is defined as interest revenue earned less interest expense incurred. |
| (2) | Net interest margin is defined as net interest earned divided by total average interest-earning assets. |
Return on Equity and Assets; Dividend Payout
The following table presents certain information and selected financial ratios for Santander-Chile for the years indicated.
| Year ended December 31, | ||||||||||||
| Ch$ million | 2018 | 2017 | 2016 | |||||||||
| Net income | 599,693 | 575,249 | 478,432 | |||||||||
| Net income attributable to shareholders | 595,333 | 562,801 | 476,067 | |||||||||
| Average total assets | 37,213,342 | 35,521,228 | 35,244,021 | |||||||||
| Average equity | 3,263,155 | 3,001,680 | 2,840,843 | |||||||||
| Net income as a percentage of: | ||||||||||||
| Average total assets | 1.6 | % | 1.6 | % | 1.4 | % | ||||||
| Average equity | 18.4 | % | 19.2 | % | 16.8 | % | ||||||
| Average equity as a percentage of: | ||||||||||||
| Average total assets | 8.8 | % | 8.5 | % | 8.1 | % | ||||||
| Cash dividend(1) | 357,757 | 423,611 | 330,646 | |||||||||
| Dividend payout ratio, based on net income attributable to shareholders(1) | 60.1 | % | 75.3 | % | 69.0 | % | ||||||
| Year ended December 31, | ||||||||||||
| 2020 | 2019 | 2018 | ||||||||||
| Ch$ million | ||||||||||||
| Net income | 552,730 | 621,313 | 599,693 | |||||||||
| Net income attributable to shareholders | 547,614 | 619,091 | 595,333 | |||||||||
| Average total assets | 55,831,535 | 43,230,013 | 37,213,342 | |||||||||
| Average equity | 3,734,243 | 3,450,729 | 3,263,155 | |||||||||
| Net income as a percentage of: | ||||||||||||
| Average total assets | 1.0 | % | 1.4 | % | 1.6 | % | ||||||
| Net income attributable to shareholders as a percentage of: | ||||||||||||
| Average equity | 14.8 | % | 18.0 | % | 18.2 | % | ||||||
| Average equity as a percentage of: | ||||||||||||
| Average total assets | 6.7 | % | 8.0 | % | 8.8 | % | ||||||
| Cash dividend (1) | n/a | 331,256 | 355,141 | |||||||||
| Dividend payout ratio, based on net income attributable to shareholders (2) | n/a | 60.0 | % | 60.0 | % | |||||||
____________________
| (1) |
| (2) | In 2020, shareholders of the Bank approved |
115
Dividends declared at the annual shareholders’ meeting of each year correspond to the Bank’s earnings of the previous year. The following table presents dividends declared and paid by us in nominal terms in the past four years:
| Year paid | Dividend Ch$ millions (1) | Dividend U.S.$ millions (2) | Per share Ch$/share (3) | Per ADS U.S.$/ADS (4) | % over earnings (5) | % over earnings (6) | Dividend Ch$ millions (1) | Dividend U.S.$ millions (2) | Per share Ch$/share (3) | Per ADS U.S.$/ADS (4) | % over earnings (5) | % over earnings (6) | |||||||||||||||||||||||||||||||||||||
| 2015 | 330,198 | 540.4 | 1.75 | 1.15 | 60 | 58 | |||||||||||||||||||||||||||||||||||||||||||
| 2016 | 336,659 | 503.7 | 1.79 | 1.07 | 75 | 75 | |||||||||||||||||||||||||||||||||||||||||||
| 2017 | 330,646 | 496.5 | 1.75 | 1.05 | 70 | 69 | 330,646 | 496.5 | 1.75 | 1.05 | 70 | 69 | |||||||||||||||||||||||||||||||||||||
| 2018 | 423,611 | 702.32 | 2.25 | 1.49 | 75 | 75 | 423,611 | 702.32 | 2.25 | 1.49 | 75 | 75 | |||||||||||||||||||||||||||||||||||||
| 2019 | 355,141 | 531.5 | 1.88 | 1.13 | 60 | 60 | |||||||||||||||||||||||||||||||||||||||||||
| 2020 (7) | 331,256 | 430.84 | 1.76 | 0.91 | 60 | 60 | |||||||||||||||||||||||||||||||||||||||||||
____________________
| (1) | Millions of nominal pesos. |
| (2) | Millions of U.S.$ using the observed exchange rate of the day the dividend was approved at the annual shareholders’ meeting. |
| (3) | Calculated on the basis of 188,446 million shares. |
| (4) | Calculated on the basis of 400 shares per ADS. |
| (5) | Calculated by dividing dividend paid in the year by net income attributable to the equity holders of the Bank for the previous year under Chilean Bank GAAP. |
| (6) | Calculated by dividing dividend paid in the year by net income attributable to the equity holders of the Bank for the previous year under IFRS. |
| (7) | In 2020, shareholders of the Bank approved the distribution of 30% of the 2019 net income attributable to shareholders under Chilean Bank GAAP on April 30, 2020. This amounted to Ch$ 165,628 million (US$ 198.0 million using the observed exchange rate of the day the dividend was approved at the annual shareholders’ meeting) or Ch$ 0.88 per share (US$ per ADR 0.49). In the Extraordinary Shareholders Meeting held on November 26, 2020, a further 30% of the 2019 earnings was approved. Therefore, in total a 60% of the net income attributable to shareholders of 2019 under Chilean Bank GAAP was distributed to shareholders, totaling Ch$ 331,256 million or Ch$ 1.76 per share. |
Loan Portfolio
The following table analyzes our loans by product type. Except where otherwise specified, all loan amounts stated below are before deduction for loan loss allowances. Total loans reflect our loan portfolio, including principal amounts of past due loan and substandard loans. Any collateral provided generally consists of a mortgage on real estate, a pledge of marketable securities, a letter of credit or cash. The existence and amount of collateral generally varies from loan to loan.
| As of December 31, | As of December 31, | |||||||||||||||||||||||||||||||||||||||
| 2018 (1) | 2017 | 2016 | 2015 | 2014 | 2020(1) | 2019(1) | 2018(1) | 2017 | 2016 | |||||||||||||||||||||||||||||||
| (in millions of Ch$) | (in millions of Ch$) | |||||||||||||||||||||||||||||||||||||||
| Commercial Loans: | ||||||||||||||||||||||||||||||||||||||||
| Commercial loans | 11,148,859 | 9,990,656 | 9,853,657 | 8,985,452 | 8,324,949 | 13,509,548 | 11,723,039 | 11,148,859 | 9,990,656 | 9,853,657 | ||||||||||||||||||||||||||||||
| Foreign trade loans | 1,752,437 | 1,574,513 | 1,829,904 | 2,152,570 | 1,786,232 | 1,239,271 | 1,713,633 | 1,752,437 | 1,574,513 | 1,829,904 | ||||||||||||||||||||||||||||||
| Checking account debtors | 215,162 | 195,696 | 179,468 | 234,723 | 266,231 | 125,610 | 196,893 | 215,162 | 195,696 | 179,468 | ||||||||||||||||||||||||||||||
| Factoring transactions | 380,983 | 449,890 | 296,751 | 275,647 | 327,841 | 497,679 | 489,400 | 380,983 | 449,890 | 296,751 | ||||||||||||||||||||||||||||||
| Student loans | 63,380 | 71,273 | 79,916 | - | - | |||||||||||||||||||||||||||||||||||
| Leasing transactions | 1,443,724 | 1,457,004 | 1,485,123 | 1,534,192 | 1,489,384 | 1,355,157 | 1,424,862 | 1,443,724 | 1,457,004 | 1,485,123 | ||||||||||||||||||||||||||||||
| Other loans and accounts receivable | 244,979 | 240,883 | 222,562 | 143,775 | 135,663 | 196,544 | 243,225 | 165,063 | 240,883 | 222,562 | ||||||||||||||||||||||||||||||
| Subtotal | 15,186,144 | 13,908,642 | 13,867,465 | 13,326,359 | 12,330,300 | 16,987,189 | 15,862,325 | 15,186,144 | 13,908,642 | 13,867,465 | ||||||||||||||||||||||||||||||
| Mortgage loans: | ||||||||||||||||||||||||||||||||||||||||
| Mortgage finance bond backed loans | 17,426 | 24,060 | 32,579 | 134,105 | 116,150 | 7,809 | 12,298 | 17,426 | 24,060 | 32,579 | ||||||||||||||||||||||||||||||
| Mortgage mutual loans | 108,536 | 115,078 | 119,934 | 44,028 | 57,356 | 92,960 | 100,152 | 108,536 | 115,078 | 119,934 | ||||||||||||||||||||||||||||||
| Other mortgage mutual loans | 10,025,019 | 8,957,757 | 8,466,843 | 7,634,717 | 6,458,525 | 12,311,056 | 11,150,545 | 10,025,019 | 8,957,757 | 8,466,843 | ||||||||||||||||||||||||||||||
| Subtotal | 10,150,981 | 9,096,895 | 8,619,356 | 7,812,850 | 6,632,031 | 12,411,825 | 11,262,995 | 10,150,981 | 9,096,895 | 8,619,356 | ||||||||||||||||||||||||||||||
| Consumer loans: | ||||||||||||||||||||||||||||||||||||||||
| Installment consumer loans | 3,189,670 | 2,910,742 | 2,722,365 | 2,469,646 | 2,320,775 | |||||||||||||||||||||||||||||||||||
| Credit card loans | 1,417,152 | 1,364,980 | 1,448,118 | 1,434,609 | 1,362,587 | |||||||||||||||||||||||||||||||||||
| Consumer leasing contracts | 4,157 | 4,715 | 5,117 | 5,460 | 5,270 | |||||||||||||||||||||||||||||||||||
| Other consumer loans | 265,310 | 277,255 | 271,203 | 240,956 | 229,743 | |||||||||||||||||||||||||||||||||||
| Subtotal | 4,876,289 | 4,557,692 | 4,446,803 | 4,150,671 | 3,918,375 | |||||||||||||||||||||||||||||||||||
| Subtotal Loans to customers | 30,213,414 | 27,563,229 | 26,933,624 | 25,289,880 | 22,880,706 | |||||||||||||||||||||||||||||||||||
| Interbank loans (2) | — | 162,685 | 272,807 | 10,877 | 11,943 | |||||||||||||||||||||||||||||||||||
| Total | 30,213,414 | 27,725,914 | 27,206,431 | 25,300,757 | 22,892,649 | |||||||||||||||||||||||||||||||||||
116
| As of December 31, | ||||||||||||||||||||
| 2020(1) | 2019(1) | 201 (1) | 2017 | 2016 | ||||||||||||||||
| (in millions of Ch$) | ||||||||||||||||||||
| Consumer loans: | ||||||||||||||||||||
| Installment consumer loans | 3,688,592 | 3,917,536 | 3,189,670 | 2,910,742 | 2,722,365 | |||||||||||||||
| Credit card loans | 1,125,908 | 1,377,710 | 1,417,152 | 1,364,980 | 1,448,118 | |||||||||||||||
| Consumer leasing contracts | 3,121 | 3,952 | 4,157 | 4,715 | 5,117 | |||||||||||||||
| Other consumer loans | 123,258 | 246,997 | 265,310 | 277,255 | 271,203 | |||||||||||||||
| Subtotal | 4,940,879 | 5,546,195 | 4,876,289 | 4,557,692 | 4,446,803 | |||||||||||||||
| Subtotal Loans to customers | 34,339,893 | 32,671,515 | 30,213,414 | 27,563,229 | 26,933,624 | |||||||||||||||
| Interbank loans (2) | — | — | — | 162,685 | 272,807 | |||||||||||||||
| Total | 34,339,893 | 32,671,515 | 30,213,414 | 27,725,914 | 27,206,431 | |||||||||||||||
____________________
(1) | Loans as of December 31, 2020, 2019 and 2018 are loans at amortized cost in accordance with IFRS 9. See “Note 9— Loans and Account Receivable at Amortized Cost |
| (2) | Interbank loans for December 31, 2020, 2019 and 2018 are included within commercial loans. |
At December 31, 2018,2020, the Bank had some loans measured at fair value through other comprehensive income according to IFRS 9 as follows:
| Stage 1 | Stage 2 | Stage 3 | Total | |||||||||||||
| Individual | Individual | Individual | ||||||||||||||
| Gross carrying amount at January 1, 2018 | 107,998 | — | — | 107,998 | ||||||||||||
| Transfers to stage 2 | (6,697 | ) | 6,697 | — | — | |||||||||||
| Net changes on financial assets | (40,754 | ) | (1,821 | ) | — | (42,575 | ) | |||||||||
| Foreign Exchange adjustments | 3,198 | 73 | — | 3,271 | ||||||||||||
| At December 31, 2018 | 63,745 | 4,949 | — | 68,694 | ||||||||||||
| Stage 1 | Stage 2 | Stage 3 | ||||||||||||||
| Individual | Individual | Individual | Total | |||||||||||||
| Gross carrying amount at January 1, 2020 | 66,166 | — | — | 66,166 | ||||||||||||
| Net changes on financial assets | 3,857 | — | — | 3,857 | ||||||||||||
| Foreign Exchange adjustments | 662 | — | — | 662 | ||||||||||||
| At December 31, 2020 | 70,685 | — | — | 70,685 | ||||||||||||
The loan categories are as follows:
Commercial loans
Interbank loans are long-term and short-term loans made to other local or international banks, granted in Chilean pesos or foreign currencies, usually at a variable rate linked to LIBOR or other interbank rates.
Commercial loans are long-term and short-term loans, including checking overdraft lines for companies, granted in Chilean pesos, inflation linked, U.S.$ linked or denominated in U.S.$. The interest on these loans is fixed or variable and is used primarily to finance working capital or investments. General commercial loans also include factoring operations.
Foreign trade loans are fixed rate, short-term loans made in foreign currencies (principally U.S.$) to finance imports and exports.
Checking account debtors mainly include mortgage loans (fixed and variable rate) that are inflation-indexed long-term loans with monthly payments of principal and interest secured by a real property mortgage. These loans can be endorsed to a third party.
Factoring transactions mainly include short-term loans to companies with a fixed monthly nominal rate backed by a company invoice.
Student loans mainly include long-term loans made to finance tertiary education mainly in fixed real rates (UF) some of which some are guaranteed by the state. These loans, per Chilean regulations, must be classified as commercial loans since they are guaranteed by the Chilean State under Law 20.027 through CORFO, the government’s development agency.
Leasing transactions are agreements for the financial leasing of capital equipment and other property.
Other loans and accounts receivable loans include other loans and accounts payable.
117
Mortgage loans
Mortgage mutual loans mainly include mortgage loans (fixed and variable rate) that are inflation-indexed long-term loans with monthly payments of principal and interest secured by a real property mortgage. These are financed by issuing mortgage bonds.
Mortgage finance bond backed loans are inflation-indexed, fixed or variable rate, long-term loans with monthly payments of principal and interest secured by a real property mortgage that are financed with mortgage finance bonds. At the time of approval, these types of mortgage loans cannot be more than 75.0% of the lower of the purchase price or the appraised value of the mortgaged property or such loan will be classified as a commercial loan. Mortgage bonds are our general obligations, and we are liable for all principal and accrued interest on such bonds. In addition, if the issuer of a mortgage finance bond becomes insolvent, the General Banking Law’s liquidation procedures provide that these types of mortgage loans with their corresponding mortgage bonds shall be auctioned as a unit and the acquirer must continue paying the mortgage finance bonds under the same conditions as the original issuer.
Other mortgage mutual loans mainly include mortgage loans (fixed and variable rate) that are inflation-indexed long-term loans with monthly payments of principal and interest secured by a real property mortgage. These are financed by our general borrowings.
Consumer loans
Installment consumer loans are loans to individuals, granted in Chilean pesos, generally on a fixed rate nominal basis, to finance the purchase of consumer goods or to pay for services. This includes auto loans originated through Santander Consumer Chile.
Consumer loans through lines of creditare checking overdraft lines to individuals, granted in Chilean pesos, generally on a fixed rate nominal basis and linked to an individual’s checking account.
Credit card loans include credit card balances subject to nominal fixed rate interest charges.
Consumer leasing contracts are agreements for the financial leasing of automobiles and other property to individuals.
Other loans and accounts receivable from customers include draft lines for individuals.
Non-client loans
Interbank loans are fixed rate, short-term loans to financial institutions that operate in Chile.
Maturity and Interest Rate Sensitivity of Loans
The following table sets forth an analysis by type and time remaining to maturity of our loans at amortized cost as of December 31, 2018.2020.
| Due in 1 year or less | Due after 1 year through 5 years | Due after 5 years | Total balance as of December 31, 2018 | Due in 1 year or less | Due after 1 year through 5 years | Due after 5 years | Total balance as of December 31, 2019 | |||||||||||||||||||||||||
| (in millions of Ch$) | (in millions of Ch$) | |||||||||||||||||||||||||||||||
| General commercial loans (1) | 4,855,960 | 3,739,606 | 2,553,293 | 11,148,859 | 3,676,431 | 2,011,903 | 7,821,214 | 13,509,548 | ||||||||||||||||||||||||
| Foreign trade loans | 1,663,819 | 79,844 | 8,774 | 1,752,437 | 1,156,377 | 34,622 | 48,272 | 1,239,271 | ||||||||||||||||||||||||
| Leasing contracts | 321,824 | 725,367 | 396,533 | 1,443,724 | 45,203 | 304,213 | 1,005,741 | 1,355,157 | ||||||||||||||||||||||||
| Other outstanding loans | 759,786 | 41,617 | 39,721 | 841,124 | 729,998 | 65,870 | 87,345 | 883,213 | ||||||||||||||||||||||||
| Subtotal commercial loans | 5,608,009 | 2,416,608 | 8,962,572 | 16,987,189 | ||||||||||||||||||||||||||||
| Residential loans backed by mortgage bonds | 25 | 6,084 | 1,700 | 7,809 | ||||||||||||||||||||||||||||
| Other residential mortgage loans | 4,783 | 55,352 | 12,343,881 | 12,404,016 | ||||||||||||||||||||||||||||
| Subtotal residential mortgage loans | 4,808 | 61,436 | 12,345,581 | 12,411,825 | ||||||||||||||||||||||||||||
| Consumer loans | 912,168 | 1,475,735 | 2,552,976 | 4,940,879 | ||||||||||||||||||||||||||||
| Total loans at amortized cost | 6,524,985 | 3,953,779 | 23,861,129 | 34,339,893 | ||||||||||||||||||||||||||||
| Due in 1 year or less | Due after 1 year through 5 years | Due after 5 years | Total balance as of December 31, 2018 | |||||||||||||
| (in millions of Ch$) | ||||||||||||||||
| Subtotal commercial loans | 7,601,389 | 4,586,434 | 2,998,321 | 15,186,144 | ||||||||||||
| Residential loans backed by mortgage bonds | 5,218 | 11,652 | 556 | 17,426 | ||||||||||||
| Other residential mortgage loans | 533,418 | 1,958,045 | 7,642,092 | 10,133,555 | ||||||||||||
| Subtotal residential mortgage loans | 538,636 | 1,969,697 | 7,642,648 | 10,150,981 | ||||||||||||
| Consumer loans | 2,597,358 | 2,154,507 | 124,424 | 4,876,289 | ||||||||||||
| Total loans at amortized cost | 10,737,383 | 8,710,638 | 10,765,393 | 30,213,414 | ||||||||||||
____________________
| (1) | Interbank loans for December 31, |
118
The following tables present the total amount of loans due after one year that have fixed and variable interest rates as of December 31, 2018.2020. See also “Item 5. Operating and Financial Review and Prospects—A. Operating Results—Interest Rates.”
| As of December 31, | ||||
| (in millions of Ch$) | ||||
| Variable Rate | ||||
| Ch$ | — | |||
| UF | ||||
| Foreign currencies | — | |||
| Subtotal | ||||
| Fixed Rate | — | |||
| Ch$ | ||||
| UF | ||||
| Foreign currencies | ||||
| Subtotal | ||||
| Total | ||||
Loans by Economic Activity
The following table sets forth, at the dates indicated, an analysis of our client loan portfolio based on the borrower’s principal economic activity and geographic distribution. Loans to individuals for business purposes are allocated to their economic activity.
As of December 31, 2020, 2019 and 2018, loans by economic activity according to IFRS 9 are listed below:
| Total loans at amortized cost | Total | % of | Total loans at amortized cost | % of | |||||||||||||||||||||||||||||||||||
| As of December 31, 2018 | Stage 1 | Stage 2 | Stage 3 | Total | ||||||||||||||||||||||||||||||||||||
| As of December 31, 2020 | Stage 1 | Stage 2 | Stage 3 | Total | Total Loans | |||||||||||||||||||||||||||||||||||
| Ch$ Million | Loans | Ch$ Million | ||||||||||||||||||||||||||||||||||||||
| Commercial loans | ||||||||||||||||||||||||||||||||||||||||
| Manufacturing | 992,786 | 92,931 | 54,048 | 1,139,765 | 3.8 | % | 1,180,220 | 130,361 | 67,640 | 1,378,221 | 4.0 | % | ||||||||||||||||||||||||||||
| Mining | 182,342 | 21,821 | 4,585 | 208,748 | 0.7 | % | 265,195 | 161,631 | 6,789 | 433,615 | 1.3 | % | ||||||||||||||||||||||||||||
| Electricity, gas, and water | 384,288 | 22,365 | 2,279 | 408,932 | 1.4 | % | 349,849 | 27,848 | 6,577 | 384,274 | 1.1 | % | ||||||||||||||||||||||||||||
| Agriculture and livestock | 934,199 | 166,271 | 100,781 | 1,201,251 | 4.0 | % | 1,024,795 | 233,552 | 87,517 | 1,345,864 | 3.9 | % | ||||||||||||||||||||||||||||
| Forest | 120,371 | 9,402 | 14,115 | 143,888 | 0.5 | % | 141,892 | 23,463 | 13,820 | 179,175 | 0.5 | % | ||||||||||||||||||||||||||||
| Fishing | 238,348 | 11,104 | 3,569 | 253,021 | 0.8 | % | 209,182 | 20,128 | 4,842 | 234,152 | 0.7 | % | ||||||||||||||||||||||||||||
| Transport | 716,493 | 55,011 | 37,802 | 809,306 | 2.7 | % | 622,161 | 97,624 | 58,076 | 777,861 | 2.3 | % | ||||||||||||||||||||||||||||
| Communications | 178,215 | 30,407 | 7,222 | 215,844 | 0.7 | % | 294,957 | 28,433 | 7,725 | 331,115 | 1.0 | % | ||||||||||||||||||||||||||||
| Construction(*) | 723,600 | 88,691 | 93,747 | 906,038 | 3.0 | % | ||||||||||||||||||||||||||||||||||
| Construction(*) | 811,807 | 61,828 | 85,734 | 959,369 | 2.8 | % | ||||||||||||||||||||||||||||||||||
| Commerce | 2,950,517 | 189,623 | 199,924 | 3,340,064 | 11.1 | % | 2,549,770 | 223,884 | 89,684 | 2,863,338 | 8.3 | % | ||||||||||||||||||||||||||||
| Services | 1,771,595 | 81,159 | 12,915 | 1,865,669 | 6.2 | % | 3,506,443 | 393,319 | 239,535 | 4,139,297 | 12.1 | % | ||||||||||||||||||||||||||||
| Other | 4,120,052 | 331,471 | 242,094 | 4,693,617 | 15.5 | % | 3,302,527 | 416,235 | 242,146 | 3,960,908 | 11.5 | % | ||||||||||||||||||||||||||||
| Subtotal | 13,312,806 | 1,100,255 | 773,083 | 15,186,144 | 50.3 | % | 14,258,798 | 1,818,306 | 910,085 | 16,987,189 | 49.5 | % | ||||||||||||||||||||||||||||
| Mortgage loans | 9,258,962 | 447,496 | 444,523 | 10,150,981 | 33.6 | % | 11,518,363 | 392,372 | 501,090 | 12,411,825 | 36.1 | % | ||||||||||||||||||||||||||||
| Consumer loans | 4,341,740 | 249,039 | 285,510 | 4,876,289 | 16.1 | % | 4,439,163 | 236,595 | 265,121 | 4,940,879 | 14.4 | % | ||||||||||||||||||||||||||||
| Total loans at amortized cost | 26,913,508 | 1,796,790 | 1,503,115 | 30,213,414 | 100.0 | % | 30,216,324 | 2,447,273 | 1,676,296 | 34,339,893 | 100.0 | % | ||||||||||||||||||||||||||||
119
| Total loans at amortized cost | % of | |||||||||||||||||||
| As of December 31, 2019 | Stage 1 | Stage 2 | Stage 3 | Total | Total Loans | |||||||||||||||
| Ch$ Million | ||||||||||||||||||||
| Commercial loans | ||||||||||||||||||||
| Manufacturing | 1,110,484 | 107,356 | 67,974 | 1,285,814 | 3.9 | % | ||||||||||||||
| Mining | 280,297 | 123,005 | 3,739 | 407,041 | 1.2 | % | ||||||||||||||
| Electricity, gas, and water | 309,941 | 22,907 | 8,196 | 341,044 | 1.0 | % | ||||||||||||||
| Agriculture and livestock | 1,020,857 | 172,984 | 93,440 | 1,287,281 | 3.9 | % | ||||||||||||||
| Forest | 132,483 | 17,035 | 15,689 | 165,207 | 0.5 | % | ||||||||||||||
| Fishing | 223,980 | 24,879 | 7,695 | 256,554 | 0.8 | % | ||||||||||||||
| Transport | 665,570 | 64,115 | 34,192 | 763,877 | 2.3 | % | ||||||||||||||
| Communications | 206,660 | 28,122 | 6,168 | 240,950 | 0.7 | % | ||||||||||||||
| Construction(*) | 782,265 | 85,435 | 106,568 | 974,268 | 3.0 | % | ||||||||||||||
| Commerce | 2,655,982 | 110,326 | 30,107 | 2,796,415 | 8.6 | % | ||||||||||||||
| Services | 2,971,563 | 190,097 | 204,472 | 3,366,132 | 10.3 | % | ||||||||||||||
| Other | 3,442,541 | 298,806 | 236,395 | 3,977,742 | 12.2 | % | ||||||||||||||
| Subtotal | 13,802,623 | 1,245,067 | 814,635 | 15,862,325 | 48.6 | % | ||||||||||||||
| Mortgage loans | 10,275,966 | 457,948 | 529,081 | 11,262,995 | 34.5 | % | ||||||||||||||
| Consumer loans | 4,963,047 | 292,718 | 290,430 | 5,546,195 | 17.0 | % | ||||||||||||||
| Total loans at amortized cost | 29,041,636 | 1,995,733 | 1,634,146 | 32,671,515 | 100.0 | % | ||||||||||||||
| Total loans at amortized cost | % of | |||||||||||||||||||
| As of December 31, 2018 | Stage 1 | Stage 2 | Stage 3 | Total | Total Loans | |||||||||||||||
| Ch$ Million | ||||||||||||||||||||
| Commercial loans | ||||||||||||||||||||
| Manufacturing | 992,786 | 92,931 | 54,048 | 1,139,765 | 3.8 | % | ||||||||||||||
| Mining | 182,342 | 21,821 | 4,585 | 208,748 | 0.7 | % | ||||||||||||||
| Electricity, gas, and water | 384,288 | 22,365 | 2,279 | 408,932 | 1.4 | % | ||||||||||||||
| Agriculture and livestock | 934,199 | 166,271 | 100,781 | 1,201,251 | 4.0 | % | ||||||||||||||
| Forest | 120,371 | 9,402 | 14,115 | 143,888 | 0.5 | % | ||||||||||||||
| Fishing | 238,348 | 11,104 | 3,569 | 253,021 | 0.8 | % | ||||||||||||||
| Transport | 716,493 | 55,011 | 37,802 | 809,306 | 2.7 | % | ||||||||||||||
| Communications | 178,215 | 30,407 | 7,222 | 215,844 | 0.7 | % | ||||||||||||||
| Construction(*) | 723,600 | 88,691 | 93,747 | 906,038 | 3.0 | % | ||||||||||||||
| Commerce | 2,950,517 | 189,623 | 199,924 | 3,340,064 | 11.1 | % | ||||||||||||||
| Services | 1,771,595 | 81,159 | 12,915 | 1,865,669 | 6.2 | % | ||||||||||||||
| Other | 4,120,052 | 331,471 | 242,094 | 4,693,617 | 15.5 | % | ||||||||||||||
| Subtotal | 13,312,806 | 1,100,255 | 773,083 | 15,186,144 | 50.3 | % | ||||||||||||||
| Mortgage loans | 9,258,962 | 447,496 | 444,523 | 10,150,981 | 33.6 | % | ||||||||||||||
| Consumer loans | 4,341,740 | 249,039 | 285,510 | 4,876,289 | 16.1 | % | ||||||||||||||
| Total loans at amortized cost | 26,913,508 | 1,796,790 | 1,503,115 | 30,213,414 | 100.0 | % | ||||||||||||||
______________________
(*) In 2018, we improved the classification of our construction loans, reassigning loans for real estate investment companies to the Services category.
| (*) | In 2018, we improved the classification of our construction loans, reassigning loans for real estate investment companies to the Services category. |
120
As of December 31, 2017 2016, 2015 and 20142016 loans by economic activity is reported according to IAS 39.
| Domestic loans (*) as of December 31, | Foreign interbank loans (**) as of December 31, | |||||||||||||||||||||||||||||||
| 2017 | 2016 | 2015 | 2014 | 2017 | 2016 | 2015 | 2014 | |||||||||||||||||||||||||
| (in millions of Ch$) | (in millions of Ch$) | |||||||||||||||||||||||||||||||
| Commercial loans | ||||||||||||||||||||||||||||||||
| Manufacturing | 1,218,232 | 1,180,886 | 1,171,830 | 1,126,268 | — | — | — | — | ||||||||||||||||||||||||
| Mining | 302,037 | 340,554 | 510,467 | 428,847 | — | — | — | — | ||||||||||||||||||||||||
| Electricity, gas and water | 336,048 | 442,936 | 454,456 | 567,548 | — | — | — | — | ||||||||||||||||||||||||
| Agriculture and livestock | 1,114,597 | 1,096,659 | 1,019,922 | 871,247 | — | — | — | — | ||||||||||||||||||||||||
| Forestry | 98,941 | 96,806 | 96,069 | 98,039 | — | — | — | — | ||||||||||||||||||||||||
| Fishing | 215,994 | 296,592 | 344,496 | 256,818 | — | — | — | — | ||||||||||||||||||||||||
| Transport | 697,948 | 787,510 | 876,329 | 758,339 | — | — | — | — | ||||||||||||||||||||||||
| Communications | 168,744 | 196,934 | 160,135 | 167,004 | — | — | — | — | ||||||||||||||||||||||||
| Construction | 1,977,417 | 1,792,485 | 1,462,535 | 1,365,841 | — | — | — | — | ||||||||||||||||||||||||
| Commerce | 3,131,870 | 3,120,400 | 3,050,663 | 2,773,410 | 162,685 | 272,733 | 10,827 | 11,899 | ||||||||||||||||||||||||
| Services | 467,747 | 482,900 | 483,516 | 469,141 | — | — | — | — | ||||||||||||||||||||||||
| Other | 4,179,067 | 4,032,877 | 3,695,991 | 3,447,842 | — | — | — | — | ||||||||||||||||||||||||
| Subtotals | 13,908,642 | 13,867,539 | 13,326,409 | 12,330,344 | 162,685 | 272,733 | 10,827 | 11,899 | ||||||||||||||||||||||||
| Mortgage loans | 9,096,895 | 8,619,356 | 7,812,850 | 6,632,031 | — | — | — | — | ||||||||||||||||||||||||
| Consumer loans | 4,557,692 | 4,446,803 | 4,150,671 | 3,918,375 | — | — | — | — | ||||||||||||||||||||||||
| Total | 27,563,229 | 26,933,698 | 25,289,930 | 22,880,750 | 162,685 | 272,733 | 10,827 | 11,899 | ||||||||||||||||||||||||
| Domestic loans (*) as of December 31, | Foreign interbank loans (**) as of December 31, | |||||||||||||||
| 2017 | 2016 | 2017 | 2016 | |||||||||||||
| (in millions of Ch$) | ||||||||||||||||
| Commercial loans | ||||||||||||||||
| Manufacturing | 1,218,232 | 1,180,886 | — | — | ||||||||||||
| Mining | 302,037 | 340,554 | — | — | ||||||||||||
| Electricity, gas and water | 336,048 | 442,936 | — | — | ||||||||||||
| Agriculture and livestock | 1,114,597 | 1,096,659 | — | — | ||||||||||||
| Forestry | 98,941 | 96,806 | — | — | ||||||||||||
| Fishing | 215,994 | 296,592 | — | — | ||||||||||||
| Transport | 697,948 | 787,510 | — | — | ||||||||||||
| Communications | 168,744 | 196,934 | — | — | ||||||||||||
| Construction | 1,977,417 | 1,792,485 | — | — | ||||||||||||
| Commerce | 3,131,870 | 3,120,400 | 162,685 | 272,733 | ||||||||||||
| Services | 467,747 | 482,900 | — | — | ||||||||||||
| Other | 4,179,067 | 4,032,877 | — | — | ||||||||||||
| Subtotals | 13,908,642 | 13,867,539 | 162,685 | 272,733 | ||||||||||||
| Mortgage loans | 9,096,895 | 8,619,356 | — | — | ||||||||||||
| Consumer loans | 4,557,692 | 4,446,803 | — | — | ||||||||||||
| Total | 27,563,229 | 26,933,698 | 162,685 | 272,733 | ||||||||||||
____________________
| (*) | Includes domestic interbank |
| (**) | Includes foreign interbank |
| Total loans as of December 31, | % of total loans as of December 31, | |||||||||||||||
| 2017 | 2016 | 2017 | 2016 | |||||||||||||
| (in millions of Ch$) | ||||||||||||||||
| Commercial loans | ||||||||||||||||
| Manufacturing | 1,218,232 | 1,180,886 | 4.4 | % | 4.3 | % | ||||||||||
| Mining | 302,037 | 340,554 | 1.1 | % | 1.3 | % | ||||||||||
| Electricity, gas and water | 336,048 | 442,936 | 1.2 | % | 1.6 | % | ||||||||||
| Agriculture and livestock | 1,114,597 | 1,096,659 | 4.0 | % | 4.0 | % | ||||||||||
| Forestry | 98,941 | 96,806 | 0.4 | % | 0.4 | % | ||||||||||
| Fishing | 215,994 | 296,592 | 0.8 | % | 1.1 | % | ||||||||||
| Transport | 697,948 | 787,510 | 2.5 | % | 2.9 | % | ||||||||||
| Communications | 168,744 | 196,934 | 0.6 | % | 0.7 | % | ||||||||||
| Construction | 1,977,417 | 1,792,485 | 7.1 | % | 6.6 | % | ||||||||||
| Commerce | 3,294,555 | 3,393,133 | 11.9 | % | 12.5 | % | ||||||||||
| Services | 467,747 | 482,900 | 1.7 | % | 1.8 | % | ||||||||||
| Other | 4,179,067 | 4,032,877 | 15.1 | % | 14.8 | % | ||||||||||
| Subtotals | 14,071,327 | 14,140,272 | 50.8 | % | 52.0 | % | ||||||||||
| Mortgage loans | 9,096,895 | 8,619,356 | 32.8 | % | 31.7 | % | ||||||||||
| Consumer loans | 4,557,692 | 4,446,803 | 16.4 | % | 16.3 | % | ||||||||||
| Total | 27,725,914 | 27,206,431 | 100.0 | % | 100.0 | % | ||||||||||
121
| Total loans as of December 31, | % of total loans as of December 31, | |||||||||||||||||||||||||||||||
| 2017 | 2016 | 2015 | 2014 | 2017 | 2016 | 2015 | 2014 | |||||||||||||||||||||||||
| (in millions of Ch$) | ||||||||||||||||||||||||||||||||
| Commercial loans | ||||||||||||||||||||||||||||||||
| Manufacturing | 1,218,232 | 1,180,886 | 1,171,830 | 1,126,268 | 4.4 | % | 4.34 | % | 4.63 | % | 4.92 | % | ||||||||||||||||||||
| Mining | 302,037 | 340,554 | 510,467 | 428,847 | 1.1 | % | 1.25 | % | 2.02 | % | 1.87 | % | ||||||||||||||||||||
| Electricity, gas and water | 336,048 | 442,936 | 454,456 | 567,548 | 1.2 | % | 1.63 | % | 1.80 | % | 2.48 | % | ||||||||||||||||||||
| Agriculture and livestock | 1,114,597 | 1,096,659 | 1,019,922 | 871,247 | 4.0 | % | 4.03 | % | 4.03 | % | 3.81 | % | ||||||||||||||||||||
| Forestry | 98,941 | 96,806 | 96,069 | 98,039 | 0.4 | % | 0.36 | % | 0.38 | % | 0.43 | % | ||||||||||||||||||||
| Fishing | 215,994 | 296,592 | 344,496 | 256,818 | 0.8 | % | 1.09 | % | 1.36 | % | 1.12 | % | ||||||||||||||||||||
| Transport | 697,948 | 787,510 | 876,329 | 758,339 | 2.5 | % | 2.89 | % | 3.46 | % | 3.31 | % | ||||||||||||||||||||
| Communications | 168,744 | 196,934 | 160,135 | 167,004 | 0.6 | % | 0.72 | % | 0.63 | % | 0.73 | % | ||||||||||||||||||||
| Construction | 1,977,417 | 1,792,485 | 1,462,535 | 1,365,841 | 7.1 | % | 6.59 | % | 5.78 | % | 5.97 | % | ||||||||||||||||||||
| Commerce | 3,294,555 | 3,393,133 | 3,061,490 | 2,773,410 | 11.9 | % | 12.47 | % | 12.10 | % | 12.17 | % | ||||||||||||||||||||
| Services | 467,747 | 482,900 | 483,516 | 469,141 | 1.7 | % | 1.77 | % | 1.91 | % | 2.05 | % | ||||||||||||||||||||
| Other | 4,179,067 | 4,032,877 | 3,695,991 | 3,447,842 | 15.1 | % | 14.84 | % | 14.61 | % | 15.06 | % | ||||||||||||||||||||
| Subtotals | 14,071,327 | 14,140,272 | 13,337,236 | 12,330,344 | 50.8 | % | 51.98 | % | 52.71 | % | 53.92 | % | ||||||||||||||||||||
| Mortgage loans | 9,096,895 | 8,619,356 | 7,812,850 | 6,632,031 | 32.8 | % | 31.68 | % | 30.88 | % | 28.99 | % | ||||||||||||||||||||
| Consumer loans | 4,557,692 | 4,446,803 | 4,150,671 | 3,918,375 | 16.4 | % | 16.34 | % | 16.41 | % | 17.17 | % | ||||||||||||||||||||
| Total | 27,725,914 | 27,206,431 | 25,300,757 | 22,880,750 | 100.0 | % | 100.00 | % | 100.00 | % | 100.00 | % | ||||||||||||||||||||
Foreign Assets and Loans
Santander-Chile’s Asset and Liability Committee, or ALCO, is responsible for determining the maximum foreign country exposure the Bank is permitted to have. The ALCO has determined that the total foreign country exposure cannot be greater than 1-time regulatory capital. To determine this, each country is classified using a ranking system from 1 to 6 based on the definition promulgated by the SBIF,FMC, in which the main consideration is the international rating of each country. The ALCO has also set a higher limit if the foreign exposure is to related parties. As of December 31, 2018,2020, the Bank’s foreign exposure, including the estimate of counterparty risk in our derivatives portfolio, was U.S.$1,4632,639 million, or 2.6%3.4% of our assets. For more information, please see Note 39 of our Audited Consolidated Financial Statements.
Below, there are additional details regarding our exposure to countries in category 2 and 3,categories other than 1, the riskiest categories we have exposure to as of December 31, 20182020 considering fair value of derivative instruments. In this category ChinaMexico is the largest exposure and is also broke downas shown in the table below.
| Country | Classification(1) | Derivative Instruments (adjusted to market) | Deposits | Loans | Financial Investments | Total Exposure | ||||||||||||||||||
| US$ Mn | US$ Mn | US$ Mn | US$ Mn | US$ Mn | ||||||||||||||||||||
| Colombia | 2 | 100.41 | 0 | 0.06 | — | 100.47 | ||||||||||||||||||
| Italy | 2 | — | 6.25 | 0.46 | — | 6.71 | ||||||||||||||||||
| Mexico | 2 | — | 0.04 | — | — | 0.04 | ||||||||||||||||||
| Panama | 2 | 0.56 | — | — | — | 0.56 | ||||||||||||||||||
| Peru | 2 | 2.26 | — | — | — | 2.26 | ||||||||||||||||||
| China | 2 | — | — | 3.72 | — | 3.72 | ||||||||||||||||||
| Turkey | 3 | — | — | 4.94 | — | 4.94 | ||||||||||||||||||
| Total | 103.23 | 6.29 | 9.18 | — | 118.7 | |||||||||||||||||||
| Country | Classification (1) | Derivative Instruments (adjusted to market) | Deposits | Loans | Financial Investments | Total Exposure | ||||||||||||||||||
| US$ Million | ||||||||||||||||||||||||
| Colombia | 2 | 0.81 | — | — | — | 0.81 | ||||||||||||||||||
| Italy | 2 | — | 3.36 | 0.13 | — | 3.49 | ||||||||||||||||||
| Mexico | 2 | 9.86 | 0.03 | — | — | 9.89 | ||||||||||||||||||
| Panama | 2 | 5.77 | — | — | — | 5.77 | ||||||||||||||||||
| Peru | 2 | 1.61 | — | — | — | 1.61 | ||||||||||||||||||
| Total | 18.05 | 3.39 | 0.13 | — | 21.57 | |||||||||||||||||||
_____________________
| (1) | Corresponds to country’s classification established in Chapter B-6 of the Compendium of Accounting Standards issued by the |
Our exposure to Grupo Santander Group is as follows:
| Counterpart | Country | Classification | Derivative instruments (market adjusted) USD Mn | Deposits USD Mn | Loans USD Mn | Financial Investments USD Mn | Total Exposure USD Mn | |||||||||||||||||||
| Banco Santander Spain* | Spain | 1 | 216.65 | 332.83 | — | — | 549.48 | |||||||||||||||||||
| Banco Santander London SA | UK | 1 | 25.93 | — | — | — | 25.93 | |||||||||||||||||||
| Santander UK PLC | UK | 1 | — | 0.9 | — | — | 0.9 | |||||||||||||||||||
| Banco Santander Mexico SA | Mexico | 2 | — | 0.04 | — | — | 0.04 | |||||||||||||||||||
| Total | 242.58 | 333.77 | — | — | 576.35 | |||||||||||||||||||||
| Counterpart | Country | Classification | Derivative instruments (market adjusted) | Deposits | Loans | Financial Investments | Total Exposure | |||||||||||||||||||
| US$ million | ||||||||||||||||||||||||||
| Banco Santander Spain* | Spain | 1 | 176.34 | 139.90 | — | — | 316.24 | |||||||||||||||||||
| Santander UK | UK | 1 | 20.95 | 0.05 | — | — | 21.00 | |||||||||||||||||||
| Banco Santander Mexico | Mexico | 2 | 9.86 | 0.03 | — | — | 9.89 | |||||||||||||||||||
| Santander Group | 207.15 | 139.98 | — | — | 347.13 | |||||||||||||||||||||
____________________
| * | We have included our exposure to Santander branches in New York and Hong Kong as exposure to Spain. |
122
The total amount of this exposure to derivative instruments must be compensated daily with collateral and, therefore, there is no credit exposure.
As of December 31, 2018,2020, we had no applicable sovereign exposure, no unfunded exposure, no credit default protection and no current developments.
Classification of Loan Portfolio
Credit Risk Governance
The Risk Division, our credit analysis and risk management group, is largely independent of our Commercial Division.business areas. Risk evaluation teams interact regularly with our clients. For larger transactions, risk teams in our headquarters work directly with clients when evaluating credit risks and preparing credit applications. Various credit approval committees, all of which include Risk Division and Commercial Division personnel, must verify that the appropriate qualitative and quantitative parameters are met by each applicant. Each committee’s powers are defined by our Board of Directors.
Santander-Chile’sThe Bank’s governance rules have established the existence of the Board Risk Committee. This committee is responsible for revising and following all risks that may affect us, including reputational risk, allowing for an integral risk management. This committee serves as the governing body through which the Board supervises all risk functions. It also evaluates the reasonability of the systems for measurement and control of risks. This Committee includes the Chairman of the Board and fiveseven Board members.
The Board has delegated the duty of credit risk management to the Board’s Risk Committee, as well as to the Bank’s risk departments, whose roles are summarized below:
| · | Establish the structure to approve and renew credit requests. The Bank structures credit risks by assigning limits to the concentration of credit risk in terms of individual debtors, debtor groups, industry segments and countries. Approval levels are assigned to the corresponding officials of the business unit (commercial, consumer, SMEs) to be exercised by that level of management. In addition, those limits are continually revised. Teams in charge of risk evaluation at the branch level interact on |
| · | Propose and |
| · | Limit concentrations of exposure to customers or counterparties in geographic areas or industries (for accounts receivable or loans), and by issuer, credit rating and liquidity. |
| · | Develop and maintain the Bank’s credit risk classifications for the purpose of classifying risks according to the degree of exposure to financial loss that is exhibited by the respective financial instruments, with the aim of focusing risk management |
123
The following diagram illustrates the governance of our credit risk division including the committees with approval power:


Role of Santander Spain’s Global Risk Department: Credit Risk
In matters regarding Credit Risk, Santander Spain’s Global Risk Department has the following role:
| All credit risks greater than Ch$63,500 million (or U.S.$ |
| In standardized risks, the consumer and mortgage scoring models are developed |
| For each scoring model, a |
Credit Approval: Loans approved on an individual basis
In preparing a credit proposal for a corporate client whose loans are approved on an individual basis, Santander-Chile’s personnel verifies such parameters as debt servicing capacity (typically including projected cash flows), the company’s financial history and projections for the economic sector in which it operates. The Risk Division is closely involved in this process, and prepares the credit application for the client. All proposals contain an analysis of the client’s strengths and weaknesses,client, a rating and a recommendation. Credit limits are determined not on the basis of outstanding balances of individual clients, but on the direct and indirect credit risk of entire financial groups. For example, a corporation will be evaluated together with its subsidiaries and affiliates.
124
Credit Approval: Loans approved on a group basis
The majority of loans to individuals and small and mid-sized companies are approved by the Standardized Risk Area through an automated credit scoring system. This system is decentralized, automated and based on multiple parameters, including demographic and information regarding credit behavior from external sources and the FMC.
Classification of Loan Portfolio
Loans are divided into: (i) consumer loans (including loans granted to individuals for the purpose of financing the acquisition of consumer goods or payment of services); (ii) residential mortgage loans (including loans granted to individuals for the acquisition, construction or repair of residential real estate, in which the value of the property covers at least 100% of the amount of the loan); and (iii) commercial loans (including all loans other than consumer loans and residential mortgage loans). The models and methods used to classify our loan portfolio and establish credit loss allowances must follow the following guiding principles, which have been approved by our Board of Directors.
Impairment assessment (policy applicable from January 1, 2018)
In accordance with the requirements of IFRS 9 the Bank has developed a new credit risk model, applicable from January 1, 2018.
a. Definition of default and cure
The Bank considers a financial instrument defaulted and therefore Stage 3 for ECL calculations in all cases when the borrower becomes 90 days past due on its contractual payments.
As a part of a qualitative assessment of whether a customer is in default, the Bank also considers a variety of instances that may indicate unlikeliness to pay. Such events include:
| Internal rating of the borrower indicating default or near-default; |
| The borrower requesting emergency funding from the Bank; |
| The borrower having past due liabilities to public creditors or employees; |
| The borrower is deceased; |
| A material decrease in the underlying collateral value where the recovery of the loan is expected from the sale of the collateral; |
| A material decrease in the borrower’s turnover or the loss of a major customer; |
| A covenant breach not waived by the Bank; |
| The debtor (or any legal entity within the debtor’s group) filing for bankruptcy application/protection; and/or |
| Debtor’s listed debt or equity suspended at the primary exchange because of rumors or facts about financial difficulties. |
It is the Bank’s policy to consider a financial instrument as “cured” and therefore re-classified out of Stage 3 when none of the default criteria have been present for at least twelve consecutive months (and 24 months for special vigilance operations). The decision whether to classify an asset as Stage 2 or Stage 1 once cured depends on the updated credit grade at the time of the cure, and whether this indicates there has been a significant increase in credit risk compared to initial recognition.
125
b. Internal rating and PD estimation
The Bank’s Credit Risk Department operates internal rating models. The models incorporate both qualitative and quantitative information, in addition to borrower-specific information, utilize supplemental external information that could affect the borrower’s behavior. The internal credit grades are assigned based on our internal scoring policy. PDs are then adjusted for IFRS 9 ECL calculations to incorporate forward-looking information and the IFRS 9 Stage classification of the exposure. In relation to the credit quality of the investment portfolio, local regulations specify that banks are able to hold only local and foreign fixed–income securities with certain exceptions. Additionally, Banco Santander-Chile has internal policies to ensure that only securities approved by the Market Risk department, which are listed in an internal document entitled “APS” – Products and underlying Approval, are acquired. The Credit Risk Department sets the exposure limits to the approved securities. The APS is updated on a daily basis.
As of December 31, 2018, 99%2020, 92.5% our total investment portfolio corresponds to securities issued by the Chilean Central Bank and US treasury notes.
c. Exposure at default
The exposure at default (EAD) represents the gross carrying amount of the financial instruments subject to the impairment calculation, addressing both the client’s ability to increase its exposure while approaching default and potential early repayments too.
To calculate the EAD for a Stage 1 loan, the Bank assesses the possible default events within 12 months for the calculation of the 12mECL. However, if a Stage 1 loan that is expected to default in the 12 months from the balance sheet date and is also expected to cure and subsequently default again, then all linked default events are taken into account. For Stage 2 and Stage 3 the exposure at default is considered for events over the lifetime of the instruments. For Stage 3, as the instruments are already in default the exposure will be the outstanding balance.
d. Loss given default
The credit risk assessment is based on a standardized LGD assessment framework that results in a certain LGD rate. These LGD rates take into account the expected EAD in comparison to the amount expected to be recovered or realized from any collateral held.
The Bank segments its retail lending products into smaller homogeneous portfolios (evaluated collective), based on key characteristics that are relevant to the estimation of future cash flows. The applied data is based on historically collected loss data and involves a wider set of transaction characteristics (e.g., product type, wider range of collateral types) as well as borrower characteristics.
Further recent data and forward-looking economic scenarios are used in order to determine the IFRS 9 LGD rate for each group of financial instruments. Under IFRS 9, LGD rates are estimated for the Stage 1, Stage 2 and Stage 3 IFRS 9 segment of each asset class. The inputs for these LGD rates are estimated and, where possible, calibrated through back testing against recent recoveries. These are repeated for each economic scenario as appropriate.
e. Significant increase in credit risk (SICR)
The Bank continuously monitors all assets subject to ECLs. In order to determine whether an instrument or a portfolio of instruments is subject to a 12-month ECL or Lifetime ECL, the Bank assesses whether there has been a significant increase in credit risk since initial recognition.
The Bank also applies a secondary qualitative method for triggering a significant increase in credit risk for an asset, such as moving a customer/facility to the watch list (Special(special vigilance). The Bank may also consider that events explained in letter a) above are a significant increase in credit risk as opposed to a default. Regardless of the change in credit grades, if contractual payments are more than 30 days past due, the credit risk is deemed to have increased significantly since initial recognition.
When estimating ECLs on a collective basis for a group of similar assets, the Bank applies the same principles for assessing whether there has been a significant increase in credit risk since initial recognition.
126
Quantitative criteria for SICR Stage 2:
The quantitative criteria is used to identify where an exposure has increased in credit risk and it is applied based on whether an increase in the lifetime PD since the recognition date exceeds the threshold set in absolute terms. The following formula is used to determine such threshold:
Threshold = Lifetime PD (at reporting date) – Lifetime PD (at origination)
| Collectively assessed | Collectively assessed | Individually assessed | Collectively assessed | Individually assessed | ||||||||
| Mortgages | Other loans | Revolving (Credit cards) | Collectively assessed SME | Individually assessed SME | Middle market | Corporate and Investment Banking | Other loans | Revolving (Credit cards) | Collectively assessed SME | Individually assessed SME | Middle market | Corporate and Investment Banking |
| 45% | 42% | 60% | 50% | Santander Group criteria | ||||||||
| 39.57% | 39.11% | 15.73% | 39.11% | 22.69% | 4.5% | Santander Group criteria | ||||||
There is also a relative threshold of 100% of all portfolios with the exception of the Corporate and Investment Banking Portfolio.
Qualitative criteria for SICR Stage 2:
The qualitative criteria is based on the existence of evidence that leads to an automatic classification of financial instruments in Stage 2 - mainly 30 days overdue and restructured. Thresholds of SICR are calibrated based on the average ECL of exposures that are 30 days overdue or with a level of credit risk considered to be “significant”.
| Collectively assessed | Individually assessed | |||||
| Mortgages | Other loans | Revolving
| Collectively assessed SME | Individually assessed SME | Middle market | Corporate and Investment Banking |
| Irregular portfolio > 30 days | Irregular portfolio > 30 days | Irregular portfolio > 30 days | Irregular portfolio > 30 days | Irregular portfolio > 30 days | Irregular portfolio > 30 days | Irregular portfolio > 30 days |
| Restructured marked for monitoring | Restructured marked for monitoring | Restructured marked for monitoring | Restructured marked for monitoring | Restructured marked for monitoring | Restructured marked for monitoring | Restructured marked for monitoring |
| Clients that are considered to be substandard or in incompliance (pre-legal action) | Clients that are considered to be substandard or in incompliance (pre-legal action) | Clients that are considered to be substandard or in incompliance (pre-legal action) | ||||
These thresholds are defined by the Model Committee and the Integral Risk Committee, and are evaluated annually with updates made depending on impacts and definitions of the risk models associated to each portfolio.
f. Grouping financial assets measured on a collective basis
The Bank calculates ECLs either on a collective or an individual basis.
The Bank evaluates on an individual basis commercial loans that are greater than Ch$400 million (US$240,000)56,143), while smaller commercial loans, mortgage loans and consumer loans are grouped into homogeneous portfolios, based on a combination of internal and external characteristics.
127
g. Modified loans
When a loan measured at amortized cost has been renegotiated or modified but not derecognized, the Bank must recognize the resulting gains or losses as the difference between the carrying amount of the original loans, and modified contractual cash flows discounted using the EIR before modification.
If the modification does not result in derecognition, then the subsequent assessment of whether there is a significant increase in credit risk is made comparing the risk at the reporting date based on the modified contractual term and the risk at initial recognition based on the original, unmodified contractual term.
If the modification results in derecognition, then the modified asset is considered to be a new asset. Accordingly, the date of modification is treated as the date of initial recognition for the purposes of the impairment requirements.
h. Collateral and other credit enhancement
The amount and type of collateral required depends on an assessment of the credit risk of the counterparty. Guidelines are in place covering the acceptability and valuation of each type of collateral.
The main types of collateral obtained are, as follows:
| · | For securities lending and reverse repurchase transactions, cash or securities |
| · | For corporate and small business lending, charges over real estate properties, inventory and trade receivables and, in special circumstances, government guarantees |
| · | For retail lending, mortgages over residential properties |
According to the Bank’s policy when an asset (such as real estate) is repossessed it is transferred to assets held for sale at its fair value less cost to sell as a non-financial asset at the repossession date.
Impairment assessment (under IAS 39)
Loans analyzed on an individual basis
For loans that are greater than Ch$400 million (US$648,455), the Bank uses internal models to assign a risk category level to each borrower and its respective loans. We consider the following risk factors: industry or sector of the borrower, the borrower’s competitive position in its markets, owners or managers of the borrower, the borrower’s financial situation, the borrower’s payment capacity and the borrower’s payment behavior to calculate the estimated incurred loan loss. Through these categories, we differentiate the normal loan portfolio from the impaired one.
These are our categories:
For loans classified as A1, A2, A3 and B, we assign a specific provision level on an individual basis to each borrower and, therefore, the amount of loan loss allowance is determined on a case by case basis.
Estimated Incurred Loan Loss = Loan Loss Allowance
The estimated incurred loss is obtained by multiplying all risk factors defined in the following equation:
EIL= EXP x PNP x SEV
Every year, models together with PNP and SEV assumptions, are tested by the Bank’s Credit Risk Department, to ensure that they are appropriate at each reporting date so as to make sure any difference between the estimated incurred losses and real losses is reduced.
These tests focus on the validation of the sufficiency of the Bank’s allowances, and consist of comparisons between actual write-offs to allowances established by the model, and the coverage of the total allowance to actual write-offs in the most current periods. Individual loan classification and improvements to any customer classification are also presented for approval to our Risk Committee.
In accordance with such policy, every year we update appraisals of fair value of collateral before the end of the 24 month period for certain customers and such updated appraisals are considered in the calculation of the allowance for loan losses. The number of updated appraisals performed in 2014 was 98, in 2015 was 43 and 2016 it was 142 and in 2017 it was 257, and such updated appraisals were performed mainly because of changes in customer conditions (renegotiation deterioration of financial situation increase in credit line).
For loans classified in the C and D categories, loan loss allowances are based mainly on the fair value of the collateral, adjusted for an estimate cost to sell, that each of these loans have. Allowance percentage for each category is then based on the fair value of the collateral, or the expected future cash flow from the loan for each individually evaluated non-performing loans.
Loans analyzed on a group basis
The Bank uses the concept of estimated incurred loss to quantify the allowances levels over loan analyzed on a group basis. Incurred loss is the expected provision expense that will appear one year away from the balance date of the transaction’s credit risk, considering the counterpart risk and the collateral associated to each transaction.
Following the Bank’s definition, the Bank uses group evaluation to approach transactions that have similar credit risk features, which indicate the debtor’s payment capacity of the entire debt, capital and interests, pursuant to the contract’s terms. In addition, this allows us to assess a high number of transactions with low individual amounts, whether they belong to individuals or small sized companies. Therefore, debtors and loans with similar features are grouped together and each group has a risk level assigned to it. These models are meant to be used mainly to analyze loans granted to individuals (including consumer loans, credit lines, mortgage loans and commercial loans) and commercial loans to SMEs.
Allowances are established using these models, taking into account the historical impairment and other known circumstances at the time of evaluation. After this, a historical loss rate is assigned to each portfolio profile constituting each segment. The method for assigning a profile is established based on a statistical building method, establishing a relation through a logistic regression various variables, such as payment behavior in the Bank, payment behavior outside the Bank, various socio-demographic data, among others, and a response variable that determines a client’s risk level, which in this case is 90 days of non-performance. Afterwards, common profiles are established related to a logical order and with differentiate default rates, applying the real historical loss the Bank has had with that portfolio.
Our models for loans analyzed on a group basis (consumer loans, residential mortgage loans and small-and-mid-sized commercial loans) are monitored on a monthly basis with respect to predictability and stability, using indices that seek to capture the underlying need to update the models for current loss trends. Therefore, the periods of historical net charge-offs used in the allowance model may be more than a year old as we only update the historical net charge-offs only when our assessment of predictability and stability indicators determine it is necessary.
The different risk categories are constructed and updated periodically based on the payment behavior of the client’s profile to which they belong, as well as his or her socio-demographic characteristics. Therefore, when a customer has past due balance or has missed some payments, the outcome is that the customer will move to a different segment with a higher loss rate, therefore capturing current trends for each risk profile.
At the same time during September 2017, and as part of the normal process of updating the provisioning model for loans analyzed on a group basis, the Bank re-calibrated these models, incorporating a greater historical depth, including a recession period, thus strengthening the parameters of probability of default and loss given default.
This update did not generate significant differences at the level of the total balance of loan loss allowances for credit risk, although it did imply an increase in the provisions associated with commercial and mortgage loans and a decrease in the provisions associated with consumer loans. These improvements, in accordance with IAS 8, are considered as a change in an estimate and its effect was therefore recorded in the Consolidated Statement of Income for the year. For a description of the impact this re-calibration had on provision expense related to our consumer loans, residential mortgage loans and commercial loans analyzed on a group basis, please see “Item 5. Operating and Financial Review and Prospects— A. Operating Results-Provision for loan losses”
Once the customers have been classified, the loan loss allowance is the product of three factors: Exposure (EXP), Probability of Non-Performance (PNP) and Severity (SEV).
EXP = Exposure. This corresponds to the value of commercial loans.
PNP = Probability of Non-Performing. This variable, expressed as a percentage, indicates the probability that a debtor will default. This percentage is associated with the internal score that we give to each debtor, which is determined by analyzing such parameters as debt servicing capacity (including, usually, projected cash flows), the company’s financial history, the solvency and capacity of shareholders and management, and projections for the economic sector in which it operates. The internal rating can be different from ratings obtained from external third parties.
SEV = Severity. This is the effective loss rate given default for debtors in the same segment, which is determined statistically based on the historical effective losses for us for each segment.
Every year, models together with PNP and SEV assumptions, are tested by the Bank’s Credit Risk Department, to ensure that they are appropriate at each reporting date so as to make sure any difference between the estimated incurred losses and real losses is reduced.
Allowances for consumer loans
The estimated incurred loss rates for consumer loans correspond to charge-offs net of recoveries. The methodology establishes the period in which the estimated incurred loss for each risk profile emerges. Once the loss has been considered to have been incurred, the estimated incurred loss rates are applied to the corresponding risk profile to obtain the net charge-off level associated with this period. The loss rates applied to each risk profile are based only on the historical net charge-off data for that specific profile within one of the four groups of consumer loans. No other statistical or other information other than net charge-offs is used to determine the loss rates.
The following diagrams set forth the allowances required by our current models for consumer loans:
Santander:
| Bank | Loan type | Allowance Level(1) (Loss rate) | |||||||||
| Consumer | Performing | New clients | Existing clients | Banefe (3) | |||||||
| 0.53% -19.75% | 0.05%-11.92% | 0.13%-18.67% | |||||||||
| Renegotiated consumer loans which were less than 90 days past due at the time of renegotiation (2) | 3.66%-30.40% | 10.19%-43.71% | |||||||||
| Renegotiated consumer loans which were more than 90 days past due at the time of renegotiation (2) | 41.50%-100% | 51,11%-100% | |||||||||
| Non-performing | Days Past Due | New Clients | Existing Clients | Previously Renegotiated Bank | Previously Renegotiated Banefe (3) | ||||||
| 90-120 | 31.78% | 31.78% | 41.50% | 51.11% | |||||||
| 120-150 | 51.17% | 51.17% | 60.15% | 66.65% | |||||||
| 150-180 | 59.98% | 59.98% | 68.86% | 78.50% | |||||||
| >180 | Charged-off | ||||||||||
There are two renegotiated categories in our consumer loan portfolio:
Profile 1: 180 or more days past due
Profile 2: between 150 and 180 days past due
Profile 3: between 120 and 150 days past due
Profile 4: between 90 and 120 days past due
Small- and mid-sized commercial loans
To determine the estimated incurred loss for individuals (natural persons), small- and mid-sized commercial loans collectively evaluated for impairment, we mainly analyze the payment behavior of clients, particularly the payment behavior of clients with payments that are 90 days or more past-due, clients with other weaknesses, such as early non-performance (i.e., payments that are past-due, though by less than 90 days), clients with modified loans and clients with renegotiated loans, as well as success in recovery against these clients. We also consider whether the loan has underlying mortgage collateral.
The risk categories are such that when a customer has a past-due balance or has missed some payments, the outcome is that the customer will move to a different risk category with a higher loss rate, therefore capturing current trends of the customer and, in the aggregate, current trends in the market.
In order to calculate the estimated incurred loan loss for all commercial loans collectively evaluated for impairment, the Bank sub-divided the portfolio in the following way:
| Loan type | Allowance Level(1) (Loss rate) | |||||||
| Commercial loans analyzed on a group basis | Performing | Commercial loan to individuals w/o mortgage collateral | Commercial loan to individuals with mortgage collateral | Small Enterprise | Mid-sized Enterprise | |||
| 0.87% -15.70% | 0.03%-3.98% | 0.21%-14.39% | 0.14%-7.31 | |||||
| Renegotiated commercial loans which were less than 90 days past due at the time of renegotiation (2) | loan w/o mortgage collateral 2.93%-20.65% | loan with mortgage collateral 1.17%-8.25% | ||||||
| Renegotiated commercial loans which were more than 90 days past due at the time of renegotiation (2) | Days Past Due when renegotiated | Commercial loan to individuals w/o mortgage collateral | Commercial loan to individuals with mortgage collateral | Small Enterprise | Mid-sized Enterprise | |||
| 90-179 | 41.69% | 12.15% | 30.95% | 18.93% | ||||
| 180-359 | 67.31% | 23.42% | 64.47% | 51.86% | ||||
| 360-719 | 75.69% | 34.65% | 70.15% | 63.12% | ||||
| >720 | 83.82% | 46.25% | 74.53% | 72.87% | ||||
| Non-performing consumer | Days Past Due | Commercial loan to individuals w/o mortgage collateral | Commercial loan to individuals with mortgage collateral | Small Enterprise | Mid-sized Enterprise | Previously renegotiated | ||
| 90-179 | 41.69% | 12.15% | 30.95% | 18.93% | 18.93% | |||
| 180-359 | 67.31% | 23.42% | 64.47% | 51.86% | 51.86% | |||
| 360-719 | 75.69% | 34.65% | 70.15% | 63.12% | 63.12% | |||
| >720 | 83.82% | 46.25% | 74.53% | 72.87% | 72.87% | |||
Allowances for residential mortgage loans
The provision methodology for residential mortgage loans takes into consideration different factors in order to group customers with less the 90 days past due into seven different risk profiles. Factors considered are whether the customer is a new customer or has prior history with the Bank. For each of these main categories additional factors are considered in order to develop risk profiles within each risk category, including payment behavior, non-performance less than 90 days, collateral levels, renegotiation history with the Bank, and historical amounts of net charge-offs, among others. The explanation for the initial segregation into three categories, existing, new customer, is as follows: an existing customer is a customer for which there is a broader level of information and history of payment behavior with the Bank, while for a new customer the Bank has no history of payment behavior and only information from the banking system and credit bureaus is available. The risk categories are such that when a customer’s payment behavior deteriorates, the outcome is that the customer will move to a different risk category with a higher loss rate, therefore capturing the current status of the customer.
Previous to 2016, mortgage loans with more than 90 days past due balances are assigned a loss rate of 11.01%. In 2016, mortgage loans more than 90 days past due balances are assigned a loss rate depending on the loan to value. We determined that 90 days is appropriate, since our historical analysis of customer’s behavior has shown that after 90 days, customers are likely to default on their obligations, and that, over succeeding periods, the loss incurred does not increase given the high fair value of collateral percentage to loan amount required under our credit policies for this type of loan. Also, we note that the Chilean economy’s stability over the last few years has not resulted in other than insignificant fluctuations in collateral fair values on residential mortgage loan properties.
The following table sets forth the required loan loss allowance for residential mortgage loans:
Analysis of Santander-Chile’s Loan Classification
The following table shows classifications of our individually assessed loans and related provisions as of December 31, 2020, 2019 and 2018 according to IFRS 9.
| As of December 31, 2020 | |||||||||||||||||||||||||||||||||||||||||||||||||||||||||||||||||||||||||||||||||
| Commercial | Stage 1 | Stage 2 | Stage 3 | Total Individually assessed | Percentage | Stage 1 | Stage 2 | Stage 3 | Total ECL Allowance | Percentage | Stage 1 | Stage 2 | Stage 3 | Total Individually Assessed | Percentage | Stage 1 | Stage 2 | Stage 3 | Total ECL Allowance | Percentage | |||||||||||||||||||||||||||||||||||||||||||||||||||||||||||||
| (in Ch$ millions) | % | (in Ch$ millions) | % | (in Ch$ millions) | % | (in Ch$ millions) | % | ||||||||||||||||||||||||||||||||||||||||||||||||||||||||||||||||||||||||||
| A1 | 29,998 | 29,998 | 0.10 | % | 2 | — | — | 2 | 0.00 | % | 45,862 | - | - | 45,862 | 0.13 | % | 3 | - | - | 3 | 0.00 | % | |||||||||||||||||||||||||||||||||||||||||||||||||||||||||||
| A2 | 1,074,789 | 1,074,789 | 3.56 | % | 525 | — | — | 525 | 0.06 | % | 1,095,506 | 3,265 | - | 1,098,771 | 3.20 | % | 900 | 54 | - | 954 | 0.09 | % | |||||||||||||||||||||||||||||||||||||||||||||||||||||||||||
| A3 | 2,699,684 | 309 | 2,699,993 | 8.94 | % | 2,526 | — | — | 2,526 | 0.29 | % | 1,863,480 | 19,658 | - | 1,883,138 | 5.48 | % | 3,318 | 339 | - | 3,657 | 0.35 | % | ||||||||||||||||||||||||||||||||||||||||||||||||||||||||||
| A4 | 3,200,608 | 16,546 | 3,217,154 | 10.65 | % | 8,865 | 323 | — | 9,188 | 1.04 | % | 2,632,793 | 42,529 | - | 2,675,322 | 7.79 | % | 7,329 | 606 | - | 7,935 | 0.77 | % | ||||||||||||||||||||||||||||||||||||||||||||||||||||||||||
| A5 | 1,755,259 | 26,141 | 1,781,400 | 5.90 | % | 11,296 | 453 | — | 11,749 | 1.33 | % | 2,538,748 | 164,341 | 232 | 2,703,321 | 7.87 | % | 11,498 | 4,618 | 78 | 16,194 | 1.56 | % | ||||||||||||||||||||||||||||||||||||||||||||||||||||||||||
| A6 | 935,499 | 45,671 | 981,170 | 3.25 | % | 6,975 | 2,213 | — | 9,188 | 1.04 | % | 1,588,410 | 289,460 | 53 | 1,877,923 | 5.47 | % | 16,541 | 14,010 | 53 | 30,604 | 2.95 | % | ||||||||||||||||||||||||||||||||||||||||||||||||||||||||||
| B1 | — | 494,915 | 187 | 495,102 | 1.64 | % | — | 14,107 | 79 | 14,186 | 1.61 | % | - | 715,348 | - | 715,348 | 2.08 | % | - | 25,679 | - | 25,679 | 2.48 | % | |||||||||||||||||||||||||||||||||||||||||||||||||||||||||
| B2 | — | 81,955 | 156 | 82,111 | 0.27 | % | — | 2,786 | 66 | 2,852 | 0.32 | % | - | 161,239 | 233 | 161,472 | 0.47 | % | - | 9,566 | 138 | 9,704 | 0.94 | % | |||||||||||||||||||||||||||||||||||||||||||||||||||||||||
| B3 | — | 67,089 | 614 | 67,703 | 0.22 | % | — | 3,841 | 233 | 4,074 | 0.46 | % | - | 65,684 | 695 | 66,379 | 0.19 | % | - | 3,764 | 434 | 4,198 | 0.40 | % | |||||||||||||||||||||||||||||||||||||||||||||||||||||||||
| B4 | — | 47,653 | 45,480 | 93,133 | 0.31 | % | — | 2,488 | 19,688 | 22,176 | 2.51 | % | - | 73,248 | 49,430 | 122,678 | 0.36 | % | - | 3,008 | 21,014 | 24,022 | 2.32 | % | |||||||||||||||||||||||||||||||||||||||||||||||||||||||||
| C1 | — | 46,383 | 108,325 | 154,708 | 0.51 | % | — | 2,548 | 48,147 | 50,695 | 5.75 | % | - | 29,863 | 138,171 | 168,034 | 0.49 | % | - | 2,201 | 48,365 | 50,566 | 4.88 | % | |||||||||||||||||||||||||||||||||||||||||||||||||||||||||
| C2 | — | 15,678 | 39,246 | 54,924 | 0.18 | % | — | 1,261 | 18,171 | 19,432 | 2.20 | % | - | 12,282 | 69,491 | 81,773 | 0.24 | % | - | 926 | 27,021 | 27,947 | 2.70 | % | |||||||||||||||||||||||||||||||||||||||||||||||||||||||||
| C3 | — | 19,655 | 26,204 | 45,859 | 0.15 | % | — | 733 | 10,803 | 11,536 | 1.31 | % | - | 1,550 | 55,378 | 56,928 | 0.17 | % | - | 86 | 15,603 | 15,689 | 1.51 | % | |||||||||||||||||||||||||||||||||||||||||||||||||||||||||
| C4 | — | 3,560 | 32,445 | 36,005 | 0.12 | % | — | 246 | 17,077 | 17,323 | 1.96 | % | - | 2,227 | 48,177 | 50,404 | 0.15 | % | - | 143 | 21,038 | 21,181 | 2.04 | % | |||||||||||||||||||||||||||||||||||||||||||||||||||||||||
| C5 | — | 703 | 64,762 | 65,465 | 0.22 | % | — | 32 | 40,541 | 40,573 | 4.60 | % | - | 3,981 | 36,822 | 40,803 | 0.12 | % | - | 267 | 20,397 | 20,664 | 1.99 | % | |||||||||||||||||||||||||||||||||||||||||||||||||||||||||
| C6 | — | 1,525 | 69,510 | 71,035 | 0.22 | % | — | 35 | 43,310 | 43,345 | 4.91 | % | - | 5,040 | 131,384 | 136,424 | 0.40 | % | - | 185 | 107,364 | 107,549 | 10.37 | % | |||||||||||||||||||||||||||||||||||||||||||||||||||||||||
| Subtotal | 9,695,837 | 867,783 | 386,929 | 10,950,549 | 36.24 | % | 30,189 | 31,066 | 198,115 | 259,370 | 29.39 | % | 9,764,799 | 1,589,715 | 530,066 | 11,884,580 | 34.61 | % | 39,589 | 65,452 | 261,505 | 366,546 | 35.35 | % | |||||||||||||||||||||||||||||||||||||||||||||||||||||||||
128
| Commercial | Stage 1 | Stage 2 | Stage 3 | Total Collectively Assessed | Percentage | Stage 1 | Stage 2 | Stage 3 | Total ECL Allowance | Percentage | ||||||||||||||||||||||||||||||
| (in Ch$ millions) | % | (in Ch$ millions) | % | |||||||||||||||||||||||||||||||||||||
| Commercial | 4,493,999 | 228,591 | 380,019 | 5,102,609 | 14.86 | % | 40,943 | 44,315 | 193,268 | 278,526 | 26.86 | % | ||||||||||||||||||||||||||||
| Mortgage | 11,518,363 | 392,372 | 501,090 | 12,411,825 | 36.14 | % | 25,065 | 8,441 | 79,016 | 112,522 | 10.85 | % | ||||||||||||||||||||||||||||
| Consumer | 4,439,163 | 236,595 | 265,121 | 4,940,879 | 14.39 | % | 88,825 | 31,732 | 158,642 | 279,199 | 26.93 | % | ||||||||||||||||||||||||||||
| Subtotal | 20,451,525 | 857,558 | 1,146,230 | 22,455,313 | 65.39 | % | 154,833 | 84,488 | 430,926 | 670,247 | 64.65 | % | ||||||||||||||||||||||||||||
| Total | 30,216,324 | 2,447,273 | 1,676,296 | 34,339,893 | 100.00 | % | 194,422 | 149,940 | 692,431 | 1,036,793 | 100.00 | % | ||||||||||||||||||||||||||||
| Stage 1 | Stage 2 | Stage 3 | Total Collectively assessed | Percentage | Stage 1 | Stage 2 | Stage 3 | Total ECL Allowance | Percentage | |||||||||||||||||||||||||||||||
| (in Ch$ millions) | % | (in Ch$ millions) | % | |||||||||||||||||||||||||||||||||||||
| Commercial | 3,616,969 | 232,472 | 386,154 | 4,235,595 | 14.02 | % | 43,541 | 24,574 | 179,317 | 247,432 | 28.04 | % | ||||||||||||||||||||||||||||
| Mortgage | 4,341,740 | 249,039 | 285,510 | 4,876,289 | 16.14 | % | 70,904 | 54,372 | 159,066 | 284,342 | 32.22 | % | ||||||||||||||||||||||||||||
| Consumer | 9,258,962 | 447,496 | 444,523 | 10,150,981 | 33.60 | % | 9,006 | 15,102 | 67,162 | 91,270 | 10.34 | % | ||||||||||||||||||||||||||||
| Subtotal | 17,217,671 | 929,007 | 1,116,187 | 19,262,865 | 63.76 | % | 123,451 | 94,048 | 405,545 | 623,044 | 70.61 | % | ||||||||||||||||||||||||||||
| Total | 26,913,508 | 1,796,790 | 1,503,116 | 30,213,414 | 100.00 | % | 153,640 | 125,114 | 603,660 | 882,414 | 100.00 | % | ||||||||||||||||||||||||||||
| As of December 31, 2019 | ||||||||||||||||||||||||||||||||||||||||
| Commercial | Stage 1 | Stage 2 | Stage 3 | Total Individually Assessed | Percentage | Stage 1 | Stage 2 | Stage 3 | Total ECL Allowance | Percentage | ||||||||||||||||||||||||||||||
| (in Ch$ millions) | % | (in Ch$ millions) | % | |||||||||||||||||||||||||||||||||||||
| A1 | 99,042 | - | - | 99,042 | 0.30 | 2 | - | 2 | 0.00 | % | ||||||||||||||||||||||||||||||
| A2 | 907,659 | 37 | - | 907,696 | 2.78 | 443 | - | 443 | 0.05 | % | ||||||||||||||||||||||||||||||
| A3 | 2,418,990 | 61 | - | 2,419,051 | 7.41 | 2,617 | - | 2,617 | 0.29 | % | ||||||||||||||||||||||||||||||
| A4 | 3,262,671 | 7,184 | - | 3,269,855 | 10.01 | 4,399 | 22 | 4,421 | 0.49 | % | ||||||||||||||||||||||||||||||
| A5 | 2,188,717 | 22,163 | - | 2,210,880 | 6.77 | 7,618 | 515 | 8,133 | 0.91 | % | ||||||||||||||||||||||||||||||
| A6 | 1,086,401 | 47,157 | 487 | 1,134,045 | 3.47 | 6,461 | 1,410 | 20 | /8 | 8,079 | 0.90 | % | ||||||||||||||||||||||||||||
| B1 | - | 603,201 | - | 603,201 | 1.85 | - | 12,641 | - | 12,641 | 1.41 | % | |||||||||||||||||||||||||||||
| B2 | - | 82,781 | 560 | 83,341 | 0.26 | - | 3,773 | 205 | 3,978 | 0.44 | % | |||||||||||||||||||||||||||||
| B3 | - | 85,034 | 817 | 85,851 | 0.26 | - | 3,367 | 261 | 3,628 | 0.40 | % | |||||||||||||||||||||||||||||
| B4 | - | 83,039 | 50,662 | 133,701 | 0.41 | - | 4,085 | 21,910 | 25,995 | 2.90 | % | |||||||||||||||||||||||||||||
| C1 | - | 45,433 | 113,004 | 158,437 | 0.49 | - | 3,516 | 50,440 | 53,956 | 6.02 | % | |||||||||||||||||||||||||||||
| C2 | - | 8,865 | 66,965 | 75,830 | 0.23 | - | 614 | 28,504 | 29,118 | 3.25 | % | |||||||||||||||||||||||||||||
| C3 | - | 15,762 | 32,839 | 48,601 | 0.15 | - | 221 | 11,281 | 11,502 | 1.28 | % | |||||||||||||||||||||||||||||
| C4 | - | 2,405 | 38,967 | 41,372 | 0.13 | - | 170 | 20,039 | 20,209 | 2.26 | % | |||||||||||||||||||||||||||||
| C5 | - | 847 | 44,057 | 44,904 | 0.14 | - | 43 | 27,586 | 27,629 | 3.08 | % | |||||||||||||||||||||||||||||
| C6 | - | 998 | 52,649 | 53,647 | 0.16 | - | 12 | 35,732 | 35,744 | 3.99 | % | |||||||||||||||||||||||||||||
| Subtotal | 9,963,480 | 1,004,967 | 401,007 | 11,369,454 | 34.80 | 21,540 | 30,389 | 196,166 | 249,095 | 27.69 | % | |||||||||||||||||||||||||||||
| Commercial | Stage 1 | Stage 2 | Stage 3 | Total Collectively Assessed | Percentage | Stage 1 | Stage 2 | Stage 3 | Total ECL Allowance | Percentage | ||||||||||||||||||||||||||||||
| (in Ch$ millions) | % | (in Ch$ millions) | % | |||||||||||||||||||||||||||||||||||||
| Commercial | 3,839,143 | 240,100 | 413,628 | 4,492,871 | 13.75 | 35,887 | 25,555 | 197,032 | 258,474 | 28.84 | % | |||||||||||||||||||||||||||||
| Mortgage | 10,275,966 | 457,948 | 529,081 | 11,262,995 | 34.47 | 8,446 | 14,509 | 78,104 | 101,059 | 11.28 | % | |||||||||||||||||||||||||||||
| Consumer | 4,963,047 | 292,718 | 290,430 | 5,546,195 | 16.98 | 67,396 | 50,808 | 170,263 | 288,467 | 32.19 | % | |||||||||||||||||||||||||||||
| Subtotal | 19,078,156 | 990,766 | 1,233,139 | 21,302,061 | 65.20 | 111,729 | 90,872 | 445,399 | 648,000 | 72.31 | % | |||||||||||||||||||||||||||||
| Total | 29,041,636 | 1,995,733 | 1,634,146 | 32,671,515 | 100.00 | 133,269 | 121,261 | 641,565 | 896,095 | 100.00 | % | |||||||||||||||||||||||||||||
| �� | ||||||||||||||||||||||||||||||||||||||||
129
| As of December 31, 2018 | ||||||||||||||||||||||||||||||||||||||||
| Commercial | Stage 1 | Stage 2 | Stage 3 | Total Individually Assessed | Percentage | Stage 1 | Stage 2 | Stage 3 | Total ECL Allowance | Percentage | ||||||||||||||||||||||||||||||
| (in Ch$ millions) | % | (in Ch$ millions) | % | |||||||||||||||||||||||||||||||||||||
| A1 | 29,998 | 29,998 | 0.10 | % | 2 | — | — | 2 | 0.00 | % | ||||||||||||||||||||||||||||||
| A2 | 1,074,789 | 1,074,789 | 3.56 | % | 525 | — | — | 525 | 0.06 | % | ||||||||||||||||||||||||||||||
| A3 | 2,699,684 | 309 | 2,699,993 | 8.94 | % | 2,526 | — | — | 2,526 | 0.29 | % | |||||||||||||||||||||||||||||
| A4 | 3,200,608 | 16,546 | 3,217,154 | 10.65 | % | 8,865 | 323 | — | 9,188 | 1.04 | % | |||||||||||||||||||||||||||||
| A5 | 1,755,259 | 26,141 | 1,781,400 | 5.90 | % | 11,296 | 453 | — | 11,749 | 1.33 | % | |||||||||||||||||||||||||||||
| A6 | 935,499 | 45,671 | 981,170 | 3.25 | % | 6,975 | 2,213 | — | 9,188 | 1.04 | % | |||||||||||||||||||||||||||||
| B1 | — | 494,915 | 187 | 495,102 | 1.64 | % | — | 14,107 | 79 | 14,186 | 1.61 | % | ||||||||||||||||||||||||||||
| B2 | — | 81,955 | 156 | 82,111 | 0.27 | % | — | 2,786 | 66 | 2,852 | 0.32 | % | ||||||||||||||||||||||||||||
| B3 | — | 67,089 | 614 | 67,703 | 0.22 | % | — | 3,841 | 233 | 4,074 | 0.46 | % | ||||||||||||||||||||||||||||
| B4 | — | 47,653 | 45,480 | 93,133 | 0.31 | % | — | 2,488 | 19,688 | 22,176 | 2.51 | % | ||||||||||||||||||||||||||||
| C1 | — | 46,383 | 108,325 | 154,708 | 0.51 | % | — | 2,548 | 48,147 | 50,695 | 5.75 | % | ||||||||||||||||||||||||||||
| C2 | — | 15,678 | 39,246 | 54,924 | 0.18 | % | — | 1,261 | 18,171 | 19,432 | 2.20 | % | ||||||||||||||||||||||||||||
| C3 | — | 19,655 | 26,204 | 45,859 | 0.15 | % | — | 733 | 10,803 | 11,536 | 1.31 | % | ||||||||||||||||||||||||||||
| C4 | — | 3,560 | 32,445 | 36,005 | 0.12 | % | — | 246 | 17,077 | 17,323 | 1.96 | % | ||||||||||||||||||||||||||||
| C5 | — | 703 | 64,762 | 65,465 | 0.22 | % | — | 32 | 40,541 | 40,573 | 4.60 | % | ||||||||||||||||||||||||||||
| C6 | — | 1,525 | 69,510 | 71,035 | 0.22 | % | — | 35 | 43,310 | 43,345 | 4.91 | % | ||||||||||||||||||||||||||||
| Subtotal | 9,695,837 | 867,783 | 386,929 | 10,950,549 | 36.24 | % | 30,189 | 31,066 | 198,115 | 259,370 | 29.39 | % | ||||||||||||||||||||||||||||
| Commercial | Stage 1 | Stage 2 | Stage 3 | Total Collectively Assessed | Percentage | Stage 1 | Stage 2 | Stage 3 | Total ECL Allowance | Percentage | ||||||||||||||||||||||||||||||
| (in Ch$ millions) | % | (in Ch$ millions) | % | |||||||||||||||||||||||||||||||||||||
| Commercial | 3,616,969 | 232,472 | 386,154 | 4,235,595 | 14.02 | % | 43,541 | 24,574 | 179,317 | 247,432 | 28.04 | % | ||||||||||||||||||||||||||||
| Mortgage | 4,341,740 | 249,039 | 285,510 | 4,876,289 | 16.14 | % | 70,904 | 54,372 | 159,066 | 284,342 | 32.22 | % | ||||||||||||||||||||||||||||
| Consumer | 9,258,962 | 447,496 | 444,523 | 10,150,981 | 33.60 | % | 9,006 | 15,102 | 67,162 | 91,270 | 10.34 | % | ||||||||||||||||||||||||||||
| Subtotal | 17,217,671 | 929,007 | 1,116,187 | 19,262,865 | 63.76 | % | 123,451 | 94,048 | 405,545 | 623,044 | 70.61 | % | ||||||||||||||||||||||||||||
| Total | 26,913,508 | 1,796,790 | 1,503,116 | 30,213,414 | 100.00 | % | 153,640 | 125,114 | 603,660 | 882,414 | 100.00 | % | ||||||||||||||||||||||||||||
The following tables provide statistical data regarding the classification of our loans analyzed on an individual basis as of December 31, 2017 and 2016 based on IAS 39.
| 2017 | 2016 | |||||||||||||||||||||||||||||||
| Category | Individual | Percentage | Allowance | Percentage | Individual | Percentage | Allowance | Percentage | ||||||||||||||||||||||||
| Ch$mn | % | Ch$mn | % | Ch$mn | % | Ch$mn | % | |||||||||||||||||||||||||
| Individualized business | ||||||||||||||||||||||||||||||||
| A1 | 1,051,072 | 3.79 | 827 | 0.10 | 1,599,311 | 5.88 | 923 | 0.12 | ||||||||||||||||||||||||
| A2 | 5,957,305 | 21.49 | 18,514 | 2.34 | 6,437,930 | 23.67 | 23,757 | 3.00 | ||||||||||||||||||||||||
| A3 | 2,176,779 | 7.85 | 27,894 | 3.53 | 2,030,867 | 7.47 | 29,668 | 3.75 | ||||||||||||||||||||||||
| B | 539,074 | 1.94 | 32,089 | 4.06 | 538,909 | 1.98 | 40,545 | 5.13 | ||||||||||||||||||||||||
| C1 | 145,033 | 0.52 | 2,604 | 0.33 | 121,893 | 0.45 | 2,176 | 0.28 | ||||||||||||||||||||||||
| C2 | 56,871 | 0.21 | 5,104 | 0.65 | 51,034 | 0.19 | 4,555 | 0.58 | ||||||||||||||||||||||||
| C3 | 39,825 | 0.14 | 8,935 | 1.13 | 49,901 | 0.18 | 11,136 | 1.41 | ||||||||||||||||||||||||
| C4 | 53,261 | 0.19 | 19,120 | 2.42 | 64,118 | 0.24 | 22,894 | 2.90 | ||||||||||||||||||||||||
| D1 | 71,896 | 0.26 | 41,941 | 5.30 | 73,462 | 0.27 | 42,625 | 5.39 | ||||||||||||||||||||||||
| D2 | 77,048 | 0.28 | 62,234 | 7.87 | 89,857 | 0.33 | 72,192 | 9.13 | ||||||||||||||||||||||||
| Total | 10,168,164 | 36.67 | 219,262 | 27.73 | 11,057,282 | 40.66 | 250,471 | 31.69 | ||||||||||||||||||||||||
Write-offs
As a general rule, charge-offs should be done when all collection efforts have been exhausted. These charge-offscharge- offs consist of de-recognition from the Consolidated Statements of Financial Position of the corresponding loans operations in its entirety, and, therefore, include portions not past-due of a loan in the case of installments loans or leasing operations (no partial charge-offs exists). Subsequent payments obtained from charged-off loans will be recognized in the Consolidated Statement of Income as a recovery of loans previously charged-off. Loan and accounts receivable charge-offs are recorded for overdue, past due, and current installments based on the time periods expired since reaching overdue status, as described below:
Type of contract | Term | |
| Consumer loans with or without collateral | 6 months | |
| Other transactions without collateral | 24 months | |
| Commercial loans with collateral | 36 months | |
| Mortgage loans | 48 months | |
| Consumer leasing | 6 months | |
| Other non-mortgage leasing transactions | 12 months | |
| Mortgage leasing (household and business) | 36 months |
Any payment agreement of an already charged-off loan will not give rise to income-as long as the operation is still in an impaired status-and the effective payments received are accounted for as a recovery from loans previously charged-off. In general, legal collection proceedings are commenced with respect to consumer loans once they are past-due for at least 90 days and, with respect to mortgage loans, once they are past-due for at least 120 days. Legal collection proceedings are always commenced within one year of such loans becoming past-due, unless we determine that the size of the past-due amount does not warrant such proceedings. In addition, the majority of our commercial loans are short-term, with single payments at maturity. Past-due loans are required to be covered by individual loan loss reserves equivalent to 100.0% of any unsecured portion thereof.
130
Analysis of Stage 1, Stage 2 and Stage 3 loans
Commercial loans at amortized cost
In 2020, commercial loans grew 7.1% or Ch$1,124,864 million with growth mainly coming from our SME segment through the FOGAPE loans. In 2020, there was a rise in commercial loans transferred to Stage 2 as a result of an adjustment due to the deterioration of macroeconomic variables. In June 2020, Ch$228,000 million where transferred from Stage 1 to Stage 2. The transfers to stage 3 and the increase in write-offs was due to the slower economic growth as result of the lockdowns due to the COVID-19 pandemic, which affected loans in the SME segment, as well as Middle-market and Corporate loans in sectors more heavily affected by the pandemic.
| Stage 1 | Stage 2 | Stage 3 | Total | |||||||||||||||||||||||||
| Commercial loans | Individual | Collective | Individual | Collective | Individual | Collective | ||||||||||||||||||||||
| (In millions of Ch$) | ||||||||||||||||||||||||||||
| Gross carrying amount at January 1, 2020 | 10,208,264 | 3,594,359 | 1,004,967 | 240,100 | 401,007 | 413,628 | 15,862,325 | |||||||||||||||||||||
| Transfers | ||||||||||||||||||||||||||||
| Transfers to stage 2 | (1,355,492 | ) | (277,926 | ) | 1,355,492 | 277,926 | - | - | - | |||||||||||||||||||
| Transfers to stage 3 | (2,492 | ) | (52,304 | ) | - | - | 2,492 | 52,304 | - | |||||||||||||||||||
| Transfers to stage 3 | - | - | (198,124 | ) | (163,049 | ) | 198,124 | 163,049 | - | |||||||||||||||||||
| Transfers to stage 1 | 239,349 | 162,768 | (239,349 | ) | (162,768 | ) | - | - | - | |||||||||||||||||||
| Transfers to stage 2 | - | - | 4,022 | 117,446 | (4,022 | ) | (117,446 | ) | - | |||||||||||||||||||
| Transfers to stage 1 | - | 138 | - | - | - | (138 | ) | - | ||||||||||||||||||||
| Net changes on financial assets | 676,413 | 867,445 | (337,291 | ) | (80,505 | ) | (537 | ) | (28,040 | ) | 1,097,485 | |||||||||||||||||
| Write-off | - | - | - | - | (66,989 | ) | (101,548 | ) | (168,537 | ) | ||||||||||||||||||
| Foreign exchange adjustments and others | (1,243 | ) | 10,082 | (2 | ) | (559 | ) | (9 | ) | 52 | 8,321 | |||||||||||||||||
| At December 31, 2020 | 9,764,799 | 4,493,999 | 1,589,715 | 228,591 | 530,066 | 380,019 | 16,987,189 | |||||||||||||||||||||
Mortgage loans at amortized cost
In 2020, mortgage loans grew 10.2% or Ch$1,148,830 million, as the lower long-term interest rates drove clients to take out more mortgages. Mortgage loans classified in Stage 2 and Stage 3 declined 14.3% and 5.3%, respectively. After the 6-month grace periods expired for the majority of these loans in November 2020, most of our clients showed a positive payment behavior and remained under Stage 1.
| Stage 1 | Stage 2 | Stage 3 | ||||||||||||||
| Mortgage loans | Collective | Collective | Collective | Total | ||||||||||||
| (in millions of Ch$) | ||||||||||||||||
| Gross carrying amount at January 1, 2020 | 10,275,966 | 457,948 | 529,081 | 11,262,995 | ||||||||||||
| Transfers | ||||||||||||||||
| Transfers to stage 2 | (248,167 | ) | 248,167 | - | - | |||||||||||
| Transfers to stage 3 | (53,621 | ) | - | 53,621 | - | |||||||||||
| Transfers to stage 3 | - | (215,547 | ) | 215,547 | - | |||||||||||
| Transfers to stage 1 | 321,954 | (321,954 | ) | - | - | |||||||||||
| Transfers to stage 2 | - | 248,635 | (248,635 | ) | - | |||||||||||
| Transfers to stage 1 | 463 | - | (463 | ) | - | |||||||||||
| Net changes on financial assets | 1,221,898 | (25,440 | ) | (22,147 | ) | 1,174,311 | ||||||||||
| Write-off | - | - | (25,831 | ) | (25,831 | ) | ||||||||||
| Foreign exchange adjustments and others | (130 | ) | 563 | (83 | ) | 350 | ||||||||||
| At December 31, 2020 | 11,518,363 | 392,372 | 501,090 | 12,411,825 | ||||||||||||
131
Consumer loans at amortized cost
In 2020, consumer loans decreased 10.9% or Ch$ 605,316 million due to low demand for loans following the COVID-19 pandemic lockdowns. This decrease is explained be the fact that we are mainly focused on lending to high-income earners, who mostly kept their jobs and increased their savings household rate. The majority of households also accessed their pension fund withdrawal, which in the initial stage was tax free, and therefore demand for consumer loans fell.
| Stage 1 | Stage 2 | Stage 3 | ||||||||||||||
| Consumer loans | Collective | Collective | Collective | Total | ||||||||||||
| (in millions of Ch$) | ||||||||||||||||
| Gross carrying amount at January 1, 2020 | 4,963,047 | 292,718 | 290,430 | 5,546,195 | ||||||||||||
| Transfers | ||||||||||||||||
| Transfers to stage 2 | (410,942 | ) | 410,942 | - | - | |||||||||||
| Transfers to stage 3 | (16,962 | ) | - | 16,962 | - | |||||||||||
| Transfers to stage 3 | - | (223,169 | ) | 223,169 | - | |||||||||||
| Transfers to stage 1 | 238,800 | (238,800 | ) | - | - | |||||||||||
| Transfers to stage 2 | - | 57,574 | (57,574 | ) | - | |||||||||||
| Transfers to stage 1 | 2,225 | - | (2,225 | ) | - | |||||||||||
| Net changes on financial assets | (337,006 | ) | (62,658 | ) | 13,763 | (385,901 | ) | |||||||||
| Write-off | - | - | (219,402 | ) | (219,402 | ) | ||||||||||
| Foreign Exchange adjustments | 1 | (12 | ) | (4 | ) | (15 | ) | |||||||||
| At December 31, 2020 | 4,439,163 | 236,595 | 265,121 | 4,940,879 | ||||||||||||
Analysis and Classification of Loan Portfolio Based on the Borrower’s Payment Performance
The following table analyzes our non-performing and impaired loans. Non-performing loans include the aggregate principal and accrued but unpaid interest of any loan with one installment that is at least 90 days past-due, and do not accrue interest.
Impaired loans include all loans classified as Stage 3 according to IFRS 9. Prior to January 1, For 2020, 2019 and 2018 impaired loans include: (a) loans individually evaluated for impairment: (i) the carrying amount of all loans to clients that are rated C1 through C4, D1 and D2 and (ii) the carrying amount of all loans to an individual client with at least one non-performing loan (which is not a residential mortgage loan past due less than 90 days), regardless of category; and (b) loans collectively evaluated for impairment, the carrying amount of all loans to a client, when at least one loan to that client is not performing or has been renegotiated. See “Note 9—Loans and Account Receivable at Amortized Cost – under IFRS 9” of the Audited Consolidated Financial Statements. Renegotiated loans, on which payments are not past-due, are not ordinarily classified as non-performing loans, but do not accrue interest.
The following table sets forth all of our non-performing loans and impaired loans as of December 31, 2018, 2017, 2016, 2015 and 2014.
| 2018 | 2017 | 2016 | 2015 | 2014 | ||||||||||||||||
| (in millions of Ch$, except percentages) | ||||||||||||||||||||
| Non-performing loans (1) | 631,649 | 633,461 | 564,131 | 643,468 | 644,327 | |||||||||||||||
| Impaired loans (2) | 1,503,116 | 1,803,173 | 1,615,441 | 1,669,340 | 1,617,251 | |||||||||||||||
| Allowance for loan losses (3) | 882,414 | 791,157 | 790,605 | 762,301 | 684,317 | |||||||||||||||
| Total loans (4) | 30,213,414 | 27,725,914 | 27,206,431 | 25,300,757 | 22,892,649 | |||||||||||||||
| Allowance for loan losses / loans | 2.9 | % | 2.85 | % | 2.89 | % | 3.01 | % | 2.99 | % | ||||||||||
| Non-performing loans as a percentage of total loans | 2.1 | % | 2.28 | % | 2.07 | % | 2.54 | % | 2.81 | % | ||||||||||
| Loan loss allowance as a percentage of non-performing loans | 139.7 | % | 124.89 | % | 140.15 | % | 118.47 | % | 106.21 | % | ||||||||||
Analysis of Stage 1, Stage 2 and Stage 3 loans
Commercial loans at amortized cost
In 2018, commercial loans grew 10% or Ch$1,385,736 million with growth mainly coming from our Middle-market segment in line with the re-activation of investment in the Chilean economy and representing the bulk of growth in Stage 1 loans in this product. The growth of Stage 1 loans was also due to the rise in commercial loans disbursed to high income individuals. In 2018, the Bank continued to remain selective in the SME loan book included in the Commercial banking segment and originated few new assets among this sub-segment. On the other hand as this loan book aged, it represented the bulk of increase and transfers to Stage 2 and Stage 3 loans.
| Commercial loans | Stage 1 | Stage 2 | Stage 3 | Total | ||||||||||||||||||||||||
| (In millions of Ch$) | Individual | Collective | Individual | Collective | Individual | Collective | ||||||||||||||||||||||
| Gross carrying amount at January 1, 2018 | 9,062,153 | 3,338,916 | 630,515 | 208,018 | 372,744 | 350,747 | 13,800,408 | |||||||||||||||||||||
| Transfers to stage 2 | (225,062 | ) | (53,020 | ) | 225,062 | 53,020 | — | — | — | |||||||||||||||||||
| Transfers to stage 3 | (16,654 | ) | (67,886 | ) | — | — | 16,654 | 67,886 | — | |||||||||||||||||||
| Transfers to stage 3 | — | — | (59,688 | ) | (40,853 | ) | 59,688 | 40,853 | — | |||||||||||||||||||
| Transfers to stage 1 | 13,199 | 52,755 | (13,199 | ) | (52,755 | ) | — | — | ||||||||||||||||||||
| Transfers to stage 2 | — | — | 4,451 | 36,247 | (4,451 | ) | (36,247 | ) | — | |||||||||||||||||||
| Transfers to stage 1 | — | 718 | — | — | — | (718 | ) | — | ||||||||||||||||||||
| Net changes on financial assets | 1,334,933 | 708,531 | 138,436 | 48,323 | 4,240 | 70,848 | 2,305,311 | |||||||||||||||||||||
| Write-off | — | — | — | — | (53,921 | ) | (74,430 | ) | (128,351 | ) | ||||||||||||||||||
| Foreign Exchange adjustments | (472,732 | ) | (363,045 | ) | (57,794 | ) | (19,528 | ) | (8,025 | ) | (32,785 | ) | (953,909 | ) | ||||||||||||||
| At December 31, 2018 | 9,695,837 | 3,616,969 | 867,783 | 232,472 | 386,929 | 386,154 | 15,186,144 | |||||||||||||||||||||
Mortgage loans at amortized cost
In 2018, mortgage loans grew 11.6% or Ch$1,054,086 million with growth mainly coming from our high income earners. The focus on this sub-segment and an origination strategy that focused on loan-to-values below 80% in a positive economic environment also explains the improvement of Stage 2 clients that shifted to Stage 1 reducing Stage 2 loans in the year.
| Mortgage loans | Stage 1 | Stage 2 | Stage 3 | Total | ||||||||||||
| (In millions of Ch$) | Collective | Collective | Collective | |||||||||||||
| Gross carrying amount at January 1, 2018 | 8,191,229 | 469,349 | 436,317 | 9,096,895 | ||||||||||||
| Transfers to stage 2 | (87,473 | ) | 87,473 | — | — | |||||||||||
| Transfers to stage 3 | (64,949 | ) | — | 64,949 | — | |||||||||||
| Transfers to stage 3 | — | (54,488 | ) | 54,488 | — | |||||||||||
| Transfers to stage 1 | 162,432 | (162,432 | ) | — | ||||||||||||
| Transfers to stage 2 | — | 79,159 | (79,159 | ) | — | |||||||||||
| Transfers to stage 1 | 2,612 | — | (2,612 | ) | — | |||||||||||
| Net changes on financial assets | 1,226,259 | 34,653 | 10,215 | 1,271,127 | ||||||||||||
| Write-off | — | — | (31,664 | ) | (31,664 | ) | ||||||||||
| Foreign Exchange adjustments | (171,148 | ) | (6,218 | ) | (8,011 | ) | (185,377 | ) | ||||||||
| At December 31, 2018 | 9,258,962 | 447,496 | 444,523 | 10,150,981 | ||||||||||||
Consumer loans at amortized cost
In 2018, consumer loans grew 7.0% or Ch$318,597 million with growth mainly coming from our high income earners and a continued decrease of loans among low income earners. The latter also explains the reduction in Stage 2 and Stage 3 consumer loans as assets repaid or written off in Stage 2 and Stage 3 outpaced the new assets originated or transferred to these stages.
| Consumer loans | Stage 1 | Stage 2 | Stage 3 | Total | ||||||||||||
| (In millions of Ch$) | Collective | Collective | Collective | |||||||||||||
| Gross carrying amount at January 1, 2018 | 3,978,393 | 257,580 | 321,719 | 4,557,692 | ||||||||||||
| Transfers to stage 2 | (46,936 | ) | 46,936 | — | — | |||||||||||
| Transfers to stage 3 | (33,161 | ) | — | 33,161 | — | |||||||||||
| Transfers to stage 3 | — | (19,327 | ) | 19,327 | — | |||||||||||
| Transfers to stage 1 | 29,777 | (29,777 | ) | — | — | |||||||||||
| Transfers to stage 2 | — | 17,988 | (17,988 | ) | — | |||||||||||
| Transfers to stage 1 | 37 | — | (37 | ) | — | |||||||||||
| Net changes on financial assets | 766,069 | 1,063 | 76,398 | 843,530 | ||||||||||||
| Write-offs | — | — | (115,933 | ) | (115,933 | ) | ||||||||||
| Foreign Exchange adjustments | (352,439 | ) | (25,424 | ) | (31,137 | ) | (409,000 | ) | ||||||||
| At December 31, 2018 | 4,341,740 | 249,039 | 285,510 | 4,876,289 | ||||||||||||
Analysis of Impaired and Non-Performing Loans
The following table analyzes our impaired loans. For 2018 Impaired loans include all loans classified as Stage 3 according to IFRS 9. Prior to January 1, 2018, impaired loans include: (i) all loans to a single client that are evaluated on a group basis, including performing loans, that have a loan classified as non-performing, (ii) all renegotiated consumer loans and (iii) all commercial loans at risk of default. See “Note 9—Loans and Accounts Receivables from Customers—(a) Loans and accounts receivable from customers” in the Audited Consolidated Financial Statements.
| 2018 (1) | 2017 | 2016 | 2015 | 2014 | 2020 (1) | 2019 (1) | 2018 (1) | 2017 | 2016 | |||||||||||||||||||||||||||||||
| (Ch$ million) | (Ch$ million) | |||||||||||||||||||||||||||||||||||||||
| Total loans | 30,213,414 | 27,725,914 | 27,206,431 | 25,300,757 | 22,892,649 | 34,339,893 | 32,671,515 | 30,213,414 | 27,725,914 | 27,206,431 | ||||||||||||||||||||||||||||||
| Allowance for loan losses | 882,414 | 791,157 | 790,605 | 762,301 | 684,317 | 1,036,793 | 896,095 | 882,414 | 791,157 | 790,605 | ||||||||||||||||||||||||||||||
| Impaired loans(2) | 1,503,116 | 1,803,173 | 1,615,441 | 1,669,340 | 1,617,251 | 1,676,296 | 1,634,146 | 1,503,116 | 1,803,173 | 1,615,441 | ||||||||||||||||||||||||||||||
| Impaired loans as a percentage of total loans | 4.97 | % | 6.50 | % | 5.94 | % | 6.60 | % | 7.06 | % | 4.88 | % | 5.00 | % | 4.97 | % | 6.50 | % | 5.94 | % | ||||||||||||||||||||
| Amounts non-performing | 631,649 | 633,461 | 564,131 | 643,468 | 644,327 | 486,435 | 671,336 | 631,649 | 633,461 | 564,131 | ||||||||||||||||||||||||||||||
| To the extent secured(3) | 323,095 | 318,218 | 298,537 | 283,731 | 296,899 | 285,731 | 375,052 | 323,095 | 318,218 | 298,537 | ||||||||||||||||||||||||||||||
| To the extent unsecured | 308,554 | 315,243 | 265,594 | 359,737 | 347,428 | 200,704 | 296,284 | 308,554 | 315,243 | 265,594 | ||||||||||||||||||||||||||||||
| Amounts non-performing as a percentage of total loans | 2.09 | % | 2.28 | % | 2.07 | % | 2.54 | % | 2.81 | % | 1.42 | % | 2.05 | % | 2.09 | % | 2.28 | % | 2.07 | % | ||||||||||||||||||||
| To the extent secured(3) | 1.07 | % | 1.15 | % | 1.10 | % | 1.12 | % | 1.30 | % | 0.83 | % | 1.15 | % | 1.07 | % | 1.15 | % | 1.10 | % | ||||||||||||||||||||
| To the extent unsecured | 1.02 | % | 1.14 | % | 0.98 | % | 1.42 | % | 1.52 | % | 0.58 | % | 0.91 | % | 1.02 | % | 1.14 | % | 0.98 | % | ||||||||||||||||||||
| Loans loss allowances as a percentage of: | ||||||||||||||||||||||||||||||||||||||||
| Total loans | 2.92 | % | 2.85 | % | 2.91 | % | 3.01 | % | 2.99 | % | 3.02 | % | 2.74 | % | 2.92 | % | 2.85 | % | 2.91 | % | ||||||||||||||||||||
| Total amounts non-performing | 139.70 | % | 124.89 | % | 140.15 | % | 118.47 | % | 106.21 | % | 213.14 | % | 133.48 | % | 139.70 | % | 124.89 | % | 140.15 | % | ||||||||||||||||||||
| Total amounts non-performing-unsecured | 285.98 | % | 250.97 | % | 297.67 | % | 211.91 | % | 196.97 | % | ||||||||||||||||||||||||||||||
| Total amounts non-performing- unsecured | 516.58 | % | 302.44 | % | 285.98 | % | 250.97 | % | 297.67 | % | ||||||||||||||||||||||||||||||
____________________
| (1) | For 2020, 2019 and 2018, loan information corresponds to loans at amortized cost in accordance with IFRS 9. See “Note 9— Loans and Account Receivable at Amortized Cost |
| (2) | For 2018, |
132
(i) the carrying amount of all loans to clients that are rated C1 through C4, D1 and D2 and (ii) the carrying amount of all loans to an individual client with at least one non-performing loan (which is not a residential mortgage loan past due less than 90 days), regardless of category; and (b) for loans collectively evaluated for impairment, the carrying amount of all loans to a client, when at least one loan to that client is not performing or has been renegotiated. Renegotiated loans on which payments are not past-due are not ordinarily classified as non-performing loans, but do not accrue interest.
| (3) | Security generally consists of mortgages on real estate, pledges of marketable securities, letters of credit or cash. |
A break-down of the loans included in the previous table which have been classified as impaired, including renegotiated loans, is as follows:
| As of December 31, 2020 | ||||||||||||||||
| Impaired loans at amortized cost | Commercial | Residential mortgage | Consumer | Total | ||||||||||||
| (in millions of Ch$) | ||||||||||||||||
| Total impaired loans at amortized cost | 910,085 | 501,090 | 265,121 | 1,676,296 | ||||||||||||
In 2020, we saw an increase in impaired loans (Stage 3) in our portfolio due to the effects of the pandemic, especially in the commercial portfolio. Both residential and consumer clients decreased the amount of impaired loans, mainly due to good payment behavior as a result of our focus on high income earners and as the government permitted people to access their private pensions to counter the effects of an economic slowdown. The consumer portfolio also shrunk in the year.
| As of December 31, 2019 | ||||||||||||||||
| Impaired loans at amortized cost | Commercial | Residential mortgage | Consumer | Total | ||||||||||||
| (in millions of Ch$) | ||||||||||||||||
| Total impaired loans at amortized cost | 814,635 | 529,081 | 290,430 | 1,634,146 | ||||||||||||
In 2019, we saw an increase in impaired loans (Stage 3) in our portfolio due to the effects of the social unrest in the latter part of the year.
| As of December 31, 2018 | ||||||||||||||||
| Impaired loans at amortized cost | Commercial | Residential mortgage | Consumer | Total | ||||||||||||
| (in millions of Ch$) | ||||||||||||||||
| Total impaired loans at amortized cost | 773,083 | 444,523 | 285,510 | 1,503,116 | ||||||||||||
In particular, in 2018, we saw a decrease in impaired loans (Stage 3) in our portfolio despite a strong increase in loan volumes during the year. Apart from the adoption of IFRS 9 criteria, this was due to an improvement in management of client risk and risk appetite.
| As of December 31, 2017 | ||||||||||||||||
| Impaired loans | Commercial | Residential mortgage | Consumer | Total | ||||||||||||
| (in millions of Ch$) | ||||||||||||||||
| Non-performing loans | 368,522 | 161,768 | 103,171 | 633,461 | ||||||||||||
| Commercial loans at risk of default (1) | 427,890 | — | — | 427,890 | ||||||||||||
| Other impaired loans consisting mainly of renegotiated loans (2) | 217,091 | 300,776 | 223,955 | 741,822 | ||||||||||||
| Total | 1,013,503 | 462,544 | 327,126 | 1,803,173 | ||||||||||||
| As of December 31, 2016 | ||||||||||||||||
| Impaired loans | Commercial | Residential mortgage | Consumer | Total | ||||||||||||
| (in millions of Ch$) | ||||||||||||||||
| Non-performing loans | 316,838 | 147,572 | 99,721 | 564,131 | ||||||||||||
| Commercial loans at risk of default (1) | 439,707 | — | — | 439,707 | ||||||||||||
| Other impaired loans consisting mainly of renegotiated loans (2) | 172,624 | 250,116 | 188,863 | 611,603 | ||||||||||||
| Total | 929,169 | 397,688 | 288,584 | 1,615,441 | ||||||||||||
| As of December 31, 2015 | ||||||||||||||||||||||||||||||||
| As of December 31, 2017 | ||||||||||||||||||||||||||||||||
| Impaired loans | Commercial | Residential mortgage | Consumer | Total | Commercial | Residential mortgage | Consumer | Total | ||||||||||||||||||||||||
| (in millions of Ch$) | (in millions of Ch$) | |||||||||||||||||||||||||||||||
| Non-performing loans | 346,868 | 183,133 | 113,467 | 643,468 | 368,522 | 161,768 | 103,171 | 633,461 | ||||||||||||||||||||||||
| Commercial loans at risk of default (1) | 486,685 | — | — | 486,685 | 427,890 | — | — | 427,890 | ||||||||||||||||||||||||
| Other impaired loans consisting mainly of renegotiated loans (2) | 108,330 | 213,014 | 217,843 | 539,187 | 217,091 | 300,776 | 223,955 | 741,822 | ||||||||||||||||||||||||
| Total | 941,883 | 396,147 | 331,310 | 1,669,340 | 1,013,503 | 462,544 | 327,126 | 1,803,173 | ||||||||||||||||||||||||
133
| As of December 31, 2014 | ||||||||||||||||
| Impaired loans | Commercial | Residential mortgage | Consumer | Total | ||||||||||||
| (in millions of Ch$) | ||||||||||||||||
| Non-performing loans | 367,791 | 179,417 | 97,119 | 644,327 | ||||||||||||
| Commercial loans at risk of default (1) | 420,038 | — | — | 420,038 | ||||||||||||
| Other impaired loans consisting mainly of renegotiated loans (2) | 95,335 | 191,186 | 266,365 | 552,886 | ||||||||||||
| Total | 883,164 | 370,603 | 363,484 | 1,617,251 | ||||||||||||
| As of December 31, 2016 | ||||||||||||||||
| Impaired loans | Commercial | Residential mortgage | Consumer | Total | ||||||||||||
| (in millions of Ch$) | ||||||||||||||||
| Non-performing loans | 316,838 | 147,572 | 99,721 | 564,131 | ||||||||||||
| Commercial loans at risk of default (1) | 439,707 | — | — | 439,707 | ||||||||||||
| Other impaired loans consisting mainly of renegotiated loans (2) | 172,624 | 250,116 | 188,863 | 611,603 | ||||||||||||
| Total | 929,169 | 397,688 | 288,584 | 1,615,441 | ||||||||||||
____________________
| (1) | Total loans to a debtor, whose allowance level is determined on an individual basis with a risk of defaulting. |
| (2) | Renegotiated loans for loans whose loan loss allowance is analyzed on a group basis. |
As of December 31, 2020, 2019 and 2018 under IFRS 9
Modified loans
When a loan measured at amortized cost has been renegotiated or modified but not derecognized, the Bank must recognize the resulting gains or losses as the difference between the carrying amount of the original loans, and modified contractual cash flows discounted using the EIR before modification. If the modification does not result in derecognition, then the subsequent assessment of whether there is a significant increase in credit risk is made by comparing the risk at the reporting date based on the modified contractual term and the risk at initial recognition based on the original, unmodified contractual term. If the modification results in derecognition, then the modified asset is considered to be a new asset. Accordingly, the date of modification is treated as the date of initial recognition for the purposes of the impairment requirements.
| As of December 31, 2018 | As of December 31, 2020 | |||||||||||||||||||||||||||||||
| Stage 1 | Stage 2 | Stage 3 | Total | Stage 1 | Stage 2 | Stage 3 | Total | |||||||||||||||||||||||||
| MCh$ | MCh$ | MCh$ | MCh$ | (in millions of Ch$) | ||||||||||||||||||||||||||||
| Gross carrying amount | 26.913.508 | 1.796.790 | 1.503.116 | 30.213.414 | 30,216,324 | 2,447,273 | 1,676,296 | 34,339,893 | ||||||||||||||||||||||||
| Modified loans | — | 582.513 | 815.094 | 1.397.607 | - | 799,572 | 886,021 | 1,685,593 | ||||||||||||||||||||||||
| % | 32 | % | 54 | % | 5 | % | - | 36.67 | % | 52.86 | % | 4.91 | % | |||||||||||||||||||
| ECL allowance | 153.640 | 125.114 | 603.660 | 882.414 | 194,422 | 149,940 | 692,431 | 1,036,793 | ||||||||||||||||||||||||
| Modified loans | — | 44.099 | 323.802 | 367.901 | 33,118 | 409,485 | 442,603 | |||||||||||||||||||||||||
| % | — | 35 | % | 54 | % | 42 | % | 22.09 | % | 59.14 | % | 42.69 | % | |||||||||||||||||||
| As of December 31, 2019 | ||||||||||||||||
| Stage 1 | Stage 2 | Stage 3 | Total | |||||||||||||
| (in millions of Ch$) | ||||||||||||||||
| Gross carrying amount | 29,041,636 | 1,995,733 | 1,634,146 | 32,671,515 | ||||||||||||
| Modified loans | - | 512,529 | 611,316 | 1,123,845 | ||||||||||||
| % | - | 25.7 | % | 37.4 | % | 3.4 | % | |||||||||
| ECL allowance | 133,269 | 121,261 | 641,565 | 896,095 | ||||||||||||
| Modified loans | - | 36,329 | 242,649 | 278,978 | ||||||||||||
| % | - | 30.0 | % | 37.8 | % | 31.1 | % | |||||||||
| As of December 31, 2018 | ||||||||||||||||
| Stage 1 | Stage 2 | Stage 3 | Total | |||||||||||||
| (in millions of Ch$) | ||||||||||||||||
| Gross carrying amount | 26,913,508 | 1,796,790 | 1,503,116 | 30,213,414 | ||||||||||||
| Modified loans | — | 582,513 | 815,094 | 1,397,607 | ||||||||||||
| % | 32.4 | % | 54.2 | % | 4.6 | % | ||||||||||
| ECL allowance | 153,640 | 125,114 | 603,660 | 882,414 | ||||||||||||
| Modified loans | — | 44,099 | 323,802 | 367,901 | ||||||||||||
| % | — | 35.3 | % | 53.6 | % | 41.7 | % | |||||||||
134
The following table shows the success rate of renegotiated consumer and residential loans used for management purposes, for the periods indicated. The success rate for consumer loans is defined for each reported period as: (i) the total amount of loans renegotiated in that period minus the amount of such renegotiated loans that are classified as non-performing loans as of December 31, 2017 or 2018, as applicable,2020, minus the amount of such renegotiated loans that have been charged off as of December 31, 2017 or 2018, as applicable,2020, divided by (ii) the total amount of such renegotiated loans. The success rate for residential mortgage loans is defined for each reported period as: (i) the total amount of loans renegotiated in that period minus the amount of such renegotiated loans that are classified as non-performing loans as of December 31, 2017 or 2018, as applicable,2020, divided by (ii) the total amount of such renegotiated loans. A charge-off of a residential mortgage loan is not generally included in measuring the success rate of mortgage renegotiations since the period to charge-off a mortgage loan is 48 months after an installment is past-due.
| Period of renegotiation | Success rate Consumer Loans at December 31, 2018 | Success rate Residential mortgage loans at December 31, 2018 | ||||||
| First Quarter 2017 | 46.9 | % | 75.3 | % | ||||
| Second Quarter 2017 | 47.6 | % | 79.2 | % | ||||
| Third Quarter 2017 | 52.6 | % | 79.7 | % | ||||
| Fourth Quarter 2017 | 60.4 | % | 82.3 | % | ||||
| First Quarter 2018 | 73.9 | % | 80.7 | % | ||||
| Second Quarter 2018 | 80.8 | % | 85.8 | % | ||||
| Third Quarter 2018 | 94.2 | % | 91.8 | % | ||||
| Fourth Quarter 2018 | 98.4 | % | 93.9 | % | ||||
134
| Period of Renegotiation | Success Rate Consumer Loans at December 31, 2020 | Residential Mortgage Loans at December 31, 2020 | ||||||
| First Quarter 2019 | 40.1 | % | 79.9 | % | ||||
| Second Quarter 2019 | 44.4 | % | 87.5 | % | ||||
| Third Quarter 2019 | 52.5 | % | 76.6 | % | ||||
| Fourth Quarter 2019 | 69.0 | % | 75.1 | % | ||||
| First Quarter 2020 | 69.1 | % | 79.3 | % | ||||
| Second Quarter 2020 | 85.1 | % | 73.5 | % | ||||
| Third Quarter 2020 | 94.7 | % | 91.8 | % | ||||
| Fourth Quarter 2020 | 99.1 | % | 93.3 | % | ||||
The COVID-19 pandemic has had a major impact on Chile and global economies in 2020. Because this, the Chilean government has announced a program in agreement with the major banks in the country, through which SME’s may apply for COVID-19 credit lines for working capital at a real interest rate close to 0% and guaranteed by FOGAPE. Additionally, the Bank – in accordance with FMC’s instruction to facilitate access to credit for companies and households - has provided payment holiday terms of up to three months to mortgage customers with no more 30 days past due. This was extended by a further three months for customers in need. For periods priorconsumer loans, the Bank has granted benefits such as a 3-month grace period to January 1, 2018start paying, increases in terms, decreases in installments, and has even opted for current lower market rates.
Customers who sought COVID-19 related support, including payment holidays, were not the subject of any wider SICR triggers, and do not have to be moved to Stage 2 for a lifetime ECL assessment unless they had triggered other SICR criteria, and payment holidays also did not cause accounts to become past due and therefore did not automatically trigger a Stage 2 or Stage 3 lifetime ECL assessment.
The assessment of SICRs and the measurement of ECLs required to be based on reasonable and supportable information that is available to an entity without undue cost or effort. The Bank has developed estimates based on the best available information about past events, current conditions and forecasts of economic conditions. In certain instances,assessing forecast conditions, the Bank has considered the effects of COVID-19 and the government support measures being undertaken. Despite of the above, with current COVID-19 infection rates having increased and continued high levels of uncertainty in the macro-economic outlook and to address a potential lag in defaults, we renegotiatemake use of a management overlay as part of our provisions for credit losses.
135
The Bank has conducted an exhaustive analysis of the measures implemented as a result of COVID-19, under the perspective of modified assets. Thus, in our commercial loan portfolio, the COVID-19 credit lines for working capital guaranteed by FOGAPE were new operations, hence, they were left out of the analysis. The modifications granted to our consumer loan portfolio were 3-month grace periods, modified terms and installments, and allowed modified interest rate, to the current market lower rates. Therefore, these consumer loans were accounted for a new financial assets. In line with our internal guide, these modifications are classified as modifications for commercial reasons, because they are not attributable to the financial difficulty of the debtor, and a new loan operation has been originated under current market conditions.
For the mortgage loan portfolio, original contractual conditions were not modified. Instead, the clients signed an addendum for the postponed installments, and a complementary operation was generated, with the mortgage guarantee covering both operations. Neither the monthly installments nor the rates were modified. This measure was granted only to clients with less than 30 days past due, and 98% of our clients are meeting their obligations in a timely manner. In line with our internal guide, we have concluded that the modifications granted to customers with no past due days were classified as modifications for commercial reasons, while clients with any past dues or that have one or more principal or interest payments past-due. The typehad some restructuring, were classified as modifications for the financial difficulty of concession we most often afford when renegotiating a loan is a reduction in interest payment or, on rare occasions, forgiveness of principal. We estimate that less than 0.5% of renegotiated loans relate to the forgiveness of principal,debtor, and the remaining 99.5% relates to reductionBank has calculated the difference between the gross carrying amount and the present value of the modified loans discounted at the original effective interest payments. Anyrate. The amount of principal forgiven is charged off directly to income as of the date the loan is renegotiated, if not already covered by an allowance for loan loss. Renegotiatedthese loans on which payments are not past-due, are not ordinarily classified as non-performing, but do not accrue interest, and they are considered to be impaired for the life of the loan, both for disclosure purposes and in our determination of our allowances for loan losses, and never moved out of renegotiated status. The effects of the amount of interest to be accrued werewas not material to “Loans and receivables from customers, net” on our Consolidated Statement of Financial Position.the Bank.
Modified loans(1) (In millions of Ch$) | 2017 | 2016 | |||||
| Commercial loans collectively evaluated for impairment | 111,963 | 117,002 | |||||
| Residential mortgage loans | 120,109 | 157,239 | |||||
| Consumer loans | 187,967 | 214,344 | |||||
| Total modified loans | 420,039 | 488,585 | |||||
COVID-19 support measures
As of December 31, 2020, the relief measures were classified into new loans subject to government guarantee and payment holiday granted by the Bank:
| COVID-19 measures | |
| In millions of Ch$ (Ch$mn) | |
| New loans subject to government guarantee | |
| Payment holiday | 9,098,028 |
| Payment holiday – current | 734,986 |
| Payment holiday - expired | 8,363,042 |
The modified loans included inpayment holidays were mainly granted to mortgage loan agreements, and postponed principal, interest, inflation and insurances. The Bank has closely monitored the payment holidays which have expired, determining that Ch$8,241,191 million correspond to clients who are servicing their debt properly, and Ch$121,850 million to clients that have defaulted.
The following table above represent the full balance of all modified loans regardlessshows residual maturity of the dategrace periods that have not expired as of modification. When a loan is marked as modified, we do not remove it from this status until paid in full. Our provisioning models currently consider a modified loan to be renegotiated forDecember 31, 2020:
| Residual maturity | <= 6 months | <= 12 months | <= 12 months | > 2 year <= 5 year | |
| Ch$mn | Ch$mn | Ch$mn | Ch$mn | Ch$mn | |
| New loans subject to government guarantee | 2,076,119 | - | - | 214,400 | 1,861,719 |
| Payment holiday – current | 734,986 | 722,746 | 7,861 | 4,379 | - |
136
The following diagram shows the lifebreakdown of the loan. Modified loans are included inCovid-19 measures as of December 31, 2021, including those that have expired and the same poolaggregate amount of loans together with renegotiated loans for the life of the loans.that are paying on time and those that are overdue:

Analysis of Loan Loss Allowances
The following tables show for 2020 the movement of provisions for expected credit losses for loans at amortized cost according to IFRS 9:
Commercial loans
| Stage 1 | Stage 2 | Stage 3 | ||||||||||||||||||||||||||
| Individual | Collective | Individual | Collective | Individual | Collective | Total | ||||||||||||||||||||||
| (In millions of Ch$) | ||||||||||||||||||||||||||||
| ECL allowance at January 1, 2020 | 21,539 | 35,888 | 30,389 | 25,555 | 196,165 | 197,033 | 506,569 | |||||||||||||||||||||
| Transfers | ||||||||||||||||||||||||||||
| Transfers to stage 2 | (23,652 | ) | (16,137 | ) | 50,253 | 48,464 | - | - | 58,928 | |||||||||||||||||||
| Transfers to stage 3 | (9 | ) | (3,007 | ) | - | - | 1,089 | 22,152 | 20,225 | |||||||||||||||||||
| Transfers to stage 3 | - | - | (25,214 | ) | (29,540 | ) | 73,885 | 55,645 | 74,776 | |||||||||||||||||||
| Transfers to stage 1 | 2,919 | 4,921 | (9,322 | ) | (20,605 | ) | - | - | (22,087 | ) | ||||||||||||||||||
| Transfers to stage 2 | - | - | 943 | 4,424 | (1,560 | ) | (22,995 | ) | (19,188 | ) | ||||||||||||||||||
| Transfers to stage 1 | - | 5 | - | - | - | (45 | ) | (40 | ) | |||||||||||||||||||
| Net changes of the exposure and modifications in credit risk | 39,971 | 19,449 | 18,462 | 15,122 | 58,915 | 43,498 | 195,417 | |||||||||||||||||||||
| Write-off | - | - | - | - | (66,989 | ) | (100,393 | ) | (167,382 | ) | ||||||||||||||||||
| Foreign exchange adjustments and others | (1,179 | ) | 9 | (59 | ) | 895 | - | 11 | (323 | ) | ||||||||||||||||||
| At December 31, 2020 | 39,589 | 40,943 | 65,452 | 4,315 | 261,505 | 193,268 | 645,072 | |||||||||||||||||||||
137
Mortgage loans
| Stage 1 | Stage 3 | |||||||||||||||
| Collective | Collective | Collective | Total | |||||||||||||
| (in millions of Ch$) | ||||||||||||||||
| ECL allowance at January 1, 2020 | 8,446 | 14,509 | 78,104 | 101,059 | ||||||||||||
| Transfers | ||||||||||||||||
| Transfers to stage 2 | (5,250 | ) | 12,502 | - | 7,252 | |||||||||||
| Transfers to stage 3 | (472 | ) | - | 4,548 | 4,076 | |||||||||||
| Transfers to stage 3 | - | (8,923 | ) | 20,034 | 11,111 | |||||||||||
| Transfers to stage 1 | 3,187 | (13,912 | ) | - | (10,725 | ) | ||||||||||
| Transfers to stage 2 | - | 7,033 | (28,146 | ) | (21,113 | ) | ||||||||||
| Transfers to stage 1 | 2 | - | (37 | ) | (35 | ) | ||||||||||
| Net changes of the exposure and modifications in credit risk | 19,162 | (2,791 | ) | 30,352 | 46,723 | |||||||||||
| Write-off | - | - | (25,831 | ) | (25,831 | ) | ||||||||||
| Foreign exchange adjustments and others | (10 | ) | 23 | (8 | ) | 5 | ||||||||||
| At December 31, 2020 | 25,065 | 8,441 | 79,016 | 112,522 | ||||||||||||
Consumer loans
| Stage 1 | Stage 3 | |||||||||||||||
| Collective | Collective | Collective | Total | |||||||||||||
| (in millions of Ch$) | ||||||||||||||||
| ECL allowance at January 1, 2020 | 67,396 | 50,808 | 170,263 | 288,467 | ||||||||||||
| Transfers | ||||||||||||||||
| Transfers to stage 2 | (36,422 | ) | 95,850 | - | 59,428 | |||||||||||
| Transfers to stage 3 | (1,484 | ) | - | 9,061 | 7,577 | |||||||||||
| Transfers to stage 3 | - | (75,229 | ) | 108,792 | 33,563 | |||||||||||
| Transfers to stage 1 | 13,589 | (41,928 | ) | - | (28,339 | ) | ||||||||||
| Transfers to stage 2 | - | 10,162 | (28,649 | ) | (18,487 | ) | ||||||||||
| Transfers to stage 1 | 254 | - | (865 | ) | (611 | ) | ||||||||||
| Net changes of the exposure and modifications in credit risk | 45,492 | (7,926 | ) | 104,328 | 141,894 | |||||||||||
| Write-off. | - | - | (204,286 | ) | (204,286 | ) | ||||||||||
| Foreign exchange adjustments and others.. | - | (5 | ) | (2 | ) | (7 | ) | |||||||||
| At December 31, 2020 | 88,825 | 31,732 | 158,642 | 279,199 | ||||||||||||
The following tables show for 2019 the movement of provisions for expected credit losses for loans at amortized cost according to IFRS 9:
Commercial loans
| Stage 1 | Stage 2 | Stage 3 | ||||||||||||||||||||||||||
| Individual | Collective | Individual | Collective | Individual | Collective | Total | ||||||||||||||||||||||
| (in millions of Ch$) | ||||||||||||||||||||||||||||
| ECL allowance at January 1, 2019(*) | 30,189 | 44,104 | 31,066 | 24,945 | 198,115 | 179,771 | 508,190 | |||||||||||||||||||||
| Transfers | ||||||||||||||||||||||||||||
| Transfers to stage 2 | (7,786 | ) | (20,058 | ) | 17,237 | 68,705 | - | - | 58,098 | |||||||||||||||||||
| Transfers to stage 3 | - | (2,666 | ) | - | - | - | 16,087 | 13,421 | ||||||||||||||||||||
| Transfers to stage 3 | - | - | (8,567 | ) | (42,601 | ) | 44,203 | 71,200 | 64,235 | |||||||||||||||||||
| Transfers to stage 1 | 1,576 | 4,838 | (7,525 | ) | (22,278 | ) | - | - | (23,389 | ) | ||||||||||||||||||
| Transfers to stage 2 | - | - | 685 | 9,667 | (3,867 | ) | (27,482 | ) | (20,997 | ) | ||||||||||||||||||
| Transfers to stage 1 | - | 88 | - | - | - | (242 | ) | (154 | ) | |||||||||||||||||||
| Net changes of the exposure and modifications in credit risk | (6,948 | ) | 14,199 | (3,151 | ) | (12,533 | ) | 41,365 | 54,962 | 87,894 | ||||||||||||||||||
| Write-off | - | - | - | - | (83,844 | ) | (94,014 | ) | (177,858 | ) | ||||||||||||||||||
| Foreign exchange adjustments and others | 4,508 | (4,617 | ) | 644 | (350 | ) | 193 | (3,249 | ) | (2,871 | ) | |||||||||||||||||
| At December 31, 2019 | 21,539 | 35,888 | 30,389 | 25,555 | 196,165 | 197,033 | 506,569 | |||||||||||||||||||||
____________________
(*) Include loans and ECL balances of the acquired Santander Consumer Chile S.A.
138
Mortgage loans
| Stage 1 | Stage 3 | |||||||||||||||
| Collective | Collective | Collective | Total | |||||||||||||
| (in millions of Ch$) | ||||||||||||||||
| ECL allowance at January 1, 2019 | 9,006 | 15,102 | 67,162 | 91,270 | ||||||||||||
| Transfers | ||||||||||||||||
| Transfers to stage 2 | (3,318 | ) | 20,509 | - | 17,191 | |||||||||||
| Transfers to stage 3 | (311 | ) | - | 5,994 | 5,683 | |||||||||||
| Transfers to stage 3 | - | (12,598 | ) | 31,654 | 19,056 | |||||||||||
| Transfers to stage 1 | 1,374 | (13,849 | ) | - | (12,475 | ) | ||||||||||
| Transfers to stage 2 | - | 8,341 | (29,303 | ) | (20,962 | ) | ||||||||||
| Transfers to stage 1 | 6 | - | (193 | ) | (187 | ) | ||||||||||
| Net changes of the exposure and modifications in credit risk | 1,655 | (3,054 | ) | 32,561 | 31,162 | |||||||||||
| Write-off | - | - | (34,184 | ) | (34,184 | ) | ||||||||||
| Foreign exchange adjustments and others | 34 | 58 | 4,413 | 4,505 | ||||||||||||
| At December 31, 2019 | 8,446 | 14,509 | 78,104 | 101,059 | ||||||||||||
Consumer loans
| Stage 1 | Stage 2 | Stage 3 | ||||||||||||||
| Collective | Collective | Collective | Total | |||||||||||||
| (in millions of Ch$) | ||||||||||||||||
| ECL allowance at January 1, 2019 (*) | 75,495 | 60,467 | 165,052 | 301,014 | ||||||||||||
| Transfers | ||||||||||||||||
| Transfers to stage 2 | (28,717 | ) | 109,916 | - | 81,199 | |||||||||||
| Transfers to stage 3 | (1,633 | ) | - | 11,699 | 10,066 | |||||||||||
| Transfers to stage 3 | - | (78,909 | ) | 111,334 | 32,425 | |||||||||||
| Transfers to stage 1 | 7,941 | (32,506 | ) | - | (24,565 | ) | ||||||||||
| Transfers to stage 2 | - | 17,002 | (31,914 | ) | (14,912 | ) | ||||||||||
| Transfers to stage 1 | 47 | - | (233 | ) | (186 | ) | ||||||||||
| Net changes of the exposure and modifications in the credit risk | 15,641 | (25,712 | ) | 135,298 | 125,227 | |||||||||||
| Write-off | - | - | (223,919 | ) | (223,919 | ) | ||||||||||
| Foreign Exchange adjustments | (1,378 | ) | 550 | 2,946 | 2,118 | |||||||||||
| At December 31, 2019 | 67,396 | 50,808 | 170,263 | 288,467 | ||||||||||||
____________________
(*) Include loans and ECL balances of the acquired Santander Consumer Chile S.A.
The following tables show for 2018 the movement of provisions for expected credit losses for loans at amortized cost according to IFRS 9:
Commercial loans
| Stage 1 | Stage 2 | Stage 3 | ||||||||||||||||||||||||||
| Individual | Collective | Individual | Collective | Individual | Collective | Total | ||||||||||||||||||||||
| (in millions of Ch$) | ||||||||||||||||||||||||||||
| ECL allowance at January 1, 2018 | 29,797 | 50,014 | 28,282 | 23,041 | 191,397 | 160,182 | 482,713 | |||||||||||||||||||||
| Transfers | ||||||||||||||||||||||||||||
| Transfers to stage 2 | (2,719 | ) | (1,525 | ) | 8,005 | 8,169 | — | — | 11,930 | |||||||||||||||||||
| Transfers to stage 3 | (241 | ) | (2,697 | ) | — | — | 6,612 | 29,839 | 33,513 | |||||||||||||||||||
| Transfers to stage 3 | — | — | (5,541 | ) | (6,776 | ) | 22,705 | 17,475 | 27,863 | |||||||||||||||||||
| Transfers to stage 1 | 167 | 553 | (411 | ) | (3,402 | ) | — | (3,093 | ) | |||||||||||||||||||
| Transfers to stage 2 | — | 330 | 1,854 | (1,704 | ) | (6,776 | ) | (6,296 | ) | |||||||||||||||||||
| Transfers to stage 1 | — | 22 | — | — | — | (72 | ) | (50 | ) | |||||||||||||||||||
| Net changes of the exposure and modifications in the credit risk | 4,105 | 3,770 | 2,740 | 2,855 | 1,251 | 29,253 | 43,974 | |||||||||||||||||||||
| Write-off | — | — | — | (37,439 | ) | (58,510 | ) | (95,949 | ) | |||||||||||||||||||
| Foreign Exchange adjustments | (920 | ) | (6,696 | ) | (2,339 | ) | (1,167 | ) | 15,293 | 7,926 | 12,197 | |||||||||||||||||
| At December 31, 2018 | 30,189 | 43,541 | 31,066 | 24,574 | 198,115 | 179,317 | 506,802 | |||||||||||||||||||||
139
Mortgage loans
| Stage 1 | Stage 2 | Stage 3 | ||||||||||||||
| Collective | Collective | Collective | Total | |||||||||||||
| (in millions of Ch$) | ||||||||||||||||
| ECL allowance at January 1, 2018 | 14,602 | 20,227 | 73,190 | 108,019 | ||||||||||||
| Transfers | ||||||||||||||||
| Transfers to stage 2 | (516 | ) | 3,846 | — | 3,330 | |||||||||||
| Transfers to stage 3 | (383 | ) | — | 9,060 | 8,677 | |||||||||||
| Transfers to stage 3 | — | (2,518 | ) | 8,056 | 5,538 | |||||||||||
| Transfers to stage 1 | 263 | (6,255 | ) | — | (5,992 | ) | ||||||||||
| Transfers to stage 2 | — | 2,296 | (10,185 | ) | (7,889 | ) | ||||||||||
| Transfers to stage 1 | 232 | — | (232 | ) | — | |||||||||||
| Net changes of the exposure and modifications in the credit risk | 1,601 | 575 | (1,784 | ) | 392 | |||||||||||
| Write-off | — | — | (13,548 | ) | (13,548 | ) | ||||||||||
| Foreign Exchange adjustments | (6,793 | ) | (3,069 | ) | 2,605 | (7,257 | ) | |||||||||
| At December 31, 2018 | 9,006 | 15,102 | 67,162 | 91,270 | ||||||||||||
Consumer loans
| Stage 1 | Stage 2 | Stage 3 | ||||||||||||||
| Collective | Collective | Collective | Total | |||||||||||||
| (in millions of Ch$) | ||||||||||||||||
| ECL allowance at January 1, 2018 | 72,712 | 54,557 | 170,090 | 297,359 | ||||||||||||
| Transfers | ||||||||||||||||
| Transfers to stage 2 | (2,117 | ) | 14,655 | — | 12,538 | |||||||||||
| Transfers to stage 3 | (1,431 | ) | — | 16,311 | 14,880 | |||||||||||
| Transfers to stage 3 | — | (3,913 | ) | 10,721 | 6,808 | |||||||||||
| Transfers to stage 1 | 1,320 | (4,890 | ) | — | (3,570 | ) | ||||||||||
| Transfers to stage 2 | — | 2,943 | (9,107 | ) | (6,164 | ) | ||||||||||
| Transfers to stage 1 | 18 | — | (18 | ) | — | |||||||||||
| Net changes of the exposure and modifications in the credit risk | 3,782 | (8,572 | ) | 42,194 | 37,404 | |||||||||||
| Write-off | — | — | (64,506 | ) | (64,506 | ) | ||||||||||
| Foreign Exchange adjustments | (3,380 | ) | (408 | ) | (6,619 | ) | (10,407 | ) | ||||||||
| At December 31, 2018 | 70,904 | 54,372 | 159,066 | 284,342 | ||||||||||||
As of January 1, 2018, the Bank has adopted IFRS 9. The following table reconciles the prior period’s closing impairment allowance measured in accordance with the IAS 39 incurred loss model to the new expected loss impairment model according to IFRS 9.
| Loans loss allowance under IAS 39 | Reclassification | Remeasurement | Loans loss allowance under IFRS 9 | Loans loss allowance under IAS 39 | Reclassification | Remeasurement | Loans loss allowance under IFRS 9 | |||||||||||||||||||||||||
| MCh$ | MCh$ | MCh$ | MCh$ | (in millions of Ch$) | ||||||||||||||||||||||||||||
| Loans and receivable (IAS 39)/ Financial assets at amortised cost (IFRS 9) | ||||||||||||||||||||||||||||||||
| Loans and receivable (IAS 39)/ Financial assets at amortized cost (IFRS 9) | ||||||||||||||||||||||||||||||||
| Interbank loans | 472 | (472 | ) | — | — | 472 | (472 | ) | — | — | ||||||||||||||||||||||
| Loans and account receivable from customers | 790,685 | 84 | 97,322 | 888,091 | 790,685 | 84 | 97,322 | 888,091 | ||||||||||||||||||||||||
| Total loans and account receivable at amortised cost | 791,157 | (388 | ) | 97,322 | 888,091 | |||||||||||||||||||||||||||
| Total loans and account receivable at amortized cost | 791,157 | (388 | ) | 97,322 | 888,091 | |||||||||||||||||||||||||||
140
The following tables show for 2018 the movementTable of provisions for expected credit losses for loans at amortized cost according to IFRS 9:Contents
Commercial loans
| Stage 1 | Stage 2 | Stage 3 | ||||||||||||||||||||||||||
Individual | Collective | Individual | Collective | Individual | Collective | TOTAL | ||||||||||||||||||||||
| ECL allowance at January 1, 2018 | 29,797 | 50,014 | 28,282 | 23,041 | 191,397 | 160,182 | 482,713 | |||||||||||||||||||||
| Transfers | ||||||||||||||||||||||||||||
| Transfers to stage 2 | (2,719 | ) | (1,525 | ) | 8,005 | 8,169 | — | — | 11,930 | |||||||||||||||||||
| Transfers to stage 3 | (241 | ) | (2,697 | ) | — | — | 6,612 | 29,839 | 33,513 | |||||||||||||||||||
| Transfers to stage 3 | — | — | (5,541 | ) | (6,776 | ) | 22,705 | 17,475 | 27,863 | |||||||||||||||||||
| Transfers to stage 1 | 167 | 553 | (411 | ) | (3,402 | ) | — | (3,093 | ) | |||||||||||||||||||
| Transfers to stage 2 | — | 330 | 1,854 | (1,704 | ) | (6,776 | ) | (6,296 | ) | |||||||||||||||||||
| Transfers to stage 1 | — | 22 | — | — | — | (72 | ) | (50 | ) | |||||||||||||||||||
| Net changes of the exposure and modifications in the credit risk | 4,105 | 3,770 | 2,740 | 2,855 | 1,251 | 29,253 | 43,974 | |||||||||||||||||||||
| Writte-off | — | — | — | (37,439 | ) | (58,510 | ) | (95,949 | ) | |||||||||||||||||||
| Foreign Exchange adjustments | (920 | ) | (6,696 | ) | (2,339 | ) | (1,167 | ) | 15,293 | 7,926 | 12,197 | |||||||||||||||||
| At 31 December 2018 | 30,189 | 43,541 | 31,066 | 24,574 | 198,115 | 179,317 | 506,802 | |||||||||||||||||||||
Mortgage loans
| Stage 1 | Stage 2 | Stage 3 | Total | |||||||||||||
| Collective | Collective | Collective | ||||||||||||||
| ECL allowance at January 1, 2018 | 14,602 | 20,227 | 73,190 | 108,019 | ||||||||||||
| Transfers | ||||||||||||||||
| Transfers to stage 2 | (516 | ) | 3,846 | — | 3,330 | |||||||||||
| Transfers to stage 3 | (383 | ) | — | 9,060 | 8,677 | |||||||||||
| Transfers to stage 3 | — | (2,518 | ) | 8,056 | 5,538 | |||||||||||
| Transfers to stage 1 | 263 | (6,255 | ) | — | (5,992 | ) | ||||||||||
| Transfers to stage 2 | — | 2,296 | (10,185 | ) | (7,889 | ) | ||||||||||
| Transfers to stage 1 | 232 | — | (232 | ) | — | |||||||||||
| Net changes of the exposure and modifications in the credit risk | 1,601 | 575 | (1,784 | ) | 392 | |||||||||||
| Write-off | — | — | (13,548 | ) | (13,548 | ) | ||||||||||
| Foreign Exchange adjustments | (6,793 | ) | (3,069 | ) | 2,605 | (7,257 | ) | |||||||||
| At December 31, 2018 | 9,006 | 15,102 | 67,162 | 91,270 | ||||||||||||
Consumer loans
| Stage 1 | Stage 2 | Stage 3 | Total | |||||||||||||
| Collective | Collective | Collective | ||||||||||||||
| ECL allowance at January 1, 2018 | 72,712 | 54,557 | 170,090 | 297,359 | ||||||||||||
| Transfers | ||||||||||||||||
| Transfers to stage 2 | (2,117 | ) | 14,655 | — | 12,538 | |||||||||||
| Transfers to stage 3 | (1,431 | ) | — | 16,311 | 14,880 | |||||||||||
| Transfers to stage 3 | — | (3,913 | ) | 10,721 | 6,808 | |||||||||||
| Transfers to stage 1 | 1,320 | (4,890 | ) | — | (3,570 | ) | ||||||||||
| Transfers to stage 2 | — | 2,943 | (9,107 | ) | (6,164 | ) | ||||||||||
| Transfers to stage 1 | 18 | — | (18 | ) | — | |||||||||||
| Net changes of the exposure and modifications in the credit risk | 3,782 | (8,572 | ) | 42,194 | 37,404 | |||||||||||
| Write-off | — | — | (64,506 | ) | (64,506 | ) | ||||||||||
| Foreign Exchange adjustments | (3,380 | ) | (408 | ) | (6,619 | ) | (10,407 | ) | ||||||||
| At December 31, 2018 | 70,904 | 54,372 | 159,066 | 284,342 | ||||||||||||
The following table provides the details of the roll-forwards in 2017 2016, 2015 and 20142016 of our allowance for loan losses under IAS 39, including decrease of allowances due to charge-offs, allowances established, allowances released, gross provision expense and opening and closing balance:
| Commercial loans | Mortgage loans | Consumer loans | Interbank loan | Commercial loans | Mortgage loans | Consumer loans | ||||||||||||||||||||||||||||||||||||||||||
| Activity during 2017 | Individual | Group | Group | Group | Total | Individual | Group | Group | Group | Interbank loan | Total | |||||||||||||||||||||||||||||||||||||
| (in millions of Ch$) | (in millions of Ch$) | |||||||||||||||||||||||||||||||||||||||||||||||
| Balances as of December 31, 2016 | 246,336 | 183,106 | 57,009 | 300,019 | 4,135 | 790,605 | 246,336 | 183,106 | 57,009 | 300,019 | 4,135 | 790,605 | ||||||||||||||||||||||||||||||||||||
| Allowances established (1) | 64,658 | 148,681 | 43,621 | 252,038 | 307 | 509,305 | 64,658 | 148,681 | 43,621 | 252,038 | 307 | 509,305 | ||||||||||||||||||||||||||||||||||||
| Allowances released (2) | (55,925 | ) | (20,491 | ) | (11,427 | ) | (46,089 | ) | (3,970 | ) | (137,902 | ) | (55,925 | ) | (20,491 | ) | (11,427 | ) | (46,089 | ) | (3,970 | ) | (137,902 | ) | ||||||||||||||||||||||||
| Released allowances by charge-off (3) | (36,279 | ) | (92,223 | ) | (20,137 | ) | (222,212 | ) | — | (370,851 | ) | |||||||||||||||||||||||||||||||||||||
| Released allowances by charge- off (3) | (36,279 | ) | (92,223 | ) | (20,137 | ) | (222,212 | ) | — | (370,851 | ) | |||||||||||||||||||||||||||||||||||||
| Balances as of December 31, 2017 | 218,790 | 219,073 | 69,066 | 283,756 | 472 | 791,157 | 218,790 | 219,073 | 69,066 | 283,756 | 472 | 791,157 | ||||||||||||||||||||||||||||||||||||
| Commercial loans | Mortgage loans | Consumer loans | Interbank loan | Commercial loans | Mortgage loans | Consumer loans | ||||||||||||||||||||||||||||||||||||||||||
| Activity during 2016 | Individual | Group | Group | Group | Total | Individual | Group | Group | Group | Interbank loan | Total | |||||||||||||||||||||||||||||||||||||
| (in millions of Ch$) | (in millions of Ch$) | |||||||||||||||||||||||||||||||||||||||||||||||
| Balances as of December 31, 2015 | 256,505 | 174,696 | 62,427 | 267,507 | 1,166 | 762,301 | 256,505 | 174,696 | 62,427 | 267,507 | 1,166 | 762,301 | ||||||||||||||||||||||||||||||||||||
| Allowances established (1) | 61,002 | 133,855 | 50,892 | 280,544 | 3,052 | 529,345 | 61,002 | 133,855 | 50,892 | 280,544 | 3,052 | 529,345 | ||||||||||||||||||||||||||||||||||||
| Allowances released (2) | (43,183 | ) | (14,432 | ) | (34,246 | ) | (30,790 | ) | (83 | ) | (122,734 | ) | (43,183 | ) | (14,432 | ) | (34,246 | ) | (30,790 | ) | (83 | ) | (122,734 | ) | ||||||||||||||||||||||||
| Released allowances by charge-off (3) | (27,988 | ) | (111,013 | ) | (22,064 | ) | (217,242 | ) | — | (378,307 | ) | |||||||||||||||||||||||||||||||||||||
| Released allowances by charge- off (3) | (27,988 | ) | (111,013 | ) | (22,064 | ) | (217,242 | ) | — | (378,307 | ) | |||||||||||||||||||||||||||||||||||||
| Balances as of December 31, 2016 | 246,336 | 183,106 | 57,009 | 300,019 | 4,135 | 790,605 | 246,336 | 183,106 | 57,009 | 300,019 | 4,135 | 790,605 | ||||||||||||||||||||||||||||||||||||
| Commercial loans | Mortgage loans | Consumer loans | Interbank loan | |||||||||||||||||||||
| Activity during 2015 | Individual | Group | Group | Group | Total | |||||||||||||||||||
| (in millions of Ch$) | ||||||||||||||||||||||||
| Balances as of December 31, 2014 | 215,852 | 165,697 | 48,744 | 254,023 | 1 | 684,317 | ||||||||||||||||||
| Allowances established (1) | 124,968 | 136,778 | 34,373 | 248,937 | 1,357 | 546,413 | ||||||||||||||||||
| Allowances released (2) | (46,614 | ) | (17,885 | ) | (7,205 | ) | (18,126 | ) | (192 | ) | (90,022 | ) | ||||||||||||
| Released allowances by charge-off (3) | (37,701 | ) | (109,894 | ) | (13,485 | ) | (217,327 | ) | — | (378,407 | ) | |||||||||||||
| Balances as of December 31, 2015 | 256,505 | 174,696 | 62,427 | 267,507 | 1,166 | 762,301 | ||||||||||||||||||
| Commercial loans | Mortgage loans | Consumer loans | Interbank loan | |||||||||||||||||||||
| Activity during 2014 | Individual | Group | Group | Group | Total | |||||||||||||||||||
| (in millions of Ch$) | ||||||||||||||||||||||||
| Balance as of December 31, 2013 | 206,377 | 100,170 | 43,306 | 264,585 | 495 | 614,933 | ||||||||||||||||||
| Allowances established (1) | 52,240 | 174,244 | 24,907 | 218,941 | 60 | 470,392 | ||||||||||||||||||
| Allowances released (2) | (15,903 | ) | (7,127 | ) | (6,561 | ) | (38,275 | ) | (554 | ) | (68,420 | ) | ||||||||||||
| Released allowances by charge-off (3) | (26,862 | ) | (101,590 | ) | (12,908 | ) | (191,228 | ) | — | (322,588 | ) | |||||||||||||
| Balances as of December 31, 2014 | 215,852 | 165,697 | 48,744 | 254,023 | 1 | 684,317 | ||||||||||||||||||
____________________
| (1) | Represents gross allowances made in respect of increased risk of loss during the period and loan growth. |
| (2) | Represents the gross amount of loan loss allowances released during the year as a consequence of reduction in the level of risk existing in the loan portfolio, including as a result of improvement in the credit risk classification of borrowers and loans paid. |
| (3) | Represents the gross amount of loan loss allowances removed due to charge-off. |
141
The following table shows recoveries by typeTable of loan:Contents
| Year ended December 31, | ||||||||||||||||||||
| 2018 | 2017 | 2016 | 2015 | 2014 | ||||||||||||||||
| (in millions of Ch$) | ||||||||||||||||||||
| Recovery of loans previously charged-off | ||||||||||||||||||||
| Consumer loans | 40,180 | 39,972 | 41,072 | 35,565 | 36,908 | |||||||||||||||
| Residential mortgage loans | 17,367 | 10,942 | 10,041 | 6,543 | 5,122 | |||||||||||||||
| Commercial loans | 30,934 | 32,613 | 27,185 | 26,032 | 16,947 | |||||||||||||||
| Total recoveries | 88,481 | 83,527 | 78,298 | 68,140 | 58,977 | |||||||||||||||
Allocation of the Loan Loss Allowances
The following tables set forth, as of December 31, 2020, 2019 and 2018 according to IFRS 9 and for the previous four years listed under IAS 39, the proportions of our required loan loss allowances that were attributable to our commercial, consumer and residential mortgage loans at each such date.
| As of December 31, 2018 | As of December 31, 2020 | |||||||||||||||||||||||||||||||
| Total ECL Allowance | Allowance amount as a percentage of loans in category | Allowance amount as a percentage of total loans at amortized cost | Allowance amount as a percentage of total allowances for loans at amortized cost | Total ECL Allowance | Allowance amount as a percentage of loans in category | Allowance amount as a percentage of total loans at amortized cost | Allowance amount as a percentage of total allowances for loans at amortized cost | |||||||||||||||||||||||||
| Ch$ million | Ch$ million | |||||||||||||||||||||||||||||||
| Commercial loans | ||||||||||||||||||||||||||||||||
| Interbank loans | 1 | 0.0 | % | 0.0 | % | 0.0 | % | |||||||||||||||||||||||||
| Commercial loans | 368,796 | 3.3 | % | 1.2 | % | 41.8 | % | 498,146 | 3.7 | % | 1.5 | % | 48.0 | % | ||||||||||||||||||
| Foreign trade loans | 39,917 | 2.3 | % | 0.1 | % | 4.5 | % | 41,261 | 3.3 | % | 0.1 | % | 4.0 | % | ||||||||||||||||||
| Checking accounts debtors | 13,784 | 6.4 | % | — | 1.6 | % | 11,602 | 9.2 | % | 0.0 | % | 1.1 | % | |||||||||||||||||||
| Factoring transactions | 4,353 | 1.1 | % | — | 0.5 | % | 4,129 | 0.8 | % | 0.0 | % | 0.4 | % | |||||||||||||||||||
| Student loans | 8,798 | 13.9 | % | 0.0 | % | 0.8 | % | |||||||||||||||||||||||||
| Leasing transactions | 38,800 | 2.7 | % | 0.1 | % | 4.4 | % | 59,687 | 4.4 | % | 0.2 | % | 5.8 | % | ||||||||||||||||||
| Other loans and accounts receivable | 41,152 | 16.8 | % | 0.1 | % | 4.7 | % | 21,448 | 10.9 | % | 0.1 | % | 2.1 | % | ||||||||||||||||||
| Subtotals | 506,802 | 3.3 | % | 1.7 | % | 57.4 | % | 645,072 | 3.8 | % | 1.9 | % | 62.2 | % | ||||||||||||||||||
| Residential mortgage loans | ||||||||||||||||||||||||||||||||
| Loans with mortgage finance bonds | 177 | 1.0 | % | — | — | 84 | 1.1 | % | 0.0 | % | 0.0 | % | ||||||||||||||||||||
| Mortgage mutual loans | 805 | 0.7 | % | — | 0.1 | % | 758 | 0.8 | % | 0.0 | % | 0.1 | % | |||||||||||||||||||
| Other mortgage mutual loans | 90,288 | 0.9 | % | 0.3 | % | 10.2 | % | 111,680 | 0.9 | % | 0.3 | % | 10.8 | % | ||||||||||||||||||
| Subtotals | 91,270 | 0.9 | % | 0.3 | % | 10.3 | % | 112,522 | 0.9 | % | 0.3 | % | 10.9 | % | ||||||||||||||||||
| Consumer loans | ||||||||||||||||||||||||||||||||
| Installment consumer loans | 247,387 | 7.8 | % | 0.8 | % | 28.0 | % | 255,516 | 6.9 | % | 0.7 | % | 24.6 | % | ||||||||||||||||||
| Credit card balances | 28,788 | 2.0 | % | 0.1 | % | 3.3 | % | 19,959 | 1.8 | % | 0.1 | % | 1.9 | % | ||||||||||||||||||
| Consumer leasing contracts | 127 | 3.1 | % | — | — | 67 | 2.1 | % | 0.0 | % | 0.0 | % | ||||||||||||||||||||
| Other consumer loans | 8,040 | 3.0 | % | — | 0.9 | % | 3,657 | 3.0 | % | 0.0 | % | 0.4 | % | |||||||||||||||||||
| Subtotals | 284,342 | 5.8 | % | 0.9 | % | 32.2 | % | 279,199 | 5.7 | % | 0.8 | % | 26.9 | % | ||||||||||||||||||
| Totals loans to clients | 882,414 | 2.9 | % | 2.9 | % | 100.0 | % | 1,036,793 | 3.0 | % | 3.0 | % | 100.0 | % | ||||||||||||||||||
| As of December 31, 2019 | ||||||||||||||||
| Total ECL Allowance | Allowance amount as a percentage of loans in category | Allowance amount as a percentage of total loans at amortized cost | Allowance amount as a percentage of total allowances for loans at amortized cost | |||||||||||||
| Ch$ million | ||||||||||||||||
| Commercial loans | ||||||||||||||||
| Interbank loans | 1 | 0.0 | % | 0.0 | % | 0.0 | % | |||||||||
| Commercial loans | 384,124 | 3.3 | % | 1.2 | % | 42.9 | % | |||||||||
| Foreign trade loans | 28,387 | 1.7 | % | 0.1 | % | 3.2 | % | |||||||||
| Checking accounts debtors | 11,900 | 6.0 | % | 0.0 | % | 1.3 | % | |||||||||
| Factoring transactions | 3,296 | 0.7 | % | 0.0 | % | 0.4 | % | |||||||||
| Student loans | 9,319 | 13.1 | % | 0.0 | % | 1.0 | % | |||||||||
| Leasing transactions | 44,645 | 3.1 | % | 0.1 | % | 5.0 | % | |||||||||
| Other loans and accounts receivable | 24,615 | 10.1 | % | 0.1 | % | 2.7 | % | |||||||||
| Subtotals | 506,569 | 3.2 | % | 1.6 | % | 56.5 | % | |||||||||
| Residential mortgage loans | ||||||||||||||||
| Loans with mortgage finance bonds | 137 | 1.1 | % | 0.0 | % | 0.0 | % | |||||||||
| Mortgage mutual loans | 816 | 0.8 | % | 0.0 | % | 0.1 | % | |||||||||
| Other mortgage mutual loans | 100,106 | 0.9 | % | 0.3 | % | 11.2 | % | |||||||||
| Subtotals | 101,059 | 0.9 | % | 0.3 | % | 11.3 | % | |||||||||
| Consumer loans | ||||||||||||||||
| Installment consumer loans | 255,061 | 6.5 | % | 0.8 | % | 28.5 | % | |||||||||
| Credit card balances | 27,337 | 2.0 | % | 0.1 | % | 3.1 | % | |||||||||
| Consumer leasing contracts | 122 | 3.1 | % | 0.0 | % | 0.0 | % | |||||||||
| Other consumer loans | 5,947 | 2.4 | % | 0.0 | % | 0.7 | % | |||||||||
| Subtotals | 288,467 | 5.2 | % | 0.9 | % | 32.2 | % | |||||||||
| Totals loans to clients | 896,095 | 2.7 | % | 2.7 | % | 100.0 | % | |||||||||
142
| As of December 31, 2017 | As of December 31, 2016 | |||||||||||||||||||||||
| Total Allowance | Allowance amount as a percentage of loans in category | Allowance amount as a percentage of total loans | Allowance amount as a percentage of total allowances | Total Allowance | Allowance amount as a percentage of loans in category | Allowance amount as a percentage of total loans | Allowance amount as a percentage of total allowances | |||||||||||||||||
| Ch$ million | Ch$ million | |||||||||||||||||||||||
| Commercial loans | ||||||||||||||||||||||||
| Commercial loans | 301,990 | 3.0 | % | 1.1 | % | 38.2 | % | 308,166 | 3.1 | % | 1.1 | % | 39.0 | % | ||||||||||
| Foreign trade loans | 50,470 | 3.2 | % | 0.2 | % | 6.4 | % | 57,820 | 3.2 | % | 0.2 | % | 7.3 | % | ||||||||||
| Checking accounts debtors | 14,466 | 7.4 | % | 0.1 | % | 1.8 | % | 9,648 | 5.4 | % | — | 1.2 | % | |||||||||||
| Factoring transactions | 5,995 | 1.3 | % | — | 0.8 | % | 5,407 | 1.8 | % | — | 0.7 | % | ||||||||||||
| Leasing transactions | 30,322 | 2.1 | % | 0.1 | % | 3.8 | % | 23,139 | 1.6 | % | 0.1 | % | 2.9 | % | ||||||||||
| Other loans and accounts receivable | 34,620 | 14.4 | % | 0.1 | % | 4.4 | % | 25,262 | 11.4 | % | 0.1 | % | 3.2 | % | ||||||||||
| Subtotals | 437,863 | 3.1 | % | 1.6 | % | 55.3 | % | 429,442 | 3.1 | % | 1.6 | % | 54.3 | % | ||||||||||
| Residential mortgage loans | ||||||||||||||||||||||||
| Loans with mortgage finance bonds | 123 | 0.5 | % | — | — | 16 | — | — | — | |||||||||||||||
| Mortgage mutual loans | 594 | 0.5 | % | — | 0.1 | % | 190 | 0.2 | % | — | — | |||||||||||||
| Other mortgage mutual loans | 68,349 | 0.8 | % | 0.2 | % | 8.6 | % | 56,803 | 0.7 | % | 0.2 | % | 7.2 | % | ||||||||||
| Subtotals | 69,066 | 0.8 | % | 0.2 | % | 8.7 | % | 57,009 | 0.7 | % | 0.2 | % | 7.2 | % | ||||||||||
| Consumer loans | ||||||||||||||||||||||||
| Installment consumer loans | 240,962 | 8.3 | % | 0.9 | % | 30.5 | % | 249,545 | 9.2 | % | 0.9 | % | 31.6 | % | ||||||||||
| Credit card balances | 33,401 | 2.4 | % | 0.1 | % | 4.2 | % | 41,063 | 2.8 | % | 0.2 | % | 5.2 | % | ||||||||||
| Consumer leasing contracts | 62 | 1.3 | % | — | — | 72 | 1.4 | % | — | — | ||||||||||||||
| Other consumer loans | 9,331 | 3.4 | % | — | 1.2 | % | 9,339 | 3.4 | % | — | 1.2 | % | ||||||||||||
| Subtotals | 283,756 | 6.2 | % | 1.0 | % | 35.9 | % | 300,019 | 6.7 | % | 1.1 | % | 37.9 | % | ||||||||||
| Totals loans to clients | 790,685 | 2.9 | % | 2.9 | % | 99.9 | % | 786,470 | 2.9 | % | 2.9 | % | 99.5 | % | ||||||||||
| Interbank loans | 472 | 0.3 | % | — | 0.1 | % | 4,135 | 1.5 | % | — | 0.5 | % | ||||||||||||
| Totals | 791,157 | 2.9 | % | 2.9 | % | 100.0 | % | 790,605 | 2.9 | % | 2.9 | % | 100.0 | % | ||||||||||
| As of December 31, 2015 | As of December 31, 2014 | As of December 31, 2018 | ||||||||||||||||||||||||||||||||||||||
| Total Allowance | Allowance amount as a percentage of loans in category | Allowance amount as a percentage of total loans | Allowance amount as a percentage of total allowances | Total Allowance | Allowance amount as a percentage of loans in category | Allowance amount as a percentage of total loans | Allowance amount as a percentage of total allowances | Total ECL Allowance | Allowance amount as a percentage of loans in category | Allowance amount as a percentage of total loans at amortized cost | Allowance amount as a percentage of total allowances for loans at amortized cost | |||||||||||||||||||||||||||||
| Ch$ million | Ch$ million | Ch$ million | ||||||||||||||||||||||||||||||||||||||
| Commercial loans | ||||||||||||||||||||||||||||||||||||||||
| Interbank loans | 10 | 0.1 | % | 0.0 | % | 0.0 | % | |||||||||||||||||||||||||||||||||
| Commercial loans | 305,465 | 3.4 | % | 1.2 | % | 40.1 | % | 269,185 | 3.2 | % | 1.2 | % | 39.3 | % | 368,786 | 3.3 | % | 1.2 | % | 41.8 | % | |||||||||||||||||||
| Foreign trade loans | 67,104 | 3.1 | % | 0.3 | % | 8.8 | % | 56,800 | 3.2 | % | 0.2 | % | 8.3 | % | 39,917 | 2.3 | % | 0.1 | % | 4.5 | % | |||||||||||||||||||
| Draft loans | 9,869 | 4.2 | % | — | 1.3 | % | 10,009 | 3.8 | % | — | 1.4 | % | ||||||||||||||||||||||||||||
| Checking accounts debtors | 13,784 | 6.4 | % | 0.0 | % | 1.6 | % | |||||||||||||||||||||||||||||||||
| Factoring transactions | 5,955 | 2.2 | % | — | 0.8 | % | 4,868 | 1.5 | % | — | 0.7 | % | 4,353 | 1.1 | % | 0.0 | % | 0.5 | % | |||||||||||||||||||||
| Student loans | 11,190 | 14.0 | % | 0.0 | % | 1.3 | % | |||||||||||||||||||||||||||||||||
| Leasing transactions | 25,437 | 1.7 | % | 0.1 | % | 3.3 | % | 23,734 | 1.6 | % | 0.1 | % | 3.5 | % | 38,800 | 2.7 | % | 0.1 | % | 4.4 | % | |||||||||||||||||||
| Other loans and accounts receivable | 17,371 | 12.1 | % | 0.1 | % | 2.3 | % | 16,953 | 12.5 | % | 0.1 | % | 2.5 | % | 29,962 | 18.2 | % | 0.1 | % | 3.4 | % | |||||||||||||||||||
| Subtotals | 431,201 | 3.2 | % | 1.7 | % | 56.6 | % | 381,549 | 3.1 | % | 1.6 | % | 55.7 | % | 506,802 | 3.3 | % | 1.7 | % | 57.4 | % | |||||||||||||||||||
| Residential mortgage loans | ||||||||||||||||||||||||||||||||||||||||
| Loans with letters of credit | 336 | 0.8 | % | — | — | 353 | 0.6 | % | — | 0.1 | % | |||||||||||||||||||||||||||||
| Loans with mortgage finance bonds | 177 | 1.0 | % | 0.0 | % | 0.0 | % | |||||||||||||||||||||||||||||||||
| Mortgage mutual loans | 848 | 0.6 | % | — | 0.1 | % | 552 | 0.5 | % | — | 0.1 | % | 805 | 0.7 | % | 0.0 | % | 0.1 | % | |||||||||||||||||||||
| Other mortgage mutual loans | 61,243 | 0.8 | % | 0.2 | % | 8.0 | % | 47,839 | 0.7 | % | 0.2 | % | 7.0 | % | 90,288 | 0.9 | % | 0.3 | % | 10.2 | % | |||||||||||||||||||
| Subtotals | 62,427 | 0.8 | % | 0.2 | % | 8.1 | % | 48,744 | 0.7 | % | 0.2 | % | 7.2 | % | 91,270 | 0.9 | % | 0.3 | % | 10.3 | % | |||||||||||||||||||
| Consumer loans | ||||||||||||||||||||||||||||||||||||||||
| Installment consumer loans | 215,914 | 8.7 | % | 0.9 | % | 28.3 | % | 201,931 | 8.7 | % | 0.9 | % | 29.5 | % | 247,387 | 7.8 | % | 0.8 | % | 28.0 | % | |||||||||||||||||||
| Credit card balances | 43,159 | 3.0 | % | 0.2 | % | 5.7 | % | 44,050 | 3.2 | % | 0.2 | % | 6.4 | % | 28,788 | 2.0 | % | 0.1 | % | 3.3 | % | |||||||||||||||||||
| Consumer leasing contracts | 79 | 1.4 | % | — | — | 80 | 1.5 | % | — | — | 127 | 3.1 | % | 0.0 | % | 0.0 | % | |||||||||||||||||||||||
| Other consumer loans | 8,355 | 3.5 | % | — | 1.1 | % | 7,962 | 3.5 | % | — | 1.2 | % | 8,040 | 3.0 | % | 0.0 | % | 0.9 | % | |||||||||||||||||||||
| Subtotals | 267,507 | 6.4 | % | 1.1 | % | 35.1 | % | 254,023 | 6.5 | % | 1.1 | % | 37.1 | % | 284,342 | 5.8 | % | 0.9 | % | 32.2 | % | |||||||||||||||||||
| Totals loans to clients | 761,135 | 3.0 | % | 3.0 | % | 99.8 | % | 648,316 | 3.11 | % | 2.9 | % | 100.0 | % | 882,414 | 2.9 | % | 2.9 | % | 100.0 | % | |||||||||||||||||||
| Interbank | 1,166 | 10.7 | % | — | 0.2 | % | 1 | — | — | — | ||||||||||||||||||||||||||||||
| Totals | 762,301 | 3.0 | % | 3.0 | % | 100.0 | % | 648,317 | 3.0 | % | 2.9 | % | 100.0 | % | ||||||||||||||||||||||||||
| As of December 31, 2017 | As of December 31, 2016 | |||||||||||||||||||||||||||||||
| Total Allowance | Allowance amount as a percentage of loans in category | Allowance amount as a percentage of total loans | Allowance amount as a percentage of total allowances | Total Allowance | Allowance amount as a percentage of loans in category | Allowance amount as a percentage of total loans | Allowance amount as a percentage of total allowances | |||||||||||||||||||||||||
| Ch$ Million | ||||||||||||||||||||||||||||||||
| Commercial loans | ||||||||||||||||||||||||||||||||
| Commercial loans | 301,990 | 3.0 | % | 1.1 | % | 38.2 | % | 308,166 | 3.1 | % | 1.1 | % | 39.0 | % | ||||||||||||||||||
| Foreign trade loans | 50,470 | 3.2 | % | 0.2 | % | 6.4 | % | 57,820 | 3.2 | % | 0.2 | % | 7.3 | % | ||||||||||||||||||
| Checking accounts debtors | 14,466 | 7.4 | % | 0.1 | % | 1.8 | % | 9,648 | 5.4 | % | 1.2 | % | ||||||||||||||||||||
| Factoring transactions | 5,995 | 1.3 | % | — | 0.8 | % | 5,407 | 1.8 | % | — | 0.7 | % | ||||||||||||||||||||
| Leasing transactions | 30,322 | 2.1 | % | 0.1 | % | 3.8 | % | 23,139 | 1.6 | % | 0.1 | % | 2.9 | % | ||||||||||||||||||
| Other loans and accounts receivable | 34,620 | 14.4 | % | 0.1 | % | 4.4 | % | 25,262 | 11.4 | % | 0.1 | % | 3.2 | % | ||||||||||||||||||
| Subtotals | 437,863 | 3.1 | % | 1.6 | % | 55.3 | % | 429,442 | 3.1 | % | 1.6 | % | 54.3 | % | ||||||||||||||||||
| Residential mortgage loans | ||||||||||||||||||||||||||||||||
| Loans with mortgage finance bonds | 123 | 0.5 | % | — | — | 16 | — | — | — | |||||||||||||||||||||||
| Mortgage mutual loans | 594 | 0.5 | % | — | 0.1 | % | 190 | 0.2 | % | — | — | |||||||||||||||||||||
| Other mortgage mutual loans | 68,349 | 0.8 | % | 0.2 | % | 8.6 | % | 56,803 | 0.7 | % | 0.2 | % | 7.2 | % | ||||||||||||||||||
| Subtotals | 69,066 | 0.8 | % | 0.2 | % | 8.7 | % | 57,009 | 0.7 | % | 0.2 | % | 7.2 | % | ||||||||||||||||||
| Consumer loans | ||||||||||||||||||||||||||||||||
| Installment consumer loans | 240,962 | 8.3 | % | 0.9 | % | 30.5 | % | 249,545 | 9.2 | % | 0.9 | % | 31.6 | % | ||||||||||||||||||
| Credit card balances | 33,401 | 2.4 | % | 0.1 | % | 4.2 | % | 41,063 | 2.8 | % | 0.2 | % | 5.2 | % | ||||||||||||||||||
| Consumer leasing contracts | 62 | 1.3 | % | — | — | 72 | 1.4 | % | — | — | ||||||||||||||||||||||
| Other consumer loans | 9,331 | 3.4 | % | — | 1.2 | % | 9,339 | 3.4 | % | — | 1.2 | % | ||||||||||||||||||||
| Subtotals | 283,756 | 6.2 | % | 1.0 | % | 35.9 | % | 300,019 | 6.7 | % | 1.1 | % | 37.9 | % | ||||||||||||||||||
| Totals loans to clients | 790,685 | 2.9 | % | 2.9 | % | 99.9 | % | 786,470 | 2.9 | % | 2.9 | % | 99.5 | % | ||||||||||||||||||
| Interbank loans | 472 | 0.3 | % | — | 0.1 | % | 4,135 | 1.5 | % | — | 0.5 | % | ||||||||||||||||||||
| Totals | 791,157 | 2.9 | % | 2.9 | % | 100.0 | % | 790,605 | 2.9 | % | 2.9 | % | 100.0 | % | ||||||||||||||||||
Based on information available regarding our borrowers, we believe that our loan loss allowances are sufficient to cover known potential losses and losses inherent in a loan portfolio of the size and nature of our loan portfolio.
143
ITEM 6. DIRECTORS, SENIOR MANAGEMENT AND EMPLOYEES
A. Directors and Senior Management
Directors
We are managed by our Board of Directors, which, in accordance with our by-laws, consists of 9 directors and two alternates who are elected at our ordinary shareholders’ meetings. As a result of resignation of the Andreu Plaza López on March 12, 2019, the Board of Directors currently has one vacancy. Except as noted below, theThe current members of the Board of Directors were elected by the shareholders in the ordinary shareholders’ meeting held on April 26, 2017.30, 2020. Members of the Board of Directors are elected for three-year terms. The term of the current Board members expires in April of 2020. On October 27, 2016, the SBIF authorized a reduction in the number of Board members from 11 to nine. This reduction and the corresponding amendment to Article 14 of the by-laws was approved by the shareholders at an Extraordinary Shareholders’ Meeting held on January 9, 2017 and was enforced from the Bank’s 2017 Ordinary Shareholders’ Meeting, which took place on April 26, 2017.2023.
Cumulative voting is permitted for the election of directors. The Board of Directors may appoint replacements to fill any vacancies that occur during periods between elections. If any member of the Board of Directors resigns before his or her term has ended, and no other alternate director is available to take the position at the next annual ordinary shareholders’ meeting a new replacing member will be elected. Our executive officers are appointed by the Board of Directors and hold office at its discretion. Scheduled meetings of the Board of Directors are held monthly. Extraordinary meetings can be held when called in one of three ways: by the Chairman of the Board of Directors, by three directors with the consent of the Chairman of the Board of Directors or by the majority of directors. None of the members of our Board of Directors has a service contract which entitles any Director to any benefits upon termination of employment with Santander-Chile.
Our current directors are as follows:
Directors | Position | Committees | Term Expires | |||
| Claudio Melandri Hinojosa | President | Asset and Liability Committee | ||||
Strategy Committee (President) | ||||||
Market Committee Remuneration Committee Integral Risk Committee Management Appointment Committee | Apr-23 | |||||
| ||||||
| Rodrigo Vergara Montes | First Vice President | Market Committee | ||||
Audit Committee | ||||||
| Apr-23 | |||||
| Orlando Poblete Iturrate | Second Vice President | Remuneration Committee (President) | ||||
Audit Committee (President) | Apr-23 | |||||
| Felix de Vicente Mingo | Director | Asset and Liability Committee | ||||
Integral Risk Committee Strategy Committee
| Apr-23 | |||||
| Alfonso Gómez Morales | Director | Integral Risk Committee (President) | ||||
| ||||||
| Apr-23 | |||||
| Ana Dorrego | Director | Apr-23 | ||||
| Rodrigo Echenique Gordillo | Director | – | Apr-23 | |||
| Lucia Santa Cruz Sutil | Director | Strategy Committee
Integral Risk Committee | Apr-23 |
144
Directors | Position | Committees | Term Expires | |||
| Juan Pedro Santa Maria Perez | Director | Audit Committee (Secretary) Analysis and Resolution Committee (President)
| Apr-23 | |||
| Blanca Bustamante Bravo | Alternate Director | Integral Risk Committee | ||||
| Apr-23 | |||||
| Oscar von Chrismar Carvajal | Alternate Director | Integral Risk Committee
| ||||
Strategy Committee | ||||||
Management Appointment Committee Asset and Liability Committee | ||||||
Analysis and Resolution Committee
| Apr-23 |
____________________
Claudio Melandri Hinojosa became the Executive Chairman on March 1,February 27, 2018 and is country head of Grupoofupo Santander in Chile. He is also President of Santander Chile Holding S.A. and Vice President of Universia Chile S.A.. He has more than 30 years of experience in the financial industryindusy and was Chief Executive Officer of Santander Chile from January 2010 to March 2018. He started his career in Banco Concepción and joined Grupo Santander in 1990, where he has held various positions of responsibility, including Regional Manager, Manager of the branch network, Human Resources Manager and Manager of Commercial Banking. He was also a Vice President at Banco Santander Venezuela for three years in the commercial area of this country. Mr. Melandri has degrees in Business and Accounting and holds a Master of Business Administration from the Universidad Adolfo Ibañez.
Rodrigo Vergara became a director and First Vice President of the Board on July 12, 2018. He was President of the Central Bank of Chile between 2011 and 2016.2016 and was a member of the Board of the Central Bank of Chile between 2009 and 2011. Mr. Vergara is an associate researcher inat the Centre of Public Studies (CEP) and a research fellow at Harvard’s Mossavar-Rahmani Center for Business and Government (Kennedy School). He is a professor at the Institute of Economics inat Pontificia Universidad Católica de Chile and an economic consultant and board member for various companies. He graduated with a Businessan Economics Degree from the Pontificia Universidad Católica de Chile in 1985 and earned a Doctorate Degree in Economics from Harvard University in 1991. Between 1985 and 1995, he worked at the Central Bank of Chile where he was promoted to Chief Economist in 1992. He has been an economic consultant for central banks and governments within Latin America, Eastern Europe, Asia and Africa. He has also been an external consultant for the World Bank, the International Monetary Fund, the Inter-American Development Bank and the United Nations. He has served, among others, as a member in the Presidential Advisor regarding Work and Equality, AdvisorEquity Commission, the Advisory Commission on the Free Trade Agreement between Chile and the US, the National Savings Commission, the Fiscal Rule Commission and the National FoundationCovid Economic Plan Commission. Mr. Vergara is the author of Sciencenumerous articles published in specialized journals and Technology Development (Conicyt).has edited several books.
Orlando Poblete Iturrate is the Second Vice President and has served on the Board since April 22, 2014. Since 1991, Mr. Poblete has been a professor at the Universidad de los Andes. Between 1997 and 2004, he was Dean of the Law School at the Universidad de los Andes and sinceuntil 2014 he has served as Chancellor. He is also a partner at the law firm Orlando Poblete & Company. He is a member of the Counsel of the Arbitration and Mediation of Santiago of the Chamber of Commerce of Santiago. Previously, between 1979 and 1991, he was a professor of Procedural Law at the Universidad de Chile. Mr. Poblete is a lawyer from the University of Chile and has a Masters in Law from the same university. He is also a graduate of the Directive Management of Companies Program (PADE) of ESE Business School of the Universidad de los Andes.
Félix de Vicente Mingo became a director on March 27, 2018. He has a Commercial EngineeringBusiness degree with honorable mentiona specialization in Economics from the Universidad de Chile. Between 2013 and 2014, he was Minister of Economy, Development and Tourism.Tourism of Chile. Before this, he was a directorTrade Commissioner of ProChile, thean institution of the Ministry of Foreign Affairs that promotesdedicated to promoting Chilean exports.products abroad. His first position was in a fruit export company in the O’Higgins region of Chile and then Manager of Administration and Finance of Telemercados Europa, as well as being president and partner of various companies in Chile and abroad.
145
Alfonso Gómez became a director on March 27, 2018. He has a Civil Engineering degree from the Universidad Católica de Chile, a Ph.D. of the Royal College of Art of London. HeLondon and he is the executive president ofan advisor to the Innovation Center UC Anacleto Angelini. He started his career in the Industrial and System Engineering Department of Universidad Católica de Chile. He was founder of various companies, such as Apple Chile, Unlimited and Virtualia, the first social network developed in Latin America. He has been a director of numerous companies and institutions such as the National Council of Culture and the Arts and Fundación País Digital, and the National Council of Innovation. He was Dean of the Faculty of Engineering and later Dean of the Business School of the Adolfo Ibáñez University.
Ana Dorrego became a director on March 15, 2015. She has been working at the Santander Group since 2000, mainly in the Financial Planning and Corporate Development department, coordinating the Group’s planning processes and following up on the different Santander Group units and projects. She is also director at CACEIS since December 2019. She was director of E-business development for the Santander Group and previously she was a corporate client relationship manager and commercial director of transactional banking at Bankinter. Ms. Dorrego holds a degree in Business Administration from the Universidad Pontificia de Comillas ICAI-ICADE, and a master’s degrees in Business Administration from Deusto University – Bilbao, Spain, and Adolfo Ibañez, Miami/Chile.
Rodrigo Echenique Gordillo became a director on March 26, 2019. He is currently the President of the Banco Santander Foundation and a board member of BSI (Banco Santander International). He is an Independent Director of Inditex. He is a member of the Board of Trustees of the Spain-US Council Foundation, Vice President of the Board of Trustees of the Teatro Real, member of the Board of Trustees of the Reina Sofía School of Music, of the Fundación Empresa y Crecimiento and of the ProCNIC and CNIC Foundation. He has been CEO, Vice President and Executive Director of Banco Santander, S.A. He has also been President of Santander Spain and Banco Popular. He was a member of the Board of Directors of Banco Santander, S.A. from 1987 to 2020. He has been a member of the Board of Banco Santander International and Santander Investment. He was also Vice President of Banco Banif, S.A., President of Allfunds Bank and SPREA. He has been a member of the Board of Directors of several industrial and financial companies: such as Ebro Azúcares y Alcoholes, S.A., Industrias Agricolas, S.A., SABA, S.A. and Lar, S.A. He was President of the Social Council of the Carlos III University of Madrid. A board member and then Chairman of the Advisory Board of Accenture, S.A., Lucent Technologies, Quercus and Agrolimen, S.A. He has been Chairman of Vallehermoso, S.A., Vocento, S.A., NH Hotels Group, Metrovacesa, S.A. and Merlin Properties, SOCIMI, S.A. He has a law degree from the Universidad Complutense de Madrid and is a State Attorney.
Lucía Santa Cruz Sutil became a director on August 19, 2003. She is a Member of the Board of the Universidad Adolfo Ibañez. She is director of Compañía de Seguros Generales y de Vida La Chilena Consolidada (Zurich). She is a member of the Academy of Social, Political and Moral Sciences of the Institute of Chile. She was a member of the Advisory Board of Nestle Chile and the Self-Regulation Committee for Insurance Companies in Chile. Ms. Santa Cruz is a historian and holds a M.Phil. in Philosophy from Oxford University and holds a Doctor Honoris Causa degree in Social Sciences from King’s College, University of London.
Juan Pedro Santa María Pérezbecame a director on July 24, 2012 after having served as Corporate Legal Director for Grupo Santander Chile, Legal Counsel for Santander-Chile, Banco O’Higgins and Banco Santiago. He has been President of the Legal Committee of the Asociación de Bancos e Instituciones Financieras de Chile for over 20 years and President Pro-Tempore of the Financial Law Committee of the Federación Latinoamericana de Bancos (FELABAN). He is a member of the Counsel of Arbitrage and Mediation of the Chamber of Commerce Chamber of Santiago. Mr. Santa María holds a degree in Law from the Pontificia Universidad Católica de Chile.
Lucía Santa Cruz Sutil became a director on August 19, 2003. She is a Member of the Board of the Universidad Adolfo Ibañez. She is director of Compañía de Seguros Generales y de Vida La Chilena Consolidada (Zurich) and member of the Advisory Board of Nestle Chile. She is a member of the Self-Regulation Committee for Insurance Companies in Chile. Ms. Santa Cruz holds a degree in History from King’s College, London University and an M.Phil. in History from Oxford University and holds a Doctor Honoris Causa degree from King’s College.
Ana Dorrego became a director in March 2015. She has been working at the Santander Group since 2005, mainly in the Financial Planning and Corporate Development department, coordinating the Group planning processes and following up on the different Santander Group units and projects. She was director of E-business development director for the Santander Group and previously she was a corporate clients relationship manager and commercial director of transactional banking at Bankinter. Ms. Dorrego holds a degree in Business Administration from the Universidad Pontificia de Comillas ICAI-ICADE, and a Master’s degrees in Business Administration from Deusto University – Bilbao, Spain, and Adolfo Ibañez, Miami/Chile.
Blanca Bustamante Bravo became an alternate director on April 28, 2015. She holds a commercial engineering degree with mention in businesseconomics from Universidad Católica de Chile. Her professional experience includes the role of economic analyst for the Central Bank of Chile and research analyst for Oppenheimer & Co. in New York and research analyst for IM Trust. In 1998, she joined Viña Concha y Toro as Head of Investor Relations, a position held until 2010 the responsibility to present business strategy and achievements of the company to the financial community.2010. In 2001, she also became directordeputy manager of Corporate Communications.Communications and in 2017 became Director of Corporative Affairs. Currently she holds the position of Director of Investor Relations. Since 2013, she ishas been a director in the Center for Research & Innovation for Viña Concha y Toro.
146
Oscar von Chrismar Carvajal joined the Board on December 22, 2009 and is currently an alternate director. Mr. von Chrismar holds ana Civil Engineering degree from the Universidad de Santiago de Chile with specialist studies in the US and Europe. He is a director of Sinacofi and the Stock Exchange as ofsince April 2012. He joined Banco Santander in 1990 as a Managermanager of the Financefinance division. Between 1995 and 1996 he was General Manager of Banco Santander Peru. In 1997, he became the General Manager of Santander Chile, a position he held until December 2009 when he joined the Board of Directors. Mr. von Chrismar iswas also a board member of Banco Santander Argentina, Peru and PeruColombia and the Santiago Stock Exchange. Prior to joining the Santander Group, he was Manager of the Finance Division for Morgan Bank and Manager of Finance of ING Bank. He has more than 25 years of experience in the banking industry.
Senior Management
Our senior managers are as follows:
Senior Manager | Position | Date Appointed | ||
| Miguel Mata | Chief Executive Officer | Mar-18 | ||
| Matias Sánchez | Director of Retail Banking | Mar-16 | ||
| Fred Meller | Director of Corporate and Investment Banking | Jan-11 | ||
| Jose Manuel Manzano | Director of Middle-Market | Apr-16 | ||
| Emiliano Muratore | Chief Financial Officer | Apr-16 | ||
| Guillermo Sabater | Financial Controller | Nov-15 | ||
| Franco Rizza | Director of Risk | Feb-14 | ||
| Ricardo Bartel | Director of Technology and Operations | Jun-15 | ||
| María Eugenia de la Fuente | Director of Human Resources | Jun-15 | ||
| Sergio Avila | Director of Administration and Costs | Mar-15 | ||
| Chief Accounting Officer | ||||
| Carlos Volante | Jan-14 | |||
| Cristian Florence | General Counsel | Sep-12 | ||
| Director of Internal Audit | ||||
| Cristian Peirano | Director of Corporate Products | Apr-19 |
Miguel Mata became the Chief Executive Officer in March 2018. Previously, he was Deputy General Manager among other diverse roles related to the business strategy of Santander-Chile. Mr. Mata joined Santander-Chile in 2002 when Santander-Chile merged with Banco Santiago. He previously served as the Financial Controller of Banco Santiago. He has been working in the banking industry since 1990, when he joined Banco O’Higgins, one of the predecessors to Banco Santiago. He is also a Director of Santander Consumer Chile S.A. and was president of Santander Asset Management S.A., as well as a director of Redbanc and Transbank, representing Banco Santander. Mr. Mata holds a degree in Engineering from Universidad Católica de Chile.
Matias Sánchez became ManagerDirector of Retail Banking in March 2016. He was the manager of Companies and InstitutionsMiddle-Market Director between 2013 and 2016 at Santander Chile. Previously, he worked for 18 years in Banesto, part of Grupo Santander as the jointdeputy general directorhead of Commercial Banking, and as Chief Executive Officer of Gescoban Soluciones S.A..S.A. Mr. Sánchez is an Economist of the Alicante University (Spain), with post-graduate studies in the Instituto de Empresa and IESE, both in Madrid. He also has a diploma in Leadership from Harvard Business School.
Fred Meller became ManagerDirector of Santander Corporate and Investment Banking in January 2011. Prior to that, he was Manager of Markets for Europe and UK for Santander Spain. Previously, he served as Treasurer and was a responsible for the Finance Division of Santander Chile. He was also General Manager of Santander Agente de Valores and is currently a director of Deposito Central de Valores de Chile and is also President of Santander S.A. Corredoresthe Bolsa Electronica de Bolsa.Chile. Mr. Meller holds a degree in Businessbusiness degree from Universidad Central de Chile.Chile and has participated in management programs at Kellogg Business School and Universidad de los Andes.
José Manuel Manzano became ManagerDirector of our Middle-market banking segment on April 1, 2016. Prior to that, he was Manager of Personnel, Organization and CostCosts of Banco Santander Chile, since September 2013. He was Corporate Director of Risk since JulySeptember 2007, and Manager of Human Resources for Santander-Chile since 1999. He was also General Manager of Santander Administradora General de Fondos and Managing Director of Santander AFAP in Uruguay. He is currently a director of Santander Chile Holding S.A., Santander Asset Management S.A. and Zurich Santander S.A. Mr. Manzano holds a Master of Business Administration and a commercial engineering degree in Business from Universidad Católica de Chile.
147
Emiliano Muratore became the Chief Financial Officer for Santander-Chile in April 2016. From Buenos Aires, Argentina, he has more than 1722 years of experience in the Santander Group. He joined Santander Rio (Argentina) in 1999 and after four years he was moved to the Group headquarters in Madrid as part of the Future Directors Program,a young talent development program, where he started his experience in the finance division. In 2006, he moved to Santander Chile where, in 2008, he was madeappointed as Manager of the Financial Division, bearing responsibility for the management of structural financial risks. After eight years, he was promoted to Chief Financial Officer. Mr. Muratore has a degree in business from Universidad Católica Argentina in Buenos Aires and a postgraduate degree in finance from Universidad de San Andrés in Buenos Aires. In 2018 he completed the Advanced Management Program at Harvard Business School. Currently, he is chairman of the Finance Committeefinancial management and infrastructure committee at Chile’s Banking Association.Association (ABIF). He also serves as board member at Fundación Belén Educa, a non-for-profit organization that manages 12 schools targeted to disadvantaged families.
Guillermo Sabateris the Financial Controller of Santander-Chile and has been working for Santander SpainGroup and its affiliates for 2328 years. Between 2009 and 2015, he was Senior Executive Vice President of Santander in the US and CFO and Controller of Sovereign Bank and Santander Holdings USA. Before that, he was the financial controller of Banco Santander Chile between 2006 and 2009. He also served for three years, between 2003 and 2006, as controllerFinancial Controller of the Consumer Finance Division in Madrid, Spain. Mr. Sabater also served as an internal auditor during his first ten years at the company. He has a degree in Economics and Business Administration from the University College of Financial Studies at the University Complutense de Madrid and completed a Program in Executive Development at the Institute of Business and has completed various courses at institutions such as Babson College and Boston University.
Franco Rizzabecame Manager ofChief Risk Officer in February 2014. Previously, he was director of Global Collections & Recoveries in the Madrid headquarters, covering all countries where the Group has commercial banking activities outside Spain. Between 2010 and 2013, he was the Chief Risk Officer of Banco Santander in Uruguay. He joined the Group in 1989 in Argentina, where he held various positions, including Regional Manager, Product Manager and Retail Credit Risk Manager. He is also a Director of Santander Consumer Chile S.A.. He has completed studies in Business and Risk Management in Argentina and Spain.
Ricardo Bartelbecame the Manager of Technology and Operation in June 2015 after joining Santander Chile in October 2014 as Manager of Operational Services of the same division. Mr. Bartel has both a Civil Engineering degree and a Master of Business Administration from Universidad Católica de Chile. He is also a graduate of the Directive Management of Companies Program (PADE) of ESE Business School of the Universidad de los Andes. He has previously held various management positions in product and service companies such as Chief Financial Officer at Madeco, Logistics and Distribution Manager and Chief Financial Officer of CCU SA. and Chief Executive Officer of Empresas Relsa S.A. and Laboratorio Mayer.Maver.
María Eugenia de la Fuenteis the Director of Human Resources and Communications. Ms. de la Fuente has a commercial engineering degree in business from the Universidad de Chile and a Master’s degree in tax planning from the Universidad Adolfo Ibañez. She has more than 2530 years of experience in strategic planning and human resource management for both private and public companies. From March 2010 to February 2012,2013, she was the Undersecretary to the Chief of Staff for the first government of President Sebastian Piñera. From 2013 to 2015, she was Managing Director of Transparency and Client Services for Corpbanca and Chief Executive Officer of BZD Consultores. She assumed her current role at Santander-Chile in June 2015.
Sergio Avilais ManagerDirector of Administration and Costs. He has worked at Banco Santander Chile for 19 years in Asset Management, Corporate Finance, Retail banking, Middle-market and Risks. Mr. Avila has a Bachelor of Science and Master of Science in Civil Engineering Degree from the Universidad Católica.lica de Chile.
Felipe Contreraswas named Chief Accounting Officer of Santander-Chile in October 2008. He has worked for 14 years in our Accounting Department, most recently as Manager of the Consolidation and Reporting Departments, overseeing our Chilean, U.S. and Spanish GAAP reporting requirements. He is also General Manager of Gesban Santander Servicios Profesionales Contables Ltda. Mr. Contreras is a Public Accountant from the University of Santiago.
Carlos Volante became manager CustomersDirector of Clients’ and Service Quality of Banco Santander Chile in January 2014. He joined the Santander Group in 1990, holding various responsibilities within the organization, including manager of the Branch Network, general manager of the Administrator of Mutual Funds, Mortgage Manager, Product Manager and Monitoring Commercial Banking. He was also Executive Vice President of Commercial Banking at Banco de Venezuela Grupo Santander. Between 2012 and 2013, he was general manager of the Corona Commercial Credit Group. Mr. Volante is an accountant auditor from the University of Talca and attended the DPA and has an MBA from the Universidad Adolfo Ibáñezez. He also has a master’s degree in Philosophy and participatesparticipated in the PADE program at the Universidad de los Andes.
148
Cristian Florenceis our General Counsel, a position he has held since September 2012. Prior to that he served as Chief Lawyer at Santander-Chile. Mr. Florence joined Santander-Chile in 2002 when Santander-Chile merged with Banco Santiago. He started working in the banking industry in 1991, when he joined Centrobanco, a predecessor of Banco O’Higgins and Banco Santiago serving at several positions in the law departments. Mr. Florence is also a Director of Administrador FinancieroZurich Santander Seguros Generales Chile S.A., Zurich Santander Seguros de TransantiagoVida Chile S.A. and Santander Asset Management S.A. Administradora General de Fondos. He has a degree in Law from the Universidad Gabriela Mistral and a Master of Laws (LLM) from the same university.university and is a professor of Civil Law.
Ricardo MartinezOscar Gómez is the Corporate Director of Internal Auditing,Audit a position he has held since September 2013.January 2020. He has worked for Grupo Santander since 19981997 in different positionpositions in the Internal Audit Division, including serving as the InternalCorporate Director of Accounting, Audit Manager of Insurance and Asset Management and head auditor offor Financial Risks.Risk Information. Mr. MartinezGómez has a degree in Economic Sciences and Business Science from Universidad de Cantabria and is certified by the IIA (Institute of Internal Auditors) as CIA (Certified Internal Auditor) and CRMA (Certification in Risk Management Assurance). He has also completed post graduate studies at Instituto de Empresa (Spain).
Cristian Peirano became the Director of Corporate Products in April 2019, date on which he reintegrated to the Bank. He has more than 30 years of experience in the banking industry. He previously held the positions of manager of corporate products for 10 years at another institution. Between 1986 and 2002 he was responsible for the areas and divisions of Research, Commercial Corporates and Risk at Banco O-Higgins and Banco Santiago, as well as director of subsidiaries in Chile and abroad. Furthermore, between 1999 and 2009 he worked in Banco Santander, which merged with Banco Santiago, as manager of Middle-market Banking and manager of Products. He has a business degree from Universidad Católica de Chile.
Jonathan Covarrubias was named Chief Accounting Officer of Santander-Chile in May 2019. He has over 19 years of experience in the banking industry, having started at Santander Chile in 2001. Previously he has held managerial positions related to the Consolidation and Reporting Departments, overseeing our Chilean, U.S. and Spanish GAAP reporting requirements. Mr. Covarrubias is a public accountant from the Universidad ComplutenseUniversity of Madrid,Santiago. He has a Master’sMasters in BusinessInternational Management of Companies’ Administration from the CIFFUniversity of the Universidad de Alcalá de HenaresZaragoza and post-graduate studieshas participated in the InstitutoESE Business School Advanced Management Program. Mr. Covarrubias is also certified by the Comité de Empresas and IESEAcreditación de Conocimientos en el Mercado de Valores (CAMV) in Spain.Chile.
B. Compensation
For the year ended December 31, 2018,2020, the aggregate amount of compensation paid by us to all of our directors, executive officers and management members was Ch$28,92131,961 million (U.S.$41.445 million). For the year ended December 31, 2018,2020, the aggregate amount of compensation paid by us to all of our directors was Ch$9131,452 million (U.S.$1.32 million), in monthly stipends. At our annual shareholder meeting held on April 24, 2018,30, 2020, shareholders agreed to maintain the remunerations approved in the previous shareholders’ meeting in 2017. Therefore it was agreed2019. In addition, a monthly stipend per director of UF 250 (U.S.$9,877)10,200), UF 500 (U.S.$19,753)20,400) for the Chairman of the Board and UF 375 (U.S.$14,815)15,301) for the Vice-ChairmanVice-Chairman’s of the Board.Board was set. This amount will be increased by UF 30 per month (U.S.$1,307)1,224) if a Board member is named to one or more committees of the Board. The additional amount will be UF 60 (U.S.$1,185)2,448) for the President of a committee.committee and UF 15 (US$612) for the Vice-President of one or more committees. In the case of the Integral Risk Committee, which holds sessions twice a month, the remuneration received by a regular board member is UF 15 (U.S.$612) per session with the President of this committee receiving 30 UF (U.S.$1,224) per session. Remuneration will be limited to two sessions per month, even if more sessions are held. Shareholders were also asked to approveapproved the Audit Committee remuneration for its members. The remuneration received by a regular board member oris UF 115 (U.S.$4,543)4,692) with the President of this committee receiving 230 UF (U.S.$9,086)9,384). This remuneration is in line with Chilean corporate governance law. In addition, we can pay certain directors professional service fees for the consulting services that they render to us in their fields of expertise. For the year ended December 31, 2018,2020, we did not make any such payments to our directors.
149
Santander-Chile and its affiliates have designed variable-compensation plans for their employees, based on performance targets and objectives, the achievement of which are evaluated and paid on a quarterly and/or annual basis.
Share-based compensation (settled in cash)
In accordance with IFRS 2, equity instruments settled in cash are allocated to executives of the Bank and its Subsidiaries as a form of compensation for their services. The Bank measures the services received and the cash obligation at fair value at the end of each reporting period and on the settlement date, recognizing any change in fair value in the income statement for the period. For the years ended December 31, 2018, 2017,2020, 2019 and 2016,2018, share-based compensation amounted to Ch$146(1,589) million, Ch$2,752 (315) million and Ch$331 (337) million.
Pension Plans:Plans
The Bank has an additional benefit available to its principal executives, consisting of a pension plan. The purpose of the pension plan is to endow the executives with funds for a better supplementary pension upon their retirement. For this purpose, the Bank will match the voluntary contributions made by the beneficiaries for their future pensions with an equivalent contribution. The executives will be entitled to receive this benefit only when they fulfillsubject to the following conditions:terms:
| a. |
| The general requisite to apply for this benefit is that the employee must be carrying out his/her duties when turning 60 years old. |
| The Bank will create a pension fund, with life insurance, for each beneficiary in the plan. Periodic contributions into this fund are made by the manager and matched by the Bank. |
| The Bank will be responsible for granting the benefits directly. |
If the working relationship between the managerexecutive and the respective company ends, before s/he fulfills the abovementioned requirements, s/he will have no rights under this benefit plan. In the event of the executive’s death or total or partial disability, s/hethe executive or his/her family will be entitled to receive this benefit. The Bank will make contributions to this benefit plan on the basis of mixed collective insurance policies whose beneficiary is the Bank. The life insurance company with whom such policies are executed is not an entity linked or related to the Bank or any other Santander Group company. Plan Assets owned by the Bank at the end of 20182020 totaled Ch$6,8048,224 million (Ch$7,9197,195 million in 2017).The2019). The amount of the defined benefit plans has been quantified by the Bank, based on the following criteria:
Calculation method:method
Use ofWe use the projected unit credit method, which considers each working year as generating an additional amount of rights over benefits and values each unit separately. It is calculated based primarily on fund contributions, as well as other factors such as the legal annual pension limit, seniority, age and yearly income for each unit valued individually.
150
Actuarial hypothesis assumptions:assumptions
Actuarial assumptions with respect to demographic and financial variables are non-biased and mutually compatible with each other. The most significant actuarial hypotheses considered in the calculations were:
| Plans post-employment 2018 | Plans post-employment 2017 | Plans post-employment 2020 | Plans post-employment 2019 | |||||||||
| Mortality chart | RV-2014 | RV-2014 | RV-2014 | RV-2014 | ||||||||
| Termination of contract rates | 5.0% | 5.0% | 5.0% | 5.0% | ||||||||
| Impairment chart | PDT 1985 | PDT 1985 | PDT 1985 | PDT 1985 |
Assets related to the pension fund contributed by the Bank into the Seguros EuroaméricaEuroamerica insurance company with respect to defined benefit plans are presented as net of associated commitments. Activity for post-employment benefits is as follows:
| As of December 31, | As of December 31, | |||||||||||||||
| 2018 | 2017 | 2020 | 2019 | |||||||||||||
| (In millions of Ch$) | (in millions of Ch$) | |||||||||||||||
| Plan assets | 6,804 | 7,919 | 8,224 | 7,195 | ||||||||||||
| Commitments for defined-benefit plans | — | — | — | |||||||||||||
| For active personnel | (5,958 | ) | (6,998 | ) | (7,551 | ) | (6,525 | ) | ||||||||
| Incurred by inactive personnel | — | — | — | — | ||||||||||||
| Minus: | ||||||||||||||||
| Unrealized actuarial (gain) losses | — | — | — | — | ||||||||||||
| Balances at year end | 846 | 921 | 673 | 670 | ||||||||||||
Year’s cash flow for post-employment benefits is as follows:
| For the years ended December 31, | ||||||||||||||||||||||||
| 2018 | 2017 | 2016 | For the years ended December 31, | |||||||||||||||||||||
| (In millions of Ch$) | 2020 | 2019 | 2018 | |||||||||||||||||||||
| (in millions of Ch$) | ||||||||||||||||||||||||
| a) Fair value of plan assets | ||||||||||||||||||||||||
| Opening balance | 7,919 | 6,612 | 6,945 | 7,195 | 6,804 | 7,919 | ||||||||||||||||||
| Expected yield of insurance contracts | 353 | 307 | 335 | 3,985 | 333 | 353 | ||||||||||||||||||
| Employer contributions | 836 | 1,931 | 886 | 870 | 859 | 836 | ||||||||||||||||||
| Actuarial (gain) losses | — | — | — | — | — | — | ||||||||||||||||||
| Premiums paid | (2,304 | ) | — | — | — | — | — | |||||||||||||||||
| Benefits paid | (931 | ) | (1,554 | ) | (226 | ) | (801 | ) | (2,304 | ) | ||||||||||||||
| Fair value of plan assets at year end | 6,804 | 7,919 | 6,612 | 8,224 | 7,195 | 6,804 | ||||||||||||||||||
| b) Present value of obligations | ||||||||||||||||||||||||
| Opening balance | (6,998 | ) | (4,975 | ) | (5,070 | ) | (6,525 | ) | (5,958 | ) | (6,998 | ) | ||||||||||||
| Net incorporation of Group companies | — | — | — | — | — | |||||||||||||||||||
| Service cost | (1,069 | ) | (2,039 | ) | 150 | (1,026 | ) | (566 | ) | (1,069 | ) | |||||||||||||
| Interest cost | — | — | — | — | — | — | ||||||||||||||||||
| Curtailment/settlement effect | — | — | — | — | — | — | ||||||||||||||||||
| Benefits paid | — | — | — | — | — | — | ||||||||||||||||||
| Past service cost | — | — | — | — | — | — | ||||||||||||||||||
| Actuarial (gain) losses | — | — | — | — | — | — | ||||||||||||||||||
| Other | 2,109 | 16 | (55 | ) | — | — | 2,109 | |||||||||||||||||
| Present value of obligations at year end | (5,958 | ) | (6,998 | ) | (4,975 | ) | (7,551 | ) | (6,525 | ) | (5,958 | ) | ||||||||||||
| Net balance at year end | 846 | 921 | 1,637 | 673 | 670 | 846 | ||||||||||||||||||
151
Plan expected profit:
| As of December 31, | As of December 31, | |||||||||||
| 2018 | 2017 | 2016 | 2020 | 2019 | 2018 | |||||||
| Type of expected yield from the plan’s assets | UF + 2.50% annual | UF + 2.50% annual | UF + 2.50% annual | UF + 2.50% annual | UF + 2.50% annual | UF + 2.50% annual | ||||||
| Type of yield expected from the reimbursement rights | UF + 2.50% annual | UF + 2.50% annual | UF + 2.50% annual | UF + 2.50% annual | UF + 2.50% annual | UF + 2.50% annual | ||||||
Plan associated expenses:
| For the years ended December 31, | ||||||||||||||||||||||||
| 2018 | 2017 | 2016 | For the years ended December 31, | |||||||||||||||||||||
| (in millions of Ch$) | 2020 | 2019 | 2018 | |||||||||||||||||||||
| (in millions of Ch$) | ||||||||||||||||||||||||
| Current period service expenses | 1,069 | 2,039 | (150 | ) | 1,026 | 566 | 1,069 | |||||||||||||||||
| Interest cost | — | — | — | — | — | — | ||||||||||||||||||
| Expected yield from plan’s assets | (353 | ) | (307 | ) | (335 | ) | (385 | ) | (333 | ) | (353 | ) | ||||||||||||
| Expected yield of insurance contracts linked to the Plan: | — | — | — | — | — | — | ||||||||||||||||||
| Extraordinary allocations | — | — | — | — | — | — | ||||||||||||||||||
| Actuarial (gain)/ losses recorded in the period | — | — | — | — | — | — | ||||||||||||||||||
| Past service cost | — | — | — | — | — | — | ||||||||||||||||||
| Other | — | — | — | — | — | — | ||||||||||||||||||
| Total | 716 | 1,732 | (485 | ) | 641 | 223 | 716 | |||||||||||||||||
C. Board Practices
Audit Committee
Board member | Position in Committee | |
| Orlando Poblete | President | |
| Felix de Vicente | Member | |
| Rodrigo Vergara | Member | |
The Audit Committee (Comité de Directores y Auditoría) is comprised of three members of the Board of Directors and the Committee Secretary is Juan Pedro Santa María.Maria. The Chief Executive Officer, General Counsel, General Auditor and other persons from the Bank can be invited to the meetings if necessary and are present on specific matters. This Committee’s primary responsibility is to support the Board of Directors in the continuous improvement of our system of internal controls, which includes reviewing the work of both the independent registered public accounting firm and the Internal Audit Department. The committee is also responsible for analyzing observations made by regulatory entities of the Chilean financial system about us and for recommending measures to be taken by our management in response. The external auditors are recommended by this committee to our Board of Directors and appointed by our shareholders at the annual shareholders’ meeting.
This committee is also responsible for:
| Presenting to the Board of Directors a list of candidates for the selection of an external auditor to be proposed at the Annual Shareholders’ Meeting. |
| Presenting to the Board of Directors a list of candidates for the selection of rating agencies. |
| Overseeing and analyzing the results of the external audit and the internal reviews. |
| Overseeing and coordinating the Bank’s operational risk policies. |
| Analyzing the interim and year-end financial statements and reporting the results to the Board of Directors. |
| Analyzing the external auditors’ reports and their content, procedures and scope. |
152
| Analyzing the rating agencies’ reports and their content, procedures and scope. |
| Obtaining information regarding the effectiveness and reliability of the internal control systems and procedures. |
| Analyzing the information systems performance, and its sufficiency, reliability and use in connection with decision-making processes. |
| Obtaining information regarding compliance with the company’s policies regarding the due observance of laws, regulations and internal rules to which the company is subject. |
| Investigating suspicious and fraudulent activities (including conflicts). |
| Analyzing the reports of the inspection visits, instructions and presentations of the |
| Obtaining information, analyzing and verifying the company’s compliance with the annual audit program prepared by the internal audit department. |
| Informing the Board of Directors of accounting changes and their effects. |
Integral Risk Committee
The Integral Risk Committee of the Board is responsible for reviewing and monitoring all risks that may affect us, including reputational risk, allowing for an integral risk management. This committee serves as the governing body through which the Board supervises risk in general. It also evaluates the reasonability of the systems for measurement and control of the following risks: Credit risk, Market risk, Operational risk, Cybersecurity, Solvency risk (BIS), Legal risks, Compliance risks and Reputational risks.
This Committee includes six Board members. This committee also includes the Chief Executive Officer, the Director of Risk and other senior level executives from the risk and commercial side of our business:business. The Board members of this committee are:are the following:
Board member | Position in Committee | |
| Alfonso | President | |
| Oscar von Chrismar | Member | |
| Member | ||
| Blanca Bustamante | Member | |
| Juan Pedro Santa | Member | |
| Claudio Melandri | Member | |
| Lucía | Member |
Asset and Liability Committee (ALCO)
The ALCO includes the Chairman and Vice PresidentChairman of the Board and three additional members of the Board, the Chief Executive Officer, the Chief Financial Officer, the Corporate Financial Controller, the Manager of the Financial Management Division, the Manager of Market Risk, the Manager of the Treasury Division, and other senior members of management. The ALCO meets monthly. All limits reviewed by the ALCO are measured and prepared by the Market Risk Department. The non-Board members of the ALCO meet weekly to review liquidity, funding, capital and market risk related matters.
Board member | Position in Committee | |
| Rodrigo Vergara | President | |
| Claudio Melandri | Member | |
| Oscar von Chrismar | Member | |
| Member | ||
| Alfonso | Member |
153
The main functions of the ALCO are:
| Making the most important decisions, approving the risk appetite and limits regarding our exposure to inflation, interest rate risk, |
| Review of the evolution of the most relevant local and international markets and monetary policies. |
The main limits set and monitored by the ALCO (and measured by the Market Risk Department) are:
Market Committee
The Market Committee includes the Chairman of the Board, the Vice Chairman of the Board, two additional members of the Board, the Chief Executive Officer, the Director of Corporate Investment Banking, the Chief Financial Officer, the Manager of the Treasury Division, the Manager of the Financial Management Division, the Manager of Market Risk, the Financial Controller and other senior members of management.
Board member | Position in Committee | |
| Oscar von Chrismar | President | |
| Rodrigo Vergara | Member | |
| Lucía Santa Cruz | Member | |
| Claudio Melandri | Member | |
| Alfonso | Member |
The Market Committee is responsible for:
| Establishing a strategy for the Bank’s trading investment portfolio. |
| Establishing the Bank’s policies, procedures and limits with respect to its trading portfolio. The Bank’s Market Risk Department measures all risks and limits and reports these to the Market Committee. |
| Reviewing the net foreign exchange exposure and limit. |
| Reviewing the results of the Bank’s client treasury business |
| Reviewing the evolution of the most relevant local and international markets and monetary policies. |
Strategy Committee
Board member | Position in Committee | |
| Claudio Melandri | President | |
| Rodrigo Vergara | Member | |
| Member | ||
| Alfonso | Member | |
| Member | ||
| Blanca Bustamante | Member | |
| Oscar von Chrismar | Member |
The Strategy Committee is in charge ofoversees our strategic planning process and follow-up, as well as the identification of broad business opportunities and threats.
Analysis and Resolution Committee
Board member | Position in Committee | |
| Juan Pedro Santa María Pérez | President | |
| Oscar von Chrismar | Member | |
| Lucía Santa Cruz | Member |
154
The Analysis and Resolution Committee defines and controls the compliance of policies, regulations and general and specific objectives regarding the prevention of money laundering and the financing of terrorism, in accordance with local rules and regulations as well as with the Santander Group.
Management Appointment Committee
Board member | Position in Committee | |
| President | ||
| Member | ||
| Oscar von Chrismar | Member |
The Management Appointment Committee is in charge ofoversees the revision and application of policies and procedures of roles defined as “Key“key positions” and also the review of other positions within the organization in general.
Remuneration Committee
Board member | Position in Committee | |
| Orlando Poblete | President | |
| Alfonso Gómez | Member | |
| Claudio Melandri | Member |
The Remuneration Committee reviews the documentation referring to the evaluation and remuneration of roles defined as “Key“key positions” and other member of the organization in general.
D. Employees
As of December 31, 2018,2020, on a consolidated basis, we had 11,305 employees, 10,71510,470 employees: 9,842 of whom were bank employees, 64121 of whomwhich were employees of our subsidiaries and 6526628 were employees of entities controlled by the Bank through other considerations. We have traditionally enjoyed good relations with our employees and their unions. Of the total headcount of us and our subsidiaries, 8,4877,819 or 75.1%74.7% were unionized. In February 2018, a new collective bargaining agreement was signed with the main unions, which will comecame into effect on September 1, 2018 and which expires on August 31, 2021, though it may be renegotiated ahead of schedule with the consent of management and the union. We generally apply the terms of our collective bargaining agreement to unionized and non-unionized employees. The following chart summarizes the number of employees employed by the bank.
| Employees | As of December 31, | 2020 | |||||
| Executives | 254 | ||||||
| Supervisors | 1,298 | ||||||
| Professionals | |||||||
| Administrative | |||||||
| Total | |||||||
E. Share Ownership
No director or executive officer owns more than 1% of the shares of Santander-Chile as of December 31, 2018.2020. Santander-Chile currently does not have any arrangements for involving employees in its capital and there is no systematic arrangement for grant of options or shares or securities of Santander-Chile to them. In accordance with IFRS 2, equity instruments settled in cash are allocated to executives of the Bank and its Subsidiaries as a form of compensation for their services. See “Item 6—Directors, Senior Management and Employees—Compensation” for more details.
155
ITEM 7. MAJOR SHAREHOLDERS AND RELATED PARTY TRANSACTIONS
A. Major Shareholders
Santander Spain controls Santander-Chile through its holdings in Teatinos Siglo XXI Inversiones S.A. and Santander Chile Holding S.A., which are controlled subsidiaries. Santander Spain has control over 67.18% of our shares and actual participation, excluding non-controlling shareholders that participate in Santander Chile Holding, S.A. of 67.12%.
| Shareholder | Number of Shares | Percentage | Number of Shares | Percentage | ||||||||
| Santander Chile Holding S.A. | 66,822,519,695 | 35.46% | 66,822,519,695 | 35.46 | % | |||||||
| Teatinos Siglo XXI Inversiones S.A. | 59,770,481,573 | 31.72% | 59,770,481,573 | 31.72 | % | |||||||
Santander Spain is in a position to cause the electionelect of a majority of the members of Santander-Chile’s Board of Directors, to determine its dividend and other policies and to determine substantially all matters to be decided by a vote of shareholders. Santander Spain holds ordinary shares to which no special voting rights are attached. Each share represents one vote and there are no shareholders with different voting rights.
The number of outstanding shares of Santander-Chile (of which there is only one class, being ordinary shares) at December 31, 2018,2020, was 188,446,126,794 shares, without par value. Santander-Chile’s shares are listed for trading on the Chilean Stock Exchange and on the NYSE in connection with the registration of ADRs. The market capitalization of Santander-Chile at December 31, 20182020 on the Chilean Stock Exchange was Ch$9,740,7806,426,013 million and U.S.$14,0868,946 million on the NYSE. At December 31, 2018,2020, Santander-Chile had 11,43111,733 holders of its ordinary shares registered in Chile, including The Bank of New York Mellon as Depositary (the “Depositary”) of Santander-Chile’s ADS Program. Other than the information disclosed in this section, there are no arrangements to the knowledge of Santander-Chile that can result in a change of control of Santander-Chile. As of December 31, 2018,2020, there were a total of 28 ADR holders on record. Since some of these ADRs are held by nominees, the number of record holders may not be representative of the number of beneficial holders.
B. Related Party Transactions
The Chilean Companies Law requires that our transactions with related parties be on a market basis, that is, on similar terms to those customarily prevailing in the market. We are required to compare the terms of any such transaction to those prevailing in the market at the date the transaction is to be entered into. Directors of companies that violate this provision are liable for losses resulting from such violations.
156
In addition, under the Chilean Companies Law, a company may not enter into a transaction with related parties unless (i) such transaction has received the prior approval of the company’s Board of Directors and (ii) the terms of such transaction are consistent with the terms of transactions of a similar type prevailing in the market. If it is not possible to make this determination, the board may appoint two independent evaluators. The evaluators’ final conclusions must be made available to shareholders and directors for a period of 20 business days, during which shareholders representing 5% or more of the issued voting shares may request the board to call a shareholders’ meeting to resolve the matter, with the agreement of two thirds of the issued voting shares required for approval. For purposes of this regulation, the law considers the amount of a proposed transaction to be material if (1) it exceeds 1% of the company’s net worth (provided that it also exceeds UF20,000)UF2,000) or (2) it exceeds UF20,000.
All resolutions approving such transactions must be reported to the company’s shareholders at the annual shareholders’ meeting. Violations of this provision may result in administrative or civil liability to the corporation, the shareholders and/or third parties who suffer losses as a result of such violation.
Loans granted to related parties
In addition to subsidiaries and associated entities, the Bank’s “related parties” include the “key personnel” of the Bank’s executive staff (members of the Bank’s Board of Directors and the Senior Managers of Santander-Chile and its subsidiaries, together with their close relatives), as well as the entities over which the key personnel could exert significant influence or control.
The Bank also considers the companies that are part of the Santander Group worldwide as related parties, given that all of them have a common parent,i.e., Santander Spain. The table below shows loans and accounts receivable and contingent loans with related parties. For more information, see “Note 36—34—Transactions with Related Parties” in our Audited Consolidated Financial Statements appearing elsewhere in this Annual Report:
| As of December 31, | ||||||||||||||||||||||||||||||||||||
| 2018 | 2017 | 2016 | ||||||||||||||||||||||||||||||||||
Companies of the Group | Associated companies | Key personnel | Other | Companies of the Group | Associated companies | Key personnel | Other | Companies of the Group | Associated companies | Key personnel | Other | |||||||||||||||||||||||||
| MCh$ | MCh$ | MCh$ | MCh$ | MCh$ | MCh$ | MCh$ | MCh$ | MCh$ | MCh$ | MCh$ | MCh$ | |||||||||||||||||||||||||
| Loans and accounts receivable: | ||||||||||||||||||||||||||||||||||||
| Commercial loans | 122,289 | 459 | 4,299 | 233 | 80,076 | 771 | 3,947 | 7,793 | 81,687 | 533 | 4,595 | 7,100 | ||||||||||||||||||||||||
| Mortgage loans | — | — | 18,814 | — | — | — | 18,796 | — | — | — | 18,046 | — | ||||||||||||||||||||||||
| Consumer loans | — | — | 5,335 | — | — | — | 4,310 | — | — | — | 3,783 | — | ||||||||||||||||||||||||
| Loans and accounts receivable: | 122,289 | 459 | 28,448 | 233 | 80,076 | 771 | 27,053 | 7,793 | 81,687 | 533 | 26,424 | 7,100 | ||||||||||||||||||||||||
| Allowance for loan losses | (308 | ) | (9 | ) | (116 | ) | (5 | ) | (209 | ) | (9 | ) | (177 | ) | (18 | ) | (209 | ) | (35 | ) | (87 | ) | (34 | ) | ||||||||||||
| Net loans | 121,981 | 450 | 28,332 | 228 | 79,867 | 762 | 26,876 | 7,775 | 81,478 | 498 | 26,337 | 7,066 | ||||||||||||||||||||||||
| Guarantees | 442,854 | — | 22,893 | 7,171 | 361,452 | — | 23,868 | 7,164 | 434,141 | — | 23,636 | 5,486 | ||||||||||||||||||||||||
| Contingent loans: | ||||||||||||||||||||||||||||||||||||
| Personal guarantees | — | — | — | — | — | — | — | — | — | — | — | — | ||||||||||||||||||||||||
| Letters of credit | 5,392 | — | 2,060 | 44 | 19,251 | — | — | 33 | 27,268 | — | — | — | ||||||||||||||||||||||||
| Guarantees | 445,064 | — | 3,364 | — | 377,578 | — | — | — | 437,101 | — | — | — | ||||||||||||||||||||||||
| Contingent loans: | 450,456 | — | 5,424 | 44 | 396,829 | — | — | 33 | 464,369 | — | — | — | ||||||||||||||||||||||||
| Allowance for contingent loans | (1 | ) | — | (18 | ) | — | (4 | ) | — | — | 1 | (5 | ) | — | — | — | ||||||||||||||||||||
| Net contingent loans | 450,455 | — | 5,406 | 44 | 396,825 | — | — | 34 | 464,364 | — | — | — | ||||||||||||||||||||||||
157
As of December 31, | ||||||||||||||||||||||||||||||||||||||||||||||||
2020 | 2019 | 2018 | ||||||||||||||||||||||||||||||||||||||||||||||
Companies of the Group | Associated companies | Key personnel | Other | Companies of the Group | Associated companies | Key personnel | Other | Companies of the Group | Associated companies | Key personnel | Other | |||||||||||||||||||||||||||||||||||||
| (in millions of Ch$) | ||||||||||||||||||||||||||||||||||||||||||||||||
| Loans and accounts receivable: | ||||||||||||||||||||||||||||||||||||||||||||||||
| Commercial loans | 352,590 | 265 | 3,939 | 900 | 246,868 | 375 | 2,986 | 685 | 122,289 | 459 | 4,299 | 233 | ||||||||||||||||||||||||||||||||||||
| Mortgage loans | - | - | 22,428 | - | - | - | 20,473 | - | — | — | 18,814 | — | ||||||||||||||||||||||||||||||||||||
| Consumer loans | - | - | 6,131 | - | - | - | 5,781 | - | — | — | 5,335 | — | ||||||||||||||||||||||||||||||||||||
| Loans and accounts receivable: | 352,590 | 265 | 32,498 | 900 | 246,868 | 375 | 29,240 | 685 | 122,289 | 459 | 28,448 | 233 | ||||||||||||||||||||||||||||||||||||
| Allowance for loan losses | (1,138 | ) | (9 | ) | (137 | ) | (14 | ) | (122 | ) | (182 | ) | (179 | ) | (10 | ) | (308 | ) | (9 | ) | (116 | ) | (5 | ) | ||||||||||||||||||||||||
| Net loans | 351,452 | 256 | 32,361 | 886 | 246,746 | 192 | 29,061 | 675 | 121,981 | 450 | 28,332 | 228 | ||||||||||||||||||||||||||||||||||||
| Guarantees | 3,323 | - | 27,203 | 442 | 462,513 | - | 23,918 | 288 | 442,854 | — | 22,893 | 7,171 | ||||||||||||||||||||||||||||||||||||
| Contingent loans: | ||||||||||||||||||||||||||||||||||||||||||||||||
| Personal guarantees | - | - | - | - | - | - | - | - | — | — | — | — | ||||||||||||||||||||||||||||||||||||
| Letters of credit | 3,447 | - | - | 93 | 4,112 | - | - | 63 | 5,392 | — | 2,060 | 44 | ||||||||||||||||||||||||||||||||||||
| Guarantees | 811 | - | - | - | 464,691 | - | - | - | 445,064 | — | 3,364 | — | ||||||||||||||||||||||||||||||||||||
| Contingent loans: | 4,258 | - | - | 93 | 468,803 | - | - | 63 | 450,456 | — | 5,424 | 44 | ||||||||||||||||||||||||||||||||||||
| Allowance for contingent loans | (6 | ) | - | - | - | (835 | ) | - | - | - | (1 | ) | — | (18 | ) | — | ||||||||||||||||||||||||||||||||
| Net contingent loans | 4,252 | - | - | 93 | 467,968 | - | - | 63 | 450,455 | 5,406 | 44 | |||||||||||||||||||||||||||||||||||||
Loans (a) were made in the ordinary course of business, (b) were made on substantially the same terms, including interest rates and collateral, as those prevailing at the time for comparable transactions with unrelated persons, and (c) did not involve more than the normal collection risk.
Under the Chilean General Banking Law, Chilean banks are subject to certain lending limits, including the following:
| a bank may not extend to any person or legal entity (or group of related entities), directly or indirectly, unsecured loans in an amount that exceeds 5.0% of the bank’s regulatory capital, or secured loans in an amount that exceeds 25.0% of its regulatory capital. In the case of foreign export trade finance, this 5.0% ceiling is raised to: 10.0% for unsecured financing, 30.0% for secured financing. This ceiling is raised to 15.0% for loans granted to finance public works under the concessions system contemplated in the Decree with Force of Law 164 of 1991, of the Ministry of Public Works, provided that either the loan is secured on the concession, or the loan is granted as part of a loan syndication; |
| a bank may not grant loans bearing more favorable terms than those generally offered by banks in the same community to any entity (or group of related entities) that is directly or indirectly related to its owners or management; |
| a bank may not extend loans to another bank in an aggregate amount exceeding 30.0% of its regulatory capital; |
| a bank may not directly or indirectly grant a loan, the purpose of which is to allow the borrower to acquire shares in the lending bank; |
| a bank may not lend, directly or indirectly, to a Director or any other person who has the power to act on behalf of the bank, or to certain related parties; and |
| a bank may not grant loans to individuals or legal entities involved in the ownership or management of the bank, whether directly or indirectly (including holders of 1.0% or more of its shares), on more favorable terms than those generally offered to non-related parties. Loans may not be extended to senior executives and to companies in which such individuals have a participation of 5.0% or more of the equity or net earnings in such companies. The aggregate amount of loans to related parties may not exceed a bank’s regulatory capital. |
We are not aware of any loans to any related parties exceeding the above lending limits.
The largest related party loan, which matures on June 13, 2019 and has an annual rate158
The table below shows all other assets and liabilities with related parties:
As of December 31, | As of December 31, | |||||||||||||||||||||||||||||||||||||||||||||||||||||||||||||||||||||||||||||||||||
2018 | 2017 | 2016 | 2020 | 2019 | 2018 | |||||||||||||||||||||||||||||||||||||||||||||||||||||||||||||||||||||||||||||||
Companies of the Group | Associated companies | Key personnel | Other | Companies of the Group | Associated companies | Key personnel | Other | Companies of the Group | Associated companies | Key personnel | Other | Companies of the Group | Associated companies | Key personnel | Other | Companies of the Group | Associated companies | Key personnel | Other | Companies of the Group | Associated companies | Key personnel | Other | |||||||||||||||||||||||||||||||||||||||||||||||||||||||||||||
| (in millions of Ch$) | (in millions of Ch$) | |||||||||||||||||||||||||||||||||||||||||||||||||||||||||||||||||||||||||||||||||||
| Assets | ||||||||||||||||||||||||||||||||||||||||||||||||||||||||||||||||||||||||||||||||||||
| Cash and deposits in banks | 189,803 | — | — | — | 74,949 | — | — | — | 187,701 | — | — | — | 703,069 | - | - | - | 171,816 | - | - | - | 189,803 | — | — | — | ||||||||||||||||||||||||||||||||||||||||||||||||||||||||||||
| Trading investments | — | — | — | — | — | — | — | — | — | — | — | — | - | - | - | - | - | - | - | - | — | — | — | — | ||||||||||||||||||||||||||||||||||||||||||||||||||||||||||||
| Obligations under repurchase agreements | — | — | — | — | — | — | — | — | — | — | — | — | - | - | 0 | - | - | - | - | - | — | — | — | — | ||||||||||||||||||||||||||||||||||||||||||||||||||||||||||||
| Financial derivative contracts | 748,632 | 105,358 | — | 9 | 545,028 | 86,011 | — | — | 742,851 | 33,433 | — | — | 978,696 | 186,038 | 33 | 7 | 2,058,715 | 218,610 | - | 55 | 748,632 | 105,358 | — | 9 | ||||||||||||||||||||||||||||||||||||||||||||||||||||||||||||
| Available-for-sale investments | — | — | — | — | — | — | — | — | — | — | — | — | - | - | - | - | - | - | - | - | — | — | — | — | ||||||||||||||||||||||||||||||||||||||||||||||||||||||||||||
| Other assets | 38,960 | 51,842 | — | — | 8,480 | 118,136 | — | — | 4,711 | 67,454 | — | — | 445,609 | 412,277 | - | - | 185,317 | 210,579 | - | - | 38,960 | 51,842 | — | — | ||||||||||||||||||||||||||||||||||||||||||||||||||||||||||||
| Liabilities | ||||||||||||||||||||||||||||||||||||||||||||||||||||||||||||||||||||||||||||||||||||
| Deposits and other demand liabilities | 27,515 | (21,577 | ) | 2,493 | (480 | ) | 24,776 | 25,805 | 2,470 | 221 | 6,988 | 7,141 | 2,883 | 630 | 1,146,273 | 4,484 | 5,997 | 3,242 | 25,261 | 93,761 | 4,624 | 566 | 27,515 | (21,577 | ) | 2,493 | (480 | ) | ||||||||||||||||||||||||||||||||||||||||||||||||||||||||
| Obligations under repurchase agreements | 6,501 | — | 329 | 68 | 50,945 | — | — | — | 56,167 | — | — | — | 961,718 | - | 101 | - | 138,498 | 5,000 | 270 | 80 | 6,501 | — | 329 | 68 | ||||||||||||||||||||||||||||||||||||||||||||||||||||||||||||
| Time deposits and other time liabilities | 2,585,337 | — | 3,189 | (838 | ) | 785,988 | 27,968 | 3,703 | 3,504 | 1,545,835 | 6,219 | 2,525 | 2,205 | 1,221,893 | 100 | 4,706 | 864 | 1,183,235 | 282,171 | 4,246 | 2,204 | 2,585,337 | — | 3,189 | (838 | ) | ||||||||||||||||||||||||||||||||||||||||||||||||||||||||||
| Financial derivative contracts | 770,624 | 112,523 | — | — | 418,647 | 142,750 | — | 7,190 | 954,575 | 54,691 | — | — | 1,137,502 | 354,108 | - | - | 2,159,660 | 288,013 | - | 3 | 770,624 | 112,523 | — | — | ||||||||||||||||||||||||||||||||||||||||||||||||||||||||||||
| Interbank borrowings | — | — | — | — | — | — | — | — | 6,165 | — | — | — | - | - | - | - | - | - | - | - | — | — | — | — | ||||||||||||||||||||||||||||||||||||||||||||||||||||||||||||
| Issued debt instruments | 335,443 | — | — | — | 482,626 | — | — | — | 484,548 | — | — | — | 349,002 | - | - | - | 363,154 | - | - | - | 335,443 | — | — | — | ||||||||||||||||||||||||||||||||||||||||||||||||||||||||||||
| Other financial liabilities | 6,807 | — | — | — | 4,919 | — | — | — | 8,970 | — | — | — | - | - | - | - | 6,231 | - | - | - | 6,807 | — | — | — | ||||||||||||||||||||||||||||||||||||||||||||||||||||||||||||
| Other liabilities | 60,884 | 89,817 | — | — | 164,303 | 58,168 | — | — | 446 | 44,329 | — | — | 1,210 | 4,484 | 5,997 | 3,242 | 8,130 | 146,164 | - | - | 60,884 | 89,817 | — | — | ||||||||||||||||||||||||||||||||||||||||||||||||||||||||||||
Other transactions with related parties
During the years ended December 31, 2018, 20172020, 2019 and 2016,2018, the Bank had the following significant income (expenses) from services provided to (by) related parties:
For the years ended December 31, | As of December 31, | |||||||||||||||||||||||||||||||||||||||||||||||||||||||||||||||||||||||||||||||||||
2018 | 2017 | 2016 | 2020 | 2019 | 2018 | |||||||||||||||||||||||||||||||||||||||||||||||||||||||||||||||||||||||||||||||
Companies of the Group | Associated Companies | Key personnel | Other | Companies of the Group | Associated companies | Key personnel | Other | Companies of the Group | Associated Companies | Key personnel | Other | Companies of the Group | Associated companies | Key personnel | Other | Companies of the Group | Associated companies | Key personnel | Other | Companies of the Group | Associated companies | Key personnel | Other | |||||||||||||||||||||||||||||||||||||||||||||||||||||||||||||
| (in millions of Ch$) | (in millions of Ch$) | |||||||||||||||||||||||||||||||||||||||||||||||||||||||||||||||||||||||||||||||||||
Interest income and inflation-indexation adjustments | (53,256 | ) | (156 | ) | 1,252 | 508 | (43,892 | ) | — | 1,051 | — | (39,279 | ) | 40 | 1,164 | 115 | (30,586 | ) | 21 | 1,202 | 10 | (41,181 | ) | (5,235 | ) | 1,151 | 26 | (53,256 | ) | (156 | ) | 1,252 | 508 | |||||||||||||||||||||||||||||||||||||||||||||||||||
| Fee and commission income and expenses | 91,178 | 7,826 | 305 | 22 | 72,273 | 15,404 | 224 | 1 | 56,952 | 22,322 | 204 | 20 | 34,147 | 22,596 | 152 | 24 | 28,274 | 14,499 | 232 | 28 | 91,178 | 7,826 | 305 | 22 | ||||||||||||||||||||||||||||||||||||||||||||||||||||||||||||
| Net income (expense) from financial operations and net foreign exchange gain (loss) (*) | (566,677 | ) | 65,727 | 27 | (12 | ) | 363,108 | (48,453 | ) | (3 | ) | 19 | (343,963 | ) | (48,373 | ) | (88 | ) | 2 | |||||||||||||||||||||||||||||||||||||||||||||||||||||||||||||||||
| Net income (expense) from financial operations and net foreign exchange gain (loss)(1) | (390,737 | ) | 240,565 | - | - | (586,318 | ) | (84,236 | ) | - | - | (566,677 | ) | 65,727 | 27 | (12 | ) | |||||||||||||||||||||||||||||||||||||||||||||||||||||||||||||||||||
| Other operating income and expenses | 42 | 1,388 | — | — | 21,610 | (1,454 | ) | — | — | 931 | (2,239 | ) | — | — | 0 | (522 | ) | - | - | 406 | (2,026 | ) | - | - | 42 | 1,388 | — | — | ||||||||||||||||||||||||||||||||||||||||||||||||||||||||
| Key personnel compensation and expenses | — | — | (11,761 | ) | — | — | — | (43,037 | ) | — | — | — | (37,328 | ) | — | 0 | - | (31,961 | ) | - | - | - | (9,548 | ) | - | — | — | (11,761 | ) | — | ||||||||||||||||||||||||||||||||||||||||||||||||||||||
| Administrative and other expenses | (43,035 | ) | (50,764 | ) | — | — | (48,246 | ) | (47,220 | ) | — | — | (35,554 | ) | (43,115 | ) | — | — | (45,478 | ) | (16,763 | ) | - | - | (11,877 | ) | (47,757 | ) | - | - | (43,035 | ) | (50,764 | ) | — | — | ||||||||||||||||||||||||||||||||||||||||||||||||
| Total | (571,748 | ) | 24,021 | (10,177 | ) | 518 | 364,913 | (81,723 | ) | (41,765 | ) | 20 | (360,913 | ) | (71,365 | ) | (36,048 | ) | 137 | (432,654 | ) | 245,897 | (30,607 | ) | 34 | (610,696 | ) | (124,755 | ) | (8,165 | ) | 54 | (571,748 | ) | 24,021 | (10,177 | ) | 518 | ||||||||||||||||||||||||||||||||||||||||||||||
____________________
| Primarily relates to derivative contracts used to financially cover exchange risk of assets and liabilities that cover positions of the Bank and its subsidiaries. |
Only transactions with related parties equal to or greater than UF5,000 (Ch$138143 million) are included individually in the table above. Transactions with related parties between UF1,000 (Ch$2829 million) and up to UF5,000 are included in other transactions with related parties. All transactions were conducted at arm’s length.
159
C. Interests of Experts and Counsel
Not applicable.
A. Consolidated Statements and Other Financial Information
Financial Information
See “Item 18. Financial Statements.Statements.”
Legal Proceedings
We are subject to certain claims and are party to certain legal and arbitration proceedings in the normal course of our business, including claims for alleged operational errors. We do not believe that the liabilities related to such claims and proceedings are likely to have, in the aggregate, a material adverse effect on our consolidated financial condition or results of operations. There are no material proceedings in which any of our directors, any members of our senior management, or any of our affiliates is either a party adverse to us or our subsidiaries or has a material interest adverse to us or our subsidiaries.
Upon the recommendation of our legal advisors, we estimate that our aggregate liability if all legal proceedings were determined adversely to us could result in significant losses not estimated by us. As of the date of the Audited Consolidated Financial Statements, the Bank and its affiliates were subject to certain legal actions in the normal course of their business. As of December 31, 2018,2020, the Bank and its subsidiaries havehas provisions for these legal actions of Ch$9231,024 million and Ch$0 million, respectively (Ch$1,214 million and Ch$01,274 million as of December 31, 2017)2019), which are included in “Provisions” in the Audited Consolidated Statements of Financial Position as provisions for contingencies.
Dividends and dividend policy
See “Item 3. Key Information—A. Selected Financial Data—Dividends.”
B. Significant Changes
None.
ITEM 9. THE9.THE OFFER AND LISTING
A. Plan of Distribution
Not applicable
B. Nature of Trading Market
Nature of Trading Market
Shares of our common stock are traded on the Chilean Stock Exchange. Each ADS represents 400 shares of common stock. ADRs have been issued pursuant to the amended and restated deposit agreement dated as of August 4, 2015. As of December 31, 2018, 66,215,0002020, 56,126,679 ADSs were outstanding (equivalentequivalent to 326,486,000,07122,450,671,671 shares of common stock or 14.05%11.91% of the total number of issued shares of common stock).stock.
C. Selling Shareholders
Not applicable.
Not applicable.
Not applicable.
D. Dilution
Not applicable.
160
E. Expenses of the Issue
Not applicable.
ITEM 10. ADDITIONAL INFORMATION
A. Share Capital
Not applicable.
B. Memorandum and Articles of Association
The legal predecessor of Santander-Chile was Banco Santiago (“Santiago”). Santiago was incorporated by public deed dated September 7, 1977 granted at the Notary Office of Alfredo Astaburuaga Gálvez. Santiago received its permission to incorporate and function as a bank by Resolution No. 118 of the SBIF on October 27, 1977. The Bank’s by-laws were approved by Resolution No. 103 of the SBIF on September 22, 1977. In January 1997, Santiago merged with Banco O’Higgins, with Santiago as the surviving entity. In 1999, Santiago became a controlled subsidiary of Santander Spain. On January 9, 2017 in an Extraordinary Shareholder Meeting, the shareholders’ approved an amendment of the Bank’s Articles of Incorporation.
Our official name is Banco Santander-Chile and Banco Santander and Santander can also be used (formerly Banco Santander Santiago, Santander Santiago could also be used, but these names were eliminated in the new Articles of Incorporation).
The Bank has a single series of capital stock, which amounts to Ch$891,302,881,691, divided into 188,446,126,794 registered shares with no par value. The capital stock is fully subscribed for, deposited, and paid up. Each share represents one vote and there are no special classes of shares with different rights. Our by-laws do not include any condition that is more significant than required by law to change the right of shareholders.
Shareholder rights in a Chilean bank that is also an open stock (public) corporation are governed by (1) the corporation’sestatutos, which effectively serve the purpose of both the articles or certificate of incorporation and the by-laws of a company incorporated in the United States, (2) the General Banking Law and (3) to the extent not inconsistent with the General Banking Law, by the provisions of Chilean Companies Law applicable to open stock corporations, except for certain provisions that are expressly excluded. Article 137 of the Chilean Companies Law provides that all provisions of the Chilean Companies Law take precedence over any contrary provision in a corporation’sestatutos. Both the Chilean Companies Law and ourestatutos provide that legal actions by shareholders against us (or our officers or directors) to enforce their rights as shareholders or by one shareholder against another in their capacity as such are to be brought in Chile in arbitration proceedings.
The Chilean securities markets are principally regulated by the FMC under the Chilean Securities Market Law and the Chilean Companies Law. In the case of banks, compliance with these laws is supervised by the SBIF. These two laws provide for disclosure requirements, restrictions on insider trading and price manipulation and protection of non-controlling investors. The Chilean Securities Market Law sets forth requirements relating to public offerings, stock exchanges and brokers, and outlines disclosure requirements for companies that issue publicly offered securities. The Chilean Companies Law sets forth the rules and requirements for establishing open stock corporations while eliminating government supervision of closed (closely-held) corporations. Open stock (public) corporations are those with 500 or more shareholders, or companies in which 100 or more shareholders own at least 10.0% of the subscribed capital (excluding those whose individual holdings exceed 10.0%), and all other companies that are registered in the Securities Registry of the FMC.
Santander-Chile is a bank providing a broad range of commercial and retail banking services, as well as a variety of financial services. Our objects and purposes can be found in Article 4 of our by-laws.
Board of Directors and Managers
Currently, the Board of Directors consists of nine directors and two alternates, elected by shareholder vote at Ordinary Shareholders’ Meetings. As a result of the resignation of Andreu Plaza López on March 12, 2019, the Board of Directors currently has one vacancy. The directors may be either shareholders or non-shareholders of the Company. There is no age limit for directors. On October 27, 2016, the SBIF authorized a reduction in the number of Board members from 11 to nine. This reduction and the corresponding amendment to Article 14 of the by-laws was approved by the shareholders at an Extraordinary Shareholders’ Meeting held on January 9, 2017 and entered into force at the Ordinary Shareholders’ Meeting, which took place on April 26, 2017. The directors may be shareholders or persons who are not members of the company.
161
The directors shall hold office for three years and may be indefinitely re-elected, and their terms of office shall be renewed in their entirety at the conclusion of each term of office. If the Ordinary Shareholders’ Meeting at which periodic elections of directors occur is not held at the stipulated time for any reason, the incumbency of those who have completed their terms shall be understood to be extended until their replacements are appointed, and the Board shall be obligated to summon a Shareholders’ Meeting to make said appointments within thirty days.
The directors shall be compensated for their service. The amount of their compensation shall be fixed annually at the Ordinary Shareholders’ Meeting. Such compensation shall be in addition to any salaries, fees, travel expenses, representation expenses, payments due as delegates of the Board, or other stipends in money, kind, or royalties of any class, whether assigned to particular directors at the Ordinary Shareholders’ Meeting or by Board approval, for specific functions or work above and beyond their obligations as directors which have been entrusted to them precisely at the Ordinary Shareholders’ Meeting or by the Board. A detailed and separate record of these special compensations must be made in the Annual Report, indicating the full name of each director who has received them.
Without prejudice to other legal disqualifications or conflicts of interest, the following persons cannot serve as directors: (a) a person who has been convicted or is on trial for crimes penalized with a principal or accessory penalty of temporary suspension or permanent disqualification to hold public positions or offices; (b) a debtor subject to a pending insolvency procedure for liquidation, (c) legislators; (d) directors or employees of any other financial institution; (e) employees of the Office of the President of Chile or employees or officials of the Treasury or of the Services, Fiscal or Semi-Fiscal Institutions, Autonomous Agencies, State-Owned Enterprises, and generally all the Public Services created by law, as well as those of companies, partnerships, or public or private entities to which the State or its companies, partnerships, or centralized or decentralized institutions have contributed the majority capital or a proportion equal thereto, or have a similar representation or participation, provided that the limitation prescribed in this letter (e) shall not apply to persons who hold teaching positions; and (f) Bank employees.
In the elections of directors, each shareholder shall have one vote per share held or represented, and may cast all such votes in favor a single candidate or distribute them as deemed convenient; those who receive the largest number of votes in an election shall be proclaimed as elected, until the number of persons to be elected is reached. Elections of principal and alternate directors must be held separately. To proceed to a vote, the Chairman and the Secretary, jointly with the persons who have previously been designated at the Ordinary Shareholders’ Meeting to sign the minutes thereof, must make a documentary record of the votes which are cast through voice vote by the shareholders present, according to the list of attendance. However, any shareholder shall be entitled to vote on a ballot signed by him, stating whether he signs on his own behalf or as a proxy. In any event, to facilitate the casting or speed of a vote, the Chairman of the Bank or the Superintendency,FMC, if applicable, may order an alternative procedure or permit either a voice vote or a ballot vote, or any other procedure stipulated as adequate for the purpose. In counting the results, the Chairman shall read out the votes cast aloud so that all the persons present can count the votes themselves and the truthfulness of the result can be verified. The Secretary shall add up the votes and the Chairman shall announce the candidates that receive the largest majorities and proclaim them thereby elected, until the number of persons to be elected is reached. The Secretary shall place the document reflecting the vote count, signed by the persons responsible for taking note of the votes cast, as well as the ballots delivered by the shareholders who did not vote by voice, in an envelope which shall be closed and sealed with the corporate seal, and shall be kept on file at the Bank for at least two years.
Every election to the Board, or every change to the composition of the Board, must be recorded in a public deed executed before a Notary, published in a Santiago newspaper, and reported to the SBIFFMC by sending an authorized copy of the respective public deed. The appointments of the General Manager and Assistant Deputy Manager must likewise be reported and converted into a public deed.
Vacancies that arise when a director ceases to be able to perform his or her duties, either because he becomes subject to any conflict of interest, limitation, or legal disqualification or because he is subject to a pending insolvency procedure for liquidation, or due to impossibility of serving, unjustified absence, death, resignation, or for another legal cause, shall be filled in the following manner: (a) vacancies of principal directors by alternate directors; and (b) in case of vacancies of alternate directors because of the application or circumstances not provided for in letter (a) above, or vacancies of principal directors which could not be filled as provided for in this letter because the alternate directors have become principal directors, the appropriate replacements shall be appointed at the first board of directors meeting to be held. The directors so designated shall remain in office until the next Ordinary Shareholders’ Meeting, at which the definitive appointments shall be made for the time remaining to complete the replaced directors’ terms.
162
The alternate directors may always take part in a Board meetingsmeeting and have the right to speak at any such meeting. However, they shall have the right to vote only when they replace a principal director.
The Board shall separately elect a Chairman, a First Vice Chairman, and a Second Vice Chairman from among its members at the first meeting held after the Shareholders’ Meeting has appointed it or at its first meeting held after the persons in question have ceased to hold the position for any reason. In case of a tie vote, the person who chairs the meeting shall have the tie-breaking vote.
The Board shall appoint a General Manager who is responsible for the management of the Bank’s business and represents the Bank in all its offices. The General Manager has the right to participate in discussions at Board meetings but may not vote at such meetings. The Board shall also appoint one or more Managers who are responsible for the transactions and business of the Bank at the offices, branch offices, divisions and services placed under their management. The Directors, Managers and other employees of the Bank shall be personally responsible for non-compliance with the Bank’s by-laws and other legal or regulatory provisions arising from the performance of their duties, and liable for such infringements which are effectedaffected with their knowledge.
The Board meetings shall be held at the company’s domicile unless the directors unanimously resolve to hold a particular session at a different location, or all the directors participate in any such meeting held at a different location. The Board shall meet in ordinary session at least once a month, on the days and at the times the Board designates, and additionally, in extraordinary sessions from time to time when summoned by the Chairman at his or her own initiative or at the request of three or more directors, following the Chairman’s determination of the need for a meeting, unless it is requested by an absolute majority of the incumbent directors, in which case the meeting must necessarily be held without the need for a prior determination. Only the topics specifically stated in the notice of meeting may be addressed at extraordinary meetings, unless all the incumbent directors are present, and they unanimously agree otherwise. Summonses to extraordinary meetings shall be made in accordance with and in the form prescribed by law.
The quorum for Board meetings shall be the absolute majority of the number of directors entitled to vote as prescribed in our by-laws. Resolutions shall be adopted by the absolute majority of the directors present who are entitled to vote. In case of a tie vote, the person who chairs the meeting shall have the tie-breaking vote. Directors who, though not present, are in simultaneous and permanent communication through technological means which have been authorized by the SBIFFMC shall be understood to participate in the meetings.
Directors who have an interest in a business dealing, legal act, contract, or operation or transaction not specifically of a banking nature, or as representatives of another person, must inform the other directors thereof. The respective resolutions shall be approved by the Board and must be in accordance with conditions of equity similar to those customarily prevailing in the market and they shall be disclosed at the next Ordinary Shareholders’ Meeting by the person who chairs such meeting.
A record of the Board’s deliberations and resolutions shall be made in a special minute book to be kept by the Secretary. The minutes must be consecutively numbered, with one numbering sequence assigned to ordinary meetings and another to extraordinary meetings, and they must be signed by the directors who took part in the meeting and the Secretary or the person who performs his or her functions. A director who believes certain minutes contain inaccuracies or omissions is entitled to record his or her reservations prior to signing them. Resolutions may be carried out without the need to approve the minutes at a subsequent meeting. If any of the persons present dies, refuses to sign the minutes, or is prevented from doing so for any reason, a record of said impediment shall be made at the foot thereof.
The directors shall be personally responsible or liable for all the legal acts they execute in the performance of their functions. A director who wishes to avoid responsibility or liability for any legal act or resolution of the Board must make a record of his or her opposition in the minutes and the Chairman shall be informed thereof at the next Ordinary Shareholders’ Meeting.
163
The Board shall represent the Bank judicially and extra-judicially and for the pursuit of its corporate purpose, which need not be demonstrated to third parties in any manner; it shall be vested with all the authorities and powers of administration that the law or the by-laws do not define as pertaining exclusively to Shareholders’ Meetings, without the need to confer any special power of attorney whatsoever, even for legal acts or contracts for which the laws so require. The foregoing does not impair the Bank’s judicial representation by the General Manager. The Board may delegate part of its powers to the General Manager, to one or more managers, assistant managers, or attorneys of the Bank, to a director, or to a committee of Directors, as well as to other persons for specific purposes.
The Board shall designate three Directors from among its members to serve on a committee of DirectorsComité de Directores (Audit Committee) which shall be governed by the provisions of Article 50bis of the Chilean Companies Law.
The Chairman/President
The Chairman of the Board shall likewise be the president of the company and the chairman of the Shareholders’ Meetings. He shall have the following obligations and authorities, in addition to those prescribed in the pertinent legal and regulatory provisions, in our by-laws, or by the Board: (a) chair the Board and Shareholders’ Meetings; (b) enforce strict compliance with the by-laws, the Board’s resolutions, and the resolutions of the Shareholders’ Meetings; (c) summon the Board meetings; and (d) sign the annual reports and the resolutions and communications of the Board and the Shareholders’ Meetings. In the absence or temporary impediment of the Chairman/President, the First Vice Chairman/First Vice President shall act in his or her stead, and in the latter’s absence, the Second Vice Chairman/Second Vice President shall act, or finally, the person designated by the Board from among its members or the shareholder designated at the Shareholders’ Meeting, as the case may be. Replacement is an internal company procedure that shall not require any formality, and it shall not be necessary to demonstrate its validity to third parties in order to assure the validity of the replacement’s actions; the sole fact of its occurrence suffices to make said actions effective.
Meetings and Voting Rights
The shareholders shall meet in Ordinary or Extraordinary Shareholders’ Meetings held in Santiago. The resolutions adopted at a validly summoned and convened Shareholders’ Meeting, in conformity with the by-laws, shall be binding on all of the shareholders.
The Ordinary Shareholders’ Meetings shall be held annually on the dates determined by the Board within the first four months following the date of the annual balance sheet. There shall be an Extraordinary Shareholders’ Meeting whenever the company’s needs so require. The meetings shall be summoned by the Board at its own initiative or at the request of shareholders representing at least 10% of the issued shares having a legal right to vote. If in this circumstance, the Board, and through it the Chairman, refuses to issue a summons, the Superintendent of Banks and Financial InstitutionsFMC may be requested to do so.
The summons to a Shareholders’ Meeting shall be given through a prominent notice to be published three times on different days in the Santiago newspaper which has been chosen at the Ordinary Shareholders’ Meeting, and in the absence of agreement or in the event of a suspension or disappearance of the designated newspaper’s circulation, in the Official Journal, at the time, in the form, and under the conditions stipulated by the Regulations of the Chilean Companies Law. Summonses to Extraordinary Shareholders’ Meetings shall state the topics which will be submitted to them. The summons to a meeting shall likewise be announced through a letter sent to the shareholders a minimum of fifteen days in advance of the date set for the meeting, which must contain a reference to the topics to be addressed at it. Failure to send said letter shall not invalidate the summons, without prejudice to legal liabilities. On a date no later than that of the first notice of a summons for an Ordinary Shareholders’ Meeting, each shareholder must be sent a copy of the Bank’s Annual Report and Balance Sheet, including the auditors’ opinion and its respective notes.
Quorum for Shareholders’ Meetings shall be established by the presence of as many shareholders as represent, directly or by proxy, at least an absolute majority of the issued voting shares. If said quorum is not satisfied, a new summons shall be given, for a meeting which must be scheduled to be held in the manner prescribed in Article 37 of our by-laws, indicating that it is a second summons and scheduling the new meeting to be held within the forty five days subsequent to the date scheduled for the meeting that was not held due to a lack of quorum. A meeting called by a second summons shall lawfully convene with the number of issued voting shares present or represented thereat.
164
In the absence of a special rule, a Shareholders’ Meeting resolution shall be adopted by an absolute majority of the voting shares present or represented.
The Ordinary Shareholders’ Meetings have the following responsibilities: (a) deliberate and resolve on the Annual Report and Balance Sheet which must be submitted by the Board; (b) annually designate an external auditing firm in conformity with the provisions of law to report on the balance sheet and comply with the legal requirements; (c) elect the members of the Board when appropriate pursuant to our by-laws; (d) resolve the distribution of the liquid profits or earnings for each fiscal year, and at the Board’s request, order the distribution of a dividend to the shareholders as of the end of each fiscal year, as prescribed in the by-laws; and (e) in general, deliberate and pass resolutions on any other topic of corporate interest which is not reserved to an Extraordinary Shareholders’ Meeting. The revocation of all the Board members elected by the shareholders and the designation of their replacements may be resolved at an Ordinary or Extraordinary Shareholders’ Meeting, but any individual or collective revocation of one or more Board members would accordingly be invalid.
The Extraordinary Shareholders’ Meetings are reserved for certain topics indicated by law or by our by-laws. Resolutions on the topics indicated in the notice of meeting may be adopted at Extraordinary Shareholders’ Meetings.
The shareholders may have themselves represented at Meetings by another person, whether a shareholder or not, as is stipulated in the Chilean Companies Law.
A record of the deliberations and resolutions at any Shareholders’ Meeting shall be made in a special minute book to be kept by the Secretary, if any, or in his or her absence by the Bank’s General Manager. The minutes shall be signed by the Chairman or the person who performs his or her functions, by the Secretary and three shareholders elected by the Meeting, or by all the persons present if they number fewer than three. In the event of death, refusal, or impediment to signing the minutes on the part of any of the persons who must do so, a record of the impediment shall be made at the foot thereof. An extract of the minutes shall be made to record what happened at the meeting, and an official copy of the following data shall necessarily be made: the names of the shareholders present and the number of shares owned or represented by each of them (a brief summary of any objections may be omitted if it is attached to the same page or roll of attendance), a list of the proposals submitted for discussion and the results of the votes taken, and the list of the shareholders who voted for or against. Solely by the unanimous consent of the persons present may a record of any event occurring at the meeting that is related to the company’s interests be deleted from the minutes.
The persons present at any Shareholders’ Meetings shall sign a roll of attendance on which they shall indicate the number of shares the signatory holds, the number of shares he represents, and the name of the shareholder he represents.
In general, Chilean law does not require a Chilean open stock corporation to provide the level and type of information that U.S. securities laws require a reporting company to provide to its shareholders in connection with a solicitation of proxies. However, shareholders are entitled to examine the books of the bank within the 15-day period before the ordinary annual meeting. In addition to these requirements, we regularly provide, and management currently intends to continue to provide, together with the notice of shareholders’ meeting, a proposal for the final annual dividend.
Annual Report, Balance Sheet, and Distribution of Profits
A Balance Sheet shall be drawn up as of the thirty-first day of December of each year, to be submitted to the Ordinary Shareholders’ Meeting for its consideration, jointly with the Annual Report. The Balance Sheet and Statement of Income shall be published in conformity with the currently applicable legal and regulatory provisions. The approval or rejection of such financial statements is entirely within our shareholders’ discretion. If our shareholders reject our financial statements, our Board of Directors must submit new financial statements not later than 60 days from the date of such rejection. If our shareholders reject our new financial statements, our entire Board of Directors is deemed removed from office and a new Board of Directors is elected at the same meeting. Directors who individually approved such rejected financial statements are disqualified for re-election for the ensuing period.
165
The profits attributable to shareholders reflected in the Balance Sheet shall be applied preferentially to absorb prior-year losses. The balance which is earned shall be allocated as may be resolved by the Shareholders’ Meeting, at the Board’s recommendation, to: (a) an increase of the effective capital, the formation of a fund for future capitalizations or dividends, or other special reserve funds; these uses shall receive the amounts the Meeting deems convenient, in conformity with the limits and obligations prescribed by law; and (b) the distribution of dividends to the shareholders in proportion to their shareholdings.
Under the Chilean Corporations Law, Chilean companies are generally required to distribute at least 30.0% of their earnings as dividends. No dividends of a bank above the legal minimum can be distributed if doing so would result in the bank exceedinginfringing its ratio of regulatory capital to risk-weighted assets and shareholders’ equity to regulatory capital or total assets.
Dividends that are declared but not paid by the date set for payment at the time of declaration are adjusted from the date set for payment to the date such dividends are actually paid, and they accrue interest.
We may declare a dividend in cash or in shares. When a share dividend is declared above the legal minimum (which minimum must be paid in cash), our shareholders must be given the option to elect to receive cash. Our ADS holders may, in the absence of an effective registration statement under the Securities Act or an available exemption from the registration requirement thereunder, effectively be required to receive a dividend in cash. See “Item 10.B.—Memorandum and Articles of Association—Preemptive Rights and Increases of Share Capital.” A dividend entitlement lapses after 5 years and the funds go to the Chilean Treasury.
Liquidation and Appraisal Rights
The Bank may be dissolved and liquidated if it is so resolved at an Extraordinary Shareholders’ Meeting, with the favorable vote of at least two thirds of the issued voting shares, and approved by the Superintendent of Banks and Financial Institutions.
Once the voluntary dissolution to which the preceding article refers has been resolved, the Shareholders’ Meeting at which it is resolved shall appoint a committee of three shareholders to proceed to the company’s liquidation. The liquidating committee so created shall act with the powers and obligations which the by-laws confer on the Board, and it shall keep the shareholders informed of the liquidation’s progress, shall summon Ordinary Shareholders’ Meetings on the dates scheduled for them, being authorized to likewise summon Extraordinary Shareholders’ Meetings. In all other respects the provisions of the Commercial Code, the applicable provisions of the Chilean Companies Law, and the corporate regulations which govern the company shall be followed. In accordance with the General Banking Law, our shareholders do not have appraisal rights.
Arbitration
Any difficulty which may arise between the Bank and any of the shareholders or directors, or between such persons, in connection with the application of the by-laws or the recognition of the existence, nonexistence, validity, nullity, construction, performance or breach, dissolution, liquidation, or any other cause shall be submitted to resolution by two arbitrators at law and in equity, who shall rule without subsequent appeal, one of whom shall be appointed by each party. If they cannot reach agreement, the parties shall appoint a third arbitrator to resolve the discord. If there is no agreement for the third arbitrator’s appointment, the two previously appointed arbitrators shall make the designation. If either party refuses to participate in the appointment of arbitrators or, after they have been appointed, there is no agreement on the ruling and neither the parties nor the arbitrators have designated the third arbitrator to resolve the discord, the designation of said arbitrator, if any, or of the third participant in discord, shall be made by the Ordinary Court of Justice, and the person so designated must necessarily be one who has held or currently holds the position of attorney and member of the Honorable Supreme Court.
Capitalization
Under Chilean law, the shareholders of a company, acting at an extraordinary shareholders’ meeting, have the power to authorize an increase in such company’s capital. When an investor subscribes for issued shares, the shares are registered in such investor’s name, even if not paid for, and the investor is treated as a shareholder for all purposes except with regard to receipt of dividends and the return of capital, provided that the shareholders may, by amending the by-laws, also grant the right to receive dividends or distributions of capital. The investor becomes eligible to receive dividends and returns of capital once it has paid for the shares (if it has paid for only a portion of such shares, it is entitled to reserve a corresponding pro-rata portion of the dividends declared and/or returns of capital with respect to such shares unless the company’s by-laws provide otherwise). If an investor does not pay for shares for which it has subscribed on or prior to the date agreed upon for payment, the company is entitled under Chilean law to auction the shares on the stock exchange and collect the difference, if any, between the subscription price and the auction proceeds. However, until such shares are sold at auction, the subscriber continues to exercise all the rights of a shareholder (except the right to receive dividends and return of capital).
Article 22 of the Chilean Corporations Law states that the purchaser of shares of a company implicitly accepts its by-laws and any agreements adopted at shareholders’ meetings.
166
Registrations and Transfers
We act as our own registrar and transfer agent, as is customary among Chilean companies. In the case of jointly owned shares, an attorney-in-fact must be appointed to represent the joint owners in dealings with us.
Ownership Restrictions
Under Article 12 of the Chilean Securities Market Law and the regulations of the SBIF,FMC, shareholders of open stock corporations are required to report the following to the FMC and the Chilean stock exchanges:
| any direct or indirect acquisition or sale of shares that results in the holder’s acquiring or disposing, directly or indirectly, 10.0% or more of an open stock corporation’s share capital; and |
| any direct or indirect acquisition or sale of shares or options to buy or sell shares, in any amount, if made by a holder of 10.0% or more of an open stock corporation’s capital or if made by a director, liquidator, main officer, general manager or manager of such corporation. |
In addition, majority shareholders must include in their report whether their purpose is to acquire control of the company or if they are making a financial investment. A beneficial owner of ADSs representing 10.0% or more of our share capital will be subject to these reporting requirements under Chilean law.
Under Article 54 of the Chilean Securities Market Law and the regulations of the FMC, persons or entities intending to acquire control, directly or indirectly, of an open stock corporation, regardless of the acquisition vehicle or procedure, and including acquisitions made through direct subscriptions or private transactions, are also required to inform the public of such acquisition at least 10 business days before the date on which the transaction is to be completed, but in any case, as soon as negotiations regarding the change of control begin (i.e., when information and documents concerning the target are delivered to the potential acquirer) through a filing with the FMC, the stock exchanges and the companies controlled by and that control the target and through a notice published in two Chilean newspapers, which notice must disclose, among other information, the person or entity purchasing or selling and the price and conditions of any negotiations.
Prior to such publication, a written communication to such effect must be sent to the target corporation, to the controlling corporation, to the corporations controlled by the target corporation, to the FMC, and to the Chilean stock exchanges on which the securities are listed.
In addition to the foregoing, Article 54A of the Chilean Securities Market Law requires that within two business days of the completion of the transactions pursuant to which a person has acquired control of a publicly traded company, a notice shall be published in the same newspapers in which the notice referred to above was published and notices shall be sent to the same persons mentioned in the preceding paragraphs.
The provisions of the aforementioned articles do not apply whenever the acquisition is being made through a tender or exchange offer.
Title XXV of the Chilean Securities Market Law on tender offers and the regulations of the Superintendency of Securities and Insurance (now the FMC)FMC provide that the following transactions must be carried out through a tender offer:
167
| an offer which allows a person to take control of a publicly traded company, unless (i) the shares are being sold by a controlling shareholder of such company at a price in cash which is not substantially higher than the market price and the shares of such company are actively traded on a stock exchange and (ii) those shares are acquired (a) through a capital increase, (b) as a consequence of a merger, (c) by inheritance or (d) through a forced sale; and |
| an offer for a controlling percentage of the shares of a listed company if such person intends to take control of the parent company (whether listed or not) of such listed company, to the extent that the listed company represents 75.0% or more of the consolidated net worth of the parent company. |
In addition, Article 199 of the Chilean Securities Market Law requires that whenever a controlling shareholder acquires two thirds of the voting shares of a listed company, such controlling shareholder must offer to purchase the remaining shares from the non-controlling shareholders in a tender offer.
Article 200 of the Chilean Securities Market Law prohibits any shareholder that has taken control of a publicly traded company to acquire, for a period of 12 months from the date of the transaction in which it gained control of the publicly traded company, a number of shares equal to or greater than 3.0% of the outstanding issued shares of the target without making a tender offer at a price per share not lower than the price paid at the time of taking control. Should the acquisition from the other shareholders of the company be made on a stock exchange and on a pro rata basis, the controlling shareholder may purchase a higher percentage of shares, if so permitted by the regulations of the stock exchange.
Title XV of the Chilean Securities Market Law sets forth the basis to determine what constitutes a controlling power, a direct holding and a related party. The Chilean Securities Market Law defines control as the power of a person or group of persons acting (either directly or through other entities or persons) pursuant to a joint action agreement, to direct the majority of the votes at the shareholders’ meetings of the corporation, to elect the majority of members of its Board of Directors, or to influence the management of the corporation significantly. Significant influence is deemed to exist in respect of the person or group of persons with an agreement to act jointly that holds, directly or indirectly, at least 25.0% of the voting share capital, unless:
| another person or group of persons acting pursuant to joint action agreement, directly or indirectly, controls a stake equal to or greater than the percentage controlled by such person or group of persons; |
| the person or group does not control, directly or indirectly, more than 40.0% of the voting share capital and the percentage controlled is lower than the sum of the shares held by other shareholders holding more than 5.0% of the share capital (either directly or pursuant to a joint action agreement); or |
| in cases where the Superintendency of Securities and Insurance (now the FMC) has ruled otherwise, based on the distribution or atomization of the overall shareholding. |
According to the Chilean Securities Market Law, a joint action agreement is an agreement among two or more parties which, directly or indirectly, own shares in a corporation at the same time and whereby they agree to participate with the same interest in the management of the corporation or in taking control of the same. The law presumes that such an agreement exists between:
| a principal and its agents; |
| spouses and relatives within certain degrees of kinship; |
| entities within the same business group; and |
| an entity and its controller or any of the members of the controller. |
Likewise, the FMC may determine that a joint action agreement exists between two or more entities considering, among other things, the number of companies in which they participate and the frequency with which they vote identically in the election of directors, appointment of managers and other resolutions passed at extraordinary shareholders’ meetings.
168
According to Article 96 of the Chilean Securities Market Law, a business group is a group of entities with such ties in their ownership, management or credit liabilities that it may be assumed that the economic and financial action of such members is directed by, or subordinated to, the joint interests of the group, or that there are common credit risks in the credits granted to, or in the acquisition of securities issued by, them. According to the Chilean Securities Market Law, the following entities are part of the same business group:
| a company and its controller; |
| all the companies with a common controller together with that controller; |
| all the entities that the FMC declares to be part of the business group due to one or more of the following reasons: |
| a substantial part of the assets of the company is involved in the business group, whether as investments in securities, equity rights, loans or guaranties; |
| the company has a significant level of indebtedness and the business group has a material participation as a lender or guarantor; |
| any member of a group of controlling entities of a company mentioned in the first two bullets above and there are grounds to include it in the business group; or |
| the company is controlled by a member of a group of controlling entities and there are grounds to include it in the business group. |
Article 36 of the General Banking Law states that as a matter of public policy, no person or company may acquire, directly or indirectly, more than 10.0% of the shares of a bank without the prior authorization of the FMC, which may not be unreasonably withheld. The prohibition would also apply to beneficial owners of ADSs. In the absence of such authorization, any person or group of persons acting in concert would not be permitted to exercise voting rights with respect to the shares or ADSs acquired. In determining whether or not to issue such an authorization, the FMC considers a number of factors enumerated in Article 28 of the General Banking Law, including, among others (i) the financial stability of the purchasing party and (ii) the legitimacy of the purchasing party.
According to Article 35bis of the General Banking Law, the prior authorization of the FMC is required for:
| the merger of two or more banks; |
| the acquisition of all or a substantial portion of a banks’ assets and liabilities by another bank; |
| the control by the same person, or controlling group, of two or more banks; or |
| a substantial increase in the existing control of a bank by a controlling shareholder of that bank. |
The FMC may deny its authorization with an accompanying resolution recording the specific reasons for denying the authorization and with the agreement of a majority of the Board of Directors of the Central Bank, provided there is notice of such agreement within 10 banking business days (which may be extended under Law 18,840).
According to the General Banking Law, a bank may not grant loans to related parties on terms more favorable than those generally offered to non-related parties. Article 84 No. 2 of the New General Banking Law provides that the FMC will determine, by means of a general rule, who must be considered a related party of the bank. In addition, the FMC will establish rules to determine if certain persons constitute a group of related parties in one or more of the following circumstances: (i) business or administrative relationships that allow a person to exercise relevant and permanent influence over another’s decisions; (ii) an assumption will be made that the loans granted to one person will be used in benefit of the other; and (iii) an assumption will be made that diverse persons maintain relationships that create a unit of economic interests. Finally, according to the regulations of the SBIF,FMC, Chilean banks that issue ADSs are required to inform the SBIFFMC if any person, directly or indirectly, acquires ADSs representing 5.0% or more of the total amount of shares of capital stock issued by such bank.
169
Article 16bis of the General Banking Law provides that the individuals or legal entities that, individually or with other people, directly control a bank and who individually own more than 10.0% of its shares must send to the FMC reliable information on their financial situation with the content and in the opportunity set forth in a general rule issued by the FMC, which will not exceed the information required for open-stock corporations (sociedad anónima abierta).
There are no limitations for non-resident or foreign shareholders to hold or exercise voting rights on the securities.
Preemptive Rights and Increases of Share Capital
The Chilean Corporations Law provides that whenever a Chilean company issues new shares for cash, it must offer its existing shareholders the right to purchase a number of shares sufficient to maintain their existing ownership percentages in the company. According to our by-laws, options for subscription of capital increases must be offered on a preemptive basis to the shareholders, in proportion to the number of shares each shareholder owns, and the released shares which are issued shall be distributed in the same proportion.
Pursuant to this requirement, preemptive rights in connection with any future issue of shares will be offered by us to the Depositary as the registered owner of the shares underlying the ADRs. However, the Depositary will not be able to make such preemptive rights available to holders of ADSs unless a registration statement under the Securities Act is effective with respect to the underlying shares or an exemption from the registration requirements thereunder is available.
We intend to evaluate, at the time of any preemptive rights offering, the practicality under Chilean law and Central Bank regulations in effect at the time of making such rights available to our ADS holders, as well as the costs and potential liabilities associated with registration of such rights and the related shares of common stock under the Securities Act, and the indirect benefits to us of thereby enabling the exercise by all or certain holders of ADSs of their preemptive rights and any other factors we consider appropriate at the time, and then to make a decision as to whether to file such registration statement. We cannot assure you that any registration statement would be filed. If we do not file a registration statement and no exemption from the registration requirements under the Securities Act is available, the Depositary will sell such holders’ preemptive rights and distribute the proceeds thereof if a premium can be recognized over the cost of such sale. In the event that the Depositary is not able, or determines that it is not feasible, to sell such rights at a premium over the cost of any such sale, all or certain holders of ADSs may receive no value for such rights. Non-U.S. holders of ADSs may be able to exercise their preemptive rights regardless of whether a registration statement is filed. The inability of all or certain holders of ADSs to exercise preemptive rights in respect of shares of common stock underlying such ADSs could result in such holders not maintaining their percentage ownership of the common stock following such preemptive rights offering unless such holder made additional market purchases of ADSs or shares of common stock.
Under Chilean law, preemptive rights are exercisable or freely transferable by shareholders during a period that cannot be less than 30 days following the grant of such rights. During such period, and for an additional 30-day period thereafter, a Chilean corporation is not permitted to offer any unsubscribed shares for sale to third parties on terms which are more favorable than those offered to its shareholders. At the end of such additional 30-day period, a Chilean open stock corporation is authorized to sell unsubscribed shares to third parties on any terms, provided they are sold on a Chilean stock exchange. Unsubscribed shares that are not sold on a Chilean stock exchange can be sold to third parties only on terms no more favorable for the purchaser than those offered to shareholders.
C. Material Contracts
During the past two years, we were not a party to any material contract outside the ordinary course of business.
D. Exchange Controls
The Central Bank is responsible for, among other things, monetary policies and exchange controls in Chile. Appropriate registration of a foreign investment in Chile grants the investor access to the Formal Exchange Market. See “Item 3. Key Information—A. Selected Financial Data—Exchange Rates.”
170
Foreign investments can be registered with the Foreign Investment Committee under Decree Law No. 600 or can be registered with the Central Bank under the Central Bank Act. The Central Bank Act is an organic constitutional law requiring a “special majority” vote of the Chilean Congress to be amended. Since April 18, 2001, all exchange controls in Chile have been eliminated.
Previously, Chilean law mandated that holders of shares of Chilean companies that were not residents of Chile register as foreign investors under one of the foreign investment regimes contemplated by Chilean law in order to receive dividends, sale proceeds or other amounts with respect to their shares remitted outside Chile through the Formal Exchange Market. Under the Foreign Investment Contract (as defined herein), the Depositary, on behalf of ADS holders, is granted access to the Formal Exchange Market to convert cash dividends from Chilean pesos to U.S. dollars and to pay such U.S. dollars to ADS holders outside Chile, net of taxes, and no separate registration by ADR holders is required. As of April 19, 2001, the Central Bank deregulated the Exchange Market, eliminating the need to obtain approval from the Central Bank in order to remit dividends, but at the same time eliminating the possibility of guaranteeing access to the Formal Exchange Market. However, this did not affect the current Foreign Investment Contract, which was signed prior to April 19, 2001, and which still permits access to the Formal Exchange Market based on the prior approval of the Central Bank. Therefore, the holders of ADRs of Santander-Chile are still subject to the Foreign Investment Contract, including its clauses referring to the prior exchange rules including the now extinct Chapter XXVI of the Compendium.
E. Taxation
The following discussion summarizes certain Chilean tax and United States federal income tax consequences to beneficial owners arising from the ownership and disposition of our common stock or ADSs. The summary does not purport to be a comprehensive description of all potential Chilean and United States federal income tax considerations that may be relevant to a decision to own or dispose of our common stock or ADSs and is not intended as tax advice to any particular investor. This summary does not describe any tax consequences arising under the laws of any state, locality or other taxing jurisdiction other than Chile and the United States. There is currently no income tax treaty between the United States and Chile. However, the U.S. government and the government of Chile signed on February 4, 2010 the Proposed Income Tax Treaty between the United States of America and the Republic of Chile (the “Proposed U.S.-Chile Treaty”), which is now subject to ratification by the U.S. Senate and Chilean Congress. If the Proposed U.S.-Chile Treaty becomes effective, U.S. investors should consult their tax advisers as to the applicability of the treaty in their particular circumstances.
Material Tax Consequences of Owning Shares of Our Common Stock or ADSs
Chilean Taxation
The following is a summary of certain Chilean tax consequences of the ownership and disposition of shares of our common stock or of ADSs evidenced by ADRs by Foreign Holders (as defined herein). The summary does not purport to be a comprehensive description of all of the tax considerations that may be relevant to a decision to own or dispose of shares of our common stock or ADSs and does not purport to address the tax consequences applicable to all categories of investors, some of whom may be subject to special rules. Holders of shares of our common stock or ADSs are advised to consult their tax advisers concerning the Chilean and other tax consequences of the ownership and disposition of shares of our common stock or of ADSs evidenced by ADRs.
The description of Chilean tax laws set forth below is based on Chilean laws in force as of the date of this Annual Report and can be subject to any changes in such laws occurring after the date of this Annual Report. Although it is uncommon, legal changes can be made on a retroactive basis. However, changes in regulations or interpretations held by the Chilean tax authorities may not be used retroactively against taxpayers who acted in good faith relying on such modified regulations or interpretations.
For purposes of this summary, the term “Foreign Holder” means either (1) in the case of an individual, a person who is not resident or domiciled in Chile; or (2) in the case of a legal entity, a legal entity that is not organized under the laws of Chile, unless the shares of our common stock or ADSs are assigned to a branch or a permanent establishment of such entity in Chile. For purposes of Chilean taxation, (a) an individual holder is resident in Chile if he or she has remained in Chile for more than six months in one calendar year, or a totalperiod of more than six months183 days in two consecutive fiscal years,any 12-month period (which need not be consecutive), and (b) an individual is domiciled in Chile if he or she resides in Chile with the actual or presumptive intent of staying in Chile (intention that can be evidenced by circumstances such as the acceptance of an employment in Chile or the relocation to Chile of his or her family).
171
The Income Tax Law provides that a Foreign Holder is subject to income taxes on his or her Chilean-sourced income. For these purposes, Chilean source income means earnings from activities performed within Chilean territory or from sale, disposition or other transactions in connection with assets or goods located in Chile. Indirect sale regulations may also attribute Chilean sourced income.
Taxation of Dividends
Cash dividends paid by us with respect to shares of our common stock held by a Foreign Holder, including shares represented by ADSs, will be subject to a 35% Chilean Withholding Tax (“WHT”), which is withheld, filed and paid over by us.
If we have paid CITCorporate Income Tax (“CIT”) on the income from which the dividend is paid, a credit for the CIT (reduced, in certain circumstances by a related fiscal debit, as described below) effectively reduces the rate of WHT.
When a credit is available, the WHT is computed by applying the 35% rate to the pre-tax amount needed to fund the dividend and then subtracting from the tentative WHT so determined the amount of CIT actually paid on the pre-tax income. For determining the pre-tax amount of the dividend, the CIT credit will depend on the amounts accumulated in the Accumulated Credit Balance (SAC), at the date of withdrawal or distribution.
In general, 35% of CIT paid on the income from which a dividend is paid gives rise to a fiscal debit owed to the Chilean Treasury at the time the dividend distribution is made to a Foreign Holder. Accordingly, a Foreign Holder generally may apply a net credit equal to only 65% of the CIT to reduce WHT.
However, if the Foreign Holder is a resident of a country with which Chile has a Doubletax treaty for the avoidance of double taxation (a “Double Tax TreatyTreaty”) in force, the Foreign Holder may be entitled to apply the entire CIT against WHT otherwise due. Moreover, if the Foreign Holder is a resident of a country with a signed Double Tax Treaty that has not entered into force on January 1, 2017,2020, (as in the case of United States) the Foreign Holder would also be entitled to a 100% CIT credit, without reduction by any related fiscal debit, until December 31, 2021.2026. If at such date the treaty has not entered into force, the Foreign Holder will be subject to the general rules, and hence entitled only to a net credit of 65% of the CIT as described above. In accordance with the above, upon the distribution of profits to Foreign Holders, a 35% WHT applies, and only 65% of the CIT is creditable against such WHT, with the remaining 35% being paid back to the Chilean Treasury; thus, the combined tax rate on profits earned in Chile amounts to 44.45%. However, if the Foreign Holder resides in a country with which Chile has a Double Tax Treaty in force, the full 27% CIT is creditable, resulting in combined tax rate of 35%.
It is worth mentioning that, on February 24, 2020, the “Modernization Tax Law” was enacted and published in the Chilean Official Gazette, after a year and a half of discussion. The original bill went through substantial amendments both in the Chamber of Deputies and in the Senate of the Chilean Congress, incorporating the amendments agreed back in “Tax Agreement” between the Senate’s Finance Commission and the Government.
Regarding the corporate tax system, the Modernization Tax Law sets forth a single partially integrated tax regime, applicable to companies whose annual sales exceed 75,000 UF (approximately USD 2.8 million). Under this single regime, the CIT remains at 27%, which is partially creditable against the final taxation of Foreign Holders, unless they reside in a tax treaty country, in which case the CIT is fully creditable, as explained above.
Another relevant modification that was incorporated in the Modernization Tax Law relates to Foreign Holders that reside in a country with a signed Double Tax Treaty that has not entered into force as of January 1, 2020, (such as in the case of United States). In such case, the Foreign Holders would be entitled to a 100% CIT credit, without deduction, until December 31, 2026. Before the Modernization Tax Law, this tax benefit was effective only until December 31, 2021.
To prove residency in a country with which Chile has a Double Tax Treaty, whether signed or in force, a Foreign Holder must produce a government-issued residence certificate, recognizing the taxpayer as a resident of the corresponding country. Foreign Holders are urged to consult with their tax advisers regarding all requirements to be entitled to the 100% CIT credit.
172
The effective rate of WHT on dividends paid by us will vary depending upon the rate of CIT. In orderapplicable to determine thewithdrawals, remittances or distributions abroad must be determined taking into account an interim CIT credit, available upon dividend distributions, earnings generated duringbased on the current year should be allocated first (at thecorporate tax rate in force duringin the year). Distributions madeyear of the remittance or distribution. Therefore, taxation of the withdrawal, remittance or distribution shall year-end. Any withholding tax difference determined at year-end must: a) be paid in excessthe annual tax return to be declared by the Chilean company in April of currentthe following year earnings wouldor b) be entitledrequested as a refund by the Foreign Holder through an administrative process or through the annual tax return to use as CIT creditbe filed in April of the average rate applied toyear following the accumulated earnings generated from January 1, 2017.distribution of the dividend.
The example below illustrates the effective Chilean WHT burden on a cash dividend received by a Foreign Holder, assuming a WHT rate of 35.0%, a statutory CIT rate of 27.0% and a distribution of all of the net proceeds available after payment of the CIT.
100% Credit available
| 100% Credit available | |||||
| Taxable income | U.S.$100 | ||||
| CIT (27.0% of U.S.$100) | (27.0 | ) | |||
| Net proceeds available | 73.0 | ||||
| Dividend payment | 73.0 | ||||
| Withholding Tax (35.0% of the sum of the dividend (U.S.$73.0) and the available CIT credit (U.S.$27.0)) | 35.0 | ||||
| CIT credit | (27.0 | ) | |||
| Payable WHT | 8.0 | ||||
| Net dividend received | 65 | ||||
| 11.0 | % | ||||
| Effective dividend withholding tax rate | (8.0/73.0 | ) | |||
65% Credit available
| 65% Credit available | |||||
| Taxable income | U.S.$100 | ||||
| CIT (27.0% of U.S.$100) | (27.0 | ) | |||
| Net proceeds available | 73.0 | ||||
| Dividend payment | 73.0 | ||||
| Withholding Tax (35.0% of the sum of the dividend (U.S.$73.0) and the available CIT credit (U.S.$ | 35.0 | ||||
| CIT credit | (27.00 | ) | |||
| CIT | 9.45 | ||||
| Payable WHT | |||||
| Net dividend received | 55.55 | ||||
| 24.0 | % | ||||
| Effective dividend withholding tax rate | (17.45/73.0 | ) | |||
Dividend distributions made in kind would be subject to the same Chilean tax rules as cash dividends.
Stock dividends received by the Foreign Holder are not subject to Chilean taxation.
If the Proposed U.S.-Chile Treaty becomes effective, U.S. investors should consult their tax advisers as to the applicability of the treaty infor their particularown circumstances.
Taxation of Capital Gains
Gain realized on the sale, exchange or other disposition by a Foreign Holder of ADSs will not be subject to Chilean taxation, provided that such sale or disposition occurs outside Chile or that it is performed under the rules of Title XXIV of the Chilean Securities Market Law, as amended by Law No. 19,601, dated January 18, 1999. The deposit and withdrawal of shares of common stock in exchange for ADSs will not be subject to any Chilean taxes.
173
Gain recognized on a sale or exchange of shares of common stock (as distinguished from sales or exchanges of ADSs representing such shares of common stock) by a Foreign Holder to an individual or entity that is not resident or domiciled in Chile will be subject to WHT. This tax must be withheld by the purchaser, with an interim rate of 10.0% of the total price without any deduction, unless the gain subject to taxation can be determined, in which case the withholding will be equal to a 35.0% onof the gain.
Notwithstanding the above, if the seller evidences that no capital gain was generated, the WHT would not be applicable. For tax purposes, the capital gain shall be the difference between the sales price and the acquisition cost of the stock.
The tax basis of shares of common stock received in exchange for ADSs will be the acquisition value of such shares. The valuation procedure set forth in the deposit agreement states that the highest price at which shares of common stock were exchanged on the Santiago Stock Exchange on the date of the exchange generally will determine the acquisition value for this purpose. Consequently, the conversion of ADSs into shares of common stock and sale of such shares of common stock for the value established under the deposit agreement made on the date of the exchange will not generate a capital gain subject to taxation in Chile. In the case where ADSs were exchanged for shares and the subsequent sale of the shares is made on a different day from the one on which the exchange is recorded in the shareholders’ registry of the issuer, capital gains subject to taxation in Chile may be generated, depending on the difference between the acquisition value and the sale price.
On October 1, 1999, the Chilean Internal Revenue Service issued Ruling N°3,708 whereby it allowed Chilean issuers of ADSs to amend the Deposit Agreements in which they are parties in order to include a clause that states that, in the case that the exchanged shares are sold by the ADSs’ holder on a Chilean stock exchange, either on the same day on which the exchange is recorded in the shareholders’ registry of the issuer or within the two prior business days to such date, the acquisition price of such exchanged shares shall be the price registered in the invoice issued by the stock broker that participated in the sale transaction.
Consequently, as we have included this clause in the form of ADRs attached to the deposit agreement, the capital gain that might be generated if the shares received in exchange for ADSs were sold within two days prior to the date on which the exchange is recorded in the shareholders’ registry of the issuer, will not be subject to Chilean taxation. Distribution and exercise of preemptive rights relating to the shares of common stock will not be subject to Chilean taxation.
Cash amounts received in exchange for the shares or assignment of preemptive rights relating to the shares will be subject to both the CIT and the WHT (the former being creditable against the latter to the extent described above).
In certain cases, and provided certain requirements are met, capital gains realized on the sale of actively traded stock of Chilean public companies may be exempt from Chilean income taxes.
Our stock is currently considered to be an actively traded stock in the Santiago Stock Exchange, and Foreign Holders of the stock may qualify for an income tax exemption. Foreign Holders are urged to consult with their own tax advisers to determine whether an exemption applies to them.
If the Proposed U.S.-Chile Double Tax Treaty becomes effective, it may further restrict the amount of Chilean tax, if any, imposed on gains derived from the sale or exchange of shares of common stock by U.S. residents eligible for the benefits of the treaty. U.S. investors should consult their tax advisers as to the applicability of the treaty in their particular circumstances.
Other Chilean Taxes
No Chilean inheritance, donation or succession taxes apply to the transfer or disposition of the ADSs by a Foreign Holder, but such taxes generally will apply to the transfer at death or by donation of shares of our common stock by a Foreign Holder. No Chilean stamp, issue, registration or similar taxes or duties apply to Foreign Holders of shares or ADSs.
Withholding Tax Certificates
Upon request, we will provide to Foreign Holders appropriate documentation evidencing the payment of Withholding Taxes. For further information, the investor should contact: Robert Moreno,irelations@santander.cl. Dividends payable to holders of ADSs are net of foreign currency conversion expenses of the Depositary and will be subject to the Withholding Tax currently at the rate of 35% (subject to credits in certain cases as described above).
174
Tax Modernization Bill
On August 23, 2018, the PresidentTable of Chile sent to the National Congress, Bill No. 107-366 containing the Tax Modernization Project.Contents
Among its changes, this bill proposes a single, fully integrated tax regime with a CIT rate of 27% under which CIT paid would be fully creditable against tax imposed on the shareholder.
If this bill becomes effective, the Attributed Income Regime(Sistema de Renta Atribuida) and the Semi-Integrated Regime(Sistema Parcialmente Integrado)introduced by the previous tax reform would be repealed and taxpayers who, as of December 31, 2018, are subject to the current regimes would be considered as fully entitled to the new general regime as of January 1, 2019.
This bill proposes to restore the integrated CIT regime, where 100% of the taxes paid under the concept of CIT can be used as a credit against WHT. Thus the combined Chilean tax burden for Foreign Holders would be 35% irrespective of whether a Double Tax Treaty is in place with the country of the investor. In other words, by virtue of being entitled to this credit, the residency of the shareholder who receives the dividends will cease to be relevant.
Changes introduced by this bill are not definitive. This project is still in discussion before the Chilean National Congress and cannot be considered as currently in force.
U.S. Federal Income Tax Considerations
The following is a discussion of material U.S. federal income tax consequences of owning and disposing of shares of our common stock or ADSs to U.S. holders described below, but it does not purport to be a comprehensive description of all of the tax considerations that may be relevant to a particular person’s decision to hold such common stock or ADSs. The discussion applies only if you are a U.S. holder holding shares of our common stock or ADSs as capital assets for U.S. federal income tax purposes. It does not address all aspects of U.S. federal income taxation that may be relevant to you in light of your particular circumstances, including the alternative minimum tax and the Medicare contribution tax, nor does it describe all tax consequences that may be relevant to U.S. holders subject to special rules, such as:
| certain financial institutions; |
| insurance companies; |
| dealers and traders in securities who use a mark-to-market method of tax accounting; |
| persons holding shares or ADSs as part of a hedge, “straddle,” conversion transaction, integrated transaction or similar transaction; |
| persons whose functional currency for U.S. federal income tax purposes is not the U.S. dollar; |
| partnerships or other entities classified as partnerships for U.S. federal income tax purposes; |
| tax-exempt entities, including “individual retirement accounts” or “Roth IRAs”; |
| persons holding shares of our common stock or ADSs that own or are deemed to own ten percent or more of the voting power or value of our stock; |
| persons who acquired shares of our common stock or ADSs pursuant to the exercise of any employee stock option plan or otherwise as compensation; or |
| persons whose shares or ADSs are held in connection with a trade or business conducted outside the United States. |
If an entity that is classified as a partnership for U.S. federal income tax purposes owns shares of our common stock or ADSs, the U.S. federal income tax treatment of a partner will generally depend on the status of the partner and upon the activities of the partnership. Partnerships owning shares of our common stock or ADSs and partners in such partnerships should consult their tax advisers as to the particular U.S. federal income tax consequences of owning and disposing of the shares of our common stock or ADSs.
This discussion is based on the Internal Revenue Code of 1986, as amended (the “Code”), administrative pronouncements, judicial decisions and final, temporary and proposed Treasury regulations, all as of the date hereof. These laws are subject to change, possibly on a retroactive basis. It is also based in part on representations by the Depositary and assumes that each obligation under the deposit agreement and any related agreement will be performed in accordance with its terms. In addition, this discussion does not address U.S. state, local and non-U.S. tax consequences. Please consult your tax advisers concerning the U.S. federal, state, local and non-U.S. tax consequences of owning and disposing of shares or ADSs in your particular circumstances.
As used herein, a “U.S. holder” is a person that for U.S. federal income tax purposes is a beneficial owner of shares of our common stock or ADSs and is:
| a citizen or individual resident of the United States; |
175
| a corporation, or other entity taxable as a corporation, created or organized in or under the laws of the United States, a state thereof or the District of Columbia; or |
| an estate or trust the income of which is subject to U.S. federal income taxation regardless of its source. |
In general, if you own ADSs, you will be treated as the owner of the underlying shares represented by those ADSs for U.S. federal income tax purposes. Accordingly, no gain or loss will be recognized if you exchange ADSs for the underlying shares represented by those ADSs.
The U.S. Treasury has expressed concerns that parties to whom American Depositary Shares are released prior to delivery of shares to the Depositary (“pre-release”) or intermediaries in the chain of ownership between U.S. holders of American Depositary Shares and the issuer of the security underlying the American Depositary Shares may be taking actions that are inconsistent with the claiming of foreign tax credits for holders of American Depositary Shares. These actions would also be inconsistent with the claiming of the favorable tax rates, described below, applicable to dividends received by certain non-corporate holders. Accordingly, the creditability of Chilean taxes and the availability of the favorable tax rates for dividends received by certain non-corporate holders, each described below, could be affected by actions that may be taken by such parties or intermediaries.
This discussion assumes that we are not, and will not become, a passive foreign investment company, as described below.
Taxation of Distributions
Distributions paid on shares of our common stock or ADSs, other than certain pro rata distributions of common shares or rights, will be treated as dividends to the extent paid out of our current or accumulated earnings and profits (as determined under U.S. federal income tax principles). Because we do not maintain calculations of our earnings and profits under U.S. federal income tax principles, it is expected that distributions generally will be reported to U.S. holders as dividends. Subject to applicable limitations, and the discussion above regarding concerns expressed by the U.S. Treasury, certain dividends paid by “qualified foreign corporations” to certain non-corporate U.S. holders may be taxable at rates applicable to long-term capital gains. A foreign corporation is treated as a qualified foreign corporation with respect to dividends paid on stock that is readily tradable on a securities market in the United States, such as the NYSE where our ADSs are traded. You should consult your tax advisers to determine whether the favorable rates may apply to dividends you receive and whether you are subject to any special rules that limit your ability to be taxed at thesuch favorable rates. The amount of the dividend will include any amounts withheld by us or our paying agent in respect of Chilean taxes at the effective rate (after credit for CIT) as described above under “ — Material Tax Consequences of Owning Shares of Our Common Stock or ADSs—Taxation of Dividends.” You should consult with your tax adviser to determine the amount considered withheld with respect to a distribution if you are subject to the Attributed Income Regime for Chilean tax purposes, as described above under “—Material Tax Consequences of Owning Shares of Our Common Stock or ADSs—Chilean Taxation.” The amount of the dividend will be treated as foreign-source dividend income to you and will not be eligible for the dividends-received deduction generally allowed to U.S. corporations under the Code.
Dividends will be included in your income on the date of your (or in the case of ADSs, the Depositary’s) receipt of the dividend. The amount of any dividend income paid in Chilean pesos will be the U.S. dollar amount calculated by reference to the exchange rate in effect on the date of receipt regardless of whether the payment is in fact converted into U.S. dollars. If the dividend is converted into U.S. dollars on the date of receipt, you should not be required to recognize foreign currency gain or loss in respect of the dividend income. You may have foreign currency gain or loss if the dividend is converted into U.S. dollars after the date of receipt.
Subject to applicable limitations that may vary depending upon your circumstances, and the discussion above regarding concerns expressed by the U.S. Treasury, Chilean taxes withheld from cash dividends on shares of our common stock or ADSs, reduced by the credit for any CIT, as described above under “—Chilean Taxation—Taxation of Dividends,” generally will be creditable against your U.S. federal income tax liability. If you are subject to the Attributed Income Regime, as described above under “—Material Tax Consequences of Owning Shares of Our Common Stock or ADSs—Chilean Taxation,” amounts paid by you or withheld by us, reduced by the credit for any CIT, may be creditable for U.S. tax purposes. If creditable, it is uncertain whether such tax would be creditable in the year the Chilean tax is imposed, irrespective of whether a distribution is actually made. You should consult your tax adviser concerning the creditability and timing issues pertaining to such tax. If, however, the Proposed U.S.-Chile Treaty becomes effective, any Chilean income taxes withheld from dividends on shares or ADSs in excess of the rate provided by the treaty will not be creditable by a U.S. holder who is eligible for the benefits of the treaty. The rules governing foreign tax credits are complex and you should consult your tax advisers to determine whether you are subject to any special rules that limit your ability to make effective use of foreign tax credits. Instead of claiming a credit, you may, at your election, deduct such Chilean taxes in computing your taxable income, subject to generally applicable limitations under U.S. law. An election to deduct foreign taxes instead of claiming foreign tax credits must apply to all foreign taxes paid or accrued in the taxable year.
176
Sale or Other Disposition of Shares or ADSs
For U.S. federal income tax purposes, gain or loss you realize on the sale or other disposition of shares of our common stock or ADSs generally will be capital gain or loss, and will be long-term capital gain or loss if you held the shares of our common stock or ADSs for more than one year. The amount of your gain or loss will be equal to the difference between your tax basis in the shares of our common stock or ADSs disposed of and the amount realized on the disposition, in each case as determined in U.S. dollars. If a Chilean tax is withheld on the sale or disposition of the shares of our common stock or ADSs, your amount realized will include the gross amount of the proceeds of such sale or disposition before deduction of the Chilean tax. See “—Chilean Taxation—Taxation of Capital Gains” for a description of when a disposition may be subject to taxation by Chile. Such gain or loss generally will be U.S.-source gain or loss for foreign tax credit purposes. Consequently, you may not be able to credit any Chilean tax imposed on the disposition of shares of our common stock or ADSs against your taxable income unless you have other foreign-source income in the appropriate foreign tax credit category. If the Proposed U.S.-Chile Treaty becomes effective, however, a U.S. holder who is eligible for the benefits of the treaty and whose gain from the sale of shares is not exempt from Chilean tax under such treaty may elect to treat disposition gain that is subject to Chilean tax as foreign-source gain and claim a credit in respect of the tax. You should consult your tax advisers as to whether the Chilean tax on gains may be creditable against your U.S. federal income tax on foreign-source income from other sources. Alternatively, instead of claiming a credit, you may elect to deduct otherwise creditable taxes in computing your income, subject to generally applicable limitations under U.S. law. An election to deduct foreign taxes instead of claiming foreign tax credits must apply to all foreign taxes paid or accrued in the taxable year.
Passive Foreign Investment Company Rules
Based on proposed Treasury regulations (the “Proposed Regulations”), including those which are proposed to be effective for taxable years beginning after December 31, 1994, we believe that we were not a “passive foreign investment company” (a “PFIC”) for U.S. federal income tax purposes for the year ended December 31, 2018.2020. However, since the Proposed Regulations may not be finalized in their current form and since PFIC status depends upon the composition of a company’s income and assets and the market value of its assets (including, among others, less than 25 percent owned equity investments) from time to time, and, if recently proposed Treasury regulations are finalized in their current form, the location of activities that produce active banking income and the location of our customers, there can be no assurance that we will not be a PFIC for any taxable year. If we were a PFIC for any taxable year during which you held an ADS or a share of our common stock, certain adverse tax consequences could apply to you.
If we were a PFIC for any taxable year during which you held shares of our common stock or ADSs, gain recognized by you on a sale or other disposition (including certain pledges) of a share of our common stock or an ADS would generally be allocated ratably over your holding period for the share of our common stock or ADS. The amounts allocated to the taxable year of the sale or other disposition and to any year before we became a PFIC would be taxed as ordinary income. The amount allocated to each other taxable year would be subject to tax at the highest rate in effect for individuals or corporations, as appropriate, for that taxable year, and an interest charge would be imposed on the resulting tax liability for that taxable year. Similar rules would apply to any distribution in respect of shares of our common stock or ADSs that exceeds 125% of the average of the annual distributions on shares of our common stock or ADSs received by you during the preceding three years or your holding period, whichever is shorter. Certain elections may be available that would result in alternative treatments of the shares of our common stock or ADSs (including, with respect to our ADSs, a mark-to-market election). In addition, if we were a PFIC for a taxable year in which we pay a dividend or the prior taxable year, the favorable rates discussed above with respect to dividends paid to non-corporate holders would not apply.
If we were to be treated as a PFIC in any taxable year, a U.S. holder may be required to file reports with the Internal Revenue Service containing such information as the Treasury Department may require.
Information Reporting and Backup Withholding
Payment of dividends and sales proceeds that are made within the United States or through certain U.S.-related financial intermediaries generally are subject to information reporting and may be subject to backup withholding, unless you are a corporation or other exempt recipient or in the case of backup withholding, you provide a correct taxpayer identification number and certify that you are not subject to backup withholding.
The amount of any backup withholding from a payment to you will be allowed as a credit against your U.S. federal income tax liability and may entitle you to a refund, provided that the required information is timely furnished to the Internal Revenue Service.
Certain U.S. holders may be required to report information relating to stock of a non-U.S. person, subject to certain exceptions (including an exception for stock held in custodial accounts maintained by a U.S. financial institution).You. You should consult your tax advisers regarding any reporting obligations you may have with respect to shares of our common stock or ADSs.
177
F. Dividends and Paying Agents
Not applicable.
G. Statement by Experts
Not applicable.
H. Documents on Display
The documents concerning us which are referred to in this Annual Report may be inspected at our offices at Bandera 140, 20thfloor, Santiago, Chile. We are subject to the information reporting requirements of the Exchange Act, except that, as a foreign issuer, we are not subject to the proxy rules or the short-swing profit and disclosure rules of the Exchange Act. In accordance with these statutory requirements, we file or furnish reports and other information with the SEC. Reports and other information filed or furnished by us with the SEC may be inspected and copied at the public reference facilities maintained by the SEC at Room 1024, 450 Fifth Street, N.W., Washington, D.C. 20549. Copies of such material may be obtained by mail from the Public Reference Section of the SEC, 450 Fifth Street, N.W., Washington, D.C. 20549, at prescribed rates. You may obtain information on the operation of the Public Reference Section by calling the SEC at 1-800-732-0330. The SEC maintains a website on the Internet at http://www.sec.gov that contains reports and information statements and other information about us. The reports and information statements and other information about us can be downloaded from the SEC’s website or our investor relations websitewww.santandercl.gcs-web.comand can also be inspected and copied at the offices of the NYSE, Inc., 20 Broad Street, New York, New York 10005. None of the information contained on our website is incorporated by reference into, or forms part of, this Annual Report.
I. Subsidiary Information
Not applicable.
ITEM 11. QUANTITATIVE AND QUALITATIVE DISCLOSURES ABOUT MARKET RISK
Introduction
The principal types of risk inherent in Santander-Chile’s business are market, liquidity, operational and credit risks. The effectiveness with which we are able to manage the balance between risk and reward is a significant factor in our ability to generate long term, stable earnings growth. Toward that end, our Board and senior management places great emphasis on risk management.
A. Integral Risk Committee
The Integral Risk Committee of the Board is responsible for reviewing and monitoring all risks that may affect us, including reputation risk, allowing for an integral risk management. This committee serves as the governing body through which the Board supervises risk in general. It also evaluates the reasonability of the systems for measurement and control of the following risks: Credit risk; Market risk, Operational risk, Cybersecurity, Solvency risk (BIS), Legal risks, Compliance risks and Reputational risks.
This Committee includes 6six Board members. This committee also includes the CEO,Chief Executive Officer, the Director of Risk and other senior level executives from the risk and commercial side of our business: The Board members of this committee are:
Board member | Position in Committee | |
| Alfonso Gomez | President | |
| Oscar von Chrismar | Member | |
| Félix de Vicente | Member | |
| Blanca Bustamante | Member | |
| Juan Pedro Santa María Pérez | Member | |
| Claudio Melandri | Member | |
| Lucía Santa Cruz | ||
| Member |
178
B. Audit Committee
Board member | Position in Committee | |
| Orlando Poblete Iturrate | President | |
| Felix de Vicente Mingo | Member | |
| Rodrigo Vergara Montes | Member | |
| Juan Pedro Santa María Pérez | Secretary |
The Audit Committee (Comité de Directores y Auditoría) is comprised of three members of the Board of Directors and the Committee Secretary is Juan Pedro Santa María. The Chief Executive Officer, General Counsel, General Auditor and other persons from the Bank can be invited to the meetings if necessary and are present on specific matters. This Committee’s primary responsibility is to support the Board of Directors in the continuous improvement of our system of internal controls, which includes reviewing the work of both the independent registered public accounting firm and the Internal Audit Department. The committee is also responsible for analyzing observations made by regulatory entities of the Chilean financial system about us and for recommending measures to be taken by our management in response. The external auditors are recommended by this committee to our Board of Directors and appointed by our shareholders at the annual shareholders’ meeting.
This committee is also responsible for:
| · | Presenting to the Board of Directors a list of candidates for the selection of an external auditor to be proposed at the Annual Shareholders’ Meeting. |
| · | Presenting to the Board of Directors a list of candidates for the selection of rating agencies. |
| · | Overseeing and analyzing the results of the external audit and the internal reviews. |
| · | Overseeing and coordinating the Bank’s operational risk policies. |
| · | Analyzing the interim and year-end financial statements and reporting the results to the Board of Directors. |
| · | Analyzing the external auditors’ reports and their content, procedures and scope. |
| · | Analyzing the rating agencies’ reports and their content, procedures and scope. |
| · | Obtaining information regarding the effectiveness and reliability of the internal control systems and procedures. |
| · | Analyzing the information systems performance, and its sufficiency, reliability and use in connection with decision-making processes. |
| · | Obtaining information regarding compliance with the company’s policies regarding the due observance of laws, regulations and internal rules to which the company is subject. |
| · | Investigating suspicious and fraudulent activities (including conflicts). |
| · | Analyzing the reports of the inspection visits, instructions and presentations of the FMC. |
| · | Obtaining information, analyzing and verifying the company’s compliance with the annual audit program prepared by the internal audit department. |
| · | Informing the Board of Directors of accounting changes and their effects. |
179
C. Asset and Liability Committee
The ALCO includes the Vice-PresidentChairman and Vice-Chairman of the Board and three additional members of the Board, the Chief Executive Officer, the Chief Financial Officer, the Corporate Financial Controller, the Manager of the Financial Management Division, the Manager of Market Risk, the Manager of the Treasury Division, and other senior members of management. The ALCO meets monthly. All limits reviewed by the ALCO are measured and prepared by the Market Risk Department. The non-Board members of the ALCO meet weekly to review liquidity, funding, capital and market risk related matters.
Board member | Position in Committee | |
| Rodrigo Vergara Montes | President | |
| Claudio Melandri | Member | |
| Oscar von Chrismar Carvajal | Member | |
| Felix de Vicente | Member | |
| Alfonso Gomez Morales | ||
| Member |
The main functions of the ALCO are:
| Making the most important decisions, approving the risk appetite and limits regarding our exposure to inflation, interest rate risk, inflation risk, funding, capital and liquidity levels. |
| Review of the evolution of the most relevant local and international markets and monetary policies. |
The main limits set and monitored by the ALCO (and measured by the Market Risk Department) are:
Risk | Measure | |
| Sensitivity Capital | ||
| Sensitivity NIM | ||
| Regulatory limit 30 Days | ||
| Regulatory limit 90 Days | ||
| Inflation GAP | ||
| Liquidity coverage ratio | ||
| Net stable funding ratio | ||
| Stress tests | ||
| Liquidity | Structural liquidity limit | |
| Wholesale funding limits | ||
| Deposit concentration | ||
| Asset encumbrance | ||
| Leverage ratio | ||
| Core capital ratio | ||
| Capital | BIS ratio | |
| ROE - COE | ||
| RORAC - COE | ||
| Intergroup exposure: Derivatives, deposits, loans | ||
| Foreign exposures | ||
| Foreign assets: Derivatives, Deposits, Loans | ||
180
D. Market Committee
The Market Committee includes the Chairman of the Board, the Vice Chairman of the Board, two additional members of the Board, the Chief Executive Officer, the Director of Corporate Investment Banking, the Chief Financial Officer, the Manager of the Treasury Division, the Manager of the Financial Management Division, the Manager of Market Risk, the Financial Controller and other senior members of management.
Board member | Position in Committee | |
| Oscar von Chrismar Carvajal | President | |
| Rodrigo Vergara Montes | Member | |
| Lucía Santa Cruz | Member | |
| Claudio Melandri Hinojosa | ||
| Member | ||
| Alfonso Gomez Morales | Member |
The Market Committee is responsible for:
| Establishing a strategy for the Bank’s trading investment portfolio. |
| Establishing the Bank’s policies, procedures and limits with respect to its trading portfolio. The Bank’s Market Risk Department measures all risks and limits and reports these to the Market Committee. |
| Reviewing the net foreign exchange exposure and limit. |
| Reviewing the results of the Bank’s client treasury |
| Reviewing the evolution of the most relevant local and international markets and monetary policies. |
181
E. Risk Department
All issues regarding risk in the Bank are the responsibility of the Bank’s Risk Department. The Risk Department reports to the CEO but has full independence, and no risk decisions can be made without its approval. The following diagram illustrates the governance of our risk division including the committees with approval power:
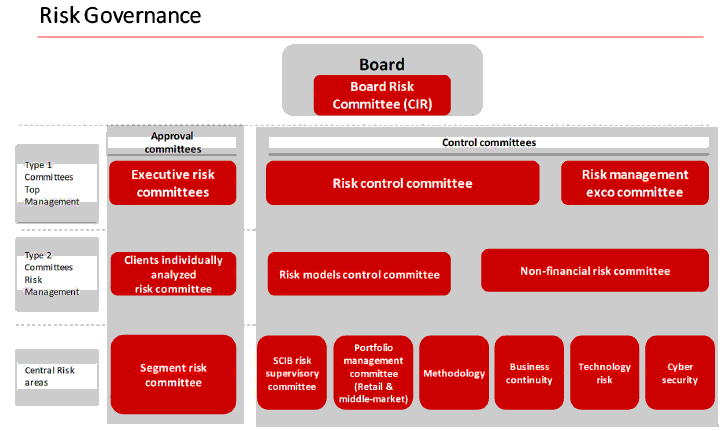
182
Below is an organizational chart of the Risk Department:
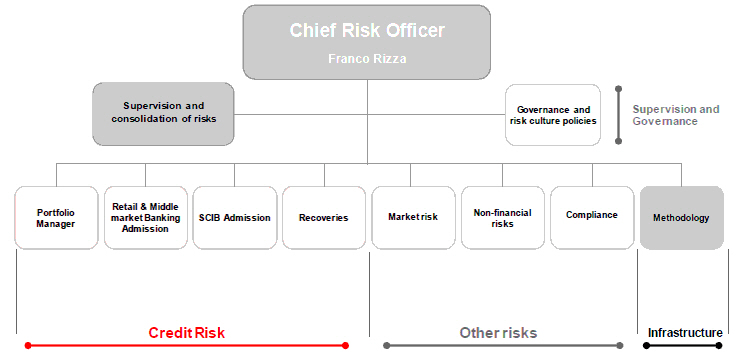
Credit risk
See “Item 5—Selected Statistical Information—Classification of Loan Portfolio for a complete description of credit risk management.
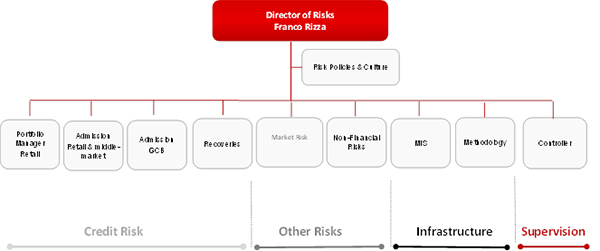
1. Credit Risk
Credit Risk Governance
The Risk Division, our credit analysis and risk management group, is largely independent of our business areas. Risk evaluation teams interact regularly with our clients. For larger transactions, risk teams in our headquarters work directly with clients when evaluating credit risks and preparing credit applications. Various credit approval committees, all of which include Risk Division and Commercial Division personnel, must verify that the appropriate qualitative and quantitative parameters are met by each applicant. Each committee’s powers are defined by our Board of Directors.
Santander-Chile’s governance rules establish an Integral Risk Committee. This committee is responsible for revising and following all risks that may affect us, including reputational risk, allowing for an integral risk management. This committee serves as the governing body through which the Board supervises all risk functions. It also evaluates the reasonability of the systems for measurement and control of risks. This Committee includes the Vice Chairman of the Board and five Board members.
The Board has delegated the duty of credit risk management to the Risk Committee, as well as to the Bank’s risk departments, whose roles are summarized below:
| Formulate credit policies by consulting with the business units, meeting requirements of guarantees, credit evaluation, risk rating and submitting reports, documentation and legal procedures in compliance with the regulatory, legal and internal requirements of the Bank. |
| Establish the structure to approve and renew credit requests. The Bank structures credit risks by assigning limits to the concentration of credit risk in terms of individual debtor, debtor group, industry segment and country. Approval levels are assigned to the corresponding officials of the business unit (commercial, consumer, SMEs) to be exercised by that level of management. In addition, those limits are continually revised. Teams in charge of risk evaluation at the branch level interact on a regular basis with customers; however, for larger credit requests, the risk team from the head office and the Executive Risk Committee works directly with customers to assess credit risks and prepare risk requests. |
183
| Limit concentrations of exposure to customers or counterparties in geographic areas or industries (for accounts receivable or loans), and by issuer, credit rating and liquidity. |
| Develop and maintain the Bank’s credit risk classifications for the purpose of classifying risks according to the degree of exposure to financial loss that is exhibited by the respective financial instruments, with the aim of focusing risk management specifically on the associated risks. |
| Revise and evaluate credit risk. Management’s risk divisions are largely independent of the Bank’s commercial division and evaluate all credit risks in excess of the specified limits prior to loan approvals for customers or prior to the acquisition of specific investments. Credit renewal and reviews are subject to similar processes. |
The following diagram illustrates the governance of our credit risk division including the committees with approval power:2. Non-financial risks
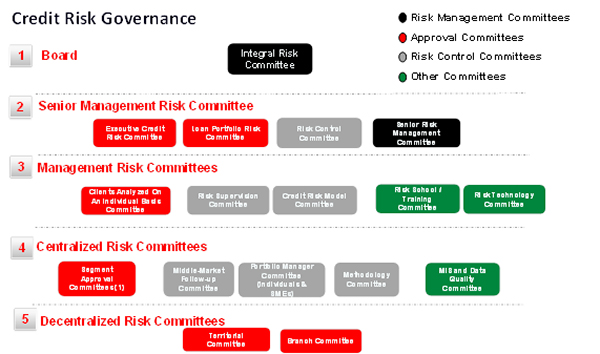
(1) Includes various approval committeesOperational risk is inherent to all products, activities, processes and systems and is generated in all business and support areas. For this reason, all employees are responsible for managing and controlling the Middle Marketoperational risks generated in their sphere of action. The Bank’s goal in terms of operational risk management and high net worth clients.control is focused on identifying, evaluating and mitigating sources of risk, regardless of whether they have materialized or not. The analysis of operational risk exposure contributes to the establishment of risk management priorities.
Governance
AllThe risk management program contemplates that all relevant risk issues regarding operational risks inmust be reported to the Bank fall underBoard of Directors, the Integral Risk Committee and the Non-Financial Risk DepartmentCommittee.
Risk identification, measurement and assessment model
A series of quantitative and qualitative techniques and tools have been defined by the Bank to identify, measure and assess operational risk. The quantitative analysis of this risk assessment is carried out mainly with tools that reportsrecord and quantify the level of potential losses associated with operational risk events. The qualitative analysis seeks to assess aspects of exposure and hedging (including the control environment). The most important operational risk tools used by Santander Chile are an internal events database, operational risk control self-assessment, analysis of operational risk scenarios, appetite of corporate and local indicators, internal audit and regulatory recommendations, among others.
Operational risk management
To accomplish our operational risk objectives, we have established a risk model based on three lines of defense, with the objective of continuously improving and developing our management and control of operational risks. The defense lines consist of: (i) the business and support areas (first line of defense), responsible for managing the risks related to their processes; (ii) the non-financial risk area (second line of defense), in charge of supporting the first line of defense in relation to the Risk Department. Below is an organization chartfulfillment of this department.its direct responsibilities and; (iii) the internal audit function (third line of defense) responsible for verifying, independently and periodically, the adequacy of the risk identification and management processes and procedures, in accordance with the guidelines established in the Internal Audit Policy and submitting the results of its recommendations for improvement to the Audit Committee.
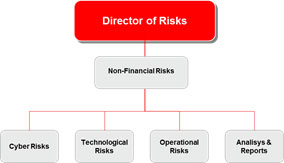
Our methodology consists of the evaluation of the risks and controls of a business from a broad perspective and includes a plan to monitor the effectiveness of such controls and the identification of eventual weaknesses. The main objectives of the Bank and its subsidiaries in terms of operational risk management are the following:
Cyber-security and data security plans
The Bank continuously monitors cyber-security risks and has implemented preventative measures to be prepared for any attack of this kind. The Bank has evolved its internal cyber-security model to reflect international standards, incorporating concepts which can be used to assess the degree of maturity in deployment. Based on this new assessment model, individual in-situ analyses have been carried out to identify deficiencies and steps to remedy any such deficiencies have been identified in our cyber-security defense plans.
The Bank has created a Cybersecurity Framework which defines the governance and policies on preventing and confronting cybercrime. The Chief of Cybersecurity or CISO (Chief Information Security Officer) has been defined as the officer responsible for cybersecurity, a function performed by the DirectorManager of Technology and Operations.Operational Risk. Embedded in the Bank’s Technology and Operations division is the TechnologyCyber and OperationsTechnology Risk Department, which is the front line of defense against cyber-security threats and data security. In addition, the Non-Financial Risk Department through the Cyber Risk (a new specialized area) enforces the policies and controls that the different areas must follow regarding technology and cyber-security risks. In turn, there is a group of supervisory bodies that include the Cybersecurity Committee, the Non-Financial Risk Committee, the Chief Executive Officer’s Management Committee and the Board’s Integral Risk Committee. We also coordinate with Santander Spain’s headquarters and units in other countries regarding strategy, best practices and experience-sharing.
All this architecture has been created with the aim of identifying cyber risks, the development of a culture and education in cybersecurity, the creation of cyber scenarios to anticipate potential threats, and the fulfillment of the regulatory framework set by the authorities.
Finally, the intelligence and analysis function has also been reinforced by contracting bank threat monitoringa threat-monitoring service, and progress has been made in the incident registration, notification and escalation mechanisms for internal reporting and reporting to supervisors. In addition, observation and analytical assessment of the events in the sector and in other industries enablesenable us to update and adapt our models for emerging threats. We also coordinate with Santander Spain’s headquarters and units in other countries regarding strategy, best practices and communicating of experiences. Among other things, we have implemented, or are currently in the process of implementing, the following controls to limit cybersecurity threats:
During 2018,2020, the Bank did not face a material loss due to cybersecurity breaches and we completed the 3rd year of the Global Cybersecurity Transformation Plan that has allowed us to reach advanced levels of maturity in Cybersecurity. The main initiatives considered in 2020 were the following:
| 1. | Security Operations Center (SOC): A series of usage cases have been designed and executed to validate that SIEM log inputs and alerts are working correctly. |
| 2. | Identity and Access Management (IAM): All SOX applications are under administration of the SailPoint user management platform. The corresponding automated onboarding has also started for the first 15 non-SOX critical applications. In the field of high-privilege users (IT administrators), the CyberArk platform has continued to be reinforced as the PAM (Privileged Access Management) of the organization for the purposes of server and database administrators. |
185
| 3. | Network Segregation: We deployed Web Application Firewall (WAF) to protect the vast majority of IFAs (Internet Facing Assets) in the organization and reinforced the segregation of internal networks by implementing new Firewalls and IPS (Intrusion Prevention System) to control internal flows. |
| 4. | Insider Threat and Data Protection: We implemented a new data classification tool (AIP - Azure Information Protection) and published the corresponding policy. We started the implementation of a new Data Loss Prevention (DLP) platform that should be fully operational in the first half of 2021. |
| 5. | Vulnerability Management: We deployed a global vulnerability scanning platform in our internal networks, which allows us to have a complete visualization of the vulnerabilities of servers, stations and network devices. At the same time, it allows us to monitor the compliance status of these platforms. |
| 6. | Cloud Security: We developed an intense security program for the cloud, including topics such as anti DDoS solutions, network segmentation via firewalls, compliance monitoring, high-privilege access management and deployment of advanced anti-malware. |
| 7. | Next Generation Endpoints: We increased the security level of the end points by activating Windows Firewall. We implemented the distribution of patches via the cloud and reinforced the navigation controls for users working at home without connection to the Bank’s internal network. |
| 8. | We continued with our initiatives to reduce obsolescence at the level of stations, servers, applications, software components, communication devices, etc. |
| 9. | In relation to the effects of the pandemic on the work environment, remote access controls were strengthened, both for Bank users and for third parties. |
During 2020, the Bank did not face material loss due to cybersecurity breaches. However, even though we have thorough cybersecurity practices and governance in place, we cannot assure that in the future a material event will not occur.
Business Continuity Management: Ensuring the realization of critical process during contingencies
The Bank has a Business Continuity Management System, which covers the entire organization in order to ensure the execution of the activities that may cause significant negative impacts (operational, reputation, consumer services, legal and operational losses) to the organization. The Non-financial Risk Department, through the Technological Risk department (BCM specialized area, as part of the second line of defense), leads the control and implementation of the model and policies defining the roles and responsibilities of each line of defense, where the first line of defense has a main role that involves the identification of their process, the business impact analysis of each risk according to the methodology, the preparation of business continuity plans and strategies to respond to each contingency scenario and ensure the realization of the critical processes, the testing and continuous updating of the information to secure the resources needed (at least annually).
The Bank is constantly facing different types of contingencies (mainly natural disasters, but more recently, social movements and protests), which has proven to be effective in order to maintain and ensure the business continuity of the organization. We are constantly detecting new opportunities to improve the current mitigation actions and contingency plans allowing the critical departments to recover after the events that may occur in the future.
Role of Grupo Santander’sSantander Group’s Global Risk Division: Operational Risk
In matters regarding operational risk, Santander Spain’s Global Risk Department’s role is to define certain global policies, guidelines and procedures regarding operational risk. The Corporate Operational Risk Committee is the main body in which the different units of Santander discuss and review the major operational risk events and policies.
Operational risk management during the COVID-19 pandemic
Overall, the COVID-19 pandemic has resulted in increased exposure to inherent operational risk, although the Bank has established greater oversight over controls in order to maintain pre-COVID-19 operational risk levels, in addition to reinforce existing ones. The risk of transaction processing increases due to the volume of new loans and multiple changes in existing portfolios resulting from payment holidays and the FOGAPE program. Transactional volume also increased due to public assistance programs and the rise in the number of checking accounts and volumes as more clients searched for digital payment solutions. Close monitoring has been carried out on the following aspects:
186
The following table summarizes our net losses from operational risks in 2020 compared to 2019.
| As of | % Change | |||||||||||
| Net losses from operational risks | December 31, 2020 | December 31, 2019 | 2020/2019 | |||||||||
| Fraud | 4,703 | 3,941 | 19.3 | % | ||||||||
| Labor related | 443 | 461 | (3.9 | %) | ||||||||
| Client / product related | 250 | 653 | (61.7 | %) | ||||||||
| Damage to fixed assets | (2,592 | ) | 3,588 | --% | ||||||||
| Business continuity / Systems | 1,570 | 234 | 570.9 | % | ||||||||
| Processing | 3,992 | 2,106 | 89.6 | % | ||||||||
| Total | 8,366 | 10,983 | (23.8 | %) | ||||||||
3. Market Risks
This section describes the market risks that we are exposed to, the tools and methodology used to control these risks, the portfolios over which these market risk methods were applied and quantitative disclosure that demonstrate the level of exposure to market risk that we are assuming. This section also discloses the derivative instruments that we use to hedge exposures and offer to our clients.
Market risk is the risk of losses due to unexpected changes in interest rates, foreign exchange rates, inflation rates and other rates or prices. We are exposed to market risk mainly as a result of the following activities:
| trading in financial instruments, which exposes us to interest rate and foreign exchange rate risk; |
| engaging in banking activities, which subjects us to interest rate risk, since a change in interest rates affected gross interest income, gross interest expense and customer behavior; |
| engaging in banking activities, which exposes us to inflation rate risk, since a change in expected inflation affects gross interest income, gross interest expense and customer behavior; |
| trading in the local equity market, which subjects us to potential losses caused by fluctuations of the stock market; and |
| investing in assets whose returns, or accounts are denominated in currencies other than the Chilean peso, which subjects us to foreign exchange risk between the Chilean peso and such other currencies. |
187
The main decisions that relate to market risk for the Bank and the limits regarding market risk are made in the Asset and Liability Committee and the Market Committee. The measurement and oversight of market risks is performed by the Market Risk Department. Santander-Chile’s governance rules have established the existence of two high-level committees that, among other things, function to monitor and control market risks: the Asset and Liability Committee and the Market Committee.
Role of Grupo Santander’sSantander Group’s Global Risk Division: Market Risk
In matters regarding Market Risk, the role of Santander Spain’s Global Risk Department is to define certain global policies, guidelines and procedures regarding market risk. The information produced by our local Market Risk Department is standardized for the whole group in order to facilitate a consolidation of risks being taken on a global basis. They review daily the consumption of limits and provide valuable input on the evolution of markets, especially regarding the Eurozone.
4. Market Risk: Quantitative Disclosure
Impact of Inflation
Our assets and liabilities are denominated in Chilean pesos, Unidades de Fomento (UF) and foreign currencies. Inflation impacts our results of operations as some loan and deposit products are contracted in UF. The UF is revalued in monthly cycles. Each day in the period beginning on the tenth day of the current month through the ninth day of the succeeding month, the nominal peso value of the UF is indexed up (or down in the event of deflation) in order to reflect a proportionate amount of the change in the Chilean Consumer Price Index during the prior calendar month. One UF equaled Ch$ 29,070.33 at December 31, 2020, Ch$28,309.94 at December 31, 2019 and Ch$27,565.79 at December 31, 2018. High levels of inflation in Chile could adversely affect the Chilean economy and could have an adverse effect on our business, financial condition and results of operations. Negative inflation rates also negatively impact our results. Inflation measured as the annual variation of the UF was 2.7 in 2020, 2.7% in 2019 and 2.9% in 2018. There can be no assurance that Chilean inflation will not change significantly from the current level. Although we currently benefit from moderate levels of inflation, due to the current structure of our assets and liabilities (i.e., a significant portion of our loans are indexed to the inflation rate, but there are significantly less features in deposits and other funding sources that would increase the size of our funding base), there can be no assurance that our business, financial condition and result of operations in the future will not be adversely affected by changing levels of inflation. In summary:
| UF-denominated assets and |
| Inflation and interest rate |
188
| The financial impact of the gap between our interest earning assets and liabilities denominated in UFs including hedges was Ch$ 173,668 million in 2020, Ch$114,340 million in 2019 and Ch$126,260 million in |
| As of December 31, | % Change | % Change | As of December 31, | % Change | ||||||||||||||||||||||||||||||||||||
| Impact of inflation on net interest income | 2018 | 2017 | 2016 | 2018/2017 | 2017/2016 | 2020 | 2019 | 2018 | 2019/2018 | 2020/2019 | ||||||||||||||||||||||||||||||
| (in millions of Ch$) | (in millions of Ch$) | |||||||||||||||||||||||||||||||||||||||
| Results from UF GAP(1) | 126,260 | 73,050 | 133,702 | 72.8 | % | (45.4 | %) | |||||||||||||||||||||||||||||||||
| Results from UF GAP(1) | 173,668 | 114,340 | 126,260 | 51.9 | % | (9.4 | %) | |||||||||||||||||||||||||||||||||
| Annual UF inflation | 2.9 | % | 1.7 | % | 2.8 | % | 2.7 | % | 2.7 | % | 2.9 | % | ||||||||||||||||||||||||||||
____________________
(1) | UF GAP is net interest income from asset and liabilities denominated in UFs and include the results from hedging the size of this gap via interest rate swaps. |
| Peso-denominated assets and liabilities. Interest rates prevailing in Chile during any period primarily reflect the inflation rate during the period and the expectations of future inflation. The sensitivity of our peso-denominated interest earning assets and |
Interest rate sensitivityRates
Interest rates earned and paid on our assets and liabilities reflect, to a certain degree, inflation, expectations regarding inflation, changes in short term interest rates set by the Central Bank and movements in long term real rates. The Central Bank manages short term interest rates based on its objectives of balancing low inflation and economic growth. Because our liabilities are generally re-priced sooner than our assets, changes in the rate of inflation or short termshort-term rates in the economy are reflected in the rates of interest paid by us on our liabilities before such changes are reflected in the rates of interest earned by us on our assets. Therefore, when short term interest rates fall, our net interest margin is positively impacted, but when short term rates increase, our interest margin is negatively affected. At the same time, our net interest margin tends to be adversely affected in the short term by a decrease in inflation rates since generally our UF-denominated assets exceed our UF-denominated liabilities. (SeeSee “Item 5.Operating5. Operating and Financial Review and Prospects—A. Operating Results—Impact of Inflation—Peso-denominated assets and liabilities”).liabilities.” An increase in long term rates has a positive effect on our net interest margin, because our interest earning assets generally have longer terms than our interest bearinginterest-bearing liabilities. A flattening of the yield curve, i.e. long-term rates falling quicker than short-term rates, negatively affects our margins by lowering loan yields at a greater pace than deposits costs. In addition, because our peso-denominated liabilities have relatively short re-pricing periods, they are generally more responsive to changes in inflation or short termshort-term rates than our UF-denominated liabilities. As a result, during periods when current inflation or expected inflation exceeds the previous period’s inflation, customers often switch funds from UF-denominated deposits to peso-denominated deposits, which generally bear higher interest rates, thereby adversely affecting our net interest margin.
189
As of December 31, 2018 and 2017,2020, the detail of the maturities of assets and liabilities is as follows:
| As of December 31, 2018 | Demand | Up to 1 month | Between 1 and 3 months | Between 3 and 12 months | Subtotal up to 1 year | Between 1 and 3 years | Between 3 and 5 years | More than 5 years | Subtotal More than 1 year | Total | ||||||||||||||||||||||||||||||||||||||||||||||||||||||||||||||||||||||
As of December 31, 2020 | ||||||||||||||||||||||||||||||||||||||||||||||||||||||||||||||||||||||||||||||||
| MCh$ | MCh$ | MCh$ | MCh$ | MCh$ | MCh$ | MCh$ | MCh$ | MCh$ | MCh$ | Demand | Up to 1 month | Between 1 and 3 months | Between 3 and 12 months | Subtotal up to 1 year | Between 1 and 3 years | Between 3 and 5 years | More than 5 years | Subtotal More than 1 year | Total | |||||||||||||||||||||||||||||||||||||||||||||||||||||||||||||
| (in millions Ch$) | ||||||||||||||||||||||||||||||||||||||||||||||||||||||||||||||||||||||||||||||||
| Financial assets | ||||||||||||||||||||||||||||||||||||||||||||||||||||||||||||||||||||||||||||||||
| Cash and deposits in banks | 2,065,411 | — | — | — | 2,065,411 | — | — | — | — | 2,065,411 | 2,803,288 | - | - | - | 2,803,288 | - | - | - | - | 2,803,288 | ||||||||||||||||||||||||||||||||||||||||||||||||||||||||||||
| Cash items in process of collection | 353,757 | — | — | — | 353,757 | — | — | — | — | 353,757 | 452,963 | - | - | - | 452,963 | - | - | - | - | 452,963 | ||||||||||||||||||||||||||||||||||||||||||||||||||||||||||||
| Financial assets held for trading | — | 1,064 | — | 11,642 | 12,706 | 16,331 | 20,080 | 27,924 | 64,335 | 77,041 | - | 680 | 2,630 | 499 | 3,809 | 633 | 18,257 | 111,019 | 129,909 | 133,718 | ||||||||||||||||||||||||||||||||||||||||||||||||||||||||||||
| Investments under resale agreements | — | — | — | — | — | — | — | — | — | — | ||||||||||||||||||||||||||||||||||||||||||||||||||||||||||||||||||||||
| Investments under resale agreement | - | - | - | - | - | - | - | - | - | - | ||||||||||||||||||||||||||||||||||||||||||||||||||||||||||||||||||||||
| Financial derivative contracts | — | 111,268 | 128,024 | 543,722 | 783,014 | 723,622 | 552,133 | 1,041,866 | 2,317,621 | 3,100,635 | - | 385,231 | 401,486 | 795,881 | 1,582,598 | 1,723,334 | 1,692,142 | 4,034,011 | 7,449,487 | 9,032,085 | ||||||||||||||||||||||||||||||||||||||||||||||||||||||||||||
| Loans and accounts receivables at amortised cost (*) | 238,212 | 3,295,003 | 2,323,442 | 4,880,726 | 10,737,383 | 5,474,289 | 3,236,349 | 10,765,393 | 19,476,031 | 30,213,414 | ||||||||||||||||||||||||||||||||||||||||||||||||||||||||||||||||||||||
| Loans and accounts receivables at amortized cost (*) | 170,214 | 1,246,271 | 1,443,659 | 3,664,841 | 6,524,985 | 3,659,994 | 293,785 | 23,861,129 | 27,814,908 | 34,339,893 | ||||||||||||||||||||||||||||||||||||||||||||||||||||||||||||||||||||||
| Loans and account receivable at FVOCI (**) | — | — | — | 25,294 | 25,294 | 4,949 | — | 38,451 | 43,400 | 68,694 | 0 | 0 | 0 | 5,405 | 5,405 | 0 | 16,243 | 49,037 | 65,280 | 70,685 | ||||||||||||||||||||||||||||||||||||||||||||||||||||||||||||
| Debt instruments at FVOCI | — | 2,391,329 | — | 1 | 2,391,330 | 86 | — | 2,907 | 2,993 | 2,394,323 | - | 1,006,983 | 493 | 188,977 | 1,196,453 | 205,150 | 2,378,752 | 3,382,187 | 5,966,089 | 7,162,542 | ||||||||||||||||||||||||||||||||||||||||||||||||||||||||||||
| Equity instruments at FVOCI | — | — | — | — | — | — | — | 483 | 483 | 483 | - | - | - | - | - | - | - | 548 | 548 | 548 | ||||||||||||||||||||||||||||||||||||||||||||||||||||||||||||
| Guarantee deposits (margin accounts) | 170,232 | — | — | — | 170,232 | — | — | — | — | 170,232 | 608,359 | - | - | - | 608,359 | - | - | - | - | 608,359 | ||||||||||||||||||||||||||||||||||||||||||||||||||||||||||||
| Total financial assets | 2,827,612 | 5,798,664 | 2,451,466 | 5,461,385 | 16,539,127 | 6,219,277 | 3,808,562 | 11,877,024 | 21,904,863 | 38,443,990 | 4,034,824 | 2,639,165 | 1,848,268 | 4,655,603 | 13,177,860 | 5,589,111 | 4,399,179 | 31,437,931 | 41,426,221 | 54,604,081 | ||||||||||||||||||||||||||||||||||||||||||||||||||||||||||||
| Financial liabilities | ||||||||||||||||||||||||||||||||||||||||||||||||||||||||||||||||||||||||||||||||
| Deposits and other demand liabilities | 8,741,417 | — | — | — | 8,741,417 | — | — | — | — | 8,741,417 | 14,560,893 | - | - | - | 14,560,893 | - | - | - | - | 14,560,893 | ||||||||||||||||||||||||||||||||||||||||||||||||||||||||||||
| Cash items in process of being cleared | 163,043 | — | — | — | 163,043 | — | — | — | — | 163,043 | 361,631 | - | - | - | 361,631 | - | - | - | - | 361,631 | ||||||||||||||||||||||||||||||||||||||||||||||||||||||||||||
| Obligations under repurchase agreements | — | 48,545 | — | — | 48,545 | — | — | — | — | 48,545 | - | 969,808 | - | - | 969,808 | - | - | - | - | 969,808 | ||||||||||||||||||||||||||||||||||||||||||||||||||||||||||||
| Time deposits and other time liabilities | 122,974 | 5,248,418 | 4,108,556 | 3,326,199 | 12,806,147 | 191,547 | 6,137 | 63,988 | 261,672 | 13,067,819 | 159,918 | 5,843,682 | 2,912,985 | 1,434,246 | 10,350,831 | 163,053 | 44,384 | 23,523 | 230,960 | 10,581,791 | ||||||||||||||||||||||||||||||||||||||||||||||||||||||||||||
| Financial derivative contracts | — | 131,378 | 120,361 | 349,551 | 601,290 | 495,789 | 471,185 | 949,464 | 1,916,438 | 2,517,728 | - | 386,690 | 445,376 | 931,358 | 1,763,424 | 1,552,482 | 1,708,509 | 3,994,245 | 7,255,236 | 9,018,660 | ||||||||||||||||||||||||||||||||||||||||||||||||||||||||||||
| Interbank borrowings | 39,378 | 16,310 | 404,575 | 1,188,692 | 1,648,955 | 139,671 | — | — | 139,671 | 1,788,626 | 16,832 | 238,414 | 222,992 | 855,434 | 1,333,672 | 1,140,426 | 3,854,501 | - | 4,994,927 | 6,328,599 | ||||||||||||||||||||||||||||||||||||||||||||||||||||||||||||
| Issued debt instruments | — | 71,465 | 39,267 | 745,830 | 856,562 | 2,431,849 | 1,549,743 | 3,277,079 | 7,258,671 | 8,115,233 | - | 344,732 | 447,117 | 343,156 | 1,135,005 | 1,813,341 | 2,499,560 | 2,756,271 | 7,069,172 | 8,204,177 | ||||||||||||||||||||||||||||||||||||||||||||||||||||||||||||
| Lease liabilities | 144,478 | 38,148 | 1,375 | 27 | 184,028 | 89 | 105 | 96 | 290 | 184,318 | ||||||||||||||||||||||||||||||||||||||||||||||||||||||||||||||||||||||
| Other financial liabilities | 179,681 | 934 | 2,412 | 22,844 | 205,871 | 9,261 | 92 | 176 | 9,529 | 215,400 | - | - | - | 25,526 | 25,526 | 44,933 | 35,679 | 43,447 | 124,059 | 149,585 | ||||||||||||||||||||||||||||||||||||||||||||||||||||||||||||
| Guarantees received (margin accounts) | 540,091 | — | — | — | 540,091 | — | — | — | — | 540,091 | 624,205 | - | - | - | 624,205 | - | - | - | - | 624,205 | ||||||||||||||||||||||||||||||||||||||||||||||||||||||||||||
| Total financial liabilities | 9,786,584 | 5,517,050 | 4,675,171 | 5,633,116 | 25,611,921 | 3,268,117 | 2,027,157 | 4,290,707 | 9,585,981 | 35,197,902 | 15,867,957 | 7,821,474 | 4,029,845 | 3,589,747 | 31,309,023 | 4,714,324 | 8,142,738 | 6,817,582 | 19,674,644 | 50,983,667 | ||||||||||||||||||||||||||||||||||||||||||||||||||||||||||||
____________________
| (*) | Loans and accounts receivables at amortized cost are presented on a gross |
| (**) | Loans and accounts receivables at FVOCI are presented on a gross |
190
The following table sets forth our average daily balance of liabilities for the years ended December 31, 2018, 20172020, 2019 and 2016,2018, in each case together with the related average nominal interest rates paid thereon.
2018 | 2017 | 2016 | 2020 | 2019 | 2018 | |||||||||||||||||||||||||||||||||||||||||||||||||||||||||||||||||||
Average Balance | % of Total Average Liabilities | Average Nominal Rate | Average Balance | % of Total Average Liabilities | Average Nominal Rate | Average Balance | % of Total Average Liabilities | Average Nominal Rate | Average Balance | % of Total Average Liabilities | Average | Average Balance | % of Total Average Liabilities | Average | Average Balance | % of Total Average Liabilities | Average | |||||||||||||||||||||||||||||||||||||||||||||||||||||||
| (in millions of Ch$, except percentages) | ||||||||||||||||||||||||||||||||||||||||||||||||||||||||||||||||||||||||
| Interest-bearing liabilities | ||||||||||||||||||||||||||||||||||||||||||||||||||||||||||||||||||||||||
| Savings accounts | 117,885 | 0.3 | % | 2.7 | % | 117,305 | 0.3 | % | 1.6 | % | 116,339 | 0.3 | % | 2.5 | % | 138,671 | 0.25 | % | 2.5 | % | 120,896 | 0.28 | % | 2.5 | % | 117,885 | 0.3 | % | 2.7 | % | ||||||||||||||||||||||||||||||||||||||||||
| Time deposits | 13,154,916 | 35.3 | % | 2.8 | % | 13,146,520 | 37.0 | % | 2.9 | % | 13,620,848 | 38.6 | % | 3.3 | % | 14,248,478 | 25.52 | % | 1.2 | % | 13,779,534 | 31.87 | % | 2.6 | % | 13,154,916 | 35.3 | % | 2.8 | % | ||||||||||||||||||||||||||||||||||||||||||
| Central Bank borrowings | 4 | 0.0 | % | 6.0 | % | 6 | 0.0 | % | 2.2 | % | 871 | 0.0 | % | 3.4 | % | 2,881,600 | 5.16 | % | 0.0 | % | - | 0.00 | % | 0.0 | % | 4 | 0.0 | % | 6.0 | % | ||||||||||||||||||||||||||||||||||||||||||
| Repurchase agreements | 291,913 | 0.8 | % | 2.3 | % | 294,368 | 0.8 | % | 2.3 | % | 121,875 | 0.3 | % | 2.4 | % | 243,280 | 0.44 | % | 0.8 | % | 414,951 | 0.96 | % | 2.5 | % | 291,913 | 0.8 | % | 2.3 | % | ||||||||||||||||||||||||||||||||||||||||||
| Mortgage finance bonds | 28,685 | 0.1 | % | 8.0 | % | 38,714 | 0.1 | % | 7.0 | % | 52,414 | 0.1 | % | 8.1 | % | 14,580 | 0.03 | % | 7.6 | % | 20,923 | 0.05 | % | 7.7 | % | 28,685 | 0.1 | % | 8.0 | % | ||||||||||||||||||||||||||||||||||||||||||
| Other interest bearing liabilities | 9,401,475 | 25.3 | % | 4.8 | % | 8,632,128 | 24.3 | % | 4.0 | % | 7,856,201 | 22.3 | % | 5.0 | % | 11,202,635 | 20.07 | % | 4.2 | % | 11,261,529 | 26.05 | % | 4.8 | % | 9,401,475 | 25.3 | % | 4.8 | % | ||||||||||||||||||||||||||||||||||||||||||
| Subtotal interest-bearing liabilities | 22,994,878 | 61.8 | % | 3.6 | % | 22,229,041 | 62.6 | % | 3.3 | % | 21,768,548 | 61.8 | % | 3.7 | % | 28,729,244 | 51.46 | % | 2.2 | % | 25,597,833 | 59.21 | % | 3.5 | % | 22,994,878 | 61.8 | % | 3.6 | % | ||||||||||||||||||||||||||||||||||||||||||
| Non-interest bearing liabilities | ||||||||||||||||||||||||||||||||||||||||||||||||||||||||||||||||||||||||
| Non-interest bearing deposits | 6,763,546 | 18.2 | % | 6,117,644 | 17.2 | % | 5,753,622 | 16.3 | % | 10,403,347 | 18.63 | % | 7,466,991 | 17.27 | % | 6,763,546 | 18.2 | % | ||||||||||||||||||||||||||||||||||||||||||||||||||||||
| Derivatives | 2,020,857 | 5.4 | % | 2,175,063 | 6.1 | % | 2,724,994 | 7.7 | % | 9,793,162 | 17.54 | % | 4,165,330 | 9.64 | % | 2,020,857 | 5.4 | % | ||||||||||||||||||||||||||||||||||||||||||||||||||||||
| Other non-interest bearing liabilities | 2,170,906 | 5.8 | % | 1,997,799 | 5.6 | % | 2,156,015 | 6.1 | % | 3,171,540 | 5.68 | % | 2,549,130 | 5.90 | % | 2,170,906 | 5.8 | % | ||||||||||||||||||||||||||||||||||||||||||||||||||||||
| Shareholders’ equity | 3,263,155 | 8.8 | % | 3,001,680 | 8.5 | % | 2,840,843 | 8.1 | % | 3,734,243 | 6.69 | % | 3,450,729 | 7.98 | % | 3,263,155 | 8.8 | % | ||||||||||||||||||||||||||||||||||||||||||||||||||||||
| Subtotal non-interest bearing liabilities and equity | 14,218,464 | 38.2 | % | 13,292,186 | 37.4 | % | 13,475,474 | 38.2 | % | 27,102,291 | 48.54 | % | 17,632,180 | 40.79 | % | 14,218,464 | 38.2 | % | ||||||||||||||||||||||||||||||||||||||||||||||||||||||
| Total liabilities | 37,213,342 | 100.0 | % | 35,521,228 | 100.0 | % | 35,244,020 | 100.0 | % | 55,831,535 | 100.00 | % | 43,230,013 | 100.00 | % | 37,213,342 | 100.0 | % | ||||||||||||||||||||||||||||||||||||||||||||||||||||||
Foreign exchange fluctuations
The Chilean government’s economic policies and any future changes in the value of the Chilean peso against the U.S. dollar could adversely affect our financial condition and results of operations. The Chilean peso has been subject to significant devaluation in the past and may be subject to significant fluctuations in the future. The year-end Central Bank exchange rate appreciated 4.5% in 2020 and depreciated 13.1%7.0% in 2018 and appreciated 7.8% in 2017. See “Item 3. Key Information—A. Selected Financial Data—Exchange Rates.”2019.
A significant portion of our assets and liabilities are denominated in foreign currencies, principally the U.S. dollar, and we historically have maintained, and may continue to maintain, material gaps between the balances of such assets and liabilities. Because such assets and liabilities, as well as interest earned or paid on such assets and liabilities, and gains and losses realized upon the sale of such assets, are translated to Chilean pesos in preparing our financial statements, our reported income is affected by changes in the value of the Chilean peso relative to foreign currencies (principally the U.S. dollar).
Our current strategy is not to maintain a significant difference between the balances of our assets and liabilities in foreign currencies. In 2018, 20172020 and 2016,2019, the Bank’s spot position in foreign currency held more liabilitiesassets than assets in foreign currencies,liabilities, mainly U.S. dollars as a result of an ample supplyhigher dollar liquidity held overnight by the Bank during the period of U.S.$ deposits from companies that receive export revenues, foreign correspondent bank loanssocial unrest and bonds issued abroad.the COVID-19 pandemic. This difference is usually hedged using forwards and cross-currency swaps. In general, the Bank is not permitted, due to guidelines set by the ALCO and the Market Committee, to open a meaningful gap in foreign currency. Therefore, all foreign currency risk is mainly included in the trading portfolio and is measured using VaR. The average VAR of our foreign currency position was U.S.$1.142.85 million in 2018.2020. The translation gaingains or loss over assets and liabilities (excluding derivatives held for trading) is included as foreign exchange transactions in the income statement. The translation and mark-to-market of foreign currency derivatives held for trading is recognized as a gain or loss in the net results from mark-to-market and trading.
As of December 31, 2018, the net difference between assets and liabilities in foreign currency was a net liability position of U.S.$8.2 million. The average gap, be it a net asset or liability position in foreign currency, in 2018 was U.S.$ 21.5 million or 0.0% of our total assets. Both figures include derivatives used to hedge foreign currency risk.
Below is a graph that illustrates the net daily foreign currency position in 2018.
We also set an absolute limit on the size of Santander-Chile’s consolidated net foreign currency trading position, which is equivalent to the maximum differential allowed between assets and liabilities in foreign currencies, including hedging of this gap. The limit on the size of the net foreign currency position is determined by the Market Committee and is calculated and monitored by the Market Risk Department. At December 31, 2018,2020, this was equal to U.S.$350 million. This limit in various other currencies is as follows:
191
Currency | Limit | ||||
| (in millions of U.S.$) | |||||
| U.S. dollars | 350 | ||||
| Euros | 110 | ||||
| Yen | 27 | ||||
| British pound | 20 | ||||
| Mexican peso | 30 | ||||
| Brazilian real | 30 | ||||
| Colombian peso | 30 | ||||
| Peruvian Sol | 20 | ||||
| Other European currencies | 30 | ||||
| Other Latin American currencies | 30 | ||||
| Other currencies | 47.5 | ||||
| Total Limit | 350 | ||||
Liquidity risk management
The Financial Management Division receives information from all the business units on the liquidity profile of their financial assets and liabilities, as well as breakdowns of other projected cash flows stemming from future businesses. On the basis of that information, the Financial Management Division maintains a portfolio of liquid short–term assets, comprised mainly of liquid investments, loans and advances to other banks, to make sure the Bank has sufficient liquidity. The business units’ liquidity needs are met through short–term transfers from the Financial Management Division to cover any short–term fluctuations and long–term financing to address all the structural liquidity requirements.
The Bank monitors its liquidity position every day, determining the future flows of its outlays and revenues. In addition, stress tests are performed at the close of each month, for which a variety of scenarios encompassing both normal market conditions and conditions of market fluctuation are used. The liquidity policy and procedures are subject to review and approval by the Bank’s Board. Periodic reports are generated by the Market Risk Department, providing a breakdown of the liquidity position of the Bank and its subsidiaries, including any exceptions and the corrective measures adopted, which are regularly submitted to the ALCO for review.
The Bank relies on demand deposits from Retail, Middle-Market and Corporates, obligations to banks, debt instruments, and time deposits as its main sources of funding. Although most obligations to banks, debt instruments and time deposits mature in over a year, customer (retail) and institutional deposits tend to have shorter maturities and a large proportion of them are payable within 90 days. The short–term nature of these deposits increases the Bank’s liquidity risk, and hence, the Bank actively manages this risk by continual supervision of the market trends and price management.
Liquidity Measures Implemented by the Central Bank of Chile as a Result of the COVID-19 Pandemic
In response to the COVID-19 pandemic, the Chilean Central Bank has made two lines of credit available to banks to reinforce their liquidity, amounting to a total of US$24 billion for the whole banking system. These lines of credit bear interest at the Central Bank’s monetary policy rate (MPR), which was 0.5% as of December 31, 2020. Pursuant to these lines of credit, a bank may borrow up to 3% of the aggregate amount of its consumer and commercial loan portfolios as of February 29, 2020 and may borrow up to an additional 12% if it uses the funds to provide loans to companies and individuals. The first line of credit is a facility available conditionally on loan growth (the “FCIC”) to ensure that banks continue to finance households and businesses in Chile. Loans provided under this line of credit may have maturities of up to 4 years and must be secured by government bonds, corporate bonds or highly rated large commercial loans as collateral. Loans provided under the second line of credit, the LCL, are unsecured and may have maturities of up to 2 years. In addition, borrowings by a bank under the LCL are limited to the aggregate amount of the liquidity reserve requirements of such bank. Ultimately, these lines of credit are intended to ensure banks have ample liquidity to enable them to continue financing Small to Mid-size Enterprises (“SMEs”) and Middle-market companies. As of December 31, 2020, we had borrowed Ch$4,959,260 billion (US$7 billion) under these lines of credit or 9.5% of our total liabilities. We cannot assure that in the event of a sudden or unexpected shortage of funds in the banking system, we will be able to maintain levels of funding without incurring higher funding costs, a reduction in the term of funding instruments or the liquidation of certain assets. If this were to happen, we could be materially adversely affected.
192
Liquidity risk management seeks to ensure that, even under adverse conditions, we have access to the funds necessary to cover client needs, maturing liabilities and capital requirements. Liquidity risk arises in the general funding for our financing, trading and investment activities. It includes the risk of unexpected increases in the cost of funding the portfolio of assets at appropriate maturities and rates, the risk of being unable to liquidate a position in a timely manner at a reasonable price and the risk that we will be required to repay liabilities earlier than anticipated. The following table sets forth the balance of ourALCO now uses as its liquidity portfolio managedthose defined by our Financial Management Division in the manner in which it is presented to the AssetFMC and Liability Committee (ALCO) and the Board. The ALCO has determined that our liquidity portfolio must be comprised of cash plus assets that can be readily convertible into cash either through the Chilean Central Bank, window, overnight deposits or instruments orwhich are in line with those established in BIS III. As of December 31, 2020, the local secondary market. The managementbreakdown of the Bank’s liquidity portfolio is performedliquid assets by levels was the Financial Management Division under rules determined by the ALCO and based on classifications by the SBIF and the Bank’s management.following:
| December 31, 2018 | December 31, 2017 | |||||||
| Ch$ million | ||||||||
| Balance as of: | ||||||||
| Financial investments for trading | 77,041 | 485,736 | ||||||
| Available-for-sale investments | 2,394,323 | 2,574,546 | ||||||
| Encumbered assets (net) (1) | (48,843 | ) | (268,330 | ) | ||||
| Net cash (2) | 149,321 | (37,628 | ) | |||||
| Net interbank deposits (3) | 967,095 | 768,595 | ||||||
| Total liquidity portfolio | 3,538,937 | 3,522,919 | ||||||
| December 31, 2020 | December 31, 2019 | |||||||
| (Ch$ million) | ||||||||
| Balance as of: | ||||||||
| Cash and cash equivalent | 988,320 | 1,305,534 | ||||||
| Level 1 liquid assets (1) | 2,490,810 | 2,452,599 | ||||||
| Level 2 liquid assets (2) | 12,681 | 15,105 | ||||||
| Total liquid assets | 3,491,811 | 3,773,238 | ||||||
| December 31, 2018 | December 31, 2017 | |||||||
| Ch$ million | ||||||||
| Average balance as of: | ||||||||
| Financial investments for trading | 259,654 | 457,546 | ||||||
| Available-for-sale investments | 2,690,184 | 2,562,753 | ||||||
| Encumbered assets (net) (1) | (134,408 | ) | (254,563 | ) | ||||
| Net cash (2) | 109,757 | (49,425 | ) | |||||
| Net interbank deposits (3) | 613,259 | 1,025,280 | ||||||
| Total liquidity portfolio | 3,538,446 | 3,741,591 | ||||||
____________________
| (1) | Includes instruments issued by the Central Bank of Chile or other central banks with a AAA rating, instruments issued by the Chilean government or other sovereign with a AAA rating and instruments issued by development banks with a AAA rating. Assets encumbered through repurchase agreements are deducted from the liquidity portfolio including those left as collateral under the FCIC funding program with the Central Bank of Chile. |
| (2) |
| December 31, 2020 | December 31, 2019 | |||||||
| (Ch$ million) | (Ch$ million) | |||||||
| Average balance as of: | ||||||||
| Cash and cash equivalent | 1,161,367 | 1,618,667 | ||||||
| Level 1 liquid assets (1) | 3,164,890 | 2,674,995 | ||||||
| Level 2 liquid assets (2) | 13,311 | 16,927 | ||||||
| Total liquid assets | 4,339,568 | 4,309,589 | ||||||
____________________
| (1) | Includes instruments issued by the Central Bank of Chile or other central banks with a AAA rating, instruments issued by the Chilean government or other sovereign with a AAA rating and instruments issued by development banks with a AAA rating. Assets encumbered through repurchase agreements are deducted from the liquidity portfolio including those left as collateral under the FCIC funding program with the Central Bank of Chile. |
| Includes |
The Central Bank and our ALCO also requires us to comply with the following liquidity limits:
New liquidity requirements in line with BIS III
The SBIF and the Chilean Central Bank published new liquidity corporate governance standards and ratios that must be implemented and calculated by all banks. These will eventually replace the current regulatory limits imposed by the SBIF and the Central Bank described above. These new liquidity standards are in line with those established in BIS III. The most important liquidity ratios that will eventually be adopted by Chilean banks are:
| ||||
(1) Includes instruments issued by the Central Bank of Chile or other central banks with a AAA rating, instruments issued by the Chilean government or other sovereign with a AAA rating and instruments issued by development banks with a AAA rating.
(2) Includes instruments issued by governments, central banks and development banks of foreign countries with a risk rating of A- to AA+ and mortgage bonds issued by Chilean banks that are acceptable at the Chilean Central Bank’s repo window.
| Liquidity coverage ratio (LCR), which measures the percentage of Liquid Assets over Net Cash Outflows. |
| Net Stable Funding Ratio (NSFR) which will measure a bank’s stable funding sources over required stables needs both concepts also defined in the new regulations. As of December 31, |
193
| · | The sum of the liabilities with a maturity of less than 30 days may not exceed the sum of the assets with a maturity of less than 30 days by an amount greater than our capital. This limit must be calculated in local currency and foreign currencies together as one gap. At December 31, 2020, the percentage of (i) our liabilities with a maturity of less than 30 days in excess of our assets with a maturity of less than 30 days to (ii) our capital and reserves was 57%, thus resulting in our compliance. |
| · | The sum of the liabilities in foreign currency with a maturity of less than 30 days may not exceed the sum of the assets in foreign currency with a maturity of less than 30 days by more than an amount greater than our capital. At December 31, 2020 the percentage of (i) our liabilities with a maturity of less than 30 days in foreign currency in excess of our assets in foreign currency with a maturity of less than 30 days to (ii) our capital and reserves was 11%, as the Bank had more foreign currency assets than liabilities for the calculation of this limit, thus resulting in our compliance. |
| · | The sum of the liabilities with a maturity of less than 90 days may not exceed the sum of the assets with a maturity of less than 90 days by more than 2 times our capital. This limit must be calculated in local currency and foreign currencies together as one gap. At December 31, 2020 the percentage of (i) our liabilities with a maturity of less than 90 days in excess of our assets with a maturity of less than 90 days to (ii) two times our capital and reserves was 45%, thus resulting in our compliance. |
Market risk management
The Bank’s internal management of market risk is based chiefly on the procedures and standards of Santander Spain, which are in turn based on analysis of management in three principal components:
| trading portfolio; |
| local financial management portfolio; and |
| foreign financial management portfolio. |
The trading portfolio is comprised chiefly of investments valued at fair market value and free of any restriction on their immediate sale, which are often bought and sold by the Bank with the intention of selling them in the short term to benefit from short–term price fluctuations. The trading portfolio also includes the Bank’s exposure to foreign currency. The financial management portfolios include all the financial investments not considered to be part of trading portfolio.
Market risk – management of trading portfolio
The Bank applies VaR methodologies to measure the market risk of its trading portfolio. The Bank has a consolidated commercial position comprised of fixed–income investments and foreign currency trading. This portfolio is comprised mostly of Central Bank of Chile bonds, mortgage bonds, locally issued, low–risk corporate bonds and foreign currencies, mainly U.S. dollars. At the end of each year, the trading portfolio included no stock portfolio investments.
For the Bank, the VaR estimate is made under the historical simulation methodology, which consists of observing the behavior of the profits and losses that would have occurred in the current portfolio if the market conditions for a given historical period had been in force, in order to infer the maximum loss on the basis of that information, with a given degree of confidence. The methodology has the advantage of precisely reflecting the historical distribution of the market variables and not requiring any assumptions regarding the distribution of specific probabilities. All the VaR measures are intended to determine the distribution function for a change in the value of a given portfolio, and once that distribution is known, to calculate the percentile related to the necessary degree of confidence, which will be equal to the value at risk by virtue of those parameters. As calculated by the Bank, the VaR is an estimate of the maximum expected loss of market value for a given portfolio over a 1–day horizon, with a 99.00% confidence level. It is the maximum 1–day loss that the Bank could expect to experience in a given portfolio, with a 99.00% confidence level. In other words, it is the loss that the Bank would expect to experience only 1.0% of the time. The VaR provides a single estimate of market risk which is not comparable from one market risk to another. Returns are calculated through the use of a 2–year time window or at least 520 data points obtained since the last reference date for calculation of the VaR going backward in time.
194
We do not calculate three separate VaRs. We calculate a single VaR for the entire trading portfolio, which in addition is segregated by risk type. The VaR software performs a historical simulation and calculates a Profit and Loss Statement (P&L) for 520 data points (days) for each risk factor (fixed income, foreign currency and variable income.) The P&L of each risk factor is added together and a consolidated VaR is calculated with 520 points or days of data. At the same time a VaR is calculated for each risk factor based on the individual P&L calculated for each individual risk factor .factor. Furthermore, a weighted VaR is calculated in the manner described above, but which gives a greater weighting to the 30 most recent data points. The larger of the two VaRs is the one that is reported. In 2018, 20172020, 2019 and 2016,2018, we used the same VaR model and there has been no change in methodology or assumptions for subsequent periods.
The Bank uses the VaR estimates to provide a warning when the statistically estimated incurred losses in its trading portfolio would exceed prudent levels, and hence, there are certain predetermined limits.
Limitations of the VaR model
When applying a calculation methodology, no assumptions are made regarding the probability distribution of the changes in the risk factors; the historically observed changes are used for the risk factors on which each position in the portfolio will be valued.
It is necessary to define a valuation function fj(xi) for each instrument j, preferably the same one used to calculate the market value and income of the daily position. This valuation function will be applied in each scenario to generate simulated prices for all the instruments in each scenario.
In addition, the VaR methodology is subject to the following limitations:
| Changes in market rates and prices may not be independent and identically distributed random variables, and may not have a normal distribution; in particular, the assumption of normal distribution may underestimate the probability of extreme market movements; |
| The historical data used by the Bank may not provide the best estimate of the joint distribution of changes in the risk factors in the future, and any modification of the data may be inadequate; In particular, the use of historical data may fail to capture the risk of potential extreme and adverse market fluctuations, regardless of the time period used; |
| A 1–day time horizon may not fully capture the market risk positions which cannot be liquidated or covered in a single day; it would not be possible to liquidate or cover all the positions in a single day; |
| The VaR is calculated at the close of business, but trading positions may change substantially in the course of the trading day; |
| The use of a 99% degree of confidence does not take account of, or make any statement about, the losses that could occur outside of that degree of confidence; and |
| A model such as the VaR does not capture all the complex effects of the risk factors over the value of the positions or portfolios, and accordingly, it could underestimate potential losses. |
At no time in 2018, 2017 and 2016 did the Bank exceed the VaR limits in respect of the three components which comprise the trading portfolio: fixed–income investments, variable–income investments and foreign currency investments. We perform back-testing daily and generally find that trading losses exceed our VaR estimate approximately one out of every 100 trading days. At the same time, we set a limit to the maximum VaR that we are willing to accept over our trading portfolio. In 2018,Also, a maximum VaR limit was established that can be applied over the Bank remained withintrading portfolio. The VaR as of December 31, 2020 was US$ 2.62 million, which is below the maximum limit it had set for VaR, including those instances in which the actual VaR exceeded the estimate.total limit.
195
The high, low, and average levels for each component and each year below were as follows:
| Consolidated | 2018 | 2017 | 2016 | 2020 | 2019 | 2018 | ||||||||||||||||||
| (in millions of U.S.$) | (in millions of U.S.$) | |||||||||||||||||||||||
| VaR: | ||||||||||||||||||||||||
| VaR | ||||||||||||||||||||||||
| High | 5.23 | 5.71 | 3.95 | 12.82 | 15.78 | 5.23 | ||||||||||||||||||
| Low | 1.21 | 1.56 | 1.08 | 1.94 | 1.33 | 1.21 | ||||||||||||||||||
| Average | 2.01 | 3.01 | 2.25 | 4.45 | 3.06 | 2.01 | ||||||||||||||||||
| Fixed–income investments: | ||||||||||||||||||||||||
| Fixed-income investments | ||||||||||||||||||||||||
| High | 2.54 | 5.51 | 2.71 | 11.96 | 9.77 | 2.54 | ||||||||||||||||||
| Low | 1.19 | 1.15 | 0.55 | 1.5 | 1.18 | 1.19 | ||||||||||||||||||
| Average | 1.71 | 2.36 | 1.33 | 3.19 | 2.33 | 1.71 | ||||||||||||||||||
| Variable–income investments: | ||||||||||||||||||||||||
| Variable-income investments | ||||||||||||||||||||||||
| High | 0.01 | 0.01 | 0.03 | 0.01 | 0.00 | 0.01 | ||||||||||||||||||
| Low | 0.00 | 0.00 | 0.00 | - | 0.01 | 0.00 | ||||||||||||||||||
| Average | 0.00 | 0.00 | 0.00 | - | 0.00 | 0.00 | ||||||||||||||||||
| Foreign currency investments: | ||||||||||||||||||||||||
| Foreign currency investments | ||||||||||||||||||||||||
| High | 4.29 | 4.21 | 3.83 | 6.47 | 6.05 | 4.29 | ||||||||||||||||||
| Low | 0.09 | 0.53 | 0.61 | 0.71 | 0.10 | 0.09 | ||||||||||||||||||
| Average | 1.14 | 1.71 | 1.91 | 2.85 | 1.60 | 1.14 | ||||||||||||||||||
Below is a graph that illustrates the daily VaR levels at 99% over a one-day horizon in 2019 and 2020.
Market risk – local and foreign financial management
The Bank’s financial management portfolio includes most of the Bank’s non–trading assets and liabilities, including the credit/loan portfolio. For these portfolios, investment and financing decisions are strongly influenced by the Bank’s commercial strategies.
196
The Bank uses a sensitivity analysis to measure the market risk of local and foreign currency (not included in the trading portfolio). The Bank performs a simulation of scenarios, which will be calculated as the difference between the present value of the flows in the chosen scenario (a curve with a parallel movement of 100 bps in all its segments) and their value in the base scenario (current market). All the inflation–indexed local currency (UF) positions are adjusted by a sensitivity factor of 0.57, which represents a 57 basis point change in the rate curve for the real rates and a 100 basis point change for the nominal rates. The same scenario is performed for the net foreign currency positions and the interest rates in U.S. dollars. The Bank has also established limits in regard to the maximum loss which these interest rate movements could impose on the capital and net financial income budgeted for the year.
Limitations of the sensitivity models
The most important assumption is the use of a 100 basis point change in the yield curve (57 basis points for the real rates). The Bank uses a 100 basis point change because sudden changes of that magnitude are considered realistic. The Santander Spain Global Risk Department has established comparable limits by country, to be able to compare, monitor and consolidate the market risk by country in a realistic and orderly way. In addition, the sensitivity simulation methodology should be interpreted with consideration for the following limitations:
| The simulation of scenarios assumes that the volumes remain in the Bank’s Consolidated General Balance Sheet and are always renewed at maturity, thereby omitting the fact that certain credit risk and prepayment considerations may affect the maturity of certain positions. |
| This model assumes an identical change along the entire length of the yield curve and takes no account of the different movements for different maturities. |
| The model takes no account of the sensitivity of volumes which results from interest rate changes. |
| The limits to losses of budgeted financial income are calculated on the basis of the financial income foreseen for the year, which may not be actually earned, meaning that the real percentage of financial income at risk may be higher than the expected one. |
Market Risk – Financial management portfolio – December 31, 2018, 20172020, 2019 and 20162018
| 2018 | 2017 | 2016 | 2020 | 2019 | 2018 | |||||||||||||||||||||||||||||||||||||||||||
Effect on net | Effect on | Effect on net | Effect on | Effect on net | Effect on | Effect on net interest income | Effect on equity | Effect on net interest income | Effect on equity | Effect on net interest income | Effect on equity | |||||||||||||||||||||||||||||||||||||
| Financial management portfolio – local currency (in millions of Ch$) | ||||||||||||||||||||||||||||||||||||||||||||||||
| Loss limit | 48,000 | 192,001 | 48,000 | 175,000 | 48,000 | 175,000 | 100,000 | 329,275 | 100,000 | 275,000 | 48,000 | 192,001 | ||||||||||||||||||||||||||||||||||||
| High | 43,742 | 189,725 | (37,148 | ) | (141,287 | ) | 30,853 | 146,208 | 66,504 | 302,263 | 32,719 | 273,473 | 43,742 | 189,725 | ||||||||||||||||||||||||||||||||||
| Low | 27,854 | 170,450 | (22,958 | ) | (112,818 | ) | 21,978 | 108,249 | 26,492 | 214,596 | 12,686 | 145,338 | 27,854 | 170,450 | ||||||||||||||||||||||||||||||||||
| Average | 37,569 | 180,972 | (29,110 | ) | (128,506 | ) | 26,119 | 120,159 | 45,380 | 255,070 | 24,719 | 228,772 | 37,569 | 180,972 | ||||||||||||||||||||||||||||||||||
| Financial management portfolio – foreign currency (in millions of U.S.$) | ||||||||||||||||||||||||||||||||||||||||||||||||
| Loss limit | 30 | 75 | 30 | 75 | 30 | 75 | 32 | 53 | 30 | 75 | 30 | 75 | ||||||||||||||||||||||||||||||||||||
| High | 12 | 38 | 16 | 42 | 14 | 35 | 19 | 47 | 20 | 35 | 12 | 38 | ||||||||||||||||||||||||||||||||||||
| Low | 4 | (10 | ) | 4 | 15 | 6 | 13 | 2 | 12 | 5 | 1 | 4 | (10 | ) | ||||||||||||||||||||||||||||||||||
| Average | 9 | 22 | 10 | 23 | 10 | 26 | 5 | 33 | 12 | 12 | 9 | 22 | ||||||||||||||||||||||||||||||||||||
| Financial management portfolio – consolidated (in millions of Ch$) | ||||||||||||||||||||||||||||||||||||||||||||||||
| Loss limit | 48,000 | 192,002 | 48,000 | 175,000 | 48,000 | 175,000 | 100,000 | 329,275 | 100,000 | 275,000 | 48,000 | 192,002 | ||||||||||||||||||||||||||||||||||||
| High | 45,492 | 192,848 | (38,249 | ) | (142,442 | ) | 31,764 | 145,566 | 67,584 | 286,436 | 34,462 | 271,989 | 45,492 | 192,848 | ||||||||||||||||||||||||||||||||||
| Low | 29,167 | 168,766 | (23,571 | ) | (112,277 | ) | 23,088 | 107,959 | 25,111 | 210,706 | 15,236 | 143,836 | 29,167 | 168,766 | ||||||||||||||||||||||||||||||||||
| Average | 38,908 | 182,557 | (29,948 | ) | (128,360 | ) | 27,390 | 119,632 | 46,044 | 246,292 | 27,918 | 227,303 | 38,908 | 182,557 | ||||||||||||||||||||||||||||||||||
197
Market risk –Regulatory method
The following table illustrates our market risk exposure according to the Chilean regulatory method, as of December 31, 2018.2020. This information is sent to the SBIFFMC on a quarterly basis. Our maximum exposure to long-term interest rate fluctuations is set at 35% of regulatory capital and is approved by the Board of Directors.
| Regulatory Market Risk | As of December 31, | 2020 | |||
| (Ch$ million) | |||||
| Market risk of trading portfolio (EMR) | |||||
| Interest rate risk of trading portfolio | |||||
| Foreign currency risk of trading portfolio | |||||
| Risk from interest rate options | |||||
| Risk from foreign currency options | |||||
| Total market risk of trading portfolio | |||||
| 10% x Risk-weighted assets | |||||
| Subtotal | |||||
| Limit = Regulatory Capital | |||||
| Available margin | |||||
| Non-trading portfolio market risk | |||||
| Short-term interest rate risk | |||||
| Inflation risk | |||||
| Long-term interest rate risk | |||||
| Total market risk of non-trading portfolio | |||||
| Regulatory limit of exposure to short-term interest rate and inflation risk | |||||
| Short-term exposure to interest rate risk | |||||
| Exposure to inflation risk | |||||
| Limit: | |||||
| 464,402 | |||||
| Available margin | |||||
| Regulatory limit of exposure to long-term interest rate risk | |||||
| Long-term exposure to interest rate risk | |||||
| 35% of regulatory capital | |||||
| Available margin | |||||
Derivative activities
At December 31, 2018, 20172020, 2019 and 2016,2018, derivatives are valued at market price on the balance sheet and the net unrealized gain (loss) on derivatives is classified as a separate line item on the income statement. Notional amounts are not recorded on the balance sheet. Banks must mark to market derivatives. A derivative financial instrument held for trading purposes must be marked to market and the unrealized gain or loss recognized in the income statement. The SBIFFMC recognizes three kinds of hedge accounting: (i) cash flow hedges, (ii) fair value hedges and (iii) hedging of foreign investments.
| When a cash flow hedge exists, the fair value movements on the part of the hedging instrument that is effective are recognized in equity. Any ineffective portion of the fair value movement on the hedging instrument is recognized in the income statement. |
| When a fair value hedge exists, the fair value movements on the hedging instrument and the corresponding fair value movements on the hedged item are recognized in the income statement. Hedged items in the balance sheet are presented at their market value. |
198
| When a hedge of foreign investment exposure exists (i.e. investment in a foreign branch), the fair value movements on the part of the hedging instrument that is effective are recognized in equity. Any ineffective portion of the fair value movement on the hedging instrument is recognized in the income statement. |
In order to reduce the credit risk in its derivative contracts, the Bank has entered into Credit Support Annex (CSA) agreements with the majority of its counterparties, which include obligations to post daily cash collateral. The majority of the agreements include an obligation to post collateral with a threshold amount of zero. In the table below we identify those contracts with CSA and breakdown the fair value of our derivative portfolio by collateral threshold requirements for 20182020 and 2017.2019.
| Fair value of derivative contracts | 2018 | 2017 | ||||||||||||||||||||||||||||||
| Fair value of derivative contracts | ||||||||||||||||||||||||||||||||
| Asset | Liabilities | Asset | Liability | 2020 | 2019 | |||||||||||||||||||||||||||
| Assets | Liabilities | Assets | Liabilities | |||||||||||||||||||||||||||||
| Derivative contracts with zero threshold collateral amount in CSA | 2,639,835 | 2,133,149 | 1,898,220 | 1,773,471 | 8,127,263 | 7,900,539 | 7,478,837 | 6,748,219 | ||||||||||||||||||||||||
| Derivative contracts with threshold collateral amounts in CSA that are greater than zero | 344,520 | 262,683 | 221,030 | 316,840 | 471,529 | 606,661 | 532,298 | 517,814 | ||||||||||||||||||||||||
| Derivative contracts without CSA agreements | 116,280 | 121,896 | 119,397 | 49,177 | 433,293 | 511,460 | 137,472 | 124,621 | ||||||||||||||||||||||||
| Total | 3,100,635 | 2,517,728 | 2,238,647 | 2,139,488 | 9,302,085 | 9,018,660 | 8,148,607 | 7,390,654 | ||||||||||||||||||||||||
We classify some of our derivative financial instruments as being financial assets held for trading, due to the guidelines from the SBIF.FMC. We enter into derivative contracts with some clients who seek hedging instruments. However, substantially all of our derivatives are not actually used for speculative purposes or trading. We also use derivatives to hedge our exposure to foreign exchange, interest rate and inflation risks. We had the following derivative financial instruments portfolio as of December 31, 2018, 20172020, 2019 and 2016:2018:
| Derivative financial instruments portfolio | ||||||||||||||||||||
| As of December 31, 2020 | ||||||||||||||||||||
| Notional amounts | Fair Value | |||||||||||||||||||
| Up to 3 months | More than 3 months to one year | More than one year | Assets | Liabilities | ||||||||||||||||
| (Ch$ million) | ||||||||||||||||||||
| Fair value hedge derivative instruments | ||||||||||||||||||||
| Interest rate swaps | 50,000 | 410,687 | 5,064,113 | 33,816 | 83,666 | |||||||||||||||
| Cross currency swaps | 317,400 | 601,987 | 5,634,700 | 294,562 | 178,529 | |||||||||||||||
| Subtotal | 367,400 | 1,012,674 | 10,698,813 | 328,378 | 262,195 | |||||||||||||||
| Cash Flow hedge derivative instruments | ||||||||||||||||||||
| Currency forwards | 2,121,326 | 503,280 | 601,582 | 2,985 | 3,556 | |||||||||||||||
| Cross currency swaps | 424,358 | 498,373 | 9,777,491 | 35,902 | 183,386 | |||||||||||||||
| Subtotal | 2,545,684 | 1,001,653 | 10,379,073 | 38,887 | 186,942 | |||||||||||||||
| Derivative instruments for trading | ||||||||||||||||||||
| Currency forwards | 22,729,787 | 12,175,074 | 8,215,576 | 1,085,327 | 1,158,904 | |||||||||||||||
| Interest rate swaps | 14,006,503 | 22,118,742 | 97,803,009 | 3,651,651 | 3,588,912 | |||||||||||||||
| Cross currency swaps | 6,719,065 | 15,138,056 | 138,352,345 | 3,921,440 | 3,819,446 | |||||||||||||||
| Call currency options | 129,339 | 31,641 | 57,581 | 1,527 | 909 | |||||||||||||||
| Put currency options | 112,145 | 16,173 | 58,276 | 4,875 | 1,352 | |||||||||||||||
| Subtotal | 43,696,839 | 49,479,686 | 244,486,787 | 8,664,820 | 8,569,523 | |||||||||||||||
| Total | 46,609,923 | 51,494,013 | 265,564,673 | 9,032,085 | 9,018,660 | |||||||||||||||
199
| Derivative financial instruments portfolio | ||||||||||||||||||||
| As of December 31, 2019 | ||||||||||||||||||||
| Notional amounts | Fair Value | |||||||||||||||||||
| Up to 3 months | More than 3 months to one year | More than one year | Assets | Liabilities | ||||||||||||||||
| (Ch$ million) | ||||||||||||||||||||
| Fair value hedge derivative instruments | ||||||||||||||||||||
| Interest rate swaps | 381,638 | 317,610 | 1,847,138 | 39,460 | 34,264 | |||||||||||||||
| Cross currency swaps | 407,008 | 863,984 | 13,357,058 | 226,870 | 295,281 | |||||||||||||||
| Subtotal | 788,646 | 1,181,594 | 15,204,196 | 266,330 | 329,545 | |||||||||||||||
| Cash Flow hedge derivative instruments | ||||||||||||||||||||
| Currency forwards | 99,105 | 1,018,656 | 768,256 | 4,131 | 3,505 | |||||||||||||||
| Cross currency swaps | 2,266,907 | 1,938,222 | 10,848,233 | 106,413 | 43,183 | |||||||||||||||
| Subtotal | 2,366,012 | 2,956,878 | 11,616,489 | 110,544 | 46,688 | |||||||||||||||
| Derivative instruments for trading | ||||||||||||||||||||
| Currency forwards | 28,472,586 | 18,508,702 | 7,679,464 | 1,023,684 | 1,137,496 | |||||||||||||||
| Interest rate swaps | 16,678,487 | 40,892,909 | 89,109,046 | 2,465,235 | 2,270,686 | |||||||||||||||
| Cross currency swaps | 7,726,724 | 20,457,463 | 113,206,678 | 4,277,450 | 3,605,516 | |||||||||||||||
| Call currency options | 17,971 | 47,012 | 81,804 | 5,176 | 240 | |||||||||||||||
| Call interest rate options | - | - | - | - | - | |||||||||||||||
| Put currency options | 16,409 | 41,872 | 80,655 | 190 | 483 | |||||||||||||||
| Subtotal | 52,912,177 | 79,947,958 | 210,157,647 | 7,771,735 | 7,014,421 | |||||||||||||||
| Total | 56,066,835 | 84,086,430 | 236,978,332 | 8,148,609 | 7,390,655 | |||||||||||||||
| Derivative financial instruments portfolio | ||||||||||||||||||||
| As of December 31, 2018 | ||||||||||||||||||||
| Notional amounts | Fair Value | |||||||||||||||||||
| Up to 3 months | More than 3 months to one year | More than one year | Assets | Liabilities | ||||||||||||||||
| (Ch$ million) | ||||||||||||||||||||
| Fair value hedge derivative instruments | ||||||||||||||||||||
| Interest rate swaps | 80,000 | 491,600 | 1,191,012 | 14,789 | 9,188 | |||||||||||||||
| Cross currency swaps | — | 1,276,909 | 6,706,197 | 96,357 | 36,708 | |||||||||||||||
| Subtotal | 80,000 | 1,768,509 | 7,897,209 | 111,146 | 45,896 | |||||||||||||||
| Cash Flow hedge derivative instruments | ||||||||||||||||||||
| Currency forwards | 205,750 | 168,151 | — | — | 8,013 | |||||||||||||||
| Cross currency swaps | 1,920,900 | 1,970,412 | 9,191,209 | 79,859 | 32,712 | |||||||||||||||
| Subtotal | 2,126,650 | 2,138,563 | 9,191,209 | 79,859 | 40,725 | |||||||||||||||
| Derivative instruments for trading | ||||||||||||||||||||
| Currency forwards | 15,301,943 | 13,080,875 | 6,062,183 | 613,063 | 466,741 | |||||||||||||||
| Interest rate swaps | 12,024,095 | 22,064,681 | 69,453,618 | 723,870 | 577,835 | |||||||||||||||
| Cross currency swaps | 2,173,111 | 8,853,306 | 68,976,339 | 1,568,365 | 1,385,314 | |||||||||||||||
| Call currency options | 26,731 | 60,235 | 57,579 | 4,332 | 854 | |||||||||||||||
| Call interest rate options | — | — | — | — | — | |||||||||||||||
| Put currency options | 23,411 | 50,445 | 56,392 | — | 363 | |||||||||||||||
| Subtotal | 29,549,291 | 44,109,542 | 144,606,111 | 2,909,630 | 2,431,107 | |||||||||||||||
| Total | 31,755,941 | 48,016,614 | 161,694,529 | 3,100,635 | 2,517,728 | |||||||||||||||
| Derivative financial instruments portfolio | As of December 31, 2017 | |||||||||||||||||||
| Notional amounts | Fair Value | |||||||||||||||||||
| Up to 3 months | More than 3 months to one year | More than one year | Assets | Liabilities | ||||||||||||||||
| (Ch$ million) | ||||||||||||||||||||
| Fair value hedge derivative instruments | ||||||||||||||||||||
| Interest rate swaps | — | 162,985 | 1,554,171 | 23,003 | 1,424 | |||||||||||||||
| Cross currency swaps | — | 715,701 | 5,362,772 | 15,085 | 65,724 | |||||||||||||||
| Subtotal | — | 878,686 | 6,916,943 | 38,088 | 67,148 | |||||||||||||||
| Cash Flow hedge derivative instruments | ||||||||||||||||||||
| Currency forwards | 801,093 | 218,982 | — | 39,233 | 59 | |||||||||||||||
| Cross currency swaps | 421,428 | 1,637,604 | 6,672,566 | 36,403 | 128,355 | |||||||||||||||
| Subtotal | 1,222,521 | 1,856,586 | 6,672,566 | 75,636 | 128,414 | |||||||||||||||
| Derivative instruments for trading | ||||||||||||||||||||
| Currency forwards | 17,976,683 | 10,679,327 | 3,091,393 | 412,994 | 502,555 | |||||||||||||||
| Interest rate swaps | 9,069,964 | 14,389,389 | 46,342,779 | 467,188 | 392,366 | |||||||||||||||
| Cross currency swaps | 2,963,641 | 7,503,144 | 47,111,371 | 1,241,632 | 1,042,120 | |||||||||||||||
| Call currency options | 190,386 | 37,099 | 49,853 | 1,322 | 1,950 | |||||||||||||||
| Call interest rate options | — | — | — | — | — | |||||||||||||||
| Put currency options | 192,722 | 28,616 | 50,470 | 1,787 | 4,935 | |||||||||||||||
| Subtotal | 30,393,396 | 32,637,575 | 96,645,866 | 2,124,923 | 1,943,926 | |||||||||||||||
| Total | 31,615,917 | 35,372,847 | 110,235,375 | 2,238,647 | 2,139,488 | |||||||||||||||
200
| As of December 31, 2016 | ||||||||||||||||||||
| Notional amounts | Fair Value | |||||||||||||||||||
| Up to 3 months | More than 3 months to one year | More than one year | Assets | Liabilities | ||||||||||||||||
| (Ch$ million) | ||||||||||||||||||||
| Fair value hedge derivative instruments | ||||||||||||||||||||
| Interest rate swaps | 74,086 | 514,454 | 1,402,870 | 38,977 | 211 | |||||||||||||||
| Cross currency swaps | 424,086 | 505,902 | 1,239,490 | 32,640 | 32,868 | |||||||||||||||
| Subtotal | 498,172 | 1,020,356 | 2,642,360 | 71,617 | 33,079 | |||||||||||||||
| Cash Flow hedge derivative instruments | ||||||||||||||||||||
| Interest rate swaps | 915,879 | 639,939 | — | 10,216 | 3,441 | |||||||||||||||
| Cross currency swaps | 897,480 | 2,613,706 | 4,260,194 | 43,591 | 68,894 | |||||||||||||||
| Subtotal | 1,813,359 | 3,253,645 | 4,260,194 | 53,807 | 72,335 | |||||||||||||||
| Derivative instruments for trading | ||||||||||||||||||||
| Currency forwards | 15,840,731 | 11,240,251 | 3,358,765 | 185,618 | 209,955 | |||||||||||||||
| Interest rate swaps | 6,889,665 | 12,512,285 | 49,747,459 | 627,047 | 526,695 | |||||||||||||||
| Cross currency swaps | 3,966,443 | 7,589,201 | 53,148,109 | 1,562,068 | 1,449,549 | |||||||||||||||
| Call currency options | 73,943 | 20,994 | 2,664 | 521 | 5 | |||||||||||||||
| Call interest rate options | — | — | — | — | — | |||||||||||||||
| Put currency options | 52,143 | 7,892 | 2,664 | 104 | 542 | |||||||||||||||
| Other Derivatives | — | — | — | — | — | |||||||||||||||
| Subtotal | 26,822,925 | 31,370,623 | 106,259,661 | 2,375,358 | 2,186,746 | |||||||||||||||
| Total | 29,134,456 | 35,644,624 | 113,162,215 | 2,500,782 | 2,292,161 | |||||||||||||||
ITEM 12. DESCRIPTION OF SECURITIES OTHER THAN EQUITY SECURITIES
A. Debt Securities
Not applicable.
B. Warrants and Right
Not applicable.
C. Other Securities
Not applicable.
D. American Depositary Shares
Our Depositary is The Bank of New York Mellon, with its principal executive office located at One Wall Street, New York, N.Y. 10286.
Each ADS represents the right to receive 400 shares of Common Stock without par value.
Persons depositing or withdrawing shares or ADS holders must pay: | |
| $5.00 (or less) per 100 ADSs | Issuance of ADSs, including issuances resulting from a distribution of shares or rights or other property Cancellation of ADSs for the purpose of withdrawal, including if the Deposit Agreement terminates |
| $.05 (or less) per ADS (or a portion thereof) | Any cash distribution to ADS holders |
| A fee equivalent to the fee that would be payable if securities distributed to you had been deposited with the Depositary | Distribution of securities distributed to holders of deposited securities (including rights) that are distributed by the Depositary to ADS holders |
| $.05 (or less) per ADS (or a portion thereof) per calendar year | Depositary services |
| Registration and transfer fees | Transfer and registration of shares on our share register to or from the name of the Depositary or its agent when you deposit or withdraw shares |
| Expenses of the Depositary | Cable (including SWIFT), telex and facsimile transmissions (when expressly provided in the Deposit Agreement)
Converting foreign currency to U.S. dollars |
| Taxes and other governmental charges the Depositary or the custodian has to pay on any ADSs or shares underlying ADSs, such as stock transfer taxes, stamp duty or withholding taxes | As necessary |
| Any other charges incurred by the Depositary or its agents for servicing the shares or other deposited securities | As necessary |
201
The Depositary may collect any of its fees by deducting those fees from any cash distributions payable to owners, or by selling a portion of distributable property to pay the fees. The Depositary may also collect its annual fee for Depositary services and its fees for any other charges incurred by deducting those fees from any cash distributions or by directly billing ADS holders.
The Depositary may convert currency itself or through any of its affiliates and, in those cases, acts as principal for its own account and not as agent, advisor, broker or fiduciary on behalf of any other person and earns revenue, including, without limitation, transaction spreads, that it will retain for its own account. The revenue is based on, among other things, the difference between the exchange rate assigned to the currency conversion made under the Deposit Agreement and the rate that the Depositary or its affiliate receives when buying or selling foreign currency for its own account. The Depositary makes no representation that the exchange rate used or obtained in any currency conversion under the Deposit Agreement will be the most favorable rate that could be obtained at the time or that the method by which that rate will be determined will be the most favorable to ADS holders, subject to the Depositary’s obligations under the Deposit Agreement. The methodology used to determine exchange rates used in currency conversions is available upon request.
In performing its duties under the Deposit Agreement, the Depositary may use brokers, dealers, foreign currency dealers or other service providers that are owned by or affiliated with the Depositary and that may earn or share fees, spreads or commissions.
Direct and Indirect Payments
The Depositary has agreed to make payments to us to reimburse us for costs and expenses generally arising out of establishment and maintenance of the ADS program, waive fees and expenses for services provided to us by the Depositary or share revenue from the fees collected from ADS holders from time to time. Under certain circumstances, including termination of the program, we are required to repay to the Depositary amounts reimbursed in prior periods.
The reimbursements include direct payments (legal and accounting fees incurred in connection with preparation of Form 20-F and ongoing SEC compliance and listing requirements, listing fees, investor relations expenses, advertising and public relations expenses and fees payable to service providers for the distribution of hard copy materials to beneficial ADR holders in the Depositary Trust Company, such as information related to shareholders’ meetings and related voting instruction cards); and indirect payments (third-party expenses paid directly and fees waived).
In 2018,2020, the Depositary made direct payments and reimbursements to us in the gross amount of U.S.$1,301,296.851,650,366 for expenses related to investor relations of which 28.6%28.4% was withheld for tax purposes in the U.S.
ITEM 13. DEFAULTS, DIVIDEND ARREARAGES AND DELINQUENCIES
Not applicable.
ITEM 14. MATERIAL MODIFICATIONS TO THE RIGHTS OF SECURITY HOLDERS AND USE OF PROCEEDS
Not applicable.
ITEM 15. CONTROLS AND PROCEDURES
Conclusion Regarding the Effectiveness of Disclosure Controls and Procedures
As of December 31, 2018,2020, the Bank, under the supervision and with the participation of the Bank’s management, including its Disclosure Committee, the Chief Executive Officer, the Chief Financial Officer and the Financial Controller, performed an evaluation of the effectiveness of the design and operation of our disclosure controls and procedures (as defined in Rule 13a-15(e) under the Exchange Act). There are, as described below, inherent limitations to the effectiveness of any control system, including disclosure controls and procedures. Accordingly, even effective disclosure controls and procedures can provide only reasonable assurance of achieving their control objectives.
202
Based on such evaluation, the Bank’s Disclosure Committee, the Chief Executive Officer, the Chief Financial Officer and the Financial Controller concluded that the Bank’s disclosure controls and procedures were effective in ensuring that information relating to the Bank, including its consolidated subsidiaries, required to be disclosed in the reports it files under the Exchange Act is (1) recorded, processed, summarized and reported within the time periods specified in the SEC’s rules and forms, and (2) accumulated and communicated to the Bank’s management, including its Disclosure Committee and principal financial officers as appropriate to allow timely decisions regarding required disclosure.
Management’s Report on Internal Control Over Financial Reporting
The Bank’s management is responsible for establishing and maintaining adequate internal control over financial reporting as defined in Rule 13a-15(f) under the Exchange Act. The Bank’s internal control over financial reporting is a process designed by, or under the supervision of, the Bank’s principal executive and principal financial officers and effected by the Bank’s Board of Directors, management and other personnel, to provide reasonable assurance regarding the reliability of financial reporting and the preparation of financial statements for external purposes in accordance with IFRS-IASB and includes those policies and procedures that:
| Pertain to the maintenance of records that, in reasonable detail, accurately and fairly reflect the transactions and dispositions of the assets of the Bank; |
| Provide reasonable assurance that transactions are recorded as necessary to permit preparation of financial statements in accordance with IFRS-IASB, and that our receipts and expenditures are being made only in accordance with authorizations of the Bank’s management and directors; and |
| Provide reasonable assurance regarding prevention or timely detection of unauthorized acquisition, use or disposition of our assets that could have a material effect on the financial statements. |
Because of its inherent limitations, internal control over financial reporting, no matter how well designed may not prevent or detect misstatements, due to the possibility that a control can be circumvented or overridden or that misstatements due to error or fraud may occur that are not detected. Also, projections of any evaluation of effectiveness to future periods are subject to the risk that controls may become inadequate because of changes in conditions, or that the degree of compliance with the policies or procedures may deteriorate.
We have adapted our internal control over financial reporting to international standards and comply with the guidelines set by the Committee of Sponsoring Organizations of the Treadway Commission in its Internal
Control―Integrated Framework (2013). The general framework assigns to management specific responsibilities regarding the structure and effectiveness of the processes related directly and indirectly with the production of consolidated financial statements, as well as the controls needed to mitigate the risks inherent in these processes.
Under the supervision and with the participation of the Bank’s management, including the Disclosure Committee, the Chief Executive Officer, the Chief Financial Officer and the Financial Controller, we conducted an evaluation of the effectiveness of our internal control over financial reporting based on the criteria established in Internal Control—Integrated Framework (2013) issued by the Committee of Sponsoring Organizations of the Treadway Commission (“COSO”).
Based on this assessment, our management concluded that, as of December 31, 2018,2020, our internal control over financial reporting was effective based on those criteria.
Changes in Internal Control Over Financial Reporting
There has been no change in the Bank’s internal control over financial reporting (as defined in Rule 13a-15(f) under the Exchange Act) that occurred during the period covered by this Annual Report that has materially affected, or is reasonably likely to materially affect, internal control over financial reporting.
203
Our internal control over financial reporting as of December 31, 20182020 has been audited by an independent registered public accounting firm, as stated in its report, which is referenced belowbelow.
Report of Independent Registered Public Accounting Firm
For the report of PricewaterhouseCoopers Consultores Auditores SpA, independent registered public accounting firm, dated March 22, 2019,February 26, 2021, on the effectiveness of our internal control over financial reporting as of December 31, 2018,2020, see page F-2 of our Audited Consolidated Financial Statements.
ITEM 16A. AUDIT COMMITTEE FINANCIAL EXPERT
Our Board of Directors determined that one of the members of our Audit Committee, Rodrigo Vergara, met the requirements of an “audit committee financial expert” in accordance with SEC rules and regulations, in that he has an understanding of IFRS-IASB and financial statements, the ability to assess the general application of IFRS-IASB in connection with the accounting for estimates, accruals and reserves, experience analyzing and evaluating financial statements that present a breadth and level of complexity of accounting issues that are generally comparable to the breadth and complexity of issues that can reasonably be expected to be raised by our consolidated financial statements, an understanding of internal controls over financial reporting, and an understanding of audit committee functions. All three members of our Audit Committee have experience overseeing and assessing the performance of Santander-Chile and its consolidated subsidiaries and our external auditors with respect to the preparation, auditing and evaluation of our consolidated financial statements.
All three members of our Audit Committee are considered to be independent according to applicable NYSE criteria.
The Bank has adopted a code of ethics that is applicable to all of the Bank’s employees and a copy is included as an exhibit hereto. We will provide to any person without charge, upon request, a copy of our code of ethics. Please email accionistas@santander.cl to request a copy. Our code of ethics is available on our website, which does not form part of this Annual Report on Form 20-F, at www.santander.cl under the heading “Información Corporativa”.http://www.santander.cl/accionistas/pdf/otros_documentos/codigo_general_de_conducta_banco-santander.pdf
ITEM 16C. PRINCIPAL ACCOUNTANT FEES AND SERVICES
Amounts paid to the auditors for statutory audit and other services were as follows:
| 2018 | 2017 | |||||||
| (in millions of Ch$) | ||||||||
| Audit Fees | ||||||||
| - Statutory audit | 420 | 410 | ||||||
| - Audit-related regulatory reporting | 313 | 318 | ||||||
| - Other audit-related fees | 112 | 408 | ||||||
| Tax Fees | ||||||||
| - Compliance | — | — | ||||||
| - Advisory Services | — | — | ||||||
| Total | 845 | 1,136 | ||||||
| 2020 | 2019 | |||||||
| (in millions of Ch$) | ||||||||
| Audit Fees | ||||||||
| Statutory audit | 561 | 441 | ||||||
| Audit-related regulatory reporting | 330 | 322 | ||||||
| Other audit-related fees | 26 | 223 | ||||||
| Tax Fees | ||||||||
| Compliance | - | — | ||||||
| Advisory Services | - | — | ||||||
| Total | 917 | 986 | ||||||
Statutory audit: Consists of fees billed for professional services rendered in connection with the audit of our consolidated financial statements that are provided by PricewaterhouseCoopers Consultores Auditores SpA in 20182020 and 20172019 in connection with statutory and regulatory filings or engagements, and attest services.
Audit-related regulatory reporting: Consists of fees billed for assurance and related services that were specifically related to the performance of the audit and review of our filings under the Securities Act.
204
Tax fees: Consist of fees billed for related services that were specifically related to tax related matters such as assuring the Bank was in compliance with tax laws and other tax advisory services.
The Audit Committee is required to pre-approve the audit and non-audit services performed by the Bank auditors in order to assure that the provision of such services do not impair the audit firm’s independence.
In the first months of each year the Audit Committee proposes to the Board the appointment of the independent auditor. As a matter of policy, at that time, the Audit Committee pre-approves the audit and audit related services that the appointed auditors will be required to carry out during the year to comply with the applicable regulation. These services will be included in the corresponding audit contracts of the Bank with its principal auditing firm.
In addition, under such policy, non-recurring audit or audit-related services and all non-audit services provided by the Bank principal auditing firm or other auditing firms are subject to case-by-case approval by the Audit Committee.
The Chief Accounting Officer is in charge of managing the process and must report monthly to the Audit Committee detailing all services to be provided by auditors, and others requiring individual approval.
All services provided by the Bank principal auditing firm in 20182020 detailed in the table above were approved by the Audit and Compliance Committee.
ITEM 16D. EXEMPTIONS FROM THE LISTING STANDARDS FOR AUDIT COMMITTEES
Not applicable.
ITEM 16E. PURCHASES OF EQUITY SECURITIES BY THE ISSUER AND AFFILIATED PURCHASERS
In 2017,2020, neither Santander-Chile nor any of its affiliates purchased any of Santander-Chile’s equity securities.
ITEM 16F. CHANGE IN REGISTRANT’S CERTIFYING ACCOUNTANT
Not applicable.
ITEM 16G. CORPORATE GOVERNANCE
Summary Comparison of Corporate Governance Standards and NYSE Listed Company Standards
Our corporate governance standards, dictated by Chilean corporate law, differ from the standards followed by U.S. companies under the New York Stock Exchange (NYSE) listing standards in a number of ways. Consequently, you will not have the same protections afforded to shareholders of companies that are subject to all NYSE corporate governance requirements. The following is a non-exhaustive summary of a few key differences:
| Whether a company’s executive officers may serve as its directors – the NYSE standards do not prohibit a U.S. company’s executive officer from also serving as a director, whereas our corporate governance standards |
| Whether the shareholders must be given an opportunity to vote on equity-compensation plans – the NYSE standards require that shareholders be allowed to vote on all equity compensation plans of a U.S. company, whereas our corporate governance standards only require that shareholders be allowed to vote on director compensation. |
| The adoption and disclosure of corporate governance guidelines – the NYSE standards require all U.S. companies listed on the NYSE to adopt the NYSE corporate governance guidelines, whereas we follow the corporate governance guidelines established under Chilean law. |
205
As more than 50% of our voting power is held by another company, Santander Spain, we would be permitted to elect for certain exemptions under NYSE corporate governance standards if we were a U.S. company. Specifically, as a U.S. company, we could elect to be exempted from the requirements (i) that we have a majority of independent directors (as defined by the NYSE), (ii) that we have a nominating/corporate governance committee meeting certain conditions, and (iii) that we have a compensation committee meeting certain requirements. Because we would not be required to follow these standards if we were a U.S. company, we have not summarized the differences, if any, between these provisions and our own corporate governance procedures.
Summary of Corporate Governance Standards
For a summary of our Board’s corporate governance practices please see “Item 6C—Board Practices,”Practices” and “Item 10B—Memorandum and Articles of Association” which describesdescribe in detail the governing standards of the board committees. Santander-Chile has also adopted diverse measures to promote good corporate governance. Among the measures adopted are:
Santander-Chile has a commitment to transparency. This includes:
In addition, our corporate governance practices reflect the Santander Spain corporate governance framework described below.
In December 2012, primarily in response to the requirements of the European Banking Authority, our controlling shareholder, Santander Spain, adopted a corporate governance framework (Marco de Gobierno Interno del Grupo Santander). The purpose of the framework is to organize and standardize the corporate governance practices of Santander Spain and its most significant subsidiaries, including us, in order to enhance the ability of Santander Spain to manage the risks arising from its operations around the world.
The three pillars of the framework are (i) an organizational model based on functions subject to internal governance, (ii) terms of reference according to which Santander Spain exercises control and oversight over its subsidiaries and participates in specific decisions at the subsidiary level and (iii) corporate models establishing common guidelines for the management and control of Santander Spain’s subsidiaries, subject to local autonomy considerations. In general, the framework purports to implement organizational and procedural changes rather than mandating particular substantive outcomes. However, in some cases, and subject to the limitations set forth in the framework, the framework states that Santander Spain may require that its subsidiaries make substantive changes or take specific actions. The framework enables Santander Spain to participate in the decision-making processes of its subsidiaries by requiring its approval of certain decisions that may have a significant impact on the Santander Group as a whole due to their significance or potential risk, such as decisions relating to mergers and acquisitions, capital structure, dividends and risk appetite, among other things. The framework also requires that a single person at each subsidiary be in charge of each function subject to internal governance and gives Santander Spain the authority to participate in the appointment, evaluation and compensation of each such person.
By its own terms, the framework as a whole is premised on the legal and financial autonomy of the subsidiaries and does not empower Santander Spain to supplant its subsidiaries’ decision-making processes. Moreover, each of the three pillars of the framework is explicitly made subject to local legal requirements. Our Board of Directors approved the adoption of this corporate governance framework in April 2013, subject to certain overarching principles:
As a result of the precedence given to local legal requirements in the framework itself and in our Board of Directors’ adopting resolutions, we do not expect that the adoption of the corporate governance framework will affect our ability to comply with applicable corporate governance regulations, including SEC and NYSE rules applicable to foreign private issuers. For example, although one provision of the framework states that we must obtain Santander Spain’s approval for our audit plan and that Santander Spain may request additional audits at its discretion, to the extent that this provision of the framework would prevent our Audit Committee from fulfilling any of the requirements of applicable SEC or NYSE rules (including, for example, the audit committee’s obligation to be directly responsible for the appointment, compensation, retention and oversight of the work of any registered public accounting firm engaged for the purpose of preparing an audit report), we understand that this provision would be limited so as not to conflict with such requirements due to the precedence given to local legal requirements in the framework and our adopting resolutions. Similarly, we understand that the authorities given to Santander Spain under the framework to approve certain decisions by us and to approve the compensation of certain persons in charge of functions subject to internal governance are limited by the framework and the adopting resolutions so as not to limit the ability of members of our Audit Committee to make independent decisions or take independent actions as required by the audit committee independence requirements of applicable SEC and NYSE rules.
ITEM 16H. MINE SAFETY DISCLOSURE
Not applicable.
We have responded to Item 18 in lieu of this Item.
Reference is made to Item 19 for a list of all financial statements filed as part of this Annual Report.
206
a) Index to Financial Statements
b) Index to Exhibits
We will furnish to the Securities and Exchange Commission, upon request, copies of any unfiled instruments that define the rights of holders of long-term debt of Banco Santander-Chile.
207
SIGNATURES
The registrant hereby certifies that it meets all of the requirements for filing on Form 20-F and that it has duly caused and authorized the undersigned to sign this Annual Report on its behalf.
| BANCO SANTANDER-CHILE | |||||
| By: | /s/ Cristian Florence | ||||
| Name: | Cristian Florence | ||||
| Title: | General Counsel | ||||
Date: March 22, 2019February 26, 2021
208

CONTENT
Report of Independent Registered Public Accounting Firm
F-2
Report of Independent Registered Public Accounting Firm
To the Board of Directors and Shareholders of Banco Santander - Chile
Opinions on the Financial Statements and Internal Control over Financial Reporting
We have audited the accompanying consolidated statements of financial position of Banco Santander - Chile and its subsidiaries (“the Company”) as of December 31,
In our opinion, the consolidated financial statements referred to above present fairly, in all material respects, the financial position of the Company as of December 31,
As discussed in Note Basis for Opinions
The Company's management is responsible for these consolidated financial statements, for maintaining effective internal control over financial reporting, and for its assessment of the effectiveness of internal control over financial reporting, included in Management’s Report on Internal Control over Financial
We conducted our audits in accordance with the standards of the PCAOB. Those standards require that we plan and perform the audits to obtain reasonable assurance about whether the consolidated financial statements are free of material misstatement, whether due to error or fraud, and whether effective internal control over financial reporting was maintained in all material respects.
Our audits of the consolidated financial statements included performing procedures to assess the risks of material misstatement of the consolidated financial statements, whether due to error or fraud, and performing procedures that respond to those risks. Such procedures included examining, on a test basis, evidence regarding the amounts and disclosures in the consolidated financial statements. Our audits also included evaluating the accounting principles used and significant estimates made by management, as well as evaluating the overall presentation of the consolidated financial statements. Our audit of internal control over financial reporting included obtaining an understanding of internal control over financial reporting, assessing the risk that a material weakness exists, and testing and evaluating the design and operating effectiveness of internal control based on the assessed risk. Our audits also included performing such other procedures as we considered necessary in the circumstances. We believe that our audits provide a reasonable basis for our opinions.
Definition and Limitations of Internal Control over Financial Reporting
A company’s internal control over financial reporting is a process designed to provide reasonable assurance regarding the reliability of financial reporting and the preparation of financial statements for external purposes in accordance with generally accepted accounting principles. A company’s internal control over financial reporting includes those policies and procedures that (i) pertain to the maintenance of records that, in reasonable detail, accurately and fairly reflect the transactions and dispositions of the assets of the company; (ii) provide reasonable assurance that transactions are recorded as necessary to permit preparation of financial statements in accordance with generally accepted accounting principles, and that receipts and expenditures of the company are being made only in accordance with authorizations of management and directors of the company; and (iii) provide reasonable assurance regarding prevention or timely detection of unauthorized acquisition, use, or disposition of the company’s assets that could have a material effect on the financial statements.
Because of its inherent limitations, internal control over financial reporting may not prevent or detect misstatements. Also, projections of any evaluation of effectiveness to future periods are subject to the risk that controls may become inadequate because of changes in conditions, or that the degree of compliance with the policies or procedures may deteriorate. F-3 Critical Audit Matters The critical audit matter communicated below is a matter arising from the current period audit of the consolidated financial statements that was communicated or required to be communicated to the audit committee and that (i) relates to accounts or disclosures that are material to the consolidated financial statements and (ii) involved our especially challenging, subjective, or complex judgments. The communication of critical audit matters does not alter in any way our opinion on the consolidated financial statements, taken as a whole, and we are not, by communicating the critical audit matter below, providing a separate opinion on the critical audit matter or on the accounts or disclosures to which it relates. Expected Credit Loss Allowance for Commercial, Mortgage and Consumer Loans – Collective Basis As described in Notes 1 and 8 to the consolidated financial statements, management assesses the adequacy of the collective basis expected credit loss allowance for commercial, mortgage and consumer loan using expected credit loss models. As of December 31, 2020, the collective basis expected credit loss allowance was Ch$ 670,247 million on total commercial, mortgage and consumer loans of Ch$ 22,455,313 million. As disclosed by management, the estimation of the collective basis expected credit loss allowance considers qualitative and quantitative information that may affect the changes in credit risk and the development of assumptions related to the probabilities of default and loss given default, including forward looking information, multi-factor analysis such as type of portfolio or transaction, macroeconomic factors Management subjectively assesses the adequacy of the qualitative information used to assess the increase in credit risk since initial recognition and the development of assumptions such as probabilities of default and loss given default. The principal considerations for our determination that performing procedures relating to the collective basis expected credit loss allowance for commercial, mortgage and consumer loans is a critical audit matter are (i) the significant judgment by management in determining the collective basis expected credit loss allowance, which in turn led to a high degree of auditor judgement, subjectivity, and effort in performing procedures and evaluating audit evidence obtained relating to the assumptions used related to the probabilities of default and loss given default, including forward looking information, multi-factor analysis such as type of portfolio or transaction and macroeconomic factors, used in the qualitative information; and (ii) the audit effort involved the use of professionals with specialized skill and knowledge to assist in evaluating the audit evidence obtained from these procedures. Addressing the matter involved performing procedures and evaluating audit evidence in connection with forming our overall opinion on the consolidated financial statements. These procedures included testing the effectiveness of controls relating to the expected credit loss allowance for commercial, mortgage and consumer loans estimation process, which included controls over the assumptions used in the estimation of the collective basis expected credit loss allowance, within the qualitative information. These procedures also included, among others, (i) testing management’s process for estimating the collective basis expected credit loss allowance for commercial, mortgage and consumer loans; (ii) testing the completeness, accuracy, and relevance of underlying data used in the model and (iii) the involvement of professionals with specialized skill and knowledge to assist in testing management’s process for estimating the collective basis expected credit loss allowance for commercial, mortgage and consumer loans, including evaluating the appropriateness of the methodologies and models, testing data used in the estimate and evaluating the reasonableness of significant assumptions such as the probabilities of default and loss given default, including forward looking information, multi-factor analysis such as type of portfolio or transaction and macroeconomic factors, used in the qualitative information.
/s/ PricewaterhouseCoopers Consultores Auditores SpA
Santiago, Chile
February 26, 2021
We have served as the Company’s auditor since 2016.
Banco Santander-Chile and Subsidiaries
CONSOLIDATED STATEMENTS OF FINANCIAL POSITION
The accompanying notes form integral part of these consolidated financial statements.
Banco Santander-Chile and Subsidiaries
CONSOLIDATED STATEMENTS OF INCOME For the years ended,
The accompanying notes form integral part of these consolidated financial statements.
Banco Santander-Chile and Subsidiaries
CONSOLIDATED STATEMENTS OF COMPREHENSIVE INCOME For the years ended,
The accompanying notes form integral part of these consolidated financial statements F-7 Banco Santander-Chile and Subsidiaries CONSOLIDATED STATEMENTS OF CHANGES IN EQUITY For the years ended,
(*) The effect was generated by the acquisition of Santander Consumer S.A. See Note 2 Significant Event. F-8 Banco Santander-Chile and Subsidiaries CONSOLIDATED STATEMENTS OF CHANGES IN EQUITY For the years ended,
The accompanying notes form integral part of these consolidated financial statements.
F-9 Banco CONSOLIDATED STATEMENTS OF For the years ended,
F-10 Banco Santander-Chile and CONSOLIDATED STATEMENTS OF CASH FLOWS For the years ended,
The accompanying notes form integral part of these consolidated financial statements.
F-11 Banco
Notes to the Consolidated Financial Statements AS OF DECEMBER 31, SUMMARY OF SIGNIFICANT ACCOUNTING POLICIES
CORPORATE INFORMATION
Banco Banco Santander Spain controls Banco Santander-Chile through its holdings in Teatinos Siglo XXI Inversiones Ltda. and
a) Basis of preparation
These Consolidated Financial Statements have been prepared in accordance with International Financial Reporting Standards (IFRS) as issued by the International Accounting Standards Board (IASB) (hereinafter referred to as IFRS).
For purposes of these financial statements we use certain terms and conventions. References to “US$”, “U.S. dollars” and “dollars” are to United States dollars, references to “EUR” are to European Economic Community Euro, references to “CNY” are to Chinese Yuan, reference to “JPY” are to Japanese Yuan, references to “CHF” are to Swiss franc, references to “Chilean pesos”, “pesos” or “Ch$” are to Chilean pesos, and references to “UF” are to Unidades de Fomento. The UF is an inflation-indexed Chilean monetary unit with a value in Chilean pesos that changes daily to reflect changes in the official Consumer Price Index (“CPI”) of the Instituto Nacional de Estadísticas (the Chilean National Institute of Statistics) for the previous month.
The UF is revalued in monthly cycles. Each day in the period beginning on the tenth day of the current month through the ninth day of the succeeding month, the nominal peso value of the UF is indexed up (or down in the event of deflation) in order to reflect a proportionate amount of the change in the Chilean Consumer Price Index during the prior calendar month. One UF is equaled to Ch$
The Notes to the Consolidated Financial Statements contain additional information to support the figures submitted in the Consolidated Statements of Financial Position, Consolidated Statements of Income, Consolidated Statements of Comprehensive Income, Consolidated Statements of Changes in Equity and Consolidated Statements of Cash Flows for the period.
b) Basis of preparation for the Consolidated Financial Statements
The Consolidated Financial Statements for the years ended December 31,
The Bank reassesses whether or not it controls an investee if facts and circumstances indicate that there are changes to one or more of the three elements of control listed above. When the Bank has less than a majority of the voting rights of an investee, it has power over the investee when the voting rights are sufficient to give it the practical ability to direct the relevant activities over the investee unilaterally. The Bank considers all relevant facts and circumstances in assessing whether or not the Bank’s voting rights in an investee are sufficient to give it power, including:
Banco Notes to the Consolidated Financial Statements AS OF DECEMBER 31,
NOTE 01 SUMMARY OF SIGNIFICANT ACCOUNTING POLICIES
Consolidation of a subsidiary begins when the Bank obtains control over the subsidiary and ceases when the Bank loses control over the subsidiary. Specifically, income and expenses of a subsidiary acquired or disposed of during the year are included in the Consolidated Statements of Income and Comprehensive Income from the date the Bank gains control until the date when the Bank ceases to control the subsidiary.
Profit or loss and each component of other comprehensive income are attributed to the owners of the Bank and to the non-controlling interests. Total comprehensive income of subsidiaries is attributed to the owners of the Bank and to the non-controlling interests even if this results in the non-controlling interests having a deficit in certain circumstances.
When necessary, adjustments are made to the financial statements of the subsidiaries to ensure their accounting policies are consistent with the Bank’s accounting policies. All intragroup assets, liabilities, equity, income, expenses and cash flows relating to transactions between consolidated entities are eliminated in full on consolidation.
Changes in the consolidated entities ownership interests in subsidiaries that do not result in a loss of control over the subsidiaries are accounted for as equity transactions. The carrying values of the Bank’s equity and the non-controlling interests’ equity are adjusted to reflect the changes to their relative interests in the subsidiaries. Any difference between the amount by which the non-controlling interests are adjusted and the fair value of the consideration paid or received is
In addition, third parties’ shares in the Bank’s consolidated equity are presented as “Non-controlling interests” in the Consolidated Statements of Changes in Equity. Their share in the income for the year is presented as “Attributable to non-controlling interest” in the Consolidated Statements of Income.
The following companies are considered entities controlled by the Bank and are therefore within the scope of consolidation:
i. Entities controlled by the Bank through participation in equity
The detail of non-controlling participation on all the remaining subsidiaries can be seen in Note
Banco Notes to the Consolidated Financial Statements AS OF DECEMBER 31,
NOTE 01 SUMMARY OF SIGNIFICANT ACCOUNTING POLICIES
Entities controlled by the Bank through other considerations The following companies have been consolidated based on the determination that the Bank has control as previously defined above and in accordance with IFRS 10,Consolidated Financial
(1) Since December 2019, Bansa Santander S.A.(“Bansa”) modified it activity to financing revolving inventory lines to automotive dealers. Accordingly, Consumer has started to guide relevant activities of Bansa, and therefore it has begun to consolidate. (2) On October 4, 2019 Multiplica Spa was created as a supporting banking business company. In accordance with IFRS 10 Consolidated Financial Statement, the Bank controls the entity, since the relevant activities are addressed by the Bank, and the Bank is exposed, or has rights, to variable returns from its involvement with the investee. iii. Associates
An associate is an entity over which the Bank has significant influence. Significant influence, in this case, is defined as the power to participate in the financial and operating policy decisions of the investee but is not control or joint control over those policies. An investment in an associate is accounted for using the equity method from the date on which the investee becomes an associate.
The following companies are considered “Associates” in which the Bank accounts for its participation using the equity method:
(*) The Bank is in process to sell its share participation on Redbanc S.A. and Transbank S.A. therefore it has
In the case of
F-14 Banco Santander-Chile and Subsidiaries Notes to the Consolidated Financial Statements AS OF DECEMBER 31, 2020 AND 2019 AND FOR THE YEARS ENDED DECEMBER 31, 2020, 2019 AND 2018 NOTE 01 SUMMARY OF SIGNIFICANT ACCOUNTING POLICIES In the case of Servicios de Infraestructura de Mercado OTC
Non-controlling interest represents the portion of net income and net assets which the Bank does not own, either directly or indirectly. It is presented as “Attributable to non-controlling interest” separately in the Consolidated Statements of Income, and separately from shareholders’ equity in the Consolidated Statements of Financial Position.
In the case of entities controlled by the Bank through other considerations, income and equity are presented in full as non-controlling interest, since the Bank controls them, but does not have any ownership expressed as a percentage.
d) Reporting segments
Operating segments are components of an entity:
Two or more segments can be combined only if aggregation is consistent with International Financial Reporting Standard 8 “Operating Segments” (IFRS 8) and the segments have similar economic characteristics and are similar in each of the following respects:
The Bank reports separately on each operating segment that exceeds any of the following quantitative thresholds:
Operating segments that do not meet any of the quantitative threshold may be treated as segments to be reported, in which case the information must be disclosed separately if management believes it could be useful for the users of the Consolidated Financial Statements.
Information about other business activities of the operating segments not separately reported is combined and disclosed in the “Other segments” category.
F-15 Banco Santander-Chile and Subsidiaries Notes to the Consolidated Financial Statements AS OF DECEMBER 31, 2020 AND 2019 AND FOR THE YEARS ENDED DECEMBER 31, 2020, 2019 AND 2018 NOTE 01 SUMMARY OF SIGNIFICANT ACCOUNTING POLICIES e) Functional and presentation currency
According to International Accounting Standard (IAS) 21 “The Effects of Changes in Foreign Exchange Rates”, the Chilean peso, which is the currency of the primary economic environment in which the Bank operates and the currency which influences its costs and revenue structure, has been defined as the Bank’s functional and presentation currency.
Accordingly, all balances and transactions denominated in currencies other than the Chilean Peso are treated as “foreign currency”.
The Bank maintains its accounting records and prepares its financial statements in Chilean pesos.
The Bank
The amounts of net foreign exchange gains and losses includes recognition of the effects that exchange rate variations have on assets and liabilities denominated in foreign currencies and the profits and losses on foreign exchange spot and forward transactions undertaken by the Bank.
g) Classification and measurement of financial instrument – under IFRS 9 (from January 1, 2018)
Financial instruments must be classified and measured in accordance with IFRS 9 starting from January 1, 2018, which established guidance for the financial reporting of financial assets and financial liabilities that will present relevant and useful information to users of financial statements for their assessment of the amounts, timing and uncertainty of an entity’s future cash flows.
I. Classification of financial instrument
i) Classification of financial assets Financial assets are classified into a measurement category based on both the Bank’s business model for managing the financial asset and the contractual cash flow characteristics of the financial asset.
Contractual cash flow assessment
For classification process the Bank perform the SPPI test, which assesses the contractual term to identify
Business model refers to how the Bank manages its financial assets in order to generate cash flows. The Bank determined its business model on initial application of IFRS 9 at the level that best reflects how it manages groups of financial assets to achieve its business objective.
The Banks’s business model is not assessed on an instrument-by- instrument basis, but at a higher level of aggregated portfolio and is based on observable factors such as: performance of the financial assets, the risk that affect the performance, and the expected frequency, value and timing of sales.
In accordance with IFRS 9 the business models are: F-16 Banco Santander-Chile and Subsidiaries Notes to the Consolidated Financial Statements AS OF DECEMBER 31, 2020 AND 2019 AND FOR THE YEARS ENDED DECEMBER 31, 2020, 2019 AND 2018 NOTE 01 SUMMARY OF SIGNIFICANT ACCOUNTING POLICIES, continued
ii) Classification of financial liabilities The Bank classified all financial liabilities as subsequently measured at
iii) Reclassification Reclassification of financial assets is required if, and only if, the objective of the
II. Measurement of financial instruments
i) Initial measurement On initial recognition, financial assets and financial liabilities are measured at the transaction price, i.e. the fair value of the consideration given or received (IFRS 13). In the case of financial instruments not at fair value through profit or loss, transaction costs are directly attributable to the acquisition or issue of the financial asset or financial liability.
ii) Subsequent measurement- financial assets After initial recognition, the Bank shall
(a) Amortized cost Financial assets that are held in a business model to collect the contractual cash flows and contain contractual terms that give rise on specific dates to cash flows that are SPPI, are measured at The effective interest method is used in the calculation of the
Financial assets that are debt instruments held in a business model that is achieved by both collecting contractual cash flows and selling, and that contain contractual terms that give rise on specific dates to cash flows that are SPPI, are measured at FVOCI. They are subsequently remeasured at fair value and changes therein (except for those relating to impairment, interest income and foreign currency exchange gains and losses) are (c) Fair value through profit or loss (FVTPL)
Financial assets that do not contain contractual terms that give rise on specified dates to cash flows that are SPPI, or if the financial assets, or if the financial asset is not held in a business model that is either (i) a business model to collect the contractual cash flows or (ii) a business model that is achieved by both collecting contractual cash flows and selling. Financial assets held for trading are
F-17 Banco Santander-Chile and Subsidiaries Notes to the Consolidated Financial Statements AS OF DECEMBER 31, 2020 AND 2019 AND FOR THE YEARS ENDED DECEMBER 31, 2020, 2019 AND 2018 NOTE 01 SUMMARY OF SIGNIFICANT ACCOUNTING POLICIES, continued (d) Equity instruments For certain equity instruments, the Bank may make an irrevocable election to present subsequent changes in the fair value of the instrument in other comprehensive income, except for dividend income which is iii) Subsequent measurement- financial liabilities After initial recognition, the Bank shall measure a financial liability at
Financial assets are
In some cases, the Bank enters into transactions for which it retains the contractual rights to receive the cash flows of the financial asset, but assumes a contractual obligation to pay the cash flows in an arrangement that meets all the conditions required, i.e. the Bank only transfers collected amounts from original assets, selling or pledging original assets is prohibited, and the Bank has the obligation to remit cash flows collected without material delay.
When a financial asset is sold and the Bank simultaneously agrees to repurchase it (or an asset that is substantially the same) at a fixed price on a future date, the Bank continues to
Financial liabilities are
The Bank issues contingent liabilities (including letters of credit, foreign letters of credit and performance guarantee) and loan commitments.
Contingent liabilities and undrawn loan commitments are commitments under which, over the duration of the commitment, the Bank is required to provide a loan with pre-specified term to the customer.
The nominal contractual loan value, when the loan agreed to be provided is on market terms, is not recorded in the statements of financial position. The related ECL allowances are disclosed in Note 22.
V. Offsetting of financial instruments Financial asset and liability balances are offset, i.e., reported in the Consolidated Statements of Financial Position at their net amount, only if there is a legally enforceable right to offset the recorded amounts and the Bank intends either to settle them on a net basis or to realize the asset and settle the liability simultaneously. As of December 31, 2020 and 2019 the Bank does not have balance offsetting of financial instruments. h) Definitions and classification of financial instruments – under IAS 39
A “financial instrument” is any contract that gives rise to a financial asset of one entity, and a financial liability or equity instrument of another entity. F-18 Banco Santander-Chile and Subsidiaries Notes to the Consolidated Financial Statements AS OF DECEMBER 31, 2020 AND 2019 AND FOR THE YEARS ENDED DECEMBER 31, 2020, 2019 AND 2018 NOTE 01 SUMMARY OF SIGNIFICANT ACCOUNTING POLICIES, continued
An “equity instrument” is a legal transaction that evidences a residual interest in the assets of an entity deducting all of its liabilities.
A “financial derivative” is a financial instrument whose value changes in response to the changes in an underlying observable market variable (such as an interest rate, a foreign exchange rate, a financial instrument’s price, or a market index, including credit ratings), whose initial investment is very small compared with other financial instruments having a similar response to changes in market factors, and which is generally settled at a future date.
“Hybrid financial instruments” are contracts that simultaneously include a non-derivative host contract together with a financial derivative, known as an embedded derivative, which is not separately transferable and has the effect that some of the cash flows of the hybrid contract vary in a way similar to a stand-alone derivative.
Financial assets are classified into the following specified categories: trading investments at fair value through profit or loss (FVTPL), ‘held to maturity investments’, ‘available for sale investments (AFS)’ and ‘loans and accounts receivable from
Regular way purchases or sales of financial assets require delivery of the asset within the time frame established by regulation or convention in the marketplace.
The effective interest method is a method of calculating the
Income is
Financial assets FVTPL – trading investment
Financial assets are classified as FVTPL when the financial asset is either held for trading or they are designated as at fair value through profit or loss.
A financial asset is classified as held for trading if:
A financial asset other than a financial asset held for trading may be designated as FVTPL upon initial recognition if:
such designation eliminates or significantly reduces a measurement or recognition inconsistency that would otherwise arise; or
F-19 Banco Santander-Chile and Subsidiaries Notes to the Consolidated Financial Statements AS OF DECEMBER 31, 2020 AND 2019 AND FOR THE YEARS ENDED DECEMBER 31, 2020, 2019 AND 2018 NOTE 01 SUMMARY OF SIGNIFICANT ACCOUNTING POLICIES, continued
Financial assets at FVTPL are stated at fair value, with any gains or losses arising on remeasurement
Held to maturity investments
Held-to-maturity investments are non-derivative financial assets with fixed or determinable payments and fixed maturity dates that the Bank has the positive intent and ability to hold to maturity. Subsequent to initial recognition, held-to-maturity investments are measured at
Available for sale investments (AFS investments)
AFS investments are non-derivatives that are either designated as AFS or are not classified as (a) loans and accounts receivable from customers, (b) held-to-maturity investments or (c) financial assets at fair value through profit or loss (trading investments).
Financial instruments held by the Bank that are traded in an active market are classified as AFS and are stated at fair value at the end of each reporting period. The Bank also has investments in financial instruments that are not traded in an active market but that are also classified as AFS investments and stated at fair value at the end of each reporting period (because the Bank considers that fair value can be reliably measured). Changes in the carrying amount of AFS monetary financial assets relating to changes in foreign currency rates, interest income calculated using the effective interest method and dividends on AFS equity investments are
Dividends on AFS equity instruments are
The fair value of AFS monetary financial assets denominated in a foreign currency is determined in that foreign currency and translated as the described in f) above. The foreign exchange gains and losses that are
Loans and accounts receivable from customers
Loans and accounts receivable from customers are non-derivative financial assets with fixed or determinable payments that are not quoted in an active market. Loans and accounts receivables from customers (including loans and accounts receivable from customers and interbank loans) are measured at
Interest income is
For presentation purposes, the financial assets are classified by their nature into the following line items in the Consolidated Financial Statements:
F-20 Banco Santander-Chile and Subsidiaries Notes to the Consolidated Financial Statements AS OF DECEMBER 31, 2020 AND 2019 AND FOR THE YEARS ENDED DECEMBER 31, 2020, 2019 AND 2018 NOTE 01 SUMMARY OF SIGNIFICANT ACCOUNTING POLICIES, continued
The Bank classifies all financial liabilities as subsequently measured at
Financial liabilities at FVTPL
As of December 31,
Other financial liabilities
Other financial liabilities (including interbank borrowings, issued debt instruments and other payables) are initially recorded at fair value and subsequently measured at
The financial liabilities are classified by their nature into the following line items in the consolidated statements of financial position:
F-21 Banco Santander-Chile and Subsidiaries Notes to the Consolidated Financial Statements AS OF DECEMBER 31, 2020 AND 2019 AND FOR THE YEARS ENDED DECEMBER 31, 2020, 2019 AND 2018 NOTE 01 SUMMARY OF SIGNIFICANT ACCOUNTING POLICIES, continued
Financial asset and liability balances are offset, i.e., reported in the Consolidated Statements of Financial Position at their net amount, only if there is a legally enforceable right to offset the recorded amounts and the Bank intends either to settle them on a net basis or to realize the asset and settle the liability simultaneously. As of December 31,
The accounting treatment of transfers of financial assets is determined by the extent and the manner in which the risks and rewards associated with the transferred assets are transferred to third
Accordingly, financial assets are only
i) Derivatives and hedging activities
The Bank has elected to continue F-22 Banco Santander-Chile and Subsidiaries Notes to the Consolidated Financial Statements AS OF DECEMBER 31, 2020 AND 2019 AND FOR THE YEARS ENDED DECEMBER 31, 2020, 2019 AND 2018 NOTE 01 SUMMARY OF SIGNIFICANT ACCOUNTING POLICIES, continued
The Bank has not provided comparative information for prior periods on the date of initial application of IFRS 9 for the new disclosures introduces by IFRS 9 as a consequential amendment to IFRS 7, as permitted by IFRS 7 paragraph 44z.
A “financial derivative” is a financial instrument whose value changes in response to the changes in an underlying observable market variable (such as an interest rate, a foreign exchange rate, a financial instrument’s price, or a market index, including credit ratings), whose initial investment is very small compared with other financial instruments having a similar response to changes in market factors, and which is generally settled at a future date.
For presentation purposes, derivatives are presented in accordance with its positive or negative fair value as assets or liabilities, respectively, and include trading and hedging instruments separately (see Note
Hedging transactions
The bank has elected to continue applying the hedge accounting requirements in IAS 39 instead of the requirements of IFRS 9, thus the Bank uses financial derivatives for the following purposes:
All financial derivatives that are not held for hedging purposes are accounted for as trading derivatives.
A derivative qualifies for hedge accounting if all the following conditions are met:
The changes in the value of financial instruments qualifying for hedge accounting are recorded as follows:
F-23 Banco Santander-Chile and Subsidiaries Notes to the Consolidated Financial Statements AS OF DECEMBER 31, 2020 AND 2019 AND FOR THE YEARS ENDED DECEMBER 31, 2020, 2019 AND 2018 NOTE 01 SUMMARY OF SIGNIFICANT ACCOUNTING POLICIES, continued
If a derivative designated as a hedging instrument no longer meets the requirements described above due to expiration, ineffectiveness or for any other reason, hedge accounting treatment is discontinued. When “fair value hedging” is discontinued, the fair value adjustments to the carrying amount of the hedged item arising from the hedged risk are
When cash flow hedges are discontinued, any cumulative gain or loss of the hedging instrument j) Fair value measurement
In general, financial assets and liabilities are initially
Financial assets are measured according to their fair value, gross of any transaction costs that may be incurred in the course of a sale, except for loans and accounts receivable from customers.
“Fair value” is defined as the price that would be received to sell an asset or paid to transfer a liability in an orderly transaction in the principal (or most advantageous) market at the measurement date under current market conditions (i.e. an exit price) regardless of whether that price is directly observable or estimated using another valuation technique. When measuring fair value an entity shall take into account the characteristics of the asset or liability if market participants would take those characteristics into account when pricing the asset or liability at the measurement date.
The fair value measurement assumes that the transaction to sell the asset or transfer the liability takes place either: (a) in the principal market for the asset or liability, or (b) in the absence of a principal market, the most advantageous market for the asset or liability. Even when there is no observable market to provide pricing information in connection with the sale of an asset or the transfer of a liability at the measurement date, the fair value measurement shall assume that the transaction takes place, considered from the perspective of a potential market participant who intends to maximize value associated with the asset or liability.
When using valuation techniques, the Bank shall maximize the use of relevant observable inputs and minimize the use of unobservable inputs as available. If an asset or a liability measured at fair value has a bid price and an ask price, the price within the bid-ask spread that is most representative of fair value in the circumstances shall be used to measure fair value regardless of where the input is categorized within the fair value hierarchy (i.e. Level 1, 2 or 3). IFRS 13 establishes a fair value hierarchy that categorizes F-24 Banco Santander-Chile and Subsidiaries Notes to the Consolidated Financial Statements AS OF DECEMBER 31, 2020 AND 2019 AND FOR THE YEARS ENDED DECEMBER 31, 2020, 2019 AND 2018 NOTE 01 SUMMARY OF SIGNIFICANT ACCOUNTING POLICIES, continued into three levels the inputs to valuation techniques used to measure fair value. The fair value hierarchy gives the highest priority to quoted prices (unadjusted) in active markets for identical assets or liabilities (Level 1 inputs) and the lowest priority to unobservable inputs (Level 3 inputs).
All derivatives are recorded in the Consolidated Statements of Financial Position at the fair valuepreviously described. This value is compared to the valuation as at the trade date. If the fair value is subsequently measured positive, this is recorded as an asset. If the fair value is subsequently measured negative, this is recorded as a liability. The fair value on the trade date is deemed, in the absence of evidence to the contrary, to be the transaction price. The changes in the fair value of derivatives from the trade date are recorded in “Net income (expense) from financial operations” in the Consolidated Statements of Income.
Specifically, the fair value of financial derivatives included in the portfolios of financial assets or liabilities held for trading is deemed to be their daily quoted price. If, for exceptional reasons, the quoted price cannot be determined on a given date, the fair value is determined using similar methods to those used to measure over the counter (OTC) derivatives. The fair value of OTC derivatives is the sum of the future cash flows resulting from the instrument, discounted to present value at the date of valuation (“present value” or “theoretical close”) using valuation techniques commonly used by the financial markets: “net present value” (NPV) and option pricing models, among other methods. Also, within the fair value of derivatives are included Credit Valuation Adjustment (CVA) and Debit Valuation Adjustment (DVA), all with the objective that the fair value of each instrument includes the credit risk of its counterparty and Bank´s own risk. The Credit valuation adjustment (CVA) is a valuation adjustment to OTC derivatives as a result of the risk associated with the credit exposure assumed by each counterparty. The CVA is calculated taking into account potential exposure to each counterparty in each future period. The debit valuation adjustment (DVA) is a valuation adjustment similar to the CVA but, in this case, it arises as a result of the Bank’s own risk assumed by its counterparties in OTC derivatives.
Financial instruments at fair value, determined on the basis of price quotations in active markets, include government debt securities, private sector debt securities, equity shares, short positions, and fixed-income securities issued.
In cases where price quotations cannot be observed in available markets, the
The most reliable evidence of the fair value of a financial instrument on initial recognition usually is the transaction price, however due to lack of availability of market information, the value of the instrument may be derived from other market transactions performed with the same or similar instruments or may be measured by using a valuation technique in which the variables used include only observable market data, mainly interest rates.
The main techniques used as of December 31,
F-25 Banco Santander-Chile and Subsidiaries Notes to the Consolidated Financial Statements AS OF DECEMBER 31, 2020 AND 2019 AND FOR THE YEARS ENDED DECEMBER 31, 2020, 2019 AND 2018 NOTE 01 SUMMARY OF SIGNIFICANT ACCOUNTING POLICIES, continued The fair value of the financial instruments calculated by the aforementioned internal models considers contractual terms and observable market data, which include interest rates, credit risk, exchange rates, quoted market price of shares, volatility and prepayments, among others. The Bank’s management considers that its valuation models are not significantly subjective, since these methodologies can be adjusted and evaluated, as appropriate, through the internal calculation of fair value and the subsequent comparison with the related actively traded price.
k)
The most significant criteria used by the Bank to
Interest income is calculated by applying the effective interest rate to the gross carrying amount of financial assets, except for financial assets that have subsequently become credit-impaired (or ‘stage 3’), for which interest revenue is calculated by applying the effective interest rate to their
ii. Commissions, fees, and similar items
Fee and commission income and expenses are
Under IFRS 15, the Bank recognises revenue when (or as) satisfied a performance obligations by transferring a service
The Bank transfers control of a good or service over time and, therefore, satisfies a performance obligation and recognises revenue over time, and/or the Bank satisfies the performance obligation at a point in time.
The main revenues arising from commissions, fees and similar items correspond to:
The main expenses arising from commissions, fees and similar items correspond to:
F-26 Banco Santander-Chile and Subsidiaries Notes to the Consolidated Financial Statements AS OF DECEMBER 31, 2020 AND 2019 AND FOR THE YEARS ENDED DECEMBER 31, 2020, 2019 AND 2018 NOTE 01 SUMMARY OF SIGNIFICANT ACCOUNTING POLICIES, continued
The Bank has incorporated disaggregated revenue and expense disclosures and reportable segment relationship in Note
iii. Loan arrangement fees
Fees that arise as a result of the origination of a loan, mainly application and analysis-related fees, are deferred and charged to the Consolidated Statements of Income over the term of the loan.
l) Impairment of non-financial assets
The Bank’s non-financial assets, are reviewed at the reporting date to determine whether they show signs of impairment (i.e. its carrying amount exceeds its recoverable amount). If any such evidence exists, the recoverable amount of the asset is estimated, in order to determine the extent of the impairment loss.
Recoverable amount is the higher of fair value less costs to sell and value in use. In assessing value in use, the estimated future cash flows are discounted to their present value using a pre-tax discount rate that reflects current market assessments of the time value of money and the risks specific to the asset for which the estimates of future cash flows have not been adjusted.
If the recoverable amount of an asset is estimated to be less than its carrying amount, the carrying amount of the asset is reduced to its recoverable amount. An impairment loss is
In connection with other assets, impairment losses recorded in prior periods are assessed at each reporting date to determine whether the loss has decreased and should be reversed. The increased carrying amount of an asset other than goodwill attributable to a reversal of an impairment loss shall not exceed the carrying amount that would have been determined (net of amortization or depreciation) had no impairment loss been
m) Property, plant, and equipment
This category includes the amount of buildings, land, furniture, vehicles, computer hardware and other fixtures owned by the consolidated entities or acquired under finance leases. Assets are classified according to their use as follows:
i. Property, plant and equipment for own use
Property, plant and equipment for own use includes but is not limited to tangible assets received by the consolidated entities in full or partial satisfaction of financial assets representing accounts receivable from third parties which are intended to be held for continuing own use and tangible assets acquired under finance leases. These assets are presented at acquisition cost less the related accumulated depreciation and, if applicable, any impairment losses (when net carrying amount was higher than recoverable amount).
Depreciation is calculated using the
The Bank applies the following useful lives for the tangible assets that comprise its assets:
F-27 Banco Santander-Chile and Subsidiaries Notes to the Consolidated Financial Statements AS OF DECEMBER 31, 2020 AND 2019 AND FOR THE YEARS ENDED DECEMBER 31, 2020, 2019 AND 2018 NOTE 01 SUMMARY OF SIGNIFICANT ACCOUNTING POLICIES, continued
The consolidated entities assess at each reporting date whether there is any indication that the carrying amount of any tangible asset exceeds its recoverable amount. If this is the case, the carrying amount of the asset is reduced to its recoverable amount and future depreciation charges are adjusted in accordance with the revised carrying amount and to the new remaining useful life.
The estimated useful lives of the items of property, plant and equipment held for own use are reviewed at the end of each reporting period to detect significant changes. If changes are detected, the useful lives of the assets are adjusted by correcting the depreciation charge to be recorded in the Consolidated Statements of Income in future years on the basis of the new useful lives.
Maintenance expenses relating to tangible assets held for own use are recorded as an expense in the period in which they are incurred.
ii. Assets leased out under operating leases
The criteria used to record the acquisition cost of assets leased out under operating leases, to calculate their depreciation and their respective estimated useful lives, and to record the impairment losses thereof, are consistent with those described in relation to property, plant and equipment held for own use. n) Leasing As of January 1, 2019, the Bank has started to apply IFRS 16 “Leases”, using the modified retrospective method and therefore, no comparative information is required, and 2018 balances continue to be reported under IAS 17 “Leases”. Policy applicable from January 1, 2019 At inception of a contract the Bank assesses whether a contract contains a lease. A contract contains a lease if the contracts conveys the right to control the use of an identified asset for a period of time in exchange for consideration. To assess whether a contract conveys the right to control the use of an identified asset, the Bank assesses whether:
F-28 Banco Notes to the Consolidated Financial Statements AS OF DECEMBER 31,
NOTE 01 SUMMARY OF SIGNIFICANT ACCOUNTING POLICIES, continued
The Bank recognizes a right-of-use asset and a lease liability at the lease commencement date in accordance within IFRS 16 “Leases”. The main contracts that the Bank has are offices and branches related, which are necessary to carry out its activities. At the beginning, the right-of-use asset is equal to the lease liability and is calculated as the present value of the lease payments discounted using the incremental interest rate at the commencement date, considering the lease term of each contract. The average incremental interest rate as of December 31, 2020 is 1.45%. After initial recognition, the right-of-use is subsequently depreciated using the straight-line method in accordance with the lease term of the contract, and the lease liability is amortized in accordance with the effective interest method. Financial interest is accounted as interest expense, and depreciation as depreciation expense in each period. The term of the lease comprises non-cancelable periods established within each contract, while for lease contracts with an indefinite useful life, the Bank has determined to assign a useful life equal to the longer non-cancelable period of its lease agreements. The Bank has elected not to recognize right-of-use assets and lease liabilities for short term leases that have a lease term of 12 months or less and leases of low-value assets. The Bank recognizes lease payments associated with these leases as an expense on a straight-line basis over the lease term. Any modification in the terms or lease should be treated as a new measurement. Initially, the Bank measures the right-of-use asset at cost. The rent of the lease agreements is agreed in UF and paid in pesos. According to that, monthly variation in UF should be treated as a new measurement, and therefore, readjustments should be recognized as a modification to the obligation and the right-of-use asset. The Bank has not entered into lease agreements with residual value guarantee or variable lease payments. In applying IFRS 16, the Bank has used the following practical expedients permitted by the standard:
The Bank has also elected not to reassess whether a contract is or contains a lease at the date of initial application. Instead, for contracts entered into before the transition date the Bank relied on its assessment made applying IAS 17 and Interpretation 4 Determining whether an Arrangement contains a Lease. b. As a lessor When the Bank acts as a lessor, it determines at the beginning if it corresponds to a financial or operating lease. To do this, it evaluates whether it has substantially transferred all the risks and benefits of the asset. In the affirmative case, it corresponds to a financial lease, otherwise it is a financial lease. The Bank recognizes the lease income on a straight-line basis over the lease term. c. Third party financing The Bank recognizes the loans with third parties within “Loans and accounts receivable from customers” in the Consolidated Statements of Financial Position, the sum of the present value of the lease payments receivable from the lessee, including the exercise price of the lessee’s purchase option at the end of the lease term, when at the inception of the lease it is reasonably certain that the lessee will exercise the option. The finance income and expenses arising from these contracts are recorded under “Interest income” and “Interest expense” respectively, in Consolidated Statements of Income to achieve constant return rate over the lease term. F-29 Banco Santander-Chile and Subsidiaries Notes to the Consolidated Financial Statements AS OF DECEMBER 31, 2020 AND 2019 AND FOR THE YEARS ENDED DECEMBER 31, 2020, 2019 AND 2018 NOTE 01 SUMMARY OF SIGNIFICANT ACCOUNTING POLICIES, continued Policy applicable prior to January 1, 2019 Prior to effective date of IFRS 16, the Bank applied IAS 17 Leases. i. Finance leases
Finance leases are leases that substantially transfer all the risks and rewards incidental to ownership of the leased asset to the lessee.
The Bank
When consolidated entities acts as lessees, the leased assets are classified based on their nature in the Consolidated Statements of Financial Position, and
In both cases, the finance income and expenses arising from these contracts are recorded under “Interest income” and “Interest expense” respectively, in Consolidated Statements of Income to achieve constant return rate over the lease term.
ii. Operating leases
In operating leases, the ownership of the leased asset and substantially all the risks and rewards incidental thereto remain with the lessor.
When the consolidated entities act as a lessor, the leased assets are classified at their acquisition cost under "Property, plant and equipment”. The depreciation criterion for these assets is consistent with that for similar items of property, plant and equipment held for own use and revenues from operating leases
When the consolidated entities act as the lessees, the lease expenses, including any incentives granted by the lessor, are charged on a
iii. Sale and leaseback transactions
For sale at fair value and operating leasebacks, the profit or loss generated is recorded at the time of the sale except in the case of excess of proceeds over fair value, which
o) Intangible assets
Intangible assets are identified as non-monetary assets (separately identifiable from other assets) without physical substance which arise as a result of legal or contractual
Intangible assets are recorded initially at acquisition or production cost and are subsequently measured at cost less any accumulated amortization and any accumulated impairment losses.
Internally developed computer software is recorded as an intangible asset if, among other requirements (basically the Bank’s ability to use or sell it), it can be identified and its ability to generate future economic benefits can be demonstrated.
F-30 Banco Santander-Chile and Subsidiaries Notes to the Consolidated Financial Statements AS OF DECEMBER 31, 2020 AND 2019 AND FOR THE YEARS ENDED DECEMBER 31, 2020, 2019 AND 2018 NOTE 01 SUMMARY OF SIGNIFICANT ACCOUNTING POLICIES, continued Intangible assets are
Expenditure on research activities is recorded as an expense in the year in which it is incurred and cannot be subsequently capitalized.
p) Cash and cash equivalents
For the preparation of the cash flow statements, the indirect method was used, starting with the Bank’s consolidated pre-tax income and incorporating non-cash transactions, as well as income and expenses associated with cash flows, which are classified as operating, investment or financing activities.
For the preparation of the cash flow statements, the following items are considered:
The
q) Expected credit losses allowance – under IFRS 9
Starting from January 1, 2018, the Bank replaced the “incurred loss” model of IAS 39 with an “expected credit loss (ECL)” model established by IFRS 9. The new single impairment model applies to all financial assets measured at
The Bank accounted ECL related to financial assets measured at
The new model uses a dual measurement approach, under which the loss allowance is measured as either:
The Bank has defined default on individual or collective basis:
F-31 Banco Santander-Chile and Subsidiaries Notes to the Consolidated Financial Statements AS OF DECEMBER 31, 2020 AND 2019 AND FOR THE YEARS ENDED DECEMBER 31, 2020, 2019 AND 2018 NOTE 01 SUMMARY OF SIGNIFICANT ACCOUNTING POLICIES, continued
The measurement basis depends on whether there has been a significant increase in credit risk since initial recognition. Based on changes in credit quality since initial recognition, IFRS 9 outlines a
The Bank, at the end of each reporting period, evaluated whether financial instrument's credit risk has significantly increased since initial recognition or whether an asset is considered to be credit-impaired, and consequently classified financial instrument in the respective stage:
The Bank considers reasonable and supportable information that is available without undue cost or effort and that may affect the credit risk on a financial instrument, including forward looking information to determine a significant increase in credit risk since initial recognition. Forward looking information includes past events, current conditions and forecast or future economic conditions (macro-economic data).
Credit risk assessment and
The Bank has considered that if contractual payments are more than 30 days past due, the credit risk is deemed to have increased significantly since initial credit recognition but is not an absolute indicator. The bank
F-32 Banco Santander-Chile and Subsidiaries Notes to the Consolidated Financial Statements AS OF DECEMBER 31, 2020 AND 2019 AND FOR THE YEARS ENDED DECEMBER 31, 2020, 2019 AND 2018 NOTE 01 SUMMARY OF SIGNIFICANT ACCOUNTING POLICIES, continued
The ECL are the probability-weighted estimate of credit losses, i.e. the present value of all cash shortfalls. A cash
PD: The Probability of default is an estimate of the likelihood of default over a given time horizon. A default may only happen at a certain time over the assessed period, if the facility has not been previously
LGD: The loss given default is an estimate of the loss arising in the case where a default occurs at a given time. It is based on the difference between the contractual cash flows due and those that the lender would expect to receive, including from the realization of any collateral.
EAD: The Exposure at default is an estimate of the exposure at a future default date, taking into account expected changes in the exposure after the reporting date, including repayments of principal and interest, whether scheduled by contract or otherwise, expected drawdown on committed facilities, and accrued interest from missed payments.
For measuring 12-month and lifetime ECL, cash shortfalls are identified as follow:
The Bank considered a multi-factor analysis to perform credit risk analysis. The Bank divides its portfolio as:
The Bank evaluates individually whether objective evidence of impairment exists for loans that are individually significant, then collectively assesses loans that are not individually significant and loans which are significant but for which there is no objective evidence of impairment available under individually assessment.
The Bank enters into various irrevocable loan commitments and contingent liabilities. Even though these obligations may not be
When the Bank estimates the ECLfor contingent loans, it estimates the expected portion of the loan commitment that will be drawn down over its expected life.
The ECL model includes a broad range of
F-33 Banco Santander-Chile and Subsidiaries Notes to the Consolidated Financial Statements AS OF DECEMBER 31, 2020 AND 2019 AND FOR THE YEARS ENDED DECEMBER 31, 2020, 2019 AND 2018 NOTE 01 SUMMARY OF SIGNIFICANT ACCOUNTING POLICIES, continued
When loan measured at
For ECL estimation purposes on financial assets that have been modified, is required to distinguish between modification that result in derecognition from those that does not result in derecognition. If the modification does not result in derecognition, then the subsequent assessment of whether there is a significant increase in credit risk is made comparing the risk at the reporting date based on the modified contractual term and the risk at initial recognition based on the original, unmodified contractual term.
If the modification results in derecognition, then the modified asset is considered to be a new asset. Accordingly, the date of modification is treated as the date of initial recognition for the purposes of the impairment
The Banks seeks to use collateral to mitigate its credit risks on financial assets, where possible. Types of collateral are:cash, securities, letters of credit, real state and inventories.The Bank’s accounting policy for collateral assigned to it through its lending arrangements under IFRS 9 is the same is it was under IAS 39. Collateral, unless repossessed, is not recorded on the Bank’s statements of financial position. However, the fair value of collateral affects the calculation of ECLs. The main collateral associated to mortgage loans are real
The estimation of ECL reflects the cash flows expected from collateral and other credit enhancement that are part of the contractual terms of the financial instruments.
According to the Bank’s policy when an asset (real
The gross carrying amount of a financial asset is reduced when there is no reasonable expectation of recovery. A write-off constitutes a derecognition event of the corresponding loan transaction in its entirety, and therefore, include portions not past-due for installments loans or leasing operation (no partial write-off).
Subsequent recoveries of amounts previously
Loan and accounts receivable
F-34 Banco Santander-Chile and Subsidiaries Notes to the Consolidated Financial Statements AS OF DECEMBER 31, 2020 AND 2019 AND FOR THE YEARS ENDED DECEMBER 31, 2020, 2019 AND 2018 NOTE 01 SUMMARY OF SIGNIFICANT ACCOUNTING POLICIES, continued
The COVID-19 pandemic has had a major impact on Chile and global economies in 2020. As a result, the Chilean government has announced a series of measures to support lending. The largest measure was to provide additional funds to the Guarantee Fund for Small Companies (Fogape), a state fund that guarantees loans, leases and other credits provided to small businesses, extend Fogape’s coverage to companies with annual sales of up to UF 1 million and further amend the rules and regulations governing Fogape to encourage banks to provide lending to small businesses. Under Fogape’s new regulations, domestic banks, including us, may provide loans with preferential interest rates equal to the MPR plus 3% and terms of up to 48 months to eligible companies in an aggregate amount equal to up to 3 months of a company’s sales and receive a guarantee from Fogape for between 60% and 85% of each loan (“Fogape loans”). Such loans must have a 6-month grace period before a company must begin paying the loan. In addition, companies that receive loans guaranteed by Fogape pursuant to these new regulations, will also have payment holiday for all other outstanding loans until a period of 6 months. Additionally, the Bank – in accordance with CMF’s instruction to facilitate access to credit for companies and household - has provided payment holiday terms of up to three months to mortgage customers with no more 30 days past due. This was extended by a further three months for customers in need. For consumer loans, the Bank has granted benefits such as a 3-month grace period to start paying, increases in terms, decreases in installments, and has even opted for current lower market rates. Customers who sought COVID-19 related support, including payment holidays, were not the subject of any wider SICR triggers, and do not have to be moved to Stage 2 for a lifetime ECL assessment unless they had triggered other SICR criteria, and payment holidays also did not cause accounts to become past due and therefore did not automatically trigger a Stage 2 or Stage 3 lifetime ECL assessment. The assessment of SICRs and the measurement of ECLs are required to be based on reasonable and supportable information that is available to an entity without undue cost or effort. The Bank has developed estimates based on the best available information about past events, current conditions and forecasts of economic conditions. In assessing forecast conditions, the Bank has considered the effects of COVID-19 and the support measures being undertaken. Despite of the above, with current COVID-19 infection rates having increased and continued high levels of uncertainty in the macro-economic outlook and to address a potential lag in defaults, the Bank has decided not to make changes over IFRS9 models regarding COVID-19, but rather has established management overlay or post-model adjustments for 2020 expected credit losses allowance. See Note N°37, Risk management. r) Allowance for loan losses – under IAS 39
The Bank performed an assessment of the risk associated with loans and accounts receivable from customers to determine their allowance for loan losses as described below:
The Bank models determined allowances and provisions for loan losses according to the type of portfolio or transactions. Loans and accounts receivables from customers were divided into three categories:
F-35 Banco Santander-Chile and Subsidiaries Notes to the Consolidated Financial Statements AS OF DECEMBER 31, 2020 AND 2019 AND FOR THE YEARS ENDED DECEMBER 31, 2020, 2019 AND 2018 NOTE 01 SUMMARY OF SIGNIFICANT ACCOUNTING POLICIES, continued
The models used to determine credit risk allowances are described as follows:
An individual assessment of commercial debtors was necessary in the case of companies which, due to their size, complexity or level of exposure regarding the entity, must be known and analyzed in detail.
For the purposes of establishing its provisions, the Bank assigned a risk category to each debtor, their loans and contingent loans. The risk factors considered
The Bank’s risk categories were as follows:
For loans classified as A1, A2, A3 and B, we assigned a specific provision level on an individual basis to each borrower and, therefore, the amount of loan loss allowance is determined on a case by case basis.
Estimated Incurred Loan Loss = Loan Loss Allowance.
The estimated incurred loss was obtained by multiplying all risk factors defined in the following equation:
EIL= EXP x PNP x SEV
EIL = Estimated Incurred Loan Loss. The estimated incurred loan loss is how much could be lost in the event a debtor does not perform the obligations under the loan.
EXP = Exposure. This corresponds to the value of commercial loans.
PNP = Probability of Non-Performance. This variable, expressed as a percentage, indicates the probability that a debtor will default. This percentage is associated with the internal rating that we give to each debtor, which is determined by analyzing such parameters as debt servicing capacity (including, usually, projected cash flows), the company’s financial history, the solvency and capacity of shareholders and management, and projections for the economic sector in which it operates.
SEV = Severity. This is the effective loss rate given default for debtors in the same segment, which is determined statistically based on the historical effective losses for each segment.
Every year, models together with PNP and SEV assumptions, were tested by the
These tests focused on the validation of the sufficiency of the F-36 Banco Santander-Chile and Subsidiaries Notes to the Consolidated Financial Statements AS OF DECEMBER 31, 2020 AND 2019 AND FOR THE YEARS ENDED DECEMBER 31, 2020, 2019 AND 2018 NOTE 01 SUMMARY OF SIGNIFICANT ACCOUNTING POLICIES, continued
For loans classified in the C and D categories, loan loss allowances were based mainly on the fair value of the collateral, adjusted for an estimated cost to sell, that each of these loans have. Allowance percentage for each category was then based on the fair value of the collateral, or the expected future cash flow from the loan for each individually evaluated non-performing loans.
The Bank used the concept of estimation of incurred loss to quantify the allowances levels over the group-evaluated portfolios, considering the risk and the guarantees associated with each transaction.
Following the
These models were meant to be used mainly to analyze loans granted to individuals (including consumer loans, credit lines, mortgage loans and commercial loans) and commercial loans to small to middle-sized entities (SMEs).
Allowances were established using these models, taking into account the historical Impairment and other known circumstances at the time of evaluation. After this, a historical loss rate was assigned to each portfolio profile constituting each evaluated group.
Allowances for group-evaluated loans were established based on the credit risk of the profile to which the loan belongs. The method for assigning a profile was based on statistical building method, establishing a relation through logistic regression of various variables, such as payment behavior in the Bank, payment behavior outside the Bank, various sociodemographic data, among others, and a response variable that determined a
The different risk categories were constructed and updated periodically based on the payment behavior of the
Allowance quantification, once the customers have been classified, was the product of three factors: exposure (EXP), Probability of Non-Performance (PNP) and Severity (SEV), the same equation used for individual assessment mentioned above.
The estimated incurred loss rates for group-evaluated loans correspond to charge-offs net of recoveries. The methodology established the period in which the estimated incurred loss for each risk profile emerges. Once the loss has been considered to have been incurred, the estimated incurred loss rates were applied to the corresponding risk profile to obtain the net charge-off level associated with this period. The loss rates applied to each risk profile are based only on the historical net charge-off data for that specific profile within one of the four groups of loans (consumer loans, credit lines, mortgage loans and commercial loans). No other statistical or other information other than net charge-offs was used to determine the loss rates.
To determine the estimated incurred loss for commercial and mortgage loans collectively evaluated for impairment, we mainly analyzed the payment behavior of clients, particularly the payment behavior of clients with payments that are more than 90 days overdue, clients with other weaknesses, such as early F-37 Banco Santander-Chile and Subsidiaries Notes to the Consolidated Financial Statements AS OF DECEMBER 31, 2020 AND 2019 AND FOR THE YEARS ENDED DECEMBER 31, 2020, 2019 AND 2018 NOTE 01 SUMMARY OF SIGNIFICANT ACCOUNTING POLICIES, continued
In connection with mortgage loans, historical net charge-offs were considered in the model to calculate loss rates for loans collectively evaluated for impairment. The risk categories were such that when a customer has a past-due balance or has missed some payments, the outcome was that the customer will move to a different risk category with a higher loss rate, therefore capturing current trends of the customer and, when aggregate, current trends in the market.
Our models for loans analyzed on a group basis (consumer loans, residential mortgage loans and small-and-mid- sized commercial loans) were monitored on a monthly basis with respect to predictability and stability, using indicators that seek to capture the underlying need to update the models for current loss trends. Therefore, the periods of historical net charge-offs used in the allowance model may were more than a year old as we only updated the historical net charge-offs when our assessment of predictability and stability indicators determine it was necessary.
As a general rule, charge-offs should be done when all collection efforts have been exhausted. These charge-offs consisted of derecognition from the Consolidated Statements of Financial Position of the corresponding loans transactions in its entirety, and, therefore, included portions not past-due of a loan in the case of installments loans or leasing transactions (no partial charge-offs exist).
Subsequent payments obtained from charged-off loans were
Loan and accounts receivable charge-offs were recorded for overdue and current installments based on the time periods expired since reaching overdue status, as described below:
Any payment agreement of an already charged-off loan did not give rise to income—as long as the operation was in an impaired status—and the effective payments received were accounted for as a recovery from loans previously charged-off.
Recovery of previously charged-off loans and accounts receivable from customers, were recorded in the Consolidated Statements of Income as a deduction from provisions for loan losses.
In accordance with our charge-off policy described in iii) above, we may subsequently
F-38 Banco Santander-Chile and Subsidiaries Notes to the Consolidated Financial Statements AS OF DECEMBER 31, 2020 AND 2019 AND FOR THE YEARS ENDED DECEMBER 31, 2020, 2019 AND 2018 NOTE 01 SUMMARY OF SIGNIFICANT ACCOUNTING POLICIES, continued s) Provisions, contingent assets and contingent liabilities
Provisions are liabilities of uncertain timing or amount. Provisions are
Contingent assets or contingent liabilities are any potential rights or obligations arising from past events whose existence will be confirmed only by the occurrence or non-occurrence if one or more uncertain future events that are not wholly within control of the Bank.
The Consolidated Statements of Financial Position and annual accounts reflect all significant provisions for which it is estimated that it is probable an outflow of resources will be required to meet the obligation where the probability of having to meet the obligation is more likely than not. Provisions are quantified using the best available information on the consequences of the event giving rise to them and are reviewed and adjusted at the end of each year. Provisions must specify the liabilities for which they were originally
Provisions are classified according to the obligation covered as follows:
t) Deferred income taxes and other deferred taxes
The Bank records, when appropriate, deferred tax assets and liabilities for the estimated future tax effects attributable to differences between the carrying amount of assets and liabilities and their tax bases. The measurement of deferred tax assets and liabilities is based on the tax rate, in accordance with the applicable tax laws, using the tax rate that applies to the period when the deferred asset and liability will be settled. The future effects of changes in tax legislation or tax rates are recorded in deferred taxes beginning on the date on which the law is enacted or substantially enacted.
u) Use of estimates
The preparation of the financial statements requires the Bank’s management to make estimates and assumptions that affect the application of the accounting policies and the reported balances of assets, liabilities, revenues and expenses. Actual results may differ from these estimates.
In certain cases, International Financial Reporting Standards (IFRS) require that assets or liabilities be recorded or disclosed at their fair values. The fair value is the price that would be received to sell an asset or paid to transfer a liability in an orderly transaction between market participants at the measurement date. When available, quoted market prices in active markets have been used as the basis for measurement. When quoted market prices in active markets are not available, the Bank has estimated such values based on the best information available, including the use of modeling and other valuation techniques.
The Bank has established allowances to cover
F-39 Banco Santander-Chile and Subsidiaries Notes to the Consolidated Financial Statements AS OF DECEMBER 31, 2020 AND 2019 AND FOR THE YEARS ENDED DECEMBER 31, 2020, 2019 AND 2018 NOTE 01 SUMMARY OF SIGNIFICANT ACCOUNTING POLICIES, continued The relevant estimates and assumptions made to calculate provisions are regularly reviewed by the Bank’s Management to quantify certain assets, liabilities, revenues, expenses, and commitments.
These estimates, made on the basis of the best available information, mainly refer to:
v) Non-current assets held for sale (in “Other Assets”)
The Bank has ensured to comply with related requirement established in IFRS 5, which include:
The Bank has measured their investment on the
As of December 31, 2020, the Bank has sold its investment in Nexus, while held its investment on Transbank and Redbanc (classified as held for sale), mainly to circumstances raised that were previously considered unlikely, such as social unrest and pandemic, and the consequent health and economic crisis. However, the Bank continues committed to its selling plan and its acquiring network development plan, as evidenced by the recent creation of a payment card operating company and the active search for potential buyers Assets received or awarded in lieu of payment
Assets received or awarded in lieu of payment of loans and accounts receivable from clients are
F-40 Banco Santander-Chile and Subsidiaries Notes to the Consolidated Financial Statements AS OF DECEMBER 31, 2020 AND 2019 AND FOR THE YEARS ENDED DECEMBER 31, 2020, 2019 AND 2018 NOTE 01 SUMMARY OF SIGNIFICANT ACCOUNTING POLICIES, continued Independent appraisals are obtained at least every 18 months and fair values are adjusted accordingly. No adjustments have been made between appraisals with respect to the period covered by these financial statements considering the stability of the real estate market in Chile during past years and expected stability of the real estate market in the coming years.
At least once a year, the Bank performs the necessary analysis to update the “cost to sale” of assets received or awarded in lieu of payments. According to the Bank’s survey, as of December 31,
w) Earnings per share
Basic earnings per share are determined by dividing the net income attributable to the shareholders of the Bank for the reported period by the weighted average number of shares outstanding during the reported period.
Diluted earnings per share are determined in the same way as basic earnings, but the weighted average number of outstanding shares is adjusted to take into consideration the potential diluting effect of stock options, warrants, and convertible debt.
As of December 31,
x) Temporary acquisition (assignment) of assets and liabilities
Purchases or sales of financial assets under non-optional repurchase agreements at a fixed price are recorded in the Consolidated Statements of Financial Position based on the nature of the debtor (creditor) under “Deposits in the Central Bank of Chile,” “Deposits in financial institutions” or “Loans and accounts receivable from customers” (“Central Bank of Chile deposits,” “Deposits from financial institutions” or “Customer deposits”), in Note 7.
Differences between the purchase and sale prices are recorded as financial interest over the term of the contract.
y) Provision for mandatory dividends
As of December 31,
According to current collective labor agreements and other agreements, the Bank has an additional benefit available to its principal executives, consisting of a pension plan whose purpose is to endow them with funds for a better supplementary pension upon their retirement.
Features of the Plan:
The main features of the Post-Employment Benefits Plan promoted by the Banco
The Bank uses the method of projected unit credit, to determine the present value of the defined benefit obligation and the current service cost.
F-41 Banco Santander-Chile and Subsidiaries Notes to the Consolidated Financial Statements AS OF DECEMBER 31, 2020 AND 2019 AND FOR THE YEARS ENDED DECEMBER 31, 2020, 2019 AND 2018 NOTE 01 SUMMARY OF SIGNIFICANT ACCOUNTING POLICIES, continued Components of defined benefit cost include:
The liability (asset) for net defined benefit is the deficit or surplus, determined as the difference between the present value of the defined benefit obligation less the fair value of plan assets.
Plan assets comprise the pension fund taken out by the Group with a third party that is not a related party. These assets are held by an entity legally separated from the Bank and exist solely to pay benefits to employees.
The Bank
The post-employment benefits liability,
When employees leave the plan before meeting the requirements to be eligible for the benefit, contributions made
ii. Cash-settled
The Bank allocates cash-settled
1. New and revised standards effective in current year
The following new and revised IFRS have been adopted in these financial statements:
Banco Santander-Chile and
Notes to the Consolidated Financial Statements AS OF DECEMBER 31,
NOTE 01 SUMMARY OF SIGNIFICANT ACCOUNTING POLICIES, continued
The
Amendments to IFRS
Amendments to IFRS
3. require lessees that apply the exemption to disclose that fact; and 4. require lessees to apply the exemption retrospectively in accordance with IAS 8,
The
2. New and revised IFRS issued but not effective
As of the closing date of these financial statements, new International Financial Reporting Standards had been published as well as interpretations of them, which were not mandatory as of December 31,
Amendments to IFRS 10 and IAS 28 - Sale or Contributions of Assets between an Investor and its Associate or Joint
On December 17, 2015 the IASB has published final amendments to “Sale or Contribution of Assets between an Investor and its Associate or Joint Venture”. The amendments defer the effective date of the September 2014 amendments to these standards indefinitely until the research project on the equity method has been concluded.The Bank’s management has considered that these amendments will not have a material impact on the consolidated financial statements of the Bank.
Banco Santander-Chile and
Notes to the Consolidated Financial Statements AS OF DECEMBER 31,
NOTE 01 SUMMARY OF SIGNIFICANT ACCOUNTING POLICIES, continued
Amendments to IAS 1 - Classification of liabilities as current or non-current. Issued on January 23, 2020, this amendment to provides a general approach to the classification of liabilities under IAS 1 based on the contractual arrangements in place at the reporting date. The
The amendments are effective for annual reporting periods beginning on or after January 1, 2023 and are to be applied retrospectively. Earlier application is permitted. The Bank’s management is evaluating the Annual Improvements to IFRS Standards 2018–2020. Issued on May 15, 2020, the
The amendments to IFRS 1, IFRS 9, and
Amendments to IAS The Bank’s management Amendments to IAS 37 Onerous Contracts — Cost of Fulfilling a Contract. Issued on May 15, 2020, the changes specify that
F-44 Banco Notes to the Consolidated Financial Statements AS OF DECEMBER 31,
NOTE SUMMARY OF SIGNIFICANT ACCOUNTING Amendments to IFRS 3 - Reference to the Conceptual Framework. Issued on May 15, 2020, the changes include:
Interest rate benchmark reform - phase 2. Issued on August 27, 2020, and once IASB has finalized its response to the ongoing reform of inter-bank offered rates (IBOR) and other interest rate benchmarks by issuing a
The
The
These amendments are effective for annual reporting periods beginning on or after January 1,
Accounting changes The Company changed the manner in which it accounts for leases in 2019, by adopting IFRS 16 starting January 1 of 2019. In addition they changed the manner in which it accounts for financial instruments in 2018, by adopting IFRS 9 starting January 1, 2018. F-45 Banco Notes to the Consolidated Financial Statements AS OF DECEMBER 31,
As of December 31,
At the extraordinary Shareholders' Meeting of Banco Santander held on April 30, 2020, the members approved the Consolidated Financial Statements for 2019, and agreed to distribute 30% of the net profits for 2019 (“Net income attributable to shareholders of the Bank ”), which amounted to $552,093 million, which correspond to a dividend of $0.87891310 Chilean pesos per share. Likewise, the members agreed to increase the Bank’s reserves by 40% and the remaining 30% will be classified as retained earnings from previous years.
Appointment of external auditors: the At the Extraordinary Shareholders' Meeting of Banco Santander held on November 26, 2020, the members agreed to distribute a dividend of $0.87891310 Chilean pesos per share, corresponding to 30% of the retained earnings for 2019, which was paid on the following banking business day after the meeting date.
COVID-19 is a highly contagious infectious disease, which was first detected in Wuhan, China in December 2019. Subsequently, on March 11, 2020, the World Health Organization (WHO) declared it a pandemic. In Chile, on March 18, 2020, the President of the Republic decreed a state of national catastrophe to implement health and economic measures. Because of the pandemic, the economic activity and employment has been affected and hence the government and government entities and regulatory entities have implemented support measures to mitigate serious impact of the pandemic. On March 23, 2020, the FMC issued a package of measures aimed at granting greater flexibility to the financial system. In addition, the FMC asked for measures to facilitate the attention of customers and users and maintain adequate risk management policies and establish prudent dividend policy, given the situation. On April 9, 2020, the Central Bank of Chile (BCCh) announced new measures to support the operation of financial markets. On April 12, 2020 the government issued its first economic emergency plan, to protect families and F-46 Banco Notes to the Consolidated Financial Statements AS OF DECEMBER 31,
NOTE SIGNIFICANT EVENTS, continued
On February 24, 2020, the law that modernizes the tax system was published in the Official Gazette. This new regulation implies modifications to the Income Tax Law, to the Value-Added Tax (VAT) and to the Tax Code, among other aspects.
On May 29, 2020, Law No. 21,234, which limits the legal responsibility of holders or users of payment cards and electronic transactions in the event of loss, theft, or fraud, was published. The law establishes that the issuer will always be responsible for the evidence related to operations that the user denies having authorized. Just the operations’ record will not necessarily be enough to demonstrate that these were authorized by the user, nor that the user acted with fault or carelessness attributable to them. The issuer must proceed to cancel the charges or restitute the funds within a period of 5 business days from the date of the claim if the amount is less than 35 UF or 7 additional days for higher amounts. Additionally, issuers are prohibited from offering insurance covering risks that must be assumed by the issuer in accordance with the new law. As a result of the new law’s application, the Bank has
providers. The Bank
On March 20, 2020, Klare Corredora de Seguros S.A. was notified by the FMC about its registration in the Insurance Trade Registry as a General and Life Insurance Broker. Currently the company operates under a 100% digital Insurance Broker modality.
A Material Event published on July 6, 2020, Banco Santander Chile informed, prior authorization of the FMC through Resolution No. 3223 dated June 30 2020, that it had registered a new company named “Sociedad Operadora de Tarjeta de Pago Santander Getnet Chile S.A.”, whose purpose is to conduct operations of credit, debit and prepaid cards in accordance with the Chilean Central Bank and the FMC regulations. This is a banking support and subsidiary company of Banco Santander with a 99.99% share participation (Santander Asesorias Financieras Limitada has a 0.01% share participation). A Material Event published on December 22, 2020, disclosed that “Sociedad Operadora de Tarjetas de Pago Santander Getnet Chile S.A.” called for an Extraordinary Shareholders' Meeting for January 7, 2021. The purpose was to discuss the monetary contribution and the analysis and appraisal of the assets that shareholders will contribute, account for the operations in scope of Title XVI of Law 18,046, and other social interest agreements and granting powers to comply with the resolutions reached in this meeting. On December 30, 2020, Banco Santander-Chile, made a capital contribution to “Sociedad Operadora de Tarjeta de Pago Santander Getnet Chile S.A.”. F-47 Banco Santander-Chile and Subsidiaries Notes to the Consolidated Financial Statements AS OF DECEMBER 31,
NOTE SIGNIFICANT EVENTS, continued
f.1 Senior bonds As of December 31, 2020 the Bank has issued senior bonds for an amount of USD742,500,000. The debt issuance information is included in Note 18.
f.2 Subordinated bonds As at December 31, 2020 the Bank has issued subordinated bonds for an amount of USD200,000,000 and UF5,000,000. The debt issuance information is included in Note 18.
F-48 Banco Santander-Chile and Subsidiaries Notes to the Consolidated Financial Statements AS OF DECEMBER 31, 2020 AND 2019 AND FOR THE YEARS ENDED DECEMBER 31, 2020, 2019 AND 2018 REPORTING SEGMENTS
The Bank manages and measures the performance of its operations by business segments. The information disclosed in this note is not necessarily comparable to that of other financial institutions, since it is based on management’s internal information system by segment.
Inter-segment transactions are conducted under normal arm’s length commercial terms and conditions. Each segment’s assets, liabilities, and income include items directly attributable to the segment to which they can be allocated on a reasonable basis.
Under IFRS 8, the Bank has aggregated operating segments with similar economic characteristics according to the aggregation criteria specified in the standard. A reporting segment consists of clients that are offered differentiated but, considering how their performance is measured, are homogenous services based on IFRS 8 aggregation criteria, thus they form part of the same reporting segment. Overall, this aggregation has no significant impact on the understanding of the nature and effects of the Bank’s business activities and the economic environment.
The Bank has the reportable segments noted below:
Retail Banking
Consists of individuals and small to middle-sized entities (SMEs) with annual income less than Ch$
Middle-market
This segment is made up of companies and large corporations with annual sales exceeding Ch$
This segment consists of foreign and domestic multinational companies with sales over Ch$10,000 million. The companies within this segment have access to many products including commercial loans, leasing, factoring, foreign trade, credit cards, mortgage loans, checking accounts, transactional services, treasury services, financial consulting, investments, savings products, mutual funds and insurance brokerage.
This segment also consists of a Treasury Division which provides sophisticated financial products, mainly to companies in the Middle-market and Global
Corporate Activities (“Other”)
This segment mainly includes the results of our Financial Management Division, which develops global management functions, including managing inflation rate risk, foreign currency gaps, interest rate risk and liquidity risk. Liquidity risk is managed mainly through wholesale deposits, debt issuances and the Bank’s available for sale portfolio. This segment also manages capital allocation by unit. These activities usually result in a negative contribution to income.
F-49 Banco Santander-Chile and Subsidiaries Notes to the Consolidated Financial Statements AS OF DECEMBER 31, 2020 AND 2019 AND FOR THE YEARS ENDED DECEMBER 31, 2020, 2019 AND 2018 NOTE 03 REPORTING SEGMENTS. CONTINUED In addition, this segment encompasses all the intra-segment income and all the activities not assigned to a given segment or product with customers.
The segments’ accounting policies are those described in the summary of accounting
Below are the tables showing the Bank’s results by reporting segment for the years ended December 31,
(1) Corresponds to loans and accounts receivable at (2) Corresponds to the sum of the net income from financial operations and the foreign exchange profit or loss. (3) Corresponds to the sum of personnel salaries and expenses, administrative expenses, depreciation and amortization.
F-50 Banco Notes to the Consolidated Financial Statements AS OF DECEMBER 31,
NOTE REPORTING SEGMENTS, continued
(1) Corresponds to loans and accounts receivable (2) Corresponds to the sum of the net income from financial operations and the foreign exchange profit or loss. (3) Corresponds to the sum of personnel salaries and expenses, administrative expenses, depreciation and amortization.
F-51 Banco Notes to the Consolidated Financial Statements AS OF DECEMBER 31,
NOTE REPORTING SEGMENTS, continued
(1) Corresponds to loans and accounts receivable (2) Corresponds to the sum of the net income from financial operations and the foreign exchange profit or loss. (3) Corresponds to the sum of personnel salaries and expenses, administrative expenses, depreciation and amortization.
F-52 Banco Notes to the Consolidated Financial Statements AS OF DECEMBER 31,
CASH AND CASH EQUIVALENTS
a) The detail of the balances included under cash and cash equivalents is as follows:
The balance of funds held in cash and at the Central Bank of Chile reflects the monthly average that the Bank must maintain in accordance with the regulations governing minimum reserves although the balance can be withdrawn on demand.
b) Cash in process of collection and in process of being cleared:
Cash items in process of collection and in process of being cleared represent domestic transactions which have not been processed through the central domestic clearinghouse or international transactions which may be delayed in settlement due to timing differences. These transactions were as follows:
F-53 Banco Notes to the Consolidated Financial Statements AS OF DECEMBER 31,
FINANCIAL ASSETS HELD FOR TRADING
The detail of instruments deemed as financial trading investments is as follows:
As of December 31,
F-54 Banco Notes to the Consolidated Financial Statements AS OF DECEMBER 31,
INVESTMENTS UNDER RESALE AGREEMENTS AND OBLIGATIONS UNDER REPURCHASE AGREEMENTS
b) Obligations arising from repurchase agreements
The Bank raises funds by selling financial instruments and committing itself to buy them back at future dates, plus interest at a predetermined rate. As of December 31,
F-55
NOTE INVESTMENTS UNDER RESALE AGREEMENTS AND OBLIGATIONS UNDER REPURCHASE AGREEMENTS, continued
c) Below is the detail by portfolio of collateral associated with repurchase agreements as of December 31, 2020 and 2019, valued at fair value:
F-56
DERIVATIVE FINANCIAL INSTRUMENTS AND HEDGE ACCOUNTING
F-57 Banco Santander-Chile and Subsidiaries Notes to the Consolidated Financial Statements AS OF DECEMBER 31, 2020 AND 2019 AND FOR THE YEARS ENDED DECEMBER 31, 2020, 2019 AND 2018 NOTE DERIVATIVE FINANCIAL INSTRUMENTS AND HEDGE ACCOUNTING, continued
Fair value
The Bank uses cross-currency swaps and interest rate swaps to hedge its exposure to changes in fair value of hedged items attributable to interest rates.
Below is a detail of the hedged elements and hedge instruments under fair value hedges as of December 31,
F-58
NOTE DERIVATIVE FINANCIAL INSTRUMENTS AND HEDGE ACCOUNTING, continued
Cash flow
The Bank uses cross currency swaps to hedge the risk from variability of cash flows attributable to changes in the interest rates of bonds and interbank loans at a variable interest rate.
Below is the notional amount of the hedged items as of December 31,
F-59 Banco Santander-Chile and Subsidiaries Notes to the Consolidated Financial Statements AS OF DECEMBER 31, 2020 AND 2019 AND FOR THE YEARS ENDED DECEMBER 31, 2020, 2019 AND 2018 NOTE DERIVATIVE FINANCIAL INSTRUMENTS AND HEDGE ACCOUNTING, continued
Below is an estimate of the periods in which cash flows are expected to be produced:
b.1 Forecasted cash flows for interest rate risk:
(*)Only includes cash flow forecast portion of the hedge instruments used to cover interest rate risk.
(*)Only includes cash flow forecast portion of the hedge instruments used to cover interest rate risk.
b.2 Forecasted cash flows for inflation risk:
F-60 Banco Santander-Chile and Subsidiaries Notes to the Consolidated Financial Statements AS OF DECEMBER 31, 2020 AND 2019 AND FOR THE YEARS ENDED DECEMBER 31, 2020, 2019 AND 2018 NOTE DERIVATIVE FINANCIAL INSTRUMENTS AND HEDGE ACCOUNTING, continued
b.3 Forecasted cash flows for exchange rate risk:
As of December 31,
Since the inflows and outflows for both the hedged element and the hedging instrument mirror each other, the hedges are nearly 100% effective, which means that
See Note 23 - Equity, letter e)
As of December 31, F-61 Banco Santander-Chile and Subsidiaries Notes to the Consolidated Financial Statements AS OF DECEMBER 31, 2020 AND 2019 AND FOR THE YEARS ENDED DECEMBER 31, 2020, 2019 AND 2018 NOTE 07 DERIVATIVE FINANCIAL INSTRUMENTS AND HEDGE ACCOUNTING, continued
As of December 31, 2020 and 2019, Other Assets include MCh$327,938 and MCh$210,867 respectively, related to fair value measurement of net assets or liabilities subject to macrohedges. See Note 15. F-62 Banco Santander-Chile and Subsidiaries Notes to the Consolidated Financial Statements AS OF DECEMBER 31, 2020 AND 2019 AND FOR THE YEARS ENDED DECEMBER 31, 2020, 2019 AND 2018 LOANS AND
As of December 31,
(*) Include overlays for an amount of MCh$59,000. See Note 37. F-63
NOTE LOANS AND
As of December 31, 2019 the composition of the loan portfolio is as follows:
F-64 Banco Santander-Chile and Subsidiaries Notes to the Consolidated Financial Statements AS OF DECEMBER 31, 2020 AND 2019 AND FOR THE YEARS ENDED DECEMBER 31, 2020, 2019 AND 2018 NOTE 08 LOANS AND ACCOUNTS RECEIVABLE AT AMORTIZED COST, continued a. Commercial loans
An analysis of changes in the gross carrying amount and the corresponding ECL allowance as of December 31, 2020, is as follows:
F-65
NOTE LOANS AND
An analysis of changes in the gross carrying amount and the corresponding ECL allowance as of December 31, 2019, is as follows:
(*) Include loans and ECL balances of the acquired Santander Consumer Chile S.A.
NOTE LOANS AND
b. Mortgage loans
An analysis of changes in the gross carrying amount and the corresponding ECL allowance as of December 31, 2020, is as follows:
NOTE LOANS AND An analysis of changes in the gross carrying amount and the corresponding ECL allowance as of December 31, 2019, is as follows:
F-68 Banco Santander-Chile and Subsidiaries Notes to the Consolidated Financial Statements AS OF DECEMBER 31, 2020 AND 2019 AND FOR THE YEARS ENDED DECEMBER 31, 2020, 2019 AND 2018 NOTE 08 LOANS AND ACCOUNTS RECEIVABLE AT AMORTIZED, continued c. Consumer loans An analysis of changes in the gross carrying amount and the corresponding ECL allowance as of December 31, 2020, is as follows:
F-69 Banco Santander-Chile and Subsidiaries Notes to the Consolidated Financial Statements AS OF DECEMBER 31, 2020 AND 2019 AND FOR THE YEARS ENDED DECEMBER 31, 2020, 2019 AND 2018 NOTE 08 LOANS AND ACCOUNTS RECEIVABLE AT AMORTIZED, continued An analysis of changes in the gross carrying amount and the corresponding ECL allowance as of December 31, 2019, is as follows:
(*) Include loans and ECL balances of the acquired Santander Consumer Chile S.A. For 2020, there were no changes in forward-looking variables. However, on April 2020, the Bank completed a calibration of parameters, in accordance with internal policies, resulting in an increase of MCh$2,066 within the expected credit losses allowance. For 2019, there were no changes to the assumptions used within the model. However, the Bank completed an update of the 2018 forward-looking assessment, resulting in an increase of MCh$6,998 within the provision for loan losses. F-70 Banco Santander-Chile and Subsidiaries Notes to the Consolidated Financial Statements AS OF DECEMBER 31, 2020 AND 2019 AND FOR THE YEARS ENDED DECEMBER 31, 2020, 2019 AND 2018 LOANS AND ACCOUNTS RECEIVABLE AT FAIR VALUE THROUGH OTHER COMPREHENSIVE INCOME
The Bank has decided to classify a portfolio at fair value through other comprehensive income (FVOCI) related to loans and account receivable with its major customer, when they request a credit operation which exceeds single client exposure under the
Additionally, the Bank includes operations which are expecting to sell or maintain, depending if market conditions are
An analysis of changes in the gross carrying amount and the corresponding ECL allowance is, as of December 31, 2020 is as follows:
Banco Notes to the Consolidated Financial Statements AS OF DECEMBER 31, 2018
NOTE LOANS AND ACCOUNTS RECEIVABLE
F-72 Banco Notes to the Consolidated Financial Statements AS OF DECEMBER 31,
DEBT INSTRUMENTS AT FAIR VALUE THROUGH OTHER COMPREHENSIVE INCOME
As of December 31,
(*) Includes Treasury bonds in Chilean pesos and UF.
As of December 31, As of December 31, 2019 debt instruments at FVOCI included a cumulative net unrealized income of MCh$29,184, recorded as "valuation adjustment" in OCI, of which MCh$28,135 are attributable to shareholders equity and F-73 Banco Santander-Chile and Subsidiaries Notes to the Consolidated Financial Statements AS OF DECEMBER 31, 2020 AND 2019 AND FOR THE YEARS ENDED DECEMBER 31, 2020, 2019 AND 2018 NOTE 10 DEBT INSTRUMENTS AT FAIR VALUE THROUGH OTHER COMPREHENSIVE INCOME, continued
An analysis of changes in the fair value and the corresponding ECL as of December 31, 2020 is as follows:
An analysis of changes in the fair value and the corresponding ECL as of December 31, 2019 is as follows:
F-74 Banco Notes to the Consolidated Financial Statements AS OF DECEMBER 31,
NOTE DEBT INSTRUMENTS AT FAIR VALUE THROUGH OTHER COMPREHENSIVE INCOME, continued
Gross profits and losses realized on the sale of available for sale investments as of December 31,
The Bank evaluated those instruments with unrealized losses as of December 31, F-75 Banco Notes to the Consolidated Financial Statements AS OF DECEMBER 31,
NOTE DEBT INSTRUMENTS AT FAIR VALUE THROUGH OTHER COMPREHENSIVE INCOME, continued
The following charts show
F-76 Banco Notes to the Consolidated Financial Statements AS OF DECEMBER 31,
NOTE 10 DEBT INSTRUMENTS AT FAIR VALUE THROUGH OTHER COMPREHENSIVE INCOME, continued The following charts show debt instruments at fair value through other comprehensive income cumulative unrealized profit and loss, as of December 31, 2019:
F-77 Banco Santander-Chile and Subsidiaries Notes to the Consolidated Financial Statements AS OF DECEMBER 31, 2020 AND 2019 AND FOR THE YEARS ENDED DECEMBER 31, 2020, 2019 AND 2018 INVESTMENTS IN ASSOCIATES AND OTHER COMPANIES
As described in Note 1 g), the Bank has irrevocably designated its
F-78 Banco Notes to the Consolidated Financial Statements AS OF DECEMBER 31,
NOTE INVESTMENTS IN ASSOCIATES AND OTHER COMPANIES, continued
There are no significant restrictions regarding the capacity of associates to transfer funds, whether in cash dividends, refund of loans, or advance payments to the Bank.
(*) The Bank has entered into a process of selling the shares in Redbanc S.A., Transbank S.A. and Nexus SA, Thus, these investments have been reclassified to
F-79 Banco Notes to the Consolidated Financial Statements AS OF DECEMBER 31,
INTANGIBLE ASSETS
b.1Gross balance
F-80 Banco Notes to the Consolidated Financial Statements AS OF DECEMBER 31,
NOTE INTANGIBLE ASSETS, continued
F-81 Banco Notes to the Consolidated Financial Statements AS OF DECEMBER 31,
FIXED ASSETS AND
b.1Gross balance
F-82 Banco Notes to the Consolidated Financial Statements AS OF DECEMBER 31,
NOTE
FIXED ASSETS AND
(*) Banco Santander-Chile has recognized in its consolidated financial statements as of December 31, 2019 impairment of $1,013 million, due to the effects of social unrest in the country. See Note 32.
b.2Accumulated depreciation
F-83 Banco Notes to the Consolidated Financial Statements AS OF DECEMBER 31,
NOTE
FIXED ASSETS AND
d.1 Gross balance
F-84 Banco Santander-Chile and Subsidiaries Notes to the Consolidated Financial Statements AS OF DECEMBER 31, 2020 AND 2019 AND FOR THE YEARS ENDED DECEMBER 31, 2020, 2019 AND 2018 NOTE 13 FIXED ASSETS AND RIGHT OF USE ASSETS AND LEASE LIABILITY, continued d.2 Accumulated amortization
As of December 31, 2020 and 2019, the composition of lease liability balances are composed as follows:
An explanation of the difference between operating lease commitment under IAS 17 at December 31, 2018 and initial application of IFRS 16 as of January 1, 2019 is as follows:
F-85 Banco Santander-Chile and Subsidiaries Notes to the Consolidated Financial Statements AS OF DECEMBER 31, 2020 AND 2019 AND FOR THE YEARS ENDED DECEMBER 31, 2020, 2019 AND 2018 NOTE 13 FIXED ASSETS AND RIGHT OF USE ASSETS AND LEASE LIABILITY, continued
As of December 31,
F-86 Banco Notes to the Consolidated Financial Statements AS OF DECEMBER 31,
CURRENT AND DEFERRED TAXES
As of December 31,
b) Effect on income
The effect of income tax expense on income for the years ended December 31,
F-87 Banco Notes to the Consolidated Financial Statements AS OF DECEMBER 31,
NOTE CURRENT AND DEFERRED TAXES, continued
c) Effective tax rate reconciliation
The reconciliation between the income tax rate and the effective rate applied in determining tax expenses as of December 31,
(1)
d) Effect of deferred taxes on comprehensive income
Below is a summary of the separate effect of deferred tax on other comprehensive income, showing the asset and liability balances, for the years ended December 31,
F-88 Banco Notes to the Consolidated Financial Statements AS OF DECEMBER 31,
NOTE CURRENT AND DEFERRED TAXES, continued
e) Effect of deferred taxes on income
As of December 31,
f) Summary of deferred tax assets and liabilities
Below is a summary of the deferred taxes impact on equity and
F-89 Banco Notes to the Consolidated Financial Statements AS OF DECEMBER 31,
OTHER ASSETS
Other
F-90 Banco Notes to the Consolidated Financial Statements AS OF DECEMBER 31,
TIME DEPOSITS AND OTHER TIME LIABILITIES
As of December 31,
F-91 Banco Notes to the Consolidated Financial Statements AS OF DECEMBER 31,
INTERBANK BORROWINGS
As of December 31,
F-92 Banco Notes to the Consolidated Financial Statements AS OF DECEMBER 31,
NOTE INTERBANK BORROWINGS, continued
a) Loans from the Chilean Central Bank In response to the COVID-19 pandemic, the Chilean Central Bank has made two lines of credit available to banks to reinforce their liquidity, amounting to a total of US$24 billion for the whole banking system. These lines of credit bear interest at the Central Bank’s monetary policy rate (MPR), which was 0.5% as of December 31, 2020. Pursuant to these lines of credit, a bank may borrow up to 3% of the aggregate amount of its consumer and commercial loan portfolios as of February 29, 2020 and may borrow up to an additional 12% if it uses the funds to provide loans to companies and individuals. The first line of credit is a facility available conditionally on loan growth (the “FCIC”) to ensure that banks continue to finance households and businesses in Chile. Loans provided by this line of credit may have maturities of up to 4 years and must be secured by government bonds, corporate bonds or highly rated large commercial loans as collateral. Loans provided under the second line of credit, the LCL, are unsecured and may have maturities of up to 2 years. In addition, the LCL are limited to the aggregate amount of the liquidity reserve requirements of each bank. F-93 Banco Notes to the Consolidated Financial Statements AS OF DECEMBER 31,
NOTE INTERBANK BORROWINGS, continued
b) Loans from domestic financial institutions
These obligations’ maturities are as follows:
c) Foreign obligations
F-94 Banco Notes to the Consolidated Financial Statements AS OF DECEMBER 31,
ISSUED DEBT INSTRUMENTS AND OTHER FINANCIAL LIABILITIES
As of December 31,
Debts classified as current are either demand obligations or will mature in one year or
F-95 Banco Notes to the Consolidated Financial Statements AS OF DECEMBER 31,
NOTE ISSUED DEBT INSTRUMENTS AND OTHER FINANCIAL LIABILITIES, continued
a) Mortgage finance bonds
These bonds are used to finance mortgage
b) Senior bonds
The following table shows senior bonds by currency:
F-96 Banco Notes to the Consolidated Financial Statements AS OF DECEMBER 31,
NOTE ISSUED DEBT INSTRUMENTS AND OTHER FINANCIAL LIABILITIES, continued
In
During
F-97 Banco Notes to the Consolidated Financial Statements AS OF DECEMBER 31,
NOTE ISSUED DEBT INSTRUMENTS AND OTHER FINANCIAL LIABILITIES, continued
F-98 Banco Notes to the Consolidated Financial Statements AS OF DECEMBER 31,
NOTE ISSUED DEBT INSTRUMENTS AND OTHER FINANCIAL LIABILITIES, continued In 2019, the Bank issued bonds for UF 29,678,000; CLP 115,000,000,000; EUR 30,000,000; AUD 160,000,000 and CHF 250,000,000 detailed as follows:
F-99 Banco Santander-Chile and Subsidiaries Notes to the Consolidated Financial Statements AS OF DECEMBER 31, 2020 AND 2019 AND FOR THE YEARS ENDED DECEMBER 31, 2020, 2019 AND 2018 NOTE 18 ISSUED DEBT INSTRUMENTS AND OTHER FINANCIAL LIABILITIES, continued
During
ii. The maturities of senior bonds are as follows:
c) Mortgage bonds
Detail of mortgage bonds per currency is as follows:
F-100 Banco Santander-Chile and Subsidiaries Notes to the Consolidated Financial Statements AS OF DECEMBER 31, 2020 AND 2019 AND FOR THE YEARS ENDED DECEMBER 31, 2020, 2019 AND 2018
NOTE 18 ISSUED DEBT INSTRUMENTS AND OTHER FINANCIAL LIABILITIES, continued i. Allocation of mortgage bonds
During
d) Subordinated bonds
Detail of the subordinated bonds per currency is as follows:
F-101 Banco Notes to the Consolidated Financial Statements AS OF DECEMBER 31,
NOTE ISSUED DEBT INSTRUMENTS AND OTHER FINANCIAL LIABILITIES, continued
e) Other financial liabilities
The composition of other financial obligations, by maturity, is detailed below:
F-102 Banco Notes to the Consolidated Financial Statements AS OF DECEMBER 31,
MATURITY OF FINANCIAL ASSETS AND LIABILITIES
As of December 31,
(*) Loans and accounts receivables at amortized cost are presented on a gross basis, the amount of allowance is Ch$1,036,793 million.
(**) Loans and accounts receivables at FVOCI are presented on a gross basis, the amount of allowance is Ch$1,354 million. F-103 Banco Notes to the Consolidated Financial Statements AS OF DECEMBER 31,
NOTE MATURITY OF FINANCIAL ASSETS AND LIABILITIES
(*) Loans and accounts receivables at amortized cost are presented on a gross basis, the amount of allowance is Ch$ 896,095 million.
(**) Loans and accounts receivables at FVOCI are presented on a gross basis, the amount of allowance is Ch$101 million. F-104 Banco Notes to the Consolidated Financial Statements AS OF DECEMBER 31,
PROVISIONS AND CONTINGENT PROVISIONS
F-105 Banco Santander-Chile and Subsidiaries Notes to the Consolidated Financial Statements AS OF DECEMBER 31, 2020 AND 2019 AND FOR THE YEARS ENDED DECEMBER 31, 2020, 2019 AND 2018 NOTE 20 PROVISIONS AND CONTINGENT PROVISIONS, continued
Provision for contingent loan arise from contingent liabilities and loan commitments. Provisions for ECL risks in respect of contingent loan are included in ECL allowance in the income statements for the year.
An analysis of changes in the corresponding ECL allowance as of December 31, 2020 and 2019 is as follows:
F-106 Banco Notes to the Consolidated Financial Statements AS OF DECEMBER 31,
OTHER LIABILITIES
The other liabilities line item is as follows:
Banco Notes to the Consolidated Financial Statements AS OF DECEMBER 31,
CONTINGENCIES AND COMMITMENTS
As of the issuance date of these financial statements, the Bank and its affiliates were subject to certain legal actions in the normal course of their
The following table shows the Bank’s contractual obligations to issue loans:
The Bank holds securities in the normal course of its business as follows:
During
Banco F-108 Banco Santander-Chile and Subsidiaries Notes to the Consolidated Financial Statements AS OF DECEMBER 31, 2020 AND 2019 AND FOR THE YEARS ENDED DECEMBER 31, 2020, 2019 AND 2018 NOTE 22 CONTINGENCIES AND COMMITMENTS, continued
Banco Notes to the Consolidated Financial Statements AS OF DECEMBER 31,
EQUITY
As of December 31,
The activity with respect to shares during
As of December 31,
As of December 31, 2020 the shareholder composition was as follows:
(*) American Depository Receipts (ADR) are certificates issued by a U.S. commercial bank to be traded on the U.S. securities markets. As of December 31, 2019 the shareholder composition was as follows:
(*) American Depository Receipts (ADR) are certificates issued by a U.S. commercial bank to be traded on the U.S. securities markets. F-110 Banco Santander-Chile and Subsidiaries Notes to the Consolidated Financial Statements AS OF DECEMBER 31, 2020 AND 2019 AND FOR THE YEARS ENDED DECEMBER 31, 2020, 2019 AND 2018 NOTE 23 EQUITY, continued As of December 31, 2018 the shareholder composition was as follows:
The distribution of dividends is detailed in the Consolidated Statements of Changes in Equity.
As of December 31,
Banco Notes to the Consolidated Financial Statements AS OF DECEMBER 31,
NOTE EQUITY, continued
The Bank expects that the results included in
Banco Notes to the Consolidated Financial Statements AS OF DECEMBER 31,
NON-CONTROLLING INTEREST
(1) Formerly Santander Agente de Valores Limitada (2) On November 27, 2019, the Bank acquired 51% of Santander Consumer S.A., and the remaining 49% is accounted as non-controlling interest.
Banco Notes to the Consolidated Financial Statements AS OF DECEMBER 31,
NOTE NON-CONTROLLING INTEREST, continued
Banco Notes to the Consolidated Financial Statements AS OF DECEMBER 31,
NOTE NON-CONTROLLING INTEREST,
F-115 Banco Notes to the Consolidated Financial Statements AS OF DECEMBER 31,
INTEREST INCOME
This item refers to interest earned in the period from the financial assets whose return, whether implicitly or explicitly, is determined by applying the effective interest rate method, regardless of the value at fair value, as well as the effect of hedge accounting (see c).
F-116 Banco Notes to the Consolidated Financial Statements AS OF DECEMBER 31,
NOTE INTEREST INCOME, continued
c) For the years ended December 31,
F-117 Banco Notes to the Consolidated Financial Statements AS OF DECEMBER 31,
FEES AND COMMISSIONS
This item includes the amount of fees earned and paid during the year, except for those which are an integral part of the financial instrument’s effective interest rate:
The fees earned in transactions with letters of credit are presented in the Consolidated Statements of Income in the line item “Interest income” F-118 Banco Notes to the Consolidated Financial Statements AS OF DECEMBER 31,
NOTE FEES AND COMMISSIONS, continued
F-119 Banco Santander-Chile and Subsidiaries Notes to the Consolidated Financial Statements AS OF DECEMBER 31, 2020 AND 2019 AND FOR THE YEARS ENDED DECEMBER 31, 2020, 2019 AND 2018 NOTE 26 FEES AND COMMISSIONS, continued
F-120 Banco Notes to the Consolidated Financial Statements AS OF DECEMBER 31,
NET INCOME (EXPENSE) FROM FINANCIAL OPERATIONS
Table of
Banco Notes to the Consolidated Financial Statements AS OF DECEMBER 31,
NET FOREIGN EXCHANGE GAIN (LOSS)
Net foreign exchange income includes the income earned from foreign currency trading, differences arising from converting monetary items in a foreign currency to the functional currency, and those generated by non-monetary assets in a foreign currency at the time of their
For the years ended December 31,
F-122 Banco Notes to the Consolidated Financial Statements AS OF DECEMBER 31,
EXPECTED CREDIT
As of December 31,
F-123 Banco Notes to the Consolidated Financial Statements AS OF DECEMBER 31,
PERSONNEL SALARIES AND EXPENSES
For the years ended December 31,
F-124 Banco Notes to the Consolidated Financial Statements AS OF DECEMBER 31, 2018
ADMINISTRATIVE EXPENSES
For the years ended December 31,
Banco Notes to the Consolidated Financial Statements AS OF DECEMBER 31, 2018
DEPRECIATION, AMORTIZATION, AND IMPAIRMENT
Depreciation, amortization and impairment charges for the years ended December 31,
F-126 Banco Notes to the Consolidated Financial Statements AS OF DECEMBER 31, 2018
OTHER OPERATING INCOME AND EXPENSES
(1)In accordance with IAS 37, the Bank recorded contingencies provisions, which
(2)
b) Other operating expenses are detailed as follows:
(1) New Fraud Law became effective on 2020. (2) Annual Land Tax surcharge approved in the Tax Modernization Law of February 24, 2020. F-127 Banco Notes to the Consolidated Financial Statements AS OF DECEMBER 31, 2018
TRANSACTIONS WITH RELATED PARTIES
In addition to affiliates and associated entities, the Bank’s “related parties” include its “key personnel” from the executive staff (members of the Bank’s Board of Directors and Managers of Banco
The Bank also considers the companies that are part of the Santander Group worldwide as related parties, given that all of them have a common parent,
Transactions between the Bank and its related parties are specified
Santander Group Companies
This category includes all the companies that are controlled by the Santander Group around the world, and hence, it also includes the companies over which the Bank exercises any degree of control (affiliates and special-purpose entities)
Associated companies
This category includes the entities over which the Bank, in accordance with section b) of Note 1 to these Financial Statements, exercises a significant degree of influence and which generally belong to the group of entities known as “business support
Key personnel
This category includes members of the Bank’s Board of Directors and managers of Banco
Other
This category encompasses the related parties that are not included in the groups identified above and which are, in general, entities over which the key personnel could exercise significant influence or
The terms for transactions with related parties are equivalent to those which prevail in transactions made under market conditions or to which the corresponding considerations in kind have been F-128 Banco Notes to the Consolidated Financial Statements AS OF DECEMBER 31, 2018
NOTE TRANSACTIONS WITH RELATED PARTIES, continued
a) Loans to related parties: Below are loans and accounts receivable as well as contingent loans that correspond to related entities:
F-129 Banco Notes to the Consolidated Financial Statements AS OF DECEMBER 31, 2018
NOTE TRANSACTIONS WITH RELATED PARTIES, continued
Loan activity to related parties during
(*) Loans with non-controlled companies (not-consolidated) amount MCh$2,286, MCh$2,059 and MCh$122,289 as of December 31, 2020, 2019 and 2018, respectively. b) Assets and liabilities with related parties
F-130 Banco Notes to the Consolidated Financial Statements AS OF DECEMBER 31, 2018
NOTE TRANSACTIONS WITH RELATED PARTIES, continued
(*) Primarily relates to derivative contracts used to financially cover exchange risk of assets and liabilities that cover positions of the Bank and its subsidiaries, F-131 Banco Notes to the Consolidated Financial Statements AS OF DECEMBER 31, 2018
NOTE TRANSACTIONS WITH RELATED PARTIES, continued
The compensation received by key management personnel, including Board members and all the executives holding manager positions shown in the “Personnel salaries and expenses” and/or “Administrative expenses” items of the Consolidated Statements of Income, corresponds to the following categories:
(*)Some of the executives that qualified for this benefit left the Group for different reasons, without complying with the requirements to receive the benefit, therefore the obligation amount decreased, which generated the reversal of
As of December 31,
F-132 Banco Notes to the Consolidated Financial Statements AS OF DECEMBER 31, 2018
PENSION PLANS
The Bank has an additional benefit available to its principal executives, consisting of a pension plan. The purpose of the pension plan is to endow the executives with funds for a better supplementary pension upon their retirement.
For this purpose, the Bank will match the voluntary contributions made by the beneficiaries for their future pensions with an equivalent contribution. The executives will be entitled to receive this benefit only when they fulfill the following conditions:
If the working relationship between the manager and the respective company ends, before s/he fulfills the abovementioned requirements, s/he will have no rights under this benefit plan.
In the event of the executive’s death or total or partial disability, s/he will be entitled to receive this benefit.
The Bank will make contributions to this benefit plan on the basis of mixed collective insurance policies whose beneficiary is the Bank. The life insurance company with whom such policies are executed is not an entity linked or related to the Bank or any other Santander Group company.
Plan Assets owned by the Bank at the end of
The amount of the defined benefit plans has been quantified by the Bank, based on the following criteria:
Calculation method:
Use of the projected unit credit method which considers each working year as generating an additional amount of rights over benefits and values each unit separately. It is calculated based primarily on fund contributions, as well as other factors such as the legal annual pension limit, seniority, age and yearly income for each unit valued individually.
Assets related to the pension fund contributed by the Bank into the Seguros Euroamérica insurance company with respect to defined benefit plans are presented as net of associated commitments.
Actuarial hypothesis assumptions:
Actuarial assumptions with respect to demographic and financial variables are non-biased and mutually compatible with each other. The most significant actuarial hypotheses considered in the calculations were:
F-133 Banco Notes to the Consolidated Financial Statements AS OF DECEMBER 31, 2018
NOTE PENSION PLANS, continued
Activity for post-employment benefits is as follows:
Year’s cash flow for post-employment benefits is as follows:
F-134 Banco Notes to the Consolidated Financial Statements AS OF DECEMBER 31,
NOTE PENSION PLANS, continued
Plan expected profit:
Plan associated expenses:
Banco Notes to the Consolidated Financial Statements AS OF DECEMBER 31,
FAIR VALUE OF FINANCIAL ASSETS AND LIABILITIES
Fair value is the price that would be received to sell an asset or paid to transfer a liability in an orderly transaction between market participants at the measurement
For financial instruments with no available market prices, fair values have been estimated by using recent transactions in analogous instruments, and in the absence thereof, the present values or other valuation techniques based on mathematical valuation models sufficiently accepted by the international financial
These techniques are significantly influenced by the assumptions used, including the discount rate, the estimates of future cash flows and prepayment
Except as detailed in the following table, management considers that the carrying amounts of financial assets and financial liabilities
Determination of fair value of financial instruments
Below is a comparison between the value at which the Bank’s financial assets and liabilities are recorded and their fair value as of December 31,
The fair value approximates the carrying amount of the following line items due to their short-term nature: cash and deposits-banks, cash items in process of collection and investments under resale or repurchase agreements.
In addition, the fair value estimates presented above do not attempt to estimate the value of the Bank’s profits generated by its business activity, nor its future activities, and accordingly, they do not represent the Bank’s value as a going concern. Below is a detail of the methods used to estimate the financial instruments’ fair value.
F-136 Banco Santander-Chile and Subsidiaries Notes to the Consolidated Financial Statements AS OF DECEMBER 31, 2020 AND 2019 AND FOR THE YEARS ENDED DECEMBER 31, 2020, 2019 AND 2018 NOTE 36 FAIR VALUE OF FINANCIAL ASSETS AND LIABILITIES, continued
The estimated fair value of these financial instruments was established using market values or estimates from an available dealer, or quoted market prices of similar financial instruments. Investments are evaluated at recorded value since they are considered as having a fair value not significantly different from their recorded value. To estimate the fair value of debt investments or representative values in these lines of businesses, we take into consideration additional variables and elements, as long as they apply, including the estimate of prepayment rates and credit risk of issuers.
Fair value of commercial, mortgage and consumer loans and credit cards
Disclosed fair value of deposits that do not bear interest and saving accounts is the amount payable at the reporting date and, therefore, equals the recorded
The fair value of these financial instruments is calculated by using a discounted cash flow analysis based on the current incremental lending rates for similar types of loans having similar maturities.
The estimated fair value of financial derivative contracts is calculated using the prices quoted on the market for financial instruments having similar characteristics.
The fair value of interest rate swaps represents the estimated amount that the Bank determines as exit price in accordance with IFRS 13.
If there are no quoted prices from the market (either direct or indirect) for any derivative instrument, the respective fair value estimates have been calculated by using models and valuation techniques such as Black-Scholes, Hull, and Monte Carlo simulations, taking into consideration the relevant inputs/outputs such as volatility of options, observable correlations between underlying assets, counterparty credit risk, implicit price volatility, the velocity with which the volatility reverts to its average value, and the straight-line relationship (correlation) between the value of a market variable and its volatility, among others.
Measurement of fair value and hierarchy
IFRS 13 - Fair Value Measurement, provides a hierarchy of reasonable values which separates the inputs and/or valuation technique assumptions used to measure the fair value of financial
F-137 Banco Santander-Chile and Subsidiaries Notes to the Consolidated Financial Statements AS OF DECEMBER 31, 2020 AND 2019 AND FOR THE YEARS ENDED DECEMBER 31, 2020, 2019 AND 2018
NOTE 36 FAIR VALUE OF FINANCIAL ASSETS AND LIABILITIES, continued
The hierarchy level within which the fair value measurement is categorized in its entirety is determined based on the lowest level of input that is significant to the fair value measurement in its entirety.
The best evidence of a financial instrument’s fair value at the initial time is the transaction price.
In cases where quoted market prices cannot be observed, Management makes its best estimate of the price that the market would set using its own internal models which in most cases use data based on observable market parameters as a significant input (Level 2) and, in very specific cases, significant inputs not observable in market data (Level 3),
Financial instruments at fair value and determined by quotations published in active markets (Level 1) include:
Instruments which cannot be 100% observable in the market are valued according to other inputs observable in the market (Level 2).
The following financial instruments are classified under Level 2:
F-138 Banco Santander-Chile and Subsidiaries Notes to the Consolidated Financial Statements AS OF DECEMBER 31, 2020 AND 2019 AND FOR THE YEARS ENDED DECEMBER 31, 2020, 2019 AND 2018 NOTE 36 FAIR VALUE OF FINANCIAL ASSETS AND LIABILITIES, continued
In limited occasions significant inputs not observable in market data are used (Level 3)
The following financial instruments are classified under Level 3:
The Bank does not believe that any change in unobservable inputs with respect to level 3 instruments would result in a significantly different fair value measurement.
The following table presents the assets and liabilities that are measured at fair value on a recurrent basis:
Banco Notes to the Consolidated Financial Statements AS OF DECEMBER 31,
NOTE FAIR VALUE OF FINANCIAL ASSETS AND LIABILITIES, continued
The following table presents assets or liabilities which are not measured at fair value in the statements of financial position but for which the fair value is disclosed:
The fair values of
The methods and assumptions to estimate the fair value are defined below:
The valuation techniques used to estimate each level are defined in Note
There were no
The table below shows the effect, at December 31,
F-140 Banco Santander-Chile and Subsidiaries Notes to the Consolidated Financial Statements AS OF DECEMBER 31, 2020 AND 2019 AND FOR THE YEARS ENDED DECEMBER 31, 2020, 2019 AND 2018
NOTE 36 FAIR VALUE OF FINANCIAL ASSETS AND LIABILITIES, continued
The following table presents the Bank’s activity for assets and liabilities measured at fair value on a recurrent basis using unobserved significant inputs (Level 3) as of December 31,
The realized and unrealized profits (losses) included in comprehensive income for
F-141 Banco Santander-Chile and Subsidiaries Notes to the Consolidated Financial Statements AS OF DECEMBER 31, 2020 AND 2019 AND FOR THE YEARS ENDED DECEMBER 31, 2020, 2019 AND 2018 NOTE 36 FAIR VALUE OF FINANCIAL ASSETS AND LIABILITIES, continued The potential effect as of December 31,
The following tables show the financial instruments subject to compensation in accordance with IAS 32, for
As of December 31, 2020
The Bank, in order to reduce its credit exposure in its financial derivative operations, has entered into collateral contracts with its counterparties, in which it establishes the terms and conditions under which they
F-142 Banco Notes to the Consolidated Financial Statements AS OF DECEMBER 31,
RISK MANAGEMENT
Introduction and general description
The Bank, due to its activities with financial instruments is exposed to several types of risks. The main risks related to financial instruments that apply to the Bank are as follows:
This note includes information on the Bank’s exposure to these risks and on its objectives, policies, and processes involved in their measurement and management.
Risk management structure
The Board is responsible for the establishment and monitoring of the Bank’s risk management structure, for which purpose it has an on-line corporate governance system which incorporates international recommendations and trends, adapted to Chilean regulatory conditions and given it the ability to apply the most advanced practices in the markets in which the Bank operates.
The effectiveness with which we are able to manage the balance between risk and reward is a significant factor in our ability to generate long term, stable earnings
A. Integral Risk Committee
The Integral Risk Committee of the Board is responsible for reviewing and monitoring all risks that may affect us,
F-143 Banco Santander-Chile and Subsidiaries Notes to the Consolidated Financial Statements AS OF DECEMBER 31, 2020 AND 2019 AND FOR THE YEARS ENDED DECEMBER 31, 2020, 2019 AND 2018 NOTE 37 RISK MANAGEMENT, continued
This Committee includes
B. Audit Committee
The Audit Committee (Comité de Directores y Auditoría) is comprised of three members of the Board of Directors. The Chief Executive Officer, General Counsel, General Auditor and other persons from the Bank can be invited to the meetings if necessary and are present on specific matters. This Committee’s primary responsibility is to support the Board of Directors in the continuous improvement of our system of internal controls, which includes reviewing the work of both the external auditors and the Internal Audit Department. The committee is also responsible for analyzing observations made by regulatory entities of the Chilean financial system about us and for recommending measures to be taken by our management in response.
C. Asset and Liability Committee
The ALCO includes the
The main functions of the ALCO are:
D. Market Committee
The Market Committee includes the
The Market Committee is responsible for:
F-144 Banco Santander-Chile and Subsidiaries Notes to the Consolidated Financial Statements AS OF DECEMBER 31, 2020 AND 2019 AND FOR THE YEARS ENDED DECEMBER 31, 2020, 2019 AND 2018 NOTE 37 RISK MANAGEMENT, continued
E. Risk Department
All issues regarding risk in the Bank are the responsibility of the Bank’s Risk Department. The Risk Department reports to the CEO but has full independence, and no risk decisions can be made without its approval. Market risk Market risk arises as a consequence of the market activity, by means of financial instruments whose value can be affected by market variations, reflected in different assets and financial risk factors. The risk can be diminished by means of hedging through other products (assets/liabilities or derivative instruments) or terminating the open transaction/position. The objective of market risk management is to manage and control market risk exposure within acceptable parameters. There are four major risk factors that affect the market prices: type of interest, type of exchange, price, and inflation. In addition and for certain positions, it is necessary to consider other risks as well, such as spread risk, base risk, commodity risk, volatility or correlation risk. Market risk management The Bank’s internal management measures market risk based mainly on the procedures and standards of Banco Santander
The trading portfolio is comprised chiefly of investments valued at fair market value and The main decisions that relate to market risk for the Bank and the limits regarding market risk are made in the Asset and Liability Committee and the Market Committee. The measurement and oversight of market risks is performed by the Market Risk Department. The Bank’s governance rules have established the existence of two high-level committees that, among other things, function to monitor and control market risks: the Asset and Liability Committee and the Market Committee. The Market Risk department’s functions in connection with trading portfolio include the following:
The Market Risk department’s functions in connection with financial management portfolios include the following:
F-145 Banco Santander-Chile and Subsidiaries Notes to the Consolidated Financial Statements AS OF DECEMBER 31,
NOTE RISK MANAGEMENT, continued Market risk – management of trading portfolio The Bank applies VaR methodologies to measure the market risk of its trading portfolio. The Bank has a consolidated commercial position comprised of fixed–income investments and foreign currency trading. This portfolio is comprised mostly of Central Bank of Chile bonds, mortgage bonds, locally issued, low–risk corporate bonds and foreign currencies, mainly U.S. dollars. At the end of each year, the trading portfolio included no stock portfolio investments. For the Bank, the VaR estimate is made under the historical simulation methodology, which consists of observing the behavior of the profits and losses that would have occurred in the current portfolio if the market conditions for a given historical period had been in force, in order to infer the maximum loss on the basis of that information, with a given degree of confidence. The methodology has the advantage of precisely reflecting the historical distribution of the market variables and not requiring any assumptions regarding the distribution of specific probabilities. All the VaR measures are intended to determine the distribution function for a change in the value of a given portfolio, and once that distribution is known, to calculate the percentile related to the necessary degree of confidence, which will be equal to the value at risk by virtue of those parameters. As calculated by the Bank, the VaR is an estimate of the maximum expected loss of market value for a given portfolio over a 1–day horizon, with a 99.00% confidence level. It is the maximum 1–day loss that the Bank could expect to experience in a given portfolio, with a 99.00% confidence level. In other words, it is the loss that the Bank would expect to experience only 1.0% of the time. The VaR provides a single estimate of market risk which is not comparable from one market risk to another. Returns are calculated through the use of a 2–year time window or at least 520 data points obtained since the last reference date for calculation of the VaR going backward in time. We do not calculate three separate VaRs. We calculate a single VaR for the entire trading portfolio, which in addition is segregated by risk type. The VaR software performs a historical simulation and calculates a Profit and Loss Statement (P&L) for 520 data points (days) for each risk factor (fixed income, foreign currency and variable income.) The P&L of each risk factor is added together and a consolidated VaR is calculated with 520 points or days of data. At the same time a VaR is calculated for each risk factor based on the individual P&L calculated for each individual risk factor. Furthermore, a weighted VaR is calculated in the manner described above, but which gives a greater weighting to the 30 most recent data points. The larger of the two VaRs is the one that is reported. In 2020, 2019 and 2018, we used the same VaR model and there has been no change in methodology or assumptions for subsequent periods. The Bank uses the VaR estimates to provide a warning when the statistically estimated incurred losses in its trading portfolio would exceed prudent levels, and hence, there are certain predetermined limits. Limitations of the VaR model When applying a calculation methodology, no assumptions are made regarding the probability distribution of the changes in the risk factors; the historically observed changes are used for the risk factors on which each position in the portfolio will be valued. It is necessary to define a valuation function fj(xi) for each instrument, preferably the same one used to calculate the market value and income of the daily position, This valuation function will be applied in each scenario to generate simulated prices for all the instruments in each scenario. In addition, the VaR methodology should be interpreted taking into consideration the following limitations:
F-146 Banco Santander-Chile and Subsidiaries Notes to the Consolidated Financial Statements AS OF DECEMBER 31, 2020 AND 2019 AND FOR THE YEARS ENDED DECEMBER 31, 2020, 2019 AND 2018 NOTE 37 RISK MANAGEMENT, continued
We perform back-testing daily and generally find that trading losses exceed our VaR estimate approximately one out of every 100 trading days. At the same time, we set a limit to the maximum VaR that we are willing to accept over our trading portfolio. Also, a maximum VaR limit was established that can be applied over the trading portfolio. The VaR as of December 31, 2020 was USD 2.62 million, below the total limit. High, low and average levels for each component for 2020 and 2019 were as follows:
Market risk - local and foreign financial management The Bank’s financial management portfolio includes most of the Bank’s non-trading assets and liabilities, including the credit/loan portfolio. For these portfolios, investment and financing decisions are strongly influenced by the Bank’s commercial strategies. The Bank uses a sensitivity analysis to measure the market risk of local and foreign currencies (not included in the trading portfolio). The Bank performs a simulation of scenarios, which will be calculated as the difference between the present value of the flows in the chosen scenario (a curve with a parallel movement of 100 bps in all its segments) and their value in the base scenario (current market). All the inflation–indexed local currency (UF) positions are adjusted by a sensitivity factor of 0.57, which represents a 57 basis point change in the rate curve for the real rates and a 100 basis point change for the nominal rates. The same scenario is performed for the net foreign currency positions and the interest rates in U.S. dollars. The Bank has also established limits in regard to the maximum loss which these interest rate movements could impose on the capital and net financial income budgeted for the year. F-147 Banco Santander-Chile and Subsidiaries Notes to the Consolidated Financial Statements AS OF DECEMBER 31, 2020 AND 2019 AND FOR THE YEARS ENDED DECEMBER 31, 2020, 2019 AND 2018 NOTE 37 RISK MANAGEMENT, continued To establish the consolidated limit, we add the foreign currency limit to the domestic currency limit and multiple by 2 the sum of the multiplication of them together both for net financial loss limit as well as for the capital and reserves loss limit, using the following formula: Consolidated limit = square root of a2 + b2 + 2ab a: domestic currency limit b: foreign currency limit Since we assume the correlation is 0; 2ab = 0, 2ab = 0 Limitations of the sensitivity models The most important assumption is using an exchange rate of 100 bp based on yield curve (57 bp for real rates). The Bank uses a 100 bp exchange since sudden changes of this magnitude are considered realistic. Santander Spain Global Risk Department has also established comparable limits by country, to be able to compare, monitor and consolidate market risk by country in a realistic and orderly way. In addition, the sensitivity simulation methodology should be interpreted taking into consideration the following limitations:
Market risk – Financial management portfolio – December 31, 2020 and 2019
F-148 Banco Santander-Chile and Subsidiaries Notes to the Consolidated Financial Statements AS OF DECEMBER 31, 2020 AND 2019 AND FOR THE YEARS ENDED DECEMBER 31, 2020, 2019 AND 2018 NOTE 37 RISK MANAGEMENT, continued IBOR – reform In December 2020, the ICB Benchmark Administration Limited (IBA) published a consultation about its intention to stop publishing LIBOR rates in currencies other than USD since December 31, 2021, and all other LIBOR in USD since June 30, 2023. The Bank is working in a “transition program” focused mainly in:
At December 31, 2020, the exposures of financial assets and liabilities impacted by the IBOR reform is presented below:
Credit risk
Credit risk is the risk that one of the parties to a financial instrument fails to meet its contractual obligations for reasons of insolvency or inability of the individuals or legal entities in question to continue as a going concern, causing a financial loss to the other party. The Bank consolidates all elements and components of credit risk exposure to manage credit risk
In Note 8, 9, 10 and Note
Credit Risk Governance
The Risk Division, our credit analysis and risk management group, is largely independent of our
The Board has delegated the duty of credit risk management to the Integral Risk Committee, as well as to the Bank’s risk departments, whose roles are summarized below:
F-149 Banco Notes to the Consolidated Financial Statements AS OF DECEMBER 31,
NOTE RISK MANAGEMENT, continued
The following diagram illustrates the governance of our credit risk division including the committees with approval power:
Role of Santander Spain’s Global Risk Department: Credit Risk
In matters regarding Credit Risk, Santander Spain’s Global Risk Department has the following role:
In preparing a credit proposal for a corporate client whose loans are approved on an individual basis, Santander-Chile’s personnel verifies such parameters as debt servicing capacity (typically including projected cash flows), the company’s financial history and projections for the economic sector in which it operates. The Risk Division is closely involved in this process and prepares the credit application for the client. All proposals contain an analysis of the client, a rating and a recommendation. Credit limits are F-150 Banco Santander-Chile and Subsidiaries Notes to the Consolidated Financial Statements AS OF DECEMBER 31, 2020 AND 2019 AND FOR THE YEARS ENDED DECEMBER 31, 2020, 2019 AND 2018 NOTE 37 RISK MANAGEMENT, continued determined not on the basis of outstanding balances of individual clients, but on the direct and indirect credit risk of entire financial groups. For example, a corporation will be evaluated together with its subsidiaries and affiliates. Credit Approval: Loans approved on a group basis The majority of loans to individuals and small and mid-sized companies are approved by the Standardized Risk Area through an automated credit scoring system. This system is decentralized, automated and based on multiple parameters, including demographic and information regarding credit behavior from external sources and the FMC. Impairment assessment (policy applicable from January 1, 2018)
In accordance with the requirements of IFRS 9 the Bank has developed a new credit risk model, applicable from January 1, 2018.
The Bank considers a financial instrument defaulted and therefore Stage 3 for ECL calculations in all cases when the borrower becomes 90 days past due on its contractual payments.
As a part of a qualitative assessment of whether a customer is in default, the Bank also considers a variety of instances that may indicate unlikeliness to pay. Such events include:
It is the Bank’s policy to consider a financial instrument as ‘cured’ and therefore re-classified out of Stage 3 when none of the default criteria have been present for at least twelve consecutive months (and 24 months for special vigilance operations). The decision whether to classify an asset as Stage 2 or Stage 1 once cured depends on the updated credit grade, at the time of the cure, and whether this indicates there has been a significant increase in credit risk compared to initial recognition.
The Bank’s Credit Risk Department operates its internal rating models. The models incorporate both qualitative and quantitative information and, in addition to information specific to the borrower
F-151 Banco Santander-Chile and Subsidiaries Notes to the Consolidated Financial Statements AS OF DECEMBER 31, 2020 AND 2019 AND FOR THE YEARS ENDED DECEMBER 31, 2020, 2019 AND 2018 NOTE 37 RISK MANAGEMENT, continued The following table shows quality assets and its related provision, based on our internal scoring policy as of December 31,
F-152 Banco Notes to the Consolidated Financial Statements AS OF DECEMBER 31,
NOTE RISK MANAGEMENT, continued
In relation to the credit quality of the investment portfolio, local regulations specify that banks are able to hold only local and foreign fixed–income securities except in certain
As of December 31,
F-153 Banco Santander-Chile and Subsidiaries Notes to the Consolidated Financial Statements AS OF DECEMBER 31, 2020 AND 2019 AND FOR THE YEARS ENDED DECEMBER 31, 2020, 2019 AND 2018 NOTE 37 RISK MANAGEMENT, continued
The exposure at default (EAD) represents the gross carrying amount of the financial instruments subject to the impairment calculation, addressing both the client’s ability to increase its exposure while approaching default and potential early repayments too.
To calculate the EAD for a Stage 1 loan, the Bank assesses the possible default events within 12 months for the calculation of the 12mECL. However, if a Stage 1 loan that is expected to default in the 12 months from the balance sheet date and is also expected to cure and subsequently default again, then all linked default events are taken into account. For Stage 2, Stage 3 the exposure at default is considered for events over the lifetime of the instruments.
The credit risk assessment is based on a
The Bank segments its retail lending products into smaller homogeneous portfolios (evaluated collective), based on key characteristics that are relevant to the estimation of future cash flows. The applied data is based on historically collected loss data and involves a wider set of transaction characteristics
Further recent data and forward-looking economic scenarios are used in order to determine the IFRS 9 LGD rate for each group of financial instruments. Under IFRS 9, LGD rates are estimated for the Stage 1, Stage 2, Stage 3 IFRS 9 segment of each asset class. The inputs for these LGD rates are estimated and, where possible, calibrated through back testing against recent recoveries. These are repeated for each economic scenario as appropriate.
The Bank continuously monitors all assets subject to ECLs. In order to determine whether an instrument or a portfolio of instruments is subject to
The Bank also applies a secondary qualitative method for triggering a significant increase in credit risk for an asset, such as moving a customer/facility to the watch list (Special vigilance). The Bank may also consider that events explained in letter a) above are a significant increase in credit risk as opposed to a default. Regardless of the change in credit grades, if contractual payments are more than 30 days past due, the credit risk is deemed to have increased significantly since initial recognition.
When estimating ECLs on a collective basis for a group of similar assets, the Bank applies the same principles for assessing whether there has been a significant increase in credit risk since initial recognition.
Quantitative criteria for SICR Stage 2: The quantitative criteria
Threshold = Lifetime PD (at reporting date) – Lifetime PD (at origination) F-154 Banco Notes to the Consolidated Financial Statements AS OF DECEMBER 31,
NOTE RISK MANAGEMENT, continued
There is also a relative threshold of 100% of all portfolios with the exception of the Corporate and Investment Banking Portfolio.
Qualitative criteria for SICR Stage 2: The qualitative criteria is based on the existence of evidence that leads to an automatic classification of financial instruments in stage 2, mainly 30 days overdue and restructured. Thresholds of SICR are calibrated based on the average ECL of exposures that are 30 days overdue or with a level of credit risk considered to be “significant”.
These thresholds are defined by the Model Committee and the Integral Risk Committee and are evaluated annually with updates made depending on impacts and definitions of the risk models associated to each portfolio.
As a result of the instability caused by the COVID-19 pandemic and according to our corporate guidelines, management has decided not to modify the thresholds for SICR defined above.
Expected credit losses are a probability-weighted estimate of credit losses over the expected life of the financial instrument. A cash shortfall is the difference between the cash flows that are due to an entity in accordance with the contract and the cash flows that the entity expects to receive. Because expected credit losses consider the amount and timing of payments, a credit loss arises even if the entity expects to be paid in full but later than when contractually due. For financial assets, a credit loss is the present value of the difference between: the contractual cash flows that are due under the contract; and the cash flows that the Bank expects to receive. For undrawn loan commitments, a credit loss is the present value of the difference between: the contractual cash flows that are due if the holder of the loan commitment draws down the loan; and the cash flows that the Bank expects to receive if the loan is drawn down. F-155 Banco Santander-Chile and Subsidiaries Notes to the Consolidated Financial Statements AS OF DECEMBER 31, 2020 AND 2019 AND FOR THE YEARS ENDED DECEMBER 31, 2020, 2019 AND 2018 NOTE 37 RISK MANAGEMENT, continued For a financial asset that is credit-impaired at the reporting date, but that is not a purchased or originated credit-impaired financial asset, an entity shall measure the expected credit losses as the difference between the asset’s gross carrying amount and the present value of estimated future cash flows discounted at the financial asset’s original effective interest rate. Any adjustment is recognized in profit or loss as an impairment gain or loss. In accordance with our internal procedures, the Bank calculates allowance for expected credit losses under de "Cash flow discounted Methodology" when the financial asset is classified in stage 3, with a PD equal to 100% and is evaluated as individually significant. The following table set up the allowance and exposure at default (EAD) of the loans that meet the conditions:
The measurement of ECLs required to be based on reasonable and supportable information that is available to an entity without undue cost or effort. The Bank has developed estimates based on the best available information about past events, current conditions and forecasts of economic conditions. Indeed, in April, the Bank completed a calibration of parameters, resulting in an additional allowance for MCh$2,066. Additionally, with current COVID-19 infection rates having increased and continued high levels of uncertainty in the macro-economic outlook and to address a potential lag in defaults the Bank’s management have determined to record overlay or post-model adjustments for an amount of MCh$59,000, wherein MCh$29,000 addressed macroeconomics’ variables and MCh$30,000 associated to expected behavior of Fogape loans.
The Bank calculates ECLs either on a collective or an individual basis.
The evaluates on individual basis commercial loans that are greater than Ch$400 million (US$240,000), while smaller commercial loans, mortgage loans and consumer loans are grouped into homogeneous portfolios, based on a combination of internal and external characteristics.
When a loan measured at
If the modification
F-156 Banco Notes to the Consolidated Financial Statements AS OF DECEMBER 31,
NOTE RISK MANAGEMENT, continued
The Bank has conducted an exhaustive analysis of the measures implemented as a result of COVID-19, under the perspective of modified assets. The payment holiday program granted to our consumer loan portfolio were 3-month grace periods, modified terms and installments, and allowed modified interest rate, to the current market lower rate, and was considered a substantial modification of the original contractual conditions. Therefore, these consumer loans were accounted for as an end of the original financial loan and the recognition of a new financial asset. In line with our internal guide, these modifications are classified as modifications for commercial reasons, because they are not attributable to the financial difficulty of the debtor, and a new loan operation has been originated under current market conditions.
For the mortgage loan portfolio, original contractual conditions were not modified, instead, the clients signed an addendum for the postponed installments, and a complementary operation was generated, with the mortgage guarantee covering both operations. Neither the monthly installments nor the rates were modified. This measure was granted only to clients with less than 30 days past due, and we have observed, once the postponed periods have ended, 98% of our clients are meeting their obligations in a timely manner. In line with our internal guide, we have concluded that the modifications granted to customers with no past due days were classified as modifications for commercial reasons, meanwhile clients with any past due or that have had some restructuring (marked special risk), were classified as modifications for the financial difficulty of the debtor, and the Bank has calculated the difference between the gross carrying amount and the present value of the modified loans discounted at the original effective interest rate. The amount was not material to the Bank.
As of December 31, 2020, , the support measures are classified as Fogape loans or payment holiday granted by the Bank:
The payment holiday mainly granted mortgage loan agreements, and postponed monthly installment that comprises principal, interest, inflation and related insurances. The Bank has been monitoring closely the expired payment holidays, and as of December 31,2020 only MCh$121,850 are defaulted.
The following table
The annual growth forecasts for the most relevant macroeconomic variables for each of our scenarios are as follows:
F-157 Banco Santander-Chile and Subsidiaries Notes to the Consolidated Financial Statements AS OF DECEMBER 31, 2020 AND 2019 AND FOR THE YEARS ENDED DECEMBER 31, 2020, 2019 AND 2018 NOTE 37 RISK MANAGEMENT, continued
The highest probability of occurrence is associated to the base scenario, while the extreme scenarios have a lower probability than the more moderate scenarios.
The methodology used for the generation of the local scenarios is based on the Methodology Framework of the Corporate Research Service and is applied to the loan portfolio with the exception of loans from the Corporate and Investment Banking segment which uses global scenarios as defined by the Santander Group. The probabilities for the scenarios must total 100% and be symmetrical.
The ECL allowance sensibility to future
Under the current uncertainty generated by COVID-19 over the macro-economical scenarios, the Bank’s management has decided not to modify macroeconomic variables for each of our scenarios, but rather has used the option to establishing management post-model adjustment or overlays. See letter f) above. F-158 Banco Notes to the Consolidated Financial Statements AS OF DECEMBER 31,
NOTE RISK MANAGEMENT, continued
The following table
Banco Santander controls the credit risk through the use of collateral in its operations. Each business unit is responsible for credit risk management and formalizes the use of collateral in its lending policies. Guidelines are in place covering the acceptability and valuation of each type of collateral.
Banco Santander uses guarantees in order to increase their resilience in the subject to credit risk
Credit limits are continually monitored and changed in customer behavior function. Thus, the potential loss values represent a fraction of the amount available.
Collateral refers to the assets pledged by the customer or a third party to secure the performance of an obligation.
F-159 Banco Santander-Chile and Subsidiaries Notes to the Consolidated Financial Statements AS OF DECEMBER 31, 2020 AND 2019 AND FOR THE YEARS ENDED DECEMBER 31, 2020, 2019 AND 2018 NOTE 37 RISK MANAGEMENT, continued The following table show the maximum exposure to credit risk by class of financial asset, associated collateral and the net exposure to credit risk:
(*)Includes Loans and account receivable at FVOCI
One very important example of financial collateral is the collateral agreement. Collateral agreements comprise a set of highly liquid instruments with a certain economic value that are deposited or transferred by a counterparty in favor of another party in order to guarantee or reduce any counterparty credit risk that might arise from the portfolios of derivative transactions between the parties in which there is exposure to risk.
Collateral agreements vary in nature but, whichever the specific form of
Transactions subject to a collateral agreement are assessed periodically (normally on a daily basis). The agreed-upon parameters defined in the agreement are applied to the net balance arising from these assessments, from which the collateral amount (normally cash or securities) payable to or receivable from the counterparty is obtained.
For real estate collateral periodic re-appraisal processes are in place, based on the actual market values for the different types of real estate, which meet all the requirements established by the regulator.
Specifically, mortgage loans are secured by a real property mortgage, and threshold mitigate counterparty credit risk of derivative
Personal guarantees and credit derivatives
Personal guarantees are guarantees that make a third party liable for another party’s obligations to the Bank. They include, for example, security deposits and standby letters of credit. Only guarantees provided by third parties that meet the minimum requirements established by the supervisor can be
Credit derivatives are financial instruments whose main purpose is to hedge credit risk by buying protection from a third party, whereby the Bank transfers the risk of the issuer of the underlying instrument. Credit derivatives are OTC instruments, i.e. they are not traded in organized markets.
Credit derivative hedges, mainly credit default swaps, are entered into with leading financial institutions.
Assets Received in Lieu of Payment
Assets received or awarded in lieu of payment of loans and accounts receivable from clients are
F-160 Banco Santander-Chile and Subsidiaries Notes to the Consolidated Financial Statements AS OF DECEMBER 31, 2020 AND 2019 AND FOR THE YEARS ENDED DECEMBER 31, 2020, 2019 AND 2018 NOTE 37 RISK MANAGEMENT, continued At December 31,
At December 31,
Financial assets and off-balance sheet commitments For financial assets recognized in the Consolidated Statements of Financial Position, maximum credit risk exposure equals their carrying value. Below is the distribution by financial asset and off-balance sheet commitments of the Bank’s maximum exposure to credit risk as of December 31, 2020 and 2019, without deduction of collateral, security interests or credit improvements received:
Foreign derivative contracts As of December 31, 2020, the Bank’s foreign exposure -including counterparty risk in the derivative instruments’ portfolio- was USD 2,639 million or 3,4% of assets. In the table below, exposure to derivative instruments is calculated by using the equivalent credit risk; which equals the replacement carrying amount plus the maximum potential value, considering the cash collateral that minimizes exposure. Below, there are additional details regarding our exposure for those countries classified above 1 and represents our majority of exposure to categories other than 1, Below we detail as of December 31, 2020, considering fair value of derivative instruments.
F-161 Banco Santander-Chile and Subsidiaries Notes to the Consolidated Financial Statements AS OF DECEMBER 31, 2020 AND 2019 AND FOR THE YEARS ENDED DECEMBER 31, 2020, 2019 AND 2018 NOTE 37 RISK MANAGEMENT, continued Our exposure to the group is as follows:
(*) We have included our exposure to Santander’s branches in New York and Hong Kong as exposure to Spain. The total amount of this exposure to derivative instruments must be compensated daily with collateral and, therefore, there is no credit exposure. As of December 31, 2020, we had no applicable sovereign exposure, no unfunded exposure, no credit default protection and no current developments. Security interests and credit improvements The maximum exposure to credit risk is reduced in some cases by security interests, credit improvements, and other actions which mitigate the Bank’s exposure. Based on the foregoing, the creation of security interests are a necessary but not a sufficient condition for granting a loan; accordingly, the Bank’s acceptance of risks requires the verification of other variables and parameters, such as the ability to pay or generate funds in order to mitigate the risk being taken on. The procedures used for the valuation of security interests utilize the prevailing market practices, which provide for the use of appraisals for mortgage securities, market prices for stock securities, fair value of the participating interest for investment funds, etc. All security interests received must be instrumented properly and registered on the relevant register, as well as have the approval of legal divisions of the Bank. The risk management model includes assessing the existence of adequate and sufficient guarantees that allow recovering the credit when the debtor’s circumstances prevent them from fulfilling their obligations. The Bank has classification tools that allow it to group the credit quality of transactions or customers. Additionally, the Bank has historical databases that keep this internally generated information to study how this probability varies. Classification tools vary according to the analyzed customer (commercial, consumer, SMEs, etc.). Below is the detail of security interests, collateral, or credit improvements provided to the Bank as of December 31, 2020 and 2019:
F-162 Banco Santander-Chile and Subsidiaries Notes to the Consolidated Financial Statements AS OF DECEMBER 31, 2020 AND 2019 AND FOR THE YEARS ENDED DECEMBER 31, 2020, 2019 AND 2018 NOTE 37 RISK MANAGEMENT, continued Credit risk mitigation techniques The Bank applies various methods of reducing credit risk, depending on the type of customer and product. As we shall see, some of these methods are specific to a particular type of transaction (i.e., real estate guarantees) while others apply to groups of transactions (i.e., netting and collateral arrangements). Liquidity risk
Liquidity risk is the risk that the Bank may have difficulty meeting the obligations associated with its financial obligations.
Liquidity risk management
The Bank is exposed on a daily basis to requirements for cash funds from various banking activities, such as wires from checking accounts, fixed-term deposit payments, guarantee payments, disbursements on derivatives transactions, etc. As typical in the banking industry, the Bank does not hold cash funds to cover the balance of all the positions, as experience shows that only a minimum level of these funds will be withdrawn, which can be accurately predicted with a high degree of certainty.
The Bank’s approach to liquidity management is to ensure-- whenever possible--to have enough liquidity on hand to fulfill its obligations at maturity, in both normal and stressed conditions, without entering into unacceptable debts or risking the Bank’s reputation. The Board establishes limits on the minimal part of available funds close to maturity to fulfill
These limits affect the mismatches of future flows of income and expenditures of the Bank on an individual basis. They are:
The
The Bank monitors its liquidity position
The Bank relies on F-163 Banco Notes to the Consolidated Financial Statements AS OF DECEMBER 31,
NOTE RISK MANAGEMENT, continued
Liquidity risk management seeks to ensure that, even under adverse conditions, we have access to the funds necessary to cover client needs, maturing liabilities and capital requirements. Liquidity risk arises in the general funding for our financing, trading and investment activities. It includes the risk of unexpected increases in the cost of funding the portfolio of assets at appropriate maturities and rates, the risk of being unable to liquidate a position in a timely manner at a reasonable price and the risk that we will be required to repay liabilities earlier than anticipated.
The following table sets forth the balance of our liquidity portfolio managed by our Financial Management Division in the manner in which it is presented to the Asset and Liability Committee (ALCO) and the Board. The ALCO
Central Bank of Chile
In response to the
Exposure to liquidity risk
A similar,
The following table displays the actual derived percentages as calculated per above:
F-164 Banco Santander-Chile and Subsidiaries Notes to the Consolidated Financial Statements AS OF DECEMBER 31, 2020 AND 2019 AND FOR THE YEARS ENDED DECEMBER 31, 2020, 2019 AND 2018 NOTE 37 RISK MANAGEMENT, continued
Below, is the breakdown by maturity, of the liability balances of the
As of December 31,
F-165 Banco Santander-Chile and
Notes to the Consolidated Financial Statements AS OF DECEMBER 31,
NOTE RISK MANAGEMENT, continued
The Bank
Operational risk is inherent to all products, activities, processes and systems and is generated in all business and support areas. For this reason, all employees are responsible for managing and controlling the operational risks generated in their sphere of action. The Bank’s goal in terms of operational risk management and control is focused on identifying, evaluating and mitigating sources of risk, regardless of whether they have materialized or not. The analysis of operational risk exposure contributes to the establishment of risk management priorities Operational risk governance The risk management program contemplates that all relevant risk issues must be reported to the Board of Directors, the Integral Risk Committee and the Non-Financial Risk Committee. Risk identification, measurement and assessment model A series of quantitative and qualitative techniques and tools have been defined by the Bank to identify, measure and assess operational risk. The quantitative analysis of this risk assessment is carried out mainly with tools that record and quantify the Operational risk management To accomplish our operational risk objectives, we have Our methodology consists of the evaluation of the risks and controls of a business from a broad perspective and includes a plan to monitor the effectiveness of such controls and the identification of eventual weaknesses. The main objectives of the Bank and its subsidiaries in terms of operational risk management are the
Banco Santander-Chile and
Notes to the Consolidated Financial Statements AS OF DECEMBER 31,
NOTE RISK MANAGEMENT, continued
Identify, evaluate, inform, manage and monitor the operational risk in connection with activities, products, and processes carried out or commercialized by the Bank and its subsidiaries;
Build a strong culture of operational risk management and internal controls, with clearly defined and adequately segregated responsibilities between business and support functions, whether these are internally-developed or outsourced to Generate effective internal reports in connection with issues related to operational risk management, with a Control the design and application of effective plans to deal with contingencies that ensure business continuity and losses control. Cyber-security and data security plans The Bank continuously monitors cyber-security risks and has implemented preventative measures to be prepared for
The Bank has a Cybersecurity Framework which defines the governance and policies on preventing and confronting cybercrime. The Chief of Cybersecurity or CISO (Chief Information Security Officer) has been defined as the officer responsible for cybersecurity, a function performed by the Manager of Technology and Operational Risk. Embedded in the Bank’s Technology and Operations division is the Cyber and Technology Risk Department, which is the front line of defense against cyber-security threats and data security. In addition, the
Finally, the intelligence and analysis function has also been reinforced by contracting a threat-monitoring service, and progress has been made in the incident registration, notification and escalation mechanisms for internal reporting and reporting to supervisors. In addition, observation and analytical assessment of the events in the sector and in other industries enable us to update and adapt our models for emerging threats. During 2020, the Bank Operational risk management during the Overall, the
Banco Santander-Chile and
Notes to the Consolidated Financial Statements AS OF DECEMBER 31,
NOTE RISK MANAGEMENT, continued
Capital risk
The
The objectives in this connection include most notably: To meet the internal capital and capital adequacy targets To meet the regulatory requirements To align the Bank’s strategic plan with the capital expectations of external agents (rating agencies, shareholders and investors, customers, supervisors, To support the growth of the businesses and any strategic opportunities that may arise
The
Capital management seeks to optimize value creation at the Bank an at its different business segment. The Bank continuously evaluates it risk-return ratios through its basic capital, effective net equity, economic capital and return on equity. With regard to capital adequacy, the Banks conducts its internal process based on the
Capital is managed according to the risk environment, the economic performance of Chile and the business Minimum Capital
Under the General Banking Law, a bank is required to have a minimum of UF800,000 (approximately Ch$ F-168 Banco Notes to the Consolidated Financial Statements AS OF DECEMBER 31,
NOTE RISK MANAGEMENT, continued
Capital adequacy requirement
Chilean banks are required by the General Banking Law to maintain regulatory capital of at least 8% of risk-weighted assets, net of required loan loss allowance and deductions, and paid-in capital and reserves (“basic capital”) of at least 3% of total assets, net of required loan loss
Regulatory capital is defined as the aggregate of:
The levels of basic capital and effective net equity at the close of each period are as follows:
Basel III Implementation in Chile
The new General Banking Law (updated through Law 21.130) defines general guidelines to establish a capital adequacy system in line with the international standards of Basel III, giving the FMC the power to dictate the capital framework in a prudential way through regulations. In particular, the FMC has been empowered, with the prior favorable agreement of the Central Bank of Chile, to define through regulation, the new methodologies for calculating credit, market and operational risk weighted assets; the condition for hybrid instruments AT1, and the determination and capital charges for banks of local systemic importance. It also introduced the conservation and counter-cyclical buffers and expanded the FMC's powers to make prudential discounts to regulatory capital and additional requirements, including higher capital, from banks that show deficiencies in the supervisory evaluation process (Pillar 2). According to the above, in December 2020 the FMC has completed the process of issuing the necessary regulation for the implementation of capital framework of Basel III. However, in the current context of COVID-19 pandemic, the FMC in coordination with the Central Bank of Chile and in line with the measures adopted by international regulators has decided to postpone the implementation of the APR calculation for one year (until December 2021). Additionally, it has disposed to advance a capital mitigation mechanism to facilitate the development of the debt agreement market (Credit Risk
The Bank F-169 Banco Santander-Chile and
Notes to the Consolidated Financial Statements AS OF DECEMBER 31,
NON CURRENT ASSETS HELD FOR SALE Banco Santander has decided to implement its own acquiring network, and therefore the Bank is in process of disposing of the investment in those companies. Accordingly, the Bank management is engaged in a search plan for buyers. In accordance with the requirements of IFRS 5, the Bank has presented as non-current assets classified as held for sale those investments, isolating them from the investments in associates, in the same way it has presented the income associated with such investments as non-current results. In accordance with facts and circumstances arising from the social unrest in Chile and the global pandemic due to COVID-19 (situations beyond the Bank's control), the process of selling its share participation has taken more than one year. If, however, the Bank continues committed to its selling plan and its acquiring network development plan, as evidenced by the recent creation of a payment card operating company and the active search for potential buyers. As of December 31, 2020, the Bank has sold its participation in Nexus. The following investments in associates were classified to Other assets as assets held for sale:
F-170 Banco Santander-Chile and Subsidiaries Notes to the Consolidated Financial Statements AS OF DECEMBER 31, 2020 AND 2019 AND FOR THE YEARS ENDED DECEMBER 31, 2020, 2019 AND 2018 SUBSEQUENT EVENTS
On January
On January
F-171
F-172
| |||||||||||||||||||||||||||||||||||||||||||||||||||||||||||||||||||||||||||||||||||||||||||||||||||||||||||||||||||||||||||||||||||||||||||||||||||||||||||||||||||||||||||||||||||||||||||||||||||||||||||||||||||||||||||||||||||||||||||||||||||||||||||||||||||||||||||||||||||||||||||||||||||||||||||||||||||||||||||||||||||||||||||||||||||||||||||||||||||||||||||||||||||||||||||||||||||||||||||||||||||||||||||||||||||||||||||||||||||||||||||||||||||||||||||||||||||||||||||||||||||||||||||||||||||||||||||||||||||||||||||||||||||||||||||||||||||||||||||||||||||||||||||||||||||||||||||||||||||||||||||||||||||||||||||||||||||||||||||||||||||||||||||||||||||||||||||||||||||||||||||||||||||||||||||||||||||||||||||||||||||||||||||||||||||||||||||||||||||||||||||||||||||||||||||||||||||||||||||||||||||||||||||||||||||||||||||||||||||||||||||||||||||||||||||||||||||||||||||||||||||||||||||||||||||||||||||||||||||||||||||||||||||||||||||||||||||||||||||||||||||||||||||||||||||||||||||||||||||||||