0000313807ifrs-full:PresentValueOfDefinedBenefitObligationMembercountry:US2019-12-31
UNITED STATES
SECURITIES AND EXCHANGE COMMISSION
Washington, D.C. 20549
FORM 20-F
(Mark One)
|
| | | | |
¨☐ | REGISTRATION STATEMENT PURSUANT TO SECTION 12(b) or (g) OF THE SECURITIES EXCHANGE ACT OF 1934 |
OR
|
| | | | |
x☒ | ANNUAL REPORT PURSUANT TO SECTION 13 OR 15(d) OF THE SECURITIES EXCHANGE ACT OF 1934 |
For the fiscal year ended 31 December 20192020
OR
|
| | | | |
¨☐
| TRANSITION REPORT PURSUANT TO SECTION 13 OR 15(d) OF THE SECURITIES EXCHANGE ACT OF 1934 |
OR
|
| | | | |
¨☐
| SHELL COMPANY REPORT PURSUANT TO SECTION 13 OR 15(d) OF THE SECURITIES EXCHANGE ACT OF 1934 |
Commission file number: 1-62621-06262
BP p.l.c.
(Exact name of Registrant as specified in its charter)
England and Wales
(Jurisdiction of incorporation or organization)
1 St James’s Square, London SW1Y 4PD
United Kingdom
(Address of principal executive offices)
Dr Brian GilvaryMurray Auchincloss
BP p.l.c.
1 St James’s Square, London SW1Y 4PD
United Kingdom
Tel +44 (0) 20 7496 53114000
Fax +44 (0) 20 7496 45734630
(Name, Telephone, E-mail and/or Facsimile number and Address of Company Contact Person)
Securities registered or to be registered pursuant to Section 12(b) of the Act
|
| | | | | | | | | | |
| | |
| Title of each class | Trading Symbol(s) | Name of each exchange on which registered | |
| American Depositary Shares | BP | New York Stock Exchange | |
| Ordinary Shares of 25c each | | New York Stock Exchange* |
Floating Rate Guaranteed Notes due 2020 | BP/20D | New York Stock Exchange | * |
| Floating Rate Guaranteed Notes due 2021 | BP/21D | New York Stock Exchange | |
| Floating Rate Guaranteed Notes due 2022 | BP/22D and
BP/22H
| New York Stock Exchange | |
4.500% Guaranteed Notes due 2020 | BP/20 and
BP/20C
| New York Stock Exchange |
| 4.742% Guaranteed Notes due 2021 | BP/21A and
BP/21F
| New York Stock Exchange | |
| 3.561% Guaranteed Notes due 2021 | BP/21B | New York Stock Exchange | |
| 2.112% Guaranteed Notes due 2021 | BP/21C and
BP/21E
| New York Stock Exchange | |
| 2.500% Guaranteed Notes due 2022 | BP/22B | New York Stock Exchange | |
| 2.520% Guaranteed Notes due 2022 | BP/22E and BP/22F | New York Stock Exchange | |
| 3.245% Guaranteed Notes due 2022 | BP/22A and BP/22G | New York Stock Exchange | |
| 3.062% Guaranteed Notes due 2022 | BP/22C | New York Stock Exchange | |
| 2.750% Guaranteed Notes due 2023 | BP/23 and
BP/23D
| New York Stock Exchange | |
| 2.937% Guaranteed Notes due 2023 | BP/23E | New York Stock Exchange | |
| 3.216% Guaranteed Notes due 2023 | BP/23B and
BP/23C
| New York Stock Exchange | |
| 3.994% Guaranteed Notes due 2023 | BP/23A | New York Stock Exchange | |
| 3.535% Guaranteed Notes due 2024 | BP/24A | New York Stock Exchange | |
| 3.814% Guaranteed Notes due 2024 | BP/24 | New York Stock Exchange | |
| 3.224% Guaranteed Notes due 2024 | BP/24B and
BP/24D
| New York Stock Exchange | |
| 3.790% Guaranteed Notes due 2024 | BP/24C | New York Stock Exchange | |
| 3.194% Guaranteed Notes due 2025 | BP/25B | New York Stock Exchange | |
| 3.506% Guaranteed Notes due 2025 | BP/25 | New York Stock Exchange | |
| 3.796% Guaranteed Notes due 2025 | BP/25A | New York Stock Exchange | |
| 3.119% Guaranteed Notes due 2026 | BP/26 and
BP/26A
| New York Stock Exchange | |
| 3.410% Guaranteed Notes due 2026 | BP/26C | New York Stock Exchange | |
| 3.017% Guaranteed Notes due 2027 | BP/27 and
BP/27D
| New York Stock Exchange | |
| 3.279% Guaranteed Notes due 2027 | BP/27B | New York Stock Exchange | |
| 3.543% Guaranteed Notes due 2027 | BP/27E | New York Stock Exchange | |
| 3.588% Guaranteed Notes due 2027 | BP/27A and
BP/27C
| New York Stock Exchange | |
| 3.723% Guaranteed Notes due 2028 | BP/28 | New York Stock Exchange | |
| 3.937% Guaranteed Notes due 2028 | BP/28A | New York Stock Exchange | |
| 4.234% Guaranteed Notes due 2028 | BP/28B | New York Stock Exchange | |
| 1.749% Guaranteed Notes due 2030 | BP/30A | New York Stock Exchange | |
| 3.633% Guaranteed Notes due 2030 | BP/30 | New York Stock Exchange | |
| 3.067% Guaranteed Notes due 2050 | BP/50 | New York Stock Exchange | |
| 3.000% Guaranteed Notes due 2050 | BP/50A | New York Stock Exchange | |
| 2.772% Guaranteed Notes due 2050 | BP/50B | New York Stock Exchange | |
| 2.939% Guaranteed Notes due 2051 | BP/51 | New York Stock Exchange | |
| 4.375% Perpetual Subordinated Non-Call 5.25 Fixed Rate Reset Notes | BP/P1 | New York Stock Exchange | |
| 4.875% Perpetual Subordinated Non-Call 10 Fixed Rate Reset Notes | BP/P2 | New York Stock Exchange | |
|
| | | | |
| * | Not for trading, but only in connection with the registration of American Depositary Shares, pursuant to the requirements of the Securities and Exchange Commission |
Securities registered or to be registered pursuant to Section 12(g) of the Act.
None
Securities for which there is a reporting obligation pursuant to Section 15(d) of the Act.
None
Indicate the number of outstanding shares of each of the issuer’s classes of capital or common stock as of the close of the period covered by the annual report. |
| | | | |
| |
| Ordinary Shares of 25c each | 21,535,839,81421,415,782,350 |
|
| Cumulative First Preference Shares of £1 each | 7,232,838 |
|
| Cumulative Second Preference Shares of £1 each | 5,473,414 |
|
Indicate by check mark if the registrant is a well-known seasoned issuer, as defined in Rule 405 of the Securities Act. Yes x☒ No ¨☐
If this report is an annual or transition report, indicate by check mark if the registrant is not required to file reports pursuant to Section 13 or 15(d) of the Securities Exchange Act of 1934. Yes ¨☐ No x☒
Note—Checking the box above will not relieve any registrant required to file reports pursuant to Section 13 or 15(d) of the Securities Exchange Act of 1934 from their obligations under those Sections.
Indicate by check mark whether the Registrant (1) has filed all reports required to be filed by Section 13 or 15(d) of the Securities Exchange Act of 1934 during the preceding 12 months (or for such shorter period that the Registrant was required to file such reports), and (2) has been subject to such filing requirements for the past 90 days. Yes x☒ No ¨☐
Indicate by check mark whether the registrant has submitted electronically and posted on its corporate website, if any, every Interactive Data File required to be submitted and posted pursuant to Rule 405 of Regulation S-T (§ 232.405 of this chapter) during the preceding 12 months (or for such shorter period that the registrant was required to submit and post such files). Yes x☒ No ¨☐
Indicate by check mark whether the registrant is a large accelerated filer, an accelerated filer, a non-accelerated filer, or an emerging growth company. See definition of “large accelerated filer,” “accelerated filer,” and “emerging growth company” in Rule 12b-2 of the Exchange Act. (Check one):
Large accelerated filer x☒ Accelerated filer ¨☐ Non-accelerated filer ¨☐ Emerging growth company ¨☐
If an emerging growth company that prepares its financial statements in accordance with U.S. GAAP, indicate by check mark if the registrant has elected not to use the extended transition period for complying with any new or revised financial accounting standards† provided pursuant to Section 13(a) of the Exchange Act. ¨☐
† The term “new or revised financial accounting standard” refers to any update issued by the Financial Accounting Standards Board to its Accounting Standards Codification after April 5, 2012.
Indicate by check mark whether the registrant has filed a report on and attestation to its management’s assessment of the effectiveness of its internal control over financial reporting under Section 404(b) of the Sarbanes-Oxley Act (15 U.S.C. 7262(b)) by the registered public accounting firm that prepared or issued its audit report. ☒
Indicate by check mark which basis of accounting the registrant has used to prepare the financial statements included in this filing:
|
| | | | | | | | | | | | | |
U.S. GAAP ¨☐ | | International Financial Reporting Standards as issued by the International Accounting Standards Board x☒ | | Other ¨☐ |
If “Other” has been checked in response to the previous question, indicate by check mark which financial statement item the registrant has elected to follow.
Item 17 ¨☐ Item 18 ¨☐
If this is an annual report, indicate by check mark whether the registrant is a shell company (as defined in Rule 12b-2 of the Exchange Act). Yes ¨☐ No x
☒

BPb p A n n u al R e p o rt an d F o rm 2 0 -F 2 0 2 0 bp Annual Report and Form 20-F 2019
2020 from IOC to IEC
Our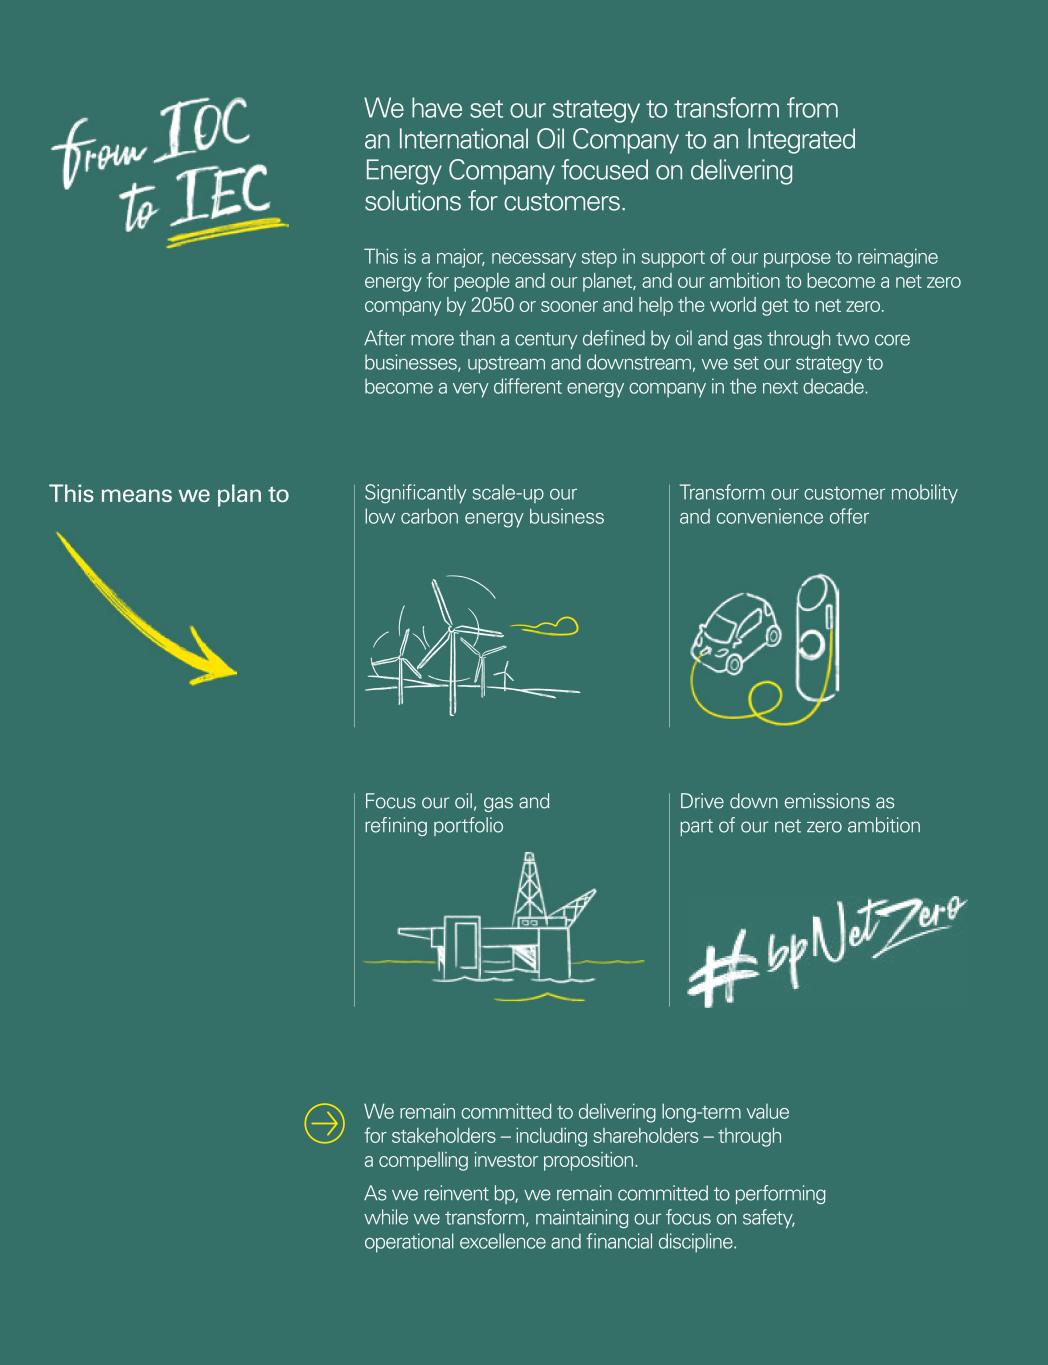
This means we plan to We have set our strategy to transform from an International Oil Company to an Integrated Energy Company focused on delivering solutions for customers. This is a major, necessary step in support of our purpose is reimaginingto reimagine energy for people and our planet, and our ambition to become a net zero company by 2050 or sooner and help the world get to net zero. After more than a century defined by oil and gas through two core businesses, upstream and downstream, we set our strategy to become a very different energy company in the next decade. We remain committed to delivering long-term value for stakeholders – including shareholders – through a compelling investor proposition. As we reinvent bp, we remain committed to performing while we transform, maintaining our focus on safety, operational excellence and financial discipline. Significantly scale-up our low carbon energy business Focus our oil, gas and refining portfolio Transform our customer mobility and convenience offer Drive down emissions as part of our net zero ambition
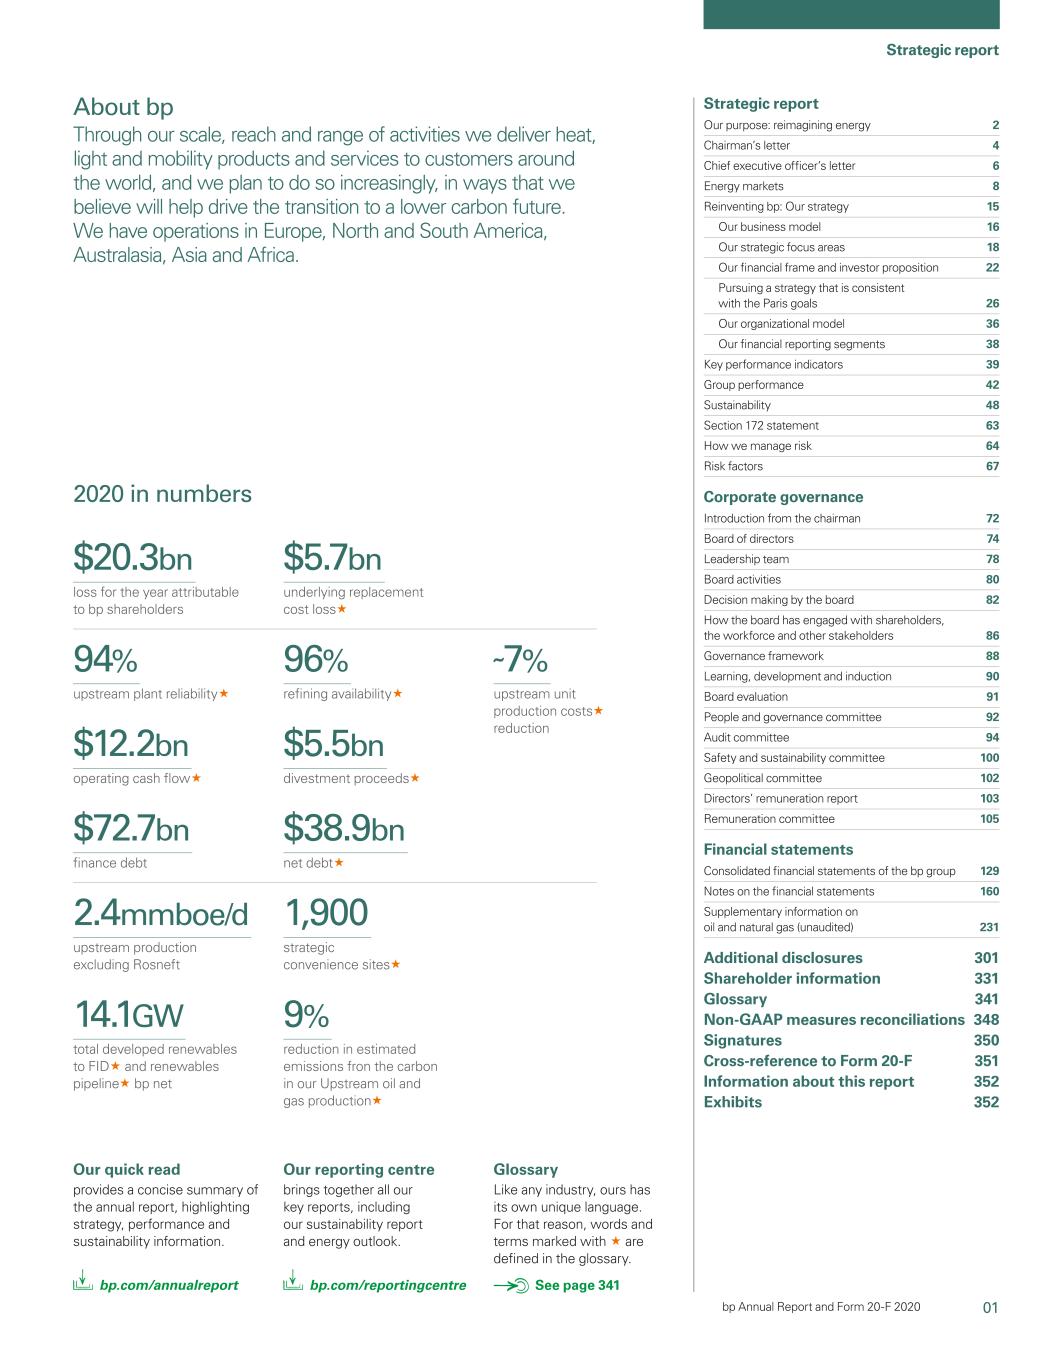
01 Strategic report bp Annual Report and Form 20-F 2020 Strategic report Our purpose: reimagining energy 2 Chairman’s letter 4 Chief executive officer’s letter 6 Energy markets 8 Reinventing bp: Our strategy 15 Our business model 16 Our strategic focus areas 18 Our financial frame and investor proposition 22 Pursuing a strategy that is consistent with the Paris goals 26 Our organizational model 36 Our financial reporting segments 38 Key performance indicators 39 Group performance 42 Sustainability 48 Section 172 statement 63 How we manage risk 64 Risk factors 67 Corporate governance Introduction from the chairman 72 Board of directors 74 Leadership team 78 Board activities 80 Decision making by the board 82 How the board has engaged with shareholders, the workforce and other stakeholders 86 Governance framework 88 Learning, development and induction 90 Board evaluation 91 People and governance committee 92 Audit committee 94 Safety and sustainability committee 100 Geopolitical committee 102 Directors’ remuneration report 103 Remuneration committee 105 Financial statements Consolidated financial statements of the bp group 129 Notes on the financial statements 160 Supplementary information on oil and natural gas (unaudited) 231 Additional disclosures 301 Shareholder information 331 Glossary 341 Non-GAAP measures reconciliations 348 Signatures 350 Cross-reference to Form 20-F 351 Information about this report 352 Exhibits 352 About bp Through our scale, reach and range of activities we deliver heat, light and mobility products and services to customers around the world, and we plan to do so increasingly, in ways that we believe will help drive the transition to a lower carbon future. We have operations in Europe, North and South America, Australasia, Asia and Africa. Our quick read provides a concise summary of the annual report, highlighting strategy, performance and sustainability information. bp.com/annualreport Our reporting centre brings together all our key reports, including our sustainability report and energy outlook. bp.com/reportingcentre Glossary Like any industry, ours has its own unique language. For that reason, words and terms marked with « are defined in the glossary. See page 341 2020 in numbers $20.3bn loss for the year attributable to bp shareholders 94% upstream plant reliability« $12.2bn operating cash flow« $72.7bn finance debt 2.4mmboe/d upstream production excluding Rosneft 14.1GW total developed renewables to FID« and renewables pipeline« bp net 9% reduction in estimated emissions fron the carbon in our Upstream oil and gas production« $5.7bn underlying replacement cost loss« 96% refining availability« ˜7% upstream unit production costs« reduction $5.5bn divestment proceeds« $38.9bn net debt« 1,900 strategic convenience sites«
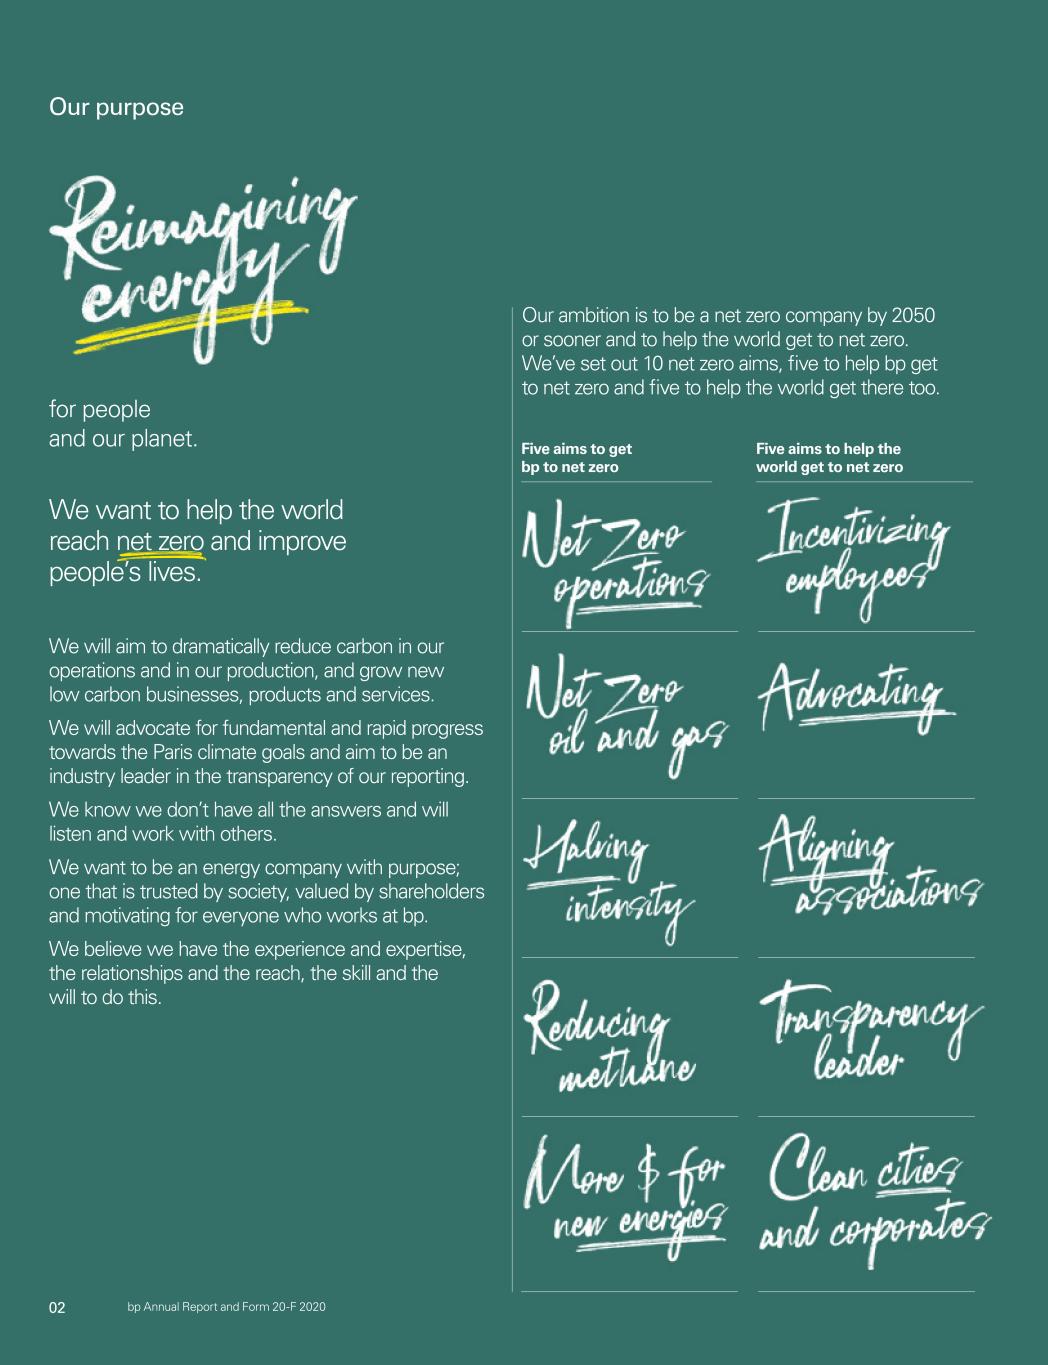
02 bp Annual Report and Form 20-F 2020 Our purpose for people and our planet. Five aims to get bp to net zero Five aims to help the world get to net zero Our ambition is to be a net zero company by 2050 or sooner and to help the world get to net zero. We’ve set out 10 net zero aims, five to help bp get to net zero and five to help the world get there too. We want to help the world reach net zero and improve people’speople’s lives. We will aim to dramatically reduce carbon in our operations and in our production, and grow new low carbon businesses, products and services. We will advocate for fundamental and rapid progress towards the Paris climate goals and striveaim to be aan industry leader in transparency.the transparency of our reporting. We know we don’tdon’t have all the answers and will listen to and work with others. We want to be an energy company with purpose; one that is trusted by society, valued by shareholders and motivating for everyone who works at BP.bp. We believe we have the experience and expertise, the relationships and the reach, the skill and the will to do this.
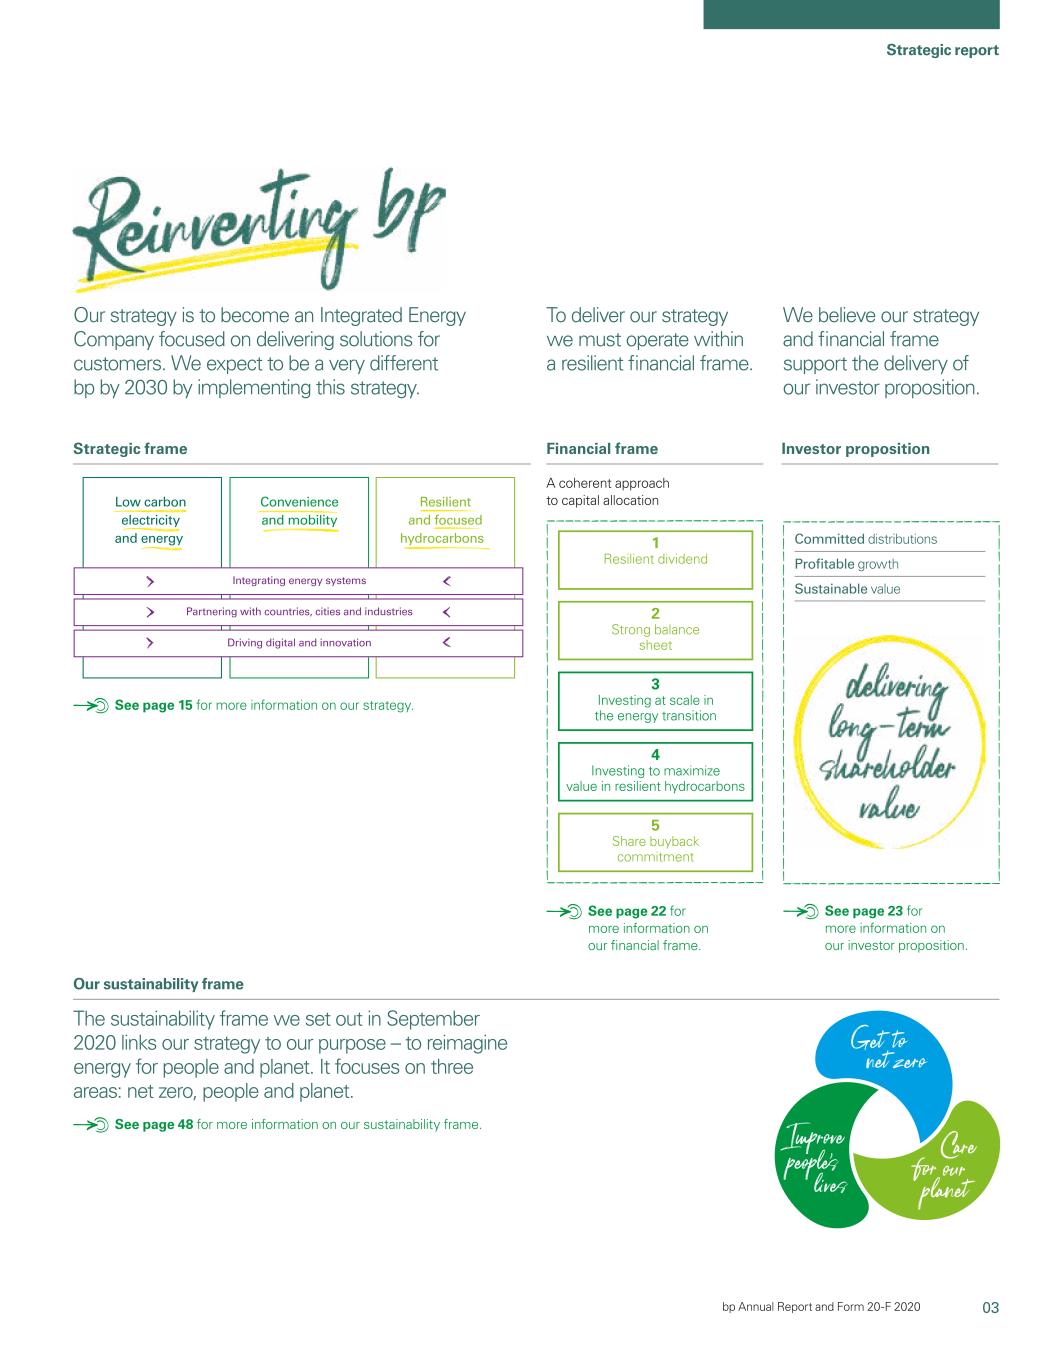

03 Strategic report Financial statements Chairman’s letter 2 Consolidated financial statements 131 Chief executive officer’s letter 4 of the BP groupA sustainability frame linking our purpose and Integrating energy systems Partnering with countries, cities and industries Driving digital and innovation Low carbon electricity and energy Convenience and mobility Resilient and focused hydrocarbons Embedding into our DN A Eng aging stakeholders Our ambition for the energy transition 6 Notes on the financial statements 157 At a glance 8 Supplementary information on 232 oilvalues and natural gas (unaudited) Global context 10 Our business model 14 Our strategy 16 Our investment process 19 Our strategy in action 24 Additional disclosures 297 Measuring our progress 32 Group performance 36 Shareholder information 327 Sustainability 39 Glossary 337 Upstream 50 Non-GAAP measures 344 reconciliations Downstream 56 Rosneft 61 Signatures 347 Other businesses and corporate 63 Cross-reference to Form 20-F 348 Alternative Energy 63 Information about this report 349 Section 172 statement 66 Exhibits 349 How we manage risk 68 Risk factors 70 Corporate governance Board of directors 74 Executive team 78 The leadership team 80 Introduction from the chair 82 Board activities in 2019 84 How the board has engaged with shareholders, 88 the workforce and other stakeholders Nomination and governance committee 90 Audit committee 91 Safety, environment and security 96 assurance committee Geopolitical committee 98 Chairman’s committee 99 Directors’ remuneration report 100 Remuneration committee 101 Navigating our reports Our fast read Our reporting centre Glossary provides a concise summary of the annual brings together all our key reports, including our Like any industry, ours has its own unique language. report, highlighting strategy, performance and sustainability report, as well as other reports on how For that reason, words and terms marked with sustainability information. we see the energy market evolving in the future. are defined in the glossary on page 337. bp.com/annualreport. bp.com/reportingcentre. BPfoundations bp Annual Report and Form 20-F 20192020 Our strategy is to become an Integrated Energy Company focused on delivering solutions for customers. We expect to be a very different bp by 2030 by implementing this strategy. We believe our strategy and financial frame support the delivery of our investor proposition. To deliver our strategy we must operate within a resilient financial frame. Strategic frame Our sustainability frame Financial frame A coherent approach to capital allocation Investor proposition The sustainability frame we set out in September 2020 links our strategy to our purpose – to reimagine energy for people and planet. It focuses on three areas: net zero, people and planet. See page 48 for more information on our sustainability frame. See page 22 for more information on our financial frame. See page 23 for more information on our investor proposition. See page 15 for more information on our strategy. 1
Resilient dividend 2 Strong balance sheet 3 Investing at scale in the energy transition 4 Investing to maximize value in resilient hydrocarbons 5 Share buyback commitment Committed distributions Profitable growth Sustainable value
Chairman’s
04 bp Annual Report and Form 20-F 2020 Chairman’s letter “We enterWhile this is a journey that will require patience, our goal is that bp over time will become a more valuable company for its shareholders and bring wider benefits for society. 7.9% annual dividend yield« ordinary share (2019 6.9%) $6.4bn total dividends distributed to bp shareholders (2019 $8.3bn)
05 Strategic report bp Annual Report and Form 20-F 2020 Dear fellow shareholders, 2020: the year of the pandemic In every sense, 2020 was an extraordinary year. The worst pandemic in a century has cost well over 2 million lives and caused worldwide economic and social disruption. While vaccination programmes are now building momentum, the path to recovery remains uncertain. Because demand for energy is closely linked to human activity, our sector was deeply affected. The combination of a steep fall in share values for almost all oil and gas companies and a new decadebp distribution policy significantly affected your shareholder returns. As chairman of your board, I am conscious of my responsibilities to bp’s shareholders. When the board decided to reset our distribution policy, it did so with a view to your long-term interests. Our priorities were, and remain, weathering the immediate challenge of the pandemic; paying a resilient dividend; strengthening our balance sheet; investing into the energy transition; investing in our resilient hydrocarbons business and, after that, returning surplus cash« to shareholders through buybacks. The board was unanimous in its support for this course of action, which will help establish bp as an Integrated Energy Company. I hope that bp’s new investor proposition and financial frame give reasons for optimism about bp’s long-term prospects. As we turn to 2021, the board’s focus is on supporting bp’s leadership team to deliver our new strategy, and on building renewed shareholder confidence through strategic progress and operational and financial performance. 2020 was also tough for our people. My board colleagues and I are proud of them. Their commitment – on rigs, in refineries, across retail stations and everywhere else in bp – helped keep the world’s lights on and allowed us to provide many emergency services with free or heavily discounted fuel. Despite new COVID-19-related practical challenges, our people maintained the safety of bp’s operations. That is a testament to their careful work. bp’s new purpose 2020 was a remarkable year for bp for other reasons too. With the backing of the board, our new CEO, Bernard Looney, introduced a new company purpose: reimagining energy for people and our planet. That purpose – together with our strong culture and values – underpins the net zero ambition that we set out last year, together with our new strategy, financial frame and investor proposition. It also informed bp’s reinvention – the selection of a new leadership team, and the replacement of bp’s upstream/downstream model with a new, integrated group structure. Change of this scale necessitated a reorganization of how we work. That reorganization will ultimately see close to 10,000 colleagues leaving bp. Saying goodbye has been difficult, but the result is a leaner, flatter, nimbler company purpose:– better able to realize the opportunities of the energy transition. Macro-economic developments have only strengthened the board’s belief that the direction in which we are taking bp is the right one – including China’s new net zero target, the EU’s Green Deal, the UK’s plan for a green industrial revolution, and the US’s recommitment to the Paris Agreement. Today, global energy markets are even further down the path of fundamental change – and bp is well-positioned to help to speed the world’s journey to net zero. A year of engagement While this is a journey that will require patience, our goal is that bp over time will become a more valuable company for its shareholders and bring wider benefits for society. Of course, the journey to net zero is, in part, one of discovery. For that reason, the board and bp’s leadership team know that we must be fully open to advice, learning and challenge. 2020 was therefore a year of engagement with our stakeholders, and I am grateful for the inputs we received – which helped us shape our new strategy, financial frame and investor proposition, sustainability frame and position on biodiversity. We will keep listening, and we count on you to share your feedback with us as we travel the road to net zero together. Evolution of the board As the company evolves, the board’s composition will evolve too – reflecting the need for new experiences and skills aligned with bp’s new direction. During the year, the board said goodbye to our former CEO, Bob Dudley, and to Brian Gilvary, our former CFO. Sir Ian Davis, Nils Andersen and Dame Alison Carnwath have also stepped down from the board, and we shall shortly say farewell to Brendan Nelson. Collectively and individually they served with distinction – bp is very fortunate to have had their wise advice and strong leadership. We are just as fortunate to welcome Tushar Morzaria, Karen Richardson and Johannes Teyssen to bp’s board for the first time. Closing thanks I would like to thank Bernard Looney, his leadership team and everyone in bp for their work during 2020. Throughout this challenging year, they showed characteristic determination. Finally, I thank you, our shareholders. I am grateful both for the continued support we received during 2020, and also for the support of our new shareholders. During 2020, we received investment and other endorsement from those who told us they would not have considered supporting bp were it not for the transformation we have begun. We look forward to repaying the faith you have placed in bp. Helge Lund, Chairman 22 March 2021
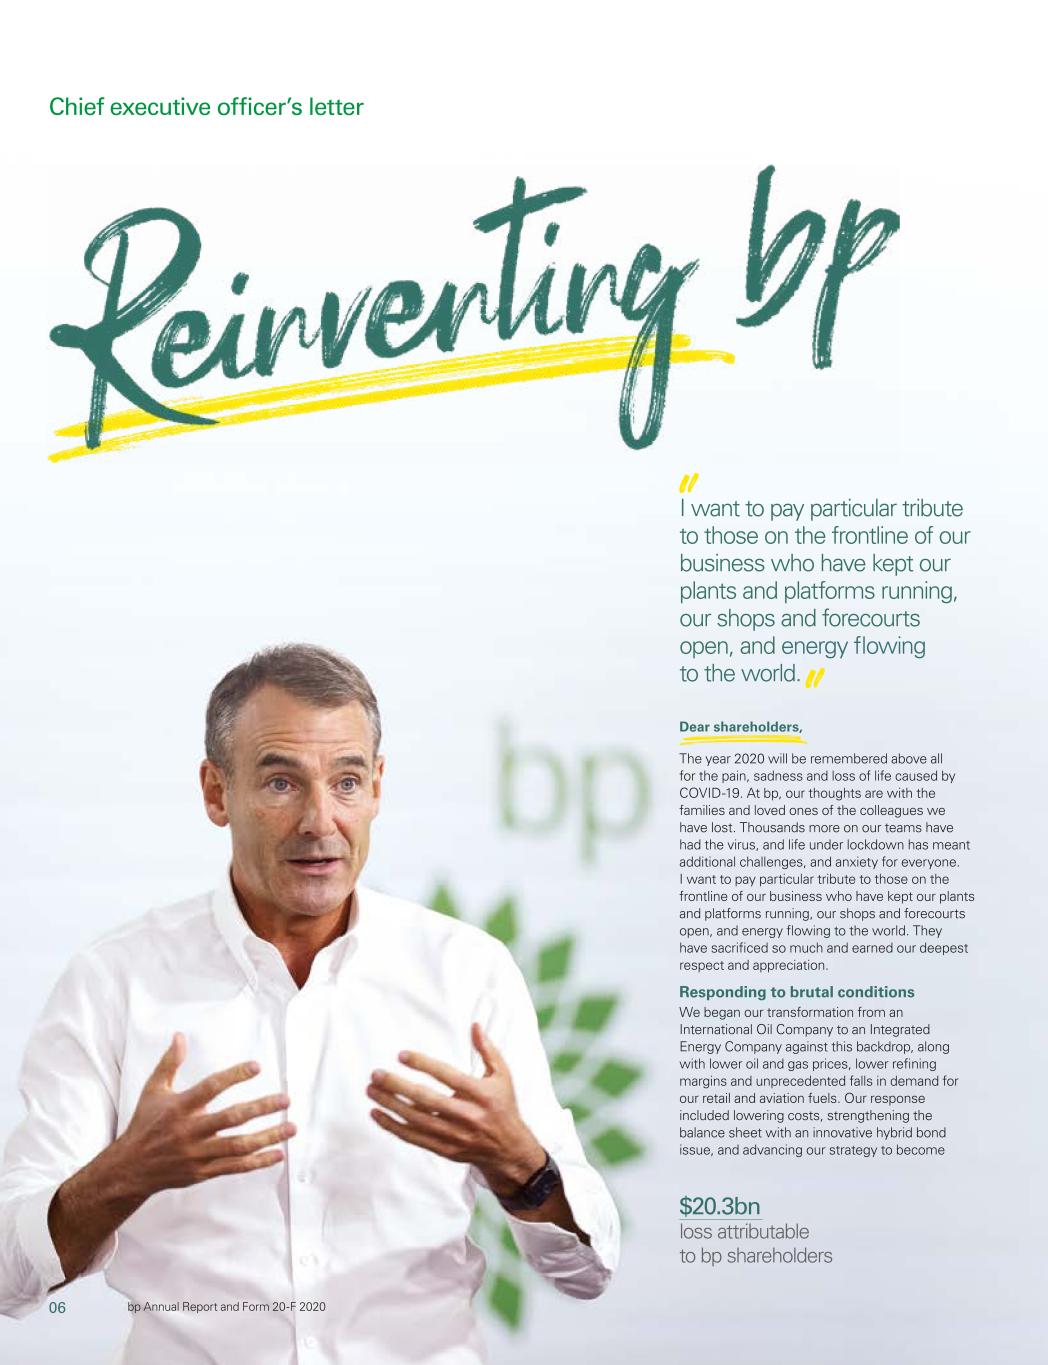
06 bp Annual Report and Form 20-F 2020 Chief executive officer’s letter $20.3bn loss attributable to bp shareholders Dear shareholders, The year 2020 will be remembered above all for the pain, sadness and loss of life caused by COVID-19. At bp, our thoughts are with the families and loved ones of the colleagues we have lost. Thousands more on our teams have had the virus, and life under lockdown has meant additional challenges, and anxiety for everyone. I want to pay particular tribute to those on the frontline of our business who have kept our plants and platforms running, our shops and forecourts open, and energy flowing to the world. They have sacrificed so much and earned our deepest respect and appreciation. Responding to brutal conditions We began our transformation from an International Oil Company to an Integrated Energy Company against this backdrop, along with lower oil and gas prices, lower refining margins and unprecedented falls in demand for our retail and aviation fuels. Our response included lowering costs, strengthening the balance sheet with an innovative hybrid bond issue, and advancing our strategy to become I want to pay particular tribute to those on the frontline of our business who have kept our plants and platforms running, our shops and forecourts open, and energy flowing to the world.
07 Strategic report bp Annual Report and Form 20-F 2020 a more diversified, resilient and lower carbon company. As part of our strategy planning process, we reviewed our portfolio and development plans. This work – informed by bp’s views of the long-term price environment – led to significant impairment charges and non-cash exploration write-offs in the second quarter. For shareholders, all this was reflected in a reset dividend and a diminished share price. I recognize the financial impact this must have had on you. However, I wholeheartedly believe we will not just restore, but will enhance the long-term sustainable value of your company through the actions we are taking to reinvent bp. And despite the most brutal operating conditions I can remember in almost 30 years in this industry, we have made considerable operational and strategic progress. Performing while transforming The loss of $20.3 billion we reported for the year is clearly disappointing. However, it in no way reflects the heroic efforts of the bp team in extremely difficult circumstances, or their deep commitment to performing while transforming: Most importantly – our safety performance continued to improve. Reliability of 94% for bp’s operated plants« and refining availability« of 96% represents remarkably strong performance, especially given the challenges faced by our frontline staff. Capital was reset and we delivered at the lower end of the range. We made good progress towards our net debt« target, including the contribution from high grading our portfolio and $6.6 billion of divestment and other proceeds received during the year. New oil and gas production came on from four major projects« – in India, Oman, the UK and the US. Natural gas from the Shah Deniz field in the Caspian Sea arrived in Italy following final completion of the historic Southern Gas Corridor project. And we doubled our retail network in growth markets to around 2,700 retail sites«, plus the addition of around 300 strategic convenience sites«. Reinventing bp This performance is even more remarkable given that we have been carrying out the most extensive reorganization in bp’s 112-year history. We have retired the upstream/downstream business model that has served bp very well. In its place we have introduced a leaner, flatter structure, stripping away tiers of management and lowering the workforce towards a target of around 10,000 fewer jobs. My role is now five layers at most away from more than half of our employees. That means people’s ideas and voices can be more easily heard – and decisions taken much faster. We are now more centralized, more agile, and better integrated. This enables us to maximize value creation in a rapidly evolving market through economies of scale, and by exploiting synergies and driving continuous improvement in operational performance. We are now organized around four business groups. Production & operations is the operating heart of the company – and is focusing our resilient hydrocarbons portfolio on value. Customers & products is growing our convenience and mobility offers for an increasing number of customers. Gas & low carbon energy is growing to help meet rapidly increasing clean energy demand. Innovation & engineering acts as a catalyst, opening up new and disruptive business models and driving our digital transformation. And our trading & shipping business and regions, cities & solutions team knit together the offers of our four core groups to drive greater value creation. Reimagining energy Completing our transformation to a net zero Integrated Energy Company will take time. But we are led by our purpose – to reimagine energy for people and our planet.”planet – and motivated by the opportunity we see in the energy transition. Trillions of dollars of investment will be needed over the next 30 years in replumbing and rewiring the global energy system. We now have offshore wind partnerships in the US with Equinor and in the UK with EnBW – two of the best regions globally for the world’s fastest-growing source of energy. Our solar development joint venture«, Lightsource bp, is growing prolifically. We are working with Ørsted to develop green hydrogen for our Lingen refinery. We have joined forces with the mobility platform DiDi to build a network of electric vehicle chargers in China, by far the world’s biggest market for EVs. And we have a growing list of low carbon partnerships with cities such as Aberdeen and Houston and some of the world’s leading companies, including Amazon, Microsoft, Qantas and Uber. A compelling investor proposition Growing sustainable free cash flowWe are fully focused at all times on the bottom line of the business – on executing our strategy while operating safely, reliably and distributionswith discipline. We continue to shareholdersbuild resilience and strength in the balance sheet as conditions remain challenging and uncertain while vaccines roll out, the pandemic recedes, and economies look to recover. At the same time, we are transforming to create value from the energy transition over the long term. $8.3bn total dividends distributedWe see tremendous business opportunity in providing people with the reliable, affordable, clean energy they want and need. Our net zero ambition is clearly the right thing for society, but we know it does not give us a free pass in a fast-changing world. We have to BP shareholders (2018 $8.1bn) 6.9% annualshow you the evidence that we can compete fiercely and add value – in service of the compelling investor proposition we believe we offer: Committed distributions – including the dividend yield ordinary share (2018 6.3%) 2 BPas the number one priority; Profitable growth; and Sustainable value. This is all in service of growing long-term shareholder value, that is our job. And I promise to keep you well informed as we execute our plans. As ever, thank you for your continued support – I will never take that for granted. And I look forward to any feedback you might have. Thank you. Bernard Looney, Chief executive officer 22 March 2021
08 bp Annual Report and Form 20-F 2019
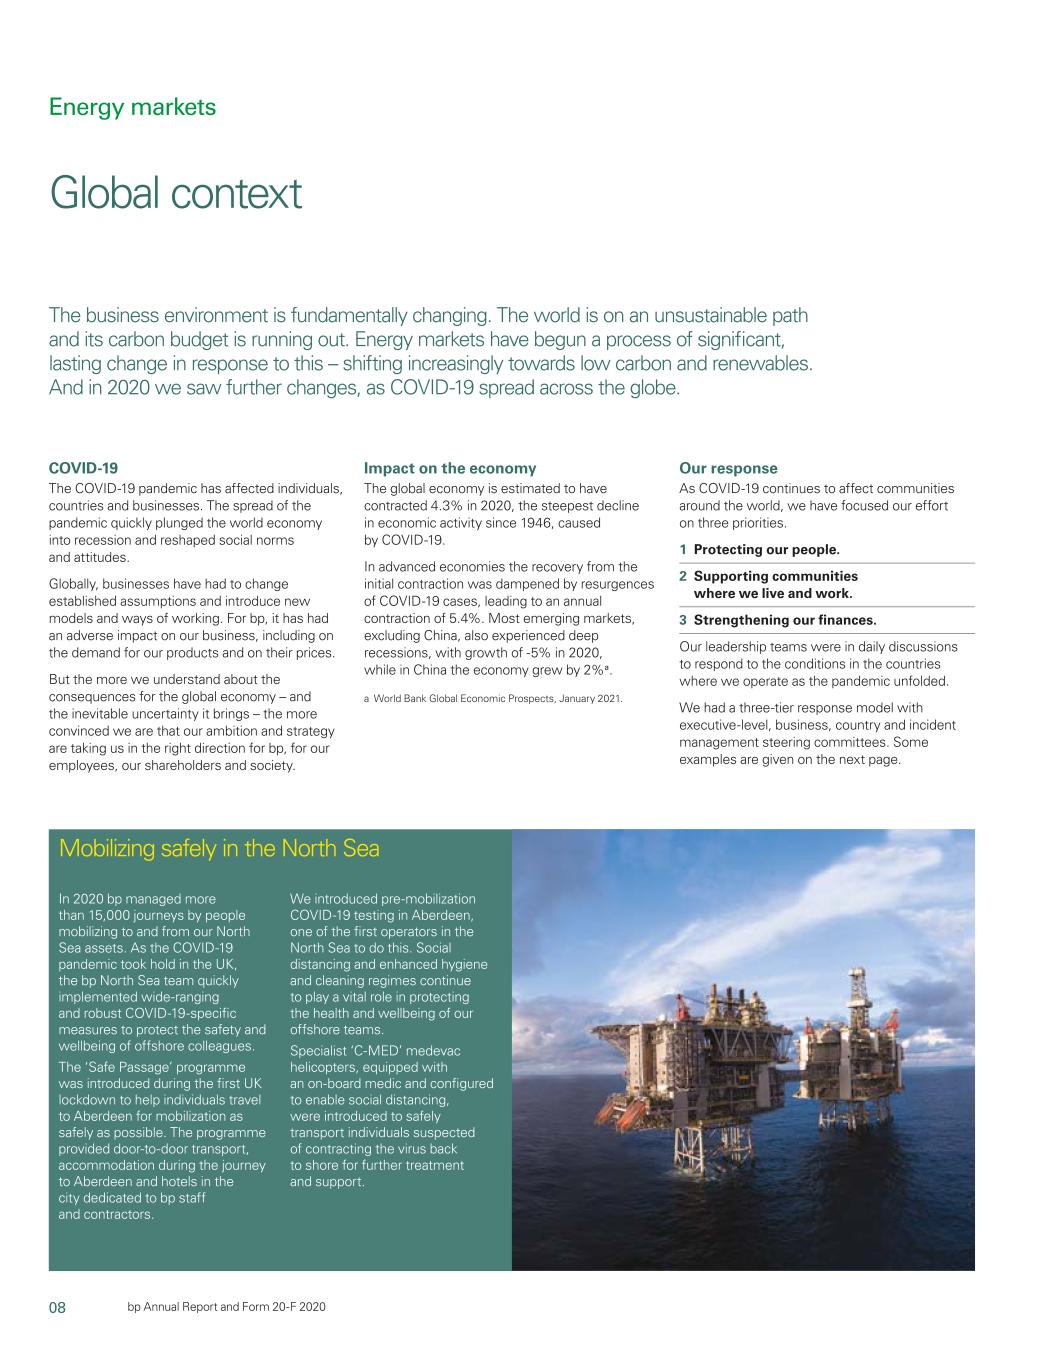
2020 Energy markets Global context Mobilizing safely in the North Sea In 2020 bp managed more than 15,000 journeys by people mobilizing to and from our North Sea assets. As the COVID-19 pandemic took hold in the UK, the bp North Sea team quickly implemented wide-ranging and robust COVID-19-specific measures to protect the safety and wellbeing of offshore colleagues. The ‘Safe Passage’ programme was introduced during the first UK lockdown to help individuals travel to Aberdeen for mobilization as safely as possible. The programme provided door-to-door transport, accommodation during the journey to Aberdeen and hotels in the city dedicated to bp staff and contractors. We introduced pre-mobilization COVID-19 testing in Aberdeen, one of the first operators in the North Sea to do this. Social distancing and enhanced hygiene and cleaning regimes continue to play a vital role in protecting the health and wellbeing of our offshore teams. Specialist ‘C-MED’ medevac helicopters, equipped with an on-board medic and configured to enable social distancing, were introduced to safely transport individuals suspected of contracting the virus back to shore for further treatment and support. COVID-19 The COVID-19 pandemic has affected individuals, countries and businesses. The spread of the pandemic quickly plunged the world economy into recession and reshaped social norms and attitudes. Globally, businesses have had to change established assumptions and introduce new models and ways of working. For bp, it has had an adverse impact on our business, including on the demand for our products and on their prices. But the more we understand about the consequences for the global economy – and the inevitable uncertainty it brings – the more convinced we are that our ambition and strategy are taking us in the right direction for bp, for our employees, our shareholders and society. Impact on the economy The global economy is estimated to have contracted 4.3% in 2020, the steepest decline in economic activity since 1946, caused by COVID-19. In advanced economies the recovery from the initial contraction was dampened by resurgences of COVID-19 cases, leading to an annual contraction of 5.4%. Most emerging markets, excluding China, also experienced deep recessions, with growth of -5% in 2020, while in China the economy grew by 2%a. a World Bank Global Economic Prospects, January 2021. Our response As COVID-19 continues to affect communities around the world, we have focused our effort on three priorities. 1 Protecting our people. 2 Supporting communities where we live and work. 3 Strengthening our finances. Our leadership teams were in daily discussions to respond to the conditions in the countries where we operate as the pandemic unfolded. We had a three-tier response model with executive-level, business, country and incident management steering committees. Some examples are given on the next page. The business environment is fundamentally changing. The world is on an unsustainable path and its carbon budget is running out. Energy markets have begun a process of significant, lasting change in response to this – shifting increasingly towards low carbon and renewables. And in 2020 we saw further changes, as COVID-19 spread across the globe.

09 Strategic report Dear fellow shareholders, focused on evolving BP’s strategy and Our focus throughout 2020 As I write, the world is facing an portfolio to address the challenges of One of the focal points for the board in unprecedented set of challenges. The tomorrow. This focus has included 2020 will be BP’s capital markets day coronavirus pandemic (COVID-19) is ensuring the smooth transition in in September, when Bernard and his spreading rapidly, with tragic consequences leadership from Bob to Bernard, followed leadership team will lay out more detail for many people across many geographies. by regular engagement by the board with about the strategy, near-term targets and Global efforts to stop the virus are also Bernard and his new leadership team to ways to measure progress. It will be the having significant economic consequences. develop BP’s purpose and net zero moment the vision and ambition set out in And in an oil market where demand has ambition. This is a process which has February becomes much more concrete. fallen, supply has sharply increased. been supported by our dialogue with We will do this while ensuring that we investors, governments, employees maintain a strong focus on high quality and Though unprecedented, a global energy and other key stakeholders. efficient operations and on delivering the company like BP should be prepared for promises we have made to our investors such challenges. Our enduring commitments BP is now set for a future that is different My thanks to you all BP is indeed prepared. Our global to its past, but some things won’t change. In addition to thanking Bob, two other operating structure and long time- BP’s values-based culture will be maintained departing senior leaders deserve a special horizons are intended to mitigate the and further developed. BP’s purpose and mention – chief financial officer Brian effect of near-term shocks. That is how ambition reflect its culture, and together Gilvary, who has decided to step down from BP has approached shocks and volatility they position BP well to develop as an the board in June after eight years in the job, in its 110-year history, and that is how increasingly sustainable company. and Downstream chief executive Tufan we will approach this storm too. In Erginbilgic, who leaves BP at the end of particular, the past decade has given Our commitment to safe and reliable March. On behalf of the board, I extend my BP unique experience in successfully operations will remain paramount. BP’s thanks and my deep appreciation for the handling crises – and we enter this one safety performance has seen near profound contributions they each made even better prepared. continuous improvement since 2010, and during an important period for the company. we must continue to learn and improve. But in this world of change, BP itself is also We believe that the new organizational Of course, each of our employees has a changing. We enter a new decade with a structure BP set out last month will help very important role to play in BP’s progress, new company purpose: to reimagine to reinforce this commitment. and they should be recognized. On behalf energy for people and our planet. We have of the board I extend my sincere thanks to also set a new ambition: to become a net As well as our enduring commitment all our people for a job well done in 2019. zero company by 2050 or sooner, and to to safety, BP’s commitment to its help the world get to net zero. And to lead relationships and partnerships will not Today, BP’s engagement with its and deliver on both we have a new chief change, including with governments customers, suppliers, shareholders, executive officer, Bernard Looney, who around the world. BP intends to use its employees and others is wider and deeper took on the role on 5 February 2020. energy market experience, skills and than ever, but it has to further develop as technology to help countries, cities and we progress on our journey. I therefore want Evolving for an uncertain world corporations decarbonize, while at the to use this opportunity to thank you, BP This is a new direction for BP, and it is only same time building a thriving, lower shareholders, for your continued support possible because of the foundation laid by carbon energy business. and engagement during 2019, including Bob Dudley. Bob served as BP’s group through your votes at our AGM in May. Your chief executive with distinction for almost BP’s new ambition also gives us extra challenge and input have been important in a decade, and he and his team deserve reason to maintain the capital discipline our effort to set a new strategic direction. our considerable thanks for guiding BP to and focus that has served the company so I look forward to continuing our dialogue. a position of operational and financial well. We can only reimagine energy if we strength and deepened resilience. generate the cash needed to manage the balance sheet, invest in new low carbon At these times, BP’s 110-year history of businesses, and continue to pay the navigating uncertainty is also reassuring. dividend on which you, our owners, depend. Your company has anticipated and That is how we will meet our ambition. It is responded to change many times over. something that I, together with the BP Helge Lund Indeed, throughout 2019 your board has board, look forward to working on with Chairman Bernard and his executive team. 18 March 2020 BPbp Annual Report and Form 20-F 2019 3

Chief executive officer’s letter Dear fellow shareholders, Reimagining2020 In 2020 we set a new target of $25 billion of proceeds between the second half of 2020 and reinventing energy Our investor proposition will remain2025, of which we’ve completed or agreed transactions for over half of this target. This includes the agreed sale of a 20% interest in Oman’s Block 61 and proceeds from the divestments of our petrochemicals business and Alaska interests. We have a deep hopper of potential future divestment options. As we publishexecute this report, the world is In February,programme, we announced a new unchanged as we lay out new near-term working through extraordinarily difficult purpose for BP, and a major reorganization plans later this year. This includes our times. Countries around the globe are to deliver our new ambition to be a net commitment to growing sustainable free battling the coronavirus pandemic zero company by 2050 or sooner and help cash flow and returns to shareholders (COVID-19). People’s lives are being the world get to net zero. over the long term. hugely disrupted, with tragic The current market shocks only reaffirm We will continue to maintain a strong consequences for many. The financial the need for this reimagining of energy and financial frame, including a focus on markets are reflecting the disruption and reinvention of BP. Our current upstream- deleveraging our balance sheet and our sector is particularly hard hit, not just downstream structure has served us well staying within a disciplined frame for our by a virus-related shock to demand but by for over a century, but I believe we now capital expenditure. a supply-side shock as well. need a different model for the rapidly And now, more than ever, we will focus At BP, we are taking calm and deliberate changing demands of the future. We need on managing costs, pursuing efficiencies actions for the well-being of our people an agile, highly integrated structure that is and driving waste out of the system. and the health of your company. We do more focused than ever on our core so with a robust balance sheet, strong capabilities in operations, customers, low A force for good and competitive returns liquidity and the flexibility in our portfolio carbon and innovation. The leadership team This new decade is a pivotal time for BP. and financial framework that provide us is working with the board to develop this We will continue to be an energy business,focused on value. Capital expenditure Capital expenditure« for 2020 was $14 billion, around 28% lower than 2019. Organic capital expenditure« for 2020 was $12 billion, in line with options. structure, alongthe guidance given in April. Liquidity Finance debt was $72.7 billion and net debt« was $38.9 billion at the end of 2020. We are actively managing the profile of our debt portfolio. We issued perpetual hybrid bonds with a new strategyUS dollar equivalent value of $11.9 billion in June 2020, and butwe bought back an aggregate US dollar equivalent value of $8 billion of debt in the third quarter of 2020, January 2021 and March 2021. bp had around $44 billion of liquidity, consisting of cash and cash equivalents (net of restricted cash) plus undrawn revolving credit facilities committed credit and bank facilities, at the end of 2020. In April 2020 Moody’s reaffirmed BP p.l.c.’s A1 credit rating and revised its outlook from stable to negative. The short-term P-1 rating was also reaffirmed. In January 2021 S&P revised its outlook on BP p.l.c. from stable to negative and affirmed BP p.l.c.’s long- and short-term corporate credit rating of A-/A-2. From January 2021, Fitch Ratings has provided a very different kindsolicited long-term corporate credit rating to BP p.l.c. of energy business near-term targets, which we intend to in years to come. We may not get A resilient company share with you in September 2020. everything right along the waystable outlook. In February 2021, Fitch Ratings assigned BP p.l.c. a short-term corporate credit rating of F1. bp’s financial performance, including cash flows and net debt, has been and will This resiliencecontinue to be impacted by the extent and duration of the current market conditions and the effectiveness of the actions that it and others take, including its financial interventions. It is a tributedifficult to Bob Dudley’s need to listenpredict when current supply and learn from others, not leadership overdemand imbalances will be resolved and what the past decade. I see huge opportunityultimate impact of COVID-19 will be. See page 22 for BP given our least you, our owners. Following the Deepwater Horizon distinctive combination of reach, accident, Bob’s steady hand has guided resources and relationships. The world will But with your continued support we BP through recovery and back to growth need to invest trillions of dollars in new expect to become leaner, faster-moving, as a safer, stronger and more disciplined energies over the next several decades. lower carbon – and more valuable. company – one that has deliveredinformation on capital allocation. We have addressed our response to COVID-19 in further detail throughout this report: See page 63 Our stakeholders. See page 64 How we manage risk. See page 67 Risk factors. See page 87 Workforce engagement. 1 Protecting our people Our first priority is the skillsafety and health of our people. Our people involved in, or supporting, critical operations continued at their normal workplace during the willpandemic and we put additional processes in place to help the Our destination is a thriving, sustainable consistentlyprotect them. These included operating robust protocols for 12 consecutive quarters world deliver a rapid energy transition. energy business in a net zero world. One on the planhealth and pre-mobilization checks, PPE, travel and workplace access, social distancing and isolation. Employees who were able to work from home were asked not to come into their workplace and we put forwardbusiness travel restrictions in 2017. Performing while transforming that isplace. Many office-based workers continue to work from home at the time of publication and are likely to do so for the foreseeable future as ways of working change. We liaised closely with industry peers and other organizations to regularly test our approach on specific safety issues. And we created a motivatingglobal COVID-19 OneMap, providing our businesses with current local COVID-19 risk profiles including rates of infection, vaccines rates and inspiring placeprocurement. 2 Supporting communities Providing essential support for the communities where our people live and our businesses operate was a priority throughout our response to •COVID-19. We made an underlying profitoffered support to governments and partners, using our expertise and resources to support the relief effort. The bp Foundation donated $2 million to the World Health Organization’s COVID-19 Solidarity Response Fund, which supports medical professionals and patients worldwide by providing critical aid and supplies. The fund also helps track and understand the spread of This may beCOVID-19 and supports efforts to develop tests, treatments and vaccines. 3 Strengthening our most wide-ranging workfinances The economic consequences of COVID-19 for the world remain uncertain at the time of publication. In response to this uncertainty, we took deliberate steps to strengthen our employees. That is wanted $10finances – reinforcing liquidity, rapidly reducing spending and costs, driving our cash balance point lower. Divestment programme We delivered our plans for $15 billion of announced divestments, which commenced at the start of 2019, in 2019. reorganization forJune 2020 – a year earlier than expected. In 2020 we supplied more than 10 million litres of free fuel to emergency service vehicles across the UK. We ran programmes during 2020 and 2021 offering free fuel to UK emergency vehicles – including police, fire, blood transportation, emergency NHS ambulances and NHS Trust non-emergency vehicles. Under the programmes, emergency services vehicles issued with either a century, but as well as needed by society. And one • Operating cash flow was strongbp Plus or Allstar fuel card could fill up without charge at I want to assure youbp’s network of our commitment that is valued by you, our shareholders, as $26 billion1,200 retail sites across the UK, including charging of electric vehicles through bp pulse. Supplying free fuel for the year. to perform as we transform. Among many a force for good as well as a provider of • That gave us the confidence to increase significant changes, however, there will be competitive returns. our dividend, which currently stands at no change to the fundamental principles 10.5c per ordinary share. that have served us well over the last decade and which apply equally in low During 2019, two colleagues sadly lost price environments as well as high. their lives while working at BP. My heart goes out to their families and friends. We Above all, our commitment to safe and must learn from these tragedies and reliable operations remains unchanged. Bernard Looney continue to make BP safer. I believe that Safety will always be a BP core value and Chief executive officer we can build on progress that last year we believe that the new structure we are 18 March 2020 saw our lowest-ever figure for BP people introducing will further strengthen our getting hurt at work (our recordable injury safety performance. frequency measure). Profit attributable to BP shareholders $4.0bn Nearest GAAP equivalent to underlying profit. 4 BPemergency services vehicles
10 bp Annual Report and Form 20-F 2020 Oil The COVID-19 pandemic resulted in a sharp contraction in oil sector demand and production in 2020. Global oil consumptiona decreased by 8.8mmb/d to 91.2mmb/d for the year (-8.8%) as global lockdown measures reduced mobility and took a toll on economic activity. On the supply side, unprecedented co-ordinated output cuts from OPEC+, coupled with curtailed non-OPEC supply, reduced global oil productiona by 6.6mmb/d to 93.9mmb/d. Dated Brent« prices averaged $41.84/bbl in 2020 – a 35% decrease from 2019
levels and almost 26% below the 2016-18 average. Prices fluctuated during 2020, reaching a peak of almost $70/bbl in January on OPEC+ supply restraints and the decline in Libyan output. Prices hit a low of almost $13/bbl in April as lockdown measures were put in place globally. In the second half of the year prices hovered around the $40-45/bbl range, before hitting $50/bbl in December. Urals prices in North West Europe (Rotterdam) averaged $41.71/bbl in 2020. The discount to dated Brent was $0.13/bbl below 2019 ($1.25/bbl). 8.8% decrease in global oil consumption in 2020 Natural gas Gas spot prices dropped in all three key regional markets in 2020. Henry Hub« prices decreased to $2.08/ mmBtu in 2020 from $2.63/mmBtu in 2019. US gas prices varied substantially during 2020, dropping in the second quarter of 2020 due to the impact of the lockdown, before recovering in the fourth quarter as production declined due to the earlier oil price drop and lower oil and gas drilling activityb. The UK National Balancing Point« hub price also dropped significantly from 34.70 pence per therm in 2019, down to 24.93 pence per therm in 2020, due to a combination of a mild winter 2019/20, global LNG oversupply, demand drop and record-high storage levelsb. Asian spot prices declined from $5.49/mmBtu in 2019, down to $4.39/mmBtu on the back of global LNG oversupply and LNG supply capacity growth, especially in the USc. They recovered in the fourth quarter on the back of strong Asian LNG demand and LNG supply issues. Global gas demand dropped by an estimated 2.5% in 2020, while China’s gas demand continued to grow. Meanwhile, LNG trade increased modestly during 2020b. 2.5% estimated decrease in global gas demand in 2020 Refining marker margin We track the refining margin environment using a global refining marker margin« (RMM)c. COVID-19 significantly impacted the downstream sector during 2020. Weaker demand drove product stocks to record highs. OECD commercial product stocks peaked in August at over 1,650Mbbls, almost 150Mbbls higher than a year ago. Since then stocks have declined but are still above historical levels. In 2020 COVID-19 impacted demand through different channels. During the initial global lockdown period, the drop in demand was concentrated in road and air travel – hitting gasoline and jet fuel the hardest. As more measured domestic social distancing policies evolved, road mobility and hence gasoline demand recovered, while jet demand remained depressed. The broader negative impact on the economy also dampened diesel demand given the close link between commercial and industrial diesel uses and economic activity. The resulting refining margins have, therefore, remained extremely weak since the beginning of the pandemic, with RMM averaging $6.7/bbl in 2020, far lower than the level in 2019 ($13.2/bbl). Moreover, the weak margin environment combined with continued capacity additions in developing markets has prompted a raft of third-party closure announcements. Some industry rationalization is expected given the step change in demand, but this is not likely to be sufficient to see a sustained rebound in margins to pre-COVID-19 levels. $6.7/bbl global RMM average in 2020 a IEA Oil Market Report, January 2021©. b Platts 2020 Review and 2021 Outlook, and IHS Markit: Waterborne LNG Export-Import Data Tables. c The RMM may not be representative of the margin achieved by bp in any period because of bp’s particular refinery configurations and crude and product slates. In addition, the RMM does not include estimates of energy or other variable costs. Energy economics Energy markets continued
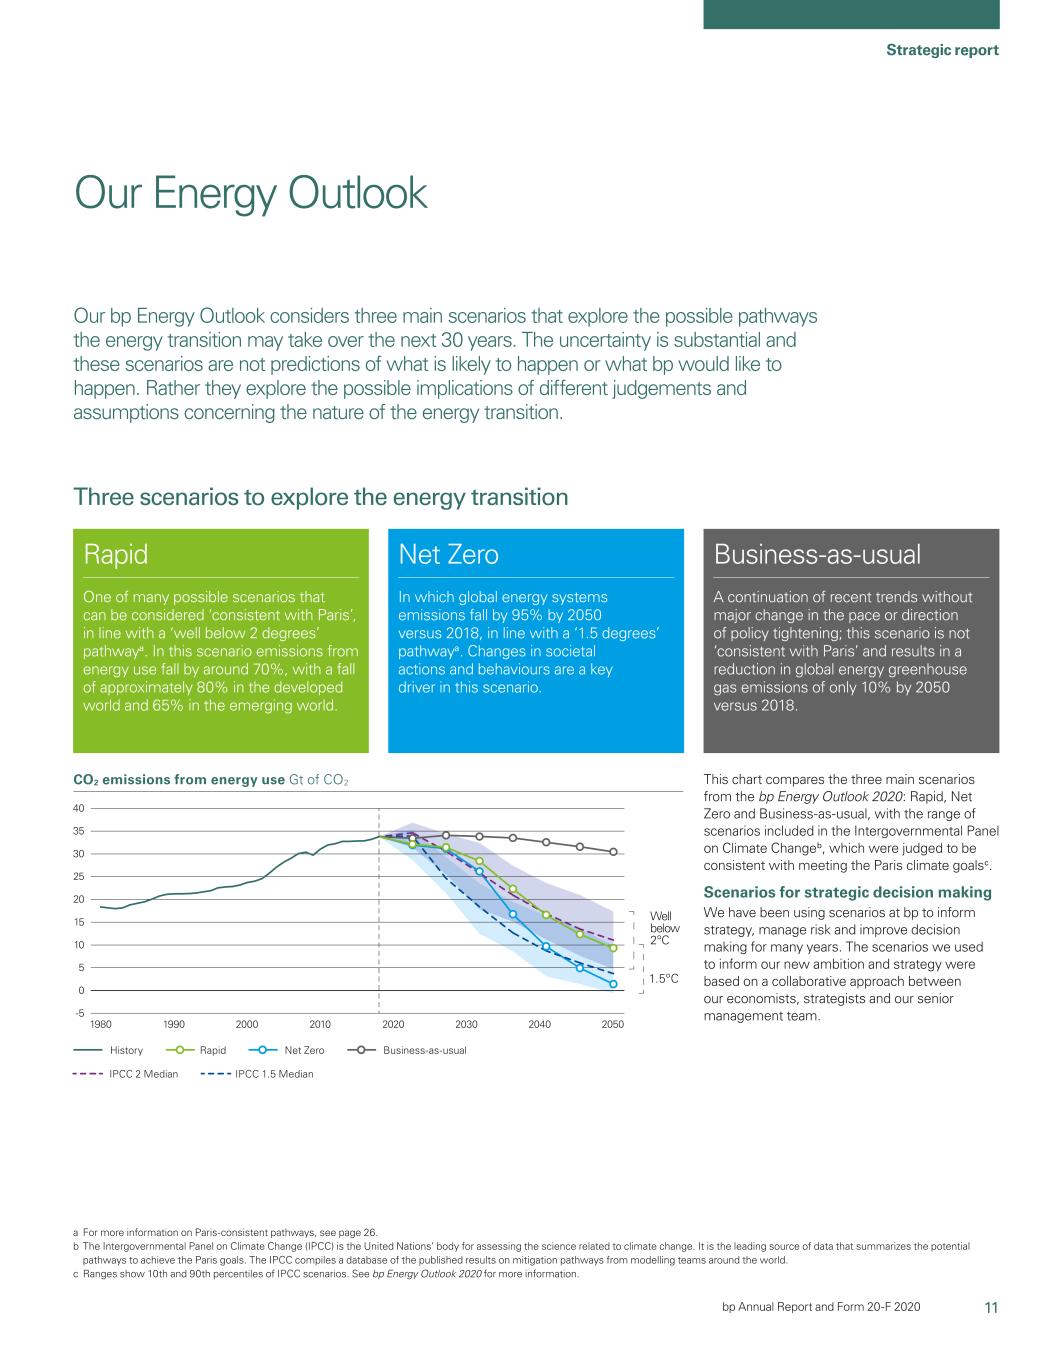
11 Strategic report “Our destination is a thriving, sustainableCO2 emissions from energy business in a net zero world. One that is a motivating and inspiring place to work for our employees.” Our purpose is reimagining energy for people and our planet. This will frame our thinking, our activities and our interactions. Introducing a new structure, new leadership team and new waysuse Gt of working. Our commitment to safe and reliable operations remains unchanged. And our investor proposition remains unchanged. BPCO2 20502020 2030 20402010200019901980 -5 40 IPCC 2 Median History Rapid Net Zero Business-as-usual IPCC 1.5 Median 0 5 10 15 20 25 30 35 Well below 2ºC 1.5ºC bp Annual Report and Form 20-F 2020 Our bp Energy Outlook considers three main scenarios that explore the possible pathways the energy transition may take over the next 30 years. The uncertainty is substantial and these scenarios are not predictions of what is likely to happen or what bp would like to happen. Rather they explore the possible implications of different judgements and assumptions concerning the nature of the energy transition. a For more information on Paris-consistent pathways, see page 26. b The Intergovernmental Panel on Climate Change (IPCC) is the United Nations’ body for assessing the science related to climate change. It is the leading source of data that summarizes the potential pathways to achieve the Paris goals. The IPCC compiles a database of the published results on mitigation pathways from modelling teams around the world. c Ranges show 10th and 90th percentiles of IPCC scenarios. See bp Energy Outlook 2020 for more information. This chart compares the three main scenarios from the bp Energy Outlook 2020: Rapid, Net Zero and Business-as-usual, with the range of scenarios included in the Intergovernmental Panel on Climate Changeb, which were judged to be consistent with meeting the Paris climate goalsc. Scenarios for strategic decision making We have been using scenarios at bp to inform strategy, manage risk and improve decision making for many years. The scenarios we used to inform our new ambition and strategy were based on a collaborative approach between our economists, strategists and our senior management team. Three scenarios to explore the energy transition Rapid One of many possible scenarios that can be considered ‘consistent with Paris’, in line with a ‘well below 2 degrees’ pathwaya. In this scenario emissions from energy use fall by around 70%, with a fall of approximately 80% in the developed world and 65% in the emerging world. Net Zero In which global energy systems emissions fall by 95% by 2050 versus 2018, in line with a ‘1.5 degrees’ pathwaya. Changes in societal actions and behaviours are a key driver in this scenario. Business-as-usual A continuation of recent trends without major change in the pace or direction of policy tightening; this scenario is not ‘consistent with Paris’ and results in a reduction in global energy greenhouse gas emissions of only 10% by 2050 versus 2018. Our Energy Outlook
12 bp Annual Report and Form 20-F 2020 Some scenarios start from today and project forward over a timeframe in which the current structure of the energy system helps to inform the pace and nature of the transition path. Other scenarios start in the distant future, breaking free from the inherent inertia in the energy system (and potentially our thinking), and look back to the present from that new perspective. In thinking about appropriate scenarios to inform our new strategy, we used both approaches. The scenarios chosen to explore the range of uncertainty surrounding the future of the global energy system span a broad range of energy transition paths. Importantly, the scenarios are not predictions of what is likely to happen or what bp would like to happen. Rather they consider the possible implications of different judgements and assumptions and so help to design a strategy which is resilient to the wide range of uncertainty we face. By considering various time horizons, we can identify key milestones or signposts which might emerge over the next five, 10 or 30 years and inform our view of the key sources of uncertainty affecting the global energy system. We actively monitor for changes in the external environment, and refresh or review our scenarios as needed in response to these signals. How we create scenarios We quantify these scenarios in the bp Energy Outlook 2020 using our global energy modelling system. This comprises of a suite of models developed over the past 10 years to help us understand supply and demand dynamics of the global energy system. The modelling framework uses historical data based on the bp Statistical Review of World Energy, IEA energy balances and a range of other energy and non-energy data sets. The model combines supply, end-use demand, and production in intermediate sectors, including power and hydrogen, to create global energy outlooks. Each scenario is determined by a set of key assumptions including population and economic growth, pace of technological change, resource constraints and government policies. Prices are used to balance supply and demand. The modelling techniques used vary by sector and include a combination of econometric modelling, least-cost optimization, adoption curves and consumer choice modelling. The regional coverage varies by sector but at its most aggregated the model produces views for 14 regions, across six sectors, more than 20 energy and technology sources and associated CO2 emissions from each. It produces annual data out to 2050. Scenarios are generated based on our own judgements alongside views from external organizations. For example, population growth from the United Nations, economic growth supported by views from Oxford Economics, resource availability based on Rystad Energy’s global upstream database, power modelling informed by Aurora Energy Research and global system dynamics based on a proprietary TIMES integrated assessment model. All scenarios typically take into account historical evidence, current policies, user judgement and specialist projections. In developing the scenarios, we benchmark our views against scenarios from external organizations including from the Intergovernmental Panel on Climate Change’s (IPPC) 2019 5
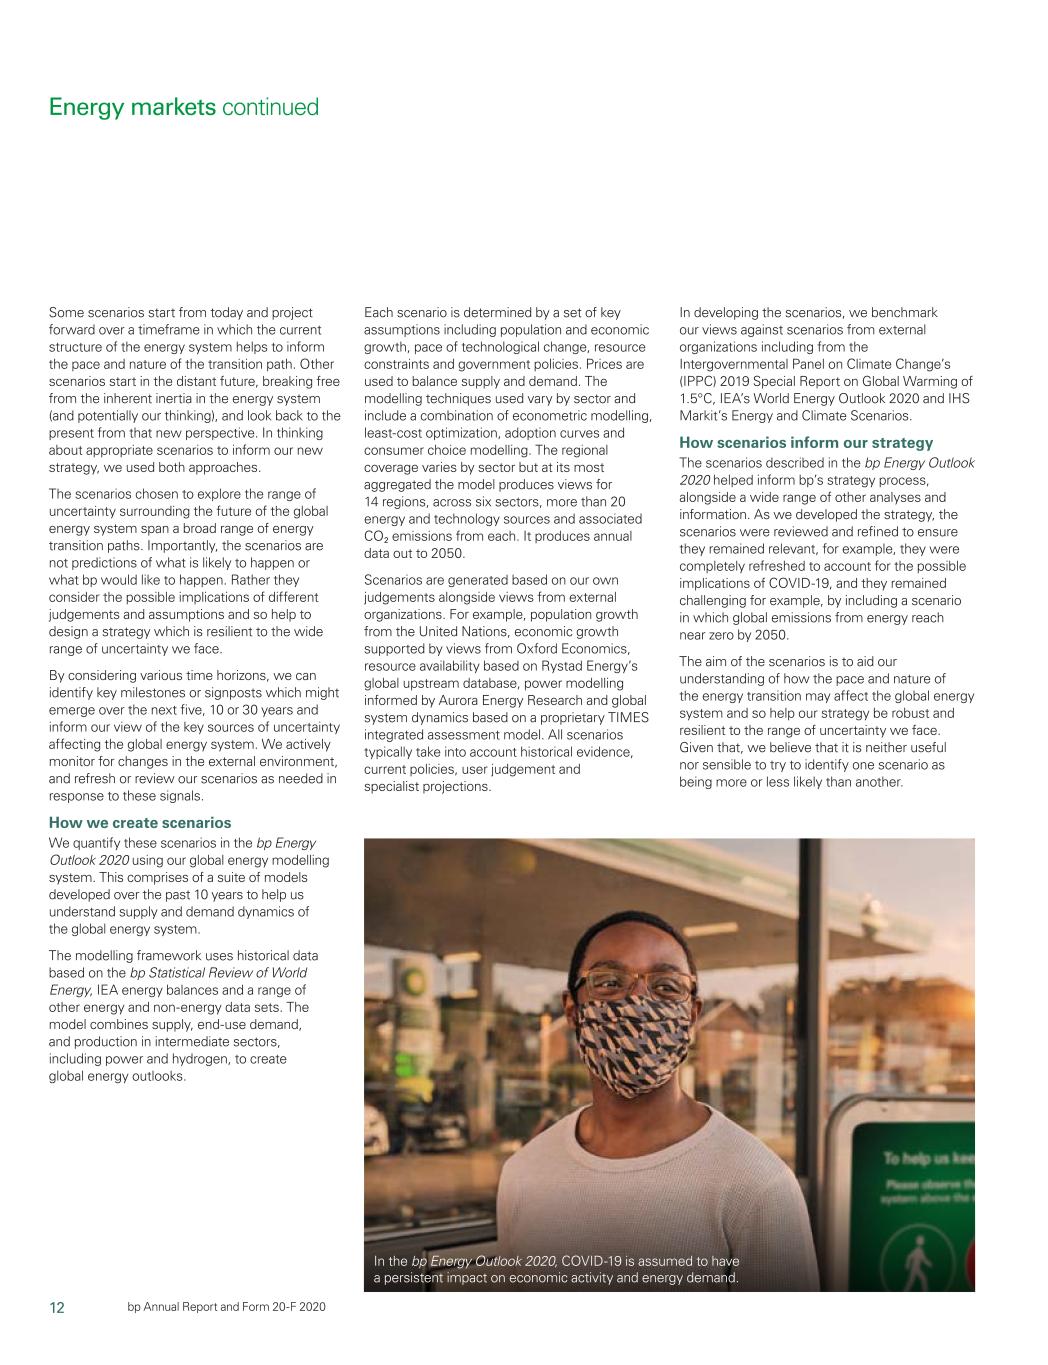
Special Report on Global Warming of 1.5°C, IEA’s World Energy Outlook 2020 and IHS Markit’s Energy and Climate Scenarios. How scenarios inform our strategy The scenarios described in the bp Energy Outlook 2020 helped inform bp’s strategy process, alongside a wide range of other analyses and information. As we developed the strategy, the scenarios were reviewed and refined to ensure they remained relevant, for example, they were completely refreshed to account for the possible implications of COVID-19, and they remained challenging for example, by including a scenario in which global emissions from energy reach near zero by 2050. The aim of the scenarios is to aid our understanding of how the pace and nature of the energy transition may affect the global energy system and so help our strategy be robust and resilient to the range of uncertainty we face. Given that, we believe that it is neither useful nor sensible to try to identify one scenario as being more or less likely than another. Energy markets continued In the bp Energy Outlook 2020, COVID-19 is assumed to have a persistent impact on economic activity and energy demand.
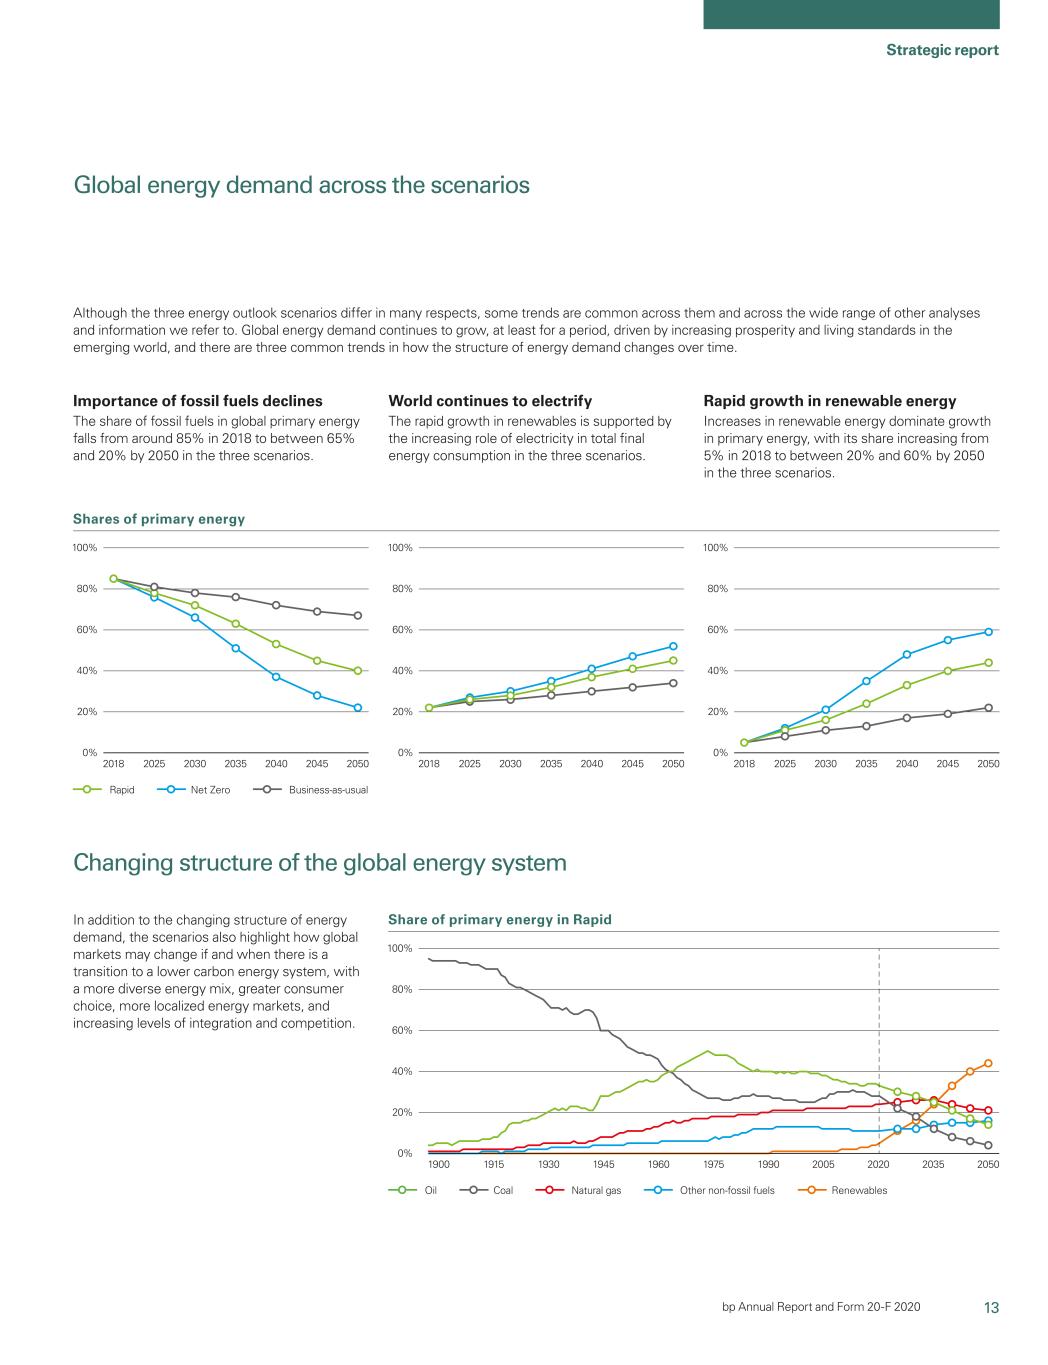
13 Strategic report Shares of primary energy 2040 2045 20502035203020252018 0% 20% 40% 60% 80% 100% Rapid Net Zero Business-as-usual Shares of primary energy 2040 2045 20502035203020252018 0% 20% 40% 60% 80% 100% Rapid Net Zero Business-as-usual Shares of total final comsumption 2040 2045 20502035203020252018 0% 20% 40% 60% 80% 100% Rapid Net Zero Business-as-usual Share of primary energy in Rapid 2035 2050202020051960 1975 19901945193019151900 0% 20% 40% 60% 80% 100% Other non-fossil fuelsOil Coal Natural gas Renewables bp Annual Report and Form 20-F 2020 World continues to electrify The rapid growth in renewables is supported by the increasing role of electricity in total final energy consumption in the three scenarios. Importance of fossil fuels declines The share of fossil fuels in global primary energy falls from around 85% in 2018 to between 65% and 20% by 2050 in the three scenarios. Rapid growth in renewable energy Increases in renewable energy dominate growth in primary energy, with its share increasing from 5% in 2018 to between 20% and 60% by 2050 in the three scenarios. Global energy demand across the scenarios Although the three energy outlook scenarios differ in many respects, some trends are common across them and across the wide range of other analyses and information we refer to. Global energy demand continues to grow, at least for a period, driven by increasing prosperity and living standards in the emerging world, and there are three common trends in how the structure of energy demand changes over time. In addition to the changing structure of energy demand, the scenarios also highlight how global markets may change if and when there is a transition to a lower carbon energy system, with a more diverse energy mix, greater consumer choice, more localized energy markets, and increasing levels of integration and competition. Changing structure of the global energy system
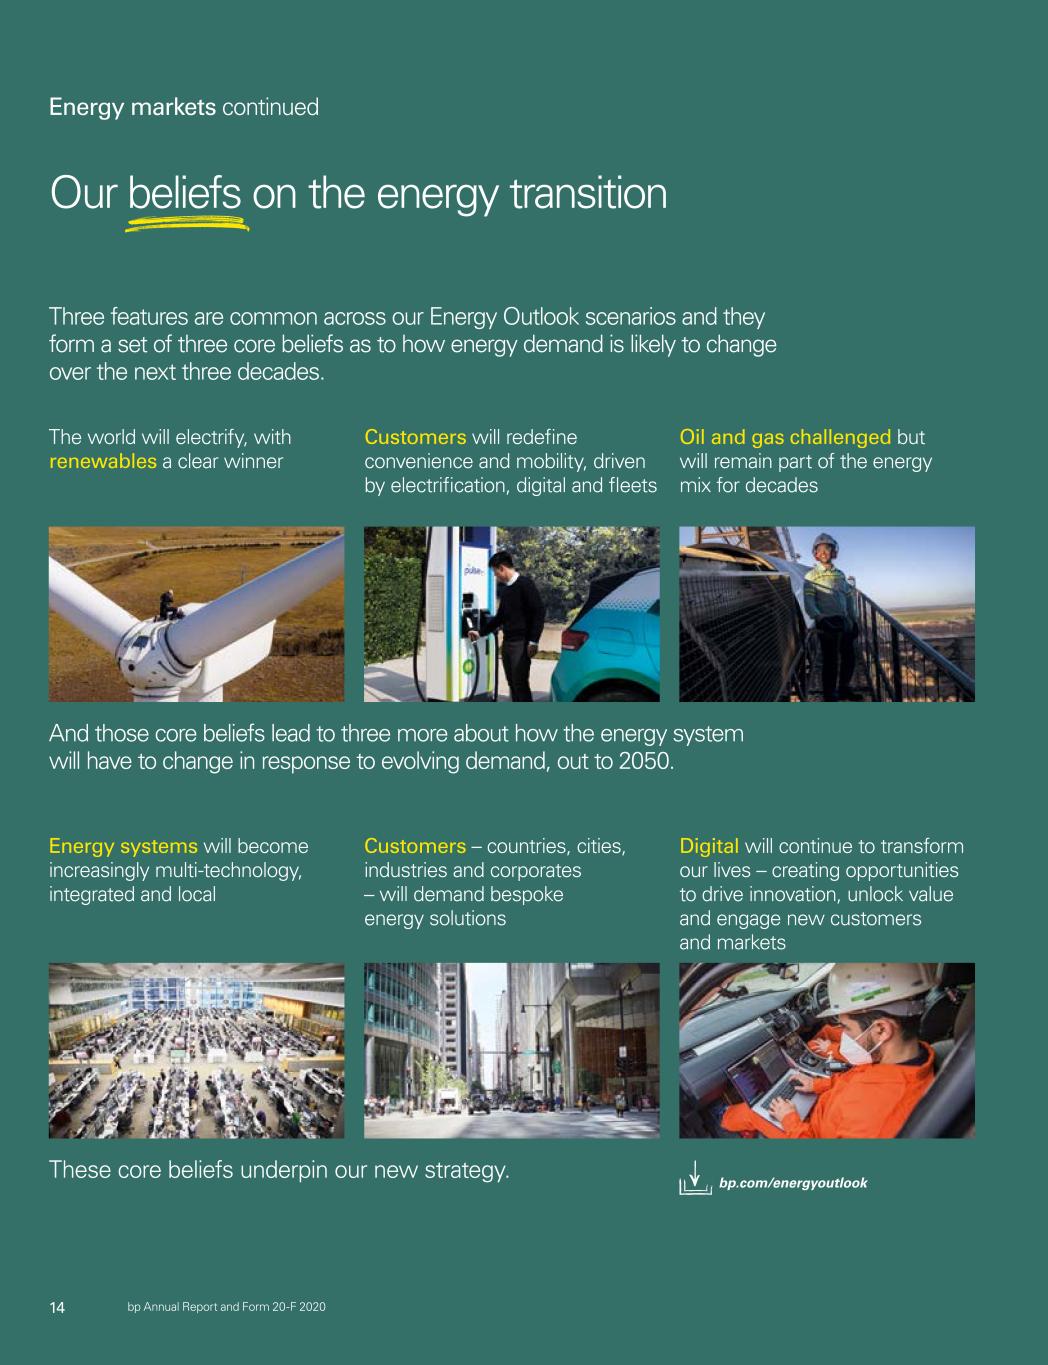
14 bp Annual Report and Form 20-F 2020 Our beliefs on the energy transition Energy markets continued Three features are common across our Energy Outlook scenarios and they form a set of three core beliefs as to how energy demand is likely to change over the next three decades. And those core beliefs lead to three more about how the energy system will have to change in response to evolving demand, out to 2050. These core beliefs underpin our new strategy. bp.com/energyoutlook The world will electrify, with renewables a clear winner Customers will redefine convenience and mobility, driven by electrification, digital and fleets Oil and gas challenged but will remain part of the energy mix for decades Digital will continue to transform our lives – creating opportunities to drive innovation, unlock value and engage new customers and markets Customers – countries, cities, industries and corporates – will demand bespoke energy solutions Energy systems will become increasingly multi-technology, integrated and local
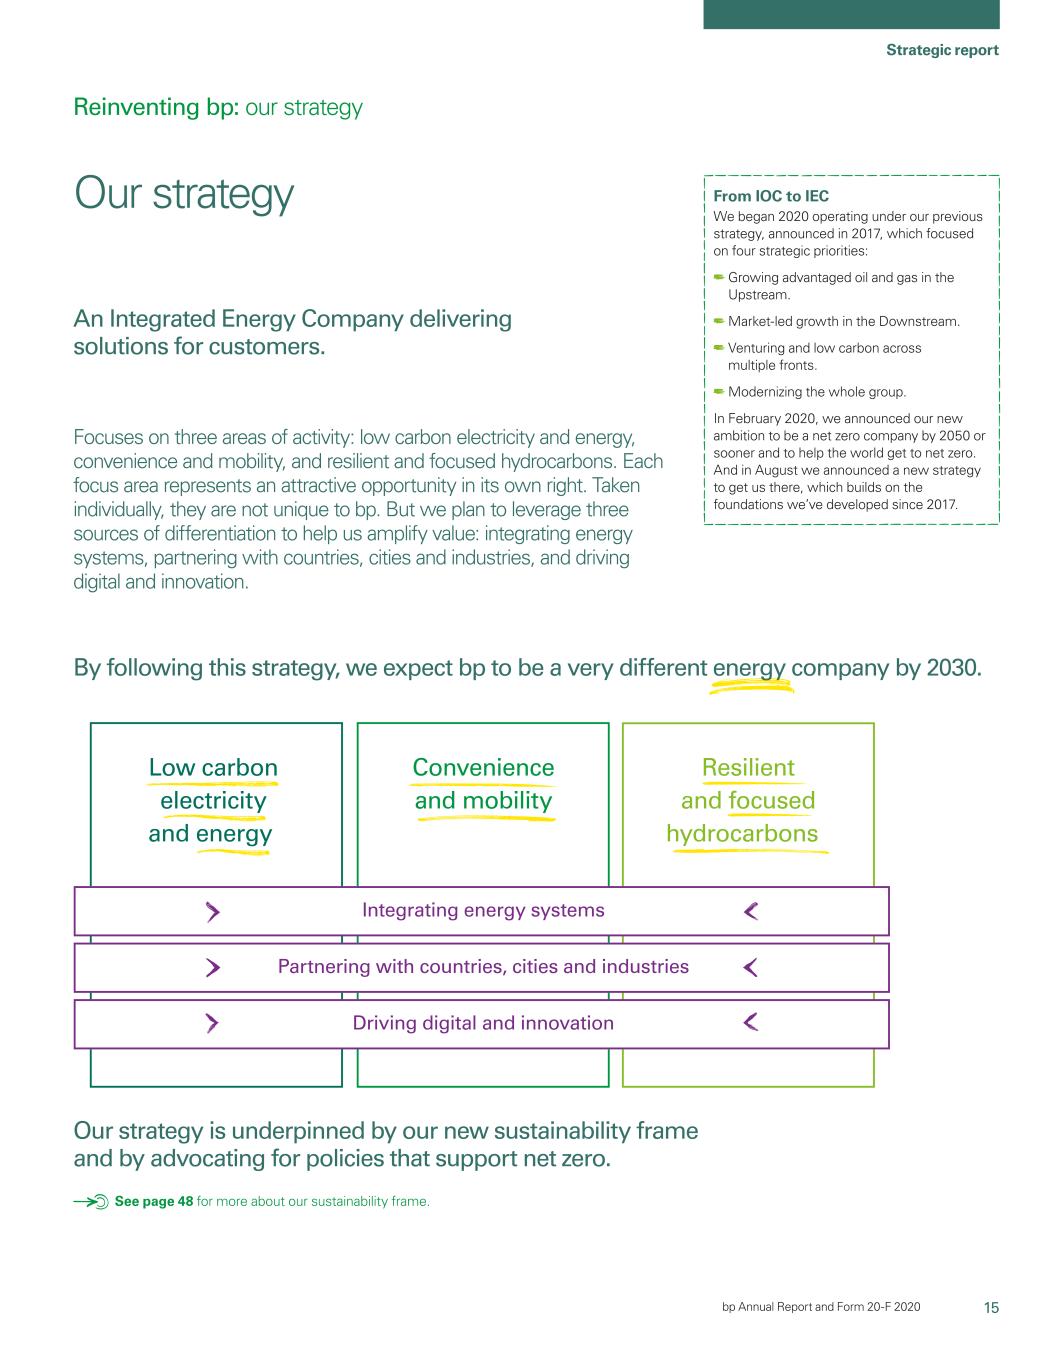
15 Strategic report A sustainability frame linking our purpose and Integrating energy systems Partnering with countries, cities and industries Driving digital and innovation Low carbon electricity and energy Convenience and mobility Resilient and focused hydrocarbons bp Annual Report and Form 20-F 2020 From IOC to IEC We began 2020 operating under our previous strategy, announced in 2017, which focused on four strategic priorities: Growing advantaged oil and gas in the Upstream. Market-led growth in the Downstream. Venturing and low carbon across multiple fronts. Modernizing the whole group. In February 2020, we announced our new ambition is to be a net zero company by 2050 or sooner and to help the world get to net zero. And in August we announced a new strategy to get us there, which builds on the foundations we’ve developed since 2017. See page 48 for more about our sustainability frame. Our ambitionstrategy is underpinned by our ew s stain bility frame and by advocating for policies that support net zero. Our strategy Focuses on three areas of activity: low carbon electricity and energy, convenience and mobility, and resilient and focused hydrocarbons. Each focus area represents an attractive opportunity in its own right. Taken individually, they are not unique to bp. But we plan to leverage three sources of differentiation to help us amplify value: integrating energy systems, partnering with countries, cities and industries, and driving digital and innovation. An Integrated Energy Company delivering solutions for customers. By following this strategy, we expect bp to be a very different energy company by 2030. Reinventing bp: our strategy
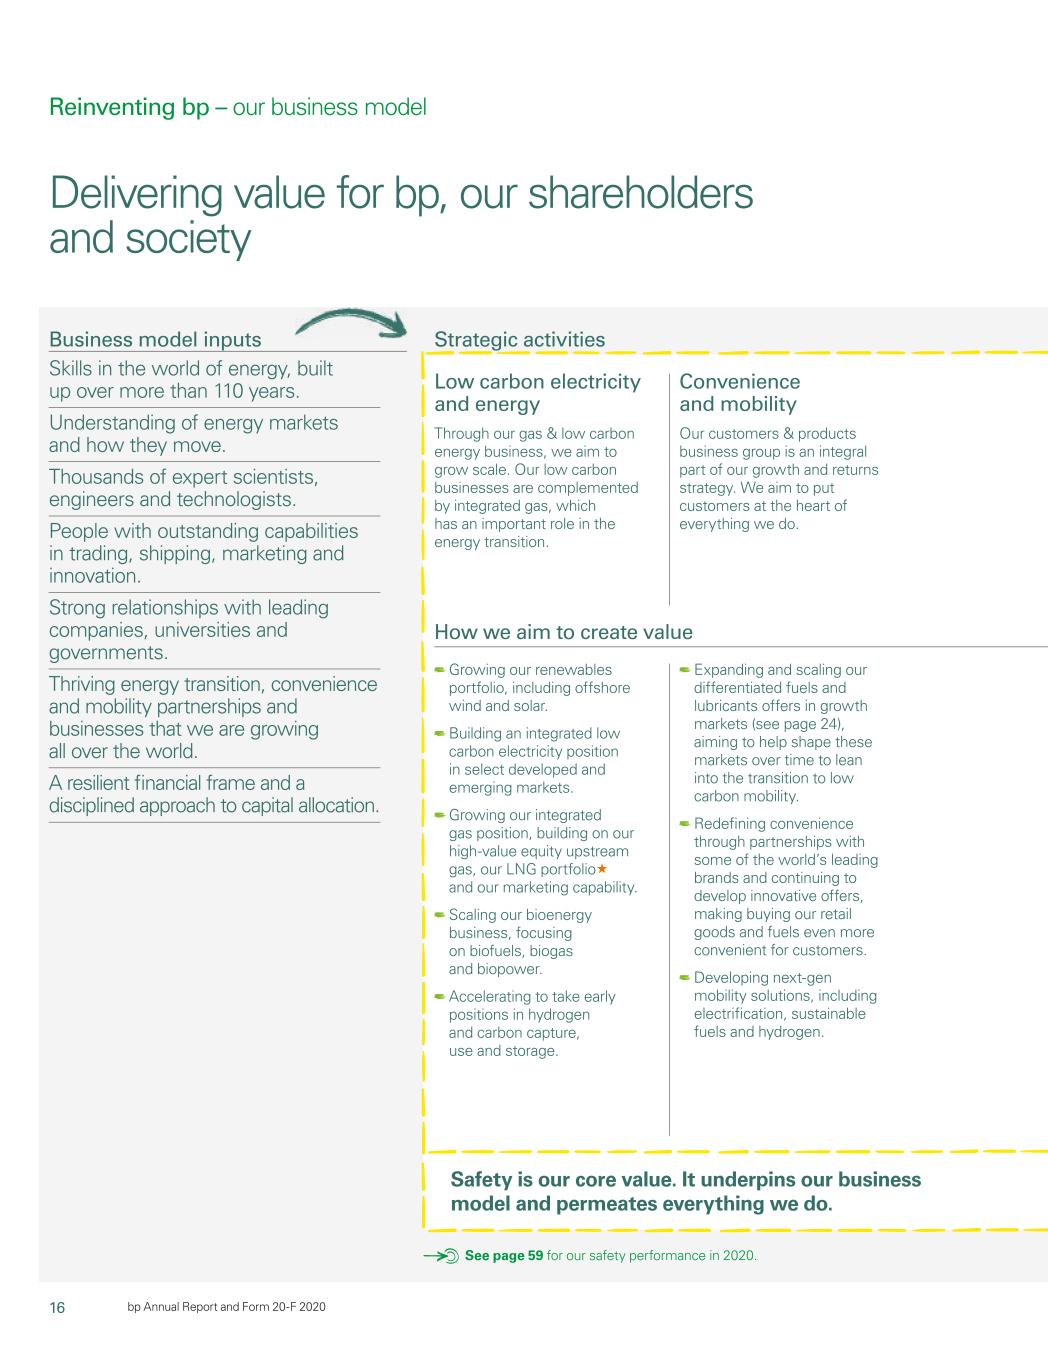
16 bp Annual Report and Form 20-F 2020 Reinventing bp – our business model Business model inputs Skills in the world of energy, built up over more than 110 years. Understanding of energy markets and how they move. Thousands of expert scientists, engineers and technologists. People with outstanding capabilities in trading, shipping, marketing and innovation. Strong relationships with leading companies, universities and governments. Thriving energy transition, convenience and mobility partnerships and businesses that we are growing all over the world. A resilient financial frame and a disciplined approach to capital allocation. Strategic activities How we aim to create value Safety is our core value. It underpins our business model and permeates everything we do. Convenience and mobility Our customers & products business group is an integral part of our growth and returns strategy. We aim to put customers at the heart of everything we do. Low carbon electricity and energy Through our gas & low carbon energy business, we aim to grow scale. Our low carbon businesses are complemented by integrated gas, which has an important role in the energy transition. Expanding and scaling our differentiated fuels and lubricants offers in growth markets (see page 24), aiming to help shape these markets over time to lean into the transition to low carbon mobility. Redefining convenience through partnerships with some of the world’s leading brands and continuing to develop innovative offers, making buying our retail goods and fuels even more convenient for customers. Developing next-gen mobility solutions, including electrification, sustainable fuels and hydrogen. Growing our renewables portfolio, including offshore wind and solar. Building an integrated low carbon electricity position in select developed and emerging markets. Growing our integrated gas position, building on our high-value equity upstream gas, our LNG portfolio« and our marketing capability. Scaling our bioenergy business, focusing on biofuels, biogas and biopower. Accelerating to take early positions in hydrogen and carbon capture, use and storage. Delivering value for bp, our shareholders and society See page 59 for our safety performance in 2020.
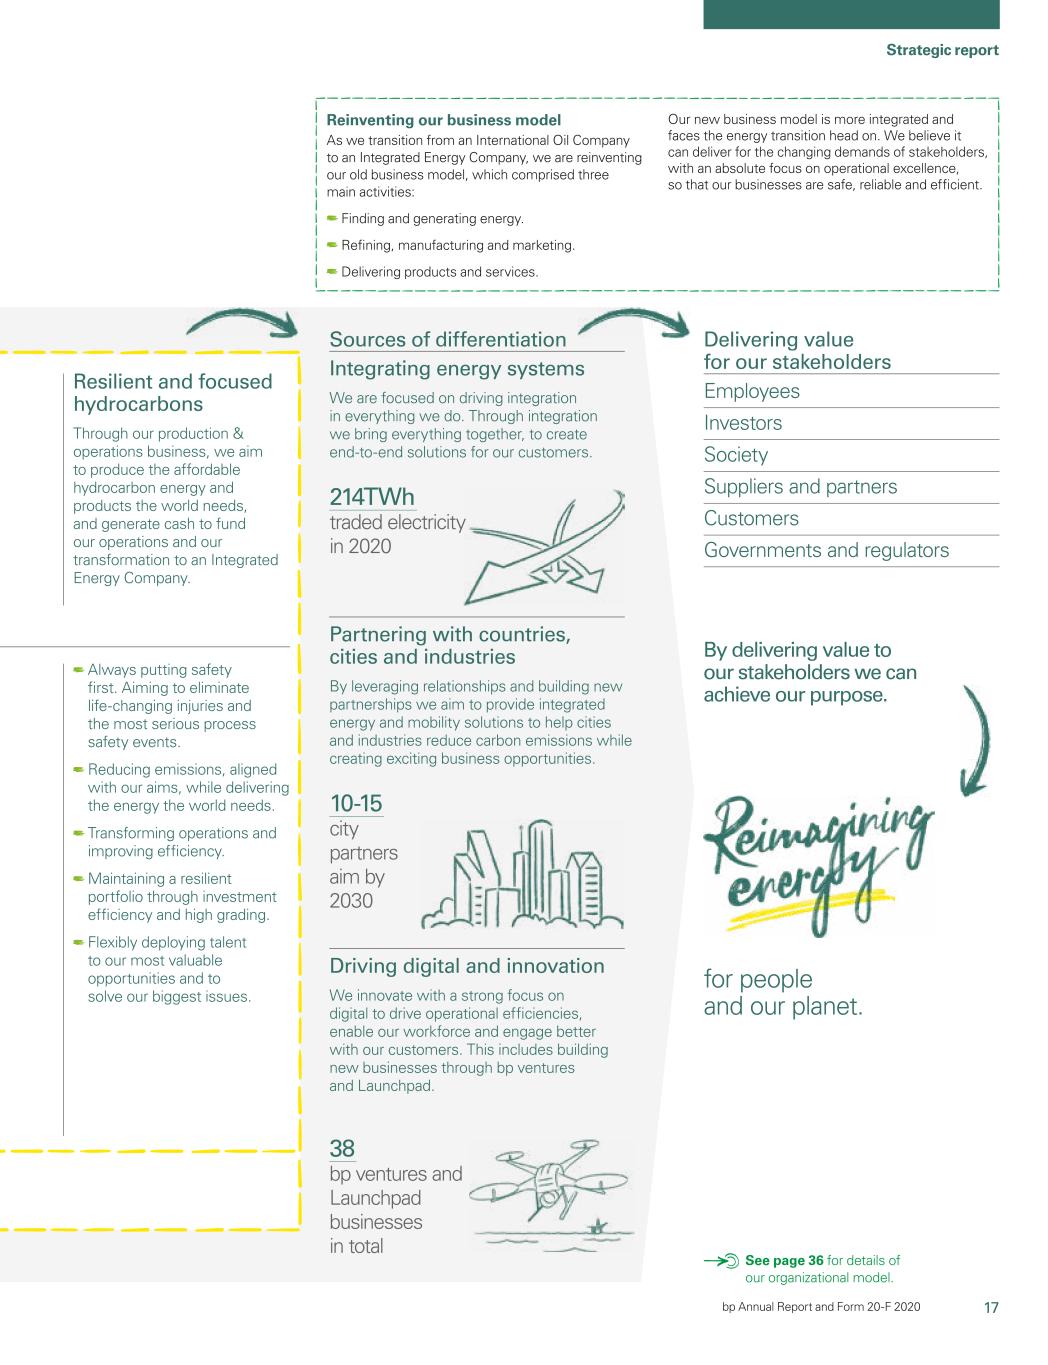
17 Strategic report bp Annual Report and Form 20-F 2020 Sources of differentiation Resilient and focused hydrocarbons Through our production & operations business, we aim to produce the affordable hydrocarbon energy and products the world needs, and generate cash to fund our operations and our transformation to an Integrated Energy Company. Integrating energy systems We are focused on driving integration in everything we do. Through integration we bring everything together, to create end-to-end solutions for our customers. Partnering with countries, cities and industries By leveraging relationships and building new partnerships we aim to provide integrated energy and mobility solutions to help cities and industries reduce carbon emissions while creating exciting business opportunities. Driving digital and innovation We innovate with a strong focus on digital to drive operational efficiencies, enable our workforce and engage better with our customers. This includes building new businesses through bp ventures and Launchpad. Always putting safety first. Aiming to eliminate life-changing injuries and the most serious process safety events. Reducing emissions, aligned with our aims, while delivering the energy the world needs. Transforming operations and improving efficiency. Maintaining a resilient portfolio through investment efficiency and high grading. Flexibly deploying talent to our most valuable opportunities and to solve our biggest issues. 214TWh traded electricity in 2020 10-15 city partners aim by 2030 38 bp ventures and Launchpad businesses in total Reinventing our business model As we transition from an International Oil Company to an Integrated Energy Company, we are reinventing our old business model, which comprised three main activities: Finding and generating energy. Refining, manufacturing and marketing. Delivering products and services. Our new business model is more integrated and faces the energy transition head on. We believe it can deliver for the changing demands of stakeholders, with an absolute focus on operational excellence, so that our businesses are safe, reliable and efficient. Delivering value for our stakeholders Employees Investors Society Suppliers and partners Customers Governments and regulators for people and our planet. By delivering value to our stakeholders we can achieve our purpose. See page 36 for details of our organizational model.

18 bp Annual Report and Form 20-F 2020 Reinventing bp – our strategic focus areas In order to advance our purpose and ambition, we have identified three strategic focus areas, and we’ve set targets and aims against these out to 2025 and 2030. These provide the basis for a common set of enduring objectives for bp as we transform the organization consistent with the long-term energy transition. Some examples of how we performed in 2020 are also set out here. As we deliver our strategy, we will focus on maximizing value through operational and commercial excellence, see pages 36-38 for more information. Strategic focus areas We aim to grow our renewables and bioenergy businesses, seek early positions in hydrogen and carbon capture utilization and storage and strengthen our gas position. These activities form an integrated low carbon portfolio that will help transform bp as we transition from an International Oil Company to an Integrated Energy Company. See page 20 for an example of our strategy in action. Metrics Developed renewables to final investment decision« Bioenergy production«	 LNG portfolio« Traded electricity« We will continue to focus on customers and respond to their changing needs. We aim to redefine convenience and scale up our differentiated offers in growth markets and next-gen mobility solutions, including electrification, sustainable fuels and hydrogen. See page 24 for an example of our strategy in action. Customer touchpoints« Strategic convenience sitesb« Retail sites in growth marketsb« Castrol sales and other operating revenues« Electric vehicle charge pointsa« Margin share from convenience and electrificationb« Our hydrocarbons business is essential to our transformation to an Integrated Energy Company. The cash flow from our oil, gas and refining activities enable our strategy, allowing us to invest in the energy transition and support our two growth areas – low carbon electricity and energy, and convenience and mobility. See page 34 for an example of our strategy in action. Unit production costs« Upstream productionc Upstream plant reliability« Refining throughput Refining availability«
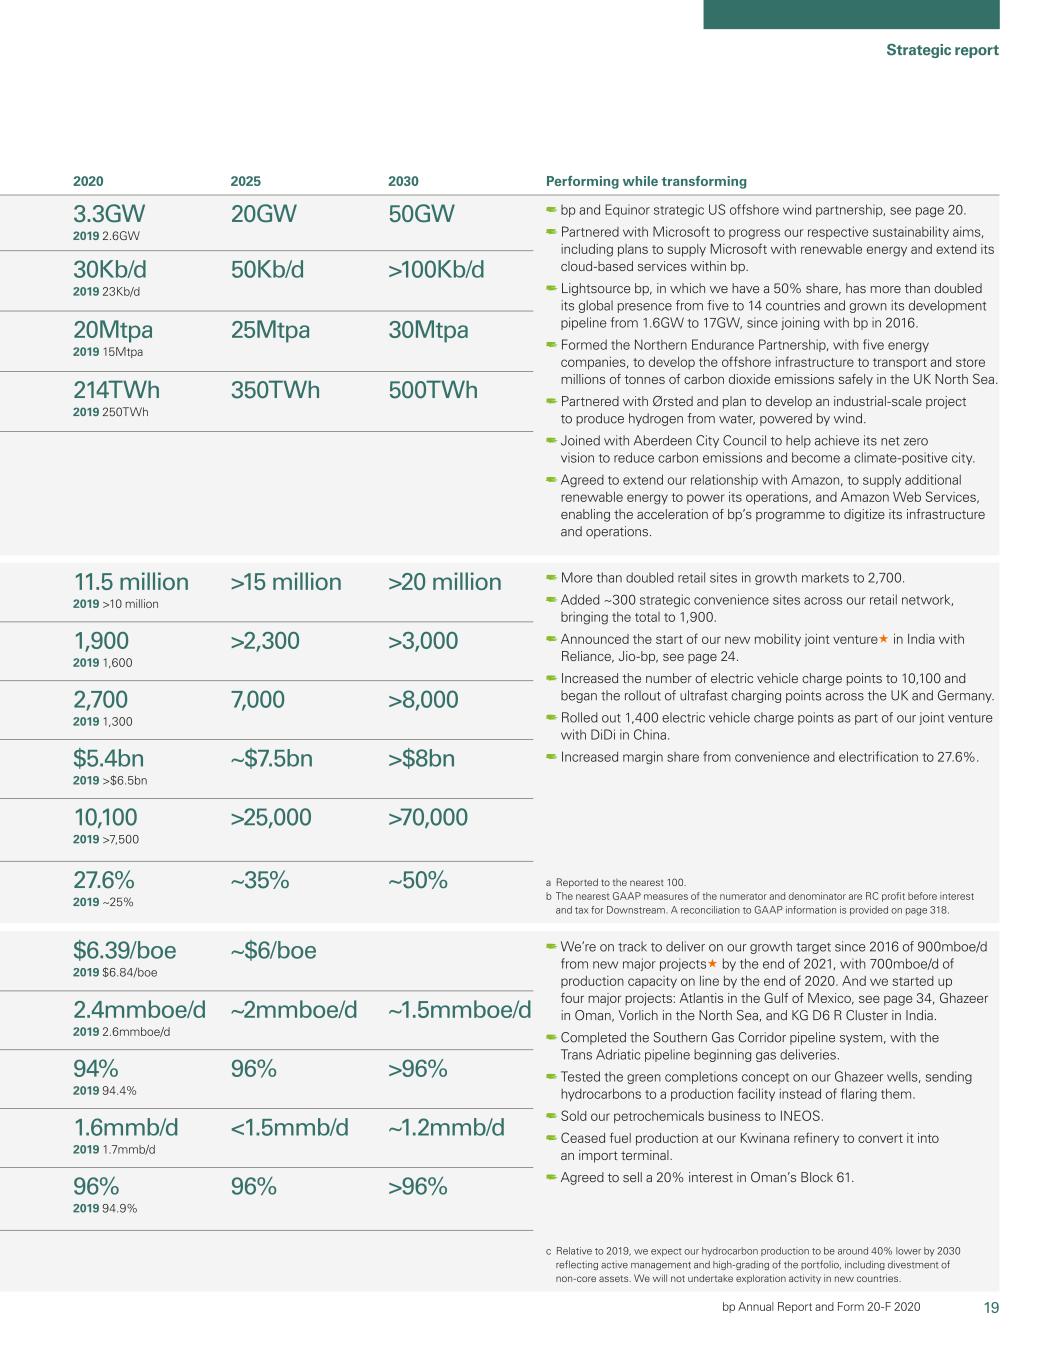
96% <1.5mmb/d 19 Strategic report bp Annual Report and Form 20-F 2020 2030 Performing while transforming2025 50Kb/d 25Mtpa 350TWh >100Kb/d 30Mtpa 500TWh 2020 3.3GW 2019 2.6GW 30Kb/d 2019 23Kb/d 20Mtpa 2019 15Mtpa 214TWh 2019 250TWh 20GW 50GW bp and Equinor strategic US offshore wind partnership, see page 20. Partnered with Microsoft to progress our respective sustainability aims, including plans to supply Microsoft with renewable energy and extend its cloud-based services within bp. Lightsource bp, in which we have a 50% share, has more than doubled its global presence from five to 14 countries and grown its development pipeline from 1.6GW to 17GW, since joining with bp in 2016. Formed the Northern Endurance Partnership, with five energy companies, to develop the offshore infrastructure to transport and store millions of tonnes of carbon dioxide emissions safely in the UK North Sea. Partnered with Ørsted and plan to develop an industrial-scale project to produce hydrogen from water, powered by wind. Joined with Aberdeen City Council to help achieve its net zero vision to reduce carbon emissions and become a climate-positive city. Agreed to extend our relationship with Amazon, to supply additional renewable energy to power its operations, and Amazon Web Services, enabling the acceleration of bp’s programme to digitize its infrastructure and operations. >15 million >20 million >2,300 >3,000 7,000 >8,000 ~$7.5bn >$8bn >25,000 >70,000 ~35% ~50% More than doubled retail sites in growth markets to 2,700. Added ~300 strategic convenience sites across our retail network, bringing the total to 1,900. Announced the start of our new mobility joint venture« in India with Reliance, Jio-bp, see page 24. Increased the number of electric vehicle charge points to 10,100 and began the rollout of ultrafast charging points across the UK and Germany. Rolled out 1,400 electric vehicle charge points as part of our joint venture with DiDi in China. Increased margin share from convenience and electrification to 27.6%. 11.5 million 2019 >10 million 1,900 2019 1,600 2,700 2019 1,300 $5.4bn 2019 >$6.5bn 10,100 2019 >7,500 27.6% 2019 ~25% ~$6/boe ~2mmboe/d ~1.5mmboe/d >96% ~1.2mmb/d 96% >96% We’re on track to deliver on our growth target since 2016 of 900mboe/d from new major projects« by the end of 2021, with 700mboe/d of production capacity on line by the end of 2020. And we started up four major projects: Atlantis in the Gulf of Mexico, see page 34, Ghazeer in Oman, Vorlich in the North Sea, and KG D6 R Cluster in India. Completed the Southern Gas Corridor pipeline system, with the Trans Adriatic pipeline beginning gas deliveries. Tested the green completions concept on our Ghazeer wells, sending hydrocarbons to a production facility instead of flaring them. Sold our petrochemicals business to INEOS. Ceased fuel production at our Kwinana refinery to convert it into an import terminal. Agreed to sell a 20% interest in Oman’s Block 61. $6.39/boe 2019 $6.84/boe 2.4mmboe/d 2019 2.6mmboe/d 94% 2019 94.4% 1.6mmb/d 2019 1.7mmb/d 96% 2019 94.9% c Relative to 2019, we expect our hydrocarbon production to be around 40% lower by 2030 reflecting active management and high-grading of the portfolio, including divestment of non-core assets. We will not undertake exploration activity in new countries. a Reported to the nearest 100. b The nearest GAAP measures of the numerator and denominator are RC profit before interest and tax for Downstream. A reconciliation to GAAP information is provided on page 318.

20 bp Annual Report and Form 20-F 2020 Reinventing bp – our strategy in action

21 Strategic report bp Annual Report and Form 20-F 2020 Low carbon electricity and energy We’re teaming up with Equinor to form a new strategic partnership to develop offshore wind projects in the US. We believe we can achieve more together, working to become leaders in the fastest-growing renewables sector and helping the world get to net zero. What we’re doing The partnership includes development of four assets in two existing offshore wind leases on the US East Coast. And we expect to pursue further opportunities for offshore wind in the US. We’re investing $1.1 billion for a 50% share in two leases: Empire Wind and Beacon Wind. Empire Wind, NY, is expected to have 2GW generating capacity, once operational. Beacon Wind, MA, is expected to have 2.4GW generating capacity, once operational. In January 2021, the Empire Wind 2 and Beacon Wind 1 projects were selected to provide New York State with 2.5GW of power – the biggest US offshore wind award to date – adding to the existing commitment to supply 0.8GW. Why it matters Our strategy aims to increase our annual low carbon investment tenfold by 2030 and rapidly grow our developed renewable generating capacity. The partnership will leverage bp’s trading expertise and onshore wind experience with Equinor’s sector-leading track record in offshore wind, and is expected to deliver value for our shareholders and help the world transition to low carbon energy. Why offshore wind? Offshore wind is growing at around 20% a year globally and is recognized as a core part of reducing global emissions. This was bp’s first ever offshore wind venture and marks an important step in the delivery of our strategy to rapidly grow our renewable electricity and energy portfolio. Building on this progress in 2021, bp and Energie Baden-Wuerttemberg AG (EnBW) were selected as the preferred bidder for two major leases in the UK Offshore Wind Round 4, marking our entry into the largest offshore wind power sector in the world. 2 million Together, these assets have the potential to generate power for more than 2 million US homes. Our partnership with Equinor will play a vital role in allowing us to deliver our aim of rapidly scaling up our renewable energy capacity, and in doing so help deliver the energy the world wants and needs. Dev Sanyal EVP, gas & low carbon energy See pages 24 and 34 for more examples of our strategy in action.
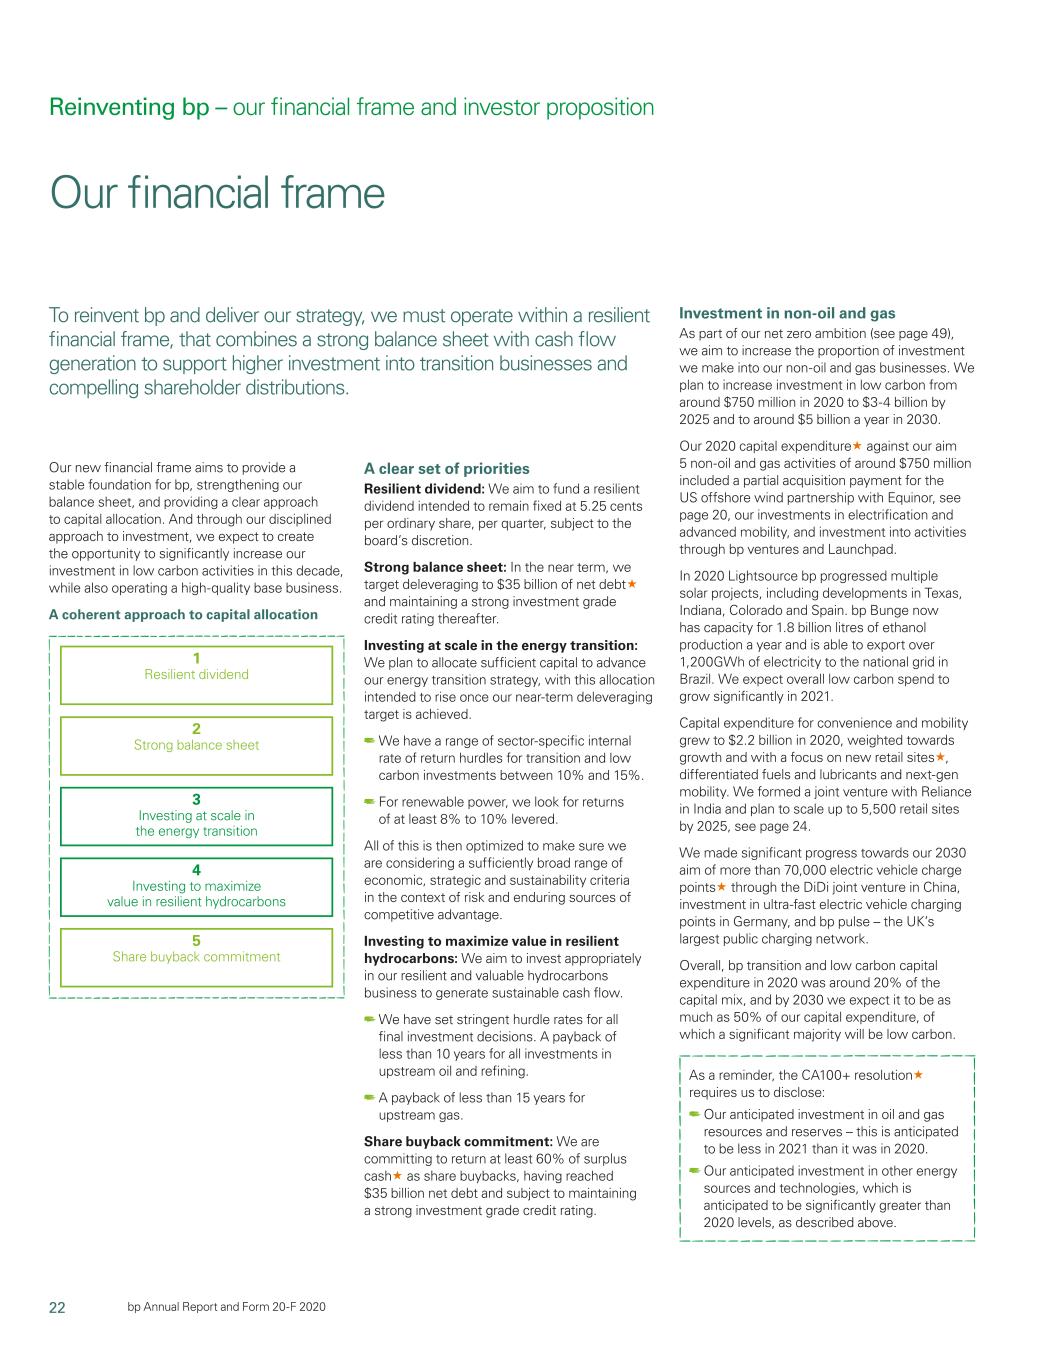
22 bp Annual Report and Form 20-F 2020 Reinventing bp – our financial frame and investor proposition Our new financial frame aims to provide a stable foundation for bp, strengthening our balance sheet, and providing a clear approach to capital allocation. And through our disciplined approach to investment, we expect to create the opportunity to significantly increase our investment in low carbon activities in this decade, while also operating a high-quality base business. A coherent approach to capital allocation A clear set of priorities Resilient dividend: We aim to fund a resilient dividend intended to remain fixed at 5.25 cents per ordinary share, per quarter, subject to the board’s discretion. Strong balance sheet: In the near term, we target deleveraging to $35 billion of net debt« and maintaining a strong investment grade credit rating thereafter. Investing at scale in the energy transition: We plan to allocate sufficient capital to advance our energy transition strategy, with this allocation intended to rise once our near-term deleveraging target is achieved. We have a range of sector-specific internal rate of return hurdles for transition and low carbon investments between 10% and 15%. For renewable power, we look for returns of at least 8% to 10% levered. All of this is then optimized to make sure we are considering a sufficiently broad range of economic, strategic and sustainability criteria in the context of risk and enduring sources of competitive advantage. Investing to maximize value in resilient hydrocarbons: We aim to invest appropriately in our resilient and valuable hydrocarbons business to generate sustainable cash flow. We have set stringent hurdle rates for all final investment decisions. A payback of less than 10 years for all investments in upstream oil and refining. A payback of less than 15 years for upstream gas. Share buyback commitment: We are committing to return at least 60% of surplus cash« as share buybacks, having reached $35 billion net debt and subject to maintaining a strong investment grade credit rating. Investment in non-oil and gas As part of our net zero ambition (see page 49), we aim to increase the proportion of investment we make into our non-oil and gas businesses. We plan to increase investment in low carbon from around $750 million in 2020 to $3-4 billion by 2025 and to around $5 billion a year in 2030. Our 2020 capital expenditure« against our aim 5 non-oil and gas activities of around $750 million included a partial acquisition payment for the US offshore wind partnership with Equinor, see page 20, our investments in electrification and advanced mobility, and investment into activities through bp ventures and Launchpad. In 2020 Lightsource bp progressed multiple solar projects, including developments in Texas, Indiana, Colorado and Spain. bp Bunge now has capacity for 1.8 billion litres of ethanol production a year and is able to export over 1,200GWh of electricity to the national grid in Brazil. We expect overall low carbon spend to grow significantly in 2021. Capital expenditure for convenience and mobility grew to $2.2 billion in 2020, weighted towards growth and with a focus on new retail sites«, differentiated fuels and lubricants and next-gen mobility. We formed a joint venture with Reliance in India and plan to scale up to 5,500 retail sites by 2025, see page 24. We made significant progress towards our 2030 aim of more than 70,000 electric vehicle charge points« through the DiDi joint venture in China, investment in ultra-fast electric vehicle charging points in Germany, and bp pulse – the UK’s largest public charging network. Overall, bp transition and low carbon capital expenditure in 2020 was around 20% of the capital mix, and by 2030 we expect it to be as much as 50% of our capital expenditure, of which a significant majority will be low carbon. Our financial frame As a reminder, the CA100+ resolution« requires us to disclose: Our anticipated investment in oil and gas resources and reserves – this is anticipated to be less in 2021 than it was in 2020. Our anticipated investment in other energy sources and technologies, which is anticipated to be significantly greater than 2020 levels, as described above. To reinvent bp and deliver our strategy, we must operate within a resilient financial frame, that combines a strong balance sheet with cash flow generation to support higher investment into transition businesses and compelling shareholder distributions. 1 Resilient dividend 2 Strong balance sheet 3 Investing at scale in the energy transition 4 Investing to maximize value in resilient hydrocarbons 5 Share buyback commitment
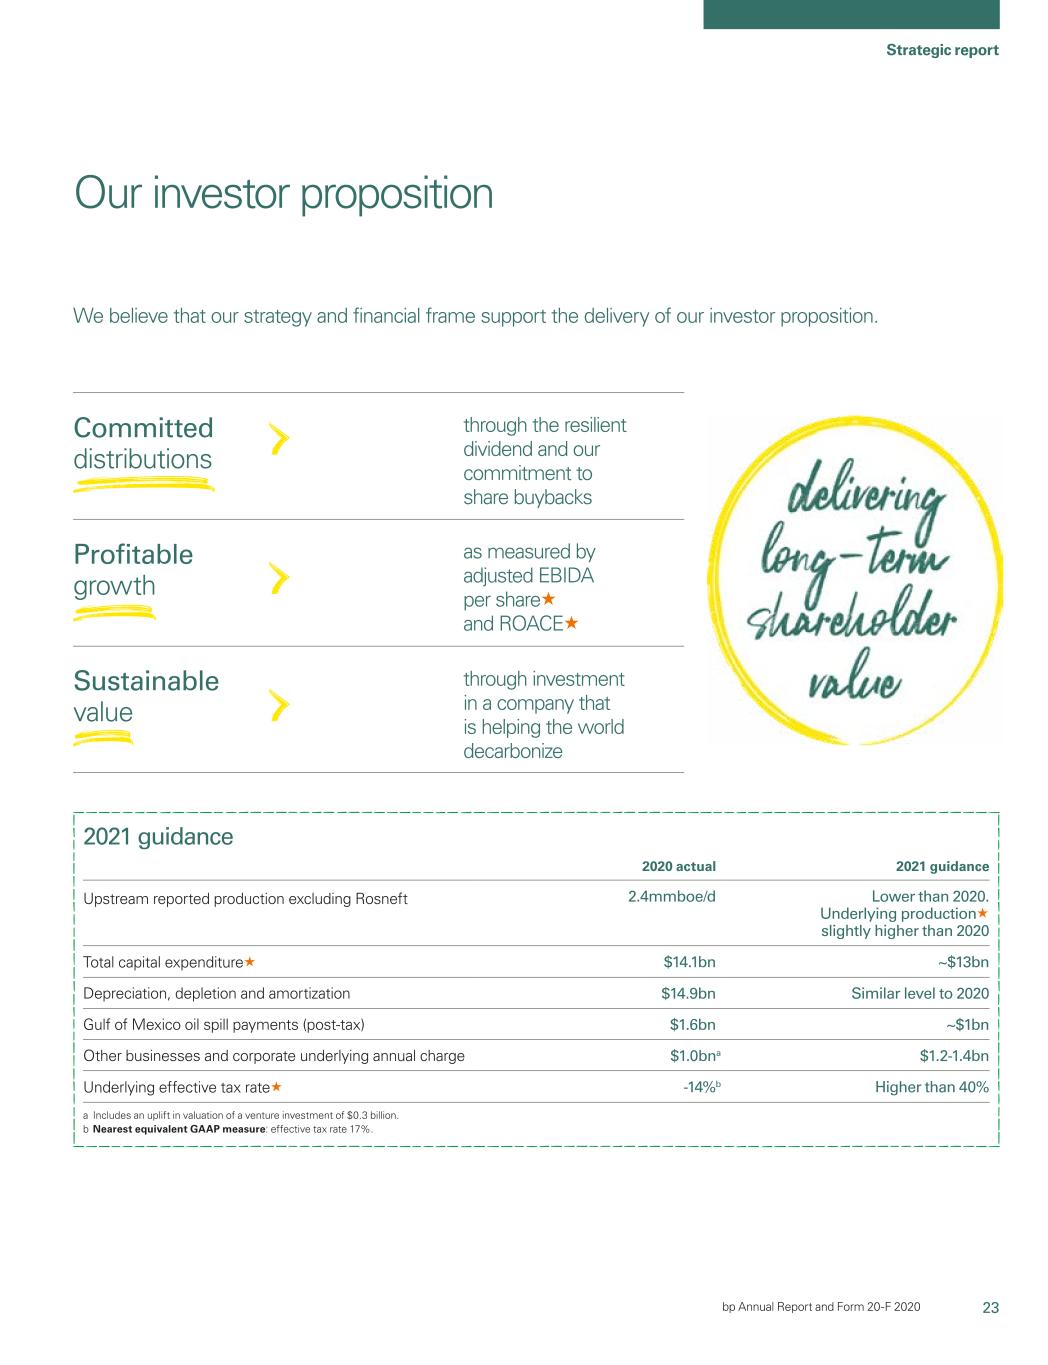
23 Strategic report bp Annual Report and Form 20-F 2020 2021 guidance Our investor proposition 2020 actual 2021 guidance Upstream reported production excluding Rosneft 2.4mmboe/d Lower than 2020. Underlying production« slightly higher than 2020 Total capital expenditure« $14.1bn ~$13bn Depreciation, depletion and amortization $14.9bn Similar level to 2020 Gulf of Mexico oil spill payments (post-tax) $1.6bn ~$1bn Other businesses and corporate underlying annual charge $1.0bna $1.2-1.4bn Underlying effective tax rate« -14%b Higher than 40% a Includes an uplift in valuation of a venture investment of $0.3 billion. b Nearest equivalent GAAP measure: effective tax rate 17%. We believe that our strategy and financial frame support the delivery of our investor proposition. Sustainable value Profitable growth Committed distributions through the resilient dividend and our commitment to share buybacks as measured by adjusted EBIDA per share« and ROACE« through investment in a company that is helping the world decarbonize

24 bp Annual Report and Form 20-F 2020 Reinventing bp – our strategy in action

25 Strategic report bp Annual Report and Form 20-F 2020 Convenience and mobility We aim to become a leading player in India’s fuels and mobility market through our Jio-bp joint venture with Reliance. The joint venture« will bring together Reliance’s market-leading Jio brand presence with bp’s extensive global experience in convenience, fuel retailing and aviation operations. In addition, Castrol lubricants, India’s number one premium lubricant brand, will also be available across the network. What we’re doing Operating under the Jio-bp brand, we expect to grow Reliance’s current fuel retailing network of more than 1,400 retail sites« to 5,500 by 2025. The joint venture also plans to increase its aviation presence from 30 to 45 airports. Why we’re doing it India is set to be one of the fastest- growing fuels and lubricants markets in the world over the next 20 years, with the number of passenger cars forecast to grow nearly six-fold over that period. We see opportunities over time to shape low carbon mobility solutions for customers in India by supporting the electrification of two and three- wheel transport and providing battery management solutions. What sets us apart Jio-bp sites will seek to offer Indian consumers high-quality, differentiated fuels and tailored convenience services, benefiting from bp’s global convenience and mobility experience and Reliance’s scale, access and digital connection to millions of customers. Customers will also have access to loyalty offers and our Castrol lubricants. This new venture is a unique opportunity to build a leading, fast-growing business that can help meet India’s demands and create exciting new digital and low carbon options for the future. Bernard Looney Chief executive officer See pages 20 and 34 for more examples of our strategy in action. 5,500 Jio-bp retail sites expected by 2025
26 bp Annual Report and Form 20-F 2020 Pursuing a strategy that is Responding to increased shareholder interest consistent with the Paris goals In 2019What we mean by Paris consistent We aim to be recognized as a leader in transparency for our sector, in the board recommendedknowledge that The CA100+ resolution, which requires BP Theinvestors and other stakeholders are seeking to understand whether companies and their strategies, targets and aims are consistent with the world needs a rapid transition to net shareholders support a special resolution to respond to a number of different elements, zero and to reimaginemeeting the global energy requisitioned by Climate Action 100+ passed with more than 99%goals of the vote. system.Paris Agreement on Climate Changea (the Paris goals). This presents an opportunity for (CA100+) on climate change disclosures. These responses are contained throughout BPis what we refer to provideas ‘Paris consistency’. We believe the cleaner energy the this annual report. world wants and needs. We see opportunities in helping the The CA100+ resolution, which includes safeguards such as for commercially confidential and world decarbonize through new competitively sensitive information, is on page 337. Key terms relatedan unsustainable path – the carbon budget is running out – and needs to this resolution responsereach net zero greenhouse gas emissions. And we believe that there are a range of global pathways to achieve the Paris goals, with differing implications for regions, industries and sectors, so business modelsstrategies need to be flexible. Our approach to determining Paris consistency is based on three key principles. We believe that our strategy satisfies all three principles and creating cleaner are indicated with and defined in the glossary on page 337. These should be reviewed with cities. We plan to provide more the following information. information on our future strategy and Element of the CA100+ resolution Related content Where near-term plans at our capital markets Strategy thattherefore the board considers in good faith Our strategy 16 day in September 2020.it to be consistent with the Paris goals. For more1. Informed by Paris-consistent energy transition scenarios – a company’s strategy should be informed by Paris-consistent scenarios. We see the Intergovernmental Panel on Climate Change (IPCC) as the most authoritative source of information about howon the evolving science of climate change and we How BP evaluates each new material capex investment Our investment process 19 believeuse it and other sources to inform our current strategy is consistent for consistency withstrategy. The IPCC highlights that there are a range of global pathways by which the world can meet the Paris goals, with differing implications for regions, industries and other outcomes withsectors. For many years to come oil and gas features in the Paris goals, see page 17. relevantenergy mix in the IPCC’s suite of Paris-consistent scenarios, albeit progressively decarbonized and ultimately offset; the exact trajectory for oil and for gas varies from scenario to BP’s strategy. Disclosurescenario. bp’s new strategy is informed by all of BP’s principal metricsthese considerations. It is designed to drive progressive decarbonization, while remaining flexible and relevant Measuring our progress 17 targets or goals overadaptable to the short, medium and long term, consistent withmany different potential pathways the energy transition may take, including various Paris-consistent pathways. 2. Contributing to net zero – whether a company’s strategy enables it to make a positive contribution to the world meeting the Paris goals. Anticipated levels of investment in: Financial framework 18 (i) OilWe believe that bp’s strategy enables us to make just such a contribution. It is designed to deliver value, while advancing bp towards meeting our net zero ambition and gas resources and reserves (ii) Other energy sources and technologies. BP’s targetshelping the world get to promote operational GHG reductions. Sustainability 40 Estimated carbon intensity of BP’s energy products Sustainability 40 and progress over time. Any linkage between above targets and executive pay Directors’ remuneration report 100 remuneration. 2019 annual bonus outcome 105 2020 remuneration: Policy on a page 110 6 BP Annual Report and Form 20-F 2019

Strategic report This is supported by 10 aims, which when taken collectively, setnet zero too. Together, we believe this sets out a path that we believe is consistent with the Paris goals. Five aimsThere are many different ways in which a company at the heart of the energy sector can make a meaningful contribution – including action on greenhouse gas emissions (GHG) measured by emissions metrics like Scope 1, 2 and 3. Paris consistency also includes consideration of a range of other activities, such as technology development, policy advocacy, low carbon collaboration and investments in low carbon. Our strategy seeks to get BP to net zero Aim 1 is toaddress all of these by reshaping bp’s business around our three focus areas and three sources of differentiation, see page 15. Some ways of contributing are more readily measured by quantitative metrics than others – but all can be net zero Aim 2 is to be net zero on Aim 3 is to cutimportant, whether or not they translate into GHG reductions for the company. To illustrate this, in terms of low carbon Aim 4 is to install methane Aim 5 isinvestment, by 2030 we aim to increase the acrossamount of renewable energy generating capacity we have developed to 50GW, as part of our entire operations an absolute basis across intensity of the products measurement at all our proportion of investmentincreased capital expenditure on an absolute basis by thelow carbon in our upstream we sell by 50% by 2050 or existing major oil and gas we make into our non-oil 2050 or sooner.businesses. This aim oil and gas productionsupports the Paris goals by sooner. Thisincreasing the low carbon options available to energy consumers. However, it does not reduce our Scope 1, 2 or 3 emissions. And it may not result in a decrease in the overall intensity of bp’s marketed products, because that is dependent on the extent to which we market the resulting renewable power, which is a lifecycle processing sitescommercial consideration. Additionally, our strategy is underpinned by 2023, and gas businesses. Over relates to Scope 1 and 2 GHG 2050 or sooner. Thisour aim carbon intensity approach, publish the data, and then time, as investment goes up emissions. relates to Scope 3 emissions, per unit of energy. It covers drive a 50% reduction in in low and no carbon, we see and is on a BP equity share marketing sales of energy methane intensity of our it going down in oil and gas. For more on our basis excluding Rosneft. products and potentially, in operations. And we will work operational emissions, future, certain other products to influence our joint ventures see Sustainability, See Sustainability, e.g. associated with land to set their own methane page 40. page 40. carbon projects. intensity targets of 0.2%. See Sustainability, See Modernizing the page 40. whole group, page 31. Five aims to help the world get to net zero Aim 6 is to more actively Aim 7 is to incentivize our Aim 8 is to set new Aim 9 is to be recognized Aim 10 is to launch a new advocate for policies that global workforce to deliver expectations for our as an industry leader for team to create integrated support net zero, including on our aims and mobilize relationships with trade the transparency of our clean energy and mobility carbon pricing. Helping policy makers to design and put in place low carbon policies can help deliver our strategy and take advantage of the huge opportunities associated with achieving the Paris goals. Well-designed low carbon policies can advance the decarbonization of a whole economy – something potentially of far greater impact than anything a single company can achieve through its own portfolio. 3. Strategic resilience – a Paris-consistent strategy should position the company for success and resilience in a Paris-consistent world – a world that is progressing on one of the many global trajectories considered to be Paris consistent, and ultimately meets the Paris goals. We will thembelieve this means having a strategy that’s flexible enough to become advocates associations aroundmanage the reporting. On 12 February solutions. The team will stop corporate reputation for net zero. This will include globe.inherent uncertainty in the range of potential global pathways, including those that can achieve the Paris goals. Our new strategy is designed to provide this flexibility. In setting the strategy, the board and management referred to the range of scenarios set out in the bp Energy Outlook 2020, see page 11. We will makesee huge opportunity in the 2020,energy transition, including the Outlook’s ‘Rapid’ and ‘Net Zero’ scenarios, which we declared our support help countries, cities and advertising campaigns and increasing the percentage case for our views onbelieve are two of many possible Paris-consistent pathways for the recommendations of corporations aroundworld. Our strategy also mitigates the re-direct resources to promote of remuneration linked to climate change within the the Task Force on Climate- world decarbonize. well-designed climate policies. emissions reductions for associations we belong to and related Financial Disclosures In future, any corporate leadership and around we will be transparent where (TCFD). We intend to work advertising will be to push 37,000 employees. we differ. And where we can’t constructivelyrisks associated with the TCFD for progressive climate policy; reach alignment, we will be and others –a scenario such as the See Directors’ communicateOutlook’s ‘Delayed and Disorderly’ transition. As a result, our net zero preparedstrategy is designed to leave. Sustainability Accounting remuneration report, ambition; invite ideas; or build Standards Board – to develop page 100. See Sustainability, collaboration. We will continue good practices and standards page 49 and bp.com/ to run recruitment campaigns for transparency. tradeassociations. and advertise our products, See Sustainability, services and partnerships – page 44. although we aim for these to increasingly be low carbon. See bp.com/sustainability. BP Annual Report and Form 20-F 2019 7

2019 at a glance Our scale, our reach and range of activities, from exploration to refining and biofuels to solar, make us a truly global energy provider. This section gives an overview of BP’s structure, scale and performance in 2019. For details of our future structure, see pages 15 and 80. Upstream Responsible for oil and natural gas exploration, field development and production, gas and power marketing and trading activities. Replacement cost (RC) profit Underlying RC profit before interest and tax before interest and tax $4.9bn $11.2bn (2018 $14.3bn) (2018 $14.6bn) Rosneft We have a 19.75% shareholding in Rosneft, one of Russia’s largest oil and gas companies, which has both upstream and downstream operations. RC profit before Underlying RC profit interest and tax before interest and tax $2.3bn $2.4bn (2018 $2.2bn) (2018 $2.3bn) Other businesses and corporate Downstream Comprises our Alternative Energy business as Comprises the manufacturing and marketing of fuels, lubricants, and well as a number of corporate activities. petrochemicals, as well as our oil integrated supply and trading function. RC loss before Underlying RC loss RC profit before Underlying RC profit interest and tax before interest and tax interest and tax before interest and tax $(2.8)bn $(1.3)bn $6.5bn $6.4bn (2018 $(3.5)bn) (2018 $(1.6)bn) (2018 $6.9bn) (2018 $7.6bn) 8 BP Annual Report and Form 20-F 2019

Strategic report Scale Performance Advancing low carbon Weresilient across scenarios, including those that are an integrated energy business. We Our 2019 performance has helped us We are committed to advancing a low carbon have operations in Europe, North and South deliver for our shareholders and other future. We will aim to dramatically reduce America, Australasia, Asia and Africa. stakeholders, including energy carbon in our operations and in our production, consumers worldwide. and grow new lower carbon businesses, products and services. 70,100 98 >20 employees tier 1 and 2 process safety events years in renewable businesses (2018 73,000) (2018 72) KPI 79 $4.0bn >$500m countries profit attributable to BP shareholders invested in low carbon activities in 2019 (2018 78) (2018 $9.4bn) 19,341 $10.0bn >7,50 0 million barrels of oil equivalent – underlying RC profit BP Chargemaster charging points in the UK group proved hydrocarbon reservesa (2018 $12.7bn) KPI (2018 19,945mmboe) 18,900 94.9% 13 retail sites downstream refining availability countries where Lightsource BP (2018 18,700) (2018 95.0%) KPIParis consistent, but is active 3.8 million barrels of oil equivalent per day – group hydrocarbon productiona (2018 3.7mmboe/d) a On a combined basis of subsidiaries and equity-accounted entities. KPI See key performance indicators on page 32. BP Annual Report and Form 20-F 2019 9

Global context Many forces and trends are fundamentally changing the business environment, creating uncertainties and influencing the way we operate. We monitor these trends closely and explore the forces shaping the global energy transition. Megatrends BP Energy Outlook 2019 The exact pace and nature of the Our Outlook explores the forces shaping the Scenarios energy transition is unclear, but it global energy transition out to 2040 and the • Evolving transition: assumes that government is clear that the market for our key uncertainties surrounding it. The 2019 policies, technology and social preferences products is changing. Megatrends Outlook considers a range of scenarios. They continue to evolve in a manner and speed seen affecting our industry include: have some common features, such as ongoing over the recent past. • Rapid transition: envisages a more rapid economic growth and a shiftweighted towards a lower Growing global concern over transition to a lower carbon energy system, carbon fuel mix, but differ in terms of policy, climate change through a reduction in emissions stemming from technology and behavioural assumptions. greater energy efficiency, fuel switching and use Rapidly advancing digital of carbon capture, use and storage (CCUS). technology, affecting all For more information see bp.com/energyoutlook. aspects of economic activity The BP Energy Outlook 2020 will be published Increasing prosperity in the later in the year. emerging world driving Global carbon emissions economic growth (GtCO2) Changing societal expectations 50 of corporations 45 Shifting geopolitical trends as 40 trade, economies and 35 relationships change over time 30 25 Growing global concern over 20 climate change is a key driving 15 force among these trends. The 10 way the world responds to this, 5 and the resulting impact on the energy sector, is the most 0 1970 1980 1990 2000 2010 2020 2030 2040 significant uncertainty we face. Evolving transition Rapid transition Source: BP Energy Outlook 2019 10 BP Annual Report and Form 20-F 2019

Strategic report The transition envisaged in the 2019 Outlook The world economy continues to grow, Demand for energy is set to But carbon emissions need to fall sharply driven by increasing prosperity grow significantly • There is a growing commitment around • The global population grows by 1.7 billion, • Global energy demand increases by about the world to move to a pathway consistent reaching close to 9.2 billion people in 2040. 20-35% by 2040 in the different scenarios. with meeting the climate goals of the • The global economy more than doubles over • The vast majority of demand growth comes Paris Agreementa. the next 25 years, with twice as much from developing economies to support their • To help achieve this, the world needs to economic activity in 2040 than we see today. industry and infrastructure and allow living transition to a lower carbon energy system. • The emergence of a large and growing standards to keep improving. middle class, particularly in emerging Asia, is an increasingly important force shaping growth and energy trends. The key dimensions of the energy transition To meet the Paris goals, we believe the world must take strong action on a range of fronts. The pace at which the transition can be achieved and the precise mix of elements Improving energy efficiency, to Switching to lower or zero carbon liquid is uncertain. decouple energy demand growth and gaseous fuels, particularly in areas There are many possible pathways to meeting from growing prosperity. such as heavy transport. the Paris goals and we use different scenarios Rapid growth in renewable energy and Deploying carbon-removal technologies, to explore this uncertainty. When we evaluate other low or zero carbon energy sources. such as CCUS, at scale. therapid transition. Reinventing bp – consistency of our new material capex investments with the Paris goals we Increasing the share of electricity in Promoting natural climate solutions, consider a range of different possible final energy use and decarbonizing including the management and restoration pathways and scenarios, see page 21. power generation. of habitats, and the role of carbon credits. a Paris Agreement: (1)Agreement 1 Article 2.1(a) of the Paris Agreement states the goal of ‘Holding‘Holding the increase in the global average temperature to well below 2°2°C above pre-industrial levels and pursuing efforts to limit the temperature increase to 1.5°1.5°C above pre-industrial levels, recognizing that this would significantly reduce the risks and impacts of climate change.’ (2)change’. 2 Article 4.1 of the Paris Agreement: In order to achieve the long-term temperature goal set out in Article 2, parties aim to reach global peaking of greenhouse gas emissions as soon as possible, recognizing that peaking will take longer for developing country parties, and to undertake rapid reductions thereafter in accordance with best available science, so as to achieve a balance between anthropogenic emissions by sources and removals by sinks of greenhouse gases in the second half of this century, on the basis of equity, and in the context of sustainable development and efforts to eradicate poverty. BP
27 Strategic report bp Annual Report and Form 20-F 2020 Responding to increased shareholder interest on Paris consistency In 2019 11

the board recommended that shareholders support a special resolution requisitioned by Climate Action 100+ (CA100+) on climate change disclosures. The changing energy mix Increased demandCA100+ resolution passed with more than 99% of the vote. This is the second year we have included responses throughout the annual report. We have adopted a similar approach to the bp Annual Report and Form 20-F 2019. The CA100+ resolution, which includes safeguards such as protections for energycommercially confidential and competitively sensitive information, is likelyon page 341. Key terms related to this resolution response are indicated with « and defined in the glossary on page 341. These should be reviewed with the following information. Element of the CA100+ resolution Related content Where Strategy that the board considers in good faith to be Primary energy consumption by fuel metconsistent with the Paris goals. Our strategy Pursuing a strategy that is consistent with the Paris goals 15 26 How bp evaluates each new material capex investment« for consistency with the Paris goals and other outcomes relevant to bp strategy. Our investment process 29 Disclosure of bp’s principal metrics and relevant targets or goals over the coming decades throughshort, medium and long term, consistent with the Paris goals. Key performance indicators Sustainability: net zero targets and aims See ‘TCFD metrics and targets’ for an overview 39 49 55 Anticipated levels of investment in: (i) Oil and gas resources and reserves. (ii) Other energy sources and technologies. Our financial frame 22 bp’s targets to promote operational GHG reductions. Sustainability: net zero targets and aims 49 Estimated carbon intensity of bp’s energy products and progress over time. Sustainability: aim 3 50 Any linkage between above targets and executive pay remuneration. Directors’ remuneration report 2020 annual bonus outcome 2021 remuneration policy on page 103 110 124 Portfolio resilience We are managing our portfolio to be resilient to the uncertainties surrounding the energy transition. By 2030 we expect to have a Exajoules (EJ) diverse range of supplies including renewable 85% energy,smaller, more resilient and focused oil and natural gas. 800 2040gas portfolio. This is supported by our evaluation of primary energyeach new material capex investment for Paris consistency and our long-term price assumptions, which were reviewed in June 2020. We lowered our price assumptions and extended them to 2050 so that they are now consistent with our long-term time planning horizon, see page 28. We are building a portfolio that is more robust in a low carbon world. We believe that the diversification of our portfolio and decarbonizing our hydrocarbons business will make bp more resilient to Paris-consistent pathways. And this will allow us to continue to redeploy capital to support our strategy to become an Integrated Energy Company – aiming to deploy an appropriate mix of cash flow from hydrocarbons and capital released by divestments into ambitious plans for growth is from renewables and The energy mix is shifting as the transition to a 700 natural gas in our ‘evolving lowerlow carbon, convenience and mobility businesses, see page 18. Scale and reach Our global footprint and interests in multiple sources of energy system continues,provide resilience through exposure to different price environments, and our presence in over 70 countries enables access to new markets. Our track record of creating mutually beneficial strategic partnerships helps our resilience, and we are building new and deeper relationships with transition’ scenario renewablegovernments, cities and corporate customers at a scale that we believe is difficult for others to replicate. Our presence across the energy value chain and natural gas gainingour ability to provide integrated energy solutions for our customers position us to succeed in 600 importance relativea Paris-consistent world. Targets and aims Our strategy is supported by clear business plans, underpinned by specific short, medium and long-term targets and aims for 2025, 2030 and 2050 or sooner, including: Aiming to be net zero across our entire operations (Scopes 1 and 2). Aiming for the carbon in our upstream oil and coal. 500 Scenarios • Evolving transition:gas production (Scope 3) to be net zero. Aiming to cut the life cycle carbon intensity of our marketed products by 50% (which includes the associated Scope 3 emissions). From a 2019 baseline, we aim to increase our annual low carbon investment ten-fold to around $5 billion a year, building out an integrated portfolio of low carbon technologies, including renewables, bioenergy and natural 400 gas account for almost 85% of the growthearly positions in 300 primary energy by 2040, with their importance increasing relative to all other 200 sources of energy. • Rapid transition: renewable energy grows 100 rapidly, accounting for more than the entire increase in primary energy by 2040 –hydrogen and a 0 2017 Evolving Rapid sharp contraction in the use of coal. The transition transition level of oil consumption falls, but gas Renew* Nuclear Gas continues to grow aided by increasing use Hydro Coal Oil of carbon capture, use and storage (CCUS). * Renewables includes wind, solar, geothermal, biomass and biofuels Source: BP Energy Outlook 2019 What this means forOver the same period, our oil and gas The BP Energy Outlook 2019 considers a range Demand and supplyproduction is expected to reduce by at least 1 million barrels of oil of scenarios for oil demand, with the timing of (Mb/d) the peak in demand varyingequivalent a day, or 40%, from the next few 140 years to beyond 2040. Despite these differences, the scenarios 120 share two common features. First, they each suggest that oil will continue to play a 100 significant role in the global energy system in 2040, with the level of oil demand in 2040 80 ranging from around 80Mb/d to 100Mb/d. Second, significant levels of investment are 60 required for there to be sufficient supplies of oil to meet demand in 2040. 40 Similarly there is a wide range of uncertainty 20 in relation to the role of gas in the energy mix even in scenarios that achieve the Paris goals, 0 with different organizations using significantly 1970 1980 1990 2000 2010 2020 2030 2040 different assumptions. Those with a higher Evolving transition �Supply with no investments in new fields proportion of CCUS see a higher demand for Rapid transition gas, and in the outlook’s ‘rapid transition’ scenario, close to a third of natural gas in Source: BP Energy Outlook 2019 2040 is being used in conjunction with CCUS. 12 BPlevels.
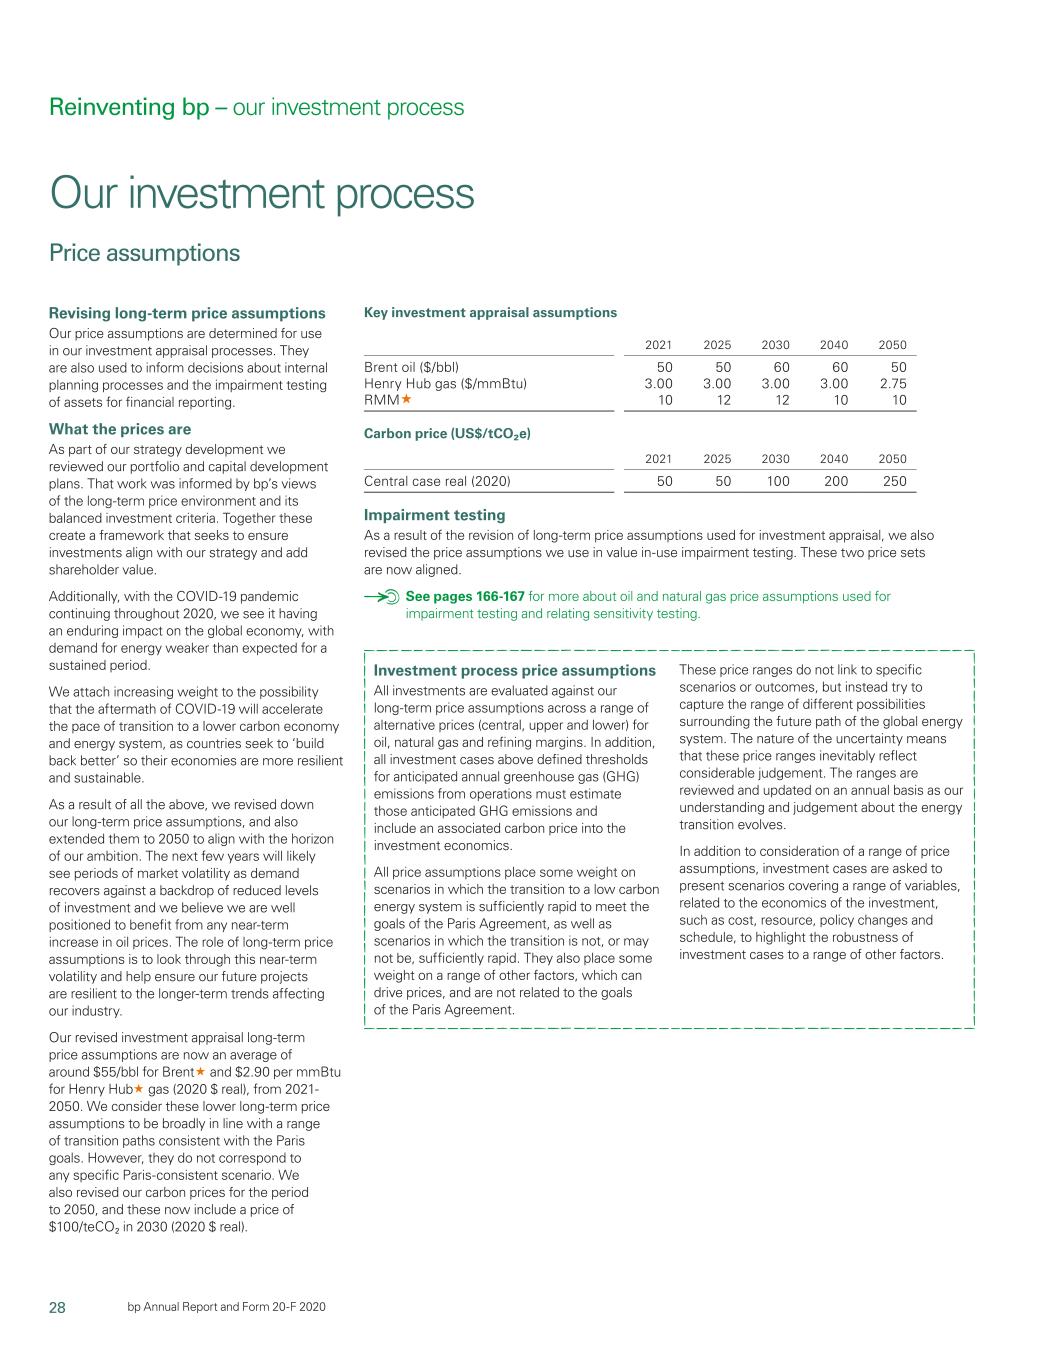
28 bp Annual Report and Form 20-F 2019

Strategic report Achieving the Paris goals – a multitude of pathways There are many different pathways to Global carbon emissions from energy use achieve the Paris goals, with substantial (GtCO2) variation in the implied energy mix. 40 The Intergovernmental Panel on Climate Change (IPCC) is the United Nations’ body 30 for assessing the science related to climate change. It is the leading source of data that 20 summarises the potential pathways to achieve the Paris goals. The IPCC compiles a database of the published results on 10 mitigation pathways from modelling teams around the world. 0 The chart shows a range of modelled pathways for carbon emissions from energy -10 and industrial use, collected by the IPCC, that meet the long-term temperature goals -20 in the Paris Agreement, together with the 1980 1990 2000 2010 2020 2030 2040 2050 2060 2070 2080 2090 2100 paths associated with two of BP’s own scenarios. The ‘rapid transition’ scenario Range of scenarios collected by the IPCC which Energy Outlook ‘evolving transition’ meet the long-term temperature goals of the IEA SDS clearly sits well within the range. Also Paris Agreement Energy Outlook ‘rapid transition’ highlighted is the ‘Sustainable Development Source: Integrated Assessment Modeling Consortium (IAMC) 1.5°C Scenario Explorer and Data hosted Scenario’ from the International Energy by International Institute for Applied Systems Analysis (IIASA), release 2.0. Scenario data has Agency (IEA SDS), which is often cited been rebased to common starting point that matches the BP Energy Outlook history for 2015. as a reference case for a scenario that is consistent with meeting the Paris goals. Global energy markets in 2019 The world economy grew at 2.4% in 2019, Oil Natural gas reflecting slower growth in both advanced and • Dated Brent crude oil prices averaged • Gas spot prices dropped in all three emerging economies, amid weakening trade $64 per barrel in 2019 – a 9% decrease key regional markets in 2019. and investment. This was below the average from 2018 levels but almost 30% above • Global consumptionc growth slowed of around 3% seen over the past 10 years. the 2015-17 average. down in 2019 compared with the Growth in advanced economies was 1.6% in • Global consumptionb increased by exceptional growth in 2018, driven by 2019 while in emerging markets was 3.5%a. 0.9 million barrels per day (mmb/d) to slower growth in both the US and China. 100.1mmb/d for the year (0.9%) – a • Total gas production growth slowed slowdown from growth rates seen in the down in 2019, with the exception of the 2020 volatility prior two years as trade tensions slowed US. Meanwhile, LNG trade increased There has been considerable market global macroeconomic growth. significantly during 2019. volatility in the first quarter, compounded • Global oil production remained flat at by the coronavirus (COVID-19). We 100.5mmb/d, with growth from non-OPEC expect the outlook for the year to remain countries offsetting supply restraint and For more information on prices and margins challenging, see pages 52 and 57. disruptions in OPEC countries. see pages 52 and 58. a World Bank Global Economic Prospects, January 2020. b IEA Oil Market Report, February 2020©. c JODI-Gas World Database, and IHS Markit: China Natural Gas Data Tables: February 2020 for China. BP Annual Report and Form 20-F 2019 13

Our business model We deliver a diverse range of energy products and services to people around the world. What we do New business models Investing in innovative companies across our value chain to help accelerate and commercialize new technologies, products and business models that we believe can benefit BP and global energy systems. Venturing and low carbon across the business Finding and Refining, manufacturing Delivering products generating energy and marketing and services Repowering some Using technology and of our facilities partnership to recycle and reuse our products Transport and trading • Finding additional resources and • Producing refined petroleum products and • Delivering fuels, fast electric-vehicle replenishing our development options scaling up co-processing of lower carbon charging and convenience retail services, with exploration and technology. fuels at our refineries. as well as premium and lower carbon • Developing and extracting oil and gas, and • Manufacturing and marketing lubricants lubricants. seeking to extend the life of existing fields. and petrochemicals products. • Supplying petrochemical products that • Generating renewable energy using • Developing technologies to help advance are used to make a range of products biofuels, biopower, wind and solar. the circular economy, such as BP Infinia, including clothes and building materials. which can recycle previously • Providing renewable power to industries unrecyclable plastics. and local electricity grids. More information Upstream on page 50. Downstream on page 56. Other businesses and corporate on page 63. 14 BP Annual Report and Form 20-F 2019

Strategic report Reinventing BP On 12 February 2020 we introduced our ambition and aims with a new structure, a new leadership team, and new ways of working. To deliver our ambition we are reinventing BP, retiring our existing model and replacing it with one that is more focused, more integrated and faces the energy transition head on. One that can deliver for the changing demands of consumers, investors and governments. Our new leadership structure is due to come into place on 1 July 2020 and is expected to be fully operational by 1 January 2021. The new leadership will focus on four core capabilities: operations, customers, low carbon and innovation. These four highly focused business groups will work with three integrators (sustainability and strategy; regions, cities and solutions; and trading and shipping) to facilitate collaboration and unlock value. And four teams will serve as enablers of business delivery. For more information see bp.com/reimagine. Business model foundations These are the things that every Partnerships and collaboration Governance and oversight energy business needs and are We aim to build enduring relationships with our Our board has a diversity of knowledge, expertise, critical foundations for what we key stakeholders, and partner with others to find and ways of thinking that help us transition our do and how we do it. innovations that can improve efficiency and deliver business, manage risks and continue to deliver low carbon solutions. value over the long term. • 20 years of collaboration with the world’s • ~42% of the company’s board are women. top universities. See page 74. Safe and reliable Talented people Technology and innovation We value the safety of our workforce and focus on We work to attract, motivate and retain the best New technologies help us produce energy safely and maintaining a safe operating culture every day. This talent the world offers and equip our people with the more efficiently. We selectively invest in areas with the culture of safety also improves the integrity and right skills for the future. Our performance and ability potential to add greatest value to our business, now and reliability of our assets. to thrive globally depend on it. in the future, including building lower carbon businesses. • 94.4% BP-operated upstream plant reliability. • 8th most desirable employer in the UK • >3,900 patents granted or pending across on LinkedIn. the BP group in 2019. See page 45. See page 47. What makes us different These are the things we believe set us Global energy trading Distinctive customer offers apart from our peers and demonstrate We combine expertise in physical supply and trading Our convenience partnerships provide customers our distinctive ways of working. and advanced analytics to deliver long-term value, with a differentiated offer that includes fresh, from wellhead to end customer. We trade a variety of high-quality food and drink, such as M&S Simply products such as crude oil, refined products, natural Food® in the UK and REWE to Go® in Germany. gas, LNG, carbon products and power. 4bn ~1,600 barrels of crude a year traded, equivalent differentiated convenience partnership sites to 20% global traded oil. across our network of around 18,900 retail sites. ‘Reduce, improve, Rosneft create’ framework partnership Our framework helps focus everyone in BP on our low Our share in Rosneft, one of Russia’s largest oil and gas carbon ambitions. It encompasses activities across producers, gives us a stake in one of the largest and the group to reduce emissions from our operations, lowest-cost hydrocarbon resource bases in the world, improve the products we offer to help customers with access to huge markets, both east and west. reduce their emissions, and create low or zero carbon businesses to deliver more energy with fewer emissions. 0.14% 19.75% methane intensity in 2019. BP’s stake in Rosneft. See page 40. See page 61. BP Annual Report and Form 20-F 2019 15

Our strategy We have established a track record of operational and financial delivery. This has helped create a strong Strategic foundation for us to advance our priorities low carbon agenda as we work to achieve our ambition to become a net zero company by 2050 or sooner and to help the world get to net zero. Growing Market-led Venturing and Modernizing Our strategy, which we set out in advantaged growth in the low carbon the whole group 2017, allows us to be competitive, oil and gas in Downstream across multiple flexible and resilient while also responding to a rapidly changing the Upstream fronts energy landscape, with growing Invest in oil and gas, Innovate with Pursue new Simplify our processes expectations for us to adapt to producing both with advanced products and opportunities to meet and enhance our changing demands from increasing efficiency strategic partnerships, evolving technology, productivity through stakeholders. (lower cost, higher building competitively consumer and digital solutions. margin and close to advantaged businesses policy trends. We remain committed to managing markets), with a focus that deliver profitable our portfolio for value, and investing on carbon. marketing growth with discipline in flexible and resilient options, which together See page 25. See page 27. See page 28. See page 31. support our pursuit of a strategy which we believe is consistent with the goals of the Paris Agreement. Supported Following BP’s new ambition and by our aims, set out in February 2020, we low carbon plan to announce more information on ambitions how we intend to reimagine energy and reinvent BP, while performing as we transform, at our capital markets day in September 2020. Embedded within Reducing Improving Creating our strategy is our commitment to advance emissions in our products low carbon a low carbon future. our operations businesses We plan to deliver this • Achieve zero net • Provide lower • Expand low carbon across our entire growth in operational emissions gas. and renewable business through what emissions out to 2025. • Develop more businesses. we call our ‘reduce, • Make 3.5Mte of efficient and lower • Invest $500 million in improve, create’ sustainable GHG carbon fuels, low carbon activities (RIC) framework. reductions by 2025. lubricants and each year. • Target industry leading petrochemicals. • Collaborate and invest methane intensity of • Grow lower carbon in the OGCI’s $1bn+ 0.2%. offers for customers. fund for research and technology. For more information on our RIC framework, see page 41. 16 BP Annual Report and Form 20-F 2019

Strategic report Pursuing a strategy that is and advocating for progressive climate policies 2. We� believe that our strategy positions BP to consistent with the Paris goals to advance a low carbon future in support of the remain an attractive investment for current Paris goals. and prospective shareholders throughout the In February 2020 we set out our ambition to be energy transition, including in a world that is In 2019 examples included: a net zero company by 2050 or sooner and to meeting the Paris goals. Our strong and help the world get to net zero. This is supported • Launching a review of our climate-related trade disciplined financial framework supports the by 10 aims which, when taken collectively, set association memberships – read more on page 49. delivery of our strategy. This provides us with out a path that we believe is consistent with the Our aim going forward is to set new expectations a strong platform to deliver our purpose to Paris goals, see page 7. One specific aim relates for trade associations around the globe. reimagine energy, and work towards our new to increasing the proportion of investment in • Establishing a collaboration with DiDi to begin net zero ambition and aims. our non-oil and gas business. Over time, as building an electric-vehicle charging network in China. investment in low or no carbon activity increases, For more information on our investor • Beginning the roll out of ultra-fast chargers across we see investment in oil and gas going down. proposition and financial framework, see BP forecourts in the UK and piloting ultra-fast page 18. Since 2017, when BP reset its five-year strategy, charging at Aral forecourts in Germany, bringing we have pursued a way forward that is flexible charging time closer to the time taken to fill a tank. The role of the board and adaptable to a range of energy and market • Increasing our stake in Lightsource BP to create a The board is responsible for setting the strategy scenarios. These different scenarios are based on 50:50 joint venture. and has oversight of the overall conduct of the a range of assumptions about policy, technology • Expanding our biofuels business in Brazil by more group’s business. During 2019, the board and consumer behaviour, and supply and demand than 50% through a joint venture with Bunge to considered BP’s strategy at every board meeting. changes. We do not know what path the energy create BP Bunge Bioenergia. This took into account the wider operating transition will take, so BP’s strategy is intended to • Installing continuous methane measurement at our environment and discussed strategic themes be effective under a range of scenarios, and not a Khazzan central processing facility in Oman to help relating to BP’s purpose, including in relation to single, deterministic view of the future – in short, quickly identify new leaks and reduce time taken the segments and key functions. The impact of responsive to uncertainty. to respond. the lower carbon energy transition on the group’s • Supporting well-designed carbon pricing, such as business model was also reviewed and discussed We believe that our current strategy is consistent the Washington State cap-and-invest bill. We aim throughout 2019. As a result, the board considers with the Paris goals. This consistency has, at its to advocate more actively for policies that support that the strategy allows us to be flexible to adapt core, two key parts. And these remain relevant as net zero, including carbon pricing. to market changes and scenarios to remain we work towards our net zero ambition and aims. consistent with the Paris goals. For more information on our strategy in action, 1. �We are striving to play our part in meeting the see pages 24-31. For more information on the role of the board world’s energy needs in reliable, affordable and in relation to climate governance, see page 42. lower carbon; and we intend to achieve this For the board’s activity in relation to strategy, through collaboration, technology, innovation see Corporate governance on page 84. Measuring our progress Our group-wide principal metrics and relevant targets/goals The CA100+ resolution requires us to disclose the company’s principal metrics and relevant RIC framework Reduce • Zero net growth in operational emissions out to 2025. targets or goals consistent with the Paris goals. Sustainability, page 40. • 3.5Mte sustainable emissions reductions by 2025. We consider this to cover the principal metrics • 0.2% methane intensity. used at group level to help monitor progress on delivery of our strategic consistency with Create the Paris goals – including our near-term • $500 million invested in low carbon activities annually. RIC framework. (>$500 million in 2019). • Collaborate and invest in OGCI’s $1bn+ fund for A number of these metrics and targets are research and technology. relevant to the recommendations of the Task Force on Climate-related Financial Investment process (RCM) • Profitability index. • Average operational carbon intensity. Disclosures (TCFD). Our investment process, page 22. Going forward, we are considering metrics to Greenhouse gas emissions • Scope 1 and 2 emissions. support our ambition to be a net zero company • Emissions from the carbon in our upstream oil and Sustainability, page 40. by 2050 or sooner, and to help the world get to gas production. net zero. We plan to provide more information • For further GHG metrics see bp.com/ESGdata. on our future strategy and near-term plans at our capital markets day in September 2020. Carbon intensity • Average emissions intensity of marketed energy products. • Ratio of Scope 1 and 2 emissions: gross production. For more information on the TCFD, see page 42. Sustainability, page 40. Remuneration • 2020 annual bonus scorecard target related to sustainable emissions reductions. Directors’ remuneration report, page 100. BP Annual Report and Form 20-F 2019 17

Our investor proposition Our investor proposition is to grow sustainable free cash flow and distributions to shareholders over the long term. Fit for Focused We believe our strategy enables this Safer through a focus on safe, reliable and the future on returns efficient execution, leveraging our distinctive portfolio, and disciplined safe, reliable and a distinctive portfolio fit value based, disciplined investment to support growing returns. efficient execution for a changing world investment and cost focus Growing sustainable free cash flow and distributions to shareholders over the long term Our financial framework We maintain a disciplined financial We continue to expect to deliver the 2021 The CA100+ resolution requires us to disclose framework, which underpins our strategy targets laid out three years ago. (a) our anticipated investment in oil and gas and investment choices, and supports resources and reserves – this is anticipated We plan to increasingly focus our investment growth in sustainable free cash flow, to be less in 2020 than it was in 2019, and on the highest-quality barrels and drive returns returns and distributions to shareholders. (b) our anticipated investment in other energy and cash flow, not volumes. As a result, the sources and technologies – which is This discipline helps us maintain a anticipated proportion of our investment that anticipated to be significantly greater focused portfolio, which we believe is goes to oil and gas is expected to change. than 2019 levels. resilient in the long run to many potential outcomes and seeks to grow long-term We also plan to provide more information returns to shareholders. on this as part of our capital markets day in September 2020. Our capital frame is reviewed on an ongoing basis. We believe that the continuing flexibility it provides gives us the flexibility to pursue 2019 actual 2020 guidance our net zero ambition and aims, allocating an Lower than increasing proportion of investment toward Upstream production excluding Rosneft lower carbon businesses over time. This will 2.6mmboe/d 2019 help drive both the long-term resilience of Lower end of the portfolio and the creation of new value. This is balanced against the pace of i $15-17bn Organic capital expenditure range development of these new lower carbon $15.2bn business developments and levels of cash Slightly below flow generation. Depreciation, depletion and amortization $17.8bn 2019 In addition, our capital expenditure programme has flexibility, which enables us to respond Gulf of Mexico oil spill payments $2.4bn <$1bn to a low-price environment by reducing or rephasing investment. Other businesses and corporate average underlying quarterly charge $320m ~$350m Below ii Underlying effective tax rate 36% 40% Nearest equivalent GAAP measures: i Capital expenditure: $19.4bn. ii Effective tax rate: 49%. 18 BP Annual Report and Form 20-F 2019

Strategic report Our investment process BP’sprice assumptions All investments fall within a governance framework. This seeks to ensure investments align with Price assumptions Resource commitment meeting our strategy, fall within our prevailing financial Investments are evaluated against our long-term price assumptions across a range For capital investments above defined financial framework, and add shareholder value. The of alternative prices (central, upper and lower) thresholds for organic or inorganic spend, the governance framework also provides for for oil, natural gas and refining margins and carbonmargins. In addition, all investment approval is conducted by the investments to be assessed consistently prices. These price ranges do not link to executive-level resource commitment meeting and against a range of other outcomes specific scenarios or outcomes, but instead (RCM), which is chaired by the chief executive relevant to our strategy, including a range try to capture the range of different officer. The RCM reviews the merits of each of environmental and sustainability factors. possibilities surrounding the future path of such investment case against a balanced set Investments follow an integrated stage gate the global energy system. The price ranges of criteria and considers any key issues raised process designed to enable us to choose refer to the long-run level of prices over the in the assurance process. and develop the most attractive investment next 20 years. The nature of the uncertainty The CA100+ resolution requires BP to disclose cases. A balanced set of investment criteria means that these price ranges inevitably how we evaluate the consistency of new are used, see page 20. This allowscases above defined thresholds for the reflect considerable judgement. The ranges material capex investments with (i) the Paris comparison and prioritization of investments are reviewed and updated on ananticipated annual basis goals and (ii) a range of other outcomes across an increasingly diverse range of as our understanding and judgement about relevant to BP’s strategy. BP’s evaluation of business models. the energy transition evolves. consistency of such investments with the Paris The governance framework also specifies Range of prices goals was undertaken by the RCM in 2019. that investments are tested against a range Henry of carbon prices for projected operational Brenta Huba RMMb The role of the boardgreenhouse gas (GHG) emissions from operations must estimate those anticipated GHG emissions and subject to assurance by ($/bbl) ($/mmBtu) ($/bbl) The board assesses the impact of portfolio functions independent of the business before Upper case 90 5.0 17 changes, such as strategic acquisitions and a final investment decision (FID) is taken. Central case 70 4.0 14 the allocation of capital. They also consider For more information on BP’s governance Lower case 50 2.0 11 specific investment cases deemed sufficiently framework, see page 83. material to warrant their attention, which have Carbon prices been approved by the RCM. ($/tonnea) For more information on climate governance, Upper case 80 see page 42. Central case 40 Lower case 0 a 2015 $ real. b Nominal. BP Annual Report and Form 20-F 2019 19

Balanced investment criteria For the purposes of evaluating consistency with a range of other outcomes relevant to BP’s strategy, all group-wide investment cases are required to set outinclude an associated carbon price into the investment Investment merits in a standard format against a set of economics balanced criteria. Investments are considered against a range Safety Cash flow and risks certainty of prices (upper, central and lower).economics. All three price assumptions place some weight on scenarios in which the transition to a low Investment carbon energy system is sufficiently rapid criteria to meet the goals of the Paris Agreement, Capability as well as scenarios in which the transition Optionality and scale is not, or may not be, sufficiently rapid. They also place some weight on a range Environment of other factors, which can drive prices, and and are not related to the goals of the sustainability Paris Agreement. These price ranges do not link to specific scenarios or outcomes, but instead try to capture the range of different possibilities surrounding the future path of the global energy system. The nature of the uncertainty means that these price ranges inevitably reflect considerable judgement. The ranges are reviewed and updated on an annual basis as our understanding and judgement about the energy transition evolves. In addition to consideration of a range of price assumptions, investment cases are asked to present scenarios covering a range of variables, related to the economics of the investment, such as cost, resource, policy Environment and sustainability Investment economics changes and schedule, to highlight the All investment cases are considered We consider investment economics against robustness of investment cases to a range of other factors. Revising long-term price assumptions Our price assumptions are determined for use in our investment appraisal processes. They are also used to inform decisions about internal planning processes and the impairment testing of assets for financial reporting. What the prices are As part of our strategy development we reviewed our portfolio and capital development plans. That work was informed by bp’s views of the long-term price environment and its balanced investment criteria. Together these create a framework that seeks to ensure investments align with our strategy and add shareholder value. Additionally, with the COVID-19 pandemic continuing throughout 2020, we see it having an enduring impact on the global economy, with demand for energy weaker than expected for a sustained period. We attach increasing weight to the possibility that the aftermath of COVID-19 will accelerate the pace of transition to a lower carbon economy and energy system, as countries seek to ‘build back better’ so their economies are more resilient and sustainable. As a result of all the above, we revised down our long-term price assumptions, and also extended them to 2050 to align with the horizon of our ambition. The next few years will likely see periods of market volatility as demand recovers against a backdrop of reduced levels of investment and we believe we are well positioned to benefit from any near-term increase in oil prices. The role of long-term price assumptions is to look through this near-term volatility and help ensure our future projects are resilient to the longer-term trends affecting our industry. Our revised investment appraisal long-term price assumptions are now an average of around $55/bbl for Brent« and $2.90 per mmBtu for Henry Hub« gas (2020 $ real), from 2021- 2050. We consider these lower long-term price assumptions to be broadly in line with a range of transition paths consistent with the Paris goals. However, they do not correspond to any specific Paris-consistent scenario. We also revised our carbon prices for the period to 2050, and these now include a price of $100/teCO2 in 2030 (2020 $ real). Key investment appraisal assumptions 2021 2025 2030 2040 2050 Brent oil ($/bbl) 50 50 60 60 50 Henry Hub gas ($/mmBtu) 3.00 3.00 3.00 3.00 2.75 RMM« 10 12 12 10 10 Carbon price (US$/tCO2e) 2021 2025 2030 2040 2050 Central case real (2020) 50 50 100 200 250 Impairment testing As a result of the revision of long-term price assumptions used for investment appraisal, we also revised the price assumptions we use in value in-use impairment testing. These two price sets are now aligned. See pages 166-167 for more about oil and natural gas price assumptions used for impairment testing and relating sensitivity testing. Our investment process Price assumptions Reinventing bp – our investment process
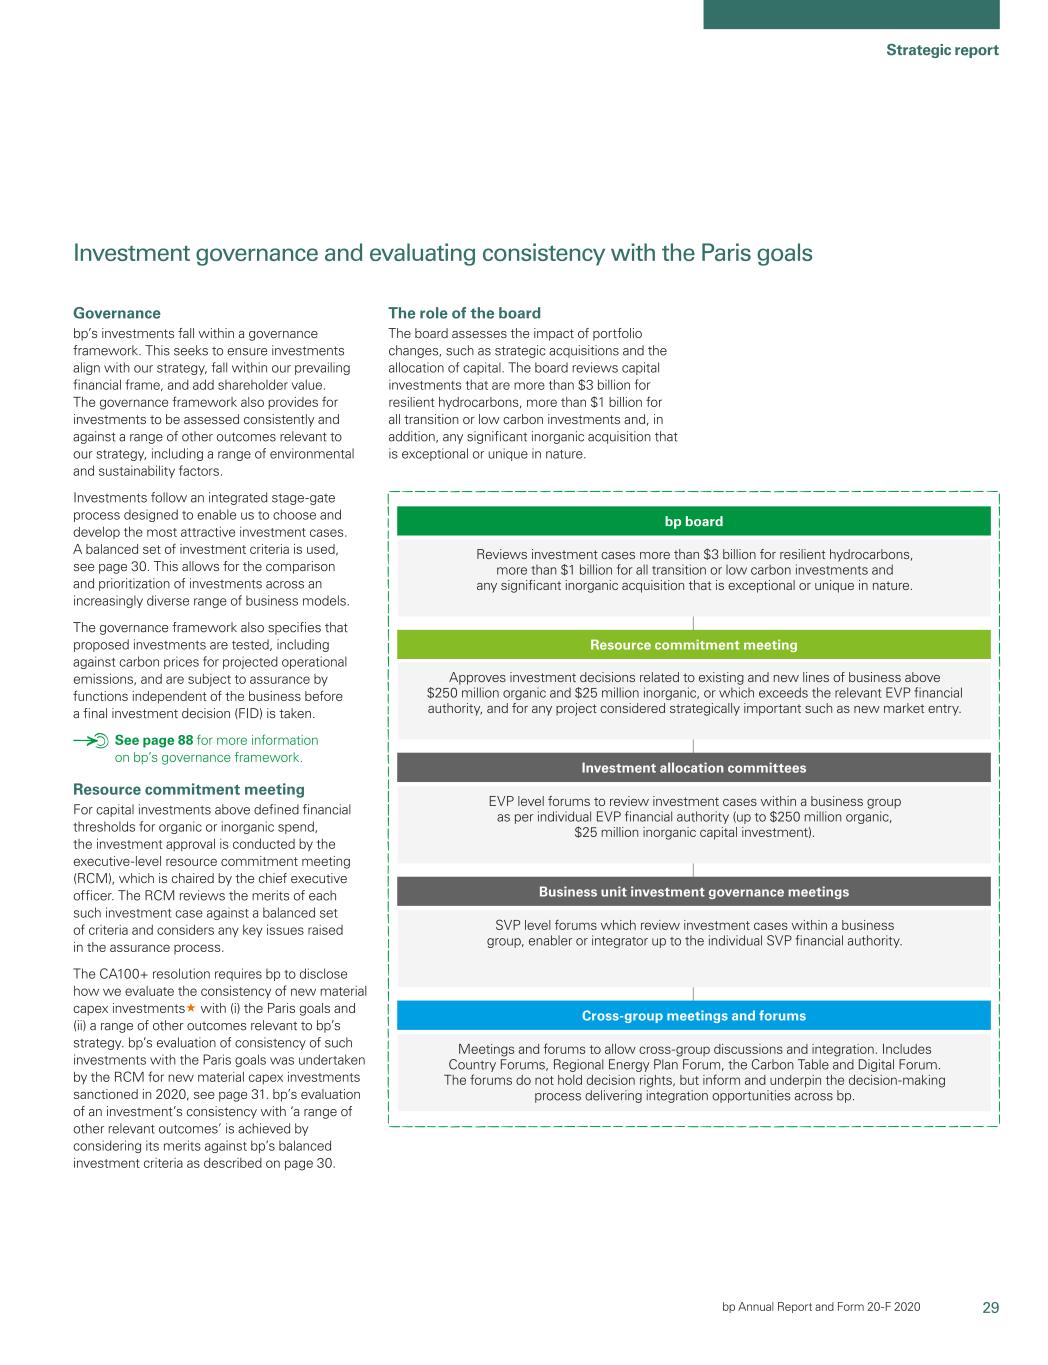
29 Strategic report bp Annual Report and Form 20-F 2020 Investment governance and evaluating consistency with the Paris goals Governance bp’s investments fall within a governance framework. This seeks to ensure investments align with our strategy, fall within our prevailing financial frame, and add shareholder value. The governance framework also provides for investments to be assessed consistently and against a range of other outcomes relevant to our strategy, including a range of environmental and sustainability factors. Investments follow an integrated stage-gate process designed to enable us to choose and develop the most attractive investment cases. A balanced set of investment criteria is used, see page 30. This allows for the comparison and prioritization of investments across an increasingly diverse range of business models. The governance framework also specifies that proposed investments are tested, including against carbon prices for projected operational emissions, and are subject to assurance by functions independent of the business before a final investment decision (FID) is taken. See page 88 for more information on bp’s governance framework. Resource commitment meeting For capital investments above defined financial thresholds for organic or inorganic spend, the investment approval is conducted by the executive-level resource commitment meeting (RCM), which is chaired by the chief executive officer. The RCM reviews the merits of each such investment case against a balanced set of criteria and considers any key issues raised in the assurance process. The CA100+ resolution requires bp to disclose how we evaluate the consistency of new material capex investments« with (i) the Paris goals and (ii) a range of other outcomes relevant to bp’s strategy. bp’s evaluation of consistency of such investments with the Paris goals was undertaken by the RCM for new material capex investments sanctioned in 2020, see page 31. bp’s evaluation of an investment’s consistency with ‘a range of other relevant outcomes’ is achieved by considering its merits against bp’s balanced investment criteria as described on page 30. The role of the board The board assesses the impact of portfolio changes, such as strategic acquisitions and the allocation of capital. The board reviews capital investments that are more than $3 billion for resilient hydrocarbons, more than $1 billion for all transition or low carbon investments and, in addition, any significant inorganic acquisition that is exceptional or unique in nature. Reviews investment cases more than $3 billion for resilient hydrocarbons, more than $1 billion for all transition or low carbon investments and any significant inorganic acquisition that is exceptional or unique in nature. bp board Approves investment decisions related to existing and new lines of business above $250 million organic and $25 million inorganic, or which exceeds the relevant EVP financial authority, and for any project considered strategically important such as new market entry. Resource commitment meeting EVP level forums to review investment cases within a business group as per individual EVP financial authority (up to $250 million organic, $25 million inorganic capital investment). Investment allocation committees SVP level forums which review investment cases within a business group, enabler or integrator up to the individual SVP financial authority. Business unit investment governance meetings Meetings and forums to allow cross-group discussions and integration. Includes Country Forums, Regional Energy Plan Forum, the Carbon Table and Digital Forum. The forums do not hold decision rights, but inform and underpin the decision-making process delivering integration opportunities across bp. Cross-group meetings and forums

30 bp Annual Report and Form 20-F 2020 Balanced investment criteria All group-wide investment cases are required to set out the investment merits and are considered against a set of balanced criteria. This standardized approach creates a level playing field for decision making and allows portfolio-wide comparisons of investment cases. Further, the decision to endorse an investment based on the information provided represents bp’s evaluation that the investment is considered consistent with a range of other outcomes, relevant to bp’s strategy. In 2020 the standardized approach for investment cases was reviewed to place a greater focus on our strategy, sustainability and integration value. These changes, and associated nomenclature, ensure our investment framework is consistent with our strategy. When taking investment decisions, we consider six factors, although our decisions may also take other factors into account as appropriate. Strategic alignment For all investment cases, we consider whether the investment supports delivery of our strategy, see page 18. And if it involves distinctive capability that bp has, or intends to develop, and whether it adds to an existing ‘scale’ business within the portfolio or could help us create one. Safety and risks Investment cases are required to describe risks unique to the project which have a significantly higher probability than usual or have a significantly greater impact (relative to the size of the project) were they to occur. Sustainability All investment cases are considered against appropriate environmental impactsand sustainability considerations, and sustainability measures, including carbon. Investment cases above defined thresholds for anticipated annual greenhouse gas (GHG) emissions from operations must estimate those anticipated GHG emissions and include an associated carbon price in the investment economics. Investment economics We consider investment economics against a range of measures including profitability of other factors. and sustainability measures, including but index, internal rate of return, net present not limited to carbon. Investment cases value, discounted payback, profitability index and investment This standardized approach creates a level above defined thresholds for anticipated efficiency, using a set of scenarios for playing field for decision making and allows annual greenhouse gas (GHG) emissions commodity prices, margins and carbon prices. portfolio wide comparisons of investment from operations must estimate thoseprices (where relevant). Investments are generally considered against cases. Further, the decision to endorsestringent differentiated hurdle rates. 1. A payback of less than 10 years for all investments in upstream oil, refining and for fuels retail in mature markets; together with an anticipated GHG emissions and include internal rate of return hurdles typically set in investment based on the informationhurdle. 2. A payback of less than 15 years for upstream gas; together with an associated carbon priceinternal rate of $40/te the mid to high teens. Close attention is paid provided represents BP’s evaluation that 2015 $ real (and sensitivities of $0 and to discounted payback as a measure of the investment is considered consistent $80) in the investment economics. commercial risk in the context of the energy withreturn hurdle. 3. We have a range of other outcomes, relevant transitionsector-specific internal rates of returns of between 10% and profitability index as a measure15%. And finally, for renewable power we look for returns of at least 8% to BP’s strategy. of capital efficiency. Capability10% levered. Volatility and scale Cash flow certainty For all investment cases, we consider whetherrateability Economic metrics are also considered in they involve distinctive capability that BP has, the context of the cash flow certainty of the or intends to develop, and whether it adds to investment assumptions. For example, a high an existing ‘scale’ business within the portfolio returnhigh-return deepwater tieback will have less certain or could help us create one. and more volatile (oil price(oil-price linked) cash flows than a lower return but more certain renewable power project with a long-term power purchase agreement (and a fixed power price). SafetyOptionality and risks Optionality Investment cases are required to describeintegration All investment cases are requested to risks unique to the project which have a quantify the strategic optionality that might significantly higher probability than usual or be accessed through follow-on activity. have a significantly greater impact (relativeactivity and regular cross-entity forums enable integration opportunities to be identified. For example, a greenfieldan offshore platform the size of the project) were they to occur.wind development may provide additional optionality to develop nearby satellite fields in the future. 20 BPfor power offtake and integration into our digital platforms. Strategic alignment Safety and risks Sustainability Optionality and integration Investment criteria Volatility and rateability Investment economics Six factors Reinventing bp – our investment process
31 Strategic report bp Annual Report and Form 20-F 2019

Strategic report Evaluating new material capex investments for consistency with the Paris goals2020 Evaluation process When evaluating the consistency of our 2019 The 2019 evaluation was done in the context These price assumptions do not2020 new material capex investmentsinvestments« with the of a ‘sustained low-price environment’, which correspond to a single specific ‘Paris- Paris goals, a focus of the evaluation criteria assumes the lower price case for oil ($50/bbla), consistent’ scenario, but instead place was on their competitiveness and financial natural gas ($2/mmBtua) and refining margins weight on a range of possibilities for how robustness as the prices of different forms of ($11/bbl (nominal)) together with the higher the demand for different forms of energy a energy and products adjust in response to the carbon price ($80/teCO2 ). may change in Paris-consistent pathways changing market environment. For new material capex investment decisions taken from September 2020, the evaluation used our revised central price assumptions of around $55/bbl for Brent« and how this may affect future energy pricesb. Sustained low-price environment Oil$2.90 per mmBtu for Henry Hub« gas (2020 $ real), from 2021-2050. It also used our revised central carbon price (Brent): In many ‘Paris-consistent’ scenarios, global oil demand peaks within the next five years or so and falls a between 15-35% by 2040. Such a fall in demand, combined with the abundance of oil resources, would be $50/bbl expected to lead to an increasingly competitive market for oil. But the extent to which these competitive forces feed through into a sustained reduction in global oil prices is expected to be tempered by the dependence of many oil-producing economies on oil revenues to support their wider economies. For example, the IMF estimate that the fiscal break-even prices of the major Middle East and North African oil exporters is close to $80c. We consider that the pace at which the major oil producing economies are able to diversify their economies and so reduce the fiscally sustainable price at which they can produce oil is likely to limit the extent to which oil prices can fall on a sustained basis over the next 20 yearsd. US natural gas price (Henry Hub): The price of US gas (Henry Hub) is used as the main price for evaluating gas-based investments, either a directly for US-based projects or indirectly (via netback pricing relationships) for gas-based projects in other $2/mmBtu parts of the world. The outlook for natural gas in ‘Paris-consistent’ scenarios is more varied across different scenarios: some point to global gas consumption increasing or remaining broadly flat over the next 20 years; others point to gas demand peaking within the next five years and declining by 20-30% by 2040. These differences stem in part from the extent to which natural gas is assumed to be used in conjunction with carbon capture, use and storage (CCUS) projects, either in the power and industrial sectors directly, or to produce decarbonized gas (in the form of ‘blue’ hydrogen). US natural gas prices will also depend on a number of supply-side factors, such as: the extent to which productivity gains within shale gas continue to improve, and how quickly US tight oil production – and hence the associated gas produced as part of that production – peaks. Refining marker margin (RMM): The outlook for refining margins is most relevant when considering investments in refineries or closely $11/ bbl related activities. (nominal) Many ‘Paris-consistent’ scenarios provide less detailed information on the outlook for refined products and refining activity. However, the significant falls in global oil demand envisaged in many of these scenarios are likely to also be reflected in the demand for refined products. Indeed, some scenarios highlight the expected growth in natural gas liquids (NGLs) and biofuels which suggest that refining activity might decline by even more than the overall demand for liquid fuels. To the extent that falling demand for refined products leads to over-capacity in the refining sector, this would be expected to leadassumptions, applied to the least-efficient refineries closing over time, raising the average efficiency of the remaining refineries and so reducing the sustainable level of refining margins. However, the need for some refineries to continue to operate can be expected to limit the extent to which refining margins can fall on a sustained basis. Carbon prices: The outlook for carbon prices has both a direct and indirect effect on the evaluation of new material a investments. The direct effect relates to theanticipated operational greenhouse gas emissions associated with differentthe investment, $80/for the period to 2050. These now include a price of $100/teCO2 projects: the greater the operational emissions, the greater the exposure to increases in carbon prices. The indirect impact relates to the impact of carbon prices on the differential between retail and wholesale prices for oil and natural gas. An increase in carbon prices can be expected to increase the differential between retail and wholesale prices: potentially both dampening demand growth (due to higher retail prices) and reducing the prices received by oil and gas producers (due to lower wholesale prices). The direct effects associated with carbon prices are explicitly assessed within BP’s investment evaluation criteria, whereas the indirect effects are captured within the overall prospects for oil and gas demand and the associated prices. In many ‘Paris-consistent’ scenarios, carbon prices are used as a key policy instrument for accelerating the transition to a low carbon energy system, with carbon prices (on a global basis) increasing to between $100‑200/teCO2 by 2040. But in these scenarios, carbon prices are typically increased only gradually, in part since this mitigates the costs to the economy of prematurely scrapping and replacing productive assets. Hence, the average level of carbon prices in these scenarios over the next 20 years tends to be significantly lower than the level they are projected to reach in 2040 or so. For example, in BP’s rapid transition scenario, carbon prices in developed economies are assumed to reach $200/teCO2 by 2040, but the average level of carbon prices between 2017 and 2040 in that scenario is around $75/teCO2. a 20152030 (2020 $ real. b To aid this analysis, we consider a range of scenarios which claim to be consistent withreal), see page 28. Our resource commitment meeting the Paris goals including: IEA’s ‘Sustainable Development Scenario’, BEIS’ ‘Low Prices’ case, Aurora Energy Research’s ‘Two degrees’ scenario and MIT’s ‘Paris to 2°C’ scenario. c Regional Economic Outlook – Middle East and Central Asia, International Monetary Fund, October 2019. d The Oil and Gas Industry in Energy Transitions | IEA 2020. BP Annual Report and Form 20-F 2019 21

Evaluating new material capex investments for(RCM) evaluates consistency with the Paris goals – continued Evaluation process Quantitative evaluationsby considering them against a balanced set of investment criteria, see page 30. For each of the investment criteria, a qualitative explanation of each business case was considered and presented to the RCM or relevant investment committee, as per the description on page 29. Our new material capital investmentscapex investments are intended to support the delivery of Investment economics Environmentbp’s strategy. In-scope investments are defined as: New: investment in a new project or extension of an existing project/asset, or share of an entity that is new to bp or a substantial increase in bp’s share. Material: more than $250 million capital investment. Capital expenditure: includes organic and sustainability BP’s strategy. Ininorganic. 2020 was an exceptional year, and one aspect of bp’s response was to reduce our planned capital expenditure, see page 9. As a result, there were only three new material capex investments – unusually low, and less than half the number in 2019. So bp decided to voluntarily conduct and disclose Paris-consistency evaluations for the four largest new capex investments which fell below our materiality threshold. We do not expect to disclose such evaluations of non- material investments in future years. To maintain consistency of approach, the conduct of these evaluations was delegated to a subset of the RCM. Quantitative evaluations Two quantitative guide levels were considered to inform the evaluation of Paris consistency. As stated in the bp Annual Report and Form 20-F 2019, we evaluatedcontinue to develop our approach and in 2020 we made a number of improvements, including benchmarking investment economics against our agreed economic investment hurdles; evaluating investments on the revised price assumptions; and setting a lower carbon intensity guide. As our approach matures with experience, we may continue to adjust or supplement these. Investment economics The calculation of profitability index (PI) Where appropriate,internal rate of return (IRR) and discounted payback uses the operational carbon their consistency with the Paris goals using the ‘low-price’‘central-price’ case for commodity intensity of the investment relative to that by considering them against a balanced prices and margins and the ‘high’‘central’ carbon ofprice. Economic indicators are then benchmarked against the portfolio average for the segment or set of investment criteria (seeeconomic hurdles, see page 20). price of $80 per tonne (2015 $ real).30. As a the related business activity (upstream, For each of the investment criteria, a guide, we would normally target a minimum refining, petrochemicals). As a guide, we qualitative explanation of each business threshold of greater than 1.0x on this basis. For clarity, Paris-consistency evaluations for investment decisions made before September 2020 were measured against the previous long-term price assumptions and against the profitability index (PI) measure. For details, see the bp Annual Report and Form 20-F 2019, page 22. Environment and sustainability Where appropriate, we measure the operational carbon intensity« of the investment relative to that of the 2020 portfolio average for the segment or the related business activity (upstream, refining, offshore wind). As a guide, we would normally target a ratio of less than case was considered and presented to 100%, meaning that the investment is the resource commitment meeting (RCM). expected to reduce the average operational They then discussed and addressed key carbon intensity of that portfolio. issues raised, as per the description on The potential impact of new material capex page 19. investments on BP’sbp’s greenhouse gas Two quantitative evaluations were emission targets is a further consideration. considered for Paris consistency. As our approach matures with experience, we may adjust or supplement these. There may be instances when new material capex investments are evaluated as consistent with the Paris goals despite either or both of these guide levels not being met, due to other considerations being taken into account. Evaluation outcomemet.
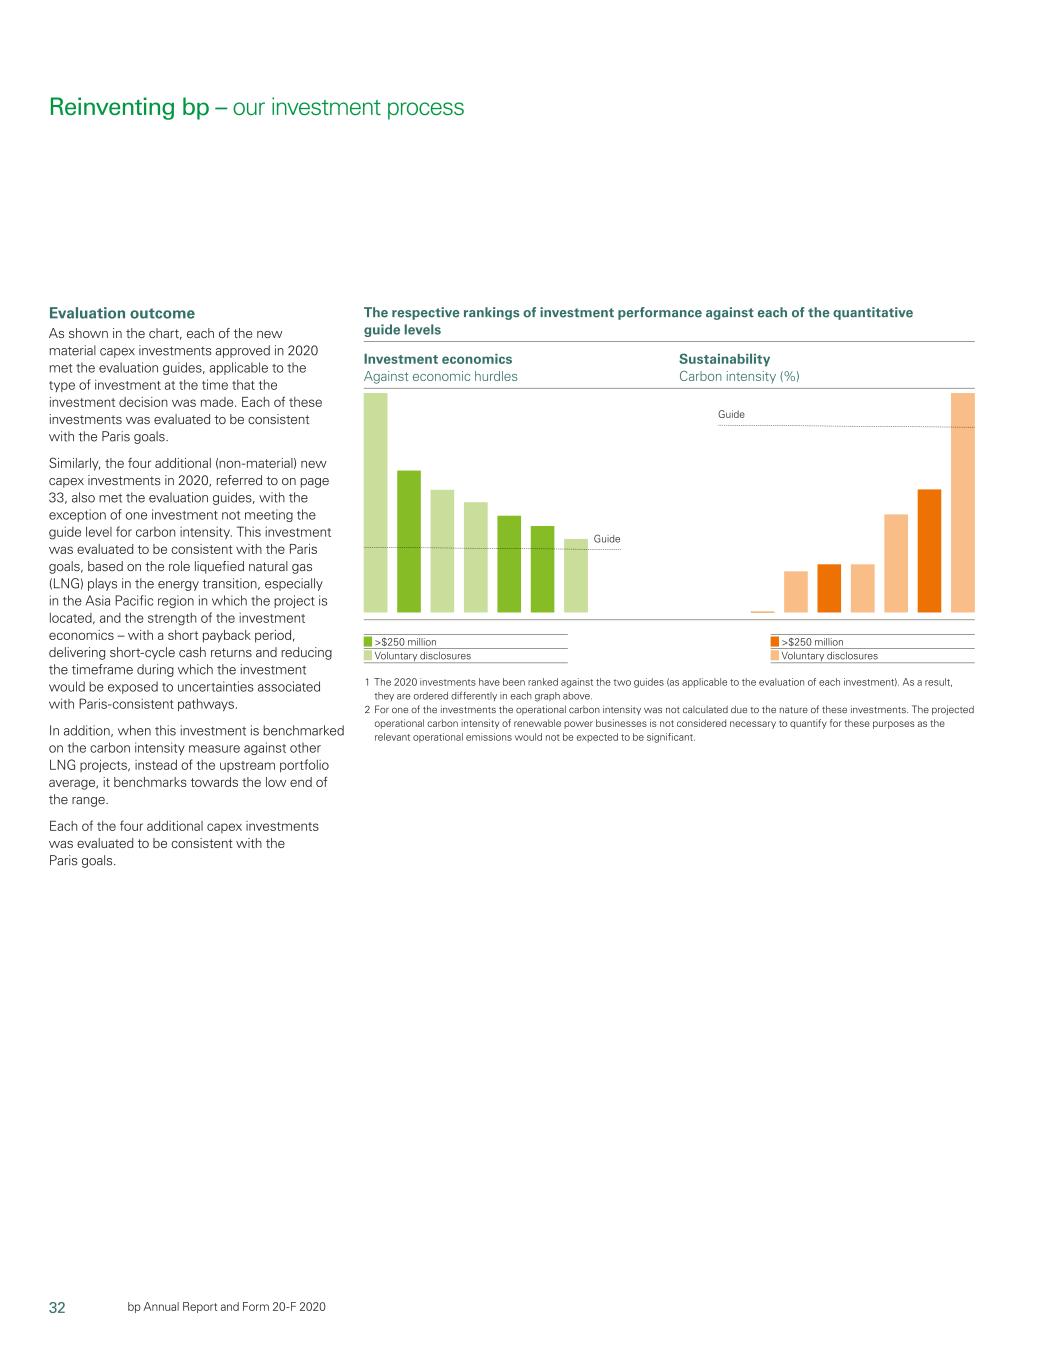
32 Investment economics Against economic hurdles Sustainability Carbon intensity (%) The figure shows the respective rankings of investment performance against each of the testsquantitative guide levels Guide Guide >$250 million Voluntary disclosures >$250 million Voluntary disclosures 1 The 2020 investments have been ranked against the two guides (as applicable to the evaluation of each investment). As a result, they are ordered differently in each graph above. 2 For one of the investments the operational carbon intensity was not calculated due to the nature of these investments. The projected operational carbon intensity of renewable power businesses is not considered necessary to quantify for these purposes as the relevant operational emissions would not be expected to be significant. bp Annual Report and Form 20-F 2020 Evaluation outcome As shown in the figure,chart, each of the new material capex investments approved in Investment economics: Environment and sustainability: 20192020 met the evaluation guides, applicable to the type of investment at the time that the investment decision was made. Each of these investments was evaluated to be consistent with the Paris goals. Similarly, the four additional (non-material) new capex investments in 2020, referred to on page 33, also met the evaluation guides, with the Profitability index Carbon intensity (%) exception of one investment not meeting the guide level for carbon intensity. This investment was evaluated to be consistent Guide with the Paris goals, based on the role liquefied natural gas (LNG) plays in the energy transition, especially in the Asia Pacific region in which the project is located, and the strength of the investment economics – with a short payback period, delivering short-cycle cash returns and reducing the timeframe during which the investment would be exposed to uncertainties associated with Paris Guide consistentParis-consistent pathways. In 2019,addition, when this investment is benchmarked on the overall averages forcarbon intensity measure against other LNG projects, instead of the new materialupstream portfolio average, it benchmarks towards the low end of the range. Each of the four additional capex investments met the guide levels for each of the two quantitative Capital weighted average ~1.5x Average operational carbon intensity is ~45% evaluation tests: • Profitability index on an average capital 1. The respective 2019 new material capex investments have been ranked against the two tests. As a result they are ordered weighted basis was approximately 1.5x, differently in each graph above. versus a guide level of greater than 1.0x. 2. For two of the 2019 new material capex investments the operational carbon intensity was not calculated due to the nature of • An average operational carbon intensity these investments: of approximately 45% relative to the • We do not calculate operational carbon intensity for replacement of end of life assets. • The projected operational carbon intensity of fuels marketing businesses is not considered necessary to quantify for current portfolio(s), versus a guide level of these purposes as the relevant operational emissions would not be expectedevaluated to be significant. less than 100%. 22 BPconsistent with the Paris goals. Reinventing bp – our investment process
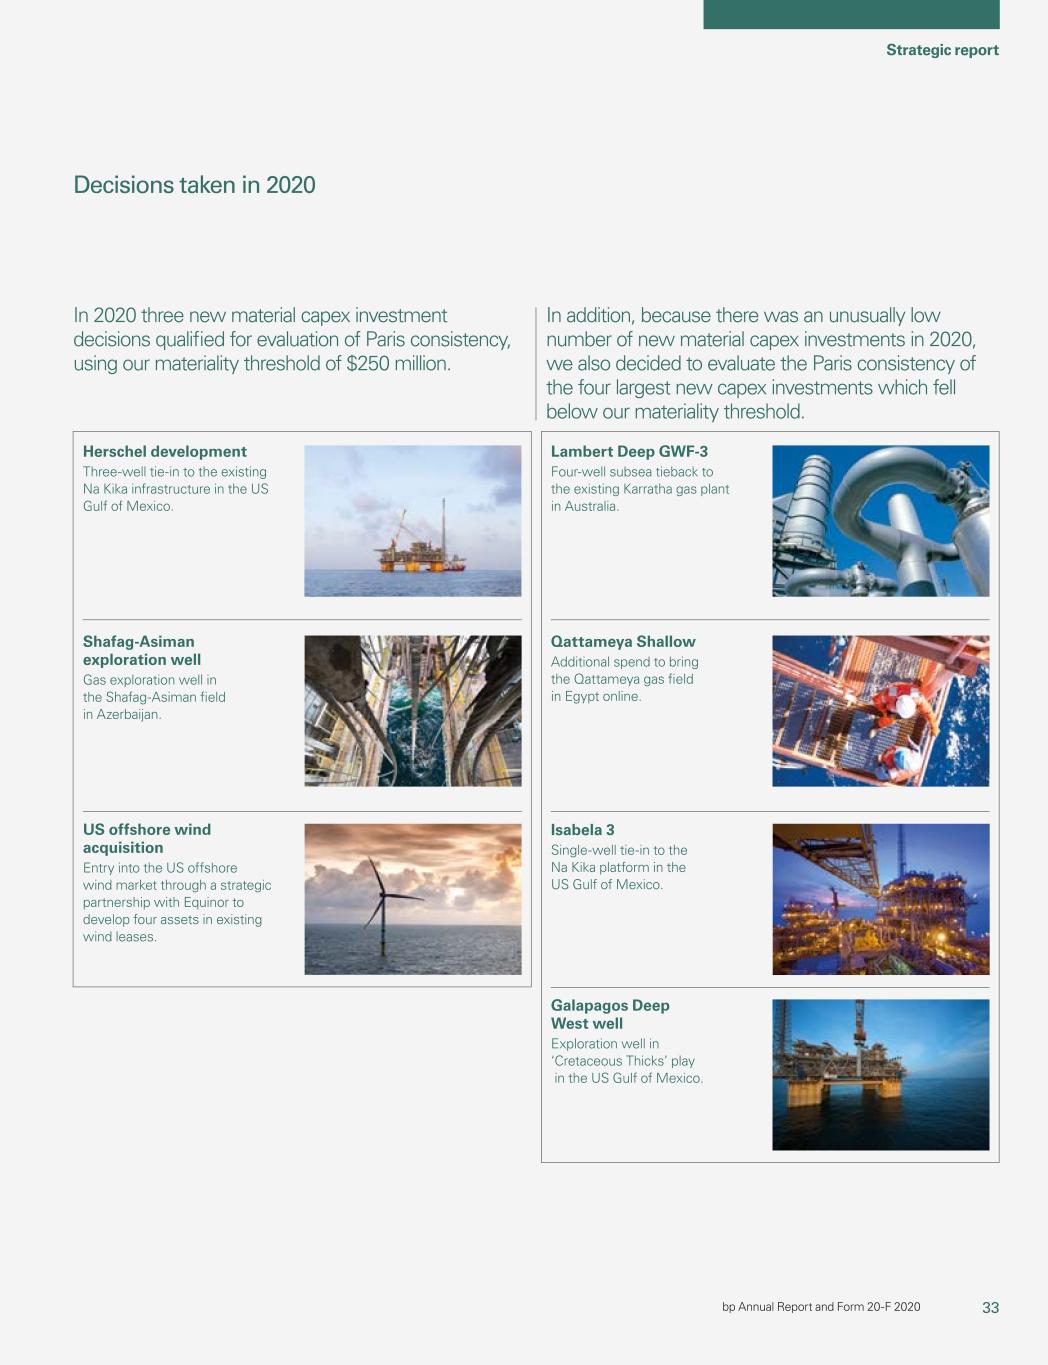
33 Strategic report bp Annual Report and Form 20-F 2019

Strategic report2020 Decisions taken in 2019 Eight new material capex investment decisions were taken2020 Lambert Deep GWF-3 Four-well subsea tieback to the existing Karratha gas plant in 2019, six inAustralia. Herschel development Three-well tie-in to the Upstream and two in the Downstream. Upstream Azeri Central East (ACE) Angola Block 18 – Platina A new offshore platform and facilities in the Azeri-Chirag-Deepwater Four subsea well tiebacks to an existing FPSO vessel, which also support Gunashli field in Azerbaijan. continued production from the main field under the licence extension granted by the Angolan government. India KGD6 – MJ Angola Block 15 The third phase of Block KG D6 gas development, seven subsea wells Further investment, which will extend the production-sharing agreement will tie‑back to a new FPSO vessel to process and separate liquids. for the block through 2032. Thunder Horse South Expansion Phase 2 Block 61 2020 development wells Two new subsea production units with eight wells tied back to existing Further development and drilling of 18 wells at Ghazeer and seven wells atNa Kika infrastructure in the US Gulf of Mexico. Khazzan, bothShafag-Asiman exploration well Gas exploration well in Oman. Downstream Gelsenkirchen steam and water project Reliancethe Shafag-Asiman field in Azerbaijan. Qattameya Shallow Additional spend to bring the Qattameya gas field in Egypt online. Isabela 3 Single-well tie-in to the Na Kika platform in the US Gulf of Mexico. Galapagos Deep West well Exploration well in ‘Cretaceous Thicks’ play in the US Gulf of Mexico. US offshore wind acquisition Entry into the US offshore wind market through a strategic partnership Constructionwith Equinor to develop four assets in existing wind leases. In 2020 three new material capex investment decisions qualified for evaluation of Paris consistency, using our materiality threshold of $250 million. In addition, because there was an unusually low number of new material capex investments in 2020, we also decided to evaluate the Paris consistency of the four boilers and a steam turbine to further the safe and Strategic agreement with Reliance Industries Limited to form a retail and reliable management of fuel gas excess. aviation joint venture in India. BPlargest new capex investments which fell below our materiality threshold.

34 bp Annual Report and Form 20-F 2019 23
2020 Reinventing bp – our strategy in action
24 BP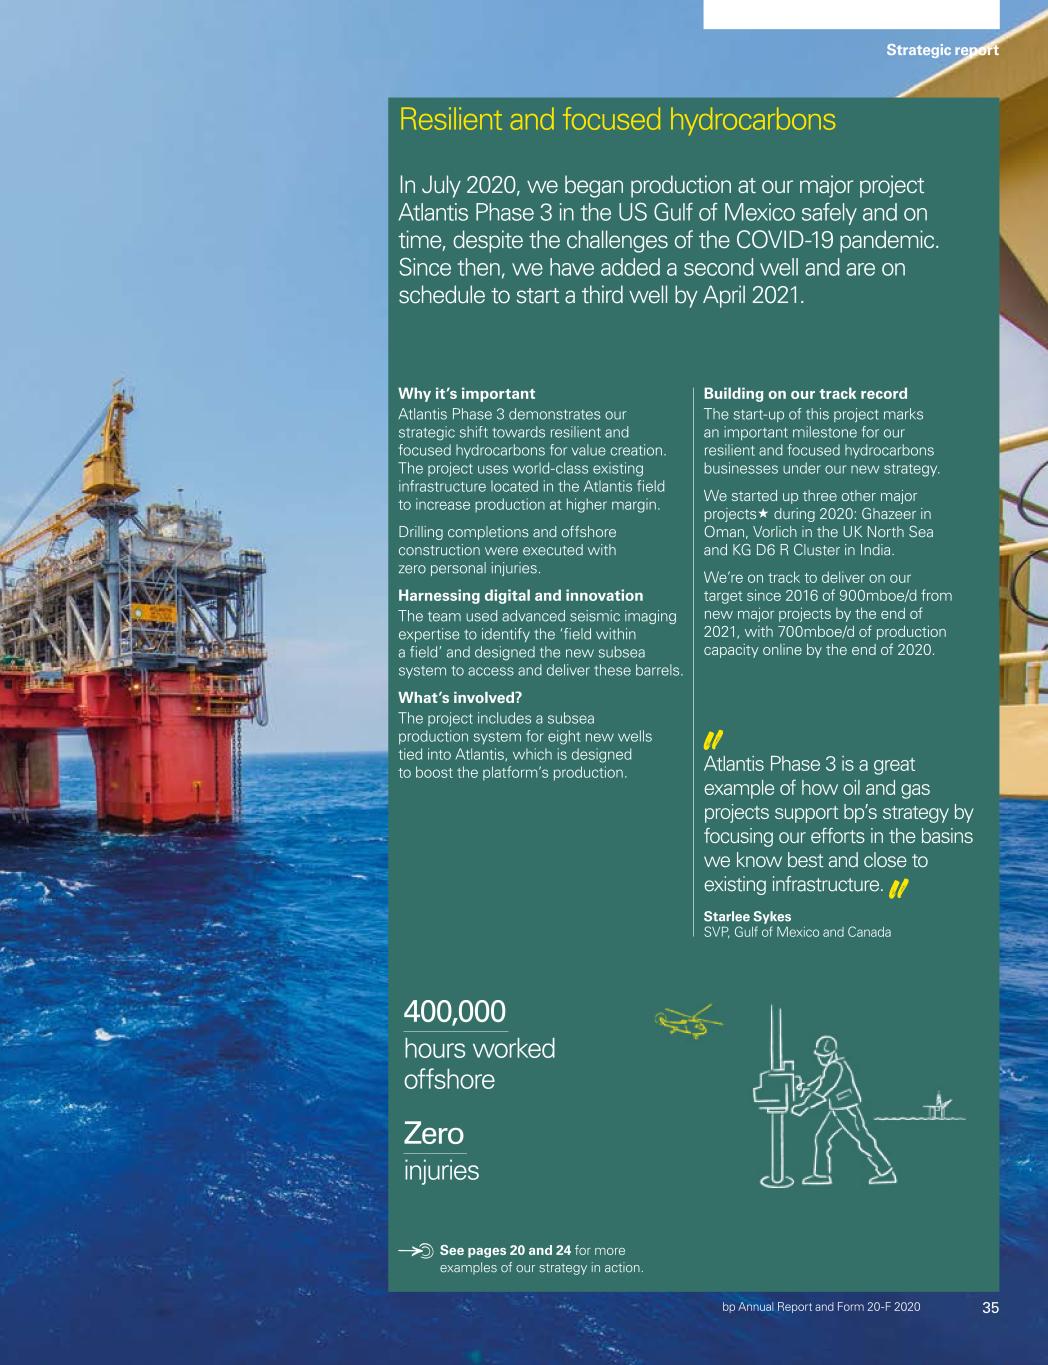
35 Strategic report bp Annual Report and Form 20-F 2019

Strategic report Growing advantaged2020 Resilient and focused hydrocarbons In July 2020, we began production at our major project Atlantis Phase 3 in the US Gulf of Mexico safely and on time, despite the challenges of the COVID-19 pandemic. Since then, we have added a second well and are on schedule to start a third well by April 2021. Why it’s important Atlantis Phase 3 demonstrates our strategic shift towards resilient and focused hydrocarbons for value creation. The project uses world-class existing infrastructure located in the Atlantis field to increase production at higher margin. Drilling completions and offshore construction were executed with zero personal injuries. Harnessing digital and innovation The team used advanced seismic imaging expertise to identify the ‘field within a field’ and designed the new subsea system to access and deliver these barrels. What’s involved? The project includes a subsea production system for eight new wells tied into Atlantis, which is designed to boost the platform’s production. Building on our track record The start-up of this project marks an important milestone for our resilient and focused hydrocarbons businesses under our new strategy. We started up three other major projects« during 2020: Ghazeer in Oman, Vorlich in the UK North Sea and KG D6 R Cluster in India. We’re on track to deliver on our target since 2016 of 900mboe/d from new major projects by the end of 2021, with 700mboe/d of production capacity online by the end of 2020. 400,000 hours worked offshore Zero injuries Atlantis Phase 3 is a great example of how oil and gas projects support bp’s strategy by focusing our efforts in the Upstream What this strategic priority means We aim to invest in oil and gas, producing both with increasing efficiency. This means lower cost, higher marginbasins we know best and close to markets, with a focus on carbon. Almost halfexisting infrastructure. Starlee Sykes SVP, Gulf of BP’s upstream portfolio is natural gas,Mexico and severalCanada See pages 20 and 24 for more gas projects are planned to come onstreamexamples of our strategy in the next few years. As the world moves towards net zero emissions, we think natural gas can play an important role in getting us there. When burned for power, natural gas has, on average on a lifecycle basis, about half the GHG emissions of coal, with fewer air pollutants, so expanding its use globally to displace coal Energy with purpose will help to reduce carbon emissions. In fact, switching from coal to gas has avoided more than 500 million tonnes of CO2 from the power Gas in Oman sector globally since 2010. BP successfully brought the Khazzan major project into production in 2017, Progress in 2019 and since then we’ve continued to build We’ve started up 24 of the 35 planned successful partnerships and reinforce major projects since 2016 and are on track our commitment to the country. to deliver 900,000 barrels of oil equivalent Exploration opportunity per day of new major project production by Together with Eni, we signed an the end of 2021. exploration and production-sharing agreement for Block 77 in central Oman • Sanctioned $6 billion Azeri Central East with the Ministry of Oil and Gas of the development with partners. Sultanate of Oman. • Agreed to sell our Alaska assets to Hilcorp. • The block covers a total area of • Sanctioned the third project in block more than 2,700 square kilometres. KG D6, offshore India with our • It is located 30 kilometres east of partner Reliance. Block 61, where the Khazzan gas field is already producing around 1 billion cubic feet of gas a day. • BP and Eni will each hold a 50% interest, subject to royal decree, with Eni acting as operator during 5 $100m exploration. major project fund for projects that will start ups. help reduce greenhouse Khazzan phase two gas emissions. Ghazeer, the second development phase of the gas field, is expected to come online in 2021. Advantaged gas We used expertise and technology from our US onshore business to help access tight gas locked in the Khazzan field and bring it commercially to market. Detecting methane We installed and tested continuous measurement of methane emissions at our Khazzan central processing facility. The technology uses instruments such as a gas cloud imaging camera to continuously monitor our facilities, quickly identify new leaks and reduce time taken to respond. We now aim to install methane measurement at all our existing major oil and gas processing sites by 2023. For more information see Upstream on page 50. BPaction.
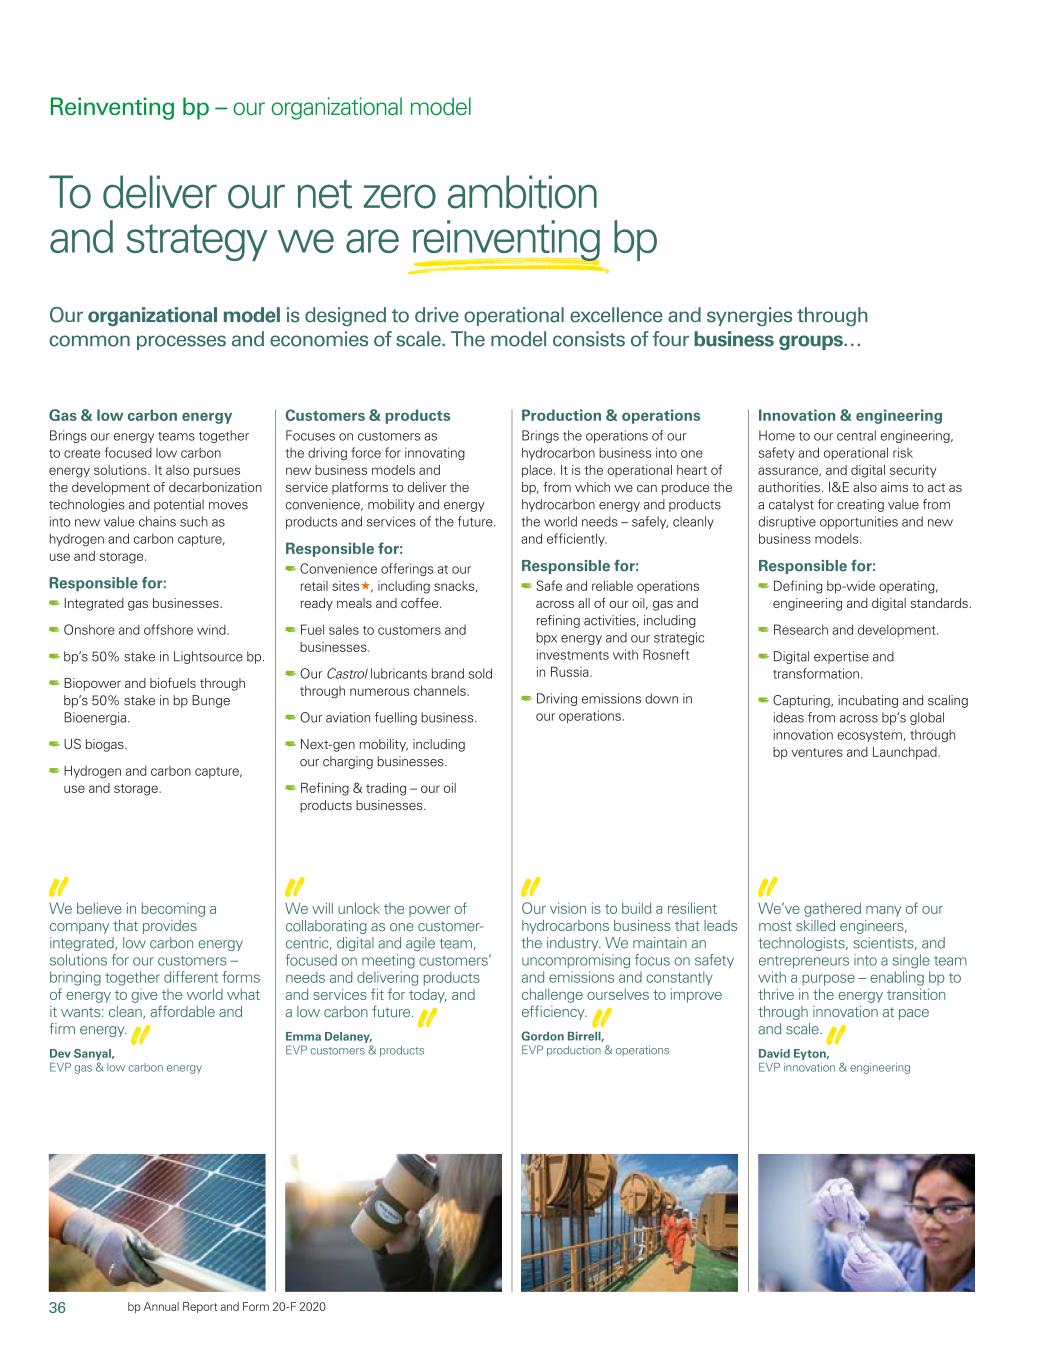
36 bp Annual Report and Form 20-F 2019 25
2020 Reinventing bp – our organizational model Our organizational model is designed to drive operational excellence and synergies through common processes and economies of scale. The model consists of four business groups… Production & operations Brings the operations of our hydrocarbon business into one place. It is the operational heart of bp, from which we can produce the hydrocarbon energy and products the world needs – safely, cleanly and efficiently. Responsible for: Safe and reliable operations across all of our oil, gas and refining activities, including bpx energy and our strategic investments with Rosneft in Russia. Driving emissions down in our operations. Customers & products Focuses on customers as the driving force for innovating new business models and service platforms to deliver the convenience, mobility and energy products and services of the future. Responsible for: Convenience offerings at our retail sites«, including snacks, ready meals and coffee. Fuel sales to customers and businesses. Our Castrol lubricants brand sold through numerous channels. Our aviation fuelling business. Next-gen mobility, including our charging businesses. Refining & trading – our oil products businesses. Gas & low carbon energy Brings our energy teams together to create focused low carbon energy solutions. It also pursues the development of decarbonization technologies and potential moves into new value chains such as hydrogen and carbon capture, use and storage. Responsible for: Integrated gas businesses. Onshore and offshore wind. bp’s 50% stake in Lightsource bp. Biopower and biofuels through bp’s 50% stake in bp Bunge Bioenergia. US biogas. Hydrogen and carbon capture, use and storage. Innovation & engineering Home to our central engineering, safety and operational risk assurance, and digital security authorities. I&E also aims to act as a catalyst for creating value from disruptive opportunities and new business models. Responsible for: Defining bp-wide operating, engineering and digital standards. Research and development. Digital expertise and transformation. Capturing, incubating and scaling ideas from across bp’s global innovation ecosystem, through bp ventures and Launchpad. We will unlock the power of collaborating as one customer- centric, digital and agile team, focused on meeting customers’ needs and delivering products and services fit for today, and a low carbon future. Emma Delaney, EVP customers & products We believe in becoming a company that provides integrated, low carbon energy solutions for our customers – bringing together different forms of energy to give the world what it wants: clean, affordable and firm energy. Dev Sanyal, EVP gas & low carbon energy We’ve gathered many of our most skilled engineers, technologists, scientists, and entrepreneurs into a single team with a purpose – enabling bp to thrive in the energy transition through innovation at pace and scale. David Eyton, EVP innovation & engineering Our vision is to build a resilient hydrocarbons business that leads the industry. We maintain an uncompromising focus on safety and emissions and constantly challenge ourselves to improve efficiency. Gordon Birrell, EVP production & operations To deliver our net zero ambition and strategy we are reinventing bp
26 BP
37 Strategic report bp Annual Report and Form 20-F 2019

Strategic report Market-led growth2020 Leadership culture We are transforming the culture of bp. It’s all about people and that begins with leadership. In 2020 we undertook a fundamental review of our organization and selected new leaders from the executive level down. These top 120 leaders were selected because they reflected a number of key attributes required to drive bp’s transformation. A track record of delivery. Curious and open-minded. Purpose-driven. Lead through our values – especially safety. Empathetic. From left to right: Emma Delaney EVP, customers & products Dev Sanyal EVP, gas & low carbon energy David Eyton EVP, innovation & engineering Gordon Birrell EVP, production & operations William Lin EVP, regions, cities & solutions Carol Howle EVP, trading & shipping Giulia Chierchia EVP, strategy & sustainability Bernard Looney Chief executive officer Geoff Morrell EVP, communications & advocacy Kerry Dryburgh EVP, people & culture Eric Nitcher EVP, legal Murray Auchincloss Chief financial officer Regions, cities & solutions brings together the best of bp to build enduring relationships with regions, countries, cities and corporations around the world to provide innovative, integrated and decarbonized energy solutions at scale to help the world reach net zero and improve people’s lives. Trading & shipping harnesses the deep expertise of our existing supply, trading and shipping businesses. bp already has world-leading expertise in the Downstream Whatintegration of businesses, customers and markets. Communications & advocacy helps translate bp’s strategy into a coherent narrative for staff and society, manages corporate reputation and leads policy, advocacy and campaigns. working with three integrators, to facilitate collaboration and unlock value... and four teams who serve as enablers of business delivery. Strategy & sustainability embeds sustainability at the top of the organization and forms a single group-wide approach to strategy and capital allocation. Finance stewards bp’s financial frame, maintains financial integrity and manages procurement activities. Legal delivers legal support to bp, focused on material risk, value and growth. People & culture helps bp recruit world-class talent, develops them, and supports them to do their best work. And of this strategic priority means We aim to innovate with advanced productsteam, 38% are women and strategic partnerships, building competitively advantaged businesses that deliver profitable marketing growth. We aim to invest in higher-returning fuels marketing28% identify as racial and lubricants businesses with growth potential and reliable cash flows. Andethnic minorities. This is good progress, but still not good enough. As a leadership, we are continuing to expand into Energy with purpose fast-growing emerging markets. We are also delivering and developing new products, offers and business models Electrifying China that supportnot yet fully reflective of bp as a whole or the transition to a lower BP has joined forces with DiDi, the carbon and digitally enabled future over world’s leading mobile transportation the longer term. platform, to build an electric vehicle (EV) charging networkcommunities in China. Progress in 2019 Why it matters We have continued to make strategic China is the largest and fastest- developing EV market. progress in fuels marketing, with our convenience partnership model now in • 50% of the world’s battery EVs around 1,600 sites across the network. are in China. • DiDi offers a full range of app-based • Agreed to expand our partnership with services across Asia, Latin America Reliance Industries Ltd to include a retail and Australia, including ride-hailing, service station network and aviation fuels automobile solutions and other offers. business across India. • The platform has 550 million users, • Continued to expand in other material tens of millions of drivers and serves markets – most notably in Mexico wherewhich we around 1 million EVs. now have more than 520 BP-branded retail What’s involved sites. We also continued to grow our The joint venture plans to develop network in Indonesia and expanded our high-quality EV charging hubsoperate. See page 57 for China network into Shandong and Hebei DiDi users and other drivers. provinces through our joint venture with • The partners intend to add loyalty, Dongming. convenience and fleet services • Announced the development of BP Infinia, in the future. an enhanced recycling technology, capable Why we’re doing it of processing currently unrecyclable PET As the world’s largest EV market, China plastic waste. offers extraordinary opportunities to develop innovative new businesses at scale and we see this as the perfect partnership for such a fast-evolving environment. The lessons we learn here will help further expand BP’s advanced >1,20 0 ~1,600 mobility business worldwide, helping retail sites in new convenience drive the energy transition and develop markets of China, partnership sites. solutions for a low carbon world. Mexico and Indonesia. And elsewhere BP Chargemaster is powering around 1.5 million electric miles a week, making this the most-used public charging infrastructure operator in the UK. We have also begun rolling out 150kW ultra-fast chargers on BP forecourts across the UK with plans to build a national network of high-power charging – one which will closely replicate the current fuelling experience. This is helping to accelerate the adoption of EVs, by making EV charging fast, convenient and For more information see Downstream on hassle-free.diversity and inclusion in bp. See page 56. BP38 for more information on our financial reporting segments. See page 78 for our leadership team biographies.

38 bp Annual Report and Form 20-F 2019 27

Venturing and2020 Changing how we report Gas & low carbon energya comprises regions with upstream businesses that predominantly produce natural gas, gas trading activities and the group’s renewables businesses, including biofuels, solar and wind. Gas-producing regions were previously reported in the Upstream segment, and our renewables businesses were previously reported as part of Other businesses and corporate. Oil production & operationsa comprises regions with upstream activities that predominantly produce crude oil, including bpx energy. These were previously reported in the Upstream segment. Customers & products comprises the group’s customer-focused businesses, spanning convenience and mobility, which includes fuels retail and next-gen offers such as electrification, as well as aviation, midstream, and Castrol lubricants. It also includes our oil products businesses, refining & trading. The petrochemicals business will also be reported in restated comparative information as part of customers & products up to its sale in December 2020. This segment is unchanged from the former Downstream segment with the exception of the disposal of our petrochemicals business. The Rosneft segment is unchanged and continues to include equity-accounted earnings from our strategic investment in Rosneft. Other businesses & corporate comprises our innovation & engineering business including bp ventures and Launchpad, regions, cities & solutions; and our corporate activities & functions. a The AGT and Middle East regions have been further subdivided by asset. See page 36 for our organizational model. Our new financial reporting model functions across multiple fronts What this strategic priority means “Pairing Calysta’s exciting We aimthe organization to pursue new opportunities to technology and meet evolving technology, consumer and entrepreneurial drive with policy trends. BP’s global scale and gas We are building upmaximize commercial value along integrated value chains. Reinventing bp – our renewable energy market expertise offers the portfolio – with activities spanning renewable opportunity to improve food fuels and products, wind and solar energy security and sustainability.” and biopower. We work across multiple fronts through our investments infinancial reporting segments Gas & low carbon Dominic Emeryenergy Oil production & operations Customers & productsd Rosneft Other businesses & corporate Gas Gas regionsc Gas marketing & trading Integrated gas & power Low carbon energy Low carbon electricity Bioenergy CCUS Hydrogen Oil regionsc Customers: convenience & mobility Convenience Mobility: fuels retail Mobility: next-gen Castrol Aviation, B2B, midstream Products: refining & trading Refining Oil & oil products trading bp ventures Launchpad Corporate activities Rosneft Upstream Rosneft Other businesses & corporate Downstream Mapping our 2020 segment reporting to our 2021 financial reporting segmentsb As set out in our organization model on page 36, operationally, our hydrocarbon businesses, including refining, will be managed together. However, the financial results of our oil, gas and refining operations will be reported separately, acknowledging opportunities for commercial integration. Gas will be reported together with joint ventures, collaborations Group chief of staff and new business models. Through BP Ventures we have invested more than $650 million in around 40 companies since it was set up in 2007. Our investments support technologies and innovations that we believe could benefit BP and global energy systems. Progress in 2019 We increased our stake in Lightsource BP to create a 50:50 joint venture and expanded Energy with purpose our biofuels business in Brazil by more than 50%, through a joint venture with Bunge to create BP Bunge Bioenergia. We also made a Using gas to create number of other investments spanning a range sustainable fish food of strategic focus areas. BP Ventures has invested $30 million • Started BP Launchpad, our scale-up factory, o help create new marketslow carbon businesses. This recognizes the potential for our designed to help quickly grow disruptive natural gas in the fish-farming industry. technologies and business models which could become future BP business units. What we’re doing We’re extending the ideaincreasing integration of gas • Expandedvalue chains with our digital energy portfolio bylow carbon businesses. Refining will be reported as a source of energy beyond its investing in Grid Edge, which has developed conventional applications, through an artificial intelligence-based energy our investment in California start-up, management platform that helps customers Calysta, to create Feedkind® – protein predict, control and optimize their buildings’ food for fish, livestock and pets. energy profile. Why it matters • Invested $5 million in Belmont Technology Finding sustainable ways to feed to further strengthen BP’s artificial a growing global population within intelligence and digital capabilities. planetary boundaries is a pressing issue and Calysta can be part of the solution: • Feedkind® is produced with fewer resources, such as water and land, >50% 7 than current alternatives. increase in biofuels new investments • Existing protein sources, including business in Brazil, through BP Ventures fishmeal and soya bean protein, are through BP Bunge in 2019. either at full capacity or connected to Bioenergia. other issues such as deforestation. • The global aquaculture market is expected to grow by around 25% by 2025 and Feedkind® offers a way to support this increase sustainably. How it works Naturally occurring bacteria is fermented using methane from gas as its energy source. The protein created is harvested, dried and sold in pellet form. Why we’re doing it The investment supports BP’s strategycustomers & products segment, recognizing the importance of creating new markets in which gas can deliver a more sustainable future.maintaining our integrated fuels value chains. For more information see page 63. 28 BPon how our hydrocarbon operations are split between the oil production & operations, gas & low carbon energy, and customers & products segments visit bp.com. b Not a comprehensive list of businesses reported in each segment. c Regions disclosed on bp.com under segment financial disclosure framework. d Includes respective low carbon results, such as bio co-processing.
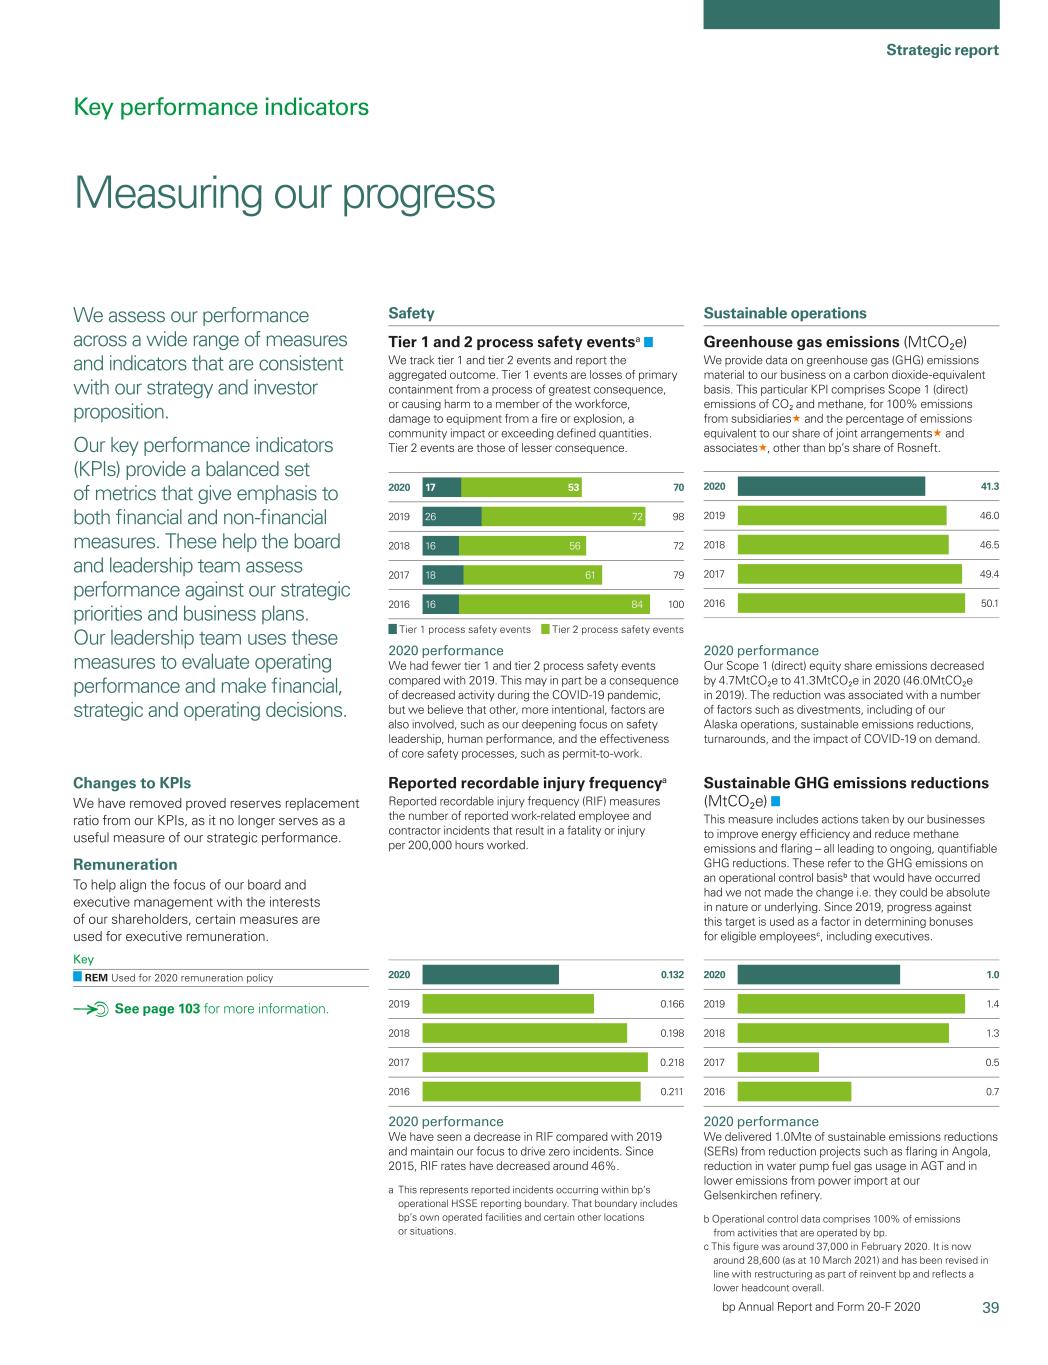
39 Strategic report 2019 9826 72 2020 7017 53 2018 7216 56 2017 7918 61 2016 10016 84 Tier 1 process safety events Tier 2 process safety events 2019 0.166 2020 0.132 2018 0.198 2017 0.218 2016 0.211 2019 46.0 2020 41.3 2018 46.5 2017 49.4 2016 50.1 2019 1.4 2020 1.0 2018 1.3 2017 0.5 2016 0.7 bp Annual Report and Form 20-F 2019

Strategic report BP Annual Report and Form 20-F 2019 29

“This programme reflects2020 Key performance indicators Changes to KPIs We have removed proved reserves replacement ratio from our commitment to beKPIs, as it no longer serves as a leader in advancing the energy transition by maximizing the benefits of natural gas.” Gordon Birrell Chief operating officer– production, transformation and carbon 30 BP Annual Report and Form 20-F 2019

Strategic report Modernizing the whole group What this strategic priority means We aim to simplify our processes and enhance our productivity through digital solutions. We achieve this through three pillars: • Agility – improving and simplifying the way we operate. • Mindset change – accepting the reality and adopting the right attitude for a business that is increasingly competitive and margin-dependent. • Digital transformation – digitizing and automating our work. Progress in 2019 We’ve introduced a range of technologies and improved ways of working across BP to support our modernization priority. Our mentors and coaches deliver a programme of training for employees to share agile practices and support changing mindsets, which are key to generating ideas to improve how we work Energy with purpose across the whole business. • Launched ‘Connected BP’ in partnership with data technology pioneer Palantir. Managing methane The programme connects different BP is introducing a programme of new systems and business areas into one and complementary technologies to platform where users can connect, continuously detect,useful measure and transform and share data. help reduce methane emissions at • Developed a holistic process for leak our BP-operated upstream assets. detection and intervention using infrared Why it matters cameras, lasers and drone technology at Methane is the primary component our US onshore BPX Energy operations. of natural gas. If it escapes into the • Performed a concept trial of Spot, a robot atmosphere unburnt, it can be a from Boston Dynamics, at our US Whiting potent greenhouse gas. refinery. Spot can gather data, detect What we’re doing abnormalities and perform tasks, such We aim to install methane as detecting gas emissions and helping measurement, such as gas cloud remove people from hazardous spaces. imaging, at all BP’s major oil and gas processing sites by 2023 and then reduce methane intensity of our operations by 50%. What else? We’re also planning to deploy a new >1,000 ~$1.5bn generationstrategic performance. Remuneration To help align the focus of drones, hand-held devices transformation projects invested every yearour board and multi-spectral flare combustion running in the Upstream. in maintaining BP’s cameras – drawing upon scientific infrastructure. breakthroughs made in diverse fields, spanning healthcare, space exploration and defence. Collaboration with stakeholders We have agreed to work in collaborationexecutive management with the Environmental Defense Fund, a New York-based non-profit environmental advocacy group. The three-year commitment aims to advance technologies and practices to reduce methane emissions from the global oil and gas supply chain. BP Annual Report and Form 20-F 2019 31

interests of our shareholders, certain measures are used for executive remuneration. Key REM Used for 2020 remuneration policy See page 103 for more information. Measuring our progress We assess our performance across a wide range of measures and indicators that are consistent with our strategy and investor proposition. Our key performance indicators (KPIs) provide Changes to KPIs Remuneration a balanced set of metrics that give emphasis • Added sustainable GHG emission To help align the focus of our board and to both financial and non-financial measures. reductions and methane intensity, in line executive management with the interests of These help the board and executive with our ‘reduce, improve, create’ our shareholders, certain measures are used managementleadership team assess performance against our framework. for executive remuneration. strategic priorities and business plans. BP • Removed production as a volume measure Key managementOur leadership team uses these measures to evaluate as it doesn’t reflect our value over volume New/amended operating performance and make financial, approach, and is not used to assess New or amended in 2019 strategic and operating decisions. executive remuneration. The metric is REM reported on At a glance, page 9. Used for the remuneration policy • Combined tier 1 and tier 2 process safety events, giving investors a wider view of For more information see Directors’ process safety events. remuneration report on page 100. • As reported in 2018, we have now revised our refining availability metric to BP‑operated refining availability, to more closely match our upstream plant reliability measure. SafetySustainable operations Tier 1 and 2 process safety eventsa We track tier 1 and tier 2 events and report the 2019 26 72 98 2019 performance aggregated outcome. Tier 1 events are losses of The total number of tier 1 and tier 2 process primary containment from a process of greatest 2018 16 56 72 safety events increased in 2019, mainly consequence, –or causing harm to a member of the reflecting performance in assets acquired over 2017 18 61 79 workforce, damage to equipment from a fire or the past 18 months. Underlying performance explosion, a community impact or exceeding 2016 16 84 100 across the group improved slightly from 2018. defined quantities. Tier 2 events are those of We are implementing BP procedures and lesser consequence. 2015 20 83 103 processes to help bring newly acquired assets Tier 1 Tier 2 in line with BP assets.Safety Reported recordable injury frequencya Reported recordable injury frequency (RIF) 2019 0.166 2019 performance measures the number of reported work-related employee and contractor incidents that result in a fatality or injury per 200,000 hours worked. 2020 performance We had fewer tier 1 and tier 2 process safety events compared with 2019. This may in part be a consequence of decreased activity during the COVID-19 pandemic, but we believe that other, more intentional, factors are also involved, such as our deepening focus on safety leadership, human performance, and the effectiveness of core safety processes, such as permit-to-work. 2020 performance We have seen a decrease in RIF compared with employee and contractor incidents that result in a 2018 0.198 2018;2019 and maintain our focus to drive toward zero fatality or injury per 200,000 hours worked. incidents. 2017 0.218 2016 0.211Since 2015, 0.243RIF rates have decreased around 46%. a This represents reported incidents occurring within BP’sbp’s operational HSSE reporting boundary. That boundary includes BP’sbp’s own operated facilities and certain other locations or situations. 32 BP Annual Report and Form 20-F 2019

Strategic report Sustainable operations Proved reserves replacement ratio (%) Proved reserves replacement ratio is the extent to 2019 67 2019 performance which the year’s production has been replaced by The lower ratio reflects a net decrease of reserves proved reserves added to our reserve base. 2018 100 due to lower gas and oil prices mainly within the US Lower 48, partly offset by new developments The ratio is expressed in oil-equivalent terms and 2017 143 and existing field optimization in Angola, includes changes resulting from discoveries, Argentina, Azerbaijan, India, Oman, Russia improved recovery and extensions and revisions 2016 109 and the US. to previous estimates, but excludes changes 2015 61 resulting from acquisitions and disposals. The ratio reflects both subsidiaries and equity‑accounted entities. This measure helps to demonstrate our success in accessing, exploring and extracting resources. Upstream unit production costs ($/boe) The upstream unit production cost indicator 2019 6.84 2019 performance shows how supply chain, headcount and scope Lower production costs compared with 2018 optimization impact cost efficiency. 2018 7.15 were mainly due to the impacts of IFRS 16. 2017 7.11 2016 8.46 2015 10.46 Upstream plant reliability (%) BP-operated upstream plant reliability is 2019 94.4 2019 performance calculated as 100% less the ratio of total Plant reliability was 1.3% lower than 2018 mainly unplanned plant deferrals divided by installed 2018 95.7 due to design and integrity issues addressed production capacity. through maintenance activities. 2017 94.7 2016 95.3 2015 95.0 90.0 Downstream refining availability (%) Refining availability represents Solomon 2019 94.9 2019 performance Associates’ operational availability for BP- Refining availability was similar to 2018, reflecting operated refineries. The measure shows the 2018 95.0 continued strong operational performance in our percentage of the year that a unit is available for portfolio. This performance is underpinned by our 2017 95.2 processing after deducting the time spent on global reliability programmes. turnaround activity and all mechanical, process 2016 95.2 and regulatory downtime. 2015 94.6 Refining availability is an important indicator of the operational performance of our downstream 90.0 businesses. Major project delivery We monitor the progress of our major projects to 2019 5 2019 performance gauge whether we are delivering our core pipeline We started up five major projects in Egypt, of projects under construction on time. 2018 6 Trinidad, the UK and US. Projects take many years to complete, requiring 2017 7 differing amounts of resource, so a smooth or increasing trend should not be anticipated. 2016 6 Major projects are defined as those with a BP net 2015 4 investment of at least $250 million, or considered to be of strategic importance to BP, or of a high degree of complexity. BP Annual Report and Form 20-F 2019 33

Sustainable operations Greenhouse gas emissions (MtCO2e) We provide data on greenhouse gas (GHG) 2019 46.0 2019 performance emissions material to our business on a Our Scope 1 (direct) equity share emissions carbon dioxide-equivalent basis. This particular 2018 46.5 decreased by 0.5MtCO2e to 46.0MtCO2e in 2019 KPI comprises Scope 1 (direct) emissions of (46.5MtCO2e in 2018). Emissions resulting from 2017 49.4 CO2 and methane, for 100% emissions from the BHP acquisitions were balanced out by subsidiaries« and the percentage of emissions 2016 50.1 sustainable emissions reductions and the impact equivalent to our share of joint arrangements of divestments.arrangements« and associatesassociates«, other than BP’sbp’s share 2015 49.0 of Rosneft. Sustainable GHG emissions reductionreductions (MtCO2e) This measure includes actions taken by our 2019 1.4 2019 performance businesses to improve energy efficiency and We delivered 1.4Mte of sustainable emissions reduce methane emissions and flaring –– all leading 2018 1.3 reductions (SERs), and this meant we exceeded to ongoing, quantifiable GHG reductions. These our target of 3.5Mte of SERs for the period 2016 2017 0.5 refer to the GHG emissions on an operational control basisb that would have to 2025, six years ahead of schedule. occurred had we not made the change i.e. they 2016 0.7 could be absolute in nature or underlying. Since 2019, progress against this target is used as a 2015 0.2 factor in determining bonuses for eligible employeesc, including executives. 2020 performance Our Scope 1 (direct) equity share emissions decreased by 4.7MtCO2e to 41.3MtCO2e in 2020 (46.0MtCO2e in 2019). The reduction was associated with a number of factors such as divestments, including of our Alaska operations, sustainable emissions reductions, turnarounds, and the impact of COVID-19 on demand. 2020 performance We delivered 1.0Mte of sustainable emissions reductions (SERs) from reduction projects such as flaring in Angola, reduction in water pump fuel gas usage in AGT and in lower emissions from power import at our Gelsenkirchen refinery. b Operational control data comprises 100% of emissions from activities that are operated by bp. c This figure was around 37,000 employees, including executives.in February 2020. It is now around 28,600 (as at 10 March 2021) and has been revised in line with restructuring as part of reinvent bp and reflects a lower headcount overall.
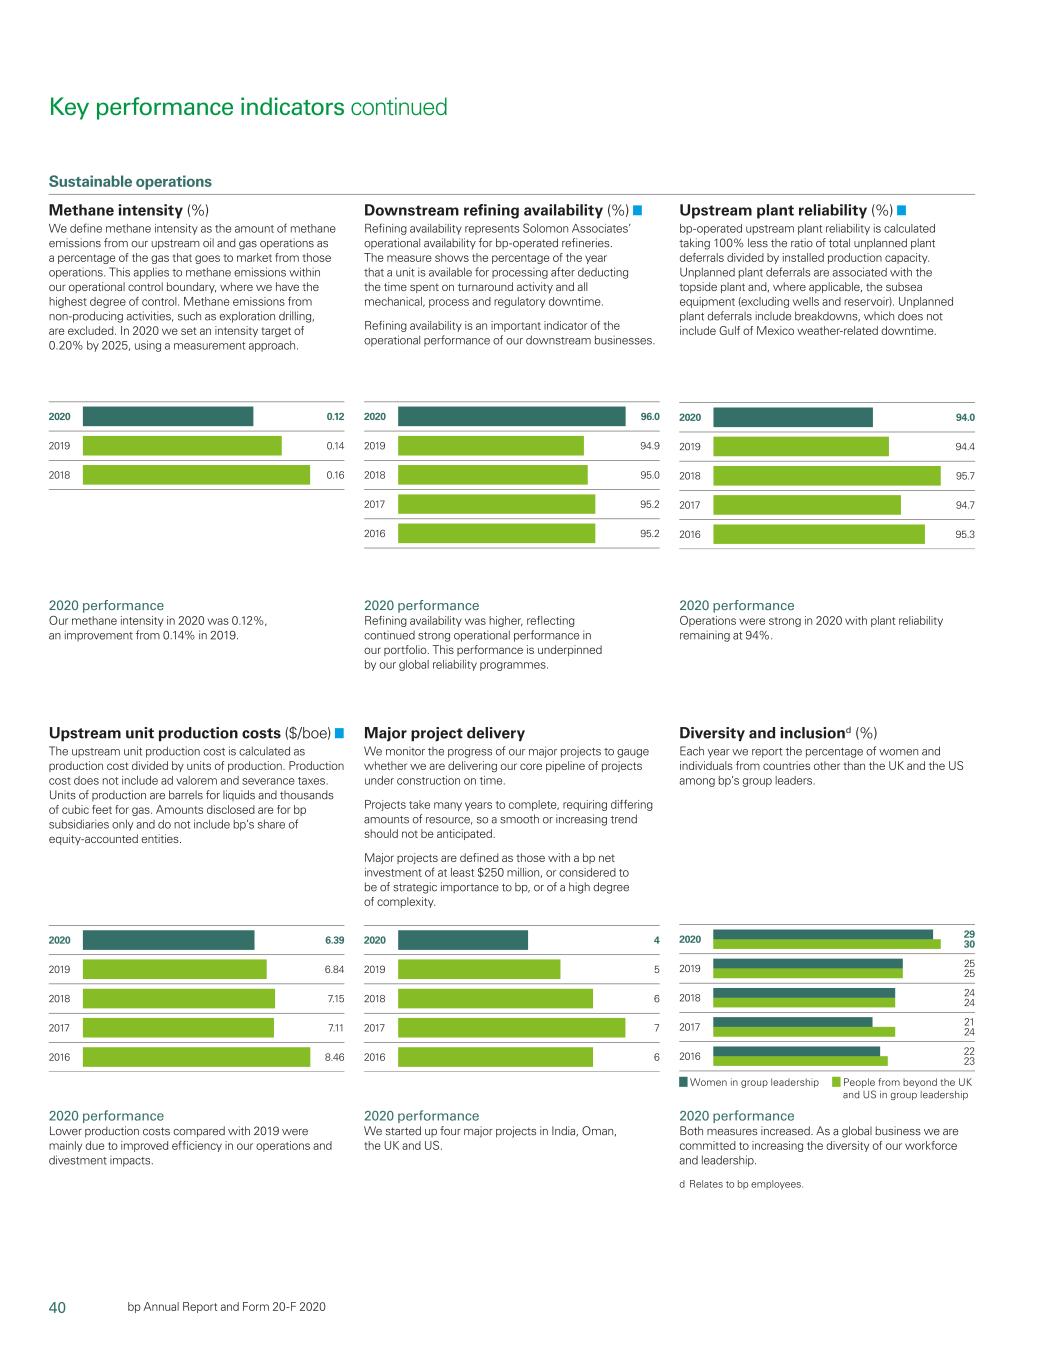
40 2019 0.14 2020 0.12 2018 0.16 2019 25 2020 29 2018 24 2017 21 2016 22 25 30 24 24 23 Women in group leadership People from beyond the UK and US in group leadership 2019 94.4 2020 94.0 2018 95.7 2017 94.7 2016 95.3 2019 94.9 2020 96.0 2018 95.0 2017 95.2 2016 95.2 2019 6.84 2020 6.39 2018 7.15 2017 7.11 2016 8.46 2019 5 2020 4 2018 6 2017 7 2016 6 bp Annual Report and Form 20-F 2020 Key performance indicators continued Methane intensity (%) We define methane intensity as the amount of 2019 0.14 2019 performance methane emissions from our upstream oil and gas Our methane intensity was 0.14%, a reduction operations as a percentage of the gas that goes to 2018 0.16 from 0.16% in 2018 and below our stated target market from those operations. This applies to of 0.2%. methane emissions within our operational control boundary, where we have the highest degree of control. Methane emissions from non-producing activities, such as exploration drilling, are excluded. We haveIn 2020 we set an existing methaneintensity target of 0.2%0.20% by 2025, using a measurement approach. 2020 performance Our methane intensity in 2020 was 0.12%, an improvement from 0.14% in 2019. 2020 performance Both measures increased. As a global business we are committed to increasing the diversity of our workforce and a new ambition that seeksleadership. d Relates to reduce that – once validated – by 50%.bp employees. Diversity and inclusionbinclusiond (%) 25 Each year we report the percentage of women and 2019 2019 performance individuals from countries other than the UK and 25 Both measures increased slightly. As a global the US among BP’sbp’s group leaders. businessUpstream plant reliability (%) bp-operated upstream plant reliability is calculated taking 100% less the ratio of total unplanned plant deferrals divided by installed production capacity. Unplanned plant deferrals are associated with the topside plant and, where applicable, the subsea equipment (excluding wells and reservoir). Unplanned plant deferrals include breakdowns, which does not include Gulf of Mexico weather-related downtime. 2020 performance Operations were strong in 2020 with plant reliability remaining at 94%. Sustainable operations Downstream refining availability (%) Refining availability represents Solomon Associates’ operational availability for bp-operated refineries. The measure shows the percentage of the year that a unit is available for processing after deducting the time spent on turnaround activity and all mechanical, process and regulatory downtime. Refining availability is an important indicator of the operational performance of our downstream businesses. 2020 performance Refining availability was higher, reflecting continued strong operational performance in our portfolio. This performance is underpinned by our global reliability programmes. Upstream unit production costs ($/boe) The upstream unit production cost is calculated as production cost divided by units of production. Production cost does not include ad valorem and severance taxes. Units of production are barrels for liquids and thousands of cubic feet for gas. Amounts disclosed are for bp subsidiaries only and do not include bp’s share of equity-accounted entities. 2020 performance Lower production costs compared with 2019 were mainly due to improved efficiency in our operations and divestment impacts. Major project delivery We monitor the progress of our major projects to gauge whether we are committeddelivering our core pipeline of projects under construction on time. Projects take many years to complete, requiring differing amounts of resource, so a smooth or increasing the 24 2018 diversitytrend should not be anticipated. Major projects are defined as those with a bp net investment of our workforce and leadership. 24 21 2017 24 22 2016 23 19 2015 21 Womenat least $250 million, or considered to be of strategic importance to bp, or of a high degree of complexity. 2020 performance We started up four major projects in group leadership People from beyondIndia, Oman, the UK and US in group leadership b RelatesUS.
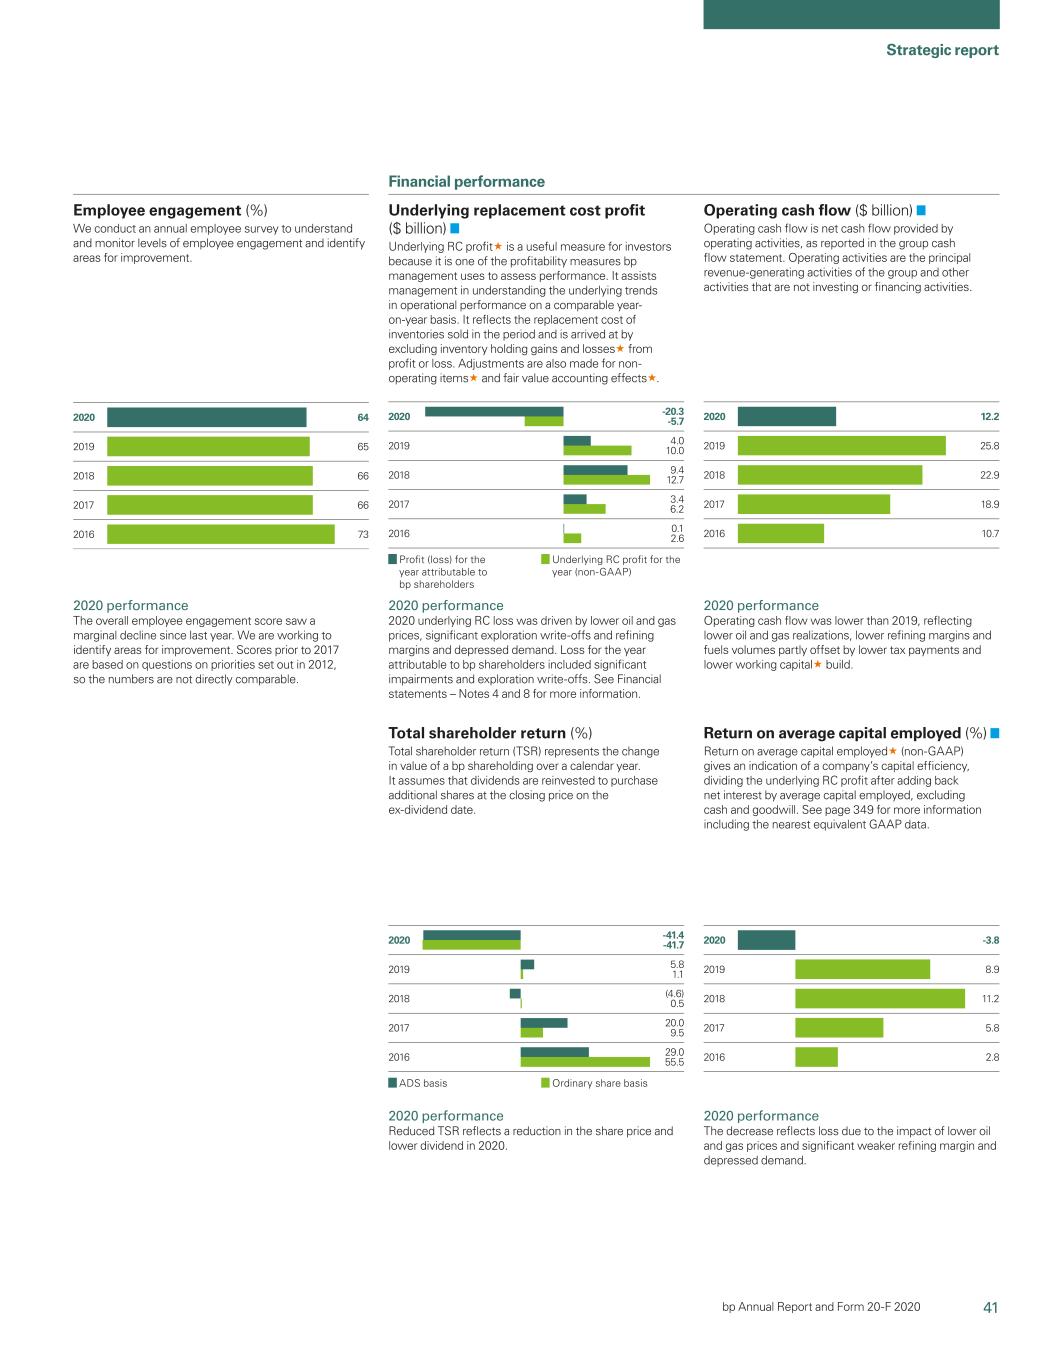
41 Strategic report 2019 65 2020 64 2018 66 2017 66 2016 73 2019 4.0 2020 -20.3 2018 9.4 2017 3.4 2016 0.1 10.0 -5.7 12.7 6.2 2.6 Profit (loss) for the year attributable to BP employees.bp shareholders Underlying RC profit for the year (non-GAAP) 2019 2020 2018 2017 2016 25.8 12.2 22.9 18.9 10.7 2019 8.9 2020 -3.8 2018 11.2 2017 5.8 2016 2.8 2019 5.8 2020 -41.4 2018 (4.6) 2017 20.0 2016 29.0 1.1 -41.7 0.5 9.5 55.5 ADS basis Ordinary share basis bp Annual Report and Form 20-F 2020 Employee engagement (%) We conduct an annual employee survey to 2019 65 2019 performance understand and monitor levels of employee The overall employee engagement score saw engagement and identify areas for improvement. 2018 662020 performance The overall employee engagement score saw a marginal decline since last year. We are working to identify areas for improvement. Scores prior 2017 66 to 2017 are based on questions on priorities 2016 73 set out in 2012, so the numbers are not directly comparable. 2015 71 34 BP Annual Report and Form 20-F 2019

Strategic report Financial performance Underlying replacement cost profit ($ billion) Underlying RC profitprofit« is a useful measure for 4.0 2019 performance 2019 investors because it is one of the profitability 10.0 2019 underlying RC profit was lower, largely measures BPbp management uses to assess reflecting the impact of the weaker price performance. It assists management in 9.4 environment. Profit for the year was significantly 2018 understanding the underlying trends in operational 12.7 lower, due to the above factor, divestment-related performance on a comparable year-on-yearyear- on-year basis. impairment charges and reclassification of past 3.4 foreign exchange losses on the formation of the It reflects the replacement cost of inventories sold 2017 6.2 BP Bunge Bioenergia joint venture. in the period and is arrived at by excluding inventory holding gains and losseslosses« from profit or 0.1 2016 loss. Adjustments are also made for non‑non- operating 2.6 itemsitems« and fair value accounting effectseffects«. (6.5) 2015 5.9 Profit (loss) for the year attributable to BP shareholders Underlying RC profit for the year (non-GAAP) Operating cash flow ($ billion) Operating cash flow is net cash flow provided 2019 25.8 2019 performance by operating activities, as reported in the group Operating cash flow was higher than 2018, cash flow statement. Operating activities are the 201� 22�9 reflecting lower Gulf of Mexico oil spill payments principal revenue-generating activities of the and the favourable impact of lease payments 201� 1��9 group and other activities that are not investing that are now classified as financing cash flows or financing activities. 201� 10�� under IFRS 16. 201� 19�1Financial performance Return on average capital employed (%) Return on average capital employedemployed« (non-GAAP) 2019 8.9 2019 performance gives an indication of a company’scompany’s capital The decrease reflects lower profit due to the efficiency, dividing the underlying RC profit after 201� 11�2 impact of lower oil and gas prices and weaker adding back net interest by average capital refining environment. 201� ��� employed, excluding cash and goodwill. See page 345349 for more information including the nearest 201� 2�� equivalent GAAP data. 201� ��� Total shareholder return (%) Total shareholder return (TSR) represents the 5.8 2019 performance 2019 change in value of a BPbp shareholding over a 1.1 Improvement in TSR reflects increased dividends calendar year. It assumes that dividends are in 2019. reinvested to purchase additional shares at the ����� 201� closing price on the ex-dividend date. 0�� We are committed2020 performance 2020 underlying RC loss was driven by lower oil and gas prices, significant exploration write-offs and refining margins and depressed demand. Loss for the year attributable to maintainingbp shareholders included significant impairments and exploration write-offs. See Financial statements – Notes 4 and 8 for more information. 2020 performance Operating cash flow was lower than 2019, reflecting lower oil and gas realizations, lower refining margins and fuels volumes partly offset by lower tax payments and lower working capital« build. 2020 performance The decrease reflects loss due to the impact of lower oil and gas prices and significant weaker refining margin and depressed demand. 2020 performance Reduced TSR reflects a progressive 20�0 201�reduction in the share price and sustainablelower dividend policy. 9�� 29�0 201� ���� �12��� 201� ����� A�S �a�i� �rdinar� ��are �a�i� BPin 2020.
42 bp Annual Report and Form 20-F 2019 35

2020 Group performance “DespiteGroup performance In the challenging environmentface of many challenges in 2019,2020, we continued to deliver operating cash flow growth, which together with continued capital discipline has underpinned growth in free cash flow. Furthermore, we have made significantstrengthened our finances and drove progress towards our $10$35 billion divestmentnet debt target. Together this supportedA resilient balance sheet, a coherent approach to capital allocation and a disciplined approach to investment are the principles which underpin our decisionfinancial frame. Our strategy and financial frame are expected to increasedrive strong growth, improved returns and a sustainable reallocation of our capital employed toward the dividend with the fourth-quarter results.” Dr Brian Gilvaryenergy transition, all in support of creating long-term value for shareholders. Murray Auchincloss Group chief financial officer $10.0bn Underlying replacement cost (RC) profit (2018 $12.7bn) $4.0bn $25.8bn Profit attributable to BP shareholders Operating cash flow (2018 $9.4bn) (2018 $22.9bn) Financial and operating performance $ million except per share amounts 2020 2019 2018 2017 Segment RC profitSales and other operating revenues 180,366 278,397 298,756 Profit (loss) before Profit before interest and taxation (21,740) 11,706 19,378 9,474 interest and tax Finance costs and net finance expense relating to pensions and (3,552) (2,655) (2,294) ($ billion) other post-retirement benefits (3,148) (3,552) (2,655) Taxation 4,159 (3,964) (7,145) (3,712) 2019 Non-controlling interests 424 (164) (195) (79) 2018 ProfitProfit (loss) for the yearayear attributable to bp shareholders (20,305) 4,026 9,383 3,389 2017 Inventory holding (gains) losseslosses«, before tax 2,868 (667) 801 (853) (5) 0 5 10 15 20 25 Taxation charge (credit) on inventory holding gains and losses (667) 156 (198) 225 ● Upstream ● Downstream ● Rosneft RC profitprofit (loss)« for the year attributable to bp shareholders (18,104) 3,515 9,986 2,761 ● Other businesses and corporate (includes Net (favourable) adverse impact of non-operating items 8,263 3,380 3,730 costs related to the Gulf of Mexico oil spill) ● Consolidation adjustment – UPll★items« and fair value accounting effectseffects«, before tax ❙ Group RC profit before interest and tax16,649 8,263 3,380 Taxation charge (credit) on non-operating items (1,788) (643) (325) and fair value accounting effects, and certain foreign exchange impacts on the group’s tax charge for the period (4,235) (1,788) (643) Underlying RC profitprofit (loss)« for the year attributable to bp shareholders (5,690) 9,990 12,723 6,166 Dividends paid per share –– cents 31.5 41.0 40.5 40.0 –– pence 24.458 31.977 30.568 30.979 a Profit (loss) attributable to BP shareholders. More information Upstream, see page 50. Downstream, see page 56. Rosneft, see page 61. Other businesses and corporate, see page 63. Oil and gas disclosures for the group, see page 308. For a discussion of BP’s financial and operating performanceResults The loss for the year endingended 31 December 2017, see BP Annual Report and Form 20-F 2018, pages 19-39 and BP Annual Report and Form 20-F 2017, pages 21-43. 36 BP Annual Report and Form 20-F 2019

Strategic report Results Cash flow2020 attributable to bp shareholders was $20.3 billion, compared with a profit of $4.0 billion in 2019. Adjusting for inventory holding losses, replacement cost (RC) loss was $18.1 billion, compared with a profit of $3.5 billion in 2019. After adjusting RC loss for a net charge for non-operating items of $12.2 billion and net debt information Profitadverse fair value accounting effects of $0.2 billion (both on a post-tax basis), underlying RC loss for the year ended 31 December 2020 was $5.7 billion. The result reflected lower oil and gas prices, significant exploration write-offs and lower refining margins and depressed demand. The profit for the year ended 31 December 2019 attributable to BP $ millionbp shareholders was $4.0 billion, compared with $9.4 billion in 2018. 2019 2018 2017 Excludingexcluding inventory holding gains, replacement cost (RC)RC profit was Operating cash flow 25,770 22,873 18,931 $3.5 billion, compared with $10.0 billion in 2018. Net cash used in investing activities (16,974) (21,571) (14,077)billion. After adjusting RC profit for a net charge for non-operating items Net cash used in financing activities (8,817) (4,079) (3,296) of $7.2 billion and net favourable fair value accounting effects of Cash and cash equivalents at end of year 22,472 22,468 25,586 $0.7 billion (both on a post-tax basis), underlying RC profit for the year Capital expenditure ended 31 December 2019 was $10.0 billion, a decrease of $2.7 billion Organic capital expenditure (15,238) (15,140) (16,501) compared with 2018. The decrease was predominantly due to lower oil and gas prices in the Upstream segment and a significantly weaker Inorganic capital expenditure (4,183) (9,948) (1,339) environment in the Downstream segment. (19,421) (25,088) (17,840) Finance debt 67,724 65,132 62,574 Profit for the year ended 31 December 2018 attributable to BP shareholders was $9.4 billion, including inventory holding losses, Net debt 45,442 43,477 37,819 RC profit was $10.0 billion. After adjusting RC profit for a net charge Finance debt ratio (%) 40.2% 39.3% 38.6% for non-operating items of $2.8 billion and net favourable fair value Gearing (%) 31.1% 30.0% 27.0% accounting effects of $68 million (both on a post-tax basis), underlying RC profit for the year ended 31 December 2019 was $10.0 billion, a decrease of $2.7 billion compared with 2018. The decrease was predominantly due to lower oil and gas prices in the Upstream segment and a significantly weaker environment in the Downstream segment. Non-operating items In 2020 the net charge for non-operating items was $12.2 billion, mainly related to impairment charges, a gain on the disposal of our petrochemicals business, certain exploration write-offs (reported within the ‘other’ category), and restructuring costs associated with the reinvent bp programme. The impairment charges mainly relate to producing assets and principally arose as a result of changes to the group’s oil and gas price assumptions. Impairment charges also include amounts relating to the disposal of the group’s interests in its Alaska business. For more information For a discussion of bp’s financial and operating performance for the year ending 31 December 2018, see bp Annual Report and Form 20-F 2019, pages 36-38 and 50-65 and bp Annual Report and Form 20-F 2018, pages 19-39.
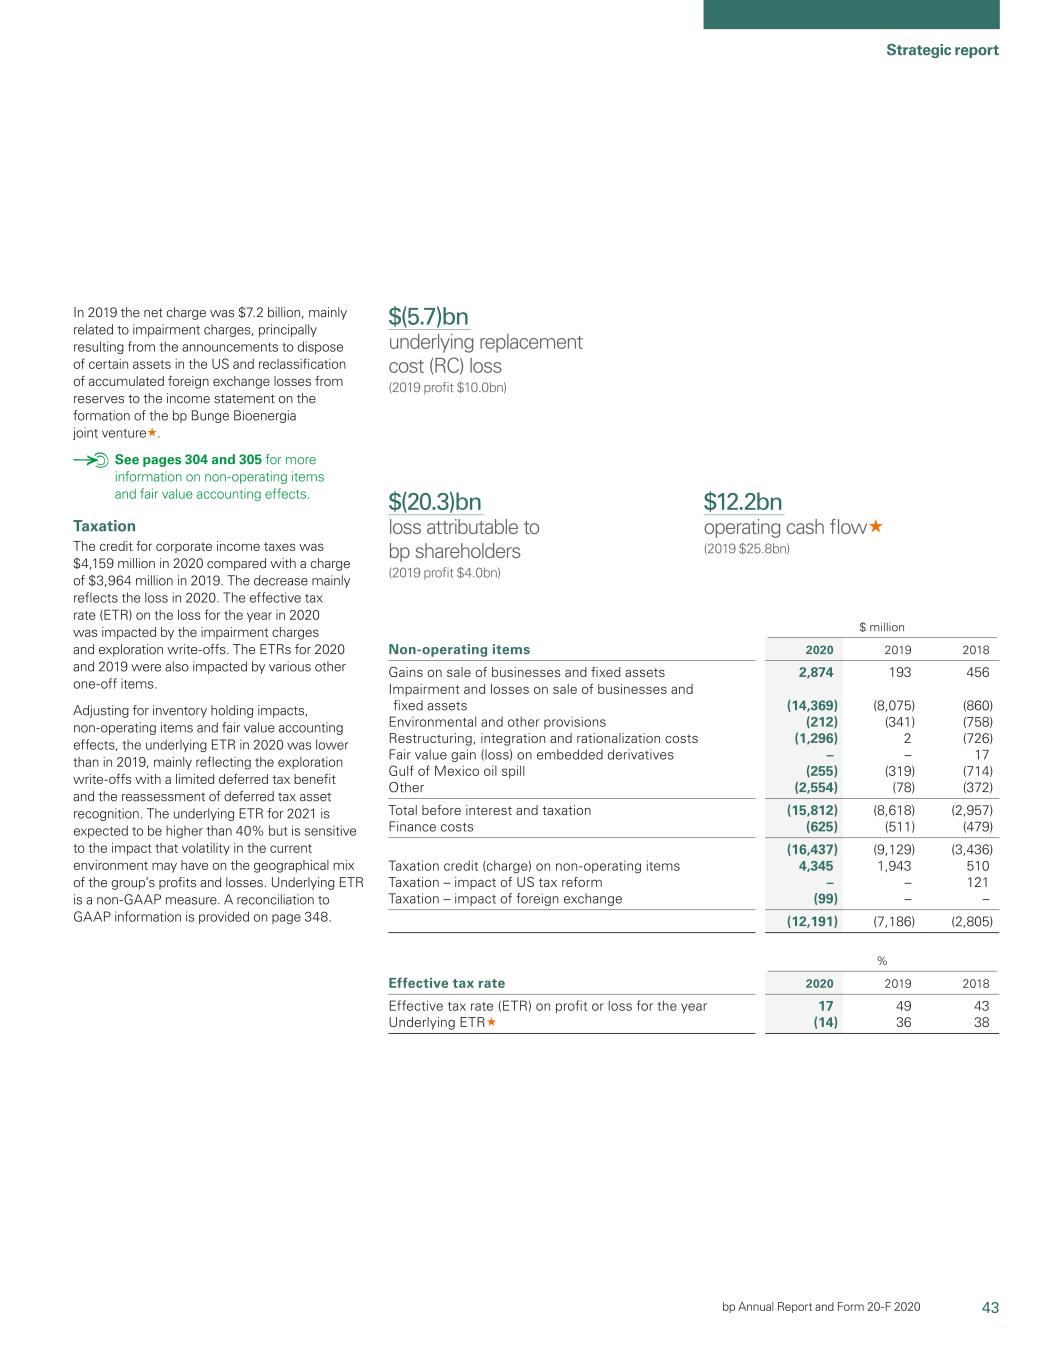
43 Strategic report bp Annual Report and Form 20-F 2020 In 2019 the net charge was $12.7$7.2 billion, mainly related to impairment charges, principally resulting from the announcements to dispose of certain assets in the US and reclassification of accumulated foreign exchange losses from reserves to the income statement on the formation of the bp Bunge Bioenergia joint venture«. See pages 304 and 305 for more information on non-operating items and fair value accounting effects. Taxation The credit for corporate income taxes was $4,159 million in 2020 compared with a charge of $3,964 million in 2019. The decrease mainly reflects the loss in 2020. The effective tax rate (ETR) on the loss for the year in 2020 was impacted by the impairment charges and exploration write-offs. The ETRs for 2020 and 2019 were also impacted by various other one-off items. Adjusting for inventory holding impacts, non-operating items and fair value accounting effects, the underlying ETR in 2020 was lower than in 2019, mainly reflecting the exploration write-offs with a limited deferred tax benefit and the reassessment of deferred tax asset recognition. The underlying ETR for 2021 is expected to be higher than 40% but is sensitive to the impact that volatility in the current environment may have on the geographical mix of the group’s profits and losses. Underlying ETR is a non-GAAP measure. A reconciliation to GAAP information is provided on page 348. $(5.7)bn underlying replacement cost (RC) loss (2019 profit $10.0bn) $(20.3)bn loss attributable to bp shareholders (2019 profit $4.0bn) $12.2bn operating cash flow« (2019 $25.8bn) $ million Non-operating items 2020 2019 2018 Gains on sale of businesses and fixed assets 2,874 193 456 Impairment and losses on sale of businesses and fixed assets (14,369) (8,075) (860) Environmental and other provisions (212) (341) (758) Restructuring, integration and rationalization costs (1,296) 2 (726) Fair value gain (loss) on embedded derivatives – – 17 Gulf of Mexico oil spill (255) (319) (714) Other (2,554) (78) (372) Total before interest and taxation (15,812) (8,618) (2,957) Finance costs (625) (511) (479) (16,437) (9,129) (3,436) Taxation credit (charge) on non-operating items 4,345 1,943 510 Taxation – impact of US tax reform – – 121 Taxation – impact of foreign exchange (99) – – (12,191) (7,186) (2,805) % Effective tax rate 2020 2019 2018 Effective tax rate (ETR) on profit or loss for the year 17 49 43 Underlying ETR« (14) 36 38
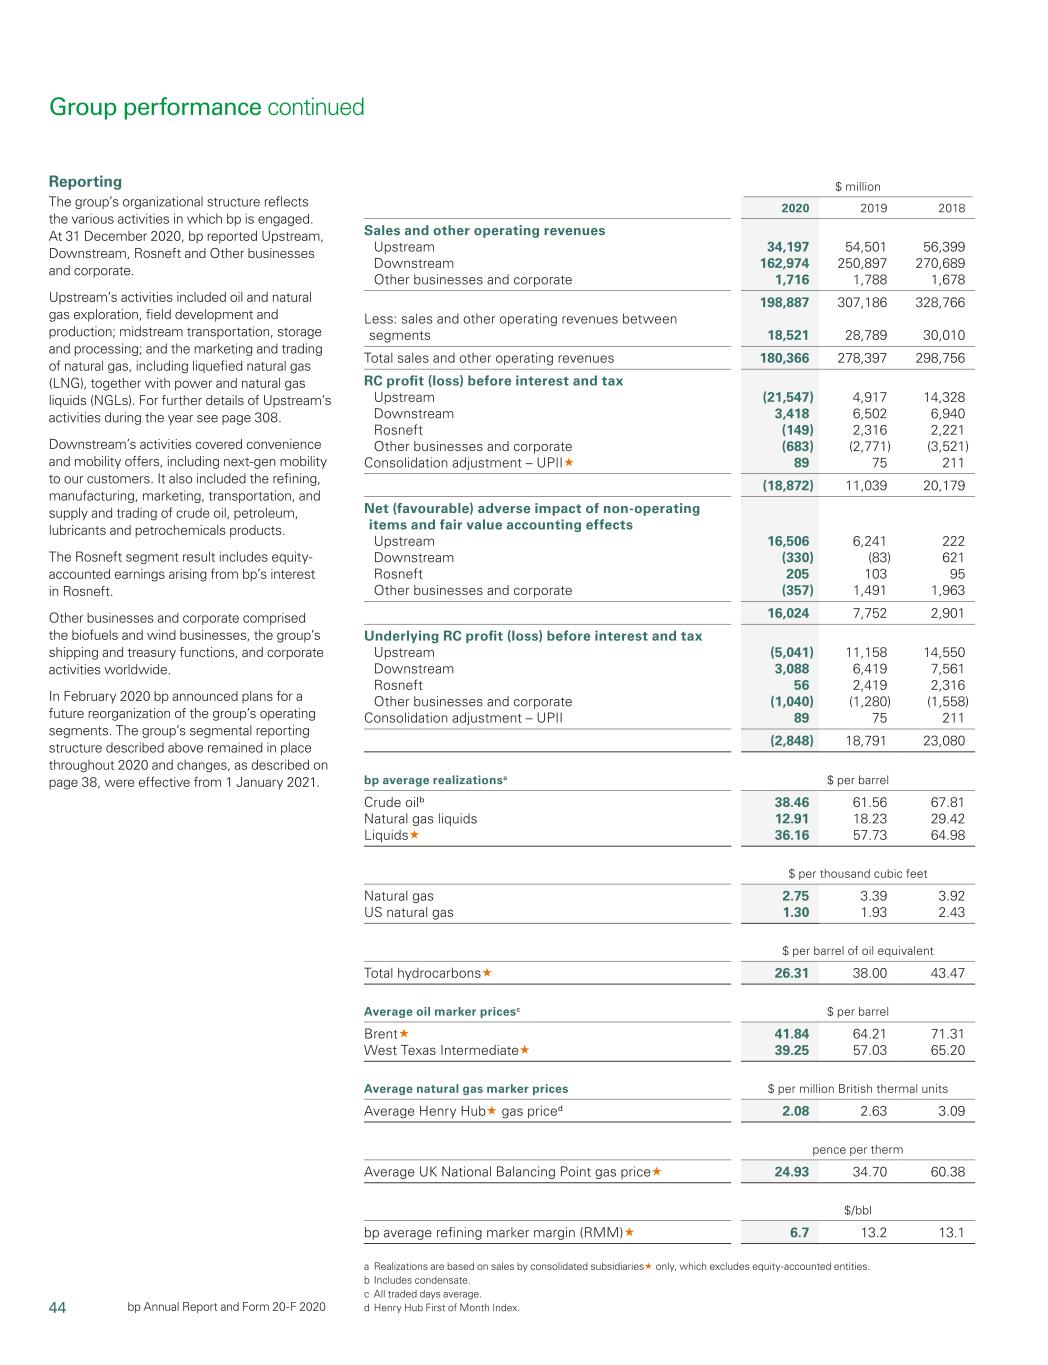
44 bp Annual Report and Form 20-F 2020 Reporting The group’s organizational structure reflects the various activities in which bp is engaged. At 31 December 2020, bp reported Upstream, Downstream, Rosneft and Other businesses and corporate. Upstream’s activities included oil and natural gas exploration, field development and production; midstream transportation, storage and processing; and the marketing and trading of natural gas, including liquefied natural gas (LNG), together with power and natural gas liquids (NGLs). For further details of Upstream’s activities during the year see page 308. Downstream’s activities covered convenience and mobility offers, including next-gen mobility to our customers. It also included the refining, manufacturing, marketing, transportation, and supply and trading of crude oil, petroleum, lubricants and petrochemicals products. The Rosneft segment result includes equity- accounted earnings arising from bp’s interest in Rosneft. Other businesses and corporate comprised the biofuels and wind businesses, the group’s shipping and treasury functions, and corporate activities worldwide. In February 2020 bp announced plans for a future reorganization of the group’s operating segments. The group’s segmental reporting structure described above remained in place throughout 2020 and changes, as described on page 38, were effective from 1 January 2021. $ million 2020 2019 2018 Sales and other operating revenues Upstream 34,197 54,501 56,399 Downstream 162,974 250,897 270,689 Other businesses and corporate 1,716 1,788 1,678 198,887 307,186 328,766 Less: sales and other operating revenues between segments 18,521 28,789 30,010 Total sales and other operating revenues 180,366 278,397 298,756 RC profit (loss) before interest and tax Upstream (21,547) 4,917 14,328 Downstream 3,418 6,502 6,940 Rosneft (149) 2,316 2,221 Other businesses and corporate (683) (2,771) (3,521) Consolidation adjustment – UPII« 89 75 211 (18,872) 11,039 20,179 Net (favourable) adverse impact of non-operating items and fair value accounting effects Upstream 16,506 6,241 222 Downstream (330) (83) 621 Rosneft 205 103 95 Other businesses and corporate (357) 1,491 1,963 16,024 7,752 2,901 Underlying RC profit (loss) before interest and tax Upstream (5,041) 11,158 14,550 Downstream 3,088 6,419 7,561 Rosneft 56 2,419 2,316 Other businesses and corporate (1,040) (1,280) (1,558) Consolidation adjustment – UPII 89 75 211 (2,848) 18,791 23,080 bp average realizationsa $ per barrel Crude oilb 38.46 61.56 67.81 Natural gas liquids 12.91 18.23 29.42 Liquids« 36.16 57.73 64.98 $ per thousand cubic feet Natural gas 2.75 3.39 3.92 US natural gas 1.30 1.93 2.43 $ per barrel of oil equivalent Total hydrocarbons« 26.31 38.00 43.47 Average oil marker pricesc $ per barrel Brent« 41.84 64.21 71.31 West Texas Intermediate« 39.25 57.03 65.20 Average natural gas marker prices $ per million British thermal units Average Henry Hub« gas priced 2.08 2.63 3.09 pence per therm Average UK National Balancing Point gas price« 24.93 34.70 60.38 $/bbl bp average refining marker margin (RMM)« 6.7 13.2 13.1 a Realizations are based on sales by consolidated subsidiaries« only, which excludes equity-accounted entities. b Includes condensate. c All traded days average. d Henry Hub First of Month Index. Group performance continued
45 Strategic report bp Annual Report and Form 20-F 2020 Upstream Sales and other operating revenues for 2020 were lower due to lower liquids and gas realizations, lower gas marketing and trading revenues and were further impacted by lower sales volumes. RC loss before interest and tax for the segment included a net non-operating charge of $15,768 million. This primarily relates to impairments associated with revisions to the long-term price assumptions. See Financial statements – Note 5 for further information. Fair value accounting effects had an adverse impact of $738 million relative to management’s view of performance. The 2019 result included a net non-operating charge of $6,947 million, primarily related to impairment charges arising from disposal transactions. Fair value accounting effects had a favourable impact of $706 million relative to management’s view of performance. After adjusting for non-operating items and fair value accounting effects, the underlying RC result before interest and tax was lower in 2020 compared with 2019. This primarily reflected lower liquids and gas realizations and the impact of writing down certain exploration intangible carrying values. Downstream Sales and other operating revenues in 2020 were lower than in 2019, mainly due to lower crude and product prices and the demand impact of COVID-19. RC profit before interest and tax for 2020 included a net non-operating gain of $479 million. The gain reflected a profit of $2.3 billion on the sale of our petrochemicals business, which was partially offset by restructuring costs and impairments. In addition, fair value accounting effects for 2020 had an adverse impact of $149 million, compared with a favourable impact of $160 million in 2019. After adjusting for non-operating items and fair value accounting effects, underlying RC profit before interest and tax for the year was $3,088 million. The fuels business reported a lower underlying RC profit before interest and tax compared with 2019, due to an exceptionally weak refining environment, with COVID-19 restrictions impacting refining utilization and fuel volumes. The 2020 result also reflects a higher contribution from supply and trading. Our fuels marketing business demonstrated continued resilience, delivering significant profit in 2020, despite COVID-19 – which adversely impacted retail fuel and aviation volumes by 14% and 50% respectively. Refining loss in 2020 reflects the continued impact of historically low industry margins. Although refining availability« was strong at 96%, utilization was around 6% lower than 2019, due to the impact of COVID-19 on demand. These factors were partially offset by a lower level of turnaround activity and lower costs. In the fourth quarter of 2020, we announced plans to cease production at our Kwinana refinery and convert it to an import terminal, helping secure ongoing fuel supply for Western Australia. We continued to redefine convenience in 2020, delivering a 6% growth in convenience gross margin«. We also expanded our retail network by more than 1,400 sites, to a total of 20,300, including more than 1,900 strategic convenience sites«. And we completed the formation of Jio-bp, our Indian joint venture with Reliance, helping more than double the number of retail sites in growth markets«, see page 24. We also progressed our electrification agenda, growing our network to 10,100 bp and joint venture operated electric vehicle charge points«, see Our strategy on page 15. The lubricants business reported a lower underlying RC profit before interest and tax compared with 2019 and this reflected significant COVID-19 demand impacts, with volumes 15% lower for the year. We continued to expand our service offer in 2020, growing the number of Castrol branded independent workshops by more than 4,000 to over 28,000 globally. The petrochemicals business reported a lower underlying RC profit before interest and tax compared with 2019, reflecting the impact of COVID-19 on demand and a significantly weaker margin environment. In December we completed the divestment of bp’s petrochemicals business to INEOS for a total consideration of $5 billion. Final payments, totalling $1 billion, were received in February 2021. For more information see Additional information for Downstream on page 318. Rosneft RC loss before interest and tax for 2020 and RC profit before interest and tax for 2019 for the segment included a non-operating charge of $205 million for 2020 and $103 million for 2019. After adjusting for non-operating items, the underlying RC profit before interest and tax in 2020 primarily reflected lower oil prices and unfavourable foreign exchange and adverse duty lag effects compared with 2019 underlying profit. Financial and operating performance for 2020 also reflected the increased average economic interest that bp holds in Rosneft as a result of Rosneft’s share buyback programme and the transaction to sell Rosneft’s business in Venezuela in exchange for its own shares, which completed in April 2020. For more information see Additional information for Rosneft on page 320. Other businesses and corporate RC loss before interest and tax for the year ended 31 December 2020 was $683 million (2019 $2,771 million). The 2020 result included a net charge for non-operating items of $318 million, primarily relating to Gulf of Mexico oil spill related costs of $255 million and restructuring costs, partly offset by a gain on disposal (non-operating items in 2019 $1,491 million). In addition, fair value accounting effects had a favourable impact of $675 million. After adjusting for non-operating items and fair value accounting effects, the underlying RC loss before interest and tax for the year ended 31 December 2020 was $1,040 million (2019 $1,280 million). This result mainly reflected an uplift in valuation of a venture investment of $284 million. Outlook for 2021 From the oil supply side, limited growth from non-OPEC+ countries coupled with active market management from OPEC+ means that for 2021 we anticipate a normalization of the currently high inventory levels. Oil demand is anticipated to recover in 2021. The speed and degree of the rebound depends on governments’ policies and individuals’ self-imposed actions as vaccine distribution proceeds.
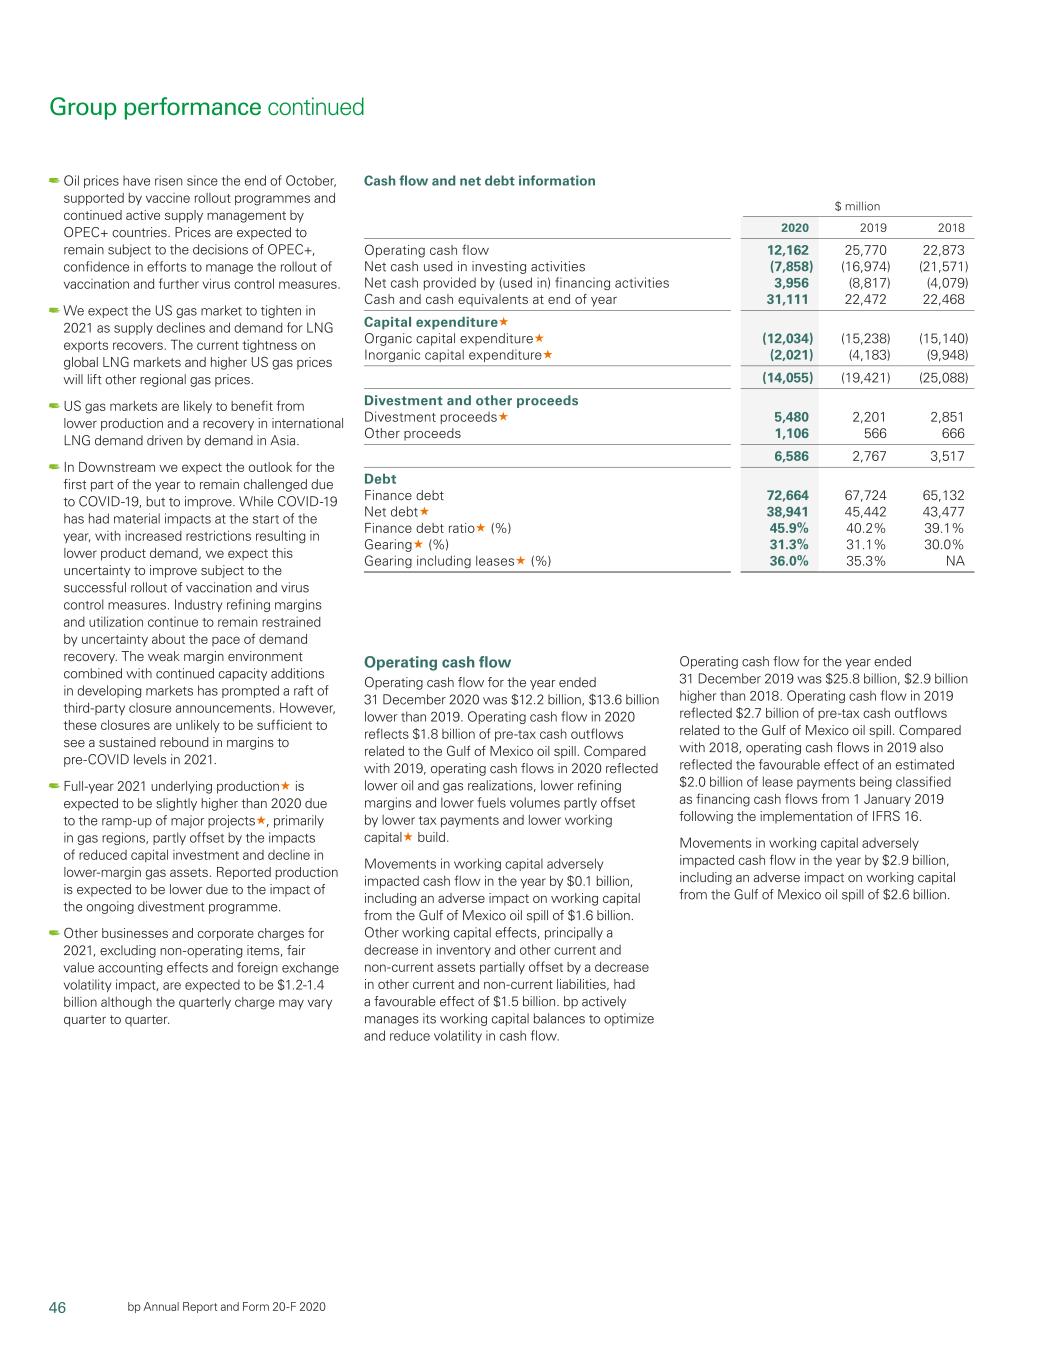
46 bp Annual Report and Form 20-F 2020 Oil prices have risen since the end of October, supported by vaccine rollout programmes and continued active supply management by OPEC+ countries. Prices are expected to remain subject to the decisions of OPEC+, confidence in efforts to manage the rollout of vaccination and further virus control measures. We expect the US gas market to tighten in 2021 as supply declines and demand for LNG exports recovers. The current tightness on global LNG markets and higher US gas prices will lift other regional gas prices. US gas markets are likely to benefit from lower production and a recovery in international LNG demand driven by demand in Asia. In Downstream we expect the outlook for the first part of the year to remain challenged due to COVID-19, but to improve. While COVID-19 has had material impacts at the start of the year, with increased restrictions resulting in lower product demand, we expect this uncertainty to improve subject to the successful rollout of vaccination and virus control measures. Industry refining margins and utilization continue to remain restrained by uncertainty about the pace of demand recovery. The weak margin environment combined with continued capacity additions in developing markets has prompted a raft of third-party closure announcements. However, these closures are unlikely to be sufficient to see a sustained rebound in margins to pre-COVID levels in 2021. Full-year 2021 underlying production« is expected to be slightly higher than 2020 due to the ramp-up of major projects«, primarily in gas regions, partly offset by the impacts of reduced capital investment and decline in lower-margin gas assets. Reported production is expected to be lower due to the impact of the ongoing divestment programme. Other businesses and corporate charges for 2021, excluding non-operating items, fair value accounting effects and foreign exchange volatility impact, are expected to be $1.2-1.4 billion although the quarterly charge may vary quarter to quarter. Operating cash flow Operating cash flow for the year ended 31 December 2020 was $12.2 billion, $13.6 billion lower than 2019. Operating cash flow in 2020 reflects $1.8 billion of pre-tax cash outflows related to the Gulf of Mexico oil spill. Compared with 2019, operating cash flows in 2020 reflected higherlower oil prices, record plant reliability and the benefit of new major projects start-ups in Upstream; strongergas realizations, lower refining margins and lower fuels volumes partly offset by lower tax payments and lower working capital« build. Movements in working capital adversely impacted cash flow in the year by $0.1 billion, including an adverse impact on working capital from the Gulf of Mexico oil spill of $1.6 billion. Other working capital effects, principally a decrease in inventory and other current and non-current assets partially offset by a decrease in other current and non-current liabilities, had a favourable effect of $1.5 billion. bp actively manages its working capital balances to optimize and reduce volatility in cash flow. Operating cash flow for the year ended 31 December 2019 was strong fuels marketing growth in Downstream; and higher oil prices in $25.8 billion, $2.9 billion higher than 2018. Operating cash flow in Rosneft segment. 2019 reflectsreflected $2.7 billion of pre-tax cash outflows related to the Gulf of Mexico oil spill. Compared with 2018, operating cash flows in 2019 Non-operating items also reflected the favourable effect of an estimated $2.0 billion of lease payments being classified as financing cash flows from 1 January 2019 The net charge for non-operating items was $7.2 billion after tax in following the implementation of IFRS 16. 2019, mainly related to impairment charges, principally resulting from the announcements to dispose of certain assets in the US and Movements in working capital adversely impacted cash flow in the reclassification of accumulated foreign exchange losses from reserves year by $2.9 billion, including an adverse impact on working capital from to the income statement on the formation of the BP Bunge Bioenergia the Gulf of Mexico oil spill of $2.6 billion. BP actively manages its joint venture. working capital balances to optimize and reduce volatility in cash flow. The net charge for non-operating items was $2.8 billion post-tax in Operating cash flow for the year ended 31 December 2018 was 2018, mainly related to additional charges for the Gulf of Mexico oil spill, $22.9 billion, reflecting $3.5 billion of pre-tax cash outflows related to environmental and other provisions, and further restructuring costs. the Gulf of Mexico oil spill. More information on non-operating items and fair value accounting Movements in working capital adversely impacted cash flow in the year effects can be found on pages 300 and 344. by $4.8 billion. There was$2.9 billion, including an adverse impact on working capital from the Gulf of Mexico oil spill of $3.1$2.6 billion. Other working capital effects, Taxation principally an increase in other currentCash flow and non-current assets partially offset by a decrease in inventory, had an adverse effect of $1.7 billion. The charge for corporate income taxes was $3,964net debt information $ million in2020 2019 compared with $7,145 million in 2018. The decrease mainly reflects the lower level of profit in 2019. The effective tax rate (ETR) on the profit or loss for the year was 49% in 2019 and 43% in 2018. The ETR for both years was impacted by various one-off items. Adjusting for inventory holding impacts, non-operating items and fair value accounting effects, the underlying ETR was 36% in 2019 (2018 38%). The lower underlying ETR in 2019 compared with 2018 reflects the reassessment of the recognition of deferred tax assets. In the current environment, the underlying ETR in 2020 is expected to be lower than 40%. BP Annual Report and Form 20-F 2019 37

Operating cash flow 12,162 25,770 22,873 Net cash used in investing activities (7,858) (16,974) (21,571) Net cash provided by (used in) financing activities 3,956 (8,817) (4,079) Cash and cash equivalents at end of year 31,111 22,472 22,468 Capital expenditure« Organic capital expenditure« (12,034) (15,238) (15,140) Inorganic capital expenditure« (2,021) (4,183) (9,948) (14,055) (19,421) (25,088) Divestment and other proceeds Divestment proceeds« 5,480 2,201 2,851 Other proceeds 1,106 566 666 6,586 2,767 3,517 Debt Finance debt 72,664 67,724 65,132 Net debt« 38,941 45,442 43,477 Finance debt ratio« (%) 45.9% 40.2% 39.1% Gearing« (%) 31.3% 31.1% 30.0% Gearing including leases« (%) 36.0% 35.3% NA Group reservesperformance continued
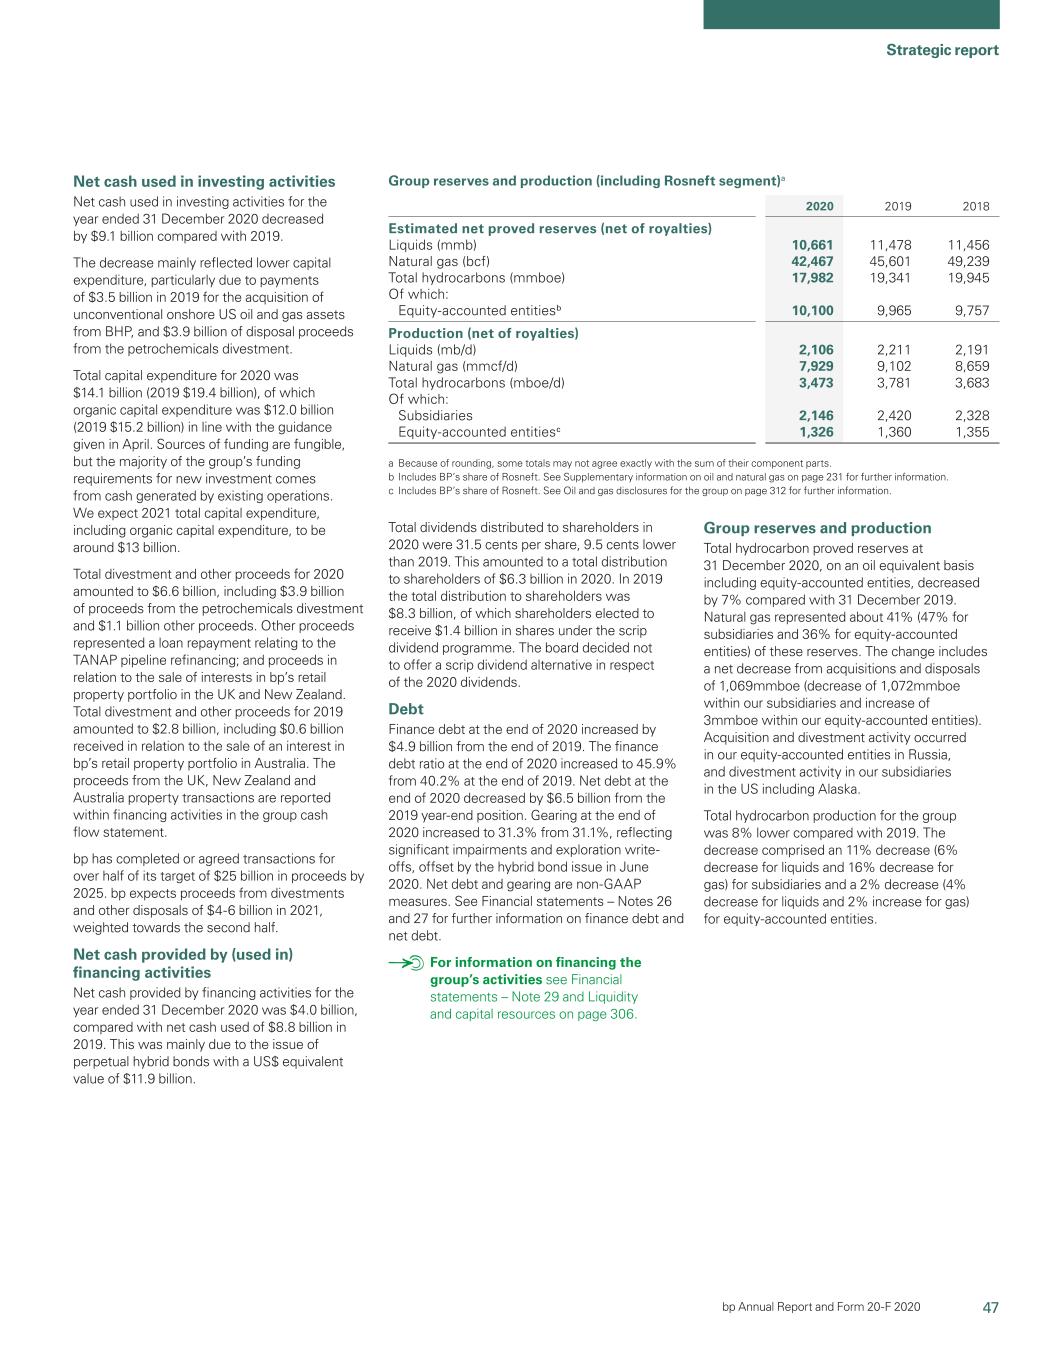
47 Strategic report bp Annual Report and production (including Rosneft segment)aForm 20-F 2020 Net cash used in investing activities Net cash used in investing activities for the year ended 31 December 20192020 decreased by $4.6$9.1 billion compared with 2018. $ million 2019 2018 20172019. The decrease mainly reflected the phasinglower capital expenditure, particularly due to payments of the payments to BHP$3.5 billion in 2019 for the Petrohawk acquisition. Estimated net proved reserves (netacquisition of royalties)unconventional onshore US oil and gas assets from BHP, and $3.9 billion of disposal proceeds from the petrochemicals divestment. Total capital expenditure for 20192020 was $14.1 billion (2019 $19.4 billion (2018 $25.1 billion), Liquids (mmb) 11,478 11,456 10,672 of which organic capital expenditure was $12.0 billion (2019 $15.2 billion (2018 $15.1 Natural gas (bcf) 45,601 49,239 45,060 billion). in line with the guidance given in April. Sources of funding are fungible, but the majority of the group’s Total hydrocarbons (mmboe) 19,341 19,945 18,441group’s funding requirements for new investment comes from cash generated by existing operations. We expect 20202021 total capital expenditure, including organic capital expenditure, to Of which: b remain towardsbe around $13 billion. Total divestment and other proceeds for 2020 amounted to $6.6 billion, including $3.9 billion of proceeds from the lower endpetrochemicals divestment and $1.1 billion other proceeds. Other proceeds represented a loan repayment relating to the TANAP pipeline refinancing; and proceeds in relation to the sale of our $15-17 billion range. Equity-accounted entities 9,965 9,757 8,949 Production (net of royalties)interests in bp’s retail property portfolio in the UK and New Zealand. Total divestment and other proceeds for 2019 amounted to $2.8 billion, Liquids (mb/d) 2,211 2,191 2,260 including $0.6 billion received in relation to the sale of a 49%an interest in BP’sbp’s retail property portfolio in Australia. The proceeds from the UK, New Zealand and Australia shownproperty transactions are reported within financing Natural gas (mmcf/d) 9,102 8,659 7,744 activities in the group cash flow statement. Total divestmentbp has completed or agreed transactions for over half of its target of $25 billion in proceeds by 2025. bp expects proceeds from divestments and other disposals of $4-6 billion in 2021, weighted towards the second half. Net cash provided by (used in) financing activities Net cash provided by financing activities for the year ended 31 December 2020 was $4.0 billion, compared with net cash used of $8.8 billion in 2019. This was mainly due to the issue of perpetual hybrid bonds with a US$ equivalent value of $11.9 billion. Total dividends distributed to shareholders in 2020 were 31.5 cents per share, 9.5 cents lower than 2019. This amounted to a total distribution to shareholders of $6.3 billion in 2020. In 2019 the total distribution to shareholders was $8.3 billion, of which shareholders elected to receive $1.4 billion in shares under the scrip dividend programme. The board decided not to offer a scrip dividend alternative in respect of the 2020 dividends. Debt Finance debt at the end of 2020 increased by $4.9 billion from the end of 2019. The finance debt ratio at the end of 2020 increased to 45.9% from 40.2% at the end of 2019. Net debt at the end of 2020 decreased by $6.5 billion from the 2019 year-end position. Gearing at the end of 2020 increased to 31.3% from 31.1%, reflecting significant impairments and exploration write- offs, offset by the hybrid bond issue in June 2020. Net debt and gearing are non-GAAP measures. See Financial statements – Notes 26 and 27 for further information on finance debt and net debt. For information on financing the group’s activities see Financial statements – Note 29 and Liquidity and capital resources on page 306. Group reserves and production (including Rosneft segment)a 2020 2019 2018 Estimated net proved reserves (net of royalties) Liquids (mmb) 10,661 11,478 11,456 Natural gas (bcf) 42,467 45,601 49,239 Total hydrocarbons (mmboe) 17,982 19,341 19,945 Of which: Equity-accounted entitiesb 10,100 9,965 9,757 Production (net of royalties) Liquids (mb/d) 2,106 2,211 2,191 Natural gas (mmcf/d) 7,929 9,102 8,659 Total hydrocarbons (mboe/d) 3,473 3,781 3,683 3,595 proceeds for 2018 amounted to $3.5 billion including a $0.6 billion loan Of which: repayment, relating to the refinancing of Trans Adriatic Pipeline AG. SubsidiariesSubsidiaries 2,146 2,420 2,328 2,164 Equity-accounted entitiesc 1,326 1,360 1,355 1,431 BP expects to meet its target of $10 billion proceeds by end-2020 and expects to announce a further $5 billion of agreed disposals by a Because of rounding, some totals may not agree exactly with the sum of their component mid-2021. parts. b Includes BP’sBP’s share of Rosneft. See Rosneft on page 61 and Supplementary information on oil and natural gas on page 232231 for further information. Net cash used in financing activities c Includes BP’sBP’s share of Rosneft. See Rosneft on page 61 and Oil and gas disclosures for the group on page 308312 for further information. Net cash used in financing activities for the year ended 31 December 2019 was $8.8 billion, compared with $4.1 billion in 2018. This wasGroup reserves and production Total hydrocarbon proved reserves at 31 December 2019,2020, on an oil mainly as a result of $2.3 billion in lease liability repayments which were equivalent basis including equity-accounted entities, decreased by 3% presented as operating cash flows and capital expenditure prior to the (decrease of 8% for subsidiaries and increase of 2% for equity- implementation of IFRS 16, an increase of $1.5 billion in debt financing, accounted entities)7% compared with 31 December 2018.2019. Natural gas an increase of $1.2 billion in net repurchase of shares and an increase in represented about 41% (48%(47% for subsidiaries and 34%36% for equity- dividend payments of $0.3 billion offset by $0.6 billion in cash received accountedequity-accounted entities) of these reserves. The change includes a net in relation to the sale of the 49% interest in BP’s retail property portfolio decrease from acquisitions and disposals of 133mmboe1,069mmboe (decrease of in Australia as described above. 134mmboe1,072mmboe within our subsidiaries and increase of 1mmboe3mmboe within our equity-accounted entities). Acquisition and divestment activity occurred in our subsidiaries Total dividends distributed to shareholdersequity-accounted entities in 2019 were 41.0 cents per occurred in India,Russia, and divestment activity in our subsidiaries in the US share, 0.5 cents higher than 2018. This amounted to a total distribution and Egypt. There were no material acquisitions or divestments in our to shareholders of $8.3 billion (2018 $8.1 billion), of which shareholders equity-accounted entities. elected to receive $1.4 billion (2018 $1.4 billion) in shares under the scrip dividend programme. The total distributed in cash during the yearincluding Alaska. Total hydrocarbon production for the group was 3% higher8% lower compared amounted to $6.9 billion (2018 $6.7 billion). with 2018.2019. The increasedecrease comprised a 4% increase (1% increasean 11% decrease (6% decrease for liquids and 7% increase16% decrease for gas) for subsidiaries and was broadly flat Debt with 2018a 2% decrease (4% decrease for liquids and 2% increase for gas) for equity-accounted entities. Finance debt at the end of 2019 increased by $2.6 billion from the end of 2018. The finance debt ratio at the end of 2019 increased by 0.9%. Net debt at the end of 2019 increased by $2.0 billion from the 2018 year-end position. Gearing at the end of 2019 increased by 1.1%. Net debt
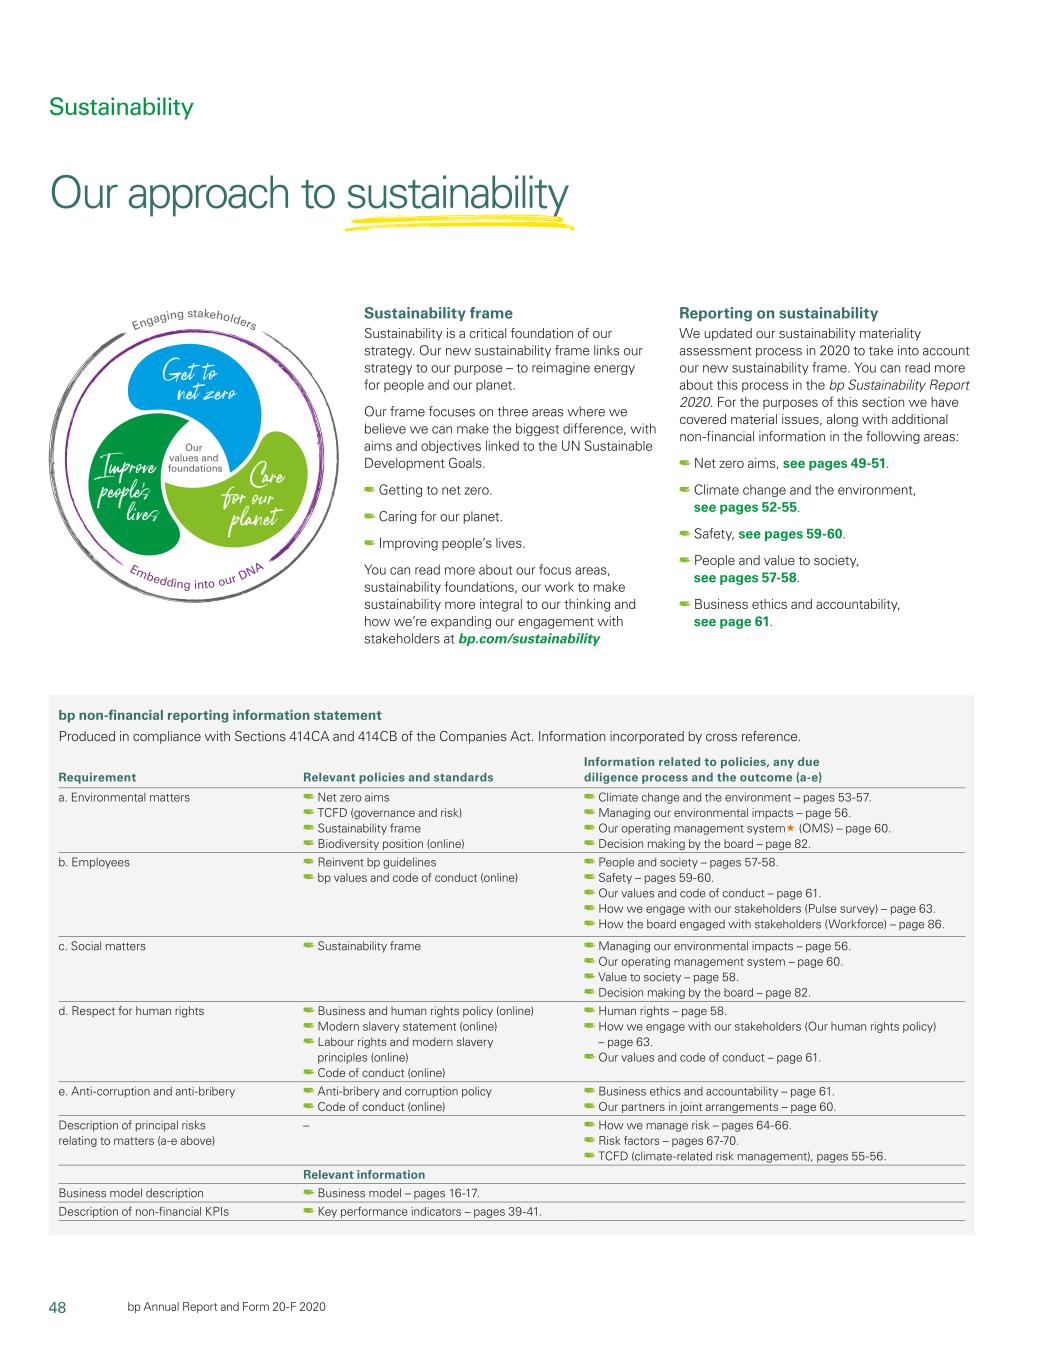
48 Embedding into our DN A Eng aging stakeholders Our values and gearing are non-GAAP measures. See Financial statements – Note 26 for finance debt, which is the nearest equivalent measure on an IFRS basis, and Note 27 for further information on net debt, including the amendment of comparative information for finance debt, net debt and gearing following the implementation of IFRS 16. For information on financing the group’s activities, see Financial statements – Note 29 and Liquidity and capital resources on page 301. 38 BPfoundations bp Annual Report and Form 20-F 2019

Strategic report2020 Our approach to sustainability Sustainability Operating sustainably, safelyRequirement Relevant policies and responsiblystandards Information related to policies, any due diligence process and the outcome (a-e) a. Environmental matters Net zero aims TCFD (governance and risk) Sustainability frame Biodiversity position (online) Climate change and the environment – pages 53-57. Managing our environmental impacts – page 56. Our operating management system« (OMS) – page 60. Decision making by the board – page 82. b. Employees Reinvent bp guidelines bp values and code of conduct (online) People and society – pages 57-58. Safety – pages 59-60. Our values and code of conduct – page 61. How we engage with our stakeholders (Pulse survey) – page 63. How the board engaged with stakeholders (Workforce) – page 86. c. Social matters Sustainability frame Managing our environmental impacts – page 56. Our operating management system – page 60. Value to society – page 58. Decision making by the board – page 82. d. Respect for human rights Business and human rights policy (online) Modern slavery statement (online) Labour rights and modern slavery principles (online) Code of conduct (online) Human rights – page 58. How we engage with our stakeholders (Our human rights policy) – page 63. Our values and code of conduct – page 61. e. Anti-corruption and anti-bribery Anti-bribery and corruption policy Code of conduct (online) Business ethics and accountability – page 61. Our partners in joint arrangements – page 60. Description of principal risks relating to matters (a-e above) – How we manage risk – pages 64-66. Risk factors – pages 67-70. TCFD (climate-related risk management), pages 55-56. Relevant information Business model description Business model – pages 16-17. Description of non-financial KPIs Key performance indicators – pages 39-41. bp non-financial reporting information statement Produced in compliance with Sections 414CA and 414CB of the Companies Act. Information incorporated by cross reference. Sustainability frame Sustainability is corea critical foundation of our strategy. Our new sustainability frame links our strategy to our ability to create long-term value for our stakeholders, deliver our net zero ambition and aims, and realize our purpose – to reimagine energy for people and our planet. Our sustainabilityframe focuses on three areas where we believe we can make the biggest difference, with aims and objectives linked to the UN Sustainable Development Goals. Getting to net zero. Caring for our planet. Improving people’s lives. You can read more about our focus areas, Environment •sustainability foundations, our work to make sustainability more integral to our thinking and how we’re expanding our engagement with stakeholders at bp.com/sustainability Reporting on sustainability We updated our sustainability materiality assessment process in 2020 to take into account our new sustainability frame. You can read more about this process in the bp Sustainability Report 2020. For the purposes of this section we have covered material issues, along with additional non-financial information in the following areas: Net zero aims, see pages 49-51. Climate change and • Accreditingthe environment, see pages 52-55. Safety, see pages 59-60. People and value to society, see pages 57-58. Business ethics and accountability, see page 61.
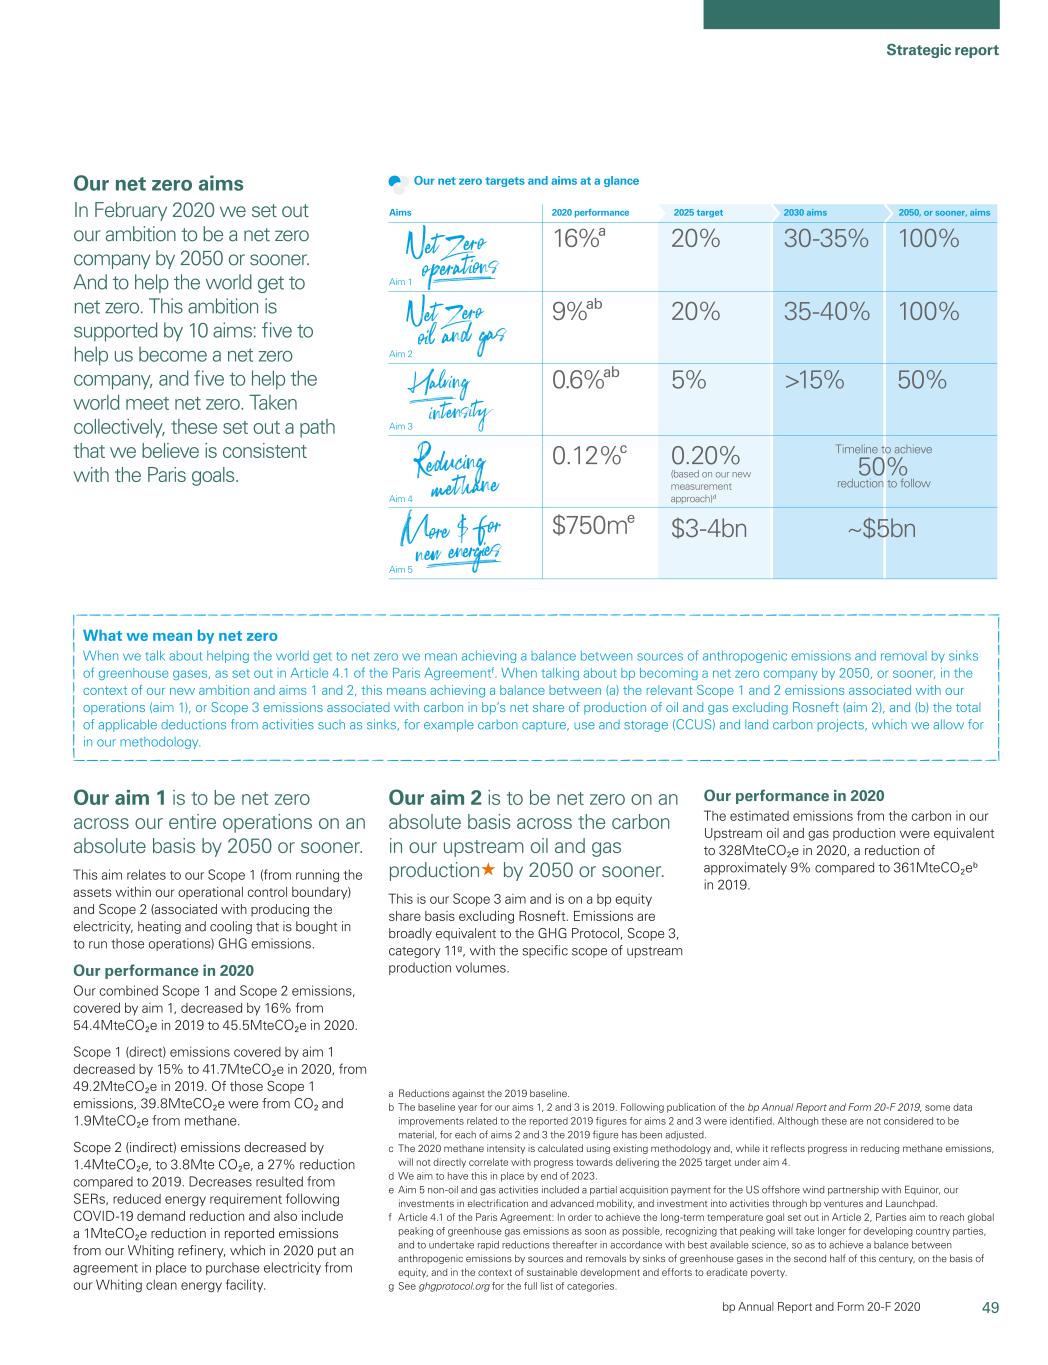
49 Strategic report Our net zero targets and aims at a glance Aims Aim 1 Aim 2 Aim 3 Aim 4 Aim 5 2020 performance 20% 30-35% 100% 20% 35-40% 100% 5% >15% 50% 0.20%0.12%c 0.6%ab 9%ab 16%a $3-4bn$750m e ~$5bn 2025 target 2030 aims 2050, or sooner, aims Timeline to achieve 50% reduction to follow (based on our low We refreshednew measurement approach)d bp Annual Report and expandedForm 20-F 2020 Our net zero aims In February 2020 we set out our ambition to be a net zero company by 2050 or sooner. And to help the energy transition. carbon activities. sustainability materiality assessment • Net zero aims. • Calling for more processworld get to net zero. This ambition is supported by 10 aims: five to help us become a net zero company, and five to help the world meet net zero. Taken collectively, these set out a path that we believe is consistent with the Paris goals. What we mean by net zero When we talk about helping the world get to net zero we mean achieving a balance between sources of anthropogenic emissions and removal by sinks of greenhouse gases, as set out in 2019. We askedArticle 4.1 of the Paris Agreementf. When talking about bp becoming a range of • Carbon intensitynet zero company by 2050, or sooner, in the context of our products. progressive climate policies externalnew ambition and internal stakeholders, • GHGaims 1 and 2, this means achieving a balance between (a) the relevant Scope 1 and 2 emissions • Climate-related financial including shareholdersassociated with our operations (aim 1), or Scope 3 emissions associated with carbon in bp’s net share of production of oil and employees,gas excluding Rosneft (aim 2), and (b) the total of applicable deductions from activities such as sinks, for example carbon capture, use and storage (CCUS) and land carbon projects, which we allow for in our operations. disclosures. to share their feedback onmethodology. a Reductions against the issues that • Our ‘reduce, improve, • Working with others. matter most to them. We also asked them create’ framework. • Managing2019 baseline. b The baseline year for our impacts. to consider the relative impact of these issues on our businessaims 1, 2 and how they think Safety and • Keeping people safe. • Cyber threats. BP can influence them positively. We security • Managing safety. • Security. validated and prioritized the findings with • Our operating • Working with contractors experts in BP to help prioritize our management system. • Our partners in joint sustainability reporting. We’ve covered • Preventing incidents. arrangements. the main issues they consider in this • Emergency preparedness. section, along with additional key non-financial information. Our people • Attraction and retention. • Employee engagement. Our reporting For more information on our sustainability • Diversity. • Share ownership. performance, see the BP Sustainability • Inclusion. Report3 is 2019. For key environmental, social and Communities • Value to society. • Human rights. governance data, see our ESG datasheet at bp.com/ESGdata. For our mapping to some key sustainability Governance • Our values. • Lobbying and political frameworks and standards, including GRI and business • The BP code of conduct. donations. and IPIECA, see bp.com/reportingcentre. ethics • Anti-bribery and corruption. • Trade associations. • Tax and transparency. Non-financial reporting Page Other related information Page information statement Environmental matters 40-45 Business model 14-15 This sustainability section, and other pages Our employees 47, 88-89, 221 Strategy 16-18 referenced below, provide information as Social matters 48 Non-financial KPIs 32-34 required by section 414CBFollowing publication of the Companies Act 2006 in relation to: Human rights 48 Principal risks 69-71 Anti-bribery and corruption 49 Policies 39-49, 68-69 BPbp Annual Report and Form 20-F 2019, 39

Environment Greenhousesome data improvements related to the reported 2019 figures for aims 2 and 3 were identified. Although these are not considered to be material, for each of aims 2 and 3 the 2019 figure has been adjusted. c The 2020 methane intensity is calculated using existing methodology and, while it reflects progress in reducing methane emissions, will not directly correlate with progress towards delivering the 2025 target under aim 4. d We aim to have this in place by end of 2023. e Aim 5 non-oil and gas activities included a partial acquisition payment for the US offshore wind partnership with Equinor, our investments in electrification and advanced mobility, and investment into activities through bp ventures and Launchpad. f Article 4.1 of the Paris Agreement: In order to achieve the long-term temperature goal set out in Article 2, Parties aim to reach global peaking of greenhouse gas emissions from our operations We report Scope 1 (direct) and Scope 2 (indirect) GHG emissions on Climate change and the energy transition a carbon dioxide equivalent (CO2e) basis. Direct emissions include CO2 The world needs more energy to fuel prosperity and improve standards and methane from the combustion of fuel and the operation of facilities, of livingas soon as possible, recognizing that peaking will take longer for a growing global population. This energy must be delivered and indirect emissions include those resulting from the purchase of in affordable and reliable ways, but it must also be lower carbon. BP’s electricity and steam we import into our operations. purpose is to reimagine energy for people and our planet. To deliver Our overall emissions, on an operational control basis, increased in this, we have set out a new ambition to become a net zero company 2019, mainly due to major acquisitions. But the SERs we achieved by 2050 or sooner,developing country parties, and to helpundertake rapid reductions thereafter in accordance with best available science, so as to achieve a balance between anthropogenic emissions by sources and removals by sinks of greenhouse gases in the world reach net zero. came closesecond half of this century, on the basis of equity, and in the context of sustainable development and efforts to countering this increase. We achieved zero net growth in our operational emissions with no offsets required against our Net zero aims adjusted 2015 baseline. Aim 1: Net zero operations a Greenhouse gas emissions (MteCO2e) Weeradicate poverty. g See ghgprotocol.org for the full list of categories. Our aim 1 is to be net zero across our entire operations on an absolute basis by 2050 or sooner. This aim relates to our Scope 1 (direct)(from running the assets within our operational control boundary) and Scope 2 Operational controlb (indirect) greenhouse gas (GHG)(associated with producing the electricity, heating and cooling that is bought in to run those operations) GHG emissions. Our performance in 2020 Our combined Scope 1 and Scope 2 emissions, covered by aim 1, decreased by 16% from 54.4MteCO2e in 2019 2018 2017 Aim 2: Net zero oil and gasto 45.5MteCO2e in 2020. Scope 1 (direct) emissions 49.2 48.8 50.5 Wecovered by aim 1 decreased by 15% to 41.7MteCO2e in 2020, from 49.2MteCO2e in 2019. Of those Scope 1 emissions, 39.8MteCO2e were from CO2 and 1.9MteCO2e from methane. Scope 2 (indirect) emissions decreased by 1.4MteCO2e, to 3.8Mte CO2e, a 27% reduction compared to 2019. Decreases resulted from SERs, reduced energy requirement following COVID-19 demand reduction and also include a 1MteCO2e reduction in reported emissions from our Whiting refinery, which in 2020 put an agreement in place to purchase electricity from our Whiting clean energy facility. Our aim 2 is to be net zero on an absolute basis across the carbon in our Scope 2 (indirect) emissions 5.2 5.4 6.1 upstream oil and gas production« by 2050 or sooner. This is our Scope 3 Total 54.4 54.2 56.6 aim and is on a BPbp equity share basis excluding Rosneft. This carbon a wasEmissions are broadly equivalent to 360MteCO2ethe GHG Protocol, Scope 3, category 11g, with the specific scope of upstream production volumes. Our performance in 2020 The estimated emissions from the carbon in our Upstream oil and gas production were equivalent to 328MteCO2e in 2020, a reduction of approximately 9% compared to 361MteCO2eb in 2019. BP equity sharec
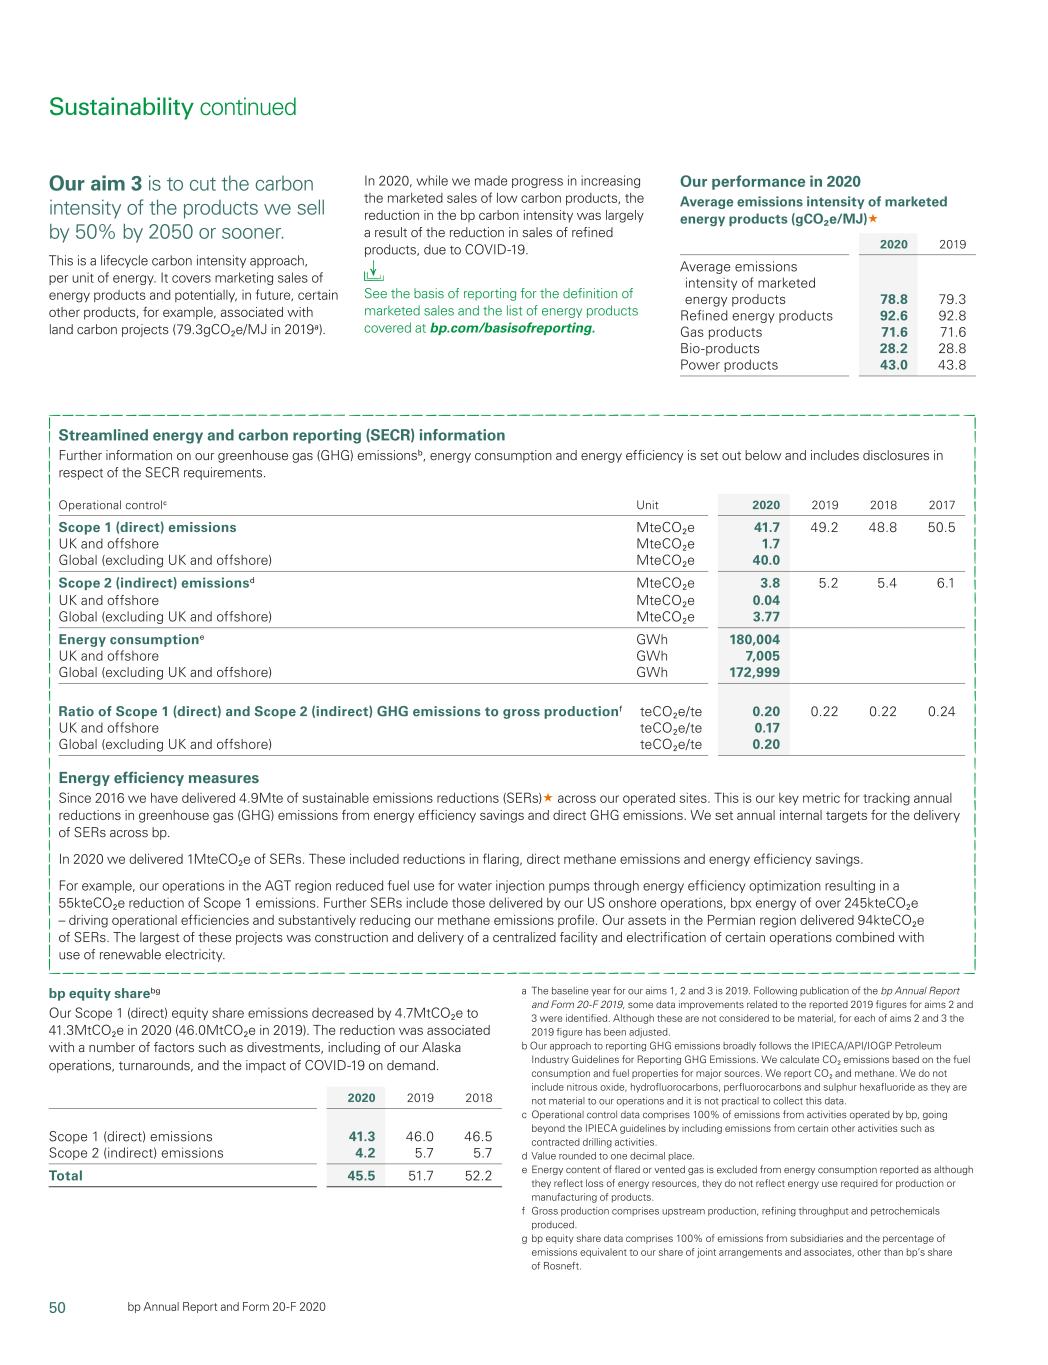
50 bp Annual Report and Form 20-F 2020 Sustainability continued Our aim 3 is to cut the carbon intensity of the products we sell by 50% by 2050 or sooner. This is a lifecycle carbon intensity approach, per unit of energy. It covers marketing sales of energy products and potentially, in future, certain other products, for example, associated with land carbon projects (79.3gCO2e/MJ in 2019a). Streamlined energy and carbon reporting (SECR) information Further information on our greenhouse gas (GHG) emissionsb, energy consumption and energy efficiency is set out below and includes disclosures in respect of the SECR requirements. Operational controlc Unit 2020 2019 2018 2017 Scope 31 (direct) emissions MteCO2e 41.7 49.2 48.8 50.5 UK and offshore MteCO2e 1.7 Global (excluding UK and offshore) MteCO2e 40.0 Scope 2 (indirect) emissionsd MteCO2e 3.8 5.2 5.4 6.1 UK and offshore MteCO2e 0.04 Global (excluding UK and offshore) MteCO2e 3.77 Energy consumptione GWh 180,004 UK and offshore GWh 7,005 Global (excluding UK and offshore) GWh 172,999 Ratio of Scope 1 (direct) and Scope 2 (indirect) GHG emissions to gross productionf teCO2e/te 0.20 0.22 0.22 0.24 UK and offshore teCO2e/te 0.17 Global (excluding UK and offshore) teCO2e/te 0.20 Energy efficiency measures Since 2016 we have delivered 4.9Mte of sustainable emissions reductions (SERs)« across our operated sites. This is our key metric for tracking annual reductions in greenhouse gas (GHG) emissions from energy efficiency savings and direct GHG emissions. We set annual internal targets for the delivery of SERs across bp. In 2020 we delivered 1MteCO2e of SERs. These included reductions in flaring, direct methane emissions and energy efficiency savings. For example, our operations in the AGT region reduced fuel use for water injection pumps through energy efficiency optimization resulting in a 55kteCO2e reduction of Scope 1 emissions. Further SERs include those delivered by our US onshore operations, bpx energy of over 245kteCO2e – driving operational efficiencies and substantively reducing our methane emissions profile. Our assets in the Permian region delivered 94kteCO2e of SERs. The largest of these projects was construction and delivery of a centralized facility and electrification of certain operations combined with use of renewable electricity. Our performance in 2020 Average emissions intensity of marketed energy products (gCO2e/MJ)« 2020 2019 Average emissions intensity of marketed energy products 78.8 79.3 Refined energy products 92.6 92.8 Gas products 71.6 71.6 Bio-products 28.2 28.8 Power products 43.0 43.8 bp equity sharebg Our Scope 1 (direct) equity share emissions decreased by 4.7MtCO2e to 41.3MtCO2e in 2020 (46.0MtCO2e in 2019). The reduction was associated with a number of factors such as divestments, including of our Alaska operations, turnarounds, and the impact of COVID-19 on demand. 2020 2019 2018 Scope 1 (direct) emissions 41.3 46.0 46.5 49.4 Scope 2 (Indirect)(indirect) emissions 4.2 5.7 5.7 6.8 There are 15 categories of Scope 3 emissions. For our industry Total 45.5 51.7 52.2 56.2a The baseline year for our aims 1, 2 and 3 is 2019. Following publication of the most importantbp Annual Report and Form 20-F 2019, some data improvements related to the reported 2019 figures for aims 2 and 3 were identified. Although these are not considered to be material, for each of these categories isaims 2 and 3 the ‘use of sold products’ (category 11). For this category of Scope 3, we are a2019 figure has been adjusted. b Our approach to reporting GHG emissions broadly follows the IPIECA/API/IOGP Petroleum reporting for the first time the estimated CO2 emissions from Industry Guidelines for Reporting GHG Emissions. We calculate CO2 emissions based on the carbon in our upstream oil and gas productiona. This metric the fuel consumption and fuel properties for major sources. We report CO2 and methane. We do not include nitrous oxide, hydrofluorocarbons, perfluorocarbons and sulphur replaces the ‘customer emissions’ metric, which we previously hexafluoride as they are not material to our operations and it is not practical to collect this reported in our Sustainability Report. For more information see data. bp.com/sustainabilityreport. bc Operational control data comprises 100% of emissions from activities that are operated by BP,bp, going beyond the IPIECA guidelines by including emissions from certain other activities such as contracted drilling activities. c BPd Value rounded to one decimal place. e Energy content of flared or vented gas is excluded from energy consumption reported as although they reflect loss of energy resources, they do not reflect energy use required for production or manufacturing of products. f Gross production comprises upstream production, refining throughput and petrochemicals produced. g bp equity share data comprises 100% of emissions from subsidiariessubsidiaries and the percentage a This figure assumes that 100% of the oil and gas produced is combusted with no carbon of emissions equivalent to our share of joint arrangementsarrangements and associates,associates, other than capture, use and storage, although a proportion of global oil and gas goes into non- BP’sbp’s share of Rosneft. combusted uses, such as petrochemicals and lubricants. RatioIn 2020, while we made progress in increasing the marketed sales of Scope 1 (direct) and Scope 2 (indirect) GHG emissions to gross Aim 3: Halving intensity d production (teCO2e/te) Our aim is to cutlow carbon products, the reduction in the bp carbon intensity was largely a result of the reduction in sales of refined products, we sell by 50%, by 2050 or sooner. This is a lifecycle GHG emissions intensity approach, 2019 2018 2017 2016 per unitdue to COVID-19. See the basis of energy. It covers marketingreporting for the definition of marketed sales and the list of energy products and, 0.22 0.22 0.24 0.24 potentially, in the future, certain other products, such as those d Gross production comprises upstream production, refining throughput and associated with land carbon projects. petrochemicals produced. This metric also responds to the CA100+ resolution, which requires us tocovered at bp.com/basisofreporting.
51 Strategic report the estimated carbon intensity of our energy products. Estimated emissions intensity (gCO2e/MJ) 2019 Average emissions intensity of marketed energy products 79.7 Refined energy products 93.7 Gas products 71.6 Bio-products 28.8 Power products 43.8 40 BPbp Annual Report and Form 20-F 2019

Strategic report2020 Our ‘reduce, improve, create’ frameworkaim 4 is to install methane measurement at all our existing major oil and gas processing sites by 2023, publish the data, and then drive a 50% reduction in methane intensity« of our operations. And we will work to influence our joint ventures« to set their own methane intensity targets of 0.2%. In 20182020 we set outan intensity target of 0.20% by 2025, using a measurement approach. To reduce our methane intensity, we will focus on achieving reductions across our key methane sources. Our performance in 2020 Our methane intensity in 2020 was 0.12%, an improvement from 0.14% in 2019. In 2020 methane emissions from upstream operations, used to calculate our intensity, decreased by 22% to 71.6kt in 2020, down from 92.2kt in 2019. Marketed gas was 3,075bcf in 2020. This reduction in methane intensity was due to the Alaska and bpx energy divestments in 2020 and from SER projects and flaring reductions, the largest reductions being delivered in bpx energy and Angola. Our aim 5 is to increase the proportion of investment we make into our non-oil and gas businesses. Over time, as investment goes up in low and no carbon, we see it going down in oil and gas. We are aiming for up to an eight-fold scaling up of our investment in low carbon ambitionenergy by 2025 and targetsa ten-fold scaling up by 2030, to around $5 billion a year. In 2020 we invested $750 million, compared to more than $500 million in 2019. See page 22 for more on our investment in line with aim 5. Five aims to help the world get to net zero Our aim 6 is to more actively advocate for policies that support net zero, including carbon pricing. We have stopped corporate reputation advertising campaigns and this is enabling us to re-direct resources to promote climate policies. In future, any corporate advertising will be to push for well-designed climate policy; communicate our net zero ambition; invite ideas; or build collaborations. We will continue to run recruitment campaigns and advertise our products, services and partnerships – although we aim for these to be increasingly low carbon. We are involved in advocacy activities related to well-designed policies, primarily carbon pricing in the US, through our support for regional initiatives. bp.com/policyandadvocacy Our aim 7 is to incentivize our global workforce to deliver on our aims and mobilize them to become advocates for net zero. We want to help our employees understand what net zero means and the part they can play – through education and training programmes. We want to incentivize employees, which is why in 2019 we announced plans to linklinked our annual cash bonus for eligible employees, including the bp leadership team, to our our ‘reduce, improve, create’ (RIC) framework: sustainable emissions reduction (SER) target. This means around 37,000 employees, including executives, are now incentivizedreductions (SERs). We have exceeded targeted delivery of SERs in both 2019 and • Reducing GHG emissions2020, though in our own operations. rewarded2020, bp decided not to pay an annual bonus due to the prevailing economic and financial environment. In 2020 for their contribution to reducing carbon emissions in BP. • Improving products to help our customers and consumers lower their emissions. We’ve met our SER target six years ahead of schedule and this has • Creatingsenior leaders we increased emphasis on low carbon, businesses. motivated usmoving from 5% to start work30% of senior leaders’ equity awards linked to low carbon. And for the bp leadership team, 25% of performance- based pay was linked to delivery of our purpose. The measures for the 2021 annual bonus for the wider workforce are aligned to bp’s strategy and net zero ambition and tied to a balanced scorecard consisting of safety and sustainability, operations and financial measures. In February 2021, we introduced the reinvent bp share award to incentivize our employees in meeting our aims. All employees will receive a one-off grant of either shares or share options that will become available to keep, sell or transfer in the first quarter of 2025. See the Directors’ remuneration report on pages 103-126 for more detail. Our aim 8 is to set new targets.expectations for our relationships with trade associations around the globe. We planbelong to provide more detailassociations that offer opportunities to share good practices and collaborate on issues of importance to our sector. We aim for alignment between our policies and those of trade associations that we are a member of but understand that associations’ positions reflect a compromise of the assorted views of the membership. We will make the case for our views on climate change and we will be transparent where we differ. And where we can’t reach alignment, we will be prepared to leave. We published our first trade associations review in September 2020. Reducing Improving Creating emissions inearly 2020, and left three associations where we assessed climate positions as not aligned. Since then, we have made interventions where our operations our products low carbon businesses 2019 progress 2019 progress 2019 progress • Achieved zero net growth in • Continued to scale up our • Began rolling out BP Chargemaster operational emissions. Our total co-processing business, growing ultra-fast charging across BP forecourts GHG emissions (operated) increased the volume of lower carbon bio-views have not aligned – these occurred in the UK and piloted ultra-fast charging slightly in 2019, largely due to the feedstock processed at our refineries. at Aral forecourts in Germany. major acquisitions at the end of 2018. • Established more than 30 carbon • Increased our stake in Lightsource BP, This was countered by other neutral BP retail sites, offering a to create a 50:50 joint venture, see emissions reductions. Total emissions rangearea of carbon neutral products page 73. were still belowpricing with the adjusted 2015 and services. • Took a leading role in the OGCI’s Net baseline so no offsets were required. • Increased the supplyCanadian Association of BP biojet, our Zero Teesside project in the UK. Using • 1.4Mte of SERs delivered in 2019 sustainable aviation fuel, to 11 locations integrated carbon capture, use and and 3.9Mte since 2016. And we linked worldwide – including in Sweden, storage, the project aims to store the this target to the annual cash bonus FrancePetroleum Producers and the US. carbon dioxide emissionsNetherlands Employer Association, VNO-NCV. In 2021 we intend to publish an update on our relationships with trade associations which will focus on our engagement with five partially aligned associations. bp.com/tradeassociations Our aim 9 is to be recognized as an industry leader for the transparency of our reporting. On 12 February 2020, we declared our support for the recommendations of the of around 37,000 eligible employees carbon-intensive industries situated in 2019. within the Teesside industrial cluster. • Methane intensity of 0.14%, below our target of 0.2%. More information Our strategyTask Force on page 16. Directors’ remuneration report on page 100. bp.com/sustainability. Accrediting our lower carbon activities Calling for more progressive climate policies Our advancing low carbon (ALC) accreditation programme aims to We plan to allocate more resources to advocate for well-designed inspire every part of BP to identify lower carbon opportunities. Since its policies, including carbon pricing. We believe carbon pricing is the launch, the programme has motivated people across BP to do more to most efficient way to reduce GHG emissions and incentivize everyone, advance low carbon, with 76 activities being accredited in 2019. Each including energy producers and consumers, to play their part. In our activity supports one of our low carbon ambitions. Deloitte conducts view, pricing can be as effective as a tax or a cap-and-trade system. independent assurance on ALC activities. We estimate that 64MteCO2e While we support well-designed carbon pricing, we’re prepared to have been saved or offset through activities delivered by BP, and oppose poorly designed proposals. For example, we opposed the 5.4Mte through activities delivered by BP partners since the ballot initiative to introduce a carbon fee in Washington State, US in programme began in 2017a. November 2018. We believed that the policy was badly designed and See bp.com/advancinglowcarbon for details on the programme and would have harmed Washington’s economy without significantly Deloitte’s assurance statement. reducing carbon emissions. The ballot was not passed. a The total emissions saved or offset from the accredited activities are estimated using a We continued to work with legislative leaders in the state and in 2019 variety of methodologies and baselines. The figures aim only to illustrate the impact of the activities within the programme, and delivered by BP or a BP partner only refers to the supported a cap-and-invest bill, which we believe will be more effective. organization leading on delivering the activity. Savings or offsets may be claimed by orClimate-related Financial Disclosures (TCFD). We intend to continue workingwork constructively with the Washington legislature during its attributedTCFD and others – such as the Sustainability Accounting Standards Board – to other parties. The scope of accredited activitiesdevelop good practices and standards for transparency. See pages 52-55 for our expanded TCFD disclosures. Our aim 10 is wider than, and does not 2020 session to see iflaunch a new carbon bill can be advanced. seekteam to aligncreate integrated clean energy and mobility solutions. We launched our regions, cities and solutions team in 2020. It will help countries, cities and corporations around the world decarbonize. We have announced our aim to partner with our GHG reporting boundaries. Therefore,10-15 cities globally over the figures are not directly comparablenext decade to BP’s reported emissions. BPhelp them achieve their climate goals. And we will work with three industrial sectors – high tech and consumer products, heavy transport and heavy industries – as they shape their energy transition journeys. In 2020 we’ve formed strategic partnerships with Aberdeen, Houston and Microsoft. We’ve also agreed to provide additional renewable energy to Amazon, helping them toward their ambition to decarbonize. bp.com/RCS
52 bp Annual Report and Form 20-F 2019 41

2020 Sustainability continued The world needs more energy to fuel prosperity and improve standards of living for a growing global population. This energy must be delivered in affordable and reliable ways, but it must also be lower carbon. Climate-related financial disclosures and the preparation and consideration of corporate reporting documents and AGM materials. The board has reviewed the consistency of our We support the recommendations of the Task Force on Climate-related current strategy with the Paris goals, see page 17. Financial Disclosures (TCFD), which was established by the Financial Stability Board with the aim of improving the reporting of climate- The executive relatedclimate-related risks and opportunities. We announced in 2020 that we intend to work constructively with The assessment and management of climate-related matters is the TCFD, and others, to develop good practices and standards for embedded across BP at various levels and delegated authority flows transparency. This will be a multi-year journey, but we have already down from the board, see page 83. started, and ourOur latest reporting provides information supporting the Climate-related matters were discussed at eachTCFD’s recommended disclosures. We responded to the FCA consultation on climate-related financial disclosures and welcome the new listing rule. Governance Recommended disclosure: a. Describe the board’s oversight of climate- related risks and opportunities. The role of the 11 executive TCFD’s recommended disclosures. team meetings in 2019 includingboard is to promote bp’s sustainable success for the developmentbenefit of BP’s net zero Governance ambitionits members, generating value for shareholders while having regard to the interests of our other stakeholders, the impact of our operations on the communities where we operate and aims ahead of discussion with the board. Recommendation: Discloseenvironment. In performing this role, the organization’s governance around The executive team is supported by BP’s senior-level leadership and climate-related issues and opportunities. their respective teams, with dedicated business and functional The board expertise focused on climate-related matters. This includes our carbon The board is responsible for oversight of the overall conduct of the group’sgroup’s business, management, safety and operational risk, group policy and our which extends to setting our strategy and approach to the energy economics teams. transition. The board and its associated committees, including the safety and sustainability, audit, people and governance and remuneration committees, where appropriate, have oversight of climate-related matters, which include climate risks and opportunities. They are updated on these matters frequently, a process which is managed by our company secretary’s office, which works closely with teams in bp to develop materials that assist the board or committee to discharge its responsibilities, including those related to climate. In 2020 these processes included formal analysis of bp’s net zero ambition and aims, briefings with subject matter experts, reviews of regulatory correspondence regarding prior year climate disclosures, virtual site visits and the preparation and consideration of corporate reporting documents and AGM materials. During 2020, climate matters were included on the agenda at every board meeting. Agendas are now structured along four distinct pillars: strategy, performance, people and governance. The safety and sustainability committee’s remit was extended from the beginning of 2020 to provide oversight of the effectiveness of the implementation of bp’s sustainability frame. This includes reviewing that appropriate progress is being made against our net zero, people and planet aims. The committee will continue to cover existing sustainability-related activities, including the oversight of operational sustainability risks. The role of the audit committee is to monitor the effectiveness of bp’s financial reporting, systems of internal control and risk management, and the integrity of bp’s external and internal audit processes. In fulfilling this purpose, the committee has oversight of financial disclosure, including TCFD reporting. The role of the remuneration committee is to recommend to the board the remuneration policy for executive directors and the leadership team. It also reviews workforce remuneration and monitors related policies, satisfying itself that incentives and rewards are aligned to bp’s strategy, culture and long-term sustainable success. This includes climate- related matters. The role of the people and governance committee (formerly the nomination and governance committee) is to oversee a diverse succession pipeline and to review workforce policies and practices, monitoring their consistency with bp’s purpose, strategy and values. This helps ensure that we have the right people to deliver our strategy and net zero ambition. Climate change and the environment Pursuing a strategy consistent with the Paris goals Strategy has been the core focus of every board meeting since the beginning of 2019. Throughout 2020 the board worked closely with the leadership team in developing our new strategy. In August 2020 the chairman outlined the key judgements the board had applied to their decision making regarding bp’s strategy, financial frame and investor proposition. As a result, the board considers that the strategy allows us to be flexible to adapt to market changes and scenarios to remain consistent with the Paris goals. The role of the board in evaluating material capex consistency with Paris The board assesses the impact of portfolio changes, such as strategic acquisitions and the allocation of capital. It also considers specific investment cases which have been approved by the resource commitment meeting, see page 29. TCFD recommendation: Disclose the organization’s governance around climate- related issues and opportunities. From 1 January 2021, bp implemented a new, simplified system of sustainability governance encompassing the board, its associated committees and the leadership team. This structure will enhance oversight of bp’s new sustainability frame, which focuses on three areas: net zero, people and planet. The remit of the board and its committees under our new governance framework is set out on page 88. Terms of reference for the board and its committees are available at bp.com/governance.
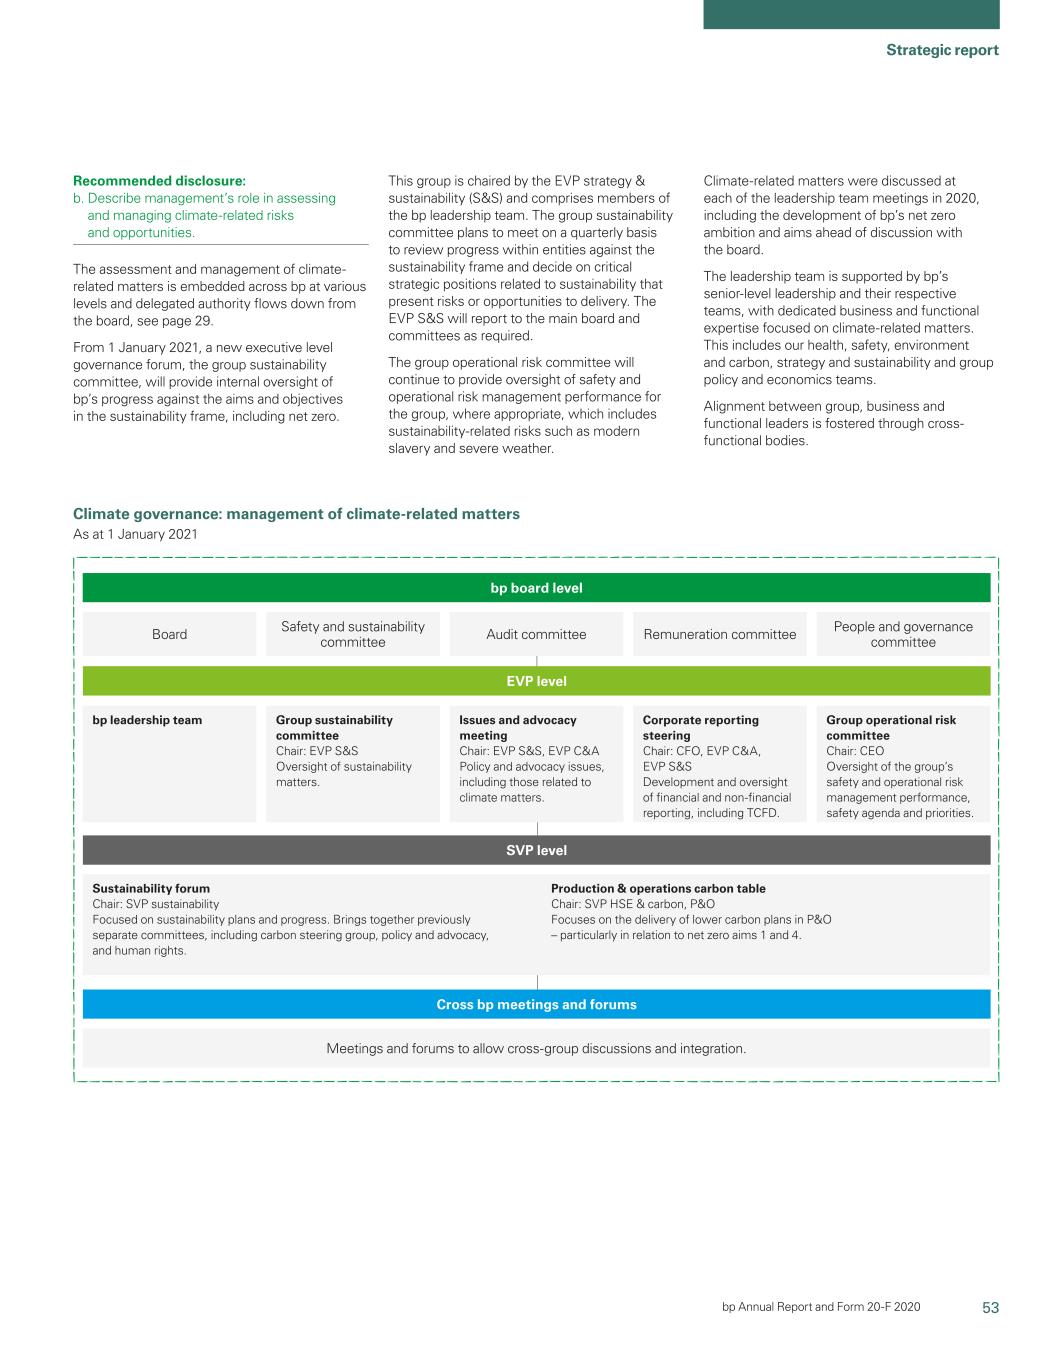
53 Strategic report bp Annual Report and Form 20-F 2020 Recommended disclosure: b. Describe management’s role in assessing and managing climate-related risks and opportunities. The assessment and management of climate- related matters is embedded across bp at various levels and delegated authority flows down from the board, see page 29. From 1 January 2021, a new executive level governance forum, the group sustainability committee, will provide internal oversight of bp’s progress against the aims and objectives in the sustainability frame, including net zero. This group is chaired by the EVP strategy & sustainability (S&S) and comprises members of the bp leadership team. The group sustainability committee plans to meet on a quarterly basis to review progress within entities against the sustainability frame and decide on critical strategic positions related to sustainability that present risks or opportunities to delivery. The EVP S&S will report to the main board and committees as required. The group operational risk committee will continue to provide oversight of safety and operational risk management performance for the group, where appropriate, which includes sustainability-related risks such as modern slavery and severe weather. Board bp leadership team Group sustainability committee Chair: EVP S&S Oversight of sustainability matters. Issues and advocacy meeting Chair: EVP S&S, EVP C&A Policy and advocacy issues, including those related to climate matters. Corporate reporting steering Chair: CFO, EVP C&A, EVP S&S Development and oversight of financial and non-financial reporting, including TCFD. Group operational risk committee Chair: CEO Oversight of the group’s safety and operational risk management performance, safety agenda and priorities. Safety and sustainability committee Audit committee Remuneration committee People and governance committee bp board level EVP level Sustainability forum Chair: SVP sustainability Focused on sustainability plans and progress. Brings together previously separate committees, including carbon steering group, policy and advocacy, and human rights. Production & operations carbon table Chair: SVP HSE & carbon, P&O Focuses on the delivery of lower carbon plans in P&O – particularly in relation to net zero aims 1 and 4. Meetings and forums to allow cross-group discussions and integration. SVP level Cross bp meetings and forums Climate governance: management of climate-related matters As at 1 January 2021 Climate-related matters were discussed at each of the leadership team meetings in 2020, including the development of bp’s net zero ambition and aims ahead of discussion with the board. The leadership team is supported by bp’s senior-level leadership and their respective teams, with dedicated business and functional expertise focused on climate-related matters. This includes our health, safety, environment and carbon, strategy and sustainability and group policy and economics teams. Alignment between group, business and functional leaders is fostered have oversight of climate-related matters (which include issues and through cross-functional bodies, including the group, upstream and opportunities) and are updated on these matters as frequently as downstream carbon steering committees.
necessary. In 2019 climate matters were included on the agenda for each of the six board meetings. This informed the board’s consideration of strategy. The process by which the board is updated on climate-related matters is managed by our company secretary’s office and depends on the topic being discussed. In 2019 these processes included formal analysis of our RIC targets, briefings with subject matter experts from the business Climate governance: investments in 2019 BP board Considers investment cases deemed sufficiently material to warrant the board’s attention. New business models Existing and new business models Renewal committee Resource commitment meeting Reviews strategic, commercial and investment decisions outside of core Reviews strategic, commercial and investment decisions related to activity and related to new lines of business (up to $250 million organic existing and new lines of business (above $250 million organic and and $25 million inorganic capital investment). Chaired by our chief $25 million inorganic capital investment). Chaired by our chief executive. transition officer. New energy frontiers Ventures investment steering committee committee Oversees strategy and Oversees strategic, commercial development of growth and investment decisions in opportunities in low carbon venturing business. Chaired by business models that can be our group head of technology. scaled up to create new businesses for BP. Chaired by our chief transition officer. BP Launchpad Launchpad is BP’s business-builder and scale-up factory. Its mission is to build five $1 billion business unicorns. Chaired by our group head of technology. Executive-level committee. Cross-functional committee. 42 BPcross- functional bodies.
54 bp Annual Report and Form 20-F 2019

2020 Sustainability continued Strategy Strategic report Strategyimplications of climate change In the bp Energy Outlook 2020 we describe the potential implications of climate change and the energy transition on both primary energy demand and the energy system, through three long-term scenarios: Rapid, Net Zero and Business-as-usual. These are summarized on page 11 and further analysis by country and region, energy sector and fuel type can be found in the bp Energy Outlook, available at bp.com/energyoutlook. The transition to a lower carbon economy presents both risks and significant business opportunities for bp. Climate-related physical and transition risks are managed and reported as part of our group-wide risk management process described on pages 64-66. Climate-related risks and opportunities associated with the energy transition were taken into consideration alongside other inputs in developing our new ambition, aims and strategy. For more information about how our new organizational model and financial reporting segments see pages 36-38. For more on our new financial frame see page 22. Strategic resilience We believe our strategy is resilient to the first time we have publishedrange of energy transition pathways and scenarios including Paris, see page 11. For more information on our financial resilience, including our revised long-term price assumptions and impairment testing, see page 28. For information on the estimated lifecycle carbon Recommendation:resilience of our individual investments, including our governance structure and investment process, see page 29. Our strategy is validated annually by the board to ensure it remains relevant and resilient, as part of our standard governance processes. Elements of the strategy may be refreshed earlier if there are significant changes in external or internal environment. TCFD recommendation: Disclose the actual and potential impacts of intensity of our marketed energy products, see page 40. climate-related risks and opportunities on the organization’s We recognize that climate-related risks include both:organization’s business, strategy and financial planning where such information is material. •Recommended disclosure: a. Describe the climate-related risk and opportunities that the organization has identified over the short, medium, and long term. b. The impact of climate-related risks and opportunities on the organization’s businesses, strategy, and financial planning. c. The resilience of the organization’s strategy, taking into consideration different climate- related scenarios, including a 2°C or lower scenario. Our strategy to become an Integrated Energy Company, and our net zero ambition and aims are set out on pages 2-3, 15 and 49. In developing this strategy, the board and leadership team consider a wide range of opportunities and risks across three discrete time horizons: Short term (to 2025): the next five years are defined by detailed business and financial plans, which are performance managed in delivery of our 2025 targets. Medium term (to 2030): looking out 10 years enables us to think beyond the short-term to consider signposts and milestones towards the longer-term scenarios, enabling us to adjust course if required. Long term (to 2050): recognizing the wide range of uncertainties, we use a scenario planning approach to help us explore possible pathways for the energy transition over the next 30 years, as the world moves towards net zero. This includes consideration of changes in policy, societal preferences, economic growth and technological progress. For more detail on our approach and how it informs our strategy, see page 11. TCFD recommendation: Disclose how the organization identifies, assesses and manages climate-related risks. Risk management Recommended disclosure: a. Describe the organization’s processes for identifying and assessing climate-related risks. bp’s risk management system, described on page 64, is designed to address all types of risks including our principal risks and uncertainties described in Risk factors on page 67. As part of this system our operating businesses, integrators and enablers (see page 36) are responsible for identifying, assessing, managing, and monitoring risks associated with their business area. Risks are assessed in line with bp’s risk management policy and this includes an impact and likelihood assessment which supports relative prioritization. Climate-related risks are classified in alignment with TCFD’s description of physical and transition risks: Physical risks –– risks related to the physical impacts of climate change including eventevent- driven risks such as changes in the severity We recognize the significance of the energy transition and the risks and/or frequency of extreme weather events. and opportunities it presents. As part of their consideration of BP’s • Transition risks –– risks related to the transition to a lower carbon strategy, the board and executive team consider risks and opportunities economy including policy and legal, technology, markets and associated with climate change and the energy transition informed by reputational risks. a range of external inputs, including the International Panel on Climate Change (IPCC), academic research and emerging regulatory The potential material impacts of such climate-relatedclimate- related risks are described in Risk requirements, and BP materials such as the different scenarios factors, see pages 70-71. We place importance on pursuing a flexible described inpage 67. Recommended disclosure: b. Describe the BP Energy Outlook 2019. strategy which gives us optionality where there is uncertainty about the pathways to achieve the Paris goals. This positions us to deliver our We believe that the transition to a lower carbon economy presents strategic priorities, and net zero ambition and aims. significant business opportunitiesorganization’s processes for BP. One of our strategic priorities is to pursue new opportunities to meet evolving technology, consumer When developing our strategy, we draw on expertise from across the and policy trends through venturing and low carbon, see page 28. organization. This includes our group economics team and their work Some of the opportunities we see are set out in our RIC framework – on the scenarios described in the BP Energy Outlook 2019. The Energy to improve our products, to help customers lower their emissions and to Outlook, together with other scenarios, informs our price assumptions create new, lower carbon businesses, see page 41. which are part of our investment governance processes. The evaluation of new material capex investment in 2019 for consistency with the Paris We have set out 10 aims to support our ambition to be a net zero goals is discussed on page 21. company by 2050 or sooner and to help the world reach net zero. We believe that collectively, these 10 aims set out a path that is consistent with the Paris goals. One of our specific aims relates to halving the carbon intensity of our marketed products by 2050 or sooner. See page 6 for more information on our net zero ambition and aims. Climate governance: management of climate-related matters in 2019 Chief executive and the executive team Senior leadership Carbon steering group Accountability Focuses on strategy, policy, performance oversight and collaboration relating to carbon management activities across the group. Chaired by our vice president of carbon management. Delegation Upstream carbon steering committee Downstream advancing the energy transition committee Focuses on the delivery of lower carbon plans in the Upstream. Develops and drives the implementation of advancing the Chaired by our chief operating officer of production, energy transition in the Downstream. Chaired by our head transformation and carbon, Upstream. of technology, Downstream and chief scientist. Underpinned by systems, processes and risk management. Executive-level committee. Cross-functional committee. Senior-leadership level. Business and segment committee. BP Annual Report and Form 20-F 2019 43

Our group strategic planning team is responsible for using data from Metrics and targets the BP Energy Outlook and implementing the insights in our strategic Recommendation: Disclose the metrics and targets used to assess frameworks, including our net zero ambition and mid-term RIC targets. and manage relevant climate-related risks and opportunities where We recognize that climate-related risks are an important consideration such information is material. in developing our strategy. Climate-related risks are incorporated into We present the principal group-wide metrics and targets used to assess BP’s governance process, see How we manage risk on page 69. and manage climate-related risks and opportunities on page 17. This Risk management includes the targets we set out in 2018 in our RIC framework. Recommendation: Disclose how the organization identifies, In addition, in 2019 BP announced that sustainable GHG emissions assesses and managesmanaging climate-related risks. reductions would be included as a factor in the reward of around Ourc. Describe how processes for identifying, assessing and managing climate-related risks are 37,000 eligible employees across the group and around the world, integrated into BP’sthe organization’s overall risk management policy and the associated risk including executive directors. This target was 10% of the group’s annual management procedures. BP’s risk management system is designed cash bonus scorecard and we exceeded the target set of 1.0Mte to address all types of risks and as part of this system our operating (1.4Mte). In 2020 we plan to increase the percentage of remuneration businesses are responsible for identifying and managing their risks. which is linked to emissions reductions for our leadership and eligiblemanagement. Risks which may be identified include potential effects on operations employees. Our aim is to mobilize our workforce to become advocates at asset level, performance at business level and developments at for our net zero ambition. regional level from extreme weather or the transition to a lower For information on our 2020 remuneration policy, see page 110. carbon economy.
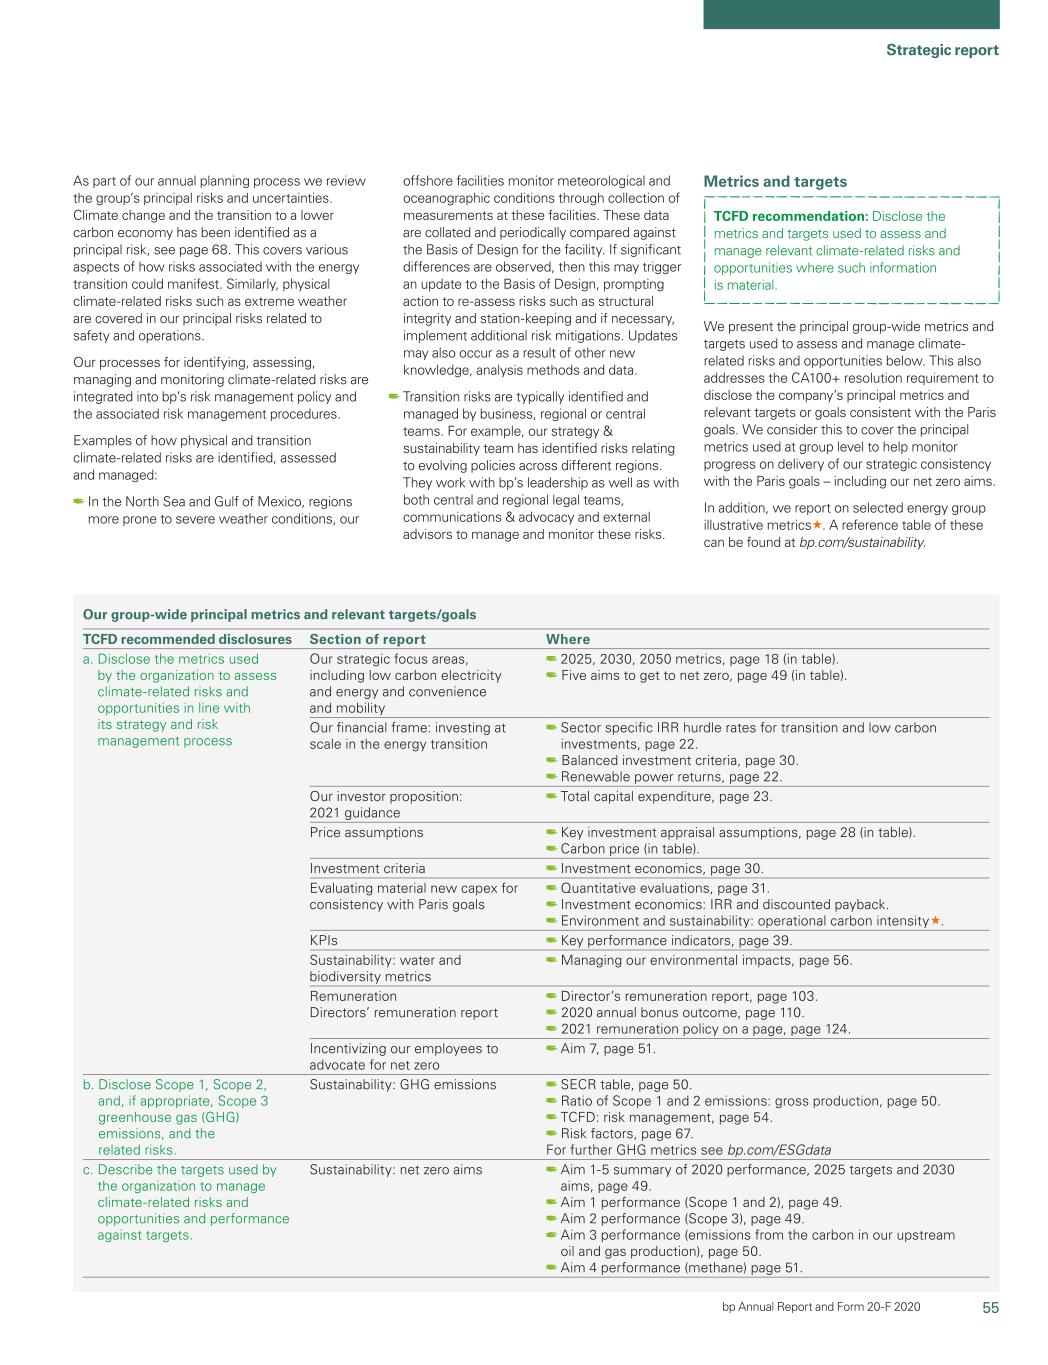
55 Strategic report bp Annual Report and Form 20-F 2020 As part of our annual planning process we review the group’sgroup’s principal risks and uncertainties. Climate change and the transition to a lower carbon economy has been identified as a principal risk, see page 69.68. This covers various aspects of how risks associated with the energy transition could manifest. Similarly, physical climate-related risks such as extreme weather are covered in our principal risks related to safety and operations. TCFD index table TCFD recommended disclosure Where reported Governance a. Describe the board’s oversight of climate-related Page 42. Disclose the organization’s risks and opportunities. governance around climate- b. Describe the management’s role in assessing and Page 42. related issues and opportunities. managing climate related risks and opportunities. Strategy a. Describe the climate-related risks and opportunities Achieving the Paris goals, page 13 – for a discussion of the Disclose the actual and potential the organization has identified over the short, different pathways and time horizons considered impacts of climate-related risks medium, and long term. RIC framework, page 41 – for an outline of opportunities. and opportunities on the Risk factors, pages 70-71 – description of principal risks. organization’s business, strategy b. Describe the impact of climate-related risks and Risk factors, pages 70-71 – description of principal risks. and financial planning where opportunities on the organization’s businesses, such information is material. strategy, and financial planning. c. Describe the resilience of the organization’s strategy, Achieving the Paris goals, page 13. taking into consideration different climate-related Our strategy, page 16. scenarios, including a 2°C or lower scenario. Risk management a. Describe the organization’s processes for identifying Risk management, page 44. Disclose how the organization and assessing climate-related risks. Upstream, page 50. identifies, assesses and Downstream, page 56. manages climate-related risks. Other businesses and corporate, page 63. b. Describe the organization’s processes for managing Risk management, page 44. climate-related risks. c. Describe how processes for identifying, assessing, Risk management, page 44.managing and managingmonitoring climate-related risks are integrated How we manageinto bp’s risk pages 68-69. intomanagement policy and the organization’s overallassociated risk management. Risk factors, pages 70-71. Metricsmanagement procedures. Examples of how physical and targetstransition climate-related risks are identified, assessed and managed: In the North Sea and Gulf of Mexico, regions more prone to severe weather conditions, our Our group-wide principal metrics and relevant targets/goals TCFD recommended disclosures Section of report Where a. Disclose the metrics used by the organization to Relevant group-wide metrics and targets, page 17. Disclose the metrics and targets assess climate-related risks and opportunities in line used to assess and manage with its strategy and risk management process. relevant climate-related risksprocess Our strategic focus areas, including low carbon electricity and energy and convenience and mobility 2025, 2030, 2050 metrics, page 18 (in table). Five aims to get to net zero, page 49 (in table). Our financial frame: investing at scale in the energy transition Sector specific IRR hurdle rates for transition and low carbon investments, page 22. Balanced investment criteria, page 30. Renewable power returns, page 22. Our investor proposition: 2021 guidance Total capital expenditure, page 23. Price assumptions Key investment appraisal assumptions, page 28 (in table). Carbon price (in table). Investment criteria Investment economics, page 30. Evaluating material new capex for consistency with Paris goals Quantitative evaluations, page 31. Investment economics: IRR and discounted payback. Environment and sustainability: operational carbon intensity«. KPIs Key performance indicators, page 39. Sustainability: water and biodiversity metrics Managing our environmental impacts, page 56. Remuneration Directors’ remuneration report Director’s remuneration report, page 103. 2020 annual bonus outcome, page 110. 2021 remuneration policy on a page, page 124. Incentivizing our employees to advocate for net zero Aim 7, page 51. b. Disclose Scope 1, Scope 2, and, if appropriate, GHG emissions data, page 40. and opportunities where such Scope 3 GHGgreenhouse gas (GHG) emissions, and the related risks. information is material.Sustainability: GHG emissions SECR table, page 50. Ratio of Scope 1 and 2 emissions: gross production, page 50. TCFD: risk management, page 54. Risk factors, page 67. For further GHG metrics see bp.com/ESGdata c. Describe the targets used by the organization to RIC framework, page 41. manage climate-related risks and opportunities and (Also note: Net zero ambition and aims, page 6). performance against targets. 44 BPSustainability: net zero aims Aim 1-5 summary of 2020 performance, 2025 targets and 2030 aims, page 49. Aim 1 performance (Scope 1 and 2), page 49. Aim 2 performance (Scope 3), page 49. Aim 3 performance (emissions from the carbon in our upstream oil and gas production), page 50. Aim 4 performance (methane) page 51. offshore facilities monitor meteorological and oceanographic conditions through collection of measurements at these facilities. These data are collated and periodically compared against the Basis of Design for the facility. If significant differences are observed, then this may trigger an update to the Basis of Design, prompting action to re-assess risks such as structural integrity and station-keeping and if necessary, implement additional risk mitigations. Updates may also occur as a result of other new knowledge, analysis methods and data. Transition risks are typically identified and managed by business, regional or central teams. For example, our strategy & sustainability team has identified risks relating to evolving policies across different regions. They work with bp’s leadership as well as with both central and regional legal teams, communications & advocacy and external advisors to manage and monitor these risks. TCFD recommendation: Disclose the metrics and targets used to assess and manage relevant climate-related risks and opportunities where such information is material. Metrics and targets We present the principal group-wide metrics and targets used to assess and manage climate- related risks and opportunities below. This also addresses the CA100+ resolution requirement to disclose the company’s principal metrics and relevant targets or goals consistent with the Paris goals. We consider this to cover the principal metrics used at group level to help monitor progress on delivery of our strategic consistency with the Paris goals – including our net zero aims. In addition, we report on selected energy group illustrative metrics«. A reference table of these can be found at bp.com/sustainability.
56 bp Annual Report and Form 20-F 2019

Strategic report Working with others Safety2020 Sustainability continued Our health, safety, security and security We work with peers, non-governmental organizations and Safety remains our number one priority and one of our core values. academic institutions to support the energy transition. Our aim is to haveenvironmental (HSSE) goals are: no accidents, no harm to people and no damage to the environment. The Oil and Gas Climate Initiative (OGCI) brings together 13 oil and gas companies to increase the ambition, speed and scale of the initiatives We are working to continue to improve personal and process safety and undertaken by its individual companies to help reduce manmade GHG operational risk management across BP and to strengthen our safety emissions. OGCI announced a collective methane intensity target for management. Our approach builds on our experience, including learning member companies in 2018. from incidents, operations audits, annual risk reviews and sharing For more information on BP’s methane intensity, see page 34. lessons learned with our industry peers. BP is working with OGCI Climate Investments and certain other OGCI Process safety events Recordable injury frequency member companies to help progress the UK’s first commercial (number of incidents) (workforce incidents per 200,000 hours worked) full-chain carbon capture, use and storage project. Net Zero Teesside 100 0.4 83 84 plans to capture CO2 from new, efficient gas-fired power generation and 72 transport it by pipeline to be stored in a formation under the southern 75 0.3 61 North Sea. The infrastructure would also allow other industries in 56 Teesside to store CO2 captured from their processes. The project, 50 0.2 which is currently undergoing a feasibility study, could be in operation by the mid-2020s. 25 0.1 26 20 16 18 16 Managing our impacts 0 0 2015 2016 2017 2018 2019 2015 2016 2017 2018 2019 We work hard to avoid, mitigate and manage our environmental Tier 1 Tier 2 Workforce 0.243 0.211 0.218 0.198 0.166 and social impacts over the life of our operations. Employee 0.203 0.194 0.202 0.152 0.128 Contractor 0.279 0.222 0.229 0.233 0.193 The way our businesses around the world are expected to understand American Petroleum Institute US benchmark* and manage their environmental and social impacts is set out in our International Association of Oil & Gas operating management systemsystem« (OMS). This includes requirements on Producers benchmark* engaging with stakeholders who may be affected by our activities. * API and IOGP 2019 data reports are not available until May 2020. In planning our projects, we identify potential impacts from our activities in areas such as land rights, water use and protected areas. We use the Keeping people safe results of this analysis to identify actions and mitigation measures and All our employees and contractors have the responsibility and the look to implement these in project design, construction and operations. authority to stop unsafe work. Our safety rules guide our workers on For example, in Mauritania and Senegal we are working with national staying safe while performing tasks with the potential to cause most and international scientists on the biodiversity action plan for the harm. The rules are aligned with our OMS and focus on areas such as Greater Tortue Ahmeyim development. working at heights, lifting operations and driving safety. Our OMS requires each of BP’sbp’s operating businesses and functions to We monitor and report on key workforce personal safety metrics in line create and maintain its own OMS handbook, describing how it will carry with industry standards. We include both employees and contractors in out its local operating activities. Through self-verification, local business our data. processes are reviewed and areas for improvement are prioritized, allowing focus on delivering safe, reliable and compliant operations. TragicallyAir emissions We monitor our air emissions and put measures in place to reduce the potential impact of our activities on local communities. As part of our aim 19 we suffered two fatalitiesplan to evaluate the air emissions from our global operating facilities to better understand how they may be affected while advancing our net zero aims for GHG emissions. For more on air emissions, see the bp Sustainability Report 2020. Caring for our planet Our sustainability frame includes a focus on making a positive difference to the environment in 2019. In July a fire-fighting assistantwhich we operate. The scope of our care for our planet aims covers biodiversity, water management, nature-based solutions including those that reduce or remove carbon, circularity and sustainable purchasing. Water We actively manage our freshwater demands in our biofuels business in Brazil was fatally injured following a For informationareas of stress and scarcity. Based on our oil spill performance see page 46. fire truck accident while attending to an agricultural fire. In October a Water contractor at our Whiting refinery in the US was fatally injured when he We review water risks every year, taking into account availability, fell from a scaffold ladder. quantity, quality and regulatory requirements. We also use a range of tools, including the Global Environmental Management Initiative Local 2019 2018 2017 a Water Tool andanalysis using the World Resources Institute Aqueduct Global Water Risk Atlas, four of our 24 major operating sites were located in regions with high or extremely high water stress in 2020, with another four in areas of medium to high water stress. This number reduces to three in regions with high or extremely high water and three in regions of medium to high water stress, if our bp petrochemicals and other 2020 divestments are excluded. In 2020 we saw a 2% fall in freshwater withdrawals and a 17% fall in freshwater consumption compared to 2019. This was largely due to the divestment of our Alaskan operation in 2020, the formation of the bp Bunge non- operated joint venture from bp operated biofuels and biopower businesses at the end of 2019 and a reduction in freshwater use in our bpx energy operations during 2020. We have set an aim to be water positive by 2035. We aim to replenish more freshwater than we consume in our operations. We will do this by being more efficient in operational freshwater use and effluent management, and by collaborating with others to replenish freshwater in stressed and scarce catchment areas where we operate. Biodiversity We have set an aim to enhance biodiversity, focusing on making a positive impact through our actions to restore, maintain and enhance biodiversity where we work. We expect that from 2022 all new bp projects in scope will have plans in place aiming to achieve net positive impact (NPI), with a target for 90% of actions to be delivered within five years of project approvala. We also aim to enhance biodiversity at our major operating sites and support biodiversity restoration and sustainable use of natural resource projects in the countries where we have current or growing investments. In 2020 we launched our new biodiversity position and focused on sharing it with our stakeholders and putting in place the resources to deliver it. We also started work on defining our NPI methodology with Fauna & Flora International, which we expect to complete at the end of 2021. bp.com/biodiversity Our aims to care for our planet: Aim 16: enhance biodiversity. Aim 17: water positive. Aim 18: championing nature-based solutions. Aim 19: unlock circularity. Aim 20: sustainable purchasing. bp.com/planet a Applicable projects that have the potential for significant direct impacts on biodiversity. Only actions that are intended to be delivered within five years in accordance with the NPI methodology are included. The 30% and 90% targets apply in aggregate across all applicable projects that meet the relevant timeframes from the final project approval (and are not targets for individual projects). Managing our environmental impacts
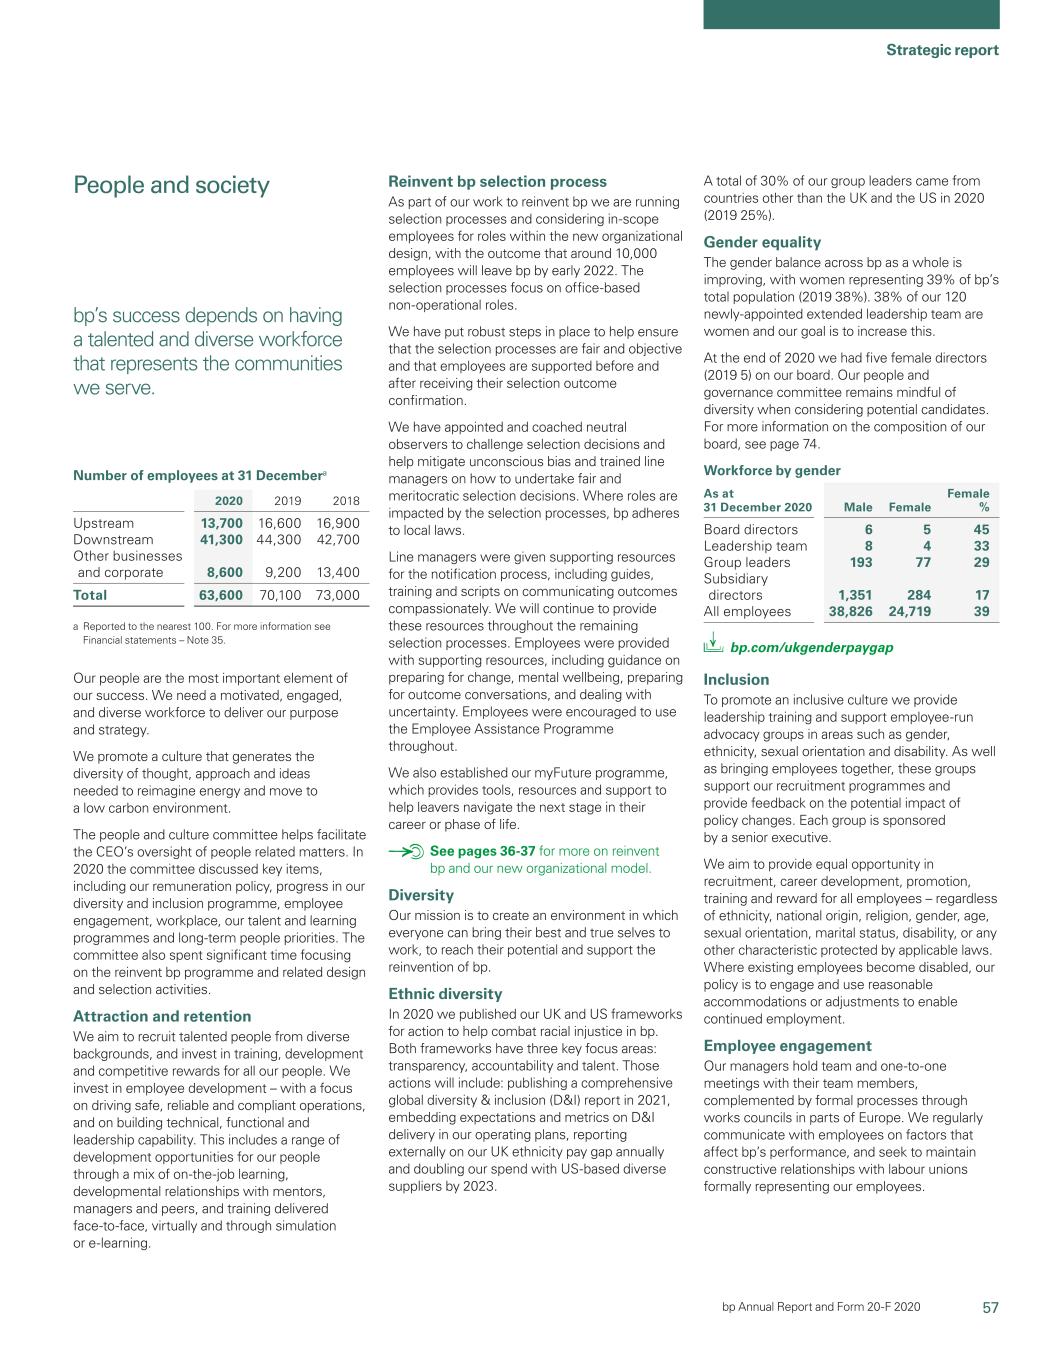
57 Strategic report bp Annual Report and Form 20-F 2020 Number of employees at 31 Decembera 2020 2019 2018 Upstream 13,700 16,600 16,900 Downstream 41,300 44,300 42,700 Other businesses and corporate 8,600 9,200 13,400 Total 63,600 70,100 73,000 a Reported to the nearest 100. For more information see Financial statements – Note 35. Our people are the most important element of our success. We need a motivated, engaged, and diverse workforce to deliver our purpose and strategy. We promote a culture that generates the diversity of thought, approach and ideas needed to reimagine energy and move to a low carbon environment. The people and culture committee helps facilitate the CEO’s oversight of people related matters. In 2020 the committee discussed key items, including our remuneration policy, progress in our diversity and inclusion programme, employee engagement, workplace, our talent and learning programmes and long-term people priorities. The committee also spent significant time focusing on the reinvent bp programme and related design and selection activities. Attraction and retention We aim to recruit talented people from diverse backgrounds, and invest in training, development and competitive rewards for all our people. We invest in employee development – with a focus on driving safe, reliable and compliant operations, and on building technical, functional and leadership capability. This includes a range of development opportunities for our people through a mix of on-the-job learning, developmental relationships with mentors, managers and peers, and training delivered face-to-face, virtually and through simulation or e-learning. bp’s success depends on having a talented and diverse workforce that represents the communities we serve. Reinvent bp selection process As part of our work to reinvent bp we are running selection processes and considering in-scope employees for roles within the new organizational design, with the outcome that around 10,000 employees will leave bp by early 2022. The selection processes focus on office-based non-operational roles. We have put robust steps in place to help ensure that the selection processes are fair and objective and that employees are supported before and after receiving their selection outcome confirmation. We have appointed and coached neutral observers to challenge selection decisions and help mitigate unconscious bias and trained line managers on how to undertake fair and meritocratic selection decisions. Where roles are impacted by the selection processes, bp adheres to local laws. Line managers were given supporting resources for the notification process, including guides, training and scripts on communicating outcomes compassionately. We will continue to provide these resources throughout the remaining selection processes. Employees were provided with supporting resources, including guidance on preparing for change, mental wellbeing, preparing for outcome conversations, and dealing with uncertainty. Employees were encouraged to use the Employee Assistance Programme throughout. We also established our myFuture programme, which provides tools, resources and support to help leavers navigate the next stage in their career or phase of life. See pages 36-37 for more on reinvent bp and our new organizational model. Diversity Our mission is to create an environment in which everyone can bring their best and true selves to work, to reach their potential and support the reinvention of bp. Ethnic diversity In 2020 we published our UK and US frameworks for action to help combat racial injustice in bp. Both frameworks have three key focus areas: transparency, accountability and talent. Those actions will include: publishing a comprehensive global diversity & inclusion (D&I) report in 2021, embedding expectations and metrics on D&I delivery in our operating plans, reporting externally on our UK ethnicity pay gap annually and doubling our spend with US-based diverse suppliers by 2023. A total of 30% of our group leaders came from countries other than the UK and the US in 2020 (2019 25%). Gender equality The gender balance across bp as a whole is improving, with women representing 39% of bp’s total population (2019 38%). 38% of our 120 newly-appointed extended leadership team are women and our goal is to increase this. At the end of 2020 we had five female directors (2019 5) on our board. Our people and governance committee remains mindful of diversity when considering potential candidates. For more information on the composition of our board, see page 74. Workforce by gender As at 31 December 2020 Male Female Female % Board directors 6 5 45 Leadership team 8 4 33 Group leaders 193 77 29 Subsidiary directors 1,351 284 17 All employees 38,826 24,719 39 bp.com/ukgenderpaygap Inclusion To promote an inclusive culture we provide leadership training and support employee-run advocacy groups in areas such as gender, ethnicity, sexual orientation and disability. As well as bringing employees together, these groups support our recruitment programmes and provide feedback on the potential impact of policy changes. Each group is sponsored by a senior executive. We aim to provide equal opportunity in recruitment, career development, promotion, training and reward for all employees – regardless of ethnicity, national origin, religion, gender, age, sexual orientation, marital status, disability, or any other characteristic protected by applicable laws. Where existing employees become disabled, our policy is to engage and use reasonable accommodations or adjustments to enable continued employment. Employee engagement Our managers hold team and one-to-one meetings with their team members, complemented by formal processes through works councils in parts of Europe. We regularly communicate with employees on factors that affect bp’s performance, and seek to maintain constructive relationships with labour unions formally representing our employees. People and society
58 bp Annual Report and Form 20-F 2020 Sustainability continued To understand what our employees think and feel about bp, we run an annual ‘Pulse’ survey as well as ‘Pulse Live’ surveys, which enable us to monitor changes in employee sentiment on a weekly basis. The overall employee engagement positivity score in our 2020 annual survey was 64% (2019 65%). Pride in working for bp was 75% (2019 75%). Employees participating in the 2020 Pulse survey told us they strongly supported the launch of bp’s new purpose and ambition in February and the strategy announcement in August. Initial positivity over the strategy waned in December, with employees expressing anxiety about the reinvent process and economic uncertainty during 2020. Most participants felt confident in bp’s approach to managing the impact of the COVID-19 pandemic. Employees also told us we should focus on addressing workload, supporting health and wellbeing and being transparent about the new structure. Share ownership We continue to encourage employee share ownership and have a number of employee share plans in place. For example, we operate a ShareMatch plan in more than 50 countries, matching bp shares purchased by our employees. We also make annual share awards as part of our total reward package all for senior and mid-level employees globally, and a portion of our more junior professional grade staff. In February 2021, we introduced the reinvent bp share award to incentivize our employees in meeting our aims. All employees will receive a one-off grant of either shares or share options that will become available to keep, sell or transfer in the first quarter of 2025. Wellbeing and mental health Mental health and physical wellbeing are priorities for us and we recognized that the COVID-19 pandemic had direct and indirect consequences for our employees and their families. We offered access to a range of facilities and services, including support through our well-established Employee Assistance Programme and new interventions, including providing access to the Headspace app to both employees and their partners. Our annual global physical wellbeing programme had 5,887 participants from 59 countries, with positive feedback on helping keep teams connected and keeping people physically active. We continue to improve our systematic management of health data points and sources, to identify where we can target preventive interventions and provide training, support and resources to help improve employee wellbeing and performance. We believe wellbeing at work is becoming part of the bp language – a critical part of caring for our people and the communities in which we operate. Value to society Improving people’s lives One of our sustainability frame areas of focus is to improve people’s lives. We have set five people aims focusing on where bp can make the biggest difference. We want people to benefit from our presence in their local communities, wherever we run projects or operate. This includes collaborating with local communities to support sustainable livelihoods and build greater resilience as part of a just transition. Our work on sustainable livelihoods to date supports several of the UN Sustainable Development Goals, in particular on education, health and economic growth as drivers for sustainable livelihoods. Human rights We believe everyone deserves to be treated with fairness, respect and dignity. At bp we strive to conduct our business in a responsible way, respecting the human rights of our workers and everyone we come into contact with. Our human rights policy and our code of conduct help us do that. See page 63 for information on how we updated our business and human rights policy in 2020. We respect internationally recognized human rights as set out in the International Bill of Human Rights and the International Labour Organization’s Declaration on Fundamental Principles and Rights at Work, including the core Conventions. These include the rights of our workforce and those living in communities potentially affected by our activities. We incorporate the UN Guiding Principles on Business and Human Rights, which set out how companies should prevent, address and remedy human rights impacts, into our business processes. When working to remediate any impacts on the rights of local communities we are open to co-operating in good faith to agree remedial actions through state-led mechanisms such as the Organisation for Economic Co-operation and Development National Contact Points. We recognize the importance of accessible and effective operational-level grievance mechanisms in addressing our impacts. bp.com/humanrights Our aims to improve people’s lives: Aim 11: more clean energy. Aim 12: just transition. Aim 13: sustainable livelihoods. Aim 14: greater equity. Aim 15: enhance wellbeing. bp.com/people
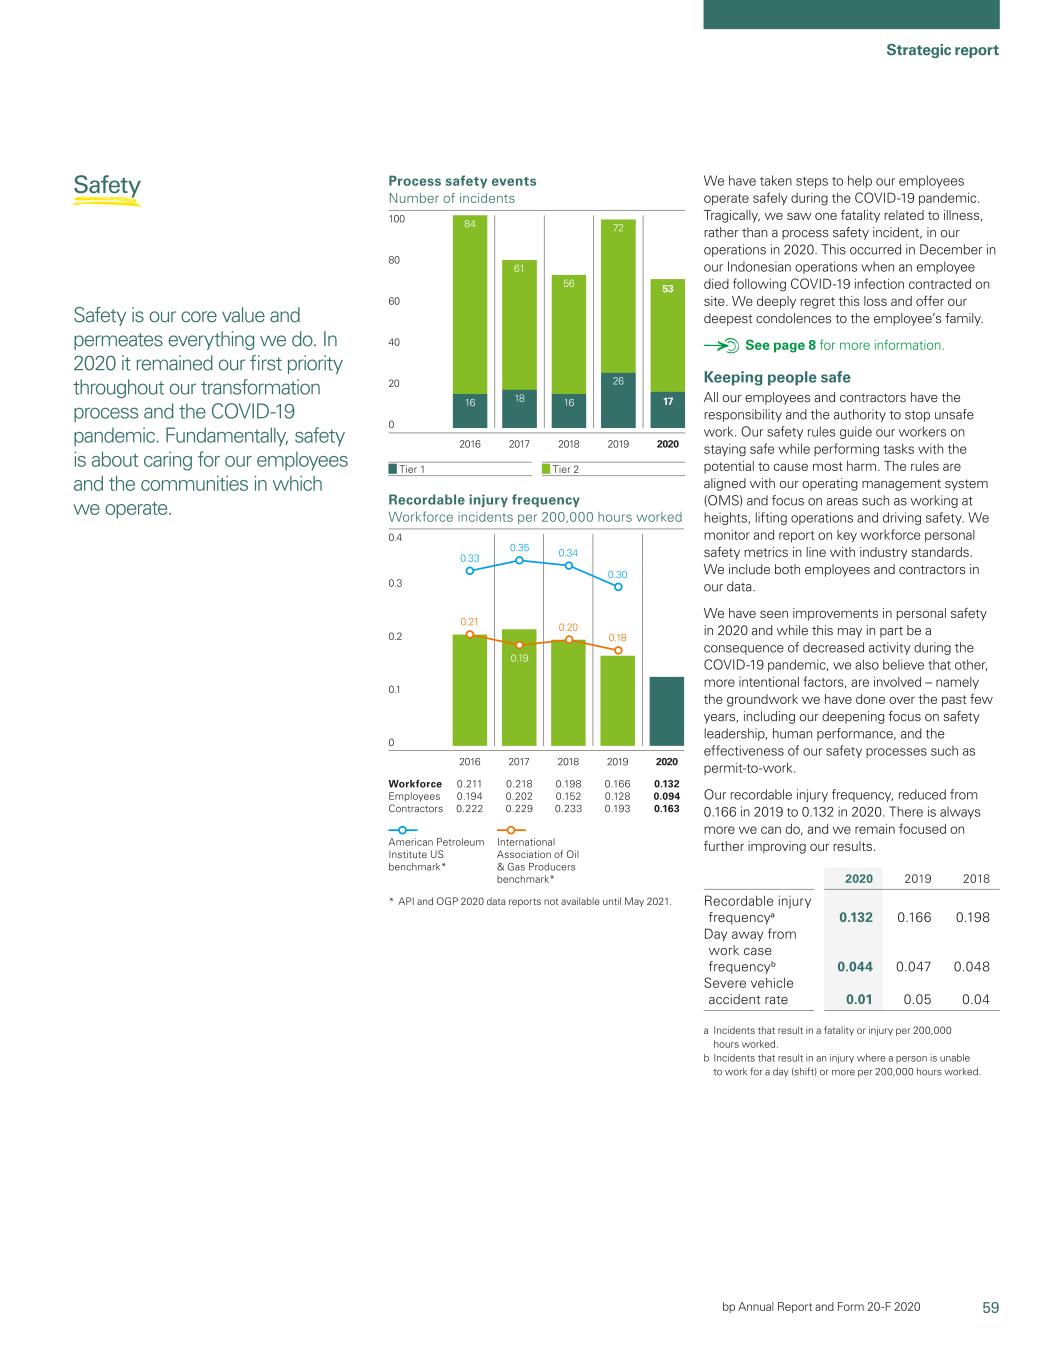
59 Strategic report 0 20 40 60 80 100 Tier 1 Tier 2 Process safety events Number of incidents 17 26 161816 53 72 56 61 84 2019 2020201820172016 Recordable injury frequency Workforce incidents per 200,000 hours worked 2019 2020201820172016 0.30 0.340.350.33 0.18 0.20 0.19 0.21 0 0.1 0.2 0.3 0.4 Workforce 0.211 0.218 0.198 0.166 0.132 Employees 0.194 0.202 0.152 0.128 0.094 Contractors 0.222 0.229 0.233 0.193 0.163 American Petroleum Institute US benchmark* International Association of Oil & Gas Producers benchmark* * API and OGP 2020 data reports not available until May 2021. bp Annual Report and Form 20-F 2020 Safety Safety is our core value and permeates everything we do. In 2020 it remained our first priority throughout our transformation process and the COVID-19 pandemic. Fundamentally, safety is about caring for our employees and the communities in which we operate. We have taken steps to help our employees operate safely during the COVID-19 pandemic. Tragically, we saw one fatality related to illness, rather than a process safety incident, in our operations in 2020. This occurred in December in our Indonesian operations when an employee died following COVID-19 infection contracted on site. We deeply regret this loss and offer our deepest condolences to the employee’s family. See page 8 for more information. Keeping people safe All our employees and contractors have the responsibility and the authority to stop unsafe work. Our safety rules guide our workers on staying safe while performing tasks with the potential to cause most harm. The rules are aligned with our operating management system (OMS) and focus on areas such as working at heights, lifting operations and driving safety. We monitor and report on key workforce personal safety metrics in line with industry standards. We include both employees and contractors in our data. We have seen improvements in personal safety in 2020 and while this may in part be a consequence of decreased activity during the COVID-19 pandemic, we also believe that other, more intentional factors, are involved – namely the groundwork we have done over the past few years, including our deepening focus on safety leadership, human performance, and the effectiveness of our safety processes such as permit-to-work. Our recordable injury frequency, reduced from 0.166 in 2019 to 0.132 in 2020. There is always more we can do, and we remain focused on further improving our results. 2020 2019 2018 Recordable injury frequencya 0.132 0.166 0.198 0.218 Risk Atlas. Day away from work case frequencyb 0.044 0.047 0.048 0.055 Severe vehicle accident rate 0.01 0.05 0.04 0.03 In 2019 we saw a 4% rise in freshwater withdrawals and a 3% rise in freshwater consumption. This was largely due to increased production, a Incidents that result in a fatality or injury per 200,000 hours worked. with freshwater withdrawal and consumption intensities remaining flat, b Incidents that result in an injury where a person is unable to work for a day (shift) or more compared with 2018. per 200,000 hours worked. Air emissions Our recordable injury frequency, which includes BHP assets acquired in We put measures in place to manage our air emissions, in line with 2018, reduced by 16% in 2019. There is always more we can do and we regulations and industry guidelines designed to protect the health of remain focused on achieving better results today and in the future. local communities and the environment. In 2019 we took delivery of the last three vessels in our new fleet of six liquefied natural gas (LNG) carriers. These use around 25% less fuel and emit less nitrogen oxides than the older LNG carriers in the BP operated fleet. See bp.com/environment for more information. BP
60 bp Annual Report and Form 20-F 2019 45

2020 Sustainability continued Managing safety Cyber threats BP-operatedbp-operated businesses are responsible for identifying and managing The severity, sophistication and scale of cyber attacks continues to operating risks and bringing together people with the right skills and evolve. The increasing digitalization and reliance on IT systems makes competencies to address them. Our safety and operational risk assurance team managing cyber risk an even greater priority for many industries, works alongside BP-operatedbp-operated businesses to provide oversight and including our own. technical guidance, while our group audit team visits sites on a The risk comes from a variety of cyber-threat actors, including nation risk-prioritized basis to check how they are managing risks. states, criminals, terrorists, hacktivists and insiders. As with previous Our operating management system years, we’ve experienced threats to the security of our digital infrastructure, but none of these had a significant impact on our Our OMS is a group-wide framework designed to help us manage risks business in 2019. We have a range of measures to manage this risk, in our operating activities and drive performance improvements. It brings including the use of cyber-security policies and procedures, security together BPbp requirements on health, safety, security, the environment, protection tools, continuous threat monitoring and event detection social responsibility and operational reliability, as well as related issues, capabilities, and incident response plans. We also conduct exercises such as maintenance, contractor relations and organizational learning, to test our response to and recovery from cyber attacks. To encourage into a common management system. vigilance among our staff, our cyber-security training and awareness programme covers topics such as phishing and the correct classification Our OMS also helps us improve the quality of our activities by setting a and handling of our information. We collaborate closely with governments, common framework that our operations must work to. We review and law enforcement and industry peers to understand and respond to new amend these requirements from time to time to reflect our priorities. and emerging threats. Any variations in the application of our OMS, in order to meet local regulations or circumstances, are subject to a governance process. Security Recently acquired operations need to transition to our OMS. Preventing incidents We carefully plan our operations, with the aim of identifying potential hazards and having rigorous operating and maintenance practices applied by capable people to manage risks at every stage. We design our new facilities in line with process safety, good design and engineering principles. We track our safety performance using industry metrics such as the American Petroleum Institute recommended practice 754 and the International Association of Oil & Gas Producers recommended practice 45. Our process safety performance improved from 2019 and was roughly comparable to 2018 and 2017. There were 35% fewer tier 1 process safety events in 2020 compared to 2019, but our performance was broadly in line with the previous three years. We also recorded 26% fewer tier 2 process safety events compared to 2019, lower than the previous 10 years. The combined tier 1 and tier 2 process safety events were down 29% in 2020 compared to 2019. We investigate incidents including near misses. And we use leading indicators, such as inspections and equipment tests, to monitor the strength of controls to prevent incidents. 2020 2019 2018 Tier 1 and tier 2 process safety eventsa 70 98 72 Oil spills – numberb 121 152 124 Oil spills contained 70 90 63 Oil spills reaching land and water 46 58 57 Oil spilled – volume (thousand litres) 784 710 538 Oil unrecovered (thousand litres) 494 300 131 a Tier 1 process safety events are losses of primary containment of greatest consequence – such as causing harm to a member of the workforce, costly damage to equipment or exceeding defined quantities. Tier 2 events are those of lesser consequence. b Number of spills greater than or equal to one barrel (159 litres, 42 US gallons). Emergency preparedness The scale and spread of bp’s operations means we must be prepared to respond to a range of possible disruptions and emergency events, such as the COVID-19 pandemic. We maintain disaster recovery, crisis and business continuity management plans and work to build day-to- day response capabilities to support local management of incidents. Security We monitor for hostile actions that could harm our people or disrupt Preventing incidents our operations. These actions might be connected to political or social unrest, terrorism, armed conflict or criminal activity. We take these We carefully plan our operations, with the aim of identifying potential potential threats seriously and assess them continuously. hazards and having rigorous operating and maintenance practices applied by capable people to manage risks at every stage. We design Our 24-hour response information centre in the UK uses state-of-the-art our new facilities in line with process safety, good design and technology to monitor evolving high-risk situations in real-time.real time. It helps engineering principles. us to assess the safety of our people and provide them with practical advice if there is an emergency. Cyber security The severity, sophistication and scale of cyber attacks continues to evolve. The increasing digitalization and reliance on IT systems makes managing cyber risk an even greater priority for many industries, including our own. The risk comes from a variety of cyber-threat actors, including nation states, criminals, terrorists, hacktivists and insiders. As with previous years, we’ve experienced threats to the security of our digital infrastructure, but none of these had a significant impact on our business in 2020. We trackhave a range of measures to manage this risk, including the use of cyber-security policies and procedures, security protection tools, continuous threat monitoring and event detection capabilities, and incident response plans. We also conduct exercises to test our safety performance using industry metricsresponse to and recovery from cyber attacks. To encourage vigilance among our staff, our cyber-security training and awareness programme covers topics such as the American Petroleum Institute recommended practice 754phishing and the This year, we faced a numbercorrect classification and handling of protests.our information. We workedcollaborate closely with local police, International Association of Oil & Gas Producers recommended including marine authorities,governments, law enforcement and industry peers to minimize any disruption from theseunderstand and respond to practice 456. our operations. 2019 2018 2017new and emerging threats. Working with contractors Tier 1 and tier 2 process safety eventsa 98 72 79 Through documents that help bridge between our policies and those Oil spills – numberb 152 124 139 of our contractors, we define the way our safety management system Oil spills contained 90 63 81 co-exists with those of our contractors to manage risk on a site. For our Oil spills reaching land and water 58 57 58 contractors facing the most serious risks, we conduct quality, technical, Oil spilled – volume (thousand litres) 710 538 886 health, safety and security audits before awarding contracts. Once they Oil unrecovered (thousand litres) 300 131 265 start work, we continue to monitor their safety performance. a Tier 1 process safety events are losses of primary containment of greatest consequence Our OMS includes requirements and practices for working with – such as causing harm to a member of the workforce, costly damage to equipment or contractors. Our standard model contracts include health, safety and exceeding defined quantities. Tier 2 events are those of lesser consequence. security requirements. We expect and encourage our contractors and b Number of spills greater than or equal to one barrel (159 litres, 42 US gallons). their employees to act in a way that is consistent with our code of The total number of tier 1 and tier 2 process safety events increased conduct and take appropriate action if those expectations, or their in 2019, mainly reflecting performance in assets recently acquired. contractual obligations, are not met. Underlying performance across the group improved slightly from 2018. We are implementing BP procedures and processes to help bring newly Our partners in joint arrangements acquired assets in line with BP assets.« In joint arrangements where we are the operator, our OMS, code of We investigate incidents including near misses. And we use leading conduct and other policies apply. We aim to report on aspects of our indicators, such as inspections and equipment tests, to monitor the business where we are the operator –– as we directly manage the strength of controls to prevent incidents. We also use techniques that performance of these operations. We monitor performance and how risk is help teams to analyse and redesign tasks to reduce the chance of managed in our joint arrangements, whether we are the operator or not. mistakes occurring. Where we are not the operator, our OMS is available as a reference point for BPbp businesses when engaging with operators and co- Emergency preparedness venturers.co-venturers. We have a group framework to assess and manage BP’s The scale and spread of BP’s operations means we must be preparedbp’s exposure related to safety, operational and bribery and corruption risk to respond to a range of possible disruptions and emergency events. from our participation in these types of arrangements. Where We maintain disaster recovery, crisis and business continuity appropriate, we may seek to influence how risk is managed in management plans and work to build day-to-day response capabilities arrangements where we are not the operator. to support local management of incidents. 46 BP
61 Strategic report bp Annual Report and Form 20-F 2019

Strategic report2020 Our people At the end of 2019 we had five female directors (2018 5) on our board. Our nomination committee remains mindful of diversity when considering BP’s success depends on having a talentedvalues and diverse workforce that potential candidates. For more information on the composition of our represents the communities we serve. board, see page 74. In the UK we report the gender pay gap for five BP entities. Our 2019 Number of employees at 31 Decembera 2019 2018 2017 report shows small improvements since 2018, including improvements Upstream 16,600 16,900 17,700 in our highest pay gap entities – BP p.l.c. and BP Exploration Operating Downstream 44,300 42,700 42,100 Company Limited. Six of the 10 gaps have narrowed. Our challenge is Other businesses and corporate 9,200 13,400 14,200 to maintain and, if possible, accelerate this trend. We are working to Total 70,100 73,000 74,000 address the differences but recognize that this is a long-term challenge. a Reported to the nearest 100. For more information see Financial statements – Note 35. See bp.com/ukgenderpaygap for data and more information on our gender pay gap in the UK. Our people are the most important element of our success. We need a motivated, engaged, and diverse workforce to deliver our purpose Inclusion and strategy. We aim to build a culture that generates the diversity of thought, approach and ideas needed to play a leading role in the To promote an inclusive culture we provide leadership training and energy transition, a culture in which people’s wellbeing is valued and support employee-run advocacy groups in areas such as gender, differences are respected. ethnicity, sexual orientation and disability. As well as bringing employees together, these groups support our recruitment programmes and The group people committee helps facilitate the group chief executive’s provide feedback on the potential impact of policy changes. Each oversight of policies relating to employees. In 2019 the committee group is sponsored by a senior executive. discussed people policies, including our remuneration policy, progress in our diversity and inclusion programme, modernizing and strengthening In 2019 we built closer ties between our central diversity and our attractiveness as an employer, our talent and learning programmes inclusion team and local business resource groups (BRGs). We also and long-term people priorities. held a number of events for employees from our BRGs, including an ‘economics of diversity’ webcast, a roadshow and a diversity and Attraction and retention inclusion week. We aim to recruit talented people from diverse backgrounds, and We aim to ensure equal opportunity in recruitment, career development, invest in training, development and competitive rewards for all our promotion, training and reward for all employees – regardless of ethnicity, people. We invest in employee development – with a focus on driving national origin, religion, gender, age, sexual orientation, marital status, safe, reliable and compliant operations, and on building technical, disability, or any other characteristic protected by applicable laws. functional and leadership capability. This includes a range of Where existing employees become disabled, our policy is to engage development opportunities for our people through a mix of on-the-job and use occupational assistance where needed, and to use reasonable learning, developmental relationships with mentors, managers and accommodations or adjustments to enable continued employment. peers, and training delivered face-to-face, virtually and through We have been recognized by a number of external awards in 2019, simulation or e-learning. including The Times newspaper’s Top 50 Employers for Women, Stonewall Global Leader and the FT’s Inclusive Companies recognition. Diversity We set out our current diversity and inclusion ambition in 2012. It is Employee engagement based on our core values of safety, respect, excellence, courage and Our managers hold regular team and one-to-one meetings with their one team. team members, complemented by formal processes through works We aim to attract, develop and retain the best talent and to create a councils in parts of Europe. We regularly communicate with employees diverse and inclusive working environment, where everyone is on factors that affect BP’s performance, and seek to maintain accepted, valued and treated equally without discrimination. constructive relationships with labour unions formally representing our employees. A total of 25% of our group leaders came from countries other than the UK and the US in 2019 (2018 24%). To understand what our employees think and feel about BP, we run an annual ‘Pulse’ survey and in 2019 we introduced ‘Pulse Live’, which Workforce by gender enables us to monitor changes in employee sentiment on a weekly As at 31 December 2019 Male Female Female % basis. The overall employee engagement score in our 2019 survey was Board directors 7 5 42 65% (2018 66%). Pride in working for BP was 75% (2018 76%). In the Executive team 11 2 15 2019 survey, participating employees told us we should focus more attention in several areas, including: sharing our strategy, reinforcing the Group leaders 285 93 25 need for an open speak-up culture, explaining how BP is taking action to Subsidiary directors 1,202 247 17 help create a low carbon future and providing updates on safety All employees 43,762 26,280 38 improvements and other priorities. The gender balance across BP as a whole is improving, with women Share ownership representing 38% of BP’s total population (2018 35%). We are working to improve these numbers further by, for example, developing We encourage employee share ownership and have a number of mentoring, sponsorship and coaching programmes to help more employee share plans in place. For example, we operate a ShareMatch women advance. But we still have work to do at the executive and plan in more than 50 countries, matching BP shares purchased by our senior levels. employees. We also operate a group-wide discretionary share plan, which allows employee participation at different levels globally and is linked to the company’s performance. BP Annual Report and Form 20-F 2019 47

Communities Value to society We aim to have a positive and enduring impact on the communities in which we operate. In supplying energy, we contribute to economies around the world by employing local staff, helping to develop national and local suppliers, and through the funds we pay to governments from taxes and other agreements. Additionally, our social investments support community efforts to increase incomes and improve standards of living. We committed $84 million in social investment in 2019 (2018 $114.2 million). We aim to recruit our workforce from the community or country in which we operate. We also run programmes to build the skills of businesses and develop the local supply chain in a number of locations. For example, in the West Nile Delta, we provided training on vocational skills and health and safety standards for local people. We reached more than 2,000 people by the end of 2019. Nationals employed 2019 2018 Angola 88% 87% Azerbaijan 92% 91% Egypt 81% 78% Indonesia 97% 96% Oman 80% 77% Trinidad & Tobago 96% 96% See bp.com/society for more information on how we generate value to society. Human rights We are committed to respecting the rights and dignity of all people when conducting our business. We respect internationally recognized human rights as set out in the International Bill of Human Rights and the International Labour Organization’s Declaration on Fundamental Principles and Rights at Work. These include the rights of our workforce and those living in BP Target Neutral communities potentially affected by our activities. By buying carbon offsets, Target Neutral is supporting finance in projects that not only reduce We set out our commitments in our business and human rights policy carbon but make a critical difference to the health and our code of conduct. Our OMS contains guidance on respecting the of low-income families. rights of workers and community members. The ONIL cookstove project has equipped 25,000 We are incorporating the UN Guiding Principles on Business and Human rural homes in Mexico with cookstoves that burn Rights, which set out how companies should prevent, address and more efficiently, using up to 58% less firewood remedy human rights impacts, into our business processes. Our focus than a traditional open fire, and are equipped with areas include ethical recruitment and working conditions, responsible chimneys to take harmful cooking fumes outside the household. security and community health and livelihoods. See bp.com/humanrights for more information about our approach to human rights. 48 BP Annual Report and Form 20-F 2019

Strategic report Governance and business ethics Lobbying and political donations Our aim is to more actively advocate for policies that support net zero, Our values including carbon pricing, see page 41.conduct Our values of safety, respect, excellence, courage and one team We work with governments on a range of issues that are relevant to represent the qualities and actions we wish to see in BP.bp. They inform our business, from regulatory compliance, to understanding our tax the wayhow we do business and the decisions we make. We use these liabilities, to collaborating on community initiatives. The way in which values as part of our recruitment, promotion and individual performance we interact with those governments depends on the legal and management processes. regulatory framework in each country. See bp.com/values for more information. We prohibit the use of BP funds or resources to support any political The BP code of conduct candidate or party. We recognize the rights of our employees to participate in the political Our code of conduct is based on our values and sets clear expectations process and these rights are governed by the applicable laws in the for how we work at BP.bp. It applies to all BPbp employees including countries in which we operate. For example, in the US we provideand members of the board. administrative support for the BP employee political action committee Employees, contractors or other third parties who have a question (PAC), which is a non-partisan committee that encourages voluntary about our code of conduct or see something that they feel is unethical employee participation in the political process. All BP employee PAC or unsafe can discuss this with their managers, supporting teams, contributions are reviewed for compliance with federal and state law works councils (where relevant) or through OpenTalk, a confidential and are publicly reported in accordance with US election laws. and anonymous helpline operated by an independent company. Trade associations We received more than 1,8001,600 concerns or enquiries through these channels in 2019 (2018 1,712)2020 (2019 1,800). The most commonly raised concerns We aim to set new expectations for our relationships with trade were related to the ‘Our people’‘Our people’ section of our code.code of conduct. The section associations around the world. BP is a member of many industry addresses issues such as harassment, equal opportunity, and diversity associations that offer opportunities to share good practices and and inclusion. collaborate on issues of importance to our sector. In 2019 we began an in-depth review assessing the alignment of the climate-related We take steps to identify and correct areas of non-conformance and policies and activities of 30 key trade associations to which we take disciplinary action where appropriate. In 20192020 our businesses belong with BP’s position. As a result of this process we will be dismissed 74approximately 50 bp employees for non-conformance with our code of conduct leaving three associations due to misalignment on climate policy. or unethical behaviour (2018 50)(2019 82a). This excludes dismissals of staff For more information on the review processcontractors and outcomes seevendors, and staff employed at our retail service stations. bp.com/tradeassociations. See bp.com/codeofconduct for more information. Tax and transparency Anti-bribery and corruption We are committed to complying with tax laws in a responsible manner We operate in parts of the world where bribery and corruption present and having open and constructive relationships with tax authorities. a high risk. We have a responsibility to our employees, our shareholders We paid $6.9 billion in income and production taxes to governments and to the countries and communities in which we do business to be in 2019 (2018 $7.5 billion). ethical and lawful in all our work. Our code of conduct explicitly prohibits engaging in bribery or corruption in any form. We disclose information on payments to governments for our upstream activities on a country-by-country and project basis under national Our group-wide anti-bribery and corruption policy and procedures reporting regulations such as those in effect in the UK. We also make include measures and guidance to assess risks, understand relevant payments to governments in connection with other parts of our laws and report concerns. They apply to all BP-operatedbp-operated businesses. Tax transparency We comply with tax laws in a responsible manner, pay and report our taxes on time and have open and constructive conversations with stakeholders, including governments and tax authorities. And we contribute to initiatives that simplify and improve tax regimes to encourage investment and sustainable growth and support the energy transition. We are committed to being transparent about our tax principles and the taxes we pay. We paid $3.3 billion in corporate income and production taxes to governments (2019 $6.9 billion). In 2020 we endorsed the B Team Responsible Tax Principles and we published Our tax report 2019. The report provides more detailed information on how we approach tax matters and the tax payments we make. New disclosures in our tax report include the total tax contribution for our global operations. This covers: all our business – such asactivities and details the transporting, trading, manufacturingtaxes we pay directly to governments on our own behalf, along with taxes we collect and pay to governments on behalf of others; financial and tax data from our OECD country-by-country report, summary activities of bp subsidiaries by country and details of bp companies located in countries considered to be low tax jurisdictions. bp is a founding member of the Extractive Industries Transparency Initiative (EITI), which supports the disclosure of payments made to and received by governments in relation to oil, gas and mining. Through EITI we work with governments, NGOs and international agencies to improve transparency. bp.com/tax We provide training to employees appropriate to the nature or location marketing of oil and gas. of their role. Around 11,0007,700 employees completed anti-bribery and corruption training in 2019 (2018 10,957)2020 (2019 ~11,000). We are a founding member of the Extractive Industries Transparency Initiative (EITI), which requires disclosure of payments made to and We assess any exposure to bribery and corruption risk when working received by governments in relation to oil, gas and mining activity. with suppliers and business partners. Where appropriate, we put in place a risk mitigation plan or we reject them if we conclude that risks Through EITI we work with governments, NGOs and international are too high. We also conduct anti-bribery compliance audits on agencies to improve transparency. For example, in 2019 we enacted selected suppliers when contracts are in place. For example,Many of our our global commitment through membership of the international board, upstream business conductsproduction & operations projects conduct supplier audits for a number of suppliers in including supporting decision making on the new global EITI standard, higher-risk regions to assess their conformance with our anti-bribery which represents a further evolution in transparency. The focus is on and corruption contractual requirements. We take corrective action making disclosure and open data a routine part of government and with suppliers and business partners that fail to meet our expectations, corporate reporting, providing information to stakeholders in a way which may include terminating contracts. In 20192020 we issued 2535 audit reports (2019 25). While our audit process was disrupted in 2020 due to the COVID-19 pandemic, we continued to engage suppliers and communicate our expectations for managing bribery and corruption risk on behalf of bp. For example, our customers & products business delivered a regional annual contractor forum digitally, to provide awareness of bribery and corruption risks. Political donations and activity We prohibit the use of bp funds or resources to support any political candidate or party. We recognize the rights of our employees to participate in the political process and these rights are governed by the applicable laws in the countries where we operate. The way in which we interact with those governments depends on the legal and regulatory framework in each country. Our stance on political activity is defined in our code of conduct. In the US we provide administrative support for the bp employee political action committee (PAC), which is a non-partisan committee that supportsencourages voluntary employee participation in the political process. All bp employee PAC contributions are reviewed for compliance with federal and state law and are publicly reported in accordance with US election laws. The PAC paused all contributions for six months beginning in January 2021. During this time the PAC will re-evaluate its widespread usecriteria for candidate support. Business ethics and accountability a 2019 figure differs from the 2019 figure (74) reported in analysis and decision making. It reports (2018 27). now requires contract transparency for new contracts from 2021, as well as new requirements on environmental reporting and gender. See bp.com/tax for our approach to tax and our payments to governments report. BPthe bp Annual Report and Form 20-F 2019 49
to reflect backdated dismissal decisions (concerns where dismissals were not known or recorded until after the 2019 report was published), heliport spot check dismissals and changes to dismissal decisions.
Upstream The Upstream segment is responsible for our activities in oil and natural gas exploration, field development and production. Business model Exploration Wells and Global operations projects organization The exploration function is The global wells organization The global operations responsible for renewing our and the global projects organization is responsible for resource base through access, organization are responsible for safe, reliable and compliant exploration and appraisal, while the safe, reliable and compliant operations, including upstream the reservoir development execution of wells (drilling and production assets and midstream function is responsible for the completions) and major projects. transportation and processing stewardship of our resource activities. portfolio over the life of each field. Performance in 2019 Upstream profitability 2 ($ billion) 58,000km 94.4% 9 new exploration access BP-operated upstream plant successful completion 4.9 2019 (2018 63,000km2) reliability of turnarounds 11.2 (2018 95.7%) (2018 7) 14.3 2018 14.6 5.2 5 5 2.6 2017 5.9 final investment decisions major project start ups million barrels of oil equivalent (2018 9) (2018 6) per day – hydrocarbon production 0.6 2016 (2018 2.5mmboe/d) –0.5 –0.9 2015 1.2 RC profit (loss) before interest and tax Underlying RC profit (loss) before interest and tax★ 50 BP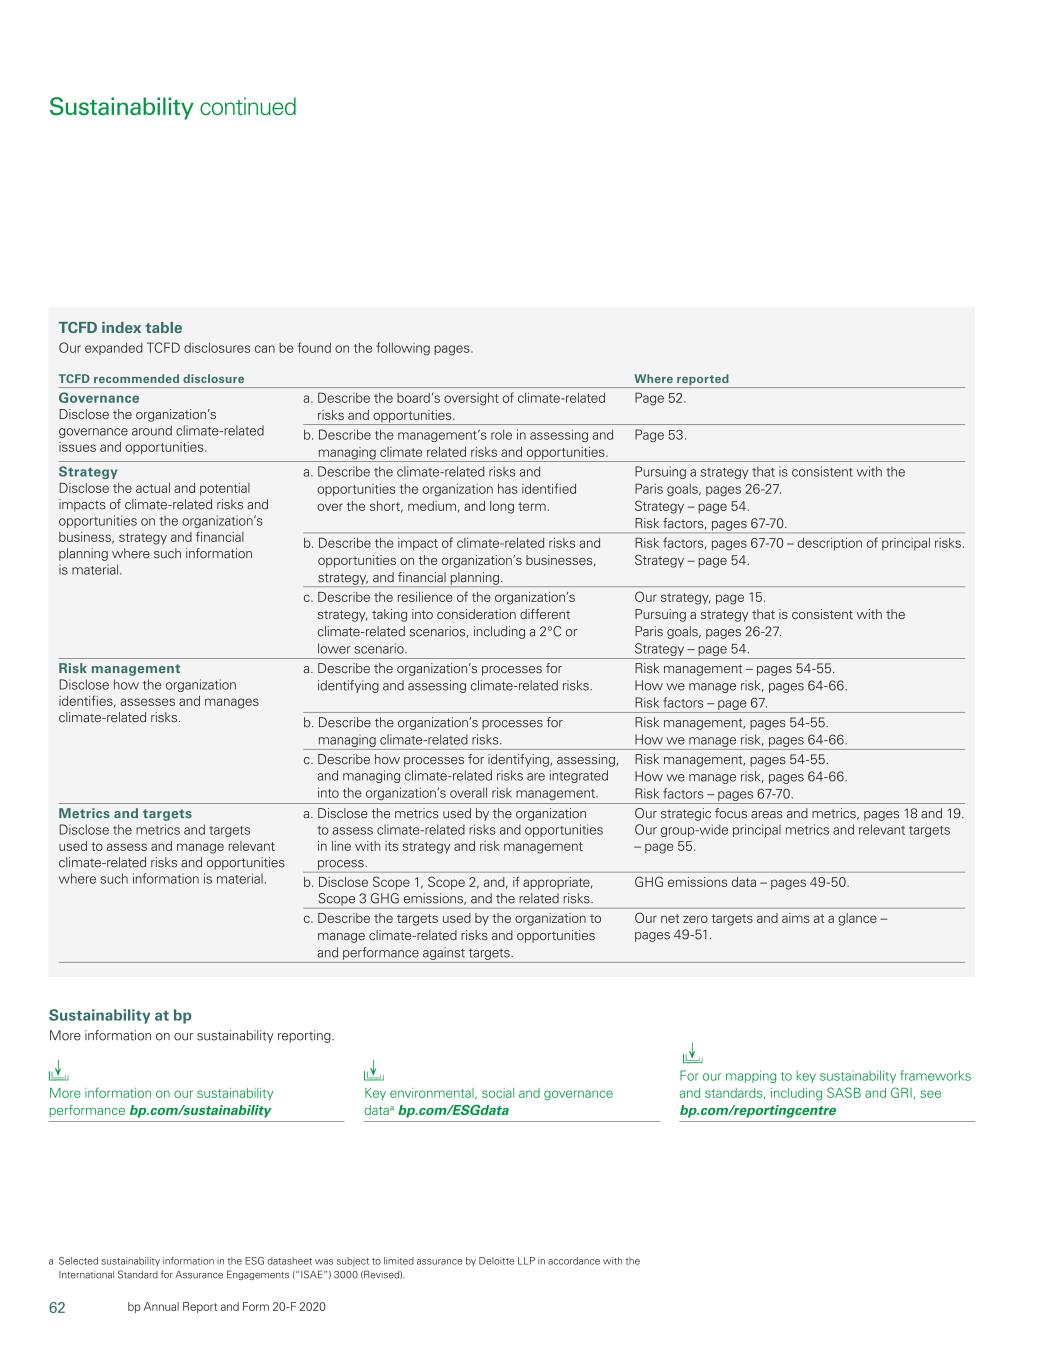
62 bp Annual Report and Form 20-F 2019

Strategic report2020 Sustainability continued TCFD index table Our expanded TCFD disclosures can be found on the following pages. TCFD recommended disclosure Where reported Governance Disclose the organization’s governance around climate-related issues and opportunities. a. Describe the board’s oversight of climate-related risks and opportunities. Page 52. b. Describe the management’s role in assessing and managing climate related risks and opportunities. Page 53. Strategy In 2016 weDisclose the actual and potential impacts of climate-related risks and opportunities on the organization’s business, strategy and financial planning where such information is material. a. Describe the climate-related risks and opportunities the organization has identified over the short, medium, and long term. Pursuing a future growth targetstrategy that is consistent with the Paris goals, pages 26-27. Strategy – page 54. Risk factors, pages 67-70. b. Describe the impact of 900,000 barrelsclimate-related risks and opportunities on the organization’s businesses, strategy, and financial planning. Risk factors, pages 67-70 – description of oil equivalent per dayprincipal risks. Strategy – page 54. c. Describe the resilience of production from new major projects by 2021 andthe organization’s strategy, taking into consideration different climate-related scenarios, including a 2°C or lower scenario. Our strategy, has three partspage 15. Pursuing a strategy that is consistent with the Paris goals, pages 26-27. Strategy – page 54. Risk management Disclose how the organization identifies, assesses and manages climate-related risks. a. Describe the organization’s processes for identifying and assessing climate-related risks. Risk management – pages 54-55. How we manage risk, pages 64-66. Risk factors – page 67. b. Describe the organization’s processes for managing climate-related risks. Risk management, pages 54-55. How we manage risk, pages 64-66. c. Describe how processes for identifying, assessing, and managing climate-related risks are integrated into the organization’s overall risk management. Risk management, pages 54-55. How we manage risk, pages 64-66. Risk factors – pages 67-70. Metrics and targets Disclose the metrics and targets used to assess and manage relevant climate-related risks and opportunities where such information is enabled by: we remain on track to deliver that, having started up 24 ofmaterial. a. Disclose the 35 major Quality execution projects needed to reach this targetmetrics used by the end of 2019. We wantorganization to be the best at what we do – everywhere we work. We see our scaleassess climate-related risks and long historyopportunities in many of the great basins in the This startsline with executing our activity safely. In every basin, we will world as a differentiator for BP and believe in the strength of our benchmark against the competition and aim to be the best – whether incumbent positions. We believe we are balanced and flexible – in it be operating facilities reliably and cost effectively, with a focus on terms of geography, hydrocarbon type and geology – and rather than emissions, drilling wells, managing our reservoirs, exploring, building being restricted by a traditional way of working, we have and will projects, or deploying technology. Through the quality of our execution, continue to use creative business models to generate value. scale and infrastructure, we aim to be competitive in every basin, and as a business, get more from a unit of capital than our peers. This describes ourits strategy and organizational model in 2019. Growing advantaged oilrisk management process. Our strategic focus areas and gas Following BP’s new ambitionmetrics, pages 18 and 19. Our group-wide principal metrics and relevant targets – page 55. b. Disclose Scope 1, Scope 2, and, if appropriate, Scope 3 GHG emissions, and the related risks. GHG emissions data – pages 49-50. c. Describe the targets used by the organization to manage climate-related risks and opportunities and performance against targets. Our net zero targets and aims set out in February 2020, We manage our portfolio through disciplined investment in the world’s we are transforming our business. We plan to provide more great oil and gas basins.at a glance – pages 49-51. More information on our future strategysustainability performance bp.com/sustainability Sustainability at bp More information on our sustainability reporting. Key environmental, social and near-term plans atgovernance dataa bp.com/ESGdata For our We intendmapping to make longer-term investments in natural gas askey sustainability frameworks and standards, including SASB and GRI, see bp.com/reportingcentre a lower capital markets day in September 2020. carbon fuel which can complement renewables and provide stable cash flows while contributing to the energy transition to a lower carbon future. We see our gas portfolio being complemented by oil assets that we consider to be advantagedSelected sustainability information in the energy transition; this is oil we can produce at a lower cost and higher margin, with faster payback Financial performance times and ready accessESG datasheet was subject to markets, and maintaining a rigorous focus $ million on carbon. 2019 2018 2017 Sales and other operating revenuesa 54,501 56,399 45,440 We aim to maintain a strong financial frame, allocating capital to build resilience to withstand uncertainty and changelimited assurance by Deloitte LLP in the external RC profit before interest and tax 4,917 14,328 5,221 environment. Ensuring sustainability of our business model and Net (favourable) adverse impact of products will be key to maintaining competitiveness. non-operating items and fair value accounting effects 6,241 222 644 Returns-led growth Underlying RC profit (loss) before We want to grow returns and value, and believe this will come from interest and tax 11,158 14,550 5,865 many sources – expanding and managing our margins, operational Organic capital expenditureb 11,904 12,027 13,763 efficiency, unit cost reduction, and capital efficiency with disciplined BP average realizationsc $ per barrel levels of capital reinvestment. Crude oild 61.56 67.81 51.71 Our major projects are selected and evaluated on a balanced set of Natural gas liquids 18.23 29.42 26.00 investment criteria, which allow for comparison and prioritization, and to Liquids 57.73 64.98 49.92 evaluate for consistency with Paris goals within an appropriate portfolio context. In the Upstream this evaluation includes confirming whether $ per thousand cubic feet we expect them to generate positive returns within a price and demand Natural gas 3.39 3.92 3.19 environment we consider to be consistent with those goals, with a bias US natural gas 1.93 2.43 2.36 towards shorter payback times and a comparisonaccordance with the operational $ per barrel of oil equivalent emissions profile of our wider Upstream portfolio. Total hydrocarbons 38.00 43.47 35.38 Underpinning our business model and strategy is our transformation $ per barrel of oil equivalent agenda. In 2019 we had more than 1,000 projects across the Upstream Average oil marker pricese $ per barrel aimed at sustainably improving both performance and ways of working Brent 64.21 71.31 54.19 in the Upstream. Since the inception of our transformation programme in 2016, projects are estimated to have delivered an additional West Texas Intermediate 57.03 65.20 50.79 $1.5 billion of cash flow to the business. Average natural gas marker prices $ per million British thermal units Average Henry Hub gas pricef 2.63 3.09 3.11 In addition to our core upstream exploration, development and production activities, the segment is responsibleInternational Standard for the midstream pence per therm transportation, storage and processing that support its operations. We Average UK National Balancing e also market and trade natural gas, including liquefied natural gas (LNG), Point gas price 34.70 60.38 44.95 power and natural gas liquids. In 2019 our activities took place in 34 a Includes sales to other segments. countries. b A reconciliation to GAAP information at the group level is provided on page 299. c Realizations are based on sales by consolidated subsidiaries only, which excludes BPX Energy, our onshore oil and gas business in the US Lower 48 equity-accounted entities. states, continues to operate as a separate, asset-focused, onshore d Includes condensate. business. Integration of the BHP assets acquired in 2018 has gone e All traded days average. well, with realized savings from synergies more than double our f Henry Hub First of Month Index. original target for 2019. We optimize and integrate the delivery of our activities across 12 regions, with support provided by global functions in specialist areas of expertise: technology, finance, procurement and supply chain, human resources, information technology and legal. BPAssurance Engagements (“ISAE”) 3000 (Revised).
63 Strategic report bp Annual Report and Form 20-F 2019 51

Market prices Financial results Brent remains an integral marker to2020 Our stakeholders Section 172 statement In accordance with the production portfolio, from which Sales and other operating revenues for 2019 decreased comparedrequirements of section 172 of the Companies Act 2006 (‘the Act’), the directors consider that, during the financial year ended 31 December 2020, they have acted in a significant proportionway that they consider, in good faith, would most likely promote the success of production is priced directly or indirectly. with 2018, primarily reflecting lower liquids and gas realizations partially offset by higher production and strong gas marketing and trading revenues. Brent ($/bbl) Replacement cost profit before interest and taxthe company for the segment 120120 included a net non-operating chargebenefit of $6,947 million. This primarily relates to impairments arising from disposal transactions. 90 See Financial statements – Note 5 for further information. Fair value accounting effects had a favourable impact of $706 million relative to 60 management’s view of performance. 30 The 2018 result included a net non-operating charge of $183 million, primarily related to impairment charges associated with a number of 0 0 assets, following changes in reserves estimates, the decision to Jan Feb Mar Apr May Jun Jul Aug Sep Oct Nov Dec dispose of certain assets and the decision to relinquish a number of 2019 2018 2017 Five-year range leases expiring in the near future, partially offset by reversals of prior year impairment charges. Fair value accounting effects had an adverse Dated Brent prices averaged $64.21 per barrel in 2019 – a 9% decrease impact of $39 million relative to management’s view of performance. from 2018 levels but almost 30% above the 2015-17 average. Prices After adjusting for non-operating items and fair value accounting fluctuated during the year reaching a peak of $71 in April on OPEC+ effects, the underlying replacement cost result before interest and tax supply restraints and the decline in Venezuelan and Iranian output. In was lower in 2019 compared with 2018. This primarily reflected lower the second half of the year, prices fluctuated between $59 in August liquids and gas realizations and higher depreciation, depletion and to $67 in December as OPEC+ restrained supply amid trade tensions. amortization partly offset by strong gas marketing and trading results Global consumption increased by 0.9 million barrels per day (mmb/d) to and higher production. 100.1mmb/d for the year (0.9%) – a slowdown from growth rates seen in the prior two years as trade tensions slowed global macroeconomic Organic capital expenditure was $11.9 billion (2018 $12.0 billion). growth. Global oil production remained flat at 100.5mmb/d, with growth In total, disposal transactions generated $2 billion in proceeds in 2019, from non-OPEC countries offsetting supply restraint and disruptions with a corresponding reduction in net proved reserves of 134mmboe in OPEC countries. The fall in output in Venezuela and Iran due to within our subsidiaries. The major disposal transaction during 2019 was sanctions significantly contributed to the 1.9mmb/d decline in the disposal of our interests in Gulf of Suez oil concessions in Egypt. OPEC output in 2019. At year end, a number of balances associated with assets awaiting the completion of announced disposals were held within the Assets Henry Hub ($/mmBtu) held for sale category in the balance sheet. These related to assets in Alaska and US Lower 48. Impairment charges totalling $6.0 billion were 9 9 recognized in connection with these planned disposals. See Financial statements – Notes 2 and 4 for further information. 6 More information on disposals is provided in Upstream analysis by region on page 303. 3 Outlook for 2020 At the current time the global spread of the coronavirus (COVID-19) 0 0 is causing considerable uncertainty in the market, lowering demand Jan Feb Mar Apr May Jun Jul Aug Sep Oct Nov Dec forecasts. This, and the changing dynamic among OPEC+its members has put downward pressure on prices. Aside from these factors, 2019 2018 2017 Five-year range we had expected price volatility in the near term. Taking these factors into account, we expect the outlook for the year as a whole, Henry Hub prices decreasedhaving regard to $2.63/mmBtuthe likely consequences of any decision in the long term and the broader interests of other stakeholders, as required by the Act. See table on pages 82-83 for more information in support of this statement, including a description of the board’s activities during 2020. Employees Monitoring employee sentiment We use our ‘Pulse’ survey and weekly ‘Pulse Live’ surveys to gather feedback from employees, including their perceptions of work demands and leadership support. The employee engagement score is a key performance indicator for bp, see page 41. Investors Developing our new strategy, financial frame and investor proposition Our decision to introduce a new strategy, financial frame and investor proposition, including a new distribution policy, benefited from extensive dialogue with our major shareholders. ESG engagement We engage frequently with our investors on environmental, social and governance (ESG) issues. This includes one-to-one conversations, participation at external events and group meetings, including with Climate Action 100+ representatives. bp week In response to feedback from investors and others, CEO Bernard Looney and his leadership team offered further insight into bp’s new strategy and sustainability frame during bp week – three consecutive virtual capital markets days held in September 2020. Keeping connected through webcasts CEO Bernard Looney hosted regular ‘Keeping Connected’ webcasts to discuss important topics with members of the leadership team and subject matter experts such as our partner Equinor’s EVP, New Energy Solutions, and our vice president health and wellbeing, Dr Richard Heron. The sessions included a live Q&A section where employees could ask questions, anonymously if desired, of the CEO and webcast guests. See page 86 for more on how the board and senior management team engaged with stakeholders throughout the year. Society Our biodiversity position We developed our updated position with input and constructive challenge from international nature and conservation organizations and experts including Conservation International, Fauna & Flora International (FFI), UNESCO and IUCN. The position sets out new measures to help restore, maintain and enhance nature. In September we announced a five-year collaboration with FFI to help support the delivery of our new position, including our aim to achieve a net positive impact. Our human rights policy We updated our business and human rights policy in 2020 to address emerging human rights issues relevant to our industry, clarify our human rights commitments and communicate how bp’s approach to managing human rights impacts has advanced. The update was supported by consultations with a wide range of NGOs, subject matter experts and investors. Responding to feedback When our ‘Pulse Live’ and Employee Assistance platforms showed increased anxiety in employees, our CEO Bernard Looney led a series of live webcasts, including one focused on reducing mental health stigma and encouraging employees to ask for help. We also increased the frequency of mental health awareness training for managers. Examples of engagement with other stakeholder groups Customers Collaboration with original equipment manufacturers such as Ford, Renault, JLR and Volvo on future technologies. Global customer brand tracking. Government and regulators Publication of Our tax report 2019 from– see bp.com/tax. Government lobbying – we actively advocated for regional carbon pricing schemes in the US, provided input to remain challenging. $3.09/mmBtuthe EU methane strategy and supported the UK government’s planned phase out of internal combustion engines. Partners and suppliers Supplier workshops, including sessions focused on net zero, people and planet. University collaborations, including the Carbon Mitigation Initiative (CMI), an independent academic research programme based at Princeton University. Throughout bp we engage with a wide variety of stakeholders on a regular basis. This engagement informs our thinking and decision making. Some examples of our engagement in 2018 as US associated gas production continued to grow strongly while US gas consumption growth slowed down. The UK National Balancing Point hub price was almost halved from 60.38 pence per therm in 2018, down to 34.70 in 2019, due to a significant increase in European LNG imports and record high storage levels. Asian spot prices declined from $9.76/mmBtu in 2018, down to $5.49/mmBtu on the back of global LNG oversupply, declining LNG demand in Japan and Korea and a slow-down of Chinese LNG imports. 52 BP2020 are set out below. How we engage with our stakeholders
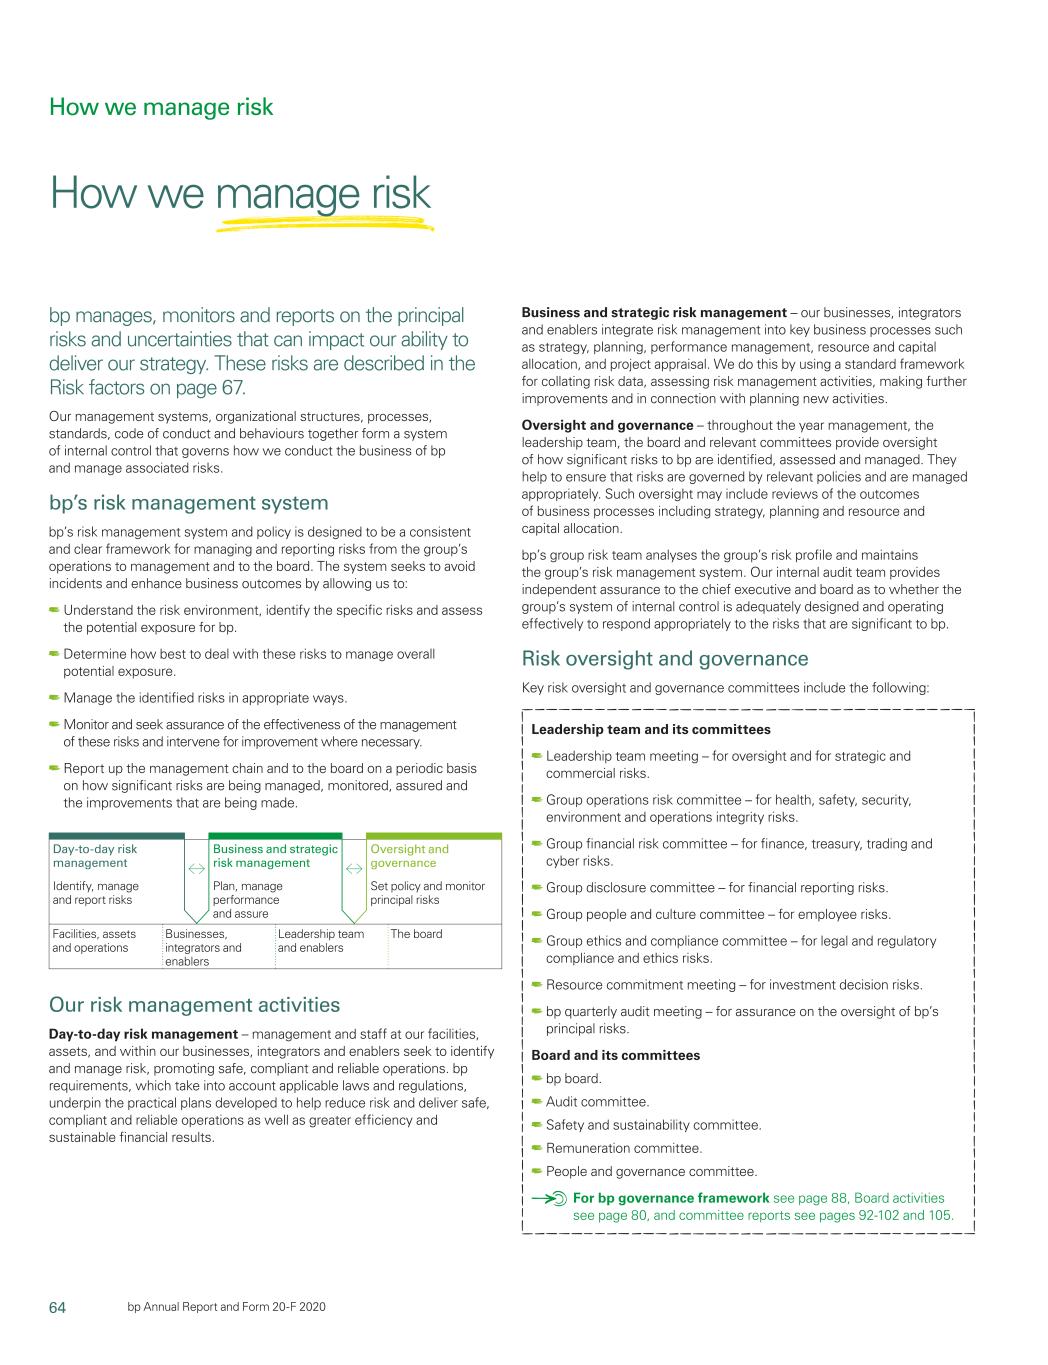
64 bp Annual Report and Form 20-F 2019

Strategic report Exploration Proved reserves replacement ratio The group explores for oil and natural gas under a wide range of The proved reserves replacement ratio for the segment in 2019 was licensing, joint arrangement and other contractual agreements. 41% for subsidiaries and equity-accounted entities (2018 69%), 25% We may do this alone or, more frequently, with partners. for subsidiaries alone (2018 66%) and 210% for equity-accounted entities alone (2018 106%). For more information on proved reserves Our exploration and new access teams work to find advantaged barrels replacement for the group see page 308. to build our hopper of options for potential future development. That hopper of options gives us the flexibility to grow the cash and value Upstream proved reserves in the Upstream business while increasing the average quality of (mmboe) the portfolio. Liquids In line with our strategy, we are spending less on exploration and we 4,902 Subsidiaries plan to spend a significant part of our exploration budget on lower-risk, 831 Equity-accounted entities shorter-cycle-time opportunities around our incumbent positions. Gas 4,473 Subsidiaries New access in 2019 854 Equity-accounted entities We gained access to new acreage covering around 58,000km2 in nine countries – Argentina, Australia, Brazil, the Gambia, India, Oman, Peru, the UK North Sea and the US Gulf of Mexico. Estimated net proved reservesa (net of royalties) Exploration success 2019 2018 2017 We participated in 10 potentially commercial discoveries in 2019 – King Liquids million barrels Embayment in the US Gulf of Mexico, Bele-1, Tuk-1, Hi-Hat-1, Boom-1 b and Ginger in Trinidad, Nour North Sinai in Egypt, GTA-1 and Yakaar-2 in Crude oil Senegal and Orca-1 in Mauritania. Subsidiaries 4,367 4,378 4,129 Equity-accounted entitiesc 810 794 674 Exploration and appraisal costs 5,177 5,172 4,803 Total exploration and appraisal costs were $1,587 million (2018 $1,478 Natural gas liquids million), of which $302 million (2018 $180 million) related to lease Subsidiaries 535 576 318 acquisition. Equity-accounted entitiesc 21 15 18 These costs included exploration and appraisal activities, which 556 590 336 were capitalized within intangible fixed assets, and geological and Total liquids geophysical exploration costs, which were charged to income Subsidiariesd 4,902 4,954 4,447 as incurred. Equity-accounted entitiesc 831 808 692 Approximately 6% of exploration and appraisal costs were directed 5,733 5,762 5,139 towards appraisal activity. We participated in 47 gross (21.15 net) Natural gas billion cubic feet exploration and appraisal wells in 11 countries. Of these, 11 were lower Subsidiariese 25,946 30,355 29,263 risk wells around incumbent positions. Equity-accounted entitiesc 4,951 4,559 2,274 Exploration expense 30,897 34,914 31,537 Total hydrocarbons million barrels of oil equivalent Total exploration expense of $964 million (2018 $1,445 million, Subsidiariese 9,375 10,188 9,492 2017 $2,080 million) comprised the write-off of expenses related to Equity-accounted entitiesc 1,685 1,594 1,085 unsuccessful drilling activities, lease expiration or uncertainties around development, as well as geological and geophysical exploration costs 11,060 11,782 10,577 (see Financial statements – Note 8). a Because of rounding, some totals may not agree exactly with the sum of their component parts. Reserves booking b Includes condensate and bitumen. c BP’s share of reserves of equity-accounted entities in the Upstream segment. During 2019 Reserves bookings from new discoveries will depend on the results upstream operations in Argentina, Bolivia, Mexico, Russia and Norway as well as some of of ongoing technical and commercial evaluations, including appraisal our operations in Angola were conducted through equity-accounted entities. d Includes 11 million barrels (12 million barrels at 31 December 2018 and 14 million barrels drilling. The segment’s total hydrocarbon reserves on an oil-equivalent at 31 December 2017) in respect of the 30% non-controlling interest in BP Trinidad & basis, including the segment’s equity-accounted entities at Tobago LLC. 31 December 2019, decreased by 6% (a decrease of 8% for e Includes 1,330 billion cubic feet of natural gas (1,573 billion cubic feet at 31 December 2018 subsidiaries and an increase of 6% for equity-accounted entities) and 1,860 billion cubic feet at 31 December 2017) in respect of the 30% non-controlling interest in BP Trinidad & Tobago LLC. compared with proved reserves at 31 December 2018. BP Annual Report and Form 20-F 2019 53

Developments We achieved five major project start-ups in 2019 – in the US Gulf of Mexico, Egypt, Trinidad and the UK North Sea. The Raven project in Egypt is now expected to come onstream at the end of 2020. In addition to these, we continued to progress all 11 of the remaining projects that we expect will deliver our future production growth target announced in 2016. Highlights from a selection of these are: • India – Work on the KG D6 series of projects continued and the first of the three projects is expected to begin production in 2020. • Mauritania and Senegal – In Phase 1 of the Greater Tortue Ahmeyim project, the first deepwater cross-border LNG project is underway following sanction in early 2019 with a ramp up in engineering, procurement and fabrication activity. • UK North Sea – At Vorlich, two wells were drilled during the year and production is expected to start in 2020. Subsidiaries’ development expenditure incurred, excluding midstream activities, was $10.8 billion (2018 $9.9 billion, 2017 $10.7 billion). Angelin, Trinidad & Tobago Operator: BP Includes a new platform and four Partners: BP (70%) and Repsol (30%) wells, with gas flowing to the Project type: LNG Serrette platform hub via a new Major project start-ups in 2019 13‑mile pipeline. Giza and Fayoum, Egypt Constellation, US Gulf of Mexico Includes a deepwater, long-distance Discovered in 2016, the field has tieback to an existing onshore plant been developed as a subsea tieback and eight wells. to Anadarko’s Constitution spar. Operator: BP Operator: Anadarko Partners: BP (82.75%), DEA Deutsche Partners: Anadarko (33.33%), Erdoel AG (17.25%) BP (66.67%) Project type: Conventional gas Project type: Deepwater oil Culzean, UK North Sea Includes a standalone three-bridge- linked platform development with six production wells. Operator: Total Partners: Total (50%), BP (32%), JX Nippon (18%) Project type: High-pressure gas Alligin, UK North Sea Operator: BP Includes two wells, tied-back into Partners: BP (50%) and Shell (50%) the existing Schiehallion and Loyal Project type: Conventional Oil subsea infrastructure. 54 BP Annual Report and Form 20-F 2019

Strategic report Production Gas and power marketing Our offshore and onshore oil and natural gas production assets include and trading activities wells, gathering centres, in-field flow lines, processing facilities, storage facilities, offshore platforms, export systems (e.g. transit lines), Our integrated supply and trading function markets and trades our own pipelines and LNG plant facilities. These include production from and third-party natural gas (including LNG), biogas, power and NGLs. conventional and unconventional assets. This provides us with routes into liquid markets for the gas we produce and generates margins and fees from selling physical products and Our principal areas of production are Angola, Argentina, Australia, derivatives to third parties as well as asset optimization and trading. Azerbaijan, Egypt, Oman, Trinidad, the UAE, the UK and the US. With This means we have a single interface with gas trading markets and BP-operated plant reliability increasing from around 86% in 2011 to 94% a single set of trading compliance and risk management processes, in 2019, efficient delivery of turnarounds and strong infill drilling systems and controls. We are continuing to expand our LNG portfolio, performance, we have maintained base decline to 3-5% on average which includes global partnerships with utility companies, gas over the last five years. Our long-term expectation for managed base distributors and national oil and gas companies. decline remains at 3-5% per guidance we have previously given. This activity primarily takes place in North America, Europe and Asia, a Production (net of royalties) and supports group LNG activities, managing market price risk and 2019 2018 2017 creating incremental trading opportunities through the use of commodity derivative contracts. It also enhances margins and Liquids thousand barrels per day generates fee income from sources such as the management of b Crude oil price risk on behalf of third-party customers. Subsidiaries 1,046 1,051 1,064 Our trading financial risk governance framework is described in Equity-accounted entitiesc 127 121 199 Financial statements – Note 29 and the range of contracts used is 1,173 1,172 1,263 described in Glossary – commodity trading contracts on page 337. Natural gas liquids Subsidiaries 104 88 85 Equity-accounted entitiesc 10 8 8 114 96 93 Total liquids Subsidiaries 1,150 1,139 1,149 Equity-accounted entitiesc 138 129 207 1,288 1,268 1,356 Natural gas million cubic feet per day Subsidiaries 7,366 6,900 5,889 Equity-accounted entitiesc 457 474 547 7,823 7,374 6,436 Total hydrocarbons thousand barrels of oil equivalent per day Subsidiaries 2,420 2,328 2,164 Equity-accounted entitiesc 216 211 302 2,637 2,539 2,466 a Because of rounding, some totals may not agree exactly with the sum of their component parts. b Includes condensate and bitumen. c Includes BP’s share of the production of equity-accounted entities in the Upstream segment. Our total hydrocarbon production for the segment in 2019 was 3.8% higher compared with 2018. The increase comprised a 3.9% increase (1.0% for liquids and 6.8% for gas) for subsidiaries and a 2.5% increase (6.4% increase for liquids and 3.6% decrease for gas) for equity- accounted entities compared with 2018. For more information on production, see Oil and gas disclosures for the group on page 308. Underlying production was broadly flat compared to 2018. The group and its equity-accounted entities have numerous long-term sales commitments in their various business activities, all of which are expected to be sourced from supplies available to the group that are not subject to priorities, curtailments or other restrictions. No single contract or group of related contracts is material to the group. BP Annual Report and Form 20-F 2019 55

Downstream The Downstream segment has global marketing and manufacturing operations. It is the product and service-led arm of BP and is made up of three businesses. Business model Fuels Lubricants Petrochemicals Includes refineries, logistic Manufactures and markets Manufactures and markets networks and fuels marketing lubricants and related products products that are produced businesses, which together with and services to the automotive, using industry-leading proprietary global oil supply and trading industrial, marine and energy BP technology, and are then used activities make up our integrated markets globally. We add value by others to make consumer fuels value chains (FVCs). We sell through brand, technology and products such as food packaging, refined petroleum products relationships, such as collaboration textiles and building materials. including gasoline, diesel and with original equipment Through our new BP Infinia aviation fuel, and have a significant manufacturing partners. technology, we are working to Downstream profitability presence in the convenience retail reduce plastic waste, helping ($ billion) sector. We also have a growing to enable a stronger circular presence in electric vehicle economy. 6.5 charging with a focused strategy to 2019 6.4 build the fastest, most convenient networks for our customers. 6.9 2018 7.6 Performance in 2019 7.2 2017 7.0 $2.7bn ~1,600 49% 5.2 2016 fuels marketing earnings convenience of lubricant sales 5.6 +2.5% vs 2018 partnership sites were premium grade 7.1 (2018 $2.6bn) (2018 ~1,400) (2018 46%) 2015 7.5 RC profit before interest and tax 94.9% 1.7 12.1 Underlying RC profit before interest and tax★ refining availability million barrels of oil million tonnes of (2018 95.0%) refined per day petrochemicals produced (2018 1.7mmb/d) (2018 11.9mmte) Strategy We aim to run safe and reliable Safe and reliable operations potential, making the businesses This describes our strategy and operations across all our This remains our core value and more resilient to margin volatility. organizational model in 2019. businesses, supported by leading first priority and we continue to Simplification and efficiency Following BP’s new ambition brands and technologies, to drive improvements in personal This remains central to what and aims set out in February deliver high-quality products and and process safety performance. we do to support performance 2020 we are transforming our services that meet our customers’ Profitable marketing growth improvement and make our business. We plan to provide needs. Our strategy is to deliver We invest in higher-returning businesses even more underlying earnings growth and more information on our future fuels marketing and lubricants competitive. build resilient, competitively strategy and near-term plans businesses with growth potential advantaged businesses, and we Transition to a lower carbon at our capital markets day in and reliable cash flows. are working at pace to create low September 2020. and digitally enabled future carbon businesses that can Advantaged manufacturing We are delivering and developing advance the energy transition. We aim to have a competitively new products, offers and business advantaged refining and models that support the transition The execution of our strategy in petrochemicals portfolio to a lower carbon and digitally 2019 has continued to deliver, underpinned by operational enabled future. with underlying replacement cost excellence and to grow earnings profit of $6.4 billion in the year. 56 BP Annual Report and Form 20-F 2019

Strategic report Financial performance $ million 2019 2018 2017 Sale of crude oil through spot 59,738 62,484 47,702 and term contracts Marketing, spot and term sales 180,236 195,020 159,475 of refined products Other sales and operating revenues 10,923 13,185 12,676 Sales and operating revenuesa 250,897 270,689 219,853 RC profit before interest and taxb Fuels 4,791 5,261 4,679 Lubricants 1,315 1,065 1,457 Petrochemicals 396 614 1,085 Energy with purpose 6,502 6,940 7,221 Net (favourable) adverse impact of non-operating items and fair value Making more plastics recyclable accounting effects Fuels (32) 381 193 Thinking beyond business as usual, Companies joining the consortium: we’re using our know-how to explore • Packaging and recycling specialist Lubricants (57) 227 22 a breakthrough technology for ALPLA. Petrochemicals 6 13 (469) recycling opaque and difficult-to- • Food, drink and consumer goods (83) 621 (254) recycle PET plastic waste – familiar producers Britvic, Danone and to consumers as coloured bottles and Unilever. Underlying RC profit before b food trays. Our enhanced recycling • Waste management and recycling interest and tax technology, BP Infinia, enables specialist REMONDIS. Fuels 4,759 5,642 4,872 PET to be diverted from landfill or Lubricants 1,258 1,292 1,479 incineration and transformed into Petrochemicals 402 627 616 virgin-quality feedstocks. 6,419 7,561 6,967 We plan to build a $25 million Organic capital expenditurec 2,997 2,781 2,399 pilot plant in the US to prove the technology, which is expected to be operational in late 2020. And a Includes sales to other segments. we’ve now joined forces with b Income from petrochemicals produced at our Gelsenkirchen and Mülheim sites in Germany leading businesses across the is reported in the fuels business. Segment-level overhead expenses are included in the fuels business result. PET packaging value chain to help c A reconciliation to GAAP information at the group level is provided on page 299. accelerate commercialization of the technology. Financial results We believe BP Infinia has the potential to be a game-changer and important Sales and other operating revenues in 2019 were lower than in 2018, stepping stone in enabling a stronger mainly due to lower crude and product prices. circular economy and helping to reduce Replacement cost (RC) profit before interest and tax for 2019 included unmanaged plastic waste. a net non-operating charge of $77 million, which includes environmental provisions. The 2018 result included a net non-operating charge of $716 million, primarily reflecting restructuring costs. In addition, fair value accounting effects had a favourable impact of $160 million, compared with a favourable impact of $95 million in 2018. After adjusting for non-operating items and fair value accounting effects, underlying RC profit before interest and tax in 2019 was $6,419 million. Outlook for 2020 The coronavirus (COVID-19) has already had significant impact on margins and activity at the start of the year. We expect this uncertainty to continue and anticipate lower industry refining margins during 2020. We also anticipate wider North American heavy crude oil discounts and a lower level of turnaround activity than in 2019. BP Annual Report and Form 20-F 2019 57

Our fuels business BP refining marker margin ($/bbl) Our fuels strategy focuses primarily on fuels value chains (FVCs). This includes an advantaged refining portfolio through operating reliability 32 and efficiency, location advantage and feedstock flexibility, as well as 24 commercial optimization opportunities. We believe that having a quality refining portfolio connected to strong marketing positions is core to our 16 integrated FVC businesses as this provides optimization opportunities in highly competitive markets. 8 Our fuels marketing business comprises retail, business-to-business 0 and aviation fuels. It is a material part of Downstream with a strong Jan Feb Mar Apr May Jun Jul Aug Sep Oct Nov Dec track record of growth. We have an advantaged portfolio of assets 2019 2018 2017 Five-year range with good growth potential, attractive returns and reliable cash flows. We continue to grow our fuels marketing business through our differentiated marketing offers and strategic convenience partnerships. Refining We also partner with leading retailers, creating distinctive retail At 31 December 2019 we owned or had a share in 10 refineriesab offers that aim to deliver good returns and reliable profit growth producing refined petroleum products that we supply to retail and and cash generation. commercial customers. For a summary of our interests in refineries We have also grown our presence in electric vehicle charging in recent and average daily crude distillation capacities see page 307. years, with a focus on the key markets of China, UK and Germany, Underlying growth in our refining business is underpinned by our where we aim to build the fastest, most convenient networks for multi-year business improvement plans, which comprise globally electric vehicle customers. consistent programmes focused on operating reliability and efficiency, Underlying RC profit before interest and tax for our fuels business advantaged feedstocks and commercial optimization. Operating was lower compared with 2018, with strong refining operational reliability is a core foundation of our refining business and in 2019 performance, which led to a second consecutive year of record refining operations remained strong, with refining availability at BP-operated throughput and higher commercial optimization, despite high levels refineries of 94.9% (2018 95%) and refinery utilization rates across of turnaround activity. This was more than offset, however, by lower our refining portfolio at 91% (2018 91%). As a result, we achieved refining margins, including significantly narrower heavy crude oil record levels of refining throughput for a second consecutive year, discounts, which together represented one of the weakest refining despite high levels of turnaround activity. environments across our portfolio in the last 10 years. In fuels marketing Our refinery portfolio – along with our supply capability – enables us to we saw volumes and margins grow year on year, offset by adverse process advantaged crudes. For example, in the US, our three refineries foreign exchange effects. The full year result also reflects a higher all have location-advantaged access to Canadian crudes which are contribution from supply and trading. typically cheaper than other crudes. Our commercial optimization programme aims to maximize value from our refineries by capturing Refining marker margin opportunities in every step of the value chain, from crude selection We track the refining margin environment using a global refining through to yield optimization and utilization improvements. marker margin (RMM). Refining margins are a measure of the difference During 2019 we also continued to scale up co-processing at our between the price a refinery pays for its inputs (crude oil) and the refineries, growing the volume of lower carbon bio-feedstock market price of its products. Although refineries produce a variety of processed. petroleum products, we track the margin environment using a simplified indicator that reflects the margins achieved on gasoline and diesel only. The refining result was lower in 2019 compared with 2018, with strong The RMM may not be representative of the margin achieved by BP in operational performance and higher commercial optimization, which any period because of BP’s particular refinery configurations and crude was more than offset by a significantly weaker refining environment, and product slates. In addition, the RMM does not include estimates of primarily driven by narrower heavy crude oil discounts. energy or other variable costs. thousand barrels per day $ per barrel 2019 2018 2017 Region Crude marker 2019 2018 2017 Refinery throughputsac US North West Alaska 17.6 16.2 18.8 US 737 703 713 North Slope Europe 787 781 773 US Mid West West Texas 16.0 16.0 16.9 Rest of the world 225 241 216 Intermediate Total 1,749 1,725 1,702 Northwest Brent 11.1 11.1 11.7 % Europe Refining availability 94.9 95.0 95.2 Mediterranean Azeri Light 9.1 9.8 10.4 Australia Brent 11.1 11.5 12.9 a This does not include BP’s interest in Pan American Energy Group. BP RMM 13.2 13.1 14.1 b On 31 December we completed the sale of our interest in the German Bayernoil refinery. c Refinery throughputs reflect crude oil and other feedstock volumes. The global RMM averaged $13.2/bbl in 2019, similar to the level in 2018 ($13.1/bbl), with weaker demand balanced by reduced supply due to an increased level of refinery maintenance over the year. In addition refining margins across our portfolio were significantly impacted by other crude and product differentials outside of the global RMM, primarily due to narrower heavy crude oil discounts. 58 BP Annual Report and Form 20-F 2019

Strategic report Fuels marketing and logistics US, while expanding into major growth markets that offer long-term competitive advantages, such as Asia, Africa and Latin America. Across our fuels marketing businesses, we operate an advantaged infrastructure and logistics network that includes pipelines, storage In 2019 we continued to develop new offers and solutions to advance terminals and tankers for road and rail. We seek to drive excellence the energy transition and to meet the changing needs of our customers. in operational and transactional processes and deliver compelling Through our collaboration with Neste, a leading producer of renewable customer offers in the various markets where we operate. Through products, we began supplying aviation fuel made from sustainable materials our retail business, we supply fuel and convenience retail services to to a number of airports in Sweden. We also expanded our partnership with consumers through company-owned and franchised retail sites, as China National Aviation Fuel Group, signing a joint venture agreement to well as other channels, including dealers and jobbers. We also supply operate a general aviation fuel and services business in southwest China. commercial customers in the transport and industrial sectors. The joint venture intends to support the growth and development of China’s general aviation sector. Retail is the most material part of our fuels marketing business and a significant source of earnings growth through our strong market Oil supply and trading positions, brands and distinctive customer offers. This is underpinned by the strength of our retail convenience partnerships, technology such Our integrated supply and trading function is responsible for delivering as our advanced fuels and use of digital technology, as well as our value across our crude and oil products supply chain. This enables our customer relationships. This differentiation enables our growth in downstream businesses to maintain a single interface with oil trading existing markets and supports our growth plans in new material markets and operate with a single set of trading compliance and risk markets such as Mexico, India, Indonesia and China. management processes, systems and controls. It principally achieves this objective in two ways: During 2019 we continued to expand our convenience partnership model, which is now in around 1,600 sites across our network, First, it seeks to identify the best markets and prices for our crude oil, including our differentiated REWE to Go® offer, now in around 550 sites source optimal raw materials for our refineries and provide competitive across Germany. supply for our marketing businesses. We will often sell our own crude and purchase alternative crudes from third parties for our refineries We also made significant progress towards our growth ambition in new where this will generate incremental margin. markets, most notably in Mexico where we now have more than 520 BP-branded retail sites, with volumes more than doubling in 2019, and Second, it aims to create and capture trading opportunities by entering in December we signed an agreement with Reliance Industries Limited into a full range of exchange-traded commodity derivatives and to form a fuels retail and aviation joint venture across India, providing over-the-counter spot and term contracts. In combination with its rights to access to one of the world’s largest and fastest growing fuels markets. access storage and transportation capacity, it also seeks to access advantageous price differences between locations, time periods, and We have a clear strategy and focused activity set for the transition to a markets. lower carbon and digitally enabled future. We are actively implementing and developing new offers and business models centred around digital The function has trading offices in Europe, North America and Asia. Our and advanced mobility trends. presence in the more actively traded regions of the global oil markets supports the overall understanding of the supply and demand forces In 2019 we signed an agreement with DiDi, the world’s leading mobile across these markets. transportation platform, to build an electric vehicle charging network in China, the world’s largest market for electric vehicles. In addition, in the Our trading financial risk governance framework is described in UK, BP Chargemaster began installing 150kW ultra-fast electric vehicle Financial statements – Note 29 and the range of contracts used is chargers at our BP retail sites, with plans to build a national network of described in Glossary – commodity trading contracts on page 337. high-power charging – one which will closely replicate the current thousand barrels per day fuelling experience. These advances support BP’s strategy to create the Sales volume 2019 2018 2017 fastest and most convenient electrification networks in these markets. Marketing salesa 2,727 2,736 2,799 BPme is our global customer engagement platform, which is also fast Trading/supply salesb 3,268 3,194 3,149 becoming the portal to a suite of offers and services that will transform Total refined product sales 5,995 5,930 5,948 our retail offer and deliver an enhanced and personalized customer Crude oilc 2,713 2,624 2,616 experience. The platform provides an easy, fast and convenient way for Total 8,708 8,554 8,564 customers to pay for fuel from their car, and for customers in the UK, Australia and the US, it also incorporates our new loyalty programme a Marketing sales include branded and unbranded sales of refined fuel products and lubricants BPme Rewards. to business-to-business and business-to-consumer customers, including service station dealers, jobbers, airlines, small and large resellers such as hypermarkets, and the military. Fuels marketing earnings in 2019 were similar to 2018, with volume b Trading/supply sales are fuel sales to large unbranded resellers and other oil companies. and margin growth offset by adverse foreign exchange effects. c Crude oil sales relate to transactions executed by our integrated supply and trading function, primarily for optimizing crude oil supplies to our refineries and in other trading. 2019 includes Aviation 118 thousand barrels per day relating to revenues reported by the Upstream segment. Our Air BP business is one of the world’s largest suppliers of aviation fuels Number of BP-branded retail sites and services, selling fuel to commercial airlines, the military and general Retail sitesd 2019 2018 2017 aviation customers. Air BP supplies around 6.6 billion gallons of aviation US 7,200 7,200 7,200 fuel a year at over 800 locations in more than 55 countries. Air BP’s Europe 8,200 8,200 8,100 services include the design, build and operation of fuelling facilities, technical consultancy and training, supporting customers to meet their Rest of world 3,500 3,300 3,000 lower carbon goals and digital fuelling solutions to increase efficiency and Total 18,900 18,700 18,300 reduce risk. Our Air BP business is differentiated through its strong market positions, brand strength, partnerships, technology and customer d Reported to the nearest 100. Includes sites not operated by BP but instead operated by dealers, relationships. Our strategy is to maintain a strong presence in our core jobbers, franchisees or brand licensees under a BP brand. These may move to or from the BP brand as their fuel supply or brand licence agreements expire and are renegotiated in the normal geographies of Australia, New Zealand, Europe, the Middle East and the course of business. Retail sites are primarily branded BP, ARCO, Amoco and Aral. BP Annual Report and Form 20-F 2019 59

Our lubricants business Our petrochemicals business We manufacture and market lubricants and related products and Our petrochemicals business manufactures and markets three main services to the automotive, industrial, marine and energy markets product lines: purified terephthalic acid (PTA), paraxylene (PX) and across the world. Our key brands are Castrol, BP and Aral. Castrol is a acetic acid. These have a large range of uses including polyester fibre, recognized brand worldwide that we believe provides us with significant food packaging and building materials. We also produce a number of competitive advantage. We are one of the largest purchasers of base other specialty petrochemicals products. In addition, we manufacture oil in the market but have chosen not to produce it or manufacture olefins and derivatives at Gelsenkirchen and solvents at Mülheim in additives at scale. Our participation choices in the value chain are Germany, the income from which is reported in our fuels business. focused on areas where we can leverage competitive differentiation and strength. Along with the assets we own and operate, we have also invested in a number of joint arrangements in Asia, where our partners are leading Our strategy is to focus on our premium lubricants and growth companies in their domestic market. markets while leveraging our strong brands, technology and customer relationships – all of which are sources of differentiation for our Our strategy is to grow our underlying earnings and ensure the business business. With 65% of profit generated from growth markets and is resilient to margin volatility, positioning ourselves to capture growth 49% of our sales from premium grade lubricants, we have a strong and investment opportunities in an attractive and growing market. base for further expansion and sustained profit growth. We do this through the execution of our business improvement In 2019 we strengthened our strategic relationship with Groupe programmes which include operational efficiency, deploying our Renault, extending the Renault Sport Racing Formula 1 sponsorship industry-leading proprietary technology, commercial optimization and through to the end of 2024 and taking over as global service fill engine competitive feedstock sourcing. We have also grown our third-party oil lubricants partner. We also announced a partnership with Bosch to technology licensing income to create additional value. run jointly branded workshops in China and the US. We aim to create material, industry leading business models in We have a robust pipeline of technology development through which sustainable chemicals and plastics circularity and in 2019 we announced we seek to respond to engine developments and evolving consumer the development of BP Infinia, an enhanced recycling technology, needs and preferences, including lower carbon options. We apply capable of processing currently unrecyclable PET plastic waste. We also our expertise to create differentiated, premium lubricants and high- formed a consortium with a number of leading companies operating performance fluids for customers in on-road, off-road, sea and industrial across the polyester packaging value chain which aims to accelerate the applications. commercialization of BP Infinia technology and to develop a new circular approach to dealing with PET plastic waste. In 2020 BP plans to build a With the onset of electrification, demand for EV-fluids is expected to pilot plant in the US to prove the technology, before progressing to grow. These include transmission fluids, battery coolants and greases. full-scale commercialization. We believe these are important steps in Castrol is investing in and partnering with original equipment enabling a stronger circular economy in the PET plastics industry, manufacturers (OEMs) to develop advantaged EV-fluid technologies, underpinned by our advantaged technology and strategic partnerships. and in 2019 we announced a new partnership with the Panasonic Jaguar Racing Formula E Team for season 2019/20. Using Castrol’s In addition, we signed an agreement with Virent and Johnson Matthey EV-fluids allows Jaguar and Castrol to collaborate and further develop to further advance the development of bio-paraxylene, a key raw advanced technology and EV-fluids for both race and road cars material for the production of renewable polyester. of the future. As part of our growth agenda we expanded capacity at our joint venture The lubricants business delivered an underlying RC profit before interest acetyls site in South Korea and signed an agreement with Zhejiang and tax that was similar to 2018, reflecting year-on-year unit margin Petroleum and Chemical Corporation (ZPCC) to explore the creation of a improvement, offset by adverse foreign exchange rate movements. new, world-scale joint venture to build and operate a 1 million tonne per annum acetic acid plant in Zhejiang Province, China. In December 2018 we signed a heads of agreement with SOCAR to evaluate the creation of a joint venture to build and operate a world- scale petrochemicals complex in Turkey. This advantaged facility would be the largest integrated aromatics and PTA complex in the western hemisphere. Significant progress has been made in defining the project with a final investment decision expected towards the end of 2020. In 2019 the petrochemicals business delivered an underlying RC profit before interest and tax that was lower compared with 2018, reflecting a significantly weaker margin environment across both aromatics and acetyls. Our petrochemicals production of 12.1 million tonnes in 2019 was higher than in 2018 (2018 11.9mmte). 60 BP Annual Report and Form 20-F 2019

Strategic report Rosneft Rosneft is the largest oil company in Russia, with a strong portfolio of current and future opportunities. Russia has one of the largest and lowest-cost hydrocarbon resource bases in the world and its resources play an important role in long-term energy supply to the global economy. Rosneft shareholding About Rosneft Rosneft is the largest oil company Rosneft is the leading Russian Rosneft’s largest shareholder in Russia and one of the largest refining company based on with 50% plus one share publicly traded oil companies in throughput. It owns and operates is Rosneftegaz JSC the world based on hydrocarbon 13 refineries in Russia, and holds (Rosneftegaz), which is production volume. Rosneft stakes in three refineries in wholly owned by the has a major resource base of Germany, one in India and Russian government. hydrocarbons onshore and one in Belarus. BP has a 19.75% shareholding offshore, with assets in all of Downstream operations include and two directors on the a Russia’s key hydrocarbon ROSNEFTEGAZ JSC 50.00% jet fuel, bunkering, bitumen and 11-person board. regions and abroad. BP 19.75% lubricants. Rosneft also owns and Bob Dudley and Guillermo QH Oil operates Rosneft-branded retail Investments LLC 18.93% Quintero are currently elected service stations, as well as to those roles. Others 11.32% BP-branded sites operating a 50% plus one share. under a licensing agreement. 2019 summary • BP received $785 million, net of withholding taxes, (2018 $620 million), representing its share of BP share of Rosneft dividend Rosneft’s dividends. This dividend represents 50% of IFRS net profit, and is paid twice a year in line ($ millions)b with the dividend policy adopted in 2017. • BP remains committed to our strategic investment in Rosneft, while complying with all relevant sanctions. 2019 451 334 785 2018 420 200 620 2017 124 190 314 8,281 18 19.75% 2016 332 million barrels of oil equivalent refineries – owned BP’s shareholding in Rosneft – BP share of Rosneft or hold a stake in 2015 271 proved reserves (2018 18) Interim (2018 8,163mmboe) Annual for previous year, less interim b Net of withholding taxes. 1.1 2.24 >3,000 million barrels of oil equivalent million barrels of oil retail service stations per day – BP share of Rosneft refined per day in Russia and abroad hydrocarbon production (2018 2.33mmb/d) (2018 >2,960) (2018 1.1mmboe/d) BP Annual Report and Form 20-F 2019 61

Co-operation with Rosneft $ million Our strategy is to work in co-operation with Rosneft to increase total 2019 2018 2017 shareholder return. We also partner with Rosneft in building a material Profit before interest and taxa b 2,306 2,288 923 business in addition to our shareholding. Inventory holding (gains) losses 10 (67) (87) Joint ventures RC profit before interest and tax 2,316 2,221 836 BP partners with Rosneft to generate incremental value from joint Net charge (credit) for non-operating items 103 95 – ventures and associates that are separate from BP’s core 19.75% Underlying RC profit before interest and tax 2,419 2,316 836 shareholding. Average oil marker prices $ per barrel • BP holds a 49% interest in Kharampurneftegaz LLC (Kharampur), Urals (Northwest Europe – CIF) 62.96 69.89 52.84 together with Rosneft (51%), which develops resources within the Kharampurskoe and Festivalnoye licence areas in Yamalo-Nenets a BP’s share of Rosneft’s earnings after finance costs, taxation and non-controlling interests in northern Russia. BP’s interest is reported through the is included in the BP group income statement within profit before interest and taxation. Upstream segment. b Includes $(11) million (2018 $(5) million, 2017 $(2) million) of foreign exchange (gain)/losses arising on the dividend received. • BP holds a 20% interest in Taas-Yuryakh Neftegazodobycha (Taas), together with Rosneft (50.1%) and a consortium comprising Oil India Market price Limited, Indian Oil Corporation Limited and Bharat PetroResources The price of Urals delivered in North West Europe (Rotterdam) averaged Limited (29.9%). In 2019 BP received dividends from Taas of $62.96/bbl in 2019. The discount to dated Brent was $1.25/bbl in line $157 million, net of withholding taxes (2018 $48 million). BP’s with 2018 ($1.42/bbl). interest in Taas is reported through the Upstream segment. Financial results • Rosneft (51%) and BP (49%) jointly own Yermak Neftegaz LLC Replacement cost (RC) profit before interest and tax for the segment (Yermak). The joint venture conducts onshore exploration in the included a non-operating charge of $103 million for 2019 and $95 million West Siberian and Yenisei-Khatanga basins. In April the right to for 2018. explore two additional oil and gas licence areas located in Sakha (Yakutia) was transferred to a wholly owned subsidiary of Yermak. After adjusting for non-operating items, the increase in the underlying BP’s interest in Yermak is reported through the Upstream segment. RC profit before interest and tax compared with 2018 primarily reflected • Rosneft and BP are in the process of creating a joint venture favourable foreign exchange and certain one-off items offset by lower investment fund (VIF). This supports BP and Rosneft’s agenda to oil prices. See also Financial statements – Notes 17 and 32 for other accelerate new innovations in the oil and gas industry. foreign exchange effects. Collaboration Balance sheet BP collaborates on the provision of technical, HSE and non-technical $ million services on a contractual basis to improve functional asset performance. As at 31 December 2019 2018 2017 BP and Rosneft have developed an innovative cable-less onshore Investments in associatesc 12,927 10,074 10,059 seismic acquisition system and are in discussions about further collaboration. Production and reserves Social projects 2019 2018 2017 BP together with Rosneft sponsor the Petroleum Engineering Masters Production (net of royalties) (BP share) degree programme led by the Kazan Federal University (Russia) and Liquids (mb/d) Imperial College London (UK), providing financial support, mentoring Crude oild 920 919 900 and lecturing for the students. Natural gas liquids 3 4 4 Also, with Rosneft, BP sponsors the Britten-Shostakovich Festival Total liquids 923 923 904 Orchestra which brings together the finest young talents from British Natural gas (mmcf/d) 1,279 1,285 1,308 and Russian music schools, with an average age of 22. Performances in 2019 took place in both the UK and Russia. Total hydrocarbons (mboe/d) 1,144 1,144 1,129 Estimated net proved reserves Rosneft segment performance (net of royalties) (BP share) Liquids (million barrels) BP’s investment in Rosneft is managed and reported as a separate Crude oild 5,604 5,539 5,402 segment under IFRS. The segment result includes equity-accounted earnings, representing BP’s 19.75% share of the profit or loss of Natural gas liquids 141 154 131 Rosneft, as adjusted for the accounting required under IFRS relating Total liquidse 5,745 5,693 5,533 to BP’s purchase of its interest in Rosneft and the amortization of Natural gas (billion cubic feet)f 14,705 14,325 13,522 the deferred gain relating to the disposal of BP’s interest in TNK-BP. Total hydrocarbons (mmboe) 8,281 8,163 7,864 See Financial statements – Note 17 for further information. c See Financial statements – Note 17 for further information. d Includes condensate. e Includes 357mmb (356mmb at 31 December 2018; 338mmb at 31 December 2017) for the 6.21% non-controlling interest (6.32% at 31 December 2018; 6.31% at 31 December 2017) in Rosneft held assets in Russia including 26 million barrels (24mmb at 31 December 2018; 6mmb at 31 December 2017) held through BP’s interests in Russia other than Rosneft. f Includes 1,430bcf (1,211bcf at 31 December 2018; 306bcf at 31 December 2017) for the 9.72% non-controlling interest (8.60% at 31 December 2018; 2.30% at 31 December 2017) in Rosneft held assets in Russia including 569bcf (480bcf at 31 December 2018; 2bcf at 31 December 2017) held through BP’s interests in Russia other than Rosneft. 62 BP Annual Report and Form 20-F 2019

Strategic report Other businesses and corporate Currently comprises our Alternative Energy business, shipping, treasury, BP Ventures and corporate activities, including centralized functions and any residual costs of the Gulf of Mexico oil spill. Alternative Energy Financial performance $ million 2019 2018 2017 Sales and other operating revenuesa 1,788 1,678 1,469 BP Ventures RC profit (loss) before interest and tax Gulf of Mexico oil spill (319) (714) (2,687) Other (2,452) (2,807) (1,758) RC profit (loss) before interest and tax (2,771) (3,521) (4,445) Shipping Net adverse impact of non-operating items Gulf of Mexico oil spill 319 714 2,687 Other 1,172 1,249 160 Net charge (credit) for non-operating items 1,491 1,963 2,847 Underlying RC profit (loss) before interest and tax (1,280) (1,558) (1,598) Treasury Organic capital expenditureb 337 332 339 a Includes sales to other segments. b A reconciliation to GAAP information at the group level is provided on page 299. Insurance The replacement cost (RC) loss before interest Alternative Energy and tax for the year ended 31 December 2019 was $2,771 million (2018 $3,521 million). The Renewables are the fastest-growing energy 2019 result included a net charge for non- source, potentially contributing half of the operating items of $1,491 million, primarily growth in global energy, with its share in relating to the reclassification of $877 million primary energy increasing from 4% in 2019 of accumulated foreign exchange losses from to around 15% by 2040a. reserves to the income statement, which In BP, we have an established and growing arose as a result of the contribution of our alternative energy business, with a significant Brazilian biofuels business to BP Bunge portfolio across renewable fuels, power Bioenergia, as well as Gulf of Mexico oil spill and products. And we are developing new related costs of $319 million (non-operating business models in areas such as low carbon items in 2018 $1,963 million). power and digital energy. After adjusting for these non-operating items, a BP Energy Outlook 2019: ‘evolving transition’ scenario. the underlying RC loss before interest and tax for the year ended 31 December 2019 was $1,280 million (2018 $1,558 million). This Our ‘reduce, improve, create’ framework result mainly reflected improved shipping We have set targets and aims to reduce performance. emissions in our operations, improve our products to help customers reduce Outlook their emissions and create low carbon businesses – see page 41. Other businesses and corporate annual charges, excluding non-operating items, are expected to be around $1.4 billion in 2020. BP Annual Report and Form 20-F 2019 63

Our Alternative Energy portfolio We formed BP Bunge Bioenergia, a joint venture that We increased our stake in Lightsource BP to combines BP and Bunge’s Brazilian bioenergy and become a 50:50 joint venture. Lightsource BP aims Biofuels sugarcane ethanol businesses. The venture operates Solar to develop 10GW of solar projects by 2023, see 11 biofuels sites and has a production capacity of energy page 73 for more information. 32 million metric tonnes of sugarcane a year (see Going big in biofuels). BP Bunge Bioenergia produces renewable energy Butamax® our 50:50 joint venture with DuPont from its biofuels manufacturing sites. The joint produces bio-isobutanol from corn. The energy-rich Biopower venture is capable of exporting 1,200GW hours of Renewable bioproduct has a variety of uses, such as in paints biopower to the national grid. products and lubricants. We operate nine sites in six US states and hold an We are developing a number of digital platforms to interest in another facility in Hawaii. Together they connect consumers with local, low carbon electricity Wind have a net generating capacity of 926MW. Low carbon to power their homes and transport, and are energy power and exploring opportunities to create value at the digital energy interplay between gas and renewable energy. Energy with purpose Investing in energy management To help grow our digital energy portfolio, we have invested in Grid Edge, an energy management company. Its technology helps customers predict, control and optimize a building’s energy profile. • Grid Edge can help customers lower carbon emissions by 10-15% on average. The cloud-based software can anticipate a building’s energy demand using data such as weather forecasts and expected occupancy. • This allows building managers to adapt energy use and take advantage of periods of high renewable power generation. • Customers can also use the building’s flexibility in energy demand and generation like a giant battery. “This investment is Going big in biofuels Brazil is the world’s second-largest “With a shared market for ethanol as a transportation in support of our BP has formed a 50:50 joint commitment to safety fuel, with around 75% of the country’s venture in Brazil with leading strategy to create vehicles able to run on it. and sustainability, agri-commodities company Bunge an ecosystem of Limited. The deal expands our • Demand for ethanol is growing bringing together our distinctive, digitally existing biofuels business by more rapidly in the country. In 2019 assets and expertise enabled, low carbon than 50%. demand increased 10% versus allows us to improve 2018 and is set to increase up to • BP Bunge Bioenergia is now businesses for 55% by 2030. performance, develop the second-largest operator by commercial and effective crushing capacity in the options for growth and industrial customers.” country’s bioethanol market. generate real value.” Nick Wayth Dev Sanyal Chief development officer, Chief executive, Alternative Energy Alternative Energy 64 BP Annual Report and Form 20-F 2019

Strategic report BP Ventures The energy transition is driving the need for rapid change in technology and ways of working, and the imperative for innovation has never been more urgent. Venturing plays a key role in BP, helping meet the world’s need for more energy, while at the same time reducing carbon emissions. We aim to do this by leveraging our investments across a portfolio of relevant technology businesses that can help BP transition to a lower carbon economy. BP Ventures is set up to grow new energy businesses in the Upstream, Downstream, Alternative Energy and in five areas: advanced mobility, power and storage, carbon management, bio and low carbon products, and digital transformation. We have invested over $650 million dollars Energy with purpose BP invests in forest since 2007 in more than 40 companies with technologies and carbon offsets leader innovations that we believe will materially impact BP and global BP Ventures’ investment in Finite energy systems. Resources is helping to grow its We invested $30 million into Calysta in 2019. This alternative protein business, supporting sustainable producer uses natural gas to produce protein for fish, livestock and pet forest management practices. feeds, see page 28. We also invested a further $30 million into Fulcrum The funding will help Finite Carbon, Bioenergy®, a pioneer in making low carbon, low-cost, transportation “The conservation and a subsidiary of Finite Resources, fuels from one of the most abundant resources – household garbage. scale up its voluntary carbon offsets And we made two investments in energy management companies – restoration of forests programme for businesses. Grid Edge and R&B – totalling $5.4 million. is vital to combatting The programme aims to connect climate change. We look landowners to businesses that want BP Launchpad to purchase forest carbon offsets, with forward to supporting corporations paying a fee per tonne of BP’s scale-up factory, BP Launchpad, became fully operational in 2019. the team’s expansion carbon stored in the forest. The initiative aims to quickly create multiple businesses valued over into the voluntary $1 billion that can help tackle the dual energy challenge. Launchpad is This investment is part of our aim to support the technologies and focused on building world-scale businesses that specialize in digital and carbon market.” innovations we believe will benefit BP low carbon technologies and the circular economy, with potential for and global energy systems during the these businesses to become future BP business units. Nacho Gimenez Managing director, transition to a low carbon economy. Examples of growth businesses in the Launchpad portfolio: BP Ventures • Lytt: a subsurface analytics business, providing fibre optic development, deployment and operational services, including acoustic and temperature sensing. • STRYDE: a land seismic receiver technology business. STRYDE’s technology breaks the cost/time trade-off to generate high-quality Treasury seismic images of the subsurface. • Fotech: a technology company focused on developing and deploying Treasury manages the financing of the group centrally, with advanced fibre optic sensing hardware. Launchpad acquired Fotech in responsibility for managing the group’s debt profile, share buyback late 2019; BP Ventures has been a minority investor since 2013. programmes and dividend payments, while seeking to ensure that liquidity is sufficient to meet group requirements. It also manages key financial risks including interest rate, foreign exchange, pension funding and investment, and financial institution credit risk. From locations in Shipping the UK, US and Singapore, treasury provides the interface between BP and the international financial markets and supports the financing of BP’s shipping and chartering activities help to ensure the safe and efficient BP’s projects around the world. Treasury holds foreign exchange and transportation of our hydrocarbons using a combination of BP-operated, interest rate products in the financial markets to hedge group time-chartered and spot-chartered vessels. At 31 December 2019, BP had exposures. In addition, treasury generates incremental value through 35 BP-operated and 40 time-chartered vessels for our international oil and optimizing and managing cash flows and the short-term investment of LNG shipping operations. All vessels conducting BP shipping activities are operational cash balances. For more information, see Financial required to meet BP approved standards. statements – Note 29. Insurance The group generally restricts its purchase of insurance to situations where this is required for legal or contractual reasons. Some risks are insured with third parties and reinsured by group insurance companies. This approach is reviewed on a regular basis or if specific circumstances require such a review. BP Annual Report and Form 20-F 2019 65

Section 172 statement How the board complied with its Section 172 duty. 3. Monitoring decisions and actions of the CEO and the performance of BP: including implementation of, and performance The board welcomes the new reporting requirement as an opportunity against, the strategy and the plan; and the exercise of authority to explain how dialogue with stakeholders has informed and helped to delegated to the CEO. The board satisfies itself that emerging and shape its decisions. For example the board’s engagement with Climate principal risks to BP are identified and understood, systems of risk Action 100+ in the lead up to the 2019 AGM. management, compliance and controls are in place to mitigate such Following the announcement of Bernard Looney’s appointment as chief risks and expected conduct of BP’s business and its employees is executive officer (CEO) in October 2019, the board engaged with Bernard reflected in a set of values established by the CEO. and the leadership team to develop the company’s new purpose, net 4. Succession: ensuring systems and processes are in place for zero ambition and aims. This was supported by extensive dialogue with succession, evaluation and compensation of the CEO, executive and investors, governments, employees and other stakeholders. non-executive directors and key members of senior management. Through working collaboratively with management and listening to Those delegated to by the directors to take decisions have access to feedback from the company’s many stakeholders, the board believes functional assurance support to identify matters which may have an that BP is well positioned to respond to increasing uncertainty. We are impact on a proposed decision. embarking on a period of change to deliver on our purpose to reimagine energy for people and our planet, while reinventing BP so that we can succeed over the long term. This means continuing to deliver our The Companies Act 2006 (CA2006) sets out a number of general investor proposition, while responding to society’s expectations. duties which directors owe to the company. New legislation has Delegation of authority been introduced to help shareholders better understand how directors have discharged their duty to promote the success of The board believes governance of BP is best achieved by delegation the company, while having regard to the matters set out in section of its authority for the executive management of BP to the CEO, subject 172(1)(a) to (f) of the CA2006 (s172 factors). In 2019 the directors to defined limits and monitoring by the board. The board routinely continued to exercise all their duties, while having regard to these monitors the delegation of authority, ensuring that it is regularly and other factors as they reviewed and considered proposals from updated, while retaining ultimate responsibility. senior management and governed the company on behalf of its The board has adopted a long-standing corporate governance shareholders through the BP board. framework, which includes principles outlining: • The board’s relationship with shareholders and executive management. Further information as to how the board has had regard to the s172 factors: • The conduct of board affairs and the tasks and requirements for board committees. Section 172 factor Key examples Page • The board’s focus on activities that enable it to promote shareholders’ Consequence of any New ambition and purpose 6 interests, including development of strategy, monitoring of executive decision in the long term Investment process 19 action and ongoing board and executive management succession. Strategy 16 Interests of employees Engagement, below and page 88 The framework is being reviewed to ensure it is best suited to support Sustainability ‘Our people’ 47 the evolving strategy and BP’s new purpose, ambition and aims. Parental leave 89 Alignment of ACB and option 34, 41, 44 The current framework covers the following principal areas: to carbon offset 1. Company purpose: pursuing BP’s purpose and accountability to Fostering business Engagement, below and page 88 shareholders for the company’s actions. This means focusing relationships with suppliers, primarily on strategic issues, while having regard to economic, customers and others political and social issues and other relevant external matters which Impact of operations New ambition and purpose 6 may influence or affect the development of BP’s business and on the community See our support for CA100+ 6 exemplify through the board principles (including the executive and the environment resolution and response limitations), its expectations for the conduct of the BP business Engagement, below and pages 40-45, 48 and its employees. Maintaining high standard Governance, pages 81-99, 101 of business conduct Sustainability 40-49 2. Strategy: responsibility for establishing and reviewing the long-term Acting fairly between Stakeholder engagement, 88 strategy and the annual plan (the plan) for BP, based on proposals members below and page made by the CEO for achieving BP’s purpose. Balanced long-term decision making 67 Investor proposition 18 How we engage and foster strong relationships with some of our key stakeholders Customers Employees Government Investors and Partners and Society and regulators shareholders suppliers • Original equipment • Pulse survey. • Country economic • Annual engagement • Industry events and • Social media. manufacturer • Town halls. impact reports. programme. memberships. • Community workshops collaborations. • Helios awards. • Multi-stakeholder • Quarterly and • Supplier workshops and and training. • Global customer groups. year‑end results. training. • Social investment brand tracking. • Government lobbying. • Annual general meeting. • University collaborations. programmes. • Customer events. See bp.com/ See Sustainability See bp.com/ See Corporate See bp.com/technology. See Sustainability sustainabilityreport. on page 47 and tradeassociations and governance on on page 39 Corporate governance bp.com/tax. page 88. and bp.com/ on page 88. sustainabilityreport. 66 BP Annual Report and Form 20-F 2019

Strategic report How our board considers stakeholders in decision making Strategy Performance People Governance At every board meeting the directors In order to become a net zero company by BP’s workforce is key to its success. The board, led by the chairman, believes review, with the management team, the 2050 or sooner, BP must perform as we Our people help us maintain our strong that strong governance is essential to progress against strategic priorities and the transform. reputation for high standards of business the success of the company. At the end changing shape of the business portfolio. conduct are fundamental in delivering our of 2018, it participated in an external This collaborative approach by the board, The board regularly reviews and monitors purpose to reimagine energy. evaluation of its performance. The board together with the board’s approval of the BP’s safety, reliability and environmental discussed the findings of this review company strategy, helps it to promote the performance, with the aim of continually The past year was significant for BP, and the chairman introduced changes to long-term success of BP. The board making BP safer for our entire workforce with the announcement of Bernard the board’s ways of working. It agreed assesses different areas of the business and minimizing our environmental impact. Looney as new CEO. As part of the to implement changes to board meetings, so that BP is well positioned to deliver on It also focuses on maintaining financial succession planning for this role, the so that agendas will be structured around its ambition to become a net zero company discipline and delivering strong earnings, board considered a number of factors, four distinct pillars in 2020 – strategy, by 2050 or sooner, and to help the world cash flow and returns to shareholders. including the values and leadership performance, people and governance. behaviours that this role requires. Bernard get to net zero. Ultimately board decisions In 2019, BP increased its stake in are taken against the backdrop of what has been with BP since 1991 and has a In light of BP’s new corporate purpose, Lightsource BP, see page 73; formed strong sense of BP’s culture and values. ambition and aims and the changing it considers to be in the best interest of a new joint venture with BP Bunge the long-term financial success of the As chief executive of Upstream, he corporate governance landscape, the Bioenergia, see page 64; partnered with oversaw improvements in personal board is reviewing its governance company and BP’s stakeholders, the world-leading mobility platform, including shareholders, employees, safety and initiated developments in the framework in order to modernize its DiDi, to create a new electric vehicle workplace in areas such as mental health, principles and processes. The new the community and environment, charging network in China, see page 27; our suppliers and customers. diversity and inclusion. framework will continue to drive the and is exiting BP’s Alaska business as highest levels of business standards We made strong progress with our part of a two-year $10 billion divestment Together the board and new CEO and best practice, aligning these with divestment plans and built exciting new programme. reviewed the new organizational structure, BP’s business purpose, values, strategy opportunities in fast-growing markets in including the appointment of the and culture. In 2019 a recordable injury frequency rate leadership team and restructuring plans. 2019. BP’s flexible strategy allows it to of 0.166 was the lowest since reporting grow in ways that can make a significant The board will continue to assess and began, while the number of injuries The board is reviewing the manner in monitor culture and will look to obtain contribution to the energy transition, recorded fell by 17%. Safety will always which it engages with the workforce helping deliver the lower carbon energy useful insight through effective dialogue be one of our core values. This is to enable it to better understand the with our key stakeholders and taking the world wants and needs, while important to our workforce, local interests and concerns of BP’s people, fostering strong relationships with our feedback into account in the board’s communities and the environment, while see page 88. decision-making process. stakeholders. This further strengthens the securing strong operational availability company’s balance sheet, enabling us to and reliability is crucial to our partners, pursue new advantaged opportunities for suppliers and customers. BP’s portfolio within our disciplined financial framework. Relevant section 172 factors The board (including delegation of authority) Customers Employees Government Investors and Partners and Society and regulators shareholders suppliers Our broad customer We work to attract, develop We aim to help countries Our investment proposition We depend on the We consult with local base spans industries, and retain the world’s best around the world grow their is to grow sustainable capability and performance people and NGOs to gain businesses and end talent, equipped with the domestic energy supplies free cash flow and of our suppliers, contractors valuable perspectives on consumers of our products right skills for the future. and boost energy security. distributions to shareholders and other partners, such as the ways in which our and services. We work Our people have a crucial This in turn helps create over the long term. We rely small businesses, industry activities could impact closely with our customers role in delivering against our jobs and generates on the support of our peers and academia, to help the local community or to understand their evolving strategy and creating value. revenues for governments. investors, analysts and deliver the products and environment. We typically needs so we can improve We aim to maintain dialogue proxy voting agencies and services we need for our engage well before any and adapt to meet them. with governments and engage with global operations and our physical work begins on a engage in policy debates investment centres, sharing customers. project and continue the that are of concern to us updates on our strategic conversation throughout a and the communities in progress and our financial project’s lifespan. which we operate. and non-financial plans. >10m 70,100 $6.9bn $8.3bn $364m $84m retail customers served employees paid in income and total dividends invested in research committed to social every day worldwide production taxes to distributed to BP and development investment in 2019 governments in 2019 shareholders in 2019 BP Annual Report and Form 20-F 2019 67

How we manage risk BPHow we manage risk bp manages, monitors and reports on the principal risks and Risk oversight and governance uncertainties that can impact our ability to deliver our strategy. Key risk oversight and governance committees include the following: These risks are described in the Risk factors on page 70.67. Our management systems, organizational structures, processes, Executive committees standards, code of conduct and behaviours together form a system of • Executive team meeting – for strategic and commercial risks. internal control that governs how we conduct the business of BPbp and • Group operations risk committee – for health, safety, security, manage associated risks. environment and operations integrity risks. • Group financial risk committee – for finance, treasury, trading BP’sbp’s risk management system and cyber risks. BP’sbp’s risk management system and policy is designed to be a consistent • Group disclosure committee – for financial reporting risks. and clear framework for managing and reporting risks from the group’s • Group people committee – for employee risks.group’s operations to management and to the board. The system seeks to avoid • Group ethics and compliance committee – for legal and incidents and maximizeenhance business outcomes by allowing us to: regulatory compliance and ethics risks. • Resource commitment meeting – for investment decision risks. • Understand the risk environment, identify the specific risks and • Renewal committee – for strategic, commercial and investment assess the potential exposure for BP. decision risks related to new lines of business. •bp. Determine how best to deal with these risks to manage overall potential exposure. Board and its committees • Manage the identified risks in appropriate ways. • BP board. • Monitor and seek assurance of the effectiveness of the management • Audit committee. of these risks and intervene for improvement where necessary. • Safety, environment and security assurance committee. • Report up the management chain and to the board on a periodic basis • Geopolitical committee. on how significant risks are being managed, monitored, assured and See BP governance framework on page 83, Board activity in 2019 the improvements that are being made. on page 84Business and committee reports on pages 90-99strategic risk management – our businesses, integrators and 101.enablers integrate risk management into key business processes such as strategy, planning, performance management, resource and capital allocation, and project appraisal. We do this by using a standard framework for collating risk data, assessing risk management activities, making further improvements and in connection with planning new activities. Oversight and governance – throughout the year management, the leadership team, the board and relevant committees provide oversight of how significant risks to bp are identified, assessed and managed. They help to ensure that risks are governed by relevant policies and are managed appropriately. Such oversight may include reviews of the outcomes of business processes including strategy, planning and resource and capital allocation. bp’s group risk team analyses the group’s risk profile and maintains the group’s risk management system. Our internal audit team provides independent assurance to the chief executive and board as to whether the group’s system of internal control is adequately designed and operating effectively to respond appropriately to the risks that are significant to bp. Risk oversight and governance Key risk oversight and governance committees include the following: Our risk management activities Day-to-day risk management – management and staff at our facilities, assets, and within our businesses, integrators and enablers seek to identify and manage risk, promoting safe, compliant and reliable operations. bp requirements, which take into account applicable laws and regulations, underpin the practical plans developed to help reduce risk and deliver safe, compliant and reliable operations as well as greater efficiency and sustainable financial results. Day-to-day risk management Identify, manage and report risks Business and strategic risk management Plan, manage performance and assure Oversight and governance Set policy and monitor principal risks Facilities, assets and operations Businesses, integrators and enablers Leadership team and enablers The board Leadership team and its committees Leadership team meeting – for oversight and for strategic and commercial risks. Group operations risk committee – for health, safety, security, environment and operations integrity risks. Group financial risk committee – for finance, treasury, trading and cyber risks. Group disclosure committee – for financial reporting risks. Group people and culture committee – for employee risks. Group ethics and compliance committee – for legal and regulatory compliance and ethics risks. Resource commitment meeting – for investment decision risks. bp quarterly audit meeting – for assurance on the oversight of bp’s principal risks. Board and its committees bp board. Audit committee. Safety and sustainability committee. Remuneration committee. People and governance committee. For bp governance framework see page 88, Board activities see page 80, and committee reports see pages 92-102 and 105.
65 Strategic report bp Annual Report and Form 20-F 2020 Risk management processes Day-to-day risk Business and Oversight and We aim for a consistent basis of measuring risk to: management strategic risk governance • Establish a common understanding of risks on a like-for-like basis, management taking into account potential impact and likelihood. �dent���� Plan� mana�e �et pol��� • Report risks and their management to the appropriate levels of mana�e and per�orman�e and mon�tor the organization. report r���� and a��ure pr�n��pal r���� • Inform prioritization of specific risk management activities and resource allocation. Fa��l�t�e�� Bu��ne�� ��e�ut��e ��e a��et�Businesses, integrators and �e�ment� and and �orporate �oard Businesses and functionsenablers review significant risks and associated risk operat�on� �un�t�on� �un�t�on� management activities in alignment with key business processes to help enable key decisions to be risk informed. Day-to-day risk management – management and staff at our As part of BP’sbp’s annual planning process, the executiveleadership team and board facilities, assets and functions seek to identify and manage risk, review the group’sgroup’s principal risks and uncertainties and determine risks promoting safe, compliant and reliable operations. BP requirements, for particular oversight by the board and its committees. These may be which take into account applicable laws and regulations, underpin the updated during the year in response to changes in internal and external practical plans developed to help reduce risk and deliver safe, compliant circumstances. and reliable operations as well as greater efficiency and sustainable financial results. Our risk profile Business and strategic risk management – our businesses and The nature of our business operations is long term, resulting in many of functions integrate risk management into key business processes such our risks being enduring in nature. Nonetheless, risks can develop and as strategy, planning, performance management, resource and capital evolve over time and their potential impact or likelihood may vary in allocation, and project appraisal. We do this by using a standard framework response to internal and external events. These may include emerging for collating risk data, assessing risk management activities, making further risks which are considered through existing processes, including BP’s improvements and in connection with planning new activities.bp’s risk management system, BP’sbp’s Energy Outlook, BP’sbp’s Technology Oversight and governance – throughout the year functional Outlook and group strategic reviews. leadership, the executive team, the board and relevant committees We identify longer-term strategic risks and high priority risks for particular provide oversight of how significant risks to BP are identified, assessed oversight by the board and its various committees in the coming year. and managed. They help to ensure that risks are governed by relevant Those identified for particular oversight in 2020 are listed in this section. policies and are managed appropriately. Such oversight may include These may be updated throughout the year in response to changes in reviews of the outcomes of business processes including strategy, internal and external circumstances. The oversight and management of planning and resource and capital allocation. other risks is undertaken in the normal course of business. BP’s group risk team analyses the group’s risk profile and maintains the There can be no certainty that our risk management activities will group risk management system. Our group audit team provides mitigate or prevent these, or other risks, from occurring. Further details independent assurance to the group chief executive and board as to of the principal risks and uncertainties we face are set out in Risk whether the group’s system of internal control is adequately designed factors on page 70. and operating effectively to respond appropriately to the risks that are significant to BP. 68 BP Annual Report and Form 20-F 2019

Strategic report67. Risks for particular oversight by the board and its We seek to manage this risk through development and maintenance of committees in 2020 relationships with governments and stakeholders and by becoming trusted partners in each country and region. In addition, we closely2021 The risks for particular oversight by the board and its committees in monitor events and implement risk mitigation plans where appropriate. 20202021 have been reviewed.reviewed and are listed in this section. These may be updated throughout the year in response to changes in internal and external circumstances. The oversight and management of other risks is undertaken in the normal course of business. In addition to the risks reviewed in 2019,2020, climate-related risks have been added asremain a longer-term strategic risk. The impact of COVID-19 The spread of COVID-19 has caused a significant drop in the UK’s exit fromoil and gas prices and refining margins. bp’s future financial performance will be impacted by the EUextent and duration of the current market conditions and the effectiveness of the actions that it and others take, including its financial interventions. Our financial frame is designed to be robust to periods of low price, with flexibility to reduce cost and capital expenditure if required. We continue to assess the impact of COVID-19 on our staff and operations and have instigated appropriate mitigation plans. Climate-related risks We have been assessing the potential impact on BP of Brexit and the UK’s future global relationships and have considered Risks associated with climate change and the transition to a lower carbon different outcomes but do not believe any of these outcomes economy impact many elements of our strategy and, as such, these risks are pose a significant risk to our business. The board’s geopolitical considered through key business processes including the strategy, annual committee continues to monitor these developments. plan, capital allocation and investment decisions. The outputs of these key business processes are reviewed in line with the cadence of these activities. Further details are described in EnvironmentClimate change and the environment on page 4052. Strategic and Climatecommercial risks Financial liquidity External market conditions can impact our financial performance. Supply and demand and the prices achieved for our products can be affected by a wide range of factors including political developments, consumer preferences for low carbon energy, global economic conditions and the influence of OPEC. We seek to manage this risk through bp’s diversified portfolio, our financial framework, liquidity stress testing, maintaining a significant cash buffer, regular reviews of market conditions and our planning and investment processes. See Prices and markets and Liquidity, financial capacity and financial, including credit, exposure on page 67. Cyber security The targeted and indiscriminate threats to the security of our digital infrastructure and those of third parties continue to evolve rapidly and are increasingly prevalent across industries worldwide. In addition, the COVID-19 pandemic changed ways of working and introduced new phishing campaigns. We seek to manage this risk through a range of measures, which include cyber security standards, security protection tools, ongoing detection and monitoring of threats and testing of cyber response and recovery procedures. We collaborate closely with governments, law enforcement agencies and industry peers to understand and respond to new and emerging cyber threats. We build awareness with our staff, share information on incidents with leadership for continuous learning and conduct regular exercises including with the leadership team to test response and recovery procedures.
66 bp Annual Report and Form 20-F 2020 Geopolitical The diverse locations of our operations around the world expose us to a wide range of political developments and consequent changes to the economic and operating environment. Geopolitical risk is inherent to many regions in which we operate, and heightened political or social tensions or changes in key relationships could adversely affect the group. We seek to manage this risk through development and maintenance of relationships with governments and stakeholders and by becoming trusted partners in each country and region. In addition, we closely monitor events and implement risk mitigation plans where appropriate. Compliance and control risks Ethical misconduct and legal or regulatory non-compliance Ethical misconduct or breaches of applicable laws or regulations could damage our reputation, result in litigation, regulatory action and penalties, adversely affect results and shareholder value, and potentially affect our licence to operate. Our code of conduct and our values and behaviours, applicable to all employees, are central to managing this risk. Additionally, we have various group requirements and training covering areas such as anti-bribery and corruption, anti-money laundering, competition/anti-trust law and international trade regulations. We seek to keep abreast of new regulations and legislation and plan our response to them. We offer an independent confidential helpline, OpenTalk, for employees, contractors and other third parties. Trading non-compliance In the normal course of business, we are subject to risks around our trading activities which could arise from shortcomings or failures in our systems, risk management methodology, internal control processes or employee conduct. We have specific operating standards and control processes to manage these risks, including guidelines specific to trading, and seek to monitor compliance through our dedicated compliance teams. We also seek to maintain a positive and collaborative relationship with regulators and the industry at large. Safety and operational risks change and the transition to a lower carbon economy on page 70. Process safety, personal safety and environmental risks Strategic and commercial risks The nature of the group’sgroup’s operating activities exposes us to a wide range of significant health, safety and environmental risks such as Financial liquidity incidents associated with releases of hydrocarbons when drilling wells, External market conditions can impact our financial performance. operating facilities and transporting hydrocarbons. Supply and demand and the prices achieved for our products can be Our operating management systemsystem« helps us manage these risks and affected by a wide range of factors including political developments, drive performance improvements. It sets out the rulesstandards and principles consumer preferences for low carbon energy, global economicrequirements which govern key risk management activities such as inspection, conditions and the influence of OPEC. maintenance, testing, business continuity and crisis response planning We seek to manage this risk through BP’s diversified portfolio, our and competency development. In addition, we conduct our drilling financial framework, liquidity stress testing, maintaining a significant activity through a global wells organization in order to promote a cash buffer, regular reviews of market conditions and our planning and consistent approach for designing, constructing and managing wells. investment processes. Security See Prices and markets and Liquidity, financial capacity and financial, Hostile acts such as terrorism or piracy could harm our people and including credit, exposure on page 70. disrupt our operations. We monitor for emerging threats and vulnerabilities to manage our physical and information security. The impact of coronavirus (COVID-19) Our central security team provides guidance and support to our The spread of coronavirus coupled with actions from OPEC+ has businesses through a network of regional security advisors who advise caused a significant drop in the oil price. Our financial frame is and conduct assurance activities with respect to the management of designed to be robust to periods of low price, with flexibility to security risks affecting our people and operations. We continue to reduce cost and capital expenditure if required. We continue to monitor threats globally and maintain disaster recovery, crisis and assess the potential impact of coronavirus on our staff and business continuity management plans. operationsThe impact of the UK’s exit from the EU We have been assessing the potential impact on bp of Brexit and the UK’s future global relationships and have instigated appropriate mitigation plans. Compliancenot identified any significant risk to our business. The impact of reinventing bp on the organization Last year we announced that we are reinventing bp to help deliver our ambition. This significant reorganization includes a new structure, a new leadership team, new ways of working and control risks Cyber security Ethical misconducta reduction in the size of bp’s office- based workforce. Risks associated with these changes have been identified, assessed and legal or regulatory non-compliance The targeted and indiscriminate threats to the securityare being managed. As part of our digital Ethical misconductthree lines of defence, our businesses, integrators and enablers are working to deliver clear accountabilities and the associated workload reduction. All individuals changing roles or breachesleaving bp are required to complete a comprehensive management of applicable laws or regulations infrastructure and those of third parties continue to evolve rapidly and could damage our reputation, adversely affect operational results are increasingly prevalent across industries worldwide. and shareholder value, and potentially affect our licence to operate. We seek to manage this risk through a range of measures, which Our code of conduct and our values and behaviours, applicable to all include cyber security standards, security protection tools, ongoing employees, are central to managing this risk. Additionally, we have various detection and monitoring of threats and testing of cyber response and group requirements and training covering areas such as anti-bribery and recovery procedures. We collaborate closely with governments, law corruption, anti-money laundering, competition/ anti-trust law and international enforcement agencies and industry peers to understand and respond to trade regulations. We seek to keep abreast of new regulations and legislation new and emerging cyber threats. We build awareness with our staff, and plan our response to them. We offer an independent confidential helpline, share information on incidents with leadership for continuous learning OpenTalk, for employees, contractors and other third parties. and conduct regular exercises including with the executive team to test Trading non-compliance response and recovery procedures. In the normal course of business, we are subject to risks around our Geopolitical trading activities which could arise from shortcomings or failures in our The diverse locations of our operations around the world expose us to systems,change. Material risk management methodology,actions are being assured by internal control processes or a wide range of political developments and consequent changes to the employee conduct. economic and operating environment. Geopoliticalaudit. How we manage risk is inherent to We have specific operating standards and control processes to manage many regions in which we operate, and heightened political or social these risks, including guidelines specific to trading, and seek to monitor tensions or changes in key relationships could adversely affect compliance through our dedicated compliance teams. We also seek to the group. maintain a positive and collaborative relationship with regulators and the industry at large. BPcontinued
67 Strategic report bp Annual Report and Form 20-F 2019 69

Risk factors2020 The risks discussed below, separately or in combination, could have Failure to accurately forecast or work within our financial framework could impact a material adverse effect on the implementation of our strategy, our our ability to operate and result in financial loss. Trade and other receivables, including business, financial performance, results of operations, cash flows, overdue receivables, may not be recovered, divestments may not be successfully liquidity, prospects, shareholder value and returns and reputation. completed and a substantial and unexpected cash call or funding request could disrupt our financial framework or overwhelm our ability to meet our obligations. Strategic and commercial risks An event such as a significant operational incident, legal proceedings or a geopolitical event in an area where we have significant activities, could reduce our Prices and markets –– our financial performance is impacted by financial liquidity and our credit ratings. Credit ratings downgrades could potentially fluctuating prices of oil, gas and refined products, technological change, increase financing costs and limit access to financing or engagement in our trading exchange rate fluctuations, and the general macroeconomic outlook. activities on acceptable terms, which could put pressure on the group’s liquidity. Oil, gas and product prices are subject to international supply and demand and Credit rating downgrades could also trigger a requirement for the company to margins can be volatile. Political developments, increased supply from new oil review its funding arrangements with the BP pension trustees and may cause and gas or alternative low carbon energy sources, technological change, global other impacts on financial performance. In the event of extended constraints on economic conditions, public health situations (including the continued impact of the COVID-19 pandemic or any future epidemic or pandemic) and the influence of OPEC can our ability to obtain financing, we could be required to reduce capital expenditure impact supply and demand and prices for our products. Decreases in oil, gas or or increase asset disposals in order to provide additional liquidity. See Liquidity product prices could have an adverse effect on revenue, margins, profitability and and capital resources on page 301 and Financial statements – Note 29. cash flows. If significant or for a prolonged period, we may have to write down assets and re-assess the viability of certain projects, which may impact future Joint arrangements and contractors – varying levels of control over the cash flows, profit, capital expenditure andexpenditure, the ability to work within our financial frame and maintain our long-term standards, operations and compliance of our partners, contractors and investment programme. Conversely, an increase in oil, gas and product prices sub-contractors could result in legal liability and reputational damage. may not improve margin performance as there could be increased fiscal take, We conduct many of our activities through joint arrangements, associates or cost inflation and more onerous terms for access to resources. The profitability of our refining activities can be volatile, with periodic over-supply or supply tightness in regional markets and fluctuations in demand. Exchange rate fluctuations can create currency exposures and impact underlying costs and revenues. Crude oil prices are generally set in US dollars, while products vary in currency. Many of our major project« development costs are denominated in local currencies, which may be subject to fluctuations against the US dollar. Access, renewal and reserves progression – inability to access, renew and progress upstream resources in a timely manner could adversely affect our long-term replacement of reserves. Focused renewal of our reserve base in line with our strategy depends on our ability to progress upstream resources from our existing portfolio and access new resource in our core areas, generating future opportunities for oil and natural gas production. Competition for access to investment opportunities, heightened political and economic risks where we operate, unsuccessful exploration activity, technical challenges and capital commitments may adversely affect our reserve replacement. This, and our ability to progress upstream resources at a level in line with our strategic outlook for hydrocarbon production, could impact our future production and financial performance. Major project delivery – failure to invest in the best opportunities or deliver major projects successfully could adversely affect our financial performance. We face challenges in developing major projects, particularly in geographically and technically challenging areas. Poor investment choice, efficiency or delivery, or operational challenges at any major project that underpins production or production growth could adversely affect our financial performance. Geopolitical – exposure to a range of political developments and consequent changes to the operating and regulatory environment could cause business disruption. We operate and may seek new opportunities in countries, regions and cities where political, economic and social transition may take place. Political instability, changes to the regulatory environment or taxation, international trade disputes and barriers to free trade, international sanctions, expropriation or nationalization of property, civil strife, strikes, insurrections, acts of terrorism, acts of war and public health situations (including the continued impact of the COVID-19 pandemic or any future epidemic or pandemic) may disrupt or curtail our operations or development activities. These may in turn cause production to decline, limit our ability to pursue new opportunities, affect the recoverability of our assets or cause us to incur additional costs, particularly due to the long-term nature of many of our projects and significant capital expenditure required. Events in or relating to Russia, including trade restrictions and other sanctions, could adversely impact our income and investment in or relating to Russia. Our ability to pursue business objectives and to recognize production and reserves relating to these investments could also be adversely impacted. Liquidity, financial capacity and financial, including credit, exposure – failure to work within our financial framework could impact our ability to operate and result in financial loss. Failure to accurately forecast or work within our financial framework could impact our ability to operate and result in financial loss. Trade and other receivables, including overdue receivables, may not be recovered, divestments may not be successfully completed and a substantial and unexpected cash call or funding request could disrupt our financial framework or overwhelm our ability to meet our obligations. Risk factors
68 bp Annual Report and Form 20-F 2020 An event such as a significant operational incident, legal proceedings or a geopolitical event in an area where we have significant activities, could reduce our financial liquidity and our credit ratings. Credit rating downgrades could potentially increase financing costs and limit access to financing or engagement in our trading activities on acceptable terms, which could put pressure on the group’s liquidity. bp’s credit rating downgrades could also trigger a requirement for the company to review its funding arrangements with the bp pension trustees and may cause other impacts on financial performance. In the event of extended constraints on our ability to obtain financing, we could be required to reduce capital expenditure or increase asset disposals in order to provide additional liquidity. See Liquidity and capital resources on page 306 and Financial statements – Note 29. Joint arrangements and contractors – varying levels of control over the standards, operations and compliance of our partners, contractors and sub-contractors could result in legal liability and reputational damage. We conduct many of our activities through joint arrangements«, associates«or with contractors and sub-contractors where we may have limited influence and our refining and petrochemicals activities can be volatile, with periodic over- control over the performance of such operations. Our partners and contractors supply or supply tightness in regional markets and fluctuations in demand. are responsible for the adequacy of the resources and capabilities they bring to a Exchange rate fluctuations can create currency exposures and impact underlying project. If these are found to be lacking, there may be financial, operational or costs and revenues. Crude oil prices are generally set in US dollars, while products safety risksexposures for BP.bp. Should an incident occur in an operation that BPbp participates vary in currency. Many of our major project development costs are denominated in, our partners and contractors may be unable or unwilling to fully compensate in local currencies, which may be subject to fluctuations against the US dollar. us against costs we may incur on their behalf or on behalf of the arrangement. Where we do not have operational control of a venture, we may still be pursued Access, renewal and reserves progression – inability to access, by regulators or claimants in the event of an incident. renew and progress upstream resources in a timely manner could adversely affect our long-term replacement of reserves. Digital infrastructure and cyber security –– breach or failure of our or third parties’parties’ digital infrastructure or cyber security, including loss or Renewing our reserve base depends on our ability to continually replenish future misuse of sensitive information could damage our operations, increase opportunities to access and produce oil and natural gas. Competition for access costs and damage our reputation. to investment opportunities, heightened political and economic risks in certain countries where significant hydrocarbon basins are located, unsuccessful The oil and gasenergy industry is subject to fast-evolving risks from cyber threat actors, exploration activity and increasing technical challenges and capital commitments including nation states, criminals, terrorists, hacktivists and insiders. A breach or may adversely affect our reserve replacement. This, and our ability to progress failure of our or third parties’parties’ digital infrastructure –– including control systems –– due upstream resources and sustain long-term reserves replacement, could impact to breaches of our cyber defences, or those of third parties, negligence, intentional our future production and financial performance. misconduct or other reasons, could seriously disrupt our operations. This could result in the loss or misuse of data or sensitive information, injury to people, Major project delivery – failure to invest in the best opportunities or disruption to our business, harm to the environment or our assets, legal or deliver major projects successfully could adversely affect our financial regulatory breaches and legal liability. Furthermore, the rapid detection of attempts performance. to gain unauthorized access to our digital infrastructure, often through the use of We face challenges in developing major projects, particularly in geographically sophisticated and co-ordinated means, is a challenge and any delay or failure to and technically challenging areas. Poor investment choice, efficiency or delivery, detect could compound these potential harms. These could result in significant or operational challenges at any major project that underpins production or costs including fines, cost of remediation or reputational consequences. production growth could adversely affect our financial performance. Climate change and the transition to a lower carbon economy Geopolitical – exposure to a range of political– developments and –in policy, legal, regulatory,law, regulation, technology and market developmentsmarkets, including societal and investor sentiment, related consequent changes to the operating and regulatory environment could to the issue of climate change could increase costs, reduce demand for causeconstrain our operations and affect our business disruption. our products, reduce revenueplans and limit certain growth opportunities. We operate and may seek new opportunities in countries and regions wherefinancial performance. Laws, regulations, policies, obligations, government actions, social attitudes and customer preferences political, economic and social transition may take place. Political instability, relating to climate change and the transition to a lower carbon economy, including the pace of change to any of these factors, and also the pace of the transition itself, could changes to the regulatory environment or taxation, international sanctions, have an adverse impactimpacts on our business (including increased costs from expropriationincluding on our access to and realization of competitive opportunities in any of our strategic focus areas, a decline in demand for, or nationalization of property, civil strife, strikes, insurrections, acts compliance, litigation, and regulatory or litigation outcomes), and could leadconstraints on our ability to of terrorism, acts of war and public health situations (including an outbreak of ansell certain products, constraints on production and supply and access to new reserves, adverse litigation and regulatory or litigation outcomes, increased costs from compliance and increased provisions for environmental and legal liabilities. Investor preferences and sentiment are influenced by environmental, social and corporate governance (ESG) considerations including climate change and the transition to a declinelower carbon economy. Changes in epidemic or pandemic) may disrupt or curtailthose preferences and sentiment could affect our operations or development demand for certain products. activities. These mayaccess to capital markets and our attractiveness to potential investors, potentially resulting in turn cause productionreduced access to decline, limitfinancing, increased financing costs and impacts upon our ability tobusiness plans and financial performance. Technological improvements or innovations that support the transition to a lower pursue new opportunities, affect the recoverability of our assets or cause us to carbon economy, and customer preferences or regulatory incentives that alter incur additional costs, particularly due to the long-term nature of many of our fuel or power choices, could impact demand for oil and gas. Depending on the projects and significant capital expenditure required. Events in or relating to nature and speed of any such changes and our response, thisthese changes could adversely Russia, including trade restrictions and other sanctions, could adversely impact affect theincrease costs, reduce our profitability, reduce demand for certain products, limit our products,access to new opportunities, require us to write down certain assets or curtail or cease certain operations, and affect investor sentiment, our access to capital our income and investment in or relating to Russia. Our ability to pursue business markets, our competitiveness and financial performance. Policy, legal regulatory, objectives and to recognize production and reserves relating to these investments technological and market developments related to climate change could also could also be adversely impacted. affect future price assumptions used in the assessment of recoverability of Liquidity, financial capacity and financial, including credit, asset carrying values including goodwill, the judgement as to whether there is continued intent to develop exploration and appraisal intangible assets, the timing exposure – failure to work within our financial framework could impact of decommissioning of assets and the useful economic lives of assets used for our ability to operate and result in financial loss. the calculation of depreciation and amortization. See Financial statements –– Note 1 and EnvironmentClimate change and the environment on page 40. 70 BP52. Risk factors continued
69 Strategic report bp Annual Report and Form 20-F 2019

Strategic report2020 Competition –– inability to remain efficient, maintain a high-quality Drilling and production – challenging operational environments and portfolio of assets, innovate and retain an appropriately skilled other uncertainties could impact drilling and production activities. workforce could negatively impact delivery of our strategy in a highly Our activities require high levels of investment and are sometimes conducted in competitive market. challenging environments such as those prone to natural disasters and extreme Our strategic progress and performance could be impeded if we are unable to control weather, which heightens the risks of technical integrity failure. The physical our development and operating costs and margins, if we fail to scale our businesses at pace, or to sustain, develop and operate characteristics of an oil or natural gas field, and cost of drilling, completing or a high-qualityhigh- quality portfolio of assets efficiently. Furthermore, as we transition from an International Oil Company to an Integrated Energy Company, we face an expanded and rapidly evolving range of competitors in the sectors in which we operate. We could be adversely affected if operating wells is often uncertain. We may be required to curtail, delay or cancel competitors offer superior terms for access rights or licences, or if our innovation in drilling operations or stop production because of a variety of factors, including areas such as new low carbon technologies, digital, customer offer, exploration, production, refining, manufacturing or renewable energy new unexpected drilling conditions, pressure or irregularities in geological formations, technologies or customer offer that lags the industry.those of our competitors. Our performance could also be equipment failures or accidents, adverse weather conditions and compliance with negatively impacted if we fail to protect our intellectual property. Our industry faces governmental requirements. increasing challengechallenges to recruit and retain diverse, skilled and experienced people in the fields of science, technology, engineering and mathematics.talent. Successful recruitment, Compliance and control risks development and retention of specialist staff is essential to our plans. Ethical misconduct and non-compliance – ethical misconduct or Crisis management and business continuity –– failure to address an breaches of applicable laws by our businesses or our employees could incident effectively could potentially disrupt our business. be damaging to our reputation, and could result in litigation, regulatory Our business activities could be disrupted if we do not respond, or are perceived action and penalties. not to respond, in an appropriate manner to any major crisis or if we are not able Incidents of ethical misconduct or non-compliance with applicable laws and to restore or replace critical operational capacity. regulations, including anti-bribery and corruption and anti-fraud laws, trade Insurance –– our insurance strategy could expose the group to material restrictions or other sanctions, could damage our reputation, and result in uninsured losses. litigation, regulatory action and penalties. BPbp generally purchases insurance only in situations where this is legally and Regulation – changes in the regulatory and legislative environment contractually required. Some risks are insured with third parties and reinsured by could increase the cost of compliance, affect our provisions and limit group insurance companies. Uninsured losses could have a material adverse our access to new growth opportunities. effect on our financial position, particularly if they arise at a time when we are Governments that award exploration and production interests may impose facing material costs as a result of a significant operational event which could put specific drilling obligations, environmental, health and safety controls, pressure on our liquidity and cash flows. controls over the development and decommissioning of a field and possibly, Security – hostile acts against our staff and activities could cause harm nationalization, expropriation, cancellation or non-renewal of contract rights. to people and disrupt our operations. Royalties and taxes tend to be high compared with those imposed on similar commercial activities, and in certain jurisdictions there is a degree of uncertainty Acts of terrorism, piracy, sabotage and similar activities directed against our relating to tax law interpretation and changes. Governments may change their operations and facilities, pipelines, transportation or digital infrastructure could fiscal and regulatory frameworks in response to public pressure on finances, cause harm to people and severely disrupt operations. Our activities could also be resulting in increased amounts payable to them or their agencies. severely affected by conflict, civil strife or political unrest. Such factors could increase the cost of compliance, reduce our profitability in Product quality – supplying customers with off-specification products certain jurisdictions, limit our opportunities for new access, require us to divest could damage our reputation, lead to regulatory action and legal liability, or write down certain assets or curtail or cease certain operations, or affect the and impact our financial performance. adequacy of our provisions for pensions, tax, decommissioning, environmental and legal liabilities. Potential changes to pension or financial market regulation Failure to meet product quality specifications could cause harm to people and the could also impact funding requirements of the group. Following the Gulf of environment, damage our reputation, result in regulatory action and legal liability, Mexico oil spill, we may be subjected to a higher level of fines or penalties and impact financial performance. imposed in relation to any alleged breaches of laws or regulations, which could Safety and operational risks result in increased costs. Treasury and trading activities – ineffective oversight of treasury Process safety, personal safety, and environmental risks – and trading activities could lead to business disruption, financial loss,– exposure to a wide range of health, safety, security and environmental regulatory intervention or damage to our reputation. risks could cause harm to people, the environment and our assets and We are subject to operational risk around our treasury and trading activities in result in regulatory action, legal liability, business interruption, increased financial and commodity markets, some of which are regulated. Failure to costs, damage to our reputation and potentially denial of our licence process, manage and monitor a large number of complex transactions across to operate. many markets and currencies while complying with all regulatory requirements Technical integrity failure, natural disasters, extreme weather or a change in its could hinder profitable trading opportunities. There is a risk that a single trader or frequency or severity, human error and other adverse events or conditions, including a group of traders could act outside of our delegations and controls, leading to breach of digital security, could lead to loss of containment of hydrocarbons or other regulatory intervention and resulting in financial loss, fines and potentially hazardous materials. This could also lead to constrained availability of resources damaging our reputation. See Financial statements – Note 29. used in our operating activities, as well as fires, explosions or other personal and Reporting – failure to accurately report our data could lead to process safety incidents, including when drilling wells, operating facilities and those associated with transportation by road, sea or pipeline. There can be no certainty regulatory action, legal liability and reputational damage. that our operating management system systemor other policies and procedures will External reporting of financial and non-financial data, including reserves adequately identify all process safety, personal safety and environmental risks or estimates, relies on the integrity of systems and people. Failure to report data that all our operating activities, including acquired businesses, will be conducted in accurately and in compliance with applicable standards could result in regulatory conformance with these systems. See Safety and security on page 45. action, legal liability and damage to our reputation.59. Such events or conditions, including a marine incident, or inability to provide safe The Strategic report was approved by the board and signed on its behalf environments for our workforce and the public while at our facilities, premises or by Ben J. S. Mathews, company secretary on 18 March 2020. during transportation, could lead to injuries, loss of life or environmental damage. As a result we could face regulatory action and legal liability, including penalties and remediation obligations, increased costs and potentially denial of our licence to operate. Our activities are sometimes conducted in hazardous, remote or environmentally sensitive locations, where the consequences of such events or conditions could be greater than in other locations. BPDrilling and production – challenging operational environments and other uncertainties could impact drilling and production activities. Our activities require high levels of investment and are sometimes conducted in challenging environments such as those prone to natural disasters and extreme weather, which heightens the risks of technical integrity failure. The physical characteristics of an oil or natural gas field, and cost of drilling, completing or operating wells is often uncertain. We may be required to curtail, delay or cancel drilling operations or stop production because of a variety of factors, including unexpected drilling conditions, pressure or irregularities in geological formations, equipment failures or accidents, adverse weather conditions and compliance with governmental requirements. Security – hostile acts against our staff and activities could cause harm to people and disrupt our operations. Acts of terrorism, piracy, sabotage and similar activities directed against our operations and facilities, pipelines, transportation or digital infrastructure could cause harm to people and severely disrupt operations. Our activities could also be severely affected by conflict, civil strife or political unrest. Product quality – supplying customers with off-specification products could damage our reputation, lead to regulatory action and legal liability, and impact our financial performance. Failure to meet product quality specifications could cause harm to people and the environment, damage our reputation, result in regulatory action and legal liability, and impact financial performance.
70 bp Annual Report and Form 20-F 2019 71
2020 Risk factors continued Compliance and control risks Ethical misconduct and non-compliance – ethical misconduct or breaches of applicable laws by our businesses or our employees could be damaging to our reputation, and could result in litigation, regulatory action and penalties. Incidents of ethical misconduct or non-compliance with applicable laws and regulations, including anti-bribery and corruption and anti-fraud laws, trade restrictions or other sanctions, could damage our reputation, and result in litigation, regulatory action, penalties and potentially affect our licence to operate. Regulation – changes in the law and regulation could increase costs, constrain our operations and affect our business plans and financial performance. Our businesses and operations are subject to the laws and regulations applicable in each country, state or other regional or local area in which they occur. These laws and regulations result in an often complex, uncertain and changing legal and regulatory environment for our global businesses and operations. Changes in laws or regulations, including how they are interpreted and enforced, can and does impact all aspects of our business. Royalties and taxes, particularly those applied to our hydrocarbon activities, tend to be high compared with those imposed on similar commercial activities. In certain jurisdictions there is also a degree of uncertainty relating to tax law interpretation and changes. Governments may change their fiscal and regulatory frameworks in response to public pressure on finances, resulting in increased amounts payable to them or their agencies. Changes in law or regulation could increase the compliance and litigation risk and costs, reduce our profitability, reduce demand for or constrain our ability to sell certain products, limit our access to new opportunities, require us to divest or write down certain assets or curtail or cease certain operations, or affect the adequacy of our provisions for pensions, tax, decommissioning, environmental and legal liabilities. Changes in laws or regulations could result in the nationalization, expropriation, cancellation, non-renewal or renegotiation of our interests, assets and related rights. Potential changes to pension or financial market regulation could also impact funding requirements of the group. Following the Gulf of Mexico oil spill, we may be subjected to a higher level of fines or penalties imposed in relation to any alleged breaches of laws or regulations, which could result in increased costs. See Regulation of the group’s business on page 321. Treasury and trading activities – ineffective oversight of treasury and trading activities could lead to business disruption, financial loss, regulatory intervention or damage to our reputation. We are subject to operational risk around our treasury and trading activities in financial and commodity markets, some of which are regulated. Failure to process, manage and monitor a large number of complex transactions across many markets and currencies while complying with all regulatory requirements could hinder profitable trading opportunities. There is a risk that a single trader or a group of traders could act outside of our delegations and controls, leading to regulatory intervention and resulting in financial loss, fines and potentially damaging our reputation. See Financial statements – Note 29. Reporting – failure to accurately report our data could lead to regulatory action, legal liability and reputational damage. External reporting of financial and non-financial data, including reserves estimates, relies on the integrity of the control environment, our systems and people operating them. Failure to report data accurately and in compliance with applicable standards could result in regulatory action, legal liability and damage to our reputation. The Strategic report was approved by the board and signed on its behalf by Ben J. S. Mathews, company secretary, on 22 March 2021.
Energy with purpose means helping the world reach net zero. 72 BP
71 Corporate governance bp Annual Report and Form 20-F 2019

2020 Corporate governance Corporate governanceIntroduction from the chairman 72 Board of directors 74 ExecutiveLeadership team 78 The leadership team 80 Introduction from the chairman 82 Board activities in 2019 8480 Decision making by the board 82 How the board has engaged with shareholders, 88 the workforce and other stakeholders Nomination86 Governance framework 88 Learning, development and induction 90 Board evaluation 91 People and governance committee 9092 Audit committee 9194 Safety environment and security 96 assurancesustainability committee 100 Geopolitical committee 98 Chairman’s committee 99 Directors’102 Directors’ remuneration report 100103 Remuneration committee 101 Energy105 Since 2017 when the partnership with purpose Expanding solarbp began, Lightsource BP is helping shape the future ofbp has more than doubled its global energy delivery by developing solar capacity around the world. • We increased our stake in Lightsource BPpresence, from five to create a 50:50 joint venture in 2019. Lightsource BP highlights in 2019 • Entered the Spanish solar market with the purchase of a 300MW portfolio of solar14 countries. It’s also grown its development projects across six sites. • Signed a long-term agreementpipeline from 1.6 to build a 240MW facility, supplying EVRAZ, a US steel company. • Established a presence in Brazil with the purchase of 1.9GW of solar projects in various stages of development. BP17GW.

72 bp Annual Report and Form 20-F 2019 73
2020 Introduction from the chairman 2020 tested bp’s governance processes like no other year. Board members, like many colleagues across bp, have achieved and learned a lot together through our new way of working – and there’s much that we will continue. I am grateful for the flexibility, commitment and clear- sightedness of my board colleagues in 2020 – it bodes well for the years ahead. Helge Lund Chairman New strategy As a board, our responsibilities include determining bp’s purpose and strategy, monitoring its culture and seeking assurance that these are aligned with our values. For bp, 2020 was a year in which we felt this responsibility especially keenly. With the board’s support, bp adopted a new purpose – reimagining energy for people and our planet, which aligns bp’s capabilities and aspirations with the needs of society. 2020 was also the year bp’s new CEO, Bernard Looney, commenced his role. As well as formally launching our new purpose, Bernard set out a net zero ambition, new strategy, financial frame and investor proposition. These actions were taken with the full support of the board following a process of careful debate, and the board is confident that they respect bp’s culture and values. The change that was immediately most consequential for many people within bp was a restructure that will see close to 10,000 colleagues leave bp. It was difficult saying goodbye to people who helped make our organization what it is today – and the board was united with the leadership team in determining that the process should be conducted fairly and respectfully. That process is now largely complete, and I believe, as does the board, that bp is now leaner, flatter and nimbler – better able to fulfil our new purpose, ambition and strategy. COVID impact on working of the board Change on this scale would be challenging in any company at any time. So, I want to pay tribute to my board colleagues for their contribution during such a difficult period. It is to their credit that we very quickly adapted to a new way of working together – with our many meetings since March held entirely virtually. Indeed, the COVID-19 pandemic justified more regular meetings with bp’s leadership – so early in the pandemic we instituted weekly calls to keep abreast of bp’s response to the pandemic and how the team was taking account of the needs and expectations of all our stakeholders. Maintaining bp’s culture Since joining bp, I have always been impressed at the strength of the company’s culture – open, co-operative, collaborative and performance- focused. Rather than weaken that culture, I believe that the pandemic has strengthened it further – and has proved its value. bp would not have achieved all it did in 2020 without such a strong culture. We have been careful that the changes introduced throughout the year are respectful of it, and consistent with bp’s values of safety, respect, excellence, courage and one team. Board composition In 2020 we welcomed Tushar Morzaria, Karen Richardson and Johannes Teyssen to the board. They each have skills, experience and a diverse mindset that is closely aligned to the strategic direction we have set for bp. We also said goodbye to friends who have served bp with distinction over many years – Nils Andersen, Brian Gilvary, Sir Ian Davis, Dame Alison Carnwath and, of course, Bob Dudley. bp has been fortunate to have them, and we will miss them. I was delighted that Paula Reynolds agreed to take over from Sir Ian Davis as senior independent director following the AGM 2020, and that Melody Meyer was able to take over the important role of chairing the safety and sustainability committee after Nils Andersen stepped down from the board. Tushar Morzaria will take over as chair of the audit committee after the AGM in May, following an extensive handover from Brendan Nelson, who will then retire.
73 Corporate governance bp Annual Report and Form 20-F 2020 In the coming year, one of my priorities will be to ensure that the board remains at an appropriate size, with strong composition, and with diversity of both thought and skills in support of the strategic direction we have set. Diversity The process of reinventing bp provided opportunities to enhance bp’s diversity in other ways, too. Though we have more to do in all areas, we have made particular progress on gender diversity at senior levels. In 2020, we increased female board representation from 42% to 45%; increased female executive committee representation from 15% to 31%; and met the Hampton-Alexander and Parker review targets for 2021. New governance framework To complement bp’s new strategic direction, we have introduced a new governance framework, covering bp’s board-level corporate governance and facilitating a stronger board focus on strategy, performance, people and governance, with the committees each playing a critical role in support. The emphasis on strategy and its execution is especially important – I believe it to be where the board can deliver most value at this time, encouraging and working closely with the leadership team as they drive forward our strategic progress, safety, financial and operational performance. The governance framework redefines the committees’ roles. Our newly-titled safety and sustainability committee rightly gains an enhanced focus on sustainability, but with no let-up on our core and overriding priority – safety, while our people and governance committee gains an enhanced focus on our single most important asset – our people. These committees and the insights they provide to the board very much support its effectiveness. Conclusion 2020 tested bp’s governance processes like no other year. Board members, like many colleagues across bp, have achieved and learned a lot together through our new way of working – and there’s much that we will continue. I am grateful for the flexibility, commitment and clear-sightedness of my board colleagues in 2020 – it bodes well for the years ahead. Helge Lund, Chairman 22 March 2021 Compliance with the UK Corporate Governance Code Throughout 2020, bp applied the principles and complied with all the provisions of the 2018 UK Corporate Governance Code.

74 Board gender diversity 1. 2. 1. Male 2. Female 7 5 bp Annual Report and Form 20-F 2020 Board of directors As at 22 March 2021 Murray Auchincloss Chief financial officer Appointed 1 July 2020 Nationality Canadian Outside interests Board member of Aker BP ASA; Member of The 100 Group Main Committee Career summary Murray Auchincloss qualified as a chartered financial analyst in the US, leading on to a wide range of tax and financial roles, first for Amoco and then for bp after the two organizations merged in 1998. Murray has worked in both the US and UK, in a range of roles including chief financial officer, Upstream, and chief financial officer, North Sea. He was commercial director for the North American Gas business and, as head of the chief executive’s office for three years, managed all aspects of that office. Skills and experience Murray’s financial expertise, experience and knowledge make him a trusted advisor and bp group leader. His broad experience of working across the group has provided him with deep insight into bp’s assets and businesses. Murray has a degree in commerce from the University of Calgary, Canada, and qualified as a chartered financial analyst at 18 March 2020 Committee membership key Chairman Audit Safety, environmentthe University of West Virginia, US. His drive to modernize is improving bp’s financial teams, controlling costs and security assurance Remuneration Geopolitical Chairman’s Nominationcontinuing to deliver transparent financial disclosures to investors and governance Non-executive directors’ tenure Helge Lundmarkets. Bernard Looney Chairman Chief executive officer Appointed to the board 26 July 2018 (appointed Appointed 5 February 2020 chairman 1 January 2019)Nationality Irish Outside interests: Outside interests:interests Fellow of the Royal Academy of Engineering,Engineering; Fellow Chairman of Novo Nordisk AS, Operating Advisor to of the Energy Institute,Institute; Mentor for the FTSE 100 Clayton Dubilier & Rice, Member of the Board of Cross-Company Mentoring Executive Programme TrusteesProgramme; Non-executive director of the International Crisis Group, Member Age: 49 of the European Round Table of Industrialists Nationality: Irish Age: 57 1 – 3 years 5Rosneft Career summary: Nationality: Norwegian 4 – 6 years 2summary Bernard Looney joined BP in 1991 as a drilling 7+ years 4 Career summary: engineer working in roles in the North Sea, Vietnam Helge served as chief executive of BG Group from and the Gulf of Mexico. Prior to becoming the chief 2015 to 2016, when the company merged with Shell. executive of BP Upstream in April 2016, Bernard held He joined BG Group from Equinor (formerly Statoil) a range of senior roles, including chief operating where he served as its president andwas appointed chief executive officer of production, managing director BP North Board gender diversity officer for 10 yearsin February 2020. He previously ran bp’s Upstream business from 2004. Prior to Equinor, Sea and vice president in Norway and North Sea Helge was president and chief executive officer of infrastructure and BP Alaska. He has led access into the industrial conglomerate, Aker Kvaerner,April 2016 and has new countries, including Mauritania and Senegal, also heldbeen a member of the company’s executive positions in the Norwegian high-graded the portfolio with the acquisition of industrial holding company, Aker RGI and the former onshore US assets from BHP Billiton and the sale of Norwegian power and industry company, Hafslund the Alaska business, and created innovative new Nycomed. He worked as a consultant with McKinsey business models, such as Aker BP in Norway. & Company and served as a political adviser for themanagement team since November 2010. As chief executive, of BP Upstream, Bernard parliamentary group of the Conservative party inwas responsible for bp’s oil and gas exploration, development and production activities worldwide. In this role, Bernard oversaw improvements in both process and personal Norway. Prior to joining BP, he was a non-executive safety performances, and production grew by 20%. director ofHe led access into new countries, high-graded the portfolio and created innovative new business models. In earlier Upstream executive roles, he was responsible for all bp-operated oil service group Schlumberger from There were also significant improvementsand gas production worldwide and for all bp’s drilling and major project« activity. Bernard joined bp in both 2016 to 2018, and Nokia from 2011 to 2014. He gender and global diversity. Bernard initiated a Female 5 served1991 as a member ondrilling engineer and worked in operational roles in the United Nations group-wide dialogue on mental health in hopeNorth Sea, Vietnam and the Gulf of Male 6 Secretary-General’s Advisory Group on Sustainable ‘ending the stigma’ associated with the issue. Energy from 2011 to 2014. Relevant skillsMexico. Skills and experience: Relevant skills and experience:experience Bernard has spent his career at BPbp and has Board nationality Helge has an impressive track record of leadership demonstrated dynamic leadership and vision as he in the oil and gas industry. His open-minded and has progressed through various roles within the forward-looking approach is vital as the industry Company. As part of the appointment process to focuses on the transition to a lower carbon world. becoming the new chief executive officer, Bernard He has deep industry knowledge and global business exceeded at range of aptitude and psychometric experience – not only in the oil and gas industry but testing.bp. During his 10 years as a leader of Upstream, also in pharmaceuticals, healthcare and construction. Bernard saw the segment through one of the most difficult periods in the BP’sbp’s history, helping transform the companyorganization into a safer, stronger and more resilient business. He was instrumental in a number of workforce basedworkforce-based initiatives to promote a diverse and UK 6 inclusive environment. Bernard set out bp’s new strategy in 2020 and is guiding the company through its transformation. Helge Lund Chairman Appointed Board: 26 July 2018; Chairman: 1 January 2019 Nationality Norwegian Outside interests Chairman of Novo Nordisk AS; Operating Advisor to Clayton Dubilier & Rice; Member of the Board of Trustees of the International Crisis Group; Member of the European Round Table of Industrialists Career summary Helge Lund was appointed chairman of the bp board on 1 January 2019. He served as chief executive of BG Group from 2015 to 2016, when it merged with Shell. He joined BG Group from Equinor (formerly Statoil) where he served as its president and chief executive officer for 10 years from 2004. Prior to Equinor, Helge was president and chief executive officer of the industrial conglomerate Aker Kvaerner, and has also held executive positions in the Norwegian industrial holding company, Aker RGI, and the former Norwegian power and industry company, Hafslund Nycomed. He worked as a consultant with McKinsey & Company and served as a political advisor for the parliamentary group of the Conservative party in Norway. Prior to joining bp, he was a non-executive director of the oil service group Schlumberger from 2016 to 2018, and Nokia from 2011 to 2014. He served as a member of the United Nations Secretary-General’s Advisory Group on Sustainable Energy from 2011 to 2014. Skills and experience Helge’s distinguished career as a leader in the oil and gas industry and his open-minded and forward-looking approach is vital as he leads the board in its oversight of delivery of bp’s new strategy. He has deep industry knowledge and global business experience – not only in the oil and gas industry but also in pharmaceuticals, healthcare and construction. His innovative leadership of the board drives cohesion and a strong environment for constructive challenge and oversight as bp works to transform into an Integrated Energy Company. P Committee membership key Chairman A Audit committee S Safety and sustainability committee R Remuneration committee P People and governance committee

75 Corporate governance Non executive directors’ tenure 1. 4. 2. 1. <1 year 2. 1–3 years 3 3 3. 4–6 years 2 4. 7+ years 2 3. Board nationality 1. 2. 1. UK 2. US 34 4 3. Non UK/US 2 View the directors’ biographies in full at bp.com/board. 74 BP4 3. bp Annual Report and Form 20-F 2019

Corporate governance Brian Gilvary Dame Alison Carnwath2020 Pamela Daley Chief financial officer Independent non-executive director Independent non-executive director Appointed 1 January 2012 Appointed 21 May 2018 Appointed 26 July 2018 Brian will retire on 30 June 2020.Nationality American Outside interests: Outside interests: Member of Supervisory Board of BASF SE, Directorinterests Director of BlackRock, Inc,Inc.; Director of SecureWorks, Inc Outside interests: of Zurich Insurance Group, Independent director of Non-executive director of Air Liquide SA, Non- Age: 67 PACCAR Inc, Member of UK Panel on Takeovers and executive director of Barclays PLC, Non-executive Mergers, Trustee of The Economist Group Nationality: American director of Royal Navy Board, Senior independent director of The Francis Crick Institute, Chairman of Age: 67Inc. Career summary: The Hundred Group of Financial Directors (The 100 Pamsummary Pamela Daley joined General Electric Company (GE) in 1989 as tax Nationality: British Group), Fellow of the Energy Institute; Great Britain counsel and held a number of senior executive roles Age Group Triathlete Career summary: in the company, overseeing a wide range of Dame Alison is a qualified chartered accountant with corporate transactions and serving as senior vice Age: 58 a wealth of financial industry experience obtained president and senior advisor to the chairman in 2013, Nationality: British during an expansive career in London and New York. before retiring from GE. PamPamela has served as a director In addition to her current appointments, she was of BlackRock since 2014 and of SecureWorks since Career summary: previously Chairman of Land Securities Group plc 2016. She was a director of BG Group plc from 2014 Brian joined BP in 1986 after obtaining a PhD in from September 2004 until July 2018 and served as to 2016 until its acquisition by Shell,Shell. She was a director of mathematics from the University of Manchester. a non-executive director of Barclays PLC from 2010 Patheon N.V. from 2016 to 2017 until its acquisition Following a broad range of roles across the group in to 2012 and Man Group plc from November 2012 to by Thermo Fisher and, prior to that, she was previously a partner at upstream, downstream and trading in Europe and the May 2013. In 2014, Dame Alison was appointed to Morgan, Lewis && Bockius, a major US law firm, US, he became downstream’s commercial director in the order of Dame Commander of the Most Excellent where she specialized in domestic and cross-border 2002. From 2005 until 2009 he was chief executive Order of the British Empire for her services to tax-oriented financings and commercial transactions. of BP’s commodity trading armSkills and in 2010, he was business and diversity. appointed deputy group chief financial officer. Brian Relevant skills and experience: was a director of TNK-BP over two separate periods, Relevant skills and experience: Pamexperience Pamela is a qualified lawyer with significant from 2003 to 2005 and from 2010 until the sale of Dame Alison has extensive financial experience both management insight obtained from previous senior the business and BP’s acquisition of Rosneft equity as an executive and non-executive director. Dame positions held at companies that operate in highly in 2013. He served on the HM Treasury Financial Alison has chaired significant boards and has deep regulated industries. PamPamela has a wealth of experience Management Review Board from 2014 to 2017. experience of the workings of investors and the in global business and strategy gained from over 20 finance industry in the City of London. She has years in an executive role at GE. She also has Relevant skills and experience: worked with global organizations and brings this experience in the UK oil and gas industry from her Brian’s broad experience of working across the broad range of skills to the BP board and to the time served on the BG Group plc board. Pam group has provided him with deep insight into BP’s audit committee.Pamela contributes important insight to the audit committee assets and businesses. He has been key during from her previous executive experience. In 2019, she BP’s strategy implementation to transform into a joined the remuneration committee, where her ‘value over volume’ business where trading is a key understanding of employee and investor creator of value. His deep understanding of finance perspectives brings value. and trading has been vital in adjusting capital structures and operational costs while ensuring the group continues to be capable of meeting new opportunities. Brian played a major role in overseeing financial aspects of the Gulf of Mexico oil spill, and leading settlement negotiations to resolve outstanding federal and state claims. He also played a lead role in the negotiations around the exit of TNK-BP and investment into Rosneft and led the 2018 acquisition of the BHP onshore Lower 48 assets. BP Annual Report and Form 20-F 2019 75

Sir Ian DavisA R Professor Dame Ann Dowling Melody Meyer Senior independent director Independent non-executive director Independent non-executive director Appointed 2 April 2010 Appointed 3 February 2012 Appointed 17 May 2017Nationality British Outside interests: Outside interests: Outside interests: Chairman of Rolls-Royce Holdings plc, Non-executiveinterests Deputy vice-chancellor and emeritus professor President of Melody Meyer Energy LLC, Director director of Majid Al Futtaim Holding LLC, of Mechanical Engineering at the University of of the National Bureau of Asian Research, Trustee Non-executive director of Johnson & Johnson, Inc. Cambridge,Cambridge; Non-executive director of Smiths of Trinity University, Non-executive director of Group plc AbbVie Inc., Non-executive director of National Age: 68 Oilwell Varco, Inc. Age: 67 Nationality: British Age: 62 Nationality: British Career summary: Nationality: American Sir Ian began his career at The Bowater Corporation Career summary: Limited, a paper manufacturing company, beforesummary Professor Dame Ann Dowling is a deputy vice-chancellor and Career summary: joining McKinsey & Company in 1979. He was a emeritus professor of Mechanical Engineeringmechanical engineering at the Melody started her career in 1979 with Gulf Oil partner at McKinsey & Company for 31 years until his University of Cambridge where her research includes which later merged with Chevron Corporation, where retirement in 2010 and also served as chairman and fluid mechanics, acoustics and combustion. She has she remained until her retirement in 2016. During her managing director between 2003 and 2009. Sir Ian held visiting posts at MIT and at Caltech. Dame Ann career with Chevron, Melody held several key has remained as a senior partner emeritus of is a fellow of the Royal Society and the Royal leadership roles in global exploration and production, McKinsey & Company since his retirement. He also Academy of Engineering and a foreign associate of working on a number of international projects and served as a lead non-executive board member for the the US National Academy of Engineering, the operational assignments. Melody was the executive Cabinet Office from 2015 to 2016. Sir Ian was given Chinese Academy of Engineering and the French sponsor of the Chevron Women’s Network and the honour of knighthood in the 2019 Birthday Academy of Sciences. She was an advisor at continues as a mentor and advocate for the Honours for services to business. Rolls-Royce until 2015. Dame Ann was President of advancement of women in the industry. Melody has the Royal Academy of Engineering from September received several awards and accolades throughout Relevant skills and experience: 2014 to 2019. In December 2015 she was appointed to the Order of Merit. Skills and experience Professor Dame Ann is an internationally respected leader in engineering research and the practical application of new technology in industry. Her contribution in these fields has been widely recognized by universities around the world. Her academic background provides valuable balance to the board and brings a different perspective to the safety and sustainability committee of which she is a member, particularly as developments in technology continue to accelerate. Her work in this area is supplemented by her chairing the company’s technology advisory council. S Melody Meyer Independent non-executive director Appointed 17 May 2017 Nationality American Outside interests President of Melody Meyer Energy LLC; Director of the National Bureau of Asian Research; Trustee of Trinity University; Non-executive director of AbbVie Inc.; Non-executive director of NOV, Inc. Career summary Melody Meyer started her career in 1979 with Gulf Oil which later merged with Chevron Corporation, where she remained until her retirement in 2016. During her career with Chevron, Melody held several key leadership roles in global exploration and production, working on a number of international projects and operational assignments. Melody was the executive sponsor of the Chevron Women’s Network and continues as a mentor and advocate for the advancement of women in the industry. Melody is a C200 member, and has received several awards and accolades throughout her career including being recognized as a 2009 Sir Ian brings global financial and strategic experience to the Order of Merit. Trinity Distinguished Alumni, with the BioHouston to the board. He has worked with and advised global Women in Science Award and she was most recently organizations and companies in a wide variety of Relevant skills and experience: recognized by Hart Energy as an Influential Woman sectors including oil and gas and the public sector. Dame Ann is an internationally respected leader in in Energy in 2018. He is able to draw2018, by Women Inc as 2018 Most Influential Corporate Board Directors, and Outstanding Director by 2020 Women on knowledge of diverse issues engineering researchBoards. She serves on McKinsey Women in Energy Advisory Board and the practical application ofco-leads Women Corporate Directors in Houston. Skills and outcomes to assist the board and its new technology in industry. Her contribution, Relevant skills and experience: committees. research and academic leadership in these fields are Melody has spent her entire career in the oil and gas admired internationally. Her academic background industry. The breadth, variety and geographic scope Sir Ian’s previous experience as a non-executive provides balance to the board and brings a different of her experience is distinctive. Her career has been director for the Cabinet Office gives him an important perspective to the safety, environment and security marked by a focus on excellence, safety and perspective on government affairs which is an asset assurance committee, particularly as developments performance improvement. She has expertise in the to both the board and the geopolitical committee. in technology accelerate. Her work in this area is execution of major capital projects, creation of supplemented by her chairing the company’s businesses in new countries, strategic and business technology advisory council. planning, merger integration and safe and reliable operations. Melody brings a world-class operational perspective to the board, with a deep understanding of the factors influencing safe, efficient and commercially high-performing projects in a global organization. Her long and illustrious career in the oil and gas industry is predicated on a dedication to excellence, safety and performance improvements. She has expertise in the execution of major capital projects, technology, R&D, creation of businesses in new countries, strategic and business planning, merger integration and safe and reliable operations. S R

76 BPbp Annual Report and Form 20-F 2019

Corporate governance Brendan Nelson Paula Rosput Reynolds Sir John Sawers2020 Tushar Morzaria Independent non-executive director Independent non-executive directorAppointed 1 September 2020 Nationality British Outside interests Group Finance Director of Barclays PLC; Member of The 100 Group Main Committee; Chair of the Sterling Risk Free Reference Rates Working Group Career summary Tushar Morzaria is a chartered accountant with over 25 years of strategic financial management, investment banking, operational and regulatory relations experience. He is currently Group Finance Director of Barclays PLC, the British universal banking and financial services company, where he is a member of the Barclays board and executive committee. Tushar joined Barclays from JP Morgan in 2013, where he held various senior roles including the CFO of its Corporate & Investment Bank at the time of the merger of the investment bank and the wholesale treasury/security services business. Skills and experience Tushar’s position as Group Finance Director of Barclays PLC gives him a breadth of knowledge and insight into financial, tax, treasury, investor relations and strategic matters which will benefit bp as Tushar assumes the role of audit committee chair at the conclusion of bp’s annual general meeting on 12 May 2021. He has strong experience in delivering corporate change programmes while maintaining a focus on performance. Brendan Nelson Independent non-executive director Appointed 8 November 2010 Appointed 14 May 2015 Appointed 14 May 2015Nationality British Outside interests: Outside interests: Outside interests:interests Non-executive director of NatWest Markets plc Non-executiveCareer summary Brendan Nelson is a qualified chartered accountant. He was made a partner of KPMG in 1984. He served as a member of the UK board of KPMG from 2000 to 2006, subsequently being appointed vice chairman until his retirement in 2010. At KPMG International he held a number of senior positions including global chairman, banking and global chairman, financial services. Brendan has extensive financial experience, having been a non-executive director of BAE Systems plc, Visiting professor at King’s College London, Governor MemberThe Royal Bank of Scotland Group p.l.c, where he also served as chairman of the group audit committee, until April 2019 and National Westminster Bank p.l.c. until December 2018. Brendan previously served as a member of the Financial Services Practitioner Panel for six years and was chairman of the audit committee of the Institute of Chartered Accountants of Scotland from 2005 to 2008 and later became President of the Institute of Chartered Accountants of Scotland from 2013 to 2014. Skills and experience Brendan has completed a wide variety of audit, regulatory and due-diligence engagements over the course of his career. He played a significant role in the development of the profession’s approach to the audit of banks in the UK, with particular emphasis on establishing auditing standards. His role as a member of the Financial Reporting Review Panel Non-executiveenabled him to further contribute to the profession. This wide experience makes him ideally suited to chair the audit committee and to act as its financial expert. He brings related input from his role as the chair of the audit committee of a major bank. His specialism in the financial services industry allows him to contribute insight into the challenges faced by global businesses by regulatory frameworks. As previously announced, Brendan will retire from the board at the conclusion of bp’s annual general meeting on 12 May 2021. A P R Board of directors continued As at 22 March 2021 Karen Richardson Independent non-executive director Appointed 1 January 2021 Nationality American Outside interests Director of Artius Acquisition Inc.; Director of Exponent Inc. Career summary Karen Richardson was Vice President of Sales at Netscape Communications Corporation from 1995 to 1998 before embarking on several senior executive roles at E.piphany from 1998 to 2003 and was Chief Executive Officer between 2003 and 2006. In 2011 she became a non-executive director of General ElectricBT plc where she served for seven years and between 2016 and 2019 Karen was a director of Worldpay Inc. (Worldpay Group plc). Karen is currently a director of Artius Acquisition Inc., a special purpose acquisition company, and, since 2013, Exponent Inc., the engineering and scientific consulting company. Karen has a Bachelor of Science degree in Industrial Engineering from Stanford University and was awarded distinctions from the Stanford Industrial Engineering Department and the American Institute of Industrial Engineers. Skills and experience Karen has over 30 years’ experience in the technology industry. She brings exceptional knowledge of digital, technology, cyber and IT security matters from her career working with innovative companies in Silicon Valley. As bp works to transform into an Integrated Energy Company, Karen has the skills, experience and diversity to further enhance the board’s ability to support and oversee the delivery of bp’s strategy. From the conclusion of the 2021 annual general meeting, Karen will become a member of the audit committee. A R

77 Corporate governance bp Annual Report and Form 20-F 2020 Sir John Sawers Independent non-executive director Appointed 14 May 2015 Nationality British Outside interests Visiting Professor at King’s College London; Senior Adviser at Chatham House; Senior Fellow at the Royal United Services Institute; Global Adviser at the Council on Foreign Relations; Governor of the Ditchley Foundation, TrusteeFoundation; Director of the Bilderberg Association, UK,UK; Executive Chairman of Newbridge Age: 70 Age: 63 Advisory Limited Nationality: British Nationality: American Age: 64 Career summary: Career summary: Nationality: British Brendan is a qualified chartered accountant and Paula commenced her energy career at Pacific Gas & former partner at KPMG having held a number of Electric Corp in 1979 and spent over 25 years in the Career summary: senior positions at KPMG International. He served energy industry. She has held a number of executivesummary Sir John Sawers spent 36 years in public service in the UK, on the KPMG UK board from 2000 until his positions during her career, including CEO of Duke working on foreign policy, international security and retirement in 2010. Brendan previously served as a Energy Power Services, Chairman, President and intelligence. He was chief of the Secret Intelligence member of the Financial Services Practitioner Panel CEO of AGL Resources as well as Chairman and CEO Service, MI6, from 2009 to 2014 and prior to that for six years and was president of the Institute of of Safeco Corporation and Vice Chairman and Chief spent the bulk of his career in the Diplomatic Service, Chartered Accountants of Scotland in 2013/14. He Restructuring Officer of AIG. Paula was a non- representing the British government around the has extensive financial and banking experience executive director of TransCanada Corporation and world and leading negotiations at the UN, in the having been a non-executive director of The Royal CBRE Group, Inc until May 2019, having been European Union and in the G8. After he left public Bank of Scotland Group p.l.c. and National appointed in 2011 and 2016 respectively. Paula was service, Sir John was chairman and general partner Westminster Bank p.l.c. from 2010 until April 2019 awarded the National Association of Corporate of Macro Advisory Partners, a firm that advises and December 2018 respectively. Directors (US) Lifetime Achievement Award in 2014. clients on the intersection of policy, politics and markets from February 2015 to May 2019. He then Relevant skills and experience: Relevant skills and experience: set up his own firm, Newbridge Advisory, to carry Brendan has completed a wide variety of audit, Paula has had a long career leading global companies out similar work. Sir John was appointed Knight regulatory and due-diligence engagements over the in the energy and financial sectors. Her financial Grand Cross of the Order of St Michael and St course of his career. He played a significant role in background and deep experience of trading makes George in the 2015 New Year Honours for services the development of the profession’s approach to the her ideally suited to serve on the audit committee. to national security. audit of banks in the UK, with particular emphasis on HerSkills and experience with international and US companies, establishing auditing standards. He continues to Relevant skills and experience: including several restructuring processes and contribute in his role as a member of the Financial Sir John’sJohn’s deep experience of international political mergers, gives her insight into strategic and Reporting Review Panel. and commercial matters is an asset to the board in regulatory issues, which is an asset to the board. navigating the geopolitical issues faced by a modern This wide experience makesglobal company. Sir John’s unique skill set made him ideally suitedan ideal chair of bp’s geopolitical committee and he will continue to Paula currently servesadvise the board on these matters as the chair of the global company. Sir John brings a unique perspective chair the audit committee and to act as its financial remuneration committee of BAE Systems plc. Her and broad experience which makes him ideal to lead expert. He brings related input from his role as the experience there and her wider business experience thenewly established geopolitical committee. His knowledge and skills chair of the audit committee of a major bank. His and understanding of the views of investors are well gained in government, diplomacy and policy analysis specialism in the financial services industry allows suited to her being the chair of the BP remuneration and advice are invaluable to both the board and the him to contribute insight into the challenges faced by committee. safety, environment and security assurance global businesses by regulatory frameworks. committee.advisory council. Ben J S Mathews Company secretary Appointed 7 May 2019 Ben joined BPbp as a company secretary in May 2019. He is chairman of the The Association of General Counsel and Company Secretaries of the FTSE Company secretary 100 (GC100) and the co-chair of the Corporate Governance Council of the Appointed 7 May 2019 Conference Board. Ben is also a Fellow of the Institute of Chartered Secretaries and Administrators. Former appointments include Group Company Secretary of HSBC Holdings plc and Rio Tinto plc. BPDr Johannes Teyssen Independent non-executive director Appointed 1 January 2021 Nationality German Outside interests CEO and Chairman of the management board of E.ON SE (until 31 March 2021); Chairman of the Supervisory Board of Innogy SE.; Member of the Shareholders’ Committee of Nord Stream AG; Member of the Presidential Board of the Federation of German Industries Career summary Johannes began his professional career at VEBA AG in 1989. There he held a number of leadership positions across Legal Affairs and Key Account Sales. In 2000 VEBA became part of E.ON and in 2001 Johannes became a member of the Board of Management of the E.ON Group’s central management company in Munich. In 2004, he was also appointed to the Board of Management of E.ON SE in Düsseldorf and later went on to become Vice Chairman in 2008 and CEO in 2010. He was President of Eurelectric from 2013 to 2015 and the World Energy Council’s Vice Chair responsible for Europe between 2006 to 2012. Johannes was a member of the Supervisory Board of Deutsche Bank AG between 2008 and 2018 and is currently a member of the Presidential Board of the Federation of German Industries and the Shareholders’ Committee of Nord Stream AG. Skills and experience Johannes brings exceptional experience and deep knowledge in the sector and its continuing transformation. His skill set further diversifies and strengthens the overall demographic and attributes of the board as a whole. His experience in the energy sector further enhances the board’s ability to support and oversee the delivery of bp’s new strategy. Johannes has a doctorate in law from the University of Göttingen. S P S Paula Rosput Reynolds Senior independent director Appointed Board: 14 May 2015; Senior independent: 27 May 2020 Nationality American Outside interests Non-executive director and Chair Designate of National Grid plc; Non-executive director of General Electric Company; Chair of the Seattle Cancer Care Alliance Career summary Paula Rosput Reynolds commenced her energy career at Pacific Gas & Electric Corp in 1979 and spent over 25 years in the energy industry. She has held a number of executive positions during her career, including CEO of Duke Energy Power Services, Chairman, President and CEO of AGL Resources as well as Chairman and CEO of Safeco Corporation and Vice Chairman and Chief Restructuring Officer of AIG. Paula was a non-executive director of TransCanada Corporation and CBRE Group, Inc until May 2019, having been appointed in 2011 and 2016 respectively. Between 2011 and 2020 Paula was a non-executive director of BAE Systems PLC. Paula was awarded the National Association of Corporate Directors (US) Lifetime Achievement Award in 2014. Skills and experience Paula has had a long career leading global companies in the energy and financial sectors. Her experience with international and US companies, including several restructuring processes and mergers, gives her insight into strategic and regulatory issues, which is an asset to the board. Her wider business experience and understanding of the views of investors are well suited to her being the chair of bp’s remuneration committee and senior independent director. R A P

78 bp Annual Report and Form 20-F 2019 77
2020 The leadership team represents the principal executive leadership of the bp group. Its members include bp’s executive directors (Bernard Looney and Murray Auchincloss whose biographies appear on page 74) and the senior management listed on these pages. Geoff Morrell EVP, communications & advocacy Leadership team tenure Appointed 1 July 2020 Nationality American Other board memberships None Career Geoff moved to London in 2017 to take over group communications and external affairs. He spent the prior six years leading bp America’s communications and government relations teams and was instrumental in rebuilding bp’s reputation following the Deepwater Horizon incident. Before joining bp, Geoff spent four years at the Pentagon, serving as chief spokesperson for the US Department of Defense under presidents Bush and Obama. He previously worked as a journalist, including as a White House correspondent for ABC News. William Lin EVP, regions, cities & solutions Leadership team tenure Appointed 1 July 2020 Nationality American Other board memberships William is a non-executive director of Pan American Energy Group that operates in Argentina. Career William served as chief operating officer, Upstream regions before joining the leadership team. He has worked in bp for 25 years having spent most of his career working abroad in different countries. Previous senior roles include vice president – gas development and operations for Egypt, regional president for Asia Pacific and head of the group chief executive’s office. William managed the successful start-up of the Tangguh LNG facility during his time in Indonesia. Emma Delaney EVP, customers & products Leadership team tenure Appointed 1 July 2020 Emma previously served on bp’s executive team starting on 1 April 2020. Nationality Irish Other board memberships None Career Emma has spent 25 years working in bp, both in the Upstream and the Downstream, most recently as interim chief executive officer Downstream from 1 April 2020 and prior to that as regional president for West Africa. She has held a variety of senior roles including Upstream chief financial officer for Asia Pacific and head of business development for gas value chains. In Downstream she held roles in retail and commercial fuels and planning. Leadership team As at 22 March 2021
Executive team as at 18 March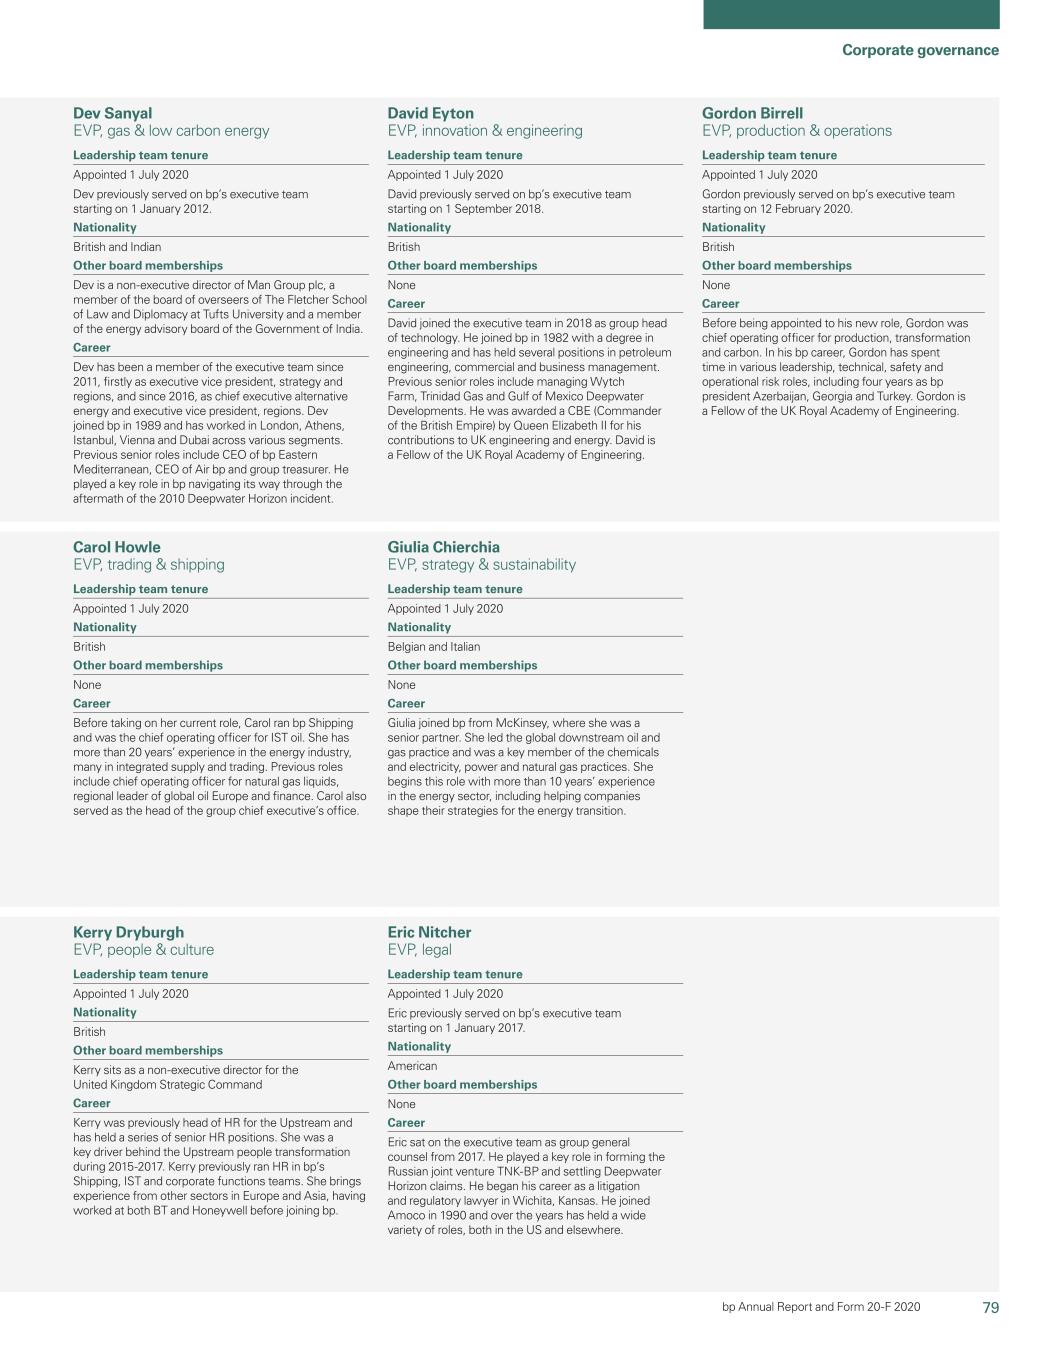
79 Corporate governance bp Annual Report and Form 20-F 2020 Gordon Birrell Susan Dio Tufan Erginbilgic Interim head of upstream Chairman and president of BP America ChiefEVP, production & operations Leadership team tenure Appointed 1 July 2020 Gordon previously served on bp’s executive Downstream Appointedteam starting on 12 February 2020 Appointed 1 September 2018 Appointed 1 October 2014 Gordon will continue as part of the new Susan will step down from her role on 30 June 2020 Tufan will retire from the company on 31 March 2020. leadership team. and retire from the company in the second half Outside interests: of 2020. Outside interests: Member of the Turkish-British Chamber of No external appointments Outside interests: Commerce & Industry Board of Directors, Member Member of the American Petroleum Institute of the Strategic Advisory Board of the University Age: 57 Nationality:Nationality British Board and Executive Committee, Member of the of Surrey.Other board memberships None Career summary: Greater Houston Partnership Executive Committee, Age: 60 Nationality: British and Turkish Before being appointed to his new role, Gordon Member of the Ford’s Theatre Board of Trustees was chief operating officer for production, Executive Committee. Career summary: transformation and carbon. In a long BPhis bp career, Tufan was appointed chief executive, Downstream Age: 59 Nationality: American Gordon has spent time in various leadership, technical, on 1 October 2014. safety and operational risk (S&OR) and leadership Career summary: Prior to this, Tufan was the chief operating officer of roles, including four years as BPbp president Susan is chairman and president of BP America, the fuels business, accountable for BP’s fuels value Azerbaijan, Georgia and Turkey. providing leadership and oversight to BP’s US chains worldwide, the global fuels businesses and businesses. the refining, sales and commercial optimization Since joining the company in 1984, she has held key functions for fuels. Tufan joined Mobil in 1990 and operational and executive positions in the US, UK and BP in 1997 and has heldGordon is a wide variety of roles in Australia. Before assuming her current role, Susan refining and marketing in Turkey, various European served as chief executive officer of BP Shipping. countries and the UK. David Eyton Bob Fryar Andy Hopwood Group head of technology Executive vice president, safety and Executive vice president, chief operating officer, Appointed 1 September 2018 operational risk upstream strategy Appointed 1 October 2010 Appointed 1 November 2010 David will continue as part of the new leadership team. Bob will retire from the company in the second half Andy will retire from the company in the second half Outside interests: of 2020. of 2020. Fellow of the UK Royal Academy of Engineering,Engineering. Carol Howle EVP, trading & shipping Leadership team tenure Appointed 1 July 2020 Nationality British Other board memberships None Career Before taking on her current role, Carol ran bp Shipping and was the chief operating officer for IST oil. She has more than 20 years’ experience in the energy industry, many in integrated supply and trading. Previous roles include chief operating officer for natural gas liquids, regional leader of global oil Europe and finance. Carol also served as the head of the group chief executive’s office. David Eyton EVP, innovation & engineering Leadership team tenure Appointed 1 July 2020 David previously served on bp’s executive team starting on 1 September 2018. Nationality British Other board memberships None Career David joined the executive team in 2018 as group head of technology. He joined bp in 1982 with a degree in engineering and has held several positions in petroleum engineering, commercial and business management. Previous senior roles include managing Wytch Farm, Trinidad Gas and Gulf of Mexico Deepwater Developments. He was awarded a CBE (Commander of the British Empire) by Queen Elizabeth II for his contributions to UK engineering and energy. David is a Fellow of the InstituteUK Royal Academy of Materials, Minerals & Outside interests: Outside interests: Mining, FellowEngineering. Kerry Dryburgh EVP, people & culture Leadership team tenure Appointed 1 July 2020 Nationality British Other board memberships Kerry sits as a non-executive director for the United Kingdom Strategic Command Career Kerry was previously head of HR for the Upstream and has held a series of senior HR positions. She was a key driver behind the Upstream people transformation during 2015-2017. Kerry previously ran HR in bp’s Shipping, IST and corporate functions teams. She brings experience from other sectors in Europe and Asia, having worked at both BT and Honeywell before joining bp. Giulia Chierchia EVP, strategy & sustainability Leadership team tenure Appointed 1 July 2020 Nationality Belgian and Italian Other board memberships None Career Giulia joined bp from McKinsey, where she was a senior partner. She led the global downstream oil and gas practice and was a key member of the Institute of Directors, Trustee No external appointments No external appointments of the John Lyons Foundation, Member of Oil & Gas Age: 56 Nationality: American Age: 62 Nationality: British Climate Initiative Climate Investments Board. Career summary: Career summary: Age: 58 Nationality: British Bob is responsible for safety, operational risk Andy was appointed chief operating officer, upstream Career summary: managementchemicals and the systematic management of strategy in April 2018. Andy joined BP in 1980, spending As group head of technology, David is accountable for operations across the BP group. He is accountable his first 10 years in operations in the North Sea, Wytch technology strategyelectricity, power and its implementation across BP. for a variety of group-level disciplines. In this capacity, Farm and Indonesia. In 1989 Andy joined the corporate This includes corporate venture capital investments he looks after the group-wide operating management planning team formulating BP’s upstream strategy and and conducting research and development in areas of system implementation and capability programmes. subsequent portfolio rationalization. corporate renewal. Innatural gas practices. She begins this role David sits on the Oil & Bob has over 30 years’with more than 10 years’ experience in the oil and gas Followingenergy sector, including helping companies shape their strategies for the BP-Amoco merger, Andy spent time Gas Climate Initiative Climate Investments Board. industry, having joined Amoco Production Company leading BP’s businesses across the world. He was David was recognized for his services to engineering in 1985. appointed executive vice president, exploration and and energy in 2018 and awarded a CBE. production in 2010. 78 BP Annual Report and Form 20-F 2019

Corporate governance Lamar McKaytransition. Eric Nitcher Dev Sanyal Chief transition officer GroupEVP, legal Leadership team tenure Appointed 1 July 2020 Eric previously served on bp’s executive team starting on 1 January 2017. Nationality American Other board memberships None Career Eric sat on the executive team as group general counsel Chief executive, alternative energyfrom 2017. He played a key role in forming the Russian joint venture TNK-BP and Appointed 16 June 2008 Appointed 1 January 2017 executive vice president, regions Appointed 1 January 2012 Lamar’s current portfolio will be redistributed on Eric will continuesettling Deepwater Horizon claims. He began his career as part of the new leadership team. 1 Julya litigation and he will continueregulatory lawyer in his capacity as chief Dev will continue as part of the new leadership team. Outside interests: transition officer. No external appointments Outside interests: Outside interests: Independent non-executive director of Man Group plc; Age: 57 Nationality: American No external appointments Member of the International Advisory Board on Energy, Career summary: Government of India; Advisory Board of the Centre for Age: 61 Nationality: American Eric is responsible for legal matters across the BP European Reform; Board of Advisors of The Fletcher Career summary: group.Wichita, Kansas. He joined Amoco in 1990 and over the years School of Law and Diplomacy, Tufts University; Fellow Lamar took on a new role as chief transition officer in has held a wide variety of roles. ofroles, both in the Energy Institute. 2019. He is responsible for supporting the chairman Eric moved to London in 2000, to join the mergers Age: 54 Nationality:US and elsewhere. Dev Sanyal EVP, gas & low carbon energy Leadership team tenure Appointed 1 July 2020 Dev previously served on bp’s executive team starting on 1 January 2012. Nationality British and Indian Other board memberships Dev is a non-executive director of Man Group plc, a member of the board of overseers of The Fletcher School of Law and new groupDiplomacy at Tufts University and a member of the energy advisory board of the Government of India. Career Dev has been a member of the executive team since 2011, firstly as executive vice president, strategy and regions, and since 2016, as chief executive in achieving a full and and acquisitions legal team. He returned to Houston orderly transfer of leadership. In addition, he Career summary: in 2007 to serve as special counsel and chief of staff continues to hold responsibility for leading BP’s Dev is responsible for BP’s global alternative energy to BP America’s chairman and president. strategy work for the energy transition. business and for the group’s interests in the Europe Most recently he played a leading role in the and Asiaexecutive vice president, regions. He was appointed to the BP Group Lamar started his career in 1980 with Amoco and settlement of the Deepwater Horizon US executive committee in 2011. has since held a number of senior roles including government claims and resolution of many of the most recently group deputy CEO. Dev joined BPbp in 1989 and has held a variety of remaining private claims. international rolesworked in London, Athens, Istanbul, Vienna and Dubai. Dev was previously appointedDubai across various segments. Previous senior roles include CEO of bp Eastern Mediterranean, CEO of Air bp and group treasurertreasurer. He played a key role in 2007 and was also chairman of BP Investment Management. Until April 2016, Dev was executive vice president, strategy and regions. Dame Angela Strank Helmut Schuster BP chief scientist and head of technology, Executive vice president, group human downstream resources director Appointed 1 September 2018 Appointed 1 March 2011 Angela will retire frombp navigating its way through the company at the end of 2020. Helmut will step down from his current role on 1 July and continue working with BP as an advisor. Outside interests: Non-executive director of Severn Trent plc, Fellow of Outside interests: the Royal Society, Fellowaftermath of the Royal Academy of Non-executive director of Ivoclar Vivadent AG, Germany Engineering. Age: 59 Nationality: Austrian and British Age: 67 Nationality: British Career summary: Career summary: Helmut became group human resources (HR) Dame Angela is responsible for technology across a director in March 2011. Since joining BP in 1989, number of BP’s businesses. As BP’s chief scientist Helmut has held a number of leadership roles. He she is accountable for developing strategic insights has worked for BP in the US, UK and continental from advances in science and managing technology Europe and within most parts of refining, marketing, capability in BP. trading and gas and power. She joined BP in 1982 as a geologist in exploration and Before taking on his current role, his portfolio of has held various leadership roles across the business. responsibilities as vice president, HR, included She was recognized for her services to the oil industry leading the people agenda for roughly 60,000 people and women in science, technology, engineering and across the globe. mathematics in 2017 and awarded a DBE. BP2010 Deepwater Horizon incident.
80 bp Annual Report and Form 20-F 2019 79

2020 Corporate governance Board activities Role of the board bp’s success is dependent upon effective and entrepreneurial leadership by the board, establishing its purpose, strategy and values and doing so within a framework of prudent and effective controls, which enable risks to be assessed and managed. The board is responsible to bp’s owners for promoting the long-term sustainable success of the company, generating value for its shareholders, while having regard to its other stakeholders, the impact of its operations on the communities within which it operates, and the environment. Primary tasks of the board in 2020 included Defining and establishing a new purpose and strategy, while assessing and monitoring whether they were consistent with bp’s culture and values. In light of the significant operational challenges presented by the COVID-19 pandemic, establishing a rhythm of board meetings to ensure that the leadership team was supported, providing guidance to the CEO to ensure that shareholder and other stakeholder interests were taken into account, while maintaining safe and reliable operations. Monitoring the activities and performance of bp’s leadership team, obtaining assurance about the delivery of 2025 and 2030 targets and aims and the sustainability frame within which they operate. Designing and establishing the board’s new corporate governance framework, including the delegations of authority under which it operates. Assessing and monitoring the principal risks and emerging risks of bp, having considered feedback from 1 Julythe committees of the board. Ways of working New ways of working were put in place during 2020 Murray Auchincloss Giulia Chierchia Emma Delaney Kerry Dryburgh Executive vice president, Executive vice president, Executive vice president, Executive vice president, financealongside the changes to the design of the board’s corporate governance framework. Meeting agendas were structured along four distinct pillars: strategy, and sustainability customers and productsperformance, people, and culture From 2015 untilgovernance, with the overarching focus being announcedon the development of bp’s new strategy in support of its transition to Giulia joins BP from McKinsey, where Emma has spent 25 years working in Kerry was previously head of HR for his new position, Murray was chief she was a senior partner. She ledan Integrated Energy Company. The board and its committees met regularly during the BP, bothyear, as well as on an ad hoc basis, as required by business needs. Attendance is shown in the Upstreamtable on page 84. Although the board and the the Upstream and has held a series of financial officer for BP Upstream. He global downstream oil and gas practice Downstream, most recently as regional senior HR positions. She was a key has held other senior rolesits committees were able to hold physical meetings in the and was a key memberearly part of the president, West Africa. Prioryear, once COVID-19-related restrictions and controls were introduced, most meetings took place virtually. Throughout the year, the board and its committees continued to this driver behindengage effectively through the Upstream people segment and spent three years as chemicals and electricity, power and role she held a varietyuse of senior roles: transformationtechnology. Key areas covered during 2015-2017. Kerry head2020 under each of these pillars are set out on the group chief executive’s natural gas practices. She begins this CFO (chief financial officer) for Asia previously ran HR in BP’s shipping, office. He spent his early career in role with more than 10 years’ Pacific, head of business development integrated supply and trading (IST) North America and qualified as a experience in the energy sector, for Upstream gas value chains and and corporate functions teams. She Chartered Financial Analyst. including helping companies shape commercial director for Iraq. She brings experience from other sectors their strategies for the energy was the vice president for integrated in Europe and Asia, having worked at transition. social and economic programmes in both BT and Honeywell before joining Indonesia. In Downstream she held a BP. She currently sits as a non- number of roles in marketing and executive director for the United planning. Kingdom Strategic Command. Carol Howle William Lin Geoff Morell Biographies for the Executive vice president, Executive vice president, Executive vice president, other members of the trading and shipping regions, cities and solutions communications and advocacy leadership team Before taking on her current role, Carol William served as chief operating Geoff has run group communications Bernard Looney, chief executive ran BP shipping and was the chief officer, upstream regions before joining and external affairs (C&EA) since 2017, officer, page 74. operating officer for IST oil. She has the leadership team. Previous senior after six years leading BP America’s more than 20 years’ experience in the roles include vice president – gas communications and government Gordon Birrell, executive energy industry, many in IST. Previous development and operations for Egypt, relations teams. He was instrumental vice-president, production and roles, include chief operating officer regional president for Asia Pacific and in rebuilding BP’s reputation in the operations, page 78. for natural gas liquids, regional leader head of the group chief executive’s years following Deepwater Horizon. of global oil Europe and finance. Carol office. William managed the Prior to BP, Geoff spent four years at David Eyton, executive vice also served as the head of the group successful start-up of the Tangguh the Pentagon, serving as the chief president, innovation and chief executive’s office. LNG facility during his time in spokesperson for the military under engineering, page 78. Indonesia. He is a non-executive presidents Bush and Obama. He Eric Nitcher, executive vice director for Pan American previously worked in television, president, legal, page 79. Energy Group that operates in including as White House Argentina. correspondent for ABC News. Dev Sanyal, executive vice president, gas and low carbon energy, page 79. 80 BPnext page.
81 Corporate governance bp Annual Report and Form 20-F 2019

Corporate governance Introduction from2020 Strategy During 2020 the chairman “Ourboard worked closely with the incoming chief executive officer (CEO) and his leadership team, establishing a new purpose is the result of a period of careful development and wide debate with the management team and also reflects the valuable feedback we have received from a number of our stakeholders, both inside and outside of BP.” Helge Lund Chairman It has been a privilege to lead BP’s boardstrategy for the past year, New ways of working especially given the important decisions we have taken The board itselfbp. bp’s purpose is an important component of BP’s leadership. together. BP now begins the new decade with a new direction. The most effective boards – and the most effective board Our new purpose, to reimagine energy for people and our meetings – are inclusive, collaborative, open and transparent. planet, is supported bywith an ambition to become a new ambition - for BP to get to net During 2019, I was pleased with the support I received from zero company by 2050 or sooner, and to help the world get to net zero my colleagueszero. This new purpose recognizes: The world is on an unsustainable path – its carbon budget is running out. Energy markets have begun to shift towards low carbon and renewables. Oil and gas produced safely and efficiently will continue to perform a vital role for the board as we fostered an atmosphere too. And we have appointed a new chief executive officer, withworld and our business, but over the management team in which those standards are Bernard Looney, who under the board’s oversight,longer term, demand for both oil and gas will lead clearly exhibited. BP in achieving both its purpose and its ambition. These improvements have gone in-hand with improvements BP’s board has been deeply involved in each of thesebe challenged. bp can contribute to the board’s efficiencyenergy transition the world wants and productivity. We have strengthened changes. It isneeds and create value in doing so. The delivery and execution of the board’s responsibility to define and set how we manage the board’s meeting agenda, the materials the company’s purpose, its values and its strategy and to developed for the board and the division of labour between the be assured that these are aligned with BP’s culture. Our committees and the board. I believe that these changes have strategy and evolving portfolio have been discussed with enabled us to effectively manage both the leadership succession the management team at every board meeting in 2019. Our and develop our new purpose and ambition.supports this new purpose is made possible through a resilient financial framework, including a new approach to capital allocation. In 2020 the result ofboard determined a period of careful development Evolvingnew distribution policy, which will support us in facing an increasingly uncertain world, allow us to strengthen the balance sheet, invest in our resilient and valuable hydrocarbons business, and invest adequately into the energy transition. A new distribution policy was approved by the board, compositioncomprising a reset and wide debateresilient dividend and a firm share buyback commitment, see page 22. Associated with the management team and also reflects The make-up ofnew strategy, the board has also evolved, and I expect that the valuable feedback we have received fromagreed a number of tactical divestments, including the disposal of its petrochemicals business. Alongside this, new business opportunities were progressed, for example the formation of a strategic partnership with Equinor, to continuedevelop offshore wind energy in futurethe US, see page 21. Against the backdrop of the board’s activities during 2020 described in this section, the table on pages 82 and 83 sets out some examples of board decision making in 2020 and how the directors have performed their duty under Section 172. Performance The board reviewed project, operational and safety performance throughout the year, as we seek to ensure we havewell as the right our stakeholders, both insidelatest view on full-year delivery against plan and outsidethe implications for the group’s scorecard measures. Equally, in light of BP. balance of skills, experiencethe challenging macro-economic environment facing the sector, the company’s financial performance, liquidity, credit position and diversity.associated financial risks were closely and regularly monitored by the board. In November last BP’s new leadership year, Nils Andersen was appointed Chairman of Unilever,this way and Duringthrough the regular interactions that were taking place during the year, the board was able to satisfy itself that bp was performing while transforming. Reports supplementing the role played by the board included: CEO and chief financial officer (CFO) reports. Group financial outlook. The annual effectiveness of investment review. Quarterly and full-year results. Shareholder distributions. The annual plan and associated capital allocation commitments. On risk oversight, the board, assisted by its committees, also regularly reviewed its principal and emerging risks, including the process through which they are identified, evaluated and managed. Linked to this, the high-priority risks were reviewed in 2020, giving the directors the chance to seek assurance as to how those risks were prioritized and being managed. On internal controls, the board also assessed the effectiveness of the group’s system of internal control and risk management as part of the process through which it reviews and, ultimately, approves the bp Annual Report and Form 20-F. No specific areas of significant deterioration were identified in this assessment. The board concluded that the group’s system of internal control continued to be resilient. The board also concluded that the overall design of the group’s system of internal control generally meets external expectations of components to be included in internal control frameworks. In arriving at these conclusions, the board took into account reports from group risk and internal audit, as well as reviews undertaken by the board and its committees during the year. In conducting reviews during the year, the board and its committees considered the impact of remote working on the control environment, among other key factors. For more information on bp’s system of risk management see How we manage risk on page 64. People The board, through the former nomination and therefore stepped down from BP’s board on 18 March after a governance committee, took equal care incontinued to focus on reviewing its executive period of transition. On behalfown composition, skills, experience and diversity, as well as that of the bp leadership team. Ultimately, new board I thank Nilsappointments were made during the year, most notably with the retirement of the CEO, Bob Dudley, and CFO, Brian Gilvary, succeeded by Bernard Looney and Murray Auchincloss, respectively. Tushar Morzaria was appointed to the board and its audit committee with effect from September 2020. Karen Richardson and Dr Johannes Teyssen were appointed to the board with effect from 1 January 2021. Johannes was also appointed to the safety and sustainability committee with effect from the same date. A new leadership team under the CEO came into being on 1 July 2020. Through the new people and governance committee, the process for hisexecutive succession planning, including in our appointmenttalent management and development is being redesigned. People insights – particularly the reinvention of a servicebp and its impact on the organization – were presented to BP. In Nils’ place, Melody Meyer agreed to chair the successor to Bob Dudley. When we began that planning in safety, environment and security assurance committee (SESAC), earnest in autumn 2018, we knew that Bob’s many recognizing her strong operational and safety experience. achievements in the role set a high bar for his eventual Separately, the board has assumed direct oversightand this committee by the CEO and EVP, people & culture, providing information on matters relating to people strategy, employee engagement, diversity and people processes and policies. To help inform board discussions and decisions, board members also engaged directly with the workforce in structured events, see page 87. Governance The board established a new corporate governance framework, which is more closely aligned with bp’s new purpose and also reinforces the effectiveness of ethics successor. That was reflected in the time we took to define and compliance matters, previously the responsibility of SESAC. the qualities we were looking for ininternal control framework. For more information on the new leadership of BP One of the chairman’s responsibilities is to ensure cohesion at a time of considerable change. A year on, we were delighted of the board over time, especially during times of transition. to welcome Bernard Looney to the role. He is both capable, To provide continuity, Sir Ian Davis and Brendan Nelson have performance oriented and deeply aware of the importance that kindly agreed to stand for re-election at the 2020 AGM for up to we attach to working in close dialogue with BPs stakeholders. a further year. Because they have now each exceeded nine years BPcorporate governance framework see page 88.
82 bp Annual Report and Form 20-F 2019 81

in the role, in putting them forward for re-election this year2020 Corporate governance continued Decision making by the board Our stakeholders carefully considered whether, they still demonstrateAs part of the necessary This year also marks the first year in whichwider board corporate governance redesign, the board reviewed the delegation of authority, in part reflecting the need to ensure that it remained appropriate in light of bp’s new strategy, and the 2025 and 2030 targets and aims. The board’s new ways of working are explained on page 80 including certain matters that under the new corporate governance framework are reserved for the board as set out in its new terms of reference. The execution of company strategy is requiredundertaken by the CEO’s leadership team, under the day-to-day authority for the management of the company delegated to qualities of independence. I am pleased to confirmthe CEO. Reflecting its governance responsibilities, the board satisfies itself that the board is report on how it has fulfilled its duties under section 172 of the satisfied that they do, and I am grateful for the support and wisdom that Companies Act, which requires directors to promote the success of the Sir Ian and Brendan bring to the board. Our nomination and governance company for the benefit of its members, and in doing so to have regard committee has, as you would expect, begun a process to identify to our stakeholders, including employees, suppliers and customers, the successors to these important roles. impact of our operations on communitiesCEO and the environment, andleadership team’s actions are in keeping with the direction it sets through receipt of management reports at each board meeting. Section 172 factor Key examples Page The likely consequences of any decision in the long term. While continuity is important, BP’s new direction gives reason to examine whetherReinventing bp: Our strategy 15 Interests of employees. How the board’s composition is optimally aligned to Regard for a wider group of stakeholders is not new. Indeed, it has been BP’s new direction. We’ll always need a core cadre of members with incorporated into the board’s working for some time. But new reporting global executive experience from similar industries, but different requirements are an opportunity to explain the processes we have specialist skills may also be valuable. These include skills relevant to followed, and how dialogue with stakeholders has shaped decisions. BP’s ambition, individuals with strong digital and transformational skills Details can be found on page 66, and information about how the board and those with broader energy and sustainability experience. has engaged with BP’sshareholders, the workforce is on page 88. In light ofand other stakeholders Sustainability: People and society 86 57 Fostering the changes ahead of us, but also as a consequence of natural Closing thanks succession, I anticipate thatcompany's business relationships with suppliers, customers and others. How we will add new competences and Finally, I want to express my gratitude to Bob Dudley, Bernard Looney, experiences to the board during 2020. the executive team, our employees and my board colleagues for their hard work, their commitment, and their contribution to BP’s new direction. Evolving remuneration structure The year 2019 also marked a transition for executive remuneration. In I look forward to workingengage with our teams to compete effectively in a order to develop a new remuneration policy, which will be proposed at changing energy market. the 2020 AGM, the remuneration committee sought candid feedback from some of our largest shareholders. Consequently, while we will retain our current structure, which is simple and well understood, we will strengthen the elements relating to our energy transition ambition. More details of our new policy are set out in the Directors’ remuneration report on page 100. Helge Lund Chairman 82 BP Annual Report and Form 20-F 2019

Corporate governance Governance framework Shareholders BP board Audit committee Safety, Geopolitical Remuneration Nomination and Chairman’s HPGR* monitored environment and committee committee governance committee • Financial liquidity. security assurance HPGR monitored Responsibilities committee Responsibilities • Cyber security. committee • Geopolitical. • Recommend Responsibilities • Evaluate • Compliance remuneration • Review performance and HPGR monitored Responsibilities with business principles and composition effectiveness • Monitor marine, • Monitor social, regulations. policy. of board. of chief executive well and pipeline economic and • Trading • Maintain dialogue • Review outside officer. incidents. political events compliance with shareholders commitments • Review the • Oversee effective around the world. and control. and workforce of the NEDs. structure and controls around • Identify major and on remuneration • Maintain strong effectiveness Responsibilities releases at correlated issues. pipeline. of the business • Reviewing facilities and/or geopolitical risks. • Monitor alignment • Review organization. financial explosion. • Consider broader of remuneration developments in • Review system disclosures. • Review and advise political policy and incentives corporate of executive • Monitoring on major security developments. for all employees. development Accountability compliance. incident. governance, • Report on and succession. • Reviewing audit • Cyber security. See page 98. law and ESG. implementation effectiveness, See page 99. Responsibilities of remuneration See page 90. including internal • Review safety and policy. Delegation controls and risk operational risk. management. • Monitor security See page 101. • Advice on external developments. auditor. • Review See page 91. environmental matters. See page 96. Chief executive officer Executive committee Group Group Group Group people Group Resource Technical operations risk financial risk disclosure committeestakeholders Sustainability: Business ethics and commitment advisory committee committee committee compliance meeting council committee Framework changes in 2020 As partaccountability 63 61 Impact of operations on the governance framework review,community and the board committees and their responsibilities will be reviewed. * HPGR – highest priority group risks. BP Annual Report and Form 20-F 2019 83

Board activities in 2019environment. Managing our environmental impacts Sustainability: Safety 57 59-60 Maintaining a reputation for high standards of business conduct. Role of the board Strategy PerformanceSustainability: Business ethics and monitoringaccountability 80 61 Acting fairly between members of the company. How the board has engaged with shareholders, the workforce and other stakeholders 86 More information on how the board had regard to the Section 172 factors Issue faced and decision taken Section 172(1)a) to (f) matters considered, including stakeholder group(s) affected and feedback received How the board had regard to the feedback in its decision making Establishing a new purpose and strategy for bp The board approved a new purpose for bp – reimagining energy for people and our planet – and a strategy to transition to an Integrated Energy Company and to meet the net zero ambition set out alongside bp’s purpose. Workforce In town halls and leadership meetings employees wanted to know how bp could do more to step up to the climate challenge and help society deal with these issues. It became clear that employees were seeking even stronger commitments to the climate change agenda by the company. Community and environment We consulted with communities, NGOs, academics and industry associations – even bringing some of bp’s harshest critics into discussions about the future of the company, about environment, social and governance matters and the issues facing the world, drawing on their external expertise, input and challenge. Investors We talked with investors about their expectations of bp and heard of their desire for bp to continue to deliver operational excellence, to drive higher returns but also to set out a clear medium to long-term vision for a sustainable bp business in light of the energy transition. Fostering business relationships We received feedback from customers via the bp leadership team, conveying the importance of being able to react rapidly to changing demand. All the elements highlighted in Section 172 were central to the discussions as the board evaluated the purpose and strategy options – what are bp’s beliefs and what does bp want to be? The discussions encompassed bp’s role with respect to its shareholders, employees and society. It considered the value creation opportunities and the importance of leaning into the changing needs of customer demand for convenience and society’s demand for renewables and lower carbon energy. The change in purpose and strategy reflects bp’s people’s belief that we can create long-term value by helping solve one of society’s biggest problems – climate change. The decision was made with the long-term future and sustainability of bp in mind with clear 2025 targets, 2030 aims and a 2050 goal. Reinvent bp The board approved a reorganization of bp, retiring the existing model and replacing it with one that is responsiblemore focused, more integrated and faces the energy transition head on. The reorganization will ultimately see around 10,000 employees leave bp. The board considered the importance of skills evaluation to the delivery of cost reduction and the wider long-term strategic delivery of bp’s aims. They heard feedback from the CEO’s ‘Keeping Connected’ webcasts with the workforce together with responses to bp’s ‘Pulse’ surveys. Considerations The wider society context following the impact of COVID-19 and the wider oil industry job losses. The importance of putting the safety of employees first. Companies should try to provide job assurance and consider the mental health impact of job insecurity. bp’s reputation for high standards of conduct and the overall During 2019importance of honesty, fairness, and respect in the process. The board supported the reinvention of bp, with the associated headcount reduction that this implied. Given the feedback received, although the board considered it was the BP strategyright decision to go ahead, they sought assurances from the executive that: The redundancy process was fair, transparent and objective with an environment of honesty, trust and co-operation that put the care and wellbeing of our people at the heart of the process. The reduction in the workforce was conducted in a manner which protected bp’s safe and reliable operations. Support for the life transition that redundancy brings is offered to the relevant employees. Discretionary enhanced redundancy terms could be offered. Financial frame and distribution policy The board reviewsapproved a new and resilient financial operationalframework, including a coherent approach to capital allocation and safety conduct ofa new distribution policy. In considering the group’s business. Directors every board meetingproposed financial frame and held a two-day strategy performance throughout the year, as well as the have duties under the both UK company law discussion in September. The board also received a latest view on expected full-year delivery against and BP’s Articles of Association. The primary number of technical briefings to expand the directors’ external scorecard measures. During the year there tasks ofdistribution policy, the board had regard to: The resilience of bp’s balance sheet for the long term. Delivering sustainable value to shareholders. The need for bp to invest adequately in 2019 included: knowledgethe energy transition and low carbon, to support the new ambition and strategy. In approving the new distribution policy the directors reflected that there may be some change in particular areas, suchbp’s investor base as Scope 3 were a number of business and regional reviews, emissions,some investors focus more on the BP Energy Outlook and including North Sea, Russia,short-term direct return that the lubricants business • Active consideration and establishment of environmental, social and corporate governance and BPX Energy. long-term strategy and approval ofdividend provides. After considering all the (ESG) matters, to best equipvarious factors, the board concluded that a resilient dividend intended to consider Updates are also given on various components of and debate strategic themes relating to BP’s annual plan. value delivery for BP’s business. Regular reports segments, key functions and the impact of the lower • Monitoring of BP’s performance against presentedremain fixed at 5.25 cents per ordinary share per quarter (subject to the board include: the strategy’s decision each quarter), with a commitment to return at least 60% of surplus cash« to shareholders through share buybacks (having reached $35 billion net debt« and plan including ethics and carbon transition on the group’s business model. This included looking at long-term energy trends and compliance. • Chief executive’s report. projections for world energy markets. • Group performance report. • Ensuring that the principal and emerging • Group financial outlook. The board monitored the company’s performance risks and uncertaintiessubject to BP are identified • Effectiveness ofmaintaining a strong investment review. against the annual plan for 2019 and approved the and that systems of risk management and • Quarterly and full-year results. annual plan for 2020 after taking into account control are in place. • Shareholder distributions. management’s revised assumptions and outlook for • Board and executive management the year. They received regular reports on the In 2019 the board re-assumed primary responsibility succession. progress and implementation of the strategy from for ethics and compliance (E&C)grade credit rating), having previously the group chief executive (GCE) and chief financial managed oversight jointly through the SESAC and officer (CFO) by means of a strategic performance the audit committee. The group head of E&C scorecard, which is discussed at each board attended the board meeting four times in 2019, meeting. providing an update on E&C matters, and how the importance of such was embedded within the BP The board undertook portfolio reviews of various culture throughout the business. The board was also parts of the BP group, including upstream, provided ethics and compliance training. The NEDs downstream and renewables. It assessed the held private sessions with the head of E&C. potential impact changes to the portfolio might have on the financial framework and discussed allocation The board reviews the quarterly and full-year results, of capital. The board looked at circular and including shareholder and capital distributions. The “The board is responsible sustainable solutions and business development 2019 annual report was assessed in terms of the opportunities in a low carbon future, through the lens directors’ obligations and reflects the briefings on for establishing the of what was in the best interest of long-term success updated corporate governance requirementsthe company, its shareholders as a whole and company’s purpose, its ofother stakeholder groups, as it enabled bp to offer sustainable value with increased investment in low carbon and non-oil and gas ventures. Matters reserved for the company. best practice. In a year that saw BP face significant transition, bothboard and section 172 The board monitors employee opinion via an annual values and strategy, and internally withdelegates authority for the announcementexecutive management of Bob Dudley’s ‘Pulse’ survey which includes measurement of how retirement and more widely asbp to the company looks the BP values are incorporated into culture around satisfying itself that thesechief executive officer, subject to play an important role in the world’s energy our global operations. transition,defined limits. Ultimately, the board discussed BP’s purposeretains responsibility for – and and its culture are aligned.” ambitions and their alignment with strategy andregularly monitors – the Feedback from other stakeholders is also considered BP culture. by the boardexecution of this delegation of authority, taking action to update it as part of its monitoring of performance, as outlined in the BP Section 172 statement and on Helge Lund pages 88-89. Chairman 84 BPrequired.
83 Corporate governance bp Annual Report and Form 20-F 2019

Corporate governance Risk Succession Looking forward,2020 Issue faced and decision taken Section 172(1)a) to (f) matters considered, including stakeholder group(s) affected and feedback received How the board is implementing changeshad regard to the feedback in its decision making Establishing a new purpose and strategy for bp The board approved a new purpose for bp – reimagining energy for people and our planet – and a strategy to transition to an Integrated Energy Company and to meet the net zero ambition set out alongside bp’s purpose. Workforce In town halls and leadership meetings employees wanted to know how bp could do more to step up to the climate challenge and help society deal with these issues. It became clear that employees were seeking even stronger commitments to the climate change agenda by the company. Community and environment We consulted with communities, NGOs, academics and industry associations – even bringing some of bp’s harshest critics into discussions about the future of the company, about environment, social and governance matters and the issues facing the world, drawing on their external expertise, input and challenge. Investors We talked with investors about their expectations of bp and heard of their desire for bp to continue to deliver operational excellence, to drive higher returns but also to set out a clear medium to long-term vision for a sustainable bp business in light of the energy transition. Fostering business relationships We received feedback from customers via the bp leadership team, conveying the importance of being able to react rapidly to changing demand. All the elements highlighted in Section 172 were central to the discussions as the board evaluated the purpose and strategy options – what are bp’s beliefs and what does bp want to be? The discussions encompassed bp’s role with respect to its waysshareholders, employees and society. It considered the value creation opportunities and the importance of workingleaning into the changing needs of customer demand for convenience and redefiningsociety’s demand for renewables and lower carbon energy. The change in purpose and strategy reflects bp’s people’s belief that we can create long-term value by helping solve one of society’s biggest problems – climate change. The decision was made with the long-term future and sustainability of bp in mind with clear 2025 targets, 2030 aims and a 2050 goal. Reinvent bp The board either directly or through its committees,approved a reorganization of bp, retiring the existing model and replacing it with one that is more focused, more integrated and faces the energy transition head on. The reorganization will ultimately see around 10,000 employees leave bp. The board in conjunctionconsidered the importance of skills evaluation to the delivery of cost reduction and the wider long-term strategic delivery of bp’s aims. They heard feedback from the CEO’s ‘Keeping Connected’ webcasts with the nominationworkforce together with responses to bp’s ‘Pulse’ surveys. Considerations The wider society context following the impact of COVID-19 and its primary responsibilities. As outlined on regularly reviews the processes whereby principalwider oil industry job losses. The importance of putting the safety of employees first. Companies should try to provide job assurance and governanceconsider the mental health impact of job insecurity. bp’s reputation for high standards of conduct and chairman’s committees, reviews page 66,the importance of honesty, fairness, and respect in the process. The board supported the reinvention of bp, with the associated headcount reduction that this implied. Given the feedback received, although the board considered it was the right decision to go ahead, they sought assurances from 2020, board agendas will be emerging risks are identified, evaluatedthe executive that: The redundancy process was fair, transparent and managed. succession plans for executiveobjective with an environment of honesty, trust and non-executive structured alongco-operation that put the following four distinct directorscare and senior executives on a regular basis. Eachwellbeing of our people at the heart of the highest priority group risks were pillars – strategy, performance, peopleprocess. The reduction in the workforce was conducted in a manner which protected bp’s safe and reliable operations. Support for the life transition that redundancy brings is offered to the relevant employees. Discretionary enhanced redundancy terms could be offered. Financial frame and distribution policy The board ensuresapproved a new and resilient financial framework, including a coherent approach to capital allocation and a new distribution policy. In considering the proposed financial frame and distribution policy, the board had regard to: The resilience of bp’s balance sheet for the long term. Delivering sustainable value to shareholders. The need for bp to invest adequately in the energy transition and low carbon, to support the new ambition and strategy. In approving the new distribution policy the directors reflected that potential candidates are reviewedthere may be some change in 2019. Thebp’s investor base as some investors focus more on the short-term direct return that the dividend provides. After considering all the various factors, the board hasconcluded that a focus on emerging governance. Within those areasresilient dividend intended to remain fixed at 5.25 cents per ordinary share per quarter (subject to the key areas identifiedboard’s decision each quarter), with a commitment to return at least 60% of surplus cash« to shareholders through share buybacks (having reached $35 billion net debt« and evaluated against objective criteriasubject to maintaining a strong investment grade credit rating), was in the best interest of the company, its shareholders as a whole and risksother stakeholder groups, as it enabled bp to offer sustainable value with increased investment in low carbon and non-oil and gas ventures. In the context of the board’s activities during 2020, the table below sets out some examples of board decision making in 2020 and how these are being managed and of focus will be: on merit, with due regards to the benefits of diversity mitigated. The board undertook its annual review of of thought, gender, social and ethnic backgrounds Strategy: the board will consider and help cyber security risk in particular in December 2019. and cognitive and personal strengths, through a establish the strategy of BP alongside the Each year the board assesses the effectiveness of formal and rigorous procedure. BP operated board new CEO and leadership team to achieve the group’s system of internal control and risk and senior executive succession planning across the purpose, ambition and aims set out on management as part of the review and sign off of the three horizons. 12 February 2020, see page 6. In doing so, BPdirectors have performed their duty under Section 172.
84 bp Annual Report and Form 20-F to satisfy itself that the board will ensure that every member of 1. Contingency planning is constantly at the forefront the report, taken as a whole, is fair, balanced and the board has a deep understanding of the as mitigation against key person risk in cases of understandable, and provides the information board’s role in determining BP’s capital sudden and unforeseen departures. necessary for shareholders to assess the company’s allocation process and enabling effective position, performance, business model and strategy. 2. Medium-term planning relates to the orderly decision making. replacement of board and committee members and Further information on BP’s system of risk Performance: the board will continue to senior executives as they retire or change roles. management is outlined in How we manage risk on perform an important monitoring role, making page 68. 3. Finally, long-term planning seeks to equip BP with sure the CEO and the leadership team are held the skills required now and in the future as we to account against the 2020 Annual Plan to implement the long-term strategy. satisfy itself that BP is performing while transforming. The board employs executive search firms when it concludes that this is an effective way of finding People: the board will focus on reviewing suitable candidates. Bernard Looney’s appointment the composition, skills, experience and as chief executive officer (CEO) resulted from a diversity of the board and executive review of both internal and external candidates. The management, as well as the process for nomination andCorporate governance committee engaged with executive succession planning talent external headhunters to source external candidates management and development. It will ensure for this purpose of the CEO succession and in that workforce policies and practices are support of the overall process. consistent with the company’s values and the manner in which BP invests and rewards its • Pamela Daley was appointed to the remuneration workforce is designed and implemented in a committee on 30 January 2019. way that supports the company’s long-term • Nils Andersen was appointed to the nomination sustainable success. and governance and remuneration committees upon becoming the chair of the safety, Governance: as outlined on page 83,the environment and security assurance committee on board is developing a new corporate 8 April 2019. Subsequently Nils stepped down as governance framework. This framework will chair of the safety, environment and security reinforce the effectiveness of the internal assurance committee on 13 November 2019 control framework and be more closely aligned following the announcement of his appointment as with BP’s new purpose and ambition. chairman of Unilever. He was succeeded by Melody Meyer as chair of the SESAC on the same day. He resigned from the board and all other committees on 18 March 2020. • Alan Boeckmann and Admiral Frank Bowman stood down as directors and from all committees following the AGM on 21 May 2019. • Bob Dudley retired as group chief executive and a director on 4 February 2020. Bernard Looney succeeded him as chief executive officer on 5 February 2020. • Brian Gilvary announced his retirement in January 2020. He will be succeeded by Murray Auchincloss on 1 July 2020. BP Annual Report and Form 20-F 2019 85

Board and committee attendance Nomination and Audit Remuneration Geopolitical governance Chairman’s Non-executive director Board committee SESAC committee committee committee committee Helge Lund 9 (9) 6 (6) 7 (7) Nils Andersen* 8 (9) 6 (6) 4 (6) 3 (4) 6 (7) Alan Boeckmann 3 (3) 2 (2) 3 (3) 2 (2) 2 (2) Admiral Frank Bowman 3 (3) 2 (2) 2 (2) 2 (2) Dame Alison Carnwath 9 (9) 8 (8) 7 (7) Pamela Daley 9 (9) 7 (8) 8 (8) 6 (7) Sir Ian Davis 9 (9) 8 (9) 4 (4) 6 (6) 7 (7) Professor Dame Ann Dowling 9 (9) 6 (6) 6 (7) Melody Meyer 9 (9) 6 (6) 4 (4) 7 (7) Brendan Nelson 9 (9) 8 (8) 9 (9) 6 (6) 7 (7) Paula Rosput Reynolds 9 (9) 8 (8) 9 (9) 6 (6) 7 (7) Sir John Sawers 9 (9) 6 (6) 4 (4) 6 (6) 7 (7) Executive directors Bob Dudley* 9 (9) Brian Gilvary 9 (9) Chairman of board/committee * Bob Dudley stepped down from the board 4 February; Nils Andersen stepped down from the board 18 March 2020 Background Non-executive director Background and experience Operational Global business People leadership excellence and risk leadership and and organizational Technology, digital Society, politics Finance, risk, Energy markets management governance transformation and innovation and geopolitics trading, etc Dame Alison Carnwath Pamela Daley Sir Ian Davis Professor Dame Ann Dowling Helge Lund Melody Meyer Brendan Nelson Paula Rosput Reynolds Sir John Sawers Diversity At the end of 2019 the board comprised five female directors (2018 5, 2017 3) representing 42% of a 12-person board (46% of an 11 person board at the time BP believes diversity and inclusion is vital to our values, the group strategy and of publication). Our senior management, as defined by the Corporate Governance the success of the company. We understand that better decisions and outcomes Code 2018, and their direct reports comprise 38% female and 18% black, Asian are achieved when we have different people, with differences of opinions from and minority ethnic (BAME) individuals. For details of BP workforce diversity and different backgrounds. inclusion, see Our people on page 47. The board looked at diversity across the We recognize the importance of diversity, whether that be gender, social or group as part of its annual review of HR, capability and talent management. ethnic backgrounds, personal identities, age, religion, physical abilities and more. BP continues to take action to address the broader issue of diversity within These all promote diversity of thought and reduce the risk of groupthink. This the group. approach is followed by the board, senior executives and their direct reports and throughout the BP group.continued Independence We are committed to attracting the best talent to BP and feel an inclusive and Non-executive directors (NEDs) are expected to beexercise independent in characterjudgement and respectful work environment, where people are valued as individuals, is key. judgement andto be free from any business or other relationship that could materially When reviewing the composition of the board, the nomination and governance interfere with exercising that judgement. Itit. This independence is crucial in bringing constructive challenge to the board’s view that all BP NEDs committee reviews not onlyCEO and the skillsleadership team at board meetings, while providing support and experience of existing board members, are independent. but also their backgroundguidance to promote meaningful discussion and, diversity. Equally, when seeking to identify candidates to join the board, the committee gives consideration to merits ofultimately, informed and effective decision making. The board is satisfied that there is no compromise toregularly reviews the independence of its NEDs, as advised by the company secretary, and diversity, including gender, in helpingtakes action to bring greater balance to the board’s nothing to give rise toidentify and manage conflicts of interest for,interests, including those directors who serve together discussion and debates on strategy and associated matters. as directors on other company’s boardsthat may arise from significant shareholdings. This process helps to ensure that the influence of third parties does not compromise or who hold other external appointments.override independent judgement. Directors are required to provide the board with sufficient information to allow the board to evaluate Diversity is considered as an integral part of succession planning. Executive gender their independence prior to and following their appointment. As a consequence of regular reviews throughout the year, the board keepshas satisfied itself that there were no matters giving rise to any conflict of interests or which compromised the other interestsindependence of the NEDs. It has therefore concluded that all bp NEDs under and ethnicity were taken into consideration as part ofare independent. Professor Dame Ann Dowling continues to serve on the board’s wider executive review and regularly reviews the conflicts of interest register. succession review in 2019, while diversity of thought, deriving from a robust combination of gender, social or ethnic backgrounds, was a prominent factor in the Sir Ian Davis and Brendan Nelson are proposed for re-electionboard notwithstanding selection process, ensuring that BPshe has a diverse executive pipeline. that they have both served beyond nine years as non-executive directors. 86 BP Annual Report and Form 20-F 2019

Corporate governancea NED. Following careful consideration, the board believes that both Sir Ian and Brendan Learning, development and inductions continueAnn continues to provide constructive challenge and robust scrutiny of matters that The board held a number of developmental briefing sessions during the year, in which come before the board and the committeescommittee on which they serve. Neither director field expertsshe serves. She has only served with the current executive directors for a range of academic and practical knowledge were invited to provide has served simultaneously with an executive director for over nine yearsyear and the bespoke training sessions, updating them on latest intelligence in their particular area. overall average tenure of the board is similar to that ofbelow the average FTSE 100 This develops and optimizes the skill set within the board on evolving technical topics directors’ tenure.average. In addition, in 2018 the board undertook significant refreshment of its and aids conversation around strategic planning. composition with a number of new non-executives and a new chairman. Since assuming the chairmanship of the board at the beginning of the year, Helge Lund The board continued to build its knowledge of the BP business through briefings has led the process to identify and, in October 2019, to announce the and site visits as part of its learning programme, see examples on page 89. appointment of a new group CEO. This was supplemented by a process to identify and, in January 2020, announce the appointment of a new group CFO. No new directors were appointed during 2019. In October 2019, BP announced that Sir Ian and Brendan will play crucial roles in the transition period as these new Bob Dudley would be retiring in 2020, succeeded by Bernard Looney. Bernard’s appointments come into effect, so that BP’s culture and values are not adversely functional and operational knowledge of BP meant that an in-depth induction impacted and that the integrity of its financial reporting is maintained. After programme was not necessary. Nonetheless, Bernard attended a number of town careful consideration,composition. Accordingly, the board is satisfied that Sir Ian and Brendan continue halls with Helge Lund in 2019 to engage with BP people.Ann continues to demonstrate the qualities of independence in carrying out theirher duties. Board evaluation Appointment and time commitment Each year, BP completes a review of the board, its committees and of the The chairman, senior independent director and other NEDs each have letters of appointment.appointment and do not serve, nor are they employed, in any executive capacity. There is no fixed term limit individual directors. It is generally recommended that such reviews are externally on a director’s service, as BPdirector’s service; however, in line with good governance practice, bp proposes all directors for annual re-election by led once every three years. Having undertaken an externally facilitated review in shareholders in line with best governance practice. 2018,shareholders. Unlike the 2019 evaluation was facilitated by the incoming company secretary. The process involved interviews with each member of the board based around a The chairman’schairman’s letter of appointment, sets out the time commitment expected of number of themes, including strategy formulation and portfolio development, the him. The NEDs’NEDs’ letters of appointment do not set out a fixed time commitment. role of the new chairman and boardroom dynamics, the evolution of BP’s purpose The time required of directors fluctuates depending on the demands of BP and wider stakeholder engagement and the processes in place for managing business and other events. TheyNEDs are expected to allocate appropriate time to BP succession across the organization. Positive feedback was receivedeffectively discharge their duties. The time required of NEDs fluctuates depending on the newdemands of bp business and other events. The COVID-19 pandemic, as well as the oversight by the board of the energy transition and associated workload, required the NEDs to performspend considerably more time fulfilling their duties effectivelyresponsibilities towards bp during 2020, than in previous years. This included NEDs dedicating additional time through regular calls with the leadership team to remain informed and make themselves available for all regular chairman’s stylehelp guide the executive through unprecedented times. The NEDs’ external time commitments are regularly reviewed, ensuring that, even in the exceptional circumstances of a global pandemic, the NEDs are able to allocate appropriate time to bp. The review process is managed by the company secretary, considering NEDs’ outside appointments and the benefits his inclusive leadership approach had brought tocommitments, including relevant factors such as complexity of company and ad hoc meetings.industry, in particular highly regulated sectors, and issues impacting these other companies. The board believeshas concluded that, notwithstanding the NEDs’NEDs’ other the board during the year. The outputs of this review highlighted three areas of appointments, they haveare each able to dedicate sufficient time to fulfil their BPbp duties. future focus and attention: Executive directors are normally permitted to take up one board appointment at • Reviewing the composition, skills, experience and diversity of the board and an external listed company, subject to the agreement of the chairman and after the process for executive succession planning talent management and consultation with the company secretary. In FebruaryBernard Looney and Murray Auchincloss each hold one non-executive directorship, shown on page 74. Prior to retiring from the board in June 2020, Brian Gilvary was development. appointedundertook a role as a non-executive directorNED of Barclays PLC. An announcementPLC, in • Ensuring every member of the board has a deep understanding of the board’s respect of Brian’s plansaddition to retire as CFO of BP was made in January 2020. He willhis NED role in determining BP’s capital allocation process and enabling effective stay in the role until June 2020 to work with his successor, Murray Auchincloss, decision making. in order to ensure an orderly transition. Given these circumstances and after • Re-shaping the BP corporate governance framework and how this it shouldL’Air Liquide S.A.. Following consideration, by the chairman and company secretary, it was concluded that reinforce the effectiveness of the internal control framework and be more Brian’s role at Barclays PLC wasBrian’s two external appointments were unlikely to be detrimental to his ability to perform his duties as closely aligned with BP’s new purpose and ambition. outgoing CFO. Fees receivedDiversity At a time of significant change across the sector, and with bp transitioning to become an Integrated Energy Company, diversity of thought is as important as ever. Our purpose, to reimagine energy for an external appointment maypeople and our planet, can only be retainedachieved through collaboration, innovation and constructive challenge that derives from having a diverse and inclusive workplace. The board understands and advocates that better decisions and outcomes are achieved when different people, with differences of opinions, from different backgrounds, come together with a common ambition. We recognize that diversity can take many forms, whether it be gender, social or ethnic backgrounds, personal identities, age, religion, physical abilities and more. All of which promote diversity of thought and reduce the risk of group think. The board has, and continues to have, regard to all these forms of diversity in respect of its processes including both its appointments and succession plans. The board and leadership team believe in leading by the executive directorexample and are reported inpleased to have met the Directors’ remuneration report (see A new corporate governance framework is in development, supported byHampton-Alexander and Parker review targets for 2021. At the page 100). Neitherend of 2020 the chairman nor the senior independent director are outputs from this year’s board review process, with the aim of ensuring that this employed as an executivecomprised five female directors, representing 45% of the group. new framework is in place byboard (2019 42%, 2018 35%). Karen Richardson and Johannes Teyssen joined the time thatboard on 1 January 2021. Dame Alison Carnwath stepped down from the new organizational structure and reporting arrangements take effect.board on 14 January 2021. As previously announced, Brendan Nelson will be stepping down from the board at the conclusion of the 2021 AGM. The board also considers all NED external appointments and considersis pleased that Tushar Morzaria, a Ugandan-born British national, joined in September 2020. He will succeed Brendan Nelson as audit committee chair following the impact those requiring significant commitment might have on2021 AGM. Our senior management, as defined by the director’s ability to UK Corporate Governance Code compliance dedicate sufficient capacity in times of increased demand. In November 2019, the board acknowledged the appointment of Nils Andersen as Chairman of BP complied throughout 2019 with the principles2018, and provisions of the 2018 UK Unilever NV/PLCtheir direct reports comprise 43% women (2019 38%) and accepted his resignation25% Black, Asian and minority ethnic (BAME) individuals (2019 18%). While bp continues to benefit from the BPwide array of perspective and vision in decision-making processes and the company culture continues to strengthen through mitigation of group think, bp will continue to strive for increased diversity across its workforce, leadership team and board. Nils remainedFor more information on our workforce diversity and inclusion see page 57.
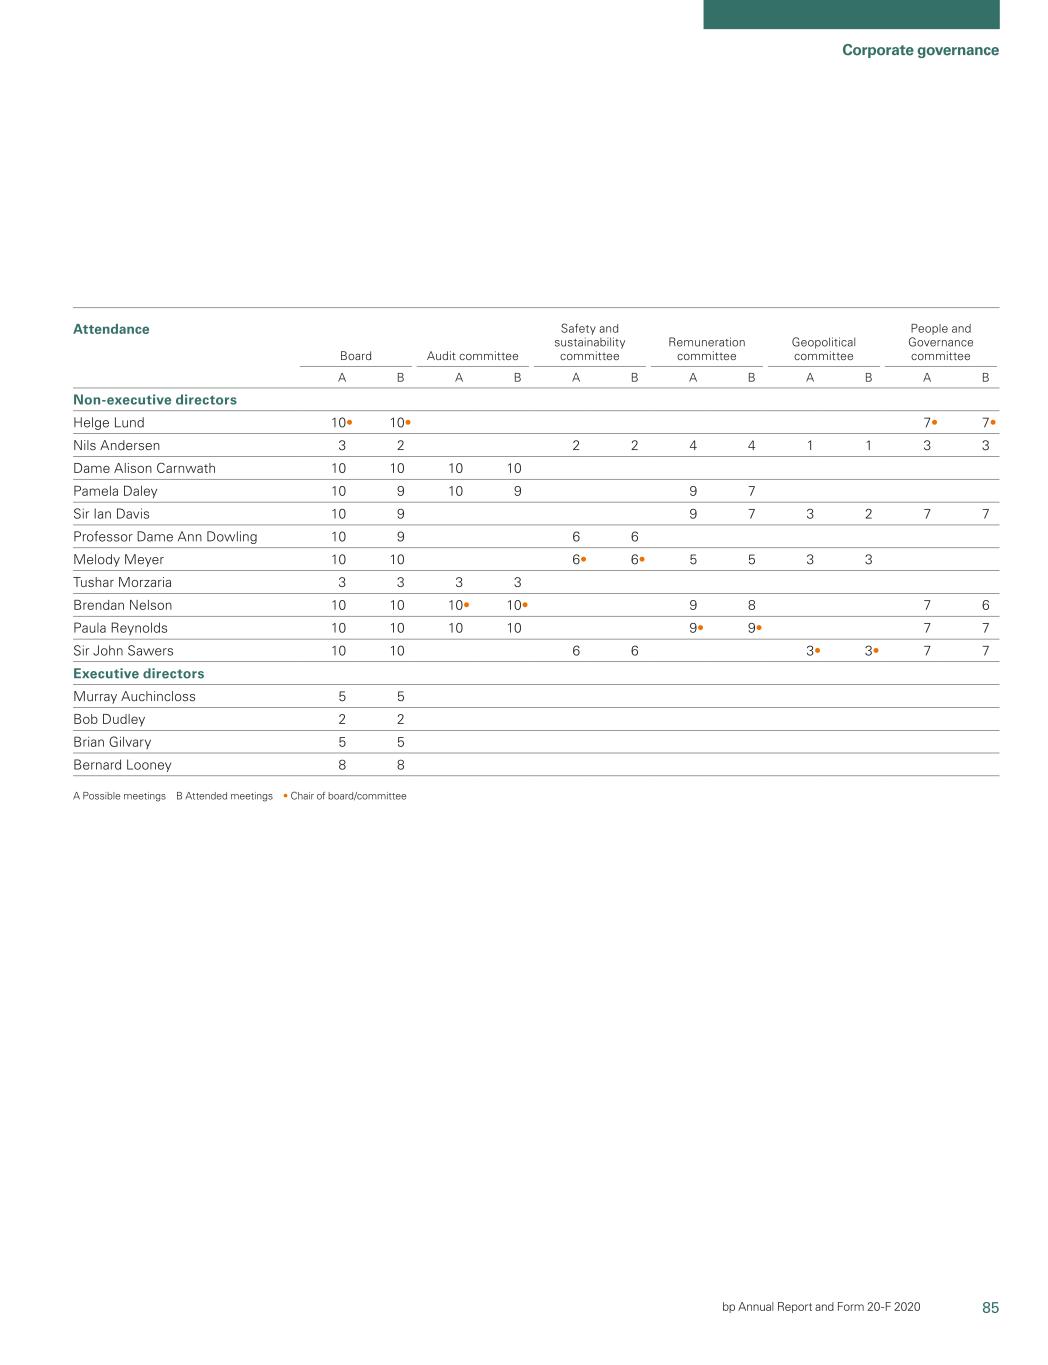
85 Corporate Governance Code except in the following aspects: as a non-executive director until March 2020 to support Melody Meyer who took Provision 33 over as chair of the SESAC in November 2019. The remuneration of the chairman is not set by the remuneration committee. Instead, the chairman’s remuneration is reviewed by the remuneration committee which makes a recommendation to the board as a whole for final approval, within the limits set by shareholders. This wider process enables all board members to discuss and approve the chairman’s remuneration, rather than solely the members of the remuneration committee. Provision 38 The pension arrangements for Bob Dudley and Brian Gilvary reflect the historical retirement benefits available to employees that joined BP at similar times. We recognize that the contribution rates under these arrangements are higher than the majority of the current workforce and as such the pension contributions for the new executive directors, Bernard Looney and Murray Auchincloss, have been aligned with those available to the majority of the workforce. A copy of the 2018 UK Corporate Governance Code is available at frc.org.uk. BPgovernance bp Annual Report and Form 20-F 2019 87
2020 Attendance Board Audit committee Safety and sustainability committee Remuneration committee Geopolitical committee People and Governance committee A B A B A B A B A B A B Non-executive directors Helge Lund 10• 10• 7• 7• Nils Andersen 3 2 2 2 4 4 1 1 3 3 Dame Alison Carnwath 10 10 10 10 Pamela Daley 10 9 10 9 9 7 Sir Ian Davis 10 9 9 7 3 2 7 7 Professor Dame Ann Dowling 10 9 6 6 Melody Meyer 10 10 6• 6• 5 5 3 3 Tushar Morzaria 3 3 3 3 Brendan Nelson 10 10 10• 10• 9 8 7 6 Paula Reynolds 10 10 10 10 9• 9• 7 7 Sir John Sawers 10 10 6 6 3• 3• 7 7 Executive directors Murray Auchincloss 5 5 Bob Dudley 2 2 Brian Gilvary 5 5 Bernard Looney 8 8 A Possible meetings B Attended meetings • Chair of board/committee
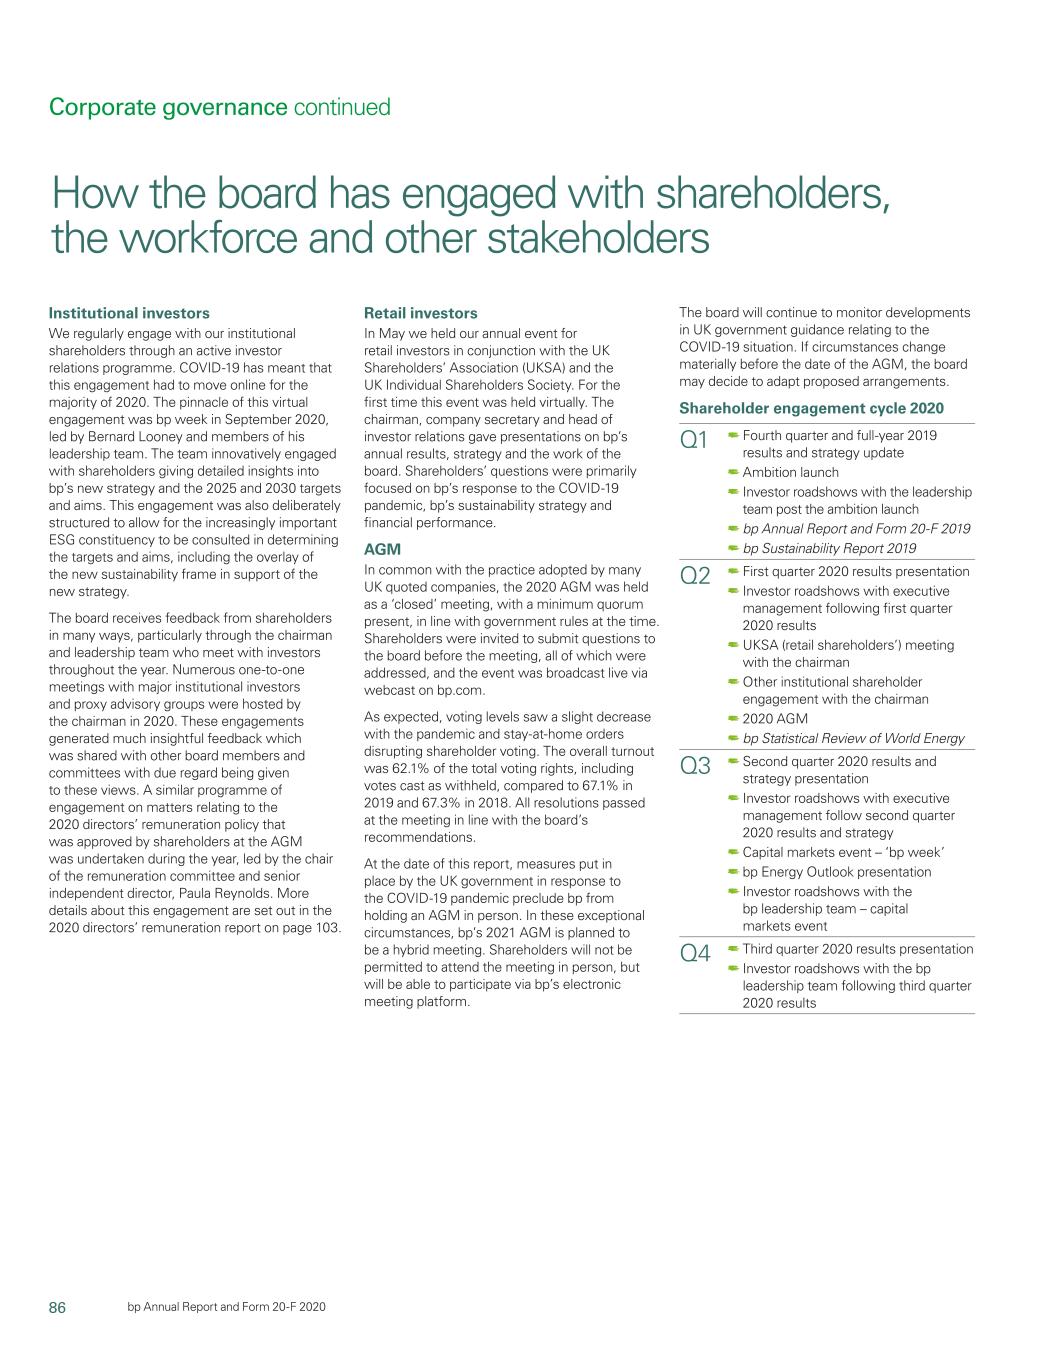
86 bp Annual Report and Form 20-F 2020 Corporate governance continued How the board has engaged with shareholders, the workforce and other stakeholders Retail investors In May we held our annual event for retail investors in conjunction with the UK Shareholders’ Association (UKSA) and the UK Individual Shareholders Society. For the first time this event was held virtually. The chairman, company secretary and head of investor relations gave presentations on bp’s annual results, strategy and the work of the board. Shareholders’ questions were primarily focused on bp’s response to the COVID-19 pandemic, bp’s sustainability strategy and financial performance. AGM In 2019common with the practice adopted by many UK quoted companies, the 2020 AGM was held as a ‘closed’ meeting, with a minimum quorum present, in Aberdeen forline with government rules at the first time, which enabledtime. Shareholders were invited to submit questions to the board before the meeting, all of which were addressed, and the event was broadcast live via webcast on bp.com. As expected, voting levels saw a slight decrease with the pandemic and stay-at-home orders disrupting shareholder voting. The overall turnout was 62.1% of the total voting rights, including votes cast as withheld, compared to 67.1% in 2019 and 67.3% in 2018. All resolutions passed at the meeting in line with the board’s recommendations. At the date of this report, measures put in place by the UK government in response to the COVID-19 pandemic preclude bp from holding an AGM in person. In these exceptional circumstances, bp’s 2021 AGM is planned to be a hybrid meeting. Shareholders will not be permitted to attend the meeting in person, but will be able to participate via bp’s electronic meeting platform. Institutional investors We regularly engage with shareholders who might not have had the Institutional investors opportunity to attend a meeting before. There were two shareholder The company engages with itsour institutional shareholders through its requisitioned resolutions put to the meeting in 2019.an active investor relations programme. COVID-19 has meant that this engagement had to move online for the majority of 2020. The pinnacle of this virtual engagement was bp week in September 2020, led by Bernard Looney and members of his leadership team. The team innovatively engaged with shareholders giving detailed insights into bp’s new strategy and the 2025 and 2030 targets and aims. This engagement was also deliberately structured to allow for the increasingly important ESG constituency to be consulted in determining the targets and aims, including the overlay of the new sustainability frame in support of the new strategy. The board receives feedback on shareholder viewsfrom shareholders in many ways, particularly through the chairman and All resolutions supportedleadership team who meet with investors throughout the year. Numerous one-to-one meetings with major institutional investors and proxy advisory groups were hosted by the chairman in 2020. These engagements generated much insightful feedback which was shared with other board includingmembers and committees with due regard being given to these views. A similar programme of engagement on matters relating to the shareholder senior management who meet regularly with2020 directors’ remuneration policy that was approved by shareholders throughout resolution from the Climate Action 100+ group, passed at the meeting,AGM was undertaken during the year, as well as through the results of an independent investor study see page 6. The shareholder resolution from Follow This, which was not and report. supportedled by the board, did not pass. In September 2019 the chair of the remuneration committee hosted an Each year the board receives a report after the AGM giving a breakdown event for large investors on considerations for the new remuneration of the votes and investor feedback on its voting decisions to inform it on policy which is to be tabled atsenior independent director, Paula Reynolds. More details about this engagement are set out in the 2020 AGM in May (see Remuneration any issues arising. committeedirectors’ remuneration report on page 101).103. The chairman also held one-to-one meetings with major institutional investors duringboard will continue to monitor developments in UK government guidance relating to the year, collecting Workforce their viewsCOVID-19 situation. If circumstances change materially before the date of the AGM, the board may decide to adapt proposed arrangements. Shareholder engagement cycle 2020 Q1 Fourth quarter and sharing thesefull-year 2019 results and strategy update Ambition launch Investor roadshows with the other board membersleadership team post the ambition launch bp Annual Report and Form 20-F 2019 bp Sustainability Report 2019 Q2 First quarter 2020 results presentation Investor roadshows with executive management following first quarter 2020 results UKSA (retail shareholders’) meeting with the At BP wechairman Other institutional shareholder engagement with the chairman 2020 AGM bp Statistical Review of World Energy Q3 Second quarter 2020 results and strategy presentation Investor roadshows with executive management follow second quarter 2020 results and strategy Capital markets event – ‘bp week’ bp Energy Outlook presentation Investor roadshows with the bp leadership team – capital markets event Q4 Third quarter 2020 results presentation Investor roadshows with the bp leadership team following third quarter 2020 results

87 Corporate governance bp Annual Report and Form 20-F 2020 Workforce 2020 engagement We believe a diverse andan engaged workforce is critical to us remuneration committee. successfully delivering our group strategy. BP strives to create an open During the course of the year, senior management met regularly with culture where dialogue between the board, senior management and institutional investors through road shows, group and one-to-one theWhen we talk about bp’s workforce, which includeswe include a wide range of employees, contractors, meetings, events for socially responsible investors (SRIs), meetings agency and remote workers across all of our geographical locations. The board is responsible for overseeing and monitoring bp’s culture and its geographical locations, is with various investorsvalues. This extends to discuss environment, socialputting in place mechanisms allowing for workforce views to be reflected in board discussion and governance encouraged and expected. ‘Respect’ and ‘courage’decision making, complementing existing mechanisms that are two of our matters, and oil and gas sector conferences. corporate values that underpin this and are embedded in our performance management system. Employees areestablished by the leadership team. Such measures include employees being informed of In May 2019, the chairman and board committee chairs held their information on matters of concern to them as employees through BP’s annual investor event. This meeting enabled BP’s largest shareholdersbp’s intranet and local sites, social media channels, town halls, site visits to hear about the work of the board and its committees and for and webinars including topics such as quarterly results, strategy, the investors to share their views directly with non-executive directors. low carbon transition and diversity. We also have a number of employee-led See bp.com/investors for investor and strategy presentations, including the forums and business resource groups (BRGs) and aim to build constructive group’s financial results and information on the work of the board and its relationships with labour unions formally representing some employees. committees. Employees are consulted on a regular basis through regular team and Shareholder engagement cycle 2019 one-to-one meetings and through our annual ‘Pulse’‘Pulse’ survey. These initiatives are applied where practicable. • Fourth quarterThe board believes that the approaches and full year 2018 results and strategy update Q1 Our annual employee ‘Pulse’ survey results for overallmechanisms described under Site visits, below, enabled effective engagement • Investor roadshows with executive management – fourth long-term cultural metrics and listening and involvement have shown quarter and full year 2018 results a steady and sustained improvement over this period, see page 47. • BP Energy Outlook presentation • BP Annual Report 2018 launch With such a diverse and globally distributed workforce, we believe • BP Sustainability Report 2018 launch ongoing dialogue through multiple channels is the best way for the Q2 • Chairman and board committee chairs meeting with investors board and management to engage with our people and listen to what • UKSA (retail shareholders’) meetingopportunities with the chairman they have to say.bp workforce. The board is firmlysatisfied that during 2020, these were effective alternatives to the proposed workforce engagement methods set out in Provision 5 of the opinionUK Corporate Governance Code (the Code). Future of workforce engagement As part of its broader review of bp’s corporate governance framework, the board discussed whether its current approach to workforce engagement continues to be the most effective mechanism to inform its discussions and the decisions that face-to-face • First quarter 2019 results presentation interaction with our peopleit takes. Building on the experience that we have had, and the innovative approaches that were taken to workforce engagement through 2020, the board has sought to create a more rigorous framework so that there is clear channel through which the best wayinsights emerging from this engagement process will be consolidated and considered in board discussions and decision making. The board also considered the significant changes to get direct feedback and • Annual general meeting an understanding of the important issues of the workforce as well as • BP Statistical Review of World Energy launch deepen the board’s operational understanding. Only by visitingfollowing reinvent bp and Q3 • Second quarter 2019 results presentation meeting with employees frombp’s wide geographic spread and size. Taking all aspects of the business canthese factors into account, the board • Investor roadshows with executive management following fully assessconcluded that for 2021 workforce engagement is best overseen by the culturenewly constituted people and tonegovernance committee. A regular programme of BP. The board heldengagement has been developed. Some sessions have a specific engagement purpose while others will simply be an open opportunity to hear views, interests, ideas and concerns. It is intended that a number of these sessions will have no line managers to allow for an unconstrained exchange of views. Engagement locations will be varied across our global operations. Alongside this programme, the ‘Pulse’ surveys, bp ‘Keeping Connected’ sessions, site 2Q results visits in 2019 to a number of different locations, including Busan, Kuala Q4 • Third quarter 2019 results presentation Lumpur, Singapore, Aberdeen and Denver. A number of non-executive • Investor roadshows with executive management following directors also took opportunities to engage directly with local workforce 3Q results at various BP offices around the globe. As part of Helge Lund’s first year as chairman, he conducted town hall meetings with the workforce in Washington DC, Baku, Rotterdam, Beijing, Houston and London. Retail investors BP held an event for retail investors in conjunction with the UK The board and its committees are committed to meeting with a Shareholders’ Association (UKSA) in 2019. The chairman and a wide range of employees across the entire workforce and at times representative from investor relations gave presentations on BP’s exclude senior management from meetings to get the unfettered annual results, strategy(even if virtual) and the workchairman’s programme of the board. Shareholders’ opinions of their teams. An example of this was the SESAC’s visit questions were focused on BP’s activities and performance. to a new LNG vessel off the coast of South Korea immediately prior to its maiden voyage. This was the first shipping visit of its kind, AGM during which members of the SESAC held private informal meetings Voting levels were relatively consistentattendance at 67.1% (of issued share capital, with the ship’s crew, away from senior officers. The crew highlighted including votes cast as withheld) in 2019, compared to 67.3% in 2018. a couple of potential improvements, the SESAC members agreed The lower voting level of 50.8% in 2017 was due to the negative impact and, as a consequence, certain improvements were undertaken by of stock lending. shipping leadership. 88 BP Annual Report and Form 20-F 2019

Corporate governance As an example of how engagement has directly contributed to shaping scheme to more employees across the group. The boardselected small team sessions will dedicate policy, in 2019 we launched a new global commitment to minimum time to specifically review the outputs from the various channels of parental leave for new parents. This policy was established through workforce engagement at board sessions. engagement with our employee-led business resource groups andcontinue. The board believes the existing approaches and mechanisms described employee forums, including the working parents’ forum. above enable comprehensive two-way engagement opportunities BP invests in its workforce through a number of employee share with BP’sbp’s workforce, and as such, is satisfied that these are effective ownership schemes and plans. For example, we operate ‘ShareMatch’ alternatives to the proposed workforce engagement methods set out in more than 50 countries. The plan matches BP shares purchased by in Provision 5 of the Code. GivenLooking beyond 2021 the current periodboard will continue to assess the effectiveness of transitionits engagement with the workforce and how ultimately this informs the decisions that it takes, including the options provided for in the Code, for example appointing a director from the workforce. CEO ‘Keeping Connected’ webcasts During 2020 restrictions associated with COVID-19 disrupted planned opportunities for the board to engage with the bp workforce in person. As a result, most engagements were conducted virtually. Virtual engagements Our CEO Bernard Looney hosted a series of webcasts featuring guests from across the organization to discuss a range of topics throughout the year, including bp’s new purpose, safety, mental health, and reinventing bp. Helge Lund, chairman of the board, joined the CEO as a speaker on two of these webcasts and non-executive directors were also invited to listen in. >12,500 average viewers per webcast Business resource groups and focus groups Non-executive directors engaged virtually with employees in BRGs and focus groups throughout the year, including virtual events organized by the Women in Wells, Future Talent and One Young World alumni forums. Through these engagements the directors heard directly from employees on a range of topics, including bp’s new purpose and strategy, employee sentiment – particularly during the reorganization of bp – the impact of COVID-19 on operations and wellbeing, diversity and career progression. Virtual site visits The audit committee conducted a virtual visit and tour of bp’s trading floors in London and Houston and a majority of our non-executive directors attended a virtual visit of bpx energy’s Permian assets, led by the safety, environment and security assurance committee. During these visits, directors heard directly from the workforce regarding their perceptions of bp’s new strategy and how these businesses planned to implement it, as well as deepening their understanding of businesses and functions within bp.

88 bp Annual Report and Form 20-F 2020 Corporate governance continued We completely redesigned the bp corporate governance framework in 2020, to more closely align with bp’s new purpose – reimagining energy for people and our employees. Weplanet – as well as our new strategy. The framework defines the board’s role, to promote the long-term sustainable success of the company, generating value for its shareholders while having regard to its other stakeholders, the impact of its operations on the communities within which it operates and the environment. The review had three main strands: 1. The role and purpose of the board The bp board believes that in order for governance to be effective it needs to have a regular review process across purpose, strategy, culture and values, while maintaining oversight of performance. Clearly defined terms of reference for the board were established together with a roadmap of activity that reflects those issues the board consider most important. The board terms of reference identify certain matters that are considered to be of such materiality at a group level that they are reserved for approval by the whole board and cannot be delegated. The matters reserved include, among others, certain investments, entry into new countries, changes to the company’s capital structure, distributions and bp’s code of conduct. The full list is available on bp.com/governance. Governance framework governance and performance oversight Board Purpose Considers bp’s purpose, which underpins its decision making. Monitors whether bp’s strategy, values and culture remain in line with that purpose. Strategy Receives regular updates to test that the strategy and strategic direction established by the board continue to be the right approach for the long-term sustainable success of bp in line with its purpose. Approves the annual plan and regularly monitors that it is aligned with the approved strategy, including reviewing business development, investment effectiveness and capita allocation. Conducts deep dives across each of the business groups and key strategic areas. Receives regular updates on progress towards the aims and objectives in the sustainability frame. Culture Reviews the ambition and aims of the people plan and in so doing assesses and monitors any impact on culture so as to satisfy itself that bp’s purpose, strategy and values continue to be aligned with its culture. Through the people and governance committee, reviews work on bp’s ways of working (including integration, agility, wellbeing, workplace, inclusion and digital). Values The board monitors bp’s values, ensuring that they are appropriate as the leadership team focuses on the execution of the new strategy.
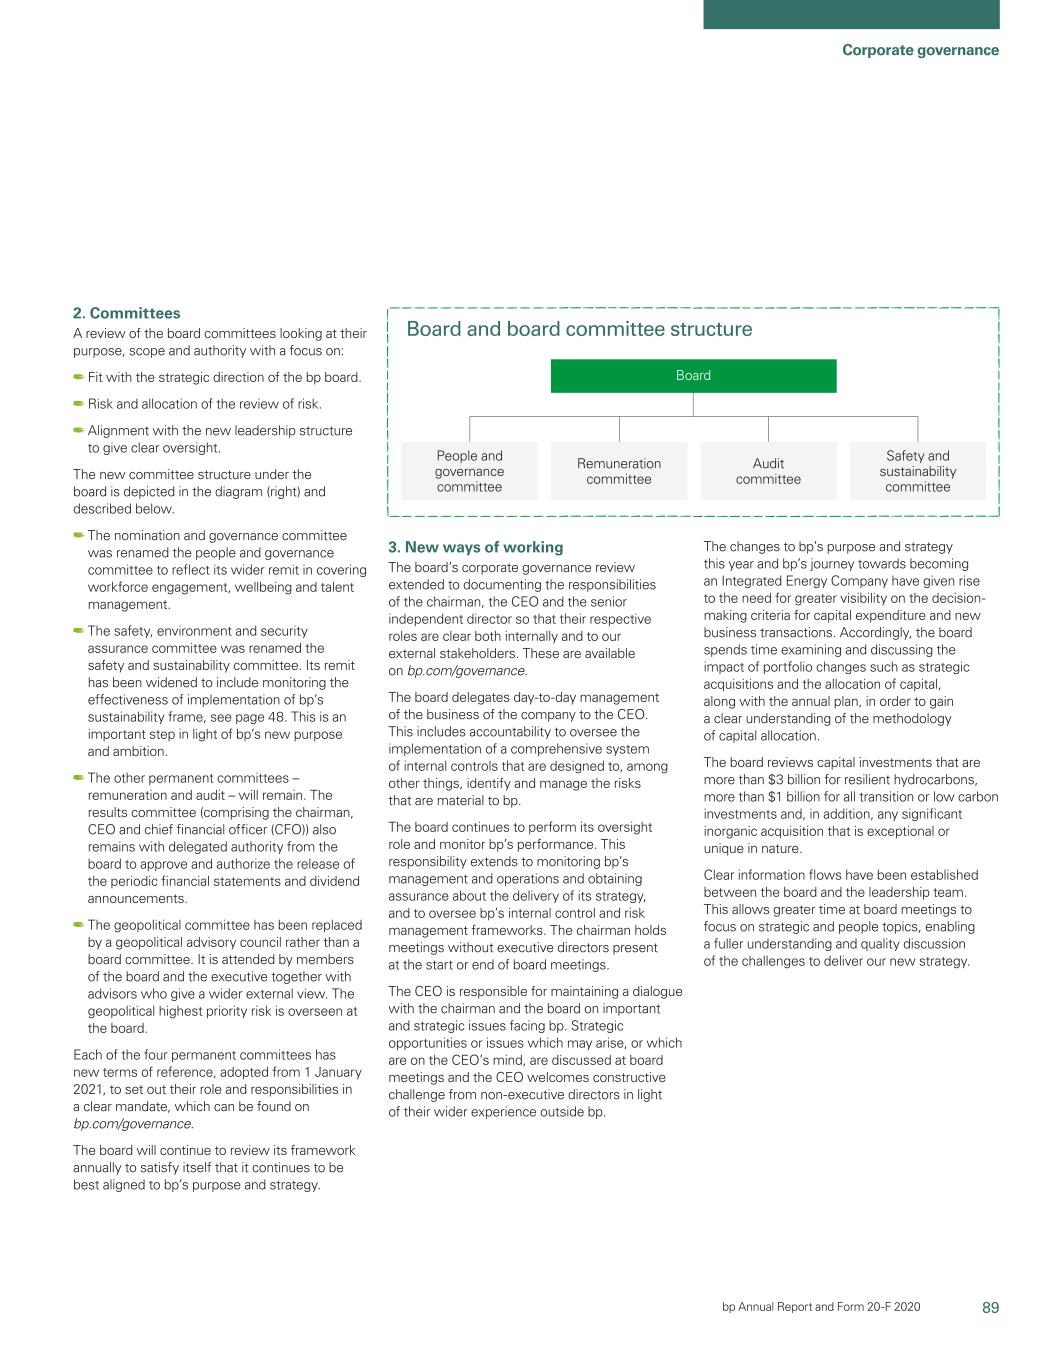
89 Corporate governance bp Annual Report and Form 20-F 2020 2. Committees A review of the board committees looking at their purpose, scope and authority with a focus on: Fit with the strategic direction of the bp board. Risk and allocation of the review of risk. Alignment with the new leadership structure to give clear oversight. The new committee structure under the board is depicted in the diagram (right) and described below. The nomination and governance committee was renamed the people and governance committee to reflect its wider remit in covering workforce engagement, wellbeing and talent management. The safety, environment and security assurance committee was renamed the safety and sustainability committee. Its remit has been widened to include monitoring the effectiveness of implementation of bp’s sustainability frame, see page 48. This is an important step in light of bp’s new purpose and ambition. The other permanent committees – remuneration and audit – will remain. The results committee (comprising the chairman, CEO and chief financial officer (CFO)) also operateremains with delegated authority from the board to approve and authorize the release of the periodic financial statements and dividend announcements. The geopolitical committee has been replaced by a group-wide discretionary share plan, BP,geopolitical advisory council rather than a board committee. It is attended by members of the board and the executive together with advisors who give a wider external view. The geopolitical highest priority risk is overseen at the board. Each of the four permanent committees has new terms of reference, adopted from 1 January 2021, to set out their role and responsibilities in a clear mandate, which can be found on bp.com/governance. The board will continue to review its engagement mechanismsframework annually to which rewards employeessatisfy itself that it continues to be best aligned to bp’s purpose and strategy. 3. New ways of working The board’s corporate governance review extended to documenting the responsibilities of the chairman, the CEO and the senior independent director so that their respective roles are clear both internally and to our external stakeholders. These are available on bp.com/governance. The board delegates day-to-day management of the business of the company to the CEO. This includes accountability to oversee the implementation of a comprehensive system of internal controls that are designed to, among other things, identify and manage the risks that are material to bp. The board continues to perform its oversight role and monitor bp’s performance. This responsibility extends to monitoring bp’s management and operations and obtaining assurance about the delivery of its strategy, and to oversee bp’s internal control and risk management frameworks. The chairman holds meetings without executive directors present at the start or end of board meetings. The CEO is responsible for maintaining a dialogue with participation in BP’s equity at different seek new ways to strengthen existing workforce forums to ensure a levels globallythe chairman and is linked to BP performance. continuing robust relationship and collaboration. As we look to achieve our purpose, ambition and aims – engagement Other stakeholders with our global talent pool is as critical as ever. BP wants to recruit, retain and reward people from wide-ranging and diverse backgrounds For details of how the board compliedon important and strategic issues facing bp. Strategic opportunities or issues which may arise, or which are on the CEO’s mind, are discussed at board meetings and the CEO welcomes constructive challenge from non-executive directors in light of their wider experience outside bp. The changes to bp’s purpose and strategy this year and bp’s journey towards becoming an Integrated Energy Company have given rise to the need for greater visibility on the decision- making criteria for capital expenditure and new business transactions. Accordingly, the board spends time examining and discussing the impact of portfolio changes such as strategic acquisitions and the allocation of capital, along with Section 172the annual plan, in order to gain a clear understanding of the who can support us in the globalmethodology of capital allocation. The board reviews capital investments that are more than $3 billion for resilient hydrocarbons, more than $1 billion for all transition to aor low carbon energy Companies Act 2006investments and, how it further engaged with other system. We will continue to expand our existing networks of stakeholders, see page 66. communication to foster a listening culturein addition, any significant inorganic acquisition that enablesis exceptional or unique in nature. Clear information flows have been established between the board and managementthe leadership team. This allows greater time at board meetings to gain meaningful insight directly from our colleagues around the world,focus on strategic and respond accordingly. For instance, following feedback from BP’s working parents’ forum, agile workingpeople topics, enabling a fuller understanding and parental leave policies have been improved, and in response to growing demand 300 from our workforce, BP introduced a way for some employees to offset employees attended their personal carbon emissions and is working towards expanding this the town hall presented by Helge Lund and Bob Dudley. Site visits Denver The board visited BP’s Denver office in September 2019 where they hosted Aberdeen several employee events. A town hall Following the AGM in Aberdeen, the Membersquality discussion of the challenges to deliver our new strategy. Board and board had further took place, led by Helge Lund, with the board held a number of engagement engagement with the workforce at the rest of the board present to talk with activities. Helge Lundcommittee structure Board People and Bob Dyce office, observing new agile ways the workforcegovernance committee Remuneration committee Audit committee Safety and answer questions Dudley led a town hall which was of working and gaining technological over a community lunch with over 150 attended by over 300 employees at insight into new initiatives. Members employees in attendance. The board was BP’s Dyce office and streamed live to of the board also visited the Clair also introduced to emerging talent in the the offshore teams in the North Sea. Ridge platform, where they learnt region and met with senior leadership. The board hosted a business more about operations offshore. As part of the suite of events the board reception, inviting members of the They discussed the safety agenda also met with external stakeholders local community, local political and onsite, visited the drilling floor and at a business reception in the city. government officials, employees and spoke with employees directly to local businesses. better understand the culture when 150 working offshore. employees attended a community lunch with the board. South Korea The SESAC visited BP’s shipping function and spent a day at sea in Kuala Lumpur and Singapore South Korea on board a new LNG Members of the auditsustainability committee vessel. They experienced the vessel visited the global business services in a period of ‘shakedown’ ahead of in Kuala Lumpur. Touring BP’s going into service. The committee offices gave valuable insight into observed safety processes in action the workforce which has been and were able to discuss physical responsible for centralizing and and cyber security planning. standardizing key business processes Members of the SESAC met with across the organization and sea farers without management transforming processes end-to-end. present to discuss life working on The directors then visited the IST board the vessels. team in Singapore where they met “The committee members with senior leadership and the wider workforce at BP’s offices. noted strong morale.” BP

90 bp Annual Report and Form 20-F 2019 89

Nomination2020 The developmental needs of the board as a whole and for individual directors are regularly reviewed, so as to ensure that the board and individual effectiveness to board discussion and decision making are maximized. A formal and comprehensive induction is provided to all directors following their appointment. This includes meetings with management, technical briefings and site visits. Learning, development and induction Corporate governance continued Tushar Morzaria, appointed on 1 September 2020, undertook a tailored and robust induction against the challenging backdrop of COVID-19. The programme was adapted to accommodate the inability to participate in physical meetings and site visits. Digital solutions were therefore deployed to facilitate Tushar’s induction. Tushar looks forward to continuing his introduction to bp’s operations and learning more about the business and its people. The programme included meetings with a wide range of senior management within bp, the external auditor and other key advisors. A selection of these and the areas of focus are outlined below. Board induction programme I am delighted to join the bp board and to contribute my expertise in support of bp’s new strategy. Tushar Morzaria Independent non-executive director Area Provided by Key topics covered Board and governance Helge Lund, chairman Ben Mathews, group company secretary Overview of board and committee matters. Priority areas for the board. Governance framework. Corporate structure. Audit committee Brendan Nelson, chair of the audit committee Jayne Hodgson, SVP, accounting, reporting, control David Jardine, SVP internal audit Doug King, Deloitte (external audit partner) Priority areas for the committee, including committee chair succession. bp’s financial position. Financial reporting framework and quarterly results close cycle. Internal audit reports. External audit and quarterly review reports. Strategy and sustainability Giulia Chierchia, EVP strategy & sustainability bp’s new strategy and sustainability focus. Legal Eric Nitcher, EVP legal Overview of legal matters, including material litigation. Treasury Kate Thomson, SVP treasury Overview of treasury matters and liquidity risk management.
91 Corporate governance bp Annual Report and Form 20-F 2020 There is also a triennial requirement for this evaluation to be externally facilitated which will next fall due in 2021. The 2019 board evaluation highlighted three specific areas for action in 2020: Focus area Action taken Review the skills, experience and diversity of the board, and the process for executive succession planning and talent management and development. The board skills matrix was used to focus NED recruitment and we have successfully recruited three NEDs with strong experience in areas which will complement and support bp’s new strategy and provide diversity of thought. The board, through the former nomination and governance committee, heard regular updates on the selection process and criteria for the bp leadership team and the next layer of leadership with a focus on building a future succession pipeline and the skills needed to drive the execution of bp’s new strategy. Satisfy itself that every member of the board has a deeper understanding of the board’s role in determining bp’s capital allocation process and in enabling more effective decision making. The board and leadership team have developed a process for greater visibility of capital allocation at the board and evaluated the methodology of capital allocation. Capital allocation above agreed thresholds is now a matter reserved for the board. Redesign bp’s corporate governance framework, reinforcing the effectiveness of this control framework so that it is more closely aligned with bp’s new purpose and strategy. The board governance framework and ways of working were redesigned, details of which can be found on page 88. The 2020 board evaluation was an internal review. The chairman spoke with each director individually. The company secretary facilitated a theme-based review including, among other matters, portfolio management, the impact of the new board agenda, the evolution of bp’s purpose, strategy and values, stakeholder engagement and people matters. The review also looked at the composition and diversity of the board and how effectively the directors work together. In early 2021, the board held a special meeting to discuss the feedback, focusing on strategic and operational oversight, board development and maintaining a dynamic and flexible approach to board and committee agendas. An action plan for areas of focus was agreed. Following this meeting, the senior independent director led a meeting with the non-executive directors without the chairman present to appraise his performance. The directors expressed their strong support for the continued leadership shown by the chairman. Board evaluation Each year bp completes a formal and rigorous annual evaluation of the performance of the board, its committees, the chairman and individual directors.

92 bp Annual Report and Form 20-F 2020 Corporate governance continued People and governance committee The committee focused on identifying candidates who would enhance the strategic discussion in the boardroom and add to the diversity, skills and experience required as bp transitions to an IEC. Helge Lund Committee chair Chair’s introduction I am pleased to present my report as chair of the people and governance committee. During 2020, the committee reviewed the composition of the board and, with the new purpose and strategy in mind, focused on identifying candidates who would enhance the strategic discussion in the boardroom and add to the diversity, skills and experience required as bp transitions to an Integrated Energy Company. We discussed and guided the development of the new board governance framework to satisfy ourselves that bp continues to maintain the highest standards of governance and we reviewed bp’s workforce engagement mechanism options in order to make a clear recommendation to the board. As part of the governance review, the committee was renamed as the people and governance committee with effect from 1 January 2021 to reflect its wider remit in covering workforce engagement, wellbeing and talent management. Looking to 2021, the committee agenda has been restructured to cover four matters: talent and capability, diversity and inclusion, engagement and culture and governance. Under that umbrella, we will oversee workforce engagement, engage an external provider for board effectiveness and continue to look at succession, leadership, talent, diversity and culture matters. Helge Lund Committee chair Committee overview Role of the committee The people and governance committee (previously called the nomination and governance committee, until 31 December 2020) seeks to ensure an orderly succession of candidates for directors, the company secretary and senior executives and oversees corporate governance matters for the group. Key responsibilities • Identify, evaluate and recommend candidates for appointment or reappointment as directors. • Review the outside directorships/commitments of the Non-Executive Directors (NEDs). •Identify, evaluate and recommend candidates for appointment as company secretary. Review the mix of knowledge, skills, experience and diversity of the board for the orderly succession of directors. • Identify, evaluate and recommend candidates for appointment as company secretary. •Review the outside directorships/commitments of the non-executive directors (NEDs). Review developments in law, regulation and best practice relating to corporate governance and make “The committee dedicated a significant recommendations to the board on appropriate action, including on Environmental, Socialenvironmental, social and amount of time to its role in 2019 and this Governancegovernance matters. will continue as BP implements its new Membership purpose, ambition and aims.” Helge Lund Member since July 2018 and chairman since September 2018 Helge Lund Alan Boeckmann Member Committee chair (resigned April 2019) Sir Ian Davis Member Nils Andersen Member (resigned March 2020) Chairman’s introduction Brendan Nelson Member Paula Reynolds Member The committee dedicated a significant amount of time to its role in 2019, a Sir John Sawers Member year which was vitally important for BP and the future direction of the company. This will continue as BP implements its new purpose, ambition Meetings and attendance and aims. The committee met sixseven times in 2019.2020. All members attended each meeting with the exception of Brendan Nelson who missed one meeting owing to a prior commitment. Membership Helge Lund Member since July 2018 and chair since September 2018 Sir Ian Davis Member (resigned December 2020) Nils DuringAndersen Member (resigned March 2020) Brendan Nelson Member Paula Reynolds Member Sir John Sawers Member
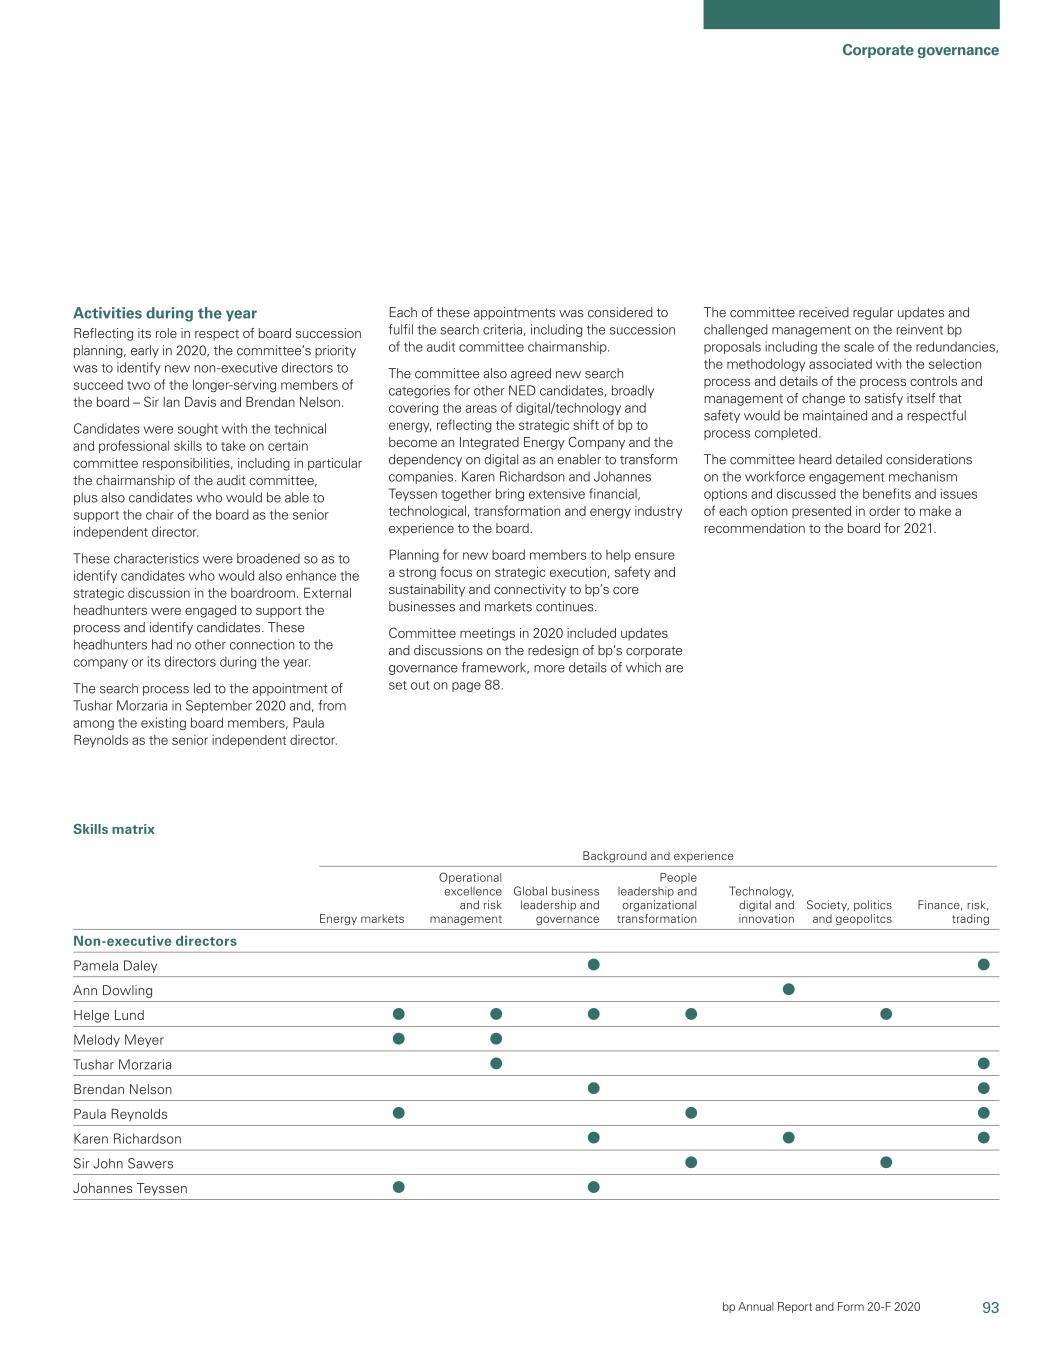
93 Corporate governance bp Annual Report and Form 20-F 2020 Activities during the year Reflecting its role in respect of board succession planning, early in 2020, the committee led the search for a’s priority was to identify new CEOnon-executive directors to succeed Andersentwo of the longer-serving members of the board – Sir Ian Davis and Brendan Nelson. Candidates were sought with the technical and professional skills to take on certain committee responsibilities, including in particular the chairmanship of the audit committee, plus also candidates who missed two meetings owingwould be able to prior Bob Dudley. This involved agreeingsupport the leadership credentials and desired commitments. experiences forchair of the executive role.board as the senior independent director. These characteristics were broadened so as to identify candidates who would also enhance the strategic discussion in the boardroom. External headhunters were engaged to support the process and identify candidates. These headhunters had no other connection to identifythe company or its directors during the year. The search process led to the appointment of Tushar Morzaria in September 2020 and, from among the existing board members, Paula Reynolds as the senior independent director. Each of these appointments was considered to fulfil the search criteria, including the succession of the audit committee chairmanship. The committee also agreed new search categories for other NED candidates, broadly covering the areas of digital/technology and energy, reflecting the strategic shift of bp to become an Integrated Energy Company and the dependency on digital as an enabler to transform companies. Karen Richardson and Johannes Teyssen together bring extensive financial, technological, transformation and energy industry experience to the board. Planning for new board members to help ensure a strong focus on strategic execution, safety and sustainability and connectivity to bp’s core businesses and markets continues. Committee meetings in 2020 included updates and discussions on the redesign of bp’s corporate governance framework, more details of which are set out on page 88. The committee received regular updates and challenged management on the reinvent bp proposals including the scale of the redundancies, the methodology associated with the required skills, Activities during the year experienceselection process and diversity credentials. After a thorough and transparent 2019 saw the workload and required time commitment of committee members increase significantly as the process, Bernard Looney was identified as the best suited candidate and committee continued to monitor the composition and his appointment was announced in October 2019. skills of the board, with foresight across the three The committee’s focus on executive succession planning continued, and succession planning horizons, as partdetails of the process BP announced Murray Auchincloss as Brian Gilvary’s successor as CFO incontrols and management of developingchange to satisfy itself that safety would be maintained and a reinvented BP. January 2020. During the year, it supported the board in the selection of the new CEO, which was announced Finally, a review was undertaken by the committee of the new leadership in October 2019, and the new CFO, which was team which was announced in February 2020. announced in January 2020. Regular updates were As part of the selection and appointmentrespectful process for each of these roles, provided to the chairman’s committee to ensure that all NEDs were kept informed of the pending changes candidates completed extensive leadership assessment testing and were to BP’s executive leadership.completed. The committee also askedheard detailed considerations on the workforce engagement mechanism options and discussed the benefits and issues of each option presented in order to give insight to their aims for BP’s future. reviewed the wider executive team’s succession During the year the committee also undertookmake a review of the executive planning, considered the implications of the new UK succession pipeline, considering the process, emerging talent and Corporate Governance Code 2018 and made recommendationsrecommendation to the board following thefor 2021. Skills matrix Background and experience Energy markets Operational excellence and risk management Global business leadership role key-person-risks. As part of this review, the committee results of the external board evaluation in 2018. took into account the importance of diverse talent pipelines and the current We will continue to focus on ensuring that thegovernance People leadership and future skill sets required to help the company achieve its strategy board’s composition is strongorganizational transformation Technology, digital and diverseinnovation Society, politics and to The committee discussed the implications of the UK Corporate Governance promote best practice governance in the boardroom and throughout the company. Code 2018 and how to maintain the highest standards of governance. Lastly, the committee considered the findings of the 2018 board evaluation and made proposals to the board on new ways of working. Together with the results from the 2019 board review, these changes are being incorporated into a new corporate governance framework.geopolitcs Finance, risk, trading Non-executive directors Pamela Daley Ann Dowling Helge Lund Committee chair 90 BPMelody Meyer Tushar Morzaria Brendan Nelson Paula Reynolds Karen Richardson Sir John Sawers Johannes Teyssen

94 bp Annual Report and Form 20-F 2019

2020 Corporate governance continued Audit committee The committee was particularly focused on the impacts of bp’s reorganization and the COVID-19 pandemic on financial performance, the financial control environment and resilience. Brendan Nelson Committee chair Committee overview Role of the committee The committee monitors the effectiveness of the group’sgroup’s financial reporting (including reporting on the financial aspects of climate matters), systems of internal control and risk management and the integrity of the group’sgroup’s external and internal audit processes. Key responsibilities •during 2020 Monitoring and obtaining assurance that the process to identify, manage and mitigate principal and emerging financial risks are appropriately addressed by the chief executive officerCEO and that the system of internal control is designed and implemented effectively in support of the limits imposed by the board (‘(‘executive limitations’limitations’), as set out in the BP board governance principles. • Reviewing financial statements and other financial disclosures and monitoring compliance with relevant legal and listing requirements. “The committee robustly challenges • Reviewing the effectiveness of the group audit function, BP’s internal financial controls and reports...enabling it to determine systems of internal control and risk management. whether BP’s financial reporting is •. Overseeing the appointment, remuneration, fair, balanced and understandable.” independence and performance of the external auditor and the integrity of the audit process as a whole, including the engagement of the external Brendan Nelson auditor to supply non-audit services to BP. Committee chair •bp. Reviewing the effectiveness of the internal audit function, bp’s internal financial controls and systems of internal control and risk management. Reviewing financial statements and other financial disclosures and monitoring compliance with relevant legal and listing requirements. Reviewing the systems in place to enable those who work for BPbp to raise concerns about possible improprieties in financial reporting or other issues and for those matters to be investigated. Chairman’s introduction Membership During 2019,Meetings and attendance There were 10 committee meetings in keeping2020. All members attended each meeting with the new UK Corporate Governance Codeexception of Pamela Daley who was absent from the March meeting owing to prior commitments. Regular attendees at the meetings include the chief financial officer, SVP accounting reporting control, SVP internal audit, EVP legal and external auditor. Membership Brendan Nelson Member since November 2010 2018, the committee continued its focus on monitoring the integrity of and chair since April 2011 the group’s financial reporting and risk management systems. Each Dame Alison Carnwath Member quarter(resigned from the committee robustly challenges the reports from management Carnwath and the external auditor highlighting significant accounting issues andboard in January 2021) Pamela Daley Member judgements, enabling it to determine whether BP’s financial reporting is Paula Reynolds Member ‘fair, balanced and understandable’. Throughout the year, the committeeTushar Morzaria Member since September 2020 (chair-designate) Brendan Nelson is chair of the audit committee. He reviewed the group’s principal and emerging risks, including scenarios was formerly vice chairman of KPMG and president of which could impact the company’s long-term viability which also helped the Institute of Chartered Accountants of Scotland. to inform the committee’s debates on what would constitute significant Currently he is chairman of the group audit committee failings and weaknesses in our system of internal control. of NatWest Markets plc and a member of the Financial Reporting Review Panel.See page 76 for his biography. The board is satisfied that he In 2019 the committee focused on the effectiveness of a number of is the audit committee member with recent and group functions including integrated supply and trading, treasury, tax, relevant financial experience as outlined in the UK information technology and security. We also received presentations Corporate Governance Code and competence in regarding, and reviewed performance of, both the Upstream and accounting and auditing as required by the FCA’s Downstream segments and regularly considered climate change riskFCA’s Corporate Governance Rules in DTR7. It considers that affecting the whole business. These reviews helped inform the the committee as a whole has an appropriate and committee of the work and future plans of those functions and experienced blend of commercial, financial and audit expertise to assess the issues it is required to address, businesses and enabled the committee to understand the key risks and as well as competence in the oil and gas sector. The challenges (and associated mitigations and lessons learned) faced by board also determined that the audit committee meets each of them. In addition, the committee carried out reviews into the the independence criteria provisions of Rule 10A-3 of group risks of financial liquidity, cyber security and compliance with the US Securities Exchange Act of 1934 and that business regulations. Brendan may be regarded as an audit committee financial expert as defined in Item 16A of Form 20-F. There were no changes to the committee membership during the year and the skills and experience of our committee members remain strong, Meetings and attendance enabling the committee to continue to perform effectively. There were eight committee meetings in 2019. All members attended each meeting with the exception of Brendan Nelson Pamela Daley who was absent from the September Committee chair meeting owing to prior commitments. Regular attendees at the meetings include the chief financial officer, group controller, chief accounting officer, group head of audit, group general counsel and external auditor. BP
95 Corporate governance bp Annual Report and Form 20-F 2019 91

2020 Chair’s introduction I am pleased to introduce the report on the audit committee’s activities during the year. During the year, the committee has continued to assist the board in fulfilling its oversight responsibilities, by monitoring the integrity of the group’s financial reporting and risk management systems, and also by challenging management and external auditors across a number of key areas of focus, including key accounting judgements and control issues. In addition to the routine committee agenda for the year, the committee was particularly focused on the impacts of bp’s reorganization and the COVID-19 pandemic on financial performance, the financial control environment and resilience. I welcome the addition of Tushar Morzaria to the committee from September 2020. His broad financial experience is immensely beneficial to the committee and bp. Following year end, Dame Alison Carnwath stepped down from the committee and the board. I would like to thank her for her diligent contribution to the committee over the years. This is my last report as chair of the audit committee. I would like to thank my board and committee colleagues, as well as management, for the open, challenging and constructive nature of discussions we have conducted during my tenure. As I hand over the committee chair to Tushar in May 2021, I remain confident that bp is well-positioned for continued resilience and success. Brendan Nelson Committee chair Activities during the year How the committee reviewed financial disclosure The committee reviewed the group’squarterly, half-year and annual financial statements with management, focusing on the: Integrity of the group’s financial reporting process. Clarity of disclosure. Compliance with relevant legal and financial reporting standards. Application of accounting policies and judgements. As part of its review, the committee received regular updates from management and the external auditor in relation to accounting judgements and estimates, including those relating to recoverability of asset carrying values. The committee keeps under review the frequency of results reporting during the year. In considering the bp Annual Report and Form 20-F, the committee assessed whether the report was fair, balanced and understandable and also whether it provided the information necessary for shareholders to assess the group’s position and performance, business model and strategy. In making this assessment, the committee examined disclosures during the year, discussed the requirement with senior management, confirmed that representations to the external auditors had been evidenced and reviewed reports relating to internal control over financial reporting. The committee made a recommendation to the board, who in turn reviewed the report as a whole, confirmed the assessment and approved the report’s publication. How accounting judgements and estimates were considered and addressed The committee was briefed on a quarterly basis in 2020 on the group’s key accounting judgements and estimates. The primary areas of judgement and estimation which were considered by the committee are set out below. These areas were discussed with management and the external auditor throughout the year and during the preparation of these financial statements. The committee is satisfied that the financial statements appropriately address the key accounting judgements and estimates both in respect of the amounts reported and disclosures made. During the year, the committee also considered and approved a change to bp’s accounting policy relating to physically settled commodity contracts, with effect from 1 January 2021. The committee’s process for considering key accounting judgements and estimates included an assessment of matters at various stages during the year. This primarily included the key accounting judgements and estimates set out on pages 98 and 99. The committee also considered and addressed key accounting estimates and judgements relating to provisions, pensions and other post-retirement benefits, and supplier financing arrangements via briefings and review of the group’s assumptions. See Notes 23, 24 and 29 respectively for further information.
96 bp Annual Report and Form 20-F 2020 Corporate governance continued How risks were reviewed The principal risks allocated to the audit committee for monitoring in 2020 included those associated with: Trading activities: including risks arising from shortcomings or failures in systems, risk management methodology, internal control processes or employees. In reviewing this risk, the committee focused on external market developments and how bp’s trading function had responded to a rapidly changing environment, including enhancing its control environment policies to strengthen its compliance and control culture. The committee further considered updates in the trading and shipping function’s risk management programme, including compliance with regulatory developments, activities in response to cyber threats, and efficiencies derived from more collaborative ways of working across group functions and businesses and the use of digital technologies. The committee also considered the impact of COVID-19 on operations and the control environment associated with trading activities, with particular reference to operational considerations associated with increased remote working. Compliance with business and regulations: including ethical misconduct or breaches of applicable laws or regulations that could damage bp’s reputation, adversely affect operational results and/or shareholder value and potentially affect bp’s licence to operate. The committee reviewed the group’s programme on controls and contingencies for managing this risk, including enhanced approaches to monitor the risk in light of business evolution (such as an increase in How the committee reviewed financial disclosure venturing), as well as other internal and external trends. The committee also The committee reviewed the quarterly, half-year and annual financial reviewed key areas of BP’s legal function that advise on compliance matters. statements with management, focusing on the: Cyber security risk: including inappropriate access to or misuse of • Integrity of the group’s financial reporting process. information and systems and disruption of business activity. • Clarity of disclosure. The committee reviewed ongoing developments in the cyber security • Compliance with relevant legal and financial reporting standards. landscape, including events in the oil and gas industry and within BP • Application of accounting policies and judgements.bp itself. The review focused on a strengthened approach in order to As part of its review, the committee received quarterly updates from manage the ever increasingever-increasing threat of cyber risk and maintain cyber management and the external auditor in relation to accounting judgements security, as the focus on a digital transformation across BPbp continues. and estimates including those relating to the Gulf of Mexico oil spill, Financial liquidity: including the risk associated with external market recoverability of asset carrying values and other matters. The committee conditions, supply and demand and prices achieved for BP’sbp’s products keeps under review the frequency of results reporting during the year. which could impact financial performance. The committee reviewed the assessment and reporting of longer-term The committee reviewed the key assumptions and underlying viability, systems of risk management and internal control, including the judgements used to manage the group’sgroup’s liquidity and capital reporting and categorization of risk across the group and the examination investments (including appraisal, effectiveness and efficiency). of what might constitute a significant failing or weakness in the system of internal control. It also examined the group’s modelling for stress testing different financial and operational events, and considered whether the How other reviews were undertaken period covered by the company’s viability statement was appropriate. Other reviews undertaken in 20192020 by the committee included the The committee considered the BP Annual Report and Form 20-F 2018 and following, and in each case where the committee received segment and assessed whether the report was fair, balanced and understandable and function reviews, each reported on strategy, performance, capability and provided the information necessary for shareholders to assess the group’s risk management as well as on their first, second and third lines of position and performance, business model and strategy. In making this defence policies as appropriate: assessment,Information technology and services: including the committee examined disclosures duringfunctions performance, strategy and optimization of core services to enable the year, • Non-operated joint venture:digitization and modernization of bp at pace. bp ventures and Launchpad: including the purpose, capabilities, operating model, governance and performance of these entities. Reinvent bp programme: including a review of programme milestones and risks, as well as business continuity and management of exposure to discussed the requirement with senior management, confirmed that financial, reputational and regulatory risks. representations to the external auditors had been evidenced and reviewed • Upstream: including strategy, business model, financial performance reports relating to internal control over financial reporting. The committee and risk management. made a recommendation to the board, which in turn reviewed the report as • Downstream: including strategy, performance, capability and risk a whole, confirmed the assessment and approved the report’s publication. management. Other disclosures reviewed included: •change. Tax: including strategy, performance, key drivers of the group’sgroup’s effective tax rate, the global indirect tax environment, the tax • Oil and gas reserves. modernization programme and the evolving approach to management • Pensions and post-retirement benefits assumptions. of key risks. • Risk factors. • Other businessesThe committee also reviewed bp’s tax transparency report. Internal audit functional review: including a five-year plan for the function in a reinvented bp. Trading and corporate: including overview of the • Legal liabilities. businesses and functional activities, financial performance and • Tax strategy. financial control framework. • Going concern. • Treasury: including performance, capability, and risk management. • IFRS 16 (lease accounting). • Integrated supply and trading:shipping: including strategy, performance, capability and risk management. How risks were reviewed • Capability and succession in BP’s finance function, including the group’s finance summary of change programme. • Effectiveness of investment: annual review of performance of The principal risks allocated to the audit committee for monitoring in projects with sanctioned capital over a certain threshold. 2019 included those associated with: • Assessment of financial metrics for executive remuneration: Trading activities: including risks arising from shortcomings or failures consideration of financial performance for the group’s 2019 annual in systems, risk management methodology, internal control processes cash bonus scorecard and performance share plan, including or employees. adjustments to plan conditions and non-operating items. • Internal controls: assessments of management’smanagement’s plans to remediate In reviewing this risk, the committee focused on external market the external auditor’sauditor’s control findings. developments and how BP’s trading function had responded to a rapidly • Information technology and security: including an update on the changing environment, including modernizing its control environment transformation of the function to enable the digitization and policies to strengthen its compliance and control culture. The committee modernization of the firm at pace. further considered updates in the integrated supply and trading function’s risk management programme, including compliance with regulatory developments, activities in response to cyber threats, and How internal control and risk management efficiencies derived from more collaborative ways of working across was assessed group functions and businesses and the use of digital technologies. GroupInternal audit Compliance with business and regulations: including ethical The committee received quarterly reports on the findings of groupinternal audit in misconduct or breaches of applicable laws or regulations that could 2019,2020, including their assessment of issues raised in previous years, damage BP’s reputation, adversely affect operational results and/or especially those relating to IT access controls. The committee met shareholder valuealso received a report from internal audit on their annual review of the system of internal control and potentially affect BP’s licence to operate. 92 BP Annual Report and Form 20-F 2019

Corporate governancerisk management. The committee met privately with the group head ofSVP, internal audit and key members of his leadership team. The committee continued to monitor and review the effectiveness and capabilities of internal audit during the year. During the year, the committee received a report on the findings of an assessment conducted by internal audit of its conformance with the Internal Audit Code of Practice which was published in January 2020. The committee noted that internal audit conforms with the vast majority of recommendations set out in the code. Actions to achieve full conformance with the code were also noted. Training and briefings The committee considered market updates and developments throughout the year. This included technical accounting updates from the SVP accounting reporting control on developments in financial reporting and accounting policy, as well as on accounting and disclosure changes that would be introduced as a result of the reorganization of the group. The committee also received briefings on specific topics, including non-operated joint ventures, and data analytics used by the external auditor. Site visit during the year In October 2020, the committee conducted a virtual visit of the trading & shipping function, including virtual presentations from the trading floor, covering low carbon trading, global power and global crude. Key areas of discussion during this site visit included the impacts of oil price volatility, COVID-19 and the reinvent bp programme on the business and its operations during 2020.
97 Corporate governance bp Annual Report and Form 20-F 2020 FRC thematic review The bp Annual Report and Form 20-F 2019 was included in the FRC’s sample for its limited scope thematic review on reporting on the impact of climate change. bp subsequently received a letter request for information from the FRC’s Corporate Reporting Review team. The audit committee considered the letter and bp’s detailed response thereto, which enabled the FRC to close its enquiries. The committee notes the further enhancements made to disclosures in relation to climate change and the energy transition in this annual report. An FRC review provides no assurance that bp’s Annual Report 2019 was correct in all material respects. The FRC’s role was not to verify the information provided but to consider compliance with reporting requirements. Its letters are written on the basis that the FRC (which includes the FRC’s officers, employees and agents) accepts no liability for reliance on them by bp or any third party, including but not limited to investors and shareholders. External audit How the committee assessed audit risk The external auditor set out its audit plan for 2020, identifying significant audit risks to be addressed during the course of the audit. These included: Impairment of upstream oil and gas property, plant and equipment. Impairment of exploration and appraisal assets. Accounting for structured commodity transactions. Valuation of level 3 instruments in trading and shipping revenue recognition. Management override of controls. The committee received updates during the year on the audit process, including how the auditor had challenged the group’s assumptions on these issues. How the committee assessed audit fees The audit committee reviews the fee structure, resourcing and terms of engagement for the external auditor annually; in addition it reviews the non-audit services that the auditor provides to the group on a quarterly basis. Fees paid to the external auditor for the year were $54 million (2019 $49 million), of which 1.9% was for non-audit and other assurance services (see Financial statements – Note 36). The audit committee is satisfied that this level of fee is appropriate in respect of the audit services provided and that an effective audit can be conducted for this fee. Non-audit or non-audit related assurance fees were $1 million (2019 $1 million). Non-audit or non-audit related services consisted of other assurance services. How the committee assessed audit effectiveness team. The committee monitored and reviewed the effectiveness of Management undertook a survey which comprised questions across internal audit and considered whether it had the appropriate level of fivefollowing: (i) The main criteria to measure the auditor’s performance: independence and its importance in assessing the company culture. •auditor’s performance were: – Robustness of the audit process. Training •process – Independence and objectivity. The committee considered market updates and developments throughout •objectivity – Quality of delivery. the year including the CMA statutory audit market study, the Brydon •delivery – Quality of people and service. Reviewservice (ii) bp’s commitment to the audit; and (iii) Aligned audit approach – which sought to measure progress against the Kingman Review. It received technical updatescommitments from the • Value added advice. chief accounting officeraudit tender. Year on developments in financial reporting and The results ofyear, the overall score from the survey indicatedincreased by +3%. Improvements were seen across audit effectiveness and service quality, including a number areas of focus that the external auditor’s performance accounting policy,had been identified in particular an update on IFRS 16 ‘Leases’ and the was broadly comparable with the previous year. Areas with high scores and stakeholder engagement disclosures required undersurvey. The Companies favourable comments included quality of accounting and auditing judgement (Miscellaneous Reporting) Regulations 2018 for the 2019 accounting year, and robust stance on issues. Areas for improvement were identified but and amendments to IFRS 9 ‘Financial Instruments’ for interest rate none impacted on the effectiveness of the audit, mostly in recognition of it benchmark reform from the start of 2020. having been Deloitte’s first year in role. The results of the survey were GBS and integrated supply and trading visit discussed with Deloitte for consideration in their 2019 audit approach. In March the committee visited BP’s global business services (GBS) The committeealso held private meetings with the external auditor during centre in Kuala Lumpur. During the visit they met with the head of country the year and the committee chair met separately with the external and his leadership team who presented GBS strategy to 2025 enabling auditor and group head of audit at least quarterly. modernization of BP through accelerated standardization, digital solutions and process transformation – underpinned by a global functional operating The effectiveness of the external auditor is evaluated by the audit model. They also met with the Procurement and HR services teams committee. The committee assessed the auditor’sauditor’s approach to providing including an interactive session with local business resource colleagues. audit services. On the basis of such assessment, the committee concluded that the audit team was providing the required quality in In March the committee also visited BP’s integrated supply and trading relation to the provision of the services. The audit team had shown the (IST) function in Singapore, meeting with senior leaders to discuss the necessary commitment and ability to provide the services together with role of this function in BP, review of the risks and controls processes a demonstrable depth of knowledge, robustness, independence and and a floor walk through key functions and the trading desks. See page objectivity as well as an appreciation of complex issues. The team had 89 for more information on these visits by the committee. posed constructive challenge to management where appropriate. In October, the committee held its meeting at BP’s IST function in London The committee specifically considered the findings of the FRC’s Audit and conducted its annual tour, which covered global oil strategy, integrated Quality Review team’s review of Deloitte’s 2018 audit. The committee gas and power, associated key risks and risk and compliance management noted the single observation raised and Deloitte’s proposed response and how the function was responding to a fast evolving market by using thereto. Overall the committee noted the review did not raise any digital tools to drive efficiencies. The following trading desks were visited concerns in respect of audit quality. by the committee: treasury trading, global environmental products and integrated gas and power. How the auditor reappointment and independence was assessed The committee considers the reappointment of the external auditor each External audit year before making a recommendation to the board. The committee How the committee assessed audit risk assesses the independence of the external auditor on an ongoing basis and The external auditor set out its audit strategy for 2019, identifying significant the external auditor is required to rotate the lead audit partner every five audit risks to be addressed during the course of the audit. These included: years and other senior audit staff every five to seven years. No partners or • Focus on the consistency of management’s judgements and senior staff associated with the BPbp audit may transfer to the group. estimates within BP’s strategy in the context of climate change. How the committee had oversight of non-audit services • Responding to the risk of material misstatements in the group, by The audit committee is responsible for BP’sbp’s policy on non-audit services way of substantive testing and the use of detailed data analytics. and the approval of non-audit services. Audit objectivity and independence • The risk of impairment of upstream oil and gas property, plant and is safeguarded through the prohibition of non-audit tax services and the equipment, and exploration and appraisal assets. limitation of audit-related work which falls within defined categories. BP’s • Accounting for structured commodity transactions in the integratedbp’s policy on non-audit services states that the auditor may not perform supply and trading function. non-audit services that are prohibited by the SEC, Public Company • Valuation of level 3 financial instruments held by the integrated supply Accounting Oversight Board (PCAOB), International Auditing and Assurance and trading function. Standards Board (IAASB) and the UK Financial Reporting Council (FRC). • Management override of controls. The audit committee approves the terms of all audit services as well as The committee received updates during the year on the audit process, permitted audit-related and non-audit services in advance. The external including how the auditor had challenged the group’s assumptions on auditor is considered for permitted non-audit services only when its these issues. expertise and experience of BPbp is important. How the committee assessed audit fees Approvals for individual engagements of pre-approved permitted services The audit committee reviews the fee structure, resourcing and terms of below certain thresholds are delegated to the group controllerSVP accounting reporting control or the chief engagement for the external auditor annually; in addition it reviews the financial officer. Any proposed service not included in the permitted non-audit services that the auditor provides to the group on a quarterly basis. services categories must be approved in advance either by the audit Fees paid to the external auditor for the year were $49 million (2018 $42 committee chairmanchair or the audit committee before engagement million), of which 2% was for non-audit assurance work (see Financial commences. The audit committee, chief financial officer and group statements – Note 36). The audit committee is satisfied that this level of controllerSVP accounting reporting control monitor overall compliance with BP’sbp’s policy on audit-related and fee is appropriate in respect of the audit services provided and that an non-audit services, including whether the necessary pre-approvals have effective audit can be conducted for this fee. Non-audit or non-audit been obtained. The categories of permitted and pre-approved services are related assurance fees were $1 million (2018 $2 million). Non-audit or outlined in Principal accountant’sprincipal accountant’s fees and services on page 322. non-audit related services consisted of other assurance services. BP327.
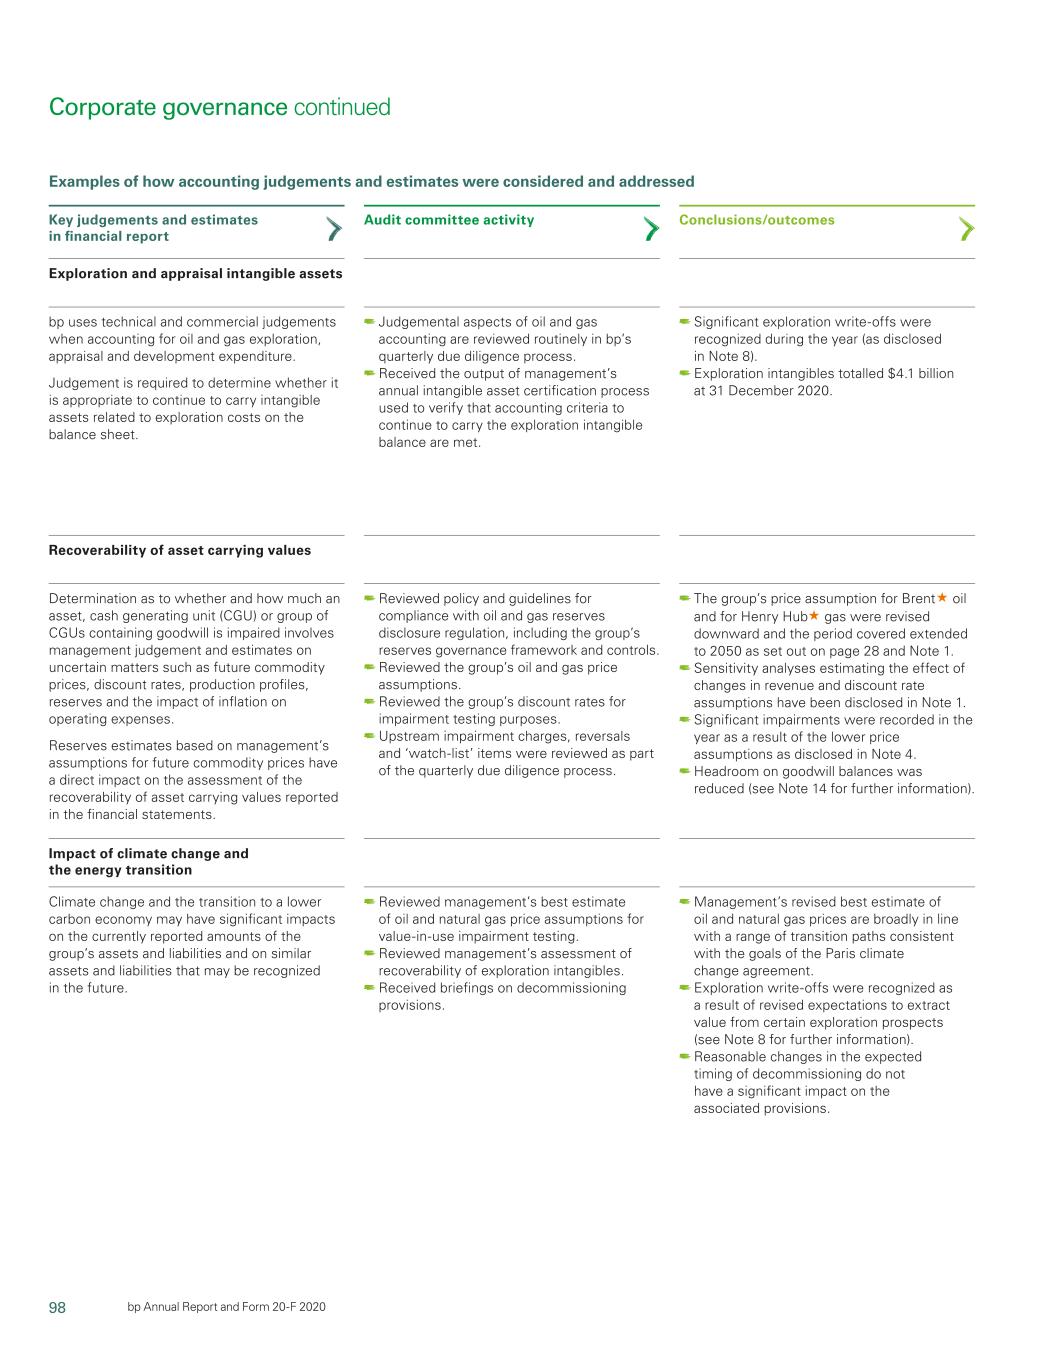
98 bp Annual Report and Form 20-F 2019 93

How2020 Corporate governance continued Examples of how accounting judgements and estimates were considered and addressed Key judgements and estimates Audit committee activity Conclusions/outcomes in financial reportingreport Exploration and appraisal intangible assets BPRecoverability of asset carrying values Impact of climate change and the energy transition Audit committee activity Conclusions/outcomes bp uses technical and commercial judgements when • Reviewed exploration write-offs as part of the • Exploration write-offs totalling $0.6 billion were accounting for oil and gas exploration, appraisal and group’s quarterly due diligence process. recognized during the year. development expenditure and in determining the • Received the output of management’s annual • Exploration intangibles totalled $14.1 billion at group’s estimated oil and gas reserves. intangible asset certification process used to 31 December 2019. ensure accounting criteria to continue to carry the • BP believes it is appropriate to continue toexpenditure. Judgement is required to determine whether it is exploration intangible balance are met. capitalize the costs relating to intangible assets, on appropriate to continue to carry intangible assets • Received briefings on the status of upstream the ‘watch-list’. related to exploration costs on the balance sheet. intangible assets, including the status of items on the intangible assets ‘watch-list’. Recoverability of asset carrying values Determination as to whether and how much an • Held an in-depth review of BP’s policy and • The group’s long-term price assumption for Brent asset, cash generating unit (CGU) or group of CGUs guidelines for compliance with oil and gas oil, was reduced by $5 from 2018 assumptions containing goodwill is impaired involves management reserves disclosure regulation, including the and was unchanged for Henry Hub gas. judgement and estimates on uncertain matters such group’s reserves governance framework • The period over which the group’s price as future commodity prices, discount rates, and controls. assumptions transition from recent market prices production profiles, reserves and the impact of • Reviewed the group’s oil and gas price to the long-term assumption was unchanged at inflation on operating expenses. assumptions. five years for Brent oil and increased from 5 to 12 • Reviewed the group’s discount rates for years for Henry Hub gas from 2018. Reserves estimates based on management’s impairment testing purposes. • A sensitivity analysis estimating the effect ofmanagement’s assumptions for future commodity prices have a • Upstream impairment charges, reversals and reductions in the price assumptions has been direct impact on the assessment of the recoverability ‘watch-list’ items were reviewed as part of the disclosed in Note 1. of asset carrying values reported in the financial statements. Climate change and the transition to a lower carbon economy may have significant impacts on the currently reported amounts of the group’s assets and liabilities and on similar assets and liabilities that may be recognized in the future. Judgemental aspects of oil and gas accounting are reviewed routinely in bp’s quarterly due diligence process. • The methodologyReceived the output of management’s annual intangible asset certification process used to verify that accounting criteria to continue to carry the exploration intangible balance are met. Reviewed policy and guidelines for determiningcompliance with oil and gas reserves disclosure regulation, including the group’s statements.group’s reserves governance framework and controls. Reviewed the group’s oil and gas price assumptions. Reviewed the group’s discount rates used for impairment testing was enhanced, resultingpurposes. Upstream impairment charges, reversals and ‘watch-list’ items were reviewed as part of the quarterly due diligence process. Reviewed management’s best estimate of oil and natural gas price assumptions for value-in-use impairment testing. Reviewed management’s assessment of recoverability of exploration intangibles. Received briefings on decommissioning provisions. Significant exploration write-offs were recognized during the year (as disclosed in country-specific rates being applied. • ImpairmentsNote 8). Exploration intangibles totalled $4.1 billion at 31 December 2020. The group’s price assumption for Brent« oil and for Henry Hub«gas were revised downward and the period covered extended to 2050 as set out on page 28 and Note 1. Sensitivity analyses estimating the effect of $6.6 billionchanges in revenue and discount rate assumptions have been disclosed in Note 1. Significant impairments were recorded in the year netas a result of impairment reversals, primarily relatingthe lower price assumptions as disclosed in Note 4. Headroom on goodwill balances was reduced (see Note 14 for further information). Management’s revised best estimate of oil and natural gas prices are broadly in line with a range of transition paths consistent with the goals of the Paris climate change agreement. Exploration write-offs were recognized as a result of revised expectations to decisions to disposeextract value from certain exploration prospects (see Note 8 for further information). Reasonable changes in the expected timing of certain assets.decommissioning do not have a significant impact on the associated provisions.
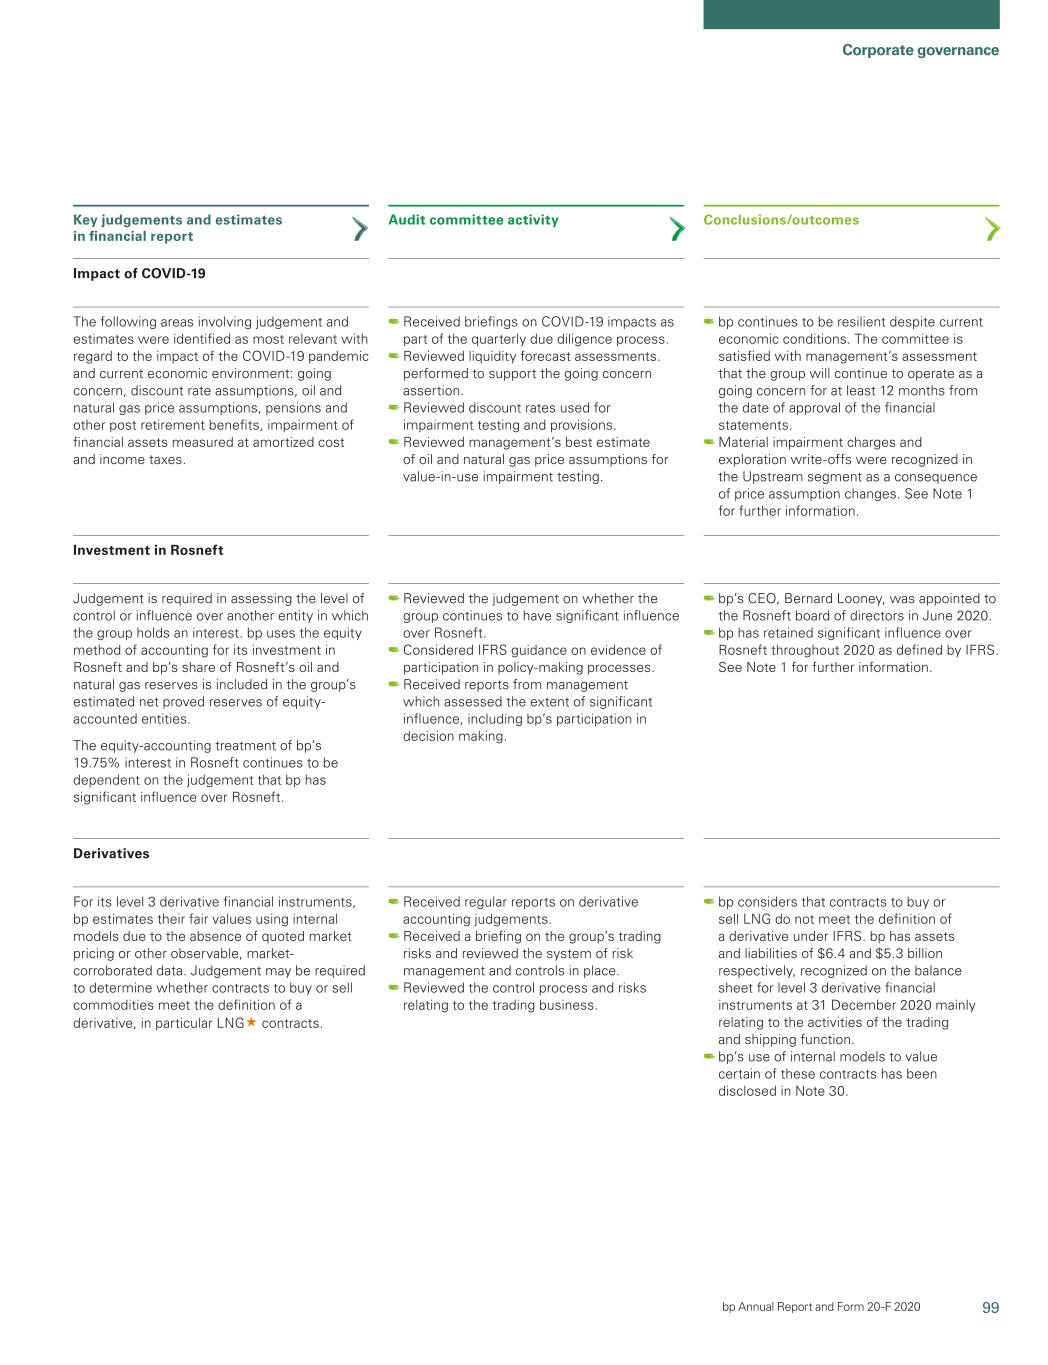
99 Corporate governance bp Annual Report and Form 20-F 2020 Key judgements and estimates in financial report Impact of COVID-19 Investment in Rosneft Derivatives Audit committee activity Conclusions/outcomes The following areas involving judgement and estimates were identified as most relevant with regard to the impact of the COVID-19 pandemic and current economic environment: going concern, discount rate assumptions, oil and natural gas price assumptions, pensions and other post retirement benefits, impairment of financial assets measured at amortized cost and income taxes. Judgement is required in assessing the level of • Reviewed the judgement on whether the group • BP has retained significant influence over Rosneft control or influence over another entity in which the continues to have significant influence over throughout 2019 as defined by IFRS. group holds an interest. Rosneft, including following Bob Dudley stepping down from his role as BP group chief executive. BPbp uses the equity method of accounting for its • Considered IFRS guidance on evidence of investment in Rosneft and BP’sbp’s share of Rosneft’sRosneft’s oil participation in policy-making processes. and natural gas reserves is included in the group’s • Received reports from management whichgroup’s estimated net proved reserves of equity-accounted assessed the extent of significant influence,equity- accounted entities. including BP’s participation in decision-making. The equity-accounting treatment of BP’sbp’s 19.75% interest in Rosneft continues to be dependent on the judgement that BPbp has significant influence over Rosneft. 94 BP Annual Report and Form 20-F 2019

Corporate governance Key judgements and estimates Audit committee activity Conclusions/outcomes in financial reporting Derivative financial instruments For its level 3 derivative financial instruments, BP • Received a briefing on the group’s trading risks • BP considers that longer-term contracts to buy orbp estimates their fair values using internal models due to the absence of quoted market pricing or other observable, market- corroborated data. Judgement may be required to determine whether contracts to buy or sell commodities meet the definition of a derivative, in particular LNG« contracts. Received briefings on COVID-19 impacts as part of the quarterly due diligence process. Reviewed liquidity forecast assessments. performed to support the going concern assertion. Reviewed discount rates used for impairment testing and provisions. Reviewed management’s best estimate of oil and natural gas price assumptions for value-in-use impairment testing. Reviewed the judgement on whether the group continues to have significant influence over Rosneft. Considered IFRS guidance on evidence of participation in policy-making processes. Received reports from management which assessed the extent of significant influence, including bp’s participation in decision making. Received regular reports on derivative accounting judgements. Received a briefing on the group’s trading risks and reviewed the system of risk management and controls in place. Reviewed the control process and risks relating to the trading business. bp continues to be resilient despite current economic conditions. The committee is satisfied with management’s assessment that the group will continue to operate as a going concern for at least 12 months from the date of approval of the financial statements. Material impairment charges and exploration write-offs were recognized in the Upstream segment as a consequence of price assumption changes. See Note 1 for further information. bp’s CEO, Bernard Looney, was appointed to the Rosneft board of directors in June 2020. bp has retained significant influence over Rosneft throughout 2020 as defined by IFRS. See Note 1 for further information. bp considers that contracts to buy or sell LNG do not meet the definition of a derivative to the absence of quoted market pricing or other controls in place. under IFRS. BPbp has assets and liabilities of $5.5 observable, market-corroborated data. Judgement • The committee annually reviews the control$6.4 and $4.4$5.3 billion respectively, recognized on the may be required to determine whether contracts to process and risks relating to the trading business. balance sheet for level 3 derivative financial buy or sell commodities meet the definition of a instruments at 31 December 2019,2020 mainly relating derivative, in particular longer-term LNG contracts. to the activities of the integrated supplytrading and trading function (IST). • BP’sshipping function. bp’s use of internal models to value certain of these contracts has been disclosed in Note 30. Provisions BP’s most significant provisions relate to • Received briefings on decommissioning, • Decommissioning provisions of $15.1 billion decommissioning, environmental remediation environmental, asbestos and litigation provisions, were recognized on the balance sheet at and litigation. including those related to the Gulf of Mexico oil 31 December 2019. spill. These included the requirements, • The discount rate used by BP to determine the The group holds provisions for the future governance and controls for the development balance sheet obligation at the end of 2019 was decommissioning of oil and natural gas production and approval of cost estimates and provisions a nominal rate of 2.5% – based on long-dated facilities and pipelines at the end of their economic in the financial statements. US government bonds – a reduction of 0.5% lives. Most of these decommissioning events are • Reviewed the group’s discount rates for from 2018. many years in the future and the exact requirements calculating provisions. • The impact of applying the revised rate has that will have to be met when a removal event occurs been disclosed. are uncertain. Assumptions are made by BP in relation to settlement dates, technology, legal requirements and discount rates. The timing and amounts of future cash flows are subject to significant uncertainty and estimation is required in determining the amounts of provisions to be recognized. Pensions and other post-retirement benefits Accounting for pensions and other post-retirement • Reviewed the group’s assumptions used to • The method for determining the group’s benefits involves making estimates when measuring determine the projected benefit obligation at assumptions remained largely unchanged from the group’s pension plan surpluses and deficits. the year end, including the discount rate, rate 2018. The values of these assumptions and a These estimates require assumptions to be made of inflation, salary growth and mortality levels. sensitivity analysis of the impact of possible about uncertain events, including discount rates, changes on the benefit expense and obligation inflation and life expectancy. are provided in Note 24. • At 31 December 2019, surpluses of $7.1 billion and deficits of $8.6 billion were recognized on the balance sheet in relation to pensions and other post-retirement benefits. BP

100 bp Annual Report and Form 20-F 2019 95

2020 Safety environment and security assurancesustainability committee (SESAC)The committee continued to work with the bp leadership team to promote safe and reliable operations. Melody Meyer Committee chair Committee overview Role of the committee The role of the SESACsafety and sustainability committee (SASC) (previously called the safety, environment and security assurance committee, until 31 December 2020) is to look at the processes adopted by BP’sbp’s executive management to identify and mitigate significant non-financial risk. This includes monitoring the management of personal and process safety risk, security and environment risks and receiving assurance that processes to identify and mitigate such non-financial risks are appropriate in their design and effective in their implementation. Key responsibilities during 2020 The committee receives specific reports from the business segments and functions, which include, but are not limited to, the safety and operational risk function, shipping, groupinternal audit and group security. The SESACSASC can access any other independent advice and counsel it requires on an unrestricted basis. “The committee has continued to The SESACSASC and audit committee worked together, focus on working with executive through their chairs and secretaries, to ensure that management to drive safe and agendas did not overlap or omit coverage of any key risks during the year. reliable operations.” Meetings and attendance Melody Meyer There were six committee meetings in 2019.2020. All Committee chair directors attended every meeting for which they were eligible. In addition to the committee members, all SESACSASC meetings were attended by the group chief executive,CEO, the executive vice presidentSVP for safety Chairman’s introduction and operational risk (S&OR)&OR) and the head of group At the end of 2019 I took the role of chair for the committee. AlanSVP internal audit and/or his delegate. The external auditor has access to the chair and secretary to the committee as Boeckmann retired from the board in April 2019 and Nils Andersen required. The group general counselEVP legal also attended replaced him as the committee chair. In November last year, Nils some of the meetings. At the conclusion of each announced his intention to step down from the board in March 2020 meeting the committee scheduled private sessions and I replaced Nils as SESAC chair with immediate effect. for the committee members only, without the presence of executive management, to discuss any During 2019 the committee has continued to focus on working with issues arising and the quality of the meeting. The executive management to drive safe and reliable operations. As part of group chief executiveCEO receives invitations to join the the committee’s review of the executives’ management of the highest private meetings on an ad hoc basis and at least once priority non-financial group risks assigned to SESAC we provide a year the head of groupSVP internal audit is invited to a private constructive challenge and oversight. The risks under our remit remained meeting with the committee. the same as for 2018: marine, wells, pipelines, explosion or release at Membership facilities, major security incidents and cyber security in the process control network. The committee receives reports on each of these risks Melody Meyer Member since May 2017 and and monitors their management and mitigation. chair since November 2019 Nils Andersen Member In 2019 the committee reviewed the BP Sustainability Report 2018. It (resigned March 2020) also reviewed work practices in BP in relation to and following publication Alan Boeckmann Member of the company’s Modern Slavery Act (MSA) statement in 2019. The (retired April 2019) committee will continue to review progress in developing and embedding Admiral Frank Member practices to mitigate the risk of modern slavery and related human rights. Bowman (retired May 2019) Professor Dame Member In March, members of the committee visited the shipping function as one Ann Dowling of the new LNG vessels went into service from the building yard inMember Sir John Sawers Member Busan, South Korea. This affordedChair’s introduction I am pleased to present my second report as chair of the SASC. During 2020, the committee timecontinued to work with the crew on boardbp leadership team to promote safe and reliable operations within the vessel, employees inorganization. Operational risk management remained a key area of focus during 2020, against the office and with contractors inchallenging backdrop of the shipyard. See page 89 for more details. The level of access into the operations on such visits gives the directors first-hand, direct insight. This framework provides an opportunity for meaningful and open dialogueCOVID-19 pandemic with the local site teams, allowingresult that bp maintained a good safety record during the year despite these challenges. The committee (together with other non-executive directors) conducted a virtual visit of bpx energy Permian assets in December 2020. We were very impressed with the safety culture and performance demonstrated by the bpx energy colleagues with whom we interacted during this virtual visit, and we look forward to being able to conduct a physical visit in due course. As part of the review by the board of its governance framework, the committee was renamed as the safety and sustainability committee with effect from 1 January 2021. The committee’s remit has also been expanded to better fulfil its obligations.include monitoring the effectiveness of the implementation of bp’s sustainability frame. This is an important step in light of bp’s new purpose and ambition and I look forward to continuing to work with the bp leadership team in furtherance of the new purpose, underpinned by safety and sustainability. Nils Andersen stepped down from the committee and the board in March 2020. I would like to thank him for his valuable contribution and commitment to the committee and I welcome Johannes Teyssen as a new member of the committee from the beginning of 2021. Melody Meyer Committee chair 96 BPCorporate governance continued
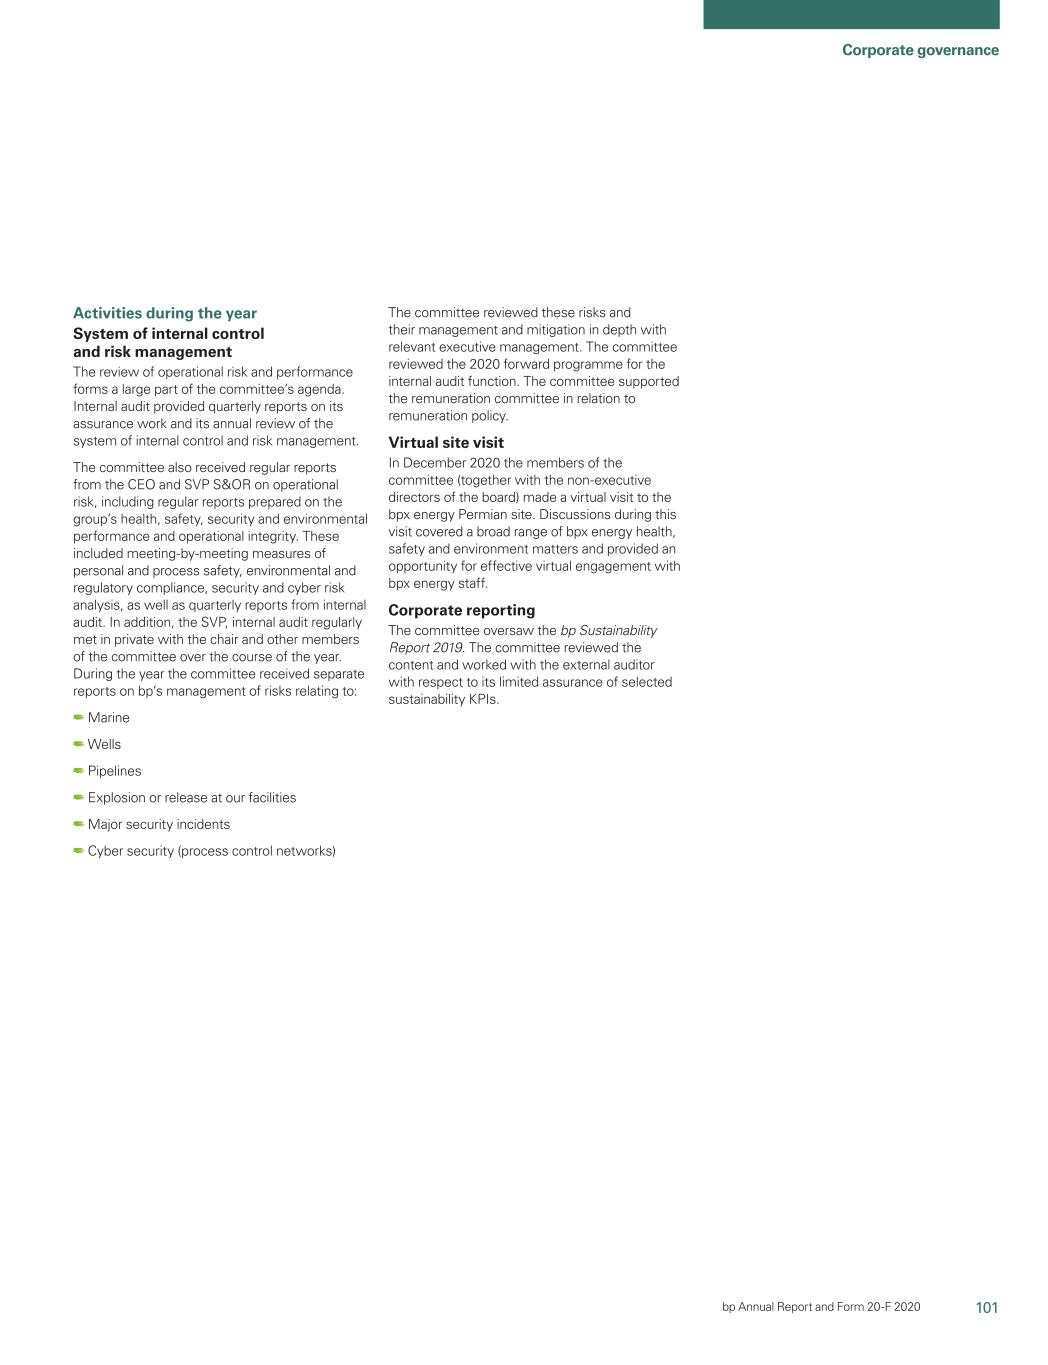
101 Corporate governance bp Annual Report and Form 20-F 2019

Corporate governance2020 Activities during the year The board also undertook a site visit. This was not a SESAC site visit but, nevertheless, safety and non-financial risk matters were covered System of internal control and risk management during the visit to Clair Ridge in May 2019. Corporate reporting The review of operational risk and performance forms a large part of the committee��committee’s agenda. GroupInternal audit provided quarterly reports on its The committee oversaw the BP Sustainability Report 2018. The assurance work and its annual review of the system of internal control committee reviewed the content and worked with the external auditor and risk management. with respect to its assurance of the report. The committee also received regular reports from the group chief executiveCEO and vice president forSVP S&OR&OR on operational risk, including regular reports prepared on the group’sgroup’s health, safety, security and environmental performance and operational integrity. These included meeting-by-meeting measures of personal and process safety, environmental and regulatory compliance, security and cyber risk analysis, as well as quarterly reports from groupinternal audit. In addition, the group auditorSVP, internal audit regularly met in private with the chairmanchair and other members of the committee over the course of the year. During the year the committee received separate reports on the company’sbp’s management of risks relating to: • Marine. • Wells. • Pipelines. •Marine Wells Pipelines Explosion or release at our facilities. •facilities Major security incidents. •incidents Cyber security (process control networks). The committee reviewed these risks and their management and mitigation in depth with relevant executive management. The committee reviewed the 20192020 forward programme for the groupinternal audit function. Site visitsThe committee supported the remuneration committee in relation to remuneration policy. Virtual site visit In MarchDecember 2020 the members of the committee (together with the non-executive directors of the board) made a physicalvirtual visit to the shipping functionbpx energy Permian site. Discussions during this visit covered a broad range of bpx energy health, safety and environment matters and provided an opportunity for the first time. While the committee has regular access to senior leaders in the function, attempting to visit the vessels needed careful planning. With the launch of six new LNG vessels between October 2018 and April 2019, the committee took the opportunity to visit, and arrived as the fifth LNG vessel was in its period of ‘shakedown’ – a period post-launch and pre-service, when checks are made onboard the ship. The visit, hosted by the chief operating officer of shipping, was made to The British Mentor while it was at sea, just off the coast of South Korea. Committee members went on board and were met by the ship’s crew, undertook a thorough tour, and later meteffective virtual engagement with various seafarers, without the captain present, to get a sense of the culture on board.bpx energy staff. Corporate reporting The committee also spent time atoversaw the office and held an informal town hall and lunch to hear from employees. The following day the committee was also able to visit the shipyard which had built the LNG vessels, and meet with management.bp Sustainability Report 2019. The committee members were able to take a tour of a LNG vessel inreviewed the building phasecontent and see the technology used in the construction of the vessel at various stages of completion. The committee spent timeworked with the shipyard owners, important stakeholders in the programmeexternal auditor with respect to its limited assurance of delivery. In respect of the visit, committee members and other directors received briefings on operations, the status of conformance with BP’s operating management system, key business and operational risks and risk management and mitigation. Committee members reported back in detail about the visit to the committee and subsequently to the board. See page 89 for further details. BPselected sustainability KPIs.

102 bp Annual Report and Form 20-F 2019 97

2020 Geopolitical committee The committee’s agenda developed and evolved during the year, reflecting a year with a significant number of geopolitical developments globally. Sir John Sawers Committee chair Chair’s introduction I am pleased to report on the work of the geopolitical committee in 2020. The committee’s agenda developed and evolved during the year, reflecting a year with a significant number of geopolitical developments globally. Following changes to the board governance framework that took effect on 1 January 2021, the committee was replaced by a geopolitical advisory council. Although the council is not a formal committee of the board, its membership includes other directors, certain members of the bp leadership team and three external advisors, with myself as chair. The geopolitical highest priority risk is now overseen by the board as a whole, informed by feedback from the council. Sir John Sawers Committee chair Activities during the year Early in the year, the committee considered the potential impact on bp of policies and plans of the new EU Commission and new UK government elected in December 2019. Later in the year, the committee considered the geopolitics of the COVID-19 pandemic and its impact on businesses and policies. The impacts of different potential outcomes of the November US election were discussed by the committee at its meeting in September 2020. The committee also received periodic geopolitical updates on a number of territories in which bp has significant interests throughout the year. Committee overview Role of the committee The committee monitors the company’scompany’s identification and management of geopolitical risk. Key responsibilities • Monitor the company’scompany’s identification and management of major and correlated geopolitical risk and consider reputational as well as financial consequences. • Review BP’sbp’s activities in the context of political and economic developments on a regional basis and advise the board on these elements in its consideration of BP’sbp’s strategy and the annual plan. • Major geopolitical risks are those brought about by social, economic or political events that occur in countries where BPbp has material investments. • Correlated geopolitical risks are those brought about by social, economic or political events that occur in “The committee continued to address countries where BPbp may or may not have a presence but that can lead to global political key geopolitical matters and their instability. potential impact on BP.” Membership Sir John Sawers Sir John Sawers Member since September 2015 Committee chair and chair since April 2016 Nils Andersen Member (resigned March 2020) Admiral Frank Member Bowman (resigned May 2019) Sir Ian Davis Member Melody Meyer Member Meetings and attendance Chairman’s introduction The chairman and group chief executiveCEO regularly attend committee meetings. The chief executive of The work of the geopolitical committee in 2019 continued to address key Alternative Energy and executive vice president, geopolitical matters and their potential impact on BP and how these regions and the head of government and political evolved during the year. As chair of this committee I also attended all of affairs attend meetings as required. The committee the international advisory board (IAB) meetings in 2019. Now that the IAB met fourthree times during the year. All directors attended has been disbanded, this committee will look to take some of the IAB’s each meeting that they were eligible to attend, with the exception of Nils AndersenSir Ian Davis who missed one remit and we will report next year on how that evolves. In May 2019, meeting due to a prior commitment. Admiral Frank Bowman stood down from the committee. Nils Andersen left the committee upon his resignation from the board in March 2020. I would like to thank Frank and Nils, both of whose contributions were much valued. Other board members joined our meetings from time to time.Membership Sir John Sawers CommitteeMember since September 2015 and chair Activities during the year The committee discussed BP’s involvement in the key countries where it has existing investments or is considering investment. These included the EU, Mexico, Brazil, Algeria, Libya, Egypt, Iraq, Oman and The Gambia. The committee also discussed the potential impact of Brexit on BP, and the negotiations between the UK and the EU on their future relationship. It reviewed the geopolitical background to BP’s global investments, the global politics of climate change, the geopolitics of gas, Russian energy exports, OPEC, the USA-China trade war, and developments in the Persian Gulf. 98 BPsince April 2016 Nils Andersen Member (resigned March 2020) Sir Ian Davis Member (resigned December 2020) Melody Meyer Member Corporate governance continued

103 Corporate governance bp Annual Report and Form 20-F 2019

Corporate governance Chairman’s2020 Directors’ remuneration report Chair’s letter The committee Rolewishes to place on record our gratitude for all that bp’s people achieved last year, and our acknowledgment of the committee To provide a forum for matterschallenging environment they faced. We look forward to be discussed by the non-executive directors. Key responsibilities • Evaluate thebetter days ahead. Paula Rosput Reynolds Committee chair Contents Alignment with strategy 108 2020 performance and pay summary 110 2018-20 performance share plan outcome 111 Executive directors’ pay for 2020 113 Wider workforce in 2020 115 Stewardship and executive director interests 118 Non-executive director outcomes and interests 121 Other disclosures 123 Policy implementation for 2021 124 Dear shareholder, Last year was enormously challenging – for the effectivenessworld and for bp. Yet the bp team operated safely and reliably, ran the business as well as could possibly be expected, and launched a strategic transformation of the chief executive officer. • Reviewcompany. That bp achieved so much last year is a credit to everyone in the structurecompany – from the leadership to the front lines. Together, they delivered the energy the world needs, and effectivenesspositioned the company for the future. Nevertheless, as COVID-19 took its toll around the globe, there were consequences for bp’s financial outcomes in 2020. The remuneration committee always seeks to align employee reward with shareholder experience. Thus, despite extraordinary efforts on the part of the business organization. • Revieworganization, we decided that there should be no 2020 pay-out for all those who normally participate in our broadly-applicable annual bonus plan. We know that this decision was painful for bp’s people, many of whom count on earning a cash bonus as part of their personal and family financial planning. While words cannot substitute for remuneration not received, the systemscommittee wishes to place on record our gratitude for senior executive developmentall that bp people achieved amidst the environment they faced. We look forward to better days ahead. Shareholder engagement Throughout this challenging period when we had many decisions to make regarding metrics and determine succession plans forreward, the chief executive officer, executive directorscommittee has benefited from engagement with our shareholders. The remuneration policy under which we now operate was directly shaped by a meeting we held with bp’s top 25 shareholders and other senior members of executive management. • Determine any other matter that is appropriate to be considered by non-executive directors. • Opine on any matter referred to it by the chairman of any committees comprised solely of non- executive directors. “The committee spent significant time Membership discussing the development and The committee is made up solely of non-executive progression of BP’s purpose, directors, each of whom is appointed to the committee upon their appointment to the board. expanding upon what the purpose Meetings and attendance actually means for the company and The committee met seven timesproxy representatives in 2019. Nils how it impacts BP’s stakeholders.” Andersen, Pamela Daley and Professor Dame Ann Dowling each missed one meeting during the year, all Helge Lund other directors attended every meeting for which they Committee chair were eligible. Chairman’s introduction The chairman’s committee worked closely with the nomination and governance committee on the selection processWe appreciated shareholders’ overwhelming support (96.58% approval) of the new group CEOpolicy at our AGM last May. Throughout 2020, we have continued to meet (virtually) with our largest shareholders to discuss a range of performance and CFO, receiving regular updatesincentive topics in detail. We are grateful for your counsel and providing feedback onhope you will see your advice reflected in the succession planning. The committee also spent significant time discussing the development and progressiondecisions which we have reached. We ask for your support of BP’s purpose, expanding upon what the purpose actually means for the company and how it impacts BP’s stakeholders. We discussed the updated UK Corporate Governance Code 2018this directors’ remuneration report, and the implications fordecisions described herein, at the business. In May 2019, Alan Boeckmann and Frank Bowman stood down from the board and the chairman’s committee. I would like to pay tribute to their exceptional service and thank them for their dedication to the committee and BP as a whole. Helge Lund Committee chair Activities during the year • Evaluated the performance of the group chief executive. • Reviewed the composition of and the succession plans for the executive team. • Discussed the company’s purpose and what it meant for the business. • Considered updates to the UK Corporate Governance Code 2018. BPforthcoming annual general meeting.
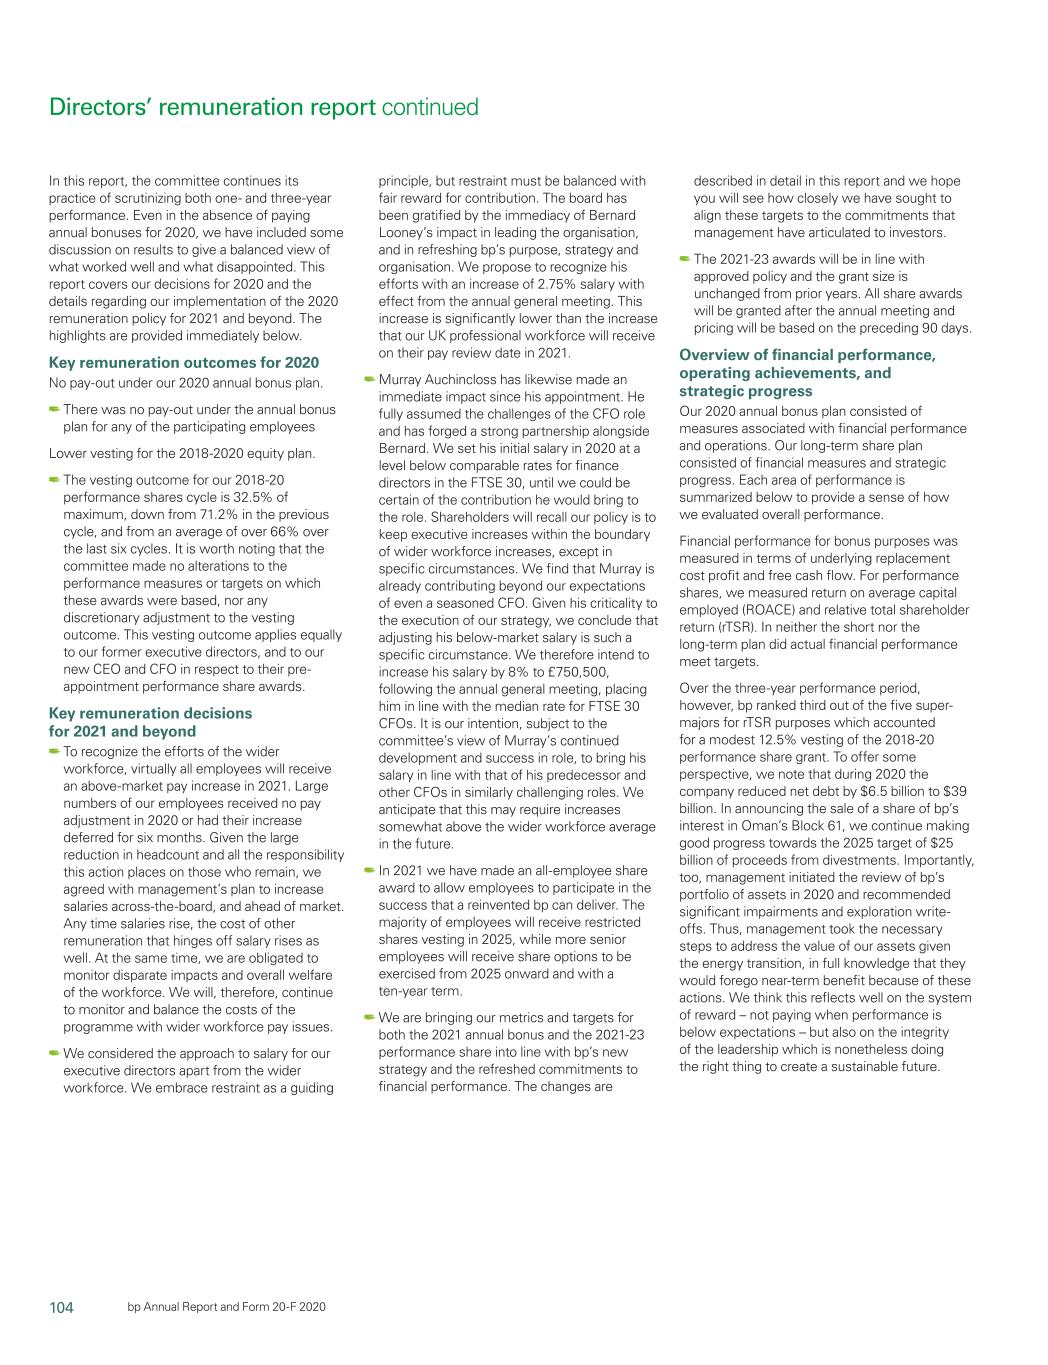
104 bp Annual Report and Form 20-F 2019 99

Directors’2020 Directors’ remuneration report Contents 2019continued In this report, the committee continues its practice of scrutinizing both one- and three-year performance. Even in the absence of paying annual bonuses for 2020, we have included some discussion on results to give a balanced view of what worked well and what disappointed. This report covers our decisions for 2020 and the details regarding our implementation of the 2020 remuneration policy for 2021 and beyond. The highlights are provided immediately below. Key remuneration outcomes for 2020 No pay-out under our 2020 annual bonus plan. There was no pay-out under the annual bonus plan for any of the participating employees Lower vesting for the 2018-2020 equity plan. The vesting outcome for our 2018-20 performance shares cycle is 32.5% of maximum, down from 71.2% in the previous cycle, and from an average of over 66% over the last six cycles. It is worth noting that the committee made no alterations to the performance measures or targets on which these awards were based, nor any discretionary adjustment to the vesting outcome. This vesting outcome applies equally to our former executive directors, and to our new CEO and CFO in respect to their pre- appointment performance share awards. Key remuneration decisions for 2021 and beyond To recognize the efforts of the wider workforce, virtually all employees will receive an above-market pay increase in 2021. Large numbers of our employees received no pay adjustment in 2020 or had their increase deferred for six months. Given the large reduction in headcount and all the responsibility this action places on those who remain, we agreed with management’s plan to increase salaries across-the-board, and ahead of market. Any time salaries rise, the cost of other remuneration that hinges off salary rises as well. At the same time, we are obligated to monitor disparate impacts and overall welfare of the workforce. We will, therefore, continue to monitor and balance the costs of the programme with wider workforce pay issues. We considered the approach to salary for our executive directors apart from the wider workforce. We embrace restraint as a guiding principle, but restraint must be balanced with fair reward for contribution. The board has been gratified by the immediacy of Bernard Looney’s impact in leading the organisation, and in refreshing bp’s purpose, strategy and organisation. We propose to recognize his efforts with an increase of 2.75% salary with effect from the annual general meeting. This increase is significantly lower than the increase that our UK professional workforce will receive on their pay review date in 2021. Murray Auchincloss has likewise made an immediate impact since his appointment. He fully assumed the challenges of the CFO role and has forged a strong partnership alongside Bernard. We set his initial salary in 2020 at a level below comparable rates for finance directors in the FTSE 30, until we could be certain of the contribution he would bring to the role. Shareholders will recall our policy is to keep executive increases within the boundary of wider workforce increases, except in specific circumstances. We find that Murray is already contributing beyond our expectations of even a seasoned CFO. Given his criticality to the execution of our strategy, we conclude that adjusting his below-market salary is such a specific circumstance. We therefore intend to increase his salary by 8% to £750,500, following the annual general meeting, placing him in line with the median rate for FTSE 30 CFOs. It is our intention, subject to the committee’s view of Murray’s continued development and success in role, to bring his salary in line with that of his predecessor and other CFOs in similarly challenging roles. We anticipate that this may require increases somewhat above the wider workforce average in the future. In 2021 we have made an all-employee share award to allow employees to participate in the success that a reinvented bp can deliver. The majority of employees will receive restricted shares vesting in 2025, while more senior employees will receive share options to be exercised from 2025 onward and with a ten-year term. We are bringing our metrics and targets for both the 2021 annual bonus and the 2021-23 performance share into line with bp’s new strategy and the refreshed commitments to financial performance. The changes are described in detail in this report and we hope you will see how closely we have sought to align these targets to the commitments that management have articulated to investors. The 2021-23 awards will be in line with approved policy and the grant size is unchanged from prior years. All share awards will be granted after the annual meeting and pricing will be based on the preceding 90 days. Overview of financial performance, operating achievements, and strategic progress Our 2020 annual bonus plan consisted of measures associated with financial performance and pay outcomes 104 2019 annualoperations. Our long-term share plan consisted of financial measures and strategic progress. Each area of performance is summarized below to provide a sense of how we evaluated overall performance. Financial performance for bonus outcome purposes was measured in terms of underlying replacement cost profit and free cash flow. For performance shares, we measured return on average capital employed (ROACE) and relative total shareholder return (rTSR). In neither the short nor the long-term plan did actual financial performance meet targets. Over the three-year performance period, however, bp ranked third out of the five super- majors for rTSR purposes which accounted for a modest 12.5% vesting of the 2018-20 performance share grant. To offer some perspective, we note that during 2020 the company reduced net debt by $6.5 billion to $39 billion. In announcing the sale of a share of bp’s interest in Oman’s Block 61, we continue making good progress towards the 2025 target of $25 billion of proceeds from divestments. Importantly, too, management initiated the review of bp’s portfolio of assets in 2020 and recommended significant impairments and exploration write- offs. Thus, management took the necessary steps to address the value of our assets given the energy transition, in full knowledge that they would forego near-term benefit because of these actions. We think this reflects well on the system of reward – not paying when performance is below expectations – but also on the integrity of the leadership which is nonetheless doing the right thing to create a sustainable future.
105 2017-19Corporate governance bp Annual Report and Form 20-F 2020 Despite the challenges of the pandemic, operations were strong in 2020, with refining availability of 96%, upstream plant reliability of 94%, and delivery of four new major projects. Safety trends were also positive, with process safety events, recordable injury frequency, and other key safety and environmental metrics significantly lower than in 2019. While workforce hours were down, bp people safely managed increased COVID-19-related risks and travel restrictions, and increased quarantine periods associated with cross-border crew rotations, while ensuring safety critical staffing and emergency response preparedness. bp teams also delivered above-target sustainable emissions reductions in 2020. Strategic progress is the other area we assessed; in the 2018-20 performance share plan outcome 106 Executive directors’ pay for 2019 108 2020 remuneration: Policy onit carried a page 110 Alignment20% weight. As we consulted with strategy 111 Wider workforce in 2019 112 Stewardship and executive director interests 114 Non-executive director outcomes and interests 116 Other disclosures 118 Directors’ remuneration report – the 2020 policy 119 “Through a vibrant exchange of views,shareholders, we believe the committee will be wiser.” Paula Rosput Reynolds Committee chair Dear shareholder, Results, progress and incentive outcomes This is my second letter to you as chair of the remuneration 2019 has been another year of challenges and accomplishments in committee. It comes at the end of a period during which we have our operating and financial performance, and concludes a three-year engaged with many of you on our new remuneration policy. I have cycle which has seen significant strategic progress. From a shareholder been fortunate to get to know a number of you individually, and as perspective, robust operating cash flow gave headroom for a committee we have deeply appreciated the spirit of collaboration distributions of $8.3 billion through dividends, together with $1.5 billion evident throughout our dialogue on remuneration matters. of share buybacks. Although recent share price performance has been disappointing for BP and global share markets generally, the year It also comes at a time when, as a global community, we are nonetheless concludes a three-year cycle that has delivered a 29% navigating uncharted territory because of the global onset of total return. coronavirus (COVID-19). None of us yet know quite how broad its impact will be, nor how deeply it will be felt. What we do know is that From our analysis of annual performance outcomes, the committee our industry is seeing a significant demand and supply-side shock, determinedcan appreciate that the 2019 bonus shouldinclusion of ‘strategic progress’ in a scorecard can be 67.5% of maximum, with consequent share price volatility. The boarda double-edged sword. On the one side, measuring strategic progress more specifically aligns our strategy and I will remain rather than the purely formulaic 71.5% derived from the performance close as the situation develops, andreward we will respond with consideration scorecard. This was to reflect our judgment that strong cash receipts ofconfer. On the facts. Clearly, the remuneration targets we have set for the year at year-end would potentially impact receipts in 2020, hence the will need to be adjusted to the circumstances as they unfold. I can reduction in the formulaic result. also confirm that the remuneration committee will monitor business The committee also determined that the performance share conditions and exercise judgement in applying discretion relating to outcome should be 71.2% of maximum. We took the financial 2020 remuneration. We will proceed with great care in determining measures as reported but used our discretion in determining the the timing and magnitude of equity awards. At year-end, when we quality of the strategic progress. We determined that, over the assess performance, we will be thoughtful in the interpretation of three-year performance cycle that ended in 2019, significant results, balanced with the shareholder experience. I do believe thatother side, strategic progress was made towards a lower carbon future. But our the 2020 policy as drafted provides usdoes not always carry with maximum flexibilityit straightforward metrics that are more typically used in message, too, with scoring of strategic progress, is that there is the applying discretion – which the times call upon us to exercise. need for greater pace and accomplishment in the years ahead. Turning to our 2019 report, we cover three areas. First the To this point, as we look forward, the committee is faced with measuring remuneration outcomes over 2019 and the 2017-19 performance strategic progress through a different lens. As our recently appointed shares cycle are presented, along with a discussion about the BP leadership realigns strategy to reduce the carbon footprint of our relationship between company performance, earned rewards and business with greater urgency,designs. Thus the committee must strikeuse its judgement and explain its rationale. We do so here on page 111. We hope you will agree that we’ve been thoughtful in evaluating the balanceorganization’s strategic performance over the shareholder experience. Second,2018-20 period. Other decisions and forward-looking activity In our approved 2020 remuneration policy, we retained flexibility to adjust performance measures and weightings in both our annual bonus and performance share plans. Given the largely regulatory driven between rewarding progressshift in energy transition mattersthe business mix and rewarding reporting of stewardship and related matters is shown. Third, the deliveryexigencies of our commitmentfinancial frame, for the 2021 annual bonus, we are introducing two new financial measures: cumulative cash cost reductions (weighted at 25%); and an operational measure to strong financial performancereflect margin share from convenience retail and safe 2020 directors’ remuneration policy, which will be the subject of a operations. As we progress the energy transition, we will be faced with binding voteelectrification (weighted at our annual general meeting in May. establishing new goals for which benchmark measures may not be With the number of statutory requirements increasing, this report readily and immediately available. You will read herein, even the question continues to grow. For those of you needing a quick overview, of the peer group to be used to measure relative total shareholder returns I recommend our summary pages on 104 and 110 which reflect (rTSR) is greatly complicated by the question of whose performance outcomes for 2019 and the 2020 policy respectively. should be tracked in the energy transition. 100 BP Annual Report and Form-20F 2019

Corporate governance10%). These changes Remuneration committee Role of the committee • Approve the principles of any equity plan that Meetings and attendance The role of the committee is to determine and requires shareholder approval. The chairman and the group chief executive attend recommend to the board the remuneration policy for • Ensure termination terms and payments to meetings of the committee except for matters the chairmanset chair, executive director and executive directors.leadership team remuneration. It reviews workforce remuneration and monitors related policies, satisfying itself that incentives and rewards are aligned with bp’s culture. In determining executive directors and the executive team are fair. relating to their own remuneration. The group chief the policy, the committee takes into account various • Receive and consider regular updates on executive is consulted on the remuneration of the factors, including structuringworkforce remuneration, and structures the policy to promote workforce views and engagement initiatives chief financial officer, the executive team and more the long-term success of the company and linking related to remuneration, insight from data sources broadly on remuneration across the wider employee reward to business performance. The committee on pay ratio, gender pay gap and other workforce population. Both the group chief executive and chief recognizes the remuneration principles applicable remuneration outcomes as appropriate. financial officer are consulted on matters relating to to all employees below board level. • Maintain appropriate dialogue with shareholders the group’s performance. on remuneration matters. Key responsibilities The group human resources director attends • Recommend to the board the remuneration Membership meetings and other executives may attend where principles and policypolicies for the chairman and the necessary. The committee consults other board Paula Rosput Member since September 2017 executive directors while considering policies committees on the group’s performanceremuneration and on Reynolds and chair since May 2018related policies for employees below the board and the issues relating to the exercise of judgement or executive team. Nils Andersen Member (resigned March 2020) discretion as necessary. • DetermineSet and approve the terms of engagement, Pamela Daley Member The committee met nine times during the year. remuneration, benefits and termination of Sir Ian Davis Member All directors attended each meeting that they were employment for the chairman and the executive Melody Meyer Member eligible to attend, except Nils Andersen who was directors, executiveleadership team and the company Brendan Nelson Member not able to attend two meetings. Pamela Daley and secretary in accordance with the policy. Sir Ian Davis each missed one committee meeting. • Prepare the annual remuneration report to shareholders to show how the policy has been implemented. We understandApprove the principles of any equity plan that requires shareholder approval. Ensure termination terms and payments to executive directors and leadership team are fair. Receive and consider regular updates on workforce views and engagement initiatives related to remuneration, insight from data sources on pay ratio, gender pay gap and other workforce remuneration outcomes as appropriate. Maintain appropriate dialogue with shareholders on remuneration matters. Membership Paula Rosput Reynolds Member since September 2017 and chair since May 2018 Nils Andersen Member (resigned March 2020) Pamela Daley Member Sir Ian Davis Member (resigned 30 December 2020) Melody Meyer Member since March 2020 Brendan Nelson Member Meetings and attendance The chairman and the CEO attend meetings of the committee except for matters relating to their own remuneration. The CEO is consulted on the remuneration of the CFO, the leadership team and more broadly on remuneration across the wider employee population. Both the CEO and CFO are consulted on matters relating to the group’s performance. bp’s EVP people and culture, SVP reward and wellbeing and advisors attend meetings and other executives may attend where necessary. The committee consults other board committees on the group’s performance and on issues relating to the exercise of judgement or discretion as necessary. The committee met nine times during the year. All directors attended each meeting that they were eligible to attend, except Sir Ian Davis who was not able to attend two meetings, and Pamela Daley and Brendan Nelson who each missed one committee meeting. represent the committee’s best judgment for fine-tuning measures to the new strategy. While we are adding two new measures, we will continue to measure annual performance of our operations, of cash generation, of sustainable emissions reductions and of safety. For the 2021-23 performance share awards, we will introduce an earnings per share growth (EBIDA CAGR) measure alongside the existing ROACE measure (each weighted at 20%), and will reduce the weighting on rTSR (from 40% to 20%). Many of you will recall that the relevance of rTSR and the selection of an appropriate peer group were widely, but inconclusively discussed, during our September 2019 stakeholder engagement session. Against that backdrop, our judgment is that if the bp team can achieve the multi-year financial results to which it committed in July 2020, then the team should be rewarded, with only a modest calibration to what other energy companies accomplish over these three years.
106 bp Annual Report and Form 20-F 2020 Directors’ remuneration report continued In this directors’ remuneration report RC profit (loss), underlying RC profit, return on average capital employed, operating cash flow excluding Gulf of Mexico oil spill payments, margin share for convenience and electrification, net debt and cumulative cash cost reductions are matters of great importancenon-GAAP measures. These measures, together with upstream plant reliability and refining availability, are defined in the Glossary on page 341. Also noteworthy for the 2021-23 performance share awards, we are recasting the strategic progress measures to our For our new chief executive officer, Bernard Looney, paythree well-defined areas: (1) delivering value through a resilient and focused hydrocarbon business; (2) building scale and value through investments in lower carbon electricity and energy sources; and (3) accelerating growth in convenience and mobility. Strategic progress metrics will be governed shareholders. Thereforeweighted at 40%. Several shareholders have asked us to be more specific about which measures from the September 2020 presentations we will work closely withintend to use in evaluating strategic progress, and I say more on this at page 109 in the incomingalignment to strategy section. The leadership team has been bold in seeking to transform bp and has shown exemplary cooperation in developing these challenging performance measures. Wider workforce and activities through the pandemic Much of the committee’s time this year was dominated by the 2020pandemic, which had a serious impact on workforce and remuneration policy. Thematters. With our plans to reinvent bp already proceeding when the pandemic hit, bp’s leadership committed that no redundancies would take place for a minimum of three months to allay immediate concerns about job security. Also, bp sought no pandemic relief in the form of grants or furlough funding from any governments anywhere in the world. Despite the limited ability to meet in person, the committee disclosed in October leadership team to assure that goal-setting, in particular for progress 2019 that it had set Bernard’s salary at £1.3 million (approximately 9% against the carbon agenda, remains ambitious while also delivering pay below Bob Dudley’s salary) as of 5 February 2020, with a reduced cash outcomes that align with your own experience. We intend to confer allowance retirement benefit of 15% of salary, which puts his allowance in with shareholders later in 2020 to establish goals once the details of our line with the majority of our wider workforce. Bernard retains a deferred energy transition efforts have been provided. pension benefit from service prior to April 2011, and certain deferred share awards from service prior to 2020. Single figure results for executive directors Earlier this year we made similar announcements regarding the 2019 single figures of total remuneration for Bob Dudley and Brian Gilvary retirement of Brian Gilvary and the appointment of his successor,board engaged with employees virtually throughout the year. Despite the fact that 2020 was a year with many discouraging moments, we find that the employees are $13.23 millionhighly engaged – and £6.56 million respectively, as reported on page 108. Murray Auchincloss, with effect from 1 July 2020. Further detail is These outcomes represent a 13% decrease for Bob, and a 20% decrease provided on page 103willing to speak their minds – which bodes well for the new executives. for Brian, reflecting reductions infuture. From the performance shares outcome, and in particular lower share price growth over the three-year cycle. As noted Our 2020 policy renewal above, the committee applied the well-established formulas where During 2019 we have been grateful for the time and attention our major relevant and, in conjunction with strategic progress, carefully reviewed shareholders gave us as we consulted on requirements for the new the contributionsoutset of the executives. Thepandemic’s impact, mental health as well as physical well-being were of weaker share price 2020 policy.concern. Both Bernard and our chair Helge Lund donated 20% of their salaries to charities dealing with mental health issues from April 2020. In particular, 30 of our largest shareholders joined us in performance on realized valueaddition, Bernard directed the company to make a substantial donation to the UK mental health charity, Mind. This generosity is consistent with the experienceleadership’s support for mental health within the company, and given the duration and far-reaching effects of Septemberthe pandemic, was exceptionally far-sighted. Closing thanks Following their retirement from the board, I thank Nils Andersen and Sir Ian Davis for a novel session focused on expressing unconstrainedtheir many contributions to this committee, while welcoming Melody Meyer and, most recently, Tushar Morzaria. At the annual general meeting, Brendan Nelson plans to stand down and his particular brand of sober judgement will be greatly missed by the committee. The technology we have all deployed in the last year has only served to enhance our consultation with shareholders and thustheir advisors. These virtual face-to-face contacts from our respective homes have allowed for frequent conversations. We thank you for fitting us into your long days, and as you review the details provided in this report, we deem these outcomes reasonable. views onwelcome your comments. Paula Rosput Reynolds Chair of the remuneration arrangements. Together with subsequent For an overviewcommittee 22 March 2021
107 Corporate governance bp Annual Report and Form 20-F 2020 Remuneration at a glance Purpose and key features Outcomes for 2020 Implementation in 2021 Salary and benefits Fixed remuneration reflecting the scale and complexity of our executive remuneration structure, please referbusiness, enabling us to discussionsattract and correspondence,keep the key issues emerginghighest calibre global talent. Reviewed annually and, if appropriate, increased following the AGM. Benchmarked to market at inception with increases limited to those of our wider workforce, except in specific circumstances. Bernard Looney’s salary set at £1,300,000 on appointment. Murray Auchincloss’s salary set at £695,000 on appointment. Bob Dudley’s salary unchanged at $1,854,000 until cessation. Brian Gilvary’s salary unchanged at £790,500 until cessation. Benefits were unchanged. Bernard’s salary to increase by 2.75% to £1,335,750 from the AGM. Murray’s salary to increase by 8% to £750,500 from the AGM. Benefits to remain unchanged. Retirement benefits To recognize competitive practice in home country. Bernard is a deferred member of a UK final salary pension plan, but now receives a cash allowance in lieu of retirement benefits. Murray is a deferred member of a US final salary pension plan, but now receives a cash allowance in lieu of retirement benefits. Bob was a member of both a US final salary pension plan and a US retirement savings plan. Brian was a member of a UK final salary pension plan and received a cash allowance in lieu of further service accrual. Bernard has no further service accrual for his deferred pension, and the pension calculation will be based on his pre-appointment salary. His cash allowance is fixed at 15% of salary. Murray has no further service accrual for his deferred pension arrangement, and the pension calculation will be based on his pre-appointment salary. His cash allowance is fixed at 15% of salary. Bob’s defined benefit pension did not increase in 2020. bp actual and notional retirement savings plan contributions of $32,445 were more than offset by investment losses within his plans, hence he received no net benefit in 2020. Brian’s defined benefit pension increase was below inflation. His cash allowance was 30% of salary to 30 May, and 25% of salary from 1 June 2020. Bernard’s cash allowance will be unchanged at 15% of salary, and he accrues no further value under his deferred pension. Murray’s cash allowance will be unchanged at 15% of salary, and he accrues no further value under his US deferred pension. Annual bonus To incentivize delivery of our annual and strategic goals. 112.5% of salary at target, and 225% at maximum. To reinforce the long-term nature of our business and the importance of sustainability, 50% of the bonus is paid in cash and 50% is mandatorily deferred and held in bp shares for three years. No bonus for 2020. For our 2021 bonus, our scorecard will be reweighted to safety (15%), environment (15%), operational (20%) and financial (50%), as described on page 125. Performance shares To align reward to our strategy and long-term performance. Vesting outcomes vary relative to our financial returns and strategic priorities. Annual grant of performance shares, representing the maximum outcome. 500% of salary for the “at a glance” tablechief executive officer and 450% of salary for chief financial officer. Awards granted in 2018 (under our 2017 policy) were assessed against our balanced scorecard of financial (80%) and strategic progress (20%) measures. Our 2018-20 performance share outcome is 32.5% of maximum vesting. Awards granted in 2019 (under our 2017 policy) will vest in proportion to success against the measures of our 2019-21 scorecard. For the 2021-23 cycle (under our 2020 policy), grant levels will remain unchanged at 500% for Bernard and 450% for Murray, with weightings of 20% each for rTSR, ROACE and EBIDA CAGR, and 40% for strategic measures, as shown on page 103. consideration125. Shareholding requirement To ensure sustained alignment between shareholder and executive director interests. The chief executive officer and other executive directors are required to maintain shareholdings equivalent to 500% and 450% of salary respectively, including for two years post employment (2020 policy). Both former executive directors materially exceed their post- employment share ownership requirements of two and a half times salary (pre-dating the 2020 policy). Bernard and Murray have been: Succession arrangements • Clearnot yet achieved their minimum shareholding requirement (they must do so within five years of appointment). The minimum shareholding requirements remain unchanged.
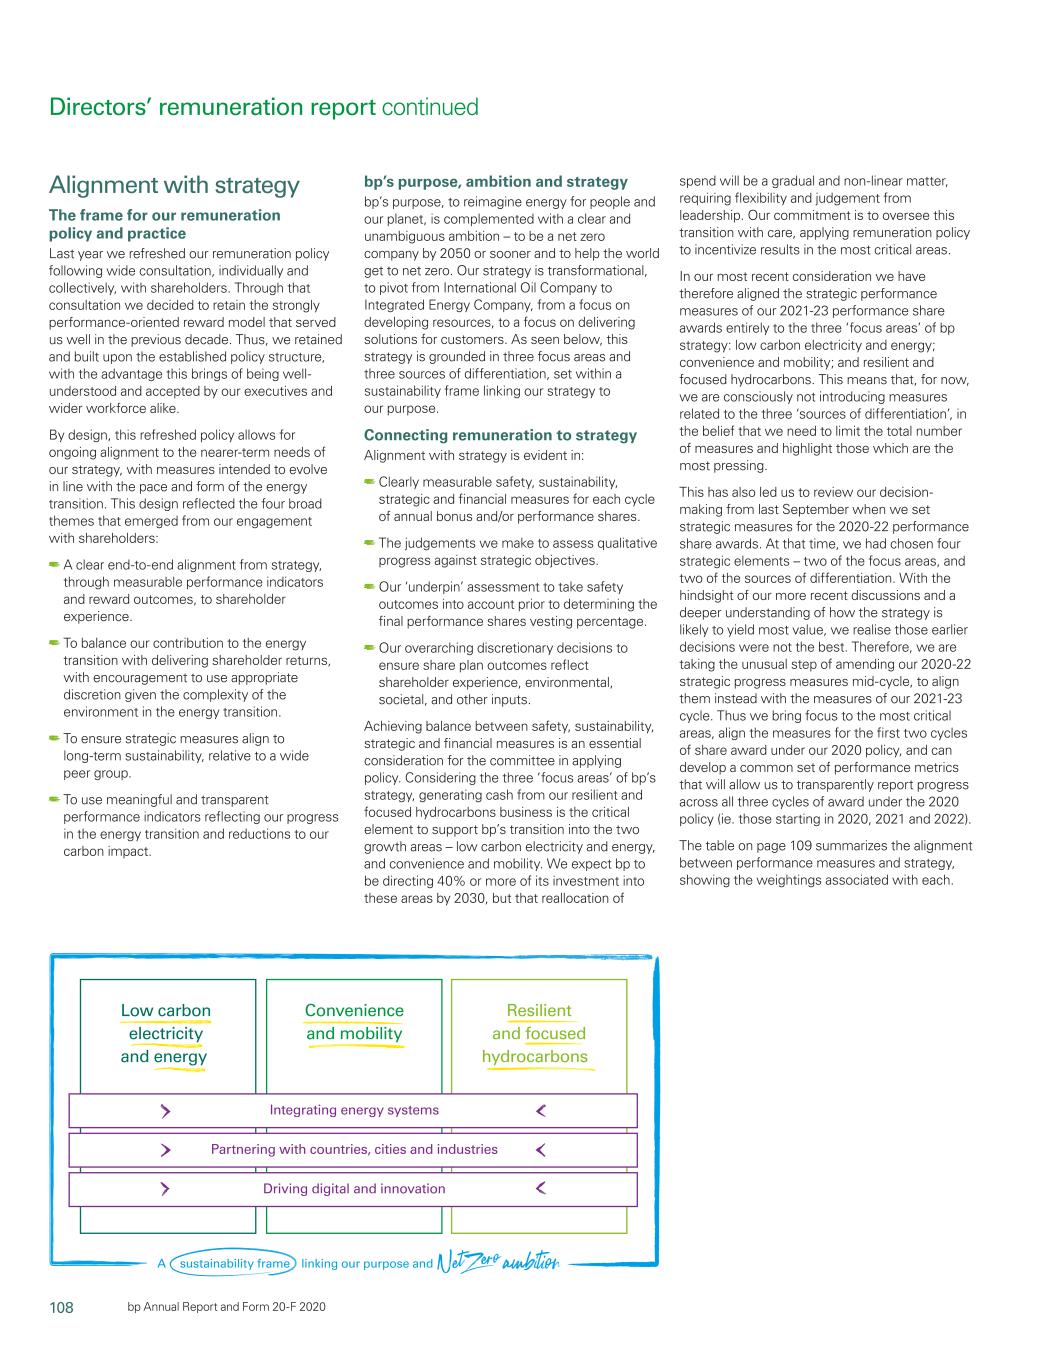
108 A sustainability frame linking our purpose and Integrating energy systems Partnering with countries, cities and industries Driving digital and innovation Low carbon electricity and energy Convenience and mobility Resilient and focused hydrocarbons bp Annual Report and Form 20-F 2020 Directors’ remuneration report continued Alignment with strategy The frame for our remuneration policy and practice Last year we refreshed our remuneration policy following wide consultation, individually and collectively, with shareholders. Through that consultation we decided to retain the strongly performance-oriented reward model that served us well in the previous decade. Thus, we retained and built upon the established policy structure, with the advantage this brings of being well- understood and accepted by our executives and wider workforce alike. By design, this refreshed policy allows for ongoing alignment to the nearer-term needs of our strategy, with measures intended to evolve in line with the pace and form of the energy transition. This design reflected the four broad themes that emerged from our engagement with shareholders: A clear end-to-end alignment from strategy, through measurable performance indicators and reward outcomes, to shareholder 2019 also marked a point of succession, as our group chief executive experience. Bob Dudley announced his intention to retire from BP, to be succeeded • BalanceTo balance our contribution to the energy transition with delivering by Bernard Looney. shareholder returns. The committee was encouragedreturns, with encouragement to use appropriate discretion given the complexity of the environment in the Bob has now stepped down from the BP board, and ceases employment energy transition. from 31 March. As we announced in October 2019, he has waived his • Assure thatTo ensure strategic movesmeasures align to long-term sustainability, relative entitlement to notice pay for the unserved part of his notice period, and to a widerwide peer group. to any bonus for any part of 2020. By any measure, Bob has been an • UseTo use meaningful and transparent measures to reflectperformance indicators reflecting our progress in exemplar of corporate service; he leaves BP as a ‘good leaver’ under the energy transition and reductions to our carbon impact. bp’s purpose, ambition and strategy bp’s purpose, to reimagine energy for people and our planet, is complemented with a clear and unambiguous ambition – to be a net zero company by 2050 or sooner and to help the termsworld get to net zero. Our strategy is transformational, to pivot from International Oil Company to Integrated Energy Company, from a focus on developing resources, to a focus on delivering solutions for customers. As seen below, this strategy is grounded in three focus areas and three sources of differentiation, set within a sustainability frame linking our strategy to our purpose. Connecting remuneration to strategy Alignment with strategy is evident in: Clearly measurable safety, sustainability, strategic and financial measures for each cycle of annual bonus and/or performance shares. The judgements we make to assess qualitative progress against strategic objectives. Our ‘underpin’ assessment to take safety outcomes into account prior to determining the final performance shares vesting percentage. Our overarching discretionary decisions to ensure share plan outcomes reflect shareholder experience, environmental, societal, and other inputs. Achieving balance between safety, sustainability, strategic and financial measures is an essential consideration for the committee in applying policy. Considering the three ‘focus areas’ of bp’s strategy, generating cash from our resilient and focused hydrocarbons business is the critical element to support bp’s transition into the two growth areas – low carbon electricity and energy, and convenience and mobility. We expect bp to be directing 40% or more of its investment into these areas by 2030, but that reallocation of spend will be a gradual and non-linear matter, requiring flexibility and judgement from leadership. Our commitment is to oversee this transition with care, applying remuneration policy to incentivize results in the most critical areas. In our most recent consideration we have therefore aligned the strategic performance measures of our executive director incentive plan, and therefore his interests under various deferred2021-23 performance share awards are preserved and will vest in line with scheduled vesting dates and decisions, subject onlyentirely to the committee retaining its discretionthree ‘focus areas’ of bp strategy: low carbon electricity and energy; convenience and mobility; and resilient and focused hydrocarbons. This means that, for now, we are consciously not introducing measures related to the three ‘sources of differentiation’, in the administrationbelief that we need to limit the total number of measures and highlight those which are the most pressing. This has also led us to review our decision- making from last September when we set strategic measures for the 2020-22 performance share awards. At that time, we had chosen four strategic elements – two of the underpinfocus areas, and two of the sources of differentiation. With the hindsight of our more recent discussions and a deeper understanding of how the strategy is likely to yield most value, we realise those earlier decisions were not the best. Therefore, we are taking the unusual step of amending our 2020-22 strategic progress measures mid-cycle, to align them instead with the measures of our 2021-23 cycle. Thus we bring focus to the most critical areas, align the measures for the first two cycles of share award under our 2020 policy, and can develop a common set of performance metrics that will allow us to transparently report progress across all three cycles of award under the 2020 policy (ie. those starting in 2020, 2021 and 2022). The table on safety. BPpage 109 summarizes the alignment between performance measures and strategy, showing the weightings associated with each.
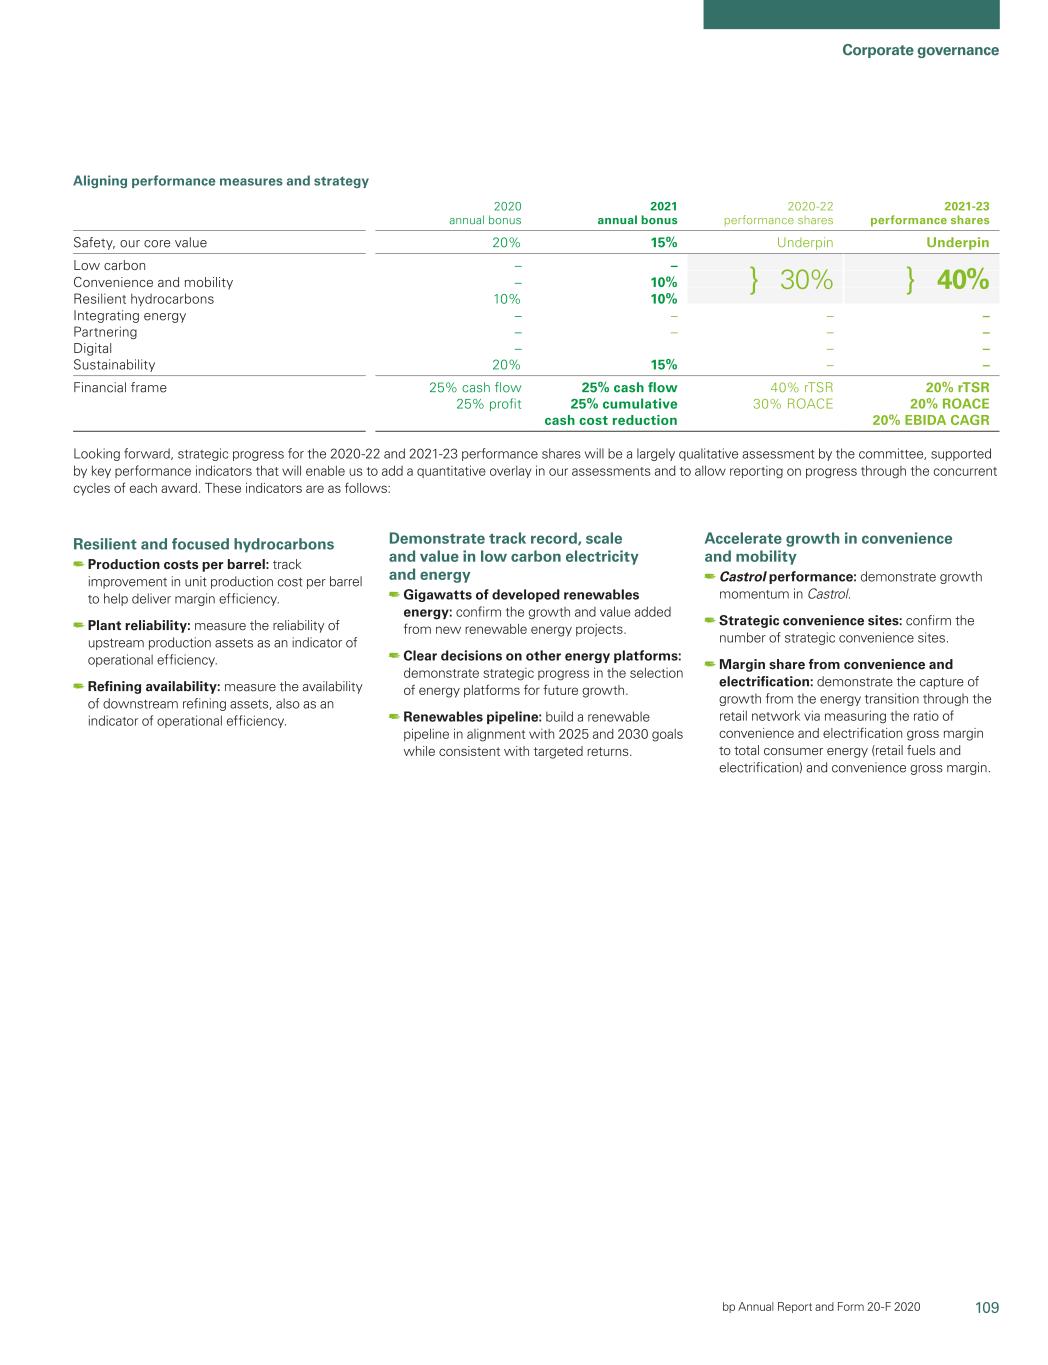
109 Corporate governance bp Annual Report and Form-20F 2019 101

Directors’ remuneration report With all of thisForm 20-F 2020 Aligning performance measures and strategy 2020 annual bonus 2021 annual bonus 2020-22 performance shares 2021-23 performance shares Safety, our core value 20% 15% Underpin Underpin Low carbon – – Convenience and mobility – 10% Resilient hydrocarbons 10% 10% Integrating energy – – – – Partnering – – – – Digital – – – Sustainability 20% 15% – – Financial frame 25% cash flow 25% profit 25% cash flow 25% cumulative cash cost reduction 40% rTSR 30% ROACE 20% rTSR 20% ROACE 20% EBIDA CAGR Looking forward, strategic progress for the 2020-22 and 2021-23 performance shares will be a largely qualitative assessment by the committee, supported by key performance indicators that will enable us to add a quantitative overlay in mind, we have established a policy proposal which As UK remuneration committees now have the regulatory obligation to we believe reflects our strategic imperatives and allows for competitive review remuneration of the wider workforce, our committee has sought remuneration outcomes aligned to the shareholder experience. The to understand how pay practices vary across the globeassessments and to examine proposal makes modest but appropriate adjustmentsallow reporting on progress through the concurrent cycles of each award. These indicators are as follows: Resilient and focused hydrocarbons Production costs per barrel: track improvement in unit production cost per barrel to our 2017 issueshelp deliver margin efficiency. Plant reliability: measure the reliability of fundamental fairness. We examinedupstream production assets as an indicator of operational efficiency. Refining availability: measure the availability of downstream refining assets, also as an indicator of operational efficiency. Demonstrate track record, scale and value in low carbon electricity and energy Gigawatts of developed renewables energy: confirm the growth and value added from new renewable energy projects. Clear decisions on other energy platforms: demonstrate strategic progress in the selection of energy platforms for future growth. Renewables pipeline: build a renewable pipeline in alignment with 2025 and 2030 goals while consistent with targeted returns. Accelerate growth in convenience and mobility Castrol performance: demonstrate growth momentum in Castrol. Strategic convenience sites: confirm the number of strategic convenience sites. Margin share from convenience and electrification: demonstrate the capture of growth from the energy transition through the retail network via measuring the ratio of convenience and electrification gross margin to total consumer energy (retail fuels and electrification) and convenience gross margin. 30%{ 40%{
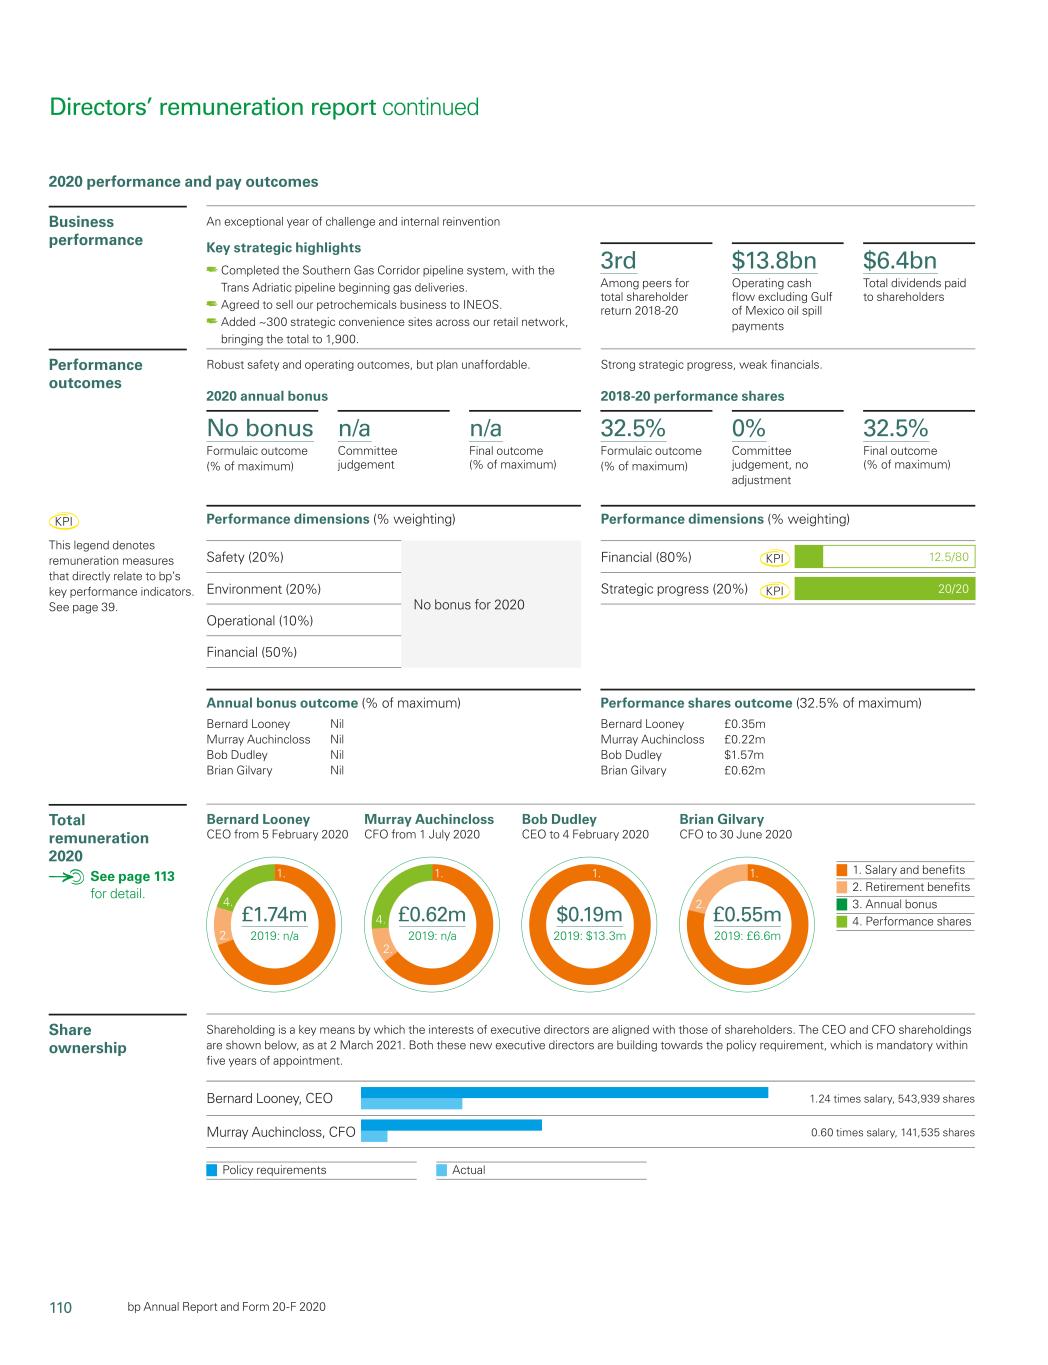
110 Bernard Looney CEO from 5 February 2020 Murray Auchincloss CFO from 1 July 2020 Bob Dudley CEO to 4 February 2020 Brian Gilvary CFO to 30 June 2020 1. Salary and benefits 2. Retirement benefits 3. Annual bonus 4. Performance shares 1. 2. 4. £1.74m 2019: n/a 1. 2. 4. £0.62m 2019: n/a 1. $0.19m 2019: $13.3m 1. 2. £0.55m 2019: £6.6m Bernard Looney, CEO Murray Auchincloss, CFO 1.24 times salary, 543,939 shares 0.60 times salary, 141,535 shares Policy requirements Actual bp Annual Report and Form 20-F 2020 2020 performance and pay outcomes by gender framework which, to our mind, is well understood and has delivered and other criteria. We have also considered how the committee can appropriate resultsBusiness performance Performance outcomes Total remuneration 2020 See page 113 for both shareholders and executive directors. We effectively add value to our stewardship of the wider workforce and studied many far-reaching alternatives in concluding our final proposal our 2020 plans will include some additional engagement in this area. but typically found other approaches carried too much complexity, an The committee reviewed the breadth of historical pension amplified concern given the transition our industry faces. arrangements across the spectrum of our employees in 2019. As an The key changes we are making include a reduced emphasis on relative outcome, BP made changes that have brought pensionsdetail. Share ownership 3rd Among peers for executive total shareholder return but measuring our returns against a more directors and the wider workforce into alignment. diverse group of companies; a sharpened focus on energy transition Our committee appreciated the time and thoughtful input shareholders measures throughout the structure; tighter limits on pension benefits; and their representatives have given to the refreshment of the and a reduction in the number of measures that will be considered for remuneration policy. Through a vibrant exchange of views, we believe the annual bonus plan. the committee will be wiser as it considers executive pay against the Other matters backdrop of a challenging environment. We respectfully ask for your endorsement of the committee’s 2019 remuneration decisions and your Our committee activity in 2019 was extensive. It included a review of approval of the proposed 2020 policy framework. the principles of remuneration to support our updated policy (page 119) and engagement with shareholders and shareholder representatives. We also spent considerable time on remuneration matters related to the succession of the group chief executive and the various leadership changes that followed, in line with our increasing accountability for setting senior executive pay. Paula Rosput Reynolds Chair of the remuneration committee 18 March 2020 In this Directors’ remuneration report RC profit (loss), underlying RC profit, return on average capital employed and operating2018-20 $13.8bn Operating cash flow (excludingexcluding Gulf of Mexico oil spill payments) are non-GAAP measures. These measures and upstream plant reliability, refining availability, major projects and underlying production and reserves replacement ratio are defined in the Glossary on page 335. 102 BP Annual Report and Form-20F 2019

Corporate governance Remuneration at a glance Purpose and Outcomes for 2019 Implementation in 2020 (2020 policy Key features linkpayments $6.4bn Total dividends paid to strategy (2017 policy) proposal unless stated otherwise) Salary and • Salary is reviewed annually • Fixed remuneration • Bob Dudley’s salary • Bob Dudley’s salary to remain at benefits and, if appropriate, increased reflecting the scale and unchanged at $1,854,000. $1,854,000 until he ceases employment following the AGM. complexity of our • Brian Gilvary’s salary on 31 March. • Benchmarked to market at business, enabling us to increased by 2% to • Bernard Looney’s salary is set at inception with increases attract and keep the £790,500. £1,300,000. reflective of those of our highest calibre global • Benefits remain • Brian Gilvary’s salary to remain at wider workforce. talent. unchanged. £790,500 until he ceases employment. • Murray Auchincloss’s salary to be set at £695,000. • Bernard’s benefits remain unchanged. Murray will be eligible for standard UK benefits from his appointment on 1 July. Retirement • Bob is a member of both US • To recognize competitive • Bob’s defined benefit • Arrangements for Bob will continue benefits pension (defined benefit) and practice in home country. pension did not increase in unchanged until he ceases employment on retirement savings (defined 2019. His actual and 31 March. contribution) plans. notional company • Bernard’s cash allowance reduces to 15% • Brian is a member of a UK contributions, together of salary from the date of his appointment. final salary defined benefit with investment returns Accrued service for his deferred pension is pension plan and receives a within his retirement already capped, and the pension cash allowance in lieu of savings plans, amounted calculation will be based on his pre- further service accrual. to $543,661. appointment salary. • Brian’s accrued defined • Brian’s cash allowance is subject to a benefit pension increase previously agreed schedule of reductions was below inflation. He and will terminate when he ceases received a cash allowance employment on 30 June. at 35% of salary to 31 • Murray’s cash allowance will be set at 15% May, and at 30% of salary of salary from his appointment on 1 July. from 1 June 2019, which is He retains a deferred pension arrangement included in the single from his US service, which will be based figure table. on his pre-appointment salary. Annual • 112.5% of salary at target, • To incentivize delivery • Against our scorecard of • Bob has waived any entitlement to an bonus and 225% at maximum. of our annual and safety (20%), environment annual bonus for 2020. • 50% of the bonus is paid in strategic goals. (10%), reliable operations • Brian will qualify for a pro-rated bonus for cash and 50% is mandatorily • The 50% deferral (20%) and financial his service in 2020. deferred and held in BP reinforces the long-term performance (50%), our • Proposed scorecard with four measures shares for three years. nature of our business performance score is across safety (20%), environment (20%), • To continue under 2020 and the importance of 135% of target (67.5% of operational (10%) and financial (50%) policy. sustainability. maximum). performance. Performance • Annual grant of performance • To link the largest part of • Against our balanced • Awards granted in 2018, under our 2017 shares shares, representing the remuneration opportunity scorecard of financial policy, at 500% (Bob Dudley) and 450% maximum outcome. 500% with the long-term measures (80%), and (Brian Gilvary) of salary will vest in of salary for group chief performance of the strategic progress (20%), proportion to success against the executive and 450% of salary business. Theshareholders 32.5% Formulaic outcome our 2017-19 performance measures of our 2018-20 scorecard, on a for chief financial officer. varies with performance score is 71.2% of pro-rata basis for time in service. • Shares only vest to the against measures linked maximum. • For our 2020-23 cycle, grant levels will extent performance directly to financial remain unchanged for our incoming chief conditions are met. returns and strategic executive and chief financial officer at • To continue under 2020 priorities. 500% and 450% of salary respectively, policy. with weightings of 40% for relative total shareholder return (rTSR), 30% for return on average capital employed (ROACE) and 30% for energy transition measures. Shareholding • Executive directors are • To ensure sustained • Both Bob Dudley and Brian • From 2020, executive directors are requirement required to maintain a alignment between the Gilvary materially exceed required to maintain their full minimum shareholding equivalent to at interests of executive the share ownership shareholding requirement for two years least five times their salary. directors and our requirements. post employment. • Additionally, they have been shareholders. • The minimum shareholding requirement expected to maintain remains five times salary for the group shareholdings of at least two chief executive and is four and a half times and a half times salary for two salary for other executive directors. years post employment. BP Annual Report and Form-20F 2019 103

Directors’ remuneration report 2019 performance and pay outcomes Business A strong year of operational performance, set against challenging external conditions. Improvement across safety metrics, and significant growth in our retail business. Strong underlying profits for 2019, with a 29% return to performance shareholders over the three-year cycle. Key strategic highlights • $10 billion underlying replacement cost profit 2nd (29%) $28.2bn $8.3bn • Dividend increased to 10.5 cents per share Among peers for Operating Dividends paid, • Expansion of our convenience partnership sites total shareholder cash flow including scrip to around 1,600 globally return 2017-19 (excluding Gulf of • Created BP Bunge Bioenergia, a world-class Mexico oil spill bioenergy company payments) Performance Strong results for the year, beating targets on five out of six measurement categories in our scorecards. outcomes 2019 Annual bonus 2017-19 Performance shares 71.5% -4.0% 67.5% 71.2% 0% 71.2% Formulaic Committee Final outcome Formulaic Committee Final outcome outcome judgement, (% of maximum) 0% Committee judgement, no adjustment 32.5% Final outcome judgement, (% of maximum) No bonus Formulaic outcome (% of maximum) discretionaryn/a Committee judgement n/a Final outcome (% of maximum) no adjustment reductionPerformance dimensions (% weighting) Annual bonus outcome (% of maximum) Bernard Looney Nil Murray Auchincloss Nil Bob Dudley Nil Brian Gilvary Nil Performance dimensions (% weighting) Performance dimensions (% weighting) Safety (20%) KPI 15.5/20 Financial (80%) KPI 57/80 Environment (10%) KPI 7/10 Strategic progress (20%) KPI 14/20 Reliability (20%) KPI 8.5/20 Financial (50%) KPI 40/50a Annual bonusshares outcome (67.5%(32.5% of maximum) Performance shares outcome (71.2% of maximum)Bernard Looney £0.35m Murray Auchincloss £0.22m Bob Dudley $2,815,763 Bob Dudley $7,936,660$1.57m Brian Gilvary £1,200,572 Brian Gilvary £2,752,815 KPI This legend denotes remuneration measures that directly relate£0.62m Key strategic highlights Completed the Southern Gas Corridor pipeline system, with the Trans Adriatic pipeline beginning gas deliveries. Agreed to BP’s key performance indicators. See page 32. Bob Dudley 18.7% fixed Brian Gilvary 16.7% fixed Total Group chief executive 81.3% variable Chief financial officer 83.3% variable remuneration Salarysell our petrochemicals business to INEOS. Added ~300 strategic convenience sites across our retail network, bringing the total to 1,900. An exceptional year of challenge and benefits, (14.6)% Salaryinternal reinvention Robust safety and benefits, (12.9)% 2019 Retirement benefits, (4.1)% Retirement benefits, (3.8)% Annual bonus, (21.3)% Annual bonus, (18.3)% Performance shares, (60.0)% $13.23m Performance shares, (42.0)% £6.56m 2018: $15.25m Discontinued plans, (23.0)% 2018: £8.22m Shareoperating outcomes, but plan unaffordable. Strong strategic progress, weak financials. Shareholding is a key means by which the interests of executive directors are aligned with those of shareholders. AsThe CEO and CFO shareholdings are shown below, as at 32 March 2021. Both these new executive directors are building towards the policy requirement, which is mandatory within five years of appointment. 2018-20 performance shares No bonus for 2020 both directors had holdings in BP which significantly exceeded our shareholding policy ownership requirement of five times salary. Bob Dudley, Group chief executive 15.18 times salary, 5,290,446 sharesb. Brian Gilvary, Chief financial officer 16.20 times salary, 3,086,437 shares. Policy requirements (5x) Actual a DueSafety (20%) Environment (20%) Operational (10%) Financial (50%) Financial (80%) Strategic progress (20%) KPI KPI KPI This legend denotes remuneration measures that directly relate to rounding, these figures do not precisely equal the overall outcome, 71.5% b Held as American depository shares (ADSs) 104 BPbp’s key performance indicators. See page 39. 2020 annual bonus 20/20 12.5/80 Directors’ remuneration report continued
111 Corporate governance bp Annual Report and Form-20F 2019

Corporate governance 2019 annual bonusForm 20-F 2020 2018-20 performance share plan outcome For 2019Vesting under our performance share plans is assessed using the committee established a bonusgroup performance scorecard of eight As noteworthy asshown on page 112, and subject to any discretionary adjustment by the committee. Bernard and Murray were granted 2018-20 performance share awards under the Group Share Value Plan (GSVP) for bp group leaders, rather than under the Executive Director Incentive Plan (EDIP). The GSVP and EDIP both use the same scorecard, therefore the comments in this result is, we still regard any accident as one too measures across four areas of focus: safety and operational risk, the many, and it is a matter of great regret that two of our colleagues suffered environment, reliable operations and financial performance. These fatal injuries in 2019. To underscore our determination to eliminate these measures align with our strategy and investor proposition and, in tragic incidents, we reflect any fatality in the performance assessment of particular, reflect the annual plan. Seven of the eight measures align the relevant business, thereby causing a material reduction in bonus for with our 2018 scorecard. The eighth measure, sustainable emissions every individual in that business. In reaching our final conclusion, we rely reduction, was new and marked an acceleration of our intent to gear on the judgement of the safety, environment and security assurance elements of financial rewardsection apply equally to our progress in navigatingformer and new executive directors, as well as our group leaders, even though they relate to performance shares awarded under different plans. The financial outcomes for the low committee (SESAC)three-year period were disappointing. Return on the evaluationaverage capital employed averaged 2.6% over 2019 and 2020 (the ROACE measurement period for this cycle), below our threshold level for vesting on this measure. Total shareholder returns turned negative for bp, alongside all our constituent peer companies. bp placed third among our competitor group, however, which yielded formulaic vesting of safety outcomes. carbon transition. Similarly, we sought the input of the audit committee to ensure our In order to build on the strong results of 2018, the committee again set conclusions are robust and properly reflect underlying financial notably stretching targets for each measure. For instance, our 2019 performance relative to markets. This included12.5% (of a review of the threshold outcome for recordable injury frequency was set at the level of adjustments we make in our financial targets to reflect any pricing our 2018 outcome, meaning we had to exceed that 2018 result to achieve impacts, and thereby avoid windfall outcomes in our financial measures. even a minimum contribution to the 2019 bonus. Overall, our focus on For 2019, this led to a proportional reduction in our profit and cash flow safety delivered a year with both the fewest process safety incidents on targets, reflecting the weaker oil price environment. Over the eight years record (excludingpotential 50%). To counter the impact of recent Mexico retailshare price volatility in TSR measures, bp has continued its standard practice of averaging US market prices over the fourth quarter immediately before, and BHP onshore to 2019, we have increased targets four times, and reduced them four aquisitions), andat the lowest recordable injury frequency on record. times, consistently stripping out the impactend of, the price environment. 2019 annual bonus scorecard Thesethree-year performance cycle. Peers in our competitor group may use different pricing methods, leading them to report different ranking outcomes from bp. As reported last year, we introduced four strategic progress measures were set under the terms ofin our 2017 policy, KPI See key performance indicatorsand this is now the second cycle for which we have made an assessment on page 32. Safety Environment Reliable Financial Formulaic 0.31 + 0.14 + operations + performance = score 1.43a 0.17 0.80 out of 2.0 Measures Weighting Threshold (0) Target (1) Maximum (2) Outcome Safety Process safety tier 1 KPI 10% 80 events 72 events 56 events 70 eventsstrategic progress. These were the measures that then positioned bp for the future, and tier 2 eventsb 0 0.1 0.2 0.11 (20% weight) Recordable injury KPI 10% 0.198/200k hrs 0.188/200k hrs 0.168/200k hrs 0.159/200k hrs frequency 0 0.1 0.2 0.20 Outcome 0.31 Environment Sustainable emissions KPI 10% 0.49 mte 1.0 mte 2.0 mte 1.4 mte reductions 0 0.1 0.2 0.14 (10% weight) Reliable BP-operated refining KPI 10% 94.5% 95.0% 95.5% 94.9% availabilityc 0 0.1 0.2 0.08 operations (20% weight) BP-operated upstream KPI 10% 92.6% 94.6% 96.6% 94.4% plant reliability 0 0.1 0.2 0.09 Outcome 0.17 Financial Operating cash flow KPI 20% $24.0 bn $26.5 bn $29.0 bn $28.2 bn (excluding Gulf of Mexico 0 0.2 0.4 0.33 performance oil spill payments) (50% weight) Underlying replacement KPI 20% $8.1 bn $8.9 bn $9.7 bn $10.0 bn cost profit 0 0.2 0.4 0.40 Upstream unit KPI 10% $7.12/bbl $6.72/bbl $6.32/bbl $6.84/bbl production costs 0 0.1 0.2 0.07 Outcome 0.80 Formulaic score 1.4 3 a out of 2.0 Formulaic Input audit Remuneration Final 67.5% scorecardthe committee committee scorecard of outcome and SESAC judgement outcome maximum 1.43 out of 2 No adjustment Minus 0.08 1.35 out of 2 a Due to rounding,found that in all four strategic areas the total does not equal the sumbusiness has delivered fully against intended outcomes. Thus vesting on this element of the parts. b Measure excludes datascorecard is determined to be 20%. The key factors that formed our scoring decision were: Growing gas and advantaged oil in the upstream. Gas production grew from Mexico retail1.11mmboed in 2017 to 1.15mmboed by 2020, with eight major gas projects started up in the period. In the same period bp started up seven major oil projects and have a further eight major oil projects under construction. We purchased BHP tight oil assets, accessing some of the best basins onshore operations for two years fromin the date of their acquisition by BP. c Solomon Associates’ operational availability. BP Annual Report and Form-20F 2019 105

Directors’ remuneration report While we continue to believe these adjustments are appropriate,US. Market-led growth in the downstream. BPWe have continued strategic progress with our convenience partnership model now in around 1,900 sites across the network, with 800 opened since 2017. The growth has materially entered they potentially create some tension betweenbeen driven by the relative basisroll-out of REWE to Go in Germany, our theThorntons business in North America, and new partnerships launched in South Africa, Australia, New Zealand and Portugal. Retail store gross margin has grown 6% per annum since 2017 to over $1bn and is showing resilience despite COVID-19. In growth markets, we doubled our retail marketssites to 2,700 in 2020, expanded our network to over 500 bp-branded retail sites« in Mexico, and Indonesiaopened over 1,400 sites in India with our Reliance joint venture. In our sustainable aviation fuel business, we added 13 new locations to Air bp’s supply network and expanded our overall financial measurement, and shareholders’ experiencehave struck an innovative collaboration with Neste for supply of cash flow and retail network with 850 sites openedsustainable aviation fuel. We have made a further $40 million investment in Fulcrum since 2016. Marketing of premium profit. With this context, we decided to reduce the formulaic bonus fuels has seen compound growth of 7% per annum in these higher scorecard outcome to reflect our judgement that strong cash receipts value sales. at year end would potentially impact receipts in 2020.2017. Venturing and low carbon across multiple fronts. BPLightsource bp now has made Our bonus outcome for 2019 is therefore 135% of target and 67.5% of signature investmentsa presence in BP Chargemaster, our DiDi fast-charging joint maximum. This compares with 81% of target and 40.5% of maximum venture14 countries, up from five in China and Lightsource BP, all of which underpin growth in in 2018. With the rigour of our process and discussions, and the support electric vehicle charging and solar. We merged our biofuels business we have received from the SESAC and audit committee, we believe the with another operator to create BP Bunge Bioenergia thereby creating 2019 annual bonuses fairly reflect and reward 2019 performance for the synergies and scale for growth in biofuels. We have created a ‘scale-up’ executive directorsdifferentiated strategy in electric vehicle charging through bp pulse and senior leadershipStoredot, which has demonstrated five-minute charging capability. Our focus on reducing emissions has progressed well, with a reduction from 48.8Mte in 2018 to 41.7Mte in 2020, aligning with our net zero ambition. Our 2020 methane intensity is estimated at 0.12%, well below our target of BP. factory known as BP Launchpad, to enhance our access to investment in new ventures, and have increased the portfolio over the last three As shown below, half of the bonus is paid in cash after year end, and years. The committee will be monitoring and measuring the progress half is deferred into shares that will vest in three years, according to of these ventures over time. 2017 policy terms. The full value of the 2019 bonus, including the deferred shares, is included in the 2019 single figure table. This differs0.2% Gas power and renewables trading and marketing growth. We from reporting in respect ofremain the 2014 policy, under which deferred noted robust early progress with BP’s new integratedlargest US gas and power shares relatedmarketing company. In 2018 and 2019 we added six advanced liquified natural gas (LNG) tankers to the 2016 bonus are includedbp-operated fleet; our Tangguh LNG expansion started drilling in the 2019 single figure, organization, mainly through a growing presence as a merchant2019; and Train 2 of our Freeport LNG began commercial operations in the i.e. the year in which they vest. global LNG trade, although financial results remain volatile. We also Adjusted Paid Deferred into noted the development of infrastructure to undertake renewables outcome in cash BP shares trading, which has included building diverse counter-party relationships, Bob Dudley $2,815,763a $1,407,881 $1,407,881 such as2020, with renewable energy source producers and owners of forests Brian Gilvary £1,200,572 £600,286 £600,286 for the purposes of creating a market for natural climate solutions (NCS).first gas deliveries from bp under our 20-year tolling agreement. Along with the combination of financial and strategic measures, that a Due to rounding the total does not match the sum of the parts. shareholders approved in the 2017 policy, the provision for ‘underpin’ The annual bonus outcome is unrelated to the BP share price, and decision by the committee was instituted. Namely,considers an ‘underpin’ decision before deciding on therefore no part of the bonus is attributable to share price appreciation. the final result, the committee takestaking a broader view of performance to ensure that the reward outcomes alignoutcome aligns with absolute shareholder returns, 2017-19 performance share plan outcome safety and environmental factors, and progress in low carbon and climate change matters. Our conclusion isconsiderations. The committee has been mindful of the need to take an even broader perspective, and thus consider executive outcomes in relation to societal matters in general and our wider workforce in particular. While absolute returns disappoint, we find that returnsall aspects of the underpin support at least 32.5% vesting, which from the 2017-19 Vesting levelsa participant’s perspective reflects a poor return for the 2017-19efforts expended. Therefore, our overall judgement is to leave the vesting outcome unadjusted. As mentioned above, this scorecard outcome applies to all participants in both the EDIP (for executive directors) and the GSVP (for group leaders). With time pro-ration for Bob and Brian to reflect their periods of service during the three-year performance period, this vesting delivers the outcomes detailed below. For Bernard and Murray these values are included in the single figure table on page 113, whereas for Bob and Brian they are reported in the payments for past directors section at page 122. 2018-20 performance share awards are performance shares cycle are proportional and appropriate. Therefore, determined under the terms of the 2017 policy, in line with the we have made no further adjustment to the scorecard outcome. Vesting performance measures andplan outcomes shown on the scorecard on therefore has been set at 71.2% of maximum, delivering the outcomes page 107, and the committee’s broader deliberations in line with the detailed below. ‘underpin’ established in that policy. The scorecard for this period included relative total shareholder return (50%), return on average(audited) Shares awarded Shares vesting including dividends Value of capital employed (30%) and four strategic progress measures (20%) Shares awarded dividends vested shares, that are assessed both quantitatively and qualitatively.Feb/ Mar 2021 Impact of share price changea Bernard Looney 158,690b 126,134 £350,652 -£228,991 Murray Auchinclossc 77,958b 62,124 $275,934 -$111,497 Bob Dudleya 1,571,628 1,319,478 $7,936,660 Assessed against the two financial scorecard measures, the group’sDudleyc 1,395,600 410,922 $1,566,298 -$962,923 Brian Gilvary 722,093 606,347 £2,752,815 performance696,705 227,337 £618,357 -£430,217 a These values reflect the impact of the reduction in share price since grant related to the number of shares that vest, excluding dividend equivalents. b Share grants under the GSVP are made at 50% of maximum, not at 100% of maximum as for the three years from 2017 to 2019 is strong. We placed second on relative total shareholder return (with a 29% total return) aEDIP. c Bob Dudley’s award isDudley and Murray Auchincloss’s awards were granted in respect of American depositary shares (ADSs). The which measures us against our super-major peers, Chevron, numbers in this table reflect calculated equivalents in ordinary shares. One ADS equates to ExxonMobil, Shell and Total. Return on average capital employed six ordinary shares. (ROACE) was 8.9%, comfortably ahead of the 8.1% target. The value of vested shares reflects the share price changes all We introduced the four strategic progress measures in our 2017 policy. shareholders have experienced over the three-year period. For this 2017-19 Hence this is the first cycle for which we have made an assessment on2018-20 award cycle, the original grant was calculated based on ordinary share strategic progress. We find that a rating of 13.8% out of 20% maximum and ADSAmerican depositary share (ADS) prices of £4.73£5.00 and $35.39$39.85 respectively, while the equivalent opportunity is appropriate. Below arevalues at vesting were £2.78/£2.72 (on 16 and 19 February respectively), and $22.87/$26.65 (on 19 February and 10 March respectively). Consequently, the four strategic pillars and a short prices on 18 February 2020, the vesting date, were £4.54 and $36.09. description of some of the factors that influenced our scoring decision: Consequently, share price appreciation in this cycle accounts for $130,549 (1.6%) offall has reduced the initial face value of Bob’s vestedthese awards by approximately 45% for ordinary shares, by 33% for Murray Auchincloss’s ADSs, and none of the Shiftby 43% for Bob Dudley’s ADSs. The committee has made no discretionary adjustment to gas and advantaged oil in the upstream. Gas production value of Brian’s vested shares. has grown 35% (comparing 2019 with 2016), and 75% of all pre-2022 start-ups planned during the 2017-19 cycle are in gas. Pre-2022 start-ups in oil are lower-cost or adjacentvesting outcomes related to existing basins, creating additional value and lowering carbon intensity relative to BP’s legacy portfolio. 106 BPthese share price changes.
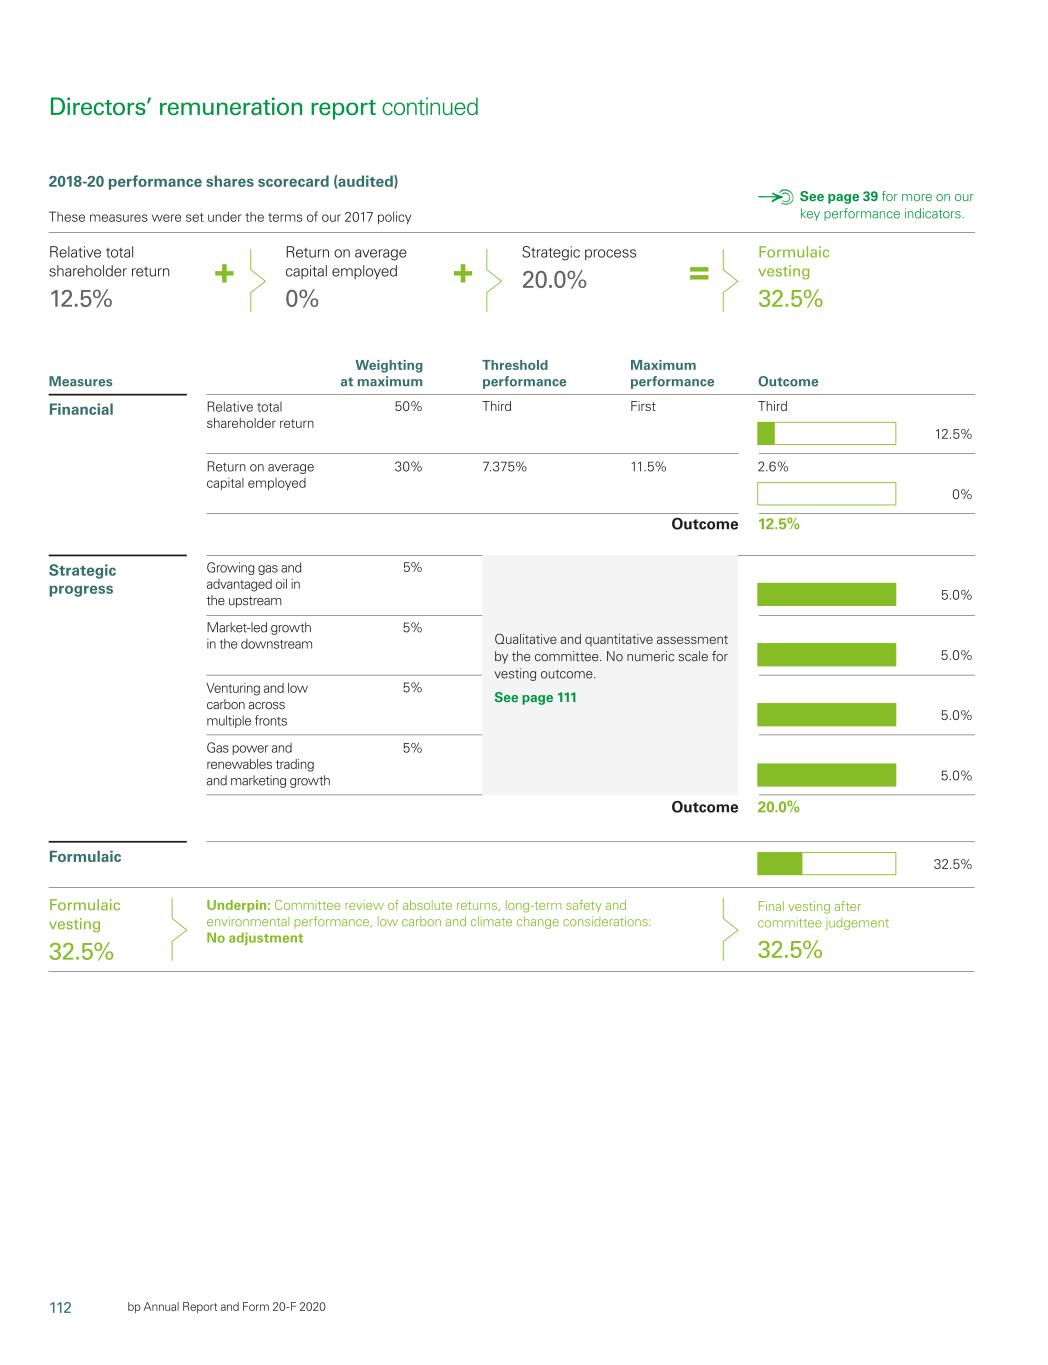
112 bp Annual Report and Form-20F 2019

Corporate governance 2017-19Form 20-F 2020 2018-20 performance shares scorecard (audited) Relative total shareholder return 12.5% Return on average capital employed 0% Strategic process 20.0% Formulaic vesting 32.5% Financial 12.5% 5.0% 0% 5.0% 5.0% These measures were set under the terms of our 2017 policy KPIMeasures Outcome Weighting at maximum Threshold performance Maximum performance See page 39 for more on our key performance indicators on page 32. Financial Strategic progress Formulaic 57.4%indicators. + 13.8%+ = vesting 71.2% Weighting Threshold Maximum Measures at maximum performance performance Outcome Financial Relative total KPI 50% Third First Second shareholder return 40.0% Return on average KPI 30% 7.25% 11.0% 8.9% capital employed 17.4% Outcome 57.4% Strategic Shift to gas and advantaged 5% oil in the upstream 3.75% progress Market-led growth 5% in the downstream Qualitative and quantitative assessment 3.0% Venturing and low carbon 5% by the committee. No numeric scale for across multiple fronts vesting outcome – see page 106. 4.25% Gas power and 5% renewables trading 2.75% and marketing growth Outcome 13.8% Total formulaic 71.2% scoreRelative total shareholder return Formulaic vesting 32.5% Underpin: Committee review of absolute shareholder returns, long-term safety 71.2% vesting and environmental performance, low carbon and climate change considerations. finalconsiderations: No adjustment Final vesting 71.2% after committee judgement 32.5% Venturing and low carbon across multiple fronts Third 7.375% 50% 5% 30% 5% 5% First 11.5% Outcome Outcome 12.5% 20.0% Third Formulaic 32.5% 2.6% Strategic progress 5.0% Growing gas and advantaged oil in the upstream 5% Qualitative and quantitative assessment by the committee. No adjustment judgement BPnumeric scale for vesting outcome. See page 111 Directors’ remuneration report continued
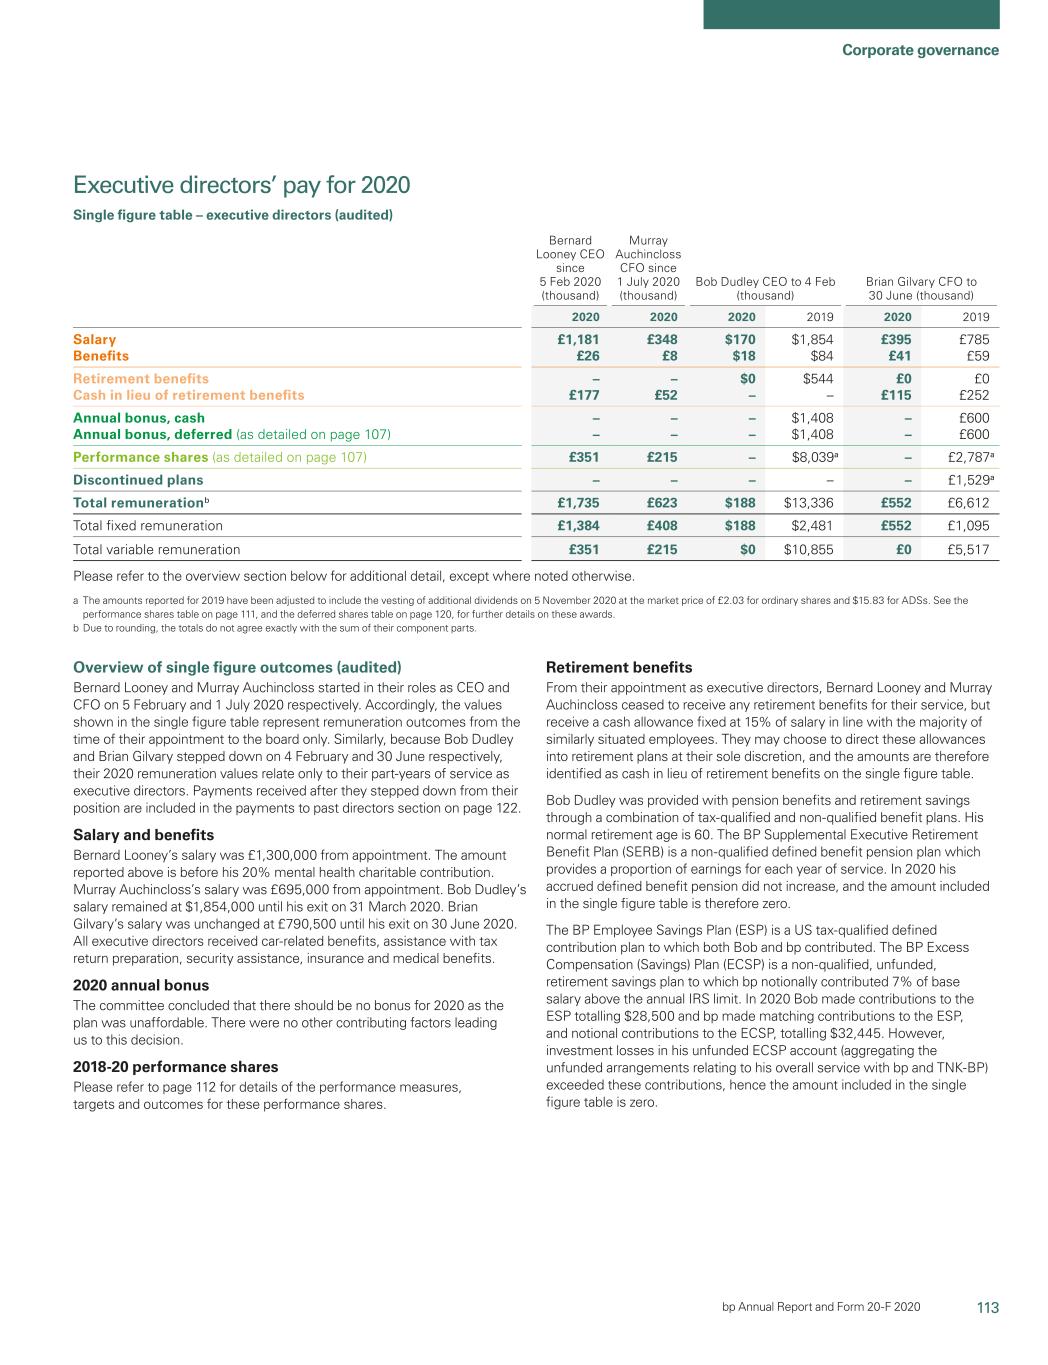
113 Corporate governance bp Annual Report and Form-20F 2019 107

Directors’ remuneration reportForm 20-F 2020 Executive directors’directors’ pay for 20192020 Single figure table –– executive directors (audited) Remuneration is reported in the currencyBernard Looney CEO since 5 Feb 2020 (thousand) Murray Auchincloss CFO since 1 July 2020 (thousand) Bob Dudley CEO to 4 Feb (thousand) Brian Gilvary in which the individual is paidCFO to 30 June (thousand) (thousand)2020 2020 2020 2019 20182020 2019 2018 Salary and Salary£1,181 £348 $170 $1,854 $1,854 £785 £769£395 £785 Benefits £26 £8 $18 $84 £41 £59 Retirement benefits Benefits $84 $79 £59 £67 Retirement Pension and retirement saving – value increasea– – $0 $544 $0 £0 £0 benefits£0 £0 Cash in lieu of future accrual – – £252 £269retirement benefits £177 £52 – – £115 £252 Annual Cash bonus, cash – – – $1,408 $845 £600 £353– £600 Annual bonus, Shares – deferred for three years(as detailed on page 107) – – – $1,408 $845 £600 £353 Performance– £600 Performance shares $7,937b $11,630 c £2,753b £4,295c shares Discontinued Deferred share awards from prior-year bonuses –d –d £1,510e £2,113 e plans Total remunerationf $13,234 $15,253 £6,558 £8,219 Value attributed to share price appreciationg $131 $2,033 – £1,753 a For Bob Dudley this represents the aggregate value of the company match and investment gains on the accumulating unfunded BP Excess Compensation (Savings) Plan (ECSP) account under Bob’s US retirement savings arrangements. Full details are set out(as detailed on page 109. For Brian Gilvary this represents107) £351 £215 – $8,039a – £2,787a Discontinued plans – – – – – £1,529a Total remunerationb £1,735 £623 $188 $13,336 £552 £6,612 Total fixed remuneration £1,384 £408 $188 $2,481 £552 £1,095 Total variable remuneration £351 £215 $0 $10,855 £0 £5,517 Please refer to the annual increase in accrued pension, net of inflation, multiplied by 20. Inoverview section below for additional detail, except where noted otherwise. a The amounts reported for 2019 Brian’s salary increased by less than inflation, hence there is no net increase in accrued pension, and zero is reported as per regulations. Full details are set out on page 109. b Representshave been adjusted to include the vesting of shares on 18 February 2020 following the end of the 2017-19 performance period, based on the assessment of performance achieved under the rules of the plan and includes accruedadditional dividends on shares vested. The value5 November 2020 at the market price of shares at vesting was $36.09 for ADSs and £4.54£2.03 for ordinary shares. c In accordance with UK regulations, in the 2018 single figure table, the performance outcome values were based on fourth quarter average prices of $41.48shares and $15.83 for ADSs and £5.33 for ordinary shares. In May 2019, after the external data became available, the committee reviewed the relative reserves replacement ratio position, and this resulted in no adjustment to the final vesting of 80%. On 3 May 2019, 269,974 ADSs for Bob Dudley and 776,611 ordinary shares for Brian Gilvary vested at prices of $43.08 and £5.53. The 2018 values for the total vesting have increased by $587,301 for Bob Dudley and £211,889 for Brian Gilvary because of the higher share prices and additional accrued dividends. d In line with previous practice Bob Dudley has voluntarily agreed to defer performance assessment and vesting of the awards related to his 2016 annual bonus until at least one year after retirement, therefore the performance period will exceed the minimum term of three years. As stated in the 2017 and 2018 directors’ remuneration reports, Bob voluntarily deferred performance assessment and vesting of the 2014 and 2015 deferred and matching awards until at least one year after retirement.ADSs. See the Deferredperformance shares table on page 115111, and the deferred shares table on page 120, for further details on these awards. e The amounts reported for 2019 relate to the matching element of the 2014 annual bonus deferral, which Brian had voluntarily deferred for an additional two years, and the deferred element of the 2016 annual bonus. These awards vested on 18 February 2020 at the market price of £4.54 for ordinary shares and include accrued dividends on shares vested. The amounts reported for 2018 relate to the 2015 annual bonus, comprising the underlying award that vested on 19 February 2019 at a market price of £5.38 (as disclosed in our 2018 report), and the additional vesting of accrued dividends on 3 May 2019 at the market price of £5.53. See the Deferred shares table on page 115 for further details on these awards. fb Due to rounding, the totals do not agree exactly with the sum of their component parts. g The values shown for performance shares and deferred share awards include the share price appreciation, if any, experienced over the applicable three-year vesting periods. This additional line shows the value of those awards that is directly attributable to share price appreciation, being the number of shares vesting multiplied by the increase in share price from grant date to vesting date. The 2018 values have been restated from the 2018 reported values to exclude share price growth relating to accrued dividends. 108 BP Annual Report and Form-20F 2019

Corporate governance Overview of single figure outcomes (audited) Bernard Looney and Murray Auchincloss started in their roles as CEO and CFO on 5 February and 1 July 2020 respectively. Accordingly, the values shown in the single figure table represent remuneration outcomes from the time of their appointment to the board only. Similarly, because Bob Dudley and Brian Gilvary stepped down on 4 February and 30 June respectively, their 2020 remuneration values relate only to their part-years of service as executive directors. Payments received after they stepped down from their position are included in the payments to past directors section on page 122. Salary and benefits Bernard Looney’s salary was £1,300,000 from appointment. The amount reported above is before his 20% mental health charitable contribution. Murray Auchincloss’s salary was £695,000 from appointment. Bob Dudley’s salary remained at $1,854,000 until his exit on 31 March 2020. Brian Gilvary’s salary was unchanged at £790,500 until his exit on 30 June 2020. All executive directors received car-related benefits, assistance with tax return preparation, security assistance, insurance and medical benefits. 2020 annual bonus The committee concluded that there should be no bonus for 2020 as the plan was unaffordable. There were no other contributing factors leading us to this decision. 2018-20 performance shares Please refer to page 112 for details of the performance measures, targets and outcomes for these performance shares. Retirement benefits From their appointment as executive directors, Bernard Looney and Murray Auchincloss ceased to receive any retirement benefits for their service, but receive a cash allowance fixed at 15% of salary in line with the majority of similarly situated employees. They may choose to direct these allowances into retirement plans at their sole discretion, and the amounts are therefore identified as cash in lieu of retirement benefits on the single figure table. Bob Dudley iswas provided with pension benefits and retirement savings The single figures of total remuneration for Bob Dudley and Brian through a combination of tax-qualified and non-qualified benefit plans. Gilvary are $13.234 million and £6.558 million respectively. This is a His normal retirement age is 60. 13% decrease for Bob, and a 20% decrease for Brian. The BP Supplemental Executive Retirement Benefit Plan (SERB) is a Salary and benefits non-qualified defined benefit pension plan which provides a proportion Bob Dudley’s salary remained at $1,854,000 throughout 2019. Brian of earnings for each year of service. In 20192020 his accrued defined benefit Gilvary’s salary was increased by 2% to £790,500 with effect from pension did not increase, and in accordance with the requirements of UK 21 May 2019. Both executive directors received car-related benefits, regulations, the amount included in the single figure table on page 108 assistance with tax return preparation, security assistance, insurance is therefore zero. and medical benefits. The BP Employee Savings Plan (ESP) is a US tax-qualified defined 2019 annual bonus and 2017-19 performance shares contribution plan to which both Bob and BP contribute.bp contributed. The BP Excess Please refer to pages 105-107 for details of the performance measures, Compensation (Savings) Plan (ECSP) is a non-qualified, unfunded, targets, results and the related reward outcomes for annual bonus and retirement savings plan to which BPbp notionally contributescontributed 7% of base performance shares. salary above the annual IRS limit. In 20192020 Bob made contributions to the Discontinued plans: deferral of 2014 and 2016 bonus ESP totalling $28,000$28,500 and BPbp made matching contributions to the ESP, In accordance with 2014 policy, Bob Dudley and Brian Gilvary and notional contributions to the ECSP, totalling $129,780. In addition to compulsorily deferred one third of their 2016 annual bonus and these contributions, Bob realised$32,445. However, investment gains of $413,881losses in his each received an equivalent value matching award of BP shares. unfunded ECSP account (aggregating the unfunded arrangements Both the deferred and matching awards were subject to a three-year relating to his overall service with BPbp and TNK-BP), exceeded these contributions, hence the amount performance period which ended on 31 December 2019. included in the single figure table is $543,661. Bob has requested that the committee delay the performancezero.
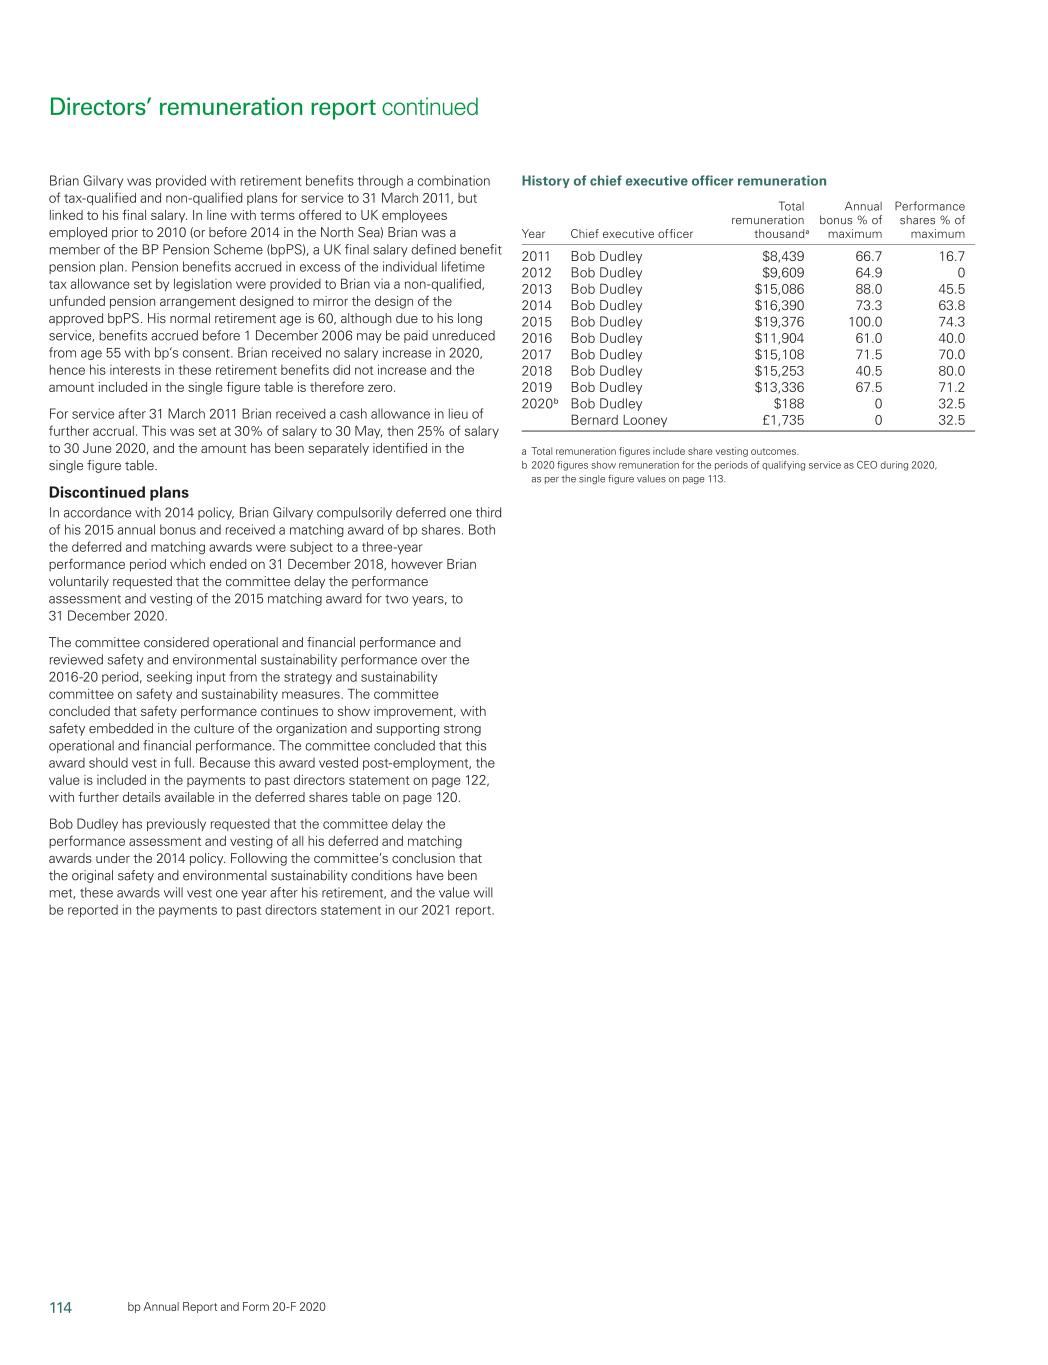
114 bp Annual Report and Form 20-F 2020 Brian Gilvary iswas provided with pensionretirement benefits through a combination of assessment and hence the vesting of his 2016 deferred and matching tax-qualified and non-qualified plans for service to 31 March 2011, but awards. This is a continuing practice from previous years and reflects linked to his final salary, and a cash allowance for service thereafter.salary. In his ongoing commitmentline with terms offered to the long-term success of BP, even post common with more than 3,800 UK employees employed prior to 2010 employment. These awards will vest, subject to an assessment against (or before 2014 in the North Sea) Brian iswas a member of the BP Pension the original safety and environmental sustainability conditions, after Scheme (BPPS)(bpPS), a UK final salary defined benefit pension plan. Pension his retirement. benefits accrued in excess of the individual lifetime tax allowance set by legislation arewere provided to Brian via a non-qualified, unfunded pension Brian had previously voluntarily requested that the committee delay arrangement designed to mirror the design of the approved BPPS.bpPS. His the performance assessment and vesting of his 2014 matching award normal retirement age is 60, although due to his long service, benefits for two years. In 2018 he requested that the committee delay the accrued before 1 December 2006 may be paid unreduced from age 55 performance assessment and vesting of his 2016 matching award with BP’sbp’s consent. until at least one year post employment. In 2019 Brian’sBrian received no salary increase was below inflation. In accordance with For Brian’s 2014 matching awardin 2020, hence his interests in these retirement benefits did not increase and 2016 deferred awards, the the requirements of UK regulations, the amount included in the single figure table is therefore zero. For service after 31 March 2011 Brian received a cash allowance in lieu of further accrual. This was set at 30% of salary to 30 May, then 25% of salary to 30 June 2020, and the amount has been separately identified in the single figure table. Discontinued plans In accordance with 2014 policy, Brian Gilvary compulsorily deferred one third of his 2015 annual bonus and received a matching award of bp shares. Both the deferred and matching awards were subject to a three-year performance period which ended on 31 December 2018, however Brian voluntarily requested that the committee delay the performance assessment and vesting of the 2015 matching award for two years, to 31 December 2020. The committee considered operational and financial performance and figure table on page 108 is zero. reviewed safety and environmental sustainability performance over the 2015-19 and 2017-19 periods,2016-20 period, seeking input from the SESACstrategy and sustainability committee on safety Brian receives a cash allowance of 30% of salary (this will reduce to 25% and sustainability measures. The committee concluded that safety on 1 June 2020 for his last month of service). This amount has been performance continues to show improvement, with safety embedded in separately identified in the single figure table. the culture of the organization and supporting strong operational and financial performance. The committee concluded that these two History of group chief executive remuneration awardsthis award should vest in full. Because this award vested post-employment, the value is included in the payments to past directors statement on page 122, with further details available in the deferred shares table on page 120. Bob Dudley has previously requested that the committee delay the performance assessment and vesting of all his deferred and matching awards under the 2014 policy. Following the committee’s conclusion that the original safety and environmental sustainability conditions have been met, these awards will vest one year after his retirement, and the value will be reported in the payments to past directors statement in our 2021 report. History of chief executive officer remuneration Year Chief executive officer Total Performance Total shares Group chief remuneration thousanda Annual bonus % of maximum Performance shares % of a vesting, Year executive thousand of maximum maximum Shares Vesting including Total value 2010b Tony Hayward £3,890 0 0 Name granted agreed dividends at vesting Bob Dudley $8,057 0 0 Bob Dudleya 2011 Bob Dudley $8,439 66.7 16.7 2016 Deferred award 147,642 –a – – 2012 Bob Dudley $9,609 64.9 0 2016 Matching award 147,642 –a – – 2013 Bob Dudley $15,086 88.0 45.5 Brian Gilvaryb 2014 Bob Dudley $16,390 73.3 63.8 2014 Matching award 176,576 100% 246,359 £1,118,470 2015 Bob Dudley $19,376 100.0 74.3 2016 Deferred award 73,070 100% 86,176 £391,239 2016 Bob Dudley $11,904 61.0 40.0 2016 Matching award 73,070 –a –a –a 2017 Bob Dudley $15,108 71.5 70.0 a Vesting of these awards deferred until at least one year post employment, subject 2018 Bob Dudley $15,253 40.5 80.0 to conditions. 2019 Bob Dudley $13,234$13,336 67.5 71.2 b Based on a vesting share price of £4.54.2020b Bob Dudley $188 0 32.5 Bernard Looney £1,735 0 32.5 a Total remuneration figures include pension. The total figure is also affected by share vesting outcomes and these amounts represent the actual outcomeoutcomes. b 2020 figures show remuneration for the periods up to 2011,of qualifying service as CEO during 2020, as per the adjusted outcome for the years 2012 to 2018 where preliminary assessments of performance for EDIP had initially been made, and the actual outcome for 2019. b 2010 figures show full yearsingle figure values on page 113. Directors’ remuneration for both Tony Hayward and Bob Dudley, although Bob Dudley did not become group chief executive until October 2010. BPreport continued
115 Corporate governance bp Annual Report and Form-20F 2019 109

Directors’ remuneration reportForm 20-F 2020 remuneration: Policy on a page Approach: We will retain the structure that has served well since 2017, reserving increased flexibility to adapt as BP pursues its ambition to become a net zero company by 2050 or sooner, and help the world get to net zero. Salary and Salary will be reviewed annually. Increases are measured against Benefits are unchanged and include car-related provisions (or cash benefits external pay relativity, and will not exceed the increase for our in lieu), security assistance, insurance and medical cover. wider workforce. Retirement New appointees from within the BP group retain previously accrued This is a material reduction from our 2017 policy. benefits benefits. For their service as a director, retirement benefits will be no more than the median provision offered to the widerWider workforce in the UK. Annual bonus Bonus is measured against an annual scorecard. Measures will The committee will set appropriately stretching targets for each include financial (50%), operational (10%), safety (20%) and measure. environmental (20%) goals. Target bonus is 112.5%, and maximum bonus is 225% of salary. The committee holds discretion to choose the specific measures to Half of the bonus for each year is paid in cash, and half is delivered be adopted within each of these categories and the relative as a deferred share award vesting in three years. weightings to assign to them to reflect the annual plan as agreed with the board. Numeric scales are set for each measure, to score outcomes relative to targets. Performance Performance shares are granted with a three-year performance At the outset of each award the committee will review the shares period. Awards to be granted under this policy will vest in 2023, measures that are to govern the award, along with weightings and 2024 and 2025, and shares held until 2026, 2027 and 2028. targets, to ensure they remain focused on delivering the strategy and are in the interests of shareholders. Measures will include rTSR (40%), assessed against a broader peer group, ROACE (30%) and an assessment related to the low carbon Annual grants will be at 500% of salary for the chief executive transition (30%). officer, and 450% of salary for any other executive director. These awards will vest in three years and in proportion to the For 2020 the rTSR peer group will include additional energy outcomes measured through the performance scorecard, with a companies in our sector, but ones who also have low carbon holding period that requires the shares to be retained for a further businesses or material commitments, such as Equinor, ENI and three years. Repsol. BeyondWorkforce experience During 2020 the committee will consider additional companies whose programmes provide meaningful challenge to The committee will assess safety outcomes over the perfomance BP regarding its own lower carbon ambitions. cycle as an underpin in determining the final vesting percentage. Shareholding Chief executive officer to build a shareholding of at least five times Executive directors are required to maintain that level for at least requirement salary, and other executive directors four and a half times salary, two years post employment. within five years of appointment. Malus and Malus provisions may apply where there is: a material safety or Clawback provisions may apply where there is: an incorrect clawback environmental failure; an incorrect award outcome due to outcome due to miscalculation or incorrect information; a miscalculation or incorrect information; a restatement due to restatement due to financial reporting failure or misstatement of financial reporting failure or misstatement of audited results; audited results; or material misconduct. material misconduct; or other exceptional circumstances that the committee considers similar in nature. Committee Under this policy, the committee will hold flexibility to choose the The committee reserves discretion in determining the outcomes flexibility measures and weightings to be adopted for each annual bonus and for annual bonus and performance shares, allowing it to take broad performance shares scorecard, and to adjust the peer group for the views on alignment with shareholder experience, environmental, rTSR measure, at the start of each performance cycle. societal and other inputs. This will allow appropriate re-alignment, over the policy term, to the anticipated evolution of the low carbon competitor market. The table above shows an at-a-glance summary of our proposed 2020 executive director remuneration policy. For the full remuneration policy, which will be proposed for shareholder approval at our 2020 AGM, please see pages 119 to 127. 110 BP Annual Report and Form-20F 2019

Corporate governance Alignment with strategy Bernard Looney recently announced a bold new purpose and ambition The strategic shift that BP signalled in February, and which will be for BP, reaching out to 2050. This reframes a crucial part of our investor further detailed during our capital markets presentation in September, proposition with an explicit commitment to the energy transition that sharply increases the need for the remuneration policy to reflect low investors and wider society rightly expect. It also recommits us to carbon ambitions and the energy transition. For this reason, the delivering competitive financial returns, through our ‘performing while environmental measure in annual bonus will increase from 10% to 20% transforming’ programme. weighting, and the strategic measures for performance share vesting are now explicitly tied to low carbon/energy transition, and carry a 30% While the specifics of our strategic milestones are yet to be defined, weighting. As BP’s leadership continues to develop specific strategic our direction is clear. For alignment of remuneration policy to corporate goals in this space, we are reserving committee discretion to define and strategy, we will broadly retain our policy structure, while reserving communicate the precise measures and weighting that will apply for the specific flexibility to allow an evolution of performance measures and performance share awards, and to adjust from cycle to cycle. their weightings over the three-year policy term. Our 2017 policy structure, driven by an annual bonus and three-year performance shares, has allowed us to harness the energy and commitment of our executive directors and senior leadership through a set of clearly articulated and ambitious goals. By retaining flexibility to adjust performance measures and weightings, we have been able to maintain alignment between shareholders and executives even as BP’s strategy has developed over time. We therefore believe that this combination of structure and flexibility, that has served us well through the last policy cycle, is equally well suited to the transition years ahead. The annual bonus is determined in line with performance relative to annual targets for safety, environmental, operational and financial measures. Performance shares vest in line with performance relative to three-year targets for rTSR, ROACE and a set of low carbon/energy transition measures. This suite of measures allows for an end-to-end alignment between our strategic direction, our executive focus and our remuneration outcomes, always with the underpin of committee discretion to adjust outcomes as appropriate to match shareholders’ own experience. Safety is and will remain a core value, hence continues to drive a material part of the bonus outcome, as well as forming part of the committee’s ‘underpin’ consideration in the finalvesting of performance shares. Likewise, BP has made clear strategic commitment to maintain focus on financial returns to shareholders, which therefore remain well-represented in the performance measures for annual bonus (50% weighting) and performance shares (40% weighting on rTSR and 30% weighting on ROACE). Reflecting the views of our shareholders, we have reduced the rTSR weighting (from 50%) and also started to widen the comparator group. For the first performance share cycle under the new 2020 policy, the comparator group is expanded from the four super majors to include ENI, Equinor and Repsol, all of whom have some lower carbon elements in their strategies. We have studied opportunities to expand the peer group further. But we conclude that other low carbon operators and indices have yet to reach sufficient maturity for inclusion at this time. Nevertheless it is possible that this will change during the policy cycle and hence we retain the discretion to introduce other companies or an index of low carbon companies in the coming equity cycles within the life of this policy. BP Annual Report and Form-20F 2019 111

Directors’ remuneration report Wider workforce in 2019 • An analysis of the use of equity-based reward, to understand the extent to which equity forms a core element of reward in different Workforce experience locations and business areas. • The structure of workforce pensions in the US and UK, to deepen our Delivery of our strategy, both near and long term, depends upon BP’s understanding of the variety of entitlements that exist across success in attracting and engaging a highly talented workforce, and on different levels of the organization, given obligations to honour equipping our people with the skills for the future. While the board legacy arrangements from prior policies. considers ways to deepen engagement with the workforce, and to understand the workplace in its broadest sense, the remuneration This wider workforce context is helpful to our thinking about future committee continuescontinued to receive and review information on pay reward policies. Aside from our specific oversight of remuneration in outcomes and processes for our wider workforce. the IST business, the committee does not intendworkforce in order to supplant the appropriate roletake account of management inwider workforce pay and conditions when setting rewards for the wider During 2019, we have taken a measured path towards deepening our workforce. But the committee believes our engagementexecutive remuneration, and our own understandingto consider alignment between pay structures. As part of this complex field by studying these five areas: experiences in other companies and other industries can be additive to • The overall demographics of the workforce, to understand wherereview we the thought process of management. employ our people, at what levels within the organization, and in what In addition to the board’s workforce engagement initiatives, as a business areas. committee we have startedcarried out a programme of engagement directly •with a diverse range of employees from different parts of the workforce from the front line to corporate office and covering new joiners, employees with long tenure in the organization, and employees of different gender and nationality. The distincttopics discussed addressed bp’s new purpose and ambition, and how this aligns with the organization’s reward frameworks used by our major business areas,programmes. Our enquiries ranged from success in attracting and retaining talent, employee preferences in how pay is delivered, the make-up of the reward package, and programmes to relatedsupport international mobility. A recurring theme was the desire for flexibility, with employees wanting to remuneration. This includes focus group sessions relatedbe empowered to understand differentmake their own choices about how they work and how they are remunerated for their work. Overall we continue to observe well-balanced and structured approaches to fixedreward. Although these approaches vary by business area and location, the core offering for the majority of our workforce is summarized in the table on page 116. We also find that financial reward is complemented with strong emphasis on maintaining a supportive and inclusive working environment. For instance, our commitment to family-friendly leave policies; recognition as a top global employer in Stonewall’s list of the best multinational employers for LGBT+ staff; and scoring 100% for a fourth consecutive year in the Human Rights Campaign’s 2021 Corporate Equality Index, which measures adoption of non-discrimination policies, equitable benefits for LGBT+ employees and families, and supporting an inclusive culture and corporate social responsibility. We are also pleased to confirm that bp is now accredited by the Living Wage Foundation as a real living wage employer in the UK. This ensures all colleagues in our UK businesses and at company-owned sites are paid at least the real living wage and we are now reviewing the position across other bp countries. We apply the insights we gain from engaging with the workforce to challenge leadership generally and to make sure we think about remuneration holistically, not just with regard to those leaders whose pay incentivesis within our remit. This has been more relevant than ever through a year in which the COVID-19 pandemic has had such a significant impact on our people and benefits.business. Wider workforce salary increases were postponed at the normal salary review date 1 April 2020; from 1 October 2020 staff below our remuneration practicessenior leadership level did receive increases. Salaries remained frozen for senior leaders (other than promotions) throughout 2020. Over half of our global workforce participates in an annual cash bonus plan and for 2020 the connectivity we see between This review included a detailed consideration, by wayplan was intended to pay an incentive based equally on individual performance and bp performance. However, as reported in my opening letter, the committee and CEO both concluded that there should be no bonus for 2020 as the plan was unaffordable, and this outcome applies equally to our executive directors, leadership team, and those of case study executive andour wider workforce remuneration. examples, ofwho participate in the progression of total reward across the job hierarchy in seven representative business areas. • A deeper look at annual bonus to buildplan. These decisions reflect our principle of consistency for all those rewarded under our common template. Note, however, that a greater appreciationlimited number of employees, such as those with specific contractual rights or who work in parts of the business with different remuneration models, have received bonus payments for 2020. Looking forward, we have reviewed the role of share plans offered to employees with a view to understanding the extent to which these plans align our wider workforce with bp’s purpose, particularly whether employees are personally invested in the new ambition and geographic profileable to share in success. This review has led to our support for a ‘one off’ equity grant to every bp employee in 2021, vesting in 2025, reflecting our belief in sharing success broadly while aligning employees’ longer-term interests with all shareholders. We have also devoted time to examine the support provided for employee health and wellbeing, to gain a better understanding of our total bonus spend,how these aspects of policy support the organization’s culture and how target levelsencourage appropriate behaviours. This is an ongoing study and we will have more to report next year. Turning to non-discrimination matters, we understand the sharp interest that exists in disclosures of bonus varygender and ethnicity pay gaps. Having reviewed the gender pay gap reports of the last several years we are satisfied that reward processes and decisions are designed and managed to effectively avoid bias, and that reported pay gaps relate in the main to differences in gender representation across the employee hierarchypay hierarchy. We therefore conclude that the narrative accompanying our pay gap reporting is better reflected within bp’s diversity and inclusion reporting, rather than remuneration reporting. With this in our top eight countries.mind, and because bp has committed to annual diversity and inclusion reporting, we will leave additional commentary to that publication, which is expected to be available on the company’s website bp.com next month.
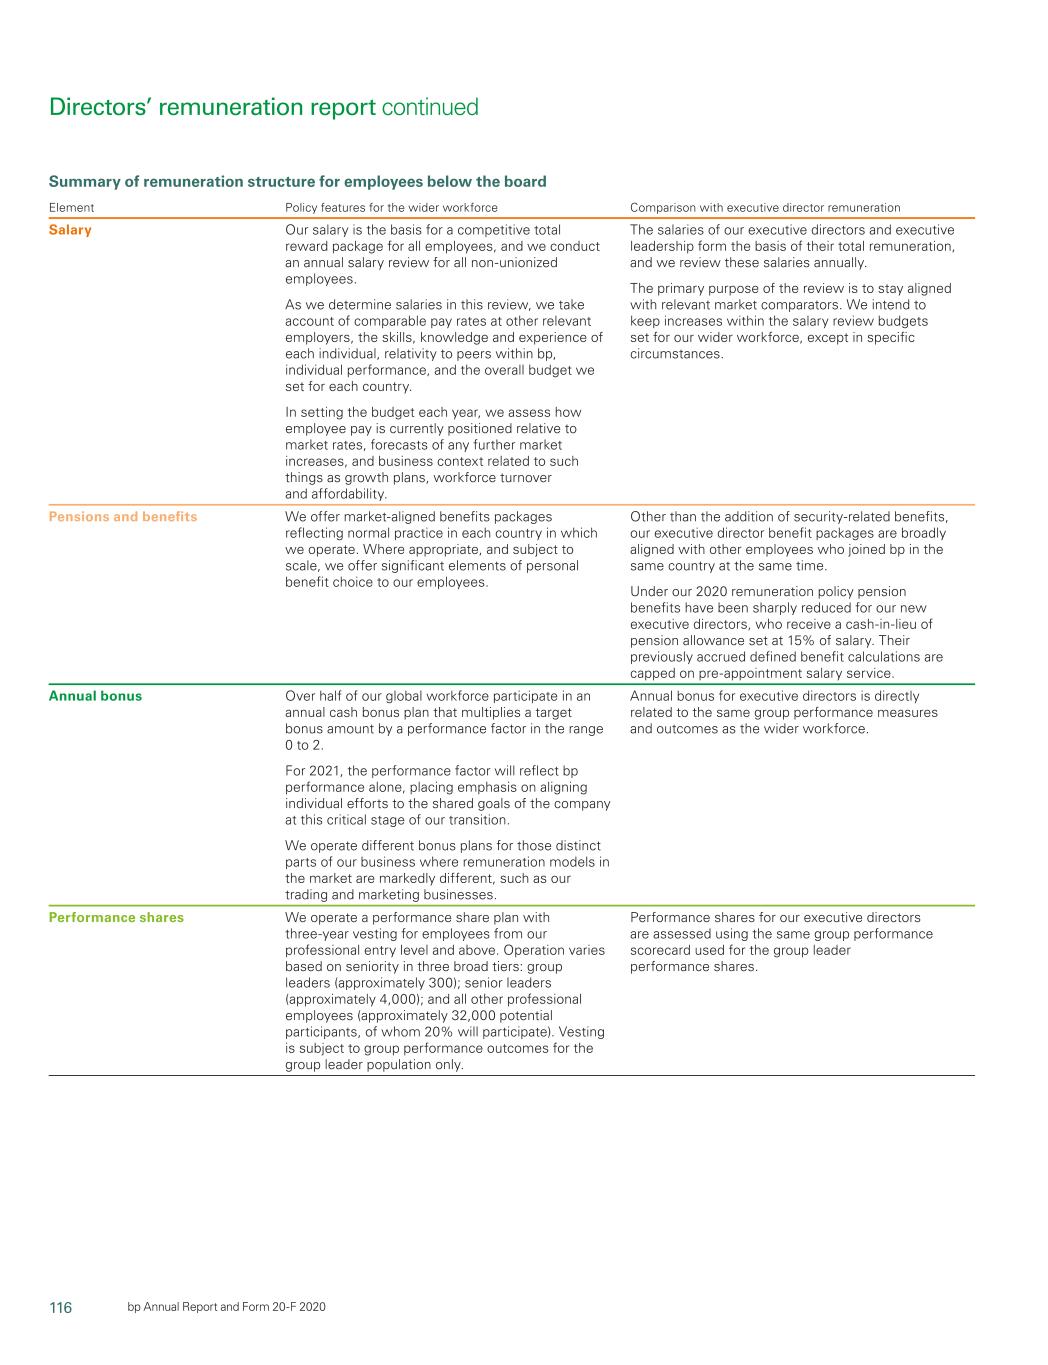
116 bp Annual Report and Form 20-F 2020 Summary of remuneration structure for employees below the board Element Policy features for the wider workforce Comparison with executive director remuneration Salary Our salary is the basis for a competitive total reward package for all The salaries of our executive directors and executive team form the basis employees, and we conduct an annual salary review for all non-unionized of their total remuneration, and we review these salaries annually. employees. The primary purpose of the review is to stay aligned with relevant market As we determine salaries in this review, we take account of marketcomparable pay rates comparators, although we ensure any increases are kept within the of pay at other relevant comparators,employers, the skills, knowledge and experience of budgets set for our wider workforce salary review. each individual, relativity to peers within BP,bp, individual performance, and the overall budget we set for each country. In setting the budget each year, we assess how employee pay is currently positioned relative to market rates, forecasts of any further market increases, and business context related to such things as growth plans, workforce turnover and affordability. The salaries of our executive directors and executive leadership form the basis of their total remuneration, and we review these salaries annually. The primary purpose of the review is to stay aligned with relevant market comparators. We intend to keep increases within the salary review budgets set for our wider workforce, except in specific circumstances. Pensions and benefits We offer market-aligned benefits packages reflecting normal practice in Other than the addition of security-related benefits, our executive benefits each country in which we operate. Where appropriate, and subject to director benefit packages are broadly aligned with other employees who scale, we offer significant elements of personal benefit choice to our employees. Other than the addition of security-related benefits, our executive director benefit packages are broadly aligned with other employees who joined BPbp in the same country at the same time. employees. Given the variety of markets in which we operate, and with For new executive directors,Under our 2020 remuneration policy pension benefits have been sharply the aspect of choice available to many employees, there is no identifiable reduced. Bernard Looney’sreduced for our new executive directors, who receive a cash-in-lieu of pension allowance is set at pension rate for our wider workforce. For context, however, a majority of 15% of salary. HisTheir previously accrued defined benefit calculation is basedcalculations are capped on his pre- our UK employees are entitled to a 15% (of salary) benefits budget. appointmentpre-appointment salary and his accrued service is capped.service. Annual bonus ApproximatelyOver half of our global workforce participate in an annual cash Annual bonus for executive directors is directly related to the same group bonus plan that multiplies a target bonus amount by a performance performance measures and outcomes as the wider workforce, but factor in the range 0 to 2. TheFor 2021, the performance factor is an average of without the individualwill reflect bp performance element. performance outcomes measured at a group and individual level. This structure places equalalone, placing emphasis on aligning individual efforts to the importanceshared goals of an employee’s personal contribution and the results achieved by BP.company at this critical stage of our transition. We operate different bonus plans for those distinct parts of our business where remuneration models in the market are markedly different, such as our trading and marketing businesses. Annual bonus for executive directors is directly related to the same group performance measures and outcomes as the wider workforce. Performance shares We operate a performance share plan with three-year vesting for Performance shares for our executive directors are assessed using the shares employees from our professional entry level and above. Operation varies same group performance scorecard used for the group leader based on seniority in three broad tiers: group leaders (approximately 400)300); performance shares. senior leaders (approximately 4,000); and all other professional employees (approximately 35,00032,000 potential participants, of whom 20% will participate). Vesting is subject to group performance outcomes for the group leader population only. 112 BPPerformance shares for our executive directors are assessed using the same group performance scorecard used for the group leader performance shares. Directors’ remuneration report continued
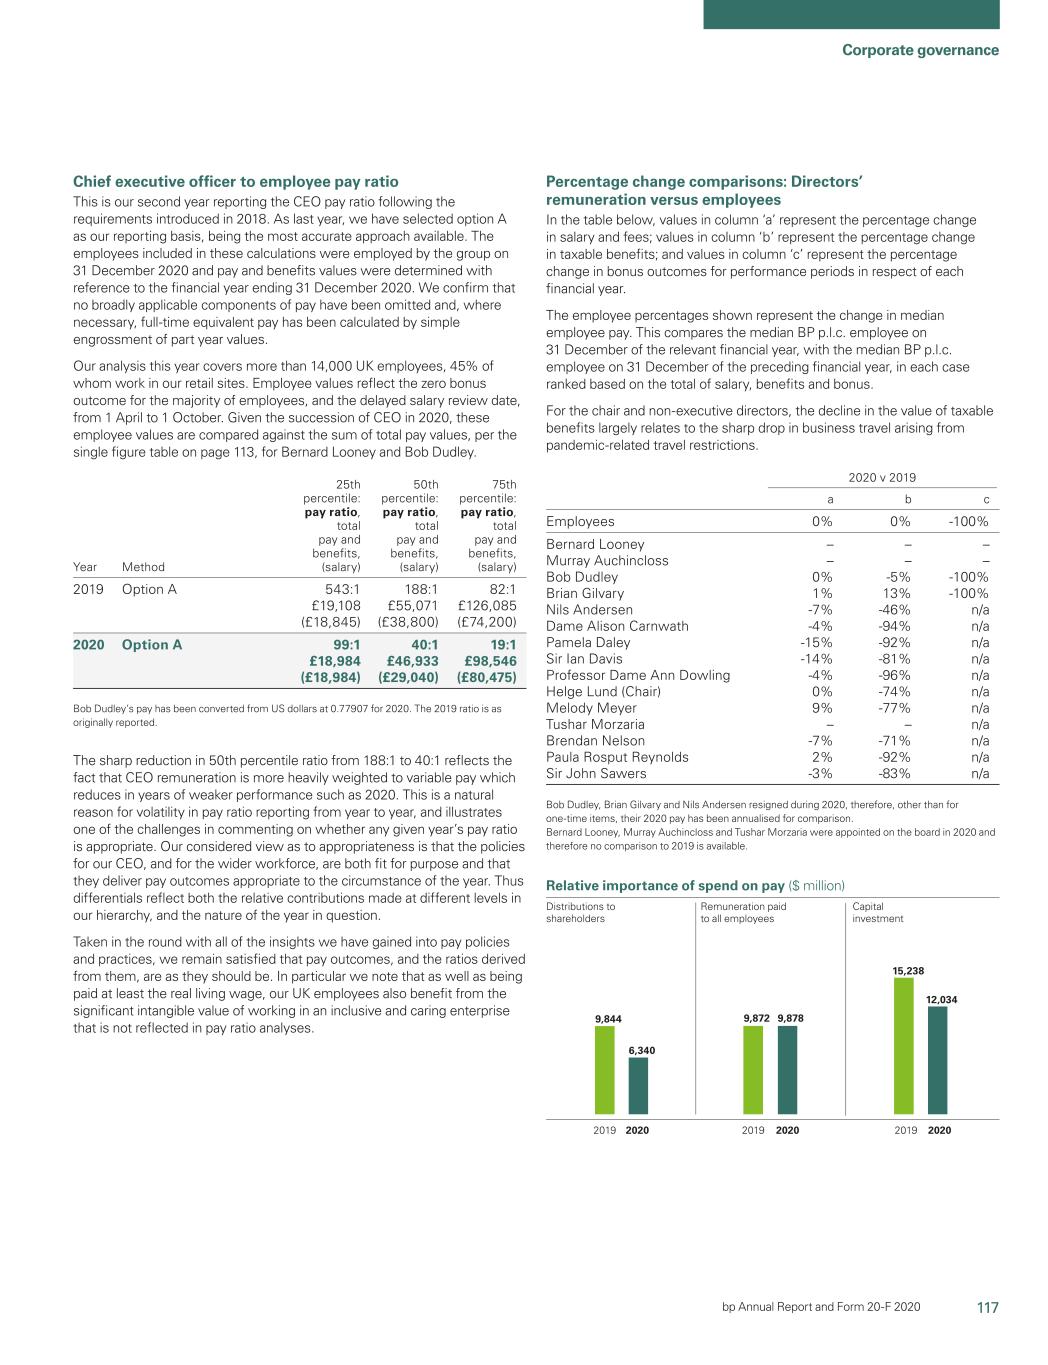
117 Corporate governance bp Annual Report and Form-20F 2019

Corporate governance Group chief executive-to-employeeForm 20-F 2020 Chief executive officer to employee pay ratio EqualThis is our second year reporting the CEO pay and UK gender pay gap reporting Since 2016ratio following the requirements introduced in 2018. As last year, we have disclosed the ratio between our group chief As well as looking at pay structures, the committee has spent time executive’s total remuneration and the median remuneration of a understanding how effectively current pay policies and processes comparator group of our UK and US professional and managerial maintain fairness and avoid bias in pay outcomes. We noted BP’s 2019 workforce (representing 38% of our global professional workforce). UK gender pay gap reporting, published in March 2020, for the five legal This calculation highlights pay differentials across the concentrated entities covered by the regulations, and the explanations provided in the portion of our workforce and thus we have retained this voluntary narrative that accompanied BP’s reporting. measure for the purpose of comparison over time. Overall the committee feels assured that the anti-discrimination For 2019, however, we also report the pay ratio based on the new controls written into pay policies, and the quality of processes behind requirements set out in the 2018 regulations. Given the markedly individual pay decision making, are effective in delivering an equal pay different comparator groups, the voluntary and required pay ratios environment (like pay for like work) for the wider workforce. While the are not directly comparable. The different ratios arise because of two UK gender pay gap reporting showed pay gaps in favour of men for four key differences: the required method includes BP hourly paid retail out of the five entities, we understand that these gaps result largely workforce in its fuels and convenience stations who are employed in from the relative under-representation of women in senior roles, and roles which attract relatively lower market rates of pay; and the required that the group’s primary focus should therefore be on improving method excludes the majority of our professional workforce, namely representation of women, rather than adjusting pay practices. We are those outside the UK, suchselected option A as our Houston, Texas campus. encouraged by the various initiatives taken by management to address these representation concerns and will continue to monitor progress. 25th 50th 50th 75th The illustration below, from our 2019 UK gender pay gap reporting (the percentile percentile percentile percentile most recent available), highlights the representation issue and how it pay ratio pay ratio total pay pay ratio Year Method relates to the gender pay gap for each entity. For instance, our larger 2018 BP voluntary – 106:1 $136,865 – median gender pay gaps relate to BP Exploration and BP p.l.c. where $147,612/ we have the largest differential between representation of women in a a 2019 BP voluntary – 89:1 £115,683 – the top and bottom pay quartiles. By contrast, we reported a negative 2019 Option Ab 543:1c 188:1df £55,071 82:1e median pay gap in BP Chemicals (-12.4%), where male to female representation is more balanced. a Remuneration converted from $ to £ at an exchange rate of 1.276. b Option A has been selected as it isbasis, being the most accurate approach. Payapproach available. The employees included in these calculations were employed by the group on 31 December 2020 and pay and benefits have been calculated using values forwere determined with reference to the financial year endedending 31 December 2019 and2020. We confirm that no broadly applicable components of pay or benefits have been omitted. Full-timeomitted and, where necessary, full-time equivalent remunerationpay has been calculated by mathematical engrossment. BP Exploration Operating c The relevant 25th percentilesimple engrossment of part year values. Our analysis this year covers more than 14,000 UK employees, 45% of whom work in our retail sites. Employee values reflect the zero bonus outcome for the majority of employees, and the delayed salary review date, from 1 April to 1 October. Given the succession of CEO in 2020, these employee values are £19,108compared against the sum of total pay values, per the single figure table on page 113, for Bernard Looney and Bob Dudley. Year Method 25th percentile: pay ratio, total pay and benefits, and £18,845 salary. BP Chemicals Limited Company Limited d The relevant(salary) 50th percentile values are £55,071percentile: pay ratio, total pay and benefits, and £38,800 salary. median(salary) 75th percentile: pay gap -12.4% median pay gap 24.9% e The relevant 75th percentile values are £126,085ratio, total pay and benefits, (salary) 2019 Option A 543:1 £19,108 (£18,845) 188:1 £55,071 (£38,800) 82:1 £126,085 (£74,200) 2020 Option A 99:1 £18,984 (£18,984) 40:1 £46,933 (£29,040) 19:1 £98,546 (£80,475) Bob Dudley’s pay has been converted from US dollars at 0.77907 for 2020. The 2019 ratio is as originally reported. The sharp reduction in 50th percentile ratio from 188:1 to 40:1 reflects the fact that CEO remuneration is more heavily weighted to variable pay which reduces in years of weaker performance such as 2020. This is a natural reason for volatility in pay ratio reporting from year to year, and £74,200 salary. Upper f The company believesillustrates one of the challenges in commenting on whether any given year’s pay ratio is appropriate. Our considered view as to appropriateness is that the 50th percentilepolicies for our CEO, and for the wider workforce, are both fit for purpose and that they deliver pay outcomes appropriate to the circumstance of the year. Thus differentials reflect both the relative contributions made at different levels in our hierarchy, and the nature of the year in question. Taken in the round with all of the insights we have gained into pay policies and practices, we remain satisfied that pay outcomes, and the ratios derived from them, are as they should be. In particular we note that as well as being paid at least the real living wage, our UK employees also benefit from the significant intangible value of working in an inclusive and caring enterprise that is not reflected in pay ratio reflects total pay and benefits values 74% 26% Upper 90% 10% fully in line with reward policies for the group chief executive and the median UK employee respectively, and consequently that the ratio is consistent with policy. 73% 27% 84% 16%analyses. Percentage change comparisons: 88% 12% 80% 20% Lower GCEDirectors’ remuneration versus UK workforce 75% 25% Lower 58% 42%employees In the table below, values in column ‘a’ represent the percentage change in salary and fees; values in column ‘b’ represent the percentage change in taxable benefits; and values in column ‘c’ represent the percentage change in bonus outcomes for performance periods in respect of each financial year. The employee percentages shown represent the change in median employee pay. This compares the median BP Chemicals is our petrochemicals businessp.l.c. employee on 31 December of the relevant financial year, with the median BP Exploration covers Upstream activitiesp.l.c. employee on 31 December of the preceding financial year, in each case ranked based on the total of salary, benefits and bonus. For the chair and non-executive directors, the decline in the UK, principally our operationvalue of taxable benefits largely relates to the sharp drop in Hull. Comparingbusiness travel arising from pandemic-related travel restrictions. 2020 v 2019 a b c Employees 0% 0% -100% Bernard Looney – – – Murray Auchincloss – – – Bob Dudley 0% -5% -100% Brian Gilvary 1% 13% -100% Nils Andersen -7% -46% n/a Dame Alison Carnwath -4% -94% n/a Pamela Daley -15% -92% n/a Sir Ian Davis -14% -81% n/a Professor Dame Ann Dowling -4% -96% n/a Helge Lund (Chair) 0% -74% n/a Melody Meyer 9% -77% n/a Tushar Morzaria – – n/a Brendan Nelson -7% -71% n/a Paula Rosput Reynolds 2% -92% n/a Sir John Sawers -3% -83% n/a Bob Dudley, Brian Gilvary and Nils Andersen resigned during 2020, therefore, other than for one-time items, their 2020 pay has been annualised for comparison. Bernard Looney, Murray Auchincloss and Tushar Morzaria were appointed on the board in 2020 and therefore no comparison to 2018 Salary Benefits Bonus in the UK, principally North Sea operations. % change in GCE remuneration 0% 6.3% 66.7% Men Women % change in comparator group remuneration 3.8% 1.0% 16.8% BP Oil UK Limited BP Express Shopping Limited median pay gap 9.5% median pay gap 4.0% The comparator group used here2019 is our UK workforce, in line with the required basis for chief executive to employee pay ratio reporting and Upper 69% 31% Upper 61% 39% therefore provides a measure of consistency in reporting. 61% 39% 60% 40%available. Relative importance of spend on pay 69% 31% 49% 51% ($ million) Lower 42% 58% Lower 38% 62%20202019 9,844 6,340 Distributions to shareholders 20202019 9,872 9,878 Remuneration paid to Capital investment shareholders all employees BP Oil represents our Downstream BP Express Shopping is our largest UK20202019 15,238 15,140 fuels and lubricants businesses. employing business, concerned with retail operations supporting our UK-wide network of forecourts. 10,497b 9,844a 9,872 BP p.l.c. a 8,435 median pay gap 18.9% Upper 71% 29% 66% 34% 56% 44% 2019 2018 2019 2018 2019 2018 Lower 37% 63% a Distributions to shareholders comprise dividend payments of $8,333 million. ($8,080 million in 2018) and share buybacks at a cost of $1,511 million ($355 million in 2018). BP p.l.c. predominantly covers employees in Bar charts represent the balance between See page 299 for details. corporate business and functions, including male ( ) and female ( ) employees in each b This amount was misstated as $10,494 in our 2018 report. our integrated Supply and Trading and Air total pay quartile of the relevant business. BP businesses. BP12,034 Capital investment
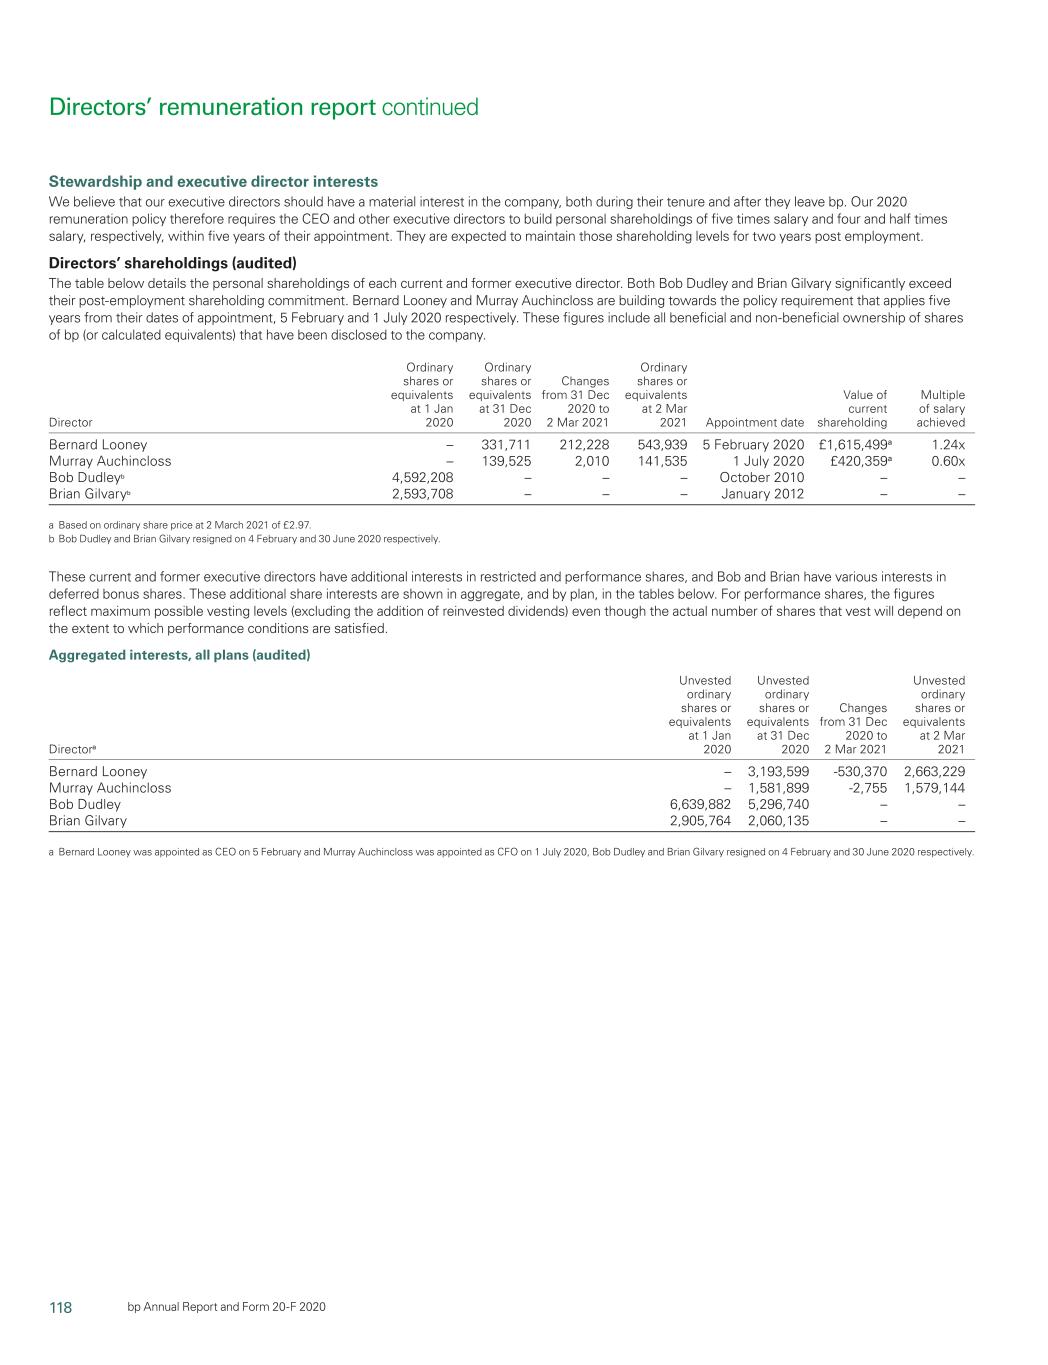
118 bp Annual Report and Form-20F 2019 113

Directors’ remuneration reportForm 20-F 2020 Stewardship and executive director interests Value of current Multiple of Director Appointment date shareholding salary achieved We believe that our executive directors should have a material interest Bob Dudley October 2010 $28,145,173 15.18 x salary in the company, both during their tenure and after they leave BP.bp. Our Brian Gilvary January 2012 £12,808,714 16.20 x salary recent shareholding2020 remuneration policy therefore requiredrequires the CEO and other executive directors to build a personal shareholdingshareholdings of five times their salary and four and half times salary, respectively, within five years of their appointment. They are expected to maintain those shareholding levels for two years post employment. Directors’ shareholdings (audited) The table below details the personal shareholdings of each current and former executive director. Both Bob Dudley and Brian Gilvary significantly exceed their post-employment shareholding commitment. Bernard Looney and Murray Auchincloss are building towards the policy requirement that applies five years from their dates of appointment, 5 February and 1 July 2020 respectively. These figures include all beneficial and non-beneficial ownership of shares of bp (or calculated equivalents) that have been disclosed to the company. Director Ordinary shares or equivalents at 1 Jan 2020 Ordinary shares or equivalents at 31 Dec 2020 Changes from 31 Dec 2020 to 2 Mar 2021 Ordinary shares or equivalents at 2 Mar 2021 Appointment date Value of current shareholding Multiple of salary achieved Bernard Looney – 331,711 212,228 543,939 5 February 2020 £1,615,499a 1.24x Murray Auchincloss – 139,525 2,010 141,535 1 July 2020 £420,359a 0.60x Bob Dudleyb 4,592,208 – – – October 2010 – – Brian Gilvaryb 2,593,708 – – – January 2012 – – a Based on ordinary share price at 2 March 2021 of £2.97. b Bob Dudley and Brian Gilvary resigned on 4 February and 30 June 2020 respectively. These current and former executive directors have additional interests in restricted and performance shares, and Bob and Brian have various interests in both performance shares and deferred of their appointment. They were expected to maintain personal bonus shares under the executive directors’ incentive plan (EDIP). The shareholdings of at least two and a half times salary for two years postshares. These additional share interests are shown in aggregate, and by plan, in the tables below. employment. Updates to this policy are proposed as an integral part of TheseFor performance shares, the figures show thereflect maximum possible vesting levels. Thelevels (excluding the addition of reinvested dividends) even though the actual our 2020 remuneration policy, as detailed on page 121. number of shares/ADSsshares that vest will depend on the extent to which Directors’ shareholdings (audited) performance conditions are satisfied. The tables below detail the personal shareholdings of each currentAggregated interests, all plans (audited) Directora Unvested ordinary shares or equivalents at 1 Jan 2020 Unvested ordinary shares or equivalents at 31 Dec 2020 Changes from 31 Dec 2020 to 2 Mar 2021 Unvested ordinary shares or equivalents at 2 Mar 2021 Bernard Looney – 3,193,599 -530,370 2,663,229 Murray Auchincloss – 1,581,899 -2,755 1,579,144 Bob Dudley 6,639,882 5,296,740 – – Brian Gilvary 2,905,764 2,060,135 – – a Bernard Looney was appointed as CEO on 5 February and recent executive director. BothMurray Auchincloss was appointed as CFO on 1 July 2020, Bob Dudley and Brian Gilvary ordinary shares ordinary shares Changes from ordinary shares significantly exceed the policy requirement at 3 Marchresigned on 4 February and 30 June 2020 with or equivalents at or equivalents as 31 Dec 2019 to or equivalents at Bernard Looney building towards the policy requirement that applies Director 1 Jan 2019 31 Dec 2019 3 Marrespectively. Directors’ remuneration report continued
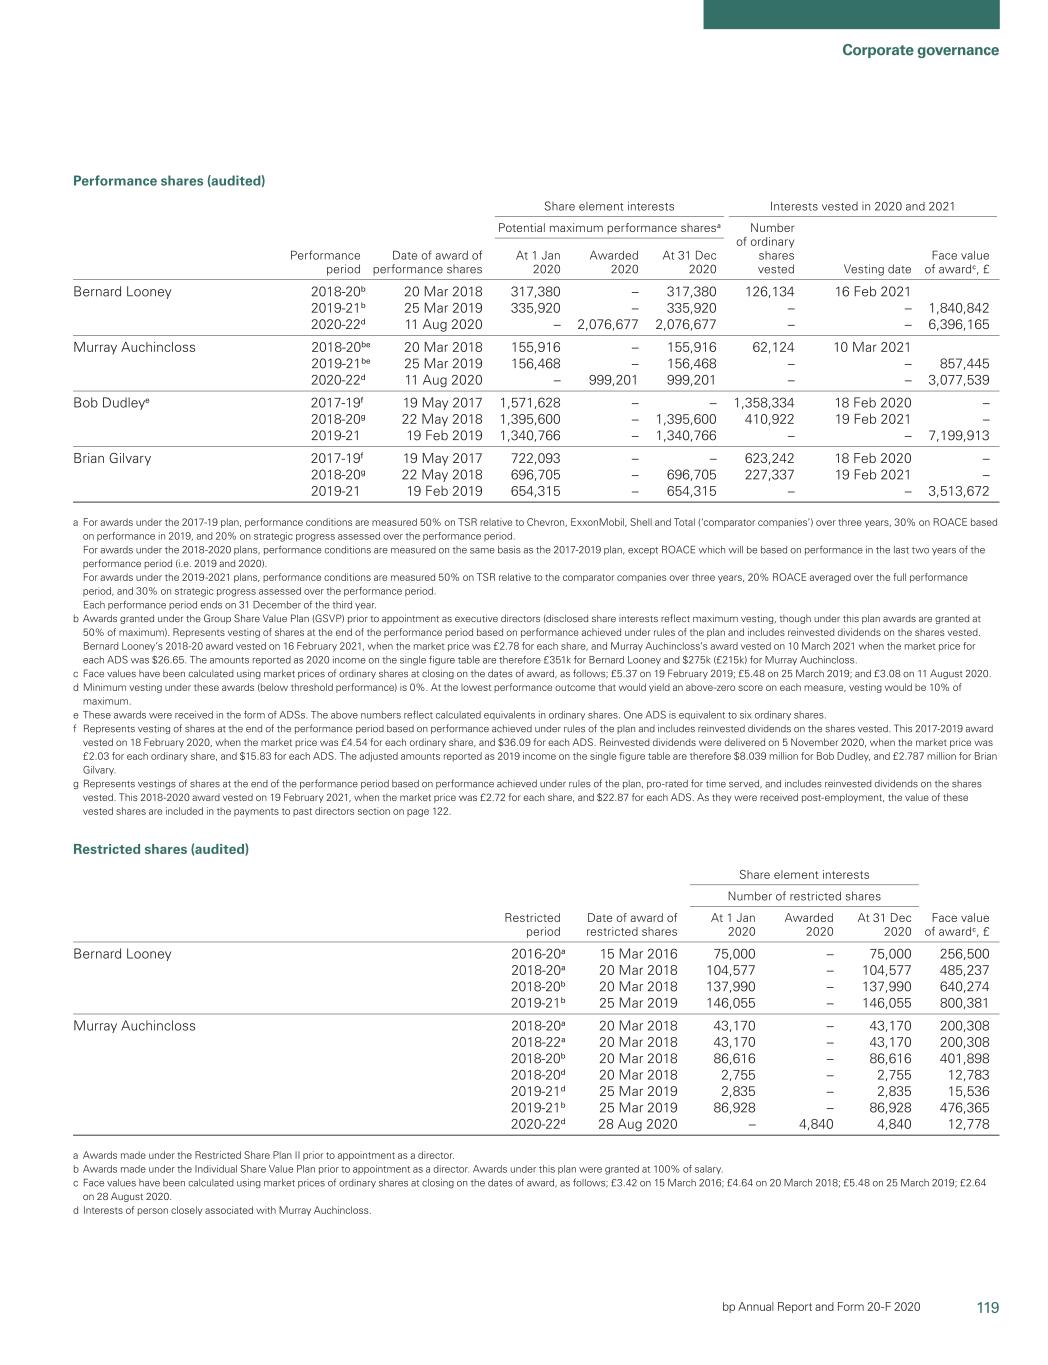
119 Corporate governance bp Annual Report and Form 20-F 2020 3 Mar 2020 five years from his appointment on 5 February 2020. These figures Bob Dudleya 6,825,606b 6,639,882 -1,343,142 5,296,740 include all beneficial and non-beneficial ownership of shares of BP Brian Gilvary 3,291,614 2,905,764 -845,629 2,060,135 (or calculated equivalents) that have been disclosed to the company. a Held as ADSs. b This shareholding has been re-based to reflect the 500% of salary grant level of the 2017 Ordinary shares Ordinary shares Changes from Ordinary shares policy, in place of the original 550% per the 2014 policy. or equivalents at or equivalents at 31 Dec 2019 to or equivalents at Director 1 Jan 2019 31 Dec 2019 3 Mar 2020 3 Mar 2020 Bob Dudleya 3,718,284 4,592,208 698,238 5,290,446 Brian Gilvary 2,043,899 2,593,708 492,729 3,086,437 a Held as ADSs. Performance shares (audited) Performance period Date of award of performance shares Share element interests Interests vested in 20192020 and 2020 a2021 Potential maximum performance sharessharesa Number of Performance Date of award of ordinary shares vested Vesting date Face value of period performance sharesawardc, £ At 1 Jan 20192020 Awarded 20192020 At 31 Dec 2020 Bernard Looney 2018-20b 20 Mar 2018 317,380 – 317,380 126,134 16 Feb 2021 2019-21b 25 Mar 2019 vested Vesting date award, £335,920 – 335,920 – – 1,840,842 2020-22d 11 Aug 2020 – 2,076,677 2,076,677 – – 6,396,165 Murray Auchincloss 2018-20be 20 Mar 2018 155,916 – 155,916 62,124 10 Mar 2021 2019-21be 25 Mar 2019 156,468 – 156,468 – – 857,445 2020-22d 11 Aug 2020 – 999,201 999,201 – – 3,077,539 Bob Dudleyb 2016-18 4 Mar 2016 1,645,074c – – 1,619,844d 3 May 2019d – 2017-19Dudleye 2017-19f 19 May 2017 1,571,628 – 1,571,628 1,319,478e– – 1,358,334 18 Feb 2020e – 2018-202020 – 2018-20g 22 May 2018 1,395,600 –– 1,395,600 – – 8,206,128 f410,922 19 Feb 2021 – 2019-21 19 Feb 2019 – 1,340,766 – 1,340,766 – –– – 7,199,913 g Brian Gilvary 2016-18 4 Mar 2016 786,559 – – 776,611d 3 May 2019d – 2017-192017-19f 19 May 2017 722,093 – 722,093 606,347e– – 623,242 18 Feb 2020e – 2018-202020 – 2018-20g 22 May 2018 696,705 –– 696,705 – – 4,096,625f227,337 19 Feb 2021 – 2019-21 19 Feb 2019 – 654,315 – 654,315 – – 3,513,672g– – 3,513,672 a For awards under the 2016-18 plan, performance conditions are measured one third on TSR relative to Chevron, ExxonMobil, Shell and Total (‘comparator companies’); one third on operating cash flow; and one third on a balanced scorecard of strategic imperatives. There is no identified overall minimum vesting threshold level but to comply with UK regulations a value of 44.4%, which is conditional on the TSR, operating cash flow, each of the strategic imperatives and strategic progress reaching the minimum threshold, has been calculated. For awards under the 2017-19 plan, performance conditions are measured 50% on TSR relative to the Chevron, ExxonMobil, Shell and Total (‘comparator companies’) over three years, 30% on ROACE based on performance in 2019, and 20% on strategic progress assessed over the performance period. For awards under the 2018-2020 plan,plans, performance conditions are measured on the same basis as the 2017-2019 plan, except ROACE which will be based on performance in the last two years of the performance period (i.e. 2019 and 2020). For awards under the 2019-2021 plan,plans, performance conditions are measured 50% on TSR relative to the comparator companies over three years, 20% ROACE averaged over the full performance period, and 30% on strategic progress assessed over the performance period and 20% ROACE averaged over the full performance period. In the event that no threshhold performance targets are met, no shares would vest unless the committee found reason to exercise discretion. Each performance period ends on 31 December of the third year. b Bob DudleyAwards granted under the Group Share Value Plan (GSVP) prior to appointment as executive directors (disclosed share interests reflect maximum vesting, though under this plan awards are granted at 50% of maximum). Represents vesting of shares at the end of the performance period based on performance achieved under rules of the plan and includes reinvested dividends on the shares vested. Bernard Looney’s 2018-20 award vested on 16 February 2021, when the market price was £2.78 for each share, and Murray Auchincloss’s award vested on 10 March 2021 when the market price for each ADS was $26.65. The amounts reported as 2020 income on the single figure table are therefore £351k for Bernard Looney and $275k (£215k) for Murray Auchincloss. c Face values have been calculated using market prices of ordinary shares at closing on the dates of award, as follows; £5.37 on 19 February 2019; £5.48 on 25 March 2019; and £3.08 on 11 August 2020. d Minimum vesting under these awards (below threshold performance) is 0%. At the lowest performance outcome that would yield an above-zero score on each measure, vesting would be 10% of maximum. e These awards were received awards in the form of ADSs. The above numbers reflect calculated equivalents in ordinary shares. One ADS is equivalent to six ordinary shares. c Bob Dudley has requested that the EDIP performance sharesf Represents vesting in respect of the performance period 2016-2018 is based on the 500% maximum annual award level which applies under the 2017 directors’ remuneration policy, rather than the 550% maximum annual award level which applied under the 2014 directors’ remuneration policy. d Represents vestings of shares made at the end of the relevant performance period based on performance achieved under rules of the plan and includes reinvested dividends on the shares vested. This 2016-2018 award vested on 3 May 2019. The market price of each share at the vesting date was £5.48 and for ADSs was $43.08. Details can be found in the single figure table on page 108. e Represents vestings of shares made at the end of the relevant performance period based on performance achieved under rules of the plan and includes reinvested dividends on the shares vested. This 2017-2019 award vested on 18 February 2020. The2020, when the market price ofwas £4.54 for each ordinary share, atand $36.09 for each ADS. Reinvested dividends were delivered on 5 November 2020, when the vesting datemarket price was £4.54£2.03 for each ordinary share, and $15.83 for ADSs was $36.09. Details can be found ineach ADS. The adjusted amounts reported as 2019 income on the single figure table are therefore $8.039 million for Bob Dudley, and £2.787 million for Brian Gilvary. g Represents vestings of shares at the end of the performance period based on performance achieved under rules of the plan, pro-rated for time served, and includes reinvested dividends on the shares vested. This 2018-2020 award vested on 19 February 2021, when the market price was £2.72 for each share, and $22.87 for each ADS. As they were received post-employment, the value of these vested shares are included in the payments to past directors section on page 108. f The face122. Restricted shares (audited) Restricted period Date of award of restricted shares Share element interests Face value hasof awardc, £ Number of restricted shares At 1 Jan 2020 Awarded 2020 At 31 Dec 2020 Bernard Looney 2016-20a 15 Mar 2016 75,000 – 75,000 256,500 2018-20a 20 Mar 2018 104,577 – 104,577 485,237 2018-20b 20 Mar 2018 137,990 – 137,990 640,274 2019-21b 25 Mar 2019 146,055 – 146,055 800,381 Murray Auchincloss 2018-20a 20 Mar 2018 43,170 – 43,170 200,308 2018-22a 20 Mar 2018 43,170 – 43,170 200,308 2018-20b 20 Mar 2018 86,616 – 86,616 401,898 2018-20d 20 Mar 2018 2,755 – 2,755 12,783 2019-21d 25 Mar 2019 2,835 – 2,835 15,536 2019-21b 25 Mar 2019 86,928 – 86,928 476,365 2020-22d 28 Aug 2020 – 4,840 4,840 12,778 a Awards made under the Restricted Share Plan II prior to appointment as a director. b Awards made under the Individual Share Value Plan prior to appointment as a director. Awards under this plan were granted at 100% of salary. c Face values have been calculated using the market price at closingprices of ordinary shares on 22 May 2018 of £5.88. g The face value has been calculated using the market price at closing on the dates of ordinary sharesaward, as follows; £3.42 on 19 February 201915 March 2016; £4.64 on 20 March 2018; £5.48 on 25 March 2019; £2.64 on 28 August 2020. d Interests of £5.37. 114 BPperson closely associated with Murray Auchincloss.
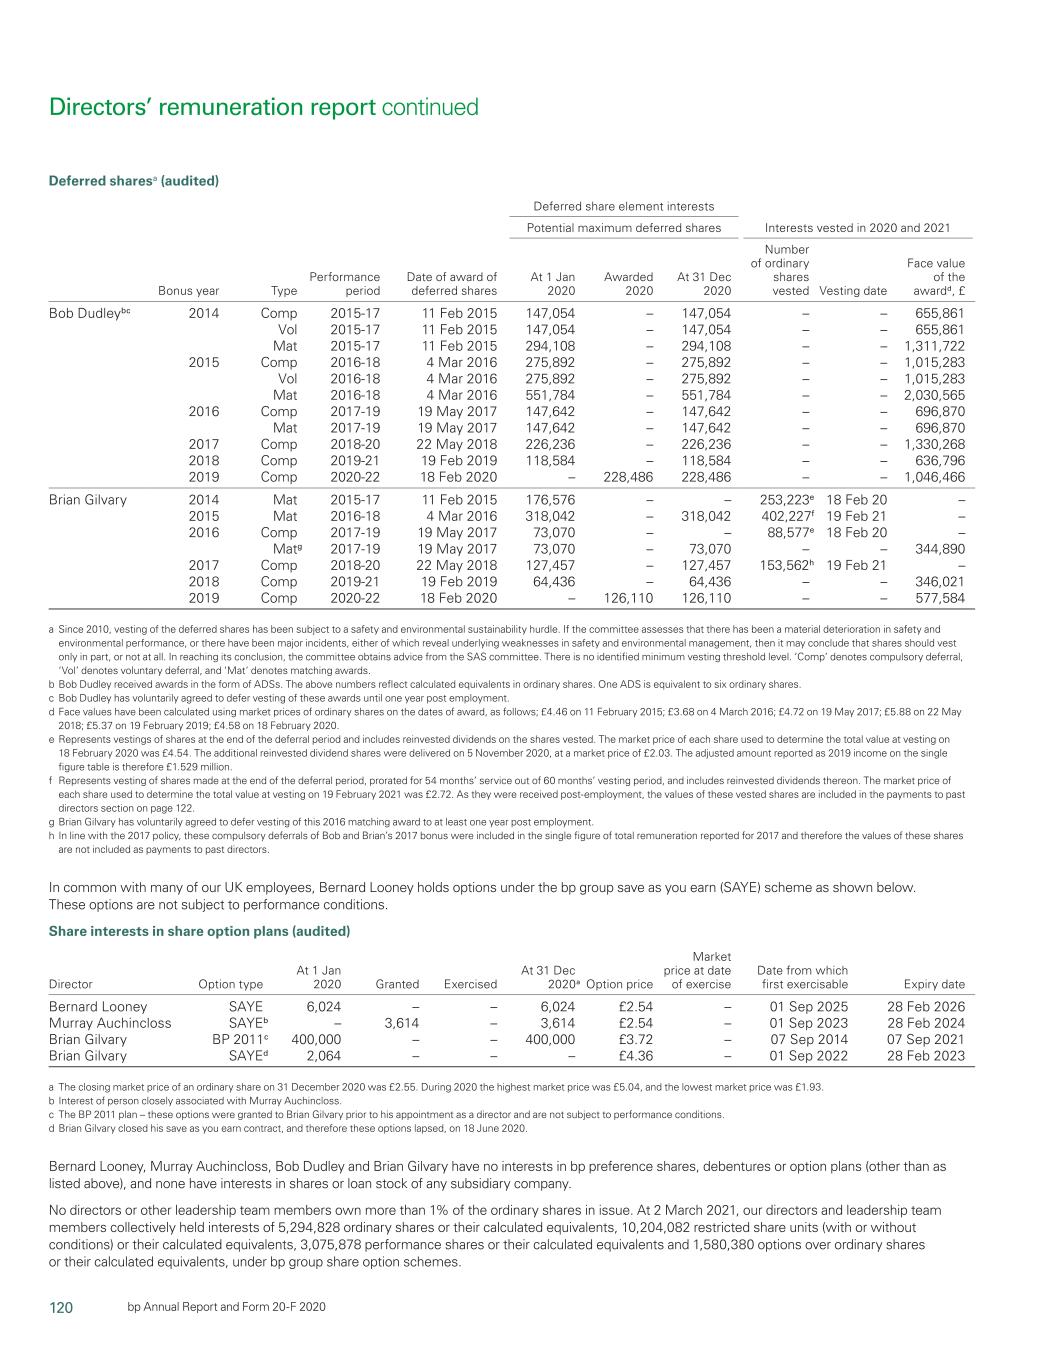
120 bp Annual Report and Form-20F 2019

Corporate governanceForm 20-F 2020 Deferred sharesa (audited) Bonus year Type Performance period Date of award of deferred shares (audited)a Deferred share element interests PotentialInterests vested in 2020 and 2021Potential maximum deferred shares Interests vested in 2019 andAt 1 Jan 2020 Awarded 2020 At 31 Dec 2020 Number of ordinary shares vested Vesting date Face Date of award ordinary value of Bonus Performance of deferred At 1 Jan Awarded At 31 Dec shares Vesting the award, year Type period shares 2019 2019 2019 vested date £awardd, £ Bob Dudleybc 2014 Comp 2015-17 11 Feb 2015 147,054 –– 147,054 – – 655,861d– – 655,861 Vol 2015-17 11 Feb 2015 147,054 –– 147,054 – – 655,861d– – 655,861 Mat 2015-17 11 Feb 2015 294,108 –– 294,108 – – 1,311,722d– – 1,311,722 2015 Comp 2016-18 044 Mar 2016 275,892 –– 275,892 – – 1,015,283e– – 1,015,283 Vol 2016-18 044 Mar 2016 275,892 –– 275,892 – – 1,015,283e– – 1,015,283 Mat 2016-18 044 Mar 2016 551,784 –– 551,784 – – 2,030,565e– – 2,030,565 2016 Comp 2017-19 19 May 2017 147,642 –– 147,642 – – 696,870f– – 696,870 Mat 2017-19 19 May 2017 147,642 –– 147,642 – – 696,870f– – 696,870 2017 Comp 2018-20 22 May 2018 226,236 –– 226,236 – – 1,330,268g– – 1,330,268 2018 Comp 2019-21 19 Feb 2019 118,584 – 118,584 – – 636,796h– – 636,796 2019 Comp 2020-22 18 Feb 2020 – 228,486 228,486 – – 1,046,466 Brian Gilvary 2014 Mat 2015-17 11 Feb 2015 176,576 – 176,576 246,359i– – 253,223e 18 Feb 20 –– 2015 CompMat 2016-18 04 Mar 2016 159,021 – 159,021 196,262j 19 Feb 19 – Vol 2016-18 04 Mar 2016 159,021 – 159,021 196,262j 19 Feb 19 – Mat 2016-18k 044 Mar 2016 318,042 –– 318,042 – – 1,170,395 e402,227f 19 Feb 21 – 2016 Comp 2017-19 19 May 2017 73,070 – 73,070 86,176 i– – 88,577e 18 Feb 20 – Mat 2017-19l– Matg 2017-19 19 May 2017 73,070 –– 73,070 – – 344,890f– – 344,890 2017 Comp 2018-20 22 May 2018 127,457 –– 127,457 – – 749,447g153,562h 19 Feb 21 – 2018 Comp 2019-21 19 Feb 2019 64,436 – 64,436 – – 346,021h– – 346,021 2019 Comp 2020-22 18 Feb 2020 – 126,110 126,110 – – 577,584 a Since 2010, vesting of the deferred shares has been subject to a safety and environmental sustainability hurdle. If the committee assesses that there has been a material deterioration in safety and environmental performance, or there have been major incidents, either of which reveal underlying weaknesses in safety and environmental management, then it may conclude that shares should vest only in part, or not at all. In reaching its conclusion, the committee will obtainobtains advice from the SESAC.SAS committee. There is no identified minimum vesting threshold level. ‘Comp’ denotes compulsory deferral, ‘Vol’ denotes voluntary deferral, and ‘Mat’ denotes matching awards. b Bob Dudley received awards in the form of ADSs. The above numbers reflect calculated equivalents in ordinary shares. One ADS is equivalent to six ordinary shares. c Bob Dudley has voluntarily agreed to defer vesting of these awards until the later of one year post employment or the end of the relevant performance period, therefore the performance period will exceed the minimum term of three years.employment. d The face value hasFace values have been calculated using the market priceprices of ordinary shares on the dates of award, as follows; £4.46 on 11 February 2015 of £4.46. e The face value has been calculated using the market price of ordinary shares2015; £3.68 on 4 March 2016 of £3.68. f The face value has been calculated using the market price of ordinary shares2016; £4.72 on 19 May 2017 of £4.72. g The face value has been calculated using the market price of ordinary shares2017; £5.88 on 22 May 2018 of £5.88. h The face value has been calculated using the market price of ordinary shares2018; £5.37 on 19 February 2019 of £5.37 i2019; £4.58 on 18 February 2020. e Represents vestings of shares made at the end of the relevant performancedeferral period based on performance achieved under rules of the plan and includes reinvested dividends on the shares vested. The market price of each share used to determine the total value at vesting on the vesting date of 18 February 2020 was £4.54. j£4.54. The additional reinvested dividend shares were delivered on 5 November 2020, at a market price of £2.03. The adjusted amount reported as 2019 income on the single figure table is therefore £1.529 million. f Represents vestingsvesting of shares made at the end of the relevant performancedeferral period, based on performance achieved under rulesprorated for 54 months’ service out of the plan60 months’ vesting period, and includes reinvested dividends on the shares vested.thereon. The market price of each share used to determine the total value at vesting on the vesting date of 19 February 20192021 was £5.38. These totals include£2.72. As they were received post-employment, the accrual of dividends which vested on 3 May 2019. k Brian Gilvary has voluntarily agreed to defer vestingvalues of these matching awards for a total of five years with a further one-year retention period. lvested shares are included in the payments to past directors section on page 122. g Brian Gilvary has voluntarily agreed to defer vesting of this 2016 matching award to at least one year post employment. h In line with the 2017 policy, these compulsory deferrals of Bob and Brian’s 2017 bonus were included in the single figure of total remuneration reported for 2017 and therefore the values of these shares are not included as payments to past directors. In common with many of our UK employees, Brian GilvaryBernard Looney holds options under the BPbp group Save As You Earnsave as you earn (SAYE) schemesscheme as shown below. These options are not subject to performance conditions. Share interests in share option plans (audited) Market price Date fromDirector Option type At 1 Jan 2020 Granted Exercised At 31 Dec 2020a Option price Market price at date of exercise Date from which first exercisable Expiry Option type 2019 Granted Exercised 2019a price exercise exercisable date Bernard Looney SAYE 6,024 – – 6,024 £2.54 – 01 Sep 2025 28 Feb 2026 Murray Auchincloss SAYEb – 3,614 – 3,614 £2.54 – 01 Sep 2023 28 Feb 2024 Brian Gilvary BP 2011b2011c 400,000 – –– – 400,000 £3.72 –£3.72 – 07 Sep 142014 07 Sep 2021 SAYE 3,103 – 3,103 – £2.90 £5.07Brian Gilvary SAYEd 2,064 – – – £4.36 – 01 Sep 19 28 Feb 2020 SAYE – 2,064 – 2,064 £4.36 01 Sep 222022 28 Feb 2023 a The closing market pricesprice of an ordinary share on 31 December 20192020 was £4.72.£2.55. During 20192020 the highest market price was £5.83£5.04, and the lowest market price was £4.62.£1.93. b Interest of person closely associated with Murray Auchincloss. c The BP 2011 means the BP 2011 plan. Theseplan – these options were granted to Brian Gilvary prior to his appointment as a director and are not subject to performance conditions. d Brian Gilvary closed his save as you earn contract, and therefore these options lapsed, on 18 June 2020. Bernard Looney, Murray Auchincloss, Bob Dudley and Brian Gilvary have no interests in BPbp preference shares, debentures or option plans (other than as listed above), and nonone have interests in shares or loan stock of any subsidiary company. No directors or other senior managersleadership team members own more than 1% of the ordinary shares in issue. At 32 March 2020,2021, our directors and senior managersleadership team members collectively held interests of 19,004,6885,294,828 ordinary shares or their calculated equivalents, 7,699,79510,204,082 restricted share units (with or without conditions) or their calculated equivalents, 8,542,4633,075,878 performance shares or their calculated equivalents and 4,299,9721,580,380 options over ordinary shares or their calculated equivalents, under BPbp group share option schemes. BPDirectors’ remuneration report continued
121 Corporate governance bp Annual Report and Form-20F 2019 115

Directors’ remuneration reportForm 20-F 2020 Post employment share ownership interests As we reported last year, Bob Dudley and Brian Gilvary have, and will continue to retain, significant interests in BPbp post employment. They have givenUnder our 2017 policy, they gave their personal commitment as executive directors to maintain actual holdings equivalent to two and a half times salary for two years post employment. The commitment is guaranteed by the fact that their anticipatedTheir ongoing interests in share awards under group plans which remain subject to vesting and/or holding periods at the time they leave BPmaterially exceed the two and a half times salary threshold.threshold, and thus guarantee that they will continue to meet their minimum shareholding commitment. Although we are institutinginstituted a formal post employment share ownership requirement as part of our 2020 policy, given the foregoing, we see no need to modifyhave not modified the commitments ofrequirements for these outgoingformer executives. Non-executiveChair and non-executive director outcomes and interests The board’s remuneration policy for the chairmanchair and non-executive directors (NEDs) was approved at the 20172020 AGM and implemented during 2017. There has been no variance of2020. Fee structure The table below shows the fees or allowances for the chairman and the NEDs since approval in 2017. Chairman The fee structure for the chairman, which has been in place since May 2013, is £785,000chair and NEDs, per year.our 2020 policy. The chairmanchair is not eligible for committee chairmanship and membership fees or intercontinental travel allowance. As chairman throughout 2019, Helge Lund had the use of a fully maintained office for company business, a car and driver, and security advice in London. The table below shows the fees paid for the year ended 31 December 2019. 2019 remuneration (audited) Fees Benefitsa Totalb ££ thousand 2019 2018 2019 2018 2019 2018 Helge LundcChair 785 46 95d 122d 880 169 Carl-Henric Svanberge – 785 – 24 – 809 a Benefits include travel and other expenses relating to attendance at board and other meetings. Amounts disclosed have been grossed up using a tax rate of 45%, where relevant, as an estimation of tax due. b Due to rounding, the totals may not agree exactly with the sum of the component parts. c Appointed as a director on 26 July 2018 and as chairman on 1 January 2019. d Benefits include relocation expenses. e Resigned on 31 December 2018. The figures below include all the beneficial and non-beneficial interests of the chairman in shares of BP (or calculated equivalents) that have been disclosed according to the disclosure guidance and transparency rules in the Financial Conduct Authority handbook (‘the DTRs’) as at the applicable dates. The chairman’s holdings as at 31 December 2019, as a percentage of the shareholding policy, were 361%. Ordinary Ordinary shares Ordinary shares Changes from shares or or equivalents at or equivalents as 31 Dec 2019 to equivalents at 1 Jan 2019 31 Dec 2019 3 Mar 2020 3 Mar 2020 Helge Lund 600,000 600,000 – 600,000 Non-executive directors’ fee structure The table below shows the fee structure for non-executive directors, per our 2017 policy. Fees £ thousand Senior independent directora 120 Board member 90 Audit, geopolitical, remuneration and SESASAS committees chairmanship feesb 30 Committee membership feec 20 Intercontinental travel allowance 5 a The senior independent director is eligible for committee chairmanship fees and intercontinental travel allowance plus any committee membership fees. b Committee chairmenchairs do not receive an additional membership fee for the committee they chair. c For members of the audit, geopolitical, SESASAS and remuneration committees. 116 BP Annual ReportAs disclosed in our 2019 report, in early 2020 a revised fee structure was adopted for implementation with effect from 1 June 2020. The implementation of that revised fee structure was postponed on account of the COVID-19 pandemic and Form-20F 2019

Corporateactions taken by bp in response. With effect from 1 January 2021, a fee for membership of the people and governance 2019 remuneration (audited)committee has been introduced given the increased time commitment associated with the expanded responsibilities of this committee. The fee is in line with other committee membership fees. The senior independent director has waived her entitlement to this committee membership fee. The geopolitical advisory council was constituted with effect from 1 January 2021. Fees Benefitsa Totalb £ thousand 2019 2018 2019 2018 2019 2018 Nils Andersen 161 132 11 11 172 144 Alan Boeckmannc 68 155 6 10 74 165 Admiral Frank Bowmanc 74 160 6 14 80 174 Dame Alison Carnwathd 115 74 33 47 148 121 Pamela Daleye 164 55 37 42 201 97 Sir Ian Davis 165 170 5 2 170 172 Professor Dame Ann Dowlingf 140 158 3 2 143 159 Melody Meyer 152 160 16 26 168 186 Brendan Nelson 150 150 11 12 161 162 Paula Rosput Reynolds 170 166 36 33 206 200 Sir John Sawers 145 150 1 1 146 151 aof £10,000 and £15,000 are payable for membership of and chairing the council, respectively. The fee structure for 2021 remains otherwise unchanged and the board will review the situation again during the year. The table below shows the fees paid and applicable benefits for the year ended 31 December 2020. Benefits include travel and other expenses relating to the attendance at board and other meetings. Amounts disclosedAs chair throughout 2020, Helge Lund had the use of a fully maintained office for company business, a car and driver, and security advice in London. Benefits values have been grossed up using a tax rate of 45%, where relevant, as an estimation of tax due. b2020 remuneration (audited) Fees Benefits Totala £ thousand 2020 2019 2020 2019 2020 2019 Nils Andersenb 38 161 1 11 39 172 Dame Alison Carnwathb 110 115 2 33 112 148 Pamela Daley 140 164 3 37 143 201 Sir Ian Davisb 143 165 1 5 143 170 Professor Dame Ann Dowlingc 135 140 0 3 135 143 Helge Lund (Chair) 785 785 25 95 810 880 Melody Meyer 166 152 4 16 170 168 Tushar Morzariab 37 – 0 – 37 – Brendan Nelson 140 150 3 11 143 161 Paula Rosput Reynolds 174 170 3 36 177 206 Sir John Sawers 140 145 0 1 140 146 a Due to rounding, the totals may not agree exactly with the sum of the component parts. c Resignedb Nils Andersen resigned on 21 May 2019. d Appointed 21 May 2018. e Appointed 26 July 2018. f18 March 2020. Sir Ian Davis resigned on 30 December 2020. Tushar Morzaria was appointed on 1 September 2020. Dame Alison Carnwath resigned on 14 January 2021. c Fee includes £25,000£25,000 for chairing and being a member of the BPbp technology advisory council. Non-executive director fees are reviewed on a regular basis
122 bp Annual Report and were last changed in 2012. This year, following a review of the increasing time commitment associated with the roleForm 20-F 2020 Chair and taking into account non-executive director fees against those of comparable UK listed companies, the fee structure below will be adopted from 1 June 2020. Fees £ thousand Senior independent directora 155 Board member 115 Audit, geopolitical, remuneration and SESA committees chairmanship feesb 35 Committee membership feec 20 a The senior independent director is eligible for committee chairmanship fees plus any committee membership fees, excluding the nomination and governance committee. b Committee chairmen do not receive an additional membership fee for the committee they chair. c A membership fee is not payable for the chairman’s committee. The board has decided to remove the intercontinental travel allowance to simplify the structure of non-executive director fees, although under the proposed policy it retains the flexibility to reintroduce such an allowance. In addition, following a review of the time commitment required, a fee of membership of the nomination and governance committee will be introduced in line with other committee membership fees to compensate for the increased time commitment. The senior independent director will not be eligible for this fee and no fee is payable for chairing the nomination and governance committee. Non-executive directors’directors’ interests (audited) The figures below indicate and include all the beneficial and non-beneficial interests of the chair and each non-executive director of the company in shares of BPbp (or calculated equivalents) that have been disclosed according to the company underdisclosure guidance and transparency rules in the Financial Conduct Authority handbook (‘the DTRs’) as at the applicable dates. OrdinaryOur policy, shown on page 126, includes a shareholding guideline encouraging non-executive directors to establish a holding in bp shares Ordinary shares Changes fromof the equivalent value of one year’s base fee. Ordinary shares or equivalents at 1 Jan 2020 Ordinary shares or equivalents at 31 Dec 20192020 Changes from 31 Dec 2020 to 2 Mar 2021 Ordinary shares or equivalents at 2 Mar 2021 Value of current shareholdinga % of policy 1 Jan 2019 31 Dec 2019 3 Mar 2020 3 Mar 2020 shareholdinga achieved Nils AndersenAndersenb 125,000 125,000 – 125,000 £518,750 576% Alan Boeckmannb 44,812cd Admiral Frank Bowmanb 24,864c– – – – – Dame Alison CarnwathCarnwathb 17,700 17,700 – 17,700 £73,455 82%– – – – Pamela Daley 17,592c 17,592c – 17,592c $93,589 82%40,332c 0 40,332c $166,504 144% Sir Ian Davis 50,296Davisb 52,671 – 52,671 £218,585 243%– – – – – Professor Dame Ann Dowling 22,320 22,320 –0 22,320 £92,628 103%£66,290 74% Helge Lund (Chair) 600,000 600,000 0 600,000 £1,782,000 227% Melody Meyer 20,646c 20,646c –0 20,646c $109,837 96%$85,234 74% Tushar Morzariab – 36,276 0 36,276 £107,740 120% Brendan Nelson 11,040 11,040 – 11,040 £45,816 51%Nelsond 21,626 21,626 0 21,626 £64,229 71% Paula Rosput Reynolds 73,200c 73,200c –0 73,200c $389,424 339%$302,194 262% Karen Richardsonb – – – 10,746c $44,363 38% Sir John Sawers 15,030 15,506 6,494 22,000 £91,300 101%23,116 0 23,116 £68,655 76% Dr Johannes Teyssenb – – – 20,000 £59,400 66% a Based on share and ADS prices at 32 March 2021 of £2.97 and $24.77. b Nils Andersen and Sir Ian Davis resigned on 18 March and 30 December 2020 of £4.15respectively. Tushar Morzaria appointed on 1 September 2020. Karen Richardson and $31.92. b ResignedDr Johannes Teyssen appointed on 21 May 2019.1 January 2021. Dame Alison Carnwath resigned on 14 January 2021. c Held as ADSs. d Amended from 44,772Brendan Nelson’s 31 December 2019 shareholding was incorrectly shown as originally disclosed11,040 shares, rather than 21,626 shares, in the 2018our 2019 report. BP Annual Report and Form-20F 2019 117

Directors’ remuneration report Other disclosures Freshfields Bruckhaus Deringer LLP (‘Freshfields’) provided legal advice on specific compliance matters to the committee. Payments for loss of office (audited) Brian Gilvary received a payment in lieu of notice of £447,950 relating to the part of his 12-month notice period that followed his retirement on 30 June 2020. As detailed on page 120, Bob Dudley deferred the vesting of various deferred and matching share awards, related to annual bonus outcomes from 2014 to 2019, until at least one year post retirement. Of these, awards under the 2014 policy (for bonus years 2014, 2015 and 2016) were not included in the single figures of total remuneration, therefore the values of these awards will be disclosed in the payments to past directors section of the relevant annual report following vesting. Similarly, Brian Gilvary deferred the vesting of his 2016 matching share award until at least one year post retirement. The value of this award will be disclosed in the payments to past directors section of the relevant annual report following vesting. Payments to past directors (audited) PwCSince leaving employment, Bob Dudley and Freshfields provide other adviceBrian Gilvary have received shares upon vesting of the awards listed below: (1) Bob Dudley received 410,922 shares on vesting of his 2018-20 performance share award on 19 February 2021. Based on a share price of $22.78 this vesting was valued at $1,566,298. This award reflects the 32.5% vesting outcome, and has been pro-rated for 27 months’ service through the three-year performance period. (2) Brian Gilvary received 227,337 shares on vesting of his 2018-20 performance share award on 19 February 2021. Based on a share price of £2.72 this vesting was valued at £618,357. This award reflects the 32.5% vesting outcome, and has been pro-rated for 30 months’ service through the three-year performance period. (3) Brian Gilvary received 402,227 shares on vesting of his 2015 matching award on 19 February 2021. Based on a share price of £2.72 this vesting was valued at £1,094,057. This award has been pro-rated for 54 months’ service through the five-year vesting period. Bob Dudley was also provided with post-employment medical benefits amounting to $14,359, ongoing car and driver benefits in their respective areasthe UK, amounting to $44,429, and relocation benefits to assist his repatriation to the group. During the year, PwC provided BP with services including:US, amounting to $47,186. We made no other payments for losswithin the scope of office during or in respect of 2019 subsidiary company secretarial support; global mobility; internal audit to current or former directors. Sir Ian Prosser (who retired as a non- subject matter expertise; cyber security risk reviews; tax modernization; executive director of BP in April 2010) was appointed as a director and low carbon strategy consulting; digital, data analytics and IT non-executive chairman of BP Pension Trustees Limited on 1 October implementation services. 2010. During 2019, he received £100,000 for this role. Other than this, we made no paymentthe disclosure requirements to any past director of BPbp during 20192020 (we have Shareholder engagement no de minimis threshold for such disclosures). Throughout 2019 weDirectors’ remuneration report continued to discuss remuneration policy
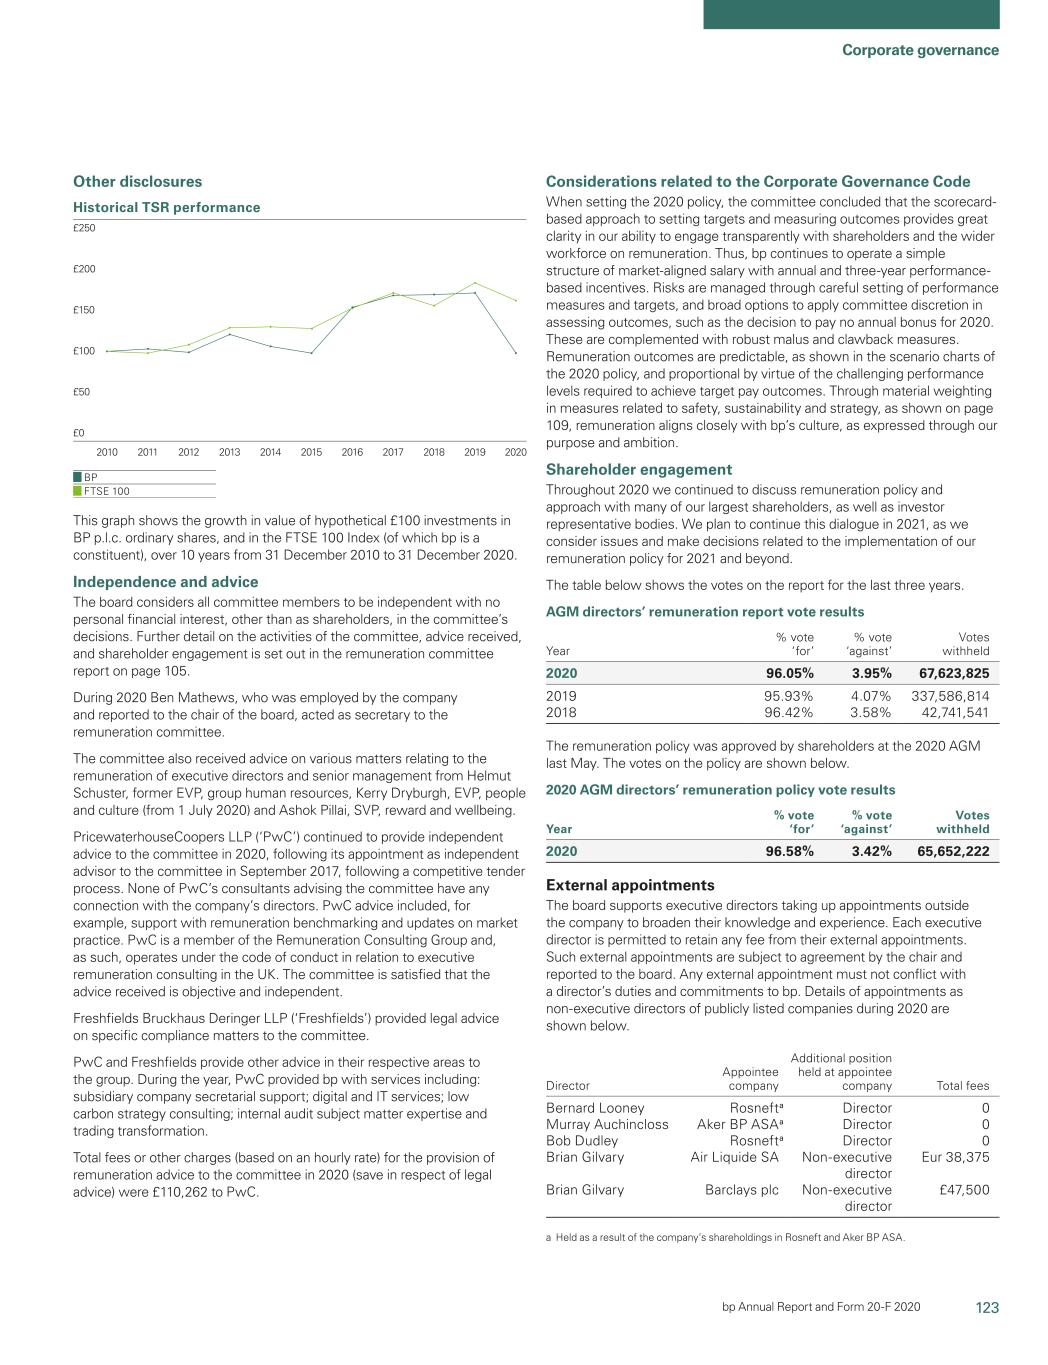
123 Corporate governance bp Annual Report and Form 20-F 2020 Other disclosures Historical TSR performance approach with many of our largest shareholders, as well as investor representative bodies. We plan to continue this dialogue in 2020, as we 250 consider updates to our remuneration policies for 2020 and beyond. 2019 2020201820172016201520142013201220112010 £0 £50 £100 £150 £200 The table below shows the votes on the report for the last three years. AGM directors’ remuneration report vote results 150 % vote % vote Votes Year ‘for’ ‘against’ withheld 100 2019 95.93% 4.07% 337,586,814 50 2018 96.42% 3.58% 42,741,541 2017 97.05% 2.95% 63,453,383 0 2010 2013 2016 2019 The remuneration policy was approved by shareholders at the 2017 AGM£250 BP FTSE 100 on 17 May 2017. The votes on the policy are shown below. 2017 AGM directors’ remuneration policy vote results This graph shows the growth in value of hypothetical £100£100 investments in BP p.l.c. ordinary shares, and in the FTSE 100 Index (of which % vote % vote Votes BPbp is a constituent), over 10 years from 31 December 20092010 to Year ‘for’ ‘against’ withheld 31 December 2019. 2017 97.28% 2.72% 36,563,8862020. Independence and advice External appointments The board considers all committee members to be independent The board supports executive directors taking up appointments with no personal financial interest, other than as shareholders, in the outside the company to broaden their knowledge and experience. committee’scommittee’s decisions. Further detail on the activities of the committee, Each executive director is permitted to retain any fee from their external advice received, and shareholder engagement is set out in the appointments. Such external appointments are subject to agreement by remuneration committee report on page 101. the chairman and reported to the board. Any external appointment must not conflict with a director’s duties and commitments to BP. Details of105. During 2019 Hannah Ashdown and, from his appointment as company appointments as non-executive directors of publicly listed companies secretary on 7 May 2019,2020 Ben Mathews, both of whom werewho was employed during 2019 are shown below. by the company and reported to the chairmanchair of the board, acted as secretary to the remuneration committee. Appointee Additional position held at The committee also received advice on various matters relating to the Director company appointee company Total fees remuneration of executive directors and senior management from Bob Dudley Rosnefta Director 0 Helmut Schuster, executive vice president,former EVP, group human resources, Brian Gilvary Air Liquide SA Non-executive director Euros 77,500Kerry Dryburgh, EVP, people and culture (from 1 July 2020) and Ashok Pillai, vice president, group reward. a Bob Dudley holds this appointment as a result of the company’s shareholding in Rosneft.SVP, reward and wellbeing. PricewaterhouseCoopers LLP (‘PwC’(‘PwC’) continued to provide independent advice to the committee in 2019,2020, following its appointment as independent adviseradvisor to the committee in September 2017, following a competitive tender process. None of PwC’sPwC’s consultants advising the BP remuneration committee have any connection with the company’scompany’s directors. AdvicePwC advice included, for example, support with the remuneration policy reviewbenchmarking and remuneration benchmarking.updates on market practice. PwC is a member of the Remuneration Consulting Group and, as such, operates under the code of conduct in relation to executive remuneration consulting in the UK. The committee is satisfied that the advice received is objective and independent. Freshfields Bruckhaus Deringer LLP (‘Freshfields’) provided legal advice on specific compliance matters to the committee. PwC and Freshfields provide other advice in their respective areas to the group. During the year, PwC provided bp with services including: subsidiary company secretarial support; digital and IT services; low carbon strategy consulting; internal audit subject matter expertise and trading transformation. Total fees or other charges (based on an hourly rate) for the provision of remuneration advice to the committee in 20192020 (save in respect of legal advice) were £144,175£110,262 to PwC. 118 BP Annual Report and Form-20F 2019

Considerations related to the Corporate governance Directors’ remuneration report –Governance Code When setting the 2020 policy, In this partthe committee concluded that the scorecard- based approach to setting targets and measuring outcomes provides great clarity in our ability to engage transparently with shareholders and the wider workforce on remuneration. Thus, bp continues to operate a simple structure of market-aligned salary with annual and three-year performance- based incentives. Risks are managed through careful setting of performance measures and targets, and broad options to apply committee discretion in assessing outcomes, such as the decision to pay no annual bonus for 2020. These are complemented with robust malus and clawback measures. Remuneration outcomes are predictable, as shown in the scenario charts of the 2020 policy, and proportional by virtue of the challenging performance levels required to achieve target pay outcomes. Through material weighting in measures related to safety, sustainability and strategy, as shown on page 109, remuneration aligns closely with bp’s culture, as expressed through our purpose and ambition. Shareholder engagement Throughout 2020 we continued to discuss remuneration policy and approach with many of our reportlargest shareholders, as well as investor representative bodies. We plan to continue this dialogue in 2021, as we set outconsider issues and make decisions related to the implementation of our directors’ remuneration policy for 2021 and beyond. The table below shows the votes on the report for the last three years. AGM directors’ remuneration report vote results Year % vote ‘for’ % vote ‘against’ Votes withheld 2020 and subsequent years (the ‘2020 policy’). We will present this 202096.05% 3.95% 67,623,825 2019 95.93% 4.07% 337,586,814 2018 96.42% 3.58% 42,741,541 The remuneration policy towas approved by shareholders at the 2020 annual general meetingAGM last May. The votes on the policy are shown below. 2020 AGM directors’ remuneration policy vote results Year % vote ‘for’ % vote ‘against’ Votes withheld 2020 96.58% 3.42% 65,652,222 External appointments The board supports executive directors taking up appointments outside the company to broaden their knowledge and experience. Each executive director is permitted to retain any fee from their external appointments. Such external appointments are subject to shareholder approval, it will take effect foragreement by the 2020 financial year. Remuneration principles In preparation for the review of our directors’ remuneration policy, the committee gave deep considerationchair and reported to the changing reward frameworks for the wider workforce, alongside our more specific debates on executive remuneration. Allboard. Any external appointment must not conflict with a director’s duties and commitments to bp. Details of this is in the contextappointments as non-executive directors of publicly listed companies during 2020 are shown below. Director Appointee company Additional position held at appointee company Total fees Bernard Looney Rosnefta Director 0 Murray Auchincloss Aker BP ASAa Director 0 Bob Dudley Rosnefta Director 0 Brian Gilvary Air Liquide SA Non-executive director Eur 38,375 Brian Gilvary Barclays plc Non-executive director £47,500 a changing business modelHeld as we evolve to meet and contribute to the low carbon energy transition. From this, we have drawn a unifying set of remuneration principles that apply equally to executives, and to employees at all levels of our workforce hierarchy. Alignment Our remuneration programmes will align with BP’s strategic priorities, long-term success and shareholders’ experience. In delivering our remuneration programmes across the globe we will reflect the policies and practicesresult of the respective marketscompany’s shareholdings in which we operate. Competitiveness Total remuneration will be competitive for the role taking into account scale, sector, complexity of responsibilityRosneft and geography. When setting senior executive pay, we will consider both external pay relativity and wider workforce remuneration and conditions. Pay for performance We promote a culture where all employees are accountable for delivering performance . Depending on the level of the individual in the organization, we use variable pay to incentivize delivery against performance. Pay will be delivered with an emphasis on long-term equity in line with seniority. Performance measures and targets will seek to balance collectiveAker BP success with clear line of sight for participants. Remuneration outcomes aim to reflect sustained long-term underlying performance of BP. Factors beyond the control of management will be adjusted in determining final outcomes. Judgement We will use discretion and judgement to review formulaic performance outcomes to arrive at fair and balanced remuneration outcomes for both BP and employees. Sustainability Remuneration programmes will support the development of a long-term sustainable business informed by environmental, societal and other inputs. Performance targets and measures will typically be chosen with due regard to incentives for prudent risk taking. Individual contribution and values and behaviours will be reflected in remuneration outcomes. Consideration of shareholder views We have reflected on the valuable shareholder engagement exercise that led to the significant changes from our 2014 to 2017 policy. In our view, those changes have stood up well over the last three years, have delivered remuneration outcomes that align to shareholders’ own experience, and have encouraged strategic decisions appropriate for the long term. Notably, the current 2017 policy also corresponds well to our recently concluded remuneration principles, shown above. Throughout 2019 we consulted widely with shareholder representatives individually and collectively. In particular through a constructive listening session with our largest shareholders in September 2019, we identified four broad themes for our future policy direction: • Clear end-to-end alignment from strategy, through measurable performance indicators and reward outcomes, to shareholder experience • Balance our contribution to the energy transition with delivering shareholder returns. The committee was encouraged to use appropriate discretion, given the complexity of the environment in the energy transition • Assure that strategic moves align to long-term sustainability, relative to a wide peer group • Use meaningful and transparent measures to reflect our progress in the energy transition and reductions to our carbon impact. We have concluded that the strongly performance-oriented reward model that has served us well in recovery from the aftermath of the 2010 Deepwater Horizon oil spill, and particularly the structure of our 2017 policy, broadly remains the right frame as we look ahead to the equally great challenge of reducing our carbon footprint. The 2020 policy set out below therefore retains and builds upon the 2017 policy structure, and thus commands the advantage of being well-understood and accepted by our executives and wider workforce alike. BPASA.
124 bp Annual Report and Form-20F 2019 119

Directors’Form 20-F 2020 Policy implementation for 2021 The table below shows how the remuneration report –policy approved by shareholders at the 2020 AGM will be implemented in 2021, alongside a summary of key features. For the full remuneration policy, Policy table – executive directorsplease go to bp.com/remuneration Salary and benefits Purpose To provide fixed remuneration to reflect the scale and complexity of both the business and the role, and to be competitive with the external market. Operation and Salary Benefits opportunity Salary levels will relate to the nature of the role, performance Executive directors are entitled to receive those benefits available of the business and the individual, market positioning and pay to all BP employees generally, such as participation in all-employee conditions in the wider BP group. There is no maximum salary share plans, sickness pay, relocation assistance and parental leave. under the policy. Benefits are not pensionable. When setting salaries, the committee considers practice in other Executive directors may receive other benefits that are judged to oil and gas majors as well as European and US companies of a be cost effective and appropriate in terms of the individual’s role, similar size, geographic spread and business dynamic to BP. The time and/or security. These include car-related benefits or cash committee will consider salary increases for the most senior in lieu, security, assistance with tax return preparation, insurance management and the wider workforce. In particular, percentage and medical benefits. The company may meet any tax chargesbp. Percentage increases for executive directors will not exceed increases for the arising on business-related benefits provided to directors, for broader employee population, other than in specific circumstances example security. identified by the committee (e.g. in response to a substantial The taxable value of benefits provided may fluctuate during the change in responsibilities). periodBernard Looney’s salary will increase by 2.75% to £1,335,750 following the 2021 AGM. Murray Auchincloss’s salary will increase by 8% to £750,500 following the 2021 AGM. This compares to an increase in excess of this policy, depending on the cost of provision4% to our UK salaried staff effective from 1 April, our annual salary review date. Benefits will remain unchanged for 2021 and a Salaries are normally setinclude car-related provisions (or cash in the home currency of the executive director’s personal circumstances. directorlieu), security assistance, insurance and are reviewed annually. They may be reviewed at other In general, the committee expects to maintain benefits at the times where appropriate, for example following a major role change. current level. Performance Not applicable frameworkmedical cover. Retirement benefits Purpose To recognize competitive practice in home country. Operation and Executive directors normally participate in the company retirement Current executives (including designates) in BP have been opportunity plans that operate in their home country. employees ofNew appointees from within the bp group forretain previously accrued benefits. For their service as a number of years and remain as participantsdirector, retirement benefits will be no more than the median provision offered to the wider workforce in long-standing arrangements in which other similarlythe UK. For future appointments, the committee will carefully review any situated employees continue to participate. retirement benefits to be granted to a new director, taking account of retirement policies across the wider group and any arrangements UK participants will become deferred pensioners of the company’s currently in place. Specifically, the committee will be sensitiveBernard and Murray are deferred members of final salary pension plans related to defined benefit plan. They willtheir service prior to appointment as executive directors, but now receive a cash supplementallowance in lieu of investor concerns over pensions for directors,retirement benefits. Bernard’s cash allowance will be unchanged at 15%, and limit pensionhe accrues no further service accrualvalue under the plan. contribution rates tohis deferred pension. Murray’s cash allowance will be unchanged at 15%, and he accrues no more than the median allowance offered to the wider workforce in the UK (as a percentage of salary). Performance Retirement benefits are not directly linked to performance. frameworkfurther value under his US deferred pension. Annual bonus Purpose To provide variable remuneration dependent on performanceBonus is measured against an annual financial, operational, safety and environmental measures. 50% of the bonus is paid in cash and 50% is mandatorily deferred and held in BP shares for three years to reinforce the long-term nature of the business and the importance of sustainability. Operation and The bonus is based on performance against annual measures and The final bonus outcome, following the formulaic assessment of opportunity targets set at the start of the year, evaluated over the financial year performance relative to targets, is specifically reserved as a matter and assessed following the year end. for the committee’s judgement. Accordingly, the committee may exercise its discretion to adjust the formulaic outcome either The target annual bonus is half of the maximum available, and relates upwards or downwards. to delivery of performance in line with targets in the annual plan. Half the bonus is paid in cash, and half is deferred into BP shares Executive directors may earn a maximum annual bonus of 225% for three years. Dividends (or equivalents, including the value of any of salary. This maximum level would relate to performance at or reinvestment) may accrue in respect of any deferred shares. above the highest end of the performance scale for every measure. The committee intends to set demanding requirements for Awards are subject to malus and clawback provisions as described maximum payment. on page 123. 120 BP Annual Report and Form-20F 2019

Corporate governance Performance The committee determines a scorecard of specific measures, The scorecard will typically include a balance of financial, framework weightings and targets each year to reflect the priorities operational, environmental and safety measures. Details of the in the annual plan. The scorecard is designed to deliver the measures and weighting will be reported in advance each year in group’s strategy. the annual report on remuneration, while targets will be disclosed retrospectively.scorecard. The committee holds discretion to choose the specific measures and the relative weightings to be adopted within each of these categoriesin the annual scorecard, to better reflect the annual plan as agreed with the board. Performance shares Purpose To linkNumeric scales are set for each measure, to score outcomes relative to targets. A scorecard outcome of 1.0 reflects the largest part of remuneration opportunity with the long-term performancetarget outcome, and half of the business. The outcome varies with performance against measures of relative total shareholder return (rTSR), return on average capital employed (ROACE) and an assessment related to the low carbon transition. Operation and The maximum annual award level for the chief executive officer will The shares that vest are subject to a holding period. The combined opportunity be 500%outcome. Target bonus is 112.5% of salary, and 450%maximum bonus is 225% of salary for the chief financial officer. lengthsalary. Half of the performancebonus for each year is paid in cash, and holding periods will normally be six years. Annual awards of shares will vest based on performance relative to measures and targets that reflect the delivery of BP’s strategy over Dividends (or equivalents, including the value of reinvestment) mayhalf is delivered as a performance period of typicallydeferred share award vesting in three years. accrue in respect of share awardsFor our 2021 bonus, our scorecard will be reweighted to the extent that they vest. For each measure, the threshold level at which vesting issafety (15%), environment (15%), operational (20%) and financial (50%). Please see scorecard measures on page 125 for detail. Awards are subject to malus and clawback provisions as described first triggered is not expected to yield vesting above 25% of on page 123. the maximum.125. Performance shares Performance shares are granted with a three-year performance period, measured against scorecard. The final performance shares outcome, following the formulaic assessment of performance relative to targets, is specifically reserved as a matter for the committee’s judgement. Accordingly, the committee may exercise itsholds discretion to adjustchoose the formulaic outcome either upwards or downwards. Performance Performance shares vest relative to performance achieved against Forspecific measures and the relative assessment of total shareholder returns,weightings adopted in the framework a combination of financial and strategic measures. committee will in time consider broadening the comparator set as our own transition towards low carbon evolves. For 2020 awards, the measures (weightings) will be: We expect to outline specific measures for the low carbon / energy • Relative total shareholder return (40%) assessed relative to transition element later this year. This will follow, and align with, the Chevron, Eni, Equinor Exxon, Repsol, Shell and Total strategy update planned for our capital markets day later this year. • Return on average capital employed (30%). This will be assessed on a three-year average basis, with no adjustment for market The committee would consult appropriately with major conditions shareholders regarding any material changes to the measures. • Low carbon/energy transition (30%). The committee will assess safety outcomes over the perfomance At the outset of each cycle the committee will review the cycle as an underpin in determining the final vesting percentage. measures that are to govern the award, along with weightings and targets,scorecard, to ensure they remainare focused on the near-term priorities for delivering the bp strategy and are in the interests of shareholders. Shareholding requirements Purpose To provide alignment betweenAnnual grants are 500% of salary for the interestsCEO, and 450% of salary for any other executive directorsdirector. Awards will vest in proportion to the outcomes measured through the performance scorecard, subject to any adjustment by the committee. For our 2021-23 cycle, 20% each for rTSR, ROACE, and EBIDA CAGR, and 40% for strategic progress. Please see scorecard measures on page 125 for detail. The 2021-23 awards will be granted in June 2021, based on the average closing share price over the 90 days preceding our other shareholders. Operation2021 AGM. Awards are subject to malus and The chief executive officer is required to build and maintain a Other executive directors are required to build and maintain opportunity minimum shareholding of five times base salary within five years a minimum shareholding of four and a half times base salary of appointment, and to maintain that minimum shareholding for at within five years of appointment, and to maintain that minimum least two years post-retirement. shareholding for at least two years post-retirement. Performance Not applicable. framework BPclawback provisions described on page 125. Directors’ remuneration report continued
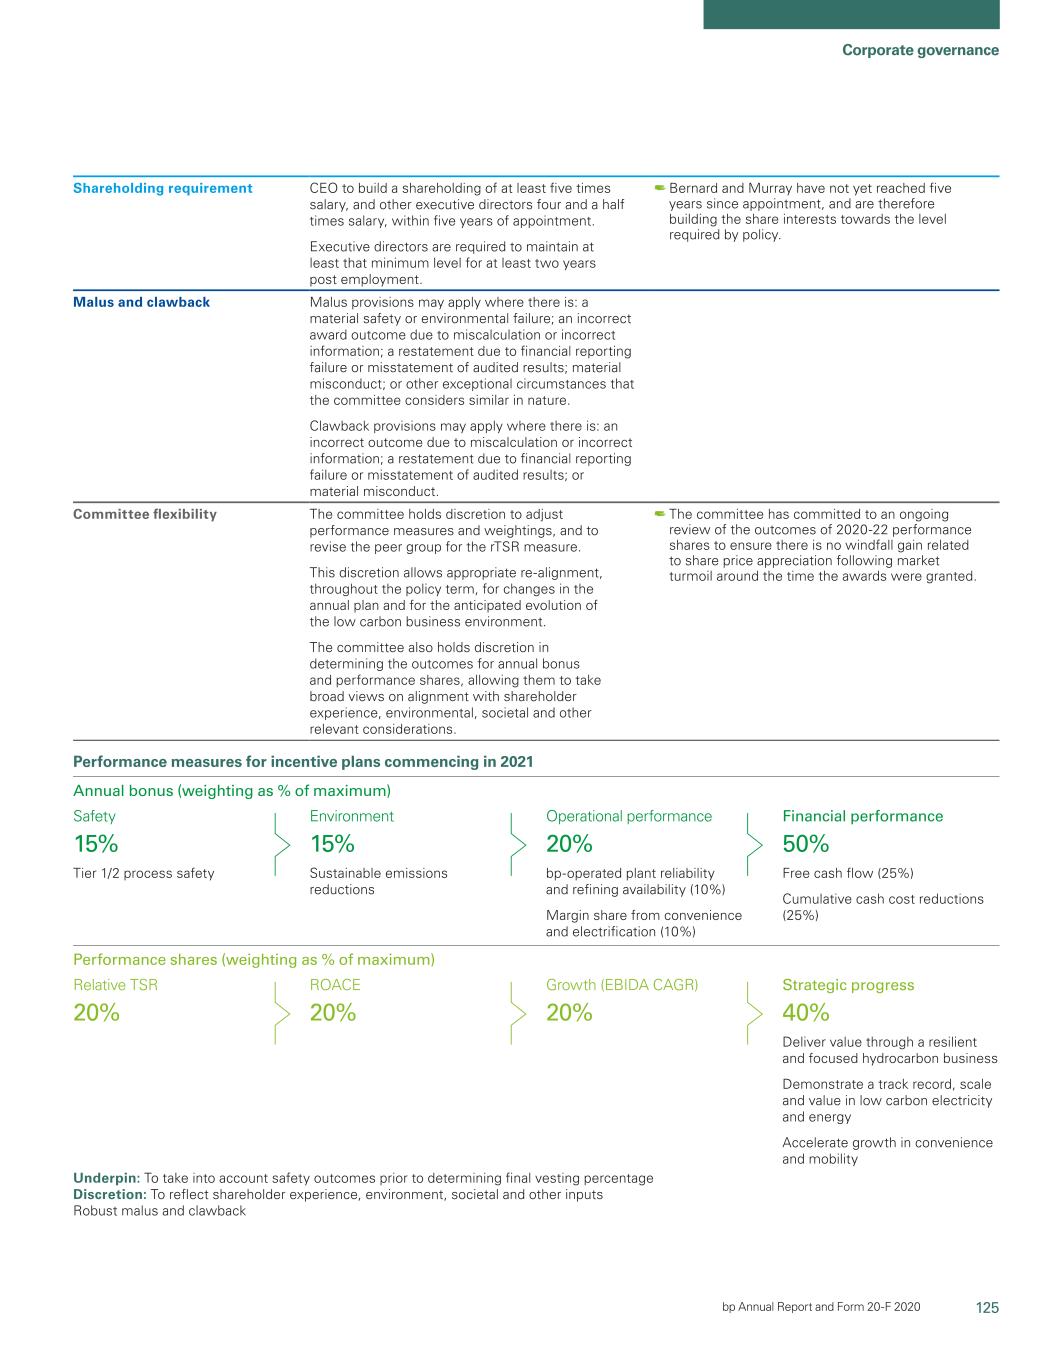
125 Corporate governance bp Annual Report and Form-20F 2019 121

Directors’ remuneration report –Form 20-F 2020 policy NotesShareholding requirement CEO to the policy table 1. New components and key changes from the 2017 policy While the structurebuild a shareholding of the 2017 policy has been retained, the committee highlights the following key changes from 2017: • A new requirement to limit the value of retirement benefits for service as an executive director. In practice, we do not expect to offer pension contribution rates worth more than 15% of salary. • The minimum shareholding requirement is clearly stated and continues to apply, in full, for two years post employment. This minimum shareholding requirement is now formally adopted as part of the remuneration policy. 2. How is variable pay linked to performance? 50% paid in cash; 50% in BP Annual bonus Bonus aligned with annual objectives shares deferred for 3 years Performance 6 years; 3 year performance period Share award for meeting three-year targets bonus + 3 year holding period Built up over 5 years Share ownership Long-term shareholding and maintained The three elements described above provide a balance between focus on short-term, medium-term and long-term performance, while encouraging behaviours which are in the long-term interests of shareholders. The operation of variable pay is supported by a focus on stewardship. There is a requirement that the chief executive officer will build up a holding ofat least five times salary, and other executive directors a holding of four and a half times salary, over a period ofwithin five years following appointment andof appointment. Executive directors are required to maintain at least that minimum level during employment and for a furtherat least two years post employment. 3. HowBernard and Murray have not yet reached five years since appointment, and are performance measures linked to strategy? Variable pay is linked to performance measures designed to delivertherefore building the BP strategy. Atshare interests towards the start of each year, the remuneration committee reviews the measures, targets and weightings to ensure they remain consistent with the priorities in the annual plan and the group strategy. For the annual bonus and performance shares, the approach to performance measurement is intended to provide a balance of measures to assess performance reflecting the global scale of the business, the unique characteristics of the oil and gas sector, and the role our enterprise will play in advancing the transition to lower carbon energy. The key changes from our 2017 policy, and a summary of measures for 2020 awards, are shown below: • Weighting of the environment target in our annual bonus scorecard is doubled to 20%. • Fewer measures in our annual bonus scorecard (from two to one on safety, from two to one on reliable operations, from three to two on financial performance). Our 2020 financial performance on cash flow changes from operating cash flow to free cash flow. • Weighting of the rTSR measure in our performance shares scorecard reduced to 40%. The comparator group has been expanded to include Repsol, ENI and Equinor. The low carbon / energy transition category replaces strategic progress and weighting increases to 30%. New remuneration policy measures for the period commencing in 2020 Annual bonus Safety Environment Operational performance Financial performance 20% 20% 10% 50% Performance shares Relative total shareholder return Return on average capital employment Low carbon / energy transition 40% 30% 30% Underpin: Take into account safety outcomes prior to determining final vesting percentage. Discretion to reflect shareholder experience, environmental, societal and other inputs. Robust malus and clawback. 122 BP Annual Report and Form-20F 2019

Corporate governance 4. How will we use flexibility, judgement and discretion? The committee reviews BP’s performance against specific measures and targets, and in doing so may make both quantitative and qualitative assessments of performance in reaching its decisions. This involves the application of judgement and discretion, in which the committee also seeks relevant input from the board’s audit and safety, environment and security assurance committees. Accordingly, the committee may decide to adjust the formulaic outcome derived from the relevant scorecards, either upwards or downwards, to reflect broader considerations. The committee continues to consider that the powers of flexibility, judgement and discretion are critical to the successful execution of thelevel required by policy. In framing the policy, the committee has taken care to ensure that these important powers continue to be available: • Sufficient flexibility to take account of future changes in the industry environment and in remuneration practice generally. This allows the committee to respond to changes in circumstances, for example in applying particular performance measures and/or weightings within the plans, or in broadening the comparator group for the relative returns measure, in order to evolve with the company’s strategy, without the need for specific shareholder approval. • Power to exercise judgement in making a qualitative assessment in certain circumstances. A number of measures are used for annual or long-term incentive awards, many of which are numerical in nature and require a quantitative assessment of performance. Others may require a qualitative assessment, such as the low carbon / energy transition measures in the performance shares plan. • Scope for the committee to exercise discretion, mainly where it is desirable to vary a formulaic outcome that would otherwise arise from the policy’s implementation. The committee considers that the ability to exercise discretion, upwards or downwards, is important to ensure that a particular outcome is fair in light of the director’s own performance, the company’s overall performance and positioning under particular performance measures and outcomes for shareholders. The committee intends to provide appropriate disclosure on the use of discretion so that shareholders can understand the basis for its decisions. 5. How will we safeguard against payments for failure? Performance A significant portion of remuneration varies with performance – based pay where performance targets are not achieved, lower or no payments will be made under the plans. Discretion The committee may vary formulaic outcomes where these do not suitably reflect performance over the relevant performance period. Malus and clawback The malus provisions enable the committee to reduce the size of The clawback provisions enable the committee to require award, cancel an unvested award, or impose further conditions on participants to return some or all of an award after payment or an award made under this policy. vesting. They may be applied under the following circumstances: The malusMalus provisions may apply if, prior to the vestingwhere there is: a material safety or payment •environmental failure; an incorrect outcomesaward outcome due to miscalculation or based on incorrect of an award, there isinformation; a negative event such as: information • restatement due to financial reporting failure or misstatement of • material failure impacting safety or environmental sustainability audited results • incorrect award outcomes due to miscalculation or based on • material misconduct by the participant. incorrect information • restatement due to financial reporting failure or misstatement of audited results •results; material misconduct by the participant • suchmisconduct; or other exceptional circumstances that the committee consider to beconsiders similar in nature. BP Annual ReportClawback provisions may apply where there is: an incorrect outcome due to miscalculation or incorrect information; a restatement due to financial reporting failure or misstatement of audited results; or material misconduct. Committee flexibility The committee holds discretion to adjust performance measures and Form-20F 2019 123

Directors’ remuneration report – 2020weightings, and to revise the peer group for the rTSR measure. This discretion allows appropriate re-alignment, throughout the policy 6. Differences from remuneration policyterm, for changes in the wider group This executive director remuneration policy is structurally similar to remunerationannual plan and for the majorityanticipated evolution of the wider workforce, but naturally differslow carbon business environment. The committee also holds discretion in quantum reflecting market normsdetermining the outcomes for the differing size and complexity of roles. Although performance assessment is a common feature for executive and wider workforce remuneration, the relative importance of different performance measures changes in line with seniority. For instance, executive directors are subject to longer-term measures and no individual performance element, whereas the majority of the wider workforce receive variable pay that is based on annual performance measures, including their own individual performance. Illustrations of application of remuneration policy The total remuneration opportunity for executive directors is strongly performance based and weighted to the long term. The charts below provide scenarios for the total remuneration of executive directors at different levels of performance and are calculated as prescribed in UK regulations. Bernard Looney Brian Gilvary Min 100% £1.5m Min 100% £1.1m Mid 25% 23% 52% £6.3m Mid 29% 24% 48% £3.8m Max 14% 27% 59% £11.0m Max 17% 28% 55% £6.4m Fixed pay Annual bonus Performance shares Fixed pay Annual bonus Performance shares Murray Auchincloss Min 100% £0.85m Mid 27% 24% 49% £3.2m Max 15% 28% 56%a £5.5m Fixed pay Annual bonus Performance shares a Due to rounding, the sum of the parts does not equal 100%. The remuneration outcomes reported above reflect the face value of performance shares and therefore exclude the impact of potential share price growth, as well as dividends. If share prices were to appreciate by 50% from face value, then the maximum remuneration receivable by Bernard Looney, Brian Gilvary and Murray Auchincloss would increase to £14.2m, £8.2m and £7.1m respectively. Fixed components For these illustrations salary, benefits and pension are the same in all three scenarios (annual values shown). Salary CEO (Looney) £1,300,000 Bernard Looney’s salary from appointment on 5 February 2020. CFO (Gilvary) £790,500 Brian’s salary, effective until his retirement from BP on 30 June 2020. CFO (Auchincloss) £695,000 Murray’s salary, effective from his appointment on 1 July 2020. Benefits and CEO (Looney) £245,000 Based on pension benefits at 15% of salary, with an estimated £50,000 total for other benefits. pension benefits CFO (Gilvary) £296,150 Based on Brian’s 30% cash in lieu of pension, plus the total of other benefits shown in the 2019 single figure table. CFO (Auchincloss) £154,250 Based on pension benefits at 15% of salary, with an estimated £50,000 total for other benefits. Variable components Variable pay under the policy comprises annual bonus and performance shares. Scenario Minimum Mid Maximumshares, allowing them to take broad views on alignment with shareholder experience, environmental, societal and other relevant considerations. The committee has committed to an ongoing review of the outcomes of 2020-22 performance shares to ensure there is no windfall gain related to share price appreciation following market turmoil around the time the awards were granted. Safety 15% Tier 1/2 process safety Relative TSR 20% Environment 15% Sustainable emissions reductions ROACE 20% Operational performance 20% bp-operated plant reliability and refining availability (10%) Margin share from convenience and electrification (10%) Growth (EBIDA CAGR) 20% Financial performance 50% Free cash flow (25%) Cumulative cash cost reductions (25%) Strategic progress 40% Deliver value through a resilient and focused hydrocarbon business Demonstrate a track record, scale and value in low carbon electricity and energy Accelerate growth in convenience and mobility Performance measures for incentive plans commencing in 2021 Annual bonus Threshold not met 50%(weighting as % of maximum 100%maximum) Performance shares (weighting as % of maximum (including cashmaximum) Underpin: To take into account safety outcomes prior to determining final vesting percentage Discretion: To reflect shareholder experience, environment, societal and Nil 112.5% of salary 225% of salary deferred elements) Performance Threshold not met 50% vesting 100% vesting shares CEO – Nil CEO – 250% of salary CEO – 500% of salary CFO – Nil CFO – 225% of salary CFO – 450% of salary 124 BPother inputs Robust malus and clawback
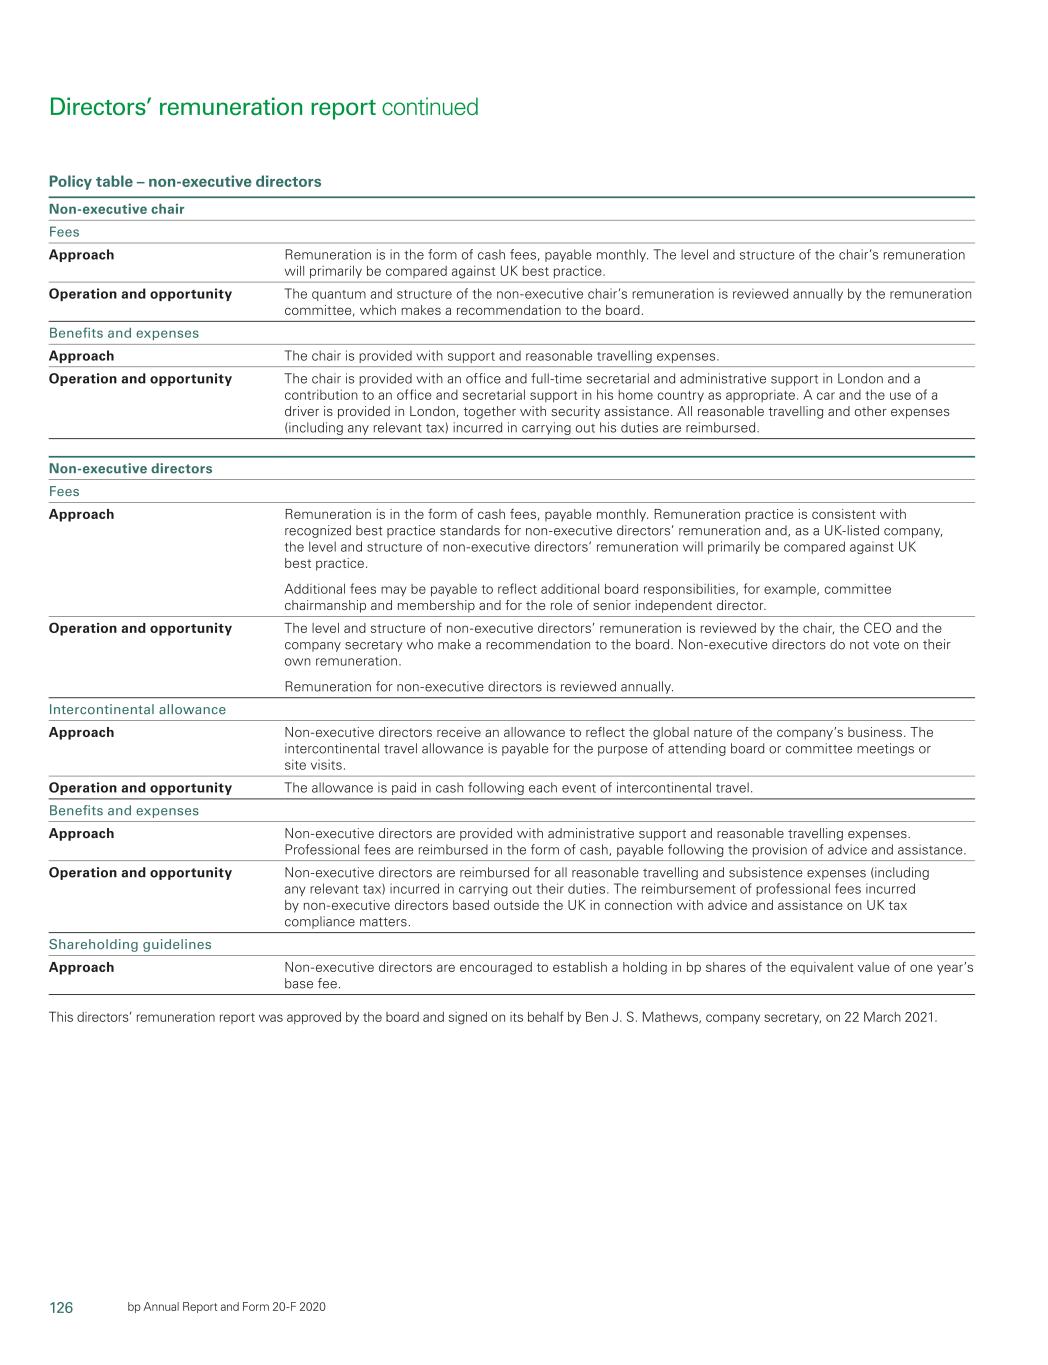
126 bp Annual Report and Form-20F 2019

Corporate governance 7. Clarity, simplicity, and other considerations related to the Service contract Corporate Governance Code Bob Dudley’s service contract is with BP Corporation North America The committee consider the scorecard-based approach to setting Inc., Bernard Looney’s and Brian Gilvary’s service contracts are with targets and measuring outcomes provides great clarity in our ability to BP p.l.c., and Murray Auchincloss’ service contract will be with BP p.l.c. engage transparently with shareholders and the wider workforce on remuneration arrangements, and that this is complemented by retaining Each executive director is entitled to retirement benefits as outlined on the simple structure of our 2017 policy; market aligned fixed pay with page 120. annual cash and three-year performance share incentives. Risks are Each executive director is also entitled to the following contractual managed through a combination of careful setting of performance benefits: measures and targets, the many options to apply committee discretion in assessing outcomes, and the robust malus and clawback measures • If appropriate for security reasons, a company car and driver is reserved in this policy. The committee also considers that remuneration provided for business and private use, with the company bearing outcomes are predictable, as shown clearly in the scenario charts at note all normal employment, servicing, insurance and running costs. 6 above, and proportional by virtue of the challenging performance levels Alternatively, where not required for security reasons, a cash required to achieve target pay outcomes. By retaining material weighting allowance may be paid instead. in measures related to both safety and the environment, this policy • Medical and dental benefits, sick pay during periods of absence and aligns closely with central themes of BP’s culture, purpose and ambition. assistance with the preparation of tax returns. • Indemnification in accordance with applicable law. Recruitment policy • Participation in bonus or incentive arrangements at the committee’s sole discretion. The committee expects any new executive director to be engaged on terms that are consistent with the policy. However it recognizes that it Each executive director may terminate their employment by giving cannot anticipate circumstances in which any new executive director may 12 months’ written notice. In this event, for business reasons, the be recruited. The committee may determine that it is in the interests of employer may not necessarily hold the executive director to their full the company and shareholders to secure the services of a particular notice period. individual which may require it to take account of the terms of that The employer may lawfully terminate the executive director’s individual’s existing employment and/or their personal circumstances. employment in the following ways: Accordingly, the committee will ensure that: • By giving the director 12 months’ written notice. • The salary level of any new director is appropriate to their role and • Without compensation, in circumstances where the employer is the competitive environment at the time of appointment. Where entitled to terminate for cause, as defined for the purposes of their appropriate it may appoint an individual on a lower salary (relative to service contract. any previous incumbent), then gradually increase salary levels as the The company may lawfully terminate employment by making a lump individual gains experience in the role. sum payment in lieu of notice equal to 12 months’ salary or by monthly • Variable remuneration will be awarded within the parameters of instalments rather than as a lump sum. the policy for current executive directors. • The committee may tailor the vesting criteria for initial incentive The lawful termination mechanisms described above are without awards depending on the specific circumstances. prejudice to the employer’s ability in appropriate circumstances to • Where an existing employee is promoted to the board, the company terminate in breach of the notice period referred to above, and thereby may honour all existing contractual commitments including any to be liable for damages to the executive director. outstanding share awards or pension entitlements. In the event of termination by the company, each executive director • The committee would expect any new director to participate may have an entitlement to compensation in respect of their statutory in the company pension and benefit schemes that are open to rights under employment protection legislation in the UK and potentially other employees (where appropriate referencing the candidate’s elsewhere. Where appropriate the company may also meet a director’s home country). reasonable legal expenses in connection with either their appointment • Where an individual is relocating in order to take up the role, the or termination of their appointment. company may provide certain one-off benefits such as reasonable relocation expenses, accommodation for a period following Copies of the executive directors’ service contracts, along with the appointment, assistance with visa applications or other immigration non-executive director appointment letters, are available for inspection issues and ongoing arrangements such as tax filing assistance, at the registered office of BP p.l.c. annual flights home and a housing/utilities allowance. • Where an individual would be forfeiting remuneration or employment terms in order to join the company, the committee may award appropriate compensation. The committee would require reasonable evidence of the nature and value of any forfeited arrangements and would, to the extent practicable, ensure any compensation was of comparable commercial value and capped as appropriate, considering the terms of the previous arrangement being forfeited (for example the form and structure of award, timeframe, performance criteria and likelihood of vesting). Where appropriate, the committee prefers to deliver buy-outs in the form of restricted shares in the company. In making any decision on the remuneration of a new director, the committee would balance shareholder expectations, current best practice and the circumstances of any new director. It would strive not to pay more than is necessary to recruit the right candidate and would give full details in the next remuneration report. BP Annual Report and Form-20F 2019 125

Directors’ remuneration report –Form 20-F 2020 policy Termination payments In determining overall termination arrangements, the committee will distinguish between types of leaver and the circumstances of their leaving. The committee would also consider all relevant circumstances, including whether a contractual provision in the director’s arrangements complied with best practice at the time of termination and the date the provision was agreed, as well as the performance of the director in certain respects. Where appropriate, the committee may consider providing certain benefits relating to termination including the provision of outplacement support or reasonable costs associated with relocation back to an individual’s home country. Should it become necessary to terminate an executive director’s employment, and therefore to determine a termination payment, the committee’s policy is as follows: Termination The director’s primary entitlement would be a termination payment If the departing director is eligible for an early retirement pension, payments in respect of their service agreement, as set out above. However the committee would consider, if relevant under the terms of the the committee will consider mitigation to reduce the termination appropriate plan, the extent of any actuarial reduction that should be payment where appropriate to do so, taking into account the applied. UK directors who leave in circumstances approved by the circumstances for leaving and the terms of the agreement. committee may have a favourable actuarial reduction applied to their Mitigation would not be applicable where a contractual payment pensions (which to date has been 3%). Departing directors who in lieu of notice is made. leave in other circumstances may be subject to a greater reduction. Annual bonus The committee would consider whether the director should be Normally, any such bonus would be restricted to the director’s entitled to an annual bonus in respect of the financial year in which actual period of service in that financial year. the termination occurs. Share awards Share awards will be treated in accordance with the relevant plan In deciding whether to exercise discretion to preserve EDIP rules. For awards granted under the executive directors’ incentive awards, the committee would also consider the proximity of the plan (EDIP), the treatment can only be made in accordance with the award to its maturity date. framework approved by shareholders. To the extent that any such share award vests, the release of those The committee would consider whether conditional share awards shares to the former director will be made approximately one year held by the director should lapse on leaving or should, at the after their date of termination (even if they would have been subject committee’s discretion, be preserved. If awards are preserved, to a longer holding period had the executive remained in the award would normally continue until the vesting date. Awards employment with BP). may be pro-rated based on service over the performance period. Legacy arrangements and other detailed provisions Previously the deferred element of the annual bonus in respect of years up to and including 2016 attracted a corresponding award of matching shares. Although the committee no longer grants matching awards in respect of future bonus awards, executives retain interests in legacy awards previously granted under this arrangement under the terms set out in the 2014 policy. For completeness, the table below summarizes the key terms of the previous matching share element. Purpose To reinforce the long-term nature of the business and the importance of sustainability. Operation Previously one third of the annual bonus was subject to compulsory Where shares vest, additional shares representing the value of deferral and a further third was subject to voluntary deferral. reinvested dividends are added. These deferred shares were matched on a one-for-one basis. All deferred shares are subject to clawback provisions if they are found to have been granted on the basis of a material misstatement of financial or other data. Performance Both deferred and matching shares must pass an additional hurdle If there has been a material deterioration in safety and framework related to safety and environmental sustainability performance in environmental metrics, or major incidents revealing underlying order to vest. weaknesses in safety and environmental management then the committee, with advice from the board’s safety, environment and security assurance committee, may conclude that shares vest in part, or not at all. In addition to the award described above, the committee may continue to satisfy existing remuneration commitments and/or payments for loss of office, including the exercise of any discretion in connection with such payments provided that such terms were agreed: • before 10 April 2014 when the first approved remuneration policy came into effect • before the 2020 policy came into effect, provided that the terms of the payment were consistent with the shareholder-approved directors’ remuneration policy in force at the time they were agreed • at a time when the relevant individual was not a director of the company and, in the opinion of the committee, the payment was not in consideration for the individual becoming a director. Share awards are subject to the terms of the relevant plan rules under which the award has been granted. The committee may adjust or amend awards, but only in accordance with the provisions of the plan rules. This includes making adjustments to awards to reflect one-off corporate events, such as a change in the company’s capital structure or treatment of awards in the event of a change of control. In accordance with the plan rules, awards may be settled in cash rather than shares, where the committee considers this appropriate. The committee may make minor amendments to the policy to aid its operation or implementation without seeking shareholder approval, for example for regulatory, exchange control, tax or administrative purposes or to take account of a change in legislation provided that any such change is not to the material advantage of the directors. 126 BP Annual Report and Form-20F 2019

Corporate governance Remuneration in the wider group The committee considers employment conditions in the BP group when establishing and implementing policy for executive directors to ensure the alignment of and context for principles and approach. In particular, the committee reviews the policy and makes decisions for the most senior leaders (the BP leadership team that reports to the CEO). Decisions regarding remuneration for employees outside the most senior leaders are the responsibility of the chief executive officer. The committee does not consult directly with employees when formulating the policy. However, feedback from employee focus groups and employee surveys, that are regularly reported to the board, provide views on a wide range of employee matters including pay. The wider employee group participates in performance-based incentives. Throughout the group, salary and benefit levels are set in accordance with the prevailing relevant market conditions and practice in the countries in which employees are based. Differences between executive director pay policy and that of other employees reflect the senior position of the individuals, prevailing market conditions and corporate governance practices in respect of executive director remuneration. The key difference in policy for executive directors is that a greater proportion of total remuneration is delivered as performance-based incentives. Policy table –– non-executive directors The following table sets out the framework that will be used to determine the fees for non-executive directors during the term of this policy. Non-executive chairmanchair Fees Approach Remuneration is in the form of cash fees, payable monthly. The level and structure of the chairman’schair’s remuneration will primarily be compared against UK best practice. Operation and opportunity The quantum and structure of the non-executive chairman’schair’s remuneration is reviewed annually by the remuneration committee, which opportunity makes a recommendation to the board. Benefits and expenses Approach The chairmanchair is provided with support and reasonable travelling expenses. Operation and opportunity The chairmanchair is provided with an office and full-time secretarial and administrative support in London and a contribution to an office opportunity and secretarial support in his home country as appropriate. A car and the use of a driver is provided in London, together with security assistance. All reasonable travelling and other expenses (including any relevant tax) incurred in carrying out his duties isare reimbursed. Non-executive directors Fees Approach Remuneration is in the form of cash fees, payable monthly. Remuneration practice is consistent with recognized best practice standards for non-executive directors’directors’ remuneration and, as a UK-listed company, the level and structure of non-executive directors’directors’ remuneration will primarily be compared against UK best practice. Additional fees may be payable to reflect additional board responsibilities, for example, committee chairmanship and membership and for the role of senior independent director. Operation and opportunity The level and structure of non-executive directors’directors’ remuneration is reviewed by the chairman,chair, the CEO and the company secretary who opportunity make a recommendation to the board. Non-executive directors do not vote on their own remuneration. Remuneration for non-executive directors is reviewed annually. Intercontinental allowance Approach Non-executive directors may receive an allowance to reflect the global nature of the company’scompany’s business. ThisThe intercontinental travel allowance would beis payable for the purpose of attending board or committee meetings or site visits. Operation and Thisopportunity The allowance would beis paid in cash following each event of intercontinental travel. opportunity Benefits and expenses Approach Non-executive directors are provided with administrative support and reasonable travelling expenses. Professional fees are reimbursed in the form of cash, payable following the provision of advice and assistance. Operation and opportunity Non-executive directors are reimbursed for all reasonable travelling and subsistence expenses (including any relevant tax) incurred in opportunity carrying out their duties. ProfessionalThe reimbursement of professional fees incurred by non-executive directors based outside the UK in connection with advice and assistance on UK tax compliance matters are reimbursed.matters. Shareholding guidelines Approach Non-executive directors are encouraged to establish a holding in BPbp shares of the equivalent value of one year’syear’s base fee. Letters of appointment for chairman and non-executiveThis directors Approach The chairman and non-executive directors each have letters of appointment. There is no term limit on a director’s service, as BP proposes all directors for annual re-election by shareholders in line with best governance practice. There are no obligations arising from the non-executive directors’ letters of appointment for remuneration or payments for loss of office, except for the chairman whose appointment may be terminated in the following ways: • by either party giving three months’ written notice, or • by the company for cause (as set out in the letter of appointment) and without compensation. The company may lawfully terminate the appointment by making a lump sum payment in lieu of notice equal to three months’ fees. Copies of the executive directors’ service contracts and non-executive directors’ letters of appointment are available for inspection at the registered office of the company. The maximum fees for non-executive directors are set in accordance with the Articles of Association. This directors’’ remuneration report was approved by the board and signed on its behalf by Ben J.S.J. S. Mathews, company secretary, on 1822 March 2020. BP2021. Directors’ remuneration report continued

127 Corporate governance bp Annual Report and Form-20F 2019 127

Form 20-F 2020 Pages 128-129127-128 have been removed as they do not form part of BP’s Annual Report on Form 20-F as filed with the SEC. 128 BP Annual Report and Form 20-F 2019

Corporate governance Pages 128-129 have been removed as they do not form part of BP’s Annual Report on Form 20-F as filed with the SEC. BP Annual Report and Form 20-F 2019 129

Energy with purpose means transforming while performing. Energy with purpose BPX Energy: Delivering synergies We have been transforming BPX Energy, our US onshore oil and gas business, with the purchase of world-class unconventional assets from BHP. • The acquisition gave us access to some of the best basins in the onshore US, with 487,000 acres of leasehold across a new position in the liquids-rich Permian-Delaware basin, and two positions in the Eagle Ford and Haynesville basins. • It positions BP as a top producer in the region. Good progress Since we began operating the assets, we have delivered synergies of $240 million in 2019, above our planned target of $90 million. 130 BP Annual Report and Form 20-F 2019
|
| | | | | | | | | | |
| | | | | | | | |
Financial statements | | | |
| | | Independent auditor’s | | | | Group statement of | |
| | | reports | | | | changes in equity | |
| | | | | | | | |
| | | Group statement of | | | | | |
| | | | comprehensive income | | | | | | |
| | | | | | | | |
| | | | |
| | | | 1. | Significant accounting | | | 21. | Valuation and qualifying | |
| | | | | policies | | | | accounts | |
| | | | 2. | Non-current assets | | | 22. | Trade and other | |
| | | | | held for sale | | | | payables | |
| | | | 3. | Business combinations | | | 23. | Provisions | |
| | | | | and other significant | | | 24. | Pensions and other post- | |
| | | | | transactions | | | | retirement benefits | |
| | | | 4. | Disposals and | | | 25. | Cash and cash equivalents | |
| | | | | impairment | | | 26. | Finance debt | |
| | | | 5. | Segmental analysis | | | 27. | Capital disclosures and | |
| | | | 6. | Revenue from contracts | | | | net debt | |
| | | | | with customers | | | 28. | Leases | |
| | | | 7. | Income statement | | | 29. | Financial instruments and | |
| | | | | analysis | | | | financial risk factors | |
| | | | 8. | Exploration expenditure | | | 30. | Derivative financial | |
| | | | 9. | Taxation | | | | instruments | |
| | | | 10. | Dividends | | | 31. | Called-up share capital | |
| | | | 11. | Earnings per share | | | 32. | Capital and reserves | |
| | | | 12. | Property, plant and | | | 33. | Contingent liabilities | |
| | | | | equipment | | | 34. | Remuneration of senior | |
| | | | 13. | Capital commitments | | | | management and non- | |
| | | | 14. | Goodwill | | | | executive directors | |
| | | | 15. | Intangible assets | | | 35. | Employee costs and | |
| | | | 16. | Investments in joint | | | | numbers | |
| | | | | ventures | | | 36. | Auditor’s remuneration | |
| | | | 17. | Investments in | | | 37. | Subsidiaries, joint | |
| | | | | associates | | | | arrangements and | |
| | | | 18. | Other investments | | | | associates | | |
| | | | 19. | Inventories | | | 38. | Condensed consolidating | | |
| | | | 20. | Trade and other | | | | information on certain US | | |
| | | | | receivables | | | | subsidiaries | | |
| | | | | | | | | | | |
| | | | | | | | | | | |
| | | | | | | | |
| | | | Supplementary information on oil and natural gas (unaudited) |
| | | | Oil and natural gas | | | | Standardized measure of | |
| | | | exploration and production | | | | discounted future net cash | |
| | | | activities | | | | flows and changes therein | |
| | | | Movements in estimated net | | | | relating to proved oil and | |
| | | | proved reserves | | | | gas reserves | |
| | | | | | | | Operational and statistical | |
| | | | | | | | | information | | |
| | | | | | | | |
| | | | |
| | | | | | | | | |
| | | | | | | | | |
| | | | | | | | | | |
| | | | | | | | | | |
| | | | | | | | | | |
| | | | | | | | | | |
| | | | | | | | | | |
| | | | | | | | | | | |
| | | | | | | | | | | |
|
| | | |
| BP Annual Report and Form 20-F 2019
| | 131 |
Consolidated financial statements of the BP group
Pages 132-145 have been removed as they do not form part of BP'sbp’s Annual Report on Form 20-F as filed with the SEC.
128 bp Annual Report and Form 20-F 2020 Pages 127-128 have been removed as they do not form part of bp’s Annual Report on Form 20-F as filed with the SEC.
| | | | | | | | | | | | | | | | | | | | | | | | | | | | | | | | | | | | | | |
| | | | | | | | |
| | | | | | | |
| Consolidated financial statements of the bp group |
| | | | | | | |
| Independent auditor's reports | | | Group statement of changes in equity | |
| Group income statement | | | Group balance sheet | |
| Group statement of comprehensive income | | | Group cash flow statement | |
| | | | | | | |
| | | | | | | |
| | | | | | | |
| Notes on financial statements |
| 1. | Significant accounting policies | | | 22. | Trade and other payables | |
| 2. | Non-current assets held for sale | | | 23. | Provisions | |
| 3. | Business combinations and other significant transactions | | | 24. | Pensions and other post-retirement benefits | |
| 4. | Disposals and impairment | | | 25. | Cash and cash equivalents | |
| 5. | Segmental analysis | | | 26. | Finance debt | |
| 6. | Revenue from contracts with customers | | | 27. | Capital disclosures and net debt | |
| 7. | Income statement analysis | | | 28. | Leases | |
| 8. | Exploration expenditure | | | 29. | Financial instruments and financial risk factors | |
| 9. | Taxation | | |
| 10. | Dividends | | | 30. | Derivative financial instruments | |
| 11. | Earnings per share | | | 31. | Called-up share capital | |
| 12. | Property, plant and equipment | | | 32. | Capital and reserves | |
| 13. | Capital commitments | | | 33. | Contingent liabilities and legal proceedings | |
| 14. | Goodwill | | | 34. | Remuneration of senior management and non-executive directors | |
| 15. | Intangible assets | | |
| 16. | Investments in joint ventures | | | 35. | Employee costs and numbers | |
| 17. | Investments in associates | | | 36. | Auditor's remuneration | |
| 18. | Other investments | | | 37. | Subsidiaries, joint arrangements and associates | |
| 19. | Inventories | | |
| 20. | Trade and other receivables | | | 38. | Condensed consolidating information on certain US subsidiaries | |
| 21. | Valuation and qualifying accounts | | |
| | | | | | | |
| | | | | | | |
| | | | | | | |
| Supplementary information on oil and natural gas (unaudited) |
| | | | | | | |
| Oil and natural gas exploration and production activities | | | Standardized measure of discounted future net cash flows and changes therein relating to proved oil and gas reserves | |
| Movements in estimated net proved reserves | | |
| | | | | Operational and statistical information | |
| | | | | | | |
| | | | | | | | | | | | |
| | | | | | | | | | | | | | |
| | bp Annual Report and Form 20-F 2020 | | 129 |
Consolidated financial statements of the bp group
Pages 130-149 have been removed as they do not form part of bp's Annual Report on Form 20-F as filed with the SEC.
This page does not form part of bp's Annual Report on Form 20-F as filed with the SEC.
| | | | | | | | | | | | | | |
| 130 | | bp Annual Report and Form 20-F 2020 | | |
Pages 130-149 have been removed as they do not form part of bp's Annual Report on Form 20-F as filed with the SEC.
This page does not form part of BP's Annual Report on Form 20-F as filed with the SEC.
|
| | | | | | | | | | | | | |
132 | | BPbp Annual Report and Form 20-F 2019
2020 | | 131 |
Pages 132-145 have been removed as they do not form part of BP's Annual Report on Form 20-F as filed with the SEC.
This page does not form part of BP's Annual Report on Form 20-F as filed with the SEC.
|
| | | |
| BP Annual Report and Form 20-F 2019
| | 133 |
Consolidated financial statements of the BPbp group
Report of Independent Registered Public Accounting Firm
To the shareholders and board of directors of BP p.l.c.
Opinion on the financial statements
We have audited the accompanying consolidated group balance sheets of BP p.l.c. (the company) and subsidiaries (together the group)company) as atof 31 December 20192020 and 2018, and2019, the related consolidated group income statements, group statements of comprehensive income, group statements of changes in equity, and group cash flow statements, for each of the twothree years in the period ended 31 December 2019,2020, and the related notes as well as the legal proceedings described on pages 319-320 (collectively referred to as the 'group financial'financial statements'). In our opinion, the group financial statements present fairly, in all material respects, the financial position of the groupcompany as atof 31 December 20192020 and 2018,2019, and the results of its operations and its cash flows for each of the twothree years in the period ended 31 December 2019,2020, in conformity with International Financial Reporting Standards (IFRS) as adopted by the European Union and IFRS as issued by the International Accounting Standards Board.
We have also audited, in accordance with the standards of the Public Company Accounting Oversight Board (United States) (PCAOB), the group'scompany's internal control over financial reporting as of 31 December 2019,2020, based on criteria established in the UK Financial Reporting Council’s Guidance on Risk Management, Internal Control and Related Financial and Business Reporting relating to internal control over financial reporting and our report dated 1822 March 20202021 expressed an unqualified opinion on the group's internal control over financial reporting.
Basis for opinion
These financial statements are the responsibility of the group's management. Our responsibility is to express an opinion on the group's financial statements based on our audits. We are a public accounting firm registered with the PCAOB and are required to be independent with respect to the group in accordance with the U.S. federal securities laws and the applicable rules and regulations of the Securities and Exchange Commission and the PCAOB.
We conducted our audits in accordance with the standards of the PCAOB. Those standards require that we plan and perform the audit to obtain reasonable assurance about whether the financial statements are free of material misstatement, whether due to error or fraud. Our audits included performing procedures to assess the risks of material misstatement of the financial statements, whether due to error or fraud, and performing procedures that respond to those risks. Such procedures included examining, on a test basis, evidence regarding the amounts and disclosures in the financial statements. Our audits also included evaluating the accounting principles used and significant estimates made by management, as well as evaluating the overall presentation of the financial statements. We believe that our audit providesaudits provide a reasonable basis for our opinion.
Critical Audit Matters
The critical audit matters communicated below are matters arising from the current-period audit of the group financial statements that were communicated or required to be communicated to the audit committee and that (1) relate to accounts or disclosures that are material to the group financial statements and (2) involved our especially challenging, subjective, or complex judgments. The communication of critical audit matters does not alter in any way our opinion on the financial statements, taken as a whole, and we are not, by communicating the critical audit matters below, providing separate opinions on the critical audit matters or on the accounts or disclosures to which they relate.
Throughout the course of our audit we identify risks of material misstatement ('risks'). We consider both the likelihood of a risk1.Property, plant and the potential magnitude of a misstatement in making the assessment. Certain risks are classified as 'significant' or 'higher' depending on their severity. The category of the risk determines the level of evidence we seek in providing assurance that the associated financial statement item is not materially misstated.
equipment (PP&E) assets – Impairment of upstream oil and gas property, plant and equipment (PP&E) assets -– Notes 1, 4 and 12 to the financial statements
Critical Audit Matter Description
The group balance sheet at 31 December 2020 includes property, plant and equipment (PP&E)PP&E of $133$115 billion, of which $90$74 billion is oil and gas properties within the upstream segment.
Management announced an approximately $10 billion disposal programme for 2019 and 2020. As a consequenceManagement’s best estimate of this, certain assets identified for disposal have been assessed for impairment in the context of their fair value based on the expected disposal proceeds from third parties, as opposed to their value in use.
The transition to a lower carbon global economy may potentially lead to a lower oil and gas price scenario in the future due to declining demand. Management took into account considerations of uncertainty over the pace of the transition to lower-carbon supply and demand and the social, political and environmental actions that will be taken to meet the goals of the Paris climate change agreement when determining their future oil and gas price assumptions andfor value–in-use impairment tests were revised the future price assumptions downwards whenduring 2020 compared withto the prior year assumptions, as set out in Note 1 on page 162. As161. The downward revisions reflect an expectation that the aftermath of the COVID-19 pandemic will accelerate the pace of transition to a consequence, they identified a risklower carbon economy and energy system. Given the significance of impairment acrossthese revisions, management tested all upstream CGUs.CGUs for impairment.
Accordingly, as required by International Accounting Standard (IAS) 36 'ImpairmentManagement recorded $12.9 billion of Assets', management performed a reviewpre-tax upstream CGU impairment charges, in large part due to the oil and gas prices revisions detailed above, and $0.1 billion of all thepre-tax upstream cash generating units (CGUs) for indicators ofCGU impairment and impairment reversal as at 31 December 2019.reversals. Further information has been provided in Note 1.1 on page 160, Note 4 on page 179 and Note 12 on page 189.
In large part due to the disposal programme, for the year ended 31 December 2019 BP recorded $5,871 million of upstream impairment charges and $129 million of impairment reversals. Through our audit risk assessment procedures, we have determined that there area identified a critical audit matter in respect of PP&E impairment principally due to the following three key management estimates in management’s determination of the level of impairment charge/charge and/or reversal to record.
•Oil and gas prices - bp’s oil and gas price assumptions have a significant impact on many CGU impairment assessments performed across the upstream segment, and are inherently uncertain. As noted above, the estimation of future prices is subject to increased uncertainty given climate change, the global energy transition and the impact of COVID-19. There is a risk that management do not forecast reasonable “best estimate” oil and gas price forecasts when assessing CGUs for impairment, leading to material misstatements. These are:price assumptions are highly judgmental and are pervasive inputs to most upstream impairment tests, such that any misstatements would also aggregate. There is also a risk that management’s oil and gas price related disclosures are not reasonable.
| |
a. | Oil and gas prices - BP’s oil and gas price assumptions have a significant impact on CGU impairment assessments and valuations performed across the portfolio, and are inherently uncertain. Furthermore, as noted above the estimation of future oil and gas prices is subject to increased uncertainty, given climate change and the global energy transition. There is a risk that management’s oil and gas price assumptions are not reasonable, leading to a material misstatement. The assumptions are highly judgemental.
|
| |
b. | Discount rates - Given the long timeframes involved, certain recoverable amounts of assets are sensitive to the discount rate applied. There is a risk that discount rates do not reflect the return required by the market and the risks inherent in the cash flows being discounted, leading to a material misstatement. Determination of the appropriate discount rate can be judgemental.
|
| |
c. | Reserves estimates - A key input to impairment assessments and valuations is the production forecast, in turn closely related to the group’s reserves estimates and field development assumptions. CGU-specific estimates are not generally material. However, material
|
•Discount rates - Given the long timeframes involved, certain CGU impairment assessments are sensitive to the discount rate applied. Discount rates should reflect the return required by the market and the risks inherent in the cash flows being discounted. There is a risk that management do not assume reasonable discount rates, adjusted as applicable for country risks and relevant tax rates, leading to material misstatements. Determining a reasonable discount rate is highly judgmental and, consistent with price assumptions above, the discount rate assumption is also a pervasive input across upstream impairment tests, before adjustments for asset specific risks and tax rates, such that any misstatements would also aggregate.
•Reserves and resources estimates - A key input to certain CGU impairment assessments is the oil and gas production forecast, which is based on underlying reserves estimates and field specific development assumptions. Certain CGU production forecasts include specific risk adjusted resource volumes, in addition to proved or probable reserves estimates, that are inherently less certain than reserves; and assumptions related to these volumes can be particularly judgemental. There is a risk that material misstatements could arise from unreasonable production forecasts for individually material CGUs and/or from the aggregation of systematic flaws in bp’s reserves and resources estimation policies across the segment.
|
| | | | | | | | | | | | | |
146150 | | BPbp Annual Report and Form 20-F 2019
2020 | | |
misstatements could arise either from systematic flaws in reserves estimation policies, or due to flawed estimates in a particularly material individual impairment test.We identified and focused on certain individual CGUs with a total carrying value of $12.3$32.1 billion which we determined would be most at risk of a material impairment charges or reversals as a result of a reasonably possibleplausible change in the key assumptions, particularly the oil and gas price and discount rate assumptions. Accordingly, we identified these as a significant audit risk.
We also focused on assetsidentified CGUs with a further $33.4$16.0 billion of combined CGU carrying value which were less sensitive. We identified these as a higher audit risksensitive as they would be potentially at risk, in aggregate, to a material impairment or reversal by a plausible change in suchsome or all of the key assumptions.
Further information regarding these sensitivities is given in Note 1 to the consolidated financial statements.on page 167.
How the Critical Audit Matter was addressed in the Audit
We tested management’s key internal controls over the settingestimation of oil and gas prices, discount rates and reserve and resources estimates, as well as thekey internal controls over the performance of the impairment valuation tests.assessments where we identified audit risks. In addition, we conducted the following substantive procedures.
Oil and gas prices
•We independently developed a reasonable range of forecasts based on external data obtained, against which we compared the company’s futuremanagement’s oil and gas price assumptions in order to challenge whether they are reasonable.
•In developing this range we obtained a variety of reputable and reliable third party forecasts, peer information and other relevant market data.
•In challenging management's price assumptions, we considered the extent to which they and each of the forecast pricing scenarios obtained from third parties reflect the impact of lower oil and gas demand due to climate change. change, the energy transition and COVID-19.
•We specifically reviewedanalysed third party forecasts stated as being, or interpreted by us as being, consistent with achieving the 2015 COP 21 Paris agreement goal to limit temperature rises to well below 2°C (Paris 2°C Goal).Goal and considered whether they presented contradictory audit evidence.
•We reviewed and challenged management’s disclosures in Notes 1 and 4 including in relation to the sensitivity of oil and gas price assumptions to reduced demand scenarios whether due to climate change or other reasons.
Discount rates
•We independently evaluated BP’sbp’s discount rates used in impairment tests with input from Deloitte valuation specialists.specialists, against relevant third party market and peer data.
•We assessed whether specific country risks and tax adjustments were appropriatelyreasonably reflected in BP’sbp’s discount rates.
•We challenged management’s disclosures in Notes 1 and 4 including in relation to the sensitivity of discount rate assumptions.
Reserves and resources estimates
We reviewed BP’s reserves estimation methods and policies, assisted by Deloitte reserves experts.
We assessed, withWith the assistance of Deloitte oil and gas reserves experts,specialists we:
•assessed bp’s reserves and resources estimation methods and policies;
•assessed, guided by our risk assessment, how these policies had been applied to a sample of internalbp’s reserves estimates.and resources estimates which included those that we judged to represent the greatest risk of material misstatement;
We reviewed•read a sample of reports provided by management’s external reserves experts and assessed theirthe scope of work and findings.findings of these third parties;
We •assessed the competence, capability and objectivity of BP’sbp’s internal and external reserve experts,experts; through obtainingunderstanding their relevant professional qualifications and experience.
We •compared hydrocarbonthe production forecasts used in the impairment tests with management’s approved reserves and resources estimates, those estimates having been subjected to estimatesthe controls that we had tested; and reports and our understanding of the life of fields.
We •performed a retrospective reviewassessment to check for indications of estimation bias over time.time
Other procedures
•We challenged management’s CGU determination,determinations, and considered whether there was any contradictory evidence present.
•We validated that BP’s assetbp’s impairment methodology was appropriateacceptable under IFRS and tested the integrity and mechanical accuracy of certain impairment models.models based on our risk assessment.
•We challenged other CGU specific valuation input assumptions, including but not limited to material cost and tax forecasts, by comparing forecasts to approved internal and third party budgets, development plans, independent expectations and historical actuals.
•Where relevant, we also assessed management’s historical forecasting accuracy and whether the estimates had been determined and applied on a consistent basis across the group.
Since 31 December 2019, the oil price has fallen sharply in large part due to the impact2.Intangible assets – Write-off of the international spread of COVID-19 (Coronavirus)Exploration and geopolitical factors. As part of our post balance sheet audit procedures we considered whether these events provide evidence of conditions that existed at the balance sheet date.
Impairment of exploration and appraisalAppraisal (E&A) assets, (includedincluded within 'intangible assets' within the groupGroup balance sheet) -sheet – Notes 1, 8 and 15 to the financial statements
Critical Audit Matter Description
The group capitalizes exploration and appraisal (E&A)capitalises E&A expenditure on a project-by-project basis in line with IFRS 6 'Exploration for and Evaluation of Mineral Resources'. At the end of 2019, $1431 December 2020, $4.1 billion of E&A expenditure was carried inon the group balance sheet.
E&A activity is inherently riskycarries inherent risk and a significant proportion of projects fail, requiring the write-off or impairment of the related capitalizedcapitalised costs when the relevant criteria in IFRS 6 and BP’sbp’s accounting policy are met.
There is a significant judgement relating to the risk that certain capitalized E&A costs are not written off promptly at the appropriate time, in line with information from, and decisions about, E&A activities and the impairment requirements of IFRS 6.
Furthermore, similar to upstream PP&E assets discussed above, E&A assets are also potentially exposed to climate change, and the global energy transition. Atransition, and COVID-19, in that a greater number of E&A projects may be expected not to proceed as a consequence of lower forecast future demand and oil and gas pricing, lower appetite by management and the board to allocate capital to certain projects, and/or increased objections from stakeholders to the development of certain projects.
DuringAs a result of bp’s revised strategy announced in 2020, including a reduced capital frame, a net-zero carbon ambition and a decision not to explore in new countries, and reflecting lower oil and gas price assumptions, management identified IFRS 6 impairment indicators at a number of upstream’s largest E&A assets during the current year,year. This led to management recording $9.9 billion of pre-tax E&A write-offs and subsequentimpairments during 2020, detailed further in Notes 1 and 8 on pages 164 and 184.
The determination of when E&A costs should be written off or impaired, or retained on the balance sheet as E&A assets, can be complex and require significant judgement from management in assessing this. There is a risk that certain capitalised E&A costs are written off or impaired when they
| | | | | | | | | | | | | | |
| | bp Annual Report and Form 20-F 2020 | | 151 |
should not have been, due to inappropriate and/or inconsistent application of IFRS 6 impairment criteria and bp’s accounting policy, leading to material misstatements. There is also a risk that E&A costs remain capitalised on the year end, managementbalance sheet which ought to have obtained license extensionsbeen written off or impaired, leading to material misstatements.
We identified a critical audit matter for the individually material E&A write-offs recorded in 2020, specifically the Kaskida and Tigris (Paleogene) licenses that were the largest part of the $2.5 billion Gulf of Mexico write downs, the Terre de Grace oil sands project that was the largest part of the $2.5 billion Canada write downs and the three licenses that were the largest part of the $2.1 billion Brazil write-downs. We also identified higher risks in relation to certain other regions where licenses had previously expired such2020 E&A write-offs and impairments recorded; and higher risks at certain assets within the $4.4 billion of E&A costs that we have concluded this does not represent a significant audit risk. Nevertheless, given the inherent uncertainty associated with the development and deployment of these assets, we still consider this area to be a higher risk.remain capitalised under IFRS 6 at 31 December 2020.
How the Critical Audit Matter was addressed in the Audit
We obtained an understanding of the group’s E&A impairment assessment processes and tested management’s key internal controls. This included the key internal controls
|
| | | |
| BP Annual Report and Form 20-F 2019
| | 147 |
including operated by management for the controls addressing potential climate change considerations.key decisions taken as a result of bp’s new strategy, which when taken together with the lower forecast oil and gas prices, led to a large portion of the material write-offs and impairments recorded during 2020.
We performed a licence-by-licence risk assessment of the group’schallenged management’s key E&A balance through to year end, to identify significant carrying amountsjudgements, with a current period risk of impairment (e.g. new information from exploration activities, or imminent licence expiry).
We performed a retrospective review of impairment charges recorded in the period, and assessed whether impairment charges were timely.
We reviewed and challenged management’s significant IFRS 6 impairment judgements, having regardregards to the impairment criteria of IFRS 6 and BP’sbp’s accounting policy. We verifiedcorroborated key factsinternal and external evidence relevant to significant carrying amounts (by obtaining for examplewrite-offs and the assets that remained on the balance sheet. This included analysing evidence of future E&A plans, budgets and budgets,capital allocation decisions, assessing management’s key accounting judgement papers, holding discussions to challenge top level operational and finance management on the key judgements taken and reading meeting minutes, license documentation and evidence of active dialogue with partners and regulators including negotiations to renew licences or modify key terms).terms, and external press releases.
For E&A assets that were written off or impaired by management in 2020, including in particular those based upon decisions taken in line with management’s new strategy, we considered whether evidence (and potential contradictory evidence) about activity in the year, future budgeted expenditure and exploration/appraisal plans, including plans and expectations for licence relinquishment or retention, were consistent with the decisions taken by management to write-off or impair these assets.
We testedassessed whether management had consistently applied IFRS 6 and bp’s accounting policy to impairment assessments, taking account of in year judgements and historical look back considerations, and the completenessrelevant facts and accuracycircumstances of information used in management’sspecific E&A impairment assessment, by reviewing and testing key controls over management’s register of E&A licences and agreeing key aspects of this to underlying support (e.g. licence documentation); holding meetings and discussions with operational and finance management; considering adverse changes in management’s reserves and resource estimates associated with E&A assets; reviewing correspondence with regulators and joint arrangement partners; and considering the implications of capital allocation decisions. assets.
When considering capital allocation decision making, we considered whether the developmentprogression of any projects that remain on the balance sheet would be inconsistent with the elements of BP’s currentbp’s new strategy which are designed to ensure it is resilient to the energy transition and climate change considerations or which would otherwise have a prohibitively high environmental or social impact for the directors to sanction the necessary investment.in particular its net zero carbon commitments.
3.Accounting for structured commodity transactions (SCTs) within the integrated supplytrading and tradingshipping (T&S) function (IST), and the valuation of other levelLevel 3 financial instruments, where fraud risks may arise in revenue recognition (potentially impacting all financial statement accounts, in particular finance debt) - Notes 1, 20, 22, 29 and 30 to the financial statements
Critical Audit Matter Description
In the normal course of business, ISTT&S enters into a variety of transactions for delivering value across the group’s supply chain. The nature of these transactions requires significant audit effort to be directed towards challenging management’s valuation estimates or the adopted accounting treatment.
We have undertaken an analysis of the portfolio composition and revisited our risk assessment throughout the year focussing particularly on the impact of COVID-19 on the valuation assertion. This process has provided us with a deeper understanding of the impact of market volatility, demand destruction and the changing structure of the markets in which bp operates.
Accounting for structured commodity transactions:
ISTT&S may also enter into a variety of transactions which we refer to as SCTs. We generally consider a SCT to be an arrangement having one of the following features:
•Two or more counterparties with non-standard contractual terms;
•Multiple commodity-based transactions; and/or
•Contractual arrangements entered into in contemplation of each other.
SCTs are often long-dated, can have a significant multi-year financial impact, and may require the use of complex valuation models or unobservable inputs when determining their fair value, in which case they will be classified as level 3 financial instruments under IFRS 13, ‘Fair Value Measurement’.
Accounting for SCTs is oftentypically complex and involves significant judgement,judgment, as these transactions often feature multiple elements that will have a material impact on the presentation and disclosure of these transactions in the financial statements and on key performance measures, including in particular the classification of liabilities as finance debt. WeAccordingly, we have identified the accounting for SCTs as a significantcritical audit risk.matter.
Level 3 financial instruments:
Unlike other financial instruments whose values or inputs are readily observable and therefore more easily independently corroborated, there are certain transactions for which the valuation is inherently more subjective due to the use of either complex valuation models and/or unobservable inputs. These instruments are classified as level 3 financial assets or liabilities under IFRS 13.liabilities. This degree of subjectivity also gives rise to a risk of potential fraud through management incorporating bias in determining fair values. Accordingly, we have identified these as a significant audit risk.
As at 31 December 2019,2020, the group’s total financial assets and liabilities measured at fair value were $12.5$12.7 billion and $8.8$8.4 billion, of which level 3 derivative financial assets were $5.3$6.4 billion and level 3 derivative financial liabilities were $4.4$5.3 billion.
How the Critical Audit Matter was addressed in the Audit
Accounting for SCTs
For structured commodity transactions, we performed audit procedures to:we:
Test•Tested controls related to the accounting for complex transactions.
Develop•Developed an understanding of the commercial rationale of the transactions through review ofreading transaction support documents and executed agreements, and discussions with management.
Perform•Performed a detailed accounting analysis for a sample of structured commodity transactionsSCTs involving significant day one profits, deferred working capital arrangements, offtake arrangements and/or commitments. We confirmed that any day one profits were appropriately deferred.
| | | | | | | | | | | | | | |
| 152 | | bp Annual Report and Form 20-F 2020 | | |
For SCTs which were identified during 2018 and 2019 and that continue through 2020, we have refreshed our assessment in 2020 taking account of any amendments to the contracts.
To assess the appropriateness of the accounting treatment of SCTs, we embedded technical accounting specialists within the audit team.
During the year we identified two new SCTs which were subjected to our audit procedures listed above. We also reconsidered the SCTs which were identified during 2018 and which have been subject to ongoing assessment in 2019.
Other levelLevel 3 financial instruments:
To address the complexities associated with auditing the value of level 3 financial instruments, the engagement team included valuation specialists having significant quantitative and modelling expertise to assist in performing our audit procedures. Our valuation audit procedures included the following control and substantive procedures:
•We tested the group’s valuation controls including the:
–Model certification control, which is designed to review a model’s theoretical soundness and the appropriateness of its valuation methodology; and
–Independent price verification control, which is designed to review the appropriateness of valuation inputs that are not observable and are significant to the financial instrument’s valuation. |
| | | |
148 | | BP Annual Report and Form 20-F 2019
| |
| |
– | Model certification control, which is designed to review a model’s theoretical soundness and the appropriateness of its valuation methodology; and |
| |
– | Independent price verification control, which is designed to review the appropriateness of valuation inputs that are not observable and are significant to the financial instrument’s valuation. |
•We performed substantive valuation testing procedures at interim and year-end balance sheet date, including:
| |
– | Engaging a Deloitte valuations specialist to develop fair value estimates, using independently sourced inputs where these were available, and challenge models to evaluate against management’s fair value estimates by evaluating whether the differences between our independent estimates and management’s estimates were within a reasonable range. In situations where we utilised management’s inputs, these were compared to external data sources to ensure they were reasonable; |
| |
– | Evaluating management’s valuation methodologies against standard valuation practice and analysing whether a consistent framework is applied across the business period over period; and |
| |
– | Comparing management’s input assumptions against the expected assumptions of other market participants and observable market data. |
–Comparing management’s input assumptions against the expected assumptions of other market participants and observable market data;
–Evaluating management’s valuation methodologies against standard valuation practice and analysing whether a consistent framework is applied across the business period over period; and
–Engaging a Deloitte valuations specialist to challenge models, develop fair value estimates and verify consistency in management’s modelling and input assumptions throughout the year. Our independent estimates were established using independently sourced inputs (where available). We evaluated whether the differences between our independent estimates and management’s estimates were within a reasonable range. In situations where we utilised management’s inputs, these were compared to external data sources to determine whether they were reasonable.
/s/ Deloitte LLP
London
United Kingdom
1822 March 20202021
The first accounting period we audited was the 12 monthsmonth period ended 31 December 2018. In 2017, we commenced our audit planning procedures.
|
| | | | | | | | | | | | | |
| BP
| bp Annual Report and Form 20-F 20192020 | | 149153 |
Consolidated financial statements of the BPbp group
Report of Independent Registered Public Accounting Firm
To the shareholders and board of directors of BP p.l.c.
Opinion on internal control over financial reporting
We have audited the internal control over financial reporting of BP p.l.c. and subsidiaries (the Company) as at 31 December 2019,2020, based on the criteria established in the UK Financial Reporting Council’s Guidance on Risk Management, Internal Control and Related Financial and Business Reporting relating to internal control over financial reporting (UK FRC Guidance). In our opinion, the Company maintained, in all material respects, effective internal control over financial reporting as ofat 31 December 2019,2020, based on the criteria established in the UK FRC Guidance.
We have also audited, in accordance with the standards of the Public Company Accounting Oversight Board (United States) (PCAOB), the consolidated financial statements as at and for the year ended 31 December 2019,2020, of the Company and our report dated 1822 March 2020,2021, expressed an unqualified opinion on those consolidated financial statements.
Basis for opinion
The Company's management is responsible for maintaining effective internal control over financial reporting and for its assessment of the effectiveness of internal control over financial reporting, included in the accompanying Management’s report on internal control over financial reporting. Our responsibility is to express an opinion on the Company's internal control over financial reporting based on our audit. We are a public accounting firm registered with the PCAOB and are required to be independent with respect to the Company in accordance with the U.S. federal securities laws and the applicable rules and regulations of the Securities and Exchange Commission and the PCAOB.
We conducted our audit in accordance with the standards of the PCAOB. Those standards require that we plan and perform the audit to obtain reasonable assurance about whether effective internal control over financial reporting was maintained in all material respects. Our audit included obtaining an understanding of internal control over financial reporting, assessing the risk that a material weakness exists, testing and evaluating the design and operating effectiveness of internal control based on the assessed risk, and performing such other procedures as we considered necessary in the circumstances. We believe that our audit provides a reasonable basis for our opinion.
Definition and limitations of internal control over financial reporting
A company’s internal control over financial reporting is a process designed to provide reasonable assurance regarding the reliability of financial reporting and the preparation of financial statements for external purposes in accordance with generally accepted accounting principles. A company’s internal control over financial reporting includes those policies and procedures that (1) pertain to the maintenance of records that, in reasonable detail, accurately and fairly reflect the transactions and dispositions of the assets of the company; (2) provide reasonable assurance that transactions are recorded as necessary to permit preparation of financial statements in accordance with generally accepted accounting principles, and that receipts and expenditures of the company are being made only in accordance with authorizations of management and directors of the company; and (3) provide reasonable assurance regarding prevention or timely detection of unauthorized acquisition, use, or disposition of the company’s assets that could have a material effect on the financial statements.
Because of its inherent limitations, internal control over financial reporting may not prevent or detect misstatements. Also, projections of any evaluation of effectiveness to future periods are subject to the risk that controls may become inadequate because of changes in conditions, or that the degree of compliance with the policies or procedures may deteriorate.
/s/ Deloitte LLP
London, United Kingdom
1822 March 20202021
|
| | | |
150 | | BP Annual Report and Form 20-F 2019
| |
Consolidated financial statements of the BP group
Report of Independent Registered Public Accounting Firm
To the shareholders and board of directors of BP p.l.c.
Opinion on the financial statements
We have audited the accompanying group balance sheet of BP p.l.c. (the Company) as of 31 December 2017, and the related group income statement, group statement of comprehensive income, group statement of changes in equity and group cash flow statement for the period ended 31 December 2017, and the related notes (collectively referred to as the "group financial statements"). In our opinion, the group financial statements present fairly, in all material respects, the financial position of BP p.l.c. at 31 December 2017 and the results of its operations and its cash flows for the period ended 31 December 2017, in conformity with International Financial Reporting Standards (IFRS) as adopted by the European Union and IFRS as issued by the International Accounting Standards Board.
Basis for opinion
These financial statements are the responsibility of BP p.l.c.'s management. Our responsibility is to express an opinion on these financial statements based on our audit. We are a public accounting firm registered with the PCAOB and are required to be independent with respect to BP p.l.c. in accordance with the U.S. federal securities laws and the applicable rules and regulations of the Securities and Exchange Commission and the PCAOB.
We conducted our audit in accordance with the standards of the PCAOB. Those standards require that we plan and perform the audit to obtain reasonable assurance about whether the financial statements are free of material misstatement, whether due to error or fraud. Our audit included performing procedures to assess the risks of material misstatement of the financial statements, whether due to error or fraud, and performing procedures that respond to those risks. Such procedures included examining, on a test basis, evidence regarding the amounts and disclosures in the financial statements. Our audit also included evaluating the accounting principles used and significant estimates made by management, as well as evaluating the overall presentation of the financial statements. We believe that our audit provides a reasonable basis for our opinion.
/s/ Ernst & Young LLP
We served as the Company's auditor from 1909 to 2018.
London, United Kingdom
29 March 2018
Note that the report set out above is included for the purposes of BP p.l.c.’s Annual Report on Form 20-F for 2019 only and does not form part of BP p.l.c.’s Annual Report and Accounts for 2017.
|
| | | |
| BP Annual Report and Form 20-F 2019
| | 151 |
Group income statement
|
| | | | | | | | | |
| For the year ended 31 December | | | | | $ million |
|
| | | Note |
| 2019 |
| 2018 |
| 2017 |
|
| Sales and other operating revenues | | 5 |
| 278,397 |
| 298,756 |
| 240,208 |
|
| Earnings from joint ventures – after interest and tax | | 16 |
| 576 |
| 897 |
| 1,177 |
|
| Earnings from associates – after interest and tax | | 17 |
| 2,681 |
| 2,856 |
| 1,330 |
|
| Interest and other income | | 7 |
| 769 |
| 773 |
| 657 |
|
| Gains on sale of businesses and fixed assets | | 4 |
| 193 |
| 456 |
| 1,210 |
|
| Total revenues and other income | | | 282,616 |
| 303,738 |
| 244,582 |
|
| Purchases | | 19 |
| 209,672 |
| 229,878 |
| 179,716 |
|
| Production and manufacturing expenses | | | 21,815 |
| 23,005 |
| 24,229 |
|
| Production and similar taxes | | 5 |
| 1,547 |
| 1,536 |
| 1,775 |
|
| Depreciation, depletion and amortization | | 5 |
| 17,780 |
| 15,457 |
| 15,584 |
|
| Impairment and losses on sale of businesses and fixed assets | | 4 |
| 8,075 |
| 860 |
| 1,216 |
|
| Exploration expense | | 8 |
| 964 |
| 1,445 |
| 2,080 |
|
| Distribution and administration expenses | | | 11,057 |
| 12,179 |
| 10,508 |
|
| Profit before interest and taxation | | | 11,706 |
| 19,378 |
| 9,474 |
|
| Finance costs | | 7 |
| 3,489 |
| 2,528 |
| 2,074 |
|
| Net finance expense relating to pensions and other post-retirement benefits | | 24 |
| 63 |
| 127 |
| 220 |
|
| Profit before taxation | | | 8,154 |
| 16,723 |
| 7,180 |
|
| Taxation | | 9 |
| 3,964 |
| 7,145 |
| 3,712 |
|
| Profit for the year | | | 4,190 |
| 9,578 |
| 3,468 |
|
| Attributable to | | | | | |
| BP shareholders | | | 4,026 |
| 9,383 |
| 3,389 |
|
| Non-controlling interests | | | 164 |
| 195 |
| 79 |
|
| | | | 4,190 |
| 9,578 |
| 3,468 |
|
| Earnings per share | | | | | |
| Profit for the year attributable to BP shareholders | | | | | |
| Per ordinary share (cents) | | | | | |
| Basic | | 11 |
| 19.84 |
| 46.98 |
| 17.20 |
|
| Diluted | | 11 |
| 19.73 |
| 46.67 |
| 17.10 |
|
| Per ADS (dollars) | | | | | |
| Basic | | 11 |
| 1.19 |
| 2.82 |
| 1.03 |
|
| Diluted | | 11 |
| 1.18 |
| 2.80 |
| 1.03 |
|
|
| | | |
152 | | BP Annual Report and Form 20-F 2019
| |
Group statement of comprehensive incomea
|
| | | | | | | | | |
| For the year ended 31 December | | | | | $ million |
|
| | | Note |
| 2019 |
| 2018 |
| 2017 |
|
| Profit for the year | | | 4,190 |
| 9,578 |
| 3,468 |
|
| Other comprehensive income | | | | | |
| Items that may be reclassified subsequently to profit or loss | | | | | |
| Currency translation differences | | | 1,538 |
| (3,771 | ) | 1,986 |
|
| Exchange (gains) losses on translation of foreign operations reclassified to gain or loss on sale of businesses and fixed assets | | | 880 |
| — |
| (120 | ) |
| Available-for-sale investments | | | — |
| — |
| 14 |
|
| Cash flow hedges marked to market | | 30 |
| (100 | ) | (126 | ) | 197 |
|
| Cash flow hedges reclassified to the income statement | | 30 |
| 106 |
| 120 |
| 116 |
|
| Cash flow hedges reclassified to the balance sheet | | 30 |
| — |
| — |
| 112 |
|
| Costs of hedging marked to market | | 30 |
| (4 | ) | (244 | ) | — |
|
| Costs of hedging reclassified to the income statement | | 30 |
| 57 |
| 58 |
| — |
|
| Share of items relating to equity-accounted entities, net of tax | | 16, 17 |
| 82 |
| 417 |
| 564 |
|
| Income tax relating to items that may be reclassified | | 9 |
| (70 | ) | 4 |
| (196 | ) |
| | | | 2,489 |
| (3,542 | ) | 2,673 |
|
| Items that will not be reclassified to profit or loss | | | | | |
| Remeasurements of the net pension and other post-retirement benefit liability or asset | | 24 |
| 328 |
| 2,317 |
| 3,646 |
|
| Cash flow hedges that will subsequently be transferred to the balance sheet | | 30 |
| (3 | ) | (37 | ) | — |
|
| Income tax relating to items that will not be reclassified | | 9 |
| (157 | ) | (718 | ) | (1,303 | ) |
| | | | 168 |
| 1,562 |
| 2,343 |
|
| Other comprehensive income | | | 2,657 |
| (1,980 | ) | 5,016 |
|
| Total comprehensive income | | | 6,847 |
| 7,598 |
| 8,484 |
|
| Attributable to | | | | | |
| BP shareholders | | | 6,674 |
| 7,444 |
| 8,353 |
|
| Non-controlling interests | | | 173 |
| 154 |
| 131 |
|
| | | | 6,847 |
| 7,598 |
| 8,484 |
|
| |
a
| See Note 32 for further information. |
|
| | | |
| BP Annual Report and Form 20-F 2019
| | 153 |
Group statement of changes in equitya
|
| | | | | | | | | | | | | | | | | |
| | | | | | | | | | $ million |
|
| | | Share capital and capital reserves |
| Treasury shares |
| Foreign currency translation reserve |
| Fair value reserves |
| Profit and loss account |
| BP shareholders' equity |
| Non-controlling interests |
| Total equity |
|
| At 31 December 2018 | | 46,352 |
| (15,767 | ) | (8,902 | ) | (987 | ) | 78,748 |
| 99,444 |
| 2,104 |
| 101,548 |
|
| Adjustment on adoption of IFRS 16, net of tax | | — |
| — |
| — |
| — |
| (329 | ) | (329 | ) | (1 | ) | (330 | ) |
| At 1 January 2019 | | 46,352 |
| (15,767 | ) | (8,902 | ) | (987 | ) | 78,419 |
| 99,115 |
| 2,103 |
| 101,218 |
|
| Profit for the year | | — |
| — |
| — |
| — |
| 4,026 |
| 4,026 |
| 164 |
| 4,190 |
|
| Other comprehensive income | | — |
| — |
| 2,407 |
| 52 |
| 189 |
| 2,648 |
| 9 |
| 2,657 |
|
| Total comprehensive income | | — |
| — |
| 2,407 |
| 52 |
| 4,215 |
| 6,674 |
| 173 |
| 6,847 |
|
Dividendsb | | — |
| — |
| — |
| — |
| (6,929 | ) | (6,929 | ) | (213 | ) | (7,142 | ) |
| Cash flow hedges transferred to the balance sheet, net of tax | | — |
| — |
| — |
| 23 |
| — |
| 23 |
| — |
| 23 |
|
| Repurchase of ordinary share capital | | — |
| — |
| — |
| — |
| (1,511 | ) | (1,511 | ) | — |
| (1,511 | ) |
| Share-based payments, net of tax | | 173 |
| 1,355 |
| — |
| — |
| (809 | ) | 719 |
| — |
| 719 |
|
| Share of equity-accounted entities’ changes in equity, net of tax | | — |
| — |
| — |
| — |
| 5 |
| 5 |
| — |
| 5 |
|
| Transactions involving non-controlling interests, net of tax | | — |
| — |
| — |
| — |
| 316 |
| 316 |
| 233 |
| 549 |
|
| At 31 December 2019 | | 46,525 |
| (14,412 | ) | (6,495 | ) | (912 | ) | 73,706 |
| 98,412 |
| 2,296 |
| 100,708 |
|
| | | | | | | | | | |
| At 31 December 2017 | | 46,122 |
| (16,958 | ) | (5,156 | ) | (743 | ) | 75,226 |
| 98,491 |
| 1,913 |
| 100,404 |
|
| Adjustment on adoption of IFRS 9, net of tax | | — |
| — |
| — |
| (54 | ) | (126 | ) | (180 | ) | — |
| (180 | ) |
| At 1 January 2018 | | 46,122 |
| (16,958 | ) | (5,156 | ) | (797 | ) | 75,100 |
| 98,311 |
| 1,913 |
| 100,224 |
|
| Profit for the year | | — |
| — |
| — |
| — |
| 9,383 |
| 9,383 |
| 195 |
| 9,578 |
|
| Other comprehensive income | | — |
| — |
| (3,746 | ) | (216 | ) | 2,023 |
| (1,939 | ) | (41 | ) | (1,980 | ) |
| Total comprehensive income | | — |
| — |
| (3,746 | ) | (216 | ) | 11,406 |
| 7,444 |
| 154 |
| 7,598 |
|
Dividendsb | | — |
| — |
| — |
| — |
| (6,699 | ) | (6,699 | ) | (170 | ) | (6,869 | ) |
| Cash flow hedges transferred to the balance sheet, net of tax | | — |
| — |
| — |
| 26 |
| — |
| 26 |
| — |
| 26 |
|
| Repurchase of ordinary share capital | | — |
| — |
| — |
| — |
| (355 | ) | (355 | ) | — |
| (355 | ) |
| Share-based payments, net of tax | | 230 |
| 1,191 |
| — |
| — |
| (718 | ) | 703 |
| — |
| 703 |
|
| Share of equity-accounted entities’ changes in equity, net of tax | | — |
| — |
| — |
| — |
| 14 |
| 14 |
| — |
| 14 |
|
| Transactions involving non-controlling interests, net of tax | | — |
| — |
| — |
| — |
| — |
| — |
| 207 |
| 207 |
|
| At 31 December 2018 | | 46,352 |
| (15,767 | ) | (8,902 | ) | (987 | ) | 78,748 |
| 99,444 |
| 2,104 |
| 101,548 |
|
| | | | | | | | | | |
| At 1 January 2017 | | 46,122 |
| (18,443 | ) | (6,878 | ) | (1,153 | ) | 75,638 |
| 95,286 |
| 1,557 |
| 96,843 |
|
| Profit for the year | | — |
| — |
| — |
| — |
| 3,389 |
| 3,389 |
| 79 |
| 3,468 |
|
| Other comprehensive income | | — |
| — |
| 1,722 |
| 410 |
| 2,832 |
| 4,964 |
| 52 |
| 5,016 |
|
| Total comprehensive income | | — |
| — |
| 1,722 |
| 410 |
| 6,221 |
| 8,353 |
| 131 |
| 8,484 |
|
Dividendsb | | — |
| — |
| — |
| — |
| (6,153 | ) | (6,153 | ) | (141 | ) | (6,294 | ) |
| Repurchases of ordinary share capital | | — |
| — |
| — |
| — |
| (343 | ) | (343 | ) | — |
| (343 | ) |
| Share-based payments, net of tax | | — |
| 1,485 |
| — |
| — |
| (798 | ) | 687 |
| — |
| 687 |
|
| Share of equity-accounted entities’ changes in equity, net of tax | | — |
| — |
| — |
| — |
| 215 |
| 215 |
| — |
| 215 |
|
| Transactions involving non-controlling interests, net of tax | | — |
| — |
| — |
| — |
| 446 |
| 446 |
| 366 |
| 812 |
|
| At 31 December 2017 | | 46,122 |
| (16,958 | ) | (5,156 | ) | (743 | ) | 75,226 |
| 98,491 |
| 1,913 |
| 100,404 |
|
a See Note 32 for further information.
b See Note 10 for further information.
|
| | | |
| 154 | | BPbp Annual Report and Form 20-F 2019
2020 | | |
Group balance sheet
|
| | | | | | | |
| At 31 December | | | | $ million |
|
| | | Note |
| 2019 |
| 2018a |
|
| Non-current assets | | | | |
| Property, plant and equipment | | 12 |
| 132,642 |
| 135,261 |
|
| Goodwill | | 14 |
| 11,868 |
| 12,204 |
|
| Intangible assets | | 15 |
| 15,539 |
| 17,284 |
|
| Investments in joint ventures | | 16 |
| 9,991 |
| 8,647 |
|
| Investments in associates | | 17 |
| 20,334 |
| 17,673 |
|
| Other investments | | 18 |
| 1,276 |
| 1,341 |
|
| Fixed assets | | | 191,650 |
| 192,410 |
|
| Loans | | | 630 |
| 637 |
|
| Trade and other receivables | | 20 |
| 2,147 |
| 1,834 |
|
| Derivative financial instruments | | 30 |
| 6,314 |
| 5,145 |
|
| Prepayments | | | 781 |
| 1,179 |
|
| Deferred tax assets | | 9 |
| 4,560 |
| 3,706 |
|
| Defined benefit pension plan surpluses | | 24 |
| 7,053 |
| 5,955 |
|
| | | | 213,135 |
| 210,866 |
|
| Current assets | | | | |
| Loans | | | 339 |
| 326 |
|
| Inventories | | 19 |
| 20,880 |
| 17,988 |
|
| Trade and other receivables | | 20 |
| 24,442 |
| 24,478 |
|
| Derivative financial instruments | | 30 |
| 4,153 |
| 3,846 |
|
| Prepayments | | | 857 |
| 963 |
|
| Current tax receivable | | | 1,282 |
| 1,019 |
|
| Other investments | | 18 |
| 169 |
| 222 |
|
| Cash and cash equivalents | | 25 |
| 22,472 |
| 22,468 |
|
| | | | 74,594 |
| 71,310 |
|
| Assets classified as held for sale | | 2 |
| 7,465 |
| — |
|
| | | | 82,059 |
| 71,310 |
|
| Total assets | | | 295,194 |
| 282,176 |
|
| Current liabilities | | | | |
| Trade and other payables | | 22 |
| 46,829 |
| 46,265 |
|
| Derivative financial instruments | | 30 |
| 3,261 |
| 3,308 |
|
| Accruals | | | 5,066 |
| 4,626 |
|
| Lease liabilities | | 28 |
| 2,067 |
| 44 |
|
Finance debta | | 26 |
| 10,487 |
| 9,329 |
|
| Current tax payable | | | 2,039 |
| 2,101 |
|
| Provisions | | 23 |
| 2,453 |
| 2,564 |
|
| | | | 72,202 |
| 68,237 |
|
| Liabilities directly associated with assets classified as held for sale | | 2 |
| 1,393 |
| — |
|
| | | | 73,595 |
| 68,237 |
|
| Non-current liabilities | | | | |
| Other payables | | 22 |
| 12,626 |
| 13,830 |
|
| Derivative financial instruments | | 30 |
| 5,537 |
| 5,625 |
|
| Accruals | | | 996 |
| 575 |
|
| Lease liabilities | | 28 |
| 7,655 |
| 623 |
|
Finance debta | | 26 |
| 57,237 |
| 55,803 |
|
| Deferred tax liabilities | | 9 |
| 9,750 |
| 9,812 |
|
| Provisions | | 23 |
| 18,498 |
| 17,732 |
|
| Defined benefit pension plan and other post-retirement benefit plan deficits | | 24 |
| 8,592 |
| 8,391 |
|
| | | | 120,891 |
| 112,391 |
|
| Total liabilities | | | 194,486 |
| 180,628 |
|
| Net assets | | | 100,708 |
| 101,548 |
|
| Equity | | | | |
| BP shareholders’ equity | | 32 |
| 98,412 |
| 99,444 |
|
| Non-controlling interests | | 32 |
| 2,296 |
| 2,104 |
|
| Total equity | | 32 |
| 100,708 |
| 101,548 |
|
a Finance debt on the comparative balance sheet has been re-presented to align with the current period. See Note 1 for further information.Group income statement
| | | | | | | | | | | | | | | | | |
| For the year ended 31 December | | | | | $ million |
| | | Note | 2020 | 2019 | 2018 |
| Sales and other operating revenues | | 6 | | 180,366 | | 278,397 | | 298,756 | |
| Earnings from joint ventures – after interest and tax | | 16 | | (302) | | 576 | | 897 | |
| Earnings from associates – after interest and tax | | 17 | | (101) | | 2,681 | | 2,856 | |
| Interest and other income | | 7 | | 663 | | 769 | | 773 | |
| Gains on sale of businesses and fixed assets | | 4 | | 2,874 | | 193 | | 456 | |
| Total revenues and other income | | | 183,500 | | 282,616 | | 303,738 | |
| Purchases | | 19 | | 132,104 | | 209,672 | | 229,878 | |
| Production and manufacturing expenses | | | 22,494 | | 21,815 | | 23,005 | |
| Production and similar taxes | | 5 | | 695 | | 1,547 | | 1,536 | |
| Depreciation, depletion and amortization | | 5 | | 14,889 | | 17,780 | | 15,457 | |
| Impairment and losses on sale of businesses and fixed assets | | 4 | | 14,381 | | 8,075 | | 860 | |
| Exploration expense | | 8 | | 10,280 | | 964 | | 1,445 | |
| Distribution and administration expenses | | | 10,397 | | 11,057 | | 12,179 | |
| Profit (loss) before interest and taxation | | | (21,740) | | 11,706 | | 19,378 | |
| Finance costs | | 7 | | 3,115 | | 3,489 | | 2,528 | |
| Net finance expense relating to pensions and other post-retirement benefits | | 24 | | 33 | | 63 | | 127 | |
| Profit (loss) before taxation | | | (24,888) | | 8,154 | | 16,723 | |
| Taxation | | 9 | | (4,159) | | 3,964 | | 7,145 | |
| Profit (loss) for the year | | | (20,729) | | 4,190 | | 9,578 | |
| Attributable to | | | | | |
| bp shareholders | | | (20,305) | | 4,026 | | 9,383 | |
| Non-controlling interests | | | (424) | | 164 | | 195 | |
| | | (20,729) | | 4,190 | | 9,578 | |
| Earnings per share | | | | | |
| Profit (loss) for the year attributable to bp shareholders | | | | | |
| Per ordinary share (cents) | | | | | |
| Basic | | 11 | | (100.42) | | 19.84 | | 46.98 | |
| Diluted | | 11 | | (100.42) | | 19.73 | | 46.67 | |
| Per ADS (dollars) | | | | | |
| Basic | | 11 | | (6.03) | | 1.19 | | 2.82 | |
| Diluted | | 11 | | (6.03) | | 1.18 | | 2.80 | |
Helge Lund Chairman
B Looney Chief executive officer
18 March 2020
|
| | | | | | | | | | | | | |
| BP
| bp Annual Report and Form 20-F 20192020 | | 155 |
Group cash flow statement
|
| | | | | | | | | |
| For the year ended 31 December | | | | | $ million |
|
| | | Note |
| 2019 |
| 2018 |
| 2017 |
|
| Operating activities | | | | | |
| Profit before taxation | | | 8,154 |
| 16,723 |
| 7,180 |
|
| Adjustments to reconcile profit before taxation to net cash provided by operating activities | | | | | |
| Exploration expenditure written off | | 8 |
| 631 |
| 1,085 |
| 1,603 |
|
| Depreciation, depletion and amortization | | 5 |
| 17,780 |
| 15,457 |
| 15,584 |
|
| Impairment and (gain) loss on sale of businesses and fixed assets | | 4 |
| 7,882 |
| 404 |
| 6 |
|
| Earnings from joint ventures and associates | | | (3,257 | ) | (3,753 | ) | (2,507 | ) |
| Dividends received from joint ventures and associates | | | 1,962 |
| 1,535 |
| 1,253 |
|
| Interest receivable | | | (441 | ) | (468 | ) | (304 | ) |
| Interest received | | | 416 |
| 348 |
| 375 |
|
| Finance costs | | 7 |
| 3,489 |
| 2,528 |
| 2,074 |
|
| Interest paid | | | (2,870 | ) | (1,928 | ) | (1,572 | ) |
| Net finance expense relating to pensions and other post-retirement benefits | | 24 |
| 63 |
| 127 |
| 220 |
|
| Share-based payments | | | 730 |
| 690 |
| 661 |
|
| Net operating charge for pensions and other post-retirement benefits, less contributions and benefit payments for unfunded plans | | 24 |
| (238 | ) | (386 | ) | (394 | ) |
| Net charge for provisions, less payments | | | (176 | ) | 986 |
| 2,106 |
|
| (Increase) decrease in inventories | | | (3,406 | ) | 672 |
| (848 | ) |
| (Increase) decrease in other current and non-current assets | | | (2,335 | ) | (2,858 | ) | (4,848 | ) |
| Increase (decrease) in other current and non-current liabilities | | | 2,823 |
| (2,577 | ) | 2,344 |
|
| Income taxes paid | | | (5,437 | ) | (5,712 | ) | (4,002 | ) |
| Net cash provided by operating activities | | | 25,770 |
| 22,873 |
| 18,931 |
|
| Investing activities | | | | | |
| Expenditure on property, plant and equipment, intangible and other assets | | | (15,418 | ) | (16,707 | ) | (16,562 | ) |
| Acquisitions, net of cash acquired | | 3 |
| (3,562 | ) | (6,986 | ) | (327 | ) |
| Investment in joint ventures | | | (137 | ) | (382 | ) | (50 | ) |
| Investment in associates | | | (304 | ) | (1,013 | ) | (901 | ) |
| Total cash capital expenditure | | | (19,421 | ) | (25,088 | ) | (17,840 | ) |
| Proceeds from disposals of fixed assets | | 4 |
| 500 |
| 940 |
| 2,936 |
|
| Proceeds from disposals of businesses, net of cash disposed | | 4 |
| 1,701 |
| 1,911 |
| 478 |
|
| Proceeds from loan repayments | | | 246 |
| 666 |
| 349 |
|
| Net cash used in investing activities | | | (16,974 | ) | (21,571 | ) | (14,077 | ) |
Financing activitiesa | | | | | |
| Repurchase of shares | | | (1,511 | ) | (355 | ) | (343 | ) |
| Lease liability payments | | | (2,372 | ) | (35 | ) | (45 | ) |
| Proceeds from long-term financing | | | 8,597 |
| 9,038 |
| 8,712 |
|
| Repayments of long-term financing | | | (7,118 | ) | (7,175 | ) | (6,231 | ) |
| Net increase (decrease) in short-term debt | | | 180 |
| 1,317 |
| (158 | ) |
| Net increase (decrease) in non-controlling interests | | | 566 |
| — |
| 1,063 |
|
| Dividends paid | | | | | |
| BP shareholders | | 10 |
| (6,946 | ) | (6,699 | ) | (6,153 | ) |
| Non-controlling interests | | | (213 | ) | (170 | ) | (141 | ) |
| Net cash provided by (used in) financing activities | | | (8,817 | ) | (4,079 | ) | (3,296 | ) |
| Currency translation differences relating to cash and cash equivalents | | | 25 |
| (330 | ) | 544 |
|
| Increase (decrease) in cash and cash equivalents | | | 4 |
| (3,107 | ) | 2,102 |
|
| Cash and cash equivalents at beginning of year | | | 22,468 |
| 25,575 |
| 23,484 |
|
| Cash and cash equivalents at end of year | | | 22,472 |
| 22,468 |
| 25,586 |
|
| | | | | | | | | | | | | | | | | |
| For the year ended 31 December | | | | | $ million |
| | Note | 2020 | 2019 | 2018 |
| Profit (loss) for the year | | | (20,729) | | 4,190 | | 9,578 | |
| Other comprehensive income | | | | | |
| Items that may be reclassified subsequently to profit or loss | | | | | |
| Currency translation differences | | | (1,843) | | 1,538 | | (3,771) | |
| Exchange (gains) losses on translation of foreign operations reclassified to gain or loss on sale of businesses and fixed assets | | | (353) | | 880 | | 0 | |
| Cash flow hedges marked to market | | 30 | | 78 | | (100) | | (126) | |
| Cash flow hedges reclassified to the income statement | | 30 | | (37) | | 106 | | 120 | |
| | | | | |
| | | | | |
| Costs of hedging marked to market | | 30 | | 42 | | (4) | | (244) | |
| Costs of hedging reclassified to the income statement | | 30 | | 22 | | 57 | | 58 | |
| | | | | |
| Share of items relating to equity-accounted entities, net of tax | | 16, 17 | 312 | | 82 | | 417 | |
| Income tax relating to items that may be reclassified | | 9 | | 66 | | (70) | | 4 | |
| | | (1,713) | | 2,489 | | (3,542) | |
| Items that will not be reclassified to profit or loss | | | | | |
| Remeasurements of the net pension and other post-retirement benefit liability or asset | | 24 | | 170 | | 328 | | 2,317 | |
| Cash flow hedges that will subsequently be transferred to the balance sheet | | 30 | | 7 | | (3) | | (37) | |
| | | | | |
| Income tax relating to items that will not be reclassified | | 9 | | (105) | | (157) | | (718) | |
| | | 72 | | 168 | | 1,562 | |
| Other comprehensive income | | | (1,641) | | 2,657 | | (1,980) | |
| Total comprehensive income | | | (22,370) | | 6,847 | | 7,598 | |
| Attributable to | | | | | |
| bp shareholders | | | (21,983) | | 6,674 | | 7,444 | |
| Non-controlling interests | | | (387) | | 173 | | 154 | |
| | | (22,370) | | 6,847 | | 7,598 | |
a The presentation of financing cash flows for the comparative periods have been amended to align with the current period. See Note 132 for further information.
|
| | | | | | | | | | | | | |
| 156 | | BPbp Annual Report and Form 20-F 2019
2020 | | |
Group statement of changes in equitya
| | | | | | | | | | | | | | | | | | | | | | | | | | | | | | | | |
| | | | | | | | | | $ million |
| | Share capital and capital reserves | Treasury shares | Foreign currency translation reserve | Fair value reserves | Profit and loss account | bp shareholders' equity | Non-controlling interests | Total equity |
| Hybrid bonds | Other interest |
| At 1 January 2020 | | 46,525 | | (14,412) | | (6,495) | | (912) | | 73,706 | | 98,412 | | — | | 2,296 | | 100,708 | |
| Profit for the year | | — | | — | | — | | — | | (20,305) | | (20,305) | | 256 | | (680) | | (20,729) | |
| Other comprehensive income | | — | | — | | (2,224) | | 98 | | 448 | | (1,678) | | — | | 37 | | (1,641) | |
| Total comprehensive income | | — | | — | | (2,224) | | 98 | | (19,857) | | (21,983) | | 256 | | (643) | | (22,370) | |
Dividendsb | | — | | — | | — | | — | | (6,367) | | (6,367) | | — | | (238) | | (6,605) | |
| Cash flow hedges transferred to the balance sheet, net of tax | | — | | — | | — | | 6 | | — | | 6 | | — | | — | | 6 | |
| | | | | | | | | | |
| Repurchase of ordinary share capital | | — | | — | | — | | — | | (776) | | (776) | | — | | — | | (776) | |
| Share-based payments, net of tax | | 176 | | 1,188 | | — | | — | | (638) | | 726 | | — | | — | | 726 | |
| Share of equity-accounted entities’ changes in equity, net of tax | | — | | — | | — | | — | | 1,341 | | 1,341 | | — | | — | | 1,341 | |
| Issue of perpetual hybrid bonds | | — | | — | | — | | — | | (48) | | (48) | | 11,909 | | — | | 11,861 | |
| | | | | | | | | | |
| Payments on perpetual hybrid bonds | | — | | — | | — | | — | | — | | — | | (89) | | — | | (89) | |
| | | | | | | | | | |
| Tax on issue of perpetual hybrid bonds | | — | | — | | — | | — | | 3 | | 3 | | — | | — | | 3 | |
| Transactions involving non-controlling interests, net of tax | | — | | — | | — | | — | | (64) | | (64) | | — | | 827 | | 763 | |
| At 31 December 2020 | | 46,701 | | (13,224) | | (8,719) | | (808) | | 47,300 | | 71,250 | | 12,076 | | 2,242 | | 85,568 | |
| | | | | | | | | | |
| At 31 December 2018 | | 46,352 | | (15,767) | | (8,902) | | (987) | | 78,748 | | 99,444 | | — | | 2,104 | | 101,548 | |
| Adjustment on adoption of IFRS 16, net of tax | | — | | — | | — | | — | | (329) | | (329) | | — | | (1) | | (330) | |
| At 1 January 2019 | | 46,352 | | (15,767) | | (8,902) | | (987) | | 78,419 | | 99,115 | | — | | 2,103 | | 101,218 | |
| Profit for the year | | — | | — | | — | | — | | 4,026 | | 4,026 | | — | | 164 | | 4,190 | |
| Other comprehensive income | | — | | — | | 2,407 | | 52 | | 189 | | 2,648 | | — | | 9 | | 2,657 | |
| Total comprehensive income | | — | | — | | 2,407 | | 52 | | 4,215 | | 6,674 | | — | | 173 | | 6,847 | |
Dividendsb | | — | | — | | — | | — | | (6,929) | | (6,929) | | — | | (213) | | (7,142) | |
| Cash flow hedges transferred to the balance sheet, net of tax | | — | | — | | — | | 23 | | — | | 23 | | — | | — | | 23 | |
| Repurchase of ordinary share capital | | — | | — | | — | | — | | (1,511) | | (1,511) | | — | | — | | (1,511) | |
| Share-based payments, net of tax | | 173 | | 1,355 | | — | | — | | (809) | | 719 | | — | | — | | 719 | |
| Share of equity-accounted entities’ changes in equity, net of tax | | — | | — | | — | | — | | 5 | | 5 | | — | | — | | 5 | |
| Transactions involving non-controlling interests, net of tax | | — | | — | | — | | — | | 316 | | 316 | | — | | 233 | | 549 | |
| At 31 December 2019 | | 46,525 | | (14,412) | | (6,495) | | (912) | | 73,706 | | 98,412 | | — | | 2,296 | | 100,708 | |
| | | | | | | | | | |
| At 31 December 2017 | | 46,122 | | (16,958) | | (5,156) | | (743) | | 75,226 | | 98,491 | | — | | 1,913 | | 100,404 | |
| Adjustment on adoption of IFRS 9, net of tax | | — | | — | | — | | (54) | | (126) | | (180) | | — | | — | | (180) | |
| At 1 January 2018 | | 46,122 | | (16,958) | | (5,156) | | (797) | | 75,100 | | 98,311 | | — | | 1,913 | | 100,224 | |
| Profit for the year | | — | | — | | — | | — | | 9,383 | | 9,383 | | — | | 195 | | 9,578 | |
| Other comprehensive income | | — | | — | | (3,746) | | (216) | | 2,023 | | (1,939) | | — | | (41) | | (1,980) | |
| Total comprehensive income | | — | | — | | (3,746) | | (216) | | 11,406 | | 7,444 | | — | | 154 | | 7,598 | |
Dividendsb | | — | | — | | — | | — | | (6,699) | | (6,699) | | — | | (170) | | (6,869) | |
| Cash flow hedges transferred to the balance sheet, net of tax | | — | | — | | — | | 26 | | — | | 26 | | — | | — | | 26 | |
| Repurchase of ordinary share capital | | — | | — | | — | | — | | (355) | | (355) | | — | | — | | (355) | |
| Share-based payments, net of tax | | 230 | | 1,191 | | — | | — | | (718) | | 703 | | — | | — | | 703 | |
| Share of equity-accounted entities’ changes in equity, net of tax | | — | | — | | — | | — | | 14 | | 14 | | — | | — | | 14 | |
| Transactions involving non-controlling interests, net of tax | | — | | — | | — | | — | | 0 | | 0 | | — | | 207 | | 207 | |
| At 31 December 2018 | | 46,352 | | (15,767) | | (8,902) | | (987) | | 78,748 | | 99,444 | | — | | 2,104 | | 101,548 | |
a See Note 32 for further information.
b See Note 10 for further information.
| | | | | | | | | | | | | | |
| | bp Annual Report and Form 20-F 2020 | | 157 |
Group balance sheet
| | | | | | | | | | | | | | |
| At 31 December | | | | $ million |
| | Note | 2020 | 2019 |
| Non-current assets | | | | |
| Property, plant and equipment | | 12 | | 114,836 | | 132,642 | |
| Goodwill | | 14 | | 12,480 | | 11,868 | |
| Intangible assets | | 15 | | 6,093 | | 15,539 | |
| Investments in joint ventures | | 16 | | 8,362 | | 9,991 | |
| Investments in associates | | 17 | | 18,975 | | 20,334 | |
| Other investments | | 18 | | 2,746 | | 1,276 | |
| Fixed assets | | | 163,492 | | 191,650 | |
| Loans | | | 840 | | 630 | |
| Trade and other receivables | | 20 | | 4,351 | | 2,147 | |
| Derivative financial instruments | | 30 | | 9,755 | | 6,314 | |
| Prepayments | | | 533 | | 781 | |
| Deferred tax assets | | 9 | | 7,744 | | 4,560 | |
| Defined benefit pension plan surpluses | | 24 | | 7,957 | | 7,053 | |
| | | 194,672 | | 213,135 | |
| Current assets | | | | |
| Loans | | | 458 | | 339 | |
| Inventories | | 19 | | 16,873 | | 20,880 | |
| Trade and other receivables | | 20 | | 17,948 | | 24,442 | |
| Derivative financial instruments | | 30 | | 2,992 | | 4,153 | |
| Prepayments | | | 1,269 | | 857 | |
| Current tax receivable | | | 672 | | 1,282 | |
| Other investments | | 18 | | 333 | | 169 | |
| Cash and cash equivalents | | 25 | | 31,111 | | 22,472 | |
| | | 71,656 | | 74,594 | |
| Assets classified as held for sale | | 2 | | 1,326 | | 7,465 | |
| | | 72,982 | | 82,059 | |
| Total assets | | | 267,654 | | 295,194 | |
| Current liabilities | | | | |
| Trade and other payables | | 22 | | 36,014 | | 46,829 | |
| Derivative financial instruments | | 30 | | 2,998 | | 3,261 | |
| Accruals | | | 4,650 | | 5,066 | |
| Lease liabilities | | 28 | | 1,933 | | 2,067 | |
| Finance debt | | 26 | | 9,359 | | 10,487 | |
| Current tax payable | | | 1,038 | | 2,039 | |
| Provisions | | 23 | | 3,761 | | 2,453 | |
| | | 59,753 | | 72,202 | |
| Liabilities directly associated with assets classified as held for sale | | 2 | | 46 | | 1,393 | |
| | | 59,799 | | 73,595 | |
| Non-current liabilities | | | | |
| Other payables | | 22 | | 12,112 | | 12,626 | |
| Derivative financial instruments | | 30 | | 5,404 | | 5,537 | |
| Accruals | | | 852 | | 996 | |
| Lease liabilities | | 28 | | 7,329 | | 7,655 | |
| Finance debt | | 26 | | 63,305 | | 57,237 | |
| Deferred tax liabilities | | 9 | | 6,831 | | 9,750 | |
| Provisions | | 23 | | 17,200 | | 18,498 | |
| Defined benefit pension plan and other post-retirement benefit plan deficits | | 24 | | 9,254 | | 8,592 | |
| | | 122,287 | | 120,891 | |
| Total liabilities | | | 182,086 | | 194,486 | |
| Net assets | | | 85,568 | | 100,708 | |
| Equity | | | | |
| bp shareholders’ equity | | 32 | | 71,250 | | 98,412 | |
| Non-controlling interests | | 32 | | 14,318 | | 2,296 | |
| Total equity | | 32 | | 85,568 | | 100,708 | |
Helge Lund Chairman
Bernard Looney Chief executive officer
22 March 2021
| | | | | | | | | | | | | | |
| 158 | | bp Annual Report and Form 20-F 2020 | | |
Group cash flow statement
| | | | | | | | | | | | | | | | | |
| For the year ended 31 December | | | | | $ million |
| | Note | 2020 | 2019 | 2018 |
| Operating activities | | | | | |
| Profit (loss) before taxation | | | (24,888) | | 8,154 | | 16,723 | |
| Adjustments to reconcile profit before taxation to net cash provided by operating activities | | | | | |
| Exploration expenditure written off | | 8 | | 9,920 | | 631 | | 1,085 | |
| Depreciation, depletion and amortization | | 5 | | 14,889 | | 17,780 | | 15,457 | |
| Impairment and (gain) loss on sale of businesses and fixed assets | | 4 | | 11,507 | | 7,882 | | 404 | |
| Earnings from joint ventures and associates | | | 403 | | (3,257) | | (3,753) | |
| Dividends received from joint ventures and associates | | | 1,442 | | 1,962 | | 1,535 | |
| Interest receivable | | | (258) | | (441) | | (468) | |
| Interest received | | | 74 | | 416 | | 348 | |
| Finance costs | | 7 | | 3,115 | | 3,489 | | 2,528 | |
| Interest paid | | | (2,728) | | (2,870) | | (1,928) | |
| Net finance expense relating to pensions and other post-retirement benefits | | 24 | | 33 | | 63 | | 127 | |
| Share-based payments | | | 723 | | 730 | | 690 | |
| Net operating charge for pensions and other post-retirement benefits, less contributions and benefit payments for unfunded plans | | 24 | | (282) | | (238) | | (386) | |
| Net charge for provisions, less payments | | | 735 | | (176) | | 986 | |
| | | | | |
| (Increase) decrease in inventories | | | 3,963 | | (3,406) | | 672 | |
| (Increase) decrease in other current and non-current assets | | | 4,230 | | (2,335) | | (2,858) | |
| Increase (decrease) in other current and non-current liabilities | | | (8,278) | | 2,823 | | (2,577) | |
| Income taxes paid | | | (2,438) | | (5,437) | | (5,712) | |
| Net cash provided by operating activities | | | 12,162 | | 25,770 | | 22,873 | |
| Investing activities | | | | | |
| Expenditure on property, plant and equipment, intangible and other assets | | | (12,306) | | (15,418) | | (16,707) | |
| Acquisitions, net of cash acquired | | 3 | | (44) | | (3,562) | | (6,986) | |
| Investment in joint ventures | | | (567) | | (137) | | (382) | |
| Investment in associates | | | (1,138) | | (304) | | (1,013) | |
| Total cash capital expenditure | | | (14,055) | | (19,421) | | (25,088) | |
| Proceeds from disposals of fixed assets | | 4 | | 491 | | 500 | | 940 | |
| Proceeds from disposals of businesses, net of cash disposed | | 4 | | 4,989 | | 1,701 | | 1,911 | |
| Proceeds from loan repayments | | | 717 | | 246 | | 666 | |
| Net cash used in investing activities | | | (7,858) | | (16,974) | | (21,571) | |
| Financing activities | | | | | |
| Repurchase of shares | | | (776) | | (1,511) | | (355) | |
| Lease liability payments | | | (2,442) | | (2,372) | | (35) | |
| Proceeds from long-term financing | | | 14,736 | | 8,597 | | 9,038 | |
| Repayments of long-term financing | | | (12,179) | | (7,118) | | (7,175) | |
| Net increase (decrease) in short-term debt | | | (1,234) | | 180 | | 1,317 | |
| Issue of perpetual hybrid bonds | | | 11,861 | | 0 | | 0 | |
| | | | | |
| Payments on perpetual hybrid bonds | | | (89) | | 0 | | 0 | |
| Payments relating to transactions involving non-controlling interests (other) | | | (8) | | 0 | | 0 | |
| Receipts relating to transactions involving non-controlling interests (other) | | | 665 | | 566 | | 0 | |
| Dividends paid | | | | | |
| bp shareholders | | 10 | | (6,340) | | (6,946) | | (6,699) | |
| Non-controlling interests | | | (238) | | (213) | | (170) | |
| Net cash provided by (used in) financing activities | | | 3,956 | | (8,817) | | (4,079) | |
| Currency translation differences relating to cash and cash equivalents | | | 379 | | 25 | | (330) | |
| Increase (decrease) in cash and cash equivalents | | | 8,639 | | 4 | | (3,107) | |
| Cash and cash equivalents at beginning of year | | | 22,472 | | 22,468 | | 25,575 | |
| Cash and cash equivalents at end of year | | | 31,111 | | 22,472 | | 22,468 | |
| | | | | | | | | | | | | | |
| | bp Annual Report and Form 20-F 2020 | | 159 |
Notes on financial statements
1.Significant accounting policies, judgements, estimates and assumptions
Authorization of financial statements and statement of compliance with International Financial Reporting Standards
The consolidated financial statements of BP p.l.c and its subsidiaries (collectively referred to as BPbp or the group) for the year ended 31 December 20192020 were approved and signed by the chief executive officer and chairman on 1822 March 20202021 having been duly authorized to do so by the board of directors. BP p.l.c. is a public limited company incorporated and domiciled in England and Wales. The consolidated financial statements have been prepared in accordance with International Financial Reporting Standards (IFRS) as issued by the International Accounting Standards Board (IASB), IFRS adopted pursuant to Regulation (EC) No 1606/2002 as adopted byit applies in the European Union (EU) and in accordance with the provisions of the UK Companies Act 2006 as applicable to companies reporting under IFRS.international accounting standards. IFRS as adopted by the EU differs in certain respects from IFRS as issued by the IASB. The differences have no impact on the group’s consolidated financial statements for the years presented. As a result of the UK's withdrawal from the EU, with effect for periods starting subsequent to the year ended 31 December 2020, the consolidated financial statements will also be prepared in accordance with UK-adopted international accounting standards. There were no differences between IFRS as adopted by the EU and UK-adopted international accounting standards as at 1 January 2021. The UK’s withdrawal from the EU has not had and is not expected to have a significant impact on the consolidated financial statements. The significant accounting policies and accounting judgements, estimates and assumptions of the group are set out below.
Basis of preparation
The consolidated financial statements have been prepared on a going concern basis and in accordance with IFRS and IFRS Interpretations Committee (IFRIC) interpretations issued and effective for the year ended 31 December 2019.2020. The accounting policies that follow have been consistently applied to all years presented, except where otherwise indicated.
The consolidated financial statements are presented in US dollars and all values are rounded to the nearest million dollars ($ million), except where otherwise indicated.
Significant accounting policies: use of judgements, estimates and assumptions
Inherent in the application of many of the accounting policies used in preparing the consolidated financial statements is the need for BPbp management to make judgements, estimates and assumptions that affect the reported amounts of assets and liabilities, the disclosure of contingent assets and liabilities, and the reported amounts of revenues and expenses. Actual outcomes could differ from the estimates and assumptions used. The accounting judgements and estimates that have a significant impact on the results of the group are set out in boxed text below, and should be read in conjunction with the information provided in the Notes on financial statements. The areas requiring the most significant judgement and estimation in the preparation of the consolidated financial statements are: accounting for the investment in Rosneft; exploration and appraisal intangible assets; the recoverability of asset carrying values, including the estimation of reserves; supplier financing arrangements; derivative financial instruments; provisions and contingencies; and pensions and other post-retirement benefits. Judgements and estimates, not all of which are significant, made in assessing the impact of the COVID-19 pandemic, and climate change and the transition to a lower carbon economy on the consolidated financial statements are also set out in boxed text below. Where an estimate has a significant risk of resulting in a material adjustment to the carrying amounts of assets and liabilities within the next financial year this is specifically noted within the boxed text. The group does not consider income taxes to represent a significant estimate or judgement for 2019, see Income taxes
| | |
Judgements and estimates made in assessing the impact of climate change and the transition to a lower carbon economy Climate change and the transition to a lower carbon economy were considered in preparing the consolidated financial statements. These may have significant impacts on the currently reported amounts of the group’s assets and liabilities discussed below and on similar assets and liabilities that may be recognized in the future. Impairment of property, plant and equipment, and goodwill The energy transition is likely to impact the future prices of commodities such as oil and natural gas which in turn may affect the recoverable amount of property, plant and equipment, and goodwill in the oil and gas industry. Management’s best estimate of oil and natural gas price assumptions for value-in-use impairment testing were revised downwards during 2020 and the period covered extended to 2050. The revised assumptions sit within the range of external forecasts considered by management and are broadly in line with a range of transition paths consistent with the goals of the Paris climate change agreement. See significant judgements and estimates: recoverability of asset carrying values for further information including sensitivity analysis in relation to reasonably possible changes in the price assumptions. Impairments were recognized during 2020 on certain Upstream oil and gas properties as a result of the lower price assumptions. See note 4 for further information. No material impairments were recognized on Downstream assets. Though the energy transition may impact demand for certain refined products in the future, management anticipates sufficiently robust demand for the remainder of each refinery’s useful life. Headroom on goodwill balances was reduced, however the recoverable amount exceeds the carrying amount. See note 14 for further information including sensitivity analysis on the assumptions used to test goodwill for impairment. Management will continue to review price assumptions as the energy transition progresses and this may result in impairment charges or reversals in the future. Exploration and appraisal intangible assets The energy transition may affect the future development or viability of exploration prospects. The lower price assumptions and work to develop bp’s new strategy resulted in a review of the recoverability of exploration and appraisal intangible assets during 2020. Certain intangible assets were subsequently written-off. See significant judgement: exploration and appraisal intangible assets and note 8 for further information. The revised long-term price assumptions for investment appraisal (see page 28) help create a framework that seeks to help ensure that currently unsanctioned future capital expenditure on property plant and equipment, and exploration and appraisal intangibles, is aligned with bp’s new strategy. Property, plant and equipment – depreciation and expected useful lives The energy transition may curtail the expected useful lives of oil and gas industry assets thereby accelerating depreciation charges. However, the significant majority of bp’s existing Upstream oil and natural gas properties are likely to be fully depreciated within the next 10 years and, as outlined in bp's new strategy, oil and natural gas production will remain an important part of bp’s business activities over that period. Similarly, for Downstream refineries, demand for refined products is expected to remain strong over the remaining useful life of existing assets. |
| | | | | | | | | | | | | | |
| 160 | | bp Annual Report and Form 20-F 2020 | | |
1.Significant accounting policies, judgements, estimates and assumptions– continued
| | |
Therefore, management does not expect the useful lives of bp’s reported property, plant and equipment to change and do not consider this to be a significant accounting judgement or estimate. Significant capital expenditure is still required for ongoing projects and therefore the useful lives of future capital expenditure may, however, be different. See significant accounting policy: property, plant and equipment for more information. Provisions: decommissioning The energy transition may bring forward the decommissioning of oil and gas industry assets thereby increasing the present value of associated decommissioning provisions. The majority of bp’s Upstream oil and gas properties are expected to start decommissioning within the next two decades and management does not expect any reasonable change in the expected timeframe to have a material effect on the Upstream decommissioning provisions, assuming cash flows remain unchanged. Decommissioning cost estimates are based on the known regulatory and external environment. These cost estimates may change in the future, including as a result of the transition to a lower carbon economy. For Downstream refineries, decommissioning provisions are generally not recognized as the associated obligations have indeterminate settlement dates, typically driven by the cessation of manufacturing. Management will continue to review facts and circumstances to assess if decommissioning provisions need to be recognized. See significant judgements and estimates: provisions for further information. |
| | |
Judgements and estimates made in assessing the impact of the COVID-19 pandemic and the economic environment In preparing the consolidated financial statements, the following areas involving judgement and estimates were identified as most relevant with regards to the impact of the COVID-19 pandemic and current economic environment. Going concern Forecast liquidity has been assessed under a number of stressed scenarios, including a significant decline in oil prices over the 12-month period. Reverse stress tests performed indicated that the group will continue to operate as a going concern for at least 12 months from the date of approval of the consolidated financial statements even if the Brent price fell to zero. No material uncertainties over going concern or significant judgements or estimates in the assessment were identified. See also Note 29 Financial instruments and financial risk factors – Liquidity risk for further information. Discount rate assumptions The discount rates used for impairment testing and provisions were reassessed during the year in light of changing economic and geopolitical outlooks. The impact was determined not to be significant and the post-tax impairment discount rate and nominal provisions discount rate were unchanged from 2019. Pre-tax impairment discount rates and post-tax premiums for certain higher-risk countries were changed but this did not have a material impact. See significant judgements and estimates: recoverability of asset carrying values and provisions for further information. Oil and natural gas price assumptions The price assumptions used in value-in-use impairment testing were revised downwards during the year, in part due to lower demand for oil and natural gas. Material impairment charges and exploration write-offs were recognized in the Upstream segment as a consequence of these price assumption changes. See significant judgements and estimates: recoverability of asset carrying values and exploration and appraisal intangible assets for further information. Demand constraints for refined products during the year did not result in any material impairment charges on Downstream refinery assets. Pensions and other post-retirement benefits The volatility in the financial markets during 2020 impacted the assumptions used for determining the fair value of plan assets and the present value of defined benefit obligations in the group’s defined benefit pension plans. See significant estimate: pensions and other post-retirement benefits and note 24 for further information. Impairment of financial assets measured at amortized cost The current economic environment and future credit risk outlook were considered in updating the estimate of expected credit loss allowances on financial assets measured at amortized cost. Whilst credit risk increased relative to 31 December 2019, there was also a significant reduction in the group's trade and other receivables balance. Therefore, the total expected credit loss allowances recognized as at 31 December 2020 did not significantly increase. Management does not consider the calculation of expected credit loss allowances to be a significant accounting estimate. See note 21 and 29 for further information. Income taxes The carrying amounts of the group’s deferred tax assets were reviewed and updated to the extent that there are changes in the probability of sufficient taxable profits being available to utilize the reported deferred tax assets. Management does not consider the measurement of deferred tax assets to be a significant accounting estimate. See significant accounting policy: income taxes and Note 9 for further information. |
Basis of consolidation
The consolidated group financial statements consolidate the financial statements of BP p.l.c. and its subsidiaries drawn up to 31 December each year. Subsidiaries are consolidated from the date of their acquisition, being the date on which the group obtains control, including when control is obtained via potential voting rights, and continue to be consolidated until the date that control ceases. The financial statements of subsidiaries are prepared for the same reporting year as the parent company, using consistent accounting policies. Intra-group balances and transactions, including unrealized profits arising from intra-group transactions, have been eliminated. Unrealized losses are eliminated unless the transaction provides evidence of an impairment of the asset transferred. Non-controlling interests represent the equity in subsidiaries that is not attributable, directly or indirectly, to BPbp shareholders. Included within non-controlling interests are perpetual subordinated hybrid bonds issued by a subsidiary and for which the group has the unconditional right to avoid transferring cash or another financial asset to the bondholders. Profit or loss attributable to bp shareholders is adjusted to reflect the coupon related to these hybrid bonds whether or not such distribution has been deferred.
Interests in other entities
Business combinations and goodwill
Business combinations are accounted for using the acquisition method. The identifiable assets acquired and liabilities assumed are recognized at their fair values at the acquisition date.
Goodwill is initially measured as the excess of the aggregate of the consideration transferred, the amount recognized for any non-controlling interest and the acquisition-date fair values of any previously held interest in the acquiree over the fair value of the identifiable assets acquired and liabilities assumed at the acquisition date. The amount recognized for any non-controlling interest is measured at the present ownership's proportionate share in
| | | | | | | | | | | | | | |
| | bp Annual Report and Form 20-F 2020 | | 161 |
1.Significant accounting policies, judgements, estimates and assumptions– continued
the recognized amounts of the acquiree’s identifiable net assets. At the acquisition date, any goodwill acquired is allocated to each of the cash-generating units, or groups of cash-generating units, expected to benefit from the combination’s synergies. Following initial recognition, goodwill is measured at cost less any accumulated impairment losses. Goodwill arising on business combinations prior to 1 January 2003 is stated at the previous carrying amount under UK generally accepted accounting practice, less subsequent impairments. See Note 14 for further information.
Goodwill may arise upon investments in joint ventures and associates, being the surplus of the cost of investment over the group’s share of the net fair value of the identifiable assets and liabilities. Any such goodwill is recorded within the corresponding investment in joint ventures and associates.
Goodwill may also arise upon acquisition of interests in joint operations that meet the definition of a business. The amount of goodwill separately recognized is the excess of the consideration transferred over the group's share of the net fair value of the identifiable assets and liabilities.
Interests in joint arrangements
The results, assets and liabilities of joint ventures are incorporated in these consolidated financial statements using the equity method of accounting as described below.
Certain of the group’s activities, particularly in the Upstream segment, are conducted through joint operations. BPbp recognizes, on a line-by-line basis in the consolidated financial statements, its share of the assets, liabilities and expenses of these joint operations incurred jointly with the other partners, along with the group’s income from the sale of its share of the output and any liabilities and expenses that the group has incurred in relation to the joint operation.
|
| | | |
| BP Annual Report and Form 20-F 2019
| | 157 |
1.Significant accounting policies, judgements, estimates and assumptions– continued
Interests in associates
The results, assets and liabilities of associates are incorporated in these consolidated financial statements using the equity method of accounting as described below.
|
| |
Significant judgement: investment in Rosneft Judgement is required in assessing the level of control or influence over another entity in which the group holds an interest. For BP,bp, the judgement that the group has significant influence over Rosneft Oil Company (Rosneft), a Russian oil and gas company is significant. As a consequence of this judgement, BPbp uses the equity method of accounting for its investment and BP'sbp's share of Rosneft's oil and natural gas reserves is included in the group's estimated net proved reserves of equity-accounted entities. If significant influence was not present, the investment would be accounted for as an investment in an equity instrument measured at fair value as described under 'Financial assets' below and no share of Rosneft's oil and natural gas reserves would be reported. Significant influence is defined in IFRS as the power to participate in the financial and operating policy decisions of the investee but is not control or joint control of those policies. Significant influence is presumed when an entity owns 20% or more of the voting power of the investee. Significant influence is presumed not to be present when an entity owns less than 20% of the voting power of the investee. BPbp owns 19.75% of the voting shares of Rosneft. TheRosneft’s largest shareholder is Rosneftegaz JSC (Rosneftegaz), which is wholly owned by the Russian federal government, through its investment company JSCgovernment. At 31 December 2020, Rosneftegaz ownedheld 40.4% (2019 50% plus one share1 share) of the voting shares of Rosneft at 31 December 2019.. IFRS identifies several indicators that may provide evidence of significant influence, including representation on the board of directors of the investee and participation in policy-making processes. BP’sbp’s group chief executive, Bernard Looney, was approved as at 31 December 2019, Bob Dudley, has been a member of the board of directors of Rosneft since 2013 and remainsin June 2020 as one of BP'sbp’s two nominated directors following his resignation as BP's group chief executive.directors. bp’s other nominated director, Bob Dudley, has been a member of the Rosneft board since 2013. He is also chairman of the Rosneft board’s Strategic Planningand Sustainable Development Committee. A second BP-nominated director, Guillermo Quintero, has been a member of the Rosneft board and its HR and Remuneration Committee since 2015. BPbp also holds the voting rights at general meetings of shareholders conferred by its 19.75% stake in Rosneft. BP'sTransactions by Rosneft in its own shares during the year have increased bp’s economic interest in Rosneft to 22.03% (2019 19.75%). bp's management consider,considers, therefore, that the group has significant influence over Rosneft, as defined by IFRS.
|
The equity method of accounting
Under the equity method, an investment is carried on the balance sheet at cost plus post-acquisition changes in the group’s share of net assets of the entity, less distributions received and less any impairment in value of the investment. Loans advanced to equity-accounted entities that have the characteristics of equity financing are also included in the investment on the group balance sheet. The group income statement reflects the group’s share of the results after tax of the equity-accounted entity, adjusted to account for depreciation, amortization and any impairment of the equity-accounted entity’s assets based on their fair values at the date of acquisition. The group statement of comprehensive income includes the group’s share of the equity-accounted entity’s other comprehensive income. The group’s share of amounts recognized directly in equity by an equity-accounted entity is recognized in the group’s statement of changes in equity.
Financial statements of equity-accounted entities are prepared for the same reporting year as the group. Where material differences arise in the accounting policies used by the equity-accounted entity and those used by BP,bp, adjustments are made to those financial statements to bring the accounting policies used into line with those of the group.
Unrealized gains on transactions, apart from those that meet the definition of a derivative, between the group and its equity-accounted entities are eliminated to the extent of the group’s interest in the equity-accounted entity.
The group assesses investments in equity-accounted entities for impairment whenever there is objective evidence that the investment is impaired. If any such objective evidence of impairment exists, the carrying amount of the investment is compared with its recoverable amount, being the higher of its fair value less costs of disposal and value in use. If the carrying amount exceeds the recoverable amount, the investment is written down to its recoverable amount.
Segmental reporting
The group’s operating segments are established on the basis of those components of the group that are evaluated regularly by the group chief executive, BP’sbp’s chief operating decision maker, in deciding how to allocate resources and in assessing performance.
The accounting policies of the operating segments are the same as the group’s accounting policies described in this note, except that IFRS requires that the measure of profit or loss disclosed for each operating segment is the measure that is provided regularly to the chief operating decision maker. For BP,bp, this measure of profit or loss is replacement cost profit before interest and tax which reflects the replacement cost of inventories sold in the period and is arrived at by excluding inventory holding gains and losses from profit.profit before interest and tax. Replacement cost profit for the group is not a recognized measure under IFRS. For further information see Note 5.
For information on changes to bp's segmental reporting see ‘Change in segmentation from 1 January 2021’ below.
| | | | | | | | | | | | | | |
| 162 | | bp Annual Report and Form 20-F 2020 | | |
1.Significant accounting policies, judgements, estimates and assumptions– continued
Foreign currency translation
In individual subsidiaries, joint ventures and associates, transactions in foreign currencies are initially recorded in the functional currency of those entities at the spot exchange rate on the date of the transaction. Monetary assets and liabilities denominated in foreign currencies are retranslated into the functional currency at the spot exchange rate on the balance sheet date. Any resulting exchange differences are included in the income statement, unless hedge accounting is applied. Non-monetary assets and liabilities,items, other than those measured at fair value, are not retranslated subsequent to initial recognition.
In the consolidated financial statements, the assets and liabilities of non-US dollar functional currency subsidiaries, joint ventures, associates, and related goodwill, are translated into US dollars at the spot exchange rate on the balance sheet date. The results and cash flows of non-US dollar functional currency subsidiaries, joint ventures and associates are translated into US dollars using average rates of exchange. In the consolidated financial statements, exchange adjustments arising when the opening net assets and the profits for the year retained by non-US dollar functional currency subsidiaries, joint ventures and associates are translated into US dollars are recognized in a separate component of equity and reported in other comprehensive income. Exchange gains and losses arising on long-term intra-group foreign currency borrowings used to finance the group’s non-US dollar investments are also reported in other comprehensive income if the borrowings form part of the net investment in the subsidiary, joint venture or associate. On disposal or for certain partial disposals of a non-US dollar functional currency subsidiary, joint venture or associate, the related accumulated exchange gains and losses recognized in equity are reclassified from equity to the income statement.
|
| | | |
158 | | BP Annual Report and Form 20-F 2019
| |
1.Significant accounting policies, judgements, estimates and assumptions– continued
Non-current assets held for sale
Non-current assets and disposal groups classified as held for sale are measured at the lower of carrying amount and fair value less costs to sell.
Significant non-current assets and disposal groups are classified as held for sale if their carrying amounts will be recovered through a sale transaction rather than through continuing use. This condition is regarded as met only when the sale is highly probable and the asset or disposal group is available for immediate sale in its present condition subject only to terms that are usual and customary for sales of such assets. Management must be committed to the sale, which should be expected to qualify for recognition as a completed sale within one year from the date of classification as held for sale, and actions required to complete the plan of sale should indicate that it is unlikely that significant changes to the plan will be made or that the plan will be withdrawn.
Property, plant and equipment and intangible assets are not depreciated or amortized once classified as held for sale.
Intangible assets
Intangible assets, other than goodwill, include expenditure on the exploration for and evaluation of oil and natural gas resources, computer software, patents, licences and trademarks and are stated at the amount initially recognized, less accumulated amortization and accumulated impairment losses.
Intangible assets are carried initially at cost unless acquired as part of a business combination. Any such asset is measured at fair value at the date of the business combination and is recognized separately from goodwill if the asset is separable or arises from contractual or other legal rights.
Intangible assets with a finite life, other than capitalized exploration and appraisal costs as described below, are amortized on a straight-line basis over their expected useful lives. For patents, licences and trademarks, expected useful life is the shorter of the duration of the legal agreement and economic useful life, and can range from three to fifteen years. Computer software costs generally have a useful life of three to five years.
The expected useful lives of assets and the amortization method are reviewed on an annual basis and, if necessary, changes in useful lives or the amortization method are accounted for prospectively.
Oil and natural gas exploration, appraisal and development expenditure
Oil and natural gas exploration, appraisal and development expenditure is accounted for using the principles of the successful efforts method of accounting as described below.
Licence and property acquisition costs
Exploration licence and leasehold property acquisition costs are capitalized within intangible assets and are reviewed at each reporting date to confirm that there is no indication that the carrying amount exceeds the recoverable amount. This review includes confirming that exploration drilling is still under way or planned or that it has been determined, or work is under way to determine, that the discovery is economically viable based on a range of technical and commercial considerations, and sufficient progress is being made on establishing development plans and timing. If no future activity is planned, the remaining balance of the licence and property acquisition costs is written off. Lower value licences are pooled and amortized on a straight-line basis over the estimated period of exploration. Upon internal approval for development and recognition of proved or sanctioned probable reserves of oil and natural gas, the relevant expenditure is transferred to property, plant and equipment.
Exploration and appraisal expenditure
Geological and geophysical exploration costs are recognized as an expense as incurred. Costs directly associated with an exploration well are initially capitalized as an intangible asset until the drilling of the well is complete and the results have been evaluated. These costs include employee remuneration, materials and fuel used, rig costs and payments made to contractors. If potentially commercial quantities of hydrocarbons are not found, the exploration well costs are written off. If hydrocarbons are found and, subject to further appraisal activity, are likely to be capable of commercial development, the costs continue to be carried as an asset. If it is determined that development will not occur, that is, the efforts are not successful, then the costs are expensed.
Costs directly associated with appraisal activity undertaken to determine the size, characteristics and commercial potential of a reservoir following the initial discovery of hydrocarbons, including the costs of appraisal wells where hydrocarbons were not found, are initially capitalized as an intangible asset. Upon internal approval for development and recognition of proved or sanctioned probable reserves, the relevant expenditure is transferred to property, plant and equipment. If development is not approved and no further activity is expected to occur, then the costs are expensed.
The determination of whether potentially economic oil and natural gas reserves have been discovered by an exploration well is usually made within one year of well completion, but can take longer, depending on the complexity of the geological structure. Exploration wells that discover potentially economic quantities of oil and natural gas and are in areas where major capital expenditure (e.g. an offshore platform or a pipeline) would be required before production could begin, and where the economic viability of that major capital expenditure depends on the successful completion of further exploration or appraisal work in the area, remain capitalized on the balance sheet as long as such work is under way or firmly planned.
| | | | | | | | | | | | | | |
| | bp Annual Report and Form 20-F 2020 | | 163 |
1.Significant accounting policies, judgements, estimates and assumptions– continued
Development expenditure
Expenditure on the construction, installation and completion of infrastructure facilities such as platforms, pipelines and the drilling of development wells, including service and unsuccessful development or delineation wells, is capitalized within property, plant and equipment and is depreciated from the commencement of production as described below in the accounting policy for property, plant and equipment.
|
| | | |
| BP Annual Report and Form 20-F 2019
| | 159 |
1.Significant accounting policies, judgements, estimates and assumptions– continued
|
|
Significant judgement: exploration and appraisal intangible assets Judgement is required to determine whether it is appropriate to continue to carry costs associated with exploration wells and exploratory-type stratigraphic test wells on the balance sheet. This includes costs relating to exploration licences or leasehold property acquisitions. It is not unusual to have such costs remaining suspended on the balance sheet for several years while additional appraisal drilling and seismic work on the potential oil and natural gas field is performed or while the optimum development plans and timing are established.The costs are carried based on the current regulatory and political environment or any known changes to that environment. All such carried costs are subject to regular technical, commercial and management review on at least an annual basis to confirm the continued intent to develop, or otherwise extract value from, the discovery. Where this is no longer the case, the costs are immediately expensed. In scenarios whereAs a result of the expected time horizon for establishingrevised price assumptions detailed in Significant judgements and estimates: recoverability of asset carrying values below and a review of bp’s long-term strategic plan, management reviewed bp’s exploration prospects and the development plan is lengthy or uncertain, greater judgement is required. BP iscarrying value of the associated intangible assets. The outcome of the review resulted in revised judgements over management's expectations to extract value from certain prospects, thereby leading to material write-offs of the associated exploration and appraisal phaseintangible assets in certain Canadian oil sands assets that require further advancement of low-carbon extraction technology in order to achieve optimum development. Sufficient technological progress is expected to be achieved and therefore BP continues to carry the capitalized costs on its balance sheet.2020.
The judgement disclosed in prior years in relation to expiring leases in the Gulf of Mexico is no longer considered to be significant following recent agreement of lease extensions with the US Bureau of Safety and Environmental Enforcement.
The carrying amount of capitalized costs isand further information on the write-offs are included in Note 8. |
Property, plant and equipment
Property, plant and equipment owned by the group is stated at cost, less accumulated depreciation and accumulated impairment losses. The initial cost of an asset comprises its purchase price or construction cost, any costs directly attributable to bringing the asset into the location and condition necessary for it to be capable of operating in the manner intended by management, the initial estimate of any decommissioning obligation, if any,applicable, and, for assets that necessarily take a substantial period of time to get ready for their intended use, directly attributable general or specific finance costs. The purchase price or construction cost is the aggregate amount paid and the fair value of any other consideration given to acquire the asset.
Expenditure on major maintenance refits or repairs comprises the cost of replacement assets or parts of assets, inspection costs and overhaul costs. Where an asset or part of an asset that was separately depreciated is replaced and it is probable that future economic benefits associated with the item will flow to the group, the expenditure is capitalized and the carrying amount of the replaced asset is derecognized. Inspection costs associated with major maintenance programmes are capitalized and amortized over the period to the next inspection. Overhaul costs for major maintenance programmes, and all other maintenance costs are expensed as incurred.
Oil and natural gas properties, including certain related pipelines, are depreciated using a unit-of-production method. The cost of producing wells is amortized over proved developed reserves. Licence acquisition, common facilities and future decommissioning costs are amortized over total proved reserves. The unit-of-production rate for the depreciation of common facilities takes into account expenditures incurred to date, together with estimated future capital expenditure expected to be incurred relating to as yet undeveloped reserves expected to be processed through these common facilities. Information on the carrying amounts of the group’s oil and natural gas properties, together with the amounts recognized in the income statement as depreciation, depletion and amortization is contained in Note 12 and Note 5 respectively.
Estimates of oil and natural gas reserves determined by applyingin accordance with US Securities and Exchange Commission (SEC) regulations, including the determinationapplication of prices using 12-month historical price data in assessing the commerciality of technical volumes, are typically used to calculate depreciation, depletion and amortization charges for the group’s oil and gas properties. Therefore, thewhere this approach is adopted, charges are not dependent on management forecasts of future oil and gas prices.
However, for certain oil and natural gas assets, the use of reserves determined in accordance with SEC regulations would result in a charge that is not reflective of the pattern in which the future economic benefits are expected to be consumed. In these limited instances other approaches are applied to determine the reserves base used to calculate depreciation, depletion and amortization, including the use of management’s best estimate of price assumptions as disclosed in Significant judgements and estimates: recoverability of asset carrying values, to determine the commerciality of technical proved reserves.
The impact of changes in estimated proved reserves is dealt with prospectively by amortizing the remaining carrying value of the asset over the expected future production. Management does not believe that a reasonably possible change in the economic environment would result in a material change to the depreciation and amortization charge for other classes of assets.
The estimation of oil and natural gas reserves and BP’sbp’s process to manage reserves bookings is described in Supplementary information on oil and natural gas on page 232,231, which is unaudited. Details on BP’sbp’s proved reserves and production compliance and governance processes are provided on page 286.312. The 20192020 movements in proved reserves are reflected in the tables showing movements in oil and natural gas reserves by region in Supplementary information on oil and natural gas (unaudited) on page 232.231.
Other property, plant and equipment is depreciated on a straight-line basis over its expected useful life. The typical useful lives of the group’s other property, plant and equipment are as follows:
|
| | | | |
| Land improvements | 15 to 25 years |
| Buildings | 20 to 50 years |
| Refineries | 20 to 30 years |
| Petrochemicals plants | 20 to 30 years |
| Pipelines | 10 to 50 years |
| Service stations | 15 years |
| Office equipment | 3 to 710 years |
| Fixtures and fittings | 5 to 15 years |
The expected useful lives and depreciation method of property, plant and equipment are reviewed on an annual basis and, if necessary, changes in useful lives or the depreciation method are accounted for prospectively.
Anprospectively.An item of property, plant and equipment is derecognized upon disposal or when no future economic benefits are expected to arise from the continued use of the asset. Any gain or loss arising on derecognition of the asset (calculated as the difference between the net disposal proceeds and the carrying amount of the item) is included in the income statement in the period in which the item is derecognized.
|
| | | | | | | | | | | | | |
160164 | | BPbp Annual Report and Form 20-F 2019
2020 | | |
1.Significant accounting policies, judgements, estimates and assumptions– continued
Impairment of property, plant and equipment, intangible assets, and goodwill
The group assesses assets or groups of assets, called cash-generating units (CGUs), for impairment whenever events or changes in circumstances indicate that the carrying amount of an asset or CGU may not be recoverable; for example, changes in the group’s business plans, plans to dispose rather than retain assets, changes in the group’s assumptions about commodity prices, low plant utilization, evidence of physical damage or, for oil and gas assets, significant downward revisions of estimated reserves or increases in estimated future development expenditure or decommissioning costs. If any such indication of impairment exists, the group makes an estimate of the asset’s or CGU’s recoverable amount. Individual assets are grouped into CGUs for impairment assessment purposes at the lowest level at which there are identifiable cash flows that are largely independent of the cash flows of other groups of assets. A CGU’s recoverable amount is the higher of its fair value less costs of disposal and its value in use. If it is probable that the value of the CGU will be primarily recovered through a disposal transaction, the expected disposal proceeds are considered in determining the recoverable amount. Where the carrying amount of a CGU exceeds its recoverable amount, the CGU is considered impaired and is written down to its recoverable amount.
The business segment plans, which are approved on an annual basis by senior management, are the primary source of information for the determination of value in use. They contain forecasts for oil and natural gas production, refinery throughputs, sales volumes for various types of refined products (e.g. gasoline and lubricants), revenues, costs and capital expenditure. Carbon taxes and costs of emissions allowances are included in estimates of future cash flows, where applicable, based on the regulatory environment in each jurisdiction in which the group operates. As an initial step in the preparation of these plans, various assumptions regarding market conditions, such as oil prices, natural gas prices, refining margins, refined product margins and cost inflation rates are set by senior management. These assumptions take account of existing prices, global supply-demand equilibrium for oil and natural gas, other macroeconomic factors and historical trends and variability. In assessing value in use, the estimated future cash flows are adjusted for the risks specific to the asset group that are not reflected in the discount rate and are discounted to their present value typically using a pre-tax discount rate that reflects current market assessments of the time value of money.
Fair value less costs of disposal is the price that would be received to sell the asset in an orderly transaction between market participants and does not reflect the effects of factors that may be specific to the group and not applicable to entities in general. In limited circumstances where recent market transactions are not available for reference, discounted cash flow techniques are applied. Where discounted cash flow analyses are used to calculate fair value less costs of disposal, estimates are made about the assumptions market participants would use when pricing the asset, CGU or group of CGUs containing goodwill and the test is performed on a post-tax basis.
An assessment is made at each reporting date as to whether there is any indication that previously recognized impairment losses may no longer exist or may have decreased. If such an indication exists, the recoverable amount is estimated. A previously recognized impairment loss is reversed only if there has been a change in the estimates used to determine the asset’s recoverable amount since the last impairment loss was recognized. If that is the case, the carrying amount of the asset is increased to the lower of its recoverable amount and the carrying amount that would have been determined, net of depreciation, had no impairment loss been recognized for the asset in prior years. Impairment reversals are recognized in profit or loss. After a reversal, the depreciation charge is adjusted in future periods to allocate the asset’s revised carrying amount, less any residual value, on a systematic basis over its remaining useful life.
Goodwill is reviewed for impairment annually or more frequently if events or changes in circumstances indicate the recoverable amount of the group of CGUs to which the goodwill relates should be assessed. In assessing whether goodwill has been impaired, the carrying amount of the group of CGUs to which goodwill has been allocated is compared with its recoverable amount. Where the recoverable amount of the group of CGUs is less than the carrying amount (including goodwill), an impairment loss is recognized. An impairment loss recognized for goodwill is not reversed in a subsequent period.
|
| | | | | | | | | | | | | |
| BP
| bp Annual Report and Form 20-F 20192020 | | 161165 |
1.Significant accounting policies, judgements, estimates and assumptions– continued
|
| |
Significant judgements and estimates: recoverability of asset carrying values Determination as to whether, and by how much, an asset, CGU, or group of CGUs containing goodwill is impaired involves management estimates on highly uncertain matters such as the effects of inflation and deflation on operating expenses, discount rates, capital expenditure, production profiles, reserves and resources, and future commodity prices, including the outlook for global or regional market supply-and-demand conditions for crude oil, natural gas and refined products. Judgement is required when determining the appropriate grouping of assets into a CGU or the appropriate grouping of CGUs for impairment testing purposes. For example, individual oil and gas properties may form separate CGUs whilst certain oil and gas properties with shared infrastructure may be grouped together to form a single CGU. Alternative groupings of assets or CGUs may result in a different outcome from impairment testing. See Note 14 for details on how these groupings have been determined in relation to the impairment testing of goodwill. As discloseddescribed above, the recoverable amount of an asset is the higher of its value in use and its fair value less costs of disposal. Fair value less costs of disposal may be determined based on expected sales proceeds or similar recent market transaction data. Details of impairment charges and reversals recognized in the income statement are provided in Note 4 and details on the carrying amounts of assets are shown in Note 12, Note 14 and Note 15. The estimates for assumptions made in impairment tests in 20192020 relating to discount rates and oil and gas properties are discussed below. Changes in the economic environment or other facts and circumstances may necessitate revisions to these assumptions and could result in a material change to the carrying values of the group's assets within the next financial year. Discount rates For discounted cash flow calculations, future cash flows are adjusted for risks specific to the CGU. Value-in-use calculations are typically discounted using a pre-tax discount rate based upon the cost of funding the group derived from an established model, adjusted to a pre-tax basis and incorporating a market participant capital structure.structure and country risk premiums. Fair value less costs of disposal discounted cash flow calculations use the post-tax discount rate. The discount rates applied in impairment tests are reassessed each year. In 2019year and in 2020, the post-tax discount rate was 6% (2018 (2019 6%) and the pre-tax discount rate typically ranged from 7% to 13% (2018 9%) depending on the applicable tax rate in the geographic location of the CGU.. Where the CGU is located in a country that iswas judged to be higher risk an additional premium of 1% to 4%3% was addedreflected in the post-tax discount rate (2019 1% to the discount rates (2018 2%4%). The judgement of classifying a country as higher risk and the applicable premium takes into account various economic and geopolitical factors. The pre-tax discount rate typically ranged from 7% to 15% (2019 7% to 13%) depending on the risk premium and applicable tax rate in the geographic location of the CGU. Oil and natural gas properties For Upstream oil and natural gas properties, expected future cash flows are estimated using management’s best estimate of future oil and natural gas prices, and production and reserves volumes. The estimated future level of production in all impairment tests is based on assumptions about future commodity prices, production and development costs, field decline rates, current fiscal regimes and other factors. The recoverable amount of oil and gas properties is primarily sensitive to changes in the oil and gas price assumptions. Further sensitivity analysis may be performed if a specific oil and gas property is identified to have low headroom above its carrying amount. In 2019,2020, the group identified Upstream oil and gas properties with carrying amounts totalling $25,092$45,027 million (2018 $22,000 million) (2019 $25,092 million) where the headroom, as atbased on the dates of the lastmost recent impairment test performed in the year on those assets, was less than or equal to 20% of the carrying value, including $1,256 million (2018 $1,345 million) in relation to equity-accounted entities.value. A change in the discount rate, reserves, resources or the oil and gas price assumptions in the next financial year may result in thea recoverable amount of one or more of these assets fallingabove or below the current carrying amount.amount and therefore there is a risk of impairment reversals or charges in that period. Management considers that reasonably possible changes in the discount rate or forecast revenue, arising from a change in oil and natural gas prices and/or production could result in a material change in their carrying amounts within the next financial year,see Sensitivity analyses, below.
The recoverability of intangible exploration and appraisal expenditure is covered under Oil and natural gas exploration, appraisal and development expenditure above. Oil and natural gas prices The long-term price assumptions used for value in use impairment testing are based on those used for investment appraisal. The investment appraisalprice assumptions are recommended by the group chief economistsenior vice president economic & energy insights after considering a range of external price,prices, and supply and demand forecasts under various energy transition scenarios. They are reviewed and approved by management. As a result of the current uncertainty over the pace of transition to lower-carbon supply and demand and the social, political and environmental actions that will be taken to meet the goals of the Paris climate change agreement, the forecasts and scenarios considered include those where those goals are met as well as those where they are not met. bp sees the prospect of an enduring impact on the global economy as a result of the COVID-19 pandemic, with the potential for weaker demand for energy for a sustained period. bp’s management also expects that the aftermath of the pandemic will accelerate the pace of transition to a lower carbon economy and energy system as countries seek to ‘build back better’ so that their economies will be more resilient in the future. As a result of all the above, bp revised its price assumptions for value-in-use impairment testing, lowering them compared to those used in 2019 and extending the period covered to 2050. These price assumptions are derived from the central case investment appraisal assumptions (see page 28). A summary of the group’s revised price assumptions, in real 2020 terms, is provided below. The assumptions below represent management’s best estimate of future prices; they do not reflect a specific scenario andprices, which sit within the range of the external forecasts considered.considered as appropriate for the purpose. They are considered by bp to be broadly in line with a range of transition paths consistent with the Paris climate goals. However, they do not correspond to any specific Paris-consistent scenario. An inflation rate of 2% (2019 2%) is applied to determine the price assumptions in nominal terms. |
| | | | | | | | | | | | | | | | | | | | |
| | 2021 | 2025 | 2030 | 2040 | 2050 |
| Brent oil ($/bbl) | | 50 | 50 | 60 | 60 | 50 |
| Henry Hub gas ($/mmBtu) | | 3.00 | 3.00 | 3.00 | 3.00 | 2.75 |
| | | | | | | | | | | | | | |
| 166 | | bp Annual Report and Form 20-F 2020 | | |
1.Significant accounting policies, judgements, estimates and assumptions– continued
| | |
Material impairment charges were recognized in 2020 following the downward revision of the price assumptions. See Note 4 for further information. The long-term price assumptions used to determine recoverable amount based on value-in-use impairments tests are derived from the central case investment appraisal assumptions (see page 19) of $70in 2019 were $70 per barrel for Brent and $4$4 per mmBtu for Henry Hub gas, both in 2015 prices (2018 $75 per barrel and $4 per mmBtu respectively, in 2015 prices).prices. These long-term prices arewere applied from 2025 and 2032 respectively (2018 both from 2024) and continue to be inflated for the remaining life of the asset. The price assumptions used in 2019 over the periods to 2025 and 2032 have beenwere set such that there iswas a linear progression from our best estimate of 2020 prices which were set by reference to 2019 average prices, to the long-term assumptions. The majority of BP’sbp’s reserves and resources that support the carrying value of the group’s existing oil and gas properties are expected to be produced over the next 10 years. Average prices (in real 2015 terms) used to estimate cash flows over this period are $67 per barrel for Brent and $3.1 per mmBtu for Henry Hub gas. Oil prices fell 10%35% in 20192020 from 20182019 due to trade tensions, a macroeconomic downturn and a slight slowdown in oil demand.demand, reflecting the impact of the COVID-19 pandemic. OPEC+ production restraint, unplanned outages, and sanctions on Venezuela and Iran kept prices from falling further. BP'sbp's long-term assumption for oil prices is higher than the 20192020 price average, based on the judgement that current price levels would not encourage sufficient investment to meet global oil demand sustainably in the longer term, especially given the financial requirements of key low-cost oil producing economies. US gas prices dropped by around 15%20% in 20192020 compared to 2018. After an initial spike2019. Henry Hub gas prices were already low in January, they remained relatively low for muchearly 2020 due to mild weather. The drop in demand from the second quarter onward as a result of the yearCOVID-19 pandemic as well as significant US LNG shut-ins contributed to prices remaining below $2/mmBtu during the second and third quarters, despite a record consumption in the power sector and the drop in natural gas production. Prices recovered in the fourth quarter due to a combination of strong associated gas production growth, and storage levels coming back to normal. USthe seasonal gas demand growth was much lower thanincrease and the exceptional increasestrong recovery in 2018, whileUS LNG exports continued to expand. BP'sexports. bp's long-term price assumption for US gas is higher than recent market prices duereflects the fact that over the coming decades US gas production increases with an increasing proportion of production being used as feedstock to forecast rising domestic demand, rapidly increasing pipeline andsupply expanding LNG exports, and lowest cost resources being absorbed leading to production of more expensive gas, as well as requiring increased investment in infrastructure. |
|
| | | |
162 | | BP Annual Report and Form 20-F 2019
| |
1.Significant accounting policies, judgements, estimates and assumptions– continued
|
|
Management tested the impact of a reduction in prices of 15% against the best estimate for Brent oil and Henry Hub gas in all future years. These price reductions in isolation could indicatively lead to a reductionwhile in the carrying amount of BP’s oillonger-term falling gas consumption and declining demand for global LNG exports leads to increasing competitive pressure on US gas properties in the range of $2-3 billion, which is approximately 1-2% of the net book value of property, plant and equipment as at 31 December 2019.
Management also tested the impact of a scenario where Brent oil and Henry Hub gas prices start 15% lower than the best estimate and gradually reduce to 25% lower than the best estimate by 2040. Although this is not considered to be a reasonably possible change in the long-term assumptions within the next financial year, it reflects the inherent uncertainty in forecasting long-term prices. These price reductions in isolation could indicatively lead to a reduction in the carrying amount of BP’s oil and gas properties in the range of $4-5 billion which is approximately 3-4% of the net book value of property, plant and equipment as at 31 December 2019. Additionally, such a price reduction does not indicate a reduction in the carrying amount of the Upstream goodwill balance.
These sensitivity analyses do not, however, represent management’s best estimate of any impairments that might be recognized as they do not fully incorporate consequential changes that may arise, such as reductions in costs and changes to business plans, phasing of development, levels of reserves and resources, and production volumes. As the extent of a price reduction increases, the more likely it is that costs would decrease across the industry. The above sensitivity analyses therefore do not reflect a linear relationship between price and value that can be extrapolated. Past experience of performing impairment tests suggests that any impairment arising from such price reductions is likely to be lower once all these factors are taken into consideration. The interdependency of these inputs and risk factors plus the diverse characteristics of our oil and gas properties limits the practicability of estimating the probability or extent to which the overall recoverable amount is impacted by changes to the price assumptions.
The decline in oil and natural gas prices in the first quarter of 2020 is not expected to materially impact the recoverable amount of the group’s oil and natural gas properties.production.
Oil and natural gas reserves In addition to oil and natural gas prices, significant technical and commercial assessments are required to determine the group’s estimated oil and natural gas reserves. Reserves estimates are regularly reviewed and updated. Factors such as the availability of geological and engineering data, reservoir performance data, acquisition and divestment activity and drilling of new wells all impact on the determination of the group’s estimates of its oil and natural gas reserves. BPbp bases its proved reserves estimates on the requirement of reasonable certainty with rigorous technical and commercial assessments based on conventional industry practice and regulatory requirements. Reserves assumptions for value-in-use tests reflect the reserves and resources that management currently intend to develop. The recoverable amount of oil and gas properties is determined using a combination of inputs including reserves, resources and production volumes. Risk factors may be applied to reserves and resources which do not meet the criteria to be treated as proved. proved or probable. Sensitivity analyses A change in revenue from Upstream oil and gas properties can arise either due to changes in oil and natural gas prices, changes in oil and natural gas production, or a combination of the two. Management tested the impact of a change in revenue cash flows in value-in-use impairment testing arising from changes in price assumptions and/or production volumes up to a combined effect on revenue of 10% in all future years. Revenue reductions of this magnitude in isolation could indicatively lead to a reduction in the carrying amount of bp’s Upstream oil and gas properties in the range of $6-7 billion, which is approximately 5-6% of the net book value of property, plant and equipment as at 31 December 2020. Revenue increases of this magnitude in isolation could indicatively lead to an increase in the carrying amount of bp’s Upstream oil and gas properties in the range of $4-5 billion, which is approximately 3-4% of the net book value of property, plant and equipment as at 31 December 2020. This potential increase in the carrying amount would arise due to reversals of previously recognized impairments. These sensitivity analyses do not, however, represent management’s best estimate of any impairment charges or reversals that might be recognized as they do not fully incorporate consequential changes that may arise, such as changes in costs and business plans and phasing of development. For example, costs across the industry are more likely to decrease as oil and natural gas prices fall. The above sensitivity analyses therefore do not reflect a linear relationship between revenue and value that can be extrapolated. The interdependency of these inputs and risk factors plus the diverse characteristics of our Upstream oil and gas properties limits the practicability of estimating the probability or extent to which the overall recoverable amount is impacted by changes to the price assumptions or production volumes. Management also tested the impact of a one percentage point change in the discount rate used for value-in-use impairment testing of Upstream oil and gas properties. If the discount rate was one percentage point higher across all tests performed, the impairment charge recognized in 2020 would have been approximately $2.4 billion higher. If the discount rate was one percentage point lower, the impairment charge recognized would have been approximately $2.7 billion lower. Goodwill Irrespective of whether there is any indication of impairment, BPbp is required to test annually for impairment of goodwill acquired in business combinations. The group carries goodwill of approximately $11.9$12.5 billion on its balance sheet (2018 $12.2 billion)(2019 $11.9 billion), principally relating to the Atlantic Richfield, Burmah Castrol, Devon Energy and Reliance transactions. Sensitivities and additional information relating to impairment testing of goodwill in the Upstream segment are provided in Note 14. |
Inventories
Inventories, other than inventories held for short-term trading purposes, are stated at the lower of cost and net realizable value. Cost is determined by the first-in first-out method and comprises direct purchase costs, cost of production, transportation and manufacturing expenses. Net realizable value is determined by reference to prices existing at the balance sheet date, adjusted where the sale of inventories after the reporting period gives evidence about their net realizable value at the end of the period.
Inventories held for short-term trading purposes are stated at fair value less costs to sell and any changes in fair value are recognized in the income statement.
Supplies are valued at the lower of cost on a weighted average basis and net realizable value.
| | | | | | | | | | | | | | |
| | bp Annual Report and Form 20-F 2020 | | 167 |
1.Significant accounting policies, judgements, estimates and assumptions– continued
Leases
Agreements that convey the right to control the use of an identified asset for a period of time in exchange for consideration are accounted for as leases. The right to control is conveyed if BPbp has both the right to obtain substantially all of the economic benefits from, and the right to direct the use of, the identified asset throughout the period of use. An asset is identified if it is explicitly or implicitly specified by the agreement and any substitution rights held by the lessor over the asset are not considered substantive.
Agreements that convey the right to control the use of an intangible asset including rights to explore for or use hydrocarbons are not accounted for as leases. See significant accounting policy: intangible assets.
A lease liability is recognized on the balance sheet on the lease commencement date at the present value of future lease payments over the lease term. The discount rate applied is the rate implicit in the lease if readily determinable, otherwise an incremental borrowing rate is used. The incremental borrowing rate is determined based on factors such as the group’s cost of borrowing, lessee legal entity credit risk, currency and lease term. The lease term is the non-cancellable period of a lease together with any periods covered by an extension option that BPbp is reasonably certain to exercise, or periods covered by a termination option that BPbp is reasonably certain not to exercise. The future lease payments included in the present value calculation are any fixed payments, payments that vary depending on an index or rate, payments due for the reasonably certain exercise of options and expected residual value guarantee payments. Repayments of principal are presented as financing cash flows and payments of interest are presented as operating cash flows.
Payments that vary based on factors other than an index or a rate such as usage, sales volumes or revenues are not included in the present value calculation and are recognized in the income statement.statement and presented as operating cash flows. The lease liability is recognized on an amortized cost basis with interest expense recognized in the income statement over the lease term, except for where capitalized as exploration, appraisal or development expenditure.
The right-of-use asset is recognized on the balance sheet as property, plant and equipment at a value equivalent to the initial measurement of the lease liability adjusted for lease prepayments, lease incentives, initial direct costs and any restoration obligations. The right-of-use asset is depreciated typically on a straight-line basis over the lease term. The depreciation charge is recognized in the income statement except for where capitalized as exploration, appraisal or development expenditure. Right-of-use assets are assessed for impairment in line with the accounting policy for impairment of property, plant and equipment, intangible assets and goodwill.
Agreements may include both lease and non-lease components. Payments for lease and non-lease components are allocated on a relative stand-alone selling price basis except for leases of retail service stations where the group has elected not to separate non-lease payments from the calculation of the lease liability and right-of-use asset.
|
| | | |
| BP Annual Report and Form 20-F 2019
| | 163 |
1.Significant accounting policies, judgements, estimates and assumptions– continued
If the lease term at commencement of the agreement is less than 12 months, a lease liability and right-of-use asset are not recognized, and a lease expense is recognized in the income statement on a straight-line basis.
If a significant event or change in circumstances, within the control of BP,bp, arises that affects the reasonably certain lease term or there are changes to the lease payments, the present value of the lease liability is remeasured using the revised term and payments, with the right-of-use asset adjusted by an equivalent amount.
Modifications to a lease agreement beyond the original terms and conditions are accounted for as a re-measurement of the lease liability with a corresponding adjustment to the right-of-use asset. Any gain or loss on modification is recognized in the income statement. Modifications that increase the scope of the lease at a price commensurate with the stand-alone selling price are accounted for as a separate new lease.
The group recognizes the full lease liability, rather than its working interest share, for leases entered into on behalf of a joint operation if the group has the primary responsibility for making the lease payments. This may be the case if for example bp, as operator of the joint operation, is the sole signatory to the lease. In such cases, BP’sbp’s working interest share of the right-of-use asset is recognized if it is jointly controlled by the group and the other joint operators, and a receivable is recognized for the share of the asset transferred to the other joint operators. If BPbp is a non-operator, a payable to the operator is recognized if they have the primary responsibility for making the lease payments and BPbp has joint control over the right-of-use asset, otherwise no balances are recognized.
As noted in ‘Impact of new International Financial Reporting Standards - IFRS 16 ‘Leases’, BP elected to apply the ‘modified retrospective’ transition approach on adoption of IFRS 16. Under this approach, comparative periods’ financial information is not restated. The accounting policy applicable for leases in the comparative periods only is disclosed in the following paragraphs.
Agreements under which payments are made to owners in return for the right to use a specific asset are accounted for as leases. Leases that transfer substantially all the risks and rewards of ownership are recognized as finance leases. All other leases are accounted for as operating leases.
Finance leases are capitalized at the commencement of the lease term at the fair value of the leased item or, if lower, at the present value of the minimum lease payments. Finance charges are allocated to each period so as to achieve a constant rate of interest on the remaining balance of the liability and are charged directly against income. Capitalized leased assets are depreciated over the shorter of the estimated useful life of the asset or the lease term. Operating lease payments are recognized as an expense on a straight-line basis over the lease term except where capitalized as exploration or appraisal expenditure. See significant accounting policy: Exploration and appraisal expenditure.
Financial assets
Financial assets are recognized initially at fair value, normally being the transaction price. In the case of financial assets not measured at fair value through profit or loss, directly attributable transaction costs are also included. The subsequent measurement of financial assets depends on their classification, as set out below. The group derecognizes financial assets when the contractual rights to the cash flows expire or the rights to receive cash flows have been transferred to a third party along withand either substantially all of the risks and rewards of the asset have been transferred, or substantially all the risks and rewards of the asset have neither been retained nor transferred but control of the asset.asset has been transferred. This includes the derecognition of receivables for which discounting arrangements are entered into.
The group classifies its financial asset debt instruments as measured at amortized cost, fair value through other comprehensive income or fair value through profit or loss. The classification depends on the business model for managing the financial assets and the contractual cash flow characteristics of the financial asset.
Financial assets measured at amortized cost
Financial assets are classified as measured at amortized cost when they are held in a business model the objective of which is to collect contractual cash flows and the contractual cash flows represent solely payments of principal and interest. Such assets are carried at amortized cost using the effective interest method if the time value of money is significant. Gains and losses are recognized in profit or loss when the assets are derecognized or impaired and when interest is recognized using the effective interest method. This category of financial assets includes trade and other receivables.
Financial assets measured at fair value through other comprehensive income
Financial assets are classified as measured at fair value through other comprehensive income when they are held in a business model the objective of which is both to collect contractual cash flows and sell the financial assets, and the contractual cash flows represent solely payments of principal and interest. The group does not have any financial assets classified in this category.
Financial assets measured at fair value through profit or loss
Financial assets are classified as measured at fair value through profit or loss when the asset does not meet the criteria to be measured at amortized cost or fair value through other comprehensive income. Such assets are carried on the balance sheet at fair value with gains or losses recognized in the income statement. Derivatives, other than those designated as effective hedging instruments, are included in this category.
| | | | | | | | | | | | | | |
| 168 | | bp Annual Report and Form 20-F 2020 | | |
1.Significant accounting policies, judgements, estimates and assumptions– continued
Investments in equity instruments
Investments in equity instruments are subsequently measured at fair value through profit or loss unless an election is made on an instrument-by-instrument basis to recognise fair value gains and losses in other comprehensive income. The group does not have any investments for which this election has been made.
Derivatives designated as hedging instruments in an effective hedge
Derivatives designated as hedging instruments in an effective hedge are carried on the balance sheet at fair value. The treatment of gains and losses arising from revaluation is described below in the accounting policy for derivative financial instruments and hedging activities.
Cash equivalents
Cash equivalents are short-term highly liquid investments that are readily convertible to known amounts of cash, are subject to insignificant risk of changes in value and generally have a maturity of three months or less from the date of acquisition. Cash equivalents are classified as financial assets measured at amortized cost or, in the case of certain money market funds, fair value through profit or loss.
|
| | | |
164 | | BP Annual Report and Form 20-F 2019
| |
1.Significant accounting policies, judgements, estimates and assumptions– continued
Impairment of financial assets measured at amortized cost
The group assesses on a forward-looking basis the expected credit losses associated with financial assets classified as measured at amortized cost at each balance sheet date. Expected credit losses are measured based on the maximum contractual period over which the group is exposed to credit risk. As lifetime expected credit losses are recognized for trade receivables and the tenor of substantially all of other in-scope financial assets is less than 12 months there is no significant difference between the measurement of 12-month and lifetime expected credit losses for the group. The measurement of expected credit losses is a function of the probability of default, loss given default and exposure at default. The expected credit loss is estimated as the difference between the asset’s carrying amount and the present value of the future cash flows the group expects to receive discounted at the financial asset’s original effective interest rate. The carrying amount of the asset is adjusted, with the amount of the impairment gain or loss recognized in the income statement.
A financial asset or group of financial assets classified as measured at amortized cost is considered to be credit-impaired if there is reasonable and supportable evidence that one or more events that have a detrimental impact on the estimated future cash flows of the financial asset (or group of financial assets) have occurred. Financial assets are written off where the group has no reasonable expectation of recovering amounts due.
Equity instruments
Instruments are classified as either financial liabilities or as equity in accordance with the substance of the contractual arrangements. Instruments that cannot be settled in the group’s own equity instruments and that include no contractual obligation to deliver cash or another financial asset or to exchange financial assets or financial liabilities with another entity that are potentially unfavourable are classified as equity. Equity instruments issued by the group are recognized at the proceeds received, net of direct issue costs.
Financial liabilities
Financial liabilities are recognized when the group becomes party to the contractual provisions of the instrument. The group derecognizes financial liabilities when the obligation specified in the contract is discharged, cancelled or expired. The measurement of financial liabilities depends on their classification, as follows:
Financial liabilities measured at fair value through profit or loss
Financial liabilities that meet the definition of held for trading are classified as measured at fair value through profit or loss. Such liabilities are carried on the balance sheet at fair value with gains or losses recognized in the income statement. Derivatives, other than those designated as effective hedging instruments, are included in this category.
Derivatives designated as hedging instruments in an effective hedge
Derivatives designated as hedging instruments in an effective hedge are carried on the balance sheet at fair value. The treatment of gains and losses arising from revaluation is described below in the accounting policy for derivative financial instruments and hedging activities.
Financial liabilities measured at amortized cost
All other financial liabilities are initially recognized at fair value, net of directly attributable transaction costs. For interest-bearing loans and borrowings this is typically equivalent to the fair value of the proceeds received, net of issue costs associated with the borrowing.
After initial recognition, other financial liabilities are subsequently measured at amortized cost using the effective interest method. Amortized cost is calculated by taking into account any issue costs and any discount or premium on settlement. Gains and losses arising on the repurchase, settlement or cancellation of liabilities are recognized in interest and other income and finance costs respectively.
This category of financial liabilities includes trade and other payables and finance debt.
The group’s trade payables include some supplier arrangements that utilize letter of credit facilities (see Note 29 - Liquidity risk for further information). The group assesses the payables subject to these arrangements to determine whether they should continue to be classified as trade payables and give rise to operating cash flows or finance debt and financing cash flows. The criteria used in making this assessment include the payment terms for the amount due relative to terms commonly seen in the markets in which BP operates. | | |
Significant judgement: supplier financing arrangements The group’s trade payables include some supplier arrangements that utilize letter of credit facilities. Judgement is required to assesses the payables subject to these arrangements to determine whether they should continue to be classified as trade payables and give rise to operating cash flows or finance debt and financing cash flows. The criteria used in making this assessment include the payment terms for the amount due relative to terms commonly seen in the markets in which bp operates and whether the arrangements significantly change the nature of the liability. Liabilities subject to these arrangements with payment terms of up to approximately 60 days are generally considered to be trade payables and give rise to operating cash flows. See Note 29 - Liquidity risk for further information. |
Financial guarantees
The group issues financial guarantee contracts to make specified payments to reimburse holders for losses incurred because certain associates, joint ventures or third-party entities fail to make payments when due in accordance with the original or modified terms of a debt instrument such as a loan. The liability for a financial guarantee contract is initially measured at fair value and subsequently measured at the higher of the contract’s estimated expected credit loss and the amount initially recognized less, where appropriate, cumulative amortization.
Derivative financial instruments and hedging activities
The group uses derivative financial instruments to manage certain exposures to fluctuations in foreign currency exchange rates, interest rates and commodity prices, as well as for trading purposes. These derivative financial instruments are recognized initially at fair value on the date on which a derivative contract is entered into and subsequently remeasured at fair value. Derivatives are carried as assets when the fair value is positive and as liabilities when the fair value is negative.
| | | | | | | | | | | | | | |
| | bp Annual Report and Form 20-F 2020 | | 169 |
1.Significant accounting policies, judgements, estimates and assumptions– continued
Contracts to buy or sell a non-financial item (for example, oil, oil products, gas or power) that can be settled net in cash, with the exception of contracts that were entered into and continue to be held for the purpose of the receipt or delivery of a non-financial item in accordance with the group’s expected purchase, sale or usage requirements, are accounted for as financial instruments. Gains or losses arising from changes in the fair value of derivatives that are not designated as effective hedging instruments are recognized in the income statement.
If, at inception of a contract, the valuation cannot be supported by observable market data, any gain or loss determined by the valuation methodology is not recognized in the income statement but is deferred on the balance sheet and is commonly known as a ‘day-one gain or loss’. This deferred gain or loss is recognized in the income statement over the life of the contract until substantially all the remaining contract term can be valued using observable market data at which point any remaining deferred gain or loss is recognized in the income statement. Changes in valuation subsequent to the initial valuation at inception of a contract are recognized immediately in the income statement.
For the purpose of hedge accounting, hedges are classified as:
•Fair value hedges when hedging exposure to changes in the fair value of a recognized asset or liability.
•Cash flow hedges when hedging exposure to variability in cash flows that is attributable to either a particular risk associated with a recognized asset or liability or a highly probable forecast transaction.
Hedge relationships are formally designated and documented at inception, together with the risk management objective and strategy for undertaking the hedge. The documentation includes identification of the hedging instrument, the hedged item or transaction, the nature of the risk being hedged, the existence at inception of an economic relationship and subsequent measurement of the hedging instrument's effectiveness in offsetting the exposure to changes in the hedged item’s fair value or cash flows attributable to the hedged risk, the hedge ratio and sources of hedge ineffectiveness. Hedges meeting the criteria for hedge accounting are accounted for as follows:
|
| | | |
| BP Annual Report and Form 20-F 2019
| | 165 |
1.Significant accounting policies, judgements, estimates and assumptions– continued
Fair value hedges
The change in fair value of a hedging derivative is recognized in profit or loss. The change in the fair value of the hedged item attributable to the risk being hedged is recorded as part of the carrying value of the hedged item and is also recognized in profit or loss, where it offsets. The group applies fair value hedge accounting when hedging interest rate risk and certain currency risks on fixed rate finance debt.
Fair value hedge accounting is discontinued only when the hedging relationship or a part thereof ceases to meet the qualifying criteria. This includes when the risk management objective changes or when the hedging instrument is sold, terminated or exercised. The accumulated adjustment to the carrying amount of a hedged item at such time is then amortized prospectively to profit or loss as finance interest expense over the hedged item's remaining period to maturity.
Cash flow hedges
The effective portion of the gain or loss on a cash flow hedging instrument is reported in other comprehensive income, while the ineffective portion is recognized in profit or loss. Amounts reported in other comprehensive income are reclassified to the income statement when the hedged transaction affects profit or loss.
Where the hedged item is a highly probably forecast transaction that results in the recognition of a non-financial asset or liability, such as a forecast foreign currency transaction for the purchase of property, plant and equipment, the amounts recognized within other comprehensive income are transferred to the initial carrying amount of the non-financial asset or liability. Where the hedged item is an equity investment, the amounts recognized in other comprehensive income remain in the separate component of equity until the hedged cash flows affect profit or loss. Where the hedged item is recognized directly in profit or loss, the amounts recognized in other comprehensive income are reclassified to production and manufacturing expenses or sales and other operating revenues as appropriate.
Cash flow hedge accounting is discontinued only when the hedging relationship or a part thereof ceases to meet the qualifying criteria. This includes when the designated hedged forecast transaction or part thereof is no longer considered to be highly probable to occur, or when the hedging instrument is sold, terminated or exercised without replacement or rollover. When cash flow hedge accounting is discontinued amounts previously recognized within other comprehensive income remain in equity until the forecast transaction occurs and are reclassified to profit or loss or transferred to the initial carrying amount of a non-financial asset or liability as above. If the forecast transaction is no longer expected to occur, amounts previously recognized within other comprehensive income will be immediately reclassified to profit or loss.
Costs of hedging
The foreign currency basis spread of cross-currency interest rate swaps are excluded from hedge designations and accounted for as costs of hedging. Changes in fair value of the foreign currency basis spread are recognized in other comprehensive income to the extent that they relate to the hedged item. For time-period related hedged items, the amount recognized in other comprehensive income is amortized to profit or loss on a straight line basis over the term of the hedging relationship.
Fair value measurement
Fair value is the price that would be received to sell an asset or paid to transfer a liability in an orderly transaction between market participants. The group categorizes assets and liabilities measured at fair value into one of three levels depending on the ability to observe inputs employed in their measurement. Level 1 inputs are quoted prices in active markets for identical assets or liabilities. Level 2 inputs are inputs that are observable, either directly or indirectly, other than quoted prices included within level 1 for the asset or liability. Level 3 inputs are unobservable inputs for the asset or liability reflecting significant modifications to observable related market data or BP’sbp’s assumptions about pricing by market participants.
| | | | | | | | | | | | | | |
| 170 | | bp Annual Report and Form 20-F 2020 | | |
1.Significant accounting policies, judgements, estimates and assumptions– continued
| | |
Significant estimate and judgement: derivative financial instruments In some cases the fair values of derivatives are estimated using internal models due to the absence of quoted prices or other observable, market-corroborated data. This primarily applies to the group’s longer-term derivative contracts. The majority of these contracts are valued using models with inputs that include price curves for each of the different products that are built up from available active market pricing data (including volatility and correlation) and modelled using the maximum available external information. Additionally, where limited data exists for certain products, prices are determined using historical and long-term pricing relationships. The use of alternative assumptions or valuation methodologies may result in significantly different values for these derivatives. A reasonably possible change in the price assumptions used in the models relating to index price would not have a material impact on net assets and the Group income statement primarily as a result of offsetting movements between derivative assets and liabilities. For more information, including the carrying amounts of level 3 derivatives, see Note 30. In some cases, judgement is required to determine whether contracts to buy or sell commodities meet the definition of a derivative.derivative or to determine appropriate presentation and classification of transactions in certain cases. In particular longer -term contracts to buy and sell LNG are not considered to meet the definition as they are not considered capable of being net settled due to a lack of liquidity in the LNG market and the inability or lack of history of net settlement and so are accounted for on an accruals basis, rather than as a derivative. |
Offsetting of financial assets and liabilities
Financial assets and liabilities are presented gross in the balance sheet unless both of the following criteria are met: the group currently has a legally enforceable right to set off the recognized amounts; and the group intends to either settle on a net basis or realize the asset and settle the liability simultaneously. A right of set off is the group’s legal right to settle an amount payable to a creditor by applying against it an amount receivable from the same counterparty. The relevant legal jurisdiction and laws applicable to the relationships between the parties are considered when assessing whether a current legally enforceable right to set off exists.
Provisions and contingencies
Provisions are recognized when the group has a present legal or constructive obligation as a result of a past event, it is probable that an outflow of resources embodying economic benefits will be required to settle the obligation and a reliable estimate can be made of the amount of the obligation. Where appropriate, the future cash flow estimates are adjusted to reflect risks specific to the liability.
If the effect of the time value of money is material, provisions are determined by discounting the expected future cash flows at a pre-tax risk-free rate that reflects current market assessments of the time value of money. Where discounting is used, the increase in the provision due to the passage of time is recognized within finance costs. Provisions are discounted using a nominal discount rate of 2.5% (2018 3.0%(2019 2.5%).
Provisions are split between amounts expected to be settled within 12 months of the balance sheet date (current) and amounts expected to be settled later (non-current).
|
| | | |
166 | | BP Annual Report and Form 20-F 2019
| |
1.Significant accounting policies, judgements, estimates and assumptions– continued
Contingent liabilities are possible obligations whose existence will only be confirmed by future events not wholly within the control of the group, or present obligations where it is not probable that an outflow of resources will be required or the amount of the obligation cannot be measured with sufficient reliability. Contingent liabilities are not recognized in the consolidated financial statements but are disclosed unless the possibility of an outflow of economic resources is considered remote.
Decommissioning
Liabilities for decommissioning costs are recognized when the group has an obligation to plug and abandon a well, dismantle and remove a facility or an item of plant and to restore the site on which it is located, and when a reliable estimate of that liability can be made. Where an obligation exists for a new facility or item of plant, such as oil and natural gas production or transportation facilities, this liability will be recognized on construction or installation. Similarly, where an obligation exists for a well, this liability is recognized when it is drilled. An obligation for decommissioning may also crystallize during the period of operation of a well, facility or item of plant through a change in legislation or through a decision to terminate operations; an obligation may also arise in cases where an asset has been sold but the subsequent owner is no longer able to fulfil its decommissioning obligations, for example due to bankruptcy. The amount recognized is the present value of the estimated future expenditure determined in accordance with local conditions and requirements. The provision for the costs of decommissioning wells, production facilities and pipelines at the end of their economic lives is estimated using existing technology, at future prices, depending on the expected timing of the activity, and discounted using the nominal discount rate.
An amount equivalent to the decommissioning provision is recognized as part of the corresponding intangible asset (in the case of an exploration or appraisal well) or property, plant and equipment. The decommissioning portion of the property, plant and equipment is subsequently depreciated at the same rate as the rest of the asset. Other than the unwinding of discount on or utilisation of the provision, any change in the present value of the estimated expenditure is reflected as an adjustment to the provision and the corresponding asset where that asset is generating or is expected to generate future economic benefits.
Environmental expenditures and liabilities
Environmental expenditures that are required in order for the group to obtain future economic benefits from its assets are capitalized as part of those assets. Expenditures that relate to an existing condition caused by past operations that do not contribute to future earnings are expensed.
Liabilities for environmental costs are recognized when a clean-up is probable and the associated costs can be reliably estimated. Generally, the timing of recognition of these provisions coincides with the commitment to a formal plan of action or, if earlier, on divestment or on closure of inactive sites.
The amount recognized is the best estimate of the expenditure required to settle the obligation. Provisions for environmental liabilities have been estimated using existing technology, at future prices and discounted using a nominal discount rate.
Emissions
Liabilities for emissions are recognized when the cumulative volumes of gases emitted by the group at the end of the reporting period exceed the allowances granted free of charge held for own use or a set baseline for emissions. The provision is measured at the best estimate of the expenditure required to settle the present obligation at the balance sheet date. It is based on the excess of actual emissions over the free allowances held or set baseline in tonnes (or other appropriate quantity) and is valued at the actual cost of any allowances that have been purchased and held for own use on a first-in-first-out (FIFO) basis, and, if insufficient allowances are held, for the remaining requirement on the basis of the spot market price of allowances at the balance sheet date. The cost of allowances purchased to cover a shortfall is recognized separately on the balance sheet as an intangible asset unless the emission allowances acquired or generated by the group are risk-managed by the integrated supply and trading function, then they are recognized on the balance sheet as inventory.
| | | | | | | | | | | | | | |
| | bp Annual Report and Form 20-F 2020 | | 171 |
1.Significant accounting policies, judgements, estimates and assumptions– continued
Restructuring provisions
The reinvent bp programme, expected to reduce headcount by around 10,000 positions, has resulted in recognition of provisions where a detailed formal plan exists, and a valid expectation of risk of redundancy has been made to those affected but where the specific outcomes remain uncertain . Where formal redundancy offers have been made, the obligations for those amounts are reported as payables and, if not, as provisions if unpaid at the year-end.
| | |
Significant judgements and estimates: provisions The group holds provisions for the future decommissioning of oil and natural gas production facilities and pipelines at the end of their economic lives. The largest decommissioning obligations facing BPbp relate to the plugging and abandonment of wells and the removal and disposal of oil and natural gas platforms and pipelines around the world. Most of these decommissioning events are many years in the future and the precise requirements that will have to be met when the removal event occurs are uncertain. Decommissioning technologies and costs are constantly changing, as are political, environmental, safety and public expectations. The timing and amounts of future cash flows are subject to significant uncertainty and estimation is required in determining the amounts of provisions to be recognized. Any changes in the expected future costs are reflected in both the provision and the asset. If oil and natural gas production facilities and pipelines are sold to third parties, judgement is required to assess whether the new owner will be unable to meet their decommissioning obligations, whether BPbp would then be responsible for decommissioning, and if so the extent of that responsibility. The group has assessed that no material decommissioning provisions should be recognized as at 31 December 2019 (20182020 (2019 no material provisions) for assets sold to third parties where the sale transferred the decommissioning obligation to the new owner. Decommissioning provisions associated with downstream refineries and petrochemicals facilities are generally not recognized, as the potential obligations cannot be measured, given their indeterminate settlement dates.Obligations may arise if refineries cease manufacturing operations and any such obligations would be recognized in the period when sufficient information becomes available to determine potential settlement dates. The group performs periodic reviews of its downstream refineries and petrochemicals long-lived assets for any changes in facts and circumstances including those relating to the energy transition, that might require the recognition of a decommissioning provision. The provision for environmental liabilities is estimated based on current legal and constructive requirements, technology, price levels and expected plans for remediation. Actual costs and cash outflows can differ from current estimates because of changes in laws and regulations, public expectations, prices, discovery and analysis of site conditions and changes in clean-up technology. The timing and amount of future expenditures relating to decommissioning and environmental liabilities are reviewed annually, together with theannually. The interest rate used in discounting the cash flows.flows is reviewed quarterly. The nominal interest rate used to determine the balance sheet obligations at the end of 20192020 was a nominal rate of 2.5% (2018 a nominal rate of 3.0%(2019 2.5%), which was based on long-dated US government bonds. The weighted average period over which decommissioning and environmental costs are generally expected to be incurred is estimated to be approximately 18 years (2018(2019 18 years) and 6 years (2018(2019 6 years) respectively. Costs at future prices are determined by applying an inflation rate of 1.5% (2019 1.5%) to decommissioning costs and 2% (2019 2%) for all other provisions. A lower rate is applied to decommissioning as certain costs are expected to remain fixed at current or past prices. Further information about the group’s provisions is provided in Note 23. Changes in assumptions in relation to the group's provisions could result in a material change in their carrying amounts within the next financial year. A 0.5% change0.5 percentage point decrease in the nominal discount rate applied could have anincrease the group’s provision balances by approximately $1.3 billion (2019 $1.4 billion). The pre-tax impact on the group income statement would be a charge of approximately $1.4 billion (2018 $1.3 billion)$0.5 billion. The discounting impact on the valuegroup's Upstream decommissioning provisions of the group’s provisions. Aa two-year change in the timing of expected future decommissioning expenditures doeswould not have a material impact on the value of the group’s decommissioning provision.be material. Management docurrently does not consider a change of greater than two years to be reasonably possible either in the next financial year or asyear.
If all expected future decommissioning expenditures were 10% higher, the group's Upstream decommissioning provisions would increase by approximately $1.4 billion and a resultpre-tax charge of changes in the longer-term economic environment.approximately $0.5 billion would be recognized. As described in Note 33, the group is subject to claims and actions for which no provisions have been recognized. The facts and circumstances relating to particular cases are evaluated regularly in determining whether a provision relating to a specific litigation should be recognized or revised. Accordingly, significant management judgement relating to provisions and contingent liabilities is required, since the outcome of litigation is difficult to predict. |
|
| | | |
| BP Annual Report and Form 20-F 2019
| | 167 |
1.Significant accounting policies, judgements, estimates and assumptions– continued
Employee benefits
Wages, salaries, bonuses, social security contributions, paid annual leave and sick leave are accrued in the period in which the associated services are rendered by employees of the group. Deferred bonus arrangements that have a vesting date more than 12 months after the balance sheet date are valued on an actuarial basis using the projected unit credit method and amortized on a straight-line basis over the service period until the award vests. The accounting policies for share-based payments and for pensions and other post-retirement benefits are described below.
Share-based payments
Equity-settled transactions
The cost of equity-settled transactions with employees is measured by reference to the fair value of the equity instruments on the date on which they are granted and is recognized as an expense over the vesting period, which ends on the date on which the employees become fully entitled to the award. A corresponding credit is recognized within equity. Fair value is determined by using an appropriate, widely used, valuation model. In valuing equity-settled transactions, no account is taken of any vesting conditions, other than conditions linked to the price of the shares of the company (market conditions). Non-vesting conditions, such as the condition that employees contribute to a savings-related plan, are taken into account in the grant-date fair value, and failure to meet a non-vesting condition, where this is within the control of the employee is treated as a cancellation and any remaining unrecognized cost is expensed.
For other equity-settled share-based payment transactions, the goods or services received and the corresponding increase in equity are measured at the fair value of the goods or services received unless their fair value cannot be reliably estimated. If the fair value of the goods and services received cannot be reliably estimated, the transaction is measured by reference to the fair value of the equity instruments granted.
| | | | | | | | | | | | | | |
| 172 | | bp Annual Report and Form 20-F 2020 | | |
1.Significant accounting policies, judgements, estimates and assumptions– continued
Cash-settled transactions
The cost of cash-settled transactions is recognized as an expense over the vesting period, measured by reference to the fair value of the corresponding liability which is recognized on the balance sheet. The liability is remeasured at fair value at each balance sheet date until settlement, with changes in fair value recognized in the income statement.
Pensions and other post-retirement benefits
The cost of providing benefits under the group’s defined benefit plans is determined separately for each plan using the projected unit credit method, which attributes entitlement to benefits to the current period to determine current service cost and to the current and prior periods to determine the present value of the defined benefit obligation. Past service costs, resulting from either a plan amendment or a curtailment (a reduction in future obligations as a result of a material reduction in the plan membership), are recognized immediately when the company becomes committed to a change.
Net interest expense relating to pensions and other post-retirement benefits, which is recognized in the income statement, represents the net change in present value of plan obligations and the value of plan assets resulting from the passage of time, and is determined by applying the discount rate to the present value of the benefit obligation at the start of the year, and to the fair value of plan assets at the start of the year, taking into account expected changes in the obligation or plan assets during the year.
Remeasurements of the defined benefit liability and asset, comprising actuarial gains and losses, and the return on plan assets (excluding amounts included in net interest described above) are recognized within other comprehensive income in the period in which they occur and are not subsequently reclassified to profit and loss.
The defined benefit pension plan surplus or deficit recognized on the balance sheet for each plan comprises the difference between the present value of the defined benefit obligation (using a discount rate based on high quality corporate bonds) and the fair value of plan assets out of which the obligations are to be settled directly. Fair value is based on market price information and, in the case of quoted securities, is the published bid price. Defined benefit pension plan surpluses are only recognized to the extent they are recoverable, either by way of a refund from the plan or reductions in future contributions to the plan.
Contributions to defined contribution plans are recognized in the income statement in the period in which they become payable.
|
| |
Significant estimate: pensions and other post-retirement benefits Accounting for defined benefit pensions and other post-retirement benefits involves making significant estimates when measuring the group's pension plan surpluses and deficits. These estimates require assumptions to be made about many uncertainties. Pensions and other post-retirement benefit assumptions are reviewed by management at the end of each year. These assumptions are used to determine the projected benefit obligation at the year end and hence the surpluses and deficits recorded on the group's balance sheet, and pension and other post-retirement benefit expense for the following year. The assumptions that are the most significant to the amounts reported are the discount rate, inflation rate, salary growth and mortality levels. Assumptions about these variables are based on the environment in each country. The assumptions used vary from year to year, with resultant effects on future net income and net assets. Changes to some of these assumptions, in particular the discount rate and inflation rate, could result in material changes to the carrying amounts of the group's pension and other post-retirement benefit obligations within the next financial year, in particular for the UK, US and Eurozone plans. Any differences between these assumptions and the actual outcome will also affect future net income and net assets. The values ascribed to these assumptions and a sensitivity analysis of the impact of changes in the assumptions on the benefit expense and obligation used are provided in Note 24. |
Income taxes
Income tax expense represents the sum of current tax and deferred tax.
Income tax is recognized in the income statement, except to the extent that it relates to items recognized in other comprehensive income or directly in equity, in which case the related tax is recognized in other comprehensive income or directly in equity.
Current tax is based on the taxable profit for the period. Taxable profit differs from net profit as reported in the income statement because it is determined in accordance with the rules established by the applicable taxation authorities. It therefore excludes items of income or expense that are taxable or deductible in other periods as well as items that are never taxable or deductible. The group’s liability for current tax is calculated using tax rates and laws that have been enacted or substantively enacted by the balance sheet date.
|
| | | |
168 | | BP Annual Report and Form 20-F 2019
| |
1.Significant accounting policies, judgements, estimates and assumptions– continued
Deferred tax is provided, using the liability method, on temporary differences at the balance sheet date between the tax bases of assets and liabilities and their carrying amounts for financial reporting purposes. Deferred tax liabilities are recognized for all taxable temporary differences except:
•Where the deferred tax liability arises on the initial recognition of goodwill.
•Where the deferred tax liability arises on the initial recognition of an asset or liability in a transaction that is not a business combination and, at the time of the transaction, affects neither accounting profit nor taxable profit or loss.
•In respect of taxable temporary differences associated with investments in subsidiaries and associates and interests in joint arrangements, where the group is able to control the timing of the reversal of the temporary differences and it is probable that the temporary differences will not reverse in the foreseeable future.
Deferred tax assets are recognized for deductible temporary differences, carry-forward of unused tax credits and unused tax losses, to the extent that it is probable that taxable profit will be available against which the deductible temporary differences and the carry-forward of unused tax credits and unused tax losses can be utilized, except where the deferred tax asset relating to the deductible temporary difference arises from the initial recognition of an asset or liability in a transaction that is not a business combination and, at the time of the transaction, affects neither accounting profit nor taxable profit or loss. In respect of deductible temporary differences associated with investments in subsidiaries and associates and interests in joint arrangements, deferred tax assets are recognized only to the extent that it is probable that the temporary differences will reverse in the foreseeable future and taxable profit will be available against which the temporary differences can be utilized.
The carrying amount of deferred tax assets is reviewed at each balance sheet date and reduced to the extent that it is no longer probable or increased to the extent that it is probable that sufficient taxable profit will be available to allow all or part of the deferred tax asset to be utilized.
| | | | | | | | | | | | | | |
| | bp Annual Report and Form 20-F 2020 | | 173 |
1.Significant accounting policies, judgements, estimates and assumptions– continued
Deferred tax assets and liabilities are measured at the tax rates that are expected to apply in the period when the asset is realized or the liability is settled, based on tax rates (and tax laws) that have been enacted or substantively enacted at the balance sheet date. Deferred tax assets and liabilities are not discounted.
Deferred tax assets and liabilities are offset only when there is a legally enforceable right to set off current tax assets against current tax liabilities and when the deferred tax assets and liabilities relate to income taxes levied by the same taxation authority on either the same taxable entity or different taxable entities where there is an intention to settle the current tax assets and liabilities on a net basis or to realize the assets and settle the liabilities simultaneously.
Where tax treatments are uncertain, if it is considered probable that a taxation authority will accept the group's proposed tax treatment, income taxes are recognized consistent with the group's income tax filings. If it is not considered probable, the uncertainty is reflected within the carrying amount of the applicable tax asset or liability using either the most likely amount or an expected value, depending on which method better predicts the resolution of the uncertainty.
The computation of the group’s income tax expense and liability involves the interpretation of applicable tax laws and regulations in many jurisdictions throughout the world. The resolution of tax positions taken by the group, through negotiations with relevant tax authorities or through litigation, can take several years to complete and in some cases it is difficult to predict the ultimate outcome. Therefore, judgement is required to determine whether provisions for income taxes are required and, if so, estimation is required of the amounts that could be payable.
In addition, the group has carry-forward tax losses and tax credits in certain taxing jurisdictions that are available to offset against future taxable profit. However, deferred tax assets are recognized only to the extent that it is probable that taxable profit will be available against which the unused tax losses or tax credits can be utilized. Management judgement is exercised in assessing whether this is the case and estimates are required to be made of the amount of future taxable profits that will be available.available.Such judgements are inherently impacted by estimates affecting future taxable profits such as oil and natural gas prices and decommissioning expenditure, see significant judgements and estimates: recoverability of asset carrying values and provisions
Management do not assess there to be a significant risk of a material change to the group’s tax provisioning or recognition of deferred tax assets within the next financial year, however the tax position remains inherently uncertain and therefore subject to change. To the extent that actual outcomes differ from management’s estimates, income tax charges or credits, and changes in current and deferred tax assets or liabilities, may arise in future periods. For more information see Note 9 and Note 33.
Judgement is also required when determining whether a particular tax is an income tax or another type of tax (for example a production tax). Accounting for deferred tax is applied to income taxes as described above, but is not applied to other types of taxes; rather such taxes are recognized in the income statement in accordance with the applicable accounting policy such as Provisions and contingencies. No new significant judgements were made in 20192020 in this regard.
Customs duties and sales taxes
Customs duties and sales taxes that are passed on or charged to customers are excluded from revenues and expenses. Assets and liabilities are recognized net of the amount of customs duties or sales tax except:
•Customs duties or sales taxes incurred on the purchase of goods and services which are not recoverable from the taxation authority are recognized as part of the cost of acquisition of the asset.
•Receivables and payables are stated with the amount of customs duty or sales tax included.
The net amount of sales tax recoverable from, or payable to, the taxation authority is included within receivables or payables in the balance sheet.
Own equity instruments – treasury shares
The group’s holdings in its own equity instruments are shown as deductions from shareholders’ equity. Treasury shares represent BPbp shares repurchased and available for specific and limited purposes. For accounting purposes, shares held in Employee Share Ownership Plans (ESOPs) to meet the future requirements of the employee share-based payment plans are treated in the same manner as treasury shares and are, therefore, included in the consolidated financial statements as treasury shares. The cost of treasury shares subsequently sold or reissued is calculated on a weighted-average basis. Consideration, if any, received for the sale of such shares is also recognized in equity. No gain or loss is recognized in the income statement on the purchase, sale, issue or cancellation of equity shares. Shares repurchased under the share buy-back programme which are immediately cancelled are not shown as treasury shares, but are shown as a deduction from the profit and loss account reserve in the group statement of changes in equity.
|
| | | |
| BP Annual Report and Form 20-F 2019
| | 169 |
1.Significant accounting policies, judgements, estimates and assumptions– continued
Revenueand other income
Revenue from contracts with customers is recognized when or as the group satisfies a performance obligation by transferring control of a promised good or service to a customer. The transfer of control of oil, natural gas, natural gas liquids, LNG, petroleum and chemical products, and other items usually coincides with title passing to the customer and the customer taking physical possession. The group principally satisfies its performance obligations at a point in time; the amounts of revenue recognized relating to performance obligations satisfied over time are not significant.
When, or as, a performance obligation is satisfied, the group recognizes as revenue the amount of the transaction price that is allocated to that performance obligation. The transaction price is the amount of consideration to which the group expects to be entitled. The transaction price is allocated to the performance obligations in the contract based on standalone selling prices of the goods or services promised.
Contracts for the sale of commodities are typically priced by reference to quoted prices. Revenue from term commodity contracts is recognized based on the contractual pricing provisions for each delivery. Certain of these contracts have pricing terms based on prices at a point in time after delivery has been made. Revenue from such contracts is initially recognized based on relevant prices at the time of delivery and subsequently adjusted as appropriate. All revenue from these contracts, both that recognized at the time of delivery and that from post-delivery price adjustments, is disclosed as revenue from contracts with customers.
Certain forward contracts entered into by the group that result in physical delivery of products such as crude oil, natural gas and refined products are required by IFRS 9 to be accounted for as derivative financial instruments. The group's counterparties in these transactions may, however, meet the IFRS 15 definition of a customer. Revenue recognized relating to such contracts when physical delivery occurs is therefore, measured at the contractual transaction price plus the carrying amount of the related derivative at the date of settlement and presented together with revenue from contracts with customers.as other operating revenues. Changes in the fair value of derivative assets and liabilities prior to physical delivery are excluded from revenue from contracts with customers and arealso classified as other operating revenues. See also Impact of new International Financial Reporting StandardsOther significant accounting policy changes - Not yet adopted - IFRIC agenda decision on IFRS 9 'Financial instruments' below.
| | | | | | | | | | | | | | |
| 174 | | bp Annual Report and Form 20-F 2020 | | |
1.Significant accounting policies, judgements, estimates and assumptions– continued
Where forward sale and purchase contracts for oil, natural gas or power have been determined to be for short-term trading purposes, the associated sales and purchases are reported net within sales and other operating revenues whether or not physical delivery has occurred.
Physical exchanges with counterparties in the same line of business in order to facilitate sales to customers are reported net, as are sales and purchases made with a common counterparty, as part of an arrangement similar to a physical exchange.
Where the group acts as agent on behalf of a third party to procure or market energy commodities, any associated fee income is recognized but no purchase or sale is recorded.
Interest income is recognized as the interest accrues (using the effective interest rate, that is, the rate that exactly discounts estimated future cash receipts through the expected life of the financial instrument to the net carrying amount of the financial asset).
Dividend income from investments is recognized when the shareholders’ right to receive the payment is established.
Contract asset and contract liability balances are included within amounts presented for trade receivables and other payables respectively.
Finance costs
Finance costs directly attributable to the acquisition, construction or production of qualifying assets, which are assets that necessarily take a substantial period of time to get ready for their intended use, are added to the cost of those assets until such time as the assets are substantially ready for their intended use. All other finance costs are recognized in the income statement in the period in which they are incurred.
Updates to significant accounting policies
Impact of new International Financial Reporting Standards
BPbp adopted ‘Interest Rate Benchmark Reform – Phase I – Amendments to IFRS 16 ‘Leases’, which replaced IAS 17 ‘Leases’9 ‘Financial instruments’ and IFRIC 4 ‘Determining whether an arrangement contains a lease’,IFRS 7 ‘Financial instruments: Disclosures’’ with effect from 1 January 2019. 2020. There are no other new or amended standards or interpretations adopted during the year that have a significant impact on the consolidated financial statements.
IFRS 16 ‘Leases’'Interest Rate Benchmark Reform – Phase I’
IFRS 16 ‘Leases’ provides a new model for lessee accounting in which the majority of leases will be accounted for by the recognition on the balance sheet of a right-of-use asset and a lease liability. The subsequent amortization of the right-of-use asset and the interest expense related to the lease liability is recognized in profit or loss over the lease term.
BP elected to apply the modified retrospective transition approach in which the cumulative effect of initial application is recognized in opening retained earnings at the date of initial application with no restatement of comparative periods’ financial information. Comparative informationFinancial authorities in the group balance sheetUS, UK, EU and group cash flow statement has, however, been re-presentedother territories are currently undertaking reviews of key interest rate benchmarks such as the London Inter-bank Offered Rate (LIBOR) with a view to alignreplacing them with current year presentation, showing lease liabilitiesalternative benchmarks. Uncertainty around the method and lease liability payments as separate line items. These were previously included within finance debt and repaymentstiming of long-term financing line items respectively. Amounts presented in these line items for the comparative periods relatetransition from Inter-bank Offered Rates (IBORs) to leases accounted for as finance leases under IAS 17. We do not consider any of the judgements or estimates made on transition to IFRS 16 to be significant.
IFRS 16 introduces a revised definition of a lease. As permitted by the standard, BP elected not to reassess the existing population of leases under the new definition and only applies the new definition foralternative risk-free rates (RfRs) may impact the assessment of contracts entered into after the transition date. On transition the standard permitted, on a lease-by-lease basis, the right-of-use assetwhether hedge accounting can be applied to be measured either at an amount equalcertain hedging relationships.
This first phase of amendments to the lease liability (as adjusted for prepaid or accrued lease payments), or on a historical basis as if the standard had always applied. BP electedIFRS 9 provide temporary relief from applying specific hedge accounting requirements to use the historical asset measurement for its more material leases and used the asset equals liability approach for the remainder of the population. In measuring the right-of-use asset BP applied the transition practical expedient to exclude initial direct costs. BP also elected to adjust the carrying amounts of the right-of-use assets as at 1 January 2019 for onerous lease provisions that had been recognized on the group balance sheet as at 31 December 2018, rather than performing impairment tests on transition.hedging relationships directly affected by interest rate benchmark reforms.
The effect on the group’s balance sheet is set out further below. The presentation and timing of recognition of charges in the income statement has changed following the adoption of IFRS 16. The operating lease expense previously reported under IAS 17, typically on a straight-line basis, has been replaced by depreciation of the right-of-use asset and interest on the lease liability. In the cash flow statement payments are now presented as financing cash flows, representing repayments of principal, and as operating cash flows, representing payments of interest. Variable lease payments that do not depend on an index or rate are not included in the lease liability and will continue to be presented as operating cash flows. In prior years, operating lease payments were principally presented within cash flows from operating activities.
|
| | | |
170 | | BP Annual Report and Form 20-F 2019
| |
1.Significant accounting policies, judgements, estimates and assumptions– continued
The following table provides a reconciliation of the operating lease commitments as at 31 December 2018 to the total lease liability recognized on the group balance sheet in accordance with IFRS 16 as at 1 January 2019, with explanations below. |
| | | |
| | $ million |
|
| | |
Operating lease commitments at 31 December 2018 | | 11,979 |
|
| | |
Leases not yet commenced | | (1,372 | ) |
Leases below materiality threshold | | (86 | ) |
Short-term leases | | (91 | ) |
Effect of discounting | | (1,512 | ) |
Impact on leases in joint operations | | 836 |
|
Variable lease payments | | (58 | ) |
Redetermination of lease term | | (252 | ) |
Other | | (22 | ) |
Total additional lease liabilities recognized on adoption of IFRS 16 | | 9,422 |
|
Finance lease obligations at 31 December 2018 | | 667 |
|
Adjustment for finance leases in joint operations | | (189 | ) |
Total lease liabilities at 1 January 2019 | | 9,900 |
|
Leases not yet commenced: The operating lease commitments disclosed as at 31 December 2018 include amounts relating to leases entered into by the group that had not yet commenced as at 31 December 2018. In accordance with IFRS 16 assets and liabilities will not be recognized on the group balance sheet in relationtransition provisions, the amendments have been adopted retrospectively to these leases untilhedging relationships that existed at the dates of commencementstart of the leases. Commitments for leases not yet commenced as at 31 December 2019 are disclosed in note 28.current reporting period and have been applied to new hedging relationships designated after that date.
Short-term leases and leases below materiality threshold: As part ofThe reliefs have meant that the transition to IFRS 16, BP elected not to recognize assets and liabilities relating to short-term leases i.e. leases with a term of less than 12 months and also applied a materiality threshold for the recognition of assets and liabilities related to leases. The disclosed operating lease commitments as at 31 December 2018 include amounts related to such leases.
Effect of discounting: The amount of the lease liability recognized in accordance with IFRS 16 is on a discounted basis whereas the operating lease commitments information as at 31 December 2018 is presented on an undiscounted basis. The discount rates used on transition were incremental borrowing rates as appropriate for each lease based on factors such as the lessee legal entity, lease term and currency. The weighted average discount rate used on transition was around 3.5%, with a weighted average remaining lease term of around nine years. For new leases commencing after 1 January 2019 the discount rate used will beuncertainty over the interest rate implicitbenchmark reforms has not resulted in the lease, if this is readily determinable, or the incremental borrowingdiscontinuation of hedge accounting for any of bp’s fair value hedges.
See Note 29 Financial instruments and financial risk factors - interest rate if the implicit rate cannot be readily determined.risk and Note 30 Derivative financial instruments - Fair value hedges for further information.
Impact on leases in joint operations: The operating lease commitments for leases within joint operations as at 31 December 2018 were included on the basis of BP’s net working interest, irrespective of whether BP is the operator and whether the lease has been co-signed by the joint operators or not. However, for transition to IFRS 16, the facts and circumstances of each lease in a joint operation were assessed to determine the group’s rights and obligations and to recognize assets and liabilities on the group balance sheet accordingly. This relates mainly to leases of drilling rigs within joint operations in the Upstream segment. Where all parties to a joint operation jointly have the right to control the use of the identified asset and all parties have a legal obligation to make lease payments to the lessor, the group’s share of the right-of-use asset and its share of the lease liability will be recognized on the group balance sheet. This may arise in cases where the lease is signed by all parties to the joint operation. However, in cases where BP is the only party with the legal obligation to make lease payments to the lessor, the full lease liability will be recognized on the group balance sheet. This may be the case if for example BP, as operator of the joint operation, is the sole signatory to the lease. If, however, the underlying asset is jointly controlled by all parties to the joint operation BP will recognize its net share of the right-of-use asset on the group balance sheet along with a receivable representing the amounts to be recovered from the other parties. If BP is not legally obliged to make lease payments to the lessor but jointly controls the asset, the net share of the right-of-use asset will be recognized on the group balance sheet along with a payable representing amounts to be paid to the other parties.
Variable lease payments: Where there are lease payments that vary depending on an index or rate, the measurement of the operating lease commitments as at 31 December 2018 was based on the variable factor as at inception of the lease and was not updated to reflect subsequent changes in the variable factor. Such subsequent changes in the lease payments were treated as contingent rentals and charged to profit or loss as and when paid. Under IFRS 16 the lease liability is adjusted whenever the lease payments are changed in response to changes in the variable factor, and for transition the liability was measured on the basis of the prevailing variable factor on 1 January 2019.
Redetermination of lease term: Under the transition provisions of IFRS 16, the remaining terms of certain leases were redetermined with the benefit of hindsight, on the basis that BP was reasonably certain to exercise its option to terminate those leases before the full term.
Under IAS 17 finance leases were recognized on the group balance sheet and continue to be recognized in accordance with IFRS 16. The amounts recognized on the group balance sheet as at 1 January 2019 in relation to the right-of-use assets and liabilities for previous finance leases within joint operations are on a net or gross basis as appropriate as described above.
|
| | | |
| BP Annual Report and Form 20-F 2019
| | 171 |
1.Significant accounting policies, judgements, estimates and assumptions– continued
In addition to the lease liability, other line items on the group balance sheet adjusted on transition to IFRS 16 include property, plant and equipment for the right-of-use assets, lease related prepayments, receivables from joint operation partners, accruals, payables to operators of joint operations, onerous lease provisions and deferred tax balances, as set out below.
|
| | | | | | | |
| | | | | $ million |
|
| | | 31 December 2018 |
| 1 January 2019 |
| Adjustment on adoption of IFRS 16 |
|
| Non-current assets | | | | |
| Property, plant and equipment | | 135,261 |
| 143,950 |
| 8,689 |
|
| Trade and other receivables | | 1,834 |
| 2,159 |
| 325 |
|
| Prepayments | | 1,179 |
| 849 |
| (330 | ) |
| Deferred tax assets | | 3,706 |
| 3,736 |
| 30 |
|
| Current assets | | | | |
| Trade and other receivables | | 24,478 |
| 24,673 |
| 195 |
|
| Prepayments | | 963 |
| 872 |
| (91 | ) |
| Current liabilities | | | | |
| Trade and other payables | | 46,265 |
| 46,209 |
| (56 | ) |
| Accruals | | 4,626 |
| 4,578 |
| (48 | ) |
| Lease liabilities | | 44 |
| 2,196 |
| 2,152 |
|
| Finance debt | | 9,329 |
| 9,329 |
| — |
|
| Provisions | | 2,564 |
| 2,547 |
| (17 | ) |
| Non-current liabilities | | | | |
| Other payables | | 13,830 |
| 14,013 |
| 183 |
|
| Accruals | | 575 |
| 548 |
| (27 | ) |
| Lease liabilities | | 623 |
| 7,704 |
| 7,081 |
|
| Finance debt | | 55,803 |
| 55,803 |
| — |
|
| Deferred tax liabilities | | 9,812 |
| 9,767 |
| (45 | ) |
| Provisions | | 17,732 |
| 17,657 |
| (75 | ) |
| | | | | |
Net assetsa | | 101,548 |
| 101,218 |
| (330 | ) |
| | | | | |
| Equity | | | | |
| BP shareholders' equity | | 99,444 |
| 99,115 |
| (329 | ) |
| Non-controlling interests | | 2,104 |
| 2,103 |
| (1 | ) |
| | | 101,548 |
| 101,218 |
| (330 | ) |
a Net assets also includes the line items not affected by the transition to IFRS 16 that are not presented separately in the table
The total adjustments to the group's lease liabilities at 1 January 2019 are reconciled as follows:
|
| | | |
| | $ million |
|
| | |
Total additional lease liabilities recognized on adoption of IFRS 16 | | 9,422 |
|
Less: adjustment for finance leases in joint operations | | (189 | ) |
Total adjustment to lease liabilities | | 9,233 |
|
Of which – current | | 2,152 |
|
– non-current | | 7,081 |
|
new International Financial Reporting Standards - Not yet adopted
The following pronouncements from the IASB have not been adopted by the group in these financial statements as they will only become effective for future financial reporting periods. In addition, the group is voluntarily changing certain accounting policies from 1 January 2020 following an IFRIC agenda decision on IFRS 9 'Financial instruments'. There are no other standards, amendments or interpretations in issue but not yet adopted that the directors anticipate will have a material effect on the reported income or net assets of the group.
IFRS 17 ' Insurance Contracts'
IFRS 17 'Insurance Contracts' provides a new general model for accounting for contracts where the issuer accepts significant insurance risk from another party and agrees to compensate that party if a future uncertain event adversely affects them. IFRS 17 replaces IFRS 4 'Insurance Contracts' and will be effective for BPbp for the financial reporting period commencing 1 January 2022 subject to endorsement2023. The standard has not yet been endorsed by the UK and the EU. BP has commenced anbp's assessment of the impact of IFRS 17 is at an initial stage but it is not expected to have a significant effect on future financial reporting.
‘Interest Rate Benchmark Reform: Amendments to IFRS 9 'Financial instruments'Reform – Phase II’
Amendments to IFRS 9, IFRS 7, IFRS 4 and IFRS 16 ‘Leases’ were issued by the IASB in September 2019August 2020 to provide temporary reliefpractical expedients and reliefs in relation to modifications of financial instruments and leases that arise from applying specifictransition from IBORs to RFRs. Phase II also provides further reliefs to hedge accounting requirements to hedging relationships directly affected by interest rate benchmark reforms. The reliefs have the effect that the uncertainty over the interest rate benchmark reforms should not generally result in discontinuation of hedge accounting.requirements. These amendments were effective for bp from 1 January 2021. The amendments have been endorsed by the EU. BP will adopt the IFRS 9 amendments in the financial reporting period commencing 1 January 2020.
The reliefs providedUK and by the amendments would allow BP to assume that:EU.
thebp’s working group on interest rate benchmark component at initial designation of fair value hedgesreform is separately identifiable;monitoring and
managing the transition to alternative benchmark rates and is currently assessing the impact on contracts and arrangements that are linked to existing interest rate benchmarks for example, borrowings, leases and derivative contracts. bp is also participating on external committees and task forces dedicated to interest rate benchmark is not altered for the purposes of assessing the economic relationship between the hedged item and the hedging instrument for fair value hedges.reform.
The amendments are applicableOther changes to all of the group's fair value hedges disclosed in note 30.
|
| | | |
172 | | BP Annual Report and Form 20-F 2019
| |
1.Significantsignificant accounting policies judgements, estimates and assumptions– continued
IFRIC agenda decision on IFRS 9Physically settled derivative contracts
In March 2019, the IFRIC issued an agenda decision on the application of IFRS 9 to the physical settlement of contracts to buy or sell a non-financial item, such as commodities, that are not accounted for as 'own-use' contracts. The IFRIC concluded that such contracts are settled by the delivery or receipt of a non-financial item in exchange for both cash and the settlement of the derivative asset or liability. BP regularly
bp routinely enters into forwardtransactions for the sale and purchase contracts.of commodities that are physically settled and meet the definition of a derivative financial instrument. As described in the group's accounting policy for revenue in bp Annual Report and Form 20-F 2019, revenue recognized at the time such contracts arewere physically settled iswas measured at the contractual transaction price and iswas presented together with revenue from contracts with customers in thesethose financial statements. From 1 January 2020, however, the group has
| | | | | | | | | | | | | | |
| | bp Annual Report and Form 20-F 2020 | | 175 |
1.Significant accounting policies, judgements, estimates and assumptions– continued
bp changed its accounting policy for these contracts, in accordance with the conclusions included in the agenda decision. Purchasesdecision, with effect from 1 April 2020, as follows:
•Revenues and revenuespurchases from such contracts will beare measured at the contractual transaction price plus the carrying amount of the related derivative at the date of settlement. Furthermore, revenuesRealized derivative gains and losses on such salesphysically settled derivative contracts will no longer be presented together with the group's revenue from contracts with customers but will beare included in other revenues. This change will have a
•There is no significant effect on current period or comparative information for ‘Sales and other operating revenues’ and ‘Purchases’ as presented in the group's disclosuresgroup income statement, therefore no comparative information has been re-stated.
•There is no significant effect on net assets or on comparative information for ‘Profit before taxation’ or ‘Profit after taxation’ as presented in relationthe group income statement.
In addition, bp chose to revenuechange its presentation of revenues from physically settled derivative sales contracts with customers. For 2019, it is currently estimated that the amount of revenue measured at the contractual transaction pricefrom 1 January 2020. Revenues from physically settled derivative sales contracts are no longer presented together with revenue from contracts with customers incustomers. In these financial statements that would bethey are now presented as other revenues following application of this changerevenues. Comparative information in accounting policy is approximately $130 billion. Comparative informationNote 6 for revenue from contracts with customers (see Note 6) will be restated in BP's 2020 financial statements.and other revenues have been re-presented to align with the current period as set out below.
Gains | | | | | | | | | | | | | | | | | | | | | | | |
| | | | | | | $ million |
| | 2019 (previously reported) | 2019 (re-presented – see note 6) | Presentational adjustments | 2018 (previously reported) | 2018 (re-presented – see note 6) | Presentational adjustments |
| Crude oil | | 62,130 | | 9,141 | | 52,989 | | 65,276 | | 10,331 | | 54,945 | |
| Oil products | | 180,528 | | 102,408 | | 78,120 | | 195,466 | | 108,515 | | 86,951 | |
| Natural gas, LNG and NGLs | | 20,167 | | 18,909 | | 1,258 | | 21,745 | | 20,494 | | 1,251 | |
| Non-oil products and other revenues from contracts with customers | | 13,254 | | 12,169 | | 1,085 | | 13,768 | | 12,489 | | 1,279 | |
| Revenue from contracts with customers | | 276,079 | | 142,627 | | 133,452 | | 296,255 | | 151,829 | | 144,426 | |
| Other operating revenues | | 2,318 | | 135,770 | | (133,452) | | 2,501 | | 146,927 | | (144,426) | |
| Total sales and other operating revenues | | 278,397 | | 278,397 | | 0 | | 298,756 | | 298,756 | | 0 | |
Voluntary changes to significant accounting policies - not yet adopted
Net presentation of revenues and losses on these realizedpurchases relating to physically settled derivative contracts will also be includedfrom 1 January 2021
As described above, bp routinely enters into transactions for the sale and purchase of commodities that are physically settled and meet the definition of a derivative financial instrument. These contracts are within the scope of IFRS 9 and as such, prior to settlement, changes in the fair value of these derivative contracts are presented as gains and losses within other operating revenues. The group expects there to be no material effectcurrently presents revenues and purchases for such contracts on reported profit as presenteda gross basis in the group income statement upon physical settlement. These transactions have historically represented a substantial portion of the revenues and purchases reported in the group’s consolidated financial statements.
The change in strategic direction of the group supported by organisational changes to implement the strategy from 1 January 2021, results in the group determining that the revenue and corresponding purchases relating to such transactions should be presented net as gains or losses within other operating revenues. Additionally the group’s trading activity has continued to evolve over time from one of capturing third party physical trades to provide flow assurance to one with increasing levels of optimisation, taking advantage of price volatility and fluctuations in demand and supply, which will continue under the new strategy, further supporting the change in presentation. The new presentation provides reliable and more relevant information for users of the accounts as the group’s revenue recognition will be more closely aligned with its assessment of ‘Scope 3’ emissions from its products, its ‘Net Zero’ ambition and how management monitors and manages performance of such contracts. Comparative information for Sales and other operating revenues and purchases for 2019 and 2020 will be restated and will be presented under the new policy alongside group’s 2021 financial information.
Change in segmentation
During the first quarter of 2021, the group's reportable segments changed consistent with a change in the way that resources are allocated and performance is assessed by the chief operating decision maker, who for bp is the group chief executive, from that date. From the first quarter of 2021, the group's reportable are gas & low carbon energy, oil production & operations, customers & products, and Rosneft. At 31 December 2020, the group's reportable segments were Upstream, Downstream and Rosneft.
Gas & low carbon energy comprises regions with upstream businesses that predominantly produce natural gas, gas trading activities and the group's renewables businesses, including biofuels, solar and wind. Gas producing regions were previously in the Upstream segment. The group's renewables businesses were previously part of 'Other businesses and corporate'.
Oil production & operations comprises regions with upstream activities that predominantly produce crude oil. These activities were previously in the Upstream segment.
Customers & products comprises the group's convenience and mobility business, which manages the sale of fuels to wholesale and retail customers, convenience products, aviation fuels, and Castrol lubricants; and refining, supply and trading. The petrochemicals business will also be reported in restated comparative information as part of the customers and products segment up to its sale in December 2020. The customers & products segment is, therefore, substantially unchanged from the former Downstream segment with the exception of the Petrochemicals disposal.
The Rosneft segment is unchanged and continues to include equity-accounted earnings from the group's investment in Rosneft.
The segment measure of profit or loss continues to be replacement cost profit or loss before interest and tax, which reflects the replacement cost of supplies by excluding from profit or loss before interest and tax inventory holding gains and losses. See Note 5 for further information.
In the group's financial reporting for 2021, comparative information for 2019 and 2020 will be restated to reflect the changes in reportable segments. Reporting under the new segment structure will begin with the first quarter 2021 interim financial statements.
Segmental information presented in these financial statements is based on net assetsthe segment structure as a result of these changes.at 31 December 2020.
| | | | | | | | | | | | | | |
| 176 | | bp Annual Report and Form 20-F 2020 | | |
2. Non-current assets held for sale
The carrying amount of assets classified as held for sale at 31 December 20192020 is $1,326 million (2019 $7,465 million,million), with associated liabilities of $46 million (2019 $1,393 million. These principally relatemillion).
Upstream segment
The balance consists primarily of a 20% participating interest from bp’s 60% participating interest in Block 61 in Oman. As announced on 1 February 2021, bp has agreed to two material disposal transactions whichsell this interest to PTT Exploration and Production Public Company Limited of Thailand for a total consideration of up to $2.6 billion, subject to final adjustments. Under the terms of the agreement, bp will receive $2,450 million on completion, with up to an additional $140 million receivable contingent on pre-agreed future conditions. Subject to approvals, the transaction is expected to complete during 2021. Assets of $1,298 million and associated liabilities of $10 million have been classified as held for sale in the group balance sheet.sheet at 31 December 2020.
Transactions that have been classified as held for sale during 2020, but were completed by 31 December 2020, are described below.
Downstream segment
On 27 August 2019, BP29 June 2020 bp announced that it had agreed to sell allits global petrochemicals business to INEOS for a total consideration of $5 billion, subject to customary closing adjustments. The assets and liabilities of the business were classified as held for sale from that date until the disposal completed on 31 December 2020. Under the terms of the agreement, INEOS paid bp a deposit of $400 million and a further $3.6 billion on completion less $0.1 billion of third-party indebtedness remaining in petrochemicals on completion. The remaining $1 billion was received in February 2021. The business had interests in manufacturing plants in Asia, Europe and the US, including interests held in equity-accounted entities. See note 4 for further information.
Upstream segment
On 27 August 2019, bp announced that it had agreed to sell its Alaska operations and interests to Hilcorp Energy for up to $5.6 billion, subject to customary closing adjustments, of which $1.6 billion is contingent on future cash flows.adjustments. The sale will include BP’s entireincluded bp’s upstream and midstream business in the state, including BP Exploration (Alaska) Inc., which ownsowned all of BP’sbp’s upstream oil and gas interests in Alaska, and BP Pipelines (Alaska) Inc.’s 49% interest in the Trans Alaska Pipeline System (TAPS). These assets and associated liabilities were classified as held for sale in the 31 December 2019 group balance sheet. The disposal of BP will retainExploration (Alaska) Inc. completed on 30 June 2020. The disposal of TAPS completed on 18 December 2020.
bp received $800 million prior to or on completion of the disposals and has recognized a loan note with a principal amount of $2,100 million receivable from Hilcorp. The group has also recognized other assets totalling $1,722 million as at 31 December 2020, principally in relation to the ‘earn-out’ provisions of the agreement. See note 4 for information on impairment charges relating to the Alaska business.
bp retained decommissioning liability relating to the TAPS, which will be partially offset by a 30% cost reimbursement from Hilcorp. The deal, which is subject to governmental authorizations, is expected to complete during 2020. Assets of $6,518 million and associated liabilities of $969 million relating to this transaction are classified as held for sale at 31 December 2019.Hilcorp when incurred.
In November 2019, BPbp agreed to sell its interests in the San Juan basin in Colorado and New Mexico to IKAV.The deal is expected to complete during the first half of 2020. AssetsThese assets and associated liabilities relating to this transaction arewere classified as held for sale atin the 31 December 2019.2019 group balance sheet. The transaction completed on 28 February 2020.
The total assets and liabilities held for sale at 31 December 2020 and 2019, which are all in the Upstream segment, are set out in the table below.
| | | | | | | | | | | |
| | | $ million |
| | 2020 | 2019 |
| Property, plant and equipment | | 1,099 | | 6,359 | |
| Goodwill | | 199 | | 0 | |
| Intangible assets | | 0 | | 610 | |
| Investments in associates | | 0 | | 43 | |
| | | |
| Inventories | | 0 | | 318 | |
| | | |
| Trade and other receivables | | 28 | | 135 | |
| Assets classified as held for sale | | 1,326 | | 7,465 | |
| Trade and other payables | | (36) | | (33) | |
| Lease liabilities | | 0 | | (280) | |
| Provisions | | (10) | | (1,012) | |
| | | |
| Defined benefit pension plan and other post-retirement benefit plan deficits | | 0 | | (68) | |
| Liabilities directly associated with assets classified as held for sale | | (46) | | (1,393) | |
|
| | | |
| | $ million |
|
| | 2019 |
|
Property, plant and equipment | | 6,359 |
|
Intangible assets | | 610 |
|
Investments in associates | | 43 |
|
Inventories | | 318 |
|
Trade and other receivables | | 135 |
|
Assets classified as held for sale | | 7,465 |
|
Trade and other payables | | (33 | ) |
Lease liabilities | | (280 | ) |
Provisions | | (1,012 | ) |
Defined benefit pension plan and other post-retirement benefit plan deficits | | (68 | ) |
Liabilities directly associated with assets classified as held for sale | | (1,393 | ) |
|
| | | |
| BP Annual Report and Form 20-F 2019
| | 173 |
3.Business combinations and other significant transactions
Business combinations
2020
The group undertook a number of business combinations during 2020. The fair value of the net assets (including goodwill) and non-controlling interests recognized were $617 million and $574 million, respectively. These principally related to an acquisition in our US Fuels business.
2019
As agreed as part of the original transaction, $3,480 million was paid in 2019 in respect of the 2018 acquisition of Petrohawk Energy Corporation from BHP Billiton that is described below. Payments on this transaction are now complete.Billiton. A number of other individually insignificant business combinations were also undertaken by BPbp in 2019.
BP undertook a number of business combinations in 2018. For the full year, total consideration paid in cash amounted to $7,100 million, offset by cash acquired of $114 million.
On 31 October 2018, BP acquired from BHP Billiton Petroleum (North America) Inc. 100% of the issued share capital of Petrohawk Energy Corporation, a wholly-owned subsidiary of BHP that holds a portfolio of unconventional onshore US oil and gas assets.
The acquisition brings BP extensive oil and gas production and resources in the liquids-rich regions of the Permian and Eagle Ford basins in Texas and in the Haynesville gas basin in Texas and Louisiana.
The total consideration for the transaction, after customary closing adjustments and the effect of discounting deferred payments, was $10,302 million, which was all paid in cash.
The transaction was accounted for as a business combination using the acquisition method. The fair values of the identifiable assets and liabilities acquired, as at the date of acquisition, are shown in the table below. No goodwill was recognized on the acquisition and no significant adjustments were made to the provisional fair values of the identifiable assets and liabilities acquired when those values were finalized.
|
| | | |
| | $ million |
|
| | 2018 |
|
Assets | | |
Property, plant and equipment | | 10,845 |
|
Intangible assets | | 21 |
|
Inventories | | 27 |
|
Trade and other receivables | | 493 |
|
Cash | | 104 |
|
Liabilities | | |
Trade and other payables | | (659 | ) |
Provisions | | (323 | ) |
Non-controlling interest | | (206 | ) |
Total consideration | | 10,302 |
|
An analysis of the cash flows relating to the acquisition included within the cash flow statement for 2018 is provided below.
|
| | | |
| | $ million |
|
| | 2018 |
|
Transaction costs of the acquisition (included in cash flows from operating activities) | | 62 |
|
Interest on deferred payments (included in cash flows from operating activities) | | 21 |
|
Cash consideration paid, net of cash acquired (included in cash flows from investing activities) | | 6,684 |
|
Total net cash outflow for the acquisition | | 6,767 |
|
From the date of acquisition to 31 December 2018, the acquired activities generated revenues of $472 million and profit before tax of $49 million. If the business combination had taken place on 1 January 2018, it is estimated that the acquired activities would have generated revenues of $2,798 million and profit before tax of $431 million.
In addition to the BHP transaction described above, BP undertook a number of other individually insignificant business combinations in 2018.
Other significant transactions
On 18 December 2018, BP purchased an additional 16.5% interest in the Clair field in the North Sea, as part of the agreements with ConocoPhillips in which ConocoPhillips simultaneously purchased BP's entire 39.2% interest in the Greater Kuparuk Area on the North Slope of Alaska. The purchase gives BP a 45.1% interest in Clair in total. Gross payments made and received of $1,739 million and $1,490 million are included in Capital expenditure and Proceeds from disposals of businesses, net of cash acquired, respectively, in the group cash flow statement for 2018. Goodwill of $804 million, resulting from the recognition of a deferred tax liability as part of the transaction accounting, was recognized on the purchase of the interest in the Clair field.
|
| | | | | | | | | | | | | |
174 | | BPbp Annual Report and Form 20-F 2019
2020 | | 177 |
4. Disposals and impairment
The following amounts were recognized in the income statement in respect of disposals and impairments.
| | | | | | $ million |
| | | | $ million |
| | | 2019 |
| 2018 |
| 2017 |
| | | 2020 | 2019 | 2018 |
| Gains on sale of businesses and fixed assets | | | Gains on sale of businesses and fixed assets | | | |
| Upstream | | 143 |
| 437 |
| 526 |
| Upstream | | 360 | | 143 | | 437 | |
| Downstream | | 50 |
| 15 |
| 674 |
| Downstream | | 2,320 | | 50 | | 15 | |
| Other businesses and corporate | | — |
| 4 |
| 10 |
| Other businesses and corporate | | 194 | | 0 | | 4 | |
| | | 193 |
| 456 |
| 1,210 |
| | | 2,874 | | 193 | | 456 | |
| | | | | | |
| | | | $ million |
| | | | $ million |
| | | 2019 |
| 2018 |
| 2017 |
| | | 2020 | 2019 | 2018 |
| Losses on sale of businesses and fixed assets | | | |
| Losses on sale of businesses and fixed assets, and closures | | Losses on sale of businesses and fixed assets, and closures | | | |
| Upstream | | 415 |
| 707 |
| 127 |
| Upstream | | 383 | | 415 | | 707 | |
| Downstream | | 57 |
| 59 |
| 88 |
| Downstream | | 296 | | 57 | | 59 | |
| Other businesses and corporate | | 887 |
| 11 |
| — |
| Other businesses and corporate | | 2 | | 887 | | 11 | |
| | | 1,359 |
| 777 |
| 215 |
| | | 681 | | 1,359 | | 777 | |
| Impairment losses | | | Impairment losses | | | |
| Upstream | | 6,752 |
| 400 |
| 1,138 |
| Upstream | | 12,917 | | 6,752 | | 400 | |
| Downstream | | 65 |
| 12 |
| 69 |
| Downstream | | 840 | | 65 | | 12 | |
| Other businesses and corporate | | 30 |
| 254 |
| 32 |
| Other businesses and corporate | | 32 | | 30 | | 254 | |
| | | 6,847 |
| 666 |
| 1,239 |
| | | 13,789 | | 6,847 | | 666 | |
| Impairment reversals | | | Impairment reversals | | | |
| Upstream | | (131 | ) | (580 | ) | (176 | ) | Upstream | | (86) | | (131) | | (580) | |
| Downstream | | — |
| (2 | ) | (62 | ) | Downstream | | 0 | | 0 | | (2) | |
| Other businesses and corporate | | — |
| (1 | ) | — |
| Other businesses and corporate | | (3) | | 0 | | (1) | |
| | | (131 | ) | (583 | ) | (238 | ) | | | (89) | | (131) | | (583) | |
| Impairment and losses on sale of businesses and fixed assets | | 8,075 |
| 860 |
| 1,216 |
| |
| Impairment and losses on sale of businesses and fixed assets, and closures | | Impairment and losses on sale of businesses and fixed assets, and closures | | 14,381 | | 8,075 | | 860 | |
Disposals
Disposal proceeds and principal gains and losses on disposals by segment are described below.
| | | | | | | | | | | | | | |
| | | | $ million |
| | 2020 | 2019 | 2018 |
| Proceeds from disposals of fixed assets | | 491 | | 500 | | 940 | |
| Proceeds from disposals of businesses, net of cash disposed | | 4,989 | | 1,701 | | 1,911 | |
| | 5,480 | | 2,201 | | 2,851 | |
| By business | | | | |
| Upstream | | 1,175 | | 2,048 | | 2,145 | |
| Downstream | | 3,959 | | 152 | | 120 | |
| Other businesses and corporate | | 346 | | 1 | | 586 | |
| | 5,480 | | 2,201 | | 2,851 | |
|
| | | | | | | |
| | | | | $ million |
|
| | | 2019 |
| 2018 |
| 2017 |
|
| Proceeds from disposals of fixed assets | | 500 |
| 940 |
| 2,936 |
|
| Proceeds from disposals of businesses, net of cash disposed | | 1,701 |
| 1,911 |
| 478 |
|
| | | 2,201 |
| 2,851 |
| 3,414 |
|
| By business | | | | |
| Upstream | | 2,048 |
| 2,145 |
| 1,183 |
|
| Downstream | | 152 |
| 120 |
| 2,078 |
|
| Other businesses and corporate | | 1 |
| 586 |
| 153 |
|
| | | 2,201 |
| 2,851 |
| 3,414 |
|
Proceeds from disposals of business in 2020 includes $3,888 million in respect of the disposal of the Petrochemical business and $347 million in respect of the disposal of the Alaska business. At 31 December 2019,2020, deferred consideration relating to disposals amounted to $159$1,291 million receivable within one year (2018 $35(2019 $159 million and 2017 $2592018 $35 million) and $125$2,402 million receivable after one year (2018 $304(2019 $125 million and 2017 $2682018 $304 million). The deferred consideration principally relates to the disposals of our Petrochemical and Alaskan businesses. In addition, contingent consideration receivable relating to disposals amounted to $598$1,999 million at 31 December 2019 (2018 $8932020 (2019 $598 million and 2017 $2372018 $893 million)..The contingent consideration at 31 December 2020 relates to the disposal of our Alaskan business and prior period disposals in the North Sea. These amounts of contingent consideration are reported within Other investments on the group balance sheet - see Note 18 for further information.
Gains and losses on sale of businesses and fixed assets, and closures
Upstream
In 2020, gains principally resulted from adjustments to disposals in prior periods. Gains include $130 million from the disposal of our Alaska operations and interests and $166 million fair value movements in relation to deferred and contingent consideration in relation to the Alaska disposal and prior disposals in the North Sea. Losses included $134 million fair value movements in relation to deferred and contingent consideration arising from prior period disposals in the North Sea, $120 million in relation to the likely disposal of an exploration asset, and $78 million from the disposal of certain properties in the US.
In 2019, losses included $191 million fair value movements in relation to contingent consideration arising from the prior period disposal of the Bruce, Keith and Devenick assets and $171 million in relation to severance costs associated with the divestment of our Alaskan business.
In 2018, gains principally resulted from the disposal of interests in the Bruce, Keith and Rhum fields in the UK North Sea, from the disposal of certain properties in the US, and from adjustments to disposals in prior periods. Losses included $335 million resulting from the disposal of our interest in the Magnus field and associated assets in the UK North Sea, $221 million from the disposal of our interest in the Greater Kuparuk Area in the US, (see Note 3 for further information), and adjustments to disposals in prior periods.
| | | | | | | | | | | | | | |
| 178 | | bp Annual Report and Form 20-F 2020 | | |
4. Disposals and impairment – continued
Downstream
In 2017,2020, gains principally resulted from the disposal of a portion of our interest in the Perdido offshore hub in the US, and further gains associated with disposals in the UK.
Downstream
In 2017, gains principally resulted from$2.3 billion gain recognised on the disposal of our interestPetrochemicals business which completed in December 2020. Losses included $229 million in relation to cessation of manufacturing operations at the SECCO joint venture andKwinana Refinery following the disposal of certain midstream assets in Europe.
|
| | | |
| BP Annual Report and Form 20-F 2019
| | 175 |
4. Disposals and impairment– continueddecision to cease fuel production.
Other businesses and corporate
In 2020 the gain on disposal of businesses and fixed assets was principally in respect of the sale and leaseback of our St James's Square London headquarters - see Note 28 for further information.
In 2019 losses on disposal of businesses and fixed assets were principally in respect of the reclassification of accumulated foreign exchange losses from reserves to the income statement upon the contribution of our Brazilian biofuels business to a new 50:50 joint venture BP Bunge Bioenergia.
In 2018 proceeds from disposals were principally in respect of life insurance policies in the US and wind farms within our US wind business.
Summarized financial information relating to the sale of businesses is shown in the table below.
The principal transactions categorized as a business disposal in 2020 were the sales of our Petrochemical and Alaskan businesses. See Note 2 for further information.
The principal transaction categorized as a business disposal in 2019 was the sale of our interests in the Gulf of Suez oil concessions in Egypt.
The principal transaction categorized as a business disposal in 2018 was the disposal of our interest in the Greater Kuparuk Area in the US - see Note 3 for further information.US.
The principal transaction categorized as a business disposal in 2017 was the disposal of our interest in the Forties Pipeline System in the North Sea. | | | | | | | | | | | | | | | | | | | | | | | |
| | | | | | | $ million |
| | | | | | 2020 | 2019 | 2018 |
| | Alaska | Petrochemicals | Other | Total | | |
| Non-current assets | | 5,143 | | 2,592 | | 1,357 | | 9,092 | | 1,653 | | 3,274 | |
| Current assets | | 693 | | 846 | | 0 | | 1,539 | | 507 | | 173 | |
| Non-current liabilities | | (923) | | (178) | | (538) | | (1,639) | | (257) | | (250) | |
| Current liabilities | | (344) | | (425) | | (13) | | (782) | | (108) | | (97) | |
| Total carrying amount of net assets disposed | | 4,569 | | 2,835 | | 806 | | 8,210 | | 1,795 | | 3,100 | |
| Recycling of foreign exchange on disposal | | 0 | | (331) | | 3 | | (328) | | 880 | | 0 | |
| Costs on disposal | | (6) | | (25) | | 44 | | 13 | | 190 | | 3 | |
| | 4,563 | | 2,479 | | 853 | | 7,895 | | 2,865 | | 3,103 | |
| Gains (losses) on sale of businesses | | 260 | | 2,414 | | (104) | | 2,570 | | (1,190) | | (221) | |
| Total consideration | | 4,823 | | 4,893 | | 749 | | 10,465 | | 1,675 | | 2,882 | |
| Non-cash consideration | | (219) | | 0 | | 0 | | (219) | | (938) | | (282) | |
Consideration received (receivable)a | | (4,257) | | (1,005) | | 5 | | (5,257) | | 964 | | (689) | |
| | | | | | | |
| | | | | | | |
Proceeds from the sale of businesses, net of cash disposedb | | 347 | | 3,888 | | 754 | | 4,989 | | 1,701 | | 1,911 | |
|
| | | | | | | |
| | | | | $ million |
|
| | | 2019 |
| 2018 |
| 2017 |
|
| Non-current assets | | 1,653 |
| 3,274 |
| 735 |
|
| Current assets | | 507 |
| 173 |
| 57 |
|
| Non-current liabilities | | (257 | ) | (250 | ) | (173 | ) |
| Current liabilities | | (108 | ) | (97 | ) | (86 | ) |
| Total carrying amount of net assets disposed | | 1,795 |
| 3,100 |
| 533 |
|
| Recycling of foreign exchange on disposal | | 880 |
| — |
| — |
|
| Costs on disposal | | 190 |
| 3 |
| 3 |
|
| | | 2,865 |
| 3,103 |
| 536 |
|
| Gains (losses) on sale of businesses | | (1,190 | ) | (221 | ) | 44 |
|
| Total consideration | | 1,675 |
| 2,882 |
| 580 |
|
| Non-cash consideration | | (938 | ) | (282 | ) | (216 | ) |
Consideration received (receivable)a | | 964 |
| (689 | ) | 114 |
|
Proceeds from the sale of businesses, net of cash disposedb | | 1,701 |
| 1,911 |
| 478 |
|
a In 2019 $633 million relates to deposits received in advance of the disposal of our Alaska business and certain assets in our BPX businessbusiness.
b Proceeds are stated net of cash and cash equivalents disposed of $101 million (2019 $30 million (2018and 2018 $15 million and 2017 $25 million).
Impairments
Impairment losses and impairment reversals in each segment are described below. For information on significant estimates and judgements made in relation to impairments see Impairment of property, plant and equipment, intangibles and goodwill within Note 1. See also Note 12, and Note 15 for further information on impairments by asset category.
Upstream
Impairment losses and reversals in all years relate primarily to producing and midstream assets.
The 2020 impairment loss of $12,917 million primarily relates to losses incurred in respect of producing and development assets in the UK North Sea ($2,796 million), the US ($2,744 million), Trinidad ($2,416 million), Mauritania and Senegal ($1,909 million), India ($1,313 million) and Canada ($865 million). Impairment losses were primarily driven by a reduction in bp’s future oil and gas price assumptions and, to a lesser extent, certain technical reserves revisions. The recoverable amount of the impaired CGUs in total is $33,415 million.
The principal CGUs on which significant impairment losses were incurred in 2020 were $1,909 million for Tortue in Mauritania and Senegal; $1,313 million for KGD6 in India; $1,181 million for Schiehallion in the UK North Sea; $1,044 million for Mahogany in Trinidad, $960 million for Cassia in Trinidad; $1,011 million for Hawkville in BPX Energy; $747 million for ETAP in the UK North Sea and $742 million for Sunrise in Canada. The recoverable amount for each of these CGUs was their value in use, which in total was $13,200 million. In addition, impairment losses of $939 million were incurred relating to the disposal of bp’s business in Alaska. The recoverable amount of the Alaska business was its fair value less costs of disposal; see note 2 for further information.
The 2019 impairment losses of $6,752 million related to various assets, with the most significant charges arising in the US. Impairment losses arose primarily as a result of the decision to dispose of certain assets, including $4,703 million in relation to completed and expected disposals in BPX Energy and $1,264 million relating to the expected disposal of our Alaskan business; of these amounts $355 million primarily relates to impairment of associated goodwill.
The 2018 impairment losses of $400 million related to a number of different assets, with the most significant charges arising in Australia and the US. Impairment losses arose primarily as a result of changes to project activity, asset obsolescence and the decision to dispose of certain assets. The 2018 impairment reversals of $580 million related to a number of different assets, with the most significant reversals arising in the North Sea and Angola following a change to decommissioning cost estimates.
The 2017 impairment losses of $1,138 million related to a number of different assets, with the most significant charges arising in BPX Energy (previously known as the US Lower 48 business) and the North Sea. Impairment losses within Upstream arose primarily as a result of changes in reserves estimates and the decision to dispose of certain assets, including the Forties Pipeline System business.
The 2017 impairment reversals of $176 million related to a number of different assets, with the most significant reversals arising in the North Sea.
Downstream
Impairment losses totalling $840 million, $65 million, $12 million, and $69$12 million were recognized in 2020, 2019 and 2018 respectively. The amount for 2020 principally relates to portfolio changes in the fuels business, including the conversion of Kwinana refinery to an import terminal. None of the impairment charges were individually material.
| | | | | | | | | | | | | | |
| | bp Annual Report and Form 20-F 2020 | | 179 |
4. Disposals and 2017 respectively.impairment – continued
Other businesses and corporate
Impairment losses totalling $32 million, $30 million, $254 million, and $32$254 million were recognized in 2020, 2019 2018 and 20172018 respectively. The amount for 2018 is in respect of assets within our US wind business in advance of their disposal in December 2018.
|
| | | |
176 | | BP Annual Report and Form 20-F 2019
| |
5.Segmental analysis
The group’s organizational structure reflects the various activities in which BPbp is engaged. At 31 December 2019, BP2020, bp had three3 reportable segments: Upstream, Downstream and Rosneft.
Upstream’s activities include oil and natural gas exploration, field development and production; midstream transportation, storage and processing; and the marketing and trading of natural gas, including liquefied natural gas (LNG), together with power and natural gas liquids (NGLs).
Downstream’s activities include the refining, manufacturing, marketing, transportation, and supply and trading of crude oil, petroleum, petrochemicals products and related services to wholesale and retail customers.
BP’sbp’s interest in Rosneft is accounted for using the equity method and is reported as a separate operating segment, reflecting the way in which the investment is managed.
Other businesses and corporate comprises the biofuels and wind businesses, the group’s shipping and treasury functions, and corporate activities worldwide.
The accounting policies of the operating segments are the same as the group’s accounting policies described in Note 1. However, IFRS requires that the measure of profit or loss disclosed for each operating segment is the measure that is provided regularly to the chief operating decision maker for the purposes of performance assessment and resource allocation. For BP,bp, this measure of profit or loss is replacement cost profit or loss before interest and tax which reflects the replacement cost of supplies by excluding from profit or loss before interest and tax inventory holding gains and lossesa. Replacement cost profit or loss before interest and tax for the group is not a recognized measure under IFRS.
Sales between segments are made at prices that approximate market prices, taking into account the volumes involved. Segment revenues and segment results include transactions between business segments. These transactions and any unrealized profits and losses are eliminated on consolidation, unless unrealized losses provide evidence of an impairment of the asset transferred. Sales to external customers by region are based on the location of the group subsidiary which made the sale. The UK region includes the UK-based international activities of Downstream.
All surpluses and deficits recognized on the group balance sheet in respect of pension and other post-retirement benefit plans are allocated to Other businesses and corporate. However, the periodic expense relating to these plans is allocated to the operating segments based upon the business in which the employees work.
Certain financial information is provided separately for the US as this is an individually material country for BP,bp, and for the UK as this is BP’sbp’s country of domicile.
In February 2020, BPbp announced plans for a future reorganization of the group’s operating segments.organizational structure. The group’s current segmental reporting structure is expected to remainas described above remained in place throughout 2020 with any2020. Changes to this structure, as described in Note 1 - Voluntary changes comingto significant accounting policies - not yet adopted, came into effect from 1 January 2021.
| |
a
| Inventory holding gains and losses represent the difference between the cost of sales calculated using the replacement cost of inventory and the cost of sales calculated on the first-in first-out (FIFO) method after adjusting for any changes in provisions where the net realizable value of the inventory is lower than its cost. Under the FIFO method, which we use for IFRS reporting, the cost of inventory charged to the income statement is based on its historical cost of purchase or manufacture, rather than its replacement cost. In volatile energy markets, this can have a significant distorting effect on reported income. The amounts disclosed represent the difference between the charge to the income statement for inventory on a FIFO basis (after adjusting for any related movements in net realizable value provisions) and the charge that would have arisen based on the replacement cost of inventory. For this purpose, the replacement cost of inventory is calculated using data from each operation’s production and manufacturing system, either on a monthly basis, or separately for each transaction where the system allows this approach. The amounts disclosed are not separately reflected in the financial statements as a gain or loss. No adjustment is made in respect of the cost of inventories held as part of a trading position and certain other temporary inventory positions. |
a Inventory holding gains and losses represent the difference between the cost of sales calculated using the replacement cost of inventory and the cost of sales calculated on the first-in first-out (FIFO) method after adjusting for any changes in provisions where the net realizable value of the inventory is lower than its cost. Under the FIFO method, which we use for IFRS reporting, the cost of inventory charged to the income statement is based on its historical cost of purchase or manufacture, rather than its replacement cost. In volatile energy markets, this can have a significant distorting effect on reported income. The amounts disclosed represent the difference between the charge to the income statement for inventory on a FIFO basis (after adjusting for any related movements in net realizable value provisions) and the charge that would have arisen based on the replacement cost of inventory. For this purpose, the replacement cost of inventory is calculated using data from each operation’s production and manufacturing system, either on a monthly basis, or separately for each transaction where the system allows this approach. The amounts disclosed are not separately reflected in the financial statements as a gain or loss. No adjustment is made in respect of the cost of inventories held as part of a trading position and certain other temporary inventory positions.
|
| | | | | | | | | | | | | |
| 180 | BP
| bp Annual Report and Form 20-F 20192020 | | 177 |
5.Segmental analysis– continued
|
| | | | | | | | | | | | | |
| | | | | | | | $ million |
|
| | | | | | | | 2019 |
|
| By business | | Upstream |
| Downstream |
| Rosneft |
| Other businesses and corporate |
| Consolidation adjustment and eliminations |
| Total group |
|
| Segment revenues | | | | | | | |
| Sales and other operating revenues | | 54,501 |
| 250,897 |
| — |
| 1,788 |
| (28,789 | ) | 278,397 |
|
| Less: sales and other operating revenues between segments | | (27,034 | ) | (973 | ) | — |
| (782 | ) | 28,789 |
| — |
|
| Third party sales and other operating revenues | | 27,467 |
| 249,924 |
| — |
| 1,006 |
| — |
| 278,397 |
|
| Earnings from joint ventures and associates – after interest and tax | | 603 |
| 374 |
| 2,295 |
| (15 | ) | — |
| 3,257 |
|
| Segment results | | | | | | | |
| Replacement cost profit (loss) before interest and taxation | | 4,917 |
| 6,502 |
| 2,316 |
| (2,771 | ) | 75 |
| 11,039 |
|
Inventory holding gains (losses)a | | (8 | ) | 685 |
| (10 | ) | — |
| — |
| 667 |
|
| Profit (loss) before interest and taxation | | 4,909 |
| 7,187 |
| 2,306 |
| (2,771 | ) | 75 |
| 11,706 |
|
| | | | | | | | |
| Finance costs | | | | | | | (3,489 | ) |
| Net finance expense relating to pensions and other post-retirement benefits | | | | | | | (63 | ) |
| Profit before taxation | | | | | | | 8,154 |
|
| Other income statement items | | | | | | | |
| Depreciation, depletion and amortization | | | | | | | |
| US | | 4,672 |
| 1,335 |
| — |
| 55 |
| — |
| 6,062 |
|
| Non-US | | 9,560 |
| 1,586 |
| — |
| 572 |
| — |
| 11,718 |
|
| Charges for provisions, net of write-back of unused provisions, including change in discount rate | | 118 |
| 507 |
| — |
| 560 |
| — |
| 1,185 |
|
| Segment assets | | | | | | | |
| Investments in joint ventures and associates | | 12,196 |
| 3,609 |
| 12,927 |
| 1,593 |
| — |
| 30,325 |
|
Additions to non-current assetsb | | 16,254 |
| 4,014 |
| — |
| 2,345 |
| — |
| 22,613 |
|
| | |
a
|
See explanation of inventory holding gains and losses on page 177.Financial statements |
5.Segmental analysis– continued
| | | | | | | | | | | | | | | | | | | | | | | |
| | | | | | | $ million |
| | | | | | | | 2020 |
| By business | | Upstream | Downstream | Rosneft | Other
businesses
and
corporate | Consolidation adjustment and eliminations | Total
group |
| Segment revenues | | | | | | | |
| Sales and other operating revenues | | 34,197 | | 162,974 | | 0 | | 1,716 | | (18,521) | | 180,366 | |
| Less: sales and other operating revenues between segments | | (17,130) | | (158) | | 0 | | (1,233) | | 18,521 | | 0 | |
| Third party sales and other operating revenues | | 17,067 | | 162,816 | | 0 | | 483 | | 0 | | 180,366 | |
| Earnings from joint ventures and associates – after interest and tax | | (268) | | 214 | | (229) | | (120) | | 0 | | (403) | |
| Segment results | | | | | | | |
| Replacement cost profit (loss) before interest and taxation | | (21,547) | | 3,418 | | (149) | | (683) | | 89 | | (18,872) | |
Inventory holding gains (losses)a | | 17 | | (2,796) | | (89) | | 0 | | 0 | | (2,868) | |
| Profit (loss) before interest and taxation | | (21,530) | | 622 | | (238) | | (683) | | 89 | | (21,740) | |
| | | | | | | |
| Finance costs | | | | | | | (3,115) | |
| Net finance expense relating to pensions and other post-retirement benefits | | | | | | | (33) | |
| Profit before taxation | | | | | | | (24,888) | |
| Other income statement items | | | | | | | |
| Depreciation, depletion and amortization | | | | | | | |
| US | | 3,772 | | 1,359 | | 0 | | 63 | | 0 | | 5,194 | |
| Non-US | | 7,447 | | 1,631 | | 0 | | 617 | | 0 | | 9,695 | |
| Charges for provisions, net of write-back of unused provisions, including change in discount rate | | 56 | | 1,903 | | 0 | | 543 | | 0 | | 2,502 | |
| Segment assets | | | | | | | |
| Investments in joint ventures and associates | | 10,749 | | 3,671 | | 11,808 | | 1,109 | | 0 | | 27,337 | |
Additions to non-current assetsb | | 8,743 | | 5,359 | | 0 | | 655 | | 0 | | 14,757 | |
a See explanation of inventory holding gains and losses on page 180.
b Includes additions to property, plant and equipment; goodwill; intangible assets; investments in joint ventures; and investments in associates.
| | | | | | | | | | | | | | | | | | | | | | | |
| | | | | | | $ million |
| | | | | | | | 2019 |
| By business | | Upstream | Downstream | Rosneft | Other businesses and corporate | Consolidation adjustment and eliminations | Total
group |
| Segment revenues | | | | | | | |
| Sales and other operating revenues | | 54,501 | | 250,897 | | 0 | | 1,788 | | (28,789) | | 278,397 | |
| Less: sales and other operating revenues between segments | | (27,034) | | (973) | | 0 | | (782) | | 28,789 | | 0 | |
| Third party sales and other operating revenues | | 27,467 | | 249,924 | | 0 | | 1,006 | | 0 | | 278,397 | |
| Earnings from joint ventures and associates – after interest and tax | | 603 | | 374 | | 2,295 | | (15) | | 0 | | 3,257 | |
| Segment results | | | | | | | |
| Replacement cost profit (loss) before interest and taxation | | 4,917 | | 6,502 | | 2,316 | | (2,771) | | 75 | | 11,039 | |
Inventory holding gains (losses)a | | (8) | | 685 | | (10) | | 0 | | 0 | | 667 | |
| Profit (loss) before interest and taxation | | 4,909 | | 7,187 | | 2,306 | | (2,771) | | 75 | | 11,706 | |
| | | | | | | |
| Finance costs | | | | | | | (3,489) | |
| Net finance expense relating to pensions and other post-retirement benefits | | | | | | | (63) | |
| Profit before taxation | | | | | | | 8,154 | |
| Other income statement items | | | | | | | |
| Depreciation, depletion and amortization | | | | | | | |
| US | | 4,672 | | 1,335 | | 0 | | 55 | | 0 | | 6,062 | |
| Non-US | | 9,560 | | 1,586 | | 0 | | 572 | | 0 | | 11,718 | |
| Charges for provisions, net of write-back of unused provisions, including change in discount rate | | 118 | | 507 | | 0 | | 560 | | 0 | | 1,185 | |
| Segment assets | | | | | | | |
| Investments in joint ventures and associates | | 12,196 | | 3,609 | | 12,927 | | 1,593 | | 0 | | 30,325 | |
Additions to non-current assetsb | | 16,254 | | 4,014 | | 0 | | 2,345 | | 0 | | 22,613 | |
a See explanation of inventory holding gains and losses on page 180.
b Includes additions to property, plant and equipment; goodwill; intangible assets; investments in joint ventures; and investments in associates.
| | | | | | | | | | | | | | |
b
| Includes additions to property, plant | bp Annual Report and equipment; goodwill; intangible assets; investments in joint ventures; and investments in associates.Form 20-F 2020 | | 181 |
|
| | | | | | | | | | | | | |
| | | | | | | | $ million |
|
| | | | | | | | 2018 |
|
| By business | | Upstream |
| Downstream |
| Rosneft |
| Other businesses and corporate |
| Consolidation adjustment and eliminations |
| Total group |
|
| Segment revenues | | | | | | | |
| Sales and other operating revenues | | 56,399 |
| 270,689 |
| — |
| 1,678 |
| (30,010 | ) | 298,756 |
|
| Less: sales and other operating revenues between segments | | (28,565 | ) | (574 | ) | — |
| (871 | ) | 30,010 |
| — |
|
| Third party sales and other operating revenues | | 27,834 |
| 270,115 |
| — |
| 807 |
| — |
| 298,756 |
|
| Earnings from joint ventures and associates – after interest and tax | | 951 |
| 589 |
| 2,283 |
| (70 | ) | — |
| 3,753 |
|
| Segment results | | | | | | | |
| Replacement cost profit (loss) before interest and taxation | | 14,328 |
| 6,940 |
| 2,221 |
| (3,521 | ) | 211 |
| 20,179 |
|
Inventory holding gains (losses)a | | (6 | ) | (862 | ) | 67 |
| — |
| — |
| (801 | ) |
| Profit (loss) before interest and taxation | | 14,322 |
| 6,078 |
| 2,288 |
| (3,521 | ) | 211 |
| 19,378 |
|
| | | | | | | | |
| Finance costs | | | | | | | (2,528 | ) |
| Net finance expense relating to pensions and other post-retirement benefits | | | | | | | (127 | ) |
| Profit before taxation | | | | | | | 16,723 |
|
| Other income statement items | | | | | | | |
| Depreciation, depletion and amortization | | | | | | | |
| US | | 4,211 |
| 900 |
| — |
| 59 |
| — |
| 5,170 |
|
| Non-US | | 8,907 |
| 1,177 |
| — |
| 203 |
| — |
| 10,287 |
|
| Charges for provisions, net of write-back of unused provisions, including change in discount rate | | 355 |
| 834 |
| — |
| 1,557 |
| — |
| 2,746 |
|
| Segment assets | | | | | | | |
| Investments in joint ventures and associates | | 12,785 |
| 2,772 |
| 10,074 |
| 689 |
| — |
| 26,320 |
|
Additions to non-current assetsb c | | 24,266 |
| 3,609 |
| — |
| 477 |
| — |
| 28,352 |
|
| |
a
| See explanation of inventory holding gains and losses on page 177. |
| |
b
| Includes additions to property, plant and equipment; goodwill; intangible assets; investments in joint ventures; and investments in associates. |
| | | | | | | | | | | | | | | | | | | | | | | |
| | | | | | | $ million |
| | | | | | | | 2018 |
| By business | | Upstream | Downstream | Rosneft | Other businesses and corporate | Consolidation adjustment and eliminations | Total
group |
| Segment revenues | | | | | | | |
| Sales and other operating revenues | | 56,399 | | 270,689 | | 0 | | 1,678 | | (30,010) | | 298,756 | |
| Less: sales and other operating revenues between segments | | (28,565) | | (574) | | 0 | | (871) | | 30,010 | | 0 | |
| Third party sales and other operating revenues | | 27,834 | | 270,115 | | 0 | | 807 | | 0 | | 298,756 | |
| Earnings from joint ventures and associates – after interest and tax | | 951 | | 589 | | 2,283 | | (70) | | 0 | | 3,753 | |
| Segment results | | | | | | | |
| Replacement cost profit (loss) before interest and taxation | | 14,328 | | 6,940 | | 2,221 | | (3,521) | | 211 | | 20,179 | |
Inventory holding gains (losses)a | | (6) | | (862) | | 67 | | 0 | | 0 | | (801) | |
| Profit (loss) before interest and taxation | | 14,322 | | 6,078 | | 2,288 | | (3,521) | | 211 | | 19,378 | |
| | | | | | | |
| Finance costs | | | | | | | (2,528) | |
| Net finance expense relating to pensions and other post-retirement benefits | | | | | | | (127) | |
| Profit before taxation | | | | | | | 16,723 | |
| Other income statement items | | | | | | | |
| Depreciation, depletion and amortization | | | | | | | |
| US | | 4,211 | | 900 | | 0 | | 59 | | 0 | | 5,170 | |
| Non-US | | 8,907 | | 1,177 | | 0 | | 203 | | 0 | | 10,287 | |
| Charges for provisions, net of write-back of unused provisions, including change in discount rate | | 355 | | 834 | | 0 | | 1,557 | | 0 | | 2,746 | |
| Segment assets | | | | | | | |
| Investments in joint ventures and associates | | 12,785 | | 2,772 | | 10,074 | | 689 | | 0 | | 26,320 | |
Additions to non-current assetsb c | | 24,266 | | 3,609 | | 0 | | 477 | | 0 | | 28,352 | |
a See explanation of inventory holding gains and losses on page 180.
b Includes additions to property, plant and equipment; goodwill; intangible assets; investments in joint ventures; and investments in associates.
c Amounts have been restated to include acquisitionsacquisitions.
| | | | | | | | | | | | | | |
| | | | $ million |
| | | | | 2020 |
| By geographical area | | US | Non-US | Total |
| Revenues | | | | |
Third party sales and other operating revenuesa | | 55,611 | | 124,755 | | 180,366 | |
| Other income statement items | | | | |
| Production and similar taxes | | 57 | | 638 | | 695 | |
| | | | |
| | | | |
| Non-current assets | | | | |
Non-current assetsb c | | 52,493 | | 108,786 | | 161,279 | |
a Non-US region includes UK $42,729 million
b Non-US region includes UK $19,583 million
c Includes property, plant and equipment; goodwill; intangible assets; investments in joint ventures; investments in associates; and non-current prepayments.
| | | | | | | | | | | | | | |
| | | | $ million |
| | | | | 2019 |
| By geographical area | | US | Non-US | Total |
| Revenues | | | | |
Third party sales and other operating revenuesa | | 89,334 | | 189,063 | | 278,397 | |
| Other income statement items | | | | |
| Production and similar taxes | | 315 | | 1,232 | | 1,547 | |
| | | | |
| | | | |
| Non-current assets | | | | |
Non-current assetsb c | | 57,757 | | 133,398 | | 191,155 | |
a Non-US region includes UK $63,194 million.
b Non-US region includes UK $22,881 million.
c Includes property, plant and equipment; goodwill; intangible assets; investments in joint ventures; investments in associates; and non-current prepayments.
|
| | | | | | | | | | | | | |
178182 | | BPbp Annual Report and Form 20-F 2019
2020 | | |
5.Segmental analysis– continued
|
| | | | | | | | | | | | | |
| | | | | | | | $ million |
|
| | | | | | | | 2017 |
|
| By business | | Upstream |
| Downstream |
| Rosneft |
| Other businesses and corporate |
| Consolidation adjustment and eliminations |
| Total group |
|
| Segment revenues | | | | | | | |
| Sales and other operating revenues | | 45,440 |
| 219,853 |
| — |
| 1,469 |
| (26,554 | ) | 240,208 |
|
| Less: sales and other operating revenues between segments | | (24,179 | ) | (1,800 | ) | — |
| (575 | ) | 26,554 |
| — |
|
| Third party sales and other operating revenues | | 21,261 |
| 218,053 |
| — |
| 894 |
| — |
| 240,208 |
|
| Earnings from joint ventures and associates – after interest and tax | | 930 |
| 674 |
| 922 |
| (19 | ) | — |
| 2,507 |
|
| Segment results | | | | | | | |
| Replacement cost profit (loss) before interest and taxation | | 5,221 |
| 7,221 |
| 836 |
| (4,445 | ) | (212 | ) | 8,621 |
|
Inventory holding gains (losses)a | | 8 |
| 758 |
| 87 |
| — |
| — |
| 853 |
|
| Profit (loss) before interest and taxation | | 5,229 |
| 7,979 |
| 923 |
| (4,445 | ) | (212 | ) | 9,474 |
|
| | | | | | | | |
| Finance costs | | | | | | | (2,074 | ) |
| Net finance expense relating to pensions and other post-retirement benefits | | | | | | | (220 | ) |
| Profit before taxation | | | | | | | 7,180 |
|
| Other income statement items | | | | | | | |
| Depreciation, depletion and amortization | | | | | | | |
| US | | 4,631 |
| 875 |
| — |
| 65 |
| — |
| 5,571 |
|
| Non-US | | 8,637 |
| 1,141 |
| — |
| 235 |
| — |
| 10,013 |
|
| Charges for provisions, net of write-back of unused provisions, including change in discount rate | | 220 |
| 304 |
| — |
| 2,902 |
| — |
| 3,426 |
|
| |
a
| See explanation of inventory holding gains and losses on page 177. |
|
| | | | | | | |
| | | | | $ million |
|
| | | | | 2019 |
|
| By geographical area | | US |
| Non-US |
| Total |
|
| Revenues | | | | |
Third party sales and other operating revenuesa | | 89,334 |
| 189,063 |
| 278,397 |
|
| Other income statement items | | | | |
| Production and similar taxes | | 315 |
| 1,232 |
| 1,547 |
|
| Non-current assets | | | | |
Non-current assetsb c | | 57,757 |
| 133,398 |
| 191,155 |
|
| |
a
| Non-US region includes UK $63,194 million
|
| |
b
| Non-US region includes UK $22,881 million |
| |
c
| Includes property, plant and equipment; goodwill; intangible assets; investments in joint ventures; investments in associates; and non-current prepayments. |
|
| | | | | | | |
| | | | | $ million |
|
| | | | | 2018 |
|
| By geographical area | | US |
| Non-US |
| Total |
|
| Revenues | | | | |
Third party sales and other operating revenuesa | | 98,066 |
| 200,690 |
| 298,756 |
|
| Other income statement items | | | | |
| Production and similar taxes | | 369 |
| 1,167 |
| 1,536 |
|
| Non-current assets | | | | |
Non-current assetsb c | | 68,188 |
| 124,060 |
| 192,248 |
|
| |
a
| Non-US region includes UK $65,630 million. |
| |
b
| Non-US region includes UK $19,426 million. |
| |
c
| Includes property, plant and equipment; goodwill; intangible assets; investments in joint ventures; investments in associates; and non-current prepayments. |
|
| | | |
|
BP Annual Report and Form 20-F 2019
| | 179Financial statements |
5.Segmental analysis– continued
| | | | | | | | | | | | | | |
| | | | $ million |
| | | | | 2018 |
| By geographical area | | US | Non-US | Total |
| Revenues | | | | |
Third party sales and other operating revenuesa | | 98,066 | | 200,690 | | 298,756 | |
| Other income statement items | | | | |
| Production and similar taxes | | 369 | | 1,167 | | 1,536 | |
| Non-current assets | | | | |
Non-current assetsb c | | 68,188 | | 124,060 | | 192,248 | |
a Non-US region includes UK $65,630 million.
b Non-US region includes UK $19,426 million.
c Includes property, plant and equipment; goodwill; intangible assets; investments in joint ventures; investments in associates; and non-current prepayments.
|
| | | | | | | |
| | | | | $ million |
|
| | | | | 2017 |
|
| By geographical area | | US |
| Non-US |
| Total |
|
| Revenues | | | | |
Third party sales and other operating revenuesa | | 83,269 |
| 156,939 |
| 240,208 |
|
| Other income statement items | | | | |
| Production and similar taxes | | 52 |
| 1,723 |
| 1,775 |
|
| |
a
| Non-US region includes UK $48,837 million. |
6. Revenue from contracts with customers
The amounts shown in the table below are included in Sales and other operating revenues in the group income statement.
| | | | | | | | | | | | | | |
| | | | $ million |
| | 2020 | 2019 | 2018 |
| Crude oil | | 5,048 | | 9,141 | | 10,331 | |
| Oil products | | 63,564 | | 102,408 | | 108,515 | |
| Natural gas, LNG and NGLs | | 12,726 | | 18,909 | | 20,494 | |
| Non-oil products and other revenues from contracts with customers | | 9,840 | | 12,169 | | 12,489 | |
| Revenue from contracts with customers | | 91,178 | | 142,627 | | 151,829 | |
Other operating revenuesa | | 89,188 | | 135,770 | | 146,927 | |
| Total sales and other operating revenues | | 180,366 | | 278,397 | | 298,756 | |
a Principally relates to physically settled derivative sales contracts.
An analysis of totalthird-party sales and other operating revenues by segment and region is provided in Note 5.
Revenue from contracts with customers, by product
|
| | | | | | | |
| | | | | $ million |
|
| | | 2019 |
| 2018 |
| 2017 |
|
| Crude oil | | 62,130 |
| 65,276 |
| 49,670 |
|
| Oil products | | 180,528 |
| 195,466 |
| 159,821 |
|
| Natural gas, LNG and NGLs | | 20,167 |
| 21,745 |
| 16,196 |
|
| Non-oil products and other revenues from contracts with customers | | 13,254 |
| 13,768 |
| 12,538 |
|
| Revenues from contracts with customers | | 276,079 |
| 296,255 |
| 238,225 |
|
The group’s sales to customers of crude oil and oil products were substantially all made by the Downstream segment. The group’s sales to customers of natural gas, LNG and NGLs were made by the Upstream segment. A significant majority of the group’s sales of non-oil products and other revenues from contracts with customers were made by the Downstream segment.
See Note 1 - impact of new International Financial Reporting Standards - Not yet adopted - IFRIC agenda decision on IFRS 9 'Financial instruments'Amounts shown for further information on changes to the presentation of revenue from contracts with customers that will apply fromand other operating revenues for 2018 and 2019 have been represented to align with the current period. See Note 1 January 2020.- Other changes to significant accounting policies - Physically settled derivative contracts for further information.
7.Income statement analysis
| | | | | | | | | | | | | | |
| | | | $ million |
| | 2020 | 2019 | 2018 |
| Interest and other income | | | | |
| Interest income from | | | | |
| Financial assets measured at amortized cost | | 215 | | 371 | | 421 | |
| Financial assets measured at fair value through profit or loss | | 25 | | 49 | | 39 | |
| Other income | | 423 | | 349 | | 313 | |
| | 663 | | 769 | | 773 | |
Currency exchange losses charged to the income statementa | | 38 | | 37 | | 368 | |
| Expenditure on research and development | | 332 | | 364 | | 429 | |
Costs relating to the Gulf of Mexico oil spill (pre-interest and tax)b | | 255 | | 319 | | 714 | |
| Finance costs | | | | |
Interest expense on lease liabilitiesc | | 337 | | 379 | | 51 | |
Interest expense on other liabilities measured at amortized costd | | 2,166 | | 2,410 | | 2,147 | |
Capitalized at 2.75% (2019 3.50% and 2018 3.56%)e | | (345) | | (374) | | (419) | |
Unwinding of discount on provisionsf | | 437 | | 505 | | 210 | |
| Unwinding of discount on other payables measured at amortized cost | | 520 | | 569 | | 539 | |
| | 3,115 | | 3,489 | | 2,528 | |
|
| | | | | | | |
| | | | | $ million |
|
| | | 2019 |
| 2018 |
| 2017 |
|
| Interest and other income | | | | |
| Interest income from | | | | |
| Financial assets measured at amortized cost | | 371 |
| 421 |
| 288 |
|
| Financial assets measured at fair value through profit or loss | | 49 |
| 39 |
| — |
|
| Other income | | 349 |
| 313 |
| 369 |
|
| | | 769 |
| 773 |
| 657 |
|
Currency exchange losses charged to the income statementa | | 37 |
| 368 |
| 83 |
|
| Expenditure on research and development | | 364 |
| 429 |
| 391 |
|
Costs relating to the Gulf of Mexico oil spill (pre-interest and tax)b | | 319 |
| 714 |
| 2,687 |
|
| Finance costs | | | | |
Interest payable on lease liabilitiesc | | 379 |
| 51 |
| 56 |
|
| Interest payable on other liabilities measured at amortized cost | | 2,410 |
| 2,147 |
| 1,662 |
|
Capitalized at 3.50% (2018 3.56% and 2017 2.25%)d | | (374 | ) | (419 | ) | (297 | ) |
Unwinding of discount on provisionse | | 505 |
| 210 |
| 150 |
|
| Unwinding of discount on other payables measured at amortized cost | | 569 |
| 539 |
| 503 |
|
| | | 3,489 |
| 2,528 |
| 2,074 |
|
| |
a
| Excludes exchange gains and losses arising on financial instruments measured at fair value through profit or loss. |
| |
b
| Included within production and manufacturing expenses. |
| |
c
| Interest payable on lease liabilities in comparative periods relate to leases previously classified as finance leases under IAS 17. |
| |
d
| Tax relief on capitalized interest is approximately $51 million (2018 $55 million and 2017 $64 million). |
b Included within production and manufacturing expenses.
c Interest payable on lease liabilities in 2018 comparative period relates to leases previously classified as finance leases under IAS 17.
d 2020 includes a loss of $158 million associated with the buyback of finance debt.
e Tax relief on capitalized interest is approximately $83 million (2019 $51 million and 2018 $55 million).
f From1 July 2018, the group changed its method of discounting and unwinding provisions from using real rates to using nominal rates.
|
| | | | | | | | | | | | | |
180 | | BPbp Annual Report and Form 20-F 2019
2020 | | 183 |
8. Exploration for and evaluation of oil and natural gas resources
The following financial information represents the amounts included within the group totals relating to activity associated with the exploration for and evaluation of oil and natural gas resources. All such activity is recorded within the Upstream segment.
For information on significant judgements made in relation to oil and natural gas accounting see Intangible assets in Note 1.
| | | | | | | | | | | | | | |
| | | | $ million |
| | 2020 | 2019 | 2018 |
| Exploration and evaluation costs | | | | |
Exploration expenditure written offa | | 9,920 | | 631 | | 1,085 | |
| Other exploration costs | | 360 | | 333 | | 360 | |
| Exploration expense for the year | | 10,280 | | 964 | | 1,445 | |
| Impairment losses | | 156 | | 2 | | 137 | |
Intangible assets – exploration and appraisal expenditureb c | | 4,113 | | 14,091 | | 15,989 | |
| Liabilities | | 71 | | 73 | | 60 | |
| Net assets | | 4,042 | | 14,018 | | 15,929 | |
| Cash used in operating activities | | 360 | | 333 | | 360 | |
| Cash used in investing activities | | 674 | | 1,215 | | 1,119 | |
|
| | | | | | | |
| | | | | $ million |
|
| | | 2019 |
| 2018 |
| 2017 |
|
| Exploration and evaluation costs | | | | |
Exploration expenditure written offa | | 631 |
| 1,085 |
| 1,603 |
|
| Other exploration costs | | 333 |
| 360 |
| 477 |
|
| Exploration expense for the year | | 964 |
| 1,445 |
| 2,080 |
|
| Impairment losses | | 2 |
| 137 |
| — |
|
Intangible assets – exploration and appraisal expenditureb | | 14,091 |
| 15,989 |
| 17,026 |
|
| Liabilities | | 73 |
| 60 |
| 82 |
|
| Net assets | | 14,018 |
| 15,929 |
| 16,944 |
|
| Cash used in operating activities | | 333 |
| 360 |
| 477 |
|
| Cash used in investing activities | | 1,215 |
| 1,119 |
| 1,901 |
|
a 2020 includes $2,643 million in the Gulf of Mexico primarily relating to the Paleogene assets, $2,539 million in Canada primarily relating to Terre de Grace, $2,141 million in Brazil, $952 million in Egypt and $832 million in Angola. 2018 includesincluded $447 million in the deepwater Gulf of Mexico principally relating to licence expiries. 2017 included write-offs in Angola of $574 million in relation to licence relinquishment and Egypt of $208 million following a determination that no commercial hydrocarbons had been found. 2017 also included a $145-million write-off in relation to the value ascribed to certain licences in the deepwater Gulf of Mexico as part of the accounting for the acquisition of upstream assets from Devon Energy in 2011. For further information see Upstream – Exploration on page 53..
b 2019 includes approximately $2.5 billion relating to Canadian oil sands. See Note 1 for further information.
The carrying amount, by location, of exploration and appraisal expenditurec Amount capitalized as intangible assets at 31 December 20192020 relates to assets in various regions. The largest of these is shown$0.7 billion capitalised in the table below.Middle East region.
|
| | |
Carrying amount | | Location |
$1 - 2 billion | | Angola; Egypt; Middle East |
$2 - 3 billion | | US - Gulf of Mexico; Canada; Brazil |
9. Taxation
Tax on profit
| | | | | | | | | | | | | | |
| | | | $ million |
| | | 2020 | 2019 | 2018 |
| Current tax | | | | |
| Charge for the year | | 2,095 | | 5,316 | | 6,217 | |
Adjustment in respect of prior yearsa | | 50 | | (68) | | (221) | |
| | 2,145 | | 5,248 | | 5,996 | |
Deferred taxb | | | | |
| Origination and reversal of temporary differences in the current year | | (7,826) | | (1,190) | | 907 | |
| Adjustment in respect of prior years | | 1,522 | | (94) | | 242 | |
| | (6,304) | | (1,284) | | 1,149 | |
| Tax charge (credit) on profit or loss | | (4,159) | | 3,964 | | 7,145 | |
|
| | | | | | | |
| | | | | $ million |
|
| | | 2019 |
| 2018 |
| 2017 |
|
| Current tax | | | | |
| Charge for the year | | 5,316 |
| 6,217 |
| 4,208 |
|
Adjustment in respect of prior yearsa | | (68 | ) | (221 | ) | 58 |
|
| | | 5,248 |
| 5,996 |
| 4,266 |
|
Deferred taxb | | | | |
| Origination and reversal of temporary differences in the current year | | (1,190 | ) | 907 |
| (503 | ) |
| Adjustment in respect of prior years | | (94 | ) | 242 |
| (51 | ) |
| | | (1,284 | ) | 1,149 |
| (554 | ) |
| Tax charge on profit | | 3,964 |
| 7,145 |
| 3,712 |
|
| |
ab Origination and reversal of temporary differences in the current year include the impact of tax rate changes on deferred tax balances. The adjustments in respect of prior years reflect the reassessment of deferred tax balances for prior periods in light of all other changes in facts and circumstances during the year; 2020 includes charges for the reassessment of deferred tax asset recognition in light of revisions to price assumptions. | The adjustments in respect of prior years reflect the reassessment of the current tax balances for prior years in light of changes in facts and circumstances during the year. |
| |
b
| Origination and reversal of temporary differences in the current year include the impact of tax rate changes on deferred tax balances. 2018 includes a credit of $121 million (2017 $859 million charge) in respect of the reduction in the US federal corporate income tax rate from 35% to 21%, effective from 1 January 2018. The adjustments in respect of prior years reflect the reassessment of deferred tax balances for prior periods in light of all other changes in facts and circumstances during the year. |
In 2019,2020, the total tax charge recognized within other comprehensive income was $227$39 million (2018 $714(2019 $227 million charge and 2017 $1,4992018 $714 million charge), primarily comprising the deferred tax impact of the remeasurements of the net pension and other post-retirement benefit liability or asset. See Note 32 for further information.
The total tax charge recognized directly in equity was $37$154 million (2018 $17(2019 $37 million charge and 2017 $2632018 $17 million charge). 2020 principally relates to a non-controlling interest transaction entered into by Rosneft.
Reconciliation of the effective tax rate
The following table provides a reconciliation of the group weighted average statutory corporate income tax rate to the effective tax rate of the group on profit or loss before taxation.
|
| | | | | | | | | | | | | |
| 184 | BP
| bp Annual Report and Form 20-F 20192020 | | 181 |
9. Taxation – continued
|
| | | | | | | |
| | | | | $ million |
|
| | | 2019 |
| 2018 |
| 2017 |
|
| Profit before taxation | | 8,154 |
| 16,723 |
| 7,180 |
|
| Tax charge on profit | | 3,964 |
| 7,145 |
| 3,712 |
|
| Effective tax rate | | 49% | 43% | 52% |
| | | | | |
| | | | |
Tax rate computed at the weighted average statutory ratea | | 52 |
| 43 |
| 44 |
|
| Increase (decrease) resulting from | | | | |
| Tax reported in equity-accounted entities | | (7 | ) | (5 | ) | (7 | ) |
Deferred tax not recognizedb | | (2 | ) | 1 |
| 6 |
|
| Tax incentives for investment | | (3 | ) | (2 | ) | (6 | ) |
| Foreign exchange | | 1 |
| 3 |
| (4 | ) |
| Items not deductible for tax purposes | | 4 |
| 1 |
| 5 |
|
Impact of US tax reformc | | — |
| (1 | ) | 12 |
|
Otherb | | 4 |
| 3 |
| 2 |
|
| Effective tax rate | | 49 |
| 43 |
| 52 |
|
| |
a
| Calculated based on the statutory corporate income tax rate applicable in the countries in which the group operates, weighted by the profits and losses before tax in the respective countries. |
| |
b
| A minor amendment has been made to 2017 and 2018 to align with current period presentation. |
| |
c
| Relates to the deferred tax impact of the reduction in the US federal corporate income tax rate from 35% to 21%, effective from 1 January 2018. |
Deferred tax
|
| | | | | |
| | | | $ million |
|
| Analysis of movements during the year in the net deferred tax liability | | 2019 |
| 2018 |
|
| At 31 December | | 6,106 |
| 3,513 |
|
Adjustment on adoption of IFRS 9a | | — |
| (36 | ) |
Adjustment on adoption of IFRS 16b | | (75 | ) | — |
|
| At 1 January | | 6,031 |
| 3,477 |
|
| Exchange adjustments | | 72 |
| (68 | ) |
| Charge (credit) for the year in the income statement | | (1,284 | ) | 1,149 |
|
| Charge for the year in other comprehensive income | | 233 |
| 734 |
|
| Charge for the year in equity | | 37 |
| 17 |
|
Acquisitions, disposals and other additionsc | | 101 |
| 797 |
|
| At 31 December | | 5,190 |
| 6,106 |
|
a 2018 reflects the deferred tax impact of adjustments recorded by the group on adoption of IFRS 9. See BP Annual Report and Form 20-F 2018 - Financial statements - Note 1 for further information.
b 2019 reflects the deferred tax impact of adjustments recorded by the group on adoption of IFRS 16. See Note 1 for further information.
c 2018 relates primarily to the purchase of an additional 16.5% interest in the Clair field. See Note 3 - Other significant transactions for further information.
|
| | | |
182 |
| BP Annual Report and Form 20-F 2019
| Financial statements |
9. Taxation – continued
| | | | | | | | | | | | | | |
| | | | $ million |
| | 2020 | 2019 | 2018 |
| Profit (loss) before taxation | | (24,888) | | 8,154 | | 16,723 | |
| Tax charge (credit) on profit or loss | | (4,159) | | 3,964 | | 7,145 | |
| Effective tax rate | | 17% | 49% | 43% |
| | | | |
| | | | % |
Tax rate computed at the weighted average statutory ratea | | 31 | | 52 | | 43 | |
| Increase (decrease) resulting from | | | | |
| Tax reported in equity-accounted entities | | 0 | | (7) | | (5) | |
| Adjustments in respect of prior years | | (6) | | (2) | | 0 | |
| Deferred tax not recognized | | (3) | | (2) | | 1 | |
| Tax incentives for investment | | 1 | | (3) | | (2) | |
| | | | |
| | | | |
| Foreign exchange | | (1) | | 1 | | 3 | |
| Items not deductible for tax purposes | | (3) | | 4 | | 1 | |
| | | | |
| | | | |
| Other | | (2) | | 6 | | 2 | |
| Effective tax rate | | 17 | | 49 | | 43 | |
a Calculated based on the statutory corporate income tax rate applicable in the countries in which the group operates, weighted by the profits and losses before tax in the respective countries.
Deferred tax
| | | | | | | | | | | |
| | | $ million |
| Analysis of movements during the year in the net deferred tax (asset) liability | | 2020 | 2019 |
| At 31 December | | 5,190 | | 6,106 | |
| | | |
| Adjustment on adoption of IFRS 16 | | 0 | | (75) | |
| At 1 January | | 5,190 | | 6,031 | |
| Exchange adjustments | | 55 | | 72 | |
| Credit for the year in the income statement | | (6,304) | | (1,284) | |
| Charge for the year in other comprehensive income | | 48 | | 233 | |
| Charge for the year in equity | | 154 | | 37 | |
| Acquisitions and disposals | | (56) | | 101 | |
| At 31 December | | (913) | | 5,190 | |
The following table provides an analysis of deferred tax in the income statement and the balance sheet by category of temporary difference:
| | | | | | | | | | | | | | | | | | | | |
| | | | | | $ million |
| | | Income statementa | | Balance sheet |
| | | 2020 | 2019 | 2018 | 2020 | 2019 |
| Deferred tax liability | | | | | | |
| Depreciation | | (7,295) | | (1,436) | | (1,297) | | 15,361 | | 22,627 | |
| Pension plan surpluses | | 69 | | (31) | | 65 | | 2,691 | | 2,290 | |
| Derivative financial instruments | | 33 | | 29 | | (36) | | 63 | | 29 | |
| Other taxable temporary differences | | (32) | | 159 | | (57) | | 1,562 | | 1,496 | |
| | (7,225) | | (1,279) | | (1,325) | | 19,677 | | 26,442 | |
| Deferred tax asset | | | | | | |
| Depreciation | | (849) | | 0 | | 0 | | (849) | | 0 | |
| Lease liabilities | | 286 | | 264 | | 8 | | (1,122) | | (1,380) | |
| Pension plan and other post-retirement benefit plan deficits | | 2 | | 62 | | (6) | | (1,548) | | (1,367) | |
| Decommissioning, environmental and other provisions | | 438 | | (472) | | 1,505 | | (7,155) | | (7,579) | |
| Derivative financial instruments | | 0 | | 63 | | (31) | | (25) | | (24) | |
| Tax credits | | 310 | | (336) | | 123 | | (3,652) | | (3,964) | |
| Loss carry forward | | 543 | | 12 | | 559 | | (5,319) | | (5,834) | |
| Other deductible temporary differences | | 191 | | 402 | | 316 | | (920) | | (1,104) | |
| | 921 | | (5) | | 2,474 | | (20,590) | | (21,252) | |
Net deferred tax charge (credit) and net deferred tax (asset) liabilityb | | (6,304) | | (1,284) | | 1,149 | | (913) | | 5,190 | |
| Of which – deferred tax liabilities | | | | | 6,831 | | 9,750 | |
| – deferred tax assets | | | | | 7,744 | | 4,560 | |
|
| | | | | | | | | | | |
| | | | | | | $ million |
|
| | | | Income statementab | | | Balance sheetab |
|
| | | 2019 |
| 2018 |
| 2017 |
| 2019 |
| 2018 |
|
| Deferred tax liability | | | | | | |
| Depreciation | | (1,436 | ) | (1,297 | ) | (3,971 | ) | 22,627 |
| 22,565 |
|
| Pension plan surpluses | | (31 | ) | 65 |
| (12 | ) | 2,290 |
| 1,956 |
|
| Derivative financial instruments | | 29 |
| (36 | ) | (27 | ) | 29 |
| — |
|
| Other taxable temporary differences | | 159 |
| (57 | ) | (64 | ) | 1,496 |
| 1,224 |
|
| | | (1,279 | ) | (1,325 | ) | (4,074 | ) | 26,442 |
| 25,745 |
|
| Deferred tax asset | | | | | | |
| Lease liabilities | | 264 |
| 8 |
| (16 | ) | (1,380 | ) | (90 | ) |
| Pension plan and other post-retirement benefit plan deficits | | 62 |
| (6 | ) | 340 |
| (1,367 | ) | (1,319 | ) |
| Decommissioning, environmental and other provisions | | (472 | ) | 1,505 |
| 3,503 |
| (7,579 | ) | (7,126 | ) |
| Derivative financial instruments | | 63 |
| (31 | ) | (47 | ) | (24 | ) | (95 | ) |
| Tax credits | | (336 | ) | 123 |
| 1,476 |
| (3,964 | ) | (3,626 | ) |
| Loss carry forward | | 12 |
| 559 |
| (964 | ) | (5,834 | ) | (5,900 | ) |
| Other deductible temporary differences | | 402 |
| 316 |
| (772 | ) | (1,104 | ) | (1,483 | ) |
| | | (5 | ) | 2,474 |
| 3,520 |
| (21,252 | ) | (19,639 | ) |
Net deferred tax charge (credit) and net deferred tax liabilityc | | (1,284 | ) | 1,149 |
| (554 | ) | 5,190 |
| 6,106 |
|
| Of which – deferred tax liabilities | | | | | 9,750 |
| 9,812 |
|
| – deferred tax assets | | | | | 4,560 |
| 3,706 |
|
a The 2017 and 2018 income statement and 2018 balance sheet areis impacted by the reduction in US federal corporate income tax rate from 35% to 21%, effective from 1 January 2018.
b The 2019 Included within the net deferred tax (asset) liability is a deferred tax asset balance sheet is impacted by the adoption of IFRS 16 and minor amendments have been made$5,471 million (2019 $5,526 million) related to the balance sheet and income statement comparatives to align with current period presentation.Gulf of Mexico oil spill.
| | | | | | | | | | | | | | |
c
| Included within the net deferred tax liability is a deferred tax asset balance of $5,526 million (2018 $5,562 million) related to the Gulf of Mexico oil spill. | bp Annual Report and Form 20-F 2020 | | 185 |
9. Taxation – continued
Of the $4,560$7,744 million of deferred tax assets recognised on the group balance sheet at 31 December 2019 (2018 $3,7062020 (2019 $4,560 million), $2,421$7,659 million (2018 $2,758(2019 $2,421 million) relates to entities that have suffered a loss in either the current or preceding period. This amount is supported by forecasts that indicate sufficient future taxable profits will be available to utilize such assets. For 2019,2020, $3,906 million relates to the US, $707 million relates to India, $637 million relates to Australia and $588 million relates to Trinidad & Tobago (2019 $2,421 million relates to the US (2018 $1,563 million relates to the US and $1,108 million relates to India)US).
A summary of temporary differences, unused tax credits and unused tax losses for which deferred tax has not been recognized is shown in the table below.
| | | | | | | | | | | |
| | | $ billion |
| At 31 December | | 2020 | 2019 |
Unused US state tax lossesa | | 2.4 | | 2.3 | |
Unused tax losses – other jurisdictionsb | | 6.0 | | 3.5 | |
| Unused tax credits | | 26.9 | | 25.4 | |
of which – arising in the UKc | | 23.0 | | 21.5 | |
– arising in the USd | | 3.9 | | 3.9 | |
Deductible temporary differencese | | 46.1 | | 40.4 | |
| Taxable temporary differences associated with investments in subsidiaries and equity-accounted entities | | 0.8 | | 1.5 | |
a For 2020 these losses expire in the period 2021-2040 with applicable tax rates ranging from 3% to 10%.
b The majority of the unused tax losses have no fixed expiry date.
c The UK unused tax credits arise predominantly in overseas branches of UK entities based in jurisdictions with higher statutory corporate income tax rates than the UK. No deferred tax asset has been recognized on these tax credits as they are unlikely to have value in the future; UK taxes on these overseas branches are largely mitigated by double tax relief in respect of overseas tax. These tax credits have no fixed expiry date.
d For 2020 the US unused tax credits expire in the period 2021-2030.
e The majority comprises fixed asset temporary differences in the UK. Substantially all of the temporary differences have no expiry date.
| | | | | | | | | | | | | | |
| | | | $ million |
| Impact of previously unrecognized deferred tax or write-down of deferred tax assets on tax charge | | 2020 | 2019 | 2018 |
| Current tax benefit relating to the utilization of previously unrecognized deferred tax assets | | 46 | | 272 | | 83 | |
| Deferred tax benefit arising from the reversal of a previous write-down of deferred tax assets | | 11 | | 96 | | 0 | |
| Deferred tax benefit relating to the recognition of previously unrecognized deferred tax assets | | 0 | | 364 | | 112 | |
| Deferred tax expense arising from the write-down of a previously recognized deferred tax asset | | 1,622 | | 73 | | 169 | |
|
| | | | | |
| | | | $ billion |
|
| At 31 December | | 2019 |
| 2018 |
|
Unused US state tax lossesa | | 2.3 |
| 6.6 |
|
Unused tax losses – other jurisdictionsb | | 3.5 |
| 4.3 |
|
| Unused tax credits | | 25.4 |
| 22.5 |
|
of which – arising in the UKc | | 21.5 |
| 18.7 |
|
– arising in the USd | | 3.9 |
| 3.8 |
|
Deductible temporary differencese | | 40.4 |
| 37.3 |
|
| Taxable temporary differences associated with investments in subsidiaries and equity-accounted entities | | 1.5 |
| 1.5 |
|
| |
a
| For 2019 these losses expire in the period 2020-2039 with applicable tax rates ranging from 3% to 12%. |
| |
b
| The majority of the unused tax losses have no fixed expiry date. |
| |
c
| The UK unused tax credits arise predominantly in overseas branches of UK entities based in jurisdictions with higher statutory corporate income tax rates than the UK. No deferred tax asset has been recognized on these tax credits as they are unlikely to have value in the future; UK taxes on these overseas branches are largely mitigated by double tax relief in respect of overseas tax. These tax credits have no fixed expiry date. |
| |
d
| For 2019 the US unused tax credits expire in the period 2020-2029. |
| |
e
| The majority comprises fixed asset temporary differences in the UK. Substantially all of the temporary differences have no expiry date. |
|
| | | | | | | |
| | | | | $ million |
|
| Impact of previously unrecognized deferred tax or write-down of deferred tax assets on tax charge | | 2019 |
| 2018 |
| 2017 |
|
| Current tax benefit relating to the utilization of previously unrecognized deferred tax assets | | 272 |
| 83 |
| 22 |
|
| Deferred tax benefit arising from the reversal of a previous write-down of deferred tax assets | | 96 |
| — |
| — |
|
| Deferred tax benefit relating to the recognition of previously unrecognized deferred tax assets | | 364 |
| 112 |
| 436 |
|
| Deferred tax expense arising from the write-down of a previously recognized deferred tax asset | | 73 |
| 169 |
| 78 |
|
|
| | | |
| BP Annual Report and Form 20-F 2019
| | 183 |
10. Dividends
The quarterly dividend which is expected to be paid on 2726 March 20202021 in respect of the fourth quarter 20192020 is 10.505.25 cents per ordinary share ($0.6300.315 per American Depositary Share (ADS)). The corresponding amount in sterling was announced on 1615 March 2020.2021.
| | | | | | | | | | | | | | | | | | | | | | | | | | | | | | | | |
| | Pence per share | Cents per share | | | $ million |
| | 2020 | 2019 | 2018 | 2020 | 2019 | 2018 | 2020 | 2019 | 2018 |
| Dividends announced and paid in cash | | | | | | | | | | |
| Preference shares | | | | | | | | 1 | | 1 | | 1 | |
| Ordinary shares | | | | | | | | | | |
| March | | 8.1558 | | 7.7382 | | 7.1691 | | 10.50 | | 10.25 | | 10.00 | | 2,102 | | 1,435 | | 1,828 | |
| June | | 8.3421 | | 8.0655 | | 7.4435 | | 10.50 | | 10.25 | | 10.00 | | 2,119 | | 1,779 | | 1,727 | |
| September | | 4.0433 | | 8.3475 | | 7.9296 | | 5.25 | | 10.25 | | 10.25 | | 1,059 | | 1,656 | | 1,409 | |
| December | | 3.9169 | | 7.8250 | | 8.0251 | | 5.25 | | 10.25 | | 10.25 | | 1,059 | | 2,075 | | 1,734 | |
| | 24.4581 | | 31.9762 | | 30.5673 | | 31.50 | | 41.00 | | 40.50 | | 6,340 | | 6,946 | | 6,699 | |
| Dividend announced, paid in March 2021 | | | | | 5.25 | | | | 1,067 | | | |
|
| | | | | | | | | | | | | | | | | | | |
| | | Pence per share | | Cents per share | | | | $ million |
|
| | | 2019 |
| 2018 |
| 2017 |
| 2019 |
| 2018 |
| 2017 |
| 2019 |
| 2018 |
| 2017 |
|
| Dividends announced and paid in cash | | | | | | | | | | |
| Preference shares | | | | | | | | 1 |
| 1 |
| 1 |
|
| Ordinary shares | | | | | | | | | | |
| March | | 7.7380 |
| 7.1691 |
| 8.1587 |
| 10.25 |
| 10.00 |
| 10.00 |
| 1,435 |
| 1,828 |
| 1,303 |
|
| June | | 8.0660 |
| 7.4435 |
| 7.7563 |
| 10.25 |
| 10.00 |
| 10.00 |
| 1,779 |
| 1,727 |
| 1,546 |
|
| September | | 8.3480 |
| 7.9296 |
| 7.6213 |
| 10.25 |
| 10.25 |
| 10.00 |
| 1,656 |
| 1,409 |
| 1,676 |
|
| December | | 7.8250 |
| 8.0251 |
| 7.4435 |
| 10.25 |
| 10.25 |
| 10.00 |
| 2,075 |
| 1,734 |
| 1,627 |
|
| | | 31.9770 |
| 30.5673 |
| 30.9798 |
| 41.00 |
| 40.50 |
| 40.00 |
| 6,946 |
| 6,699 |
| 6,153 |
|
| Dividend announced, paid in March 2020 | | | | | 10.50 |
| | | 2,120 |
| | |
The details of the scrip dividends issued are shown in the table below. The board decided not to offer a scrip dividend alternative in respect of any dividends announced since the third quarter 2019, dividend paid in December 2019 andincluding the fourth quarter 20192020 dividend expected to be paid on 2726 March 2020.2021.
| | | | | 2019 |
| 2018 |
| 2017 |
| | | 2020 | 2019 | 2018 |
| Number of shares issued (thousand) | | 208,927 |
| 195,305 |
| 289,789 |
| Number of shares issued (thousand) | | 0 | | 208,927 | | 195,305 | |
| Value of shares issued ($ million) | | 1,387 |
| 1,381 |
| 1,714 |
| Value of shares issued ($ million) | | 0 | | 1,387 | | 1,381 | |
The financial statements for the year ended 31 December 20192020 do not reflect the dividend announced on 42 February 20202021 and paid in March 2020;2021; this will be treated as an appropriation of profit in the year ending 31 December 2020.2021.
| | | | | | | | | | | | | | |
| 186 | | bp Annual Report and Form 20-F 2020 | | |
11.Earnings per share
| | | | | | | | | | | | | | |
| | | | Cents per share |
| Per ordinary share | | 2020 | 2019 | 2018 |
| Basic earnings per share | | (100.42) | | 19.84 | | 46.98 | |
| Diluted earnings per share | | (100.42) | | 19.73 | | 46.67 | |
| | | | |
| | | | Dollars per share |
Per American Depositary Share (ADS)a | | 2020 | 2019 | 2018 |
| Basic earnings per share | | (6.03) | | 1.19 | | 2.82 | |
| Diluted earnings per share | | (6.03) | | 1.18 | | 2.80 | |
|
| | | | | | | |
| | | | | Cents per share |
|
| Per ordinary share | | 2019 |
| 2018 |
| 2017 |
|
| Basic earnings per share | | 19.84 |
| 46.98 |
| 17.20 |
|
| Diluted earnings per share | | 19.73 |
| 46.67 |
| 17.10 |
|
| | | | | |
| | | | Dollars per share | |
| Per American Depositary Share (ADS) | | 2019 |
| 2018 |
| 2017 |
|
| Basic earnings per share | | 1.19 |
| 2.82 |
| 1.03 |
|
| Diluted earnings per share | | 1.18 |
| 2.80 |
| 1.03 |
|
Basic earnings per ordinary share amounts are calculated by dividing the profit for the year attributable to BPbp ordinary shareholders by the weighted average number of ordinary shares outstanding during the year.
The weighted average number of shares outstanding includes certain shares that will be issuable in the future under employee share-based payment plans and excludes treasury shares, which includes shares held by the Employee Share Ownership Plan trusts (ESOPs).
For the diluted earnings per share calculation, the weighted average number of shares outstanding during the year is adjusted for the average number of shares that are potentially issuable in connection with employee share-based payment plans. If the inclusion of potentially issuable shares would decrease loss per share, the potentially issuable shares are excluded from the weighted average number of shares outstanding used to calculate diluted earnings per share.
| | | | | | | | | | | | | | |
| | | | $ million |
| | | 2020 | 2019 | 2018 |
| Profit attributable to bp shareholders | | (20,305) | | 4,026 | | 9,383 | |
| Less: dividend requirements on preference shares | | 1 | | 1 | | 1 | |
| Profit for the year attributable to bp ordinary shareholders | | (20,306) | | 4,025 | | 9,382 | |
| | | | |
| | | | | Shares thousand |
| | | 2020 | 2019 | 2018 |
| Basic weighted average number of ordinary shares | | 20,221,514 | | 20,284,859 | | 19,970,215 | |
| Potential dilutive effect of ordinary shares issuable under employee share-based payment plans | | 0 | | 114,811 | | 132,278 | |
| Weighted average number of ordinary shares outstanding used to calculate diluted earnings per share | | 20,221,514 | | 20,399,670 | | 20,102,493 | |
| | | | |
| | | | | Shares thousand |
| | | 2020 | 2019 | 2018 |
| Basic weighted average number of ordinary shares – ADS equivalent | | 3,370,252 | | 3,380,809 | | 3,328,369 | |
| Potential dilutive effect of ordinary shares (ADS equivalent) issuable under employee share-based payment plans | | 0 | | 19,136 | | 22,046 | |
| Weighted average number of ordinary shares (ADS equivalent) outstanding used to calculate diluted earnings per share | | 3,370,252 | | 3,399,945 | | 3,350,415 | |
|
| | | | | | | |
| | | | | $ million |
|
| | | 2019 |
| 2018 |
| 2017 |
|
| Profit attributable to BP shareholders | | 4,026 |
| 9,383 |
| 3,389 |
|
| Less: dividend requirements on preference shares | | 1 |
| 1 |
| 1 |
|
| Profit for the year attributable to BP ordinary shareholders | | 4,025 |
| 9,382 |
| 3,388 |
|
| | | | | |
| | | | | Shares thousand |
|
| | | 2019 |
| 2018 |
| 2017 |
|
| Basic weighted average number of ordinary shares | | 20,284,859 |
| 19,970,215 |
| 19,692,613 |
|
| Potential dilutive effect of ordinary shares issuable under employee share-based payment plans | | 114,811 |
| 132,278 |
| 123,829 |
|
| Weighted average number of ordinary shares outstanding used to calculate diluted earnings per share | | 20,399,670 |
| 20,102,493 |
| 19,816,442 |
|
| | | | | |
| | | | | Shares thousand |
|
| | | 2019 |
| 2018 |
| 2017 |
|
| Basic weighted average number of ordinary shares – ADS equivalent | | 3,380,809 |
| 3,328,369 |
| 3,282,102 |
|
| Potential dilutive effect of ordinary shares (ADS equivalent) issuable under employee share-based payment plans | | 19,136 |
| 22,046 |
| 20,638 |
|
| Weighted average number of ordinary shares (ADS equivalent) outstanding used to calculate diluted earnings per share | | 3,399,945 |
| 3,350,415 |
| 3,302,740 |
|
|
| | | |
184 | | BP Annual Report and Form 20-F 2019
| |
11.Earnings per share – continued
The number of ordinary shares outstanding at 31 December 2019,2020, excluding treasury shares, and including certain shares that will be issuable in the future under employee share-based payment plans was 20,241,170,965.20,264,027,711. Between 31 December 20192020 and 2725 February 2020,2021, the latest practicable date before the completion of these financial statements, there was a net decreaseincrease of 46,527,85166,249,231 in the number of ordinary shares outstanding primarily as a result of share issues in relation to employee share-based payment plans. A further 120 million of shares have also been repurchased in January 2020 as part of the share buyback programme at a total cost of $776 million.
Employee share-based payment plans
The group operates share and share option plans for directors and certain employees to obtain ordinary shares and ADSs in the company. Information on these plans for directors is shown in the Directors remuneration report on pages 100-127.103-126.
The following table shows the number of shares potentially issuable under equity-settled employee share option plans, including the number of options outstanding, the number of options exercisable at the end of each year, and the corresponding weighted average exercise prices. The dilutive effect of these plans at 31 December is also shown.
| | | | | | | | | | | | | | | | | |
| Share options | | | 2020 | | 2019 |
| | Number of optionsa b thousand | Weighted average
exercise price $ | Number of optionsa b thousand | Weighted average
exercise price $ |
| Outstanding | | 28,171 | | 3.79 | | 17,112 | | 4.91 | |
| Exercisable | | 1,874 | | 5.02 | | 1,067 | | 3.97 | |
| Dilutive effect | | 2,497 | | n/a | 3,990 | | n/a |
|
| | | | | | | | | |
| Share options | | | 2019 |
| | 2018 |
|
| | | Number of optionsab thousand |
| Weighted average exercise price $ |
| Number of optionsab thousand |
| Weighted average exercise price $ |
|
| Outstanding | | 17,112 |
| 4.91 |
| 19,437 |
| 4.28 |
|
| Exercisable | | 1,067 |
| 3.97 |
| 481 |
| 4.69 |
|
| Dilutive effect | | 3,990 |
| n/a |
| 6,123 |
| n/a |
|
| |
ab At 31 December 2020 the quoted market price of one bp ordinary share was £2.55 (2019 £4.72). | Numbers of options shown are ordinary share equivalents (one ADS is equivalent to six ordinary shares). |
| |
b
| At 31 December 2019 the quoted market price of one BP ordinary share was £4.72 (2018 £4.96). |
In addition, the group operates a number of equity-settled employee share plans under which share units are granted to the group’s senior leaders and certain other employees. These plans typically have a three-year performance or restricted period during which the units accrue net notional dividends which are treated as having been reinvested. Leaving employment will normally preclude the conversion of units into shares, but special arrangements apply for participants that leave for qualifying reasons. The number of shares that are expected to vest each year under employee share plans are shown in the table below. The dilutive effect of the employee share plans at 31 December is also shown.
|
| | | | | |
| Share plans | | 2019 |
| 2018 |
|
| | | Number of sharesa |
| Number of sharesa |
|
| Vesting | | thousand |
| thousand |
|
| Within one year | | 91,105 |
| 108,934 |
|
| 1 to 2 years | | 89,939 |
| 106,337 |
|
| 2 to 3 years | | 80,844 |
| 71,407 |
|
| 3 to 4 years | | 725 |
| 588 |
|
| Over 4 years | | 576 |
| 799 |
|
| | | 263,189 |
| 288,065 |
|
| Dilutive effect | | 92,343 |
| 127,165 |
|
| | | | | | | | | | | | | | |
a
| Numbers of shares shown are ordinary share equivalents (one ADS is equivalent to six ordinary shares). | bp Annual Report and Form 20-F 2020 | | 187 |
11.Earnings per share – continued
| | | | | | | | | | | |
| Share plans | | 2020 | 2019 |
| | Number of sharesa | Number of sharesa |
| Vesting | | thousand | thousand |
| Within one year | | 87,517 | | 91,105 | |
| 1 to 2 years | | 85,720 | | 89,939 | |
| 2 to 3 years | | 147,097 | | 80,844 | |
| 3 to 4 years | | 749 | | 725 | |
| Over 4 years | | 349 | | 576 | |
| | 321,432 | | 263,189 | |
| Dilutive effect | | 104,068 | | 92,343 | |
a Numbers of shares shown are ordinary share equivalents (one ADS is equivalent to 6 ordinary shares).
There has been a net decrease of 37,497,36429,718,486 in the number of potential ordinary shares relating to employee share-based payment plans between 31 December 20192020 and 2725 February 2020.2021.
|
| | | | | | | | | | | | | |
| 188 | BP
| bp Annual Report and Form 20-F 20192020 | | 185 |
12.Property, plant and equipment (PP&E)
| | | | | | | | | | | | | | | | | | | | | | | | | | | | | |
| | | | | | | | | $ million |
| | Land and land improvements | Buildings | Oil and gas propertiesa | Plant, machinery and equipment | Fittings, fixtures and office equipment | Transportation | Oil depots, storage tanks and service stations | Total |
| Cost - owned PP&E | | | | | | | | | |
| At 1 January 2020 | | 3,609 | | 1,422 | | 214,352 | | 46,724 | | 2,532 | | 3,474 | | 8,694 | | 280,807 | |
| Exchange adjustments | | 219 | | 6 | | 0 | | 801 | | 33 | | 8 | | 603 | | 1,670 | |
| Additions | | 101 | | 63 | | 6,922 | | 1,539 | | 586 | | 49 | | 864 | | 10,124 | |
| Acquisitions | | 89 | | 0 | | 0 | | 35 | | 5 | | 9 | | 376 | | 514 | |
| | | | | | | | | |
| Transfers from intangible assets | | 0 | | 0 | | 605 | | 0 | | 0 | | 0 | | 0 | | 605 | |
| Reclassified as assets held for sale | | 0 | | 0 | | (1,425) | | 0 | | 0 | | 0 | | 0 | | (1,425) | |
| Deletions | | (146) | | (281) | | (6,131) | | (6,185) | | (738) | | (491) | | (261) | | (14,233) | |
| At 31 December 2020 | | 3,872 | | 1,210 | | 214,323 | | 42,914 | | 2,418 | | 3,049 | | 10,276 | | 278,062 | |
| Depreciation - owned PP&E | | | | | | | | | |
| At 1 January 2020 | | 581 | | 697 | | 124,766 | | 21,527 | | 2,006 | | 2,744 | | 4,865 | | 157,186 | |
| Exchange adjustments | | 35 | | 6 | | 0 | | 424 | | 26 | | 9 | | 379 | | 879 | |
| Charge for the year | | 113 | | 46 | | 10,068 | | 1,312 | | 170 | | 77 | | 740 | | 12,526 | |
| | | | | | | | | |
| Impairment losses | | 8 | | 9 | | 11,705 | | 744 | | 2 | | 4 | | 3 | | 12,475 | |
| Impairment reversals | | 0 | | (1) | | (83) | | 0 | | 0 | | (5) | | 0 | | (89) | |
| | | | | | | | | |
| Reclassified as assets held for sale | | 0 | | 0 | | (326) | | 0 | | 0 | | 0 | | 0 | | (326) | |
| Deletions | | (45) | | (126) | | (5,579) | | (3,976) | | (359) | | (448) | | (201) | | (10,734) | |
| At 31 December 2020 | | 692 | | 631 | | 140,551 | | 20,031 | | 1,845 | | 2,381 | | 5,786 | | 171,917 | |
| Owned PP&E - net book amount at 31 December 2020 | | 3,180 | | 579 | | 73,772 | | 22,883 | | 573 | | 668 | | 4,490 | | 106,145 | |
Right-of-use assets - net book amount at 31 December 2020b | | 0 | | 1,254 | | 77 | | 792 | | 21 | | 2,855 | | 3,692 | | 8,691 | |
| Total PP&E - net book amount at 31 December 2020 | | 3,180 | | 1,833 | | 73,849 | | 23,675 | | 594 | | 3,523 | | 8,182 | | 114,836 | |
| Cost - owned PP&E | | | | | | | | | |
| At 1 January 2019 | | 3,562 | | 1,502 | | 232,684 | | 45,721 | | 2,747 | | 10,183 | | 8,866 | | 305,265 | |
| Exchange adjustments | | (22) | | 5 | | 0 | | (158) | | 15 | | (3) | | (69) | | (232) | |
| Additions | | 88 | | 93 | | 13,237 | | 2,433 | | 172 | | 274 | | 644 | | 16,941 | |
| Acquisitions | | 51 | | 0 | | 0 | | 0 | | 0 | | 0 | | 8 | | 59 | |
| | | | | | | | | |
| Transfers from intangible assets | | 0 | | 0 | | 1,885 | | 0 | | 0 | | 0 | | 0 | | 1,885 | |
| Reclassified as assets held for sale | | (26) | | 0 | | (22,602) | | 0 | | (76) | | (6,708) | | 0 | | (29,412) | |
| Deletions | | (44) | | (178) | | (10,852) | | (1,272) | | (326) | | (272) | | (755) | | (13,699) | |
| At 31 December 2019 | | 3,609 | | 1,422 | | 214,352 | | 46,724 | | 2,532 | | 3,474 | | 8,694 | | 280,807 | |
| Depreciation - owned PP&E | | | | | | | | | |
| At 1 January 2019 | | 626 | | 697 | | 133,687 | | 20,512 | | 2,041 | | 7,819 | | 5,146 | | 170,528 | |
| Exchange adjustments | | (4) | | 5 | | 0 | | (63) | | 12 | | (3) | | (45) | | (98) | |
| Charge for the year | | 44 | | 59 | | 13,012 | | 1,705 | | 168 | | 173 | | 420 | | 15,581 | |
| | | | | | | | | |
| Impairment losses | | 1 | | 1 | | 5,871 | | 64 | | 1 | | 404 | | 4 | | 6,346 | |
| Impairment reversals | | 0 | | 0 | | (129) | | 0 | | 0 | | (2) | | 0 | | (131) | |
| | | | | | | | | |
| Reclassified as assets held for sale | | 0 | | 0 | | (17,764) | | 0 | | (69) | | (5,478) | | 0 | | (23,311) | |
| Deletions | | (86) | | (65) | | (9,911) | | (691) | | (147) | | (169) | | (660) | | (11,729) | |
| At 31 December 2019 | | 581 | | 697 | | 124,766 | | 21,527 | | 2,006 | | 2,744 | | 4,865 | | 157,186 | |
| Owned PP&E - net book amount at 31 December 2019 | | 3,028 | | 725 | | 89,586 | | 25,197 | | 526 | | 730 | | 3,829 | | 123,621 | |
Right-of-use assets - net book amount at 31 December 2019b | | 0 | | 1,196 | | 128 | | 1,241 | | 16 | | 3,385 | | 3,055 | | 9,021 | |
| Total PP&E - net book amount at 31 December 2019 | | 3,028 | | 1,921 | | 89,714 | | 26,438 | | 542 | | 4,115 | | 6,884 | | 132,642 | |
| | | | | | | | | |
| Assets under construction included above | | | | | | | | | |
| At 31 December 2020 | | | | | | | | | 17,259 | |
| At 31 December 2019 | | | | | | | | | 23,897 | |
| Depreciation charge for the year on right-of-use assets | | | | | | | | | |
| 2020 | | | 192 | | 43 | | 637 | | 10 | | 829 | | 579 | | 2,290 | |
| 2019 | | | 220 | | 31 | | 671 | | 9 | | 784 | | 526 | | 2,241 | |
|
| | | | | | | | | | | | | | | | | |
| | | | | | | | | | $ million |
|
| | | Land and land improvements |
| Buildings |
| Oil and gas propertiesa |
| Plant, machinery and equipment |
| Fittings, fixtures and office equipment |
| Transportationb |
| Oil depots, storage tanks and service stations |
| Total |
|
| Cost - owned property, plant and equipment (PP&E) | | | | | | | | | |
| At 1 January 2019 | | 3,562 |
| 1,502 |
| 232,684 |
| 45,721 |
| 2,747 |
| 10,183 |
| 8,866 |
| 305,265 |
|
| Exchange adjustments | | (22 | ) | 5 |
| — |
| (158 | ) | 15 |
| (3 | ) | (69 | ) | (232 | ) |
| Additions | | 88 |
| 93 |
| 13,237 |
| 2,433 |
| 172 |
| 274 |
| 644 |
| 16,941 |
|
| Acquisitions | | 51 |
| — |
| — |
| — |
| — |
| — |
| 8 |
| 59 |
|
| Transfers from intangible assets | | — |
| — |
| 1,885 |
| — |
| — |
| — |
| — |
| 1,885 |
|
| Reclassified as assets held for sale | | (26 | ) | — |
| (22,602 | ) | — |
| (76 | ) | (6,708 | ) | — |
| (29,412 | ) |
| Deletions | | (44 | ) | (178 | ) | (10,852 | ) | (1,272 | ) | (326 | ) | (272 | ) | (755 | ) | (13,699 | ) |
| At 31 December 2019 | | 3,609 |
| 1,422 |
| 214,352 |
| 46,724 |
| 2,532 |
| 3,474 |
| 8,694 |
| 280,807 |
|
| Depreciation - owned PP&E | | | | | | | | | |
| At 1 January 2019 | | 626 |
| 697 |
| 133,687 |
| 20,512 |
| 2,041 |
| 7,819 |
| 5,146 |
| 170,528 |
|
| Exchange adjustments | | (4 | ) | 5 |
| — |
| (63 | ) | 12 |
| (3 | ) | (45 | ) | (98 | ) |
| Charge for the year | | 44 |
| 59 |
| 13,012 |
| 1,705 |
| 168 |
| 173 |
| 420 |
| 15,581 |
|
| Impairment losses | | 1 |
| 1 |
| 5,871 |
| 64 |
| 1 |
| 404 |
| 4 |
| 6,346 |
|
| Impairment reversals | | — |
| — |
| (129 | ) | — |
| — |
| (2 | ) | — |
| (131 | ) |
| Reclassified as assets held for sale | | — |
| — |
| (17,764 | ) | — |
| (69 | ) | (5,478 | ) | — |
| (23,311 | ) |
| Deletions | | (86 | ) | (65 | ) | (9,911 | ) | (691 | ) | (147 | ) | (169 | ) | (660 | ) | (11,729 | ) |
| At 31 December 2019 | | 581 |
| 697 |
| 124,766 |
| 21,527 |
| 2,006 |
| 2,744 |
| 4,865 |
| 157,186 |
|
| Owned PP&E - net book amount at 31 December 2019 | | 3,028 |
| 725 |
| 89,586 |
| 25,197 |
| 526 |
| 730 |
| 3,829 |
| 123,621 |
|
Right-of-use assets - net book amount at 31 December 2019c | | — |
| 1,196 |
| 128 |
| 1,241 |
| 16 |
| 3,385 |
| 3,055 |
| 9,021 |
|
| Total PP&E - net book amount at 31 December 2019 | | 3,028 |
| 1,921 |
| 89,714 |
| 26,438 |
| 542 |
| 4,115 |
| 6,884 |
| 132,642 |
|
| Cost | | | | | | | | | |
| At 1 January 2018 | | 3,474 |
| 1,573 |
| 226,054 |
| 46,662 |
| 2,853 |
| 10,774 |
| 8,748 |
| 300,138 |
|
| Exchange adjustments | | (168 | ) | (58 | ) | — |
| (892 | ) | (73 | ) | (43 | ) | (501 | ) | (1,735 | ) |
| Additions | | 233 |
| 40 |
| 9,712 |
| 2,323 |
| 204 |
| (112 | ) | 736 |
| 13,136 |
|
| Acquisitions | | 163 |
| 4 |
| 10,882 |
| 9 |
| 1 |
| 2 |
| 36 |
| 11,097 |
|
Remeasurementsb | | — |
| — |
| 17 |
| — |
| — |
| — |
| — |
| 17 |
|
| Transfers from intangible assets | | — |
| — |
| 901 |
| — |
| — |
| — |
| — |
| 901 |
|
| Deletions | | (140 | ) | (45 | ) | (14,699 | ) | (1,810 | ) | (238 | ) | (128 | ) | (146 | ) | (17,206 | ) |
| At 31 December 2018 | | 3,562 |
| 1,514 |
| 232,867 |
| 46,292 |
| 2,747 |
| 10,493 |
| 8,873 |
| 306,348 |
|
| Depreciation | | | | | | | | | |
| At 1 January 2018 | | 683 |
| 818 |
| 133,326 |
| 20,996 |
| 2,136 |
| 7,523 |
| 5,185 |
| 170,667 |
|
| Exchange adjustments | | (25 | ) | (24 | ) | — |
| (460 | ) | (52 | ) | (27 | ) | (279 | ) | (867 | ) |
| Charge for the year | | 92 |
| 52 |
| 12,342 |
| 1,820 |
| 189 |
| 252 |
| 384 |
| 15,131 |
|
| Impairment losses | | 2 |
| — |
| 86 |
| 253 |
| — |
| 178 |
| 2 |
| 521 |
|
| Impairment reversals | | — |
| — |
| (564 | ) | (1 | ) | — |
| (17 | ) | — |
| (582 | ) |
| Deletions | | (126 | ) | (139 | ) | (11,333 | ) | (1,733 | ) | (232 | ) | (75 | ) | (145 | ) | (13,783 | ) |
| At 31 December 2018 | | 626 |
| 707 |
| 133,857 |
| 20,875 |
| 2,041 |
| 7,834 |
| 5,147 |
| 171,087 |
|
| Net book amount at 31 December 2018 | | 2,936 |
| 807 |
| 99,010 |
| 25,417 |
| 706 |
| 2,659 |
| 3,726 |
| 135,261 |
|
| | | | | | | | | | |
Assets held under finance leases at net book amount included aboved | | | | | | | | | |
| At 31 December 2018 | | — |
| 2 |
| 12 |
| 207 |
| — |
| 295 |
| 6 |
| 522 |
|
| Assets under construction included above | | | | | | | | | |
| At 31 December 2019 | | | | | | | | | 23,897 |
|
| At 31 December 2018 | | | | | | | | | 22,522 |
|
| Depreciation charge for the year on right-of-use assets | | | | | | | | | |
| 2019 | |
| 220 |
| 31 |
| 671 |
| 9 |
| 784 |
| 526 |
| 2,241 |
|
a For information on significant estimates and judgements made in relation to the estimation of oil and natural reserves see Property, plant and equipment within Note 1.
| |
b
| Includes adjustments to decommissioning provisions; see Note 1 for further information. |
cb $284 million (2019 $653 millionmillion) of drilling rig right-of-use assets and $2,521 million (2019 $2,929 millionmillion) of shipping vessel right-of-use assets are included in Plant, machinery and equipment and Transportation respectively.
d Leases previously classified as finance leases are included within right-of-use assets following the implementation of IFRS 16 ‘Leases’; see Note 1 for further information. The reconciliation of owned property, plant and equipment for 2019 does not include right-of-use assets and, therefore, the cost and depreciation at 1 January 2019 is not equal to the cost and depreciation of total property, plant and equipment at 31 December 2018. The relevant amounts excluded are cost of $1,083 million and depreciation of $559 million relating to leases previously classified as finance leases.
|
| | | | | | | | | | | | | |
186 | | BPbp Annual Report and Form 20-F 2019
2020 | | 189 |
13.Capital commitments
Authorized future capital expenditure for property, plant and equipment (excluding right-of-use assets) by group companies for which contracts had been signed at 31 December 20192020 amounted to $8,009 million (2019 $11,382 million, (20182018 $8,319 million, 2017 $11,340 million). BPbp has contracted capital commitments amounting to $1,087 million (2019 $77 million, 2018 $25 million) in relation to joint ventures and $183 million (2019 $787 million, (20182018 $1,227 million, 2017 $1,451 million) in relation to associates. BP’sbp’s share of contracted capital commitments of joint ventures amounted to $900 million (2019 $1,024 million, (20182018 $619 million, 2017 $483 million).
14.Goodwill and impairment review of goodwill
| | | | | | | | | | | |
| | | $ million |
| | 2020 | 2019 |
| Cost | | | |
| At 1 January | | 12,865 | | 12,815 | |
| Exchange adjustments | | 184 | | 79 | |
Acquisitions and other additionsa | | 632 | | 26 | |
| Reclassified as assets held for sale | | (199) | | 0 | |
| Deletions | | (389) | | (55) | |
| At 31 December | | 13,093 | | 12,865 | |
| Impairment losses | | | |
| At 1 January | | 997 | | 611 | |
| Exchange adjustments | | 1 | | 0 | |
| Impairment losses for the year | | 1 | | 386 | |
| Deletions | | (386) | | 0 | |
| At 31 December | | 613 | | 997 | |
| Net book amount at 31 December | | 12,480 | | 11,868 | |
| Net book amount at 1 January | | 11,868 | | 12,204 | |
|
| | | | | |
| | | | $ million |
|
| | | 2019 |
| 2018 |
|
| Cost | | | |
| At 1 January | | 12,815 |
| 12,163 |
|
| Exchange adjustments | | 79 |
| (210 | ) |
Acquisitions and other additionsa | | 26 |
| 1,046 |
|
| Deletions | | (55 | ) | (184 | ) |
| At 31 December | | 12,865 |
| 12,815 |
|
| Impairment losses | | | |
| At 1 January | | 611 |
| 612 |
|
| Exchange adjustments | | — |
| — |
|
| Impairment losses for the year | | 386 |
| — |
|
| Deletions | | — |
| (1 | ) |
| At 31 December | | 997 |
| 611 |
|
| Net book amount at 31 December | | 11,868 |
| 12,204 |
|
| Net book amount at 1 January | | 12,204 |
| 11,551 |
|
a 2018 2020 principally relates to the purchase of an additional 16.5% shareacquisition in the Clair field in the North Sea. See Note 3 - Other significant transactions for further information.US Fuels business.
Impairment review of goodwill
| | | | | |
|
| | | | $ million |
| Goodwill at 31 December | | 2019 |
| 2018 |
| Goodwill at 31 December | | 2020 | 2019 |
| Upstream | | 7,958 |
| 8,346 |
| Upstream | | 7,765 | | 7,958 | |
| Downstream | | 3,904 |
| 3,802 |
| Downstream | | 4,660 | | 3,904 | |
| Other businesses and corporate | | 6 |
| 56 |
| Other businesses and corporate | | 55 | | 6 | |
| | | 11,868 |
| 12,204 |
| | | 12,480 | | 11,868 | |
Goodwill acquired through business combinations has been allocated to groups of cash-generating units that are expected to benefit from the synergies of the acquisition. For Upstream, goodwill is allocated to all oil and gas assets in aggregate at the segment level. For Downstream, goodwill has been allocated to Lubricants, US Fuels, European Fuels and Other.
For information on significant estimates and judgements made in relation to impairments see Impairment of property, plant and equipment, intangible assets and goodwill in Note 1.
Upstream
| | | | | |
|
| | | | $ million |
| | | 2019 |
| 2018 |
| | | 2020 | 2019 |
| Goodwill | | 7,958 |
| 8,346 |
| Goodwill | | 7,765 | | 7,958 | |
| Excess of recoverable amount over carrying amount | | 93,250 |
| 53,391 |
| Excess of recoverable amount over carrying amount | | 31,749 | | 93,250 | |
The table above shows the carrying amount of goodwill for the segment at the period end and the excess of the recoverable amount, based on a pre-tax value-in-use calculation, over the carrying amount (headroom) at the date of the most recent test. The increasereduction in headroom since the prior period principally arises from acquisitions (includingrelates to the acquisition from BHP), new activity and discount rateimpact of changes netto price assumptions.
NaN impairment of highly probable and completed divestments and price assumption changes.
Goodwill impairments of $386 million, related tothe Upstream goodwill allocated to expected divestments, werebalance was recognized during 2019 (2018 nil)2020 (2019 $386 million).
The value in use is based on the cash flows expected to be generated by the projected oil or natural gas production profiles up to the expected dates of cessation of production of each producing field, based on current estimates of reserves and resources, appropriately risked. Midstream and supply and trading activities and equity-accounted entities are generally not included in the impairment review of goodwill, becauseas they aredo not represent part of the grouping of cash-generating units to which the goodwill relates and which is used to monitor the goodwill for internal management purposes. Where such activities form part of a wider Upstream cash-generating unit, they are reflected in the test. As the production profile and related cash flows can be estimated from BP’sbp’s past experience, management believes that the cash flows generated over the estimated life of field is the appropriate basis upon which to assess goodwill and individual assets for impairment. The estimated date of cessation of production depends on the interaction of a number of variables, such as the recoverable quantities of hydrocarbons, the production profile of the hydrocarbons, the cost of the development of the infrastructure necessary to recover the hydrocarbons, production costs, the contractual duration of the production concession and the selling price of the hydrocarbons produced. As each producing field has specific reservoir characteristics and economic circumstances, the cash flows of the fields areeach field is computed using appropriate individual economic models and key assumptions agreed by BPbp management. Capital expenditure, operating costs and expected hydrocarbon production profiles are derived from the business segment plan adjusted for assumptions reflecting the price environment at the time that the test was performed.
Estimated production volumes and cash flows up to the date of cessation of production on a field-by-field basis, including operating and capital expenditure, are consistent with this.derived from the business segment plan. The production profiles used are consistent with the reserve and resource volumes approved as part of BP’sbp’s centrally controlled process for the estimation of proved and probable reserves and total resources.
Oil and gas price assumptions and discount rate assumptions used were as disclosed in Note 1. The average production for the purposes of goodwill impairment testing over the next 15 years is 877 mmboe per year (2019 829 mmboe per year). The weighted average pre-tax discount rate used in the test is 11% (2019 12%).
|
| | | | | | | | | | | | | |
| 190 | BP
| bp Annual Report and Form 20-F 20192020 | | 187 |
14.Goodwill and impairment review of goodwill – continued
The most recent review for impairment was carried out in the fourth quarter. The key assumptions used in the value-in-use calculation are oil and natural gas prices, production volumes and the discount rate. Oil and gas price assumptions and discount rate assumptions used were as disclosed in Note 1. The value-in-use calculation has been prepared solely for the purposes of determining whether the goodwill balance was impaired. Estimated future cash flows were prepared on the basis of certain assumptions prevailing at the time of the test. The actual outcomes may differ from the assumptions made. For example, reserves and resources estimates and production forecasts are subject to revision as further technical information becomes available and economic conditions change. Due to economic developments, regulatory change and emissions reduction activity arising from climate concern and other factors, future commodity prices and other assumptions may differ from the forecasts used in the calculations.
Sensitivities to different variables have been estimated using certain simplifying assumptions. For example, lower oil and gas price or production sensitivities do not fully reflect the specific impacts for each contractual arrangement and will not capture all favourable impacts that may arise from cost deflation.deflation or savings. A detailed calculation at any given price or production profile may, therefore, produce a different result.
Adverse changes in input assumptions applied in respect to assets carried at or close to their value in use, primarily being those assets previously impaired, would have a limited effect on goodwill headroom, instead resulting in a direct impairment of the particular cash-generating unit's net book value. Conversely, a reduction in the value in use of those assets carried at a value below their respective values in use would result in an adverse impact on the goodwill headroom. It is estimated that no reasonable sustained falla 21% reduction in the oil or gas price assumption over the next 20 years would individually cause the recoverable amount to be equal to the carrying amount of goodwill and related net non-current assetsrevenue throughout each year of the segment.
Estimatedremaining life of those assets, either as a result of adverse price or production volumes are based on detailed data forconditions or a combination of each, field and take into account development plans agreed by management as part of the long-term planning process. The average production for the purposes of goodwill impairment testing over the next 15 years is 829 mmboe per year (2018 829 mmboe per year). It is estimated that no reasonably possible change in production volumes would cause the recoverable amount to be equal to the carrying amount of goodwill and related net non-current assets of the segment.
It is estimated that no reasonably possible change in the pre-tax discount rate would cause the recoverable amount to be equal to the carrying amount of goodwill and related net non-current assets of the segment. The weighted average discount rate used in the test is 12%.
Downstream
|
| | | | | | | | | | | | | |
| | | | | | | | $ million |
|
| | | | | 2019 |
| | | 2018 |
|
| | | Lubricants |
| Other |
| Total |
| Lubricants |
| Other |
| Total |
|
| Goodwill | | 2,779 |
| 1,125 |
| 3,904 |
| 2,692 |
| 1,110 |
| 3,802 |
|
| | | | | | | | | | | | | | | | | | | | | | | | | | | | | | | | | | | |
| | | | | | | | | | | $ million |
| | | | | | 2020 | | | | | 2019 |
| | Lubricants | US Fuels | European Fuels | Other | Total | Lubricants | US Fuels | European Fuels | Other | Total |
| Goodwill | | 2,865 | | 606 | | 913 | | 276 | | 4,660 | | 2,779 | | 0 | | 858 | | 267 | | 3,904 | |
Cash flows for each cash-generating unit are derived from the business segment plans, which cover a period of up to five years. To determine the value in use for each of the cash-generating units, cash flows for a period of 10 years are discounted and aggregated with a terminal value.
Lubricants
As permitted by IAS 36, the detailed calculations of Lubricants’ recoverable amount performed in the most recent detailed calculation in 2018 was used as the basis for the tests in 20192020 as the criteria of IAS 36 were considered satisfied: the headroom was substantial in 2018; there have been no significant changes in the assets and liabilities; and the likelihood that the recoverable amount would be less than the carrying amount is remote.
The key assumptions to which the calculation of value in use for the Lubricants unit is most sensitive are operating unit margins, sales volumes, and discount rate. Operating margin and sales volumes assumptions used in the detailed impairment review of goodwill calculation are consistent with the assumptions used in the Lubricants unit’s business plan and values assigned to these key assumptions reflect past experience. No reasonably possible change in any of these key assumptions would cause the unit’s carrying amount to exceed its recoverable amount. Cash flows beyond the plan period are extrapolated using a nominal 2.8% growth rate.
15.Intangible assets
| | | | | | | | | | | | | | | | | | | | | | | |
| | | | | | | $ million |
| | | | 2020 | | | 2019 |
| | Exploration and appraisal expenditurea | Other intangibles | Total | Exploration and appraisal expenditurea | Other intangibles | Total |
| Cost | | | | | | | |
| At 1 January | | 15,306 | | 4,900 | | 20,206 | | 17,053 | | 4,504 | | 21,557 | |
| Exchange adjustments | | 0 | | 138 | | 138 | | 0 | | 2 | | 2 | |
| Acquisitions | | 0 | | 318 | | 318 | | 0 | | 35 | | 35 | |
| Additions | | 703 | | 645 | | 1,348 | | 1,268 | | 457 | | 1,725 | |
| Transfers to property, plant and equipment | | (605) | | 0 | | (605) | | (1,885) | | 0 | | (1,885) | |
| Reclassified as assets held for sale | | 0 | | 0 | | 0 | | (671) | | 0 | | (671) | |
| Deletions | | (987) | | (379) | | (1,366) | | (459) | | (98) | | (557) | |
| At 31 December | | 14,417 | | 5,622 | | 20,039 | | 15,306 | | 4,900 | | 20,206 | |
| Amortization | | | | | | | |
| At 1 January | | 1,215 | | 3,452 | | 4,667 | | 1,064 | | 3,209 | | 4,273 | |
| Exchange adjustments | | 0 | | 93 | | 93 | | 0 | | 4 | | 4 | |
| Exploration expenditure written off | | 9,920 | | 0 | | 9,920 | | 631 | | 0 | | 631 | |
| Charge for the year | | 0 | | 372 | | 372 | | 0 | | 331 | | 331 | |
| Impairment losses | | 156 | | 9 | | 165 | | 2 | | 2 | | 4 | |
| | | | | | | |
| Reclassified as assets held for sale | | 0 | | 0 | | 0 | | (61) | | 0 | | (61) | |
| Deletions | | (987) | | (284) | | (1,271) | | (421) | | (94) | | (515) | |
| At 31 December | | 10,304 | | 3,642 | | 13,946 | | 1,215 | | 3,452 | | 4,667 | |
| Net book amount at 31 December | | 4,113 | | 1,980 | | 6,093 | | 14,091 | | 1,448 | | 15,539 | |
| Net book amount at 1 January | | 14,091 | | 1,448 | | 15,539 | | 15,989 | | 1,295 | | 17,284 | |
|
| | | | | | | | | | | | | |
| | | | | | | | $ million |
|
| | | | | 2019 |
| | | 2018 |
|
| | | Exploration and appraisal expenditurea |
| Other intangibles |
| Total |
| Exploration and appraisal expenditurea |
| Other intangibles |
| Total |
|
| Cost | | | | | | | |
| At 1 January | | 17,053 |
| 4,504 |
| 21,557 |
| 17,886 |
| 4,488 |
| 22,374 |
|
| Exchange adjustments | | — |
| 2 |
| 2 |
| — |
| (128 | ) | (128 | ) |
| Acquisitions | | — |
| 35 |
| 35 |
| — |
| 25 |
| 25 |
|
| Additions | | 1,268 |
| 457 |
| 1,725 |
| 1,095 |
| 318 |
| 1,413 |
|
| Transfers to property, plant and equipment | | (1,885 | ) | — |
| (1,885 | ) | (901 | ) | — |
| (901 | ) |
| Reclassified as assets held for sale | | (671 | ) | — |
| (671 | ) | — |
| — |
| — |
|
| Deletions | | (459 | ) | (98 | ) | (557 | ) | (1,027 | ) | (199 | ) | (1,226 | ) |
| At 31 December | | 15,306 |
| 4,900 |
| 20,206 |
| 17,053 |
| 4,504 |
| 21,557 |
|
| Amortization | | | | | | | |
| At 1 January | | 1,064 |
| 3,209 |
| 4,273 |
| 860 |
| 3,159 |
| 4,019 |
|
| Exchange adjustments | | — |
| 4 |
| 4 |
| — |
| (77 | ) | (77 | ) |
| Charge for the year | | 631 |
| 331 |
| 962 |
| 1,085 |
| 326 |
| 1,411 |
|
| Impairment losses | | 2 |
| 2 |
| 4 |
| 137 |
| — |
| 137 |
|
| Reclassified as assets held for sale | | (61 | ) | — |
| (61 | ) | — |
| — |
| — |
|
| Deletions | | (421 | ) | (94 | ) | (515 | ) | (1,018 | ) | (199 | ) | (1,217 | ) |
| At 31 December | | 1,215 |
| 3,452 |
| 4,667 |
| 1,064 |
| 3,209 |
| 4,273 |
|
| Net book amount at 31 December | | 14,091 |
| 1,448 |
| 15,539 |
| 15,989 |
| 1,295 |
| 17,284 |
|
| Net book amount at 1 January | | 15,989 |
| 1,295 |
| 17,284 |
| 17,026 |
| 1,329 |
| 18,355 |
|
a For further information see Intangible assets within Note 1 and Note 8.
|
| | | | | | | | | | | | | |
188 | | BPbp Annual Report and Form 20-F 2019
2020 | | 191 |
16.Investments in joint ventures
The following table provides aggregated summarized financial information relating to the group’s share of joint ventures. In December
| | | | | | | | | | | | | | |
| | | | $ million |
| | 2020 | 2019a | 2018 |
| Sales and other operating revenues | | 10,545 | | 14,139 | | 13,258 | |
| Profit before interest and taxation | | (151) | | 976 | | 1,396 | |
| Finance costs | | 201 | | 109 | | 85 | |
| Profit before taxation | | (352) | | 867 | | 1,311 | |
| Taxation | | (51) | | 289 | | 414 | |
| Non-controlling interest | | 1 | | 2 | | 0 | |
| Profit for the year | | (302) | | 576 | | 897 | |
| Other comprehensive income | | (5) | | (6) | | 6 | |
| Total comprehensive income | | (307) | | 570 | | 903 | |
| Non-current assets | | 12,646 | | 13,457 | | |
| Current assets | | 3,424 | | 3,738 | | |
| Total assets | | 16,070 | | 17,195 | | |
| Current liabilities | | 2,644 | | 2,514 | | |
| Non-current liabilities | | 5,023 | | 4,676 | | |
| Total liabilities | | 7,667 | | 7,190 | | |
| Net assets | | 8,403 | | 10,005 | | |
| Less: non-controlling interests | | 39 | | 49 | | |
| | 8,364 | | 9,956 | | |
| | | | |
| Group investment in joint ventures | | | | |
| Group share of net assets (as above) | | 8,364 | | 9,956 | | |
| Loans made by group companies to joint ventures | | (2) | | 35 | | |
| | 8,362 | | 9,991 | | |
a 2019 BP and Bunge both contributed their Brazilian biofuels and biopower businesses into a new joint venture, BP Bunge Bioenergia. BP owns 50% of the new entity.has been restated to include non-controlling interest
|
| | | | | | | |
| | | | | $ million |
|
| | | 2019 |
| 2018 |
| 2017 |
|
| Sales and other operating revenues | | 14,139 |
| 13,258 |
| 11,380 |
|
| Profit before interest and taxation | | 975 |
| 1,396 |
| 1,394 |
|
| Finance costs | | 111 |
| 85 |
| 100 |
|
| Profit before taxation | | 864 |
| 1,311 |
| 1,294 |
|
| Taxation | | 288 |
| 414 |
| 117 |
|
| Profit for the year | | 576 |
| 897 |
| 1,177 |
|
| Other comprehensive income | | (6 | ) | 6 |
| 8 |
|
| Total comprehensive income | | 570 |
| 903 |
| 1,185 |
|
| Non-current assets | | 13,408 |
| 10,399 |
| |
| Current assets | | 3,738 |
| 2,935 |
| |
| Total assets | | 17,146 |
| 13,334 |
| |
| Current liabilities | | 2,514 |
| 1,715 |
| |
| Non-current liabilities | | 4,676 |
| 3,017 |
| |
| Total liabilities | | 7,190 |
| 4,732 |
| |
| Net assets | | 9,956 |
| 8,602 |
| |
| Group investment in joint ventures | | | | |
| Group share of net assets (as above) | | 9,956 |
| 8,602 |
| |
| Loans made by group companies to joint ventures | | 35 |
| 45 |
| |
| | | 9,991 |
| 8,647 |
| |
Transactions between the group and its joint ventures are summarized below.
| | | | | | $ million |
| | | | $ million |
| Sales to joint ventures | | | 2019 |
| | 2018 |
| | 2017 |
| Sales to joint ventures | | | 2020 | | 2019 | | 2018 |
| Product | | Sales |
| Amount receivable at 31 December |
| Sales |
| Amount receivable at 31 December |
| Sales |
| Amount receivable at
31 December |
| Product | | Sales | Amount receivable at
31 December | Sales | Amount receivable at
31 December | Sales | Amount receivable at
31 December |
| LNG, crude oil and oil products, natural gas | | 4,884 |
| 431 |
| 4,603 |
| 251 |
| 3,578 |
| 352 |
| LNG, crude oil and oil products, natural gas | | 2,974 | | 180 | | 4,884 | | 431 | | 4,603 | | 251 | |
| | | | | | |
| | | | $ million |
| | | | $ million |
| Purchases from joint ventures | | | 2019 |
| | 2018 |
| | 2017 |
| Purchases from joint ventures | | | 2020 | | 2019 | | 2018 |
| Product | | Purchases |
| Amount payable at 31 December |
| Purchases |
| Amount payable at 31 December |
| Purchases |
| Amount
payable at
31 December |
| Product | | Purchases | Amount payable at
31 December | Purchases | Amount
payable at
31 December | Purchases | Amount
payable at
31 December |
| LNG, crude oil and oil products, natural gas, refinery operating costs, plant processing fees | | 1,812 |
| 225 |
| 1,336 |
| 300 |
| 1,257 |
| 176 |
| LNG, crude oil and oil products, natural gas, refinery operating costs, plant processing fees | | 959 | | 84 | | 1,812 | | 225 | | 1,336 | | 300 | |
The terms of the outstanding balances receivable from joint ventures are typically 30 to 45 days. The balances are unsecured and will be settled in cash. There are no0 significant provisions for doubtful debts relating to these balances and no0 significant expense recognized in the income statement in respect of bad or doubtful debts. Dividends receivable are not included in the table above.
bp's share of impairment charges taken by joint ventures in 2020 was $433 million (2019 $25 million reversal) of which $336 million (2019 $25 million reversal) was in the Upstream segment.
17. Investments in associates
The following table provides aggregated summarized financial information for the group’s associates as it relates to the amounts recognized in the group income statement and on the group balance sheet.
| | | | | | $ million |
| | | | | | $ million |
| | | | Income statement | | | Balance sheet |
| | | | Income statement | | Balance sheet |
| | | | Earnings from associates - after interest and tax | | | Investments in associates |
| | | | Earnings from associates
- after interest and tax | | Investments in associates |
| | | 2019 |
| 2018 |
| 2017 |
| 2019 |
| 2018 |
| | | 2020 | 2019 | 2018 | 2020 | 2019 |
| Rosneft | | 2,295 |
| 2,283 |
| 922 |
| 12,927 |
| 10,074 |
| Rosneft | | (229) | | 2,295 | | 2,283 | | 11,808 | | 12,927 | |
| Other associates | | 386 |
| 573 |
| 408 |
| 7,407 |
| 7,599 |
| Other associates | | 128 | | 386 | | 573 | | 7,167 | | 7,407 | |
| | | 2,681 |
| 2,856 |
| 1,330 |
| 20,334 |
| 17,673 |
| | | (101) | | 2,681 | | 2,856 | | 18,975 | | 20,334 | |
The associate that is material to the group at both 31 December 20192020 and 20182019 is Rosneft.
BP
| | | | | | | | | | | | | | |
| 192 | | bp Annual Report and Form 20-F 2020 | | |
17. Investments in associates – continued
bp owns 19.75% of the voting shares of Rosneft which are listed on the MICEX stock exchange in Moscow and its global depository receipts are listed on the London Stock Exchange. TheRosneft’s largest shareholder is Rosneftegaz JSC (Rosneftegaz), which is wholly owned by the Russian federal government, through its investment company JSCgovernment. At 31 December 2020, Rosneftegaz ownedheld 40.4% (2019 50.0% plus one share1 share) of the voting shares of Rosneft at 31 December 2019.Rosneft.
BPbp classifies its investment in Rosneft as an associate because, in management’s judgement, BPbp has significant influence over Rosneft; see Interests in other entities within Note 1 for further information. The group’s investment in Rosneft is a foreign operation whose functional currency is the Russian rouble. The increasedecrease in the group's equity-accounted investment balance for Rosneft at 31 December 20192020 compared with 31 December 20182019 principally relates to earnings from Rosneft andadverse foreign exchange effects, which have been recognized in other comprehensive income, and dividends, partially offset by dividends.bp's share of Rosneft’s changes in equity.
During 2020 Rosneft completed a transaction to transfer all of its interest and cease participation in its Venezuelan businesses to a company owned by the government of the Russian Federation. In consideration, Rosneft received shares equal to a 9.6% share of its own equity. The shares are held by a 100% subsidiary of Rosneft and accounted for as treasury shares. Rosneft also entered into share buyback transactions during the year. These are also accounted for as treasury shares. bp retains 19.75% of the voting rights at meetings of Rosneft shareholders and will continue to be entitled to dividends based on its current shareholding. bp’s economic interest, however, increased as a result of its indirect interest in the shares held by the subsidiary of Rosneft. bp’s share of profit or loss of Rosneft reflects its economic interest. At 31 December 2020, bp's economic interest was 22.03%.
|
| | | |
| BP Annual Report and Form 20-F 2019
| | 189 |
17. InvestmentsOn 28 December 2020 Rosneft completed the acquisition of 100% stakes in associates – continuedJSC Taimyrneftegaz and LLC Taimyrburservis, and the sale of a 10% interest in LLC Vostok Oil. A preliminary assessment of the fair values of the assets and liabilities acquired and the consideration transferred in respect of the acquisitions has been undertaken and the further impact, if any, on bp’s accounting for its equity-accounted investment in Rosneft will be updated once this has been finalised.
The value of BP’sbp’s 19.75% shareholding in Rosneft based on the quoted market share price of $7.21$5.64 per share (2018 $6.18(2019 $7.21 per share) was $15,090$11,804 million at 31 December 2019 (2018 $12,9342020 (2019 $15,090 million). The value of bp's 22.03% economic interest based on the quoted market share price was $13,167 million at 31 December 2020.
The following table provides summarized financial information relating to Rosneft. This information is presented on a 100% basis and reflects adjustments made by BPbp to Rosneft’s own results in applying the equity method of accounting. BPbp adjusts Rosneft’s results for the accounting required under IFRS relating to BP’sbp’s purchase of its interest in Rosneft and the amortization of the deferred gain relating to the disposal of BP’sbp’s interest in TNK-BP. These adjustments have increased the reported profit for 2019, as shown in the table below, compared with the amounts reported in Rosneft's IFRS financial statements. In particular, in 2018 these adjustments resulted in BP reporting a lower amount relating to impairment charges of downstream goodwill than the equivalent amounts reported by Rosneft.
| | | | | | $ million |
| | | | $ million |
| | | | Gross amount |
| | | | Gross amount |
| | | 2019 |
| 2018 |
| 2017 |
| | | 2020 | 2019 | 2018 |
| Sales and other operating revenues | | 134,046 |
| 131,322 |
| 103,028 |
| Sales and other operating revenues | | 82,786 | | 134,046 | | 131,322 | |
| Profit before interest and taxation | | 17,473 |
| 18,886 |
| 9,949 |
| Profit before interest and taxation | | 1,270 | | 17,473 | | 18,886 | |
| Finance costs | | 1,281 |
| 2,785 |
| 2,228 |
| Finance costs | | 1,742 | | 1,281 | | 2,785 | |
| Profit before taxation | | 16,192 |
| 16,101 |
| 7,721 |
| |
| Profit (loss) before taxation | | Profit (loss) before taxation | | (472) | | 16,192 | | 16,101 | |
| Taxation | | 3,058 |
| 2,957 |
| 1,742 |
| Taxation | | 208 | | 3,058 | | 2,957 | |
| Non-controlling interests | | 1,514 |
| 1,585 |
| 1,311 |
| Non-controlling interests | | 482 | | 1,514 | | 1,585 | |
| Profit for the year | | 11,620 |
| 11,559 |
| 4,668 |
| |
| Profit (loss) for the year | | Profit (loss) for the year | | (1,162) | | 11,620 | | 11,559 | |
| Other comprehensive income | | 572 |
| 2,086 |
| 2,810 |
| Other comprehensive income | | 1,653 | | 572 | | 2,086 | |
| Total comprehensive income | | 12,192 |
| 13,645 |
| 7,478 |
| Total comprehensive income | | 491 | | 12,192 | | 13,645 | |
| Non-current assets | | 161,327 |
| 137,038 |
| | Non-current assets | | 175,978 | | 161,327 | | |
| Current assets | | 38,657 |
| 43,438 |
| | Current assets | | 42,459 | | 38,657 | | |
| Total assets | | 199,984 |
| 180,476 |
| | Total assets | | 218,437 | | 199,984 | | |
| Current liabilities | | 44,459 |
| 41,311 |
| | Current liabilities | | 49,781 | | 44,459 | | |
| Non-current liabilities | | 79,327 |
| 78,754 |
| | Non-current liabilities | | 96,727 | | 79,327 | | |
| Total liabilities | | 123,786 |
| 120,065 |
| | Total liabilities | | 146,508 | | 123,786 | | |
| Net assets | | 76,198 |
| 60,411 |
| | Net assets | | 71,929 | | 76,198 | | |
| Less: non-controlling interests | | 10,744 |
| 9,403 |
| | Less: non-controlling interests | | 10,897 | | 10,744 | | |
| | | 65,454 |
| 51,008 |
| | | | 61,032 | | 65,454 | | |
The group received dividends, net of withholding tax, of $785$480 million from Rosneft in 2019 (2018 $6202020 (2019 $785 million and 2017 $3142018 $620 million).
| | | | | | | | | | | | | | |
| | bp Annual Report and Form 20-F 2020 | | 193 |
17. Investments in associates – continued
Summarized financial information for the group’s share of associates is shown below.
| | | | | | | | | | | | | | | | | | | | | | | | | | | | | | | | |
| | | | | | | | | | $ million |
| | | | | | | | | | bp share |
| | | | 2020 | | | 2019 | | | 2018 |
| | Rosnefta | Other | Total | Rosnefta | Other | Total | Rosnefta | Other | Total |
| Sales and other operating revenues | | 17,535 | | 5,946 | | 23,481 | | 26,474 | | 7,934 | | 34,408 | | 25,936 | | 9,134 | | 35,070 | |
| Profit before interest and taxation | | 295 | | 276 | | 571 | | 3,451 | | 788 | | 4,239 | | 3,730 | | 1,150 | | 4,880 | |
| Finance costs | | 372 | | 80 | | 452 | | 253 | | 87 | | 340 | | 550 | | 78 | | 628 | |
| Profit (loss) before taxation | | (77) | | 196 | | 119 | | 3,198 | | 701 | | 3,899 | | 3,180 | | 1,072 | | 4,252 | |
| Taxation | | 51 | | 67 | | 118 | | 604 | | 315 | | 919 | | 584 | | 499 | | 1,083 | |
| Non-controlling interests | | 101 | | 1 | | 102 | | 299 | | 0 | | 299 | | 313 | | 0 | | 313 | |
| Profit (loss) for the year | | (229) | | 128 | | (101) | | 2,295 | | 386 | | 2,681 | | 2,283 | | 573 | | 2,856 | |
| Other comprehensive income | | 336 | | (19) | | 317 | | 113 | | (25) | | 88 | | 412 | | (1) | | 411 | |
| Total comprehensive income | | 107 | | 109 | | 216 | | 2,408 | | 361 | | 2,769 | | 2,695 | | 572 | | 3,267 | |
| Non-current assets | | 33,754 | | 11,449 | | 45,203 | | 31,862 | | 11,504 | | 43,366 | | | | |
| Current assets | | 8,238 | | 1,749 | | 9,987 | | 7,635 | | 1,924 | | 9,559 | | | | |
| Total assets | | 41,992 | | 13,198 | | 55,190 | | 39,497 | | 13,428 | | 52,925 | | | | |
| Current liabilities | | 9,535 | | 1,346 | | 10,881 | | 8,781 | | 1,908 | | 10,689 | | | | |
| Non-current liabilities | | 18,558 | | 4,709 | | 23,267 | | 15,667 | | 4,577 | | 20,244 | | | | |
| Total liabilities | | 28,093 | | 6,055 | | 34,148 | | 24,448 | | 6,485 | | 30,933 | | | | |
| Net assets | | 13,899 | | 7,143 | | 21,042 | | 15,049 | | 6,943 | | 21,992 | | | | |
| Less: non-controlling interests | | 2,091 | | 0 | | 2,091 | | 2,122 | | 0 | | 2,122 | | | | |
| | 11,808 | | 7,143 | | 18,951 | | 12,927 | | 6,943 | | 19,870 | | | | |
| Group investment in associates | | | | | | | | | | |
| Group share of net assets (as above) | | 11,808 | | 7,143 | | 18,951 | | 12,927 | | 6,943 | | 19,870 | | | | |
| Loans made by group companies to associates | | 0 | | 24 | | 24 | | 0 | | 464 | | 464 | | | | |
| | 11,808 | | 7,167 | | 18,975 | | 12,927 | | 7,407 | | 20,334 | | | | |
a In 2014-2019, Rosneft adopted hedge accounting in relation to a portion of highly probable future export revenue denominated in US dollars. Foreign exchange gains and losses arising on the retranslation of borrowings denominated in currencies other than the Russian rouble and designated as hedging instruments were recognized initially in other comprehensive income, and were reclassified to the income statement as the hedged revenue was recognized. |
| | | | | | | | | | | | | | | | | | | |
| | | | | | | | | | | $ million |
|
| | | | | | | | | | | BP share |
|
| | | | | 2019 |
| | | 2018 |
| | | 2017 |
|
| | | Rosnefta |
| Other |
| Total |
| Rosnefta |
| Other |
| Total |
| Rosnefta |
| Other |
| Total |
|
| Sales and other operating revenues | | 26,474 |
| 7,934 |
| 34,408 |
| 25,936 |
| 9,134 |
| 35,070 |
| 20,348 |
| 7,600 |
| 27,948 |
|
| Profit before interest and taxation | | 3,451 |
| 788 |
| 4,239 |
| 3,730 |
| 1,150 |
| 4,880 |
| 1,965 |
| 626 |
| 2,591 |
|
| Finance costs | | 253 |
| 87 |
| 340 |
| 550 |
| 78 |
| 628 |
| 440 |
| 54 |
| 494 |
|
| Profit before taxation | | 3,198 |
| 701 |
| 3,899 |
| 3,180 |
| 1,072 |
| 4,252 |
| 1,525 |
| 572 |
| 2,097 |
|
| Taxation | | 604 |
| 315 |
| 919 |
| 584 |
| 499 |
| 1,083 |
| 344 |
| 164 |
| 508 |
|
| Non-controlling interests | | 299 |
| — |
| 299 |
| 313 |
| — |
| 313 |
| 259 |
| — |
| 259 |
|
| Profit for the year | | 2,295 |
| 386 |
| 2,681 |
| 2,283 |
| 573 |
| 2,856 |
| 922 |
| 408 |
| 1,330 |
|
| Other comprehensive income | | 113 |
| (25 | ) | 88 |
| 412 |
| (1 | ) | 411 |
| 555 |
| 1 |
| 556 |
|
| Total comprehensive income | | 2,408 |
| 361 |
| 2,769 |
| 2,695 |
| 572 |
| 3,267 |
| 1,477 |
| 409 |
| 1,886 |
|
| Non-current assets | | 31,862 |
| 11,504 |
| 43,366 |
| 27,065 |
| 10,787 |
| 37,852 |
| | | |
| Current assets | | 7,635 |
| 1,924 |
| 9,559 |
| 8,579 |
| 2,398 |
| 10,977 |
| | | |
| Total assets | | 39,497 |
| 13,428 |
| 52,925 |
| 35,644 |
| 13,185 |
| 48,829 |
| | | |
| Current liabilities | | 8,781 |
| 1,908 |
| 10,689 |
| 8,159 |
| 2,232 |
| 10,391 |
| | | |
| Non-current liabilities | | 15,667 |
| 4,577 |
| 20,244 |
| 15,554 |
| 3,817 |
| 19,371 |
| | | |
| Total liabilities | | 24,448 |
| 6,485 |
| 30,933 |
| 23,713 |
| 6,049 |
| 29,762 |
| | | |
| Net assets | | 15,049 |
| 6,943 |
| 21,992 |
| 11,931 |
| 7,136 |
| 19,067 |
| | | |
| Less: non-controlling interests | | 2,122 |
| — |
| 2,122 |
| 1,857 |
| — |
| 1,857 |
| | | |
| | | 12,927 |
| 6,943 |
| 19,870 |
| 10,074 |
| 7,136 |
| 17,210 |
| | | |
| Group investment in associates | | | | | | | | | | |
| Group share of net assets (as above) | | 12,927 |
| 6,943 |
| 19,870 |
| 10,074 |
| 7,136 |
| 17,210 |
| | | |
| Loans made by group companies to associates | | — |
| 464 |
| 464 |
| — |
| 463 |
| 463 |
| | | |
| | | 12,927 |
| 7,407 |
| 20,334 |
| 10,074 |
| 7,599 |
| 17,673 |
| | | |
| |
a
| From 1 October 2014, Rosneft adopted hedge accounting in relation to a portion of highly probable future export revenue denominated in US dollars over a five-year period. Foreign exchange gains and losses arising on the retranslation of borrowings denominated in currencies other than the Russian rouble and designated as hedging instruments are recognized initially in other comprehensive income, and are reclassified to the income statement as the hedged revenue is recognized. |
|
| | | |
190 | | BP Annual Report and Form 20-F 2019
| |
17. InvestmentsDuring the year, bp and Reliance Industries completed the formation of a new fuels and mobility venture, Reliance BP Mobility Limited, that will operate across India under the Jio-bp brand. bp invested $1 billion to acquire a 49% stake in associates – continuedthe company.
Transactions between the group and its associates are summarized below.
| | | | | | $ million |
| | | | $ million |
| Sales to associates | | | 2019 |
| | 2018 |
| | 2017 |
| Sales to associates | | | 2020 | | 2019 | | 2018 |
| Product | | Sales |
| Amount receivable at
31 December |
| Sales |
| Amount receivable at
31 December |
| Sales |
| Amount receivable at
31 December |
| Product | | Sales | Amount receivable at
31 December | Sales | Amount receivable at
31 December | Sales | Amount receivable at
31 December |
| LNG, crude oil and oil products, natural gas | | 1,544 |
| 243 |
| 2,064 |
| 393 |
| 1,612 |
| 216 |
| LNG, crude oil and oil products, natural gas | | 855 | | 169 | | 1,544 | | 243 | | 2,064 | | 393 | |
| | | | | | |
| | | | $ million |
| | | | $ million |
| Purchases from associates | | | 2019 |
| | 2018 |
| | 2017 |
| Purchases from associates | | | 2020 | | 2019 | | 2018 |
| Product | | Purchases |
| Amount payable at
31 December |
| Purchases |
| Amount payable at
31 December |
| Purchases |
| Amount payable at
31 December |
| Product | | Purchases | Amount payable at
31 December | Purchases | Amount
payable at
31 December | Purchases | Amount
payable at
31 December |
| Crude oil and oil products, natural gas, transportation tariff | | 9,503 |
| 1,641 |
| 14,112 |
| 2,069 |
| 11,613 |
| 1,681 |
| Crude oil and oil products, natural gas, transportation tariff | | 4,926 | | 1,280 | | 9,503 | | 1,641 | | 14,112 | | 2,069 | |
In addition to the transactions shown in the table above, in 2018 BPbp acquired a 49% stake in LLC Kharampurneftegaz, a Rosneft subsidiary, which develops resources within the Kharampurskoe and Festivalnoye licence areas in Yamalo-Nenets in northern Russia. BP’sbp’s interest in LLC Kharampurneftegaz is accounted for as an associate.
The terms of the outstanding balances receivable from associates are typically 30 to 45 days. The balances are unsecured and will be settled in cash. There are no0 significant provisions for doubtful debts relating to these balances and no0 significant expense recognized in the income statement in respect of bad or doubtful debts. Dividends receivable are not included in the table above.
The majority of purchases from associates relate to crude oil and oil products transactions with Rosneft. Sales to associates are related to various entities.
BPbp has commitments amounting to $11,198$10,777 million (2018 $11,303(2019 $11,198 million), primarily in relation to contracts with its associates for the purchase of transportation capacity. For information on capital commitments in relation to associates see Note 13.
bp's share of impairment charges taken by associates in 2020 was $414 million (2019 $152 million).
18.Other investments
|
| | | | | | | | | |
| | | | | | $ million |
|
| | | | 2019 |
| | 2018 |
|
| | | Current |
| Non-current |
| Current |
| Non-current |
|
Equity investmentsa | | — |
| 571 |
| 1 |
| 482 |
|
| Other | | 169 |
| 705 |
| 221 |
| 859 |
|
| | | 169 |
| 1,276 |
| 222 |
| 1,341 |
|
| | | | | | | | | | | | | | |
a
194 | The majority of equity investments are unlisted. | bp Annual Report and Form 20-F 2020 | | |
18.Other investments includes $598 million relating
| | | | | | | | | | | | | | | | | |
| | | | | $ million |
| | | 2020 | | 2019 |
| | Current | Non-current | Current | Non-current |
Equity investmentsa | | 0 | | 913 | | 0 | | 571 | |
| Contingent consideration | | 317 | | 1,682 | | 122 | | 476 | |
| Other | | 16 | | 151 | | 47 | | 229 | |
| | 333 | | 2,746 | | 169 | | 1,276 | |
a Approximately half of the group's equity investments are unlisted.
Contingent consideration relates to contingent consideration amounts arising on disposals (2018 $893 million) which are financial assets classified as measured at fair value through profit or loss. The fair value is determined using an estimate of discounted future cash flows that are expected to be received and is considered a level 3 valuation under the fair value hierarchy. Future cash flows are estimated based on inputs including oil and natural gas prices, production volumes and operating costs related to the disposed operations. The discount rate used is based on a risk-free rate adjusted for asset-specific risks. The contingent consideration principally relates to the disposal of our Alaskan business.
19.Inventories
| | | | | | | | | | | |
| | | $ million |
| | 2020 | 2019 |
| Crude oil | | 4,498 | | 5,610 | |
| Natural gas | | 265 | | 222 | |
Emissions allowancesa | | 1,297 | | 1,193 | |
| Refined petroleum and petrochemical products | | 8,791 | | 11,714 | |
| | 14,851 | | 18,739 | |
| Trading inventories | | 292 | | 182 | |
| | 15,143 | | 18,921 | |
| Supplies | | 1,730 | | 1,959 | |
| | 16,873 | | 20,880 | |
| Cost of inventories expensed in the income statement | | 132,104 | | 209,672 | |
|
| | | | | |
| | | | $ million |
|
| | | 2019 |
| 2018 |
|
| Crude oil | | 5,610 |
| 4,878 |
|
| Natural gas | | 222 |
| 322 |
|
| Refined petroleum and petrochemical products | | 12,907 |
| 10,419 |
|
| | | 18,739 |
| 15,619 |
|
| Trading inventories | | 182 |
| 282 |
|
| | | 18,921 |
| 15,901 |
|
| Supplies | | 1,959 |
| 2,087 |
|
| | | 20,880 |
| 17,988 |
|
| Cost of inventories expensed in the income statement | | 209,672 |
| 229,878 |
|
The inventory valuation at 31 December 20192020 is stated net of a provision of $650$584 million (2018 $1,009(2019 $650 million) to write down inventories to their net realizable value, of which $290$216 million (2018 $604(2019 $290 million) relates to hydrocarbon inventories. The net credit to the income statement in the year in respect of inventory net realizable value provisions was $17 million (2019 $348 million (2018 $552 million charge)credit), of which $71 million credit (2019 $309 million credit (2018 $553 million charge)credit) related to hydrocarbon inventories.
Trading inventories are valued using quoted benchmark prices adjusted as appropriate for location and quality differentials. They are predominantly categorized within level 2 of the fair value hierarchy.
|
| | | |
| BP Annual Report and Form 20-F 2019
| | 191 |
20.Trade and other receivables
| | | | | | | | | | | | | | | | | |
| | | | | $ million |
| | | 2020 | | 2019 |
| | Current | Non-current | Current | Non-current |
| Financial assets | | | | | |
| Trade receivables | | 12,926 | | 19 | | 19,424 | | 22 | |
| Amounts receivable from joint ventures and associates | | 339 | | 10 | | 672 | | 2 | |
Receivables related to disposalsa | | 1,291 | | 2,402 | | 159 | | 125 | |
| Other receivables | | 2,628 | | 637 | | 3,166 | | 701 | |
| | 17,184 | | 3,068 | | 23,421 | | 850 | |
| Non-financial assets | | | | | |
| Gulf of Mexico oil spill trust fund reimbursement asset | | 32 | | 0 | | 201 | | 0 | |
| Sales taxes and production taxes | | 557 | | 504 | | 640 | | 538 | |
| Other receivables | | 175 | | 779 | | 180 | | 759 | |
| | 764 | | 1,283 | | 1,021 | | 1,297 | |
| | 17,948 | | 4,351 | | 24,442 | | 2,147 | |
|
| | | | | | | | | |
| | | | | | $ million |
|
| | | | 2019 |
| | 2018 |
|
| | | Current |
| Non-current |
| Current |
| Non-current |
|
| Financial assets | | | | | |
| Trade receivables | | 19,424 |
| 22 |
| 19,414 |
| 7 |
|
| Amounts receivable from joint ventures and associates | | 672 |
| 2 |
| 642 |
| 2 |
|
| Other receivables | | 3,325 |
| 826 |
| 3,275 |
| 740 |
|
| | | 23,421 |
| 850 |
| 23,331 |
| 749 |
|
| Non-financial assets | | | | | |
| Gulf of Mexico oil spill trust fund reimbursement asset | | 201 |
| — |
| 214 |
| — |
|
| Sales taxes and production taxes | | 640 |
| 538 |
| 790 |
| 482 |
|
| Other receivables | | 180 |
| 759 |
| 143 |
| 603 |
|
| | | 1,021 |
| 1,297 |
| 1,147 |
| 1,085 |
|
| | | 24,442 |
| 2,147 |
| 24,478 |
| 1,834 |
|
In both 20192020 and 20182019 the group entered into non-recourse arrangements to discount certain receivables in support of supply and trading activities and the management of credit risk.
Trade and other receivables, other than certain receivables related to disposals, are predominantly non-interest bearing. See Note 29 for further information.
| | | | | | | | | | | | | | |
| | bp Annual Report and Form 20-F 2020 | | 195 |
21. Valuation and qualifying accounts
| | | | | | | | | | | | | | | | | | | | | | | |
| | | | | | | $ million |
| | | 2020 | | 2019 | | 2018 |
| | Trade and other receivables | Fixed asset
investments | Trade and other receivables | Fixed asset
investments | Trade and other receivables | Fixed asset
investments |
| At 1 January – IAS 39 | | 509 | | 249 | | 416 | | 235 | | 335 | | 314 | |
| Adjustment on adoption of IFRS 9 | | — | | — | | — | | — | | 115 | | (85) | |
| At 1 January – IFRS 9 | | 509 | | 249 | | 416 | | 235 | | 450 | | 229 | |
| Charged to costs and expenses | | 214 | | 103 | | 206 | | 28 | | 30 | | 10 | |
Charged to other accountsa | | 2 | | 0 | | (2) | | 0 | | (12) | | (1) | |
| Deductions | | (170) | | (166) | | (111) | | (14) | | (52) | | (3) | |
| At 31 December | | 555 | | 186 | | 509 | | 249 | | 416 | | 235 | |
| | | | | | | |
| | | | | | | |
| | | | | | | |
| | | | | | | |
| | | | | | | |
| | | | | | | |
| | | | | | | |
| | | | | | | |
| | | | | | | |
| | | | | | | |
| | | | | | | |
| | | | | | | |
| | | | | | | |
| | | | | | | |
| | | | | | | |
| | | | | | | |
| | | | | | | |
| | | | | | | |
| | | | | | | |
| | | | | | | |
| | | | | | | |
| | | | | | | |
|
| | | | | | | | | | | | | |
| | | | | | | | $ million |
|
| | | | 2019 |
| | 2018 |
| | 2017 |
|
| | | Trade and other receivables |
| Fixed asset investments |
| Trade and other receivables |
| Fixed asset investments |
| Trade and other receivables |
| Fixed asset investments |
|
| At 1 January – IAS 39 | | 416 |
| 235 |
| 335 |
| 314 |
| 392 |
| 335 |
|
| Adjustment on adoption of IFRS 9 | | — |
| — |
| 115 |
| (85 | ) | — |
| — |
|
| At 1 January – IFRS 9 | | 416 |
| 235 |
| 450 |
| 229 |
| 392 |
| 335 |
|
| Charged to costs and expenses | | 206 |
| 28 |
| 30 |
| 10 |
| 68 |
| 47 |
|
Charged to other accountsa | | (2 | ) | — |
| (12 | ) | (1 | ) | 13 |
| 3 |
|
| Deductions | | (111 | ) | (14 | ) | (52 | ) | (3 | ) | (138 | ) | (71 | ) |
| At 31 December | | 509 |
| 249 |
| 416 |
| 235 |
| 335 |
| 314 |
|
a Principally exchange adjustments.adjustments.
Valuation and qualifying accounts relating to trade and other receivables comprise expected credit loss allowances in 2019 and 2018 and impairment provisions recognized on an incurred loss basis in 2017.allowances. The adjustment on adoption of IFRS 9 relates to the additional loss allowance required by IFRS 9's expected credit loss model. The expected credit loss allowance comprises $456 million (2019 $414 million, (20182018 $327 million) relating to receivables that were credit-impaired at the end of the year and $99 million (2019 $95 million, (20182018 $89 million) relating to receivables that were not credit-impaired at the end of the year. There were noWhilst credit risk has increased since 31 December 2019, there has also been a significant changes toreduction in the gross carrying amounts ofgroup's trade and other receivables duringbalance. Therefore, the year that affected the estimation of thetotal expected credit loss allowanceallowances recognized as at 31 December 2019.2020 have not significantly increased during the year.
Valuation and qualifying accounts relating to fixed asset investments comprise impairment provisions for investments in equity-accounted entities in 2019 and 2018. This includes expected credit loss allowances of $2 million (2018 $44 million) relating to loans that form part of the net investment in equity-accounted entities. The adjustment on adoption of IFRS 9 primarily relates to amounts provided against investments in equity instruments that were held at cost less impairment losses under IAS 39 but that are classified as measured at fair value through profit or loss under IFRS 9.
In addition to the amounts presented above, expected loss allowances on cash and cash equivalents classified as measured at amortized cost totalled $11 million (2018(2019 $11 million). For further information on the group's credit risk management policies and how the group recognizes and measures expected losses see Note 29.
Valuation and qualifying accounts are deducted in the balance sheet from the assets to which they apply.
|
| | | |
192 | | BP Annual Report and Form 20-F 2019
| |
22. Trade and other payables
| | | | | | | | | | | | | | | | | |
| | | | | $ million |
| | | 2020 | | 2019 |
| | Current | Non-current | Current | Non-current |
| Financial liabilities | | | | | |
| Trade payables | | 23,157 | | 0 | | 30,538 | | 0 | |
| Amounts payable to joint ventures and associates | | 1,364 | | 0 | | 1,866 | | 0 | |
| Payables for capital expenditure and acquisitions | | 2,297 | | 1,033 | | 3,868 | | 1,196 | |
| Payables related to the Gulf of Mexico oil spill | | 1,399 | | 9,988 | | 1,617 | | 10,863 | |
| Other payables | | 5,041 | | 681 | | 5,810 | | 133 | |
| | 33,258 | | 11,702 | | 43,699 | | 12,192 | |
| Non-financial liabilities | | | | | |
| Sales taxes, customs duties, production taxes and social security | | 2,103 | | 73 | | 2,381 | | 33 | |
| Other payables | | 653 | | 337 | | 749 | | 401 | |
| | 2,756 | | 410 | | 3,130 | | 434 | |
| | 36,014 | | 12,112 | | 46,829 | | 12,626 | |
|
| | | | | | | | | |
| | | | | | $ million |
|
| | | | 2019 |
| | 2018 |
|
| | | Current |
| Non-current |
| Current |
| Non-current |
|
| Financial liabilities | | | | | |
| Trade payables | | 30,538 |
| — |
| 26,252 |
| — |
|
| Amounts payable to joint ventures and associates | | 1,866 |
| — |
| 2,369 |
| — |
|
Payables for capital expenditure and acquisitionsa | | 3,868 |
| 1,196 |
| 7,325 |
| 1,345 |
|
| Payables related to the Gulf of Mexico oil spill | | 1,617 |
| 10,863 |
| 2,279 |
| 11,922 |
|
| Other payables | | 5,810 |
| 133 |
| 4,980 |
| 318 |
|
| | | 43,699 |
| 12,192 |
| 43,205 |
| 13,585 |
|
| Non-financial liabilities | | | | | |
| Sales taxes, customs duties, production taxes and social security | | 2,381 |
| 33 |
| 2,272 |
| 35 |
|
| Other payables | | 749 |
| 401 |
| 788 |
| 210 |
|
| | | 3,130 |
| 434 |
| 3,060 |
| 245 |
|
| | | 46,829 |
| 12,626 |
| 46,265 |
| 13,830 |
|
| |
a
| 2018 includes $3,514 million deferred consideration relating to the acquisition of Petrohawk Energy Corporation from BHP Billiton Petroleum (North America) Inc. See Note 3 for further information. |
Materially all of BP'sbp's trade payables have payment terms in the range of 30 to 60 days and give rise to operating cash flows.
Trade and other payables, other than those relating to the Gulf of Mexico oil spill, are predominantly interest free. See Note 29 (c) for further information.
Payables related to the Gulf of Mexico oil spill include amounts payable under the 2016 consent decree and settlement agreement with the United States and five5 Gulf coast states, including amounts payable for natural resource damages, state claims and Clean Water Act penalties. On a discounted basis the amounts included in other payables related to the Gulf of Mexico oil spill for these elements of the agreements are $5,166$4,837 million payable over 12 years, $2,584 million payable over 13 years $2,742and $3,549 million payable over 14 years and $3,782 million payable over 1312 years respectively at 31 December 2019.2020. Reported within net cash provided by operating activities in the group cash flow statement is a net cash outflow of $1,786 million (2019 outflow of $2,694 million, (20182018 outflow of $3,531 million, 2017 outflow of $5,336 million) related to the Gulf of Mexico oil spill, which includes payments made in relation to these agreements. For 2018 and 2017 payments under the 2012 agreement with the US government to resolve all federal criminal claims arising from the incident are also included. For full details of these agreements, see BPbp Annual Report and Form 20-F 2015.- Legal Proceedings.
Payables related to the Gulf of Mexico oil spill at 31 December 20192020 also include amounts payable for settled economic loss and property damage claims which are payable over a period of up to eightseven years.
23.Provisions | | | | | | | | | | | | | | |
| 196 | | bp Annual Report and Form 20-F 2020 | | |
|
| | | | | | | | | | | |
| | | | | | | $ million |
|
| | | Decommissioning |
| Environmental |
| Litigation and claims |
| Other |
| Total |
|
At 1 January 2019a | | 13,613 |
| 1,567 |
| 1,718 |
| 3,306 |
| 20,204 |
|
| Exchange adjustments | | 74 |
| (1 | ) | — |
| (19 | ) | 54 |
|
| Acquisitions | | 13 |
| — |
| 47 |
| 22 |
| 82 |
|
| Increase (decrease) in existing provisions | | 1,045 |
| 272 |
| 290 |
| 960 |
| 2,567 |
|
| Write-back of unused provisions | | (22 | ) | (43 | ) | (15 | ) | (361 | ) | (441 | ) |
| Unwinding of discount | | 415 |
| 45 |
| 28 |
| 17 |
| 505 |
|
| Change in discount rate | | 1,360 |
| 40 |
| 31 |
| 11 |
| 1,442 |
|
| Utilization | | (9 | ) | (252 | ) | (674 | ) | (665 | ) | (1,600 | ) |
| Reclassified to other payables | | (187 | ) | — |
| (139 | ) | (328 | ) | (654 | ) |
| Reclassified as liabilities directly associated with assets held for sale | | (1,004 | ) | (8 | ) | — |
| — |
| (1,012 | ) |
| Deletions | | (188 | ) | — |
| (5 | ) | (3 | ) | (196 | ) |
| At 31 December 2019 | | 15,110 |
| 1,620 |
| 1,281 |
| 2,940 |
| 20,951 |
|
| Of which – current | | 317 |
| 280 |
| 558 |
| 1,298 |
| 2,453 |
|
| – non-current | | 14,793 |
| 1,340 |
| 723 |
| 1,642 |
| 18,498 |
|
| Of which – Gulf of Mexico oil spill | | — |
| — |
| 189 |
| — |
| 189 |
|
a Includes adjustment of $92 million for the implementation of IFRS 16. See Note 1 for further information. 23.Provisions
| | | | | | | | | | | | | | | | | | | | | | | |
| | | | | | | $ million |
| | Decommissioning | Environmental | Litigation and claims | Emissions | Other | Total |
| At 1 January 2020 | | 15,110 | | 1,620 | | 1,281 | | 919 | | 2,021 | | 20,951 | |
| Exchange adjustments | | 96 | | 9 | | 1 | | 25 | | 84 | | 215 | |
| | | | | | | |
| Increase (decrease) in existing provisions | | (686) | | 297 | | 260 | | 1,429 | | 974 | | 2,274 | |
| Write-back of unused provisions | | (11) | | (88) | | (12) | | (17) | | (341) | | (469) | |
| Unwinding of discount | | 369 | | 39 | | 18 | | 0 | | 11 | | 437 | |
| | | | | | | |
| Utilization | | (7) | | (246) | | (508) | | (687) | | (378) | | (1,826) | |
| Reclassified to other payables | | (245) | | 0 | | (129) | | 0 | | (86) | | (460) | |
| Reclassified as liabilities directly associated with assets held for sale | | (10) | | 0 | | 0 | | 0 | | 0 | | (10) | |
| Deletions | | (140) | | (2) | | (1) | | 0 | | (8) | | (151) | |
| At 31 December 2020 | | 14,476 | | 1,629 | | 910 | | 1,669 | | 2,277 | | 20,961 | |
| Of which – current | | 428 | | 273 | | 260 | | 1,621 | | 1,179 | | 3,761 | |
| – non-current | | 14,048 | | 1,356 | | 650 | | 48 | | 1,098 | | 17,200 | |
| | | | | | | |
The decommissioning provision comprises the future cost of decommissioning oil and natural gas wells, facilities and related pipelines. The environmental provision includes provisions for costs related to the control, abatement, clean-up or elimination of environmental pollution relating to soil, groundwater, surface water and sediment contamination. The litigation and claims category includes provisions for matters related to, for example, commercial disputes, product liability, and allegations of exposures of third parties to toxic substances. The emissions provision relates to the group’s obligation to transfer emissions allowances under relevant regulations. The provision will principally be settled through allowances already held as inventory in the group balance sheet.Included within the other category at 31 December 20192020 are reinvent bp restructuring provisions for deferred employee compensationtermination payments of $311 million (2018 $338 million).$428 million.
For information on significant estimates and judgements made in relation to provisions, see Provisions and contingencies within Note 1.
|
| | | |
| BP Annual Report and Form 20-F 2019
| | 193 |
23.Provisions – continued
Gulf of Mexico oil spill
The group has recognized certain assets, payables and provisions and incurs certain residual costs relating to the Gulf of Mexico oil spill that occurred in 2010. In addition to the Litigation and claims narrative provided in this note, for further information see Notes 7, 9, 20, 22, 29, 33 and Legal proceedings on pages 319-320.33.
Litigation and claims - PSC settlements
The Economic and Property Damages Settlement Agreement (EPD Settlement Agreement) with the Plaintiff's Steering Committee (PSC) provides for a court-supervised settlement programme, ,the DHCSSP,the Deepwater Horizon Court Supervised Settlement Programme (DHCSSP), which commenced operation on 4 June 2012. On 22 January 2021, the United States District Court for the Eastern District of Louisiana issued an order determining the completion of all claims processing operations of the DHCSSP. The Court also concluded that future issues concerning EPD Settlement Agreement claims would be time barred under the DHCSSP and the claim administrator would proceed to complete post-closure administrative wind down activities. Amounts payable for settled economic and property damage claims are reported within payables - see Note 22 for further information.
A separate claims administrator was appointed to pay medical claims and to implement other aspects of the Medical Benefits Class Action Settlement. For further information on the PSC settlements, see Legal proceedings on page 319.226.
The litigation and claims provision reflects the latest estimate for the remaining costs associated with the PSC settlements. These costs relate predominantly to business economic loss (BEL) claims and associated administration costs. Only a very small numberGulf of claims remained to be determined by the end of 2019 however certain BEL claims determined by the DHCSSP have been and continue to be appealed by BP and/or the claimants. Claims under appeal will ultimately only be resolved once the full judicial appeals process has been concluded, including appeals to the Federal District Court and Fifth Circuit, as may be the case, or when settlements are reached with individual claimants. Depending upon the ultimate resolution of these claims, theMexico oil spill. The amounts payable may differ from those currently provided. Payments to resolve outstanding claims under the PSC settlements are expected to be made overamount provided and the next couple of years. The timing of payments however, is uncertain, and, in particular, will be impacted by how long it takes to resolve claims that have been appealed and may be appealed in the future.uncertain.
24. Pensions and other post-retirement benefits
Most group companies have pension plans, the forms and benefits of which vary with conditions and practices in the countries concerned. Pension benefits may be provided through defined contribution plans (money purchase schemes) or defined benefit plans (final salary and other types of schemes with committed pension benefit payments). For defined contribution plans, retirement benefits are determined by the value of funds arising from contributions paid in respect of each employee. For defined benefit plans, retirement benefits are based on such factors as an employee’s pensionable salary and length of service. Defined benefit plans may be funded or unfunded. The assets of funded plans are generally held in separately administered trusts.
For information on significant estimates and judgements made in relation to accounting for these plans see Pensions and other post-retirement benefits in Note 1.
The primary pension arrangement in the UK is a funded final salary pension plan under which retired employees draw the majority of their benefit as an annuity. This pension plan is governed by a corporate trustee whose board is composed of four4 member-nominated directors, four4 company-nominated directors, an1 independent director and an1 independent chairman nominated by the company. The trustee board is required by law to act in the best interests of the plan participants and is responsible for setting certain policies, such as investment policies of the plan. The UK plan is closed to new joiners but remainsand is currently under consultation for closure to future accrual. As at 31 December 2020, it remained open to ongoing accrual for current members. New joiners in the UK are eligible for membership of a defined contribution plan.
In the US, all pension benefits now accrue under a cash balance formula. Benefits previously accrued under final salary formulas are legally protected. Retiring US employees typically take their pension benefit in the form of a lump sum payment upon retirement. The plan is funded and its assets are overseen by a fiduciary Investment Committee. During 20192020 the committee was composed of six BP7 bp employees appointed by the president of BPbp Corporation North America Inc. (the appointing officer). A seventh BP employee was added to the committee on 1 January 2020. The Investment Committee is required by law to act in the best interests of the plan participants and is responsible for setting certain policies, such as the investment policies of the plan. US employees are also eligible to participate in a defined contribution (401k) plan in which employee contributions are matched with company contributions. In the US, group companies also provide post-retirement healthcare to most retired employees and their dependants (and, in certain cases, life insurance coverage); the entitlement to these benefits is usually based on the employee remaining in service until a specified age and completion of a minimum period of service.
| | | | | | | | | | | | | | |
| | bp Annual Report and Form 20-F 2020 | | 197 |
24. Pensions and other post-retirement benefits – continued
In the Eurozone, there are defined benefit pension plans in Germany, France, the Netherlands and other countries. In Germany and France, the majority of the pensions are unfunded, in line with market practice. In Germany, the group’s largest Eurozone plan, employees receive a pension and also have a choice to supplement their core pension through salary sacrifice. For employees who joined since 2002, the core pension benefit is a career average plan with retirement benefits based on such factors as an employee’s pensionable salary and length of service. The returns on the notional contributions made by both the company and employees are based on the interest rate which is set out in German tax law. Retired German employees take their pension benefit typically in the form of an annuity. The German plans are governed by legal agreements between BPbp and the works council or between BPbp and the trade union.
The level of contributions to funded defined benefit plans is the amount needed to provide adequate funds to meet pension obligations as they fall due. During 20192020 the aggregate level of contributions was $325 million (2019 $349 million (2018and 2018 $610 million and 2017 $637 million). The aggregate level of contributions in 20202021 is expected to be approximately $550$400 million, and includes contributions in all countries that we expect to be required to make contributions by law or under contractual agreements, as well as an allowance for discretionary funding.
For the primary UK plan there is a funding agreement between the group and the trustee. On an annual basis the latest funding position is reviewed and a schedule of contributions is agreed covering the next five years. Contractually committed funding amounted to $1,276$1,014 million at 31 December 2019,2020, all of which relates to future service. This amount is included in the group’s committed cash flows relating to pensions and other post-retirement benefit plans as set out in the table of contractual obligations on page 302.307.
The surplus relating to the primary UK pension plan is recognized on the balance sheet on the basis that the company is entitled to a refund of any remaining assets once all members have left the plan.
Pension contributionsMinimum pension funding in the US areis determined by legislation and areis supplemented by discretionary contributions. No contributions were made into the primary US pension plan in 20192020 and no statutory funding requirement is expected in the next 12 months.
The surplus relating to the primary US fund is recognized on the balance sheet on the basis that economic benefit can be gained from the surplus through a reduction in future contributions.
There was no minimum funding requirement for the US plan, and no significant minimum funding requirements in other countries at 31 December 2019.
|
| | | |
194 | | BP Annual Report and Form 20-F 2019
| |
24. Pensions and other post-retirement benefits – continued2020.
The obligation and cost of providing pensions and other post-retirement benefits is assessed annually using the projected unit credit method. The date of the most recent actuarial review was 31 December 2019.2020. The UK plans are subject to a formal actuarial valuation every three years; valuations are required more frequently in many other countries. Thecountries.The most recent formal actuarial valuation of the UK pension plans was as at 31 December 2017.2017, and a valuation as at 31 December 2020 is currently underway. A valuation of the US plan and largest Eurozone plans are carried out annually.
The material financial assumptions used to estimate the benefit obligations of the various plans are set out below. The assumptions are reviewed by management at the end of each year and are used to evaluate the accrued benefit obligation at 31 December and pension expense for the following year.
| | | | | | % | | | | % |
| Financial assumptions used to determine benefit obligation | | | UK | | US | | Eurozone | Financial assumptions used to determine benefit obligation | | | UK | | US | | Eurozone |
| | 2019 | 2018 | 2017 | 2019 | 2018 | 2017 | 2019 | 2018 | 2017 | | 2020 | 2019 | 2018 | 2020 | 2019 | 2018 | 2020 | 2019 | 2018 |
| Discount rate for plan liabilities | | 2.1 | 2.9 | 2.5 | 3.1 | 4.1 | 3.5 | 1.3 | 2.0 | 1.9 | Discount rate for plan liabilities | | 1.4 | | 2.1 | | 2.9 | | 2.2 | | 3.1 | | 4.1 | | 1.0 | | 1.3 | | 2.0 | |
| Rate of increase in salaries | | 3.4 | 3.8 | 4.1 | 3.9 | 3.9 | 4.1 | 3.1 | 3.1 | 3.0 | Rate of increase in salaries | | 3.6 | | 3.4 | | 3.8 | | 4.1 | | 3.9 | | 3.9 | | 2.9 | | 3.1 | | 3.1 | |
| Rate of increase for pensions in payment | | 2.7 | 3.0 | 2.9 | — | — | 1.5 | 1.5 | 1.4 | Rate of increase for pensions in payment | | 2.8 | | 2.7 | | 3.0 | | 0 | | 0 | | 0 | | 1.3 | | 1.5 | | 1.5 | |
| Rate of increase in deferred pensions | | 2.7 | 3.0 | 2.9 | — | — | 0.5 | 0.5 | 0.6 | Rate of increase in deferred pensions | | 2.8 | | 2.7 | | 3.0 | | 0 | | 0 | | 0 | | 0.5 | | 0.5 | | 0.5 | |
| Inflation for plan liabilities | | 2.7 | 3.1 | 1.5 | 1.5 | 1.7 | 1.7 | 1.7 | 1.6 | Inflation for plan liabilities | | 2.9 | | 2.7 | | 3.1 | | 1.7 | | 1.5 | | 1.5 | | 1.5 | | 1.7 | | 1.7 | |
| | | | % | | | | % |
| Financial assumptions used to determine benefit expense | | | UK | | US | | Eurozone | Financial assumptions used to determine benefit expense | | | UK | | US | | Eurozone |
| | 2019 | 2018 | 2017 | 2019 | 2018 | 2017 | 2019 | 2018 | 2017 | | 2020 | 2019 | 2018 | 2020 | 2019 | 2018 | 2020 | 2019 | 2018 |
| Discount rate for plan service cost | | 3.0 | 2.6 | 2.7 | 4.2 | 3.6 | 4.1 | 2.5 | 2.4 | 2.1 | Discount rate for plan service cost | | 2.1 | | 3.0 | | 2.6 | | 3.2 | | 4.2 | | 3.6 | | 1.8 | | 2.5 | | 2.4 | |
| Discount rate for plan other finance expense | | 2.9 | 2.5 | 2.7 | 4.1 | 3.5 | 3.9 | 2.0 | 1.9 | 1.7 | Discount rate for plan other finance expense | | 2.1 | | 2.9 | | 2.5 | | 3.1 | | 4.1 | | 3.5 | | 1.3 | | 2.0 | | 1.9 | |
| Inflation for plan service cost | | 3.1 | 3.1 | 3.2 | 1.5 | 1.7 | 1.8 | 1.7 | 1.6 | Inflation for plan service cost | | 2.6 | | 3.1 | | 3.1 | | 1.5 | | 1.5 | | 1.7 | | 1.7 | | 1.7 | | 1.6 | |
The discount rate assumptions are based on third-party AA corporate bond indices and for our largest plans in the UK, US and the Eurozone we use yields that reflect the maturity profile of the expected benefit payments. The inflation rate assumptions for our UK and US plans are based on the difference between the yields on index-linked and fixed-interest long-term government bonds. In other countries, including the Eurozone, we use this approach, or advice from the local actuary depending on the information available. The inflation assumptions are used to determine the rate of increase for pensions in payment and the rate of increase in deferred pensions where there is such an increase.
The assumptions for the rate of increase in salaries are based on the inflation assumption plus an allowance for expected long-term real salary growth. These include an allowance for promotion-related salary growth, of up to 0.8% depending on country.
| | | | | | | | | | | | | | |
| 198 | | bp Annual Report and Form 20-F 2020 | | |
24. Pensions and other post-retirement benefits – continued
In addition to the financial assumptions, we regularly review the demographic and mortality assumptions. The mortality assumptions reflect best practice in the countries in which we provide pensions and have been chosen with regard to applicable published tables adjusted where appropriate to reflect the experience of the group and an extrapolation of past longevity improvements into the future. BP’sbp’s most substantial pension liabilities are in the UK, the US and the Eurozone where our mortality assumptions are as follows:
| | | | | | Years |
| | | | Years |
| Mortality assumptions | | | UK |
| | US |
| | Eurozone |
| Mortality assumptions | | | UK | | US | | Eurozone |
| | | 2019 |
| 2018 |
| 2017 |
| 2019 |
| 2018 |
| 2017 |
| 2019 |
| 2018 |
| 2017 |
| | 2020 | 2019 | 2018 | 2020 | 2019 | 2018 | 2020 | 2019 | 2018 |
| Life expectancy at age 60 for a male currently aged 60 | | 27.3 |
| 27.4 |
| 27.4 |
| 24.9 |
| 25.1 |
| 25.1 |
| 25.7 |
| 25.6 |
| 25.1 |
| Life expectancy at age 60 for a male currently aged 60 | | 26.9 | | 27.3 | | 27.4 | | 24.7 | | 24.9 | | 25.1 | | 25.7 | | 25.7 | | 25.6 | |
| Life expectancy at age 60 for a male currently aged 40 | | 28.9 |
| 28.9 |
| 29.0 |
| 26.7 |
| 26.9 |
| 26.8 |
| 28.3 |
| 28.1 |
| 27.6 |
| Life expectancy at age 60 for a male currently aged 40 | | 28.4 | | 28.9 | | 28.9 | | 26.4 | | 26.7 | | 26.9 | | 28.2 | | 28.3 | | 28.1 | |
| Life expectancy at age 60 for a female currently aged 60 | | 28.7 |
| 28.8 |
| 28.8 |
| 28.0 |
| 28.5 |
| 28.4 |
| 29.1 |
| 29.0 |
| 29.0 |
| Life expectancy at age 60 for a female currently aged 60 | | 28.8 | | 28.7 | | 28.8 | | 27.7 | | 28.0 | | 28.5 | | 29.0 | | 29.1 | | 29.0 | |
| Life expectancy at age 60 for a female currently aged 40 | | 30.5 |
| 30.6 |
| 30.5 |
| 29.7 |
| 30.1 |
| 30.0 |
| 31.2 |
| 31.2 |
| 31.4 |
| Life expectancy at age 60 for a female currently aged 40 | | 30.4 | | 30.5 | | 30.6 | | 29.2 | | 29.7 | | 30.1 | | 31.2 | | 31.2 | | 31.2 | |
Pension plan assets are generally held in trusts, the primary objective of which is to accumulate assets sufficient to meet the obligations of the plans. The assets of the trusts are invested in a manner consistent with fiduciary obligations and principles that reflect current practices in portfolio management.
A significant proportion of the assets are held in equities, which are expected to generate a higher level of return over the long term, with an acceptable level of risk. In order to provide reasonable assurance that no single security or type of security has an unwarranted impact on the total portfolio, the investment portfolios are highly diversified.
The trustee’s long-term investment objective for the primary UK plan as it matures is to invest in assets whose value changes in the same way as the plan liabilities, in order to reduce the level of funding risk. To move towards this objective, the UK plan uses a liability driven investment (LDI) approach for part of the portfolio, investing primarily in government bonds to achieve this matching effect for the most significant plan liability assumptions of interest rate and inflation rate. This is partly funded by short-term sale and repurchase agreements, whereby the plan borrows money using existing bonds as security and which will be bought back at a specified price at an agreed future date. The funds raised are used to invest in further bonds to increase the proportion of assets which match the plan liabilities. The borrowings are shown separately in the analysis of pension plan assets in the table below.
For the primary UK pension plan there is an agreement with the trustee to increase the proportion of assets with liability matching characteristics over time primarily by reducing the proportion of plan assets held as equities and increasing the proportion held as bonds. During 2020, the UK plan switched 11% of plan assets from equities to bonds (2019 2%). There is a similar agreement in place for the primary US plan. Duringplan, although no switches have taken place in 2019 the UK and the US plans switched 2% and nil of plan assets respectively from equities to bonds (2018 12.5% and 10% respectively).
|
| | | |
| BP Annual Report and Form 20-F 2019
| | 195 |
24. Pensions and other post-retirement benefits – continuedor 2020.
The current asset allocation policy for the major plans at 31 December 20192020 was as follows:
| | | | | UK | US | | | UK | US |
| Asset category | | % | Asset category | | % |
| Total equity (including private equity) | | 28 | 40 | Total equity (including private equity) | | 17 | | 40 | |
| Bonds/cash (including LDI) | | 65 | 60 | Bonds/cash (including LDI) | | 76 | | 60 | |
| Property/real estate | | 7 | — | Property/real estate | | 7 | | 0 | |
The amounts invested under the LDI programme by the primary UK pension plan as at 31 December 20192020 were $4,804$4,217 million (2018 $4,197(2019 $4,804 million) of government-issued nominal bonds and $19,462$24,576 million (2018 $17,491(2019 $19,462 million) of index-linked bonds.
Some of the group’s pension plans in the Eurozone and other countries use derivative financial instruments as part of their asset mix to manage the level of risk. The fair value of these instruments areis included in other assets in the table below. The UK and US plans do not use derivative financial instruments.
The group’s main pension plans do not invest directly in either securities or property/real estate of the company or of any subsidiary.
The fair values of the various categories of assets held by the defined benefit plans at 31 December are presented in the table below, including the effects of derivative financial instruments. Movements in the fair value of plan assets during the year are shown in detail in the table on page 197.201.
|
| | | | | | | | | | | |
| | | | | | | $ million |
|
| | | UKa |
| USb |
| Eurozone |
| Other |
| Total |
|
| Fair value of pension plan assets | | | | | | |
| At 31 December 2019 | | | | | | |
| Listed equities – developed markets | | 6,285 |
| 1,290 |
| 495 |
| 371 |
| 8,441 |
|
| – emerging markets | | 1,096 |
| 124 |
| 61 |
| 64 |
| 1,345 |
|
Private equityc | | 2,675 |
| 1,474 |
| — |
| 3 |
| 4,152 |
|
Government issued nominal bondsd | | 4,884 |
| 2,100 |
| 959 |
| 572 |
| 8,515 |
|
Government issued index-linked bondsd | | 19,462 |
| — |
| 100 |
| — |
| 19,562 |
|
Corporate bondsd | | 6,132 |
| 2,304 |
| 569 |
| 256 |
| 9,261 |
|
Propertye | | 2,507 |
| — |
| 96 |
| 27 |
| 2,630 |
|
| Cash | | 426 |
| 289 |
| 33 |
| 93 |
| 841 |
|
| Other | | 98 |
| 74 |
| 30 |
| 26 |
| 228 |
|
| Debt (repurchase agreements) used to fund liability driven investments | | (7,436 | ) | — |
| — |
| — |
| (7,436 | ) |
| | | 36,129 |
| 7,655 |
| 2,343 |
| 1,412 |
| 47,539 |
|
| At 31 December 2018 | | | | | | |
| Listed equities – developed markets | | 5,191 |
| 1,238 |
| 413 |
| 306 |
| 7,148 |
|
| – emerging markets | | 950 |
| 63 |
| 65 |
| 56 |
| 1,134 |
|
Private equityc | | 2,792 |
| 1,495 |
| — |
| 4 |
| 4,291 |
|
Government issued nominal bondsd | | 4,263 |
| 2,072 |
| 895 |
| 533 |
| 7,763 |
|
Government issued index-linked bondsd | | 17,491 |
| — |
| 102 |
| — |
| 17,593 |
|
Corporate bondsd | | 4,606 |
| 2,184 |
| 506 |
| 243 |
| 7,539 |
|
Propertye | | 2,311 |
| 6 |
| 57 |
| 25 |
| 2,399 |
|
| Cash | | 376 |
| 73 |
| 42 |
| 83 |
| 574 |
|
| Other | | 116 |
| 64 |
| 32 |
| 40 |
| 252 |
|
| Debt (repurchase agreements) used to fund liability driven investments | | (6,011 | ) | — |
| — |
| — |
| (6,011 | ) |
| | | 32,085 |
| 7,195 |
| 2,112 |
| 1,290 |
| 42,682 |
|
| At 31 December 2017 | | | | | | |
| Listed equities – developed markets | | 9,548 |
| 2,158 |
| 537 |
| 376 |
| 12,619 |
|
| – emerging markets | | 2,220 |
| 220 |
| 83 |
| 53 |
| 2,576 |
|
Private equityc | | 2,679 |
| 1,461 |
| — |
| — |
| 4,140 |
|
Government issued nominal bondsd | | 2,663 |
| 1,777 |
| 941 |
| 545 |
| 5,926 |
|
Government issued index-linked bondsd | | 16,177 |
| — |
| 2 |
| — |
| 16,179 |
|
Corporate bondsd | | 4,682 |
| 2,024 |
| 546 |
| 272 |
| 7,524 |
|
Propertye | | 2,211 |
| 6 |
| 71 |
| 30 |
| 2,318 |
|
| Cash | | 390 |
| 80 |
| 21 |
| 98 |
| 589 |
|
| Other | | 104 |
| 53 |
| 23 |
| 45 |
| 225 |
|
| Debt (repurchase agreements) used to fund liability driven investments | | (5,583 | ) | — |
| — |
| — |
| (5,583 | ) |
| | | 35,091 |
| 7,779 |
| 2,224 |
| 1,419 |
| 46,513 |
|
| | | | | | | | | | | | | | |
a
| Bonds held by the UK pension plans are denominated in sterling. Property held by the UK pension plans is in the United Kingdom. | bp Annual Report and Form 20-F 2020 | | 199 |
| |
b
| Bonds held by the US pension plans are denominated in US dollars. |
24. Pensions and other post-retirement benefits – continued
| | | | | | | | | | | | | | | | | | | | |
| | | | | | $ million |
| | | UKa | USb | Eurozone | Other | Total |
| Fair value of pension plan assets | | | | | | |
| At 31 December 2020 | | | | | | |
| Listed equities – developed markets | | 5,008 | | 1,112 | | 542 | | 318 | | 6,980 | |
| – emerging markets | | 418 | | 115 | | 68 | | 70 | | 671 | |
Private equityc | | 2,899 | | 1,604 | | 0 | | 4 | | 4,507 | |
Government issued nominal bondsd | | 4,303 | | 1,839 | | 1,111 | | 616 | | 7,869 | |
Government issued index-linked bondsd | | 24,576 | | 0 | | 107 | | 0 | | 24,683 | |
Corporate bondsd | | 8,906 | | 2,398 | | 587 | | 279 | | 12,170 | |
Propertye | | 2,553 | | 0 | | 110 | | 28 | | 2,691 | |
| Cash | | 1,392 | | 267 | | 51 | | 163 | | 1,873 | |
| Other | | 795 | | 131 | | 104 | | 30 | | 1,060 | |
| Debt (repurchase agreements) used to fund liability driven investments | | (9,387) | | 0 | | 0 | | 0 | | (9,387) | |
| | 41,463 | | 7,466 | | 2,680 | | 1,508 | | 53,117 | |
| At 31 December 2019 | | | | | | |
| Listed equities – developed markets | | 6,285 | | 1,290 | | 495 | | 371 | | 8,441 | |
| – emerging markets | | 1,096 | | 124 | | 61 | | 64 | | 1,345 | |
Private equityc | | 2,675 | | 1,474 | | 0 | | 3 | | 4,152 | |
Government issued nominal bondsd | | 4,884 | | 2,100 | | 959 | | 572 | | 8,515 | |
Government issued index-linked bondsd | | 19,462 | | 0 | | 100 | | 0 | | 19,562 | |
Corporate bondsd | | 6,132 | | 2,304 | | 569 | | 256 | | 9,261 | |
Propertye | | 2,507 | | 0 | | 96 | | 27 | | 2,630 | |
| Cash | | 426 | | 289 | | 33 | | 93 | | 841 | |
| Other | | 98 | | 74 | | 30 | | 26 | | 228 | |
| Debt (repurchase agreements) used to fund liability driven investments | | (7,436) | | 0 | | 0 | | 0 | | (7,436) | |
| | 36,129 | | 7,655 | | 2,343 | | 1,412 | | 47,539 | |
| At 31 December 2018 | | | | | | |
| Listed equities – developed markets | | 5,191 | | 1,238 | | 413 | | 306 | | 7,148 | |
| – emerging markets | | 950 | | 63 | | 65 | | 56 | | 1,134 | |
Private equityc | | 2,792 | | 1,495 | | 0 | | 4 | | 4,291 | |
Government issued nominal bondsd | | 4,263 | | 2,072 | | 895 | | 533 | | 7,763 | |
Government issued index-linked bondsd | | 17,491 | | 0 | | 102 | | 0 | | 17,593 | |
Corporate bondsd | | 4,606 | | 2,184 | | 506 | | 243 | | 7,539 | |
Propertye | | 2,311 | | 6 | | 57 | | 25 | | 2,399 | |
| Cash | | 376 | | 73 | | 42 | | 83 | | 574 | |
| Other | | 116 | | 64 | | 32 | | 40 | | 252 | |
| Debt (repurchase agreements) used to fund liability driven investments | | (6,011) | | 0 | | 0 | | 0 | | (6,011) | |
| | 32,085 | | 7,195 | | 2,112 | | 1,290 | | 42,682 | |
a Bonds held by the UK pension plans are denominated in sterling. Property held by the UK pension plans is in the United Kingdom.
b Bonds held by the US pension plans are denominated in US dollars.
c Private equity is valued at fair value based on the most recent transaction price or third-party net asset, revenue or earnings based valuations that generally result in the use of significant unobservable inputs.
d Bonds held by pension plans are valued using quoted prices in active markets.
e Properties are valued based on an analysis of recent market transactions supported by market knowledge derived from third-party professional valuers that generally result in the use of significant unobservable inputs.
|
| | | | | | | | | | | | | |
196200 | | BPbp Annual Report and Form 20-F 2019
2020 | | |
24. Pensions and other post-retirement benefits – continued
| | | | | | | | | | | | | | | | | | | | |
| | | | | | $ million |
| | | | | | 2020 |
| | UK | US | Eurozone | Other | Total |
| Analysis of the amount charged to profit or loss | | | | | | |
Current service costa | | 250 | | 292 | | 103 | | 38 | | 683 | |
Past service costb | | (48) | | (66) | | 12 | | (20) | | (122) | |
Settlementb | | 0 | | (23) | | 10 | | (1) | | (14) | |
| Operating charge relating to defined benefit plans | | 202 | | 203 | | 125 | | 17 | | 547 | |
| Payments to defined contribution plans | | 49 | | 183 | | 2 | | 38 | | 272 | |
| Total operating charge | | 251 | | 386 | | 127 | | 55 | | 819 | |
Interest income on plan assetsa | | (725) | | (210) | | (33) | | (40) | | (1,008) | |
| Interest on plan liabilities | | 596 | | 289 | | 97 | | 59 | | 1,041 | |
| Other finance (income) expense | | (129) | | 79 | | 64 | | 19 | | 33 | |
| Analysis of the amount recognized in other comprehensive income | | | | | | |
| Actual asset return less interest income on plan assets | | 4,108 | | 1,041 | | 104 | | 38 | | 5,291 | |
| Change in financial assumptions underlying the present value of the plan liabilities | | (4,207) | | (1,178) | | (143) | | (42) | | (5,570) | |
| Change in demographic assumptions underlying the present value of the plan liabilities | | 585 | | 29 | | 56 | | (4) | | 666 | |
| Experience gains and losses arising on the plan liabilities | | 54 | | (101) | | (178) | | 8 | | (217) | |
| Remeasurements recognized in other comprehensive income | | 540 | | (209) | | (161) | | 0 | | 170 | |
| Movements in benefit obligation during the year | | | | | | |
| Benefit obligation at 1 January | | 29,780 | | 10,119 | | 7,353 | | 1,826 | | 49,078 | |
| Exchange adjustments | | 1,303 | | 0 | | 720 | | 64 | | 2,087 | |
| Operating charge relating to defined benefit plans | | 202 | | 203 | | 125 | | 17 | | 547 | |
| Interest cost | | 596 | | 289 | | 97 | | 59 | | 1,041 | |
Contributions by plan participantsc | | 21 | | 0 | | 2 | | 11 | | 34 | |
Benefit payments (funded plans)d | | (1,291) | | (1,441) | | (81) | | (86) | | (2,899) | |
Benefit payments (unfunded plans)d | | (8) | | (197) | | (265) | | (34) | | (504) | |
| Reclassified as assets held for sale | | 0 | | (1) | | (55) | | 0 | | (56) | |
| Disposals | | 0 | | (35) | | 0 | | 0 | | (35) | |
| Remeasurements | | 3,568 | | 1,250 | | 265 | | 38 | | 5,121 | |
Benefit obligation at 31 Decembera e | | 34,171 | | 10,187 | | 8,161 | | 1,895 | | 54,414 | |
| Movements in fair value of plan assets during the year | | | | | | |
| Fair value of plan assets at 1 January | | 36,129 | | 7,655 | | 2,343 | | 1,412 | | 47,539 | |
| Exchange adjustments | | 1,582 | | 0 | | 235 | | 64 | | 1,881 | |
Interest income on plan assetsa f | | 725 | | 210 | | 33 | | 40 | | 1,008 | |
Contributions by plan participantsc | | 21 | | 0 | | 2 | | 11 | | 34 | |
| Contributions by employers (funded plans) | | 189 | | 8 | | 99 | | 29 | | 325 | |
Benefit payments (funded plans)d | | (1,291) | | (1,441) | | (81) | | (86) | | (2,899) | |
| Reclassified as assets held for sale | | 0 | | (7) | | (55) | | 0 | | (62) | |
| | | | | | |
Remeasurementsf | | 4,108 | | 1,041 | | 104 | | 38 | | 5,291 | |
Fair value of plan assets at 31 Decemberg | | 41,463 | | 7,466 | | 2,680 | | 1,508 | | 53,117 | |
| Surplus (deficit) at 31 December | | 7,292 | | (2,721) | | (5,481) | | (387) | | (1,297) | |
| Represented by | | | | | | |
| Asset recognized | | 7,567 | | 269 | | 59 | | 62 | | 7,957 | |
| Liability recognized | | (275) | | (2,990) | | (5,540) | | (449) | | (9,254) | |
| | 7,292 | | (2,721) | | (5,481) | | (387) | | (1,297) | |
| The surplus (deficit) may be analysed between funded and unfunded plans as follows | | | | | | |
| Funded | | 7,564 | | 269 | | (109) | | (58) | | 7,666 | |
| Unfunded | | (272) | | (2,990) | | (5,372) | | (329) | | (8,963) | |
| | 7,292 | | (2,721) | | (5,481) | | (387) | | (1,297) | |
| The defined benefit obligation may be analysed between funded and unfunded plans as follows | | | | | | |
| Funded | | (33,899) | | (7,197) | | (2,789) | | (1,566) | | (45,451) | |
| Unfunded | | (272) | | (2,990) | | (5,372) | | (329) | | (8,963) | |
| | (34,171) | | (10,187) | | (8,161) | | (1,895) | | (54,414) | |
|
| | | | | | | | | | | |
| | | | | | | $ million |
|
| | | | | | | 2019 |
|
| | | UK |
| US |
| Eurozone |
| Other |
| Total |
|
| Analysis of the amount charged to profit or loss | | | | | | |
Current service costa | | 227 |
| 263 |
| 81 |
| 38 |
| 609 |
|
Past service costb | | 2 |
| — |
| 5 |
| (1 | ) | 6 |
|
Settlementb | | — |
| (13 | ) | 8 |
| — |
| (5 | ) |
| Operating charge relating to defined benefit plans | | 229 |
| 250 |
| 94 |
| 37 |
| 610 |
|
| Payments to defined contribution plans | | 42 |
| 188 |
| 7 |
| 38 |
| 275 |
|
| Total operating charge | | 271 |
| 438 |
| 101 |
| 75 |
| 885 |
|
Interest income on plan assetsa | | (909 | ) | (285 | ) | (43 | ) | (46 | ) | (1,283 | ) |
| Interest on plan liabilities | | 757 |
| 387 |
| 133 |
| 69 |
| 1,346 |
|
| Other finance (income) expense | | (152 | ) | 102 |
| 90 |
| 23 |
| 63 |
|
| Analysis of the amount recognized in other comprehensive income | | | | | | |
| Actual asset return less interest income on plan assets | | 2,945 |
| 1,079 |
| 220 |
| 97 |
| 4,341 |
|
| Change in financial assumptions underlying the present value of the plan liabilities | | (2,294 | ) | (1,036 | ) | (748 | ) | (92 | ) | (4,170 | ) |
| Change in demographic assumptions underlying the present value of the plan liabilities | | 136 |
| 91 |
| 3 |
| (4 | ) | 226 |
|
| Experience gains and losses arising on the plan liabilities | | (57 | ) | (22 | ) | 6 |
| 4 |
| (69 | ) |
| Remeasurements recognized in other comprehensive income | | 730 |
| 112 |
| (519 | ) | 5 |
| 328 |
|
| Movements in benefit obligation during the year | | | | | | |
| Benefit obligation at 1 January | | 26,830 |
| 9,696 |
| 6,906 |
| 1,686 |
| 45,118 |
|
| Exchange adjustments | | 942 |
| — |
| (142 | ) | 26 |
| 826 |
|
| Operating charge relating to defined benefit plans | | 229 |
| 250 |
| 94 |
| 37 |
| 610 |
|
| Interest cost | | 757 |
| 387 |
| 133 |
| 69 |
| 1,346 |
|
Contributions by plan participantsc | | 20 |
| — |
| 2 |
| 6 |
| 28 |
|
Benefit payments (funded plans)d | | (1,207 | ) | (830 | ) | (76 | ) | (75 | ) | (2,188 | ) |
Benefit payments (unfunded plans)d | | (6 | ) | (205 | ) | (273 | ) | (15 | ) | (499 | ) |
| Reclassified as assets held for sale | | — |
| (146 | ) | — |
| — |
| (146 | ) |
| Disposals | | — |
| — |
| (30 | ) | — |
| (30 | ) |
| Remeasurements | | 2,215 |
| 967 |
| 739 |
| 92 |
| 4,013 |
|
Benefit obligation at 31 Decembera e | | 29,780 |
| 10,119 |
| 7,353 |
| 1,826 |
| 49,078 |
|
| Movements in fair value of plan assets during the year | |
|
|
|
|
|
| Fair value of plan assets at 1 January | | 32,085 |
| 7,195 |
| 2,112 |
| 1,290 |
| 42,682 |
|
| Exchange adjustments | | 1,141 |
| — |
| (43 | ) | 24 |
| 1,122 |
|
Interest income on plan assetsa f | | 909 |
| 285 |
| 43 |
| 46 |
| 1,283 |
|
Contributions by plan participantsc | | 20 |
| — |
| 2 |
| 6 |
| 28 |
|
| Contributions by employers (funded plans) | | 236 |
| 4 |
| 85 |
| 24 |
| 349 |
|
Benefit payments (funded plans)d | | (1,207 | ) | (830 | ) | (76 | ) | (75 | ) | (2,188 | ) |
| Reclassified as assets held for sale | | — |
| (78 | ) | — |
| — |
| (78 | ) |
Remeasurementsf | | 2,945 |
| 1,079 |
| 220 |
| 97 |
| 4,341 |
|
Fair value of plan assets at 31 Decemberg | | 36,129 |
| 7,655 |
| 2,343 |
| 1,412 |
| 47,539 |
|
| Surplus (deficit) at 31 December | | 6,349 |
| (2,464 | ) | (5,010 | ) | (414 | ) | (1,539 | ) |
| Represented by | |
|
|
|
|
|
| Asset recognized | | 6,588 |
| 387 |
| 27 |
| 51 |
| 7,053 |
|
| Liability recognized | | (239 | ) | (2,851 | ) | (5,037 | ) | (465 | ) | (8,592 | ) |
| | | 6,349 |
| (2,464 | ) | (5,010 | ) | (414 | ) | (1,539 | ) |
| The surplus (deficit) may be analysed between funded and unfunded plans as follows | |
|
|
|
|
|
| Funded | | 6,588 |
| 387 |
| (136 | ) | (87 | ) | 6,752 |
|
| Unfunded | | (239 | ) | (2,851 | ) | (4,874 | ) | (327 | ) | (8,291 | ) |
| | | 6,349 |
| (2,464 | ) | (5,010 | ) | (414 | ) | (1,539 | ) |
| The defined benefit obligation may be analysed between funded and unfunded plans as follows | |
|
|
|
|
|
| Funded | | (29,541 | ) | (7,268 | ) | (2,479 | ) | (1,499 | ) | (40,787 | ) |
| Unfunded | | (239 | ) | (2,851 | ) | (4,874 | ) | (327 | ) | (8,291 | ) |
| | | (29,780 | ) | (10,119 | ) | (7,353 | ) | (1,826 | ) | (49,078 | ) |
| |
a
| The costs of managing plan investments are offset against the investment return, the costs of administering pension plan benefits are generally included in current service cost and the costs of administering other post-retirement benefit plans are included in the benefit obligation. |
| |
b
| Past service costs and settlements in the Eurozone have arisen from restructuring programmes and represent charges for special termination benefits reflecting the increased liability arising as a result of early retirements. Settlements in the US are the result of a buy-out transaction for the pensions of a group of low value annuitants. |
| |
c
| Most of the contributions made by plan participants into UK pension plans were made under salary sacrifice. |
| |
d
| The benefit payments amount shown above comprises $2,304 million benefits and $346 million settlements, plus $37 million of plan expenses incurred in the administration of the benefit. |
| |
e
| The benefit obligation for the US is made up of $7,789 million for pension liabilities and $2,330 million for other post-retirement benefit liabilities (which are unfunded and are primarily retiree medical liabilities). The benefit obligation for the Eurozone includes $4,567 million for pension liabilities in Germany which is largely unfunded. |
| |
f
| The actual return on plan assets is made up of the sum of the interest income on plan assets and the remeasurement of plan assets as disclosed above. |
| |
g
| The fair value of plan assets includes borrowings related to the LDI programme as described on page 196. |
|
| | | |
| BP Annual Report and Form 20-F 2019
| | 197 |
24. Pensions and other post-retirement benefits – continued
|
| | | | | | | | | | | |
| | | | | | | $ million |
|
| | | | | | | 2018 |
|
| | | UK |
| US |
| Eurozone |
| Other |
| Total |
|
| Analysis of the amount charged to profit or loss | | | | | | |
Current service costa | | 295 |
| 299 |
| 84 |
| 43 |
| 721 |
|
Past service costb | | 15 |
| — |
| 9 |
| 4 |
| 28 |
|
Settlementb | | — |
| — |
| 17 |
| — |
| 17 |
|
| Operating charge relating to defined benefit plans | | 310 |
| 299 |
| 110 |
| 47 |
| 766 |
|
| Payments to defined contribution plans | | 38 |
| 178 |
| 5 |
| 40 |
| 261 |
|
| Total operating charge | | 348 |
| 477 |
| 115 |
| 87 |
| 1,027 |
|
Interest income on plan assetsa | | (868 | ) | (262 | ) | (44 | ) | (45 | ) | (1,219 | ) |
| Interest on plan liabilities | | 774 |
| 369 |
| 136 |
| 67 |
| 1,346 |
|
| Other finance (income) expense | | (94 | ) | 107 |
| 92 |
| 22 |
| 127 |
|
| Analysis of the amount recognized in other comprehensive income | | | | | | |
| Actual asset return less interest income on plan assets | | (722 | ) | (256 | ) | (69 | ) | (36 | ) | (1,083 | ) |
| Change in financial assumptions underlying the present value of the plan liabilities | | 1,770 |
| 945 |
| 14 |
| 65 |
| 2,794 |
|
| Change in demographic assumptions underlying the present value of the plan liabilities | | 123 |
| (9 | ) | (42 | ) | 7 |
| 79 |
|
| Experience gains and losses arising on the plan liabilities | | 520 |
| 41 |
| (43 | ) | 9 |
| 527 |
|
| Remeasurements recognized in other comprehensive income | | 1,691 |
| 721 |
| (140 | ) | 45 |
| 2,317 |
|
| Movements in benefit obligation during the year | | | | | | |
| Benefit obligation at 1 January | | 31,513 |
| 10,820 |
| 7,275 |
| 1,873 |
| 51,481 |
|
| Exchange adjustments | | (1,589 | ) | — |
| (303 | ) | (113 | ) | (2,005 | ) |
| Operating charge relating to defined benefit plans | | 310 |
| 299 |
| 110 |
| 47 |
| 766 |
|
| Interest cost | | 774 |
| 369 |
| 136 |
| 67 |
| 1,346 |
|
Contributions by plan participantsc | | 21 |
| — |
| 2 |
| 7 |
| 30 |
|
Benefit payments (funded plans)d | | (1,780 | ) | (597 | ) | (84 | ) | (83 | ) | (2,544 | ) |
Benefit payments (unfunded plans)d | | (6 | ) | (218 | ) | (301 | ) | (17 | ) | (542 | ) |
| Disposals | | — |
| — |
| — |
| (14 | ) | (14 | ) |
| Remeasurements | | (2,413 | ) | (977 | ) | 71 |
| (81 | ) | (3,400 | ) |
Benefit obligation at 31 Decembera e | | 26,830 |
| 9,696 |
| 6,906 |
| 1,686 |
| 45,118 |
|
| Movements in fair value of plan assets during the year | | | | | | |
| Fair value of plan assets at 1 January | | 35,091 |
| 7,779 |
| 2,224 |
| 1,419 |
| 46,513 |
|
| Exchange adjustments | | (1,883 | ) | — |
| (93 | ) | (73 | ) | (2,049 | ) |
Interest income on plan assetsa f | | 868 |
| 262 |
| 44 |
| 45 |
| 1,219 |
|
Contributions by plan participantsc | | 21 |
| — |
| 2 |
| 7 |
| 30 |
|
| Contributions by employers (funded plans) | | 490 |
| 7 |
| 88 |
| 25 |
| 610 |
|
Benefit payments (funded plans)d | | (1,780 | ) | (597 | ) | (84 | ) | (83 | ) | (2,544 | ) |
| Disposals | | — |
| — |
| — |
| (14 | ) | (14 | ) |
Remeasurementsf | | (722 | ) | (256 | ) | (69 | ) | (36 | ) | (1,083 | ) |
Fair value of plan assets at 31 Decemberg | | 32,085 |
| 7,195 |
| 2,112 |
| 1,290 |
| 42,682 |
|
| Surplus (deficit) at 31 December | | 5,255 |
| (2,501 | ) | (4,794 | ) | (396 | ) | (2,436 | ) |
| Represented by | | | | | | |
| Asset recognized | | 5,473 |
| 418 |
| 29 |
| 35 |
| 5,955 |
|
| Liability recognized | | (218 | ) | (2,919 | ) | (4,823 | ) | (431 | ) | (8,391 | ) |
| | | 5,255 |
| (2,501 | ) | (4,794 | ) | (396 | ) | (2,436 | ) |
| The surplus (deficit) may be analysed between funded and unfunded plans as follows | | | | | | |
| Funded | | 5,473 |
| 396 |
| (152 | ) | (97 | ) | 5,620 |
|
| Unfunded | | (218 | ) | (2,897 | ) | (4,642 | ) | (299 | ) | (8,056 | ) |
| | | 5,255 |
| (2,501 | ) | (4,794 | ) | (396 | ) | (2,436 | ) |
| The defined benefit obligation may be analysed between funded and unfunded plans as follows | | | | | | |
| Funded | | (26,612 | ) | (6,799 | ) | (2,264 | ) | (1,387 | ) | (37,062 | ) |
| Unfunded | | (218 | ) | (2,897 | ) | (4,642 | ) | (299 | ) | (8,056 | ) |
| | | (26,830 | ) | (9,696 | ) | (6,906 | ) | (1,686 | ) | (45,118 | ) |
| |
a
| The costs of managing plan investments are offset against the investment return, the costs of administering pension plan benefits are generally included in current service cost and the costs of administering other post-retirement benefit plans are included in the benefit obligation. |
| |
b
| Past service costs and settlements have arisen from restructuring programmes and represent charges for special termination benefits representing the increased liability arising as a result of early retirements mostly in the UK and Eurozone. |
| |
c
| Most of the contributions made by plan participants into UK pension plans were made under salary sacrifice. |
| |
d
| The benefit payments amount shown above comprises $3,046 million benefits and $2 million settlements, plus $38 million of plan expenses incurred in the administration of the benefit. |
| |
e
| The benefit obligation for the US is made up of $7,290 million for pension liabilities and $2,406 million for other post-retirement benefit liabilities (which are unfunded and are primarily retiree medical liabilities). The benefit obligation for the Eurozone includes $4,328 million for pension liabilities in Germany which is largely unfunded. |
| |
f
| The actual return on plan assets is made up of the sum of the interest income on plan assets and the remeasurement of plan assets as disclosed above. |
| |
g
| The fair value of plan assets includes borrowings related to the LDI programme as described on page 196. |
|
| | | |
198 | | BP Annual Report and Form 20-F 2019
| |
24. Pensions and other post-retirement benefits – continued
|
| | | | | | | | | | | |
| | | | | | | $ million |
|
| | | | | | | 2017 |
|
| | | UK |
| US |
| Eurozone |
| Other |
| Total |
|
| Analysis of the amount charged to profit or loss | | | | | | |
Current service costa | | 357 |
| 292 |
| 85 |
| 46 |
| 780 |
|
Past service costb | | 12 |
| — |
| 5 |
| (1 | ) | 16 |
|
| Settlement | | — |
| — |
| 13 |
| — |
| 13 |
|
| Operating charge relating to defined benefit plans | | 369 |
| 292 |
| 103 |
| 45 |
| 809 |
|
| Payments to defined contribution plans | | 31 |
| 191 |
| 7 |
| 38 |
| 267 |
|
| Total operating charge | | 400 |
| 483 |
| 110 |
| 83 |
| 1,076 |
|
Interest income on plan assetsa | | (845 | ) | (266 | ) | (37 | ) | (48 | ) | (1,196 | ) |
| Interest on plan liabilities | | 831 |
| 393 |
| 121 |
| 71 |
| 1,416 |
|
| Other finance (income) expense | | (14 | ) | 127 |
| 84 |
| 23 |
| 220 |
|
| Analysis of the amount recognized in other comprehensive income | | | | | | |
| Actual asset return less interest income on plan assets | | 2,396 |
| 826 |
| 30 |
| 43 |
| 3,295 |
|
| Change in financial assumptions underlying the present value of the plan liabilities | | (236 | ) | (514 | ) | 336 |
| (47 | ) | (461 | ) |
| Change in demographic assumptions underlying the present value of the plan liabilities | | 734 |
| 72 |
| — |
| (23 | ) | 783 |
|
| Experience gains and losses arising on the plan liabilities | | 91 |
| (40 | ) | (36 | ) | 14 |
| 29 |
|
| Remeasurements recognized in other comprehensive income | | 2,985 |
| 344 |
| 330 |
| (13 | ) | 3,646 |
|
a The costs of managing plan investments are offset against the investment return, the costs of administering pension plan benefits are generally included in current service cost and the costs of administering other post-retirement benefit plans are included in the benefit obligation.
b Past service credits represent curtailment gains arising from restructuring programmes in the UK, US and other countries, whilst past service costs and settlements in the Eurozone represent charges for special termination benefits reflecting the increased liability arising as a result of early retirements. Settlement costs in the US resulted from a pension risk transfer to an external carrier for a group of small benefit retirees.
c Most of the contributions made by plan participants into UK pension plans were made under salary sacrifice.
d The benefit payments amount shown above comprises $2,935 million benefits and $428 million settlements, plus $40 million of plan expenses incurred in the administration of the benefit.
e The benefit obligation for the US is made up of $7,728 million for pension liabilities and $2,459 million for other post-retirement benefit liabilities (which are unfunded and are primarily retiree medical liabilities). The benefit obligation for the Eurozone includes $5,060 million for pension liabilities in Germany which is largely unfunded.
f The actual return on plan assets is made up of the sum of the interest income on plan assets and the remeasurement of plan assets as disclosed above.
g The fair value of plan assets includes borrowings related to the LDI programme as described on page 199.
| | | | | | | | | | | | | | |
| | bp Annual Report and Form 20-F 2020 | | 201 |
24. Pensions and other post-retirement benefits – continued
| | | | | | | | | | | | | | | | | | | | |
| | | | | | $ million |
| | | | | | 2019 |
| | UK | US | Eurozone | Other | Total |
| Analysis of the amount charged to profit or loss | | | | | | |
Current service costa | | 227 | | 263 | | 81 | | 38 | | 609 | |
Past service costb | | 2 | | 0 | | 5 | | (1) | | 6 | |
Settlementb | | 0 | | (13) | | 8 | | 0 | | (5) | |
| Operating charge relating to defined benefit plans | | 229 | | 250 | | 94 | | 37 | | 610 | |
| Payments to defined contribution plans | | 42 | | 188 | | 7 | | 38 | | 275 | |
| Total operating charge | | 271 | | 438 | | 101 | | 75 | | 885 | |
Interest income on plan assetsa | | (909) | | (285) | | (43) | | (46) | | (1,283) | |
| Interest on plan liabilities | | 757 | | 387 | | 133 | | 69 | | 1,346 | |
| Other finance (income) expense | | (152) | | 102 | | 90 | | 23 | | 63 | |
| Analysis of the amount recognized in other comprehensive income | | | | | | |
| Actual asset return less interest income on plan assets | | 2,945 | | 1,079 | | 220 | | 97 | | 4,341 | |
| Change in financial assumptions underlying the present value of the plan liabilities | | (2,294) | | (1,036) | | (748) | | (92) | | (4,170) | |
| Change in demographic assumptions underlying the present value of the plan liabilities | | 136 | | 91 | | 3 | | (4) | | 226 | |
| Experience gains and losses arising on the plan liabilities | | (57) | | (22) | | 6 | | 4 | | (69) | |
| Remeasurements recognized in other comprehensive income | | 730 | | 112 | | (519) | | 5 | | 328 | |
| Movements in benefit obligation during the year | | | | | | |
| Benefit obligation at 1 January | | 26,830 | | 9,696 | | 6,906 | | 1,686 | | 45,118 | |
| Exchange adjustments | | 942 | | 0 | | (142) | | 26 | | 826 | |
| Operating charge relating to defined benefit plans | | 229 | | 250 | | 94 | | 37 | | 610 | |
| Interest cost | | 757 | | 387 | | 133 | | 69 | | 1,346 | |
Contributions by plan participantsc | | 20 | | 0 | | 2 | | 6 | | 28 | |
Benefit payments (funded plans)d | | (1,207) | | (830) | | (76) | | (75) | | (2,188) | |
Benefit payments (unfunded plans)d | | (6) | | (205) | | (273) | | (15) | | (499) | |
| Reclassified as assets held for sale | | 0 | | (146) | | 0 | | 0 | | (146) | |
| Disposals | | 0 | | 0 | | (30) | | 0 | | (30) | |
| Remeasurements | | 2,215 | | 967 | | 739 | | 92 | | 4,013 | |
Benefit obligation at 31 Decembera e | | 29,780 | | 10,119 | | 7,353 | | 1,826 | | 49,078 | |
| Movements in fair value of plan assets during the year | | | | | | |
| Fair value of plan assets at 1 January | | 32,085 | | 7,195 | | 2,112 | | 1,290 | | 42,682 | |
| Exchange adjustments | | 1,141 | | 0 | | (43) | | 24 | | 1,122 | |
Interest income on plan assetsa f | | 909 | | 285 | | 43 | | 46 | | 1,283 | |
Contributions by plan participantsc | | 20 | | 0 | | 2 | | 6 | | 28 | |
| Contributions by employers (funded plans) | | 236 | | 4 | | 85 | | 24 | | 349 | |
Benefit payments (funded plans)d | | (1,207) | | (830) | | (76) | | (75) | | (2,188) | |
| Reclassified as assets held for sale | | 0 | | (78) | | 0 | | 0 | | (78) | |
Remeasurementsf | | 2,945 | | 1,079 | | 220 | | 97 | | 4,341 | |
Fair value of plan assets at 31 Decemberg | | 36,129 | | 7,655 | | 2,343 | | 1,412 | | 47,539 | |
| Surplus (deficit) at 31 December | | 6,349 | | (2,464) | | (5,010) | | (414) | | (1,539) | |
| Represented by | | | | | | |
| Asset recognized | | 6,588 | | 387 | | 27 | | 51 | | 7,053 | |
| Liability recognized | | (239) | | (2,851) | | (5,037) | | (465) | | (8,592) | |
| | 6,349 | | (2,464) | | (5,010) | | (414) | | (1,539) | |
| The surplus (deficit) may be analysed between funded and unfunded plans as follows | | | | | | |
| Funded | | 6,588 | | 387 | | (136) | | (87) | | 6,752 | |
| Unfunded | | (239) | | (2,851) | | (4,874) | | (327) | | (8,291) | |
| | 6,349 | | (2,464) | | (5,010) | | (414) | | (1,539) | |
| The defined benefit obligation may be analysed between funded and unfunded plans as follows | | | | | | |
| Funded | | (29,541) | | (7,268) | | (2,479) | | (1,499) | | (40,787) | |
| Unfunded | | (239) | | (2,851) | | (4,874) | | (327) | | (8,291) | |
| | (29,780) | | (10,119) | | (7,353) | | (1,826) | | (49,078) | |
a The costs of managing plan investments are offset against the investment return, the costs of administering pension plan benefits are generally included in current service cost and the costs of administering other post-retirement benefit plans are included in the benefit obligation.
b Past service costs and settlements have arisen from restructuring programmes and represent charges for special termination benefits reflecting the increased liability arising as a result of early retirements. Settlements in the US are the result of a buy-out transaction for the pensions of a group of low value annuitants.
c Most of the contributions made by plan participants into UK pension plans were made under salary sacrifice.
d The benefit payments amount shown above comprises $2,304 million benefits and $346 million settlements, plus $37 million of plan expenses incurred in the administration of the benefit.
e The benefit obligation for the US is made up of $7,789 million for pension liabilities and $2,330 million for other post-retirement benefit liabilities (which are unfunded and are primarily retiree medical liabilities). The benefit obligation for the Eurozone includes $4,567 million for pension liabilities in Germany which is largely unfunded.
f The actual return on plan assets is made up of the sum of the interest income on plan assets and the remeasurement of plan assets as disclosed above.
g The fair value of plan assets includes borrowings related to the LDI programme as described on page 199.
| | | | | | | | | | | | | | |
| 202 | | bp Annual Report and Form 20-F 2020 | | |
24. Pensions and other post-retirement benefits – continued
| | | | | | | | | | | | | | | | | | | | |
| | | | | | $ million |
| | | | | | | 2018 |
| | | UK | US | Eurozone | Other | Total |
| Analysis of the amount charged to profit or loss | | | | | | |
Current service costa | | 295 | | 299 | | 84 | | 43 | | 721 | |
Past service costb | | 15 | | 0 | | 9 | | 4 | | 28 | |
| Settlement | | 0 | | 0 | | 17 | | 0 | | 17 | |
| Operating charge relating to defined benefit plans | | 310 | | 299 | | 110 | | 47 | | 766 | |
| Payments to defined contribution plans | | 38 | | 178 | | 5 | | 40 | | 261 | |
| Total operating charge | | 348 | | 477 | | 115 | | 87 | | 1,027 | |
Interest income on plan assetsa | | (868) | | (262) | | (44) | | (45) | | (1,219) | |
| Interest on plan liabilities | | 774 | | 369 | | 136 | | 67 | | 1,346 | |
| Other finance (income) expense | | (94) | | 107 | | 92 | | 22 | | 127 | |
| Analysis of the amount recognized in other comprehensive income | | | | | | |
| Actual asset return less interest income on plan assets | | (722) | | (256) | | (69) | | (36) | | (1,083) | |
| Change in financial assumptions underlying the present value of the plan liabilities | | 1,770 | | 945 | | 14 | | 65 | | 2,794 | |
| Change in demographic assumptions underlying the present value of the plan liabilities | | 123 | | (9) | | (42) | | 7 | | 79 | |
| Experience gains and losses arising on the plan liabilities | | 520 | | 41 | | (43) | | 9 | | 527 | |
| Remeasurements recognized in other comprehensive income | | 1,691 | | 721 | | (140) | | 45 | | 2,317 | |
a The costs of managing plan investments are offset against the investment return, the costs of administering pension plan benefits are generally included in current service cost and the costs of administering other post-retirement benefit plans are included in the benefit obligation.
b Past service costs have arisen from restructuring programmes and represent a combination of credits as a result of the curtailment in the pension arrangements of a number of employees mostly in the US and charges for special termination benefits representing the increased liability arising as a result of early retirements mostly in the UK and Eurozone.
Sensitivity analysis
The discount rate, inflation, salary growth and the mortality assumptions all have a significant effect on the amounts reported. A one-percentage point change, in isolation, in certain assumptions as at 31 December 20192020 for the group’s pensions and other post-retirementbenefit expense would have had the effects shown in the tables below. The effects shown for the expense in 20202021 comprise the total of current service cost and net finance income or expense.
| | | | | | | | | | | | | | | | | | | | | | | |
| | | | | | | $ million |
| | | | | | | One percentage point |
| | UK | US | Eurozone |
| | | Increase | Decrease | Increase | Decrease | Increase | Decrease |
Discount ratea | | | | | | | |
| Effect on expense in 2021 | | (274) | | 198 | | (51) | | 36 | | (2) | | (11) | |
| Effect on obligation at 31 December 2020 | | (5,658) | | 7,690 | | (1,272) | | 1,556 | | (1,149) | | 1,452 | |
Inflation rateb | | | | | | | |
| Effect on expense in 2021 | | 145 | | (116) | | 10 | | (8) | | 35 | | (28) | |
| Effect on obligation at 31 December 2020 | | 5,337 | | (4,482) | | 66 | | (55) | | 1,025 | | (870) | |
| Salary growth | | | | | | | |
| Effect on expense in 2021 | | 31 | | (27) | | 12 | | (10) | | 7 | | (7) | |
| Effect on obligation at 31 December 2020 | | 670 | | (585) | | 82 | | (69) | | 91 | | (89) | |
|
| | | | | | | | | | | | | |
| | | | | | | | $ million |
|
| | | | | | | One percentage point | |
| | | UK | US | Eurozone |
| | | Increase |
| Decrease |
| Increase |
| Decrease |
| Increase |
| Decrease |
|
Discount ratea | | | | | | | |
| Effect on expense in 2020 | | (274 | ) | 227 |
| (66 | ) | 58 |
| (1 | ) | (11 | ) |
| Effect on obligation at 31 December 2019 | | (4,729 | ) | 6,364 |
| (1,191 | ) | 1,478 |
| (1,060 | ) | 1,347 |
|
Inflation rateb | | | | | | | |
| Effect on expense in 2020 | | 171 |
| (134 | ) | 11 |
| (9 | ) | 35 |
| (27 | ) |
| Effect on obligation at 31 December 2019 | | 4,711 |
| (3,890 | ) | 67 |
| (54 | ) | 978 |
| (824 | ) |
| Salary growth | | | | | | | |
| Effect on expense in 2020 | | 42 |
| (36 | ) | 13 |
| (11 | ) | 7 |
| (7 | ) |
| Effect on obligation at 31 December 2019 | | 604 |
| (525 | ) | 80 |
| (67 | ) | 93 |
| (89 | ) |
| |
a
| The amounts presented reflect that the discount rate is used to determine the asset interest income as well as the interest cost on the obligation. |
| |
b
| The amounts presented reflect the total impact of an inflation rate change on the assumptions for rate of increase in salaries, pensions in payment and deferred pensions. |
a The amounts presented reflect that the discount rate is used to determine the asset interest income as well as the interest cost on the obligation.
b The amounts presented reflect the total impact of an inflation rate change on the assumptions for rate of increase in salaries, pensions in payment and deferred pensions. |
| | | | | | | |
| | | | | $ million |
|
| | | | One year increase | |
| | | UK |
| US |
| Eurozone |
|
| Longevity | | | | |
| Effect on expense in 2020 | | 31 |
| 6 |
| 9 |
|
| Effect on obligation at 31 December 2019 | | 1,140 |
| 147 |
| 306 |
|
| | | | | | | | | | | | | | |
| | | | $ million |
| | | | One year increase |
| | UK | US | Eurozone |
| Longevity | | | | |
| Effect on expense in 2021 | | 28 | | 5 | | 8 | |
| Effect on obligation at 31 December 2020 | | 1,406 | | 150 | | 333 | |
Estimated future benefit payments and the weighted average duration of defined benefit obligations
The expected benefit payments, which reflect expected future service, as appropriate, but exclude plan expenses, up until 20292030 and the weighted average duration of the defined benefit obligations at 31 December 20192020 are as follows:
| | | | | | $ million |
| | | | $ million |
| Estimated future benefit payments | | UK |
| US |
| Eurozone |
| Other |
| Total |
| Estimated future benefit payments | | UK | US | Eurozone | Other | Total |
| 2020 | | 1,065 |
| 743 |
| 333 |
| 104 |
| 2,245 |
| |
| 2021 | | 1,078 |
| 789 |
| 323 |
| 98 |
| 2,288 |
| 2021 | | 1,072 | | 1,568 | | 357 | | 112 | | 3,109 | |
| 2022 | | 1,098 |
| 711 |
| 319 |
| 101 |
| 2,229 |
| 2022 | | 1,086 | | 612 | | 346 | | 109 | | 2,153 | |
| 2023 | | 1,138 |
| 718 |
| 314 |
| 98 |
| 2,268 |
| 2023 | | 1,120 | | 593 | | 339 | | 107 | | 2,159 | |
| 2024 | | 1,151 |
| 699 |
| 300 |
| 99 |
| 2,249 |
| 2024 | | 1,141 | | 575 | | 332 | | 108 | | 2,156 | |
| 2025-2029 | | 5,895 |
| 3,277 |
| 1,438 |
| 489 |
| 11,099 |
| |
| 2025 | | 2025 | | 1,135 | | 583 | | 328 | | 107 | | 2,153 | |
| 2026-2030 | | 2026-2030 | | 5,939 | | 2,696 | | 1,521 | | 528 | | 10,684 | |
| | | | Years |
| | | | Years |
| Weighted average duration | | 18.3 |
| 13.2 |
| 16.4 |
| 13.0 |
| | Weighted average duration | | 19.2 | 13.8 | 16.1 | 12.7 | |
|
| | | | | | | | | | | | | |
| BP
| bp Annual Report and Form 20-F 20192020 | | 199203 |
25. Cash and cash equivalents
|
| | | | | |
| | | | $ million |
|
| | | 2019 |
| 2018 |
|
| Cash | | 6,462 |
| 6,148 |
|
| Term bank deposits | | 10,296 |
| 13,105 |
|
| Cash equivalents (excluding term bank deposits) | | 5,714 |
| 3,215 |
|
| | | 22,472 |
| 22,468 |
|
| | | | | | | | | | | |
| | | $ million |
| | 2020 | 2019 |
| Cash | | 6,235 | | 6,462 | |
| Triparty repos and term bank deposits | | 17,368 | | 10,296 | |
| Cash equivalents (excluding triparty repos and term bank deposits) | | 7,508 | | 5,714 | |
| | 31,111 | | 22,472 | |
Cash and cash equivalents comprise cash in hand; current balances with banks and similar institutions; term deposits of three months or less with banks and similar institutions; money market funds and commercial paper. The carrying amounts of cash, triparty repos and term bank deposits approximate their fair values. Substantially all of the other cash equivalents are categorized within level 1 of the fair value hierarchy.
Cash and cash equivalents at 31 December 20192020 includes $1,676$1,917 million (2018 $1,350(2019 $1,676 million) that is restricted. The restricted cash balances include amounts required to cover initial margin on trading exchanges and certain cash balances which are subject to exchange controls.
The group holds $4,678$3,890 million (2018 $4,693(2019 $4,678 million) of cash and cash equivalents outside the UK and it is not expected that any significant tax will arise on repatriation.
26. Finance debt
|
| | | | | | | | | | | | | |
| | | | | | | | $ million |
|
| | | | | 2019 |
| | | 2018 |
|
| | | Current |
| Non-current |
| Total |
| Current |
| Non-current |
| Total |
|
| Borrowings | | 10,487 |
| 57,237 |
| 67,724 |
| 9,329 |
| 55,803 |
| 65,132 |
|
As a result of the adoption of IFRS 16 ‘Leases’, leases that were previously classified as finance leases under IAS 17 are now presented as ‘Lease liabilities’ on the group balance sheet and therefore do not form part of finance debt. Comparative information for finance debt has been amended to be on a consistent basis with amounts presented for 2019. See Note 1 and Note 27 for further information. | | | | | | | | | | | | | | | | | | | | | | | |
| | | | | | | $ million |
| | | | 2020 | | | 2019 |
| | Current | Non-current | Total | Current | Non-current | Total |
| Borrowings | | 9,359 | | 63,305 | | 72,664 | | 10,487 | | 57,237 | | 67,724 | |
The main elements of current borrowings are the current portion of long-term borrowings that is due to be repaid in the next 12 months of $8,166$8,122 million (2018 $7,175(2019 $8,166 million) and issued commercial paper of $2,279$1,004 million (2018 $2,040(2019 $2,279 million). Finance debt does not include accrued interest, which is reported within other payables. As part of actively managing its debt portfolio, during the year the group bought back $4.0 billion equivalent (2019 $NaN) of euro and sterling bonds and terminated derivatives associated with the debt bought back. In addition on 18 December 2020 the group exercised its option to redeem finance debt with an outstanding aggregate principal amount of $2.0 billion on 22 January 2021. On 19 March 2021 the group bought back a further $1.9 billion equivalent of euro and sterling bonds and terminated associated derivatives. These transactions have no significant impact on net debt or gearing.
The following table shows the weighted-average interest rates achieved through a combination of borrowings and derivative financial instruments entered into to manage interest rate and currency exposures.
|
| | | | | | | | | | |
| | | | Fixed rate debt | | Floating rate debt | | Total |
|
| | | Weighted average interest rate % | Weighted average time for which rate is fixed Years | Amount $ million |
| Weighted average interest rate % | Amount $ million |
| Amount $ million |
|
| | | | | | | | 2019 |
|
| US dollar | | 4 | 5 | 25,634 |
| 3 | 41,871 |
| 67,505 |
|
| Other currencies | | 6 | 10 | 183 |
| 7 | 36 |
| 219 |
|
| | | | | 25,817 |
| | 41,907 |
| 67,724 |
|
| | | | | | | | |
| | | | | | | | 2018 |
|
| US dollar | | 4 | 4 | 17,264 |
| 4 | 47,461 |
| 64,725 |
|
| Other currencies | | 5 | 5 | 323 |
| 8 | 84 |
| 407 |
|
| | | | | 17,587 |
| | 47,545 |
| 65,132 |
|
Comparative information in the table above has been amended to exclude previously classified finance lease liabilities of $667 million from US dollar and other currencies, primarily from fixed-rate debt. The calculation of the comparative weighted-average interest rate and time for which rate is fixed is unchanged for US dollar fixed-rate debt and was previously 7% and 18 years respectively for other currencies fixed-rate debt. | | | | | | | | | | | | | | | | | | | | | | | |
| | | Fixed rate debt | Floating rate debt | Total |
| | Weighted
average
interest
rate
% | Weighted
average
time for
which rate
is fixed
Years | Amount
$ million | Weighted
average
interest
rate
% | Amount
$ million | Amount
$ million |
| | | | | | | 2020 |
| US dollar | | 3 | | 8 | 39,452 | | 2 | | 32,891 | | 72,343 | |
| Other currencies | | 6 | | 9 | 178 | | 5 | | 143 | | 321 | |
| | | | 39,630 | | | 33,034 | | 72,664 | |
| | | | | | | |
| | | | | | | 2019 |
| US dollar | | 4 | | 5 | 25,634 | | 3 | | 41,871 | | 67,505 | |
| Other currencies | | 6 | | 10 | 183 | | 7 | | 36 | | 219 | |
| | | | 25,817 | | | 41,907 | | 67,724 | |
Fair values
The estimated fair value of finance debt is shown in the table below together with the carrying amount as reflected in the balance sheet.
Long-term borrowings in the table below include the portion of debt that matures in the 12 months from 31 December 2019,2020, whereas in the group balance sheet the amount is reported within current finance debt.
The carrying amount of the group’s short-term borrowings, comprising mainly of commercial paper, approximates their fair value. The fair values of the significant majority of the group’s long-term borrowings are determined using quoted prices in active markets, and so fall within level 1 of the fair value hierarchy. Where quoted prices are not available, quoted prices for similar instruments in active markets are used and such measurements are therefore categorized in level 2 of the fair value hierarchy.
| | | | | | | | | | | | | | | | | |
| | | | | $ million |
| | | 2020 | | 2019 |
| | Fair value | Carrying
amount | Fair value | Carrying
amount |
| Short-term borrowings | | 1,237 | | 1,237 | | 2,321 | | 2,321 | |
| Long-term borrowings | | 74,855 | | 71,427 | | 67,055 | | 65,403 | |
| Total finance debt | | 76,092 | | 72,664 | | 69,376 | | 67,724 | |
|
| | | | | | | | | |
| | | | | | $ million |
|
| | | | 2019 |
| | 2018 |
|
| | | Fair value |
| Carrying amount |
| Fair value |
| Carrying amount |
|
| Short-term borrowings | | 2,321 |
| 2,321 |
| 2,153 |
| 2,153 |
|
| Long-term borrowings | | 67,055 |
| 65,403 |
| 63,213 |
| 62,979 |
|
| Total finance debt | | 69,376 |
| 67,724 |
| 65,366 |
| 65,132 |
|
|
| | | | | | | | | | | | | |
200204 | | BPbp Annual Report and Form 20-F 2019
2020 | | |
27.Capital disclosures and net debt
The group defines capital as total equity.equity plus net debt. We maintain our financial framework to support the pursuit of value growth for shareholders, while ensuring a secure financial base.
The group monitors capital on basis of gearing, (previously termed 'net debt ratio'), that is, the ratio of net debt to net debt plus equity. Net debt is calculated as finance debt, as shown in the balance sheet, plus the fair value of associated derivative financial instruments that are used to hedge foreign exchange and interest rate risks relating to finance debt for which hedge accounting is applied, less cash and cash equivalents. Net debt and gearing are non-GAAP measures. BPbp believes these measures provide useful information to investors. Net debt enables investors to see the economic effect of finance debt, related hedges and cash and cash equivalents in total. Gearing enables investors to see how significant net debt is relative to equity from shareholders.total equity. The derivatives are reported on the balance sheet within the headings ‘Derivative financial instruments’. All components of equity are included in the denominator of the calculation.
We aim to manage the gearing within a 20-30% band and maintain a significant liquidity buffer. At 31 December 2019,2020, gearing was 31.3% (2019 31.1% (2018 30.0%).
As | | | | | | | | | | | |
| | | $ million |
| At 31 December | | 2020 | 2019 |
| Finance debt | | 72,664 | | 67,724 | |
Less: fair value asset (liability) of hedges related to finance debta | | 2,612 | | (190) | |
| | 70,052 | | 67,914 | |
| Less: cash and cash equivalents | | 31,111 | | 22,472 | |
| Net debt | | 38,941 | | 45,442 | |
Total equityb | | 85,568 | | 100,708 | |
| Gearing | | 31.3 | % | 31.1 | % |
a resultDerivative financial instruments entered into for the purpose of the adoption of IFRS 16 ‘Leases’ from 1 January 2019, leases that were previously classified as finance leases under IAS 17 are now presented as ‘Lease liabilities’ on the group balance sheetmanaging interest rate and therefore do not form part of finance debt. Comparative information for finance debt (previously also termed ‘gross debt’),foreign currency exchange risk associated with net debt and gearing have been amended to be onwith a consistent basis with amounts presented for 2019. The relevant amount for finance lease liabilities that has been excluded from comparative information for 2018 is $667 million. The previously disclosed amounts for finance debt andfair value liability position of $236 million (2019 liability of $601 million) are not included in the calculation of net debt shown above as hedge accounting was not applied for 2018 were $65,799 million and $44,144 million respectively. The previously disclosed gearingthese instruments.
b Total equity in 2020 includes perpetual hybrid bonds issued on 17 June 2020. See Note 32 for 2018 was 30.3%.further information.
|
| | | | | |
| | | | $ million |
|
| At 31 December | | 2019 |
| 2018 |
|
| Finance debt | | 67,724 |
| 65,132 |
|
Less: fair value asset (liability) of hedges related to finance debta | | (190 | ) | (813 | ) |
| | | 67,914 |
| 65,945 |
|
| Less: cash and cash equivalents | | 22,472 |
| 22,468 |
|
| Net debt | | 45,442 |
| 43,477 |
|
| Equity | | 100,708 |
| 101,548 |
|
| Gearing | | 31.1 | % | 30.0 | % |
| |
a
| Derivative financial instruments entered into for the purpose of managing interest rate and foreign currency exchange risk associated with net debt with a fair value liability position of $601 million (2018 liability of $827 million) are not included in the calculation of net debt shown above as hedge accounting was not applied for these instruments. The movement in the year is attributable to a net cash out flow of $286 million (2018 net cash flow $nil) and fair value loss of $60 million (2018 fair value losses of $193 million). |
Net debt including leases is shown in the table below.
|
| | | | | |
| | | | $ million |
|
| At 31 December | | 2019 |
| 2018 |
|
| Net debt | | 45,442 |
| 43,477 |
|
| Lease liabilities | | 9,722 |
| 667 |
|
| Net partner (receivable) payable for leases entered into on behalf of joint operations | | (158 | ) | — |
|
| Net debt including leases | | 55,006 |
| 44,144 |
|
An analysis of changes in liabilities arising from financing activities is provided below.
| | | | | | | | | | | | | | | | | | | | |
| | | | | | $ million |
| | Finance
debt | Currency swapsa | Lease liabilities | Net partner payable for leases entered into on behalf of joint operations | Total liabilities arising from financing activities |
| At 1 January 2020 | | 67,724 | | 918 | | 9,722 | | 290 | | 78,654 | |
| Exchange adjustments | | 349 | | 0 | | 181 | | 4 | | 534 | |
| Net financing cash flow | | 1,589 | | (226) | | (2,442) | | (40) | | (1,119) | |
| Fair value (gains) losses | | 2,612 | | (3,734) | | 0 | | 0 | | (1,122) | |
| New and remeasured leases/joint operation payables | | 0 | | 0 | | 1,579 | | 20 | | 1,599 | |
| Other movements | | 390 | | 77 | | 222 | | (7) | | 682 | |
| At 31 December 2020 | | 72,664 | | (2,965) | | 9,262 | | 267 | | 79,228 | |
| | | | | | |
| At 1 January 2019 | | 65,132 | | 1,486 | | 667 | | 0 | | 67,285 | |
| Adjustment on adoption of IFRS16 | | 0 | | 0 | | 9,233 | | 217 | | 9,450 | |
| Exchange adjustments | | (62) | | 0 | | (4) | | 8 | | (58) | |
| Net financing cash flow | | 1,671 | | 2 | | (2,372) | | (14) | | (713) | |
| Fair value (gains) losses | | 924 | | (570) | | 0 | | 0 | | 354 | |
| New and remeasured leases/joint operations payables | | 0 | | 0 | | 2,614 | | 82 | | 2,696 | |
| Other movements | | 59 | | 0 | | (416) | | (3) | | (360) | |
| At 31 December 2019 | | 67,724 | | 918 | | 9,722 | | 290 | | 78,654 | |
|
| | | | | | | | | | | |
| | | | | | | $ million |
|
| | | Finance debt |
| Hedge- accounted derivatives |
| Lease liabilities |
| Net partner payable for leases entered into on behalf of joint operations |
| Total liabilities arising from financing activities |
|
| At 1 January 2019 | | 65,132 |
| 813 |
| 667 |
| — |
| 66,612 |
|
Adjustment on adoption of IFRS 16a | | — |
| — |
| 9,233 |
| 217 |
| 9,450 |
|
| Exchange adjustments | | (62 | ) | — |
| (4 | ) | 8 |
| (58 | ) |
| Net financing cash flow | | 1,671 |
| 2 |
| (2,372 | ) | (14 | ) | (713 | ) |
| Fair value (gains) losses | | 924 |
| (1,104 | ) | — |
| — |
| (180 | ) |
| New and remeasured leases/joint operation payables | | — |
| — |
| 2,614 |
| 82 |
| 2,696 |
|
| Other movements | | 59 |
| 479 |
| (416 | ) | (3 | ) | 119 |
|
| At 31 December 2019 | | 67,724 |
| 190 |
| 9,722 |
| 290 |
| 77,926 |
|
| | | | | | | |
| At 1 January 2018 | | 62,574 |
| 175 |
| 656 |
| — |
| 63,405 |
|
| Exchange adjustments | | (237 | ) | — |
| (22 | ) | — |
| (259 | ) |
| Net financing cash flow | | 3,540 |
| (360 | ) | (35 | ) | — |
| 3,145 |
|
| Fair value (gains) losses | | (856 | ) | 998 |
| — |
| — |
| 142 |
|
| New leases | | — |
| — |
| 74 |
| — |
| 74 |
|
| Other movements | | 111 |
| — |
| (6 | ) | — |
| 105 |
|
| At 31 December 2018 | | 65,132 |
| 813 |
| 667 |
| — |
| 66,612 |
|
a SeeThe balances above do not include accrued interest, which is reported within other receivables and other payables on the balance sheet and for which the associated cash flows are presented as operating cash flows in the group cash flow statement. The currency swaps are reported on the balance sheet within the headings 'Derivative financial instruments' and are subsets of both derivatives held for trading and derivatives designated in fair value hedge relationships as detailed in Note 1 for information on adoption30. When hedge accounting is applied to these derivatives they are included in the calculation of IFRS 16 'Leases'.
net debt shown above.
|
| | | | | | | | | | | | | |
| BP
| bp Annual Report and Form 20-F 20192020 | | 201205 |
28. Leases
The group leases a number of assets as part of its activities. This primarily includes drilling rigs in the Upstream segment and retail service stations, oil depots and storage tanks in the Downstream segment as well as office accommodation and vessel charters across the group. The weighted-average remaining lease term for the total lease portfolio is around 8 years (2019 9 years.years). Some leases will have payments that vary with market interest or inflation rates. Certain leases contain residual value guarantees, which may be triggered in certain circumstances such as if market values have significantly declined at the conclusion of the lease.
The table below shows the timing of the undiscounted cash outflows for the lease liabilities included on the balance sheet.
| | | | | | | | | | | |
| | | $ million |
| | 2020 | 2019 |
| Undiscounted lease liability cash flows due: | | | |
| Within 1 year | | 2,262 | | 2,514 | |
| 1 to 2 years | | 1,672 | | 1,839 | |
| 2 to 3 years | | 1,340 | | 1,364 | |
| 3 to 4 years | | 1,025 | | 1,105 | |
| 4 to 5 years | | 878 | | 876 | |
| 5 to 10 years | | 2,192 | | 2,427 | |
| Over 10 years | | 1,515 | | 1,174 | |
| | 10,884 | | 11,299 | |
| Impact of discounting | | (1,622) | | (1,577) | |
| Lease liabilities at 31 December | | 9,262 | | 9,722 | |
| Of which – current | | 1,933 | | 2,067 | |
| – non-current | | 7,329 | | 7,655 | |
|
| | | | | |
| | | | $ million |
|
| | | 2019 |
| 2018a |
|
| Undiscounted lease liability cash flows due: | | | |
| Within 1 year | | 2,514 |
| 98 |
|
| 1 to 2 years | | 1,839 |
| 97 |
|
| 2 to 3 years | | 1,364 |
| 95 |
|
| 3 to 4 years | | 1,105 |
| 94 |
|
| 4 to 5 years | | 876 |
| 86 |
|
| 5 to 10 years | | 2,427 |
| 309 |
|
| Over 10 years | | 1,174 |
| 571 |
|
| | | 11,299 |
| 1,350 |
|
| Impact of discounting | | (1,577 | ) | (683 | ) |
| Lease liabilities at 31 December | | 9,722 |
| 667 |
|
| Of which – current | | 2,067 |
| 44 |
|
| – non-current | | 7,655 |
| 623 |
|
a Comparative information represents finance leases accounted for under IAS 17
The group may enter into lease arrangements a number of years before taking control of the underlying asset due to construction lead times or to secure future operational requirements. The total undiscounted amount for future commitments for leases not yet commenced as at 31 December 20192020 is $5,309 million (2019 $5,688 million.million). The majority of this future commitment relates to the floating LNG vessel to service the Greater Tortue Ahmeyim project from 2022.2023.
| | | | | | | | | | | |
| | | $ million |
| | 2020 | 2019 |
Total cash outflow for amounts included in lease liabilitiesa | | 2,779 | | 2,709 | |
| Expense for variable payments not included in the lease liability | | 41 | | 67 | |
| Short-term lease expense | | 621 | | 331 | |
| Additions to right-of-use assets in the period | | 1,714 | | 2,542 | |
| Gain on sale and leaseback transactions | | 187 | | 0 | |
|
| | | |
| | $ million |
|
| | 2019 |
|
Total cash outflow for amounts included in lease liabilitiesa
| | 2,709 |
|
Expense for variable payments not included in the lease liability | | 67 |
|
Short-term lease expense | | 331 |
|
Additions to right-of-use assets in the period | | 2,542 |
|
a The cash outflows for amounts not included in lease liabilities approximate the income statement expense disclosed aboveabove.
An analysis of right-of-use assets and depreciation is provided in Note 12. An analysis of lease interest expense is provided in Note 7.
29. Financial instruments and financial risk factors
The accounting classification of each category of financial instruments and their carrying amounts are set out below. | | | | | | | | | | | | | | | | | $ million |
| | | | | | $ million |
| |
| At 31 December 2019 | | Note |
| | Measured at amortized cost |
| Mandatorily measured at fair value through profit or loss |
| Derivative hedging instruments |
| Total carrying amount |
| |
| At 31 December 2020 | | At 31 December 2020 | | Note | | Measured at amortized cost | Mandatorily measured at fair value through profit or loss | Derivative hedging instruments | Total carrying
amount |
| Financial assets | | | | | Financial assets | | | |
| Other investments | | 18 |
| | — |
| 1,445 |
| — |
| 1,445 |
| Other investments | | 18 | | | — | | 3,079 | | — | | 3,079 | |
| Loans | | | | 906 |
| 63 |
| — |
| 969 |
| Loans | | 929 | | 369 | | — | | 1,298 | |
| Trade and other receivables | | 20 |
| | 24,271 |
| — |
| — |
| 24,271 |
| Trade and other receivables | | 20 | | | 20,252 | | — | | — | | 20,252 | |
| Derivative financial instruments | | 30 |
| | — |
| 9,984 |
| 483 |
| 10,467 |
| Derivative financial instruments | | 30 | | | — | | 10,049 | | 2,698 | | 12,747 | |
| Cash and cash equivalents | | 25 |
| | 18,183 |
| 4,289 |
| — |
| 22,472 |
| Cash and cash equivalents | | 25 | | | 24,905 | | 6,206 | | — | | 31,111 | |
| Financial liabilities | | | | | Financial liabilities | | |
| Trade and other payables | | 22 |
| | (55,891 | ) | — |
| — |
| (55,891 | ) | Trade and other payables | | 22 | | | (44,960) | | — | | — | | (44,960) | |
| Derivative financial instruments | | 30 |
| | — |
| (8,122 | ) | (676 | ) | (8,798 | ) | Derivative financial instruments | | 30 | | | — | | (8,320) | | (82) | | (8,402) | |
| Accruals | | | | (6,062 | ) | — |
| — |
| (6,062 | ) | Accruals | | (5,502) | | — | | — | | (5,502) | |
| Lease liabilities | | 28 |
| | (9,722 | ) | — |
| — |
| (9,722 | ) | Lease liabilities | | 28 | | | (9,262) | | — | | — | | (9,262) | |
Finance debta | | 26 |
| | (67,724 | ) | — |
| — |
| (67,724 | ) | |
| Finance debt | | Finance debt | | 26 | | | (72,664) | | — | | — | | (72,664) | |
| | | | | (96,039 | ) | 7,659 |
| (193 | ) | (88,573 | ) | | | | (86,302) | | 11,383 | | 2,616 | | (72,303) | |
|
| | | | | | | | | | | | | |
202206 | | BPbp Annual Report and Form 20-F 2019
2020 | | |
29. Financial instruments and financial risk factors – continued
| | | | | | | | | | | | | | | | | | | | | | | |
| | | | | | | $ million |
| At 31 December 2019 | | Note | | Measured at amortized cost | Mandatorily measured at fair value through profit or loss | Derivative hedging instruments | Total carrying
amount |
| Financial assets | | | | | | | |
| Other investments | | 18 | | | — | | 1,445 | | — | | 1,445 | |
| Loans | | | | 906 | | 63 | | — | | 969 | |
| Trade and other receivables | | 20 | | | 24,271 | | — | | — | | 24,271 | |
| Derivative financial instruments | | 30 | | | — | | 9,984 | | 483 | | 10,467 | |
| Cash and cash equivalents | | 25 | | | 18,183 | | 4,289 | | — | | 22,472 | |
| Financial liabilities | | | | | | | |
| Trade and other payables | | 22 | | | (55,891) | | — | | — | | (55,891) | |
| Derivative financial instruments | | 30 | | | — | | (8,122) | | (676) | | (8,798) | |
| Accruals | | | | (6,062) | | — | | — | | (6,062) | |
| Lease liabilities | | 28 | | | (9,722) | | — | | — | | (9,722) | |
| Finance debt | | 26 | | | (67,724) | | — | | — | | (67,724) | |
| | | | (96,039) | | 7,659 | | (193) | | (88,573) | |
|
| | | | | | | | | | | | |
| | | | | | | | $ million |
|
| At 31 December 2018 | | Note |
| | Measured at amortized cost |
| Mandatorily measured at fair value through profit or loss |
| Derivative hedging instruments |
| Total carrying
amount |
|
| Financial assets | | | | | | | |
| Other investments | | 18 |
| | — |
| 1,563 |
| — |
| 1,563 |
|
| Loans | | | | 839 |
| 124 |
| — |
| 963 |
|
| Trade and other receivables | | 20 |
| | 24,080 |
| — |
| — |
| 24,080 |
|
| Derivative financial instruments | | 30 |
| | — |
| 8,564 |
| 427 |
| 8,991 |
|
| Cash and cash equivalents | | 25 |
| | 20,366 |
| 2,102 |
| — |
| 22,468 |
|
| Financial liabilities | | | |
|
|
|
|
| Trade and other payables | | 22 |
| | (56,790 | ) | — |
| — |
| (56,790 | ) |
| Derivative financial instruments | | 30 |
| | — |
| (7,685 | ) | (1,248 | ) | (8,933 | ) |
| Accruals | | | | (5,201 | ) | — |
| — |
| (5,201 | ) |
| Lease liabilities | | 28 |
| | (667 | ) | — |
| — |
| (667 | ) |
Finance debta | | 26 |
| | (65,132 | ) | — |
| — |
| (65,132 | ) |
| | | | | (82,505 | ) | 4,668 |
| (821 | ) | (78,658 | ) |
a As a result of the adoption of IFRS 16 ‘Leases’, leases that were previously classified as finance leases under IAS 17 are now presented as ‘Lease liabilities’ on the group balance sheet and therefore do not form part of finance debt. Comparative information for finance debt and lease liabilities have been amended to be on a consistent basis with amounts presented for 2019. The previously disclosed amounts for finance debt for 2018 was $65,799 million.
The fair value of finance debt is shown in Note 26. For all other financial instruments within the scope of IFRS 9, the carrying amount is either the fair value, or approximates the fair value.
Information on gains and losses on derivative financial assets and financial liabilities classified as measured at fair value through profit or loss is provided in the derivative gains and losses section of Note 30. Fair value gains and losses related to other assets and liabilities classified as measured at fair value through profit or loss totalled a net gain of $367 million (2019 net loss of $129 million.million). Dividend income of $20$17 million (2018 $8(2019 $20 million) from investments in equity instruments classified as measured at fair value through profit or loss is presented within other income - see Note 7.
Interest income and expenses arising on financial instruments are disclosed in Note 7.
Financial risk factors
The group is exposed to a number of different financial risks arising from natural business exposures as well as its use of financial instruments including market risks relating to commodity prices; foreign currency exchange rates and interest rates; credit risk; and liquidity risk.
The group financial risk committee (GFRC) advises the group chief financial officer (CFO) who oversees the management of these risks. The GFRC is chaired by the CFO and consists of a group of senior managers including the group treasurer and the heads of the group finance, tax and the integrated supply and trading functions. The purpose of the committee is to advise on financial risks and the appropriate financial risk governance framework for the group. The committee provides assurance to the CFO and the group chief executive (GCE), and via the GCE to the board, that the group’s financial risk-taking activity is governed by appropriate policies and procedures and that financial risks are identified, measured and managed in accordance with group policies and group risk appetite.
The group’s trading activities in the oil, natural gas, LNG and power markets are managed within the integrated supply and trading function. Treasury holds foreign exchange and interest-rate products in the financial markets to hedge group exposures related to debt and hybrid bond issuance; the compliance, control, and risk management processes for these activities are managed within the treasury function. All other foreign exchange and interest rate activities within financial markets are performed within the integrated supply and trading function and are also underpinned by the compliance, control and risk management infrastructure common to the activities of BP’sbp’s integrated supply and trading function. All derivative activity is carried out by specialist teams that have the appropriate skills, experience and supervision. These teams are subject to close financial and management control.
The integrated supply and trading function maintains formal governance processes that provide oversight of market risk, credit risk and operational risk associated with trading activity. A policy and risk committee approves value-at-risk delegations, reviews incidents and validates risk-related policies, methodologies and procedures. A commitments committee approves the trading of new products, instruments and strategies and material commitments.
In addition, the integrated supply and trading function undertakes derivative activity for risk management purposes under a control framework as described more fully below.
(a) Market risk
Market risk is the risk or uncertainty arising from possible market price movements and their impact on the future performance of a business. The primary commodity price risks that the group is exposed to include oil, natural gas and power prices that could adversely affect the value of the group’s financial assets, liabilities or expected future cash flows. The group enters into derivatives in a well-established entrepreneurial trading operation. In addition, the group has developed a control framework aimed at managing the volatility inherent in certain of its natural business exposures. In accordance with the control framework the group enters into various transactions using derivatives for risk management purposes.
The major components of market risk are commodity price risk, foreign currency exchange risk and interest rate risk, each of which is discussed below.
|
| | | |
| BP Annual Report and Form 20-F 2019
| | 203 |
29. Financial instruments and financial risk factors – continued
(i) Commodity price risk
The group’s integrated, supply and trading function is responsible for delivering value across the overall crude, oil products, gas and power supply chains. As such, it routinely enters into spot and term physical commodity contracts in addition to optimising physical storage, pipeline and transportation capacity. These activities expose the group to commodity price risk which is managed by entering into oil and natural gas swaps, options and futures.
The group measures market risk exposure arising from its trading positions in liquid periods using value-at-risk techniques based on Variance/Covariance or Monte Carlo simulation models. These techniques make a statistical assessment of the market risk arising from possible future changes in market prices over a one-day holding period within a 95% confidence level. The value-at-risk measure is supplemented by stress testing and scenario analysis through simulating the financial impact of certain physical, economic and geo-political scenarios. Trading activity occurring in liquid periods is
| | | | | | | | | | | | | | |
| | bp Annual Report and Form 20-F 2020 | | 207 |
29. Financial instruments and financial risk factors – continued
subject to value-at-risk and other limits for each trading activity and the aggregate of all trading activity. The board has delegated a limit of $100 million (2018(2019 $100 million) value at risk in support of this trading activity. Alternative measures are used to monitor exposures which are outside liquid periods and for which value-at-risk techniques are not appropriate.
(ii) Foreign currency exchange risk
Since BPbp has global operations, fluctuations in foreign currency exchange rates can have a significant effect on the group’s reported results and future expenditure commitments. The effects of most exchange rate fluctuations are absorbed in business operating results through changing cost competitiveness, lags in market adjustment to movements in rates and translation differences accounted for on specific transactions. For this reason, the total effect of exchange rate fluctuations is not identifiable separately in the group’s reported results. The main underlying economic currency of the group’s cash flows is the US dollar. This is because BP’sbp’s major product, oil, is priced internationally in US dollars. BP’sbp’s foreign currency exchange management policy is to limit economic and material transactional exposures arising from currency movements against the US dollar. The group co-ordinates the handling of foreign currency exchange risks centrally, by netting off naturally-occurring opposite exposures wherever possible and then managing any material residual foreign currency exchange risks.
Most of the group’s borrowings are in US dollars or are hedged with respect to the US dollar. At 31 December 2019,2020, the total foreign currency borrowings not swapped into US dollars amounted to $321 million (2019 $219 million (2018 $407 million excludes leases)million). During the year the group issued perpetual subordinated hybrid bonds in euro, sterling and US dollars. Whilst the contractual terms of these instruments allow the group to defer coupon payments and the repayment of principal indefinitely, the group has chosen to manage the foreign currency exposure relating to the non-US dollar hybrid bonds to their respective first call periods.
The group manages the net residual foreign currency exposures by constantly reviewing the foreign currency economic value at risk and aims to manage such risk to keep the 12-month foreign currency value at risk below $400 million. At no point over the past three years did the value at risk exceed the maximum risk limit. A continuous assessment is made in respect to the group’s foreign currency exposures to capture hedging requirements.
During the year, hedge accounting was applied to foreign currency exposure to highly probable forecast capital expenditure commitments. The group fixes the US dollar cost of non-US dollar supplies by using currency forwards for the highly probable forecast capital expenditure; the exposures are in sterling, euro, Australian dollar and Korean won. At 31 December 20192020 the most significant open contracts in place were for $106$124 million sterling (2018 $434(2019 $106 million sterling).
Where the group enters into foreign currency exchange contracts for entrepreneurial trading purposes the activity is controlled using trading value-at-risk techniques as explained in (i) commodity price risk above.
(iii) Interest rate risk
BPbp is also exposed to interest rate risk from the possibility that changes in interest rates will affect future cash flows or the fair values of its financial instruments, principally finance debt. While the group issues debt and hybrid bonds in a variety of currencies based on market opportunities, it uses derivatives to swap the debteconomic exposure to a floating rate exposure,basis, mainly to US dollar floating, but in certain defined circumstances maintains a US dollar fixed rate exposure for a proportion of debt. The proportion of floating rate debt net of interest rate swaps at 31 December 20192020 was 62%45% of total finance debt outstanding (2018 73% excludes leases)(2019 62%). The weighted average interest rate on finance debt at 31 December 20192020 was 3% (2018 4%(2019 3%) and the weighted average maturity of fixed rate debt was eight years (2019 five years (2018 four years excludes leases)years).
The group’s earnings are sensitive to changes in interest rates on the floating rate element of the group’s finance debt.debt that has been swapped to floating rates. If the interest rates applicable to these floating rate instruments were to have changed by one percentage point on 1 January 2020,2021, it is estimated that the group’s finance costs for 20202021 would change by approximately $330 million (2019 $419 million (2018 $475 million).
Financial authorities in the US, UK, EU and other territories are currently undertaking reviews of key interest rate benchmarks such as the London Inter-bank Offered Rate (LIBOR) with a view to replacing them with alternative benchmarks. bp is significantly exposed to benchmark interest rate components; predominantly USD LIBOR, GBP LIBOR, EURIBOR and CHF LIBOR. Following the completion of consultation processes, these financial authorities have begun to announce the timing of both benchmark transitions and continued publication of synthetic benchmarks.
In October 2020 the International Swaps and Derivatives Association (ISDA) published its fallback protocol containing clauses to amend derivative contracts on the cessation of LIBOR should an entity and its counterparties adhere to the protocol. The protocol’s pricing mechanism is at fair market value and bp has signed up to the protocol as this removes transition uncertainty for any interest rate and cross-currency interest rate swap contracts of the Group without fall-back clauses. The ISDA fallback protocol is expected to increase market activity and certainty such that corporates can finalize their plans for implementation of the transition. bp continues to monitor regulatory and market developments over the course of the transition.
In response to the cessation of the interbank offered rates (IBORs), bp has set up an internal working group to monitor market developments and manage the transition to alternative benchmark rates and is currently assessing the impact on contracts and arrangements that are linked to existing interest rate benchmarks, for example, borrowings, leases and derivative contracts. bp is also participating on external committees and task forces dedicated to interest rate benchmark reform.
(b) Credit risk
Credit risk is the risk that a customer or counterparty to a financial instrument will fail to perform or fail to pay amounts due causing financial loss to the group and arises from cash and cash equivalents, derivative financial instruments and deposits with financial institutions and principally from credit exposures to customers relating to outstanding receivables. Credit exposure also exists in relation to guarantees issued by group companies under which the outstanding exposure incremental to that recognized on the balance sheet at 31 December 20192020 was $692$1,405 million (2018 $696(2019 $692 million) in respect of liabilities of joint ventures and associates and $523$661 million (2018 $432(2019 $523 million) in respect of liabilities of other third parties.
The group has a credit policy, approved by the CFO that is designed to ensure that consistent processes are in place throughout the group to measure and control credit risk. Credit risk is considered as part of the risk-reward balance of doing business. On entering into any business contract the extent to which the arrangement exposes the group to credit risk is considered. Key requirements of the policy include segregation of credit approval authorities from any sales, marketing or trading teams authorized to incur credit risk; the establishment of credit systems and processes to ensure that all counterparty exposure is rated and that all counterparty exposure and limits can be monitored and reported; and the timely identification and reporting of any non-approved credit exposures and credit losses. While each segment is responsible for its own credit risk management and reporting consistent with group policy, the treasury function holds group-wide credit risk authority and oversight responsibility for exposure to banks and financial institutions.
Standing credit controls and processes were augmented intra-year given heightened uncertainty from increased oil price volatility and the evolving COVID-19 pandemic. Constraints on incoming credit risks were tightened, credit reporting and frequency was enhanced from the operational to board level, and key credit risk strategies were reviewed and vetted.
|
| | | | | | | | | | | | | |
204208 | | BPbp Annual Report and Form 20-F 2019
2020 | | |
29. Financial instruments and financial risk factors – continued
For the purposes of financial reporting the group calculates expected loss allowances based on the maximum contractual period over which the group is exposed to credit risk. Lifetime expected credit losses are recognized for trade receivables and the credit risk associated with the significant majority of financial assets measured at amortized cost is considered to be low. Since the tenor of substantially all of the group's in-scope financial assets is less than 12 months there is no significant difference between the measurement of 12-month and lifetime expected credit losses. Expected loss allowances for financial guarantee contracts are typically lower than their initial fair value less, where appropriate, amortization. Financial assets are considered to be credit-impaired when there is reasonable and supportable evidence that one or more events that have a detrimental impact on the estimated future cash flows of the financial asset have occurred. This includes observable data concerning significant financial difficulty of the counterparty; a breach of contract; concession being granted to the counterparty for economic or contractual reasons relating to the counterparty’s financial difficulty, that would not otherwise be considered; it becoming probable that the counterparty will enter bankruptcy or other financial re-organization or an active market for the financial asset disappearing because of financial difficulties. The group also applies a rebuttable presumption that an asset is credit-impaired when contractual payments are more than 30 days past due. Where the group has no reasonable expectation of recovering a financial asset in its entirety or a portion thereof, for example where all legal avenues for collection of amounts due have been exhausted, the financial asset (or relevant portion) is written off.
The measurement of expected credit losses is a function of the probability of default, loss given default (i.e. the magnitude of the loss after recovery if there is a default) and the exposure at default (i.e. the asset's carrying amount). The group allocates a credit risk rating to exposures based on data that is determined to be predictive of the risk of loss, including but not limited to external ratings. Probabilities of default derived from historical, current and future-looking market data are assigned by credit risk rating with a loss given default based on historical experience and relevant market and academic research applied by exposure type. Experienced credit judgement is applied to ensure probabilities of default are reflective of the credit risk associated with the group's exposures. Credit enhancements that would reduce the group's credit losses in the event of default are reflected in the calculation when they are considered integral to the related asset.
The maximum credit exposure associated with financial assets is equal to the carrying amount. The group does not aim to remove credit risk entirely but expects to experience a certain level of credit losses. As at 31 December 2019,2020, the group had in place credit enhancements designed to mitigate approximately $7.0$5.4 billion (2018 $7.3(2019 $7.0 billion) of credit risk, of which substantially all relates to assets in the scope of IFRS 9's impairment requirements. Credit enhancements include standby and documentary letters of credit, bank guarantees, insurance and liens which are typically taken out with financial institutions who have investment grade credit ratings, or are liens over assets held by the counterparty of the related receivables. Reports are regularly prepared and presented to the GFRC that cover the group’s overall credit exposure and expected loss trends, exposure by segment, and overall quality of the portfolio.
Management information used to monitor credit risk, which reflects the impact of credit enhancements, indicates that the risk profile of financial assets which are subject to review for impairment under IFRS 9 is as set out below. | | | | | | % |
| | | | % |
| As at 31 December | | 2019 |
| 2018 |
| As at 31 December | | 2020 | 2019 |
| AAA to AA- | | 16 | % | 22 | % | AAA to AA- | | 11 | % | 16 | % |
| A+ to A- | | 51 | % | 41 | % | A+ to A- | | 59 | % | 51 | % |
| BBB+ to BBB- | | 13 | % | 16 | % | BBB+ to BBB- | | 8 | % | 13 | % |
| BB+ to BB- | | 7 | % | 8 | % | BB+ to BB- | | 6 | % | 7 | % |
| B+ to B- | | 11 | % | 11 | % | B+ to B- | | 13 | % | 11 | % |
| CCC+ and below | | 2 | % | 2 | % | CCC+ and below | | 3 | % | 2 | % |
Movements in the impairment provision for trade and other receivables are shown in Note 21.
Financial instruments subject to offsetting, enforceable master netting arrangements and similar agreements
The following table shows the amounts recognized for financial assets and liabilities which are subject to offsetting arrangements on a gross basis, and the amounts offset in the balance sheet.
Amounts which cannot be offset under IFRS, but which could be settled net under the terms of master netting agreements if certain conditions arise, and collateral received or pledged, are also presented in the table to show the total net exposure of the group.
| | | | | | | | | | | | | | | | | | | $ million |
| | | | $ million |
| | | Gross amounts of recognized financial assets (liabilities) | Amounts
set off | Net amounts
presented on
the balance
sheet | Related amounts not set off
in the balance sheet | Net amount |
| | | Gross amounts of recognized financial assets (liabilities) |
| Amounts set off |
| Net amounts presented on the balance sheet |
| Related amounts not set off in the balance sheet | | Net amount |
| |
| At 31 December 2020 | | At 31 December 2020 | | Gross amounts of recognized financial assets (liabilities) | Amounts
set off | Net amounts
presented on
the balance
sheet | Master
netting
arrangements | Cash
collateral
(received)
pledged | Net amount |
| Derivative assets | | Derivative assets | | (2,075) | | (386) | |
| Derivative liabilities | | Derivative liabilities | | (10,414) | | 2,019 | | (8,395) | | 2,075 | | 0 | | (6,320) | |
| Trade and other receivables | | Trade and other receivables | | 7,667 | | (3,679) | | 3,988 | | (693) | | (122) | | 3,173 | |
| Trade and other payables | | Trade and other payables | | (7,862) | | 3,679 | | (4,183) | | 693 | | 0 | | (3,490) | |
| At 31 December 2019 | | Gross amounts of recognized financial assets (liabilities) |
| Amounts set off |
| Net amounts presented on the balance sheet |
| Master netting arrangements |
| Cash collateral (received) pledged |
| Net amount |
| At 31 December 2019 | | | | | |
| Derivative assets | | (1,971 | ) | (206 | ) | Derivative assets | | 13,191 | | (2,724) | | 10,467 | | (1,971) | | (206) | | 8,290 | |
| Derivative liabilities | | (11,445 | ) | 2,724 |
| (8,721 | ) | 1,971 |
| — |
| (6,750 | ) | Derivative liabilities | | (11,445) | | 2,724 | | (8,721) | | 1,971 | | 0 | | (6,750) | |
| Trade and other receivables | | 10,661 |
| (5,211 | ) | 5,450 |
| (961 | ) | (190 | ) | 4,299 |
| Trade and other receivables | | 10,661 | | (5,211) | | 5,450 | | (961) | | (190) | | 4,299 | |
| Trade and other payables | | (10,266 | ) | 5,211 |
| (5,055 | ) | 961 |
| — |
| (4,094 | ) | Trade and other payables | | (10,266) | | 5,211 | | (5,055) | | 961 | | 0 | | (4,094) | |
| At 31 December 2018 | | | | | | | |
| Derivative assets | | 11,502 |
| (2,511 | ) | 8,991 |
| (2,079 | ) | (299 | ) | 6,613 |
| |
| Derivative liabilities | | (11,337 | ) | 2,511 |
| (8,826 | ) | 2,079 |
| — |
| (6,747 | ) | |
| Trade and other receivables | | 11,296 |
| (5,390 | ) | 5,906 |
| (1,020 | ) | (169 | ) | 4,717 |
| |
| Trade and other payables | | (10,797 | ) | 5,390 |
| (5,407 | ) | 1,020 |
| — |
| (4,387 | ) | |
|
| | | | | | | | | | | | | |
| BP
| bp Annual Report and Form 20-F 20192020 | | 205209 |
29. Financial instruments and financial risk factors – continued
(c) Liquidity risk
Liquidity risk is the risk that suitable sources of funding for the group’s business activities may not be available. The group’s liquidity is managed centrally with operating units forecasting their cash and currency requirements to the central treasury function. Unless restricted by local regulations, generally subsidiaries pool their cash surpluses to the treasury function, which will then arrange to fund other subsidiaries’ requirements, or invest any net surplus in the market or arrange for necessary external borrowings, while managing the group’s overall net currency positions.
The group benefits from open credit provided by suppliers who generally sell on five to 60-day payment terms in accordance with industry norms. BPbp utilizes various arrangements in order to manage its working capital and reduce volatility in cash flow. This includes discounting of receivables and, in the supply and trading business,businesses, managing inventory, collateral and supplier payment terms within a maximum of 60 days.
It is normal practice in the oil and gas supply and trading business for customers and suppliers to utilise letter of credit (LC) facilities to mitigate credit and non-performance risk. Consequently, LCs facilitate active trading in a global market where credit and performance risk can be significant. In common with the industry, BPbp routinely provides LCs to some of its suppliers.
The group has committed LC facilities totalling $12,175$11,325 million (2018(2019 $12,175 million), allowing LCs to be issued for a maximum 24-month duration. There were also uncommitted secured LC facilities in place at 31 December 20192020 for $4,440$3,460 million (2018 $4,190(2019 $4,440 million), which are secured against inventories or receivables when utilized. The facilities are held with over 2025 international banks. The uncommitted secured LC facilities can only be terminated by either party giving a stipulated termination notice to the other.
In certain circumstances, the supplier has the option to request accelerated payment from the LC provider in order to further reduce their exposure. BP’sbp’s payments are made to the provider of the LC rather than the supplier according to the original contractual payment terms. At 31 December 2019,2020, $5,250 million (2019 $4,755 million (2018 $3,705 million) of the group’s trade payables subject to these arrangements were payable to LC providers, with no material exposure to any individual provider. If these facilities were not available, this could result in renegotiation of payment terms with suppliers such that settlement periods were shorter.
Standard & Poor’s Ratings long-term credit rating for BPbp is A- (positive(negative outlook) and Moody’s Investors Service rating is A1 (stable(negative outlook) and the Fitch Ratings' long-term credit rating is A (stable).
During 2019,2020, $14 billion (2019 $8 billion (2018 $9 billion) of long-term taxable bonds were issued with terms ranging from onetwo to thirty years. In addition the group issued perpetual hybrid bonds with a US dollar equivalent value of $11.9 billion. Commercial paper is issued at competitive rates to meet short-term borrowing requirements as and when needed.
As a further liquidity measure, the group continues to maintain suitable levels of cash and cash equivalents, amounting to $22.5$31.1 billion at 31 December 2019 (20182020 (2019 $22.5 billion), primarily invested with highly rated banks or money market funds and readily accessible at immediate and short notice. At 31 December 2019,2020, the group had substantial amounts of undrawn borrowing facilities available, consisting of $7,625 million (2018 $7,625 million)an undrawn committed $10.0 billion credit facility and $7.6 billion (2019 $7.6 billion) of standby facilities, allfacilities. On 1st March 2021, following an assessment of which is available to drawliquidity requirements, the group replaced these with new facility agreements, consisting of an undrawn committed $8.0 billion credit facility and repay up to the first half$4.0 billion of 2022. Thesestandby facilities. The facilities are available for three and five years respectively at pre-agreed margins and are with 2527 international banks, and borrowings under them would be at pre-agreed rates. On 13th March
For further information on the group entered into a committed $10,000 million credit facility which is available for two years at pre-agreed margins.
The table below shows the timinggroup's sources and uses of cash outflows relating to finance debt, tradesee Liquidity and other payables and accruals.
|
| | | | | | | | | | | | | | | | | |
| | | | | | | | | | $ million |
|
| | | | | | 2019 |
| | | | 2018 |
|
| | | Trade and other payablesa |
| Accruals |
| Finance debt |
| Interest on finance debt |
| Trade and other payablesa |
| Accruals |
| Finance debtb |
| Interest on finance debtb |
|
| Within one year | | 43,699 |
| 5,066 |
| 10,065 |
| 2,037 |
| 43,230 |
| 4,626 |
| 9,257 |
| 2,350 |
|
| 1 to 2 years | | 1,937 |
| 261 |
| 6,726 |
| 1,641 |
| 2,232 |
| 146 |
| 6,743 |
| 1,904 |
|
| 2 to 3 years | | 1,465 |
| 146 |
| 7,949 |
| 1,409 |
| 1,662 |
| 95 |
| 6,758 |
| 1,653 |
|
| 3 to 4 years | | 1,409 |
| 181 |
| 7,022 |
| 1,172 |
| 1,484 |
| 64 |
| 8,005 |
| 1,379 |
|
| 4 to 5 years | | 1,332 |
| 108 |
| 7,554 |
| 942 |
| 1,406 |
| 89 |
| 7,009 |
| 1,101 |
|
| 5 to 10 years | | 5,863 |
| 231 |
| 23,540 |
| 1,970 |
| 6,058 |
| 113 |
| 25,187 |
| 2,250 |
|
| Over 10 years | | 3,957 |
| 69 |
| 2,497 |
| 249 |
| 5,001 |
| 68 |
| 983 |
| 9 |
|
| | | 59,662 |
| 6,062 |
| 65,353 |
| 9,420 |
| 61,073 |
| 5,201 |
| 63,942 |
| 10,646 |
|
a 2019 includes $16,129 million (2018 $18,360 million) in relation to the Gulf of Mexico oil spill, of which $14,501 million (2018 $16,058 million) matures in greater than one year.
b As a result of the adoption of IFRS 16 ‘Leases’, leases that were previously classified as finance leases under IAS 17 are now presented as ‘Lease liabilities’capital resources on the group balance sheet and therefore do not form part of finance debt. Comparative information for finance debt and interest on finance debt has been amended to be on a consistent basis with amounts presented for 2019. $667 million and $683 million relating to finance lease liabilities have been excluded from the comparative information for finance debt and interest on finance debt respectively for 2018. The previously disclosed amounts for finance debt and interest on finance debt for 2018 was $64,608 million and $11,329 million respectively. The timing of cash outflows relating to lease liabilities reported on the balance sheet are now shown in Note 28.
page 306.
The group manages liquidity risk associated with derivative contracts, other than derivative hedging instruments, based on the expected maturities of both derivative assets and liabilities as indicated in Note 30. Management does not currently anticipate any cash flows, other than noted below, that could be of a significantly different amount or could occur earlier than the expected maturity analysis provided.
The table below shows the timing of cash outflows relating to finance debt, trade and other payables and accruals. As part of actively managing the group’s debt portfolio it is possible that cash flows in relation to finance debt could be accelerated from the profile provided. As a result of the 19 March 2021 debt buy back (see Note 26 for further information) $1.9 billion equivalent of cash outflows relating to finance debt that are presented in the table with maturities of 2-8 years have occurred within one year of the balance sheet date.
| | | | | | | | | | | | | | | | | | | | | | | | | | | | | |
| | | | | | | | | $ million |
| | | | | 2020 | | | | 2019 |
| | Trade and other payablesa | Accruals | Finance
debt | Interest on finance debt | Trade and other payablesa | Accruals | Finance debtb | Interest on finance debt |
| Within one year | | 33,290 | | 4,650 | | 9,119 | | 1,778 | | 43,699 | | 5,066 | | 10,065 | | 2,037 | |
| 1 to 2 years | | 1,728 | | 157 | | 6,292 | | 1,477 | | 1,937 | | 261 | | 6,726 | | 1,641 | |
| 2 to 3 years | | 1,590 | | 184 | | 7,031 | | 1,305 | | 1,465 | | 146 | | 7,949 | | 1,409 | |
| 3 to 4 years | | 1,332 | | 87 | | 8,047 | | 1,110 | | 1,409 | | 181 | | 7,022 | | 1,172 | |
| 4 to 5 years | | 1,335 | | 217 | | 6,652 | | 919 | | 1,332 | | 108 | | 7,554 | | 942 | |
| 5 to 10 years | | 4,570 | | 108 | | 22,156 | | 2,408 | | 5,863 | | 231 | | 23,540 | | 1,970 | |
| Over 10 years | | 4,419 | | 99 | | 10,008 | | 1,037 | | 3,957 | | 69 | | 2,497 | | 249 | |
| | 48,264 | | 5,502 | | 69,305 | | 10,034 | | 59,662 | | 6,062 | | 65,353 | | 9,420 | |
a 2020 includes $14,569 million (2019 $16,129 million) in relation to the Gulf of Mexico oil spill, of which $13,160 million (2019 $14,501 million) matures in greater than one year.
|
| | | | | | | | | | | | | |
206210 | | BPbp Annual Report and Form 20-F 2019
2020 | | |
29. Financial instruments and financial risk factors – continued
The table below shows the timing of cash outflows for derivative financial instruments entered into for the purpose of managing interest rate and foreign currency exchange risk, associated with finance debt, whether or not hedge accounting is applied, based upon contractual payment dates. As part of actively managing the group’s debt portfolio it is possible that cash flows in relation to associated derivatives could be accelerated from the profile provided. The amounts reflect the gross settlement amount where the pay leg of a derivative will be settled separately from the receive leg, as in the case of cross-currency swaps hedging non-US dollar finance debt.debt or hybrid bonds. The swaps are with high investment-grade counterparties and therefore the settlement-day risk exposure is considered to be negligible. Not shown in the table are the gross settlement amounts (inflows) for the receive leg of derivatives that are settled separately from the pay leg, which amount to $24,787$33,704 million at 31 December 2019 (2018 $22,4532020 (2019 $24,787 million) to be received on the same day as the related cash outflows. As a result of the termination of derivatives associated with the 19 March 2021 debt buy back (see Note 26 for further information) $1.8 billion of cash outflows that are presented in the table with maturities of 2-8 years and $1.9 billion equivalent of cash inflows on the receive legs have occurred within one year of the balance sheet date.
| | | | | | | | | | | |
| | | $ million |
| Cash outflows for derivative financial instruments at 31 December | | 2020 | 2019 |
| Within one year | | 2,384 | | 1,678 | |
| 1 to 2 years | | 1,976 | | 2,384 | |
| 2 to 3 years | | 2,017 | | 2,838 | |
| 3 to 4 years | | 3,074 | | 2,906 | |
| 4 to 5 years | | 2,582 | | 3,321 | |
| 5 to 10 years | | 15,263 | | 10,633 | |
| Over 10 years | | 4,483 | | 2,224 | |
| | | 31,779 | | 25,984 | |
For further information on our derivative financial instruments, see Note 30.
|
| | | | | |
| | | | $ million |
|
| Cash outflows for derivative financial instruments at 31 December | | 2019 |
| 2018 |
|
| Within one year | | 1,678 |
| 1,700 |
|
| 1 to 2 years | | 2,384 |
| 1,678 |
|
| 2 to 3 years | | 2,838 |
| 2,384 |
|
| 3 to 4 years | | 2,906 |
| 2,838 |
|
| 4 to 5 years | | 3,321 |
| 2,906 |
|
| 5 to 10 years | | 10,633 |
| 11,475 |
|
| Over 10 years | | 2,224 |
| 724 |
|
| | | 25,984 |
| 23,705 |
|
30. Derivative financial instruments
In the normal course of business the group enters into derivative financial instruments (derivatives) to manage its normal business exposures in relation to commodity prices, foreign currency exchange rates and interest rates, including management of the balance between floating rate and fixed rate debt, consistent with risk management policies and objectives. An outline of the group’s financial risks and the objectives and policies pursued in relation to those risks is set out in Note 29. Additionally, the group has a well-established entrepreneurial trading operation that is undertaken in conjunction with these activities using a similar range of contracts.
For information on significant estimates and judgements made in relation to the valuation of derivatives see Derivative financial instruments within Note 1.
The fair values of derivative financial instruments at 31 December are set out below.
Exchange traded derivatives are valued using closing prices provided by the exchange as at the balance sheet date. These derivatives are categorized within level 1 of the fair value hierarchy. Exchange traded derivatives are typically considered settled through the (normally daily) payment or receipt of variation margin.
Over-the-counter (OTC) financial swaps and physical commodity sale and purchase contracts are generally valued using readily available information in the public markets and quotations provided by brokers and price index developers. These quotes are corroborated with market data and are categorized within level 2 of the fair value hierarchy.
In certain less liquid markets, or for longer-term contracts, forward prices are not as readily available. In these circumstances, OTC financial swaps and physical commodity sale and purchase contracts are valued using internally developed methodologies that consider historical relationships between various commodities, and that result in management’s best estimate of fair value. These contracts are categorized within level 3 of the fair value hierarchy.
|
| | | | | | | | | | | | | |
| BP
| bp Annual Report and Form 20-F 20192020 | | 207211 |
30. Derivative financial instruments – continued
Financial OTC and physical commodity options are valued using industry standard models that consider various assumptions, including quoted forward prices for commodities, time value, volatility factors, and contractual prices for the underlying instruments, as well as other relevant economic factors. The degree to which these inputs are observable in the forward markets determines whether the option is categorized within level 2 or level 3 of the fair value hierarchy.
| | | | | | $ million |
| | | | $ million |
| | | | 2019 |
| | 2018 |
| | | | 2020 | | 2019 |
| | | Fair value asset |
| Fair value liability |
| Fair value asset |
| Fair value liability |
| | | Fair value
asset | Fair value
liability | Fair value
asset | Fair value
liability |
| Derivatives held for trading | | | Derivatives held for trading | | | |
| Currency derivatives | | 81 |
| (744 | ) | 69 |
| (898 | ) | Currency derivatives | | 858 | | (694) | | 81 | | (744) | |
| Oil price derivatives | | 1,918 |
| (1,478 | ) | 2,361 |
| (1,849 | ) | Oil price derivatives | | 1,519 | | (1,093) | | 1,918 | | (1,478) | |
| Natural gas price derivatives | | 6,569 |
| (4,871 | ) | 4,787 |
| (3,888 | ) | Natural gas price derivatives | | 6,406 | | (5,489) | | 6,569 | | (4,871) | |
| Power price derivatives | | 1,306 |
| (952 | ) | 1,240 |
| (943 | ) | Power price derivatives | | 1,258 | | (1,037) | | 1,306 | | (952) | |
| Other derivatives | | 110 |
| — |
| 107 |
| — |
| Other derivatives | | 7 | | 0 | | 110 | | 0 | |
| | | 9,984 |
| (8,045 | ) | 8,564 |
| (7,578 | ) | | | 10,048 | | (8,313) | | 9,984 | | (8,045) | |
| Embedded derivatives | | | Embedded derivatives | | | |
| | Other embedded derivatives | | — |
| (77 | ) | — |
| (107 | ) | Other embedded derivatives | | 1 | | (7) | | 0 | | (77) | |
| | | — |
| (77 | ) | — |
| (107 | ) | | | 1 | | (7) | | 0 | | (77) | |
| Cash flow hedges | | | Cash flow hedges | | | |
| Currency forwards | | 1 |
| (4 | ) | 5 |
| (14 | ) | Currency forwards | | 4 | | 0 | | 1 | | (4) | |
| | Gas price futures | | — |
| — |
| 2 |
| — |
| Gas price futures | | 0 | | 0 | | 0 | | 0 | |
| | | 1 |
| (4 | ) | 7 |
| (14 | ) | | | 4 | | 0 | | 1 | | (4) | |
| Fair value hedges | | | Fair value hedges | | | |
| Currency swaps | | 344 |
| (637 | ) | 158 |
| (789 | ) | Currency swaps | | 2,614 | | (82) | | 344 | | (637) | |
| Interest rate swaps | | 138 |
| (35 | ) | 262 |
| (445 | ) | Interest rate swaps | | 80 | | 0 | | 138 | | (35) | |
| | | 482 |
| (672 | ) | 420 |
| (1,234 | ) | | | 2,694 | | (82) | | 482 | | (672) | |
| | | 10,467 |
| (8,798 | ) | 8,991 |
| (8,933 | ) | | | 12,747 | | (8,402) | | 10,467 | | (8,798) | |
| Of which – current | | 4,153 |
| (3,261 | ) | 3,846 |
| (3,308 | ) | Of which – current | | 2,992 | | (2,998) | | 4,153 | | (3,261) | |
| – non-current | | 6,314 |
| (5,537 | ) | 5,145 |
| (5,625 | ) | – non-current | | 9,755 | | (5,404) | | 6,314 | | (5,537) | |
Derivatives held for trading
The group maintains active trading positions in a variety of derivatives. The contracts may be entered into for risk management purposes, to satisfy supply requirements or for entrepreneurial trading. Certain contracts are classified as held for trading, regardless of their original business objective, and are recognized at fair value with changes in fair value recognized in the income statement. Trading activities are undertaken by using a range of contract types in combination to create incremental gains by arbitraging prices between markets, locations and time periods. The net of these exposures is monitored using market value-at-risk techniques as described in Note 29.
The following tables show further information on the fair value of derivatives and other financial instruments held for trading purposes.
Derivative assets held for trading have the following fair values and maturities.
| | | | | | $ million |
| | | | $ million |
| | | | 2019 |
| | | | 2020 |
| | | Less than 1 year |
| 1-2 years |
| 2-3 years |
| 3-4 years |
| 4-5 years |
| Over 5 years |
| Total |
| | | Less than
1 year | 1-2 years | 2-3 years | 3-4 years | 4-5 years | Over
5 years | Total |
| Currency derivatives | | 48 |
| 23 |
| 9 |
| 1 |
| — |
| — |
| 81 |
| Currency derivatives | | 153 | | 9 | | 3 | | 2 | | 2 | | 689 | | 858 | |
| Oil price derivatives | | 1,619 |
| 114 |
| 76 |
| 53 |
| 45 |
| 11 |
| 1,918 |
| Oil price derivatives | | 1,159 | | 197 | | 90 | | 63 | | 7 | | 3 | | 1,519 | |
| Natural gas price derivatives | | 1,889 |
| 824 |
| 615 |
| 489 |
| 433 |
| 2,319 |
| 6,569 |
| Natural gas price derivatives | | 1,210 | | 731 | | 596 | | 525 | | 476 | | 2,868 | | 6,406 | |
| Power price derivatives | | 556 |
| 269 |
| 146 |
| 94 |
| 67 |
| 174 |
| 1,306 |
| Power price derivatives | | 425 | | 223 | | 161 | | 107 | | 76 | | 266 | | 1,258 | |
| Other derivatives | | 33 |
| — |
| — |
| 77 |
| — |
| — |
| 110 |
| Other derivatives | | 0 | | 0 | | 7 | | 0 | | 0 | | 0 | | 7 | |
| | | 4,145 |
| 1,230 |
| 846 |
| 714 |
| 545 |
| 2,504 |
| 9,984 |
| | | 2,947 | | 1,160 | | 857 | | 697 | | 561 | | 3,826 | | 10,048 | |
| | | | | | |
| | | | $ million |
| | | | $ million |
| | | | 2018 |
| | | | 2019 |
| | | Less than 1 year |
| 1-2 years |
| 2-3 years |
| 3-4 years |
| 4-5 years |
| Over 5 years |
| Total |
| | | Less than
1 year | 1-2 years | 2-3 years | 3-4 years | 4-5 years | Over
5 years | Total |
| Currency derivatives | | 48 |
| 12 |
| 9 |
| — |
| — |
| — |
| 69 |
| Currency derivatives | | 48 | | 23 | | 9 | | 1 | | 0 | | 0 | | 81 | |
| Oil price derivatives | | 1,916 |
| 363 |
| 53 |
| 25 |
| 4 |
| — |
| 2,361 |
| Oil price derivatives | | 1,619 | | 114 | | 76 | | 53 | | 45 | | 11 | | 1,918 | |
| Natural gas price derivatives | | 1,333 |
| 708 |
| 542 |
| 452 |
| 352 |
| 1,400 |
| 4,787 |
| Natural gas price derivatives | | 1,889 | | 824 | | 615 | | 489 | | 433 | | 2,319 | | 6,569 | |
| Power price derivatives | | 540 |
| 276 |
| 158 |
| 79 |
| 55 |
| 132 |
| 1,240 |
| Power price derivatives | | 556 | | 269 | | 146 | | 94 | | 67 | | 174 | | 1,306 | |
| Other derivatives | | — |
| — |
| — |
| — |
| 107 |
| — |
| 107 |
| Other derivatives | | 33 | | 0 | | 0 | | 77 | | 0 | | 0 | | 110 | |
| | | 3,837 |
| 1,359 |
| 762 |
| 556 |
| 518 |
| 1,532 |
| 8,564 |
| | | 4,145 | | 1,230 | | 846 | | 714 | | 545 | | 2,504 | | 9,984 | |
|
| | | | | | | | | | | | | |
208212 | | BPbp Annual Report and Form 20-F 2019
2020 | | |
30. Derivative financial instruments – continued
Derivative liabilities held for trading have the following fair values and maturities.
| | | | | | $ million |
| | | | $ million |
| | | | 2019 |
| | | | 2020 |
| | | Less than 1 year |
| 1-2 years |
| 2-3 years |
| 3-4 years |
| 4-5 years |
| Over 5 years |
| Total |
| | | Less than
1 year | 1-2 years | 2-3 years | 3-4 years | 4-5 years | Over
5 years | Total |
| Currency derivatives | | (166 | ) | (283 | ) | (201 | ) | (1 | ) | (23 | ) | (70 | ) | (744 | ) | Currency derivatives | | (502) | | (117) | | (11) | | (1) | | 0 | | (63) | | (694) | |
| Oil price derivatives | | (1,405 | ) | (56 | ) | (14 | ) | (2 | ) | (1 | ) | — |
| (1,478 | ) | Oil price derivatives | | (1,000) | | (83) | | (9) | | (1) | | 0 | | 0 | | (1,093) | |
| Natural gas price derivatives | | (1,070 | ) | (522 | ) | (446 | ) | (399 | ) | (363 | ) | (2,071 | ) | (4,871 | ) | Natural gas price derivatives | | (1,095) | | (595) | | (479) | | (422) | | (348) | | (2,550) | | (5,489) | |
| Power price derivatives | | (395 | ) | (165 | ) | (104 | ) | (76 | ) | (51 | ) | (161 | ) | (952 | ) | Power price derivatives | | (345) | | (184) | | (126) | | (81) | | (68) | | (233) | | (1,037) | |
| | | (3,036 | ) | (1,026 | ) | (765 | ) | (478 | ) | (438 | ) | (2,302 | ) | (8,045 | ) | | | (2,942) | | (979) | | (625) | | (505) | | (416) | | (2,846) | | (8,313) | |
| | | | | | |
| | | | $ million |
| | | | $ million |
| | | | 2018 |
| | | | 2019 |
| | | Less than 1 year |
| 1-2 years |
| 2-3 years |
| 3-4 years |
| 4-5 years |
| Over 5 years |
| Total |
| | | Less than
1 year | 1-2 years | 2-3 years | 3-4 years | 4-5 years | Over
5 years | Total |
| Currency derivatives | | (299 | ) | (71 | ) | (256 | ) | (171 | ) | (3 | ) | (98 | ) | (898 | ) | Currency derivatives | | (166) | | (283) | | (201) | | (1) | | (23) | | (70) | | (744) | |
| Oil price derivatives | | (1,560 | ) | (232 | ) | (43 | ) | (12 | ) | (2 | ) | — |
| (1,849 | ) | Oil price derivatives | | (1,405) | | (56) | | (14) | | (2) | | (1) | | 0 | | (1,478) | |
| Natural gas price derivatives | | (1,030 | ) | (557 | ) | (391 | ) | (338 | ) | (285 | ) | (1,287 | ) | (3,888 | ) | Natural gas price derivatives | | (1,070) | | (522) | | (446) | | (399) | | (363) | | (2,071) | | (4,871) | |
| Power price derivatives | | (401 | ) | (213 | ) | (95 | ) | (54 | ) | (47 | ) | (133 | ) | (943 | ) | Power price derivatives | | (395) | | (165) | | (104) | | (76) | | (51) | | (161) | | (952) | |
| | | (3,290 | ) | (1,073 | ) | (785 | ) | (575 | ) | (337 | ) | (1,518 | ) | (7,578 | ) | | | (3,036) | | (1,026) | | (765) | | (478) | | (438) | | (2,302) | | (8,045) | |
The following table shows the fair value of derivative assets and derivative liabilities held for trading, analysed by maturity period and by methodology of fair value estimation. This information is presented on a gross basis, that is, before netting by counterparty.
| | | | | | | | | | | | | | | | | | | | | | | | | | |
| | | | | | | | $ million |
| | | | | | | | 2020 |
| | Less than
1 year | 1-2 years | 2-3 years | 3-4 years | 4-5 years | Over
5 years | Total |
| Fair value of derivative assets | | | | | | | | |
| Level 1 | | 48 | | 9 | | 15 | | 3 | | 5 | | 1 | | 81 | |
| Level 2 | | 3,342 | | 858 | | 367 | | 212 | | 100 | | 709 | | 5,588 | |
| Level 3 | | 739 | | 546 | | 552 | | 520 | | 493 | | 3,548 | | 6,398 | |
| | 4,129 | | 1,413 | | 934 | | 735 | | 598 | | 4,258 | | 12,067 | |
| Less: netting by counterparty | | (1,182) | | (253) | | (77) | | (38) | | (37) | | (432) | | (2,019) | |
| | 2,947 | | 1,160 | | 857 | | 697 | | 561 | | 3,826 | | 10,048 | |
| Fair value of derivative liabilities | | | | | | | | |
| Level 1 | | (55) | | (9) | | (13) | | (3) | | (5) | | (1) | | (86) | |
| Level 2 | | (3,577) | | (809) | | (263) | | (136) | | (41) | | (79) | | (4,905) | |
| Level 3 | | (492) | | (414) | | (426) | | (404) | | (407) | | (3,198) | | (5,341) | |
| | (4,124) | | (1,232) | | (702) | | (543) | | (453) | | (3,278) | | (10,332) | |
| Less: netting by counterparty | | 1,182 | | 253 | | 77 | | 38 | | 37 | | 432 | | 2,019 | |
| | (2,942) | | (979) | | (625) | | (505) | | (416) | | (2,846) | | (8,313) | |
| Net fair value | | 5 | | 181 | | 232 | | 192 | | 145 | | 980 | | 1,735 | |
| | | | | | | | |
| | | | | | | | | $ million |
| | | | | | | | | 2019 |
| | Less than
1 year | 1-2 years | 2-3 years | 3-4 years | 4-5 years | Over
5 years | Total |
| Fair value of derivative assets | | | | | | | | |
| Level 1 | | 63 | | 6 | | 2 | | 0 | | 2 | | 1 | | 74 | |
| Level 2 | | 5,344 | | 1,014 | | 439 | | 210 | | 120 | | 42 | | 7,169 | |
| Level 3 | | 779 | | 501 | | 485 | | 540 | | 452 | | 2,708 | | 5,465 | |
| | 6,186 | | 1,521 | | 926 | | 750 | | 574 | | 2,751 | | 12,708 | |
| Less: netting by counterparty | | (2,041) | | (291) | | (80) | | (36) | | (29) | | (247) | | (2,724) | |
| | 4,145 | | 1,230 | | 846 | | 714 | | 545 | | 2,504 | | 9,984 | |
| Fair value of derivative liabilities | | | | | | | | |
| Level 1 | | (49) | | (8) | | (4) | | (1) | | (2) | | (1) | | (65) | |
| Level 2 | | (4,522) | | (932) | | (458) | | (146) | | (113) | | (101) | | (6,272) | |
| Level 3 | | (506) | | (377) | | (383) | | (367) | | (352) | | (2,447) | | (4,432) | |
| | (5,077) | | (1,317) | | (845) | | (514) | | (467) | | (2,549) | | (10,769) | |
| Less: netting by counterparty | | 2,041 | | 291 | | 80 | | 36 | | 29 | | 247 | | 2,724 | |
| | (3,036) | | (1,026) | | (765) | | (478) | | (438) | | (2,302) | | (8,045) | |
| Net fair value | | 1,109 | | 204 | | 81 | | 236 | | 107 | | 202 | | 1,939 | |
|
| | | | | | | | | | | | | | | |
| | | | | | | | | $ million |
|
| | | | | | | | | 2019 |
|
| | | Less than 1 year |
| 1-2 years |
| 2-3 years |
| 3-4 years |
| 4-5 years |
| Over 5 years |
| Total |
|
| Fair value of derivative assets | | | | | | | | |
| Level 1 | | 63 |
| 6 |
| 2 |
| — |
| 2 |
| 1 |
| 74 |
|
| Level 2 | | 5,344 |
| 1,014 |
| 439 |
| 210 |
| 120 |
| 42 |
| 7,169 |
|
| Level 3 | | 779 |
| 501 |
| 485 |
| 540 |
| 452 |
| 2,708 |
| 5,465 |
|
| | | 6,186 |
| 1,521 |
| 926 |
| 750 |
| 574 |
| 2,751 |
| 12,708 |
|
| Less: netting by counterparty | | (2,041 | ) | (291 | ) | (80 | ) | (36 | ) | (29 | ) | (247 | ) | (2,724 | ) |
| | | 4,145 |
| 1,230 |
| 846 |
| 714 |
| 545 |
| 2,504 |
| 9,984 |
|
| Fair value of derivative liabilities | | | | | | | | |
| Level 1 | | (49 | ) | (8 | ) | (4 | ) | (1 | ) | (2 | ) | (1 | ) | (65 | ) |
| Level 2 | | (4,522 | ) | (932 | ) | (458 | ) | (146 | ) | (113 | ) | (101 | ) | (6,272 | ) |
| Level 3 | | (506 | ) | (377 | ) | (383 | ) | (367 | ) | (352 | ) | (2,447 | ) | (4,432 | ) |
| | | (5,077 | ) | (1,317 | ) | (845 | ) | (514 | ) | (467 | ) | (2,549 | ) | (10,769 | ) |
| Less: netting by counterparty | | 2,041 |
| 291 |
| 80 |
| 36 |
| 29 |
| 247 |
| 2,724 |
|
| | | (3,036 | ) | (1,026 | ) | (765 | ) | (478 | ) | (438 | ) | (2,302 | ) | (8,045 | ) |
| Net fair value | | 1,109 |
| 204 |
| 81 |
| 236 |
| 107 |
| 202 |
| 1,939 |
|
| | | | | | | | | |
| | | | | | | | | $ million |
|
| | | | | | | | | 2018 |
|
| | | Less than 1 year |
| 1-2 years |
| 2-3 years |
| 3-4 years |
| 4-5 years |
| Over 5 years |
| Total |
|
| Fair value of derivative assets | | | | | | | | |
| Level 1 | | 111 |
| 14 |
| 3 |
| — |
| — |
| — |
| 128 |
|
| Level 2 | | 5,000 |
| 1,362 |
| 504 |
| 262 |
| 120 |
| 72 |
| 7,320 |
|
| Level 3 | | 491 |
| 385 |
| 353 |
| 331 |
| 427 |
| 1,640 |
| 3,627 |
|
| | | 5,602 |
| 1,761 |
| 860 |
| 593 |
| 547 |
| 1,712 |
| 11,075 |
|
| Less: netting by counterparty | | (1,765 | ) | (402 | ) | (98 | ) | (37 | ) | (29 | ) | (180 | ) | (2,511 | ) |
| | | 3,837 |
| 1,359 |
| 762 |
| 556 |
| 518 |
| 1,532 |
| 8,564 |
|
| Fair value of derivative liabilities | | | | | | | | |
| Level 1 | | (156 | ) | (11 | ) | (2 | ) | (2 | ) | — |
| — |
| (171 | ) |
| Level 2 | | (4,562 | ) | (1,161 | ) | (576 | ) | (308 | ) | (67 | ) | (163 | ) | (6,837 | ) |
| Level 3 | | (337 | ) | (303 | ) | (305 | ) | (302 | ) | (299 | ) | (1,535 | ) | (3,081 | ) |
| | | (5,055 | ) | (1,475 | ) | (883 | ) | (612 | ) | (366 | ) | (1,698 | ) | (10,089 | ) |
| Less: netting by counterparty | | 1,765 |
| 402 |
| 98 |
| 37 |
| 29 |
| 180 |
| 2,511 |
|
| | | (3,290 | ) | (1,073 | ) | (785 | ) | (575 | ) | (337 | ) | (1,518 | ) | (7,578 | ) |
| Net fair value | | 547 |
| 286 |
| (23 | ) | (19 | ) | 181 |
| 14 |
| 986 |
|
|
| | | | | | | | | | | | | |
| BP
| bp Annual Report and Form 20-F 20192020 | | 209213 |
30. Derivative financial instruments – continued
Level 3 derivatives
The following table shows the changes during the year in the net fair value of derivatives held for trading purposes within level 3 of the fair value hierarchy.
| | | | | | $ million |
| | | | Oil
price | Natural gas
price | Power
price | Currency and other | Total |
| Fair value contracts at 1 January 2020 | | Fair value contracts at 1 January 2020 | | 71 | | 28 | | (125) | | 110 | | 84 | |
| Gains (losses) recognized in the income statement | | Gains (losses) recognized in the income statement | | 250 | | 184 | | 162 | | (66) | | 530 | |
| | Sales | | Sales | | 0 | | 0 | | 0 | | (32) | | (32) | |
| Settlements | | Settlements | | (135) | | (22) | | (189) | | 0 | | (346) | |
| Transfers out of level 3 | | Transfers out of level 3 | | 5 | | (43) | | (21) | | (1) | | (60) | |
| Net fair value of contracts at 31 December 2020 | | Net fair value of contracts at 31 December 2020 | | 191 | | 147 | | (173) | | 11 | | 176 | |
| Deferred day-one gains (losses) | | Deferred day-one gains (losses) | | | 881 | |
| Derivative asset (liability) | | Derivative asset (liability) | | | 1,057 | |
| | | | | $ million |
| | | | $ million |
| | | Oil price |
| Natural gas price |
| Power price |
| Other |
| Total |
| | | Oil
price | Natural gas
price | Power
price | Other | Total |
| Fair value contracts at 1 January 2019 | | 23 |
| (13 | ) | (148 | ) | 107 |
| (31 | ) | Fair value contracts at 1 January 2019 | | 23 | | (13) | | (148) | | 107 | | (31) | |
| Gains (losses) recognized in the income statement | | 128 |
| 82 |
| 244 |
| 2 |
| 456 |
| Gains (losses) recognized in the income statement | | 128 | | 82 | | 244 | | 2 | | 456 | |
| Gains (losses) recognized in other comprehensive income | | — |
| — |
| (18 | ) | — |
| (18 | ) | Gains (losses) recognized in other comprehensive income | | 0 | | 0 | | (18) | | 0 | | (18) | |
| Settlements | | (79 | ) | (21 | ) | (179 | ) | — |
| (279 | ) | Settlements | | (79) | | (21) | | (179) | | 0 | | (279) | |
| Transfers out of level 3 | | (1 | ) | (20 | ) | (24 | ) | 1 |
| (44 | ) | Transfers out of level 3 | | (1) | | (20) | | (24) | | 1 | | (44) | |
| Net fair value of contracts at 31 December 2019 | | 71 |
| 28 |
| (125 | ) | 110 |
| 84 |
| Net fair value of contracts at 31 December 2019 | | 71 | | 28 | | (125) | | 110 | | 84 | |
| Deferred day-one gains (losses) | | | 949 |
| Deferred day-one gains (losses) | | | 949 | |
| Derivative asset (liability) | | | 1,033 |
| Derivative asset (liability) | | | 1,033 | |
| | | | |
| | | | $ million |
| |
| | | Oil price |
| Natural gas price |
| Power price |
| Other |
| Total |
| |
| Fair value contracts at 1 January 2018 | | 67 |
| 65 |
| (226 | ) | 115 |
| 21 |
| |
| Gains (losses) recognized in the income statement | | 58 |
| (26 | ) | 209 |
| (8 | ) | 233 |
| |
| Settlements | | (107 | ) | (32 | ) | (97 | ) | — |
| (236 | ) | |
| Transfers out of level 3 | | 5 |
| (20 | ) | (34 | ) | — |
| (49 | ) | |
| Net fair value of contracts at 31 December 2018 | | 23 |
| (13 | ) | (148 | ) | 107 |
| (31 | ) | |
| Deferred day-one gains (losses) | | | 577 |
| |
| Derivative asset (liability) | | | 546 |
| |
The amount recognized in the income statement for the year relating to level 3 held-for-trading derivatives still held at 31 December 20192020 was a $250-million$315-million gain (2018 $123-million(2019 $250-million gain related to derivatives still held at 31 December 2018)2019).
Derivative gains and losses
The group enters into derivative contracts including futures, options, swaps and certain forward sales and forward purchases contracts, relating to both currency and commodity trading activities. Gains or losses arise on contracts entered into for risk management purposes, optimization activity and entrepreneurial trading. They also arise on certain contracts that are for normal procurement or sales activity for the group but that are required to be fair valued under accounting standards. These gains and losses are included within sales and other operating revenues in the income statement. Also included within this line item are gains and losses on inventory held for trading purposes. The total amount relating to all these items was a net gain of $2,153 million (2018 $2,504 million net gain and 2017 $1,983 million net gain).$2,808 million. This number does not include gains and losses on realized physical derivative contracts that have been reflected gross in the income statement within sales and purchases or the change in value of transportation and storage contracts which are not recognized under IFRS such as transportation and storage contracts, but does include the associated financially settled contracts. The net amounts for actual gains and losses relating to these derivative contracts and all related items therefore differ significantly from the amounts disclosed above.
The group also enters into derivative contracts relating to foreign currency risk management activities.activities including contracts that the group has entered into to manage the foreign currency exposure relating to the non-US dollar hybrid bonds to their respective first call periods. Gains and losses on these contracts are included within production and manufacturing expenses in the income statement. The change in the unrealized value of these contracts was a net gain of $829 million (2019 $160 million (2018net gain and 2018 $351 million net loss and 2017 $1,420 million net gain)loss), however thewhere these gains and losses in each yeararise on derivatives hedging finance debt they are largely offset by opposing net foreign exchange differences on retranslation of the associated non-US dollar debt. The net amounts for actual gains and losses relating to these derivative contracts and all related items therefore differ significantly from the amounts disclosed above.
Cash flow hedges
(i) Foreign currency risk of highly probable forecast capital expenditure
At 31 December 2019,2020, the group held currency forwards designated as hedging instruments in cash flow hedge relationships of highly probable forecast non-US dollar capital expenditure. Note 29 outlines the group’s approach to foreign currency exchange risk management. When the highly probable forecast capital expenditure designated as a hedged item occurs, a non-financial asset is recognized and is presented within the fixed asset section of the balance sheet.
The group claims hedge accounting only for the spot value of the currency exposure in line with the strategy to fix the volatility in the spot exchange rate element. The fair value on the instrument attributable to forward points and foreign currency basis spreads is taken immediately to the income statement.
The group applies hedge accounting where there is an economic relationship between the hedged item and hedging instrument. The existence of an economic relationship is determined at inception and prospectively by comparing the critical terms of the hedging instrument and those of the hedged item. The group enters into hedging derivatives that match the currency and notional of the hedged items on a 1:1 hedge ratio basis. The hedge ratio is determined by comparing the notional amount of the derivative with the notional designated on the forecast transaction. The group determines the extent to which it hedges highly probable forecast capital expenditures on a project by project basis.
The group has identified the following sources of ineffectiveness, which are not expected to be material:
•counterparty's credit risk, the group mitigates counterparty credit risk by entering into derivative transactions with high credit quality counterparties; and
| | | | | | | | | | | | | | |
| 214 | | bp Annual Report and Form 20-F 2020 | | |
30. Derivative financial instruments – continued
•differences in settlement timing between the derivative and hedged items. The latter impacts the discount factor used in the calculation of the hedge ineffectiveness. The group mitigates differences in timing between the derivatives and hedged items by applying a rolling strategy and by hedging currency pairs from stable economies (i.e. sterling/US dollar, Euro/US dollar, Korean won/US dollar). The group's cash flow hedge designations are highly effective as the sources of ineffectiveness identified are expected to result in minimal hedge ineffectiveness.
The group has not designated any net positions as hedged items in cash flow hedges of foreign currency risk.
|
| | | |
210 | | BP Annual Report and Form 20-F 2019
| |
30. Derivative financial instruments – continued
(ii) Commodity price risk of highly probable forecast sales
During the period the group held Henry Hub NYMEX futures designated as hedging instruments in cash flow hedge relationships of certain highly probable forecast future sales. At 31 December 2019,Henry Hub NYMEX futures are subject to daily settlement, where their fair value at the end of each day is required to be cash settled, such that the carrying amount of these hedging instruments and highly probably forecast sales had been realised andwithin continuing hedge relationships is always zero at the corresponding amounts recognised in the cash flow hedge reserve were released to the income statement during the period.end of each day.
The group is exposed to the variability in the gas price, but only applied hedge accounting to the risk of Henry Hub price movements for a percentage of future gas sales from its BPX Energy business (previously known as US Lower 48 business).business.
The group applied hedge accounting in relation to these highly probable future sales where there was an economic relationship between the hedged item and hedging instrument. The existence of an economic relationship was determined at inception and prospectively by comparing the critical terms of the hedging instrument and those of the hedged item. The group entered into hedging derivatives that matched the notional amounts of the hedged items on a 1:1 hedge ratio basis. The hedge ratio was determined by comparing the notional amount of the derivative with the notional amount designated on the forecast transaction.
The hedge was highly effective due to the price index of the hedging instruments matching the price index of the hedged item. The group did not designate any net positions as hedged items in cash flow hedges of commodity price risk.
The tables below summarize the change in the fair value of hedging instruments and the hedged item used to calculate ineffectiveness in the period.
| | | | | | | | | | | | | | |
| | | | $ million |
| | Change in fair value of hedging instrument used to calculate ineffectiveness | Change in fair value of hedged item used to calculate ineffectiveness | Hedge ineffectiveness recognized in profit or (loss) |
| At 31 December 2020 | | | | |
| Cash flow hedges | | | | |
| Foreign exchange risk | | | | |
| Highly probable forecast capital expenditure | | 4 | | (4) | | 0 | |
| Commodity price risk | | | | |
| Highly probable forecast sales | | 78 | | (78) | | 0 | |
| | | | |
| At 31 December 2019 | | | | |
| Cash flow hedges | | | | |
| Foreign exchange risk | | | | |
| Highly probable forecast capital expenditure | | (1) | | 1 | | 0 | |
| Commodity price risk | | | | |
| Highly probable forecast sales | | (100) | | 100 | | 0 | |
|
| | | | | | | |
| | | | | $ million |
|
| | | Change in fair value of hedging instrument used to calculate ineffectiveness |
| Change in fair value of hedged item used to calculate ineffectiveness |
| Hedge ineffectiveness recognized in profit or (loss) |
|
| At 31 December 2019 | | | | |
| Cash flow hedges | | | | |
| Foreign exchange risk | | | | |
| Highly probable forecast capital expenditure | | (1 | ) | 1 |
| — |
|
| Commodity price risk | | | | |
| Highly probable forecast sales | | (100 | ) | 100 |
| — |
|
| | | | | |
| At 31 December 2018 | | | | |
| Cash flow hedges | | | | |
| Foreign exchange risk | | | | |
| Highly probable forecast capital expenditure | | (5 | ) | 5 |
| — |
|
| Commodity price risk | | | | |
| Highly probable forecast sales | | (126 | ) | 126 |
| — |
|
The tables below summarize the carrying amount and nominal amount of the derivatives designated as hedging instruments in cash flow hedge relationships.
| | | | | | | | Carrying amount of hedging instrument | Nominal amounts of hedging instruments |
| | | Carrying amount of hedging instrument | | Nominal amounts of hedging instruments | | | Assets | Liabilities |
| At 31 December 2020 | | At 31 December 2020 | | $ million | mmBtu |
| Cash flow hedges | | Cash flow hedges | | |
| Foreign exchange risk | | Foreign exchange risk | | |
| Highly probable forecast capital expenditure | | Highly probable forecast capital expenditure | | 4 | | 0 | | 162 | | |
| Commodity price risk | | Commodity price risk | | |
| Highly probable forecast sales | | Highly probable forecast sales | | 0 | | 0 | | | (175) | |
| | | Assets |
| Liabilities |
| Nominal amounts of hedging instruments | | | | |
| At 31 December 2019 | | $ million |
| $ million |
| At 31 December 2019 | | |
| Cash flow hedges | | | Cash flow hedges | | |
| Foreign exchange risk | | | Foreign exchange risk | |
| Highly probable forecast capital expenditure | | 1 |
| (4 | ) | 150 |
|
|
| Highly probable forecast capital expenditure | | 1 | | (4) | | 150 | | |
| | | | |
| At 31 December 2018 | | | |
| Cash flow hedges | | | |
| Foreign exchange risk | | | |
| Highly probable forecast capital expenditure | | 5 |
| (14 | ) | 386 |
| | |
| Commodity price risk | | | |
| Highly probable forecast sales | | 2 |
| — |
| | 145 |
| |
All hedging instruments are presented within derivative financial instruments on the group balance sheet.
All of the nominal amount of hedging instruments at 31 December 2020 and 2019 relating to highly probably forecast capital expenditure matures within 12 months of the relevant balance sheet date. Of the nominal amount of hedging instruments at 31 December 2020 relating to highly probably forecast capital expenditure $150 million (2018 $304 million)sales 135 mmBtu matures within 12 months and $nil (2018 $82 million)40 mmBtu within one to two years. All of the hedging instruments relating to highly probable forecast sales at 31 December 2018 matured in 2019.
|
| | | | | | | | | | | | | |
| BP
| bp Annual Report and Form 20-F 20192020 | | 211215 |
30. Derivative financial instruments – continued
The table below summarizes the weighted average exchange rates and the weighted average sales price in relation to the derivatives designated as hedging instruments in cash flow hedge relationships at 31 December.
| | | | | | | | | | | | | | | | |
| | Weighted average price/rate |
| | 2020 | 2019 | |
| At 31 December | | Forecast capital expenditure | | Forecast sales | Forecast capital expenditure | |
| Sterling/US dollar | | 1.35 | | | | 1.35 | | |
| Euro/US dollar | | 0 | | | | 1.11 | | |
| | | | | | |
| | | | | | |
| Korean won/US dollar | | 1,174.47 | | | | 1,115.66 | | |
| | | | | | |
| Henry Hub $/mmBtu | | | | 2.88 | | | |
|
| | | | | | | |
| | | Weighted average price/rate |
| | | 2019 |
| | 2018 |
|
| At 31 December | | Forecast capital expenditure |
| Forecast capital expenditure |
| Forecast sales |
|
| Sterling/US dollar | | 1.35 |
| 1.34 |
|
|
|
| Euro/US dollar | | 1.11 |
| 1.14 |
|
|
|
| Australian dollar/US dollar | | — |
| 0.72 |
|
|
|
| Norwegian krone/US dollar | | — |
| 8.67 |
|
|
|
| Korean won/US dollar | | 1,115.66 |
| 1,107.90 |
|
|
|
| Henry Hub $/mmBtu | | | | 2.86 |
|
Fair value hedges
At 31 December 2019,2020, the group held interest rate and cross-currency interest rate swap contracts as fair value hedges of the interest rate risk and foreign currency risk arising from group fixed rate debt issuances. Note 29 outlines the group’s approach to interest rate and foreign currency exchange risk management. The interest rate swaps are used to convert US dollar denominated fixed rate borrowings into floating rate debt. The cross-currency interest rate swaps are used to convert sterling, euro, Swiss franc, Canadian dollar and Norwegian krone denominated fixed rate borrowings into US dollar floating rate debt. The group manages all risks derived from debt issuance, such as credit risk, however, the group applies hedge accounting only to certain components of interest rate and foreign currency risk in order to minimize hedge ineffectiveness. Note 29 outlines the group’s approach to interest rate and foreign currency exchange risk management.
The interest rate and foreign currency exposures are identified and hedged on an instrument-by-instrument basis. For interest rate exposures, the group designates as a fair value hedge the benchmark interest rate component only. This is an observable and reliably measurable component of interest rate risk.
All of the fair value hedge accounting relationships currently in place are directly affected by the interest rate benchmark reform which will replace interbank offered rates (IBORs) with alternative benchmark rates as they all manage interest rate risk. The Group is significantly exposed to benchmark interest rate components; predominantly USD LIBOR, GBP LIBOR, EURIBOR and CHF LIBOR. The nominal amounts of the applicable hedging instruments represent the extent of the risk exposure bp manages for financial derivatives designated in fair value hedge relationships that is directly affected by the interest rate benchmark reform. These are disclosed in the table below. Uncertainty around the method and timing of transition from Inter-bank Offered Rates (IBORs) to alternative risk-free rates (RfRs) may impact the assessment of whether hedge accounting can be applied to certain hedging relationships. However, the temporary reliefs provided by IFRS 9 allow bp to assume that in the event that significant uncertainty around the reform arises:
•the interest rate benchmark component of fair value hedges only needs to be assessed as separately identifiable at initial designation; and
•the interest rate benchmark is not altered for the purposes of assessing the economic relationship between the hedged item and the hedging instrument for fair value hedges.
Judgement will be required to determine when the uncertainty arising from interest rate benchmark reform is no longer present and when the temporary reliefs no longer apply. However, at 31 December 2020 the reliefs apply and bp continues to monitor regulatory and market developments as it manages the contractual transition.
For foreign currency exposures, the group excludes from the designation the foreign currency basis spread component implicit in the cross-currency interest rate swaps. This is separately calculated at hedge designation, is recognized in other comprehensive income over the life of the hedge and amortized to the income statement on a straight-line basis, in accordance with the group’s policy on costs of hedging.
The group applies hedge accounting where there is an economic relationship between the hedged item and the hedging instrument. The existence of an economic relationship is determined initially by comparing the critical terms of the hedging instrument and those of the hedged item and it is prospectively assessed using linear regression analysis. The group issues fixed rate debt and enters into interest rate and cross-currency interest rate swaps with critical terms that match those of the debt and on a 1:1 hedge ratio basis. The hedge ratio is determined by comparing the notional amount of the derivative with the notional amount of the debt. The hedge relationship is designated for the full term and notional value of the debt. Both the hedging instrument and the hedged item are expected to be held to maturity.
The group has identified the following sources of ineffectiveness, which are not expected to be material:
•derivative counterparty’s credit risk which is not offset by the hedged item. This risk is mitigated by entering into derivative transactions only with high credit quality counterparties; and
•sensitivity to interest rate between the hedged item and the derivatives. This is driven by differences in payment frequencies between the instrument and the bond.
The tables below summarize the change in the fair value of hedging instruments and the hedged item used to calculate ineffectiveness in the period. The signage convention for changes in fair value presented in this table is consistent with that presented in Note 27.
|
| | | | | | | |
| | | | | $ million |
|
| | | Change in fair value of hedging instrument used to calculate ineffectiveness |
| Change in fair value of hedged item used to calculate ineffectiveness |
| Hedge ineffectiveness recognized in profit or (loss) |
|
| At 31 December 2019 | |
| Fair value hedges | | | | |
| Interest rate risk on finance debt | | (764 | ) | 737 |
| 27 |
|
| Interest rate and foreign currency risk on finance debt | | (336 | ) | 286 |
| 50 |
|
| | | | | |
| At 31 December 2018 | | | | |
| Fair value hedges | | | | |
| Interest rate risk on finance debt | | (70 | ) | 69 |
| (1 | ) |
| Interest rate and foreign currency risk on finance debt | | 812 |
| (809 | ) | 3 |
|
| | | | | | | | | | | | | | |
| | | | $ million |
| | Change in fair value of hedging instrument used to calculate ineffectiveness | Change in fair value of hedged item used to calculate ineffectiveness | Hedge ineffectiveness recognized in profit or (loss) |
| At 31 December 2020 | |
| Fair value hedges | | | | |
| Interest rate risk on finance debt | | (258) | | 258 | | 0 | |
| Interest rate and foreign currency risk on finance debt | | (2,743) | | 2,549 | | 194 | |
| | | | |
| At 31 December 2019 | | | | |
| Fair value hedges | | | | |
| Interest rate risk on finance debt | | (764) | | 737 | | 27 | |
| Interest rate and foreign currency risk on finance debt | | (336) | | 286 | | 50 | |
|
| | | | | | | | | | | | | |
212216 | | BPbp Annual Report and Form 20-F 2019
2020 | | |
30. Derivative financial instruments – continued
The tables below summarize the carrying amount of the derivatives designated as hedging instruments in fair value hedge relationships at 31 December.
| | | | | | | | | | | | | | | |
| | | | | $ million |
| | Carrying amount of hedging instrument | | Nominal amounts of hedging instruments |
| At 31 December 2020 | | Assets | Liabilities |
| Fair value hedges | | | | | |
| Interest rate risk on finance debt | | 80 | | 0 | | | 4,104 | |
| Interest rate and foreign currency risk on finance debt | | 2,614 | | (82) | | | 23,313 | |
| | | | | |
| At 31 December 2019 | | | | | |
| Fair value hedges | | | | | |
| Interest rate risk on finance debt | | 138 | | (35) | | | 13,442 | |
| Interest rate and foreign currency risk on finance debt | | 344 | | (637) | | | 21,296 | |
|
| | | | | | | |
| | | | | $ million |
|
| | | Carrying amount of hedging instrument | | Nominal amounts of hedging instruments |
|
| At 31 December 2019 | | Assets |
| Liabilities |
|
| Fair value hedges | | | | |
| Interest rate risk on finance debt | | 138 |
| (35 | ) | 13,442 |
|
| Interest rate and foreign currency risk on finance debt | | 344 |
| (637 | ) | 21,296 |
|
| | | | | |
| At 31 December 2018 | | | | |
| Fair value hedges | | | | |
| Interest rate risk on finance debt | | 262 |
| (445 | ) | 24,513 |
|
| Interest rate and foreign currency risk on finance debt | | 158 |
| (789 | ) | 16,580 |
|
All hedging instruments are presented within derivative financial instruments on the group balance sheet. Ineffectiveness arising on fair value hedges is included within the production and manufacturing expenses section of the income statement.
The tables below summarize the profile by tenor of the nominal amount of the derivatives designated as hedging instruments in fair value hedge relationships at 31 December.
| | | | | | | | | | | | | | | | | | | | | | | | | | | | | | |
| | | | | | | | | | $ million |
| At 31 December 2020 | | | Less than 1 year | 1-2 years | 2-3 years | 3-4 years | 4-5 years | 5-10 years | Over 10 years | Total |
| Fair value hedges | | | | | | | | | | |
| Interest rate risk on finance debt | | | 2,705 | | 996 | | 0 | | 227 | | 0 | | 176 | | 0 | | 4,104 | |
| Interest rate and foreign currency risk on finance debt | | | 737 | | 1,056 | | 2,039 | | 3,175 | | 2,804 | | 8,587 | | 4,915 | | 23,313 | |
| | | | | | | | | | |
| At 31 December 2019 | | | | | | | | | | |
| Fair value hedges | | | | | | | | | | |
| Interest rate risk on finance debt | | | 3,000 | | 2,576 | | 4,039 | | 1,200 | | 206 | | 2,421 | | 0 | | 13,442 | |
| Interest rate and foreign currency risk on finance debt | | | 882 | | 672 | | 1,400 | | 2,777 | | 3,109 | | 10,216 | | 2,240 | | 21,296 | |
The table below summarizes the weighted average floating interest rate of these interest rate swaps and cross-currency interest rate swaps was 2.36% (2018 3.04%) and 3.27% (2018 4.07%) respectively.the weighted average exchange rates in relation to the derivatives designated as hedging instruments in fair value hedge relationships at 31 December.
|
| | | | | | | | | | | | | | | | | |
| | | | | | | | | | $ million |
|
| At 31 December 2019 | | Less than 1 year |
| 1-2 years |
| 2-3 years |
| 3-4 years |
| 4-5 years |
| 5-10 years |
| Over 10 years |
| Total |
|
| Fair value hedges | | | | | | | | | |
| Interest rate risk on finance debt | | 3,000 |
| 2,576 |
| 4,039 |
| 1,200 |
| 206 |
| 2,421 |
| — |
| 13,442 |
|
| Interest rate and foreign currency risk on finance debt | | 882 |
| 672 |
| 1,400 |
| 2,777 |
| 3,109 |
| 10,216 |
| 2,240 |
| 21,296 |
|
| | | | | | | | | | |
| At 31 December 2018 | | | | | | | | | |
| Fair value hedges | | | | | | | | | |
| Interest rate risk on finance debt | | 2,694 |
| 2,324 |
| 2,597 |
| 4,923 |
| 1,700 |
| 10,275 |
| — |
| 24,513 |
|
| Interest rate and foreign currency risk on finance debt | | — |
| 1,245 |
| 1,167 |
| 707 |
| 2,921 |
| 10,254 |
| 286 |
| 16,580 |
|
| | | | | | | | | | | | | | | | | |
| At 31 December | | | 2020 | | 2019 |
| | Interest rate swaps | Cross-currency interest rate swaps | Interest rate swaps | Cross-currency interest rate swaps |
| Interest rate | | 0.58 | % | 1.88 | % | 2.36 | % | 3.27 | % |
| Sterling/US dollar | | | 1.33 | | 1.32 |
| Euro/US dollar | | | 1.14 | | 1.15 |
| Canadian dollar/US dollar | | | 0.78 | | 0.87 |
The tables below summarize the carrying amount, and the accumulated fair value adjustments included within the carrying amount, of the hedged items designated in fair value hedge relationships at 31 December.
| | | | | | | | | | | | | | | | | | | $ million | |
| | | | | $ million |
| | | Carrying amount of hedged item | Accumulated fair value adjustment included in the carrying amount of hedged items | |
| At 31 December 2020 | | At 31 December 2020 | | Assets | Liabilities | Assets | Liabilities | Discontinued hedges |
| Fair value hedges | | Fair value hedges | | | |
| Interest rate risk on finance debt | | Interest rate risk on finance debt | | 0 | | (4,196) | | 0 | | (81) | | (775) | | |
| Interest rate and foreign currency risk on finance debt | | Interest rate and foreign currency risk on finance debt | | 0 | | (23,253) | | 0 | | (938) | | 0 | | |
| | | Carrying amount of hedged item | | Accumulated fair value adjustment included in the carrying amount of hedged items | | | | | |
| At 31 December 2019 | | Assets |
| Liabilities |
| Assets |
| Liabilities |
| Discontinued hedges |
| At 31 December 2019 | | | |
| Fair value hedges | | | Fair value hedges | | | |
| Interest rate risk on finance debt | | — |
| (13,441 | ) | — |
| (100 | ) | (714 | ) | Interest rate risk on finance debt | | 0 | | (13,441) | | 0 | | (100) | | (714) | | |
| Interest rate and foreign currency risk on finance debt | | — |
| (21,240 | ) | — |
| (525 | ) | — |
| Interest rate and foreign currency risk on finance debt | | 0 | | (21,240) | | 0 | | (525) | | 0 | | |
| | | | |
| At 31 December 2018 | | | |
| Fair value hedges | | | |
| Interest rate risk on finance debt | | — |
| (24,747 | ) | 175 |
| — |
| (360 | ) | |
| Interest rate and foreign currency risk on finance debt | | — |
| (16,883 | ) | — |
| (62 | ) | — |
| |
The hedged item for all fair value hedges is presented within finance debt on the group balance sheet.
|
| | | | | | | | | | | | | |
| BP
| bp Annual Report and Form 20-F 20192020 | | 213217 |
30. Derivative financial instruments – continued
Movement in reserves related to hedge accounting
The table below provides a reconciliation of the cash flow hedge and costs of hedging reserves on a pre-tax basis by risk category. The signage convention of this table is consistent with that presented in Note 32.
| | | | | | | | | | | | | | | | | | | | | | | |
| | | | | | | | | $ million |
| | Cash flow hedge reserve | | | Costs of hedging reserve | |
| | Highly probable forecast capital expenditure | | Highly probable forecast sales | Purchase of equitya | | | Interest rate and foreign currency risk on finance debt | Total |
| At 1 January 2020 | | (1) | | | 0 | | (651) | | | | (170) | | (822) | |
| Recognized in other comprehensive income | | | | | | | | | |
| Cash flow hedges marked to market | | 7 | | | 78 | | 0 | | | | — | | 85 | |
| Cash flow hedges reclassified to the income statement - hedged item affected profit or loss | | 0 | | | (37) | | 0 | | | | — | | (37) | |
| | | | | | | | | |
| Costs of hedging marked to market | | — | | | — | | — | | | | 42 | | 42 | |
| Costs of hedging reclassified to the income statement | | — | | | — | | — | | | | 22 | | 22 | |
| | 7 | | | 41 | | 0 | | | | 64 | | 112 | |
| Cash flow hedges transferred to the balance sheet | | 6 | | | 0 | | 0 | | | | — | | 6 | |
| | | | | | | | | |
| At 31 December 2020 | | 12 | | | 41 | | (651) | | | | (106) | | (704) | |
| | | | | | | | | |
| | | | | | | | | $ million |
| | Cash flow hedge reserve | | | Costs of hedging reserve | |
| | Highly probable forecast capital expenditure | | Highly probable forecast sales | Purchase of equitya | | | Interest rate and foreign currency risk on finance debt | Total |
| At 1 January 2019 | | (21) | | | (6) | | (651) | | | | (223) | | (901) | |
| Recognized in other comprehensive income | | | | | | | | | |
| Cash flow hedges marked to market | | (3) | | | (100) | | 0 | | | | — | | (103) | |
| Cash flow hedges reclassified to the income statement - hedged item affected profit or loss | | 0 | | | 106 | | 0 | | | | — | | 106 | |
| | | | | | | | | |
| Costs of hedging marked to market | | — | | | — | | — | | | | (4) | | (4) | |
| Costs of hedging reclassified to the income statement | | — | | | — | | — | | | | 57 | | 57 | |
| | (3) | | | 6 | | 0 | | | | 53 | | 56 | |
| Cash flow hedges transferred to the balance sheet | | 23 | | | 0 | | 0 | | | | — | | 23 | |
| | | | | | | | | |
| At 31 December 2019 | | (1) | | | 0 | | (651) | | | | (170) | | (822) | |
| | | | | | | | | |
| | | | | | | | | |
|
| | | | | | | | | | | |
| | | | | | | $ million |
|
| | | Cash flow hedge reserve | | Costs of hedging reserve |
| |
| | | Highly probable forecast capital expenditure |
| Highly probable forecast sales |
| Purchase of equitya |
| Interest rate and foreign currency risk on finance debt |
| Total |
|
| At 1 January 2019 | | (21 | ) | (6 | ) | (651 | ) | (223 | ) | (901 | ) |
| Recognized in other comprehensive income | | | | | | |
| Cash flow hedges marked to market | | (3 | ) | (100 | ) | — |
| — |
| (103 | ) |
| Cash flow hedges reclassified to the income statement - hedged item affected profit or loss | | — |
| 106 |
| — |
| — |
| 106 |
|
| Costs of hedging marked to market | | — |
| — |
| — |
| (4 | ) | (4 | ) |
| Costs of hedging reclassified to the income statement | | — |
| — |
| — |
| 57 |
| 57 |
|
| | | (3 | ) | 6 |
| — |
| 53 |
| 56 |
|
| Cash flow hedges transferred to the balance sheet | | 23 |
| — |
| — |
| — |
| 23 |
|
| At 31 December 2019 | | (1 | ) | — |
| (651 | ) | (170 | ) | (822 | ) |
| | | | | | | |
| | | | | | | $ million |
|
| | | Cash flow hedge reserve | | Costs of hedging reserve |
| |
| | | Highly probable forecast capital expenditure |
| Highly probable forecast sales |
| Purchase of equitya |
| Interest rate and foreign currency risk on finance debt |
| Total |
|
| At 31 December 2017 | | (10 | ) | — |
| (651 | ) | — |
| (661 | ) |
| Adjustment on adoption of IFRS 9 | | — |
| — |
| — |
| (37 | ) | (37 | ) |
| At 1 January 2018 | | (10 | ) | — |
| (651 | ) | (37 | ) | (698 | ) |
| Recognized in other comprehensive income | | | | | | |
| Cash flow hedges marked to market | | (37 | ) | (126 | ) | — |
| — |
| (163 | ) |
| Cash flow hedges reclassified to the income statement - hedged item affected profit or loss | | — |
| 120 |
| — |
| — |
| 120 |
|
| Costs of hedging marked to market | | — |
| — |
| — |
| (244 | ) | (244 | ) |
| Costs of hedging reclassified to the income statement | | — |
| — |
| — |
| 58 |
| 58 |
|
| | | (37 | ) | (6 | ) | — |
| (186 | ) | (229 | ) |
| Cash flow hedges transferred to the balance sheet | | 26 |
| — |
| — |
| — |
| 26 |
|
| At 31 December 2018 | | (21 | ) | (6 | ) | (651 | ) | (223 | ) | (901 | ) |
a See Note 32 for further information on the cash flow hedge reserve relating to the purchase of equityequity.
Substantially all of the cash flow hedge reserve balances and all of the amounts reclassified from the cash flow hedge reserve into profit or loss during the year relate to continuing hedge relationships. Amounts deferred in the cash flow hedge reserve that have been reclassified to profit or loss are presented in sales and other operating revenues in the income statement.
Costs of hedging relates to the foreign currency basis spreads of hedging instruments used to hedge the group's interest rate and foreign currency risk on debt which is a time-period related item.
|
| | | | | | | | | | | | | |
214218 | | BPbp Annual Report and Form 20-F 2019
2020 | | |
31.Called-up share capital
The allotted, called up and fully paid share capital at 31 December was as follows:
| | | | | | | | | | | | | | | | | | | | | | | |
| | | 2020 | | 2019 | | 2018 |
| Issued | | Shares
thousand | $ million | Shares
thousand | $ million | Shares
thousand | $ million |
8% cumulative first preference shares of £1 eacha | | 7,233 | | 12 | | 7,233 | | 12 | | 7,233 | | 12 | |
9% cumulative second preference shares of £1 eacha | | 5,473 | | 9 | | 5,473 | | 9 | | 5,473 | | 9 | |
| | | 21 | | | 21 | | | 21 | |
| Ordinary shares of 25 cents each | | | | | | | |
| At 1 January | | 21,535,840 | | 5,383 | | 21,525,464 | | 5,381 | | 21,288,193 | | 5,322 | |
| Issue of new shares for the scrip dividend programme | | 0 | | 0 | | 208,927 | | 52 | | 195,305 | | 49 | |
| Issue of new shares for employee share-based payment plans | | 34,000 | | 9 | | 37,400 | | 9 | | 92,168 | | 23 | |
| Issue of new shares – other | | 0 | | 0 | | 0 | | 0 | | 0 | | 0 | |
| Repurchase of ordinary share capital | | (120,058) | | (30) | | (235,951) | | (59) | | (50,202) | | (13) | |
| At 31 December | | 21,449,782 | | 5,362 | | 21,535,840 | | 5,383 | | 21,525,464 | | 5,381 | |
| | | 5,383 | | | 5,404 | | | 5,402 | |
|
| | | | | | | | | | | | | |
| | | | 2019 |
| | 2018 |
| | 2017 |
|
| Issued | | Shares thousand |
| $ million |
| Shares thousand |
| $ million |
| Shares thousand |
| $ million |
|
8% cumulative first preference shares of £1 eacha | | 7,233 |
| 12 |
| 7,233 |
| 12 |
| 7,233 |
| 12 |
|
9% cumulative second preference shares of £1 eacha | | 5,473 |
| 9 |
| 5,473 |
| 9 |
| 5,473 |
| 9 |
|
| | | | 21 |
| | 21 |
| | 21 |
|
| Ordinary shares of 25 cents each | | | | | | | |
| At 1 January | | 21,525,464 |
| 5,381 |
| 21,288,193 |
| 5,322 |
| 21,049,696 |
| 5,263 |
|
| Issue of new shares for the scrip dividend programme | | 208,927 |
| 52 |
| 195,305 |
| 49 |
| 289,789 |
| 72 |
|
| Issue of new shares for employee share-based payment plans | | 37,400 |
| 9 |
| 92,168 |
| 23 |
| — |
| — |
|
| Issue of new shares – other | | — |
| — |
| — |
| — |
| — |
| — |
|
| Repurchase of ordinary share capital | | (235,951 | ) | (59 | ) | (50,202 | ) | (13 | ) | (51,292 | ) | (13 | ) |
| At 31 December | | 21,535,840 |
| 5,383 |
| 21,525,464 |
| 5,381 |
| 21,288,193 |
| 5,322 |
|
| | | | 5,404 |
| | 5,402 |
| | 5,343 |
|
a The nominal amount of 8% cumulative first preference shares and 9% cumulative second preference shares that can be in issue at any time shall not exceed £10,000,000 for each class of preference shares.
Voting on substantive resolutions tabled at a general meeting is on a poll. On a poll, shareholders present in person or by proxy have two2 votes for every £5 in nominal amount of the first and second preference shares held and one1 vote for every ordinary share held. On a show-of-hands vote on other resolutions (procedural matters) at a general meeting, shareholders present in person or by proxy have one vote each.
In the event of the winding up of the company, preference shareholders would be entitled to a sum equal to the capital paid up on the preference shares, plus an amount in respect of accrued and unpaid dividends and a premium equal to the higher of (i) 10% of the capital paid up on the preference shares and (ii) the excess of the average market price of such shares on the London Stock Exchange during the previous six months over par value.
During 20192020 the company repurchased 236120 million ordinary shares for a total consideration of $1,511$776 million, including transaction costs of $8$4 million, as part of the share repurchase programme announced on 31 October 2017. All shares purchased were for cancellation. The repurchased shares represented 1.1%0.6% of ordinary share capital. A further 120 million of shares have been repurchased in January 2020 at a total cost of $776 million. The number of shares in issue is reduced when shares are repurchased.
Treasury sharesa
| | | | | | | | | | | | | | | | | | | | | | | |
| | | 2020 | | 2019 | | 2018 |
| | Shares
thousand | Nominal value
$ million | Shares
thousand | Nominal value
$ million | Shares
thousand | Nominal value
$ million |
| At 1 January | | 1,296,856 | | 323 | | 1,426,265 | | 356 | | 1,482,072 | | 370 | |
| Purchases for settlement of employee share plans | | 0 | | 0 | | 1,118 | | 0 | | 757 | | 0 | |
| Issue of new shares for employee share-based payment plans | | 34,116 | | 9 | | 37,400 | | 9 | | 92,168 | | 23 | |
| Shares re-issued for employee share-based payment plans | | (143,322) | | (36) | | (167,927) | | (42) | | (148,732) | | (37) | |
| At 31 December | | 1,187,650 | | 296 | | 1,296,856 | | 323 | | 1,426,265 | | 356 | |
| Of which – shares held in treasury by bp | | 1,105,157 | | 275 | | 1,163,077 | | 290 | | 1,264,732 | | 316 | |
| – shares held in ESOP trusts | | 82,491 | | 21 | | 133,707 | | 33 | | 161,518 | | 40 | |
– shares held by bp’s US share plan administratorb | | 2 | | 0 | | 72 | | 0 | | 15 | | 0 | |
|
| | | | | | | | | | | | | |
| | | | 2019 |
| | 2018 |
| | 2017 |
|
| | | Shares thousand |
| Nominal value $ million |
| Shares thousand |
| Nominal value $ million |
| Shares thousand |
| Nominal value $ million |
|
| At 1 January | | 1,426,265 |
| 356 |
| 1,482,072 |
| 370 |
| 1,614,657 |
| 403 |
|
| Purchases for settlement of employee share plans | | 1,118 |
| — |
| 757 |
| — |
| 4,423 |
| 1 |
|
| Issue of new shares for employee share-based payment plans | | 37,400 |
| 9 |
| 92,168 |
| 23 |
| — |
| — |
|
| Shares re-issued for employee share-based payment plans | | (167,927 | ) | (42 | ) | (148,732 | ) | (37 | ) | (137,008 | ) | (34 | ) |
| At 31 December | | 1,296,856 |
| 323 |
| 1,426,265 |
| 356 |
| 1,482,072 |
| 370 |
|
| Of which – shares held in treasury by BP | | 1,163,077 |
| 290 |
| 1,264,732 |
| 316 |
| 1,472,343 |
| 368 |
|
| – shares held in ESOP trusts | | 133,707 |
| 33 |
| 161,518 |
| 40 |
| 9,705 |
| 2 |
|
– shares held by BP’s US share plan administratorb | | 72 |
| — |
| 15 |
| — |
| 24 |
| — |
|
| |
a
| See Note 32 for definition of treasury shares. |
| |
b
| Held in the form of ADSs to meet the requirements of employee share-based payment plans in the US. |
b Held in the form of ADSs to meet the requirements of employee share-based payment plans in the US.
For each year presented, the balance at 1 January represents the maximum number of shares held in treasury by BPbp during the year, representing 5.4% (2019 5.9% (2018and 2018 6.9% and 2017 7.5%) of the called-up ordinary share capital of the company.
During 2019,2020, the movement in shares held in treasury by BPbp represented less than 0.5% (20180.3% (2019 less than 1.0%0.5% and 20172018 less than 0.5%1.0%) of the ordinary share capital of the company.
|
| | | | | | | | | | | | | |
| BP
| bp Annual Report and Form 20-F 20192020 | | 215219 |
32.Capital and reserves
| | | | | | | | | | | | | | | | | | | | |
| | | | | | |
| | Share
capital | Share
premium
account | Capital
redemption
reserve | Merger
reserve | Total share capital
and capital
reserves |
|
| At 1 January 2020 | | 5,404 | | 12,417 | | 1,498 | | 27,206 | | 46,525 | |
| Profit (loss) for the year | | — | | — | | — | | — | | — | |
| Items that may be reclassified subsequently to profit or loss | | | | | | |
| Currency translation differences (including reclassifications) | | — | | — | | — | | — | | — | |
| | | | | | |
| | | | | | |
| | | | | | |
| | | | | | |
| | | | | | |
| Cash flow hedges and costs of hedging (including reclassifications) | | — | | — | | — | | — | | — | |
Share of items relating to equity-accounted entities, net of taxa | | — | | — | | — | | — | | — | |
| Other | | — | | — | | — | | — | | — | |
| Items that will not be reclassified to profit or loss | | | | | | |
| Remeasurements of the net pension and other post-retirement benefit liability or asset | | — | | — | | — | | — | | — | |
| Cash flow hedges that will subsequently be transferred to the balance sheet | | — | | — | | — | | — | | — | |
| | | | | | |
| Total comprehensive income | | — | | — | | — | | — | | — | |
| Dividends | | 0 | | 0 | | — | | — | | 0 | |
| | | | | | |
| Cash flow hedges transferred to the balance sheet, net of tax | | — | | — | | — | | — | | — | |
| | | | | | |
| Repurchases of ordinary share capital | | (30) | | — | | 30 | | — | | 0 | |
Share-based payments, net of taxb | | 9 | | 167 | | — | | — | | 176 | |
Share of equity-accounted entities’ changes in equity, net of taxc | | — | | — | | — | | — | | — | |
| Issue of perpetual hybrid bonds | | — | | — | | — | | — | | — | |
| | | | | | |
| Payments on perpetual hybrid bonds | | — | | — | | — | | — | | — | |
| | | | | | |
| Tax on issue of perpetual hybrid bonds | | — | | — | | — | | — | | — | |
Transactions involving non-controlling interests, net of taxd | | — | | — | | — | | — | | — | |
| At 31 December 2020 | | 5,383 | | 12,584 | | 1,528 | | 27,206 | | 46,701 | |
| | | | | | |
| | | | | | |
| At 31 December 2018 | | 5,402 | | 12,305 | | 1,439 | | 27,206 | | 46,352 | |
| Adjustment on adoption of IFRS 16, net of tax | | — | | — | | — | | — | | — | |
| At 1 January 2019 | | 5,402 | | 12,305 | | 1,439 | | 27,206 | | 46,352 | |
| Profit (loss) for the year | | — | | — | | — | | — | | — | |
| Items that may be reclassified subsequently to profit or loss | | | | | | |
| Currency translation differences (including reclassifications) | | — | | — | | — | | — | | — | |
| Cash flow hedges and costs of hedging (including reclassifications) | | — | | — | | — | | — | | — | |
Share of items relating to equity-accounted entities, net of taxa | | — | | — | | — | | — | | — | |
| Other | | — | | — | | — | | — | | — | |
| Items that will not be reclassified to profit or loss | | | | | | |
| Remeasurements of the net pension and other post-retirement benefit liability or asset | | — | | — | | — | | — | | — | |
| Cash flow hedges that will subsequently be transferred to the balance sheet | | — | | — | | — | | — | | — | |
| Total comprehensive income | | — | | — | | — | | — | | — | |
| Dividends | | 52 | | (52) | | — | | — | | 0 | |
| Cash flow hedges transferred to the balance sheet, net of tax | | — | | — | | — | | — | | — | |
| Repurchases of ordinary share capital | | (59) | | — | | 59 | | — | | 0 | |
Share-based payments, net of taxb | | 9 | | 164 | | — | | — | | 173 | |
| Share of equity-accounted entities’ changes in equity, net of tax | | — | | — | | — | | — | | — | |
Transactions involving non-controlling interests, net of taxe | | — | | — | | — | | — | | — | |
| At 31 December 2019 | | 5,404 | | 12,417 | | 1,498 | | 27,206 | | 46,525 | |
|
| | | | | | | | | | | |
| | | | | | | |
| | | Share capital |
| Share premium account |
| Capital redemption reserve |
| Merger reserve |
| Total share capital and capital reserves |
|
| At 31 December 2018 | | 5,402 |
| 12,305 |
| 1,439 |
| 27,206 |
| 46,352 |
|
| Adjustment on adoption of IFRS 16, net of tax | | — |
| — |
| — |
| — |
| — |
|
| At 1 January 2019 | | 5,402 |
| 12,305 |
| 1,439 |
| 27,206 |
| 46,352 |
|
| Profit (loss) for the year | | — |
| — |
| — |
| — |
| — |
|
| Items that may be reclassified subsequently to profit or loss | | | | | | |
| Currency translation differences (including reclassifications) | | — |
| — |
| — |
| — |
| — |
|
| Cash flow hedges and costs of hedging (including reclassifications) | | — |
| — |
| — |
| — |
| — |
|
Share of items relating to equity-accounted entities, net of taxa | | — |
| — |
| — |
| — |
| — |
|
| Other | | — |
| — |
| — |
| — |
| — |
|
| Items that will not be reclassified to profit or loss | | | | | | |
| Remeasurements of the net pension and other post-retirement benefit liability or asset | | — |
| — |
| — |
| — |
| — |
|
| Cash flow hedges that will subsequently be transferred to the balance sheet | | — |
| — |
| — |
| — |
| — |
|
| Total comprehensive income | | — |
| — |
| — |
| — |
| — |
|
| Dividends | | 52 |
| (52 | ) | — |
| — |
| — |
|
| Cash flow hedges transferred to the balance sheet, net of tax | | — |
| — |
| — |
| — |
| — |
|
| Repurchases of ordinary share capital | | (59 | ) | — |
| 59 |
| — |
| — |
|
Share-based payments, net of taxb | | 9 |
| 164 |
| — |
| — |
| 173 |
|
| Share of equity-accounted entities’ changes in equity, net of tax | | — |
| — |
| — |
| — |
| — |
|
Transactions involving non-controlling interests, net of taxc | | — |
| — |
| — |
| — |
| — |
|
| At 31 December 2019 | | 5,404 |
| 12,417 |
| 1,498 |
| 27,206 |
| 46,525 |
|
| | | | | | | |
| At 31 December 2017 | | 5,343 |
| 12,147 |
| 1,426 |
| 27,206 |
| 46,122 |
|
| Adjustment on adoption of IFRS 9, net of tax | | — |
| — |
| — |
| — |
| — |
|
| At 1 January 2018 | | 5,343 |
| 12,147 |
| 1,426 |
| 27,206 |
| 46,122 |
|
| Profit (loss) for the year | | — |
| — |
| — |
| — |
| — |
|
| Items that may be reclassified subsequently to profit or loss | | | | | | |
| Currency translation differences (including reclassifications) | | — |
| — |
| — |
| — |
| — |
|
| Cash flow hedges and costs of hedging (including reclassifications) | | — |
| — |
| — |
| — |
| — |
|
Share of items relating to equity-accounted entities, net of taxa | | — |
| — |
| — |
| — |
| — |
|
| Other | | — |
| — |
| — |
| — |
| — |
|
| Items that will not be reclassified to profit or loss | | | | | | |
| Remeasurements of the net pension and other post-retirement benefit liability or asset | | — |
| — |
| — |
| — |
| — |
|
| Cash flow hedges that will subsequently be transferred to the balance sheet | | — |
| — |
| — |
| — |
| — |
|
| Total comprehensive income | | — |
| — |
| — |
| — |
| — |
|
| Dividends | | 49 |
| (49 | ) | — |
| — |
| — |
|
| Cash flow hedges transferred to the balance sheet, net of tax | | — |
| — |
| — |
| — |
| — |
|
| Repurchases of ordinary share capital | | (13 | ) | — |
| 13 |
| — |
| — |
|
Share-based payments, net of taxb | | 23 |
| 207 |
| — |
| — |
| 230 |
|
| Share of equity-accounted entities’ changes in equity, net of tax | | — |
| — |
| — |
| — |
| — |
|
| Transactions involving non-controlling interests, net of tax | | — |
| — |
| — |
| — |
| — |
|
| At 31 December 2018 | | 5,402 |
| 12,305 |
| 1,439 |
| 27,206 |
| 46,352 |
|
| | | | | | | |
| At 1 January 2017 | | 5,284 |
| 12,219 |
| 1,413 |
| 27,206 |
| 46,122 |
|
| Profit (loss) for the year | | — |
| — |
| — |
| — |
| — |
|
| Items that may be reclassified subsequently to profit or loss | | | | | | |
| Currency translation differences (including reclassifications) | | — |
| — |
| — |
| — |
| — |
|
| Available-for-sale investments (including reclassifications) | | — |
| — |
| — |
| — |
| — |
|
| Cash flow hedges (including reclassifications) | | — |
| — |
| — |
| — |
| — |
|
Share of items relating to equity-accounted entities, net of taxa | | — |
| — |
| — |
| — |
| — |
|
| Other | | — |
| — |
| — |
| — |
| — |
|
| Items that will not be reclassified to profit or loss | | | | | | |
| Remeasurements of the net pension and other post-retirement benefit liability or asset | | — |
| — |
| — |
| — |
| — |
|
| Total comprehensive income | | — |
| — |
| — |
| — |
| — |
|
| Dividends | | 72 |
| (72 | ) | — |
| — |
| — |
|
| Repurchases of ordinary share capital | | (13 | ) | — |
| 13 |
| — |
| — |
|
Share-based payments, net of taxb | | — |
| — |
| — |
| — |
| — |
|
| Share of equity-accounted entities’ changes in equity, net of tax | | — |
| — |
| — |
| — |
| — |
|
Transactions involving non-controlling interests, net of taxd | | — |
| — |
| — |
| — |
| — |
|
| At 31 December 2017 | | 5,343 |
| 12,147 |
| 1,426 |
| 27,206 |
| 46,122 |
|
a Principally foreign exchange effects relating to the Russian rouble.
b Movements in treasury shares relate to employee share-based payment plans.
c Principally relates to a non-controlling interest transaction entered into by Rosneft.
d Principally relates to the sale of interests in our UK and New Zealand retail property portfolio, for which proceeds of $0.5 billion and $0.2 billion were received respectively.
|
| | | |
216 | | BP Annual Report and Form 20-F 2019
| |
32.Capital and reserves – continued
|
| | | | | | | | | | | | | | | | | | | |
| | | | | | | | | | $ million |
|
Treasury shares |
| Foreign currency translation reserve |
| Available- for-sale investments |
| Cash flow hedges |
| Costs of hedging |
| Total fair value reserves |
| Profit and loss account |
| BP shareholders’ equity |
| Non- controlling interests |
| Total equity |
|
| (15,767 | ) | (8,902 | ) | — |
| (777 | ) | (210 | ) | (987 | ) | 78,748 |
| 99,444 |
| 2,104 |
| 101,548 |
|
| — |
| — |
| — |
| — |
| — |
| — |
| (329 | ) | (329 | ) | (1 | ) | (330 | ) |
| (15,767 | ) | (8,902 | ) | — |
| (777 | ) | (210 | ) | (987 | ) | 78,419 |
| 99,115 |
| 2,103 |
| 101,218 |
|
| — |
| — |
| — |
| — |
| — |
| — |
| 4,026 |
| 4,026 |
| 164 |
| 4,190 |
|
| | | | | | | | | | |
| — |
| 2,407 |
| — |
| — |
| — |
| — |
| — |
| 2,407 |
| 9 |
| 2,416 |
|
| — |
| — |
| — |
| 5 |
| 50 |
| 55 |
| — |
| 55 |
| — |
| 55 |
|
| — |
| — |
| — |
| — |
| — |
| — |
| 82 |
| 82 |
| — |
| 82 |
|
| — |
| — |
| — |
| — |
| — |
| — |
| (64 | ) | (64 | ) | — |
| (64 | ) |
| | | | | | | | | | |
| — |
| — |
| — |
| — |
| — |
| — |
| 171 |
| 171 |
| — |
| 171 |
|
| — |
| — |
| — |
| (3 | ) | — |
| (3 | ) | — |
| (3 | ) | — |
| (3 | ) |
| — |
| 2,407 |
| — |
| 2 |
| 50 |
| 52 |
| 4,215 |
| 6,674 |
| 173 |
| 6,847 |
|
| — |
| — |
| — |
| — |
| — |
| — |
| (6,929 | ) | (6,929 | ) | (213 | ) | (7,142 | ) |
| — |
| — |
| — |
| 23 |
| — |
| 23 |
| — |
| 23 |
| — |
| 23 |
|
| — |
| — |
| — |
| — |
| — |
| — |
| (1,511 | ) | (1,511 | ) | — |
| (1,511 | ) |
| 1,355 |
| — |
| — |
| — |
| — |
| — |
| (809 | ) | 719 |
| — |
| 719 |
|
| — |
| — |
| — |
| — |
| — |
| — |
| 5 |
| 5 |
| — |
| 5 |
|
| — |
| — |
| — |
| — |
| — |
| — |
| 316 |
| 316 |
| 233 |
| 549 |
|
| (14,412 | ) | (6,495 | ) | — |
| (752 | ) | (160 | ) | (912 | ) | 73,706 |
| 98,412 |
| 2,296 |
| 100,708 |
|
| | | | | | | | | | |
| (16,958 | ) | (5,156 | ) | 17 |
| (760 | ) | — |
| (743 | ) | 75,226 |
| 98,491 |
| 1,913 |
| 100,404 |
|
| — |
| — |
| (17 | ) | — |
| (37 | ) | (54 | ) | (126 | ) | (180 | ) | — |
| (180 | ) |
| (16,958 | ) | (5,156 | ) | — |
| (760 | ) | (37 | ) | (797 | ) | 75,100 |
| 98,311 |
| 1,913 |
| 100,224 |
|
| — |
| — |
| — |
| — |
| — |
| — |
| 9,383 |
| 9,383 |
| 195 |
| 9,578 |
|
| | | | | | | | | | |
| — |
| (3,746 | ) | — |
| — |
| — |
| — |
| — |
| (3,746 | ) | (41 | ) | (3,787 | ) |
| — |
| — |
| — |
| (6 | ) | (173 | ) | (179 | ) | — |
| (179 | ) | — |
| (179 | ) |
| — |
| — |
| — |
| — |
| — |
| — |
| 417 |
| 417 |
| — |
| 417 |
|
| — |
| — |
| — |
| — |
| — |
| — |
| 7 |
| 7 |
| — |
| 7 |
|
| | | | | | | | | | |
| — |
| — |
| — |
| — |
| — |
| — |
| 1,599 |
| 1,599 |
| — |
| 1,599 |
|
| — |
| — |
| — |
| (37 | ) | — |
| (37 | ) | — |
| (37 | ) | — |
| (37 | ) |
| — |
| (3,746 | ) | — |
| (43 | ) | (173 | ) | (216 | ) | 11,406 |
| 7,444 |
| 154 |
| 7,598 |
|
| — |
| — |
| — |
| — |
| — |
| — |
| (6,699 | ) | (6,699 | ) | (170 | ) | (6,869 | ) |
| — |
| — |
| — |
| 26 |
| — |
| 26 |
| — |
| 26 |
| — |
| 26 |
|
| — |
| — |
| — |
| — |
| — |
| — |
| (355 | ) | (355 | ) | — |
| (355 | ) |
| 1,191 |
| — |
| — |
| — |
| — |
| — |
| (718 | ) | 703 |
| — |
| 703 |
|
| — |
| — |
| — |
| — |
| — |
| — |
| 14 |
| 14 |
| — |
| 14 |
|
| — |
| — |
| — |
| — |
| — |
| — |
| — |
| — |
| 207 |
| 207 |
|
| (15,767 | ) | (8,902 | ) | — |
| (777 | ) | (210 | ) | (987 | ) | 78,748 |
| 99,444 |
| 2,104 |
| 101,548 |
|
| | | | | | | | | | |
| (18,443 | ) | (6,878 | ) | 3 |
| (1,156 | ) | — |
| (1,153 | ) | 75,638 |
| 95,286 |
| 1,557 |
| 96,843 |
|
| — |
| — |
| — |
| — |
| — |
| — |
| 3,389 |
| 3,389 |
| 79 |
| 3,468 |
|
| | | | | | | | | | |
| — |
| 1,722 |
| — |
| — |
| — |
| — |
| (3 | ) | 1,719 |
| 52 |
| 1,771 |
|
| — |
| — |
| 14 |
| — |
| — |
| 14 |
| — |
| 14 |
| — |
| 14 |
|
| — |
| — |
| — |
| 396 |
| — |
| 396 |
| — |
| 396 |
| — |
| 396 |
|
| — |
| — |
| — |
| — |
| — |
| — |
| 564 |
| 564 |
| — |
| 564 |
|
| — |
| — |
| — |
| — |
| — |
| — |
| (72 | ) | (72 | ) | — |
| (72 | ) |
| | | | | | | | | | |
| — |
| — |
| — |
| — |
| — |
| — |
| 2,343 |
| 2,343 |
| — |
| 2,343 |
|
| — |
| 1,722 |
| 14 |
| 396 |
| — |
| 410 |
| 6,221 |
| 8,353 |
| 131 |
| 8,484 |
|
| — |
| — |
| — |
| — |
| — |
| — |
| (6,153 | ) | (6,153 | ) | (141 | ) | (6,294 | ) |
| — |
| — |
| — |
| — |
| — |
| — |
| (343 | ) | (343 | ) | — |
| (343 | ) |
| 1,485 |
| — |
| — |
| — |
| — |
| — |
| (798 | ) | 687 |
| — |
| 687 |
|
| — |
| — |
| — |
| — |
| — |
| — |
| 215 |
| 215 |
| — |
| 215 |
|
| — |
| — |
| — |
| — |
| — |
| — |
| 446 |
| 446 |
| 366 |
| 812 |
|
| (16,958 | ) | (5,156 | ) | 17 |
| (760 | ) | — |
| (743 | ) | 75,226 |
| 98,491 |
| 1,913 |
| 100,404 |
|
c ePrincipally relates to the sale of a 49% interest in BP'sbp's retail property portfolio in Australia.
d Principally relates to the initial public offering of common units in BP Midstream Partners LP for which net proceeds of $811 million were received.
|
| | | | | | | | | | | | | |
| 220 | BP
| bp Annual Report and Form 20-F 20192020 | | 217 |
32.Capital and reserves – continued
| | | | | | | | | | | | | | | | | | | | | | | | | | | | | | | | | |
| | | | | | | | | | | $ million |
Treasury
shares | Foreign
currency
translation
reserve | Available-
for-sale
investments | | Cash flow
hedges | Costs of hedging | Total
fair value
reserves | Profit and
loss
account | bp
shareholders’
equity | Non-controlling interests | Total equity |
| Hybrid bonds | Other interest |
| (14,412) | | (6,495) | | — | | | (752) | | (160) | | (912) | | 73,706 | | 98,412 | | — | | 2,296 | | 100,708 | |
| — | | — | | — | | | — | | — | | — | | (20,305) | | (20,305) | | 256 | | (680) | | (20,729) | |
| | | | | | | | | | | |
| — | | (2,224) | | — | | | — | | — | | — | | — | | (2,224) | | — | | 37 | | (2,187) | |
| | | | | | | | | | | |
| | | | | | | | | | | |
| | | | | | | | | | | |
| | | | | | | | | | | |
| | | | | | | | | | | |
| — | | — | | — | | | 31 | | 60 | | 91 | | — | | 91 | | — | | — | | 91 | |
| — | | — | | — | | | — | | — | | — | | 312 | | 312 | | — | | — | | 312 | |
| — | | — | | — | | | — | | — | | — | | 71 | | 71 | | — | | — | | 71 | |
| | | | | | | | | | | |
| — | | — | | — | | | — | | — | | — | | 65 | | 65 | | — | | — | | 65 | |
| — | | — | | — | | | 7 | | — | | 7 | | — | | 7 | | — | | — | | 7 | |
| | | | | | | | | | | |
| — | | (2,224) | | — | | | 38 | | 60 | | 98 | | (19,857) | | (21,983) | | 256 | | (643) | | (22,370) | |
| — | | — | | — | | | — | | — | | — | | (6,367) | | (6,367) | | — | | (238) | | (6,605) | |
| | | | | | | | | | | |
| — | | — | | — | | | 6 | | — | | 6 | | — | | 6 | | — | | — | | 6 | |
| | | | | | | | | | | |
| — | | — | | — | | | — | | — | | — | | (776) | | (776) | | — | | — | | (776) | |
| 1,188 | | — | | — | | | — | | — | | — | | (638) | | 726 | | — | | — | | 726 | |
| — | | — | | — | | | — | | — | | — | | 1,341 | | 1,341 | | — | | — | | 1,341 | |
| — | | — | | — | | | — | | — | | — | | (48) | | (48) | | 11,909 | | — | | 11,861 | |
| | | | | | | | | | | |
| — | | — | | — | | | — | | — | | — | | — | | — | | (89) | | — | | (89) | |
| | | | | | | | | | | |
| — | | — | | — | | | — | | — | | — | | 3 | | 3 | | — | | — | | 3 | |
| — | | — | | — | | | — | | — | | — | | (64) | | (64) | | — | | 827 | | 763 | |
| (13,224) | | (8,719) | | 0 | | | (708) | | (100) | | (808) | | 47,300 | | 71,250 | | 12,076 | | 2,242 | | 85,568 | |
| | | | | | | | | | | |
| | | | | | | | | | | |
| (15,767) | | (8,902) | | — | | | (777) | | (210) | | (987) | | 78,748 | | 99,444 | | — | | 2,104 | | 101,548 | |
| — | | — | | — | | | — | | — | | — | | (329) | | (329) | | — | | (1) | | (330) | |
| (15,767) | | (8,902) | | — | | | (777) | | (210) | | (987) | | 78,419 | | 99,115 | | — | | 2,103 | | 101,218 | |
| — | | — | | — | | | — | | — | | — | | 4,026 | | 4,026 | | — | | 164 | | 4,190 | |
| | | | | | | | | | | |
| — | | 2,407 | | — | | | — | | — | | — | | 0 | | 2,407 | | — | | 9 | | 2,416 | |
| — | | — | | — | | | 5 | | 50 | | 55 | | — | | 55 | | — | | — | | 55 | |
| — | | — | | — | | | — | | — | | — | | 82 | | 82 | | — | | — | | 82 | |
| — | | — | | — | | | — | | — | | — | | (64) | | (64) | | — | | — | | (64) | |
| | | | | | | | | | | |
| — | | — | | — | | | — | | — | | — | | 171 | | 171 | | — | | — | | 171 | |
| — | | — | | — | | | (3) | | — | | (3) | | — | | (3) | | — | | — | | (3) | |
| — | | 2,407 | | 0 | | | 2 | | 50 | | 52 | | 4,215 | | 6,674 | | — | | 173 | | 6,847 | |
| — | | — | | — | | | — | | — | | — | | (6,929) | | (6,929) | | — | | (213) | | (7,142) | |
| — | | — | | — | | | 23 | | — | | 23 | | — | | 23 | | — | | — | | 23 | |
| — | | — | | — | | | — | | — | | — | | (1,511) | | (1,511) | | — | | — | | (1,511) | |
| 1,355 | | — | | — | | | — | | — | | — | | (809) | | 719 | | — | | — | | 719 | |
| — | | — | | — | | | — | | — | | — | | 5 | | 5 | | — | | — | | 5 | |
| — | | — | | — | | | — | | — | | — | | 316 | | 316 | | — | | 233 | | 549 | |
| (14,412) | | (6,495) | | 0 | | | (752) | | (160) | | (912) | | 73,706 | | 98,412 | | — | | 2,296 | | 100,708 | |
| | | | | | | | | | | | | | |
| | bp Annual Report and Form 20-F 2020 | | 221 |
32.Capital and reserves – continued
| | | | | | | | | | | | | | | | | | | | |
| | | | | | |
| | Share
capital | Share
premium
account | Capital
redemption
reserve | Merger
reserve | Total share capital
and capital
reserves |
|
| | | | | | |
| At 31 December 2017 | | 5,343 | | 12,147 | | 1,426 | | 27,206 | | 46,122 | |
| Adjustment on adoption of IFRS 9, net of tax | | — | | — | | — | | — | | — | |
| At 1 January 2018 | | 5,343 | | 12,147 | | 1,426 | | 27,206 | | 46,122 | |
| Profit (loss) for the year | | — | | — | | — | | — | | — | |
| Items that may be reclassified subsequently to profit or loss | | | | | | |
| Currency translation differences (including reclassifications) | | — | | — | | — | | — | | — | |
| Cash flow hedges and costs of hedging (including reclassifications) | | — | | — | | — | | — | | — | |
Share of items relating to equity-accounted entities, net of taxa | | — | | — | | — | | — | | — | |
| Other | | — | | — | | — | | — | | — | |
| Items that will not be reclassified to profit or loss | | | | | | |
| Remeasurements of the net pension and other post-retirement benefit liability or asset | | — | | — | | — | | — | | — | |
| Cash flow hedges that will subsequently be transferred to the balance sheet | | — | | — | | — | | — | | — | |
| Total comprehensive income | | — | | — | | — | | — | | — | |
| Dividends | | 49 | | (49) | | — | | — | | 0 | |
| Cash flow hedges transferred to the balance sheet, net of tax | | — | | — | | — | | — | | — | |
| Repurchases of ordinary share capital | | (13) | | — | | 13 | | — | | — | |
Share-based payments, net of taxb | | 23 | | 207 | | — | | — | | 230 | |
| Share of equity-accounted entities’ changes in equity, net of tax | | — | | — | | — | | — | | — | |
| Transactions involving non-controlling interests, net of tax | | — | | — | | — | | — | | — | |
| At 31 December 2018 | | 5,402 | | 12,305 | | 1,439 | | 27,206 | | 46,352 | |
a Principally foreign exchange effects relating to the Russian rouble.
b Movements in treasury shares relate to employee share-based payment plans.
| | | | | | | | | | | | | | |
| 222 | | bp Annual Report and Form 20-F 2020 | | |
32.Capital and reserves – continued
| | | | | | | | | | | | | | | | | | | | | | | | | | | | | | | | | |
| | | | | | | | | | | $ million |
Treasury
shares | Foreign
currency
translation
reserve | Available-
for-sale
investments | | Cash flow
hedges | Costs of hedging | Total
fair value
reserves | Profit and
loss
account | bp
shareholders’
equity | Non-controlling interests | Total equity |
| Hybrid bonds | Other interest |
| | | | | | | | | | | |
| (16,958) | | (5,156) | | 17 | | | (760) | | 0 | | (743) | | 75,226 | | 98,491 | | — | | 1,913 | | 100,404 | |
| — | | — | | (17) | | | — | | (37) | | (54) | | (126) | | (180) | | — | | 0 | | (180) | |
| (16,958) | | (5,156) | | 0 | | | (760) | | (37) | | (797) | | 75,100 | | 98,311 | | — | | 1,913 | | 100,224 | |
| — | | — | | — | | | — | | — | | — | | 9,383 | | 9,383 | | — | | 195 | | 9,578 | |
| | | | | | | | | | | |
| — | | (3,746) | | — | | | — | | — | | — | | 0 | | (3,746) | | — | | (41) | | (3,787) | |
| — | | — | | — | | | (6) | | (173) | | (179) | | — | | (179) | | — | | — | | (179) | |
| — | | — | | — | | | — | | — | | — | | 417 | | 417 | | — | | — | | 417 | |
| — | | — | | — | | | — | | — | | — | | 7 | | 7 | | — | | — | | 7 | |
| | | | | | | | | | | |
| — | | — | | — | | | — | | — | | — | | 1,599 | | 1,599 | | — | | — | | 1,599 | |
| — | | — | | — | | | (37) | | — | | (37) | | — | | (37) | | — | | — | | (37) | |
| — | | (3,746) | | 0 | | | (43) | | (173) | | (216) | | 11,406 | | 7,444 | | — | | 154 | | 7,598 | |
| — | | — | | — | | | — | | — | | — | | (6,699) | | (6,699) | | — | | (170) | | (6,869) | |
| — | | — | | — | | | 26 | | — | | 26 | | — | | 26 | | — | | — | | 26 | |
| — | | — | | — | | | — | | — | | — | | (355) | | (355) | | — | | — | | (355) | |
| 1,191 | | — | | — | | | — | | — | | — | | (718) | | 703 | | — | | — | | 703 | |
| — | | — | | — | | | — | | — | | — | | 14 | | 14 | | — | | — | | 14 | |
| — | | — | | — | | | — | | — | | — | | 0 | | 0 | | — | | 207 | | 207 | |
| (15,767) | | (8,902) | | 0 | | | (777) | | (210) | | (987) | | 78,748 | | 99,444 | | — | | 2,104 | | 101,548 | |
.
| | | | | | | | | | | | | | |
| | bp Annual Report and Form 20-F 2020 | | 223 |
32.Capital and reserves – continued
Share capital
The balance on the share capital account represents the aggregate nominal value of all ordinary and preference shares in issue, including treasury shares.
Share premium account
The balance on the share premium account represents the amounts received in excess of the nominal value of the ordinary and preference shares.
Capital redemption reserve
The balance on the capital redemption reserve represents the aggregate nominal value of all the ordinary shares repurchased and cancelled.
Merger reserve
The balance on the merger reserve represents the fair value of the consideration given in excess of the nominal value of the ordinary shares issued in an acquisition made by the issue of shares.
Treasury shares
Treasury shares represent BPbp shares repurchased and available for specific and limited purposes. For accounting purposes shares held in Employee Share Ownership Plans (ESOPs) and BP’sbp’s US share plan administrator to meet the future requirements of the employee share-based payment plans are treated in the same manner as treasury shares and are, therefore, included in the financial statements as treasury shares. The ESOPs are funded by the group and have waived their rights to dividends in respect of such shares held for future awards. Until such time as the shares held by the ESOPs vest unconditionally to employees, the amount paid for those shares is shown as a reduction in shareholders’ equity. Assets and liabilities of the ESOPs are recognized as assets and liabilities of the group.
Foreign currency translation reserve
The foreign currency translation reserve records exchange differences arising from the translation of the financial statements of foreign operations. Upon disposal of foreign operations, the related accumulated exchange differences are reclassified to the income statement.
Available-for-sale investments
This reserve recorded the changes in fair value of investments classified as available-for-sale under IAS 39 except for impairment losses, foreign exchange gains or losses, or changes arising from revised estimates of future cash flows. On adoption of IFRS 9 the balance in this reserve was transferred to the profit and loss account reserve. Under the new standard the group recognizes fair value gains and losses on these investments in profit or loss.
Cash flow hedges
This reserve records the portion of the gain or loss on a hedging instrument in a cash flow hedge that is determined to be an effective hedge. It includes $651 million relating to the acquisition of an 18.5% interest in Rosneft in 2013 which will only be reclassified to the income statement if the investment in Rosneft is either sold or impaired. For further information on the accounting for cash flow hedges see Note 1 - Derivative financial instruments and hedging activities.
Costs of hedging
This reserve records the change in fair value of the foreign currency basis spread of financial instruments to which cost of hedge accounting has been applied. The accumulated amount relates to time-period related hedged items and is amortized to profit or loss over the term of the hedging relationship.
Prior to the group’s adoption of IFRS 9 changes in the fair value of such foreign currency basis spreads were recognized in profit or loss. On adoption of the new standard a transfer from the profit and loss account reserve to the costs of hedging reserve was made in order to reflect the opening reserves position for relevant hedging instruments existing on transition. For further information on the accounting for costs of hedging see Note 1 - Derivative financial instruments and hedging activities.
Profit and loss account
The balance held on this reserve is the accumulated retained profits of the group.
Non-controlling interests
Non-controlling interests represent the equity in subsidiaries that is not attributable, directly or indirectly, to bp shareholders. Included within non-controlling interests are perpetual subordinated hybrid bonds issued by BP Capital Markets PLC, a group subsidiary, on 17 June 2020 in euro, sterling and US dollars for a US dollar equivalent amount of $11.9 billion. The hybrid bonds include redemption options exercisable at the group’s discretion from June 2025 to March 2030 (the first ‘call date’), on specified dates thereafter, or in the event of specific circumstances (such as a change in IFRS or tax regime) as set out in the individual terms of each issue. Coupons are fixed for an initial period up to dates from September 2025 to June 2030 at rates of 3.25% to 4.875% and reset to rates determined by the contractual terms of each instrument on certain dates thereafter. The contractual terms of the hybrid bonds allow the group to defer coupon payments and the repayment of principal indefinitely, however their terms and conditions stipulate that any deferred payments must be made in the event of an announcement of an ordinary share or parity equity dividend distribution or certain share repurchases or redemptions. As the group has the unconditional right to avoid transferring cash or another financial asset in relation to these hybrid bonds, they are classified as equity instruments and reported within non-controlling interests in the consolidated financial statements.
|
| | | | | | | | | | | | | |
218224 | | BPbp Annual Report and Form 20-F 2019
2020 | | |
32.Capital and reserves – continued
The pre-tax amounts of each component of other comprehensive income, and the related amounts of tax, are shown in the table below.
| | | | | | | | | | | | | | |
| | | | $ million |
| | | | 2020 |
| | Pre-tax | Tax | Net of tax |
| Items that may be reclassified subsequently to profit or loss | | | | |
| Currency translation differences (including reclassifications) | | (2,196) | | 9 | | (2,187) | |
| | | | |
| Cash flow hedges (including reclassifications) | | 41 | | (10) | | 31 | |
| Costs of hedging (including reclassifications) | | 64 | | (4) | | 60 | |
| Share of items relating to equity-accounted entities, net of tax | | 312 | | 0 | | 312 | |
| Other | | 0 | | 71 | | 71 | |
| Items that will not be reclassified to profit or loss | | | | |
| Remeasurements of the net pension and other post-retirement benefit liability or asset | | 170 | | (105) | | 65 | |
| Cash flow hedges that will subsequently be transferred to the balance sheet | | 7 | | 0 | | 7 | |
| | | | |
| | | | |
| Other comprehensive income | | (1,602) | | (39) | | (1,641) | |
| | | | |
| | | | $ million |
| | | | 2019 |
| | Pre-tax | Tax | Net of tax |
| Items that may be reclassified subsequently to profit or loss | | | | |
| Currency translation differences (including reclassifications) | | 2,418 | | (2) | | 2,416 | |
| Cash flow hedges (including reclassifications) | | 6 | | (1) | | 5 | |
| Costs of hedging (including reclassifications) | | 53 | | (3) | | 50 | |
| Share of items relating to equity-accounted entities, net of tax | | 82 | | 0 | | 82 | |
| Other | | 0 | | (64) | | (64) | |
| Items that will not be reclassified to profit or loss | | | | |
| Remeasurements of the net pension and other post-retirement benefit liability or asset | | 328 | | (157) | | 171 | |
| Cash flow hedges that will subsequently be transferred to the balance sheet | | (3) | | 0 | | (3) | |
| Other comprehensive income | | 2,884 | | (227) | | 2,657 | |
| | | | |
| | | | $ million |
| | | | 2018 |
| | Pre-tax | Tax | Net of tax |
| Items that may be reclassified subsequently to profit or loss | | | | |
| Currency translation differences (including reclassifications) | | (3,771) | | (16) | | (3,787) | |
| Cash flow hedges (including reclassifications) | | (6) | | 0 | | (6) | |
| Costs of hedging (including reclassifications) | | (186) | | 13 | | (173) | |
| Share of items relating to equity-accounted entities, net of tax | | 417 | | 0 | | 417 | |
| Other | | 0 | | 7 | | 7 | |
| Items that will not be reclassified to profit or loss | | | | |
| Remeasurements of the net pension and other post-retirement benefit liability or asset | | 2,317 | | (718) | | 1,599 | |
| Cash flow hedges that will subsequently be transferred to the balance sheet | | (37) | | 0 | | (37) | |
| Other comprehensive income | | (1,266) | | (714) | | (1,980) | |
|
| | | | | | | |
| | | | | $ million |
|
| | | | | 2019 |
|
| | | Pre-tax |
| Tax |
| Net of tax |
|
| Items that may be reclassified subsequently to profit or loss | | | | |
| Currency translation differences (including reclassifications) | | 2,418 |
| (2 | ) | 2,416 |
|
| Cash flow hedges (including reclassifications) | | 6 |
| (1 | ) | 5 |
|
| Costs of hedging (including reclassifications) | | 53 |
| (3 | ) | 50 |
|
| Share of items relating to equity-accounted entities, net of tax | | 82 |
| — |
| 82 |
|
| Other | | — |
| (64 | ) | (64 | ) |
| Items that will not be reclassified to profit or loss | | | | |
| Remeasurements of the net pension and other post-retirement benefit liability or asset | | 328 |
| (157 | ) | 171 |
|
| Cash flow hedges that will subsequently be transferred to the balance sheet | | (3 | ) | — |
| (3 | ) |
| Other comprehensive income | | 2,884 |
| (227 | ) | 2,657 |
|
| | | | | |
| | | | | $ million |
|
| | | | | 2018 |
|
| | | Pre-tax |
| Tax |
| Net of tax |
|
| Items that may be reclassified subsequently to profit or loss | | | | |
| Currency translation differences (including reclassifications) | | (3,771 | ) | (16 | ) | (3,787 | ) |
| Cash flow hedges (including reclassifications) | | (6 | ) | — |
| (6 | ) |
| Costs of hedging (including reclassifications) | | (186 | ) | 13 |
| (173 | ) |
| Share of items relating to equity-accounted entities, net of tax | | 417 |
| — |
| 417 |
|
| Other | | — |
| 7 |
| 7 |
|
| Items that will not be reclassified to profit or loss | | | | |
| Remeasurements of the net pension and other post-retirement benefit liability or asset | | 2,317 |
| (718 | ) | 1,599 |
|
| Cash flow hedges that will subsequently be transferred to the balance sheet | | (37 | ) | — |
| (37 | ) |
| Other comprehensive income | | (1,266 | ) | (714 | ) | (1,980 | ) |
| | | | | |
| | | | | $ million |
|
| | | | | 2017 |
|
| | | Pre-tax |
| Tax |
| Net of tax |
|
| Items that may be reclassified subsequently to profit or loss | | | | |
| Currency translation differences (including reclassifications) | | 1,866 |
| (95 | ) | 1,771 |
|
| Available-for-sale investments (including reclassifications) | | 14 |
| — |
| 14 |
|
| Cash flow hedges (including reclassifications) | | 425 |
| (29 | ) | 396 |
|
| Share of items relating to equity-accounted entities, net of tax | | 564 |
| — |
| 564 |
|
| Other | | — |
| (72 | ) | (72 | ) |
| Items that will not be reclassified to profit or loss | | | | |
| Remeasurements of the net pension and other post-retirement benefit liability or asset | | 3,646 |
| (1,303 | ) | 2,343 |
|
| Other comprehensive income | | 6,515 |
| (1,499 | ) | 5,016 |
|
33.Contingent liabilities and legal proceedings
Contingent liabilities
There were contingent liabilities at 31 December 20192020 in respect of guarantees and indemnities entered into as part of the ordinary course of the group’s business. No material losses are likely to arise from such contingent liabilities. Further information on financial guarantees is included in Note 29.
In the normal course of the group’s business, BPbp group entities are subject to legal and regulatory proceedings arising out of current and past operations, including matters related to commercial disputes, product liability, antitrust, commodities trading, premises-liability claims, consumer protection, general health, safety, climate change and environmental claims and allegations of exposures of third parties to toxic substances, such as lead pigment in paint, asbestos and other chemicals. The amounts claimed could be significant and could be material to the group’s results of operations, financial position or liquidity. While it is difficult to predict the ultimate outcome in some cases, BPbp expects that the impact of current legal and regulatory proceedings on the group‘s results of operations, liquidity or financial position will not be material.
The group files tax returns in many jurisdictions throughoutacross the world. Various tax authorities are currently examining the group’s tax returns. Taxthese returns, which contain matters that could be subject to differing interpretations of applicable tax laws and regulations including the tax deductibility of certain intercompany charges.regulations. The resolution of tax positions through negotiations with relevant tax authorities, or through litigation, can take several years to complete and the amounts could be significant and could, in aggregate, be material to the group’s results of operations, financial position or liquidity. While it is difficult to predict the ultimate outcome in some cases, BPbp does not expect there to be any material impact upon the group‘s results of operations, financial position or liquidity.
|
| | | | | | | | | | | | | |
| BP
| bp Annual Report and Form 20-F 20192020 | | 219225 |
33.Contingent liabilities and legal proceedings – continued
The group is subject to numerous national and local health, safety and environmental laws and regulations concerning its products, operations and other activities. These laws and regulations may require the group to take future action to remediate the effects on the environment of prior disposal or release of chemicals or petroleum substances by the group or other parties. Such contingencies may exist for various sites including refineries, chemical plants, oil fields, commodities extraction sites, service stations, terminals and waste disposal sites. In addition, the group may have obligations relating to prior asset sales or closed facilities. The ultimate requirement for remediation and its costs are inherently difficult to estimate. However, the estimated cost of environmental obligations has been provided in these accounts in accordance with the group‘s accounting policies. While the amounts of future possible costs that are not provided for could be significant and material to the group‘s results of operations in the period in which they are recognized, it is not possible to estimate the amounts involved. BPbp does not expect these costs to have a material impact on the group’s results of operations, financial position or liquidity.
If oil and natural gas production facilities and pipelines are sold to third parties and the subsequent owner is unable to meet their decommissioning obligations it is possible that, in certain circumstances, BPbp could be partially or wholly responsible for decommissioning. While the amounts associated with decommissioning provisions reverting to the group could be significant and could be material, BPbp is not currently aware of any such material cases that have a greater than remote chance of reverting to the group. In one current case in the US, the owner of facilities has filed for bankruptcy and submitted a proposed restructuring plan. It is considered possible that certain decommissioning costs associated with some of these facilities may in the future revert to bp in relation to assets previously disposed. No provision has been recognised and no reliable estimate of this potential exposure is available, however any amount which may revert is not expected to have a material impact on the group’s financial position. Furthermore, as described in Provisions and contingencies within Note 1, decommissioning provisions associated with downstream and petrochemical facilities are not generally recognized as the potential obligations cannot be measured given their indeterminate settlement dates.
See also Legal proceedings on pages 319-320.
Contingent liabilities related to the Gulf of Mexico oil spill
For information on legal proceedings relating to the Deepwater Horizon oil spill, see Legal proceedings on pages 319-320.below. Any further outstanding Deepwater Horizon related claims are not expected to have a material impact on the group's financial performance.
Legal proceedings
Proceedings relating to the Deepwater Horizon oil spill Introduction
BP Exploration & Production Inc. (BPXP) was lease operator of Mississippi Canyon, Block 252 in the Gulf of Mexico, where the semi-submersible rig Deepwater Horizon was deployed at the time of the 20 April 2010 explosion and fire and resulting oil spill (the Incident). Lawsuits and claims arising from the Incident were brought principally in US federal and state courts. The remaining proceedings arising from the Incident are discussed below.
Economic and Property Damages Settlement
On 22 January 2021, the United States District Court for the Eastern District of Louisiana issued an order determining the completion of all claims processing operations of the court supervised settlement programme. That settlement programme had been established to administer claims pursuant to the Economic and Property Damages Settlement (EPD Settlement) which was entered into with the plaintiffs’ steering committee (PSC) acting on behalf of individual and business plaintiffs in the multi-district litigation proceedings in 2012 to resolve certain economic and property damage claims. The Court also ordered that all future issues concerning EPD Settlement claims would be considered time barred under the settlement programme and that the claims administrator should proceed to complete post-closure administrative wind down activities.
Medical Benefits Class Action Settlement
In 2012 the Medical Benefits Class Action Settlement (Medical Settlement) was entered into with the PSC. It involves payments to qualifying class members based on a matrix for certain Specified Physical Conditions (SPCs), as well as a 21-year Periodic Medical Consultation Program (PMCP) for qualifying class members. As of 31 December 2020, 1 claim remained pending determination. In total, 27,603 claims (comprising 22,833 SPC claims and 4,770 PMCP claims) have been approved for compensation totalling approximately $67 million and 9,623 claims have been denied.
The Medical Settlement also includes provisions regarding class members pursuing claims for later-manifested physical conditions (LMPCs). In order to seek compensation from bp for an LMPC, class members must file a notice with the Medical Claims Administrator within 4 years after the date of first diagnosis of the LMPC. As of 31 December 2020, there were 612 pending lawsuits brought by class members claiming LMPCs.
Other civil complaints – economic loss
Nearly all economic loss and property damage claims from individuals and businesses that either opted out of the EPD Settlement and/or were excluded from that settlement have been settled or dismissed.
The claims of 10 US-resident private plaintiffs remain in the multi-district litigation proceedings in federal district court in New Orleans. Those claims have been scheduled for a process of discovery and dispositive motions which is expected to conclude around mid-2021.
Other civil complaints – personal injury
The vast majority of post-explosion clean-up, medical monitoring and personal injury claims from individuals that either opted out of the Medical Settlement and/or were excluded from that settlement have been dismissed.
In 2019, the federal district court in New Orleans determined in a series of proceedings that 923 plaintiffs had post-explosion clean-up, medical monitoring and personal injury claims that complied with the court’s prior order to show cause why their claims should not be dismissed. As a result of several subsequent dismissals, approximately 881 plaintiffs’ claims remained as of 31 December 2020.
On 23 February 2021, the district court issued a Case Management Order announcing its intent to sever the personal injury cases from the multi-district litigation proceedings and staying the litigation of any punitive damages claims until plaintiffs can establish a right to compensatory damages. The district court also stated that the order severing and re-allotting these cases is forthcoming. Most cases will remain in the federal district court in New Orleans and be re-allotted among the judges of that court.
Individual securities litigation
In October 2020, bp engaged with the plaintiffs in a mediation of all remaining multi-district litigation proceedings in federal district court in Houston. 28 such actions on behalf of 115 plaintiffs remained pending on 31 December 2020. The mediation resulted in settlements of all these cases and settlement agreements have now been executed with all plaintiffs.
| | | | | | | | | | | | | | |
| 226 | | bp Annual Report and Form 20-F 2020 | | |
33.Contingent liabilities and legal proceedings – continued
Canadian class actions
Following various legal proceedings, a plaintiff seeking to assert claims under Canadian law against bp on behalf of a class of Canadian residents who allegedly suffered losses because of their purchase of bp ordinary shares and ADSs appealed the motion to dismiss the case in its entirety granted on 8 November 2019. On 20 January 2021, the Court of Appeal affirmed that dismissal.
Non-US government lawsuits
On 18 October 2012, before a Mexican Federal District Court located in Mexico City, a class action complaint was filed against BP America Production Company (BPAPC) and other bp subsidiaries. On 27 June 2018, bp answered the complaint by seeking dismissal on various grounds including that no oil reached Mexican waters or land and there was no economic or environmental harm in Mexico. There has been no material development in these proceedings during 2020 and up to the date of publication of this BP Annual Report and Form 20-F 2020 in 2021.
On 3 December 2015 and 29 March 2016, Acciones Colectivas de Sinaloa (ACS) filed two class actions (which have since been consolidated) in a Mexican Federal District Court on behalf of several Mexican states against BPXP, BPAPC, and other purported bp subsidiaries. In these class actions, plaintiffs seek an order requiring the bp defendants to repair the damage to the Gulf of Mexico, to pay penalties, and to compensate plaintiffs for damage to property, to health and for economic loss. BPXP and BPAPC opposed class certification and sought dismissal, principally on the basis that no oil reached Mexican waters or land and there was no economic or environmental harm in Mexico. The court certified the class on 25 September 2019 and bp appealed that decision including by way of constitutional challenge (amparo). The amparo action was denied on 8 October 2020 and on 18 January 2021, bp’s appeal of that ruling was also denied. Class notification procedures have not yet been finally determined.
These legal actions remain at a relatively early stage and while it is not possible to predict the outcome, bp believes that it has valid defences, and it intends to defend such actions vigorously.
Other legal proceedings
FERC and CFTC matters
Following an investigation by the US Federal Energy Regulatory Commission (FERC) and the US Commodity Futures Trading Commission (CFTC) of several bp entities, the Administrative Law Judge of the FERC ruled on 13 August 2015 that bp manipulated the market by selling next-day, fixed price natural gas at Houston Ship Channel in 2008 in order to suppress the Gas Daily index and benefit its financial position. On 11 July 2016 the FERC issued an Order affirming the initial decision and directing bp to pay a civil penalty of $20.16 million and to disgorge $207,169 in unjust profits. On 10 August 2016, bp filed a request for rehearing with the FERC. On 17 December 2020, the FERC denied the rehearing request, sustaining the prior decision and ordering payment of the penalty and disgorgement amounts. bp has complied with the order but strongly disagrees with the FERC’s decision and is pursuing an appeal to the US Court of Appeals.
Lead paint matters
Since 1987, Atlantic Richfield Company (Atlantic Richfield), a subsidiary« of bp, has been named as a co-defendant in numerous lawsuits brought in the US alleging injury to persons and property caused by lead pigment in paint. The majority of the lawsuits have been abandoned or dismissed against Atlantic Richfield. Atlantic Richfield is named in these lawsuits as alleged successor to International Smelting and Refining and another company that manufactured lead pigment during the period 1920-1946. The plaintiffs include individuals and governmental entities. Several of the lawsuits purport to be class actions. The lawsuits seek various remedies including compensation to lead-poisoned children, cost to find and remove lead paint from buildings, medical monitoring and screening programmes, public warning and education of lead hazards, reimbursement of government healthcare costs and special education for lead-poisoned citizens and punitive damages. No lawsuit against Atlantic Richfield has been settled nor has Atlantic Richfield been subject to a final adverse judgment in any proceeding. The amounts claimed and, if such suits were successful, the costs of implementing the remedies sought in the various cases could be substantial. While it is not possible to predict the outcome of these legal actions, Atlantic Richfield believes that it has valid defences. It intends to defend such actions vigorously and believes that the incurrence of liability is remote. Consequently, bp believes that the impact of these lawsuits on the group’s results, financial position or liquidity will not be material.
Climate change
BP p.l.c., BP America Inc. and BP Products North America Inc. are co-defendants with other oil and gas companies in multiple lawsuits brought in various state and federal courts on behalf of various governmental and private parties. The lawsuits generally assert claims under a variety of legal theories seeking to hold the defendant companies responsible for impacts allegedly caused by and/or relating to climate change and seek remedies including payment of money and other forms of equitable relief. If such suits were successful, the cost of the remedies sought in the various cases could be substantial. All of these lawsuits remain at relatively early stages and while it is not possible to predict the outcome of these legal actions, BP believes that it has valid defences, and it intends to defend such actions vigorously.
Louisiana Coastal restoration
NaN coastal parishes and the State of Louisiana have filed over 40 separate lawsuits in state courts in Louisiana against various oil and gas companies seeking damages for coastal erosion. bp entities are defendants in 17 of these cases. The lawsuits allege that the defendants' historical operations in oil fields within the Louisiana onshore coastal zone failed to comply with state permits and/or were conducted without the required coastal use permits. The plaintiffs seek unspecified statutory penalties and damages, including the costs of restoring coastal wetlands allegedly impacted by oil field operations.
In addition, 4 private landowners have filed separate claims in the state courts in Jefferson and Plaquemines Parishes of Louisiana for restoration damages related to alleged impacts to their marshlands associated with historic oil field operations. bp entities are defendants in 2 of these private landowner cases.
All of these lawsuits remain at relatively early stages and while it is not possible to predict the outcome of these legal actions, bp believes that it has valid defences, and it intends to defend such actions vigorously.
| | | | | | | | | | | | | | |
| | bp Annual Report and Form 20-F 2020 | | 227 |
34.Remuneration of senior management and non-executive directors
Remuneration of directors
| | | | | | | | | | | | | | |
| | | | $ million |
| | 2020 | 2019 | 2018 |
| Total for all directors | | | | |
| Emoluments | | 6 | | 9 | | 8 | |
Amounts received under incentive schemesa | | 14 | | 20 | | 16 | |
| Total | | 20 | | 29 | | 24 | |
|
| | | | | | | |
| | | | | $ million |
|
| | | 2019 |
| 2018 |
| 2017 |
|
| Total for all directors | | | | |
| Emoluments | | 9 |
| 8 |
| 9 |
|
Amounts received under incentive schemesa | | 20 |
| 16 |
| 9 |
|
| Total | | 29 |
| 24 |
| 18 |
|
a Excludes amounts relating to past directors.
Emoluments
These amounts comprise fees paid to the non-executive chairman and the non-executive directors and, for executive directors, salary and benefits earned during the relevant financial year, plus cash bonuses awarded for the year.
Pension contributions
During 2019 one2020 1 executive director participated in a UK final salary pension plan in respect of service prior to 1 April 2011. During 2019, one2020, 1 executive director participated in retirement savings plans established for US employees and in a US defined benefit pension plan in respect of service prior to 1 September 2016.
Further information
Full details of individual directors’ remuneration are given in the Directors’ remuneration report on page 100.103. See also Related-party transactions on page 321.326.
Remuneration of directors and senior management
| | | | | | $ million |
| | | | $ million |
| | | 2019 |
| 2018 |
| 2017 |
| | | 2020 | 2019 | 2018 |
| Total for all senior management and non-executive directors | | | Total for all senior management and non-executive directors | | | |
| Short-term employee benefits | | 30 |
| 25 |
| 29 |
| Short-term employee benefits | | 17 | | 30 | | 25 | |
| Pensions and other post-retirement benefits | | 2 |
| 2 |
| 2 |
| Pensions and other post-retirement benefits | | 2 | | 2 | | 2 | |
| Share-based payments | | 32 |
| 32 |
| 29 |
| Share-based payments | | 52 | | 32 | | 32 | |
| Termination benefits | | Termination benefits | | 8 | | 0 | | 0 | |
| Total | | 64 |
| 59 |
| 60 |
| Total | | 79 | | 64 | | 59 | |
Senior management comprises members of the executiveleadership team, see pages 78-79 for further information.
Short-term employee benefits
These amounts comprise fees and benefits paid to the non-executive chairman and non-executive directors, as well as salary, benefits and cash bonuses for senior management. Deferred annual bonus awards, to be settled in shares, are included in share-based payments. Short term employee benefits includes compensation for loss of office of $nil in 2019 (2018 $nil and 2017 $nil).
Pensions and other post-retirement benefits
The amounts represent the estimated cost to the group of providing pensions and other post-retirement benefits to senior management in respect of the current year of service measured in accordance with IAS 19 ‘Employee Benefits’.
Share-based payments
This is the cost to the group of senior management’s participation in share-based payment plans, as measured by the fair value of options and shares granted, accounted for in accordance with IFRS 2 ‘Share-based Payments’.
Termination benefits
Termination benefits include compensation to senior management for loss of office.
|
| | | | | | | | | | | | | |
220228 | | BPbp Annual Report and Form 20-F 2019
2020 | | |
35.Employee costs and numbers
| | | | | | | | | | | | | | |
| | | | $ million |
| Employee costs | | 2020 | 2019 | 2018 |
Wages and salariesa | | 7,600 | | 7,497 | | 7,931 | |
| Social security costs | | 729 | | 733 | | 743 | |
Share-based paymentsb | | 728 | | 694 | | 669 | |
| Pension and other post-retirement benefit costs | | 852 | | 948 | | 1,154 | |
| | 9,909 | | 9,872 | | 10,497 | |
|
| | | | | | | |
| | | | | $ million |
|
| Employee costs | | 2019 |
| 2018 |
| 2017 |
|
Wages and salariesa | | 7,497 |
| 7,931 |
| 7,572 |
|
| Social security costs | | 733 |
| 743 |
| 711 |
|
Share-based paymentsb | | 694 |
| 669 |
| 624 |
|
| Pension and other post-retirement benefit costs | | 948 |
| 1,154 |
| 1,296 |
|
| | | 9,872 |
| 10,497 |
| 10,203 |
|
| | | | | | | | | | | | | | | | | | | | | | | | | | | | | | | | |
| | | | 2020 | | | 2019 | | | 2018 |
Average number of employeesc | | US | Non-US | Total | US | Non-US | Total | US | Non-US | Total |
| Upstream | | 4,800 | | 10,600 | | 15,400 | | 5,800 | | 11,000 | | 16,800 | | 5,900 | | 11,500 | | 17,400 | |
Downstreamd | | 5,800 | | 37,800 | | 43,600 | | 5,700 | | 37,300 | | 43,000 | | 6,000 | | 36,300 | | 42,300 | |
Other businesses and corporatee | | 1,800 | | 7,300 | | 9,100 | | 2,100 | | 10,600 | | 12,700 | | 1,900 | | 12,100 | | 14,000 | |
| | 12,400 | | 55,700 | | 68,100 | | 13,600 | | 58,900 | | 72,500 | | 13,800 | | 59,900 | | 73,700 | |
|
| | | | | | | | | | | | | | | | | | | |
| | | | | 2019 |
| | | 2018 |
| | | 2017 |
|
Average number of employeesc | | US |
| Non-US |
| Total |
| US |
| Non-US |
| Total |
| US |
| Non-US |
| Total |
|
| Upstream | | 5,800 |
| 11,000 |
| 16,800 |
| 5,900 |
| 11,500 |
| 17,400 |
| 6,200 |
| 12,200 |
| 18,400 |
|
Downstreamd | | 5,700 |
| 37,300 |
| 43,000 |
| 6,000 |
| 36,300 |
| 42,300 |
| 6,100 |
| 35,900 |
| 42,000 |
|
Other businesses and corporatee | | 2,100 |
| 10,600 |
| 12,700 |
| 1,900 |
| 12,100 |
| 14,000 |
| 1,900 |
| 12,400 |
| 14,300 |
|
| | | 13,600 |
| 58,900 |
| 72,500 |
| 13,800 |
| 59,900 |
| 73,700 |
| 14,200 |
| 60,500 |
| 74,700 |
|
a Includes termination costs of $1,237 million (2019 $182 million (2018and 2018 $493 million). Reinvent bp restructuring accruals of $714 million and 2017 $189 million).provisions of $428 million for employee termination payments were held at 31 December 2020.
b The group provides certain employees with shares and share options as part of their remuneration packages. The majority of these share-based payment arrangements are equity-settled.
c Reported to the nearest 100.
d Includes 19,100 (2019 18,100 (2018 17,100 and 2017 16,500)2018 17,100) service station staff.
e Includes 0 (2019 2,500 (2018 4,000 and 2017 4,700)2018 4,000) agricultural, operational and seasonal workers in Brazil.
The reduction in the average number of employees in 2020 compared to 2019 is principally a result of the reinvent bp programme and divestment activity.
36.Auditor’s remuneration
| | | | | | | | | | | | | | |
| | | | $ million |
| Fees | | 2020 | 2019 | 2018 |
The audit of the company annual accountsa | | 30 | | 32 | | 25 | |
| The audit of accounts of subsidiaries of the company | | 11 | | 11 | | 10 | |
| Total audit | | 41 | | 43 | | 35 | |
Audit-related assurance servicesb | | 11 | | 4 | | 4 | |
| Total audit and audit-related assurance services | | 52 | | 47 | | 39 | |
| | | | |
| | | | |
| | | | |
| Non-audit and other assurance services | | 1 | | 1 | | 2 | |
| | | | |
| Services relating to bp pension plans | | 1 | | 1 | | 1 | |
| | 54 | | 49 | | 42 | |
|
| | | | | | | |
| | | | | $ million |
|
| Fees | | 2019 |
| 2018 |
| 2017 |
|
The audit of the company annual accountsa | | 32 |
| 25 |
| 26 |
|
| The audit of accounts of subsidiaries of the company | | 11 |
| 10 |
| 11 |
|
| Total audit | | 43 |
| 35 |
| 37 |
|
Audit-related assurance servicesb | | 4 |
| 4 |
| 7 |
|
| Total audit and audit-related assurance services | | 47 |
| 39 |
| 44 |
|
| Non-audit and other assurance services | | 1 |
| 2 |
| 3 |
|
| Total non-audit or non-audit-related assurance services | | 1 |
| 2 |
| 3 |
|
| Services relating to BP pension plans | | 1 |
| 1 |
| — |
|
| | | 49 |
| 42 |
| 47 |
|
a Fees in respect of the audit of the accounts of BP p.l.c. including the group’s consolidated financial statements.
b Includes interim reviews and audit of internal control over financial reporting and non-statutory audit services. 2020 fees include audit fees relating to the Petrochemicals disposal.
With effect from 2018, following a competitive tender process, Deloitte LLP (Deloitte) was appointed as auditor of the Company, replacing Ernst & Young LLP (EY). In the table above, auditor’s remuneration
2020 includes $0.5 million of additional fees for services provided during the years ended 31 December 2019 and 31 December 2018 thus relates to Deloitte and for the year ended 31 December 2017 EY.
2019. 2019 includes $3.6 million of additional fees for 2018. In addition to the amounts shown in the table above, in2018 $0.75 million of additional fees were paid to EY in respect of their audit for 2017. Auditor's remuneration is included in the income statement within distribution and administration expenses.
Tax services (in relation to income tax, indirect tax compliance, employee tax services and tax advisory services) were $nil in all periods presented.
The audit committee has established pre-approval policies and procedures for the engagement of Deloitte to render audit and certain assurance and other services. The audit fees payable to Deloitte were considered as part of the audit tender process in 2016 and challenged by the audit committee through comparison with the audit pricing proposals of the other bidding firms, firms. Changes in audit fees subsequent to the audit tender, including matters relevant to the 2020 audit, have been reviewed and challenged by the Audit Committee,before being approved. Deloitte performed further assurance services that were not prohibited by regulatory or other professional requirements and were pre-approved by the Committee. Deloitte is engaged for these services when its expertise and experience of BPbp are important. Most of this work is of an audit-related or assurance nature.
Under SEC regulations, the remuneration of the auditor of $54 million (2019 $49 million (2018and 2018 $42 million and 2017 $47 million) is required to be presented as follows: audit $41 million (2019 $43 million (2018and 2018 $35 million and 2017 $37 million); other audit-related $4$11 million (2018(2019 $4 million and 2017 $72018 $4 million); tax $nil (2018 $nil$NaN (2019 $NaN and 2017 $nil)2018 $NaN); and all other fees $3$2 million (2018 $3(2019 $2 million and 20172018 $3 million).
|
| | | | | | | | | | | | | |
| BP
| bp Annual Report and Form 20-F 20192020 | | 221229 |
37.Subsidiaries, joint arrangements and associates
The more important subsidiaries and associates of the group at 31 December 20192020 and the group percentage of ordinary share capital (to nearest whole number) are set out below. There are no individually significant incorporated joint arrangements. The group's share of the assets and liabilities of the more important unincorporated joint arrangements are held by subsidiaries listed in the table below. Those subsidiaries held directly by the parent company are marked with an asterisk (*), the percentage owned being that of the group unless otherwise indicated. A complete list of undertakings of the group is included in Note 14 in the parent company financial statements of BP p.l.c. which are filed with the Registrar of Companies in the UK, along with the group’s annual report.
| | | | | | | | | | | | | | | | | |
| Subsidiaries | | % | Country of
incorporation | | Principal activities |
| International | | | | | |
| BP Corporate Holdings | | 100 | | England & Wales | | Investment holding |
| BP Exploration Operating Company | | 100 | | England & Wales | | Exploration and production |
| *BP Global Investments | | 100 | | England & Wales | | Investment holding |
| *BP International | | 100 | | England & Wales | | Integrated oil operations |
| BP Oil International | | 100 | | England & Wales | | Integrated oil operations |
| *Burmah Castrol | | 100 | | Scotland | | Lubricants |
| Angola | | | | | |
| BP Exploration (Angola) | | 100 | | England & Wales | | Exploration and production |
| Azerbaijan | | | | | |
| BP Exploration (Caspian Sea) | | 100 | | England & Wales | | Exploration and production |
| BP Exploration (Azerbaijan) | | 100 | | England & Wales | | Exploration and production |
| Canada | | | | | |
| *BP Holdings Canada | | 100 | | England & Wales | | Investment holding |
| Egypt | | | | | |
| BP Exploration (Delta) | | 100 | | England & Wales | | Exploration and production |
| Germany | | | | | |
| BP Europa SE | | 100 | | Germany | | Refining and marketing |
| India | | | | | |
| BP Exploration (Alpha) | | 100 | | England & Wales | | Exploration and production |
| Trinidad & Tobago | | | | | |
| BP Trinidad and Tobago | | 70 | | US | | Exploration and production |
| UK | | | | | |
| BP Capital Markets | | 100 | | England & Wales | | Finance |
| US | | | | | |
| *BP Holdings North America | | 100 | | England & Wales | | Investment holding |
| Atlantic Richfield Company | | 100 | | US | | Exploration and production, refining and marketing |
| BP America | | 100 | | US | |
| BP America Production Company | | 100 | | US | |
| BP Company North America | | 100 | | US | |
| BP Corporation North America | | 100 | | US | |
| | | | |
| BP Products North America | | 100 | | US | |
| Standard Oil Company | | 100 | | US | |
| BP Capital Markets America | | 100 | | US | | Finance |
| | | | | |
SubsidiariesAssociates | | % | Country of
incorporation
| | Principal activities |
InternationalRussia | | | | | |
BP Corporate Holdings | | 100 | England & Wales | | Investment holding |
BP Exploration Operating Company | | 100 | England & Wales | | Exploration and production |
*BP Global Investments | | 100 | England & Wales | | Investment holding |
*BP International | | 100 | England & Wales | | Integrated oil operations |
BP Oil International | | 100 | England & Wales | | Integrated oil operations |
*Burmah Castrol | | 100 | Scotland | | Lubricants |
Angola | | | | | |
BP Exploration (Angola) | | 100 | England & Wales | | Exploration and production |
Azerbaijan | | | | | |
BP Exploration (Caspian Sea) | | 100 | England & Wales | | Exploration and production |
BP Exploration (Azerbaijan) | | 100 | England & Wales | | Exploration and production |
Canada | | | | | |
*BP Holdings Canada | | 100 | England & Wales | | Investment holding |
Egypt | | | | | |
BP Exploration (Delta) | | 100 | England & Wales | | Exploration and production |
Germany | | | | | |
BP Europa SE | | 100 | Germany | | Refining and marketing |
India | | | | | |
BP Exploration (Alpha) | | 100 | England & Wales | | Exploration and production |
Trinidad & Tobago | | | | | |
BP Trinidad and Tobago | | 70 | US | | Exploration and production |
UK | | | | | |
BP Capital Markets | | 100 | England & Wales | | Finance |
US | | | | | |
*BP Holdings North America | | 100 | England & Wales | | Investment holding |
Atlantic Richfield Company | | 100 | US | | Exploration and production, refining and marketing |
BP America | | 100 | US | |
BP America Production Company | | 100 | US | |
BP Company North America | | 100 | US | |
BP Corporation North America | | 100 | US | |
BP Exploration (Alaska) | | 100 | US | |
BP Products North America | | 100 | US | |
Standard Oil Company | | 100 | US | |
BP Capital Markets America | | 100 | US | | Finance |
| | | | | |
Associates | | % | Country of
incorporation
| | Principal activities |
Russia | | | | | |
Rosneft Oil Company | | 19.75 | Russia | | Integrated oil operations |
|
| | | |
222 Rosneft Oil Company | | BP Annual Report and Form 20-F 2019
19.75 | | Russia | | Integrated oil operations |
38.Condensed consolidating information on certain US subsidiaries
BP p.l.c. fully and unconditionally guarantees the payment obligations of its 100%-owned subsidiary BP Exploration (Alaska) Inc. under the BP Prudhoe Bay Royalty Trust. As described in Note 2, in
On June 30, 2020, BP expects, subject to governmental authorizations, to completebp completed the sale of all of its Alaska operations, including its interest in BP Exploration (Alaska) Inc., to Hilcorp Energy. Following completionEnergy, and BP Exploration (Alaska) Inc. is therefore no longer a subsidiary of the sale, BP p.l.c. Accordingly, bp is no longer presenting condensed consolidating information on BP Exploration (Alaska) Inc. as a subsidiary issuer of registered securities pursuant to Rule 3-10 of Regulation S-X. BP p.l.c. will continue to fully and unconditionally guarantee the payment obligations of BP Exploration (Alaska) Inc. tounder the BP Prudhoe Bay Royalty Trust. The following financial information for BP p.l.c., BP Exploration (Alaska) Inc. and all other subsidiaries on a condensed consolidating basis is intended to provide investors with meaningful and comparable financial information about BP p.l.c. and its subsidiary issuers of registered securities and is provided pursuant to Rule 3-10 of Regulation S-X in lieu of the separate financial statements of each subsidiary issuer of public debt securities. Non-current assets for BP p.l.c. includes investments in subsidiaries recorded under the equity method for the purposes of the condensed consolidating financial information. Equity-accounted income of subsidiaries is the group’s share of profit related to such investments. The eliminations and reclassifications column includes the necessary amounts to eliminate the intercompany balances and transactions between BP p.l.c., BP Exploration (Alaska) Inc. and other subsidiaries. The financial information presented in the following tables for BP Exploration (Alaska) Inc. incorporates subsidiaries of BP Exploration (Alaska) Inc. using the equity method of accounting and excludes the BP group’s midstream operations in Alaska that are reported through different legal entities and that are included within the ‘other subsidiaries’ column in these tables. BP p.l.c. also fully and unconditionally guarantees securities issued by BP Capital Markets p.l.c. and BP Capital Markets America Inc. These companies, which are 100%-owned finance subsidiaries of BP p.l.c.
Income statement
|
| | | | | | | | | | | |
| | | | | | | $ million |
|
| | | | | | | 2019 |
|
| | | Issuer |
| Guarantor |
| | | |
| | | BP Exploration (Alaska) Inc. |
| BP p.l.c. |
| Other subsidiaries |
| Eliminations and reclassifications |
| BP group |
|
| Sales and other operating revenues | | 4,413 |
| — |
| 278,111 |
| (4,127 | ) | 278,397 |
|
| Earnings from joint ventures - after interest and tax | | — |
| — |
| 576 |
| — |
| 576 |
|
| Earnings from associates - after interest and tax | | — |
| — |
| 2,681 |
| — |
| 2,681 |
|
| Equity-accounted income of subsidiaries - after interest and tax | | — |
| 5,916 |
| — |
| (5,916 | ) | — |
|
| Interest and other income | | 42 |
| 385 |
| 2,284 |
| (1,942 | ) | 769 |
|
| Gains on sale of businesses and fixed assets | | 4 |
| — |
| 189 |
| — |
| 193 |
|
| Total revenues and other income | | 4,459 |
| 6,301 |
| 283,841 |
| (11,985 | ) | 282,616 |
|
| Purchases | | 2,361 |
| — |
| 211,438 |
| (4,127 | ) | 209,672 |
|
| Production and manufacturing expenses | | 907 |
| — |
| 20,908 |
| — |
| 21,815 |
|
| Production and similar taxes | | 163 |
| — |
| 1,384 |
| — |
| 1,547 |
|
| Depreciation, depletion and amortization | | 169 |
| — |
| 17,611 |
| — |
| 17,780 |
|
| Impairment and losses on sale of businesses and fixed assets | | 747 |
| — |
| 7,328 |
| — |
| 8,075 |
|
| Exploration expense | | — |
| — |
| 964 |
| — |
| 964 |
|
| Distribution and administration expenses | | 75 |
| 803 |
| 10,333 |
| (154 | ) | 11,057 |
|
| Profit (loss) before interest and taxation | | 37 |
| 5,498 |
| 13,875 |
| (7,704 | ) | 11,706 |
|
| Finance costs | | 17 |
| 1,569 |
| 3,691 |
| (1,788 | ) | 3,489 |
|
| Net finance (income) expense relating to pensions and other post-retirement benefits | | — |
| (153 | ) | 216 |
| — |
| 63 |
|
| Profit (loss) before taxation | | 20 |
| 4,082 |
| 9,968 |
| (5,916 | ) | 8,154 |
|
| Taxation | | (40 | ) | 56 |
| 3,948 |
| — |
| 3,964 |
|
| Profit (loss) for the year | | 60 |
| 4,026 |
| 6,020 |
| (5,916 | ) | 4,190 |
|
| Attributable to | |
|
|
|
|
|
| BP shareholders | | 60 |
| 4,026 |
| 5,856 |
| (5,916 | ) | 4,026 |
|
| Non-controlling interests | | — |
| — |
| 164 |
| — |
| 164 |
|
| | | 60 |
| 4,026 |
| 6,020 |
| (5,916 | ) | 4,190 |
|
|
| | | |
| BP Annual Report and Form 20-F 2019
| | 223 |
38.Condensed consolidating information on certain US subsidiaries – continued
Income statementcontinued
|
| | | | | | | | | | | |
| | | | | | | $ million |
|
| | | | | | | 2018 |
|
| | | Issuer |
| Guarantor |
| | | |
| | | BP Exploration (Alaska) Inc. |
| BP p.l.c. |
| Other subsidiaries |
| Eliminations and reclassifications |
| BP group |
|
| Sales and other operating revenues | | 4,315 |
| — |
| 298,620 |
| (4,179 | ) | 298,756 |
|
| Earnings from joint ventures - after interest and tax | | — |
| — |
| 897 |
| — |
| 897 |
|
| Earnings from associates - after interest and tax | | — |
| — |
| 2,856 |
| — |
| 2,856 |
|
| Equity-accounted income of subsidiaries - after interest and tax | | — |
| 10,942 |
| — |
| (10,942 | ) | — |
|
| Interest and other income | | 42 |
| 373 |
| 2,081 |
| (1,723 | ) | 773 |
|
| Gains on sale of businesses and fixed assets | | — |
| — |
| 456 |
| — |
| 456 |
|
| Total revenues and other income | | 4,357 |
| 11,315 |
| 304,910 |
| (16,844 | ) | 303,738 |
|
| Purchases | | 1,507 |
| — |
| 232,550 |
| (4,179 | ) | 229,878 |
|
| Production and manufacturing expenses | | 1,015 |
| — |
| 21,990 |
| — |
| 23,005 |
|
| Production and similar taxes | | 282 |
| — |
| 1,254 |
| — |
| 1,536 |
|
| Depreciation, depletion and amortization | | 377 |
| — |
| 15,080 |
| — |
| 15,457 |
|
| Impairment and losses on sale of businesses and fixed assets | | 66 |
| — |
| 794 |
| — |
| 860 |
|
| Exploration expense | | — |
| — |
| 1,445 |
| — |
| 1,445 |
|
| Distribution and administration expenses | | 22 |
| 642 |
| 11,673 |
| (158 | ) | 12,179 |
|
| Profit (loss) before interest and taxation | | 1,088 |
| 10,673 |
| 20,124 |
| (12,507 | ) | 19,378 |
|
| Finance costs | | 8 |
| 1,326 |
| 2,759 |
| (1,565 | ) | 2,528 |
|
| Net finance (income) expense relating to pensions and other post-retirement benefits | | — |
| (95 | ) | 222 |
| — |
| 127 |
|
| Profit (loss) before taxation | | 1,080 |
| 9,442 |
| 17,143 |
| (10,942 | ) | 16,723 |
|
| Taxation | | 164 |
| 59 |
| 6,922 |
| — |
| 7,145 |
|
| Profit (loss) for the year | | 916 |
| 9,383 |
| 10,221 |
| (10,942 | ) | 9,578 |
|
| Attributable to | | | | | | |
| BP shareholders | | 916 |
| 9,383 |
| 10,026 |
| (10,942 | ) | 9,383 |
|
| Non-controlling interests | | — |
| — |
| 195 |
| — |
| 195 |
|
| | | 916 |
| 9,383 |
| 10,221 |
| (10,942 | ) | 9,578 |
|
Income statementcontinued
|
| | | | | | | | | | | |
| | | | | | | $ million |
|
| | | | | | | 2017 |
|
| | | Issuer |
| Guarantor |
| | | |
| | | BP Exploration (Alaska) Inc. |
| BP p.l.c. |
| Other subsidiaries |
| Eliminations and reclassifications |
| BP group |
|
| Sales and other operating revenues | | 3,264 |
| — |
| 240,177 |
| (3,233 | ) | 240,208 |
|
| Earnings from joint ventures - after interest and tax | | — |
| — |
| 1,177 |
| — |
| 1,177 |
|
| Earnings from associates - after interest and tax | | — |
| — |
| 1,330 |
| — |
| 1,330 |
|
| Equity-accounted income of subsidiaries - after interest and tax | | — |
| 4,436 |
| — |
| (4,436 | ) | — |
|
| Interest and other income | | 11 |
| 369 |
| 1,470 |
| (1,193 | ) | 657 |
|
| Gains on sale of businesses and fixed assets | | 71 |
| 9 |
| 1,139 |
| (9 | ) | 1,210 |
|
| Total revenues and other income | | 3,346 |
| 4,814 |
| 245,293 |
| (8,871 | ) | 244,582 |
|
| Purchases | | 1,010 |
| — |
| 181,939 |
| (3,233 | ) | 179,716 |
|
| Production and manufacturing expenses | | 1,156 |
| — |
| 23,073 |
| — |
| 24,229 |
|
Production and similar taxesa | | (18 | ) | — |
| 1,793 |
| — |
| 1,775 |
|
| Depreciation, depletion and amortization | | 735 |
| — |
| 14,849 |
| — |
| 15,584 |
|
| Impairment and losses on sale of businesses and fixed assets | | — |
| — |
| 1,216 |
| — |
| 1,216 |
|
| Exploration expense | | — |
| — |
| 2,080 |
| — |
| 2,080 |
|
| Distribution and administration expenses | | 19 |
| 616 |
| 10,022 |
| (149 | ) | 10,508 |
|
| Profit (loss) before interest and taxation | | 444 |
| 4,198 |
| 10,321 |
| (5,489 | ) | 9,474 |
|
| Finance costs | | 6 |
| 826 |
| 2,286 |
| (1,044 | ) | 2,074 |
|
| Net finance (income) expense relating to pensions and other post-retirement benefits | | — |
| (15 | ) | 235 |
| — |
| 220 |
|
| Profit (loss) before taxation | | 438 |
| 3,387 |
| 7,800 |
| (4,445 | ) | 7,180 |
|
| Taxation | | (392 | ) | (11 | ) | 4,115 |
| — |
| 3,712 |
|
| Profit (loss) for the year | | 830 |
| 3,398 |
| 3,685 |
| (4,445 | ) | 3,468 |
|
| Attributable to | | | | | | |
| BP shareholders | | 830 |
| 3,398 |
| 3,606 |
| (4,445 | ) | 3,389 |
|
| Non-controlling interests | | — |
| — |
| 79 |
| — |
| 79 |
|
| | | 830 |
| 3,398 |
| 3,685 |
| (4,445 | ) | 3,468 |
|
a Includes revised non-cash provision adjustments; actual cash payments for Production and similar taxes remain in line with prior year.
|
| | | |
224 | | BP Annual Report and Form 20-F 2019
| |
38.Condensed consolidating information on certain US subsidiaries – continued
Statement of comprehensive income
|
| | | | | | | | | | | |
| | | | | | | $ million |
|
| | | | | | | 2019 |
|
| | | Issuer |
| Guarantor |
| | | |
| | | BP Exploration (Alaska) Inc. |
| BP p.l.c. |
| Other subsidiaries |
| Eliminations and reclassifications |
| BP group |
|
| Profit (loss) for the year | | 60 |
| 4,026 |
| 6,020 |
| (5,916 | ) | 4,190 |
|
| Other comprehensive income | | | | | | |
| Items that may be reclassified subsequently to profit or loss | | | | | | |
| Currency translation differences | | — |
| 200 |
| 1,338 |
| — |
| 1,538 |
|
| Exchange (gains) or losses on translation of foreign operations transferred to gain or loss on sale of businesses and fixed assets | | — |
| — |
| 880 |
| — |
| 880 |
|
| Cash flow hedges marked to market | | — |
| — |
| (100 | ) | — |
| (100 | ) |
| Cash flow hedges - recycled to the income statement | | — |
| — |
| 106 |
| — |
| 106 |
|
| Costs of hedging market to market | | — |
| — |
| (4 | ) | — |
| (4 | ) |
| Costs of hedging reclassified to the income statement | | — |
| — |
| 57 |
| — |
| 57 |
|
| Share of items relating to equity-accounted entities, net of tax | | — |
| — |
| 82 |
| — |
| 82 |
|
| Income tax relating to items that may be reclassified | | — |
| — |
| (70 | ) | — |
| (70 | ) |
| | | — |
| 200 |
| 2,289 |
| — |
| 2,489 |
|
| Items that will not be reclassified to profit or loss | | | | | | |
| Remeasurements of the net pension and other post-retirement benefit liability or asset | | — |
| 732 |
| (404 | ) | — |
| 328 |
|
| Cash flow hedges that will subsequently be transferred to the balance sheet | | — |
| — |
| (3 | ) | — |
| (3 | ) |
| Income tax relating to items that will not be reclassified | | — |
| (331 | ) | 174 |
| — |
| (157 | ) |
| | | — |
| 401 |
| (233 | ) | — |
| 168 |
|
| Other comprehensive income | | — |
| 601 |
| 2,056 |
| — |
| 2,657 |
|
| Equity-accounted other comprehensive income of subsidiaries | | — |
| 2,047 |
| — |
| (2,047 | ) | — |
|
| Total comprehensive income | | 60 |
| 6,674 |
| 8,076 |
| (7,963 | ) | 6,847 |
|
| Attributable to | | | | | | |
| BP shareholders | | 60 |
| 6,674 |
| 7,903 |
| (7,963 | ) | 6,674 |
|
| Non-controlling interests | | — |
| — |
| 173 |
| — |
| 173 |
|
| | | 60 |
| 6,674 |
| 8,076 |
| (7,963 | ) | 6,847 |
|
Statement of comprehensive income continued
|
| | | | | | | | | | | |
| | | | | | | $ million |
|
| | | | | | | 2018 |
|
| | | Issuer |
| Guarantor |
| | | |
| | | BP Exploration (Alaska) Inc. |
| BP p.l.c. |
| Other subsidiaries |
| Eliminations and reclassifications |
| BP group |
|
| Profit (loss) for the year | | 916 |
| 9,383 |
| 10,221 |
| (10,942 | ) | 9,578 |
|
| Other comprehensive income | | | | | | |
| Items that may be reclassified subsequently to profit or loss | | | | | | |
| Currency translation differences | | — |
| (296 | ) | (3,475 | ) | — |
| (3,771 | ) |
| Cash flow hedges (including reclassifications) | | — |
| — |
| (6 | ) | — |
| (6 | ) |
| Costs of hedging (including reclassifications) | | — |
| — |
| (186 | ) | — |
| (186 | ) |
| Share of items relating to equity-accounted entities, net of tax | | — |
| — |
| 417 |
| — |
| 417 |
|
| Income tax relating to items that may be reclassified | | — |
| — |
| 4 |
| — |
| 4 |
|
| | | — |
| (296 | ) | (3,246 | ) | — |
| (3,542 | ) |
| Items that will not be reclassified to profit or loss | |
|
|
|
|
|
|
|
|
|
|
| Remeasurements of the net pension and other post-retirement benefit liability or asset | | — |
| 1,689 |
| 628 |
| — |
| 2,317 |
|
| Cash flow hedges that will subsequently be transferred to the balance sheet | | — |
| — |
| (37 | ) | — |
| (37 | ) |
| Income tax relating to items that will not be reclassified | | — |
| (511 | ) | (207 | ) | — |
| (718 | ) |
| | | — |
| 1,178 |
| 384 |
| — |
| 1,562 |
|
| Other comprehensive income | | — |
| 882 |
| (2,862 | ) | — |
| (1,980 | ) |
| Equity-accounted other comprehensive income of subsidiaries | | — |
| (2,821 | ) | — |
| 2,821 |
| — |
|
| Total comprehensive income | | 916 |
| 7,444 |
| 7,359 |
| (8,121 | ) | 7,598 |
|
| Attributable to | | | | | | |
| BP shareholders | | 916 |
| 7,444 |
| 7,205 |
| (8,121 | ) | 7,444 |
|
| Non-controlling interests | | — |
| — |
| 154 |
| — |
| 154 |
|
| | | 916 |
| 7,444 |
| 7,359 |
| (8,121 | ) | 7,598 |
|
|
| | | |
| BP Annual Report and Form 20-F 2019
| | 225 |
38.Condensed consolidating information on certain US subsidiaries – continued
Statement of comprehensive income continued
|
| | | | | | | | | | | |
| | | | | | | $ million |
|
| | | | | | | 2017 |
|
| | | Issuer |
| Guarantor |
| | | |
| | | BP Exploration (Alaska) Inc. |
| BP p.l.c. |
| Other subsidiaries |
| Eliminations and reclassifications |
| BP group |
|
| Profit (loss) for the year | | 830 |
| 3,398 |
| 3,685 |
| (4,445 | ) | 3,468 |
|
| Other comprehensive income | | | | | | |
| Items that may be reclassified subsequently to profit or loss | | | | | | |
| Currency translation differences | | — |
| 166 |
| 1,820 |
| — |
| 1,986 |
|
| Exchange (gains) losses on translation of foreign operations transferred to gain or loss on sale of businesses and fixed assets | | — |
| — |
| (120 | ) | — |
| (120 | ) |
| Available-for-sale investments marked to market | | — |
| — |
| 14 |
| — |
| 14 |
|
| Cash flow hedges marked to market | | — |
| — |
| 197 |
| — |
| 197 |
|
| Cash flow hedges reclassified to the income statement | | — |
| — |
| 116 |
| — |
| 116 |
|
| Cash flow hedges reclassified to the balance sheet | | — |
| — |
| 112 |
| — |
| 112 |
|
| Share of items relating to equity-accounted entities, net of tax | | — |
| — |
| 564 |
| — |
| 564 |
|
| Income tax relating to items that may be reclassified | | — |
| — |
| (196 | ) | — |
| (196 | ) |
| | | — |
| 166 |
| 2,507 |
| — |
| 2,673 |
|
| Items that will not be reclassified to profit or loss | | | | | | |
| Remeasurements of the net pension and other post-retirement benefit liability or asset | | — |
| 2,984 |
| 662 |
| — |
| 3,646 |
|
| Income tax relating to items that will not be reclassified | | — |
| (1,169 | ) | (134 | ) | — |
| (1,303 | ) |
| | | — |
| 1,815 |
| 528 |
| — |
| 2,343 |
|
| Other comprehensive income | | — |
| 1,981 |
| 3,035 |
| — |
| 5,016 |
|
| Equity-accounted other comprehensive income of subsidiaries | | — |
| 2,983 |
| — |
| (2,983 | ) | — |
|
| Total comprehensive income | | 830 |
| 8,362 |
| 6,720 |
| (7,428 | ) | 8,484 |
|
| Attributable to | | | | | | |
| BP shareholders | | 830 |
| 8,362 |
| 6,589 |
| (7,428 | ) | 8,353 |
|
| Non-controlling interests | | — |
| — |
| 131 |
| — |
| 131 |
|
| | | 830 |
| 8,362 |
| 6,720 |
| (7,428 | ) | 8,484 |
|
|
| | | |
226 | | BP Annual Report and Form 20-F 2019
| |
38.Condensed consolidating information on certain US subsidiaries – continued
Balance sheet
|
| | | | | | | | | | | |
| | | | | | | $ million |
|
| | | | | | | 2019 |
|
| | | Issuer |
| Guarantor |
| | | |
| | | BP Exploration (Alaska) Inc. |
| BP p.l.c. |
| Other subsidiaries |
| Eliminations and reclassifications |
| BP group |
|
| Non-current assets | | | | | | |
| Property, plant and equipment | | — |
| — |
| 132,642 |
| — |
| 132,642 |
|
| Goodwill | | — |
| — |
| 11,868 |
| — |
| 11,868 |
|
| Intangible assets | | — |
| — |
| 15,539 |
| — |
| 15,539 |
|
| Investments in joint ventures | | — |
| — |
| 9,991 |
| — |
| 9,991 |
|
| Investments in associates | | — |
| 2 |
| 20,332 |
| — |
| 20,334 |
|
| Other investments | | — |
| — |
| 1,276 |
| — |
| 1,276 |
|
| Subsidiaries - equity-accounted basis | | — |
| 167,895 |
| — |
| (167,895 | ) | — |
|
| Fixed assets | | — |
| 167,897 |
| 191,648 |
| (167,895 | ) | 191,650 |
|
| Loans | | — |
| — |
| 32,524 |
| (31,894 | ) | 630 |
|
| Trade and other receivables | | — |
| 2,771 |
| 2,147 |
| (2,771 | ) | 2,147 |
|
| Derivative financial instruments | | — |
| — |
| 6,314 |
| — |
| 6,314 |
|
| Prepayments | | — |
| — |
| 781 |
| — |
| 781 |
|
| Deferred tax assets | | — |
| — |
| 4,560 |
| — |
| 4,560 |
|
| Defined benefit pension plan surpluses | | — |
| 6,588 |
| 465 |
| — |
| 7,053 |
|
| | | — |
| 177,256 |
| 238,439 |
| (202,560 | ) | 213,135 |
|
| Current assets | | | | | | |
| Loans | | — |
| — |
| 339 |
| — |
| 339 |
|
| Inventories | | 44 |
| — |
| 20,836 |
| — |
| 20,880 |
|
| Trade and other receivables | | 690 |
| 135 |
| 42,157 |
| (18,540 | ) | 24,442 |
|
| Derivative financial instruments | | — |
| — |
| 4,153 |
| — |
| 4,153 |
|
| Prepayments | | — |
| — |
| 857 |
| — |
| 857 |
|
| Current tax receivable | | 45 |
| — |
| 1,237 |
| — |
| 1,282 |
|
| Other investments | | — |
| — |
| 169 |
| — |
| 169 |
|
| Cash and cash equivalents | | — |
| — |
| 22,472 |
| — |
| 22,472 |
|
| | | 779 |
| 135 |
| 92,220 |
| (18,540 | ) | 74,594 |
|
| Assets classified as held for sale | | 5,023 |
| — |
| 2,442 |
| — |
| 7,465 |
|
| | | 5,802 |
| 135 |
| 94,662 |
| (18,540 | ) | 82,059 |
|
| Total assets | | 5,802 |
| 177,391 |
| 333,101 |
| (221,100 | ) | 295,194 |
|
| Current liabilities | | | | | | |
| Trade and other payables | | 436 |
| 17,986 |
| 46,947 |
| (18,540 | ) | 46,829 |
|
| Derivative financial instruments | | — |
| — |
| 3,261 |
| — |
| 3,261 |
|
| Accruals | | 347 |
| 21 |
| 4,698 |
| — |
| 5,066 |
|
| Lease liabilities | | — |
| — |
| 2,067 |
| — |
| 2,067 |
|
| Finance debt | | — |
| — |
| 10,487 |
| — |
| 10,487 |
|
| Current tax payable | | — |
| — |
| 2,039 |
| — |
| 2,039 |
|
| Provisions | | — |
| — |
| 2,453 |
| — |
| 2,453 |
|
| | | 783 |
| 18,007 |
| 71,952 |
| (18,540 | ) | 72,202 |
|
| Liabilities directly associated with assets classified as held for sale | | 706 |
| — |
| 687 |
| — |
| 1,393 |
|
| | | 1,489 |
| 18,007 |
| 72,639 |
| (18,540 | ) | 73,595 |
|
| Non-current liabilities | | | | | | |
| Other payables | | — |
| 31,927 |
| 15,364 |
| (34,665 | ) | 12,626 |
|
| Derivative financial instruments | | — |
| — |
| 5,537 |
| — |
| 5,537 |
|
| Accruals | | — |
| — |
| 996 |
| — |
| 996 |
|
| Lease liabilities | | — |
| — |
| 7,655 |
| — |
| 7,655 |
|
| Finance debt | | — |
| — |
| 57,237 |
| — |
| 57,237 |
|
| Deferred tax liabilities | | 456 |
| 2,293 |
| 7,001 |
| — |
| 9,750 |
|
| Provisions | | 114 |
| — |
| 18,384 |
| — |
| 18,498 |
|
| Defined benefit pension plan and other post-retirement benefit plan deficits | | — |
| 202 |
| 8,390 |
| — |
| 8,592 |
|
| | | 570 |
| 34,422 |
| 120,564 |
| (34,665 | ) | 120,891 |
|
| Total liabilities | | 2,059 |
| 52,429 |
| 193,203 |
| (53,205 | ) | 194,486 |
|
| Net assets | | 3,743 |
| 124,962 |
| 139,898 |
| (167,895 | ) | 100,708 |
|
| Equity | | | | | | |
| BP shareholders’ equity | | 3,743 |
| 124,962 |
| 137,602 |
| (167,895 | ) | 98,412 |
|
| Non-controlling interests | | — |
| — |
| 2,296 |
| — |
| 2,296 |
|
| | | 3,743 |
| 124,962 |
| 139,898 |
| (167,895 | ) | 100,708 |
|
|
| | | |
| BP Annual Report and Form 20-F 2019
| | 227 |
38.Condensed consolidating information on certain US subsidiaries – continued
Balance sheetcontinued
|
| | | | | | | | | | | |
| | | | | | | $ million |
|
| | | | | | | 2018 |
|
| | | Issuer |
| Guarantor |
| | | |
| | | BP Exploration (Alaska) Inc. |
| BP p.l.c. |
| Other subsidiaries |
| Eliminations and reclassifications |
| BP group |
|
| Non-current assets | | | | | | |
| Property, plant and equipment | | 4,445 |
| — |
| 130,816 |
| — |
| 135,261 |
|
| Goodwill | | — |
| — |
| 12,204 |
| — |
| 12,204 |
|
| Intangible assets | | 598 |
| — |
| 16,686 |
| — |
| 17,284 |
|
| Investments in joint ventures | | — |
| — |
| 8,647 |
| — |
| 8,647 |
|
| Investments in associates | | — |
| 2 |
| 17,671 |
| — |
| 17,673 |
|
| Other investments | | — |
| — |
| 1,341 |
| — |
| 1,341 |
|
| Subsidiaries - equity-accounted basis | | — |
| 166,311 |
| — |
| (166,311 | ) | — |
|
| Fixed assets | | 5,043 |
| 166,313 |
| 187,365 |
| (166,311 | ) | 192,410 |
|
| Loans | | — |
| — |
| 32,402 |
| (31,765 | ) | 637 |
|
| Trade and other receivables | | — |
| 2,600 |
| 1,834 |
| (2,600 | ) | 1,834 |
|
| Derivative financial instruments | | — |
| — |
| 5,145 |
| — |
| 5,145 |
|
| Prepayments | | — |
| — |
| 1,179 |
| — |
| 1,179 |
|
| Deferred tax assets | | — |
| — |
| 3,706 |
| — |
| 3,706 |
|
| Defined benefit pension plan surpluses | | — |
| 5,473 |
| 482 |
| — |
| 5,955 |
|
| | | 5,043 |
| 174,386 |
| 232,113 |
| (200,676 | ) | 210,866 |
|
| Current assets | | | | | | |
| Loans | | — |
| — |
| 326 |
| — |
| 326 |
|
| Inventories | | 302 |
| — |
| 17,686 |
| — |
| 17,988 |
|
| Trade and other receivables | | 2,536 |
| 151 |
| 38,931 |
| (17,140 | ) | 24,478 |
|
| Derivative financial instruments | | — |
| — |
| 3,846 |
| — |
| 3,846 |
|
| Prepayments | | 7 |
| — |
| 956 |
| — |
| 963 |
|
| Current tax receivable | | — |
| — |
| 1,019 |
| — |
| 1,019 |
|
| Other investments | | — |
| — |
| 222 |
| — |
| 222 |
|
| Cash and cash equivalents | | — |
| 13 |
| 22,455 |
| — |
| 22,468 |
|
| | | 2,845 |
| 164 |
| 85,441 |
| (17,140 | ) | 71,310 |
|
| Total assets | | 7,888 |
| 174,550 |
| 317,554 |
| (217,816 | ) | 282,176 |
|
| Current liabilities | | | | | | |
| Trade and other payables | | 413 |
| 14,634 |
| 48,358 |
| (17,140 | ) | 46,265 |
|
| Derivative financial instruments | | — |
| — |
| 3,308 |
| — |
| 3,308 |
|
| Accruals | | 89 |
| 31 |
| 4,506 |
| — |
| 4,626 |
|
| Lease liabilities | | — |
| — |
| 44 |
| — |
| 44 |
|
| Finance debt | | — |
| — |
| 9,329 |
| — |
| 9,329 |
|
| Current tax payable | | 310 |
| — |
| 1,791 |
| — |
| 2,101 |
|
| Provisions | | 1 |
| — |
| 2,563 |
| — |
| 2,564 |
|
| | | 813 |
| 14,665 |
| 69,899 |
| (17,140 | ) | 68,237 |
|
| Non-current liabilities | | | | | | |
| Other payables | | — |
| 31,800 |
| 16,395 |
| (34,365 | ) | 13,830 |
|
| Derivative financial instruments | | — |
| — |
| 5,625 |
| — |
| 5,625 |
|
| Accruals | | — |
| — |
| 575 |
| — |
| 575 |
|
| Lease liabilities | | — |
| — |
| 623 |
| — |
| 623 |
|
| Finance debt | | — |
| — |
| 55,803 |
| — |
| 55,803 |
|
| Deferred tax liabilities | | 586 |
| 1,907 |
| 7,319 |
| — |
| 9,812 |
|
| Provisions | | 670 |
| — |
| 17,062 |
| — |
| 17,732 |
|
| Defined benefit pension plan and other post-retirement benefit plan deficits | | — |
| 184 |
| 8,207 |
| — |
| 8,391 |
|
| | | 1,256 |
| 33,891 |
| 111,609 |
| (34,365 | ) | 112,391 |
|
| Total liabilities | | 2,069 |
| 48,556 |
| 181,508 |
| (51,505 | ) | 180,628 |
|
| Net assets | | 5,819 |
| 125,994 |
| 136,046 |
| (166,311 | ) | 101,548 |
|
| Equity | | | | | | |
| BP shareholders’ equity | | 5,819 |
| 125,994 |
| 133,942 |
| (166,311 | ) | 99,444 |
|
| Non-controlling interests | | — |
| — |
| 2,104 |
| — |
| 2,104 |
|
| | | 5,819 |
| 125,994 |
| 136,046 |
| (166,311 | ) | 101,548 |
|
|
| | | |
228 | | BP Annual Report and Form 20-F 2019
| |
38.Condensed consolidating information on certain US subsidiaries – continued
Cash flow statement
|
| | | | | | | | | | | |
| | | | | | | $ million |
|
| | | | | | | 2019 |
|
| | | Issuer |
| Guarantor |
| | | |
| | | BP Exploration (Alaska) Inc. |
| BP p.l.c. |
| Other subsidiaries |
| Eliminations and reclassifications |
| BP group |
|
| Operating activities | | | | | | |
| Profit (loss) before taxation | | 20 |
| 4,082 |
| 9,968 |
| (5,916 | ) | 8,154 |
|
| Adjustments to reconcile profit (loss) before taxation to net cash provided by operating activities | | | | | | |
| Exploration expenditure written off | | — |
| — |
| 631 |
| — |
| 631 |
|
| Depreciation, depletion and amortization | | 169 |
| — |
| 17,611 |
| — |
| 17,780 |
|
| Impairment and (gain) loss on sale of businesses and fixed assets | | 743 |
| — |
| 7,139 |
| — |
| 7,882 |
|
| Earnings from joint ventures and associates | | — |
| — |
| (3,257 | ) | — |
| (3,257 | ) |
| Dividends received from joint ventures and associates | | — |
| — |
| 1,962 |
| — |
| 1,962 |
|
| Equity accounted income of subsidiaries - after interest and tax | | — |
| (5,916 | ) | — |
| 5,916 |
| — |
|
| Dividends received from subsidiaries | | — |
| 6,360 |
| — |
| (6,360 | ) | — |
|
| Interest receivable | | (1 | ) | — |
| (2,228 | ) | 1,788 |
| (441 | ) |
| Interest received | | 1 |
| 12 |
| 2,191 |
| (1,788 | ) | 416 |
|
| Finance costs | | 17 |
| — |
| 5,260 |
| (1,788 | ) | 3,489 |
|
| Interest paid | | (6 | ) | — |
| (4,652 | ) | 1,788 |
| (2,870 | ) |
| Net finance expense relating to pensions and other post-retirement benefits | | — |
| (153 | ) | 216 |
| — |
| 63 |
|
| Share-based payments | | — |
| 739 |
| (9 | ) | — |
| 730 |
|
| Net operating charge for pensions and other post-retirement benefits, less contributions and benefit payments for unfunded plans | | — |
| (10 | ) | (228 | ) | — |
| (238 | ) |
| Net charge for provisions, less payments | | 21 |
| — |
| (197 | ) | — |
| (176 | ) |
| (Increase) decrease in inventories | | (31 | ) | — |
| (3,375 | ) | — |
| (3,406 | ) |
| (Increase) decrease in other current and non-current assets | | (132 | ) | (155 | ) | (2,048 | ) | — |
| (2,335 | ) |
| Increase (decrease) in other current and non-current liabilities | | 1,954 |
| 3,469 |
| (2,600 | ) | — |
| 2,823 |
|
| Income taxes paid | | (444 | ) | (1 | ) | (4,992 | ) | — |
| (5,437 | ) |
| Net cash provided by (used in) operating activities | | 2,311 |
| 8,427 |
| 21,392 |
| (6,360 | ) | 25,770 |
|
| Investing activities | | | | | | |
| Expenditure on property, plant and equipment, intangible and other assets | | (173 | ) | — |
| (15,245 | ) | — |
| (15,418 | ) |
| Acquisitions, net of cash acquired | | — |
| — |
| (3,562 | ) | — |
| (3,562 | ) |
| Investment in joint ventures | | — |
| — |
| (137 | ) | — |
| (137 | ) |
| Investment in associates | | — |
| — |
| (304 | ) | — |
| (304 | ) |
| Total cash capital expenditure | | (173 | ) | — |
| (19,248 | ) | — |
| (19,421 | ) |
| Proceeds from disposals of fixed assets | | 19 |
| — |
| 481 |
| — |
| 500 |
|
| Proceeds from disposals of businesses, net of cash disposed | | — |
| — |
| 1,701 |
| — |
| 1,701 |
|
| Proceeds from loan repayments | | 21 |
| — |
| 225 |
| — |
| 246 |
|
| Net cash provided by (used in) investing activities | | (133 | ) | — |
| (16,841 | ) | — |
| (16,974 | ) |
| Financing activities | | | | | | |
| Repurchase of shares | | — |
| (1,511 | ) | — |
| — |
| (1,511 | ) |
| Lease liability payments | | (46 | ) | — |
| (2,326 | ) | — |
| (2,372 | ) |
| Proceeds from long-term financing | | — |
| — |
| 8,597 |
| — |
| 8,597 |
|
| Repayments of long-term financing | | — |
| — |
| (7,118 | ) | — |
| (7,118 | ) |
| Net increase (decrease) in short-term debt | | — |
| — |
| 180 |
| — |
| 180 |
|
| Net increase (decrease) in non-controlling interests | | — |
| — |
| 566 |
| — |
| 566 |
|
| Dividends paid | | | | | | |
| BP shareholders | | (2,132 | ) | (6,929 | ) | (4,245 | ) | 6,360 |
| (6,946 | ) |
| Non-controlling interests | | — |
| — |
| (213 | ) | — |
| (213 | ) |
| Net cash provided by (used in) financing activities | | (2,178 | ) | (8,440 | ) | (4,559 | ) | 6,360 |
| (8,817 | ) |
| Currency translation differences relating to cash and cash equivalents | | — |
| — |
| 25 |
| — |
| 25 |
|
| Increase (decrease) in cash and cash equivalents | | — |
| (13 | ) | 17 |
| — |
| 4 |
|
| Cash and cash equivalents at beginning of year | | — |
| 13 |
| 22,455 |
| — |
| 22,468 |
|
| Cash and cash equivalents at end of year | | — |
| — |
| 22,472 |
| — |
| 22,472 |
|
|
| | | |
| BP Annual Report and Form 20-F 2019
| | 229 |
38.Condensed consolidating information on certain US subsidiaries – continued
Cash flow statementcontinued
|
| | | | | | | | | | | |
| | | | | | | $ million |
|
| | | | | | | 2018 |
|
| | | Issuer |
| Guarantor |
| | | |
| | | BP Exploration (Alaska) Inc. |
| BP p.l.c. |
| Other subsidiaries |
| Eliminations and reclassifications |
| BP group |
|
| Operating activities | | | | | | |
| Profit (loss) before taxation | | 1,080 |
| 9,442 |
| 17,143 |
| (10,942 | ) | 16,723 |
|
| Adjustments to reconcile profit (loss) before taxation to net cash provided by operating activities | | | | | | |
| Exploration expenditure written off | | — |
| — |
| 1,085 |
| — |
| 1,085 |
|
| Depreciation, depletion and amortization | | 377 |
| — |
| 15,080 |
| — |
| 15,457 |
|
| Impairment and (gain) loss on sale of businesses and fixed assets | | 66 |
| — |
| 338 |
| — |
| 404 |
|
| Earnings from joint ventures and associates | | — |
| — |
| (3,753 | ) | — |
| (3,753 | ) |
| Dividends received from joint ventures and associates | | — |
| — |
| 1,535 |
| — |
| 1,535 |
|
| Equity accounted income of subsidiaries - after interest and tax | | — |
| (10,942 | ) | — |
| 10,942 |
| — |
|
| Dividends received from subsidiaries | | — |
| 3,490 |
| — |
| (3,490 | ) | — |
|
| Interest receivable | | (42 | ) | (215 | ) | (1,776 | ) | 1,565 |
| (468 | ) |
| Interest received | | 42 |
| 215 |
| 1,656 |
| (1,565 | ) | 348 |
|
| Finance costs | | 8 |
| 1,326 |
| 2,759 |
| (1,565 | ) | 2,528 |
|
| Interest paid | | (8 | ) | (1,326 | ) | (2,159 | ) | 1,565 |
| (1,928 | ) |
| Net finance expense relating to pensions and other post-retirement benefits | | — |
| (95 | ) | 222 |
| — |
| 127 |
|
| Share-based payments | | — |
| 671 |
| 19 |
| — |
| 690 |
|
| Net operating charge for pensions and other post-retirement benefits, less contributions and benefit payments for unfunded plans | | — |
| (183 | ) | (203 | ) | — |
| (386 | ) |
| Net charge for provisions, less payments | | 33 |
| — |
| 953 |
| — |
| 986 |
|
| (Increase) decrease in inventories | | (62 | ) | — |
| 734 |
| — |
| 672 |
|
| (Increase) decrease in other current and non-current assets | | (72 | ) | 165 |
| (951 | ) | (2,000 | ) | (2,858 | ) |
| Increase (decrease) in other current and non-current liabilities | | (491 | ) | 4,509 |
| (6,595 | ) | — |
| (2,577 | ) |
| Income taxes paid | | (133 | ) | — |
| (5,579 | ) | — |
| (5,712 | ) |
| Net cash provided by operating activities | | 798 |
| 7,057 |
| 20,508 |
| (5,490 | ) | 22,873 |
|
| Investing activities | | | | | | |
| Expenditure on property, plant and equipment, intangible and other assets | | (273 | ) | — |
| (16,434 | ) | — |
| (16,707 | ) |
| Acquisitions, net of cash acquired | | — |
| — |
| (6,986 | ) | — |
| (6,986 | ) |
| Investment in joint ventures | | — |
| — |
| (382 | ) | — |
| (382 | ) |
| Investment in associates | | — |
| — |
| (1,013 | ) | — |
| (1,013 | ) |
| Total cash capital expenditure | | (273 | ) | — |
| (24,815 | ) | — |
| (25,088 | ) |
| Proceeds from disposals of fixed assets | | — |
| — |
| 940 |
| — |
| 940 |
|
| Proceeds from disposals of businesses, net of cash disposed | | 1,475 |
| — |
| 436 |
| — |
| 1,911 |
|
| Proceeds from loan repayments | | — |
| — |
| 666 |
| — |
| 666 |
|
| Net cash provided by (used in) investing activities | | 1,202 |
| — |
| (22,773 | ) | — |
| (21,571 | ) |
| Financing activities | | | | | | |
| Repurchase of shares | | — |
| (355 | ) | — |
| — |
| (355 | ) |
| Lease liability payments | | — |
| — |
| (35 | ) | — |
| (35 | ) |
| Proceeds from long-term financing | | — |
| — |
| 9,038 |
| — |
| 9,038 |
|
| Repayments of long-term financing | | — |
| — |
| (7,175 | ) | — |
| (7,175 | ) |
| Net increase (decrease) in short-term debt | | — |
| — |
| 1,317 |
| — |
| 1,317 |
|
| Dividends paid | | | | | | |
| BP shareholders | | (2,000 | ) | (6,699 | ) | (3,490 | ) | 5,490 |
| (6,699 | ) |
| Non-controlling interests | | — |
| — |
| (170 | ) | — |
| (170 | ) |
| Net cash provided by (used in) financing activities | | (2,000 | ) | (7,054 | ) | (515 | ) | 5,490 |
| (4,079 | ) |
| Currency translation differences relating to cash and cash equivalents | | — |
| — |
| (330 | ) | — |
| (330 | ) |
| Increase (decrease) in cash and cash equivalents | | — |
| 3 |
| (3,110 | ) | — |
| (3,107 | ) |
| Cash and cash equivalents at beginning of year | | — |
| 10 |
| 25,565 |
| — |
| 25,575 |
|
| Cash and cash equivalents at end of year | | — |
| 13 |
| 22,455 |
| — |
| 22,468 |
|
|
| | | |
| 230 | | BPbp Annual Report and Form 20-F 2019
2020 | | |
38.Condensed consolidating information on certain US subsidiaries – continued
Cash flow statementcontinued
|
| | | | | | | | | | | |
| | | | | | | $ million |
|
| | | | | | | 2017 |
|
| | | Issuer |
| Guarantor |
| | | |
| | | BP Exploration (Alaska) Inc. |
| BP p.l.c. |
| Other subsidiaries |
| Eliminations and reclassifications |
| BP group |
|
| Operating activities | | | | | | |
| Profit (loss) before taxation | | 438 |
| 3,387 |
| 7,800 |
| (4,445 | ) | 7,180 |
|
| Adjustments to reconcile profit (loss) before taxation to net cash provided by operating activities | | | | | | |
| Exploration expenditure written off | | — |
| — |
| 1,603 |
| — |
| 1,603 |
|
| Depreciation, depletion and amortization | | 735 |
| — |
| 14,849 |
| — |
| 15,584 |
|
| Impairment and (gain) loss on sale of businesses and fixed assets | | (71 | ) | (9 | ) | 77 |
| 9 |
| 6 |
|
| Earnings from joint ventures and associates | | — |
| — |
| (2,507 | ) | — |
| (2,507 | ) |
| Dividends received from joint ventures and associates | | — |
| — |
| 1,253 |
| — |
| 1,253 |
|
| Equity accounted income of subsidiaries - after interest and tax | | — |
| (4,436 | ) | — |
| 4,436 |
| — |
|
| Dividends received from (paid to) subsidiaries | | — |
| 3,183 |
| — |
| (3,183 | ) | — |
|
| Interest receivable | | (11 | ) | (220 | ) | (1,117 | ) | 1,044 |
| (304 | ) |
| Interest received | | 11 |
| 220 |
| 1,188 |
| (1,044 | ) | 375 |
|
| Finance costs | | 6 |
| 826 |
| 2,286 |
| (1,044 | ) | 2,074 |
|
| Interest paid | | (6 | ) | (826 | ) | (1,784 | ) | 1,044 |
| (1,572 | ) |
| Net finance expense relating to pensions and other post-retirement benefits | | — |
| (15 | ) | 235 |
| — |
| 220 |
|
| Share-based payments | | — |
| 595 |
| 66 |
| — |
| 661 |
|
| Net operating charge for pensions and other post-retirement benefits, less contributions and benefit payments for unfunded plans | | — |
| (145 | ) | (249 | ) | — |
| (394 | ) |
| Net charge for provisions, less payments | | (128 | ) | — |
| 2,234 |
| — |
| 2,106 |
|
| (Increase) decrease in inventories | | (25 | ) | — |
| (823 | ) | — |
| (848 | ) |
| (Increase) decrease in other current and non-current assets | | 108 |
| 522 |
| (5,478 | ) | — |
| (4,848 | ) |
| Increase (decrease) in other current and non-current liabilities | | (830 | ) | 3,374 |
| (200 | ) | — |
| 2,344 |
|
| Income taxes paid | | — |
| — |
| (4,002 | ) | — |
| (4,002 | ) |
| Net cash provided by operating activities | | 227 |
| 6,456 |
| 15,431 |
| (3,183 | ) | 18,931 |
|
| Investing activities | | | | | | |
| Expenditure on property, plant and equipment, intangible and other assets | | (321 | ) | — |
| (16,241 | ) | — |
| (16,562 | ) |
| Acquisitions, net of cash acquired | | — |
| — |
| (327 | ) | — |
| (327 | ) |
| Investment in joint ventures | | — |
| — |
| (50 | ) | — |
| (50 | ) |
| Investment in associates | | — |
| — |
| (901 | ) | — |
| (901 | ) |
| Total cash capital expenditure | | (321 | ) | — |
| (17,519 | ) | — |
| (17,840 | ) |
| Proceeds from disposals of fixed assets | | 94 |
| — |
| 2,842 |
| — |
| 2,936 |
|
| Proceeds from disposals of businesses, net of cash disposed | | — |
| — |
| 478 |
| — |
| 478 |
|
| Proceeds from loan repayments | | — |
| — |
| 349 |
| — |
| 349 |
|
| Net cash provided by (used in) investing activities | | (227 | ) | — |
| (13,850 | ) | — |
| (14,077 | ) |
| Financing activities | | | | | | |
| Net issue (repurchase) of shares | | — |
| (343 | ) | — |
| — |
| (343 | ) |
| Lease liability payments | | — |
| — |
| (45 | ) | — |
| (45 | ) |
| Proceeds from long-term financing | | — |
| — |
| 8,712 |
| — |
| 8,712 |
|
| Repayments of long-term financing | | — |
| — |
| (6,231 | ) | — |
| (6,231 | ) |
| Net increase (decrease) in short-term debt | | — |
| — |
| (158 | ) | — |
| (158 | ) |
| Net increase (decrease) in non-controlling interests | | — |
| — |
| 1,063 |
| — |
| 1,063 |
|
| Dividends paid | | | | | | |
| BP shareholders | | — |
| (6,153 | ) | (3,183 | ) | 3,183 |
| (6,153 | ) |
| Non-controlling interests | | — |
| — |
| (141 | ) | — |
| (141 | ) |
| Net cash provided by (used in) financing activities | | — |
| (6,496 | ) | 17 |
| 3,183 |
| (3,296 | ) |
| Currency translation differences relating to cash and cash equivalents | | — |
| — |
| 544 |
| — |
| 544 |
|
| Increase (decrease) in cash and cash equivalents | | — |
| (40 | ) | 2,142 |
| — |
| 2,102 |
|
| Cash and cash equivalents at beginning of year | | — |
| 50 |
| 23,434 |
| — |
| 23,484 |
|
| Cash and cash equivalents at end of year | | — |
| 10 |
| 25,576 |
| — |
| 25,586 |
|
|
| | | |
|
BP Annual Report and Form 20-F 2019
| | 231Financial statements |
Supplementary information on oil and natural gas (unaudited)
The regional analysis presented below is on a continent basis, with separate disclosure for countries that contain 15% or more of the total proved reserves (for subsidiaries plus equity-accounted entities), in accordance with SEC and FASB requirements.
Oil and gas reserves – certain definitions
Unless the context indicates otherwise, the following terms have the meanings shown below:
Proved oil and gas reserves
Proved oil and gas reserves are those quantities of oil and gas, which, by analysis of geoscience and engineering data, can be estimated with reasonable certainty to be economically producible – from a given date forward, from known reservoirs, and under existing economic conditions, operating methods, and government regulations – prior to the time at which contracts providing the right to operate expire, unless evidence indicates that renewal is reasonably certain, regardless of whether deterministic or probabilistic methods are used for the estimation. The project to extract the hydrocarbons must have commenced or the operator must be reasonably certain that it will commence the project within a reasonable time.
| |
(i) | The area of the reservoir considered as proved includes: |
(i)The area of the reservoir considered as proved includes:
(A) The area identified by drilling and limited by fluid contacts, if any; and
(B) Adjacent undrilled portions of the reservoir that can, with reasonable certainty, be judged to be continuous with it and to contain economically producible oil or gas on the basis of available geoscience and engineering data.
| |
(ii) | In the absence of data on fluid contacts, proved quantities in a reservoir are limited by the lowest known hydrocarbons (LKH) as seen in a well penetration unless geoscience, engineering, or performance data and reliable technology establishes a lower contact with reasonable certainty. |
| |
(iii) | Where direct observation from well penetrations has defined a highest known oil (HKO) elevation and the potential exists for an associated gas cap, proved oil reserves may be assigned in the structurally higher portions of the reservoir only if geoscience, engineering, or performance data and reliable technology establish the higher contact with reasonable certainty. |
| |
(iv) | Reserves which can be produced economically through application of improved recovery techniques (including, but not limited to, fluid injection) are included in the proved classification when: |
(ii)In the absence of data on fluid contacts, proved quantities in a reservoir are limited by the lowest known hydrocarbons (LKH) as seen in a well penetration unless geoscience, engineering, or performance data and reliable technology establishes a lower contact with reasonable certainty.
(iii)Where direct observation from well penetrations has defined a highest known oil (HKO) elevation and the potential exists for an associated gas cap, proved oil reserves may be assigned in the structurally higher portions of the reservoir only if geoscience, engineering, or performance data and reliable technology establish the higher contact with reasonable certainty.
(iv)Reserves which can be produced economically through application of improved recovery techniques (including, but not limited to, fluid injection) are included in the proved classification when:
(A) Successful testing by a pilot project in an area of the reservoir with properties no more favourable than in the reservoir as a whole, the operation of an installed programme in the reservoir or an analogous reservoir, or other evidence using reliable technology establishes the reasonable certainty of the engineering analysis on which the project or programme was based; and
(B) The project has been approved for development by all necessary parties and entities, including governmental entities.
| |
(v) | Existing economic conditions include prices and costs at which economic producibility from a reservoir is to be determined. The price shall be the average price during the 12-month period prior to the ending date of the period covered by the report, determined as an unweighted arithmetic average of the first-day-of-the-month price for each month within such period, unless prices are defined by contractual arrangements, excluding escalations based upon future conditions.(v)Existing economic conditions include prices and costs at which economic producibility from a reservoir is to be determined. The price shall be the average price during the 12-month period prior to the ending date of the period covered by the report, determined as an unweighted arithmetic average of the first-day-of-the-month price for each month within such period, unless prices are defined by contractual arrangements, excluding escalations based upon future conditions. |
Undeveloped oil and gas reserves
Undeveloped oil and gas reserves are reserves of any category that are expected to be recovered from new wells on undrilled acreage, or from existing wells where a relatively major expenditure is required for recompletion.
| |
(i) | Reserves on undrilled acreage shall be limited to those directly offsetting development spacing areas that are reasonably certain of production when drilled, unless evidence using reliable technology exists that establishes reasonable certainty of economic producibility at greater distances. |
| |
(ii) | Undrilled locations can be classified as having undeveloped reserves only if a development plan has been adopted indicating that they are scheduled to be drilled within five years, unless the specific circumstances, justify a longer time. |
| |
(iii) | Under no circumstances shall estimates for undeveloped reserves be attributable to any acreage for which an application of fluid injection or other improved recovery technique is contemplated, unless such techniques have been proved effective by actual projects in the same reservoir or an analogous reservoir, or by other evidence using reliable technology establishing reasonable certainty. |
(i)Reserves on undrilled acreage shall be limited to those directly offsetting development spacing areas that are reasonably certain of production when drilled, unless evidence using reliable technology exists that establishes reasonable certainty of economic producibility at greater distances.
(ii)Undrilled locations can be classified as having undeveloped reserves only if a development plan has been adopted indicating that they are scheduled to be drilled within five years, unless the specific circumstances, justify a longer time.
(iii)Under no circumstances shall estimates for undeveloped reserves be attributable to any acreage for which an application of fluid injection or other improved recovery technique is contemplated, unless such techniques have been proved effective by actual projects in the same reservoir or an analogous reservoir, or by other evidence using reliable technology establishing reasonable certainty.
Developed oil and gas reserves
Developed oil and gas reserves are reserves of any category that can be expected to be recovered:
| |
(i) | Through existing wells with existing equipment and operating methods or in which the cost of the required equipment is relatively minor compared to the cost of a new well; and |
| |
(ii) | Through installed extraction equipment and infrastructure operational at the time of the reserves estimate if the extraction is by means not involving a well. |
(i)Through existing wells with existing equipment and operating methods or in which the cost of the required equipment is relatively minor compared to the cost of a new well; and
(ii)Through installed extraction equipment and infrastructure operational at the time of the reserves estimate if the extraction is by means not involving a well.
For details on BP’sbp’s proved reserves and production compliance and governance processes, see pages 308-313.312-317.
|
| | | | | | | | | | | | | |
232 | | BPbp Annual Report and Form 20-F 2019
2020 | | 231 |
Oil and natural gas exploration and production activities
| | | | | | | | | | | | | | | | | | | | | | | | | | | | | | | | | | | |
| | | | | | | | | | | $ million |
| | | | | | | | | | | 2020 |
| | Europe | North
America | South
America | Africa | Asia | Australasia | Total |
| | UK | Rest of
Europe | US | Rest of
North
America | | | Russia | Rest of
Asia | | |
| Subsidiaries | | | | | | | | | | | |
Capitalized costs at 31 Decembera b | | | | | | | | | |
| Gross capitalized costs | | | | | | | | | | | |
| Proved properties | | 31,729 | | — | | 63,803 | | 3,431 | | 15,526 | | 49,736 | | — | | 44,031 | | 6,409 | | 214,665 | |
| Unproved properties | | 410 | | — | | 3,102 | | 2,644 | | 2,477 | | 3,560 | | — | | 1,584 | | 640 | | 14,417 | |
| | 32,139 | | — | | 66,905 | | 6,075 | | 18,003 | | 53,296 | | — | | 45,615 | | 7,049 | | 229,082 | |
| Accumulated depreciation | | 22,501 | | — | | 37,176 | | 3,852 | | 14,488 | | 42,575 | | — | | 26,246 | | 4,282 | | 151,120 | |
| Net capitalized costs | | 9,638 | | — | | 29,729 | | 2,223 | | 3,515 | | 10,721 | | — | | 19,369 | | 2,767 | | 77,962 | |
| | | | | | | | | | | |
Costs incurred for the year ended 31 Decembera b | | | | | | | | |
| Acquisition of properties | | | | | | | | | | | |
| Proved | | — | | — | | 1 | | — | | — | | — | | — | | — | | — | | 1 | |
| Unproved | | — | | — | | 25 | | 2 | | (1) | | — | | — | | 16 | | — | | 42 | |
| | — | | — | | 26 | | 2 | | (1) | | — | | — | | 16 | | — | | 43 | |
Exploration and appraisal costsc | | 86 | | — | | 233 | | 127 | | 69 | | 168 | | 1 | | 265 | | 43 | | 992 | |
| Development | | 365 | | — | | 2,966 | | 9 | | 451 | | 1,507 | | — | | 2,222 | | 130 | | 7,650 | |
| Total costs | | 451 | | — | | 3,225 | | 138 | | 519 | | 1,675 | | 1 | | 2,503 | | 173 | | 8,685 | |
| | | | | | | | | | | |
Results of operations for the year ended 31 Decembera | | | | | | | | |
Sales and other operating revenuesd | | | | | | | | | | | |
| Third parties | | 36 | | — | | 687 | | 113 | | 813 | | 1,553 | | 2 | | 1,378 | | 610 | | 5,192 | |
| Sales between businesses | | 1,759 | | — | | 6,274 | | — | | 53 | | 1,641 | | — | | 4,805 | | 277 | | 14,809 | |
| | 1,795 | | — | | 6,961 | | 113 | | 866 | | 3,194 | | 2 | | 6,183 | | 887 | | 20,001 | |
| Exploration expenditure | | 93 | | — | | 2,724 | | 2,579 | | 2,185 | | 2,289 | | 1 | | 367 | | 42 | | 10,280 | |
| Production costs | | 636 | | — | | 2,058 | | 102 | | 421 | | 817 | | — | | 875 | | 114 | | 5,023 | |
| Production taxes | | (22) | | — | | 57 | | — | | 140 | | — | | — | | 508 | | 12 | | 695 | |
Other costs (income)e | | (130) | | 1 | | 1,633 | | 301 | | 117 | | 157 | | 44 | | 97 | | 113 | | 2,333 | |
| Depreciation, depletion and amortization | | 1,370 | | — | | 3,655 | | 93 | | 678 | | 2,459 | | 2 | | 1,994 | | 335 | | 10,586 | |
| Net impairments and (gains) losses on sale of businesses and fixed assets | | 2,712 | | 5 | | 1,716 | | 866 | | 2,693 | | 2,042 | | — | | 1,839 | | — | | 11,873 | |
| | 4,659 | | 6 | | 11,843 | | 3,941 | | 6,234 | | 7,764 | | 47 | | 5,680 | | 616 | | 40,790 | |
Profit (loss) before taxationf | | (2,864) | | (6) | | (4,882) | | (3,828) | | (5,368) | | (4,570) | | (45) | | 503 | | 271 | | (20,789) | |
| Allocable taxes | | (1,344) | | — | | (1,125) | | (682) | | (1,802) | | (308) | | 1 | | 1,923 | | 91 | | (3,246) | |
| Results of operations | | (1,520) | | (6) | | (3,757) | | (3,146) | | (3,566) | | (4,262) | | (46) | | (1,420) | | 180 | | (17,543) | |
| | | | | | | | | | | |
| Upstream and Rosneft segments replacement cost profit (loss) before interest and tax | | | | |
| Exploration and production activities – subsidiaries (as above) | | (2,864) | | (6) | | (4,882) | | (3,828) | | (5,368) | | (4,570) | | (45) | | 503 | | 271 | | (20,789) | |
Midstream and other activities – subsidiariesg | | (356) | | 44 | | (302) | | 185 | | 104 | | (14) | | (8) | | (163) | | 8 | | (502) | |
Equity-accounted entitiesh | | — | | 31 | | 17 | | — | | (211) | | (242) | | (224) | | 224 | | — | | (405) | |
| Total replacement cost profit (loss) before interest and tax | | (3,220) | | 69 | | (5,167) | | (3,643) | | (5,475) | | (4,826) | | (277) | | 564 | | 279 | | (21,696) | |
|
| | | | | | | | | | | | | | | | | | | | | |
| | | | | | | | | | | | $ million |
|
| | | | | | | | | | | | 2019 |
|
| | | Europe | North America | South America | Africa | Asia | Australasia | Total |
|
| | | UK |
| Rest of Europe | US |
| Rest of North America |
| | | Russia |
| Rest of Asia |
| | |
| Subsidiaries | | | | | | | | | | | |
Capitalized costs at 31 Decembera b | | | | | | | | | |
| Gross capitalized costs | | | | | | | | | | | |
| Proved properties | | 31,655 |
| — |
| 67,319 |
| 3,421 |
| 15,194 |
| 48,150 |
| — |
| 42,629 |
| 6,300 |
| 214,668 |
|
| Unproved properties | | 425 |
| — |
| 3,106 |
| 2,547 |
| 3,262 |
| 3,495 |
| — |
| 1,865 |
| 606 |
| 15,306 |
|
| | | 32,080 |
| — |
| 70,425 |
| 5,968 |
| 18,456 |
| 51,645 |
| — |
| 44,494 |
| 6,906 |
| 229,974 |
|
| Accumulated depreciation | | 18,481 |
| — |
| 35,379 |
| 409 |
| 9,922 |
| 35,572 |
| — |
| 22,481 |
| 3,924 |
| 126,168 |
|
| Net capitalized costs | | 13,599 |
| — |
| 35,046 |
| 5,559 |
| 8,534 |
| 16,073 |
| — |
| 22,013 |
| 2,982 |
| 103,806 |
|
| | | | | | | | | | | | |
Costs incurred for the year ended 31 Decembera b | | | | | | | | |
| Acquisition of properties | | | | | | | | | | | |
| Proved | | 2 |
| — |
| 5 |
| — |
| — |
| — |
| — |
| 188 |
| — |
| 195 |
|
| Unproved | | 13 |
| — |
| 50 |
| 1 |
| 220 |
| 18 |
| — |
| — |
| — |
| 302 |
|
| | | 15 |
| — |
| 55 |
| 1 |
| 220 |
| 18 |
| — |
| 188 |
| — |
| 497 |
|
Exploration and appraisal costsc | | 128 |
| — |
| 271 |
| 15 |
| 220 |
| 417 |
| 2 |
| 171 |
| 61 |
| 1,285 |
|
| Development | | 717 |
| — |
| 4,047 |
| 33 |
| 737 |
| 2,530 |
| — |
| 2,614 |
| 137 |
| 10,815 |
|
| Total costs | | 860 |
| — |
| 4,373 |
| 49 |
| 1,177 |
| 2,965 |
| 2 |
| 2,973 |
| 198 |
| 12,597 |
|
| | | | | | | | | | | | |
Results of operations for the year ended 31 Decembera | | | | | | | | |
Sales and other operating revenuesd | | | | | | | | | | | |
| Third parties | | 229 |
| — |
| 1,780 |
| 274 |
| 1,620 |
| 2,736 |
| 2 |
| 1,588 |
| 1,142 |
| 9,371 |
|
| Sales between businesses | | 2,345 |
| — |
| 10,785 |
| 1 |
| 142 |
| 2,815 |
| — |
| 7,596 |
| 554 |
| 24,238 |
|
| | | 2,574 |
| — |
| 12,565 |
| 275 |
| 1,762 |
| 5,551 |
| 2 |
| 9,184 |
| 1,696 |
| 33,609 |
|
| Exploration expenditure | | 157 |
| — |
| 233 |
| 13 |
| 124 |
| 222 |
| 2 |
| 187 |
| 26 |
| 964 |
|
| Production costs | | 607 |
| — |
| 2,742 |
| 118 |
| 437 |
| 1,045 |
| — |
| 961 |
| 131 |
| 6,041 |
|
| Production taxes | | (75 | ) | — |
| 315 |
| — |
| 293 |
| — |
| — |
| 951 |
| 63 |
| 1,547 |
|
Other costs (income)e | | (308 | ) | — |
| 2,527 |
| 67 |
| 92 |
| 33 |
| 42 |
| (124 | ) | 153 |
| 2,482 |
|
| Depreciation, depletion and amortization | | 1,383 |
| — |
| 4,456 |
| 118 |
| 1,056 |
| 3,806 |
| 2 |
| 2,384 |
| 297 |
| 13,502 |
|
| Net impairments and (gains) losses on sale of businesses and fixed assets | | 483 |
| (10 | ) | 5,726 |
| (1 | ) | 160 |
| 151 |
| — |
| 1 |
| — |
| 6,510 |
|
| | | 2,247 |
| (10 | ) | 15,999 |
| 315 |
| 2,162 |
| 5,257 |
| 46 |
| 4,360 |
| 670 |
| 31,046 |
|
Profit (loss) before taxationf | | 327 |
| 10 |
| (3,434 | ) | (40 | ) | (400 | ) | 294 |
| (44 | ) | 4,824 |
| 1,026 |
| 2,563 |
|
| Allocable taxes | | (141 | ) | — |
| (776 | ) | (76 | ) | (234 | ) | 593 |
| (8 | ) | 3,078 |
| 392 |
| 2,828 |
|
| Results of operations | | 468 |
| 10 |
| (2,658 | ) | 36 |
| (166 | ) | (299 | ) | (36 | ) | 1,746 |
| 634 |
| (265 | ) |
| | | | | | | | | | | | |
| Upstream and Rosneft segments replacement cost profit (loss) before interest and tax | | | | |
| Exploration and production activities – subsidiaries (as above) | | 327 |
| 10 |
| (3,434 | ) | (40 | ) | (400 | ) | 294 |
| (44 | ) | 4,824 |
| 1,026 |
| 2,563 |
|
Midstream and other activities – subsidiariesg | | 749 |
| (26 | ) | (363 | ) | 442 |
| 194 |
| (19 | ) | 11 |
| 766 |
| 9 |
| 1,763 |
|
Equity-accounted entitiesh | | (6 | ) | 70 |
| 23 |
| — |
| 65 |
| 82 |
| 2,460 |
| 213 |
| — |
| 2,907 |
|
| Total replacement cost profit (loss) before interest and tax | | 1,070 |
| 54 |
| (3,774 | ) | 402 |
| (141 | ) | 357 |
| 2,427 |
| 5,803 |
| 1,035 |
| 7,233 |
|
a These tables contain information relating to oil and natural gas exploration and production activities of subsidiaries, which includes ourbp's share of oil and natural gas exploration and production activities of joint operations. They do not include any costs relating to the Gulf of Mexico oil spill. Amounts relating to the management and ownership of crude oil and natural gas pipelines, LNG liquefaction and transportation operations are excluded. In addition, ourbp's midstream activities of marketing and trading of natural gas, power and NGLs in the US, Canada, UK, Asia and Europe are excluded. The most significant midstream pipeline interests include the Trans-Alaska Pipeline System, the South Caucasus Pipeline, the Baku-Tbilisi-Ceyhan pipeline, the Trans Adriatic Pipeline and the Baku-Tbilisi-Ceyhan pipeline.Trans Anatolian Pipeline. Major LNG activities are located in Trinidad, Indonesia Australia and Angola.Australia.
b Costs of decommissioning are included in capitalized costs at 31 December but are excluded from costs incurred for the year.
c Includes exploration and appraisal drilling expenditures, which are capitalized within intangible assets, and geological and geophysical exploration costs, which are charged to income as incurred.
d Presented net of transportation costs, purchases and sales taxes.
e Includes property taxes and other government take. The UK region includes a $361-million$330-million gain which is offset by corresponding charges primarily in the US region, relating to the group self-insurance programme.
f Excludes the unwinding of the discount on provisions and payables amounting to $439$369 million which is included in finance costs in the group income statement.
g Midstream and other activities excludes inventory holding gains and losses.
h The profits of equity-accounted entities are included after interest and tax.
|
| | | | | | | | | | | | | |
| 232 | BP
| bp Annual Report and Form 20-F 20192020 | | 233 |
Oil and natural gas exploration and production activities – continued
| | | | | | | | | | | | | | | | | | | | | | | | | | | | | | | | | | | |
| | | | | | | | | | | $ million |
| | | | | | | | | | | 2020 |
| | Europe | North
America | South
America | Africa | Asia | Australasia | Total |
| | UK | Rest of
Europe | US | Rest of
North
America | | | Russiaa | Rest of
Asia | | |
| Equity-accounted entities (bp share) | | | | | | | | | |
Capitalized costs at 31 Decemberb c | | | | | | | | | |
| Gross capitalized costs | | | | | | | | | | | |
| Proved properties | | — | | 4,457 | | — | | — | | 10,690 | | — | | 24,963 | | — | | — | | 40,110 | |
| Unproved properties | | — | | 806 | | — | | — | | 108 | | — | | 4,627 | | — | | — | | 5,541 | |
| | — | | 5,263 | | — | | — | | 10,798 | | — | | 29,590 | | — | | — | | 45,651 | |
| Accumulated depreciation | | — | | 1,592 | | — | | — | | 5,490 | | — | | 7,693 | | — | | — | | 14,775 | |
| Net capitalized costs | | — | | 3,671 | | — | | — | | 5,308 | | — | | 21,897 | | — | | — | | 30,876 | |
| | | | | | | | | | | |
Costs incurred for the year ended 31 Decemberb d e | | | | | | | |
Acquisition of propertiesc | | | | | | | | | | | |
| Proved | | — | | — | | — | | — | | — | | — | | 82 | | — | | — | | 82 | |
| Unproved | | — | | — | | — | | — | | — | | — | | 3,714 | | — | | — | | 3,714 | |
| | — | | — | | — | | — | | — | | — | | 3,796 | | — | | — | | 3,796 | |
Exploration and appraisal costsd | | — | | 46 | | — | | — | | 15 | | — | | 315 | | — | | — | | 376 | |
| Development | | — | | 404 | | — | | — | | 393 | | — | | 2,594 | | — | | — | | 3,391 | |
| Total costs | | — | | 450 | | — | | — | | 408 | | — | | 6,705 | | — | | — | | 7,563 | |
| | | | | | | | | | | |
Results of operations for the year ended 31 Decemberb | | | | | | | |
Sales and other operating revenuesf | | | | | | | | | | | |
| Third parties | | — | | 860 | | — | | — | | 1,110 | | — | | — | | — | | — | | 1,970 | |
| Sales between businesses | | — | | — | | — | | — | | — | | — | | 9,344 | | — | | — | | 9,344 | |
| | — | | 860 | | — | | — | | 1,110 | | — | | 9,344 | | — | | — | | 11,314 | |
| Exploration expenditure | | — | | 50 | | — | | — | | — | | — | | 109 | | — | | — | | 159 | |
| Production costs | | — | | 188 | | — | | — | | 486 | | — | | 1,387 | | — | | — | | 2,061 | |
| Production taxes | | — | | — | | — | | — | | 216 | | — | | 4,418 | | — | | — | | 4,634 | |
| Other costs (income) | | — | | 3 | | — | | — | | 5 | | — | | 236 | | — | | — | | 244 | |
| Depreciation, depletion and amortization | | — | | 412 | | — | | — | | 411 | | — | | 1,532 | | — | | — | | 2,355 | |
| Net impairments and losses on sale of businesses and fixed assets | | | 119 | | — | | — | | 108 | | — | | 294 | | — | | — | | 521 | |
| | — | | 772 | | — | | — | | 1,226 | | — | | 7,976 | | — | | — | | 9,974 | |
| Profit (loss) before taxation | | — | | 88 | | — | | — | | (116) | | — | | 1,368 | | — | | — | | 1,340 | |
| Allocable taxes | | — | | 15 | | — | | — | | (41) | | — | | 226 | | — | | — | | 200 | |
| Results of operations | | — | | 73 | | — | | — | | (75) | | — | | 1,142 | | — | | — | | 1,140 | |
| | | | | | | | | | | |
| Upstream and Rosneft segments replacement cost profit (loss) before interest and tax from equity-accounted entities |
| Exploration and production activities – equity-accounted entities after tax (as above) | | — | | 73 | | — | | — | | (75) | | — | | 1,142 | | — | | — | | 1,140 | |
Midstream and other activities after taxg | | — | | (42) | | 17 | | — | | (136) | | (242) | | (1,366) | | 224 | | — | | (1,545) | |
| Total replacement cost profit (loss) after interest and tax | | — | | 31 | | 17 | | — | | (211) | | (242) | | (224) | | 224 | | — | | (405) | |
|
| | | | | | | | | | | | | | | | | | | | | |
| | | | | | | | | | | | $ million |
|
| | | | | | | | | | | | 2019 |
|
| | | Europe | North America | South America | Africa | Asia | Australasia | Total |
|
| | | UK |
| Rest of Europe |
| US |
| Rest of North America |
| | | Russiaa |
| Rest of Asia |
| | |
| Equity-accounted entities (BP share) | | | | | | | | | |
Capitalized costs at 31 Decemberb c | | | | | | | | | |
| Gross capitalized costs | | | | | | | | | | | |
| Proved properties | | — |
| 4,078 |
| — |
| — |
| 10,376 |
| — |
| 29,883 |
| — |
| — |
| 44,337 |
|
| Unproved properties | | — |
| 768 |
| — |
| — |
| 93 |
| — |
| 1,120 |
| — |
| — |
| 1,981 |
|
| | | — |
| 4,846 |
| — |
| — |
| 10,469 |
| — |
| 31,003 |
| — |
| — |
| 46,318 |
|
| Accumulated depreciation | | — |
| 1,046 |
| — |
| — |
| 5,078 |
| — |
| 9,248 |
| — |
| — |
| 15,372 |
|
| Net capitalized costs | | — |
| 3,800 |
| — |
| — |
| 5,391 |
| — |
| 21,755 |
| — |
| — |
| 30,946 |
|
| | | | | | | | | | | | |
Costs incurred for the year ended 31 Decemberb d e | | | | | | | |
Acquisition of propertiesc | | | | | | | | | | | |
| Proved | | — |
| — |
| — |
| — |
| — |
| — |
| — |
| — |
| — |
| — |
|
| Unproved | | — |
| — |
| — |
| — |
| — |
| — |
| 58 |
| — |
| — |
| 58 |
|
| | | — |
| — |
| — |
| — |
| — |
| — |
| 58 |
| — |
| — |
| 58 |
|
Exploration and appraisal costsd | | — |
| 120 |
| — |
| — |
| 19 |
| — |
| 198 |
| — |
| — |
| 337 |
|
| Development | | — |
| 640 |
| — |
| — |
| 675 |
| — |
| 3,076 |
| — |
| — |
| 4,391 |
|
| Total costs | | — |
| 760 |
| — |
| — |
| 694 |
| — |
| 3,332 |
| — |
| — |
| 4,786 |
|
| | | | | | | | | | | | |
Results of operations for the year ended 31 Decemberb | | | | | | | |
Sales and other operating revenuesf | | | | | | | | | | | |
| Third parties | | — |
| 1,002 |
| — |
| — |
| 1,621 |
| — |
| — |
| — |
| — |
| 2,623 |
|
| Sales between businesses | | — |
| — |
| — |
| — |
| — |
| — |
| 15,979 |
| — |
| — |
| 15,979 |
|
| | | — |
| 1,002 |
| — |
| — |
| 1,621 |
| — |
| 15,979 |
| — |
| — |
| 18,602 |
|
| Exploration expenditure | | — |
| 92 |
| — |
| — |
| 43 |
| — |
| 73 |
| — |
| — |
| 208 |
|
| Production costs | | — |
| 216 |
| — |
| — |
| 465 |
| — |
| 1,535 |
| — |
| — |
| 2,216 |
|
| Production taxes | | — |
| — |
| — |
| — |
| 343 |
| — |
| 7,861 |
| — |
| — |
| 8,204 |
|
| Other costs (income) | | — |
| 59 |
| — |
| — |
| 16 |
| — |
| 358 |
| — |
| — |
| 433 |
|
| Depreciation, depletion and amortization | | — |
| 323 |
| — |
| — |
| 414 |
| — |
| 1,773 |
| — |
| — |
| 2,510 |
|
| Net impairments and losses on sale of businesses and fixed assets | | — |
| — |
| — |
| — |
| (42 | ) | — |
| 49 |
| — |
| — |
| 7 |
|
| | | — |
| 690 |
| — |
| — |
| 1,239 |
| — |
| 11,649 |
| — |
| — |
| 13,578 |
|
| Profit (loss) before taxation | | — |
| 312 |
| — |
| — |
| 382 |
| — |
| 4,330 |
| — |
| — |
| 5,024 |
|
| Allocable taxes | | — |
| 229 |
| — |
| — |
| 245 |
| — |
| 848 |
| — |
| — |
| 1,322 |
|
| Results of operations | | — |
| 83 |
| — |
| — |
| 137 |
| — |
| 3,482 |
| — |
| — |
| 3,702 |
|
| | | | | | | | | | | | |
| Upstream and Rosneft segments replacement cost profit (loss) before interest and tax from equity-accounted entities |
| Exploration and production activities – equity-accounted entities after tax (as above) | | — |
| 83 |
| — |
| — |
| 137 |
| — |
| 3,482 |
| — |
| — |
| 3,702 |
|
Midstream and other activities after taxg | | (6 | ) | (13 | ) | 23 |
| — |
| (72 | ) | 82 |
| (1,022 | ) | 213 |
| — |
| (795 | ) |
| Total replacement cost profit (loss) after interest and tax | | (6 | ) | 70 |
| 23 |
| — |
| 65 |
| 82 |
| 2,460 |
| 213 |
| — |
| 2,907 |
|
a Amounts reported for Russia in this table include BP’sbp’s share of Rosneft’s worldwide activities, including insignificant amounts outside Russia. The amounts reported include the corresponding amounts for their equity-accounted entities.
b These tables contain information relating to oil and natural gas exploration and production activities of equity-accounted entities. Amounts relating to the management and ownership of crude oil and natural gas pipelines, LNG liquefaction, and transportation operations as well as downstream activities of Rosneft and Pan American Energy Groupother activities are excluded.
c Costs of decommissioning are included in capitalized costs at 31 December but are excluded from costs incurred for the year.
d Includes exploration and appraisal drilling expenditures, which are capitalized within intangible assets, and geological and geophysical exploration costs, which are charged to income as incurred.
e The amounts shown reflect BP’sbp’s share of equity-accounted entities’ costs incurred, and not the costs incurred by BPbp in acquiring an interest in equity-accounted entities.
f Presented net of sales tax.
g Includes interest and adjustment for non-controlling interests. Excludes inventory holding gains and losses.
|
| | | | | | | | | | | | | |
234 | | BPbp Annual Report and Form 20-F 2019
2020 | | 233 |
Oil and natural gas exploration and production activities – continued
| | | | | | | | | | | | | | | | | | | | | | | | | | | | | | | | | | | |
| | | | | | | | | | | $ million |
| | | | | | | | | | | 2019 |
| | Europe | North
America | South
America | Africa | Asia | Australasia | Total |
| | UK | Rest of
Europe | US | Rest of
North
America | | | Russia | Rest of
Asia | | |
| Subsidiaries | | | | | | | | | | | |
Capitalized costs at 31 Decembera b | | | | | | | | | |
| Gross capitalized costs | | | | | | | | | | | |
| Proved properties | | 31,655 | | — | | 67,319 | | 3,421 | | 15,194 | | 48,150 | | — | | 42,629 | | 6,300 | | 214,668 | |
| Unproved properties | | 425 | | — | | 3,106 | | 2,547 | | 3,262 | | 3,495 | | — | | 1,865 | | 606 | | 15,306 | |
| | 32,080 | | — | | 70,425 | | 5,968 | | 18,456 | | 51,645 | | — | | 44,494 | | 6,906 | | 229,974 | |
| Accumulated depreciation | | 18,481 | | — | | 35,379 | | 409 | | 9,922 | | 35,572 | | — | | 22,481 | | 3,924 | | 126,168 | |
| Net capitalized costs | | 13,599 | | — | | 35,046 | | 5,559 | | 8,534 | | 16,073 | | — | | 22,013 | | 2,982 | | 103,806 | |
| | | | | | | | | | | |
Costs incurred for the year ended 31 Decembera b | | | | | | |
| Acquisition of properties | | | | | | | | | | | |
| Proved | | 2 | | — | | 5 | | — | | — | | — | | — | | 188 | | — | | 195 | |
| Unproved | | 13 | | — | | 50 | | 1 | | 220 | | 18 | | — | | — | | — | | 302 | |
| | 15 | | — | | 55 | | 1 | | 220 | | 18 | | — | | 188 | | — | | 497 | |
Exploration and appraisal costsc | | 128 | | — | | 271 | | 15 | | 220 | | 417 | | 2 | | 171 | | 61 | | 1,285 | |
| Development | | 717 | | — | | 4,047 | | 33 | | 737 | | 2,530 | | — | | 2,614 | | 137 | | 10,815 | |
| Total costs | | 860 | | — | | 4,373 | | 49 | | 1,177 | | 2,965 | | 2 | | 2,973 | | 198 | | 12,597 | |
| | | | | | | | | | | |
Results of operations for the year ended 31 Decembera | | | | | | |
Sales and other operating revenuesd | | | | | | | | | | | |
| Third parties | | 229 | | — | | 1,780 | | 274 | | 1,620 | | 2,736 | | 2 | | 1,588 | | 1,142 | | 9,371 | |
| Sales between businesses | | 2,345 | | — | | 10,785 | | 1 | | 142 | | 2,815 | | — | | 7,596 | | 554 | | 24,238 | |
| | 2,574 | | — | | 12,565 | | 275 | | 1,762 | | 5,551 | | 2 | | 9,184 | | 1,696 | | 33,609 | |
| Exploration expenditure | | 157 | | — | | 233 | | 13 | | 124 | | 222 | | 2 | | 187 | | 26 | | 964 | |
| Production costs | | 607 | | — | | 2,742 | | 118 | | 437 | | 1,045 | | — | | 961 | | 131 | | 6,041 | |
| Production taxes | | (75) | | — | | 315 | | — | | 293 | | — | | — | | 951 | | 63 | | 1,547 | |
Other costs (income)e | | (308) | | — | | 2,527 | | 67 | | 92 | | 33 | | 42 | | (124) | | 153 | | 2,482 | |
| Depreciation, depletion and amortization | | 1,383 | | — | | 4,456 | | 118 | | 1,056 | | 3,806 | | 2 | | 2,384 | | 297 | | 13,502 | |
| Net impairments and (gains) losses on sale of businesses and fixed assets | | 483 | | (10) | | 5,726 | | (1) | | 160 | | 151 | | — | | 1 | | — | | 6,510 | |
| | 2,247 | | (10) | | 15,999 | | 315 | | 2,162 | | 5,257 | | 46 | | 4,360 | | 670 | | 31,046 | |
Profit (loss) before taxationf | | 327 | | 10 | | (3,434) | | (40) | | (400) | | 294 | | (44) | | 4,824 | | 1,026 | | 2,563 | |
| Allocable taxes | | (141) | | — | | (776) | | (76) | | (234) | | 593 | | (8) | | 3,078 | | 392 | | 2,828 | |
| Results of operations | | 468 | | 10 | | (2,658) | | 36 | | (166) | | (299) | | (36) | | 1,746 | | 634 | | (265) | |
| | | | | | | | | | | |
| Upstream and Rosneft segments replacement cost profit (loss) before interest and tax | | | | |
| Exploration and production activities – subsidiaries (as above) | | 327 | | 10 | | (3,434) | | (40) | | (400) | | 294 | | (44) | | 4,824 | | 1,026 | | 2,563 | |
Midstream and other activities – subsidiariesg | | 749 | | (26) | | (363) | | 442 | | 194 | | (19) | | 11 | | 766 | | 9 | | 1,763 | |
Equity-accounted entitiesh | | (6) | | 70 | | 23 | | — | | 65 | | 82 | | 2,460 | | 213 | | — | | 2,907 | |
| Total replacement cost profit (loss) after interest and tax | | 1,070 | | 54 | | (3,774) | | 402 | | (141) | | 357 | | 2,427 | | 5,803 | | 1,035 | | 7,233 | |
|
| | | | | | | | | | | | | | | | | | | | | |
| | | | | | | | | | | | $ million |
|
| | | | | | | | | | | | 2018 |
|
| | | Europe | North America | South America | Africa | Asia | Australasia | Total |
|
| | | UK |
| Rest of Europe |
| US |
| Rest of North America |
| | | Russia |
| Rest of Asia |
| | |
| Subsidiaries | | | | | | | | | | | |
Capitalized costs at 31 Decembera b | | | | | | | | | |
| Gross capitalized costs | | | | | | | | | | | |
| Proved properties | | 29,730 |
| — |
| 89,069 |
| 3,385 |
| 14,269 |
| 51,980 |
| — |
| 38,315 |
| 6,119 |
| 232,867 |
|
| Unproved properties | | 451 |
| — |
| 3,602 |
| 2,667 |
| 2,742 |
| 3,870 |
| — |
| 3,153 |
| 568 |
| 17,053 |
|
| | | 30,181 |
| — |
| 92,671 |
| 6,052 |
| 17,011 |
| 55,850 |
| — |
| 41,468 |
| 6,687 |
| 249,920 |
|
| Accumulated depreciation | | 16,809 |
| — |
| 47,051 |
| 420 |
| 8,517 |
| 38,324 |
| — |
| 20,173 |
| 3,626 |
| 134,920 |
|
| Net capitalized costs | | 13,372 |
| — |
| 45,620 |
| 5,632 |
| 8,494 |
| 17,526 |
| — |
| 21,295 |
| 3,061 |
| 115,000 |
|
| | | | | | | | | | | | |
Costs incurred for the year ended 31 Decembera b | | | | | | |
| Acquisition of properties | | | | | | | | | | | |
| Proved | | 1,933 |
| — |
| 10,650 |
| — |
| — |
| (1 | ) | — |
| 36 |
| — |
| 12,618 |
|
| Unproved | | — |
| — |
| 35 |
| — |
| 100 |
| 50 |
| — |
| (5 | ) | — |
| 180 |
|
| | | 1,933 |
| — |
| 10,685 |
| — |
| 100 |
| 49 |
| — |
| 31 |
| — |
| 12,798 |
|
Exploration and appraisal costsc | | 238 |
| — |
| 216 |
| 139 |
| 245 |
| 283 |
| 5 |
| 148 |
| 24 |
| 1,298 |
|
| Development | | 817 |
| — |
| 3,429 |
| 46 |
| 591 |
| 2,340 |
| — |
| 2,458 |
| 236 |
| 9,917 |
|
| Total costs | | 2,988 |
| — |
| 14,330 |
| 185 |
| 936 |
| 2,672 |
| 5 |
| 2,637 |
| 260 |
| 24,013 |
|
| | | | | | | | | | | | |
Results of operations for the year ended 31 Decembera | | | | | | |
Sales and other operating revenuesd | | | | | | | | | | | |
| Third parties | | 619 |
| — |
| 1,306 |
| 105 |
| 2,074 |
| 3,228 |
| — |
| 1,430 |
| 1,410 |
| 10,172 |
|
| Sales between businesses | | 2,255 |
| — |
| 11,656 |
| 1 |
| 195 |
| 3,928 |
| — |
| 7,793 |
| 665 |
| 26,493 |
|
| | | 2,874 |
| — |
| 12,962 |
| 106 |
| 2,269 |
| 7,156 |
| — |
| 9,223 |
| 2,075 |
| 36,665 |
|
| Exploration expenditure | | 105 |
| — |
| 509 |
| 146 |
| 252 |
| 405 |
| 5 |
| 20 |
| 3 |
| 1,445 |
|
| Production costs | | 646 |
| — |
| 2,729 |
| 120 |
| 430 |
| 1,066 |
| — |
| 951 |
| 138 |
| 6,080 |
|
| Production taxes | | (269 | ) | — |
| 369 |
| — |
| 357 |
| — |
| — |
| 1,010 |
| 69 |
| 1,536 |
|
Other costs (income)e | | (331 | ) | (2 | ) | 2,379 |
| 43 |
| 165 |
| 133 |
| 42 |
| 94 |
| 223 |
| 2,746 |
|
| Depreciation, depletion and amortization | | 1,199 |
| — |
| 3,921 |
| 101 |
| 1,023 |
| 3,635 |
| — |
| 2,165 |
| 298 |
| 12,342 |
|
| Net impairments and (gains) losses on sale of businesses and fixed assets | | (226 | ) | — |
| 203 |
| 10 |
| — |
| (141 | ) | — |
| 21 |
| 136 |
| 3 |
|
| | | 1,124 |
| (2 | ) | 10,110 |
| 420 |
| 2,227 |
| 5,098 |
| 47 |
| 4,261 |
| 867 |
| 24,152 |
|
Profit (loss) before taxationf | | 1,750 |
| 2 |
| 2,852 |
| (314 | ) | 42 |
| 2,058 |
| (47 | ) | 4,962 |
| 1,208 |
| 12,513 |
|
Allocable taxesg | | 446 |
| — |
| 454 |
| (95 | ) | 314 |
| 1,184 |
| 13 |
| 3,509 |
| 508 |
| 6,333 |
|
| Results of operations | | 1,304 |
| 2 |
| 2,398 |
| (219 | ) | (272 | ) | 874 |
| (60 | ) | 1,453 |
| 700 |
| 6,180 |
|
| | | | | | | | | | | | |
| Upstream and Rosneft segments replacement cost profit (loss) before interest and tax | | | | |
| Exploration and production activities – subsidiaries (as above) | | 1,750 |
| 2 |
| 2,852 |
| (314 | ) | 42 |
| 2,058 |
| (47 | ) | 4,962 |
| 1,208 |
| 12,513 |
|
Midstream and other activities – subsidiariesh | | (20 | ) | 265 |
| 188 |
| (111 | ) | 135 |
| (58 | ) | 5 |
| 463 |
| 6 |
| 873 |
|
Equity-accounted entitiesi j | | (2 | ) | 130 |
| 28 |
| — |
| 209 |
| 207 |
| 2,346 |
| 245 |
| — |
| 3,163 |
|
| Total replacement cost profit (loss) before interest and tax | | 1,728 |
| 397 |
| 3,068 |
| (425 | ) | 386 |
| 2,207 |
| 2,304 |
| 5,670 |
| 1,214 |
| 16,549 |
|
a These tables contain information relating to oil and natural gas exploration and production activities of subsidiaries, which includes ourbp's share of oil and natural gas exploration and production activities of joint operations. They do not include any costs relating to the Gulf of Mexico oil spill. Amounts relating to the management and ownership of crude oil and natural gas pipelines, LNG liquefaction and transportation operations are excluded. In addition, ourbp's midstream activities of marketing and trading of natural gas, power and NGLs in the US, Canada, UK, Asia and Europe are excluded. The most significant midstream pipeline interests include the Trans-Alaska Pipeline System, the South Caucasus Pipeline and the Baku-Tbilisi-Ceyhan pipeline. Major LNG activities are located in Trinidad, Indonesia Australia and Angola.Australia.
b Costs of decommissioning are included in capitalized costs at 31 December but are excluded from costs incurred for the year.
c Includes exploration and appraisal drilling expenditures, which are capitalized within intangible assets, and geological and geophysical exploration costs, which are charged to income as incurred.
d Presented net of transportation costs, purchases and sales taxes.
e Includes property taxes and other government take and the fair value gain on embedded derivatives of $17 million.take. The UK region includes a $384-million$361-million gain which is offset by corresponding charges primarily in the US region, relating to the group self-insurance programme.
f Excludes the unwinding of the discount on provisions and payables amounting to $208$439 million which is included in finance costs in the group income statement.
g US region includes the deferred tax impact of the reduction in the US Federal corporate income tax rate from 35% to 21% enacted in December 2017.
h Midstream and other activities excludes inventory holding gains and losses.
ih The profits of equity-accounted entities are included after interest and taxes.tax.
j From 16 December 2017, BP entered into a new 50:50 joint venture Pan American Energy Group (PAEG). Prior to this, Pan American Energy (PAE) was owned 60% by BP and 40% by Bridas Corporation.
|
| | | | | | | | | | | | | |
| 234 | BP
| bp Annual Report and Form 20-F 20192020 | | 235 |
Oil and natural gas exploration and production activities – continued
| | | | | | | | | | | | | | | | | | | | | | | | | | | | | | | | | | | |
| | | $ million |
| | | | | | | | | | | 2019 |
| | Europe | North
America | South
America | Africa | Asia | Australasia | Total |
| | UK | Rest of
Europe | US | Rest of
North
America | | | Russiaa | Rest of
Asia | | |
| Equity-accounted entities (bp share) | | | | | | | | | |
Capitalized costs at 31 Decemberb c | | | | | | | | | |
| Gross capitalized costs | | | | | | | | | | | |
| Proved properties | | — | | 4,078 | | — | | — | | 10,376 | | — | | 28,179 | | — | | — | | 42,633 | |
| Unproved properties | | — | | 768 | | — | | — | | 93 | | — | | 1,097 | | — | | — | | 1,958 | |
| | — | | 4,846 | | — | | — | | 10,469 | | — | | 29,276 | | — | | — | | 44,591 | |
| Accumulated depreciation | | — | | 1,046 | | — | | — | | 5,078 | | — | | 8,477 | | — | | — | | 14,601 | |
| Net capitalized costs | | — | | 3,800 | | — | | — | | 5,391 | | — | | 20,799 | | — | | — | | 29,990 | |
| | | | | | | | | | | |
Costs incurred for the year ended 31 Decemberb d e | | | | | |
Acquisition of propertiesc | | | | | | | | | | | |
| Proved | | — | | — | | — | | — | | — | | — | | — | | — | | — | | — | |
| Unproved | | — | | — | | — | | — | | — | | — | | 58 | | — | | — | | 58 | |
| | — | | — | | — | | — | | — | | — | | 58 | | — | | — | | 58 | |
Exploration and appraisal costsd | | — | | 120 | | — | | — | | 19 | | — | | 177 | | — | | — | | 316 | |
| Development | | — | | 640 | | — | | — | | 675 | | — | | 2,908 | | — | | — | | 4,223 | |
| Total costs | | — | | 760 | | — | | — | | 694 | | — | | 3,143 | | — | | — | | 4,597 | |
| | | | | | | | | | | |
Results of operations for the year ended 31 Decemberb | | | | | |
Sales and other operating revenuesf | | | | | | | | | | | |
| Third parties | | — | | 1,002 | | — | | — | | 1,621 | | — | | — | | — | | — | | 2,623 | |
| Sales between businesses | | — | | — | | — | | — | | — | | — | | 15,012 | | — | | — | | 15,012 | |
| | — | | 1,002 | | — | | — | | 1,621 | | — | | 15,012 | | — | | — | | 17,635 | |
| Exploration expenditure | | — | | 92 | | — | | — | | 43 | | — | | 73 | | — | | — | | 208 | |
| Production costs | | — | | 216 | | — | | — | | 465 | | — | | 1,386 | | — | | — | | 2,067 | |
| Production taxes | | — | | — | | — | | — | | 343 | | — | | 7,413 | | — | | — | | 7,756 | |
| Other costs (income) | | — | | 59 | | — | | — | | 16 | | — | | 346 | | — | | — | | 421 | |
| Depreciation, depletion and amortization | | — | | 323 | | — | | — | | 414 | | — | | 1,657 | | — | | — | | 2,394 | |
| Net impairments and losses on sale of businesses and fixed assets | | — | | — | | — | | — | | (42) | | — | | 46 | | — | | — | | 4 | |
| | — | | 690 | | — | | — | | 1,239 | | — | | 10,921 | | — | | — | | 12,850 | |
| Profit (loss) before taxation | | — | | 312 | | — | | — | | 382 | | — | | 4,091 | | — | | — | | 4,785 | |
| Allocable taxes | | — | | 229 | | — | | — | | 245 | | — | | 811 | | — | | — | | 1,285 | |
| Results of operations | | — | | 83 | | — | | — | | 137 | | — | | 3,280 | | — | | — | | 3,500 | |
| | | | | | | | | | | |
| Upstream and Rosneft segments replacement cost profit (loss) before interest and tax from equity-accounted entities |
| Exploration and production activities – equity-accounted entities after tax (as above) | | — | | 83 | | — | | — | | 137 | | — | | 3,280 | | — | | — | | 3,500 | |
Midstream and other activities after taxg | | (6) | | (13) | | 23 | | — | | (72) | | 82 | | (820) | | 213 | | — | | (593) | |
| Total replacement cost profit (loss) after interest and tax | | (6) | | 70 | | 23 | | — | | 65 | | 82 | | 2,460 | | 213 | | — | | 2,907 | |
|
| | | | | | | | | | | | | | | | | | | | | |
| | | | $ million |
|
| | | | | | | | | | | | 2018 |
|
| | | Europe | North America | South America | Africa | Asia | Australasia | Total |
|
| | | UK |
| Rest of Europe |
| US |
| Rest of North America |
| | | Russiaa |
| Rest of Asia |
| | |
| Equity-accounted entities (BP share) | | | | | | | | | |
Capitalized costs at 31 Decemberb c | | | | | | | | | |
| Gross capitalized costs | | | | | | | | | | | |
| Proved properties | | — |
| 3,439 |
| — |
| — |
| 9,643 |
| — |
| 24,052 |
| 3,646 |
| — |
| 40,780 |
|
| Unproved properties | | — |
| 657 |
| — |
| — |
| 86 |
| — |
| 828 |
| 26 |
| — |
| 1,597 |
|
| | | — |
| 4,096 |
| — |
| — |
| 9,729 |
| — |
| 24,880 |
| 3,672 |
| — |
| 42,377 |
|
| Accumulated depreciation | | — |
| 670 |
| — |
| — |
| 4,665 |
| — |
| 6,749 |
| 3,672 |
| — |
| 15,756 |
|
| Net capitalized costs | | — |
| 3,426 |
| — |
| — |
| 5,064 |
| — |
| 18,131 |
| — |
| — |
| 26,621 |
|
| | | | | | | | | | | | |
Costs incurred for the year ended 31 Decemberb d e | | | | | |
Acquisition of propertiesc | | | | | | | | | | | |
| Proved | | — |
| — |
| — |
| — |
| — |
| — |
| 425 |
| — |
| — |
| 425 |
|
| Unproved | | — |
| 137 |
| — |
| — |
| — |
| — |
| 148 |
| — |
| — |
| 285 |
|
| | | — |
| 137 |
| — |
| — |
| — |
| — |
| 573 |
| — |
| — |
| 710 |
|
Exploration and appraisal costsd | | — |
| 67 |
| — |
| — |
| 25 |
| — |
| 207 |
| — |
| — |
| 299 |
|
| Development | | — |
| 251 |
| — |
| — |
| 575 |
| — |
| 3,255 |
| 212 |
| — |
| 4,293 |
|
| Total costs | | — |
| 455 |
| — |
| — |
| 600 |
| — |
| 4,035 |
| 212 |
| — |
| 5,302 |
|
| | | | | | | | | | | | |
Results of operations for the year ended 31 Decemberb | | | | | |
Sales and other operating revenuesf | | | | | | | | | | | |
| Third parties | | — |
| 1,114 |
| — |
| — |
| 1,792 |
| — |
| — |
| 353 |
| — |
| 3,259 |
|
| Sales between businesses | | — |
| — |
| — |
| — |
| — |
| — |
| 15,901 |
| — |
| — |
| 15,901 |
|
| | | — |
| 1,114 |
| — |
| — |
| 1,792 |
| — |
| 15,901 |
| 353 |
| — |
| 19,160 |
|
| Exploration expenditure | | — |
| 89 |
| — |
| — |
| 7 |
| — |
| 112 |
| — |
| — |
| 208 |
|
| Production costs | | — |
| 207 |
| — |
| — |
| 438 |
| — |
| 1,487 |
| 39 |
| — |
| 2,171 |
|
| Production taxes | | — |
| — |
| — |
| — |
| 361 |
| — |
| 7,634 |
| 94 |
| — |
| 8,089 |
|
| Other costs (income) | | — |
| 21 |
| — |
| — |
| 55 |
| — |
| 638 |
| — |
| — |
| 714 |
|
| Depreciation, depletion and amortization | | — |
| 290 |
| — |
| — |
| 416 |
| — |
| 1,627 |
| 212 |
| — |
| 2,545 |
|
| Net impairments and losses on sale of businesses and fixed assets | | — |
| 6 |
| — |
| — |
| — |
| — |
| 47 |
| 1 |
| — |
| 54 |
|
| | | — |
| 613 |
| — |
| — |
| 1,277 |
| — |
| 11,545 |
| 346 |
| — |
| 13,781 |
|
| Profit (loss) before taxation | | — |
| 501 |
| — |
| — |
| 515 |
| — |
| 4,356 |
| 7 |
| — |
| 5,379 |
|
| Allocable taxes | | — |
| 350 |
| — |
| — |
| 321 |
| — |
| 849 |
| — |
| — |
| 1,520 |
|
Results of operationsg | | — |
| 151 |
| — |
| — |
| 194 |
| — |
| 3,507 |
| 7 |
| — |
| 3,859 |
|
| | | | | | | | | | | | |
| Upstream and Rosneft segments replacement cost profit (loss) before interest and tax from equity-accounted entities |
| Exploration and production activities – equity-accounted entities after tax (as above) | | — |
| 151 |
| — |
| — |
| 194 |
| — |
| 3,507 |
| 7 |
| — |
| 3,859 |
|
Midstream and other activities after taxh | | (2 | ) | (21 | ) | 28 |
| — |
| 15 |
| 207 |
| (1,161 | ) | 238 |
| — |
| (696 | ) |
| Total replacement cost profit (loss) after interest and tax | | (2 | ) | 130 |
| 28 |
| — |
| 209 |
| 207 |
| 2,346 |
| 245 |
| — |
| 3,163 |
|
a Amounts reported for Russia in this table include BP’sbp’s share of Rosneft’s worldwide activities, including insignificant amounts outside Russia. The amountsAmounts reported includehave been amended to exclude the corresponding amounts for their equity-accounted entities.
b These tables contain information relating to oil and natural gas exploration and production activities of equity-accounted entities. Amounts relating to the management and ownership of crude oil and natural gas pipelines, LNG liquefaction, and transportation operations as well as downstream activities of Rosneft and Pan American Energy Groupother activities are excluded.
c Costs of decommissioning are included in capitalized costs at 31 December but are excluded from costs incurred for the year.
d Includes exploration and appraisal drilling expenditures, which are capitalized within intangible assets, and geological and geophysical exploration costs, which are charged to income as incurred.
e The amounts shown reflect BP’sbp’s share of equity-accounted entities’ costs incurred, and not the costs incurred by BPbp in acquiring an interest in equity-accounted entities.
f Presented net of sales taxes.tax.
g From 16 December 2017, BP entered into a new 50:50 joint venture Pan American Energy Group (PAEG). Prior to this, Pan American Energy (PAE) was owned 60% by BP and 40% by Bridas Corporation.
h Includes interest and adjustment for non-controlling interests. Excludes inventory holding gains and losses.
|
| | | | | | | | | | | | | |
236 | | BPbp Annual Report and Form 20-F 2019
2020 | | 235 |
Oil and natural gas exploration and production activities – continued
| | | | | | | | | | | | | | | | | | | | | | | | | | | | | | | | | | | |
| | | $ million |
| | | | | | | | | | | 2018 |
| | Europe | North
America | South
America | Africa | Asia | Australasia | Total |
| | UK | Rest of
Europe | US | Rest of
North
America | | | Russia | Rest of
Asia | | |
| Subsidiaries | | | | | | | | | | | |
Capitalized costs at 31 Decembera b | | | | | | | | | |
| Gross capitalized costs | | | | | | | | | | | |
| Proved properties | | 29,730 | | — | | 89,069 | | 3,385 | | 14,269 | | 51,980 | | — | | 38,315 | | 6,119 | | 232,867 | |
| Unproved properties | | 451 | | — | | 3,602 | | 2,667 | | 2,742 | | 3,870 | | — | | 3,153 | | 568 | | 17,053 | |
| | 30,181 | | — | | 92,671 | | 6,052 | | 17,011 | | 55,850 | | — | | 41,468 | | 6,687 | | 249,920 | |
| Accumulated depreciation | | 16,809 | | — | | 47,051 | | 420 | | 8,517 | | 38,324 | | — | | 20,173 | | 3,626 | | 134,920 | |
| Net capitalized costs | | 13,372 | | — | | 45,620 | | 5,632 | | 8,494 | | 17,526 | | — | | 21,295 | | 3,061 | | 115,000 | |
| | | | | | | | | | | |
Costs incurred for the year ended 31 Decembera b | | | | | | | |
| Acquisition of properties | | | | | | | | | | | |
| Proved | | 1,933 | | — | | 10,650 | | — | | — | | (1) | | — | | 36 | | — | | 12,618 | |
| Unproved | | — | | — | | 35 | | — | | 100 | | 50 | | — | | (5) | | — | | 180 | |
| | 1,933 | | — | | 10,685 | | — | | 100 | | 49 | | — | | 31 | | — | | 12,798 | |
Exploration and appraisal costsc | | 238 | | — | | 216 | | 139 | | 245 | | 283 | | 5 | | 148 | | 24 | | 1,298 | |
| Development | | 817 | | — | | 3,429 | | 46 | | 591 | | 2,340 | | — | | 2,458 | | 236 | | 9,917 | |
| Total costs | | 2,988 | | — | | 14,330 | | 185 | | 936 | | 2,672 | | 5 | | 2,637 | | 260 | | 24,013 | |
| | | | | | | | | | | |
Results of operations for the year ended 31 Decembera | | | | | |
Sales and other operating revenuesd | | | | | | | | | | | |
| Third parties | | 619 | | — | | 1,306 | | 105 | | 2,074 | | 3,228 | | — | | 1,430 | | 1,410 | | 10,172 | |
| Sales between businesses | | 2,255 | | — | | 11,656 | | 1 | | 195 | | 3,928 | | — | | 7,793 | | 665 | | 26,493 | |
| | 2,874 | | — | | 12,962 | | 106 | | 2,269 | | 7,156 | | — | | 9,223 | | 2,075 | | 36,665 | |
| Exploration expenditure | | 105 | | — | | 509 | | 146 | | 252 | | 405 | | 5 | | 20 | | 3 | | 1,445 | |
| Production costs | | 646 | | — | | 2,729 | | 120 | | 430 | | 1,066 | | — | | 951 | | 138 | | 6,080 | |
| Production taxes | | (269) | | — | | 369 | | — | | 357 | | — | | — | | 1,010 | | 69 | | 1,536 | |
Other costs (income)e | | (331) | | (2) | | 2,379 | | 43 | | 165 | | 133 | | 42 | | 94 | | 223 | | 2,746 | |
| Depreciation, depletion and amortization | | 1,199 | | — | | 3,921 | | 101 | | 1,023 | | 3,635 | | — | | 2,165 | | 298 | | 12,342 | |
| Net impairments and (gains) losses on sale of businesses and fixed assets | | (226) | | — | | 203 | | 10 | | — | | (141) | | — | | 21 | | 136 | | 3 | |
| | 1,124 | | (2) | | 10,110 | | 420 | | 2,227 | | 5,098 | | 47 | | 4,261 | | 867 | | 24,152 | |
Profit (loss) before taxationf | | 1,750 | | 2 | | 2,852 | | (314) | | 42 | | 2,058 | | (47) | | 4,962 | | 1,208 | | 12,513 | |
Allocable taxesg | | 446 | | — | | 454 | | (95) | | 314 | | 1,184 | | 13 | | 3,509 | | 508 | | 6,333 | |
| Results of operations | | 1,304 | | 2 | | 2,398 | | (219) | | (272) | | 874 | | (60) | | 1,453 | | 700 | | 6,180 | |
| | | | | | | | | | | |
| Upstream and Rosneft segments replacement cost profit (loss) before interest and tax |
| Exploration and production activities – subsidiaries (as above) | | 1,750 | | 2 | | 2,852 | | (314) | | 42 | | 2,058 | | (47) | | 4,962 | | 1,208 | | 12,513 | |
Midstream and other activities – subsidiariesh | | (20) | | 265 | | 188 | | (111) | | 135 | | (58) | | 5 | | 463 | | 6 | | 873 | |
Equity-accounted entitiesi j | | (2) | | 130 | | 28 | | — | | 209 | | 207 | | 2,346 | | 245 | | — | | 3,163 | |
| Total replacement cost profit (loss) after interest and tax | | 1,728 | | 397 | | 3,068 | | (425) | | 386 | | 2,207 | | 2,304 | | 5,670 | | 1,214 | | 16,549 | |
|
| | | | | | | | | | | | | | | | | | | | | |
| | | | $ million |
|
| | | | | | | | | | | | 2017 |
|
| | | Europe | North America | South America | Africa | Asia | Australasia | Total |
|
| | | UK |
| Rest of Europe |
| US |
| Rest of North America |
| | | Russia |
| Rest of Asia |
| | |
| Subsidiaries | | | | | | | | | | | |
Capitalized costs at 31 Decembera b | | | | | | | | | |
| Gross capitalized costs | | | | | | | | | | | |
| Proved properties | | 34,208 |
| — |
| 83,449 |
| 3,518 |
| 13,581 |
| 49,795 |
| — |
| 35,519 |
| 5,984 |
| 226,054 |
|
| Unproved properties | | 481 |
| — |
| 3,957 |
| 2,561 |
| 2,905 |
| 4,013 |
| — |
| 3,407 |
| 562 |
| 17,886 |
|
| | | 34,689 |
| — |
| 87,406 |
| 6,079 |
| 16,486 |
| 53,808 |
| — |
| 38,926 |
| 6,546 |
| 243,940 |
|
| Accumulated depreciation | | 21,793 |
| — |
| 48,462 |
| 367 |
| 7,495 |
| 34,870 |
| — |
| 18,007 |
| 3,192 |
| 134,186 |
|
| Net capitalized costs | | 12,896 |
| — |
| 38,944 |
| 5,712 |
| 8,991 |
| 18,938 |
| — |
| 20,919 |
| 3,354 |
| 109,754 |
|
| | | | | | | | | | | | |
Costs incurred for the year ended 31 Decembera b | | | | | | | |
| Acquisition of properties | | | | | | | | | | | |
| Proved | | — |
| — |
| 22 |
| — |
| — |
| 564 |
| — |
| 1,187 |
| — |
| 1,773 |
|
| Unproved | | 13 |
| — |
| 13 |
| — |
| 330 |
| 374 |
| — |
| 228 |
| — |
| 958 |
|
| | | 13 |
| — |
| 35 |
| — |
| 330 |
| 938 |
| — |
| 1,415 |
| — |
| 2,731 |
|
Exploration and appraisal costsc | | 336 |
| — |
| 102 |
| 52 |
| 264 |
| 682 |
| 11 |
| 190 |
| 18 |
| 1,655 |
|
| Development | | 995 |
| — |
| 2,776 |
| 58 |
| 911 |
| 2,972 |
| — |
| 2,760 |
| 223 |
| 10,695 |
|
| Total costs | | 1,344 |
| — |
| 2,913 |
| 110 |
| 1,505 |
| 4,592 |
| 11 |
| 4,365 |
| 241 |
| 15,081 |
|
| | | | | | | | | | | | |
Results of operations for the year ended 31 Decembera | | | | | |
Sales and other operating revenuesd | | | | | | | | | | | |
| Third parties | | 204 |
| — |
| 724 |
| 171 |
| 1,134 |
| 2,211 |
| — |
| 1,276 |
| 967 |
| 6,687 |
|
| Sales between businesses | | 1,745 |
| — |
| 9,117 |
| 2 |
| 327 |
| 4,022 |
| — |
| 6,394 |
| 487 |
| 22,094 |
|
| | | 1,949 |
| — |
| 9,841 |
| 173 |
| 1,461 |
| 6,233 |
| — |
| 7,670 |
| 1,454 |
| 28,781 |
|
| Exploration expenditure | | 331 |
| — |
| 282 |
| 39 |
| 83 |
| 1,346 |
| 11 |
| (29 | ) | 17 |
| 2,080 |
|
| Production costs | | 629 |
| — |
| 2,256 |
| 116 |
| 573 |
| 979 |
| — |
| 904 |
| 157 |
| 5,614 |
|
| Production taxes | | (37 | ) | — |
| 52 |
| — |
| 86 |
| — |
| — |
| 1,618 |
| 56 |
| 1,775 |
|
Other costs (income)e | | (272 | ) | 2 |
| 1,655 |
| 34 |
| 71 |
| 280 |
| 39 |
| 311 |
| 349 |
| 2,469 |
|
| Depreciation, depletion and amortization | | 1,190 |
| — |
| 4,258 |
| 96 |
| 742 |
| 3,586 |
| — |
| 2,147 |
| 366 |
| 12,385 |
|
| Net impairments and (gains) losses on sale of businesses and fixed assets | | 133 |
| (12 | ) | 87 |
| (1 | ) | (31 | ) | — |
| — |
| (10 | ) | 13 |
| 179 |
|
| | | 1,974 |
| (10 | ) | 8,590 |
| 284 |
| 1,524 |
| 6,191 |
| 50 |
| 4,941 |
| 958 |
| 24,502 |
|
Profit (loss) before taxationf | | (25 | ) | 10 |
| 1,251 |
| (111 | ) | (63 | ) | 42 |
| (50 | ) | 2,729 |
| 496 |
| 4,279 |
|
Allocable taxesg | | (104 | ) | — |
| (1,811 | ) | (28 | ) | 155 |
| 788 |
| (19 | ) | 1,505 |
| 146 |
| 632 |
|
| Results of operations | | 79 |
| 10 |
| 3,062 |
| (83 | ) | (218 | ) | (746 | ) | (31 | ) | 1,224 |
| 350 |
| 3,647 |
|
| | | | | | | | | | | | |
| Upstream and Rosneft segments replacement cost profit (loss) before interest and tax |
| Exploration and production activities – subsidiaries (as above) | | (25 | ) | 10 |
| 1,251 |
| (111 | ) | (63 | ) | 42 |
| (50 | ) | 2,729 |
| 496 |
| 4,279 |
|
Midstream and other activities – subsidiariesh | | (185 | ) | 97 |
| (176 | ) | (111 | ) | 140 |
| (80 | ) | 3 |
| 315 |
| 11 |
| 14 |
|
Equity-accounted entitiesi j | | — |
| 71 |
| 25 |
| — |
| 381 |
| 205 |
| 837 |
| 245 |
| — |
| 1,764 |
|
| Total replacement cost profit (loss) before interest and tax | | (210 | ) | 178 |
| 1,100 |
| (222 | ) | 458 |
| 167 |
| 790 |
| 3,289 |
| 507 |
| 6,057 |
|
a These tables contain information relating to oil and natural gas exploration and production activities of subsidiaries, which includes ourbp's share of oil and natural gas exploration and production activities of joint operations. They do not include any costs relating to the Gulf of Mexico oil spill. Amounts relating to the management and ownership of crude oil and natural gas pipelines, LNG liquefaction and transportation operations are excluded. In addition, ourbp's midstream activities of marketing and trading of natural gas, power and NGLs in the US, Canada, UK, Asia and Europe are excluded. The most significant midstream pipeline interests include the Trans-Alaska Pipeline System, the South Caucasus Pipeline the Forties Pipeline System and the Baku-Tbilisi-Ceyhan pipeline. The Forties Pipeline System was divested on 31 October 2017. Major LNG activities are located in Trinidad, Indonesia Australia and Angola.Australia.
b Costs of decommissioning are included in capitalized costs at 31 December but are excluded from costs incurred for the year.
c Includes exploration and appraisal drilling expenditures, which are capitalized within intangible assets, and geological and geophysical exploration costs, which are charged to income as incurred.
d Presented net of transportation costs, purchases and sales taxes.
e Includes property taxes, other government take and the fair value gain on embedded derivatives of $32$17 million. The UK region includes a $343-million$384-million gain which is offset by corresponding charges primarily in the US region, relating to the group self-insurance programme.
f Excludes the unwinding of the discount on provisions and payables amounting to $120$208 million which is included in finance costs in the group income statement.
g US region includes the deferred tax impact of the reduction in the US Federal corporate income tax rate from 35% to 21% enacted in December 2017.
h Midstream and other activities excludes inventory holding gains and losses.
i The profits of equity-accounted entities are included after interest and tax.taxes.
j From 16 December 2017, BPbp entered into a new 50:50 joint venture Pan American Energy Group (PAEG). Prior to this, Pan American Energy (PAE) was owned 60% by BPbp and 40% by Bridas Corporation. Of BP's initial 60% interest in PAE, 10% was classified as held for sale on 9 September 2017. For September, only 9 days of income was reported for the full 60%. After this equity accounting continued for the 50% not classified as held for sale. BP accounted for 50% of the enlarged entity from 16 December 2017.
|
| | | | | | | | | | | | | |
| 236 | BP
| bp Annual Report and Form 20-F 20192020 | | 237 |
Oil and natural gas exploration and production activities – continued
| | | | | | | | | | | | | | | | | | | | | | | | | | | | | | | | | | | |
| | | $ million |
| | | | | | | | | | | 2018 |
| | Europe | North
America | South
America | Africa | Asia | Australasia | Total |
| | UK | Rest of
Europe | US | Rest of
North
America | | | Russiaa | Rest of
Asia | | |
| Equity-accounted entities (bp share) | | | | | | | | | |
Capitalized costs at 31 Decemberb c | | | | | | | | | |
| Gross capitalized costs | | | | | | | | | | | |
| Proved properties | | — | | 3,439 | | — | | — | | 9,643 | | — | | 22,561 | | 3,646 | | — | | 39,289 | |
| Unproved properties | | — | | 657 | | — | | — | | 86 | | — | | 811 | | 26 | | — | | 1,580 | |
| | — | | 4,096 | | — | | — | | 9,729 | | — | | 23,372 | | 3,672 | | — | | 40,869 | |
| Accumulated depreciation | | — | | 670 | | — | | — | | 4,665 | | — | | 6,050 | | 3,672 | | — | | 15,057 | |
| Net capitalized costs | | — | | 3,426 | | — | | — | | 5,064 | | — | | 17,322 | | — | | — | | 25,812 | |
| | | | | | | | | | | |
Costs incurred for the year ended 31 Decemberb d e | | | | | | |
Acquisition of propertiesc | | | | | | | | | | | |
| Proved | | — | | — | | — | | — | | — | | — | | 393 | | — | | — | | 393 | |
| Unproved | | — | | 137 | | — | | — | | — | | — | | 148 | | — | | — | | 285 | |
| | — | | 137 | | — | | — | | — | | — | | 541 | | — | | — | | 678 | |
Exploration and appraisal costsd | | — | | 67 | | — | | — | | 25 | | — | | 179 | | — | | — | | 271 | |
| Development | | — | | 251 | | — | | — | | 575 | | — | | 3,085 | | 212 | | — | | 4,123 | |
| Total costs | | — | | 455 | | — | | — | | 600 | | — | | 3,805 | | 212 | | — | | 5,072 | |
| | | | | | | | | | | |
Results of operations for the year ended 31 Decemberb | | | | | | |
Sales and other operating revenuesf | | | | | | | | | | | |
| Third parties | | — | | 1,114 | | — | | — | | 1,792 | | — | | — | | 353 | | — | | 3,259 | |
| Sales between businesses | | — | | — | | — | | — | | — | | — | | 14,839 | | — | | — | | 14,839 | |
| | | — | | 1,114 | | — | | — | | 1,792 | | — | | 14,839 | | 353 | | — | | 18,098 | |
| Exploration expenditure | | — | | 89 | | — | | — | | 7 | | — | | 109 | | — | | — | | 205 | |
| Production costs | | — | | 207 | | — | | — | | 438 | | — | | 1,324 | | 39 | | — | | 2,008 | |
| Production taxes | | — | | — | | — | | — | | 361 | | — | | 7,168 | | 94 | | — | | 7,623 | |
| Other costs (income) | | — | | 21 | | — | | — | | 55 | | — | | 594 | | — | | — | | 670 | |
| Depreciation, depletion and amortization | | — | | 290 | | — | | — | | 416 | | — | | 1,514 | | 212 | | — | | 2,432 | |
| Net impairments and losses on sale of businesses and fixed assets | | — | | 6 | | — | | — | | — | | — | | 47 | | 1 | | — | | 54 | |
| | | — | | 613 | | — | | — | | 1,277 | | — | | 10,756 | | 346 | | — | | 12,992 | |
| Profit (loss) before taxation | | — | | 501 | | — | | — | | 515 | | — | | 4,083 | | 7 | | — | | 5,106 | |
| Allocable taxes | | — | | 350 | | — | | — | | 321 | | — | | 814 | | — | | — | | 1,485 | |
Results of operationsg | | — | | 151 | | — | | — | | 194 | | — | | 3,269 | | 7 | | — | | 3,621 | |
| | | | | | | | | | | |
| Upstream and Rosneft segments replacement cost profit (loss) before interest and tax from equity-accounted entities |
| Exploration and production activities – equity-accounted entities after tax (as above) | | — | | 151 | | — | | — | | 194 | | — | | 3,269 | | 7 | | — | | 3,621 | |
Midstream and other activities after taxh | | (2) | | (21) | | 28 | | — | | 15 | | 207 | | (923) | | 238 | | — | | (458) | |
| Total replacement cost profit (loss) after interest and tax | | (2) | | 130 | | 28 | | — | | 209 | | 207 | | 2,346 | | 245 | | — | | 3,163 | |
|
| | | | | | | | | | | | | | | | | | | | | |
| | | | $ million |
|
| | | | | | | | | | | | 2017 |
|
| | | Europe | North America | South America | Africa | Asia | Australasia | Total |
|
| | | UK |
| Rest of Europe |
| US |
| Rest of North America |
| | | Russiaa |
| Rest of Asia |
| | |
| Equity-accounted entities (BP share) | | | | | | | | | |
Capitalized costs at 31 Decemberb c | | | | | | | | | |
| Gross capitalized costs | | | | | | | | | | | |
| Proved properties | | — |
| 3,187 |
| — |
| — |
| 9,096 |
| — |
| 24,686 |
| 3,434 |
| — |
| 40,403 |
|
| Unproved properties | | — |
| 481 |
| — |
| — |
| 68 |
| — |
| 907 |
| 26 |
| — |
| 1,482 |
|
| | | — |
| 3,668 |
| — |
| — |
| 9,164 |
| — |
| 25,593 |
| 3,460 |
| — |
| 41,885 |
|
| Accumulated depreciation | | — |
| 400 |
| — |
| — |
| 4,249 |
| — |
| 6,207 |
| 3,460 |
| — |
| 14,316 |
|
| Net capitalized costs | | — |
| 3,268 |
| — |
| — |
| 4,915 |
| — |
| 19,386 |
| — |
| — |
| 27,569 |
|
| | | | | | | | | | | | |
Costs incurred for the year ended 31 Decemberb d e | | | | | | |
Acquisition of propertiesc | | | | | | | | | | | |
| Proved | | — |
| 323 |
| — |
| — |
| — |
| — |
| 653 |
| — |
| — |
| 976 |
|
| Unproved | | — |
| 152 |
| — |
| — |
| 20 |
| — |
| 416 |
| — |
| — |
| 588 |
|
| | | — |
| 475 |
| — |
| — |
| 20 |
| — |
| 1,069 |
| — |
| — |
| 1,564 |
|
Exploration and appraisal costsd | | — |
| 49 |
| — |
| — |
| 43 |
| — |
| 194 |
| — |
| — |
| 286 |
|
| Development | | — |
| 199 |
| — |
| — |
| 576 |
| — |
| 3,361 |
| 446 |
| — |
| 4,582 |
|
| Total costs | | — |
| 723 |
| — |
| — |
| 639 |
| — |
| 4,624 |
| 446 |
| — |
| 6,432 |
|
| | | | | | | | | | | | |
Results of operations for the year ended 31 Decemberb | | | | | | |
Sales and other operating revenuesf | | | | | | | | | | | |
| Third parties | | — |
| 773 |
| — |
| — |
| 1,750 |
| — |
| — |
| 988 |
| — |
| 3,511 |
|
| Sales between businesses | | — |
| — |
| — |
| — |
| — |
| — |
| 11,537 |
| — |
| — |
| 11,537 |
|
| | | — |
| 773 |
| — |
| — |
| 1,750 |
| — |
| 11,537 |
| 988 |
| — |
| 15,048 |
|
| Exploration expenditure | | — |
| 68 |
| — |
| — |
| — |
| — |
| 59 |
| — |
| — |
| 127 |
|
| Production costs | | — |
| 157 |
| — |
| — |
| 592 |
| — |
| 1,424 |
| 117 |
| — |
| 2,290 |
|
| Production taxes | | — |
| — |
| — |
| — |
| 336 |
| — |
| 5,712 |
| 426 |
| — |
| 6,474 |
|
| Other costs (income) | | — |
| 67 |
| — |
| — |
| 11 |
| — |
| 409 |
| (5 | ) | — |
| 482 |
|
| Depreciation, depletion and amortization | | — |
| 328 |
| — |
| — |
| 458 |
| — |
| 1,539 |
| 446 |
| — |
| 2,771 |
|
| Net impairments and losses on sale of businesses and fixed assets | | — |
| 6 |
| — |
| — |
| 27 |
| — |
| 54 |
| — |
| — |
| 87 |
|
| | | — |
| 626 |
| — |
| — |
| 1,424 |
| — |
| 9,197 |
| 984 |
| — |
| 12,231 |
|
| Profit (loss) before taxation | | — |
| 147 |
| — |
| — |
| 326 |
| — |
| 2,340 |
| 4 |
| — |
| 2,817 |
|
| Allocable taxes | | — |
| 54 |
| — |
| — |
| (18 | ) | — |
| 457 |
| — |
| — |
| 493 |
|
Results of operationsg | | — |
| 93 |
| — |
| — |
| 344 |
| — |
| 1,883 |
| 4 |
| — |
| 2,324 |
|
| | | | | | | | | | | | |
| Upstream and Rosneft segments replacement cost profit (loss) before interest and tax from equity-accounted entities |
| Exploration and production activities – equity-accounted entities after tax (as above) | | — |
| 93 |
| — |
| — |
| 344 |
| — |
| 1,883 |
| 4 |
| — |
| 2,324 |
|
Midstream and other activities after taxh | | — |
| (22 | ) | 25 |
| — |
| 37 |
| 205 |
| (1,046 | ) | 241 |
| — |
| (560 | ) |
| Total replacement cost profit (loss) after interest and tax | | — |
| 71 |
| 25 |
| — |
| 381 |
| 205 |
| 837 |
| 245 |
| — |
| 1,764 |
|
a Amounts reported for Russia in this table include BP’sbp’s share of Rosneft’s worldwide activities, including insignificant amounts outside Russia. The amounts reported includehave been amended to exclude the corresponding amounts for their equity-accounted entities.
b These tables contain information relating to oil and natural gas exploration and production activities of equity-accounted entities. Amounts relating to the management and ownership of crude oil and natural gas pipelines, LNG liquefaction, and transportation operations as well as downstream activities of Rosneft and Pan American Energy Groupother activities are excluded.
c Costs of decommissioning are included in capitalized costs at 31 December but are excluded from costs incurred for the year.
d Includes exploration and appraisal drilling expenditures, which are capitalized within intangible assets, and geological and geophysical exploration costs, which are charged to income as incurred.
e The amounts shown reflect BP’sbp’s share of equity-accounted entities’ costs incurred, and not the costs incurred by BPbp in acquiring an interest in equity-accounted entities.
f Presented net of sales taxes.
g From 16 December 2017, BPbp entered into a new 50:50 joint venture Pan American Energy Group (PAEG). Prior to this, Pan American Energy (PAE) was owned 60% by BPbp and 40% by Bridas Corporation. Of BP's initial 60% interest in PAE, 10% was classified as held for sale on 9 September 2017. For September, only 9 days of income was reported for the full 60%. After this equity accounting continued for the 50% not classified as held for sale. BP accounted for 50% of the enlarged entity from 16 December 2017.
h Includes interest and adjustment for non-controlling interests. Excludes inventory holding gains and losses.
|
| | | | | | | | | | | | | |
238 | | BPbp Annual Report and Form 20-F 2019
2020 | | 237 |
Movements in estimated net proved reserves
| | | | | | | | | | | | | | | | | | | | | | | | | | | | | | | | | | | |
| | | | | | | | | | million barrels |
Crude oila b | | | | | | | | | | 2020 |
| | Europe | North
America | South
America | Africa | Asia | Australasia | Total |
| | UK | Rest of
Europe | USc | Rest of
North
America | | | Russia | Rest of Asiac | | |
| Subsidiaries | | | | | | | | | | | |
| At 1 January | | | | | | | | | | | |
| Developed | | 206 | | — | | 1,063 | | 40 | | 7 | | 156 | | — | | 1,074 | | 26 | | 2,572 | |
| Undeveloped | | 200 | | — | | 842 | | 179 | | 5 | | 40 | | — | | 525 | | 4 | | 1,794 | |
| | 406 | | — | | 1,905 | | 218 | | 12 | | 196 | | — | | 1,599 | | 30 | | 4,367 | |
| Changes attributable to | | | | | | | | | | | |
| Revisions of previous estimates | | (62) | | — | | (17) | | 22 | | — | | (17) | | — | | 175 | | 14 | | 114 | |
| Improved recovery | | — | | — | | 24 | | — | | — | | 3 | | — | | — | | — | | 27 | |
| Purchases of reserves-in-place | | — | | — | | — | | — | | — | | — | | — | | — | | — | | — | |
| Discoveries and extensions | | — | | — | | 2 | | — | | 5 | | — | | — | | 11 | | — | | 18 | |
| Production | | (35) | | — | | (125) | | (8) | | — | | (44) | | — | | (137) | | (5) | | (355) | |
| Sales of reserves-in-place | | — | | — | | (351) | | — | | — | | — | | — | | — | | — | | (351) | |
| | (97) | | — | | (467) | | 14 | | 5 | | (58) | | — | | 48 | | 8 | | (547) | |
At 31 Decemberd | | | | | | | | | | | |
| Developed | | 162 | | — | | 697 | | 37 | | 8 | | 116 | | — | | 1,100 | | 34 | | 2,154 | |
| Undeveloped | | 148 | | — | | 742 | | 195 | | 9 | | 21 | | — | | 547 | | 5 | | 1,666 | |
| | 309 | | — | | 1,438 | | 232 | | 16 | | 137 | | — | | 1,647 | | 38 | | 3,819 | |
Equity-accounted entities (bp share)e | | | | | | | | |
| At 1 January | | | | | | | | | | | |
| Developed | | — | | 115 | | — | | — | | 291 | | 2 | | 3,159 | | — | | — | | 3,567 | |
| Undeveloped | | — | | 35 | | — | | 20 | | 257 | | — | | 2,535 | | — | | — | | 2,847 | |
| | — | | 150 | | — | | 20 | | 548 | | 2 | | 5,695 | | — | | — | | 6,414 | |
| Changes attributable to | | | | | | | | | | | |
| Revisions of previous estimates | | — | | (5) | | — | | 6 | | 2 | | 1 | | 31 | | — | | — | | 35 | |
| Improved recovery | | — | | 10 | | — | | — | | — | | — | | — | | — | | — | | 10 | |
| Purchases of reserves-in-place | | — | | — | | — | | — | | 1 | | — | | 643 | | — | | — | | 644 | |
| Discoveries and extensions | | — | | — | | — | | — | | 17 | | | 238 | | — | | — | | 255 | |
| Production | | — | | (18) | | — | | — | | (21) | | — | | (330) | | — | | — | | (369) | |
| Sales of reserves-in-place | | — | | — | | — | | — | | (35) | | | (662) | | — | | — | | (697) | |
| | — | | (14) | | — | | 6 | | (36) | | 1 | | (79) | | — | | — | | (122) | |
At 31 Decemberf g | | | | | | | | | | | |
| Developed | | — | | 112 | | — | | 5 | | 275 | | 2 | | 3,123 | | — | | — | | 3,517 | |
| Undeveloped | | — | | 24 | | — | | 21 | | 237 | | — | | 2,493 | | — | | — | | 2,776 | |
| | — | | 136 | | — | | 26 | | 512 | | 3 | | 5,615 | | 1 | | — | | 6,293 | |
| Total subsidiaries and equity-accounted entities (bp share) | | | | | | | |
| At 1 January | | | | | | | | | | | |
| Developed | | 206 | | 115 | | 1,063 | | 40 | | 298 | | 158 | | 3,159 | | 1,074 | | 26 | | 6,140 | |
| Undeveloped | | 200 | | 35 | | 842 | | 198 | | 262 | | 40 | | 2,535 | | 525 | | 4 | | 4,642 | |
| | 406 | | 150 | | 1,905 | | 238 | | 560 | | 198 | | 5,695 | | 1,599 | | 30 | | 10,781 | |
| At 31 December | | | | | | | | | | | |
| Developed | | 162 | | 112 | | 697 | | 42 | | 283 | | 119 | | 3,123 | | 1,100 | | 34 | | 5,671 | |
| Undeveloped | | 148 | | 24 | | 742 | | 215 | | 246 | | 22 | | 2,493 | | 548 | | 5 | | 4,441 | |
| | 309 | | 136 | | 1,438 | | 258 | | 529 | | 140 | | 5,615 | | 1,648 | | 38 | | 10,112 | |
|
| | | | | | | | | | | | | | | | | | | | | |
| | | | | | | | | | | million barrels | |
Crude oila b | | | | | | | | | | 2019 | |
| | | Europe | North America | South America | Africa | Asia | Australasia | Total |
|
| | | UK |
| Rest of Europe |
| USc d |
| Rest of North America |
| | | Russia |
| Rest of Asia |
| | |
| Subsidiaries | | | | | | | | | | | |
| At 1 January | | | | | | | | | | | |
| Developed | | 223 |
| — |
| 962 |
| 43 |
| 8 |
| 223 |
| — |
| 1,126 |
| 30 |
| 2,615 |
|
| Undeveloped | | 243 |
| — |
| 802 |
| 190 |
| 5 |
| 36 |
| — |
| 482 |
| 5 |
| 1,763 |
|
| | | 466 |
| — |
| 1,764 |
| 234 |
| 14 |
| 259 |
| — |
| 1,608 |
| 34 |
| 4,378 |
|
| Changes attributable to | | | | | | | | | | | |
| Revisions of previous estimates | | (23 | ) | — |
| 72 |
| (8 | ) | 1 |
| 39 |
| — |
| 104 |
| 2 |
| 187 |
|
| Improved recovery | | — |
| — |
| 189 |
| 1 |
| — |
| — |
| — |
| — |
| — |
| 191 |
|
| Purchases of reserves-in-place | | — |
| — |
| — |
| — |
| — |
| — |
| — |
| 1 |
| — |
| 1 |
|
| Discoveries and extensions | | — |
| — |
| 34 |
| — |
| — |
| — |
| — |
| 11 |
| — |
| 45 |
|
| Production | | (36 | ) | — |
| (143 | ) | (9 | ) | (3 | ) | (57 | ) | — |
| (125 | ) | (6 | ) | (378 | ) |
| Sales of reserves-in-place | | — |
| — |
| (12 | ) | — |
| — |
| (45 | ) | — |
| — |
| — |
| (57 | ) |
| | | (59 | ) | — |
| 141 |
| (16 | ) | (2 | ) | (63 | ) | — |
| (9 | ) | (4 | ) | (12 | ) |
At 31 Decembere | | | | | | | | | | | |
| Developed | | 206 |
| — |
| 1,063 |
| 40 |
| 7 |
| 156 |
| — |
| 1,074 |
| 26 |
| 2,572 |
|
| Undeveloped | | 200 |
| — |
| 842 |
| 179 |
| 5 |
| 40 |
| — |
| 525 |
| 4 |
| 1,794 |
|
| | | 406 |
| — |
| 1,905 |
| 218 |
| 12 |
| 196 |
| — |
| 1,599 |
| 30 |
| 4,367 |
|
Equity-accounted entities (BP share)f | | | | | | | | |
| At 1 January | | | | | | | | | | | |
| Developed | | — |
| 57 |
| — |
| — |
| 293 |
| 1 |
| 3,190 |
| — |
| — |
| 3,541 |
|
| Undeveloped | | — |
| 100 |
| — |
| 19 |
| 259 |
| — |
| 2,414 |
| — |
| — |
| 2,792 |
|
| | | — |
| 157 |
| — |
| 19 |
| 552 |
| 1 |
| 5,604 |
| — |
| — |
| 6,333 |
|
| Changes attributable to | | | | | | | | | | | |
| Revisions of previous estimates | | — |
| 2 |
| — |
| 1 |
| (13 | ) | 1 |
| 158 |
| — |
| — |
| 147 |
|
| Improved recovery | | — |
| 4 |
| — |
| — |
| — |
| — |
| — |
| — |
| — |
| 4 |
|
| Purchases of reserves-in-place | | — |
| — |
| — |
| — |
| — |
| — |
| 7 |
| — |
| — |
| 7 |
|
| Discoveries and extensions | | — |
| — |
| — |
| — |
| 33 |
| — |
| 277 |
| — |
| — |
| 310 |
|
| Production | | — |
| (13 | ) | — |
| — |
| (24 | ) | — |
| (345 | ) | — |
| — |
| (382 | ) |
| Sales of reserves-in-place | | — |
| — |
| — |
| — |
| — |
| — |
| (6 | ) | — |
| — |
| (6 | ) |
| | | — |
| (7 | ) | — |
| 1 |
| (4 | ) | 1 |
| 91 |
| — |
| — |
| 81 |
|
At 31 Decemberg h | | | | | | | | | | | |
| Developed | | — |
| 115 |
| — |
| — |
| 291 |
| 2 |
| 3,159 |
| — |
| — |
| 3,567 |
|
| Undeveloped | | — |
| 35 |
| — |
| 20 |
| 257 |
| — |
| 2,535 |
| — |
| — |
| 2,847 |
|
| | | — |
| 150 |
| — |
| 20 |
| 548 |
| 2 |
| 5,695 |
| — |
| — |
| 6,415 |
|
| Total subsidiaries and equity-accounted entities (BP share) | | | | | | | |
| At 1 January | | | | | | | | | | | |
| Developed | | 223 |
| 57 |
| 962 |
| 43 |
| 302 |
| 224 |
| 3,190 |
| 1,126 |
| 30 |
| 6,156 |
|
| Undeveloped | | 243 |
| 100 |
| 802 |
| 209 |
| 264 |
| 36 |
| 2,414 |
| 482 |
| 5 |
| 4,555 |
|
| | | 466 |
| 157 |
| 1,764 |
| 253 |
| 566 |
| 260 |
| 5,604 |
| 1,608 |
| 34 |
| 10,711 |
|
| At 31 December | | | | | | | | | | | |
| Developed | | 206 |
| 115 |
| 1,063 |
| 40 |
| 298 |
| 158 |
| 3,159 |
| 1,074 |
| 26 |
| 6,140 |
|
| Undeveloped | | 200 |
| 35 |
| 842 |
| 198 |
| 262 |
| 40 |
| 2,535 |
| 525 |
| 4 |
| 4,642 |
|
| | | 406 |
| 150 |
| 1,905 |
| 238 |
| 560 |
| 198 |
| 5,695 |
| 1,599 |
| 30 |
| 10,781 |
|
a Crude oil includes condensate and bitumen. Proved reserves exclude royalties due to others, whether payable in cash or in kind, where the royalty owner has a direct interest in the underlying production and the option and ability to make lifting and sales arrangements independently.
b Because of rounding, some totals may not exactly agree with the sum of their component parts.
c Includes 37 million barrels of crude oil associated with Assets Held for Sale in Oman.
d Includes 5 million barrels of crude oil in respect of the 30% non-controlling interest in BP Trinidad and Tobago LLC.
e Volumes of equity-accounted entities include volumes of equity-accounted investments of those entities.
f Includes 393 million barrels of crude oil in respect of the 7.09% non-controlling interest in Rosneft, including 18.53 mmbbl held through bp's interests in Russia other than Rosneft.
g Total proved crude oil reserves held as part of our equity interest in Rosneft is 5,533 million barrels, comprising less than 1 million barrels each in Egypt, Vietnam, Iraq and Canada, 0 million barrels in Venezuela and 5,531 million barrels in Russia.
| | | | | | | | | | | | | | |
| 238 | | bp Annual Report and Form 20-F 2020 | | |
Movements in estimated net proved reserves – continued
| | | | | | | | | | | | | | | | | | | | | | | | | | | | | | | | | | | |
| | | | | | | | | | million barrels |
Natural gas liquidsa b | | | | | | | | | | 2020 |
| | Europe | North
America | South
America | Africa | Asia | Australasia | Total |
| | UK | Rest of
Europe | US | Rest of
North
America | | | Russia | Rest of Asiac | | |
| Subsidiaries | | | | | | | | | | | |
| At 1 January | | | | | | | | | | | |
| Developed | | 8 | | — | | 229 | | — | | 2 | | 12 | | — | | — | | 4 | | 255 | |
| Undeveloped | | 5 | | — | | 250 | | — | | 21 | | 4 | | — | | — | | — | | 280 | |
| | 13 | | — | | 479 | | — | | 23 | | 16 | | — | | — | | 4 | | 535 | |
| Changes attributable to | | | | | | | | | | | |
| Revisions of previous estimates | | (5) | | — | | (22) | | — | | — | | 1 | | — | | — | | (1) | | (26) | |
| Improved recovery | | — | | — | | 1 | | — | | — | | — | | — | | — | | — | | 1 | |
| Purchases of reserves-in-place | | — | | — | | — | | — | | — | | — | | — | | — | | — | | — | |
| Discoveries and extensions | | — | | — | | — | | — | | — | | — | | — | | — | | — | | — | |
Productiond | | (2) | | — | | (31) | | — | | (3) | | (3) | | — | | — | | (1) | | (39) | |
| Sales of reserves-in-place | | — | | — | | (94) | | — | | — | | — | | — | | — | | — | | (94) | |
| | (7) | | — | | (146) | | — | | (2) | | (2) | | — | | — | | (2) | | (159) | |
At 31 Decembere | | | | | | | | | | | |
| Developed | | 7 | | — | | 115 | | — | | 2 | | 13 | | — | | — | | 2 | | 139 | |
| Undeveloped | | — | | — | | 218 | | — | | 19 | | 1 | | — | | — | | — | | 237 | |
| | 7 | | — | | 333 | | — | | 21 | | 14 | | — | | — | | 2 | | 376 | |
Equity-accounted entities (bp share)f | | | | | | | | |
| At 1 January | | | | | | | | | | | |
| Developed | | — | | 5 | | — | | — | | 2 | | 11 | | 89 | | — | | — | | 107 | |
| Undeveloped | | — | | 3 | | — | | — | | — | | — | | 52 | | — | | — | | 55 | |
| | — | | 7 | | — | | — | | 2 | | 11 | | 141 | | — | | — | | 162 | |
| Changes attributable to | | | | | | | | | | | |
| Revisions of previous estimates | | — | | 1 | | — | | — | | — | | 3 | | 9 | | — | | — | | 12 | |
| Improved recovery | | — | | — | | — | | — | | — | | — | | — | | — | | — | | — | |
| Purchases of reserves-in-place | | — | | — | | — | | — | | — | | — | | 16 | | — | | — | | 16 | |
| Discoveries and extensions | | — | | — | | — | | — | | — | | — | | — | | — | | — | | — | |
| Production | | — | | (1) | | — | | — | | — | | (2) | | (2) | | — | | — | | (5) | |
| Sales of reserves-in-place | | — | | — | | — | | — | | — | | — | | (14) | | — | | — | | (14) | |
| | — | | — | | — | | — | | — | | 1 | | 10 | | — | | — | | 10 | |
At 31 Decemberg h | | | | | | | | | | | |
| Developed | | — | | 6 | | — | | — | | 2 | | 12 | | 108 | | — | | — | | 129 | |
| Undeveloped | | — | | 1 | | — | | — | | — | | — | | 43 | | — | | — | | 44 | |
| | — | | 7 | | — | | — | | 2 | | 12 | | 151 | | — | | — | | 172 | |
| Total subsidiaries and equity-accounted entities (bp share) | | | | | | | |
| At 1 January | | | | | | | | | | | |
| Developed | | 8 | | 5 | | 229 | | — | | 4 | | 23 | | 89 | | — | | 4 | | 363 | |
| Undeveloped | | 5 | | 3 | | 250 | | — | | 21 | | 4 | | 52 | | — | | — | | 334 | |
| | 13 | | 7 | | 479 | | — | | 25 | | 27 | | 141 | | — | | 4 | | 697 | |
| At 31 December | | | | | | | | | | | |
| Developed | | 7 | | 6 | | 115 | | — | | 4 | | 25 | | 108 | | — | | 2 | | 268 | |
| Undeveloped | | — | | 1 | | 218 | | — | | 19 | | 1 | | 43 | | — | | — | | 281 | |
| | 7 | | 7 | | 333 | | — | | 23 | | 26 | | 151 | | — | | 2 | | 549 | |
a Proved reserves exclude royalties due to others, whether payable in cash or in kind, where the royalty owner has a direct interest in the underlying production and the option and ability to make lifting and sales arrangements independently.
b Because of rounding, some totals may not exactly agree with the sum of their component parts.
c Includes 0 million barrels of NGL associated with Assets Held for Sale in Oman.
d Excludes NGLs from processing plants in which an interest is held of less than 1 thousand barrels per day for subsidiaries and 3 thousand barrels per day for equity-accounted entities.
e Includes 6 million barrels of NGL in respect of the 30% non-controlling interest in BP Trinidad and Tobago LLC.
f Volumes of equity-accounted entities include volumes of equity-accounted investments of those entities.
g Includes 12 million barrels of NGLs in respect of the 7.99% non-controlling interest in Rosneft.
h Total proved NGL reserves held as part of our equity interest in Rosneft is 151 million barrels, comprising less than 1 million barrels each in Egypt, Venezuela, Vietnam and Canada, and 151 million barrels in Russia.
| | | | | | | | | | | | | | |
| | bp Annual Report and Form 20-F 2020 | | 239 |
Movements in estimated net proved reserves – continued
| | | | | | | | | | | | | | | | | | | | | | | | | | | | | | | | | | | |
| | | | | | | | | | million barrels |
Total liquidsa b | | | | | | | | | | | 2020 |
| | Europe | North
America | South
America | Africa | Asia | Australasia | Total |
| | UK | Rest of
Europe | USc | Rest of
North
America | | | Russia | Rest of Asiac | | |
| Subsidiaries | | | | | | | | | | | |
| At 1 January | | | | | | | | | | | |
| Developed | | 214 | | — | | 1,292 | | 40 | | 9 | | 168 | | — | | 1,074 | | 30 | | 2,828 | |
| Undeveloped | | 205 | | — | | 1,092 | | 179 | | 26 | | 43 | | — | | 525 | | 4 | | 2,074 | |
| | 420 | | — | | 2,384 | | 218 | | 35 | | 211 | | — | | 1,599 | | 34 | | 4,902 | |
| Changes attributable to | | | | | | | | | | | |
| Revisions of previous estimates | | (67) | | — | | (40) | | 22 | | 1 | | (16) | | — | | 175 | | 13 | | 87 | |
| Improved recovery | | — | | — | | 25 | | — | | — | | 3 | | — | | — | | — | | 28 | |
| Purchases of reserves-in-place | | — | | — | | — | | — | | — | | — | | — | | — | | — | | — | |
| Discoveries and extensions | | — | | — | | 2 | | — | | 5 | | — | | — | | 11 | | — | | 18 | |
Productiond | | (37) | | — | | (155) | | (8) | | (3) | | (47) | | — | | (137) | | (6) | | (394) | |
| Sales of reserves-in-place | | — | | — | | (445) | | — | | — | | — | | — | | — | | — | | (445) | |
| | (104) | | — | | (613) | | 14 | | 2 | | (60) | | — | | 48 | | 6 | | (706) | |
At 31 Decembere | | | | | | | | | | | |
| Developed | | 168 | | — | | 812 | | 37 | | 10 | | 129 | | — | | 1,100 | | 36 | | 2,293 | |
| Undeveloped | | 148 | | — | | 959 | | 195 | | 27 | | 22 | | — | | 547 | | 5 | | 1,903 | |
| | 316 | | — | | 1,771 | | 232 | | 37 | | 151 | | — | | 1,647 | | 41 | | 4,196 | |
Equity-accounted entities (bp share)f | | | | | | | | |
| At 1 January | | | | | | | | | | | |
| Developed | | — | | 120 | | — | | — | | 293 | | 13 | | 3,248 | | — | | — | | 3,675 | |
| Undeveloped | | — | | 37 | | — | | 20 | | 257 | | — | | 2,588 | | — | | — | | 2,902 | |
| | — | | 157 | | — | | 20 | | 550 | | 13 | | 5,836 | | — | | — | | 6,576 | |
| Changes attributable to | | | | | | | | | | | |
| Revisions of previous estimates | | — | | (4) | | — | | 6 | | 2 | | 4 | | 39 | | — | | — | | 47 | |
| Improved recovery | | — | | 10 | | — | | — | | — | | — | | — | | — | | — | | 10 | |
| Purchases of reserves-in-place | | — | | — | | — | | — | | 1 | | — | | 660 | | — | | — | | 661 | |
| Discoveries and extensions | | — | | — | | — | | | 17 | | | 238 | | — | | — | | 255 | |
| Production | | — | | (19) | | — | | — | | (21) | | (2) | | (331) | | — | | — | | (374) | |
| Sales of reserves-in-place | | — | | (1) | | — | | — | | (35) | | | (675) | | — | | — | | (711) | |
| | — | | (14) | | — | | 6 | | (36) | | 2 | | (70) | | — | | — | | (112) | |
At 31 Decemberg h | | | | | | | | | | | |
| Developed | | — | | 118 | | — | | 5 | | 277 | | 15 | | 3,231 | | — | | — | | 3,645 | |
| Undeveloped | | — | | 25 | | — | | 21 | | 237 | | — | | 2,535 | | — | | — | | 2,819 | |
| | — | | 143 | | — | | 26 | | 514 | | 15 | | 5,766 | | 1 | | — | | 6,465 | |
| Total subsidiaries and equity-accounted entities (bp share) | | | | | | | |
| At 1 January | | | | | | | | | | | |
| Developed | | 214 | | 120 | | 1,292 | | 40 | | 302 | | 181 | | 3,248 | | 1,074 | | 30 | | 6,502 | |
| Undeveloped | | 205 | | 37 | | 1,092 | | 198 | | 283 | | 43 | | 2,588 | | 525 | | 4 | | 4,976 | |
| | 420 | | 157 | | 2,384 | | 238 | | 585 | | 224 | | 5,836 | | 1,599 | | 34 | | 11,478 | |
| At 31 December | | | | | | | | | | | |
| Developed | | 168 | | 118 | | 812 | | 42 | | 287 | | 144 | | 3,231 | | 1,100 | | 36 | | 5,938 | |
| Undeveloped | | 148 | | 25 | | 959 | | 215 | | 265 | | 23 | | 2,535 | | 548 | | 5 | | 4,722 | |
| | 316 | | 143 | | 1,771 | | 258 | | 552 | | 166 | | 5,766 | | 1,648 | | 41 | | 10,661 | |
a Proved reserves exclude royalties due to others, whether payable in cash or in kind, where the royalty owner has a direct interest in the underlying production and the option and ability to make lifting and sales arrangements independently.
b Because of rounding, some totals may not exactly agree with the sum of their component parts.
c Includes 37 million barrels associated with Assets Held for Sale in Oman.
d Excludes NGLs from processing plants in which an interest is held of less than 1 thousand barrels per day for subsidiaries and 3 thousand barrels per day for equity-accounted entities.
e Also includes 11 million barrels in respect of the 30% non-controlling interest in BP Trinidad and Tobago LLC.
f Volumes of equity-accounted entities include volumes of equity-accounted investments of those entities.
g Includes 405 million barrels of liquids in respect of the non-controlling interest in Rosneft, including 19mmboe held through bp’s interests in Russia other than Rosneft.
h Total proved liquid reserves held as part of our equity interest in Rosneft is 5,683 million barrels, comprising 0 million barrels in Venezuela, less than 1 million barrels each in Iraq, Canada, Egypt and Vietnam and 5,682 million barrels in Russia.
| | | | | | | | | | | | | | |
| 240 | | bp Annual Report and Form 20-F 2020 | | |
Movements in estimated net proved reserves – continued
| | | | | | | | | | | | | | | | | | | | | | | | | | | | | | | | | | | |
| | | | | | | | | | billion cubic feet |
Natural gasa b | | | | | | | | | | 2020 |
| | Europe | North
America | South
America | Africa | Asia | Australasia | Total |
| | UK | Rest of
Europe | US | Rest of
North
America | | | Russia | Rest of Asiac | | |
| Subsidiaries | | | | | | | | | | | |
| At 1 January | | | | | | | | | | | |
| Developed | | 493 | | — | | 6,330 | | — | | 2,192 | | 1,163 | | — | | 3,667 | | 2,256 | | 16,101 | |
| Undeveloped | | 207 | | — | | 2,127 | | — | | 2,235 | | 742 | | — | | 3,401 | | 1,132 | | 9,844 | |
| | 700 | | — | | 8,458 | | — | | 4,427 | | 1,905 | | — | | 7,068 | | 3,389 | | 25,946 | |
| Changes attributable to | | | | | | | | | | | |
| Revisions of previous estimates | | (252) | | — | | 580 | | 1 | | (362) | | (26) | | — | | 570 | | (9) | | 503 | |
| Improved recovery | | 1 | | — | | 545 | | — | | — | | — | | — | | — | | — | | 546 | |
| Purchases of reserves-in-place | | — | | — | | — | | — | | — | | — | | — | | — | | — | | — | |
| Discoveries and extensions | | — | | — | | 1 | | — | | 93 | | 28 | | — | | 263 | | — | | 386 | |
Productiond | | (92) | | — | | (603) | | (1) | | (627) | | (367) | | — | | (376) | | (293) | | (2,358) | |
| Sales of reserves-in-place | | — | | — | | (3,636) | | — | | — | | — | | — | | — | | — | | (3,636) | |
| | (342) | | — | | (3,114) | | — | | (896) | | (364) | | — | | 457 | | (301) | | (4,561) | |
At 31 Decembere | | | | | | | | | | | |
| Developed | | 306 | | — | | 1,921 | | — | | 1,567 | | 1,382 | | — | | 3,883 | | 2,058 | | 11,118 | |
| Undeveloped | | 51 | | — | | 3,423 | | — | | 1,964 | | 158 | | — | | 3,641 | | 1,029 | | 10,267 | |
| | 358 | | — | | 5,344 | | — | | 3,531 | | 1,541 | | — | | 7,524 | | 3,087 | | 21,385 | |
Equity-accounted entities (bp share)f | | | | | | | | | | | |
| At 1 January | | | | | | | | | | | |
| Developed | | — | | 108 | | — | | — | | 1,130 | | 508 | | 9,324 | | 10 | | — | | 11,080 | |
| Undeveloped | | — | | 56 | | — | | 6 | | 447 | | — | | 8,067 | | — | | — | | 8,576 | |
| | — | | 164 | | — | | 6 | | 1,577 | | 508 | | 17,391 | | 10 | | — | | 19,656 | |
| Changes attributable to | | | | | | | | | | | |
| Revisions of previous estimates | | — | | 29 | | — | | 2 | | (86) | | 285 | | 1,022 | | — | | — | | 1,251 | |
| Improved recovery | | — | | 8 | | — | | — | | — | | — | | — | | — | | — | | 8 | |
| Purchases of reserves-in-place | | — | | — | | — | | — | | — | | 18 | | 1,681 | | 1 | | — | | 1,701 | |
| Discoveries and extensions | | — | | — | | — | | — | | 139 | | — | | 422 | | — | | — | | 561 | |
Productiond | | — | | (35) | | — | | — | | (124) | | (69) | | (470) | | (5) | | — | | (703) | |
| Sales of reserves-in-place | | — | | (3) | | — | | — | | (28) | | — | | (1,361) | | — | | — | | (1,393) | |
| | — | | (2) | | — | | 2 | | (99) | | 234 | | 1,294 | | (4) | | — | | 1,426 | |
At 31 Decemberg h | | | | | | | | | | | |
| Developed | | — | | 141 | | — | | 2 | | 965 | | 600 | | 11,373 | | 7 | | — | | 13,088 | |
| Undeveloped | | — | | 21 | | — | | 6 | | 513 | | 142 | | 7,312 | | — | | — | | 7,994 | |
| | — | | 162 | | — | | 8 | | 1,478 | | 741 | | 18,685 | | 7 | | — | | 21,082 | |
| Total subsidiaries and equity-accounted entities (bp share) | | | | |
| At 1 January | | | | | | | | | | | |
| Developed | | 493 | | 108 | | 6,330 | | — | | 3,323 | | 1,670 | | 9,324 | | 3,677 | | 2,256 | | 27,181 | |
| Undeveloped | | 207 | | 56 | | 2,127 | | 6 | | 2,682 | | 742 | | 8,067 | | 3,401 | | 1,132 | | 18,421 | |
| | 700 | | 164 | | 8,458 | | 6 | | 6,004 | | 2,413 | | 17,391 | | 7,078 | | 3,389 | | 45,601 | |
| At 31 December | | | | | | | | | | | |
| Developed | | 306 | | 141 | | 1,921 | | 2 | | 2,532 | | 1,982 | | 11,373 | | 3,890 | | 2,058 | | 24,206 | |
| Undeveloped | | 51 | | 21 | | 3,423 | | 6 | | 2,477 | | 300 | | 7,312 | | 3,641 | | 1,029 | | 18,260 | |
| | 358 | | 162 | | 5,344 | | 8 | | 5,009 | | 2,282 | | 18,685 | | 7,531 | | 3,087 | | 42,467 | |
a Proved reserves exclude royalties due to others, whether payable in cash or in kind, where the royalty owner has a direct interest in the underlying production and the option and ability to make lifting and sales arrangements independently.
b Because of rounding, some totals may not exactly agree with the sum of their component parts.
c Includes 1316 billion cubic feet of natural gas associated with Assets Held for Sale in Oman.
d Includes 158 billion cubic feet of natural gas consumed in operations, 103 billion cubic feet in subsidiaries, 55 billion cubic feet in equity-accounted entities.
e Includes 1,059 billion cubic feet of natural gas in respect of the 30% non-controlling interest in BP Trinidad and Tobago LLC.
f Volumes of equity-accounted entities include volumes of equity-accounted investments of those entities.
g Includes 1,640 billion cubic feet of natural gas in respect of the 10.01% non-controlling interest in Rosneft including 614 billion cubic feet held through bp’s interests in Russia other than Rosneft.
h Total proved gas reserves held as part of our equity interest in Rosneft is 16,324 billion cubic feet, comprising 0 billion cubic feet in Venezuela, 7 billion cubic feet in Vietnam, 420 billion cubic feet in Egypt and 15,897 billion cubic feet in Russia.
| | | | | | | | | | | | | | |
| | bp Annual Report and Form 20-F 2020 | | 241 |
Movements in estimated net proved reserves – continued
| | | | | | | | | | | | | | | | | | | | | | | | | | | | | | | | | | | |
| | | million barrels of oil equivalentc |
Total hydrocarbonsa b | | | | | | | | | | | 2020 |
| | Europe | North
America | South
America | Africa | Asia | Australasia | Total |
| | UK | Rest of
Europe | USd | Rest of
North
America | | | Russia | Rest of Asiad | | |
| Subsidiaries | | | | | | | | | | | |
| At 1 January | | | | | | | | | | | |
| Developed | | 300 | | — | | 2,384 | | 40 | | 387 | | 369 | | — | | 1,707 | | 419 | | 5,604 | |
| Undeveloped | | 241 | | — | | 1,459 | | 179 | | 411 | | 171 | | — | | 1,111 | | 199 | | 3,771 | |
| | 540 | | — | | 3,842 | | 218 | | 798 | | 540 | | — | | 2,818 | | 618 | | 9,375 | |
| Changes attributable to | | | | | | | | | | | |
| Revisions of previous estimates | | (110) | | — | | 60 | | 22 | | (62) | | (21) | | — | | 273 | | 11 | | 174 | |
| Improved recovery | | — | | — | | 118 | | — | | — | | 3 | | — | | — | | — | | 122 | |
| Purchases of reserves-in-place | | — | | — | | — | | — | | — | | — | | — | | — | | — | | — | |
| Discoveries and extensions | | — | | — | | 3 | | — | | 21 | | 5 | | — | | 56 | | — | | 84 | |
Productione f | | (53) | | — | | (259) | | (8) | | (111) | | (110) | | — | | (202) | | (57) | | (800) | |
| Sales of reserves-in-place | | — | | — | | (1,072) | | — | | — | | — | | — | | — | | — | | (1,072) | |
| | (163) | | — | | (1,150) | | 14 | | (152) | | (123) | | — | | 127 | | (46) | | (1,492) | |
At 31 Decemberh | | | | | | | | | | | |
| Developed | | 221 | | — | | 1,143 | | 37 | | 280 | | 367 | | — | | 1,770 | | 391 | | 4,210 | |
| Undeveloped | | 157 | | — | | 1,549 | | 195 | | 366 | | 50 | | — | | 1,175 | | 182 | | 3,673 | |
| | 378 | | — | | 2,692 | | 232 | | 646 | | 417 | | — | | 2,945 | | 573 | | 7,883 | |
Equity-accounted entities (bp share)h | | | | | | | | | | | |
| At 1 January | | | | | | | | | | | |
| Developed | | — | | 139 | | — | | — | | 488 | | 100 | | 4,856 | | 2 | | — | | 5,585 | |
| Undeveloped | | — | | 47 | | — | | 21 | | 334 | | — | | 3,978 | | — | | — | | 4,381 | |
| | — | | 186 | | — | | 21 | | 822 | | 100 | | 8,834 | | 2 | | — | | 9,965 | |
| Changes attributable to | | | | | | | | | | | |
| Revisions of previous estimates | | — | | 1 | | — | | 7 | | (13) | | 53 | | 216 | | — | | — | | 263 | |
| Improved recovery | | — | | 11 | | — | | — | | — | | — | | — | | — | | — | | 11 | |
| Purchases of reserves-in-place | | — | | — | | — | | — | | 1 | | 3 | | 949 | | — | | — | | 954 | |
| Discoveries and extensions | | — | | — | | — | | — | | 41 | | — | | 311 | | — | | — | | 352 | |
Productione | | — | | (25) | | — | | — | | (42) | | (14) | | (412) | | (1) | | — | | (495) | |
| Sales of reserves-in-place | | — | | (1) | | — | | — | | (40) | | — | | (910) | | — | | — | | (951) | |
| | — | | (15) | | — | | 7 | | (53) | | 42 | | 153 | | — | | — | | 134 | |
At 31 Decemberi j | | | | | | | | | | | |
| Developed | | — | | 142 | | — | | 5 | | 443 | | 118 | | 5,192 | | 1 | | — | | 5,902 | |
| Undeveloped | | — | | 29 | | — | | 22 | | 326 | | 25 | | 3,796 | | — | | — | | 4,198 | |
| | — | | 171 | | — | | 27 | | 769 | | 143 | | 8,988 | | 2 | | — | | 10,100 | |
| Total subsidiaries and equity-accounted entities (bp share) | | | | | | | |
| At 1 January | | | | | | | | | | | |
| Developed | | 300 | | 139 | | 2,384 | | 40 | | 875 | | 469 | | 4,856 | | 1,708 | | 419 | | 11,189 | |
| Undeveloped | | 241 | | 47 | | 1,459 | | 199 | | 746 | | 171 | | 3,978 | | 1,112 | | 199 | | 8,152 | |
| | 540 | | 186 | | 3,842 | | 239 | | 1,621 | | 640 | | 8,834 | | 2,820 | | 618 | | 19,341 | |
| At 31 December | | | | | | | | | | | |
| Developed | | 221 | | 142 | | 1,143 | | 43 | | 724 | | 485 | | 5,192 | | 1,771 | | 391 | | 10,112 | |
| Undeveloped | | 157 | | 29 | | 1,549 | | 217 | | 692 | | 74 | | 3,796 | | 1,175 | | 182 | | 7,871 | |
| | 378 | | 171 | | 2,692 | | 259 | | 1,415 | | 560 | | 8,988 | | 2,946 | | 573 | | 17,982 | |
a Proved reserves exclude royalties due to others, whether payable in cash or in kind, where the royalty owner has a direct interest in the underlying production and the option and ability to make lifting and sales arrangements independently.
b Because of rounding, some totals may not exactly agree with the sum of their component parts.
c 5.8 billion cubic feet of natural gas = 1 million barrels of oil equivalent.
d Includes 264 million barrels of oil equivalent associated with Assets Held for Sale in Oman.
e Excludes NGLs from processing plants in which an interest is held of less than 1 thousand barrels per day for subsidiaries and 3 thousand barrels per day for equity-accounted entities.
f Includes 27 million barrels of oil equivalent of natural gas consumed in operations, 18 million barrels of oil equivalent in subsidiaries, 10 million barrels of oil equivalent in equity-accounted entities.
g Includes 194 million barrels of oil equivalent in respect of the 30% non-controlling interest in BP Trinidad and Tobago LLC.
h Volumes of equity-accounted entities include volumes of equity-accounted investments of those entities.
i Includes 687 million barrels of oil equivalent in respect of the non-controlling interest in Rosneft, including 124mmboe held through bp’s interests in Russia other than Rosneft.
j Total proved reserves held as part of our equity interest in Rosneft is 8,498 million barrels of oil equivalent, comprising less than 1 million barrels of oil equivalent in Iraq and Canada, 0 million barrels of oil equivalent in Venezuela, 1 million barrels of oil equivalent in Vietnam, 73 million barrels of oil equivalent in Egypt and 8,423 million barrels of oil equivalent in Russia.
| | | | | | | | | | | | | | |
| 242 | | bp Annual Report and Form 20-F 2020 | | |
Movements in estimated net proved reserves – continued
| | | | | | | | | | | | | | | | | | | | | | | | | | | | | | | | | | | |
| | | | | | | | | | million barrels |
Crude oila b | | | | | | | | | | 2019 |
| | Europe | North
America | South
America | Africa | Asia | Australasia | Total |
| | UK | Rest of
Europe | USc d | Rest of
North
America | | | Russia | Rest of
Asia | | |
| Subsidiaries | | | | | | | | | | | |
| At 1 January | | | | | | | | | | | |
| Developed | | 223 | | — | | 962 | | 43 | | 8 | | 223 | | — | | 1,126 | | 30 | | 2,615 | |
| Undeveloped | | 243 | | — | | 802 | | 190 | | 5 | | 36 | | — | | 482 | | 5 | | 1,763 | |
| | 466 | | — | | 1,764 | | 234 | | 14 | | 259 | | — | | 1,608 | | 34 | | 4,378 | |
| Changes attributable to | | | | | | | | | | | |
| Revisions of previous estimates | | (23) | | — | | 72 | | (8) | | 1 | | 39 | | — | | 104 | | 2 | | 187 | |
| Improved recovery | | — | | — | | 189 | | 1 | | — | | — | | — | | — | | — | | 191 | |
| Purchases of reserves-in-place | | — | | — | | — | | — | | — | | — | | — | | 1 | | — | | 1 | |
| Discoveries and extensions | | — | | — | | 34 | | — | | — | | — | | — | | 11 | | — | | 45 | |
| Production | | (36) | | — | | (143) | | (9) | | (3) | | (57) | | — | | (125) | | (6) | | (378) | |
| Sales of reserves-in-place | | — | | — | | (12) | | — | | — | | (45) | | — | | — | | — | | (57) | |
| | (59) | | — | | 141 | | (16) | | (2) | | (63) | | — | | (9) | | (4) | | (12) | |
At 31 Decembere | | | | | | | | | | | |
| Developed | | 206 | | — | | 1,063 | | 40 | | 7 | | 156 | | — | | 1,074 | | 26 | | 2,572 | |
| Undeveloped | | 200 | | — | | 842 | | 179 | | 5 | | 40 | | — | | 525 | | 4 | | 1,794 | |
| | 406 | | — | | 1,905 | | 218 | | 12 | | 196 | | — | | 1,599 | | 30 | | 4,367 | |
Equity-accounted entities (bp share)f | | | | | | | | | | | |
| At 1 January | | | | | | | | | | | |
| Developed | | — | | 57 | | — | | — | | 293 | | 1 | | 3,190 | | — | | — | | 3,541 | |
| Undeveloped | | — | | 100 | | — | | 19 | | 259 | | — | | 2,414 | | — | | — | | 2,792 | |
| | — | | 157 | | — | | 19 | | 552 | | 1 | | 5,604 | | — | | — | | 6,333 | |
| Changes attributable to | | | | | | | | | | | |
| Revisions of previous estimates | | — | | 2 | | — | | 1 | | (13) | | 1 | | 158 | | — | | — | | 147 | |
| Improved recovery | | — | | 4 | | — | | — | | — | | — | | — | | — | | — | | 4 | |
| Purchases of reserves-in-place | | — | | — | | — | | — | | — | | — | | 7 | | — | | — | | 7 | |
| Discoveries and extensions | | — | | — | | — | | — | | 33 | | — | | 277 | | — | | — | | 310 | |
| Production | | — | | (13) | | — | | — | | (24) | | — | | (345) | | — | | — | | (382) | |
| Sales of reserves-in-place | | — | | — | | — | | — | | — | | — | | (6) | | — | | — | | (6) | |
| | — | | (7) | | — | | 1 | | (4) | | 1 | | 91 | | — | | — | | 81 | |
At 31 Decemberg h | | | | | | | | | | | |
| Developed | | — | | 115 | | — | | — | | 291 | | 2 | | 3,159 | | — | | — | | 3,567 | |
| Undeveloped | | — | | 35 | | — | | 20 | | 257 | | — | | 2,535 | | — | | — | | 2,847 | |
| | — | | 150 | | — | | 20 | | 548 | | 2 | | 5,695 | | — | | — | | 6,415 | |
| Total subsidiaries and equity-accounted entities (bp share) | | | | | | | |
| At 1 January | | | | | | | | | | | |
| Developed | | 223 | | 57 | | 962 | | 43 | | 302 | | 224 | | 3,190 | | 1,126 | | 30 | | 6,156 | |
| Undeveloped | | 243 | | 100 | | 802 | | 209 | | 264 | | 36 | | 2,414 | | 482 | | 5 | | 4,555 | |
| | 466 | | 157 | | 1,764 | | 253 | | 566 | | 260 | | 5,604 | | 1,608 | | 34 | | 10,711 | |
| At 31 December | | | | | | | | | | | |
| Developed | | 206 | | 115 | | 1,063 | | 40 | | 298 | | 158 | | 3,159 | | 1,074 | | 26 | | 6,140 | |
| Undeveloped | | 200 | | 35 | | 842 | | 198 | | 262 | | 40 | | 2,535 | | 525 | | 4 | | 4,642 | |
| | 406 | | 150 | | 1,905 | | 238 | | 560 | | 198 | | 5,695 | | 1,599 | | 30 | | 10,781 | |
a Crude oil includes condensate and bitumen. Proved reserves exclude royalties due to others, whether payable in cash or in kind, where the royalty owner has a direct interest in the underlying production and the option and ability to make lifting and sales arrangements independently.
b Because of rounding, some totals may not exactly agree with the sum of their component parts.
c Proved reserves in the Prudhoe Bay field in Alaska include an estimated 4.5 million barrels upon which a net profits royalty will be payable over the life of the field under the terms of the BP Prudhoe Bay Royalty Trust.
dIncludes 362 million barrels of crude oil associated with Assets Held for Sale in the USA.
e Includes 4 million barrels of crude oil in respect of the 30% non-controlling interest in BP Trinidad and Tobago LLC.
f Volumes of equity-accounted entities include volumes of equity-accounted investments of those entities.
g Includes 346 million barrels of crude oil in respect of the 6.17% non-controlling interest in Rosneft, including 26 mmbbl held through BP'sbp’s interests in Russia other than Rosneft.
h Total proved crude oil reserves held as part of our equity interest in Rosneft is 5,604 million barrels, comprising less than 1 million barrels in Egypt, Vietnam, Iraq and Canada, 35 million barrels in Venezuela and 5,568 million barrels in Russia.
|
| | | | | | | | | | | | | |
| BP
| bp Annual Report and Form 20-F 20192020 | | 239243 |
Movements in estimated net proved reserves -– continued
| | | | | | | | | | | | | | | | | | | | | | | | | | | | | | | | | | | |
| | | | | | | | | | million barrels |
Natural gas liquidsa b | | | | | | | | | | 2019 |
| | Europe | North
America | South
America | Africa | Asia | Australasia | Total |
| | UK | Rest of
Europe | USc | Rest of
North
America | | | Russia | Rest of
Asia | | |
| Subsidiaries | | | | | | | | | | | |
| At 1 January | | | | | | | | | | | |
| Developed | | 8 | | — | | 266 | | — | | 2 | | 14 | | — | | — | | 5 | | 295 | |
| Undeveloped | | 6 | | — | | 246 | | — | | 25 | | 4 | | — | | — | | — | | 280 | |
| | 14 | | — | | 511 | | — | | 27 | | 18 | | — | | — | | 5 | | 576 | |
| Changes attributable to | | | | | | | | | | | |
| Revisions of previous estimates | | — | | — | | (46) | | — | | (1) | | — | | — | | — | | — | | (47) | |
| Improved recovery | | 1 | | — | | 62 | | — | | — | | — | | — | | — | | — | | 63 | |
| Purchases of reserves-in-place | | — | | — | | — | | — | | — | | — | | — | | — | | — | | — | |
| Discoveries and extensions | | — | | — | | 1 | | — | | — | | — | | — | | — | | — | | 1 | |
Productiond | | (1) | | — | | (33) | | — | | (3) | | (3) | | — | | — | | (1) | | (41) | |
| Sales of reserves-in-place | | — | | — | | (17) | | — | | — | | — | | — | | — | | — | | (17) | |
| | (1) | | — | | (32) | | — | | (4) | | (3) | | — | | — | | (1) | | (41) | |
At 31 Decembere | | | | | | | | | | | |
| Developed | | 8 | | — | | 229 | | — | | 2 | | 12 | | — | | — | | 4 | | 255 | |
| Undeveloped | | 5 | | — | | 250 | | — | | 21 | | 4 | | — | | — | | — | | 280 | |
| | 13 | | — | | 479 | | — | | 23 | | 16 | | — | | — | | 4 | | 535 | |
Equity-accounted entities (bp share)f | | | | | | | | | | | |
| At 1 January | | | | | | | | | | | |
| Developed | | — | | 4 | | — | | — | | — | | 7 | | 103 | | — | | — | | 114 | |
| Undeveloped | | — | | 3 | | — | | — | | — | | — | | 51 | | — | | — | | 54 | |
| | — | | 7 | | — | | — | | — | | 7 | | 154 | | — | | — | | 169 | |
| Changes attributable to | | | | | | | | | | | |
| Revisions of previous estimates | | — | | — | | — | | — | | 3 | | 5 | | (11) | | — | | — | | (3) | |
| Improved recovery | | — | | 1 | | — | | — | | — | | — | | — | | — | | — | | 1 | |
| Purchases of reserves-in-place | | — | | — | | — | | — | | — | | — | | — | | — | | — | | — | |
| Discoveries and extensions | | — | | — | | — | | — | | — | | — | | — | | — | | — | | — | |
| Production | | — | | (1) | | — | | — | | — | | (2) | | (2) | | — | | — | | (4) | |
| Sales of reserves-in-place | | — | | — | | — | | — | | — | | — | | — | | — | | — | | — | |
| | — | | — | | — | | — | | 2 | | 4 | | (13) | | — | | — | | (7) | |
At 31 Decemberg h | | | | | | | | | | | |
| Developed | | — | | 5 | | — | | — | | 2 | | 11 | | 89 | | — | | — | | 107 | |
| Undeveloped | | — | | 3 | | — | | — | | — | | — | | 52 | | — | | — | | 55 | |
| | — | | 7 | | — | | — | | 2 | | 11 | | 141 | | — | | — | | 162 | |
| Total subsidiaries and equity-accounted entities (bp share) | | | | | | | |
| At 1 January | | | | | | | | | | | |
| Developed | | 8 | | 4 | | 266 | | — | | 2 | | 22 | | 103 | | — | | 5 | | 409 | |
| Undeveloped | | 6 | | 3 | | 246 | | — | | 25 | | 4 | | 51 | | — | | — | | 335 | |
| | 14 | | 7 | | 511 | | — | | 27 | | 26 | | 154 | | — | | 5 | | 744 | |
| At 31 December | | | | | | | | | | | |
| Developed | | 8 | | 5 | | 229 | | — | | 4 | | 23 | | 89 | | — | | 4 | | 363 | |
| Undeveloped | | 5 | | 3 | | 250 | | — | | 21 | | 4 | | 52 | | — | | — | | 334 | |
| | 13 | | 7 | | 479 | | — | | 25 | | 27 | | 141 | | — | | 4 | | 697 | |
|
| | | | | | | | | | | | | | | | | | | | | |
| | | | | | | | | | | million barrels | |
Natural gas liquidsa b | | | | | | | | | | 2019 | |
| | | Europe | North America | South America | Africa | Asia | Australasia | Total |
|
| | | UK |
| Rest of Europe |
| USc |
| Rest of North America |
| | | Russia |
| Rest of Asia |
| | |
| Subsidiaries | | | | | | | | | | | |
| At 1 January | | | | | | | | | | | |
| Developed | | 8 |
| — |
| 266 |
| — |
| 2 |
| 14 |
| — |
| — |
| 5 |
| 295 |
|
| Undeveloped | | 6 |
| — |
| 246 |
| — |
| 25 |
| 4 |
| — |
| — |
| — |
| 280 |
|
| | | 14 |
| — |
| 511 |
| — |
| 27 |
| 18 |
| — |
| — |
| 5 |
| 576 |
|
| Changes attributable to | | | | | | | | | | | |
| Revisions of previous estimates | | — |
| — |
| (46 | ) | — |
| (1 | ) | — |
| — |
| — |
| — |
| (47 | ) |
| Improved recovery | | 1 |
| — |
| 62 |
| — |
| — |
| — |
| — |
| — |
| — |
| 63 |
|
| Purchases of reserves-in-place | | — |
| — |
| — |
| — |
| — |
| — |
| — |
| — |
| — |
| — |
|
| Discoveries and extensions | | — |
| — |
| 1 |
| — |
| — |
| — |
| — |
| — |
| — |
| 1 |
|
Productiond | | (1 | ) | — |
| (33 | ) | — |
| (3 | ) | (3 | ) | — |
| — |
| (1 | ) | (41 | ) |
| Sales of reserves-in-place | | — |
| — |
| (17 | ) | — |
| — |
| — |
| — |
| — |
| — |
| (17 | ) |
| | | (1 | ) | — |
| (32 | ) | — |
| (4 | ) | (3 | ) | — |
| — |
| (1 | ) | (41 | ) |
At 31 Decembere | | | | | | | | | | | |
| Developed | | 8 |
| — |
| 229 |
| — |
| 2 |
| 12 |
| — |
| — |
| 4 |
| 255 |
|
| Undeveloped | | 5 |
| — |
| 250 |
| — |
| 21 |
| 4 |
| — |
| — |
| — |
| 280 |
|
| | | 13 |
| — |
| 479 |
| — |
| 23 |
| 16 |
| — |
| — |
| 4 |
| 535 |
|
Equity-accounted entities (BP share)f | | | | | | | | |
| At 1 January | | | | | | | | | | | |
| Developed | | — |
| 4 |
| — |
| — |
| — |
| 7 |
| 103 |
| — |
| — |
| 114 |
|
| Undeveloped | | — |
| 3 |
| — |
| — |
| — |
| — |
| 51 |
| — |
| — |
| 54 |
|
| | | — |
| 7 |
| — |
| — |
| — |
| 7 |
| 154 |
| — |
| — |
| 169 |
|
| Changes attributable to | | | | | | | | | | | |
| Revisions of previous estimates | | — |
| — |
| — |
| — |
| 3 |
| 5 |
| (11 | ) | — |
| — |
| (3 | ) |
| Improved recovery | | — |
| 1 |
| — |
| — |
| — |
| — |
| — |
| — |
| — |
| 1 |
|
| Purchases of reserves-in-place | | — |
| — |
| — |
| — |
| — |
| — |
| — |
| — |
| — |
| — |
|
| Discoveries and extensions | | — |
| — |
| — |
| — |
| — |
| — |
| — |
| — |
| — |
| — |
|
| Production | | — |
| (1 | ) | — |
| — |
| — |
| (2 | ) | (2 | ) | — |
| — |
| (4 | ) |
| Sales of reserves-in-place | | — |
| — |
| — |
| — |
| — |
| — |
| — |
| — |
| — |
| — |
|
| | | — |
| — |
| — |
| — |
| 2 |
| 4 |
| (13 | ) | — |
| — |
| (7 | ) |
At 31 Decemberg h | | | | | | | | | | | |
| Developed | | — |
| 5 |
| — |
| — |
| 2 |
| 11 |
| 89 |
| — |
| — |
| 107 |
|
| Undeveloped | | — |
| 3 |
| — |
| — |
| — |
| — |
| 52 |
| — |
| — |
| 55 |
|
| | | — |
| 7 |
| — |
| — |
| 2 |
| 11 |
| 141 |
| — |
| — |
| 162 |
|
| Total subsidiaries and equity-accounted entities (BP share) | | | | | | |
| At 1 January | | | | | | | | | | | |
| Developed | | 8 |
| 4 |
| 266 |
| — |
| 2 |
| 22 |
| 103 |
| — |
| 5 |
| 409 |
|
| Undeveloped | | 6 |
| 3 |
| 246 |
| — |
| 25 |
| 4 |
| 51 |
| — |
| — |
| 335 |
|
| | | 14 |
| 7 |
| 511 |
| — |
| 27 |
| 26 |
| 154 |
| — |
| 5 |
| 744 |
|
| At 31 December | | | | | | | | | | | |
| Developed | | 8 |
| 5 |
| 229 |
| — |
| 4 |
| 23 |
| 89 |
| — |
| 4 |
| 363 |
|
| Undeveloped | | 5 |
| 3 |
| 250 |
| — |
| 21 |
| 4 |
| 52 |
| — |
| — |
| 334 |
|
| | | 13 |
| 7 |
| 479 |
| — |
| 25 |
| 27 |
| 141 |
| — |
| 4 |
| 697 |
|
a Proved reserves exclude royalties due to others, whether payable in cash or in kind, where the royalty owner has a direct interest in the underlying production and the option and ability to make lifting and sales arrangements independently.
b Because of rounding, some totals may not exactly agree with the sum of their component parts.
c Includes 94 million barrels of NGL associated with Assets Held for Sale in the USA.
d Excludes NGLs from processing plants in which an interest is held of less than 1 thousand barrels per day for subsidiaries and 3 thousand barrels per day for equity-accounted entities.
e Includes 7 million barrels of NGL in respect of the 30% non-controlling interest in BP Trinidad and Tobago LLC.
f Volumes of equity-accounted entities include volumes of equity-accounted investments of those entities.
g Includes 11 million barrels of NGLs in respect of the 7.90% non-controlling interest in Rosneft.
h Total proved NGL reserves held as part of our equity interest in Rosneft is 141 million barrels, comprising less than 1 million barrels in Egypt, Venezuela, Vietnam and Canada, and 141 million barrels in Russia.
|
| | | | | | | | | | | | | |
240244 | | BPbp Annual Report and Form 20-F 2019
2020 | | |
Movements in estimated net proved reserves -– continued
| | | | | | | | | | | | | | | | | | | | | | | | | | | | | | | | | | | |
| | million barrels |
Total liquidsa b | | | | | | | | | | 2019 |
| | Europe | North
America | South
America | Africa | Asia | Australasia | Total |
| | UK | Rest of
Europe | USc d | Rest of
North
America | | | Russia | Rest of
Asia | | |
| Subsidiaries | | | | | | | | | | | |
| At 1 January | | | | | | | | | | | |
| Developed | | 231 | | — | | 1,228 | | 43 | | 10 | | 237 | | — | | 1,126 | | 35 | | 2,910 | |
| Undeveloped | | 249 | | — | | 1,048 | | 190 | | 30 | | 40 | | — | | 482 | | 5 | | 2,044 | |
| | 480 | | — | | 2,276 | | 234 | | 41 | | 277 | | — | | 1,608 | | 39 | | 4,954 | |
| Changes attributable to | | | | | | | | | | | |
| Revisions of previous estimates | | (24) | | — | | 26 | | (8) | | — | | 40 | | — | | 104 | | 2 | | 140 | |
| Improved recovery | | 1 | | — | | 252 | | 1 | | — | | — | | — | | — | | — | | 254 | |
| Purchases of reserves-in-place | | — | | — | | — | | — | | — | | — | | — | | 1 | | — | | 1 | |
| Discoveries and extensions | | — | | — | | 35 | | — | | — | | — | | — | | 11 | | — | | 46 | |
Productione | | (38) | | — | | (176) | | (9) | | (6) | | (60) | | — | | (125) | | (7) | | (420) | |
| Sales of reserves-in-place | | — | | — | | (28) | | — | | — | | (45) | | — | | — | | — | | (74) | |
| | (60) | | — | | 109 | | (16) | | (6) | | (65) | | — | | (9) | | (5) | | (52) | |
At 31 Decemberf | | | | | | | | | | | |
| Developed | | 214 | | — | | 1,292 | | 40 | | 9 | | 168 | | — | | 1,074 | | 30 | | 2,828 | |
| Undeveloped | | 205 | | — | | 1,092 | | 179 | | 26 | | 43 | | — | | 525 | | 4 | | 2,074 | |
| | 420 | | — | | 2,384 | | 218 | | 35 | | 212 | | — | | 1,599 | | 34 | | 4,902 | |
Equity-accounted entities (bp share)g | | | | | | | | | | | |
| At 1 January | | | | | | | | | | | |
| Developed | | — | | 60 | | — | | — | | 293 | | 8 | | 3,293 | | — | | — | | 3,655 | |
| Undeveloped | | — | | 104 | | — | | 19 | | 259 | | — | | 2,465 | | — | | — | | 2,846 | |
| | — | | 164 | | — | | 19 | | 552 | | 8 | | 5,758 | | — | | — | | 6,502 | |
| Changes attributable to | | | | | | | | | | | |
| Revisions of previous estimates | | — | | 2 | | — | | 1 | | (11) | | 7 | | 146 | | — | | — | | 145 | |
| Improved recovery | | — | | 5 | | — | | — | | — | | — | | — | | — | | — | | 5 | |
| Purchases of reserves-in-place | | — | | — | | — | | — | | — | | — | | 7 | | — | | — | | 7 | |
| Discoveries and extensions | | — | | — | | — | | — | | 33 | | — | | 277 | | — | | — | | 310 | |
| Production | | — | | (14) | | — | | — | | (24) | | (2) | | (346) | | — | | — | | (386) | |
| Sales of reserves-in-place | | — | | — | | — | | — | | — | | — | | (6) | | — | | — | | (6) | |
| | — | | (7) | | — | | 1 | | (1) | | 5 | | 78 | | — | | — | | 75 | |
At 31 Decemberh i | | | | | | | | | | | |
| Developed | | — | | 120 | | — | | — | | 293 | | 13 | | 3,248 | | — | | — | | 3,675 | |
| Undeveloped | | — | | 37 | | — | | 20 | | 257 | | — | | 2,588 | | — | | — | | 2,902 | |
| | — | | 157 | | — | | 20 | | 550 | | 13 | | 5,836 | | — | | — | | 6,576 | |
| Total subsidiaries and equity-accounted entities (bp share) | | | | | | | |
| At 1 January | | | | | | | | | | | |
| Developed | | 231 | | 60 | | 1,228 | | 44 | | 303 | | 245 | | 3,293 | | 1,126 | | 35 | | 6,565 | |
| Undeveloped | | 249 | | 104 | | 1,048 | | 209 | | 289 | | 40 | | 2,465 | | 482 | | 5 | | 4,890 | |
| | 480 | | 164 | | 2,276 | | 253 | | 593 | | 285 | | 5,758 | | 1,608 | | 39 | | 11,456 | |
| At 31 December | | | | | | | | | | | |
| Developed | | 214 | | 120 | | 1,292 | | 40 | | 302 | | 181 | | 3,248 | | 1,074 | | 30 | | 6,502 | |
| Undeveloped | | 205 | | 37 | | 1,092 | | 198 | | 283 | | 43 | | 2,588 | | 525 | | 4 | | 4,976 | |
| | 420 | | 157 | | 2,384 | | 238 | | 585 | | 224 | | 5,836 | | 1,599 | | 34 | | 11,478 | |
|
| | | | | | | | | | | | | | | | | | | | | |
| | | | | | | | | | | million barrels | |
Total liquidsa b | | | | | | | | | | | 2019 |
|
| | | Europe | North America | South America | Africa | Asia | Australasia | Total |
|
| | | UK |
| Rest of Europe |
| USc d |
| Rest of North America |
| | | Russia |
| Rest of Asia |
| | |
| Subsidiaries | | | | | | | | | | | |
| At 1 January | | | | | | | | | | | |
| Developed | | 231 |
| — |
| 1,228 |
| 43 |
| 10 |
| 237 |
| — |
| 1,126 |
| 35 |
| 2,910 |
|
| Undeveloped | | 249 |
| — |
| 1,048 |
| 190 |
| 30 |
| 40 |
| — |
| 482 |
| 5 |
| 2,044 |
|
| | | 480 |
| — |
| 2,276 |
| 234 |
| 41 |
| 277 |
| — |
| 1,608 |
| 39 |
| 4,954 |
|
| Changes attributable to | | | | | | | | | | | |
| Revisions of previous estimates | | (24 | ) | — |
| 26 |
| (8 | ) | — |
| 40 |
| — |
| 104 |
| 2 |
| 140 |
|
| Improved recovery | | 1 |
| — |
| 252 |
| 1 |
| — |
| — |
| — |
| — |
| — |
| 254 |
|
| Purchases of reserves-in-place | | — |
| — |
| — |
| — |
| — |
| — |
| — |
| 1 |
| — |
| 1 |
|
| Discoveries and extensions | | — |
| — |
| 35 |
| — |
| — |
| — |
| — |
| 11 |
| — |
| 46 |
|
Productione | | (38 | ) | — |
| (176 | ) | (9 | ) | (6 | ) | (60 | ) | — |
| (125 | ) | (7 | ) | (420 | ) |
| Sales of reserves-in-place | | — |
| — |
| (28 | ) | — |
| — |
| (45 | ) | — |
| — |
| — |
| (74 | ) |
| | | (60 | ) | — |
| 109 |
| (16 | ) | (6 | ) | (65 | ) | — |
| (9 | ) | (5 | ) | (52 | ) |
At 31 Decemberf | | | | | | | | | | | |
| Developed | | 214 |
| — |
| 1,292 |
| 40 |
| 9 |
| 168 |
| — |
| 1,074 |
| 30 |
| 2,828 |
|
| Undeveloped | | 205 |
| — |
| 1,092 |
| 179 |
| 26 |
| 43 |
| — |
| 525 |
| 4 |
| 2,074 |
|
| | | 420 |
| — |
| 2,384 |
| 218 |
| 35 |
| 212 |
| — |
| 1,599 |
| 34 |
| 4,902 |
|
Equity-accounted entities (BP share)g | | | | | | | | | | | |
| At 1 January | | | | | | | | | | | |
| Developed | | — |
| 60 |
| — |
| — |
| 293 |
| 8 |
| 3,293 |
| — |
| — |
| 3,655 |
|
| Undeveloped | | — |
| 104 |
| — |
| 19 |
| 259 |
| — |
| 2,465 |
| — |
| — |
| 2,846 |
|
| | | — |
| 164 |
| — |
| 19 |
| 552 |
| 8 |
| 5,758 |
| — |
| — |
| 6,502 |
|
| Changes attributable to | | | | | | | | | | | |
| Revisions of previous estimates | | — |
| 2 |
| — |
| 1 |
| (11 | ) | 7 |
| 146 |
| — |
| — |
| 145 |
|
| Improved recovery | | — |
| 5 |
| — |
| — |
| — |
| — |
| — |
| — |
| — |
| 5 |
|
| Purchases of reserves-in-place | | — |
| — |
| — |
| — |
| — |
| — |
| 7 |
| — |
| — |
| 7 |
|
| Discoveries and extensions | | — |
| — |
| — |
| — |
| 33 |
| — |
| 277 |
| — |
| — |
| 310 |
|
| Production | | — |
| (14 | ) | — |
| — |
| (24 | ) | (2 | ) | (346 | ) | — |
| — |
| (386 | ) |
| Sales of reserves-in-place | | — |
| — |
| — |
| — |
| — |
| — |
| (6 | ) | — |
| — |
| (6 | ) |
| | | — |
| (7 | ) | — |
| 1 |
| (1 | ) | 5 |
| 78 |
| — |
| — |
| 75 |
|
At 31 Decemberh i | | | | | | | | | | | |
| Developed | | — |
| 120 |
| — |
| — |
| 293 |
| 13 |
| 3,248 |
| — |
| — |
| 3,675 |
|
| Undeveloped | | — |
| 37 |
| — |
| 20 |
| 257 |
| — |
| 2,588 |
| — |
| — |
| 2,902 |
|
| | | — |
| 157 |
| — |
| 20 |
| 550 |
| 13 |
| 5,836 |
| — |
| — |
| 6,576 |
|
| Total subsidiaries and equity-accounted entities (BP share) | | | | | | | |
| At 1 January | | | | | | | | | | | |
| Developed | | 231 |
| 60 |
| 1,228 |
| 44 |
| 303 |
| 245 |
| 3,293 |
| 1,126 |
| 35 |
| 6,565 |
|
| Undeveloped | | 249 |
| 104 |
| 1,048 |
| 209 |
| 289 |
| 40 |
| 2,465 |
| 482 |
| 5 |
| 4,890 |
|
| | | 480 |
| 164 |
| 2,276 |
| 253 |
| 593 |
| 285 |
| 5,758 |
| 1,608 |
| 39 |
| 11,456 |
|
| At 31 December | | | | | | | | | | | |
| Developed | | 214 |
| 120 |
| 1,292 |
| 40 |
| 302 |
| 181 |
| 3,248 |
| 1,074 |
| 30 |
| 6,502 |
|
| Undeveloped | | 205 |
| 37 |
| 1,092 |
| 198 |
| 283 |
| 43 |
| 2,588 |
| 525 |
| 4 |
| 4,976 |
|
| | | 420 |
| 157 |
| 2,384 |
| 238 |
| 585 |
| 224 |
| 5,836 |
| 1,599 |
| 34 |
| 11,478 |
|
a Proved reserves exclude royalties due to others, whether payable in cash or in kind, where the royalty owner has a direct interest in the underlying production and the option and ability to make lifting and sales arrangements independently.
bBecause of rounding, some totals may not exactly agree with the sum of their component parts.
c Proved reserves in the Prudhoe Bay field in Alaska include an estimated 4.5 million barrels of oil equivalent upon which a net profits royalty will be payable, over the life of the field under the terms of the BP Prudhoe Bay Royalty Trust.
d Includes 456 million barrels associated with Assets Held for Sale in the USA.
e Excludes NGLs from processing plants in which an interest is held of less than 1 thousand barrels per day for subsidiaries and 3 thousand barrels per day for equity-accounted entities.
f Also includes 11 million barrels in respect of the 30% non-controlling interest in BP Trinidad and Tobago LLC.
gVolumes of equity-accounted entities include volumes of equity-accounted investments of those entities.
h Includes 357 million barrels in respect of the non-controlling interest in Rosneft, including 26 mmboe held through BP’sbp’s interests in Russia other than Rosneft.
iTotal proved liquid reserves held as part of our equity interest in Rosneft is 5,745 million barrels, comprising 35 million barrels in Venezuela, less than 1 million barrels in Iraq, Canada, Egypt and Vietnam and 5,709 million barrels in Russia.
|
| | | | | | | | | | | | | |
| BP
| bp Annual Report and Form 20-F 20192020 | | 241245 |
Movements in estimated net proved reserves – continued
| | | | | | | | | | | | | | | | | | | | | | | | | | | | | | | | | | | |
| | | | | | | | | | billion cubic feet |
Natural gasa b | | | | | | | | | | 2019 |
| | Europe | North
America | South
America | Africa | Asia | Australasia | Total |
| | UK | Rest of
Europe | USc | Rest of
North
America | | | Russia | Rest of
Asia | | |
| Subsidiaries | | | | | | | | | | | |
| At 1 January | | | | | | | | | | | |
| Developed | | 439 | | — | | 6,270 | | — | | 2,168 | | 1,313 | | — | | 3,599 | | 2,630 | | 16,420 | |
| Undeveloped | | 343 | | — | | 5,056 | | — | | 3,073 | | 1,067 | | — | | 3,218 | | 1,179 | | 13,936 | |
| | 782 | | — | | 11,326 | | — | | 5,241 | | 2,380 | | — | | 6,817 | | 3,809 | | 30,355 | |
| Changes attributable to | | | | | | | | | | | |
| Revisions of previous estimates | | (34) | | — | | (1,877) | | 1 | | (263) | | (4) | | — | | 285 | | (129) | | (2,022) | |
| Improved recovery | | 9 | | — | | 307 | | — | | — | | — | | — | | — | | — | | 315 | |
| Purchases of reserves-in-place | | — | | — | | — | | — | | — | | — | | — | | 50 | | — | | 50 | |
| Discoveries and extensions | | — | | — | | 11 | | — | | 178 | | — | | — | | 299 | | — | | 488 | |
Productiond | | (57) | | — | | (923) | | (1) | | (729) | | (450) | | — | | (383) | | (291) | | (2,834) | |
| Sales of reserves-in-place | | — | | — | | (386) | | — | | — | | (21) | | — | | — | | — | | (406) | |
| | (82) | | — | | (2,869) | | — | | (814) | | (475) | | — | | 251 | | (420) | | (4,410) | |
At 31 Decembere | | | | | | | | | | | |
| Developed | | 493 | | — | | 6,330 | | — | | 2,192 | | 1,163 | | — | | 3,667 | | 2,256 | | 16,101 | |
| Undeveloped | | 207 | | — | | 2,127 | | — | | 2,235 | | 742 | | — | | 3,401 | | 1,132 | | 9,844 | |
| | 700 | | — | | 8,458 | | — | | 4,427 | | 1,905 | | — | | 7,068 | | 3,389 | | 25,946 | |
Equity-accounted entities (bp share)f | | | | | | | | | | | |
| At 1 January | | | | | | | | | | | |
| Developed | | — | | 107 | | — | | — | | 1,207 | | 391 | | 7,798 | | 12 | | — | | 9,515 | |
| Undeveloped | | — | | 55 | | — | | 4 | | 446 | | 143 | | 8,719 | | 4 | | — | | 9,369 | |
| | — | | 161 | | — | | 4 | | 1,653 | | 534 | | 16,517 | | 15 | | — | | 18,884 | |
| Changes attributable to | | | | | | | | | | | |
| Revisions of previous estimates | | — | | 9 | | — | | 3 | | (120) | | 38 | | 789 | | — | | — | | 718 | |
| Improved recovery | | — | | 15 | | — | | — | | — | | — | | — | | — | | — | | 15 | |
| Purchases of reserves-in-place | | — | | — | | — | | — | | — | | — | | — | | — | | — | | — | |
| Discoveries and extensions | | — | | — | | — | | — | | 180 | | — | | 534 | | — | | — | | 714 | |
Productiond | | — | | (22) | | — | | — | | (135) | | (65) | | (448) | | (5) | | — | | (676) | |
| Sales of reserves-in-place | | — | | — | | — | | — | | — | | — | | — | | — | | — | | — | |
| | — | | 2 | | — | | 3 | | (75) | | (27) | | 874 | | (5) | | — | | 772 | |
At 31 Decemberg h | | | | | | | | | | | |
| Developed | | — | | 108 | | — | | — | | 1,130 | | 507 | | 9,324 | | 10 | | — | | 11,079 | |
| Undeveloped | | — | | 56 | | — | | 6 | | 447 | | — | | 8,067 | | — | | — | | 8,576 | |
| | — | | 164 | | — | | 6 | | 1,577 | | 507 | | 17,391 | | 10 | | — | | 19,656 | |
| Total subsidiaries and equity-accounted entities (bp share) | | | | | | | |
| At 1 January | | | | | | | | | | | |
| Developed | | 439 | | 107 | | 6,270 | | — | | 3,375 | | 1,704 | | 7,798 | | 3,610 | | 2,630 | | 25,934 | |
| Undeveloped | | 343 | | 55 | | 5,056 | | 4 | | 3,519 | | 1,210 | | 8,719 | | 3,221 | | 1,179 | | 23,305 | |
| | 782 | | 161 | | 11,326 | | 4 | | 6,894 | | 2,914 | | 16,517 | | 6,832 | | 3,809 | | 49,239 | |
| At 31 December | | | | | | | | | | | |
| Developed | | 493 | | 108 | | 6,330 | | — | | 3,323 | | 1,670 | | 9,324 | | 3,677 | | 2,256 | | 27,181 | |
| Undeveloped | | 207 | | 56 | | 2,127 | | 6 | | 2,682 | | 742 | | 8,067 | | 3,401 | | 1,132 | | 18,421 | |
| | 700 | | 164 | | 8,458 | | 6 | | 6,004 | | 2,412 | | 17,391 | | 7,078 | | 3,389 | | 45,601 | |
|
| | | | | | | | | | | | | | | | | | | | | |
| | | | | | | | | | | billion cubic feet | |
Natural gasa b | | | | | | | | | | 2019 | |
| | | Europe | North America | South America | Africa | Asia | Australasia | Total |
|
| | | UK |
| Rest of Europe |
| USc |
| Rest of North America |
| | | Russia |
| Rest of Asia |
| | |
| Subsidiaries | | | | | | | | | | | |
| At 1 January | | | | | | | | | | | |
| Developed | | 439 |
| — |
| 6,270 |
| — |
| 2,168 |
| 1,313 |
| — |
| 3,599 |
| 2,630 |
| 16,420 |
|
| Undeveloped | | 343 |
| — |
| 5,056 |
| — |
| 3,073 |
| 1,067 |
| — |
| 3,218 |
| 1,179 |
| 13,936 |
|
| | | 782 |
| — |
| 11,326 |
| — |
| 5,241 |
| 2,380 |
| — |
| 6,817 |
| 3,809 |
| 30,355 |
|
| Changes attributable to | | | | | | | | | | | |
| Revisions of previous estimates | | (34 | ) | — |
| (1,877 | ) | 1 |
| (263 | ) | (4 | ) | — |
| 285 |
| (129 | ) | (2,022 | ) |
| Improved recovery | | 9 |
| — |
| 307 |
| — |
| — |
| — |
| — |
| — |
| — |
| 315 |
|
| Purchases of reserves-in-place | | — |
| — |
| — |
| — |
| — |
| — |
| — |
| 50 |
| — |
| 50 |
|
| Discoveries and extensions | | — |
| — |
| 11 |
| — |
| 178 |
| — |
| — |
| 299 |
| — |
| 488 |
|
Productiond | | (57 | ) | — |
| (923 | ) | (1 | ) | (729 | ) | (450 | ) | — |
| (383 | ) | (291 | ) | (2,834 | ) |
| Sales of reserves-in-place | | — |
| — |
| (386 | ) | — |
| — |
| (21 | ) | — |
| — |
| — |
| (406 | ) |
| | | (82 | ) | — |
| (2,869 | ) | — |
| (814 | ) | (475 | ) | — |
| 251 |
| (420 | ) | (4,410 | ) |
At 31 Decembere | | | | | | | | | | | |
| Developed | | 493 |
| — |
| 6,330 |
| — |
| 2,192 |
| 1,163 |
| — |
| 3,667 |
| 2,256 |
| 16,101 |
|
| Undeveloped | | 207 |
| — |
| 2,127 |
| — |
| 2,235 |
| 742 |
| — |
| 3,401 |
| 1,132 |
| 9,844 |
|
| | | 700 |
| — |
| 8,458 |
| — |
| 4,427 |
| 1,905 |
| — |
| 7,068 |
| 3,389 |
| 25,946 |
|
Equity-accounted entities (BP share)f | | | | | | | | | | | |
| At 1 January | | | | | | | | | | | |
| Developed | | — |
| 107 |
| — |
| — |
| 1,207 |
| 391 |
| 7,798 |
| 12 |
| — |
| 9,515 |
|
| Undeveloped | | — |
| 55 |
| — |
| 4 |
| 446 |
| 143 |
| 8,719 |
| 4 |
| — |
| 9,369 |
|
| | | — |
| 161 |
| — |
| 4 |
| 1,653 |
| 534 |
| 16,517 |
| 15 |
| — |
| 18,884 |
|
| Changes attributable to | | | | | | | | | | | |
| Revisions of previous estimates | | — |
| 9 |
| — |
| 3 |
| (120 | ) | 38 |
| 789 |
| — |
| — |
| 718 |
|
| Improved recovery | | — |
| 15 |
| — |
| — |
| — |
| — |
| — |
| — |
| — |
| 15 |
|
| Purchases of reserves-in-place | | — |
| — |
| — |
| — |
| — |
| — |
| — |
| — |
| — |
| — |
|
| Discoveries and extensions | | — |
| — |
| — |
| — |
| 180 |
| — |
| 534 |
| — |
| — |
| 714 |
|
Productiond | | — |
| (22 | ) | — |
| — |
| (135 | ) | (65 | ) | (448 | ) | (5 | ) | — |
| (676 | ) |
| Sales of reserves-in-place | | — |
| — |
| — |
| — |
| — |
| — |
| — |
| — |
| — |
| — |
|
| | | — |
| 2 |
| — |
| 3 |
| (75 | ) | (27 | ) | 874 |
| (5 | ) | — |
| 772 |
|
At 31 Decemberg h | | | | | | | | | | | |
| Developed | | — |
| 108 |
| — |
| — |
| 1,130 |
| 507 |
| 9,324 |
| 10 |
| — |
| 11,079 |
|
| Undeveloped | | — |
| 56 |
| — |
| 6 |
| 447 |
| — |
| 8,067 |
| — |
| — |
| 8,576 |
|
| | | — |
| 164 |
| — |
| 6 |
| 1,577 |
| 507 |
| 17,391 |
| 10 |
| — |
| 19,656 |
|
| Total subsidiaries and equity-accounted entities (BP share) | | | | |
| At 1 January | | | | | | | | | | | |
| Developed | | 439 |
| 107 |
| 6,270 |
| — |
| 3,375 |
| 1,704 |
| 7,798 |
| 3,610 |
| 2,630 |
| 25,934 |
|
| Undeveloped | | 343 |
| 55 |
| 5,056 |
| 4 |
| 3,519 |
| 1,210 |
| 8,719 |
| 3,221 |
| 1,179 |
| 23,305 |
|
| | | 782 |
| 161 |
| 11,326 |
| 4 |
| 6,894 |
| 2,914 |
| 16,517 |
| 6,832 |
| 3,809 |
| 49,239 |
|
| At 31 December | | | | | | | | | | | |
| Developed | | 493 |
| 108 |
| 6,330 |
| — |
| 3,323 |
| 1,670 |
| 9,324 |
| 3,677 |
| 2,256 |
| 27,181 |
|
| Undeveloped | | 207 |
| 56 |
| 2,127 |
| 6 |
| 2,682 |
| 742 |
| 8,067 |
| 3,401 |
| 1,132 |
| 18,421 |
|
| | | 700 |
| 164 |
| 8,458 |
| 6 |
| 6,004 |
| 2,412 |
| 17,391 |
| 7,078 |
| 3,389 |
| 45,601 |
|
a Proved reserves exclude royalties due to others, whether payable in cash or in kind, where the royalty owner has a direct interest in the underlying production and the option and ability to make lifting and sales arrangements independently.
b Because of rounding, some totals may not exactly agree with the sum of their component parts.
c Includes 3,054 billion cubic feet of natural gas associated with Assets Held for Sale in the USA.
d Includes 188 billion cubic feet of natural gas consumed in operations, 146 billion cubic feet in subsidiaries, 42 billion cubic feet in equity-accounted entities.
eIncludes 1,330 billion cubic feet of natural gas in respect of the 30% non-controlling interest in BP Trinidad and Tobago LLC.
fVolumes of equity-accounted entities include volumes of equity-accounted investments of those entities.
g Includes 1,433 billion cubic feet of natural gas in respect of the 9.72% non-controlling interest in Rosneft including 569 billion cubic feet held through BP’sbp’s interests in Russia other than Rosneft.
h Total proved gas reserves held as part of our equity interest in Rosneft is 14,705 billion cubic feet, comprising 28 billion cubic feet in Venezuela, 10 billion cubic feet in Vietnam, 171 billion cubic feet in Egypt and 14,495 billion cubic feet in Russia.
|
| | | | | | | | | | | | | |
242246 | | BPbp Annual Report and Form 20-F 2019
2020 | | |
Movements in estimated net proved reserves – continued
| | | | | | | | | | | | | | | | | | | | | | | | | | | | | | | | | | | |
| | | | | | | | | million barrels of oil equivalentc |
Total hydrocarbonsa b | | | | | | | | | | 2019 |
| | Europe | North
America | South
America | Africa | Asia | Australasia | Total |
| | UK | Rest of
Europe | USd e | Rest of
North
America | | | Russia | Rest of
Asia | | |
| Subsidiaries | | | | | | | | | | | |
| At 1 January | | | | | | | | | | | |
| Developed | | 307 | | — | | 2,309 | | 43 | | 384 | | 464 | | — | | 1,746 | | 488 | | 5,741 | |
| Undeveloped | | 308 | | — | | 1,919 | | 190 | | 560 | | 224 | | — | | 1,037 | | 208 | | 4,447 | |
| | 615 | | — | | 4,228 | | 234 | | 944 | | 687 | | — | | 2,783 | | 696 | | 10,188 | |
| Changes attributable to | | | | | | | | | | | |
| Revisions of previous estimates | | (29) | | — | | (297) | | (8) | | (45) | | 39 | | — | | 153 | | (21) | | (208) | |
| Improved recovery | | 3 | | — | | 305 | | 1 | | — | | — | | — | | — | | — | | 309 | |
| Purchases of reserves-in-place | | — | | — | | — | | — | | — | | — | | — | | 10 | | — | | 10 | |
| Discoveries and extensions | | — | | — | | 36 | | — | | 31 | | — | | — | | 63 | | — | | 130 | |
Productionf g | | (48) | | — | | (335) | | (9) | | (131) | | (137) | | — | | (191) | | (57) | | (908) | |
| Sales of reserves-in-place | | — | | — | | (95) | | — | | — | | (49) | | — | | — | | — | | (144) | |
| | (74) | | — | | (386) | | (16) | | (146) | | (147) | | — | | 35 | | (78) | | (813) | |
At 31 Decemberh | | | | | | | | | | | |
| Developed | | 300 | | — | | 2,384 | | 40 | | 387 | | 369 | | — | | 1,707 | | 419 | | 5,604 | |
| Undeveloped | | 241 | | — | | 1,459 | | 179 | | 411 | | 171 | | — | | 1,111 | | 199 | | 3,771 | |
| | 540 | | — | | 3,842 | | 218 | | 798 | | 540 | | — | | 2,818 | | 618 | | 9,375 | |
Equity-accounted entities (bp share)i | | | | | | | | | | | |
| At 1 January | | | | | | | | | | | |
| Developed | | — | | 79 | | — | | — | | 501 | | 76 | | 4,638 | | 2 | | — | | 5,296 | |
| Undeveloped | | — | | 113 | | — | | 20 | | 336 | | 25 | | 3,968 | | 1 | | — | | 4,462 | |
| | — | | 192 | | — | | 20 | | 837 | | 101 | | 8,605 | | 3 | | — | | 9,757 | |
| Changes attributable to | | | | | | | | | | | |
| Revisions of previous estimates | | — | | 4 | | — | | 1 | | (31) | | 13 | | 282 | | — | | — | | 269 | |
| Improved recovery | | — | | 7 | | — | | — | | — | | — | | — | | — | | — | | 7 | |
| Purchases of reserves-in-place | | — | | — | | — | | — | | — | | — | | 7 | | — | | — | | 7 | |
| Discoveries and extensions | | — | | — | | — | | — | | 64 | | — | | 369 | | — | | — | | 434 | |
Productionf | | — | | (17) | | — | | — | | (47) | | (13) | | (424) | | (1) | | — | | (503) | |
| Sales of reserves-in-place | | — | | — | | — | | — | | — | | — | | (6) | | — | | — | | (6) | |
| | — | | (6) | | — | | 1 | | (14) | | — | | 229 | | (1) | | — | | 208 | |
At 31 Decemberj k | | | | | | | | | | | |
| Developed | | — | | 139 | | — | | — | | 488 | | 100 | | 4,856 | | 2 | | — | | 5,585 | |
| Undeveloped | | — | | 47 | | — | | 21 | | 334 | | — | | 3,978 | | — | | — | | 4,381 | |
| | — | | 186 | | — | | 21 | | 822 | | 100 | | 8,834 | | 2 | | — | | 9,965 | |
| Total subsidiaries and equity-accounted entities (bp share) | | | | | | | |
| At 1 January | | | | | | | | | | | |
| Developed | | 307 | | 79 | | 2,309 | | 44 | | 885 | | 539 | | 4,638 | | 1,749 | | 488 | | 11,037 | |
| Undeveloped | | 308 | | 113 | | 1,919 | | 210 | | 896 | | 249 | | 3,968 | | 1,037 | | 208 | | 8,908 | |
| | 615 | | 192 | | 4,228 | | 253 | | 1,781 | | 788 | | 8,605 | | 2,786 | | 696 | | 19,945 | |
| At 31 December | | | | | | | | | | | |
| Developed | | 300 | | 139 | | 2,384 | | 40 | | 875 | | 469 | | 4,856 | | 1,708 | | 419 | | 11,189 | |
| Undeveloped | | 241 | | 47 | | 1,459 | | 199 | | 746 | | 171 | | 3,978 | | 1,112 | | 199 | | 8,152 | |
| | 540 | | 186 | | 3,842 | | 239 | | 1,621 | | 640 | | 8,834 | | 2,820 | | 618 | | 19,341 | |
|
| | | | | | | | | | | | | | | | | | | | | |
| | | | million barrels of oil equivalentc | |
Total hydrocarbonsa b | | | | | | | | | | | 2019 |
|
| | | Europe | North America | South America | Africa | Asia | Australasia | Total |
|
| | | UK |
| Rest of Europe |
| USd e |
| Rest of North America |
| | | Russia |
| Rest of Asia |
| | |
| Subsidiaries | | | | | | | | | | | |
| At 1 January | | | | | | | | | | | |
| Developed | | 307 |
| — |
| 2,309 |
| 43 |
| 384 |
| 464 |
| — |
| 1,746 |
| 488 |
| 5,741 |
|
| Undeveloped | | 308 |
| — |
| 1,919 |
| 190 |
| 560 |
| 224 |
| — |
| 1,037 |
| 208 |
| 4,447 |
|
| | | 615 |
| — |
| 4,228 |
| 234 |
| 944 |
| 687 |
| — |
| 2,783 |
| 696 |
| 10,188 |
|
| Changes attributable to | | | | | | | | | | | |
| Revisions of previous estimates | | (29 | ) | — |
| (297 | ) | (8 | ) | (45 | ) | 39 |
| — |
| 153 |
| (21 | ) | (208 | ) |
| Improved recovery | | 3 |
| — |
| 305 |
| 1 |
| — |
| — |
| — |
| — |
| — |
| 309 |
|
| Purchases of reserves-in-place | | — |
| — |
| — |
| — |
| — |
| — |
| — |
| 10 |
| — |
| 10 |
|
| Discoveries and extensions | | — |
| — |
| 36 |
| — |
| 31 |
| — |
| — |
| 63 |
| — |
| 130 |
|
Productionf g | | (48 | ) | — |
| (335 | ) | (9 | ) | (131 | ) | (137 | ) | — |
| (191 | ) | (57 | ) | (908 | ) |
| Sales of reserves-in-place | | — |
| — |
| (95 | ) | — |
| — |
| (49 | ) | — |
| — |
| — |
| (144 | ) |
| | | (74 | ) | — |
| (386 | ) | (16 | ) | (146 | ) | (147 | ) | — |
| 35 |
| (78 | ) | (813 | ) |
At 31 Decemberh | | | | | | | | | | | |
| Developed | | 300 |
| — |
| 2,384 |
| 40 |
| 387 |
| 369 |
| — |
| 1,707 |
| 419 |
| 5,604 |
|
| Undeveloped | | 241 |
| — |
| 1,459 |
| 179 |
| 411 |
| 171 |
| — |
| 1,111 |
| 199 |
| 3,771 |
|
| | | 540 |
| — |
| 3,842 |
| 218 |
| 798 |
| 540 |
| — |
| 2,818 |
| 618 |
| 9,375 |
|
Equity-accounted entities (BP share)i | | | | | | | | | | | |
| At 1 January | | | | | | | | | | | |
| Developed | | — |
| 79 |
| — |
| — |
| 501 |
| 76 |
| 4,638 |
| 2 |
| — |
| 5,296 |
|
| Undeveloped | | — |
| 113 |
| — |
| 20 |
| 336 |
| 25 |
| 3,968 |
| 1 |
| — |
| 4,462 |
|
| | | — |
| 192 |
| — |
| 20 |
| 837 |
| 101 |
| 8,605 |
| 3 |
| — |
| 9,757 |
|
| Changes attributable to | | | | | | | | | | | |
| Revisions of previous estimates | | — |
| 4 |
| — |
| 1 |
| (31 | ) | 13 |
| 282 |
| — |
| — |
| 269 |
|
| Improved recovery | | — |
| 7 |
| — |
| — |
| — |
| — |
| — |
| — |
| — |
| 7 |
|
| Purchases of reserves-in-place | | — |
| — |
| — |
| — |
| — |
| — |
| 7 |
| — |
| — |
| 7 |
|
| Discoveries and extensions | | — |
| — |
| — |
| — |
| 64 |
| — |
| 369 |
| — |
| — |
| 434 |
|
Productionf | | — |
| (17 | ) | — |
| — |
| (47 | ) | (13 | ) | (424 | ) | (1 | ) | — |
| (503 | ) |
| Sales of reserves-in-place | | — |
| — |
| — |
| — |
| — |
| — |
| (6 | ) | — |
| — |
| (6 | ) |
| | | — |
| (6 | ) | — |
| 1 |
| (14 | ) | — |
| 229 |
| (1 | ) | — |
| 208 |
|
At 31 Decemberj k | | | | | | | | | | | |
| Developed | | — |
| 139 |
| — |
| — |
| 488 |
| 100 |
| 4,856 |
| 2 |
| — |
| 5,585 |
|
| Undeveloped | | — |
| 47 |
| — |
| 21 |
| 334 |
| — |
| 3,978 |
| — |
| — |
| 4,381 |
|
| | | — |
| 186 |
| — |
| 21 |
| 822 |
| 100 |
| 8,834 |
| 2 |
| — |
| 9,965 |
|
| Total subsidiaries and equity-accounted entities (BP share) | | | | | | | |
| At 1 January | | | | | | | | | | | |
| Developed | | 307 |
| 79 |
| 2,309 |
| 44 |
| 885 |
| 539 |
| 4,638 |
| 1,749 |
| 488 |
| 11,037 |
|
| Undeveloped | | 308 |
| 113 |
| 1,919 |
| 210 |
| 896 |
| 249 |
| 3,968 |
| 1,037 |
| 208 |
| 8,908 |
|
| | | 615 |
| 192 |
| 4,228 |
| 253 |
| 1,781 |
| 788 |
| 8,605 |
| 2,786 |
| 696 |
| 19,945 |
|
| At 31 December | | | | | | | | | | | |
| Developed | | 300 |
| 139 |
| 2,384 |
| 40 |
| 875 |
| 469 |
| 4,856 |
| 1,708 |
| 419 |
| 11,189 |
|
| Undeveloped | | 241 |
| 47 |
| 1,459 |
| 199 |
| 746 |
| 171 |
| 3,978 |
| 1,112 |
| 199 |
| 8,152 |
|
| | | 540 |
| 186 |
| 3,842 |
| 239 |
| 1,621 |
| 640 |
| 8,834 |
| 2,820 |
| 618 |
| 19,341 |
|
a Proved reserves exclude royalties due to others, whether payable in cash or in kind, where the royalty owner has a direct interest in the underlying production and the option and ability to make lifting and sales arrangements independently.
b Because of rounding, some totals may not exactly agree with the sum of their component parts.
c 5.8 billion cubic feet of natural gas = 1 million barrels of oil equivalent.
dProved reserves in the Prudhoe Bay field in Alaska include an estimated 4.5 million barrels of oil equivalent upon which a net profits royalty will be payable, over the life of the field under the terms of the BP Prudhoe Bay Royalty Trust.
e Includes 982 million barrels of oil equivalent associated with Assets Held for Sale in the USA.
f Excludes NGLs from processing plants in which an interest is held of less than 1 thousand barrels per day for subsidiaries and 3 thousand barrels per day for equity-accounted entities.
g Includes 32 million barrels of oil equivalent of natural gas consumed in operations, 25 million barrels of oil equivalent in subsidiaries, 7 million barrels of oil equivalent in equity-accounted entities.
hIncludes 240 million barrels of oil equivalent in respect of the 30% non-controlling interest in BP Trinidad and Tobago LLC.
iVolumes of equity-accounted entities include volumes of equity-accounted investments of those entities.
j Includes 603 million barrels of oil equivalent in respect of the non-controlling interest in Rosneft, including 124 mmboe held through BP’sbp’s interests in Russia other than Rosneft.
k Total proved reserves held as part of our equity interest in Rosneft is 8,281 million barrels of oil equivalent, comprising less than 1 million barrels of oil equivalent in Iraq and Canada, 40 million barrels of oil equivalent in Venezuela, 2 million barrels of oil equivalent in Vietnam, 30 million barrels of oil equivalent in Egypt and 8,208 million barrels of oil equivalent in Russia.
|
| | | | | | | | | | | | | |
| BP
| bp Annual Report and Form 20-F 20192020 | | 243247 |
Movements in estimated net proved reserves – continued
| | | | | | | | | | | | | | | | | | | | | | | | | | | | | | | | | | | |
| | | | | | | | | | | million barrels |
Crude oila b | | | | | | | | | | 2018 |
| | Europe | North
America | South
America | Africa | Asia | Australasia | Total |
| | UK | Rest of
Europe | USc | Rest of
North
America | | | Russia | Rest of
Asia | | |
| Subsidiaries | | | | | | | | | | | |
| At 1 January | | | | | | | | | | | |
| Developed | | 245 | | — | | 932 | | 54 | | 10 | | 281 | | — | | 1,040 | | 31 | | 2,592 | |
| Undeveloped | | 164 | | — | | 492 | | 195 | | 6 | | 28 | | — | | 642 | | 11 | | 1,537 | |
| | | 409 | | — | | 1,423 | | 248 | | 16 | | 309 | | — | | 1,682 | | 42 | | 4,129 | |
| Changes attributable to | | | | | | | | | | | |
| Revisions of previous estimates | | 22 | | — | | 116 | | (6) | | 1 | | 11 | | — | | 40 | | (2) | | 183 | |
| Improved recovery | | — | | — | | 51 | | — | | — | | 1 | | — | | — | | — | | 52 | |
| Purchases of reserves-in-place | | 93 | | — | | 412 | | — | | — | | — | | — | | — | | — | | 504 | |
| Discoveries and extensions | | 15 | | — | | 17 | | — | | — | | 13 | | — | | — | | — | | 46 | |
| Production | | (37) | | — | | (137) | | (9) | | (3) | | (75) | | — | | (114) | | (6) | | (381) | |
| Sales of reserves-in-place | | (37) | | — | | (118) | | — | | — | | — | | — | | — | | — | | (155) | |
| | | 57 | | — | | 341 | | (15) | | (2) | | (50) | | — | | (74) | | (8) | | 249 | |
At 31 Decemberd e | | | | | | | | | | | |
| Developed | | 223 | | — | | 962 | | 43 | | 8 | | 223 | | — | | 1,126 | | 30 | | 2,615 | |
| Undeveloped | | 243 | | — | | 802 | | 190 | | 5 | | 36 | | — | | 482 | | 5 | | 1,763 | |
| | | 466 | | — | | 1,764 | | 234 | | 14 | | 259 | | — | | 1,608 | | 34 | | 4,378 | |
Equity-accounted entities (bp share)f | | | | | | | | |
| At 1 January | | | | | | | | | | | |
| Developed | | — | | 56 | | — | | — | | 285 | | 1 | | 3,124 | | 6 | | — | | 3,473 | |
| Undeveloped | | — | | 89 | | — | | — | | 263 | | — | | 2,251 | | — | | — | | 2,603 | |
| | | — | | 145 | | — | | — | | 548 | | 1 | | 5,374 | | 6 | | — | | 6,076 | |
| Changes attributable to | | | | | | | | | | | |
| Revisions of previous estimates | | — | | 11 | | — | | — | | 7 | | — | | 150 | | — | | — | | 168 | |
| Improved recovery | | — | | 13 | | — | | — | | — | | — | | — | | — | | — | | 13 | |
| Purchases of reserves-in-place | | — | | — | | — | | — | | — | | — | | 89 | | — | | — | | 89 | |
| Discoveries and extensions | | — | | — | | — | | 19 | | 21 | | — | | 326 | | — | | — | | 366 | |
| Production | | — | | (13) | | — | | — | | (25) | | — | | (335) | | (6) | | — | | (379) | |
| Sales of reserves-in-place | | — | | — | | — | | — | | — | | — | | — | | — | | — | | — | |
| | | — | | 12 | | — | | 19 | | 4 | | (1) | | 229 | | (6) | | — | | 257 | |
At 31 Decemberg | | | | | | | | | | | |
| Developed | | — | | 57 | | — | | — | | 293 | | 1 | | 3,190 | | — | | — | | 3,541 | |
| Undeveloped | | — | | 100 | | — | | 19 | | 259 | | — | | 2,414 | | — | | — | | 2,792 | |
| | | — | | 157 | | — | | 19 | | 552 | | 1 | | 5,604 | | — | | — | | 6,333 | |
| Total subsidiaries and equity-accounted entities (bp share) | | | | | | | |
| At 1 January | | | | | | | | | | | |
| Developed | | 245 | | 56 | | 932 | | 54 | | 295 | | 282 | | 3,124 | | 1,047 | | 31 | | 6,064 | |
| Undeveloped | | 164 | | 89 | | 492 | | 195 | | 269 | | 28 | | 2,251 | | 642 | | 11 | | 4,140 | |
| | | 409 | | 145 | | 1,423 | | 249 | | 564 | | 310 | | 5,374 | | 1,688 | | 42 | | 10,205 | |
| At 31 December | | | | | | | | | | | |
| Developed | | 223 | | 57 | | 962 | | 43 | | 302 | | 224 | | 3,190 | | 1,126 | | 30 | | 6,156 | |
| Undeveloped | | 243 | | 100 | | 802 | | 209 | | 264 | | 36 | | 2,414 | | 482 | | 5 | | 4,555 | |
| | | 466 | | 157 | | 1,764 | | 253 | | 566 | | 260 | | 5,604 | | 1,608 | | 34 | | 10,711 | |
|
| | | | | | | | | | | | | | | | | | | | | |
| | | | | | | | | | | million barrels | |
Crude oila b | | | | | | | | | | 2018 | |
| | | Europe | North America | South America | Africa | Asia | Australasia | Total |
|
| | | UK |
| Rest of Europe |
| USc |
| Rest of North America |
| | | Russia |
| Rest of Asia |
| | |
| Subsidiaries | | | | | | | | | | | |
| At 1 January | | | | | | | | | | | |
| Developed | | 245 |
| — |
| 932 |
| 54 |
| 10 |
| 281 |
| — |
| 1,040 |
| 31 |
| 2,592 |
|
| Undeveloped | | 164 |
| — |
| 492 |
| 195 |
| 6 |
| 28 |
| — |
| 642 |
| 11 |
| 1,537 |
|
| | | 409 |
| — |
| 1,423 |
| 248 |
| 16 |
| 309 |
| — |
| 1,682 |
| 42 |
| 4,129 |
|
| Changes attributable to | | | | | | | | | | | |
| Revisions of previous estimates | | 22 |
| — |
| 116 |
| (6 | ) | 1 |
| 11 |
| — |
| 40 |
| (2 | ) | 183 |
|
| Improved recovery | | — |
| — |
| 51 |
| — |
| — |
| 1 |
| — |
| — |
| — |
| 52 |
|
| Purchases of reserves-in-place | | 93 |
| — |
| 412 |
| — |
| — |
| — |
| — |
| — |
| — |
| 504 |
|
| Discoveries and extensions | | 15 |
| — |
| 17 |
| — |
| — |
| 13 |
| — |
| — |
| — |
| 46 |
|
| Production | | (37 | ) | — |
| (137 | ) | (9 | ) | (3 | ) | (75 | ) | — |
| (114 | ) | (6 | ) | (381 | ) |
| Sales of reserves-in-place | | (37 | ) | — |
| (118 | ) | — |
| — |
| — |
| — |
| — |
| — |
| (155 | ) |
| | | 57 |
| — |
| 341 |
| (15 | ) | (2 | ) | (50 | ) | — |
| (74 | ) | (8 | ) | 249 |
|
At 31 Decemberd e | | | | | | | | | | | |
| Developed | | 223 |
| — |
| 962 |
| 43 |
| 8 |
| 223 |
| — |
| 1,126 |
| 30 |
| 2,615 |
|
| Undeveloped | | 243 |
| — |
| 802 |
| 190 |
| 5 |
| 36 |
| — |
| 482 |
| 5 |
| 1,763 |
|
| | | 466 |
| — |
| 1,764 |
| 234 |
| 14 |
| 259 |
| — |
| 1,608 |
| 34 |
| 4,378 |
|
Equity-accounted entities (BP share)f | | | | | | | | | | | |
| At 1 January | | | | | | | | | | | |
| Developed | | — |
| 56 |
| — |
| — |
| 285 |
| 1 |
| 3,124 |
| 6 |
| — |
| 3,473 |
|
| Undeveloped | | — |
| 89 |
| — |
| — |
| 263 |
| — |
| 2,251 |
| — |
| — |
| 2,603 |
|
| | | — |
| 145 |
| — |
| — |
| 548 |
| 1 |
| 5,374 |
| 6 |
| — |
| 6,076 |
|
| Changes attributable to | | | | | | | | | | | |
| Revisions of previous estimates | | — |
| 11 |
| — |
| — |
| 7 |
| — |
| 150 |
| — |
| — |
| 168 |
|
| Improved recovery | | — |
| 13 |
| — |
| — |
| — |
| — |
| — |
| — |
| — |
| 13 |
|
| Purchases of reserves-in-place | | — |
| — |
| — |
| — |
| — |
| — |
| 89 |
| — |
| — |
| 89 |
|
| Discoveries and extensions | | — |
| — |
| — |
| 19 |
| 21 |
| — |
| 326 |
| — |
| — |
| 366 |
|
| Production | | — |
| (13 | ) | — |
| — |
| (25 | ) | — |
| (335 | ) | (6 | ) | — |
| (379 | ) |
| Sales of reserves-in-place | | — |
| — |
| — |
| — |
| — |
| — |
| — |
| — |
| — |
| — |
|
| | | — |
| 12 |
| — |
| 19 |
| 4 |
| (1 | ) | 229 |
| (6 | ) | — |
| 257 |
|
At 31 Decemberg | | | | | | | | | | | |
| Developed | | — |
| 57 |
| — |
| — |
| 293 |
| 1 |
| 3,190 |
| — |
| — |
| 3,541 |
|
| Undeveloped | | — |
| 100 |
| — |
| 19 |
| 259 |
| — |
| 2,414 |
| — |
| — |
| 2,792 |
|
| | | — |
| 157 |
| — |
| 19 |
| 552 |
| 1 |
| 5,604 |
| — |
| — |
| 6,333 |
|
| Total subsidiaries and equity-accounted entities (BP share) | | | | | | | |
| At 1 January | | | | | | | | | | | |
| Developed | | 245 |
| 56 |
| 932 |
| 54 |
| 295 |
| 282 |
| 3,124 |
| 1,047 |
| 31 |
| 6,064 |
|
| Undeveloped | | 164 |
| 89 |
| 492 |
| 195 |
| 269 |
| 28 |
| 2,251 |
| 642 |
| 11 |
| 4,140 |
|
| | | 409 |
| 145 |
| 1,423 |
| 249 |
| 564 |
| 310 |
| 5,374 |
| 1,688 |
| 42 |
| 10,205 |
|
| At 31 December | | | | | | | | | | | |
| Developed | | 223 |
| 57 |
| 962 |
| 43 |
| 302 |
| 224 |
| 3,190 |
| 1,126 |
| 30 |
| 6,156 |
|
| Undeveloped | | 243 |
| 100 |
| 802 |
| 209 |
| 264 |
| 36 |
| 2,414 |
| 482 |
| 5 |
| 4,555 |
|
| | | 466 |
| 157 |
| 1,764 |
| 253 |
| 566 |
| 260 |
| 5,604 |
| 1,608 |
| 34 |
| 10,711 |
|
a Crude oil includes condensate and bitumen. Proved reserves exclude royalties due to others, whether payable in cash or in kind, where the royalty owner has a direct interest in the underlying production and the option and ability to make lifting and sales arrangements independently.
bBecause of rounding, some totals may not exactly agree with the sum of their component parts.
cProved reserves in the Prudhoe Bay field in Alaska include an estimated 16 million barrels upon which a net profits royalty will be payable over the life of the field under the terms of the BP Prudhoe Bay Royalty Trust.
dIncludes 4 million barrels of crude oil in respect of the 30% non-controlling interest in BP Trinidad and Tobago LLC.
e Volumes of equity-accounted entities include volumes of equity-accounted investments of those entities.
f Includes 344 million barrels of crude oil in respect of the 6.28% non-controlling interest in Rosneft, including 24 mmbbl held through BP’sbp’s interests in Russia other than Rosneft.
gTotal proved crude oil reserves held as part of our equity interest in Rosneft is 5,539 million barrels, comprising less than 1 million barrels in Vietnam and Canada, 58 million barrels in Venezuela and 5,481 million barrels in Russia.
|
| | | | | | | | | | | | | |
244248 | | BPbp Annual Report and Form 20-F 2019
2020 | | |
Movements in estimated net proved reserves – continued
| | | | | | | | | | | | | | | | | | | | | | | | | | | | | | | | | | | |
| | | | | | | | | | million barrels |
Natural gas liquidsa b | | | | | | | | | | 2018 |
| | Europe | North
America | South
America | Africa | Asia | Australasia | Total |
| | UK | Rest of
Europe | US | Rest of
North
America | | | Russia | Rest of
Asia | | |
| Subsidiaries | | | | | | | | | | | |
| At 1 January | | | | | | | | | | | |
| Developed | | 11 | | — | | 177 | | — | | 2 | | 21 | | — | | — | | 5 | | 216 | |
| Undeveloped | | 3 | | — | | 69 | | — | | 28 | | — | | — | | — | | 1 | | 102 | |
| | 14 | | — | | 246 | | — | | 30 | | 21 | | — | | — | | 6 | | 318 | |
| Changes attributable to | | | | | | | | | | | |
| Revisions of previous estimates | | 1 | | — | | 20 | | — | | — | | (3) | | — | | — | | — | | 17 | |
| Improved recovery | | — | | — | | 16 | | — | | — | | 2 | | — | | — | | — | | 18 | |
| Purchases of reserves-in-place | | — | | — | | 253 | | — | | — | | — | | — | | — | | — | | 253 | |
| Discoveries and extensions | | 3 | | — | | 1 | | — | | — | | 3 | | — | | — | | — | | 7 | |
Productionc | | (2) | | — | | (25) | | — | | (3) | | (3) | | — | | — | | (1) | | (34) | |
| Sales of reserves-in-place | | (3) | | — | | — | | — | | — | | — | | — | | — | | — | | (3) | |
| | — | | — | | 265 | | — | | (3) | | (2) | | — | | — | | (1) | | 258 | |
At 31 Decemberd | | | | | | | | | | | |
| Developed | | 8 | | — | | 266 | | — | | 2 | | 14 | | — | | — | | 5 | | 295 | |
| Undeveloped | | 6 | | — | | 246 | | — | | 25 | | 4 | | — | | — | | — | | 280 | |
| | | 14 | | — | | 511 | | — | | 27 | | 18 | | — | | — | | 5 | | 576 | |
Equity-accounted entities (bp share)e | | | | | | | | | | | |
| At 1 January | | | | | | | | | | | |
| Developed | | — | | 4 | | — | | — | | — | | 10 | | 82 | | — | | — | | 97 | |
| Undeveloped | | — | | 4 | | — | | — | | — | | — | | 49 | | — | | — | | 53 | |
| | | — | | 8 | | — | | — | | — | | 10 | | 131 | | — | | — | | 149 | |
| Changes attributable to | | | | | | | | | | | |
| Revisions of previous estimates | | — | | — | | — | | — | | — | | (1) | | 25 | | — | | — | | 23 | |
| Improved recovery | | — | | — | | — | | — | | — | | — | | — | | — | | — | | — | |
| Purchases of reserves-in-place | | — | | — | | — | | — | | — | | — | | — | | — | | — | | — | |
| Discoveries and extensions | | — | | — | | — | | — | | — | | — | | — | | — | | — | | — | |
| Production | | — | | (1) | | — | | — | | — | | (1) | | (2) | | — | | — | | (4) | |
| Sales of reserves-in-place | | — | | — | | — | | — | | — | | — | | — | | — | | — | | — | |
| | | — | | (1) | | — | | — | | — | | (3) | | 23 | | — | | — | | 19 | |
At 31 Decemberf g | | | | | | | | | | | |
| Developed | | — | | 4 | | — | | — | | — | | 7 | | 103 | | — | | — | | 114 | |
| Undeveloped | | — | | 3 | | — | | — | | — | | — | | 51 | | — | | — | | 54 | |
| | | — | | 7 | | — | | — | | — | | 7 | | 154 | | — | | — | | 169 | |
| Total subsidiaries and equity-accounted entities (bp share) | | | | | | | |
| At 1 January | | | | | | | | | | | |
| Developed | | 11 | | 4 | | 177 | | — | | 2 | | 31 | | 82 | | — | | 5 | | 313 | |
| Undeveloped | | 3 | | 4 | | 69 | | — | | 28 | | — | | 49 | | — | | 1 | | 154 | |
| | | 14 | | 8 | | 246 | | — | | 30 | | 31 | | 131 | | — | | 6 | | 467 | |
| At 31 December | | | | | | | | | | | |
| Developed | | 8 | | 4 | | 266 | | — | | 2 | | 22 | | 103 | | — | | 5 | | 409 | |
| Undeveloped | | 6 | | 3 | | 246 | | — | | 25 | | 4 | | 51 | | — | | — | | 335 | |
| | | 14 | | 7 | | 511 | | — | | 27 | | 26 | | 154 | | — | | 5 | | 744 | |
|
| | | | | | | | | | | | | | | | | | | | | |
| | | | | | | | | | | million barrels | |
Natural gas liquidsa b | | | | | | | | | | 2018 | |
| | | Europe | North America | South America | Africa | Asia | Australasia | Total |
|
| | | UK |
| Rest of Europe |
| US |
| Rest of North America |
| | | Russia |
| Rest of Asia |
| | |
| Subsidiaries | | | | | | | | | | | |
| At 1 January | | | | | | | | | | | |
| Developed | | 11 |
| — |
| 177 |
| — |
| 2 |
| 21 |
| — |
| — |
| 5 |
| 216 |
|
| Undeveloped | | 3 |
| — |
| 69 |
| — |
| 28 |
| — |
| — |
| — |
| 1 |
| 102 |
|
| | | 14 |
| — |
| 246 |
| — |
| 30 |
| 21 |
| — |
| — |
| 6 |
| 318 |
|
| Changes attributable to | | | | | | | | | | | |
| Revisions of previous estimates | | 1 |
| — |
| 20 |
| — |
| — |
| (3 | ) | — |
| — |
| — |
| 17 |
|
| Improved recovery | | — |
| — |
| 16 |
| — |
| — |
| 2 |
| — |
| — |
| — |
| 18 |
|
| Purchases of reserves-in-place | | — |
| — |
| 253 |
| — |
| — |
| — |
| — |
| — |
| — |
| 253 |
|
| Discoveries and extensions | | 3 |
| — |
| 1 |
| — |
| — |
| 3 |
| — |
| — |
| — |
| 7 |
|
Productionc | | (2 | ) | — |
| (25 | ) | — |
| (3 | ) | (3 | ) | — |
| — |
| (1 | ) | (34 | ) |
| Sales of reserves-in-place | | (3 | ) | — |
| — |
| — |
| — |
| — |
| — |
| — |
| — |
| (3 | ) |
| | | — |
| — |
| 265 |
| — |
| (3 | ) | (2 | ) | — |
| — |
| (1 | ) | 258 |
|
At 31 Decemberd | | | | | | | | | | | |
| Developed | | 8 |
| — |
| 266 |
| — |
| 2 |
| 14 |
| — |
| — |
| 5 |
| 295 |
|
| Undeveloped | | 6 |
| — |
| 246 |
| — |
| 25 |
| 4 |
| — |
| — |
| — |
| 280 |
|
| | | 14 |
| — |
| 511 |
| — |
| 27 |
| 18 |
| — |
| — |
| 5 |
| 576 |
|
Equity-accounted entities (BP share)e | | | | | | | | | | | |
| At 1 January | | | | | | | | | | | |
| Developed | | — |
| 4 |
| — |
| — |
| — |
| 10 |
| 82 |
| — |
| — |
| 97 |
|
| Undeveloped | | — |
| 4 |
| — |
| — |
| — |
| — |
| 49 |
| — |
| — |
| 53 |
|
| | | — |
| 8 |
| — |
| — |
| — |
| 10 |
| 131 |
| — |
| — |
| 149 |
|
| Changes attributable to | | | | | | | | | | | |
| Revisions of previous estimates | | — |
| — |
| — |
| — |
| — |
| (1 | ) | 25 |
| — |
| — |
| 23 |
|
| Improved recovery | | — |
| — |
| — |
| — |
| — |
| — |
| — |
| — |
| — |
| — |
|
| Purchases of reserves-in-place | | — |
| — |
| — |
| — |
| — |
| — |
| — |
| — |
| — |
| — |
|
| Discoveries and extensions | | — |
| — |
| — |
| — |
| — |
| — |
| — |
| — |
| — |
| — |
|
| Production | | — |
| (1 | ) | — |
| — |
| — |
| (1 | ) | (2 | ) | — |
| — |
| (4 | ) |
| Sales of reserves-in-place | | — |
| — |
| — |
| — |
| — |
| — |
| — |
| — |
| — |
| — |
|
| | | — |
| (1 | ) | — |
| — |
| — |
| (3 | ) | 23 |
| — |
| — |
| 19 |
|
At 31 Decemberf | | | | | | | | | | | |
| Developed | | — |
| 4 |
| — |
| — |
| — |
| 7 |
| 103 |
| — |
| — |
| 114 |
|
| Undeveloped | | — |
| 3 |
| — |
| — |
| — |
| — |
| 51 |
| — |
| — |
| 54 |
|
| | | — |
| 7 |
| — |
| — |
| — |
| 7 |
| 154 |
| — |
| — |
| 169 |
|
| Total subsidiaries and equity-accounted entities (BP share) | | | | | | | |
| At 1 January | | | | | | | | | | | |
| Developed | | 11 |
| 4 |
| 177 |
| — |
| 2 |
| 31 |
| 82 |
| — |
| 5 |
| 313 |
|
| Undeveloped | | 3 |
| 4 |
| 69 |
| — |
| 28 |
| — |
| 49 |
| — |
| 1 |
| 154 |
|
| | | 14 |
| 8 |
| 246 |
| — |
| 30 |
| 31 |
| 131 |
| — |
| 6 |
| 467 |
|
| At 31 December | | | | | | | | | | | |
| Developed | | 8 |
| 4 |
| 266 |
| — |
| 2 |
| 22 |
| 103 |
| — |
| 5 |
| 409 |
|
| Undeveloped | | 6 |
| 3 |
| 246 |
| — |
| 25 |
| 4 |
| 51 |
| — |
| — |
| 335 |
|
| | | 14 |
| 7 |
| 511 |
| — |
| 27 |
| 26 |
| 154 |
| — |
| 5 |
| 744 |
|
a Proved reserves exclude royalties due to others, whether payable in cash or in kind, where the royalty owner has a direct interest in the underlying production and the option and ability to make lifting and sales arrangements independently.
b Because of rounding, some totals may not exactly agree with the sum of their component parts.
c Excludes NGLs from processing plants in which an interest is held of less than 1 thousand barrels per day for subsidiaries and 3 thousand barrels per day for equity-accounted entities.
d Includes 8 million barrels of NGL in respect of the 30% non-controlling interest in BP Trinidad and Tobago LLC.
e Volumes of equity-accounted entities include volumes of equity-accounted investments of those entities.
f Includes 12 million barrels of NGLs in respect of the 7.82% non-controlling interest in Rosneft.
g Total proved NGL reserves held as part of our equity interest in Rosneft is 154 million barrels, comprising less than 1 million barrels in Venezuela, Vietnam and Canada, and 154 million barrels in Russia.
|
| | | | | | | | | | | | | |
| BP
| bp Annual Report and Form 20-F 20192020 | | 245249 |
Movements in estimated net proved reserves – continued
| | | | | | | | | | | | | | | | | | | | | | | | | | | | | | | | | | | |
| | | | | | | | | | million barrels |
Total liquidsa b | | | | | | | | | | | 2018 |
| | Europe | North
America | South
America | Africa | Asia | Australasia | Total |
| | UK | Rest of
Europe | USc | Rest of
North
America | | | Russia | Rest of
Asia | | |
| Subsidiaries | | | | | | | | | | | |
| At 1 January | | | | | | | | | | | |
| Developed | | 256 | | — | | 1,108 | | 54 | | 12 | | 301 | | — | | 1,040 | | 36 | | 2,808 | |
| Undeveloped | | 167 | | — | | 561 | | 195 | | 34 | | 28 | | — | | 642 | | 12 | | 1,639 | |
| | 424 | | — | | 1,669 | | 248 | | 46 | | 329 | | — | | 1,682 | | 48 | | 4,447 | |
| Changes attributable to | | | | | | | | | | | |
| Revisions of previous estimates | | 23 | | — | | 136 | | (6) | | 1 | | 8 | | — | | 40 | | (2) | | 200 | |
| Improved recovery | | — | | — | | 67 | | — | | — | | 3 | | — | | — | | — | | 70 | |
| Purchases of reserves-in-place | | 93 | | — | | 665 | | — | | — | | — | | — | | — | | — | | 758 | |
| Discoveries and extensions | | 18 | | — | | 18 | | — | | — | | 16 | | — | | — | | — | | 52 | |
Productiond | | (39) | | — | | (162) | | (9) | | (6) | | (79) | | — | | (114) | | (7) | | (415) | |
| Sales of reserves-in-place | | (40) | | — | | (118) | | — | | — | | — | | — | | — | | — | | (158) | |
| | 56 | | — | | 606 | | (15) | | (5) | | (52) | | — | | (74) | | (9) | | 507 | |
At 31 Decembere | | | | | | | | | | | |
| Developed | | 231 | | — | | 1,228 | | 43 | | 10 | | 237 | | — | | 1,126 | | 35 | | 2,910 | |
| Undeveloped | | 249 | | — | | 1,048 | | 190 | | 30 | | 40 | | — | | 482 | | 5 | | 2,044 | |
| | 480 | | — | | 2,276 | | 234 | | 41 | | 277 | | — | | 1,608 | | 39 | | 4,954 | |
Equity-accounted entities (bp share)f | | | | | | | | |
| At 1 January | | | | | | | | | | | |
| Developed | | — | | 60 | | — | | — | | 285 | | 11 | | 3,206 | | 6 | | — | | 3,569 | |
| Undeveloped | | — | | 93 | | — | | — | | 263 | | — | | 2,300 | | — | | — | | 2,656 | |
| | — | | 153 | | — | | — | | 548 | | 12 | | 5,505 | | 6 | | — | | 6,225 | |
| Changes attributable to | | | | | | | | | | | |
| Revisions of previous estimates | | — | | 11 | | — | | — | | 7 | | (2) | | 175 | | — | | — | | 191 | |
| Improved recovery | | — | | 13 | | — | | — | | — | | — | | — | | — | | — | | 13 | |
| Purchases of reserves-in-place | | — | | — | | — | | — | | — | | — | | 89 | | — | | — | | 89 | |
| Discoveries and extensions | | — | | — | | — | | 19 | | 21 | | — | | 326 | | — | | — | | 366 | |
| Production | | — | | (13) | | — | | — | | (25) | | (2) | | (337) | | (6) | | — | | (383) | |
| Sales of reserves-in-place | | — | | — | | — | | — | | — | | — | | — | | — | | — | | — | |
| | — | | 11 | | — | | 19 | | 4 | | (3) | | 253 | | (6) | | — | | 277 | |
At 31 Decemberg h | | | | | | | | | | | |
| Developed | | — | | 60 | | — | | — | | 293 | | 8 | | 3,293 | | — | | — | | 3,655 | |
| Undeveloped | | — | | 104 | | — | | 19 | | 259 | | — | | 2,465 | | — | | — | | 2,846 | |
| | | — | | 164 | | — | | 19 | | 552 | | 8 | | 5,758 | | — | | — | | 6,502 | |
| Total subsidiaries and equity-accounted entities (bp share) | | | | | | | |
| At 1 January | | | | | | | | | | | |
| Developed | | 256 | | 60 | | 1,108 | | 54 | | 297 | | 313 | | 3,206 | | 1,047 | | 36 | | 6,377 | |
| Undeveloped | | 167 | | 93 | | 561 | | 195 | | 297 | | 28 | | 2,300 | | 642 | | 12 | | 4,295 | |
| | | 424 | | 153 | | 1,669 | | 249 | | 594 | | 341 | | 5,505 | | 1,688 | | 48 | | 10,672 | |
| At 31 December | | | | | | | | | | | |
| Developed | | 231 | | 60 | | 1,228 | | 44 | | 303 | | 245 | | 3,293 | | 1,126 | | 35 | | 6,565 | |
| Undeveloped | | 249 | | 104 | | 1,048 | | 209 | | 289 | | 40 | | 2,465 | | 482 | | 5 | | 4,890 | |
| | | 480 | | 164 | | 2,276 | | 253 | | 593 | | 285 | | 5,758 | | 1,608 | | 39 | | 11,456 | |
|
| | | | | | | | | | | | | | | | | | | | | |
| | | million barrels | |
Total liquidsa b | | | | | | | | | | 2018 | |
| | | Europe | North America | South America | Africa | Asia | Australasia | Total |
|
| | | UK |
| Rest of Europe |
| USc |
| Rest of North America |
| | | Russia |
| Rest of Asia |
| | |
| Subsidiaries | | | | | | | | | | | |
| At 1 January | | | | | | | | | | | |
| Developed | | 256 |
| — |
| 1,108 |
| 54 |
| 12 |
| 301 |
| — |
| 1,040 |
| 36 |
| 2,808 |
|
| Undeveloped | | 167 |
| — |
| 561 |
| 195 |
| 34 |
| 28 |
| — |
| 642 |
| 12 |
| 1,639 |
|
| | | 424 |
| — |
| 1,669 |
| 248 |
| 46 |
| 329 |
| — |
| 1,682 |
| 48 |
| 4,447 |
|
| Changes attributable to | | | | | | | | | | | |
| Revisions of previous estimates | | 23 |
| — |
| 136 |
| (6 | ) | 1 |
| 8 |
| — |
| 40 |
| (2 | ) | 200 |
|
| Improved recovery | | — |
| — |
| 67 |
| — |
| — |
| 3 |
| — |
| — |
| — |
| 70 |
|
| Purchases of reserves-in-place | | 93 |
| — |
| 665 |
| — |
| — |
| — |
| — |
| — |
| — |
| 758 |
|
| Discoveries and extensions | | 18 |
| — |
| 18 |
| — |
| — |
| 16 |
| — |
| — |
| — |
| 52 |
|
Productiond | | (39 | ) | — |
| (162 | ) | (9 | ) | (6 | ) | (79 | ) | — |
| (114 | ) | (7 | ) | (415 | ) |
| Sales of reserves-in-place | | (40 | ) | — |
| (118 | ) | — |
| — |
| — |
| — |
| — |
| — |
| (158 | ) |
| | | 56 |
| — |
| 606 |
| (15 | ) | (5 | ) | (52 | ) | — |
| (74 | ) | (9 | ) | 507 |
|
At 31 Decembere | | | | | | | | | | | |
| Developed | | 231 |
| — |
| 1,228 |
| 43 |
| 10 |
| 237 |
| — |
| 1,126 |
| 35 |
| 2,910 |
|
| Undeveloped | | 249 |
| — |
| 1,048 |
| 190 |
| 30 |
| 40 |
| — |
| 482 |
| 5 |
| 2,044 |
|
| | | 480 |
| — |
| 2,276 |
| 234 |
| 41 |
| 277 |
| — |
| 1,608 |
| 39 |
| 4,954 |
|
Equity-accounted entities (BP share)f | | | | | | | | | | | |
| At 1 January | | | | | | | | | | | |
| Developed | | — |
| 60 |
| — |
| — |
| 285 |
| 11 |
| 3,206 |
| 6 |
| — |
| 3,569 |
|
| Undeveloped | | — |
| 93 |
| — |
| — |
| 263 |
| — |
| 2,300 |
| — |
| — |
| 2,656 |
|
| | | — |
| 153 |
| — |
| — |
| 548 |
| 12 |
| 5,505 |
| 6 |
| — |
| 6,225 |
|
| Changes attributable to | | | | | | | | | | | |
| Revisions of previous estimates | | — |
| 11 |
| — |
| — |
| 7 |
| (2 | ) | 175 |
| — |
| — |
| 191 |
|
| Improved recovery | | — |
| 13 |
| — |
| — |
| — |
| — |
| — |
| — |
| — |
| 13 |
|
| Purchases of reserves-in-place | | — |
| — |
| — |
| — |
| — |
| — |
| 89 |
| — |
| — |
| 89 |
|
| Discoveries and extensions | | — |
| — |
| — |
| 19 |
| 21 |
| — |
| 326 |
| — |
| — |
| 366 |
|
| Production | | — |
| (13 | ) | — |
| — |
| (25 | ) | (2 | ) | (337 | ) | (6 | ) | — |
| (383 | ) |
| Sales of reserves-in-place | | — |
| — |
| — |
| — |
| — |
| — |
| — |
| — |
| — |
| — |
|
| | | — |
| 11 |
| — |
| 19 |
| 4 |
| (3 | ) | 253 |
| (6 | ) | — |
| 277 |
|
At 31 Decemberg h | | | | | | | | | | | |
| Developed | | — |
| 60 |
| — |
| — |
| 293 |
| 8 |
| 3,293 |
| — |
| — |
| 3,655 |
|
| Undeveloped | | — |
| 104 |
| — |
| 19 |
| 259 |
| — |
| 2,465 |
| — |
| — |
| 2,846 |
|
| | | — |
| 164 |
| — |
| 19 |
| 552 |
| 8 |
| 5,758 |
| — |
| — |
| 6,502 |
|
| Total subsidiaries and equity-accounted entities (BP share) | | | | | | | |
| At 1 January | | | | | | | | | | | |
| Developed | | 256 |
| 60 |
| 1,108 |
| 54 |
| 297 |
| 313 |
| 3,206 |
| 1,047 |
| 36 |
| 6,377 |
|
| Undeveloped | | 167 |
| 93 |
| 561 |
| 195 |
| 297 |
| 28 |
| 2,300 |
| 642 |
| 12 |
| 4,295 |
|
| | | 424 |
| 153 |
| 1,669 |
| 249 |
| 594 |
| 341 |
| 5,505 |
| 1,688 |
| 48 |
| 10,672 |
|
| At 31 December | | | | | | | | | | | |
| Developed | | 231 |
| 60 |
| 1,228 |
| 44 |
| 303 |
| 245 |
| 3,293 |
| 1,126 |
| 35 |
| 6,565 |
|
| Undeveloped | | 249 |
| 104 |
| 1,048 |
| 209 |
| 289 |
| 40 |
| 2,465 |
| 482 |
| 5 |
| 4,890 |
|
| | | 480 |
| 164 |
| 2,276 |
| 253 |
| 593 |
| 285 |
| 5,758 |
| 1,608 |
| 39 |
| 11,456 |
|
a Proved reserves exclude royalties due to others, whether payable in cash or in kind, where the royalty owner has a direct interest in the underlying production and the option and ability to make lifting and sales arrangements independently.
bBecause of rounding, some totals may not exactly agree with the sum of their component parts.
c Proved reserves in the Prudhoe Bay field in Alaska include an estimated 16 million barrels of oil equivalent upon which a net profits royalty will be payable, over the life of the field under the terms of the BP Prudhoe Bay Royalty Trust.
d Excludes NGLs from processing plants in which an interest is held of less than 1 thousand barrels per day for subsidiaries and 3 thousand barrels per day for equity-accounted entities.
e Also includes 12 million barrels in respect of the 30% non-controlling interest in BP Trinidad and Tobago LLC.
f Volumes of equity-accounted entities include volumes of equity-accounted investments of those entities.
g Includes 356 million barrels in respect of the non-controlling interest in Rosneft, including 24 mmboe held through BP’sbp’s interests in Russia other than Rosneft.
hTotal proved liquid reserves held as part of our equity interest in Rosneft is 5,693 million barrels, comprising less than 1 million barrels in Canada, 58 million barrels in Venezuela, less than 1 million barrels in Vietnam and 5,635 million barrels in Russia.
|
| | | | | | | | | | | | | |
246250 | | BPbp Annual Report and Form 20-F 2019
2020 | | |
Movements in estimated net proved reserves – continued
| | | | | | | | | | | | | | | | | | | | | | | | | | | | | | | | | | | |
| | | | | | | | | | billion cubic feet |
Natural gasa b | | | | | | | | | | 2018 |
| | Europe | North
America | South
America | Africa | Asia | Australasia | Total |
| | UK | Rest of
Europe | US | Rest of
North
America | | | Russia | Rest of
Asia | | |
| Subsidiaries | | | | | | | | | | | |
| At 1 January | | | | | | | | | | | |
| Developed | | 523 | | — | | 5,238 | | (1) | | 2,862 | | 1,159 | | — | | 2,755 | | 2,730 | | 15,266 | |
| Undeveloped | | 320 | | — | | 3,086 | | — | | 3,330 | | 1,510 | | — | | 4,245 | | 1,505 | | 13,997 | |
| | 843 | | — | | 8,323 | | (1) | | 6,193 | | 2,670 | | — | | 7,000 | | 4,235 | | 29,263 | |
| Changes attributable to | | | | | | | | | | | |
| Revisions of previous estimates | | 84 | | — | | 10 | | 3 | | (195) | | (444) | | — | | 140 | | (123) | | (524) | |
| Improved recovery | | — | | — | | 1,315 | | — | | — | | — | | — | | — | | — | | 1,315 | |
| Purchases of reserves-in-place | | 40 | | — | | 2,655 | | — | | — | | — | | — | | — | | — | | 2,695 | |
| Discoveries and extensions | | 60 | | — | | 11 | | — | | 31 | | 578 | | — | | — | | — | | 680 | |
Productionc | | (66) | | — | | (751) | | (3) | | (788) | | (423) | | — | | (324) | | (303) | | (2,658) | |
| Sales of reserves-in-place | | (178) | | — | | (237) | | — | | — | | — | | — | | — | | — | | (416) | |
| | (61) | | — | | 3,003 | | 1 | | (951) | | (290) | | — | | (184) | | (426) | | 1,092 | |
At 31 Decemberd | | | | | | | | | | | |
| Developed | | 439 | | — | | 6,270 | | — | | 2,168 | | 1,313 | | — | | 3,599 | | 2,630 | | 16,420 | |
| Undeveloped | | 343 | | — | | 5,056 | | — | | 3,073 | | 1,067 | | — | | 3,218 | | 1,179 | | 13,936 | |
| | | 782 | | — | | 11,326 | | — | | 5,241 | | 2,380 | | — | | 6,817 | | 3,809 | | 30,355 | |
Equity-accounted entities (bp share)e | | | | | | | | | | | |
| At 1 January | | | | | | | | | | | |
| Developed | | — | | 112 | | — | | — | | 1,274 | | 476 | | 6,077 | | 17 | | — | | 7,955 | |
| Undeveloped | | — | | 69 | | — | | — | | 450 | | 146 | | 7,173 | | 3 | | — | | 7,841 | |
| | | — | | 180 | | — | | — | | 1,724 | | 622 | | 13,250 | | 20 | | — | | 15,796 | |
| Changes attributable to | | | | | | | | | | | |
| Revisions of previous estimates | | — | | 2 | | — | | — | | (50) | | (39) | | 805 | | 2 | | — | | 719 | |
| Improved recovery | | — | | — | | — | | — | | 1 | | — | | — | | — | | — | | 1 | |
| Purchases of reserves-in-place | | — | | — | | — | | — | | — | | — | | 2,413 | | — | | — | | 2,413 | |
| Discoveries and extensions | | — | | — | | — | | 4 | | 122 | | — | | 512 | | — | | — | | 638 | |
Productionc | | — | | (22) | | — | | — | | (145) | | (48) | | (464) | | (6) | | — | | (685) | |
| Sales of reserves-in-place | | — | | — | | — | | — | | — | | — | | — | | — | | — | | — | |
| | — | | (19) | | — | | 3 | | (71) | | (87) | | 3,267 | | (5) | | — | | 3,087 | |
At 31 Decemberf g | | | | | | | | | | | |
| Developed | | — | | 107 | | — | | — | | 1,207 | | 391 | | 7,798 | | 12 | | — | | 9,515 | |
| Undeveloped | | — | | 55 | | — | | 4 | | 446 | | 143 | | 8,719 | | 4 | | — | | 9,369 | |
| | — | | 161 | | — | | 4 | | 1,653 | | 534 | | 16,517 | | 15 | | — | | 18,884 | |
| Total subsidiaries and equity-accounted entities (bp share) | | | | | | | |
| At 1 January | | | | | | | | | | | |
| Developed | | 523 | | 112 | | 5,238 | | — | | 4,136 | | 1,635 | | 6,077 | | 2,771 | | 2,730 | | 23,221 | |
| Undeveloped | | 320 | | 69 | | 3,086 | | — | | 3,781 | | 1,656 | | 7,173 | | 4,249 | | 1,505 | | 21,838 | |
| | 843 | | 180 | | 8,323 | | — | | 7,917 | | 3,291 | | 13,250 | | 7,020 | | 4,235 | | 45,060 | |
| At 31 December | | | | | | | | | | | |
| Developed | | 439 | | 107 | | 6,270 | | — | | 3,375 | | 1,704 | | 7,798 | | 3,610 | | 2,630 | | 25,934 | |
| Undeveloped | | 343 | | 55 | | 5,056 | | 4 | | 3,519 | | 1,210 | | 8,719 | | 3,221 | | 1,179 | | 23,305 | |
| | 782 | | 161 | | 11,326 | | 4 | | 6,894 | | 2,914 | | 16,517 | | 6,832 | | 3,809 | | 49,239 | |
|
| | | | | | | | | | | | | | | | | | | | | |
| | | | | | | | | | | billion cubic feet | |
Natural gasa b | | | | | | | | | | 2018 | |
| | | Europe | North America | South America | Africa | Asia | Australasia |
| Total |
|
| | | UK |
| Rest of Europe |
| US |
| Rest of North America |
| | | Russia |
| Rest of Asia |
| | |
| Subsidiaries | | | | | | | | | | | |
| At 1 January | | | | | | | | | | | |
| Developed | | 523 |
| — |
| 5,238 |
| (1 | ) | 2,862 |
| 1,159 |
| — |
| 2,755 |
| 2,730 |
| 15,266 |
|
| Undeveloped | | 320 |
| — |
| 3,086 |
| — |
| 3,330 |
| 1,510 |
| — |
| 4,245 |
| 1,505 |
| 13,997 |
|
| | | 843 |
| — |
| 8,323 |
| (1 | ) | 6,193 |
| 2,670 |
| — |
| 7,000 |
| 4,235 |
| 29,263 |
|
| Changes attributable to | | | | | | | | | | | |
| Revisions of previous estimates | | 84 |
| — |
| 10 |
| 3 |
| (195 | ) | (444 | ) | — |
| 140 |
| (123 | ) | (524 | ) |
| Improved recovery | | — |
| — |
| 1,315 |
| — |
| — |
| — |
| — |
| — |
| — |
| 1,315 |
|
| Purchases of reserves-in-place | | 40 |
| — |
| 2,655 |
| — |
| — |
| — |
| — |
| — |
| — |
| 2,695 |
|
| Discoveries and extensions | | 60 |
| — |
| 11 |
| — |
| 31 |
| 578 |
| — |
| — |
| — |
| 680 |
|
Productionc | | (66 | ) | — |
| (751 | ) | (3 | ) | (788 | ) | (423 | ) | — |
| (324 | ) | (303 | ) | (2,658 | ) |
| Sales of reserves-in-place | | (178 | ) | — |
| (237 | ) | — |
| — |
| — |
| — |
| — |
| — |
| (416 | ) |
| | | (61 | ) | — |
| 3,003 |
| 1 |
| (951 | ) | (290 | ) | — |
| (184 | ) | (426 | ) | 1,092 |
|
At 31 Decemberd | | | | | | | | | | | |
| Developed | | 439 |
| — |
| 6,270 |
| — |
| 2,168 |
| 1,313 |
| — |
| 3,599 |
| 2,630 |
| 16,420 |
|
| Undeveloped | | 343 |
| — |
| 5,056 |
| — |
| 3,073 |
| 1,067 |
| — |
| 3,218 |
| 1,179 |
| 13,936 |
|
| | | 782 |
| — |
| 11,326 |
| — |
| 5,241 |
| 2,380 |
| — |
| 6,817 |
| 3,809 |
| 30,355 |
|
Equity-accounted entities (BP share)e | | | | | | | | | | | |
| At 1 January | | | | | | | | | | | |
| Developed | | — |
| 112 |
| — |
| — |
| 1,274 |
| 476 |
| 6,077 |
| 17 |
| — |
| 7,955 |
|
| Undeveloped | | — |
| 69 |
| — |
| — |
| 450 |
| 146 |
| 7,173 |
| 3 |
| — |
| 7,841 |
|
| | | — |
| 180 |
| — |
| — |
| 1,724 |
| 622 |
| 13,250 |
| 20 |
| — |
| 15,796 |
|
| Changes attributable to | | | | | | | | | | | |
| Revisions of previous estimates | | — |
| 2 |
| — |
| — |
| (50 | ) | (39 | ) | 805 |
| 2 |
| — |
| 719 |
|
| Improved recovery | | — |
| — |
| — |
| — |
| 1 |
| — |
| — |
| — |
| — |
| 1 |
|
| Purchases of reserves-in-place | | — |
| — |
| — |
| — |
| — |
| — |
| 2,413 |
| — |
| — |
| 2,413 |
|
| Discoveries and extensions | | — |
| — |
| — |
| 4 |
| 122 |
| — |
| 512 |
| — |
| — |
| 638 |
|
Productionc | | — |
| (22 | ) | — |
| — |
| (145 | ) | (48 | ) | (464 | ) | (6 | ) | — |
| (685 | ) |
| Sales of reserves-in-place | | — |
| — |
| — |
| — |
| — |
| — |
| — |
| — |
| — |
| — |
|
| | | — |
| (19 | ) | — |
| 3 |
| (71 | ) | (87 | ) | 3,267 |
| (5 | ) | — |
| 3,087 |
|
At 31 Decemberf g | | | | | | | | | | | |
| Developed | | — |
| 107 |
| — |
| — |
| 1,207 |
| 391 |
| 7,798 |
| 12 |
| — |
| 9,515 |
|
| Undeveloped | | — |
| 55 |
| — |
| 4 |
| 446 |
| 143 |
| 8,719 |
| 4 |
| — |
| 9,369 |
|
| | | — |
| 161 |
| — |
| 4 |
| 1,653 |
| 534 |
| 16,517 |
| 15 |
| — |
| 18,884 |
|
| Total subsidiaries and equity-accounted entities (BP share) | | | | | | | |
| At 1 January | | | | | | | | | | | |
| Developed | | 523 |
| 112 |
| 5,238 |
| — |
| 4,136 |
| 1,635 |
| 6,077 |
| 2,771 |
| 2,730 |
| 23,221 |
|
| Undeveloped | | 320 |
| 69 |
| 3,086 |
| — |
| 3,781 |
| 1,656 |
| 7,173 |
| 4,249 |
| 1,505 |
| 21,838 |
|
| | | 843 |
| 180 |
| 8,323 |
| — |
| 7,917 |
| 3,291 |
| 13,250 |
| 7,020 |
| 4,235 |
| 45,060 |
|
| At 31 December | | | | | | | | | | | |
| Developed | | 439 |
| 107 |
| 6,270 |
| — |
| 3,375 |
| 1,704 |
| 7,798 |
| 3,610 |
| 2,630 |
| 25,934 |
|
| Undeveloped | | 343 |
| 55 |
| 5,056 |
| 4 |
| 3,519 |
| 1,210 |
| 8,719 |
| 3,221 |
| 1,179 |
| 23,305 |
|
| | | 782 |
| 161 |
| 11,326 |
| 4 |
| 6,894 |
| 2,914 |
| 16,517 |
| 6,832 |
| 3,809 |
| 49,239 |
|
a Proved reserves exclude royalties due to others, whether payable in cash or in kind, where the royalty owner has a direct interest in the underlying production and the option and ability to make lifting and sales arrangements independently.
b Because of rounding, some totals may not exactly agree with the sum of their component parts.
c Includes 181 billion cubic feet of natural gas consumed in operations, 139 billion cubic feet in subsidiaries, 42 billion cubic feet in equity-accounted entities.
dIncludes 1,573 billion cubic feet of natural gas in respect of the 30% non-controlling interest in BP Trinidad and Tobago LLC.
eVolumes of equity-accounted entities include volumes of equity-accounted investments of those entities.
f Includes 1,211 billion cubic feet of natural gas in respect of the 8.60% non-controlling interest in Rosneft including 480 billion cubic feet held through BP’sbp’s interests in Russia other than Rosneft.
g Total proved gas reserves held as part of our equity interest in Rosneft is 14,325 billion cubic feet, comprising 0 billion cubic feet in Canada, 26 billion cubic feet in Venezuela, 15 billion cubic feet in Vietnam, 200 billion cubic feet in Egypt and 14,084 billion cubic feet in Russia.
|
| | | | | | | | | | | | | |
| BP
| bp Annual Report and Form 20-F 20192020 | | 247251 |
Movements in estimated net proved reserves – continued
| | | | | | | | | | | | | | | | | | | | | | | | | | | | | | | | | | | |
| | | | | | | | | million barrels of oil equivalentc |
Total hydrocarbonsa b | | | | | | | | | | 2018 |
| | Europe | North
America | South
America | Africa | Asia | Australasia | Total |
| | UK | Rest of
Europe | USd | Rest of
North
America | | | Russia | Rest of
Asia | | |
| Subsidiaries | | | | | | | | | | | |
| At 1 January | | | | | | | | | | | |
| Developed | | 347 | | — | | 2,011 | | 54 | | 505 | | 501 | | — | | 1,515 | | 507 | | 5,440 | |
| Undeveloped | | 222 | | — | | 1,093 | | 195 | | 608 | | 288 | | — | | 1,374 | | 272 | | 4,052 | |
| | 569 | | — | | 3,104 | | 248 | | 1,114 | | 790 | | — | | 2,889 | | 779 | | 9,492 | |
| Changes attributable to | | | | | | | | | | | |
| Revisions of previous estimates | | 38 | | — | | 138 | | (5) | | (33) | | (69) | | — | | 64 | | (23) | | 110 | |
| Improved recovery | | — | | — | | 294 | | — | | — | | 3 | | — | | — | | — | | 297 | |
| Purchases of reserves-in-place | | 100 | | — | | 1,123 | | — | | — | | — | | — | | — | | — | | 1,222 | |
| Discoveries and extensions | | 29 | | — | | 20 | | — | | 5 | | 116 | | — | | — | | — | | 169 | |
Productione f | | (50) | | — | | (292) | | (9) | | (142) | | (152) | | — | | (170) | | (59) | | (874) | |
| Sales of reserves-in-place | | (70) | | — | | (159) | | — | | — | | — | | — | | — | | — | | (229) | |
| | 46 | | — | | 1,124 | | (15) | | (169) | | (102) | | — | | (106) | | (82) | | 696 | |
At 31 Decemberg | | | | | | | | | | | |
| Developed | | 307 | | — | | 2,309 | | 43 | | 384 | | 464 | | — | | 1,746 | | 488 | | 5,741 | |
| Undeveloped | | 308 | | — | | 1,919 | | 190 | | 560 | | 224 | | — | | 1,037 | | 208 | | 4,447 | |
| | 615 | | — | | 4,228 | | 234 | | 944 | | 687 | | — | | 2,783 | | 696 | | 10,188 | |
Equity-accounted entities (bp share)h | | | | | | | | | | | |
| At 1 January | | | | | | | | | | | |
| Developed | | — | | 80 | | — | | — | | 505 | | 93 | | 4,254 | | 9 | | — | | 4,941 | |
| Undeveloped | | — | | 105 | | — | | — | | 341 | | 25 | | 3,536 | | 1 | | — | | 4,008 | |
| | — | | 184 | | — | | — | | 846 | | 119 | | 7,790 | | 10 | | — | | 8,949 | |
| Changes attributable to | | | | | | | | | | | |
| Revisions of previous estimates | | — | | 11 | | — | | — | | (1) | | (8) | | 313 | | — | | — | | 315 | |
| Improved recovery | | — | | 13 | | — | | — | | — | | — | | — | | — | | — | | 14 | |
| Purchases of reserves-in-place | | — | | — | | — | | — | | — | | — | | 505 | | — | | — | | 505 | |
| Discoveries and extensions | | — | | — | | — | | 20 | | 42 | | — | | 414 | | — | | — | | 476 | |
Productione | | — | | (17) | | — | | — | | (50) | | (10) | | (417) | | (7) | | — | | (501) | |
| Sales of reserves-in-place | | — | | — | | — | | — | | — | | — | | — | | — | | — | | — | |
| | — | | 8 | | — | | 19 | | (9) | | (18) | | 816 | | (7) | | — | | 809 | |
At 31 Decemberi j | | | | | | | | | | | |
| Developed | | — | | 79 | | — | | — | | 501 | | 76 | | 4,638 | | 2 | | — | | 5,296 | |
| Undeveloped | | — | | 113 | | — | | 20 | | 336 | | 25 | | 3,968 | | 1 | | — | | 4,462 | |
| | — | | 192 | | — | | 20 | | 837 | | 101 | | 8,605 | | 3 | | — | | 9,757 | |
| Total subsidiaries and equity-accounted entities (bp share) | | | | | | | |
| At 1 January | | | | | | | | | | | |
| Developed | | 347 | | 80 | | 2,011 | | 54 | | 1,010 | | 595 | | 4,254 | | 1,524 | | 507 | | 10,381 | |
| Undeveloped | | 222 | | 105 | | 1,093 | | 195 | | 949 | | 314 | | 3,536 | | 1,374 | | 272 | | 8,060 | |
| | 569 | | 184 | | 3,104 | | 249 | | 1,959 | | 908 | | 7,790 | | 2,899 | | 779 | | 18,441 | |
| At 31 December | | | | | | | | | | | |
| Developed | | 307 | | 79 | | 2,309 | | 44 | | 885 | | 539 | | 4,638 | | 1,749 | | 488 | | 11,037 | |
| Undeveloped | | 308 | | 113 | | 1,919 | | 210 | | 896 | | 249 | | 3,968 | | 1,037 | | 208 | | 8,908 | |
| | 615 | | 192 | | 4,228 | | 253 | | 1,781 | | 788 | | 8,605 | | 2,786 | | 696 | | 19,945 | |
|
| | | | | | | | | | | | | | | | | | | | | |
| | | | | | | | | | million barrels of oil equivalent c | |
Total hydrocarbonsa b | | | | | | | | | | 2018 | |
| | | Europe | North America | South America | Africa | Asia | Australasia | Total |
|
| | | UK |
| Rest of Europe |
| USd |
| Rest of North America |
| | | Russia |
| Rest of Asia |
| | |
| Subsidiaries | | | | | | | | | | | |
| At 1 January | | | | | | | | | | | |
| Developed | | 347 |
| — |
| 2,011 |
| 54 |
| 505 |
| 501 |
| — |
| 1,515 |
| 507 |
| 5,440 |
|
| Undeveloped | | 222 |
| — |
| 1,093 |
| 195 |
| 608 |
| 288 |
| — |
| 1,374 |
| 272 |
| 4,052 |
|
| | | 569 |
| — |
| 3,104 |
| 248 |
| 1,114 |
| 790 |
| — |
| 2,889 |
| 779 |
| 9,492 |
|
| Changes attributable to | | | | | | | | | | | |
| Revisions of previous estimates | | 38 |
| — |
| 138 |
| (5 | ) | (33 | ) | (69 | ) | — |
| 64 |
| (23 | ) | 110 |
|
| Improved recovery | | — |
| — |
| 294 |
| — |
| — |
| 3 |
| — |
| — |
| — |
| 297 |
|
| Purchases of reserves-in-place | | 100 |
| — |
| 1,123 |
| — |
| — |
| — |
| — |
| — |
| — |
| 1,222 |
|
| Discoveries and extensions | | 29 |
| — |
| 20 |
| — |
| 5 |
| 116 |
| — |
| — |
| — |
| 169 |
|
Productione f | | (50 | ) | — |
| (292 | ) | (9 | ) | (142 | ) | (152 | ) | — |
| (170 | ) | (59 | ) | (874 | ) |
| Sales of reserves-in-place | | (70 | ) | — |
| (159 | ) | — |
| — |
| — |
| — |
| — |
| — |
| (229 | ) |
| | | 46 |
| — |
| 1,124 |
| (15 | ) | (169 | ) | (102 | ) | — |
| (106 | ) | (82 | ) | 696 |
|
At 31 Decemberg | | | | | | | | | | | |
| Developed | | 307 |
| — |
| 2,309 |
| 43 |
| 384 |
| 464 |
| — |
| 1,746 |
| 488 |
| 5,741 |
|
| Undeveloped | | 308 |
| — |
| 1,919 |
| 190 |
| 560 |
| 224 |
| — |
| 1,037 |
| 208 |
| 4,447 |
|
| | | 615 |
| — |
| 4,228 |
| 234 |
| 944 |
| 687 |
| — |
| 2,783 |
| 696 |
| 10,188 |
|
Equity-accounted entities (BP share)h | | | | | | | | | | | |
| At 1 January | | | | | | | | | | | |
| Developed | | — |
| 80 |
| — |
| — |
| 505 |
| 93 |
| 4,254 |
| 9 |
| — |
| 4,941 |
|
| Undeveloped | | — |
| 105 |
| — |
| — |
| 341 |
| 25 |
| 3,536 |
| 1 |
| — |
| 4,008 |
|
| | | — |
| 184 |
| — |
| — |
| 846 |
| 119 |
| 7,790 |
| 10 |
| — |
| 8,949 |
|
| Changes attributable to | | | | | | | | | | | |
| Revisions of previous estimates | | — |
| 11 |
| — |
| — |
| (1 | ) | (8 | ) | 313 |
| — |
| — |
| 315 |
|
| Improved recovery | | — |
| 13 |
| — |
| — |
| — |
| — |
| — |
| — |
| — |
| 14 |
|
| Purchases of reserves-in-place | | — |
| — |
| — |
| — |
| — |
| — |
| 505 |
| — |
| — |
| 505 |
|
| Discoveries and extensions | | — |
| — |
| — |
| 20 |
| 42 |
| — |
| 414 |
| — |
| — |
| 476 |
|
Productione | | — |
| (17 | ) | — |
| — |
| (50 | ) | (10 | ) | (417 | ) | (7 | ) | — |
| (501 | ) |
| Sales of reserves-in-place | | — |
| — |
| — |
| — |
| — |
| — |
| — |
| — |
| — |
| — |
|
| | | — |
| 8 |
| — |
| 19 |
| (9 | ) | (18 | ) | 816 |
| (7 | ) | — |
| 809 |
|
At 31 Decemberi j | | | | | | | | | | | |
| Developed | | — |
| 79 |
| — |
| — |
| 501 |
| 76 |
| 4,638 |
| 2 |
| — |
| 5,296 |
|
| Undeveloped | | — |
| 113 |
| — |
| 20 |
| 336 |
| 25 |
| 3,968 |
| 1 |
| — |
| 4,462 |
|
| | | — |
| 192 |
| — |
| 20 |
| 837 |
| 101 |
| 8,605 |
| 3 |
| — |
| 9,757 |
|
| Total subsidiaries and equity-accounted entities (BP share) | | | | | | | |
| At 1 January | | | | | | | | | | | |
| Developed | | 347 |
| 80 |
| 2,011 |
| 54 |
| 1,010 |
| 595 |
| 4,254 |
| 1,524 |
| 507 |
| 10,381 |
|
| Undeveloped | | 222 |
| 105 |
| 1,093 |
| 195 |
| 949 |
| 314 |
| 3,536 |
| 1,374 |
| 272 |
| 8,060 |
|
| | | 569 |
| 184 |
| 3,104 |
| 249 |
| 1,959 |
| 908 |
| 7,790 |
| 2,899 |
| 779 |
| 18,441 |
|
| At 31 December | | | | | | | | | | | |
| Developed | | 307 |
| 79 |
| 2,309 |
| 44 |
| 885 |
| 539 |
| 4,638 |
| 1,749 |
| 488 |
| 11,037 |
|
| Undeveloped | | 308 |
| 113 |
| 1,919 |
| 210 |
| 896 |
| 249 |
| 3,968 |
| 1,037 |
| 208 |
| 8,908 |
|
| | | 615 |
| 192 |
| 4,228 |
| 253 |
| 1,781 |
| 788 |
| 8,605 |
| 2,786 |
| 696 |
| 19,945 |
|
a Proved reserves exclude royalties due to others, whether payable in cash or in kind, where the royalty owner has a direct interest in the underlying production and the option and ability to make lifting and sales arrangements independently.
b Because of rounding, some totals may not exactly agree with the sum of their component parts.
c 5.8 billion cubic feet of natural gas = 1 million barrels of oil equivalent.
dProved reserves in the Prudhoe Bay field in Alaska include an estimated 16 million barrels of oil equivalent upon which a net profits royalty will be payable, over the life of the field under the terms of the BP Prudhoe Bay Royalty Trust.
e Excludes NGLs from processing plants in which an interest is held of less than 1 thousand barrels per day for subsidiaries and 3 thousand barrels per day for equity-accounted entities.
f Includes 31 million barrels of oil equivalent of natural gas consumed in operations, 24 million barrels of oil equivalent in subsidiaries, 7 million barrels of oil equivalent in equity-accounted entities.
gIncludes 283 million barrels of oil equivalent in respect of the 30% non-controlling interest in BP Trinidad and Tobago LLC.
h Volumes of equity-accounted entities include volumes of equity-accounted investments of those entities.
i Includes 565 million barrels of oil equivalent in respect of the non-controlling interest in Rosneft, including 107 mmboe held through BP’sbp’s interests in Russia other than Rosneft.
j Total proved reserves held as part of our equity interest in Rosneft is 8,163 million barrels of oil equivalent, comprising less than 1 million barrels of oil equivalent in Canada, 62 million barrels of oil equivalent in Venezuela, 3 million barrels of oil equivalent in Vietnam, 35 million barrels of oil equivalent in Egypt and 8,063 million barrels of oil equivalent in Russia.
|
| | | |
248 | | BP Annual Report and Form 20-F 2019
| |
Movements in estimated net proved reserves – continued
|
| | | | | | | | | | | | | | | | | | | | | |
| | | | | | | | | | | million barrels | |
Crude oila b | | | | | | | | | | 2017 | |
| | | Europe | North America | South America | Africa | Asia | Australasia | Total |
|
| | | UK |
| Rest of Europe |
| USc |
| Rest of North America |
| | | Russia |
| Rest of Asia |
| | |
| Subsidiaries | | | | | | | | | | | |
| At 1 January | | | | | | | | | | | |
| Developed | | 155 |
| — |
| 826 |
| 42 |
| 9 |
| 317 |
| — |
| 1,107 |
| 32 |
| 2,487 |
|
| Undeveloped | | 274 |
| — |
| 497 |
| 209 |
| 11 |
| 42 |
| — |
| 245 |
| 14 |
| 1,291 |
|
| | | 429 |
| — |
| 1,322 |
| 251 |
| 20 |
| 358 |
| — |
| 1,352 |
| 46 |
| 3,778 |
|
| Changes attributable to | | | | | | | | | | | |
| Revisions of previous estimates | | 15 |
| — |
| 208 |
| 5 |
| 1 |
| 35 |
| — |
| 407 |
| 2 |
| 673 |
|
| Improved recovery | | — |
| — |
| 12 |
| — |
| — |
| 2 |
| — |
| — |
| — |
| 14 |
|
| Purchases of reserves-in-place | | 3 |
| — |
| 1 |
| — |
| — |
| 1 |
| — |
| — |
| — |
| 5 |
|
| Discoveries and extensions | | — |
| — |
| 12 |
| — |
| — |
| — |
| — |
| 42 |
| — |
| 53 |
|
| Production | | (29 | ) | — |
| (131 | ) | (7 | ) | (5 | ) | (88 | ) | — |
| (119 | ) | (6 | ) | (384 | ) |
| Sales of reserves-in-place | | (9 | ) | — |
| — |
| — |
| — |
| — |
| — |
| — |
| — |
| (9 | ) |
| | | (20 | ) | — |
| 101 |
| (2 | ) | (4 | ) | (50 | ) | — |
| 330 |
| (4 | ) | 351 |
|
At 31 Decemberd e | | | | | | | | | | | |
| Developed | | 245 |
| — |
| 932 |
| 54 |
| 10 |
| 281 |
| — |
| 1,040 |
| 31 |
| 2,592 |
|
| Undeveloped | | 164 |
| — |
| 492 |
| 195 |
| 6 |
| 28 |
| — |
| 642 |
| 11 |
| 1,537 |
|
| | | 409 |
| — |
| 1,423 |
| 248 |
| 16 |
| 309 |
| — |
| 1,682 |
| 42 |
| 4,129 |
|
Equity-accounted entities (BP share)f | | | | | | | | |
| At 1 January | | | | | | | | | | | |
| Developed | | — |
| 45 |
| — |
| — |
| 321 |
| 1 |
| 3,162 |
| 43 |
| — |
| 3,573 |
|
| Undeveloped | | — |
| 69 |
| — |
| — |
| 325 |
| — |
| 2,134 |
| 1 |
| — |
| 2,529 |
|
| | | — |
| 114 |
| — |
| — |
| 646 |
| 1 |
| 5,296 |
| 44 |
| — |
| 6,101 |
|
| Changes attributable to | | | | | | | | | | | |
| Revisions of previous estimates | | — |
| 2 |
| — |
| — |
| 1 |
| — |
| 102 |
| (1 | ) | — |
| 104 |
|
| Improved recovery | | — |
| 11 |
| — |
| — |
| 4 |
| — |
| — |
| — |
| — |
| 16 |
|
| Purchases of reserves-in-place | | — |
| 34 |
| — |
| — |
| — |
| — |
| 37 |
| — |
| — |
| 71 |
|
| Discoveries and extensions | | — |
| 1 |
| — |
| — |
| 22 |
| — |
| 264 |
| — |
| — |
| 288 |
|
| Production | | — |
| (11 | ) | — |
| — |
| (28 | ) | — |
| (325 | ) | (36 | ) | — |
| (401 | ) |
| Sales of reserves-in-place | | — |
| (5 | ) | — |
| — |
| (98 | ) | — |
| — |
| — |
| — |
| (103 | ) |
| | | — |
| 31 |
| — |
| — |
| (98 | ) | — |
| 78 |
| (37 | ) | — |
| (25 | ) |
At 31 Decemberg | | | | | | | | | | | |
| Developed | | — |
| 56 |
| — |
| — |
| 285 |
| 1 |
| 3,124 |
| 6 |
| — |
| 3,473 |
|
| Undeveloped | | — |
| 89 |
| — |
| — |
| 263 |
| — |
| 2,251 |
| — |
| — |
| 2,603 |
|
| | | — |
| 145 |
| — |
| — |
| 548 |
| 1 |
| 5,374 |
| 6 |
| — |
| 6,076 |
|
| Total subsidiaries and equity-accounted entities (BP share) | | | | | | | |
| At 1 January | | | | | | | | | | | |
| Developed | | 155 |
| 45 |
| 826 |
| 42 |
| 330 |
| 318 |
| 3,162 |
| 1,150 |
| 32 |
| 6,060 |
|
| Undeveloped | | 274 |
| 69 |
| 497 |
| 209 |
| 336 |
| 42 |
| 2,134 |
| 246 |
| 14 |
| 3,819 |
|
| | | 429 |
| 114 |
| 1,322 |
| 251 |
| 666 |
| 360 |
| 5,296 |
| 1,395 |
| 46 |
| 9,879 |
|
| At 31 December | | | | | | | | | | | |
| Developed | | 245 |
| 56 |
| 932 |
| 54 |
| 295 |
| 282 |
| 3,124 |
| 1,047 |
| 31 |
| 6,064 |
|
| Undeveloped | | 164 |
| 89 |
| 492 |
| 195 |
| 269 |
| 28 |
| 2,251 |
| 642 |
| 11 |
| 4,140 |
|
| | | 409 |
| 145 |
| 1,423 |
| 249 |
| 564 |
| 310 |
| 5,374 |
| 1,688 |
| 42 |
| 10,205 |
|
| |
a
| Crude oil includes condensate and bitumen. Proved reserves exclude royalties due to others, whether payable in cash or in kind, where the royalty owner has a direct interest in the underlying production and the option and ability to make lifting and sales arrangements independently. |
| |
b
| Because of rounding, some totals may not exactly agree with the sum of their component parts. |
| |
c
| Proved reserves in the Prudhoe Bay field in Alaska include an estimated 9 million barrels upon which a net profits royalty will be payable over the life of the field under the terms of the BP Prudhoe Bay Royalty Trust. |
d Includes 5 million barrels of crude oil in respect of the 30% non-controlling interest in BP Trinidad and Tobago LLC.
e Volumes of equity-accounted entities include volumes of equity-accounted investments of those entities.
f Includes 337 million barrels of crude oil in respect of the 6.31% non-controlling interest in Rosneft, including 6 mmbbl held through BP’s equity accounted interest in Taas-Yuryakh Neftegazodobycha.
g Total proved crude oil reserves held as part of our equity interest in Rosneft is 5,402 million barrels, comprising less than 1 million barrels in Vietnam and Canada, 59 million barrels in Venezuela and 5,342 million barrels in Russia.
|
| | | |
| BP Annual Report and Form 20-F 2019
| | 249 |
Movements in estimated net proved reserves – continued
|
| | | | | | | | | | | | | | | | | | | | | |
| | | | | | | | | | | million barrels | |
Natural gas liquidsa b | | | | | | | | | | 2017 | |
| | | Europe | North America | South America | Africa | Asia | Australasia | Total |
|
| | | UK |
| Rest of Europe |
| US |
| Rest of North America |
| | | Russia |
| Rest of Asia |
| | |
| Subsidiaries | | | | | | | | | | | |
| At 1 January | | | | | | | | | | | |
| Developed | | 13 |
| — |
| 226 |
| — |
| 5 |
| 13 |
| — |
| — |
| 9 |
| 266 |
|
| Undeveloped | | 3 |
| — |
| 73 |
| — |
| 28 |
| 1 |
| — |
| — |
| 2 |
| 107 |
|
| | | 16 |
| — |
| 299 |
| — |
| 33 |
| 14 |
| — |
| — |
| 11 |
| 373 |
|
| Changes attributable to | | | | | | | | | | | |
| Revisions of previous estimates | | 2 |
| — |
| (44 | ) | — |
| — |
| 11 |
| — |
| — |
| (4 | ) | (36 | ) |
| Improved recovery | | — |
| — |
| 15 |
| — |
| — |
| — |
| — |
| — |
| — |
| 15 |
|
| Purchases of reserves-in-place | | — |
| — |
| — |
| — |
| — |
| — |
| — |
| — |
| — |
| — |
|
| Discoveries and extensions | | — |
| — |
| 1 |
| — |
| — |
| — |
| — |
| — |
| — |
| 1 |
|
Productionc | | (3 | ) | — |
| (24 | ) | — |
| (3 | ) | (4 | ) | — |
| — |
| (1 | ) | (35 | ) |
| Sales of reserves-in-place | | (1 | ) | — |
| — |
| — |
| — |
| — |
| — |
| — |
| — |
| (1 | ) |
| | | (2 | ) | — |
| (52 | ) | — |
| (3 | ) | 7 |
| — |
| — |
| (5 | ) | (55 | ) |
At 31 Decemberd | | | | | | | | | | | |
| Developed | | 11 |
| — |
| 177 |
| — |
| 2 |
| 21 |
| — |
| — |
| 5 |
| 216 |
|
| Undeveloped | | 3 |
| — |
| 69 |
| — |
| 28 |
| — |
| — |
| — |
| 1 |
| 102 |
|
| | | 14 |
| — |
| 246 |
| — |
| 30 |
| 21 |
| — |
| — |
| 6 |
| 318 |
|
Equity-accounted entities (BP share)e | | | | | | | | | | | |
| At 1 January | | | | | | | | | | | |
| Developed | | — |
| 3 |
| — |
| — |
| — |
| 11 |
| 50 |
| — |
| — |
| 65 |
|
| Undeveloped | | — |
| 2 |
| — |
| — |
| — |
| — |
| 15 |
| — |
| — |
| 17 |
|
| | | — |
| 5 |
| — |
| — |
| — |
| 11 |
| 65 |
| — |
| — |
| 81 |
|
| Changes attributable to | | | | | | | | | | | |
| Revisions of previous estimates | | — |
| — |
| — |
| — |
| — |
| 1 |
| 68 |
| — |
| — |
| 69 |
|
| Improved recovery | | — |
| 1 |
| — |
| — |
| — |
| — |
| — |
| — |
| — |
| 1 |
|
| Purchases of reserves-in-place | | — |
| 2 |
| — |
| — |
| — |
| — |
| — |
| — |
| — |
| 2 |
|
| Discoveries and extensions | | — |
| — |
| — |
| — |
| — |
| — |
| — |
| — |
| — |
| — |
|
| Production | | — |
| (1 | ) | — |
| — |
| — |
| (1 | ) | (2 | ) | — |
| — |
| (4 | ) |
| Sales of reserves-in-place | | — |
| — |
| — |
| — |
| — |
| — |
| — |
| — |
| — |
| — |
|
| | | — |
| 3 |
| — |
| — |
| — |
| (1 | ) | 66 |
| — |
| — |
| 68 |
|
At 31 Decemberf | | | | | | | | | | | |
| Developed | | — |
| 4 |
| — |
| — |
| — |
| 10 |
| 82 |
| — |
| — |
| 97 |
|
| Undeveloped | | — |
| 4 |
| — |
| — |
| — |
| — |
| 49 |
| — |
| — |
| 53 |
|
| | | — |
| 8 |
| — |
| — |
| — |
| 10 |
| 131 |
| — |
| — |
| 149 |
|
| Total subsidiaries and equity-accounted entities (BP share) | | | | | | | |
| At 1 January | | | | | | | | | | | |
| Developed | | 13 |
| 3 |
| 226 |
| — |
| 5 |
| 24 |
| 50 |
| — |
| 9 |
| 331 |
|
| Undeveloped | | 3 |
| 2 |
| 73 |
| — |
| 28 |
| 1 |
| 15 |
| — |
| 2 |
| 123 |
|
| | | 16 |
| 5 |
| 299 |
| — |
| 33 |
| 25 |
| 65 |
| — |
| 11 |
| 454 |
|
| At 31 December | | | | | | | | | | | |
| Developed | | 11 |
| 4 |
| 177 |
| — |
| 2 |
| 31 |
| 82 |
| — |
| 5 |
| 313 |
|
| Undeveloped | | 3 |
| 4 |
| 69 |
| — |
| 28 |
| — |
| 49 |
| — |
| 1 |
| 154 |
|
| | | 14 |
| 8 |
| 246 |
| — |
| 30 |
| 31 |
| 131 |
| — |
| 6 |
| 467 |
|
| |
a
| Proved reserves exclude royalties due to others, whether payable in cash or in kind, where the royalty owner has a direct interest in the underlying production and the option and ability to make lifting and sales arrangements independently. |
| |
b
| Because of rounding, some totals may not exactly agree with the sum of their component parts. |
| |
c
| Excludes NGLs from processing plants in which an interest is held of less than 1 thousand barrels per day for subsidiaries and 2 thousand barrels per day for equity-accounted entities. |
| |
d
| Includes 9 million barrels of NGL in respect of the 30% non-controlling interest in BP Trinidad and Tobago LLC. |
| |
e
| Volumes of equity-accounted entities include volumes of equity-accounted investments of those entities. |
| |
f
| Total proved NGL reserves held as part of our equity interest in Rosneft is 131 million barrels, comprising less than 1 million barrels in Venezuela, Vietnam and Canada, and 131 million barrels in Russia. |
|
| | | |
250 | | BP Annual Report and Form 20-F 2019
| |
Movements in estimated net proved reserves – continued
|
| | | | | | | | | | | | | | | | | | | | | |
| | | | | | | | | | | million barrels | |
Total liquidsa b | | | | | | | | | | | 2017 |
|
| | | Europe | North America | South America | Africa | Asia | Australasia | Total |
|
| | | UK |
| Rest of Europe |
| USc |
| Rest of North America |
| | | Russia |
| Rest of Asia |
| | |
| Subsidiaries | | | | | | | | | | | |
| At 1 January | | | | | | | | | | | |
| Developed | | 168 |
| — |
| 1,051 |
| 42 |
| 14 |
| 330 |
| — |
| 1,107 |
| 42 |
| 2,753 |
|
| Undeveloped | | 277 |
| — |
| 569 |
| 209 |
| 39 |
| 43 |
| — |
| 245 |
| 16 |
| 1,398 |
|
| | | 445 |
| — |
| 1,621 |
| 251 |
| 53 |
| 372 |
| — |
| 1,352 |
| 57 |
| 4,151 |
|
| Changes attributable to | | | | | | | | | | | |
| Revisions of previous estimates | | 17 |
| — |
| 164 |
| 5 |
| 1 |
| 45 |
| — |
| 407 |
| (2 | ) | 637 |
|
| Improved recovery | | — |
| — |
| 27 |
| — |
| — |
| 2 |
| — |
| — |
| — |
| 29 |
|
| Purchases of reserves-in-place | | 3 |
| — |
| 1 |
| — |
| — |
| 1 |
| — |
| — |
| — |
| 5 |
|
| Discoveries and extensions | | — |
| — |
| 12 |
| — |
| — |
| — |
| — |
| 42 |
| — |
| 54 |
|
Productiond | | (32 | ) | — |
| (155 | ) | (7 | ) | (8 | ) | (92 | ) | — |
| (119 | ) | (7 | ) | (419 | ) |
| Sales of reserves-in-place | | (10 | ) | — |
| — |
| — |
| — |
| — |
| — |
| — |
| — |
| (10 | ) |
| | | (22 | ) | — |
| 49 |
| (2 | ) | (7 | ) | (43 | ) | — |
| 330 |
| (9 | ) | 296 |
|
At 31 Decembere | | | | | | | | | | | |
| Developed | | 256 |
| — |
| 1,108 |
| 54 |
| 12 |
| 301 |
| — |
| 1,040 |
| 36 |
| 2,808 |
|
| Undeveloped | | 167 |
| — |
| 561 |
| 195 |
| 34 |
| 28 |
| — |
| 642 |
| 12 |
| 1,639 |
|
| | | 424 |
| — |
| 1,669 |
| 248 |
| 46 |
| 329 |
| — |
| 1,682 |
| 48 |
| 4,447 |
|
Equity-accounted entities (BP share)f | | | | | | | | |
| At 1 January | | | | | | | | | | | |
| Developed | | — |
| 48 |
| — |
| — |
| 321 |
| 12 |
| 3,213 |
| 43 |
| — |
| 3,637 |
|
| Undeveloped | | — |
| 71 |
| — |
| — |
| 325 |
| — |
| 2,148 |
| 1 |
| — |
| 2,545 |
|
| | | — |
| 119 |
| — |
| — |
| 646 |
| 12 |
| 5,361 |
| 44 |
| — |
| 6,183 |
|
| Changes attributable to | | | | | | | | | | | |
| Revisions of previous estimates | | — |
| 2 |
| — |
| — |
| 1 |
| 1 |
| 170 |
| (1 | ) | — |
| 174 |
|
| Improved recovery | | — |
| 13 |
| — |
| — |
| 4 |
| — |
| — |
| — |
| — |
| 17 |
|
| Purchases of reserves-in-place | | — |
| 36 |
| — |
| — |
| — |
| — |
| 37 |
| — |
| — |
| 72 |
|
| Discoveries and extensions | | — |
| 1 |
| — |
| — |
| 22 |
| — |
| 264 |
| — |
| — |
| 288 |
|
| Production | | — |
| (12 | ) | — |
| — |
| (28 | ) | (2 | ) | (327 | ) | (36 | ) | — |
| (405 | ) |
| Sales of reserves-in-place | | — |
| (6 | ) | — |
| — |
| (98 | ) | — |
| — |
| — |
| — |
| (104 | ) |
| | | — |
| 34 |
| — |
| — |
| (98 | ) | (1 | ) | 144 |
| (37 | ) | — |
| 43 |
|
At 31 Decemberg h | | | | | | | | | | | |
| Developed | | — |
| 60 |
| — |
| — |
| 285 |
| 11 |
| 3,206 |
| 6 |
| — |
| 3,569 |
|
| Undeveloped | | — |
| 93 |
| — |
| — |
| 263 |
| — |
| 2,300 |
| — |
| — |
| 2,656 |
|
| | | — |
| 153 |
| — |
| — |
| 548 |
| 12 |
| 5,505 |
| 6 |
| — |
| 6,225 |
|
| Total subsidiaries and equity-accounted entities (BP share) | | | | | | | |
| At 1 January | | | | | | | | | | | |
| Developed | | 168 |
| 48 |
| 1,051 |
| 42 |
| 335 |
| 342 |
| 3,213 |
| 1,150 |
| 42 |
| 6,390 |
|
| Undeveloped | | 277 |
| 71 |
| 569 |
| 209 |
| 364 |
| 43 |
| 2,148 |
| 246 |
| 16 |
| 3,943 |
|
| | | 445 |
| 119 |
| 1,621 |
| 251 |
| 699 |
| 385 |
| 5,361 |
| 1,395 |
| 57 |
| 10,333 |
|
| At 31 December | | | | | | | | | | | |
| Developed | | 256 |
| 60 |
| 1,108 |
| 54 |
| 297 |
| 313 |
| 3,206 |
| 1,047 |
| 36 |
| 6,377 |
|
| Undeveloped | | 167 |
| 93 |
| 561 |
| 195 |
| 297 |
| 28 |
| 2,300 |
| 642 |
| 12 |
| 4,295 |
|
| | | 424 |
| 153 |
| 1,669 |
| 249 |
| 594 |
| 341 |
| 5,505 |
| 1,688 |
| 48 |
| 10,672 |
|
| |
a
| Proved reserves exclude royalties due to others, whether payable in cash or in kind, where the royalty owner has a direct interest in the underlying production and the option and ability to make lifting and sales arrangements independently. |
| |
b
| Because of rounding, some totals may not exactly agree with the sum of their component parts. |
| |
c
| Proved reserves in the Prudhoe Bay field in Alaska include an estimated 9 million barrels of oil equivalent upon which a net profits royalty will be payable, over the life of the field under the terms of the BP Prudhoe Bay Royalty Trust. |
| |
d
| Excludes NGLs from processing plants in which an interest is held of less than 1 thousand barrels per day for subsidiaries and 2 thousand barrels per day for equity-accounted entities. |
| |
e
| Also includes 14 million barrels in respect of the 30% non-controlling interest in BP Trinidad and Tobago LLC. |
| |
f
| Volumes of equity-accounted entities include volumes of equity-accounted investments of those entities. |
| |
g
| Includes 338 million barrels in respect of the non-controlling interest in Rosneft, including 6 mmboe held through BP’s equity accounted interest in Taas-Yuryakh Neftegazodobycha. |
| |
h
| Total proved liquid reserves held as part of our equity interest in Rosneft is 5,533 million barrels, comprising less than 1 million barrels in Canada, 59 million barrels in Venezuela, less than 1 million barrels in Vietnam and 5,473 million barrels in Russia. |
|
| | | |
| BP Annual Report and Form 20-F 2019
| | 251 |
Movements in estimated net proved reserves – continued
|
| | | | | | | | | | | | | | | | | | | | | |
| | | | | | | | | | | billion cubic feet | |
Natural gasa b | | | | | | | | | | 2017 | |
| | | Europe | North America | South America | Africa | Asia | Australasia | Total |
|
| | | UK |
| Rest of Europe |
| US |
| Rest of North America |
| | | Russia |
| Rest of Asia |
| | |
| Subsidiaries | | | | | | | | | | | |
| At 1 January | | | | | | | | | | | |
| Developed | | 499 |
| — |
| 5,447 |
| — |
| 1,784 |
| 767 |
| — |
| 1,890 |
| 3,012 |
| 13,398 |
|
| Undeveloped | | 350 |
| — |
| 2,567 |
| — |
| 4,970 |
| 2,191 |
| — |
| 3,769 |
| 1,643 |
| 15,490 |
|
| | | 848 |
| — |
| 8,014 |
| — |
| 6,755 |
| 2,958 |
| — |
| 5,659 |
| 4,654 |
| 28,888 |
|
| Changes attributable to | | | | | | | | | | | |
| Revisions of previous estimates | | 50 |
| — |
| (38 | ) | 3 |
| (677 | ) | (450 | ) | — |
| 258 |
| (129 | ) | (983 | ) |
| Improved recovery | | — |
| — |
| 1,002 |
| — |
| — |
| 1 |
| — |
| 6 |
| — |
| 1,009 |
|
| Purchases of reserves-in-place | | 25 |
| — |
| — |
| — |
| — |
| 527 |
| — |
| — |
| — |
| 552 |
|
| Discoveries and extensions | | — |
| — |
| 10 |
| — |
| 829 |
| 14 |
| — |
| 1,229 |
| — |
| 2,082 |
|
Productionc | | (77 | ) | — |
| (664 | ) | (3 | ) | (714 | ) | (380 | ) | — |
| (152 | ) | (291 | ) | (2,281 | ) |
| Sales of reserves-in-place | | (4 | ) | — |
| — |
| — |
| — |
| — |
| — |
| — |
| — |
| (4 | ) |
| | | (5 | ) | — |
| 309 |
| — |
| (562 | ) | (288 | ) | — |
| 1,342 |
| (420 | ) | 376 |
|
At 31 Decemberd | | | | | | | | | | | |
| Developed | | 523 |
| — |
| 5,238 |
| (1 | ) | 2,862 |
| 1,159 |
| — |
| 2,755 |
| 2,730 |
| 15,266 |
|
| Undeveloped | | 320 |
| — |
| 3,086 |
| — |
| 3,330 |
| 1,510 |
| — |
| 4,245 |
| 1,505 |
| 13,997 |
|
| | | 843 |
| — |
| 8,323 |
| (1 | ) | 6,193 |
| 2,670 |
| — |
| 7,000 |
| 4,235 |
| 29,263 |
|
Equity-accounted entities (BP share)e | | | | | | | | | | | |
| At 1 January | | | | | | | | | | | |
| Developed | | — |
| 89 |
| — |
| — |
| 1,546 |
| 412 |
| 5,544 |
| 26 |
| — |
| 7,617 |
|
| Undeveloped | | — |
| 21 |
| — |
| — |
| 534 |
| — |
| 6,304 |
| 4 |
| — |
| 6,863 |
|
| | | — |
| 110 |
| — |
| 1 |
| 2,080 |
| 412 |
| 11,847 |
| 30 |
| — |
| 14,480 |
|
| Changes attributable to | | | | | | | | | | | |
| Revisions of previous estimates | | — |
| 19 |
| — |
| — |
| 47 |
| 5 |
| 1,556 |
| (2 | ) | — |
| 1,625 |
|
| Improved recovery | | — |
| 37 |
| — |
| — |
| 55 |
| — |
| — |
| — |
| — |
| 92 |
|
| Purchases of reserves-in-place | | — |
| 39 |
| — |
| — |
| — |
| 237 |
| 10 |
| — |
| — |
| 286 |
|
| Discoveries and extensions | | — |
| 1 |
| — |
| — |
| 67 |
| — |
| 324 |
| — |
| — |
| 392 |
|
Productionc | | — |
| (19 | ) | — |
| — |
| (178 | ) | (32 | ) | (488 | ) | (8 | ) | — |
| (726 | ) |
| Sales of reserves-in-place | | — |
| (6 | ) | — |
| — |
| (347 | ) | — |
| — |
| — |
| — |
| (353 | ) |
| | | — |
| 70 |
| — |
| — |
| (356 | ) | 210 |
| 1,403 |
| (10 | ) | — |
| 1,316 |
|
At 31 Decemberf g | | | | | | | | | | | |
| Developed | | — |
| 112 |
| — |
| — |
| 1,274 |
| 476 |
| 6,077 |
| 17 |
| — |
| 7,955 |
|
| Undeveloped | | — |
| 69 |
| — |
| — |
| 450 |
| 146 |
| 7,173 |
| 3 |
| — |
| 7,841 |
|
| | | — |
| 180 |
| — |
| — |
| 1,724 |
| 622 |
| 13,250 |
| 20 |
| — |
| 15,796 |
|
| Total subsidiaries and equity-accounted entities (BP share) | | | | | | | |
| At 1 January | | | | | | | | | | | |
| Developed | | 499 |
| 89 |
| 5,447 |
| — |
| 3,330 |
| 1,179 |
| 5,544 |
| 1,916 |
| 3,012 |
| 21,015 |
|
| Undeveloped | | 350 |
| 21 |
| 2,567 |
| — |
| 5,505 |
| 2,191 |
| 6,304 |
| 3,772 |
| 1,643 |
| 22,353 |
|
| | | 848 |
| 110 |
| 8,014 |
| — |
| 8,835 |
| 3,370 |
| 11,847 |
| 5,688 |
| 4,654 |
| 43,368 |
|
| At 31 December | | | | | | | | | | | |
| Developed | | 523 |
| 112 |
| 5,238 |
| — |
| 4,136 |
| 1,635 |
| 6,077 |
| 2,771 |
| 2,730 |
| 23,221 |
|
| Undeveloped | | 320 |
| 69 |
| 3,086 |
| — |
| 3,781 |
| 1,656 |
| 7,173 |
| 4,249 |
| 1,505 |
| 21,838 |
|
| | | 843 |
| 180 |
| 8,323 |
| — |
| 7,917 |
| 3,291 |
| 13,250 |
| 7,020 |
| 4,235 |
| 45,060 |
|
| |
a
| Proved reserves exclude royalties due to others, whether payable in cash or in kind, where the royalty owner has a direct interest in the underlying production and the option and ability to make lifting and sales arrangements independently. |
| |
b
| Because of rounding, some totals may not exactly agree with the sum of their component parts. |
| |
c
| Includes 180 billion cubic feet of natural gas consumed in operations, 131 billion cubic feet in subsidiaries, 49 billion cubic feet in equity-accounted entities. |
| |
d
| Includes 1,860 billion cubic feet of natural gas in respect of the 30% non-controlling interest in BP Trinidad and Tobago LLC. |
| |
e
| Volumes of equity-accounted entities include volumes of equity-accounted investments of those entities. |
| |
f
| Includes 306 billion cubic feet of natural gas in respect of the 2.30% non-controlling interest in Rosneft including 2 billion cubic feet held through BP’s equity accounted interest in Taas-Yuryakh Neftegazodobycha. |
| |
g
| Total proved gas reserves held as part of our equity interest in Rosneft is 13,522 billion cubic feet, comprising 0 billion cubic feet in Canada, 28 billion cubic feet in Venezuela, 19 billion cubic feet in Vietnam, 237 billion cubic feet in Egypt and 13,237 billion cubic feet in Russia. |
|
| | | |
| 252 | | BPbp Annual Report and Form 20-F 2019
2020 | | |
Movements in estimated net proved reserves – continued
|
| | | | | | | | | | | | | | | | | | | | | |
| | | | | | | | | | million barrels of oil equivalentc | |
Total hydrocarbonsa b | | | | | | | | | | 2017 | |
| | | Europe | North America | South America | Africa | Asia | Australasia | Total |
|
| | | UK |
| Rest of Europe |
| USd |
| Rest of North America |
| | | Russia |
| Rest of Asia |
| | |
| Subsidiaries | | | | | | | | | | | |
| At 1 January | | | | | | | | | | | |
| Developed | | 254 |
| — |
| 1,990 |
| 42 |
| 321 |
| 462 |
| — |
| 1,433 |
| 561 |
| 5,063 |
|
| Undeveloped | | 338 |
| — |
| 1,012 |
| 209 |
| 896 |
| 420 |
| — |
| 895 |
| 299 |
| 4,068 |
|
| | | 592 |
| — |
| 3,002 |
| 251 |
| 1,217 |
| 882 |
| — |
| 2,327 |
| 860 |
| 9,131 |
|
| Changes attributable to | | | | | | | | | | | |
| Revisions of previous estimates | | 25 |
| — |
| 157 |
| 5 |
| (116 | ) | (32 | ) | — |
| 451 |
| (24 | ) | 467 |
|
| Improved recovery | | — |
| — |
| 200 |
| — |
| — |
| 2 |
| — |
| 1 |
| — |
| 203 |
|
| Purchases of reserves-in-place | | 8 |
| — |
| 1 |
| — |
| — |
| 92 |
| — |
| — |
| — |
| 100 |
|
| Discoveries and extensions | | — |
| — |
| 14 |
| — |
| 143 |
| 3 |
| — |
| 254 |
| — |
| 413 |
|
Productione f | | (45 | ) | — |
| (270 | ) | (8 | ) | (131 | ) | (157 | ) | — |
| (145 | ) | (57 | ) | (812 | ) |
| Sales of reserves-in-place | | (11 | ) | — |
| — |
| — |
| — |
| — |
| — |
| — |
| — |
| (11 | ) |
| | | (23 | ) | — |
| 102 |
| (2 | ) | (104 | ) | (93 | ) | — |
| 562 |
| (81 | ) | 361 |
|
At 31 Decemberg | | | | | | | | | | | |
| Developed | | 347 |
| — |
| 2,011 |
| 54 |
| 505 |
| 501 |
| — |
| 1,515 |
| 507 |
| 5,440 |
|
| Undeveloped | | 222 |
| — |
| 1,093 |
| 195 |
| 608 |
| 288 |
| — |
| 1,374 |
| 272 |
| 4,052 |
|
| | | 569 |
| — |
| 3,104 |
| 248 |
| 1,114 |
| 790 |
| — |
| 2,889 |
| 779 |
| 9,492 |
|
Equity-accounted entities (BP share)h | | | | | | | | | | | |
| At 1 January | | | | | | | | | | | |
| Developed | | — |
| 63 |
| — |
| — |
| 588 |
| 83 |
| 4,168 |
| 47 |
| — |
| 4,951 |
|
| Undeveloped | | — |
| 75 |
| — |
| — |
| 417 |
| — |
| 3,235 |
| 1 |
| — |
| 3,729 |
|
| | | — |
| 138 |
| — |
| — |
| 1,005 |
| 83 |
| 7,404 |
| 49 |
| — |
| 8,679 |
|
| Changes attributable to | | | | | | | | | | | |
| Revisions of previous estimates | | — |
| 5 |
| — |
| — |
| 9 |
| 2 |
| 439 |
| (1 | ) | — |
| 454 |
|
| Improved recovery | | — |
| 19 |
| — |
| — |
| 14 |
| — |
| — |
| — |
| — |
| 33 |
|
| Purchases of reserves-in-place | | — |
| 42 |
| — |
| — |
| — |
| 41 |
| 38 |
| — |
| — |
| 122 |
|
| Discoveries and extensions | | — |
| 1 |
| — |
| — |
| 34 |
| — |
| 320 |
| — |
| — |
| 355 |
|
Productione | | — |
| (15 | ) | — |
| — |
| (58 | ) | (7 | ) | (411 | ) | (38 | ) | — |
| (530 | ) |
| Sales of reserves-in-place | | — |
| (7 | ) | — |
| — |
| (158 | ) | — |
| — |
| — |
| — |
| (165 | ) |
| | | — |
| 46 |
| — |
| — |
| (159 | ) | 35 |
| 386 |
| (39 | ) | — |
| 269 |
|
At 31 Decemberi j | | | | | | | | | | | |
| Developed | | — |
| 80 |
| — |
| — |
| 505 |
| 93 |
| 4,254 |
| 9 |
| — |
| 4,941 |
|
| Undeveloped | | — |
| 105 |
| — |
| — |
| 341 |
| 25 |
| 3,536 |
| 1 |
| — |
| 4,008 |
|
| | | — |
| 184 |
| — |
| — |
| 846 |
| 119 |
| 7,790 |
| 10 |
| — |
| 8,949 |
|
| Total subsidiaries and equity-accounted entities (BP share) | | | | | | | |
| At 1 January | | | | | | | | | | | |
| Developed | | 254 |
| 63 |
| 1,990 |
| 42 |
| 909 |
| 545 |
| 4,168 |
| 1,480 |
| 561 |
| 10,014 |
|
| Undeveloped | | 338 |
| 75 |
| 1,012 |
| 209 |
| 1,313 |
| 420 |
| 3,235 |
| 896 |
| 299 |
| 7,797 |
|
| | | 592 |
| 138 |
| 3,002 |
| 251 |
| 2,222 |
| 966 |
| 7,404 |
| 2,376 |
| 860 |
| 17,810 |
|
| At 31 December | | | | | | | | | | | |
| Developed | | 347 |
| 80 |
| 2,011 |
| 54 |
| 1,010 |
| 595 |
| 4,254 |
| 1,524 |
| 507 |
| 10,381 |
|
| Undeveloped | | 222 |
| 105 |
| 1,093 |
| 195 |
| 949 |
| 314 |
| 3,536 |
| 1,374 |
| 272 |
| 8,060 |
|
| | | 569 |
| 184 |
| 3,104 |
| 249 |
| 1,959 |
| 908 |
| 7,790 |
| 2,899 |
| 779 |
| 18,441 |
|
| |
a
| Proved reserves exclude royalties due to others, whether payable in cash or in kind, where the royalty owner has a direct interest in the underlying production and the option and ability to make lifting and sales arrangements independently. |
| |
b
| Because of rounding, some totals may not exactly agree with the sum of their component parts. |
| |
c
| 5.8 billion cubic feet of natural gas = 1 million barrels of oil equivalent. |
| |
d
| Proved reserves in the Prudhoe Bay field in Alaska include an estimated 9 million barrels of oil equivalent upon which a net profits royalty will be payable, over the life of the field under the terms of the BP Prudhoe Bay Royalty Trust. |
| |
e
| Excludes NGLs from processing plants in which an interest is held of less than 1 thousand barrels per day for subsidiaries and 2 thousand barrels per day for equity-accounted entities. |
| |
f
| Includes 31 million barrels of oil equivalent of natural gas consumed in operations, 23 million barrels of oil equivalent in subsidiaries, 8 million barrels of oil equivalent in equity-accounted entities. |
| |
g
| Includes 335 million barrels of oil equivalent in respect of the 30% non-controlling interest in BP Trinidad and Tobago LLC. |
| |
h
| Volumes of equity-accounted entities include volumes of equity-accounted investments of those entities. |
| |
i
| Includes 391 million barrels of oil equivalent in respect of the non-controlling interest in Rosneft, including 7 mmboe held through BP’s equity accounted interest in Taas-Yuryakh Neftegazodobycha. |
| |
j
| Total proved reserves held as part of our equity interest in Rosneft is 7,864 million barrels of oil equivalent, comprising less than 1 million barrels of oil equivalent in Canada, 64 million barrels of oil equivalent in Venezuela, 3 million barrels of oil equivalent in Vietnam, 41 million barrels of oil equivalent in Egypt and 7,755 million barrels of oil equivalent in Russia. |
|
| | | |
|
BP Annual Report and Form 20-F 2019
| | 253Financial statements |
Standardized measure of discounted future net cash flows and changes therein relating to proved oil and gas reserves
The following tables set out the standardized measure of discounted future net cash flows, and changes therein, relating to crude oil and natural gas production from the group’s estimated proved reserves. This information is prepared in compliance with FASB Oil and Gas Disclosures requirements.
Future net cash flows have been prepared on the basis of certain assumptions which may or may not be realized. These include the timing of future production, the estimation of crude oil and natural gas reserves and the application of average crude oil and natural gas prices and exchange rates from the previous 12 months. Furthermore, both proved reserves estimates and production forecasts are subject to revision as further technical information becomes available and economic conditions change. BPbp cautions against relying on the information presented because of the highly arbitrary nature of the assumptions on which it is based and its lack of comparability with the historical cost information presented in the financial statements.
| | | | | | $ million |
| | | | $ million |
| | | | 2019 |
| | | | | | | | | | 2020 |
| | | Europe | North America | South America | Africa | Asia | Australasia | Total |
| | | Europe | North
America | South
America | Africa | Asia | Australasia | Total |
| | | UK |
| Rest of Europe |
| US |
| Rest of North America |
| | Russia |
| Rest of Asia |
| | | | UK | Rest of
Europe | US | Rest of
North
America | | Russia | Rest of
Asia | |
| At 31 December | | | At 31 December | | |
| Subsidiaries | | | Subsidiaries | | |
Future cash inflowsa | | 28,600 |
| — |
| 135,900 |
| 7,400 |
| 11,500 |
| 21,200 |
| — |
| 135,800 |
| 24,000 |
| 364,400 |
| Future cash inflowsa | | 13,900 | | — | | 64,400 | | 4,100 | | 6,700 | | 12,600 | | — | | 93,500 | | 15,900 | | 211,100 | |
Future production costb | | 13,700 |
| — |
| 59,200 |
| 3,400 |
| 5,700 |
| 6,700 |
| — |
| 53,200 |
| 6,100 |
| 148,000 |
| Future production costb | | 10,000 | | — | | 28,200 | | 3,400 | | 3,600 | | 4,200 | | — | | 45,300 | | 5,400 | | 100,100 | |
Future development costb | | 1,700 |
| — |
| 16,400 |
| 1,200 |
| 2,000 |
| 1,300 |
| — |
| 16,700 |
| 2,700 |
| 42,000 |
| Future development costb | | 800 | | — | | 12,700 | | 1,200 | | 1,700 | | 1,100 | | — | | 13,300 | | 1,900 | | 32,700 | |
Future taxationc | | 5,200 |
| — |
| 8,700 |
| 200 |
| 1,300 |
| 3,300 |
| — |
| 46,000 |
| 5,300 |
| 70,000 |
| Future taxationc | | 1,200 | | — | | 1,100 | | — | | 500 | | 1,800 | | — | | 26,100 | | 2,600 | | 33,300 | |
| Future net cash flows | | 8,000 |
| — |
| 51,600 |
| 2,600 |
| 2,500 |
| 9,900 |
| — |
| 19,900 |
| 9,900 |
| 104,400 |
| Future net cash flows | | 1,900 | | — | | 22,400 | | (500) | | 900 | | 5,500 | | — | | 8,800 | | 6,000 | | 45,000 | |
10% annual discountd | | 2,700 |
| — |
| 23,100 |
| 1,400 |
| 600 |
| 2,300 |
| — |
| 7,200 |
| 4,400 |
| 41,700 |
| 10% annual discountd | | 500 | | — | | 9,200 | | (200) | | 200 | | 1,100 | | — | | 2,000 | | 2,500 | | 15,300 | |
Standardized measure of discounted future net cash flowse f | | 5,300 |
| — |
| 28,500 |
| 1,200 |
| 1,900 |
| 7,600 |
| — |
| 12,700 |
| 5,500 |
| 62,700 |
| Standardized measure of discounted future net cash flowse f | | 1,400 | | — | | 13,200 | | (300) | | 700 | | 4,400 | | — | | 6,800 | | 3,500 | | 29,700 | |
Equity-accounted entities (BP share)g | | | |
Equity-accounted entities (bp share)g | | Equity-accounted entities (bp share)g | | |
Future cash inflowsa | | — |
| 10,300 |
| — |
| — |
| 36,800 |
| — |
| 322,000 |
| — |
| — |
| 369,100 |
| Future cash inflowsa | | — | | 6,300 | | — | | — | | 25,100 | | — | | 214,800 | | — | | — | | 246,200 | |
Future production costb | | — |
| 3,500 |
| — |
| — |
| 14,900 |
| — |
| 222,600 |
| — |
| — |
| 241,000 |
| Future production costb | | — | | 3,100 | | — | | — | | 13,000 | | — | | 145,700 | | — | | — | | 161,800 | |
Future development costb | | — |
| 700 |
| — |
| — |
| 3,900 |
| — |
| 21,800 |
| — |
| — |
| 26,400 |
| Future development costb | | — | | 500 | | — | | — | | 3,300 | | — | | 20,800 | | — | | — | | 24,600 | |
Future taxationc | | — |
| 4,700 |
| — |
| — |
| 4,100 |
| — |
| 13,300 |
| — |
| — |
| 22,100 |
| Future taxationc | | — | | 2,200 | | — | | — | | 1,700 | | — | | 8,000 | | — | | — | | 11,900 | |
| Future net cash flows | | — |
| 1,400 |
| — |
| — |
| 13,900 |
| — |
| 64,300 |
| — |
| — |
| 79,600 |
| Future net cash flows | | — | | 500 | | — | | — | | 7,100 | | — | | 40,300 | | — | | — | | 47,900 | |
10% annual discountd | | — |
| 400 |
| — |
| — |
| 8,200 |
| — |
| 37,100 |
| — |
| — |
| 45,700 |
| 10% annual discountd | | — | | 100 | | — | | — | | 4,400 | | — | | 23,500 | | — | | — | | 28,000 | |
Standardized measure of discounted future net cash flowsh i | | — |
| 1,000 |
| — |
| — |
| 5,700 |
| — |
| 27,200 |
| — |
| — |
| 33,900 |
| Standardized measure of discounted future net cash flowsh i | | — | | 400 | | — | | — | | 2,700 | | — | | 16,800 | | — | | — | | 19,900 | |
| Total subsidiaries and equity-accounted entities | Total subsidiaries and equity-accounted entities | Total subsidiaries and equity-accounted entities |
Standardized measure of discounted future net cash flowsj | | 5,300 |
| 1,000 |
| 28,500 |
| 1,200 |
| 7,600 |
| 7,600 |
| 27,200 |
| 12,700 |
| 5,500 |
| 96,600 |
| Standardized measure of discounted future net cash flowsj | | 1,400 | | 400 | | 13,200 | | (300) | | 3,400 | | 4,400 | | 16,800 | | 6,800 | | 3,500 | | 49,600 | |
The following are the principal sources of change in the standardized measure of discounted future net cash flows:
| | | | | | | | | | | | | | |
| | | | $ million |
| | Subsidiaries | Equity-accounted
entities (bp share) | Total subsidiaries and
equity-accounted
entities |
| Sales and transfers of oil and gas produced, net of production costs | | (21,200) | | (6,000) | | (27,200) | |
| Development costs for the current year as estimated in previous year | | 8,700 | | 4,100 | | 12,800 | |
| Extensions, discoveries and improved recovery, less related costs | | 1,100 | | 1,400 | | 2,500 | |
| Net changes in prices and production cost | | (51,600) | | (19,200) | | (70,800) | |
| Revisions of previous reserves estimates | | 6,900 | | 400 | | 7,300 | |
| Net change in taxation | | 22,900 | | 4,600 | | 27,500 | |
| Future development costs | | 100 | | (2,700) | | (2,600) | |
| Net change in purchase and sales of reserves-in-place | | (6,200) | | — | | (6,200) | |
| Addition of 10% annual discount | | 6,300 | | 3,400 | | 9,700 | |
Total change in the standardized measure during the yeark | | (33,000) | | (14,000) | | (47,000) | |
|
| | | | | | | |
| | | | | $ million |
|
| | | Subsidiaries |
| Equity-accounted entities (BP share) |
| Total subsidiaries and equity-accounted entities |
|
| Sales and transfers of oil and gas produced, net of production costs | | (27,400 | ) | (8,400 | ) | (35,800 | ) |
| Development costs for the current year as estimated in previous year | | 9,200 |
| 4,100 |
| 13,300 |
|
| Extensions, discoveries and improved recovery, less related costs | | 3,800 |
| 2,600 |
| 6,400 |
|
| Net changes in prices and production cost | | (28,100 | ) | (8,200 | ) | (36,300 | ) |
| Revisions of previous reserves estimates | | 300 |
| 1,100 |
| 1,400 |
|
| Net change in taxation | | 16,600 |
| 2,400 |
| 19,000 |
|
| Future development costs | | (1,500 | ) | (4,300 | ) | (5,800 | ) |
| Net change in purchase and sales of reserves-in-place | | (1,400 | ) | — |
| (1,400 | ) |
| Addition of 10% annual discount | | 8,300 |
| 4,100 |
| 12,400 |
|
Total change in the standardized measure during the yeark | | (20,200 | ) | (6,600 | ) | (26,800 | ) |
| |
a
| The marker prices used were Brent $62.74/bbl, Henry Hub $2.58/mmBtu. |
| |
b
| Production costs, which include production taxes, and development costs relating to future production of proved reserves are based on the continuation of existing economic conditions. Future decommissioning costs are included. |
| |
c
| Taxation is computed with reference to appropriate year-end statutory corporate income tax rates. |
| |
d
| Future net cash flows from oil and natural gas production are discounted at 10% regardless of the group assessment of the risk associated with its producing activities. |
| |
e
| In certain situations, revenues and costs are included in the standardized measure of discounted future net cash flows valuation and excluded from the determination of proved reserves and vice versa. This can result in the standardized measure of discounted future net cash flows being negative. |
| |
f
| Non-controlling interests in BP Trinidad and Tobago LLC amounted to $600 million. |
| |
g
| The standardized measure of discounted future net cash flows of equity-accounted entities includes standardized measure of discounted future net cash flows of equity-accounted investments of those entities. |
| |
h
| Non-controlling interests in Rosneft amounted to $2,100 million in Russia. |
| |
i
| No equity-accounted future cash flows in Africa because proved reserves are received as a result of contractual arrangements, with no associated costs. |
| |
j
| Includes future net cash flows for assets held for sale at 31 December 2019. |
b Production costs, which include production taxes, and development costs relating to future production of proved reserves are based on the continuation of existing economic conditions. Future decommissioning costs are included.
c Taxation is computed with reference to appropriate year-end statutory corporate income tax rates.
d Future net cash flows from oil and natural gas production are discounted at 10% regardless of the group assessment of the risk associated with its producing activities.
e In certain situations, revenues and costs are included in the standardized measure of discounted future net cash flows valuation and excluded from the determination of proved reserves and vice versa. This can result in the standardized measure of discounted future net cash flows being negative.
f Non-controlling interests in BP Trinidad and Tobago LLC amounted to $200 million.
g The standardized measure of discounted future net cash flows of equity-accounted entities includes standardized measure of discounted future net cash flows of equity-accounted investments of those entities.
h Non-controlling interests in Rosneft amounted to $1,600 million in Russia.
i No equity-accounted future cash flows in Africa because proved reserves are received as a result of contractual arrangements, with no associated costs.
j Includes future net cash flows for assets held for sale at 31 December 2020.
k Total change in the standardized measure during the year includes the effect of exchange rate movements. Exchange rate effects arising from the translation of our share of Rosneft changes to US dollars are included within ‘Net changes in prices and production cost’.
|
| | | | | | | | | | | | | |
254 | | BPbp Annual Report and Form 20-F 2019
2020 | | 253 |
Standardized measure of discounted future net cash flows and changes therein relating to proved oil and gas reserves – continued
| | | | | | $ million |
| | | | $ million |
| | | | 2018 |
| | | | | | | | | | 2019 |
| | | Europe | North America | South America | Africa | Asia | Australasia | Total |
| | | Europe | North
America | South
America | Africa | Asia | Australasia | Total |
| | | UK |
| Rest of Europe |
| US |
| Rest of North America |
| | Russia |
| Rest of Asia |
| | | | UK | Rest of
Europe | US | Rest of
North
America | | Russia | Rest of
Asia | |
| At 31 December | | | At 31 December | | |
| Subsidiaries | | | Subsidiaries | |
Future cash inflowsa | | 39,700 |
| — |
| 160,000 |
| 4,100 |
| 17,500 |
| 30,400 |
| — |
| 147,500 |
| 30,000 |
| 429,200 |
| Future cash inflowsa | | 28,600 | | — | | 135,900 | | 7,400 | | 11,500 | | 21,200 | | — | | 135,800 | | 24,000 | | 364,400 | |
Future production costb | | 15,000 |
| — |
| 57,600 |
| 3,400 |
| 7,200 |
| 8,500 |
| — |
| 55,800 |
| 7,600 |
| 155,100 |
| Future production costb | | 13,700 | | — | | 59,200 | | 3,400 | | 5,700 | | 6,700 | | — | | 53,200 | | 6,100 | | 148,000 | |
Future development costb | | 2,100 |
| — |
| 17,800 |
| 1,100 |
| 2,800 |
| 2,600 |
| — |
| 16,400 |
| 2,500 |
| 45,300 |
| Future development costb | | 1,700 | | — | | 16,400 | | 1,200 | | 2,000 | | 1,300 | | — | | 16,700 | | 2,700 | | 42,000 | |
Future taxationc | | 8,900 |
| — |
| 16,600 |
| — |
| 3,200 |
| 5,300 |
| — |
| 51,100 |
| 6,900 |
| 92,000 |
| Future taxationc | | 5,200 | | — | | 8,700 | | 200 | | 1,300 | | 3,300 | | — | | 46,000 | | 5,300 | | 70,000 | |
| Future net cash flows | | 13,700 |
| — |
| 68,000 |
| (400 | ) | 4,300 |
| 14,000 |
| — |
| 24,200 |
| 13,000 |
| 136,800 |
| Future net cash flows | | 8,000 | | — | | 51,600 | | 2,600 | | 2,500 | | 9,900 | | — | | 19,900 | | 9,900 | | 104,400 | |
10% annual discountd | | 5,000 |
| — |
| 29,900 |
| (200 | ) | 700 |
| 3,300 |
| — |
| 9,400 |
| 5,800 |
| 53,900 |
| 10% annual discountd | | 2,700 | | — | | 23,100 | | 1,400 | | 600 | | 2,300 | | — | | 7,200 | | 4,400 | | 41,700 | |
Standardized measure of discounted future net cash flowse f | | 8,700 |
| — |
| 38,100 |
| (200 | ) | 3,600 |
| 10,700 |
| — |
| 14,800 |
| 7,200 |
| 82,900 |
| Standardized measure of discounted future net cash flowse f | | 5,300 | | — | | 28,500 | | 1,200 | | 1,900 | | 7,600 | | — | | 12,700 | | 5,500 | | 62,700 | |
Equity-accounted entities (BP share)g | | |
Equity-accounted entities (bp share)g | | Equity-accounted entities (bp share)g | |
Future cash inflowsa | | — |
| 12,800 |
| — |
| — |
| 38,500 |
| — |
| 356,800 |
| — |
| — |
| 408,100 |
| Future cash inflowsa | | — | | 10,300 | | — | | — | | 36,800 | | — | | 322,000 | | — | | — | | 369,100 | |
Future production costb | | — |
| 4,200 |
| — |
| — |
| 16,100 |
| — |
| 238,400 |
| — |
| — |
| 258,700 |
| Future production costb | | — | | 3,500 | | — | | — | | 14,900 | | — | | 222,600 | | — | | — | | 241,000 | |
Future development costb | | — |
| 800 |
| — |
| — |
| 3,600 |
| — |
| 19,300 |
| — |
| — |
| 23,700 |
| Future development costb | | — | | 700 | | — | | — | | 3,900 | | — | | 21,800 | | — | | — | | 26,400 | |
Future taxationc | | — |
| 5,900 |
| — |
| — |
| 4,400 |
| — |
| 17,700 |
| — |
| — |
| 28,000 |
| Future taxationc | | — | | 4,700 | | — | | — | | 4,100 | | — | | 13,300 | | — | | — | | 22,100 | |
| Future net cash flows | | — |
| 1,900 |
| — |
| — |
| 14,400 |
| — |
| 81,400 |
| — |
| — |
| 97,700 |
| Future net cash flows | | — | | 1,400 | | — | | — | | 13,900 | | — | | 64,300 | | — | | — | | 79,600 | |
10% annual discountd | | — |
| 600 |
| — |
| — |
| 8,500 |
| — |
| 48,100 |
| — |
| — |
| 57,200 |
| 10% annual discountd | | — | | 400 | | — | | — | | 8,200 | | — | | 37,100 | | — | | — | | 45,700 | |
Standardized measure of discounted future net cash flowsh i | | — |
| 1,300 |
| — |
| — |
| 5,900 |
| — |
| 33,300 |
| — |
| — |
| 40,500 |
| Standardized measure of discounted future net cash flowsh i | | — | | 1,000 | | — | | — | | 5,700 | | — | | 27,200 | | — | | — | | 33,900 | |
| Total subsidiaries and equity-accounted entities | Total subsidiaries and equity-accounted entities | | Total subsidiaries and equity-accounted entities | |
| Standardized measure of discounted future net cash flows | | 8,700 |
| 1,300 |
| 38,100 |
| (200 | ) | 9,500 |
| 10,700 |
| 33,300 |
| 14,800 |
| 7,200 |
| 123,400 |
| |
Standardized measure of discounted future net cash flowsj | | Standardized measure of discounted future net cash flowsj | | 5,300 | | 1,000 | | 28,500 | | 1,200 | | 7,600 | | 7,600 | | 27,200 | | 12,700 | | 5,500 | | 96,600 | |
The following are the principal sources of change in the standardized measure of discounted future net cash flows:
| | | | | | | | | | | | | | |
| | | | $ million |
| | Subsidiaries | Equity-accounted
entities (bp share) | Total subsidiaries and equity-accounted entities |
| Sales and transfers of oil and gas produced, net of production costs | | (27,400) | | (8,400) | | (35,800) | |
| Development costs for the current year as estimated in previous year | | 9,200 | | 4,100 | | 13,300 | |
| Extensions, discoveries and improved recovery, less related costs | | 3,800 | | 2,600 | | 6,400 | |
| Net changes in prices and production cost | | (28,100) | | (8,200) | | (36,300) | |
| Revisions of previous reserves estimates | | 300 | | 1,100 | | 1,400 | |
| Net change in taxation | | 16,600 | | 2,400 | | 19,000 | |
| Future development costs | | (1,500) | | (4,300) | | (5,800) | |
| Net change in purchase and sales of reserves-in-place | | (1,400) | | — | | (1,400) | |
| Addition of 10% annual discount | | 8,300 | | 4,100 | | 12,400 | |
Total change in the standardized measure during the yeark | | (20,200) | | (6,600) | | (26,800) | |
|
| | | | | | | |
| | | | | $ million |
|
| | | Subsidiaries |
| Equity-accounted entities (BP share) |
| Total subsidiaries and equity-accounted entities |
|
| Sales and transfers of oil and gas produced, net of production costs | | (18,800 | ) | (8,000 | ) | (26,800 | ) |
| Development costs for the current year as estimated in previous year | | 8,500 |
| 4,300 |
| 12,800 |
|
| Extensions, discoveries and improved recovery, less related costs | | 5,800 |
| 3,300 |
| 9,100 |
|
| Net changes in prices and production cost | | 41,000 |
| 13,100 |
| 54,100 |
|
| Revisions of previous reserves estimates | | (2,100 | ) | 2,000 |
| (100 | ) |
| Net change in taxation | | (17,000 | ) | (4,600 | ) | (21,600 | ) |
| Future development costs | | 1,000 |
| (3,500 | ) | (2,500 | ) |
| Net change in purchase and sales of reserves-in-place | | 7,600 |
| 400 |
| 8,000 |
|
| Addition of 10% annual discount | | 5,200 |
| 3,100 |
| 8,300 |
|
Total change in the standardized measure during the yearj | | 31,200 |
| 10,100 |
| 41,300 |
|
| |
a
| The marker prices used were Brent $71.43/bbl, Henry Hub $3.10/mmBtu. |
| |
b
| Production costs, which include production taxes, and development costs relating to future production of proved reserves are based on the continuation of existing economic conditions. Future decommissioning costs are included. 2018 comparative for Russia equity-accounted entity future production cost has been restated from $232,100 million to maintain consistency with 2019 presentation. |
| |
c
| Taxation is computed with reference to appropriate year-end statutory corporate income tax rates. 2018 comparative for Russia equity-accounted entity future taxation has been restated from $24,000 million to maintain consistency with 2019 presentation. |
| |
d
| Future net cash flows from oil and natural gas production are discounted at 10% regardless of the group assessment of the risk associated with its producing activities. |
| |
e
| In certain situations, revenues and costs are included in the standardized measure of discounted future net cash flows valuation and excluded from the determination of proved reserves and vice versa. This can result in the standardized measure of discounted future net cash flows being negative. |
| |
f
| Non-controlling interests in BP Trinidad and Tobago LLC amounted to $1,100 million. |
| |
g
| The standardized measure of discounted future net cash flows of equity-accounted entities includes standardized measure of discounted future net cash flows of equity-accounted investments of those entities. |
| |
h
| Non-controlling interests in Rosneft amounted to $2,500 million in Russia. |
| |
i
| No equity-accounted future cash flows in Africa because proved reserves are received as a result of contractual arrangements, with no associated costs. |
| |
i
| Total change in the standardized measure during the year includes the effect of exchange rate movements. Exchange rate effects arising from the translation of our share of Rosneft changes to US dollars are included within ‘Net changes in prices and production cost’. |
b Production costs, which include production taxes, and development costs relating to future production of proved reserves are based on the continuation of existing economic conditions. Future decommissioning costs are included.
c Taxation is computed with reference to appropriate year-end statutory corporate income tax rates.
d Future net cash flows from oil and natural gas production are discounted at 10% regardless of the group assessment of the risk associated with its producing activities.
e In certain situations, revenues and costs are included in the standardized measure of discounted future net cash flows valuation and excluded from the determination of proved reserves and vice versa. This can result in the standardized measure of discounted future net cash flows being negative.
f Non-controlling interests in BP Trinidad and Tobago LLC amounted to $600 million.
g The standardized measure of discounted future net cash flows of equity-accounted entities includes standardized measure of discounted future net cash flows of equity-accounted investments of those entities.
h Non-controlling interests in Rosneft amounted to $2,100 million in Russia.
i No equity-accounted future cash flows in Africa because proved reserves are received as a result of contractual arrangements, with no associated costs.
i Includes future net cash flows for assets held for sale at 31 December 2019.
k Total change in the standardized measure during the year includes the effect of exchange rate movements. Exchange rate effects arising from the translation of our share of Rosneft changes to US dollars are included within ‘Net changes in prices and production cost’.
|
| | | | | | | | | | | | | |
| 254 | BP
| bp Annual Report and Form 20-F 20192020 | | 255 |
Standardized measure of discounted future net cash flows and changes therein relating to proved oil and gas reserves – continued
| | | | | | $ million |
| | | | $ million |
| | | | 2017 |
| | | | | | | | | | 2018 |
| | | Europe | North America | South America | Africa | Asia | Australasia | Total |
| | | Europe | North
America | South
America | Africa | Asia | Australasia | Total |
| | | UK |
| Rest of Europe |
| US |
| Rest of North America |
| | Russia |
| Rest of Asia |
| | | | UK | Rest of
Europe | US | Rest of
North
America | | Russia | Rest of
Asia | |
| At 31 December | | | At 31 December | | |
| Subsidiaries | | | Subsidiaries | |
Future cash inflowsa | | 26,300 |
| — |
| 99,200 |
| 7,100 |
| 15,200 |
| 27,000 |
| — |
| 118,800 |
| 26,200 |
| 319,800 |
| Future cash inflowsa | | 39,700 | | — | | 160,000 | | 4,100 | | 17,500 | | 30,400 | | — | | 147,500 | | 30,000 | | 429,200 | |
Future production costb | | 13,800 |
| — |
| 46,700 |
| 4,100 |
| 7,100 |
| 8,600 |
| — |
| 52,600 |
| 8,400 |
| 141,300 |
| Future production costb | | 15,000 | | — | | 57,600 | | 3,400 | | 7,200 | | 8,500 | | — | | 55,800 | | 7,600 | | 155,100 | |
Future development costb | | 1,700 |
| — |
| 12,100 |
| 1,100 |
| 2,400 |
| 3,400 |
| — |
| 18,200 |
| 3,200 |
| 42,100 |
| Future development costb | | 2,100 | | — | | 17,800 | | 1,100 | | 2,800 | | 2,600 | | — | | 16,400 | | 2,500 | | 45,300 | |
Future taxationc | | 4,200 |
| — |
| 6,500 |
| — |
| 1,700 |
| 3,800 |
| — |
| 33,200 |
| 4,800 |
| 54,200 |
| Future taxationc | | 8,900 | | — | | 16,600 | | — | | 3,200 | | 5,300 | | — | | 51,100 | | 6,900 | | 92,000 | |
| Future net cash flows | | 6,600 |
| — |
| 33,900 |
| 1,900 |
| 4,000 |
| 11,200 |
| — |
| 14,800 |
| 9,800 |
| 82,200 |
| Future net cash flows | | 13,700 | | — | | 68,000 | | (400) | | 4,300 | | 14,000 | | — | | 24,200 | | 13,000 | | 136,800 | |
10% annual discountd | | 2,100 |
| — |
| 13,100 |
| 1,100 |
| 500 |
| 3,400 |
| — |
| 5,500 |
| 4,800 |
| 30,500 |
| 10% annual discountd | | 5,000 | | — | | 29,900 | | (200) | | 700 | | 3,300 | | — | | 9,400 | | 5,800 | | 53,900 | |
Standardized measure of discounted future net cash flowse | | 4,500 |
| — |
| 20,800 |
| 800 |
| 3,500 |
| 7,800 |
| — |
| 9,300 |
| 5,000 |
| 51,700 |
| |
Equity-accounted entities (BP share)f | | |
Standardized measure of discounted future net cash flowse f | | Standardized measure of discounted future net cash flowse f | | 8,700 | | — | | 38,100 | | (200) | | 3,600 | | 10,700 | | — | | 14,800 | | 7,200 | | 82,900 | |
Equity-accounted entities (bp share)g | | Equity-accounted entities (bp share)g | |
Future cash inflowsa | | — |
| 9,000 |
| — |
| — |
| 32,900 |
| — |
| 205,100 |
| 400 |
| — |
| 247,400 |
| Future cash inflowsa | | — | | 12,800 | | — | | — | | 38,500 | | — | | 356,800 | | — | | — | | 408,100 | |
Future production costb | | — |
| 4,100 |
| — |
| — |
| 15,500 |
| — |
| 114,900 |
| 300 |
| — |
| 134,800 |
| Future production costb | | — | | 4,200 | | — | | — | | 16,100 | | — | | 238,400 | | — | | — | | 258,700 | |
Future development costb | | — |
| 800 |
| — |
| — |
| 3,400 |
| — |
| 17,600 |
| 100 |
| — |
| 21,900 |
| Future development costb | | — | | 800 | | — | | — | | 3,600 | | — | | 19,300 | | — | | — | | 23,700 | |
Future taxationc | | — |
| 3,100 |
| — |
| — |
| 3,100 |
| — |
| 12,400 |
| — |
| — |
| 18,600 |
| Future taxationc | | — | | 5,900 | | — | | — | | 4,400 | | — | | 17,700 | | — | | — | | 28,000 | |
| Future net cash flows | | — |
| 1,000 |
| — |
| — |
| 10,900 |
| — |
| 60,200 |
| — |
| — |
| 72,100 |
| Future net cash flows | | — | | 1,900 | | — | | — | | 14,400 | | — | | 81,400 | | — | | — | | 97,700 | |
10% annual discountd | | — |
| 400 |
| — |
| — |
| 6,400 |
| — |
| 34,900 |
| — |
| — |
| 41,700 |
| 10% annual discountd | | — | | 600 | | — | | — | | 8,500 | | — | | 48,100 | | — | | — | | 57,200 | |
Standardized measure of discounted future net cash flowsg h | | — |
| 600 |
| — |
| — |
| 4,500 |
| — |
| 25,300 |
| — |
| — |
| 30,400 |
| |
Standardized measure of discounted future net cash flowsh i | | Standardized measure of discounted future net cash flowsh i | | — | | 1,300 | | — | | — | | 5,900 | | — | | 33,300 | | — | | — | | 40,500 | |
| Total subsidiaries and equity-accounted entities | Total subsidiaries and equity-accounted entities | | Total subsidiaries and equity-accounted entities | |
| Standardized measure of discounted future net cash flows | | 4,500 |
| 600 |
| 20,800 |
| 800 |
| 8,000 |
| 7,800 |
| 25,300 |
| 9,300 |
| 5,000 |
| 82,100 |
| Standardized measure of discounted future net cash flows | | 8,700 | | 1,300 | | 38,100 | | (200) | | 9,500 | | 10,700 | | 33,300 | | 14,800 | | 7,200 | | 123,400 | |
The following are the principal sources of change in the standardized measure of discounted future net cash flows:
| | | | | | | | | | | | | | |
| | | | $ million |
| | Subsidiaries | Equity-accounted
entities (bp share) | Total subsidiaries and
equity-accounted
entities |
| Sales and transfers of oil and gas produced, net of production costs | | (18,800) | | (8,000) | | (26,800) | |
| Development costs for the current year as estimated in previous year | | 8,500 | | 4,300 | | 12,800 | |
| Extensions, discoveries and improved recovery, less related costs | | 5,800 | | 3,300 | | 9,100 | |
| Net changes in prices and production cost | | 41,000 | | 13,100 | | 54,100 | |
| Revisions of previous reserves estimates | | (2,100) | | 2,000 | | (100) | |
| Net change in taxation | | (17,000) | | (4,600) | | (21,600) | |
| Future development costs | | 1,000 | | (3,500) | | (2,500) | |
| Net change in purchase and sales of reserves-in-place | | 7,600 | | 400 | | 8,000 | |
| Addition of 10% annual discount | | 5,200 | | 3,100 | | 8,300 | |
Total change in the standardized measure during the yearj | | 31,200 | | 10,100 | | 41,300 | |
|
| | | | | | | |
| | | | | $ million |
|
| | | Subsidiaries |
| Equity-accounted entities (BP share) |
| Total subsidiaries and equity-accounted entities |
|
| Sales and transfers of oil and gas produced, net of production costs | | (12,800 | ) | (5,500 | ) | (18,300 | ) |
| Development costs for the current year as estimated in previous year | | 9,800 |
| 4,200 |
| 14,000 |
|
| Extensions, discoveries and improved recovery, less related costs | | 2,300 |
| 1,300 |
| 3,600 |
|
| Net changes in prices and production cost | | 33,100 |
| 7,300 |
| 40,400 |
|
| Revisions of previous reserves estimates | | 2,800 |
| 1,000 |
| 3,800 |
|
| Net change in taxation | | (12,500 | ) | (1,500 | ) | (14,000 | ) |
| Future development costs | | 3,000 |
| (4,600 | ) | (1,600 | ) |
| Net change in purchase and sales of reserves-in-place | | 800 |
| (600 | ) | 200 |
|
| Addition of 10% annual discount | | 2,300 |
| 2,600 |
| 4,900 |
|
Total change in the standardized measure during the yearj | | 28,800 |
| 4,200 |
| 33,000 |
|
| |
a
| The marker prices used were Brent $54.36/bbl, Henry Hub $2.96/mmBtu. |
| |
b
| Production costs, which include production taxes, and development costs relating to future production of proved reserves are based on the continuation of existing economic conditions. Future decommissioning costs are included. |
| |
c
| Taxation is computed with reference to appropriate year-end statutory corporate income tax rates. |
| |
d
| Future net cash flows from oil and natural gas production are discounted at 10% regardless of the group assessment of the risk associated with its producing activities. |
| |
e
| Non-controlling interests in BP Trinidad and Tobago LLC amounted to $1,100 million. |
| |
f
| The standardized measure of discounted future net cash flows of equity-accounted entities includes standardized measure of discounted future net cash flows of equity-accounted investments of those entities. |
| |
g
| Non-controlling interests in Rosneft amounted to $1,963 million in Russia. |
| |
h
| No equity-accounted future cash flows in Africa because proved reserves are received as a result of contractual arrangements, with no associated costs. |
| |
i
| Total change in the standardized measure during the year includes the effect of exchange rate movements. Exchange rate effects arising from the translation of our share of Rosneft to US dollars are included within ‘Net changes in prices and production cost’. |
a The marker prices used were Brent $71.43/bbl, Henry Hub $3.10/mmBtu.
b Production costs, which include production taxes, and development costs relating to future production of proved reserves are based on the continuation of existing economic conditions. Future decommissioning costs are included. 2018 comparative for Russia equity-accounted entity future production cost has been restated from $232,100 million to maintain consistency with 2019 presentation.
c Taxation is computed with reference to appropriate year-end statutory corporate income tax rates. 2018 comparative for Russia equity-accounted entity future taxation has been restated from $24,000 million to maintain consistency with 2019 presentation.
d Future net cash flows from oil and natural gas production are discounted at 10% regardless of the group assessment of the risk associated with its producing activities.
e In certain situations, revenues and costs are included in the standardized measure of discounted future net cash flows valuation and excluded from the determination of proved reserves and vice versa. This can result in the standardized measure of discounted future net cash flows being negative.
f Non-controlling interests in BP Trinidad and Tobago LLC amounted to $1,100 million.
g The standardized measure of discounted future net cash flows of equity-accounted entities includes standardized measure of discounted future net cash flows of equity-accounted investments of those entities.
h Non-controlling interests in Rosneft amounted to $2,500 million in Russia.
i No equity-accounted future cash flows in Africa because proved reserves are received as a result of contractual arrangements, with no associated costs.
j Total change in the standardized measure during the year includes the effect of exchange rate movements. Exchange rate effects arising from the translation of our share of Rosneft changes to US dollars are included within ‘Net changes in prices and production cost’.
|
| | | | | | | | | | | | | |
256 | | BPbp Annual Report and Form 20-F 2019
2020 | | 255 |
Operational and statistical information
The following tables present operational and statistical information related to production, drilling, productive wells and acreage. Figures include amounts attributable to assets held for sale.
Crude oil and natural gas production
The following table shows crude oil, natural gas liquids and natural gas production for the years ended 31 December 2020, 2019 2018 and 2017.2018.
Production for the yeara b
| | | | | | | | | | | | | | | | | | | | | | | | | | | | | | | | | | | |
| | Europe | North
America | South
America | Africa | Asia | Australasia | Total |
| | UK | Rest of
Europe | US | Rest of
North
America | | | Russiac | Rest of
Asia | | |
Subsidiariesd | | | | | | | | | | | |
Crude oile | | | | | | | | | | thousand barrels per day |
| 2020 | | 96 | | — | | 345 | | 22 | | 7 | | 123 | | — | | 375 | | 15 | | 983 | |
| 2019 | | 100 | | — | | 400 | | 24 | | 7 | | 156 | | — | | 343 | | 17 | | 1,046 | |
| 2018 | | 101 | | — | | 385 | | 24 | | 7 | | 204 | | — | | 313 | | 17 | | 1,051 | |
| Natural gas liquids | | | thousand barrels per day |
| 2020 | | 5 | | — | | 79 | | — | | 7 | | 8 | | — | | — | | 2 | | 101 | |
| 2019 | | 3 | | — | | 81 | | — | | 9 | | 8 | | — | | — | | 2 | | 104 | |
| 2018 | | 5 | | — | | 60 | | — | | 9 | | 11 | | — | | — | | 2 | | 88 | |
Natural gasf | | | million cubic feet per day |
| 2020 | | 221 | | — | | 1,561 | | 2 | | 1,695 | | 923 | | — | | 966 | | 795 | | 6,163 | |
| 2019 | | 129 | | — | | 2,358 | | 2 | | 1,977 | | 1,138 | | — | | 976 | | 786 | | 7,366 | |
| 2018 | | 152 | | — | | 1,900 | | 7 | | 2,136 | | 1,061 | | — | | 826 | | 819 | | 6,900 | |
| Equity-accounted entities (bp share) | | | | | | | | | | | |
Crude oile | | | thousand barrels per day |
| 2020 | | — | | 50 | | — | | — | | 54 | | 1 | | 903 | | — | | — | | 1,009 | |
| 2019 | | — | | 35 | | — | | — | | 56 | | 1 | | 955 | | — | | — | | 1,047 | |
| 2018 | | — | | 34 | | — | | — | | 55 | | 1 | | 933 | | 16 | | — | | 1,040 | |
| Natural gas liquids | | | thousand barrels per day |
| 2020 | | — | | 3 | | — | | — | | 1 | | 7 | | 3 | | — | | — | | 14 | |
| 2019 | | — | | 2 | | — | | — | | 1 | | 8 | | 3 | | — | | — | | 14 | |
| 2018 | | — | | 2 | | — | | — | | — | | 6 | | 4 | | — | | — | | 12 | |
Natural gasf | | | million cubic feet per day |
| 2020 | | — | | 61 | | — | | — | | 286 | | 92 | | 1,327 | | — | | — | | 1,765 | |
| 2019 | | — | | 56 | | — | | — | | 314 | | 87 | | 1,279 | | — | | — | | 1,736 | |
| 2018 | | — | | 59 | | — | | — | | 335 | | 80 | | 1,286 | | — | | — | | 1,760 | |
|
| | | | | | | | | | | | | | | | | | | | | |
| | | Europe | North America | South America | Africa | Asia | Australasia | Total |
|
| | | UK |
| Rest of Europe |
| US |
| Rest of North America |
| | | Russiac |
| Rest of Asia |
| | |
Subsidiariesd | | | | | | | | | | | |
Crude oile | | | | | | | | | | thousand barrels per day | |
| 2019 | | 100 |
| — |
| 400 |
| 24 |
| 7 |
| 156 |
| — |
| 343 |
| 17 |
| 1,046 |
|
| 2018 | | 101 |
| — |
| 385 |
| 24 |
| 7 |
| 204 |
| — |
| 313 |
| 17 |
| 1,051 |
|
| 2017 | | 80 |
| — |
| 370 |
| 20 |
| 12 |
| 241 |
| — |
| 325 |
| 17 |
| 1,064 |
|
| Natural gas liquids | | | thousand barrels per day | |
| 2019 | | 3 |
| — |
| 81 |
| — |
| 9 |
| 8 |
| — |
| — |
| 2 |
| 104 |
|
| 2018 | | 5 |
| — |
| 60 |
| — |
| 9 |
| 11 |
| — |
| — |
| 2 |
| 88 |
|
| 2017 | | 6 |
| — |
| 56 |
| — |
| 10 |
| 10 |
| — |
| — |
| 2 |
| 85 |
|
Natural gasf | | | million cubic feet per day | |
| 2019 | | 129 |
| — |
| 2,358 |
| 2 |
| 1,977 |
| 1,138 |
| — |
| 976 |
| 786 |
| 7,366 |
|
| 2018 | | 152 |
| — |
| 1,900 |
| 7 |
| 2,136 |
| 1,061 |
| — |
| 826 |
| 819 |
| 6,900 |
|
| 2017 | | 182 |
| — |
| 1,659 |
| 9 |
| 1,936 |
| 949 |
| — |
| 371 |
| 783 |
| 5,889 |
|
| Equity-accounted entities (BP share) | | | | | | | | | |
Crude oile | | | thousand barrels per day | |
| 2019 | | — |
| 35 |
| — |
| — |
| 56 |
| 1 |
| 955 |
| — |
| — |
| 1,047 |
|
| 2018 | | — |
| 34 |
| — |
| — |
| 55 |
| 1 |
| 933 |
| 16 |
| — |
| 1,040 |
|
| 2017 | | — |
| 31 |
| — |
| — |
| 63 |
| 1 |
| 905 |
| 99 |
| — |
| 1,099 |
|
| Natural gas liquids | | | thousand barrels per day | |
| 2019 | | — |
| 2 |
| — |
| — |
| 1 |
| 8 |
| 3 |
| — |
| — |
| 14 |
|
| 2018 | | — |
| 2 |
| — |
| — |
| — |
| 6 |
| 4 |
| — |
| — |
| 12 |
|
| 2017 | | — |
| 2 |
| — |
| — |
| — |
| 6 |
| 4 |
| — |
| — |
| 12 |
|
Natural gasf | | | million cubic feet per day | |
| 2019 | | — |
| 56 |
| — |
| — |
| 314 |
| 87 |
| 1,279 |
| — |
| — |
| 1,736 |
|
| 2018 | | — |
| 59 |
| — |
| — |
| 335 |
| 80 |
| 1,286 |
| — |
| — |
| 1,760 |
|
| 2017 | | — |
| 53 |
| — |
| — |
| 418 |
| 77 |
| 1,308 |
| — |
| — |
| 1,855 |
|
| |
a
| Production excludes royalties due to others, whether payable in cash or in kind, where the royalty owner has a direct interest in the underlying production and the option and ability to make lifting and sales arrangements independently. |
| |
b
| Because of rounding, some totals may not exactly agree with the sum of their component parts. |
| |
c
| Amounts reported for Russia include BP’s share of Rosneft worldwide activities, including insignificant amounts outside Russia. |
| |
d
| All of the oil and liquid production from Canada is bitumen. |
| |
e
| Crude oil includes condensate. |
| |
f
| Natural gas production excludes gas consumed in operations. |
b Because of rounding, some totals may not exactly agree with the sum of their component parts.
c Amounts reported for Russia include bp’s share of Rosneft worldwide activities, including insignificant amounts outside Russia.
d All of the oil and liquid production from Canada is bitumen.
e Crude oil includes condensate.
f Natural gas production excludes gas consumed in operations.
|
| | | | | | | | | | | | | |
| 256 | BP
| bp Annual Report and Form 20-F 20192020 | | 257 |
Operational and statistical information – continued
Productive oil and gas wells and acreage
The following tables show the number of gross and net productive oil and natural gas wells and total gross and net developed and undeveloped oil and natural gas acreage in which the group and its equity-accounted entities had interests as at 31 December 2019.2020. A ‘gross’ well or acre is one in which a whole or fractional working interest is owned, while the number of ‘net’ wells or acres is the sum of the whole or fractional working interests in gross wells or acres. Productive wells are producing wells and wells capable of production. Developed acreage is the acreage within the boundary of a field, on which development wells have been drilled, which could produce the reserves; while undeveloped acres are those on which wells have not been drilled or completed to a point that would permit the production of commercial quantities, whether or not such acres contain proved reserves.
| | | | | | | | | | | | | | | | | | | | | | | | | | | | | | | | | | | | | | |
| | | Europe | North
America | South
America | Africa | Asia | Australasia | Totalb |
| | | UK | Rest of
Europe | US | Rest of
North
America | | | Russiaa | Rest of
Asia | | |
| Number of productive wells at 31 December 2020 | | | | | | | |
Oil wellsc | – gross | | 125 | | 90 | | 1,326 | | 175 | | 5,551 | | 291 | | 68,286 | | 2,020 | | 12 | | 77,876 | |
| – net | | 73 | | 27 | | 741 | | 47 | | 2,557 | | 62 | | 13,594 | | 475 | | 2 | | 17,578 | |
Gas wellsd | – gross | | 39 | | 2 | | 6,405 | | 238 | | 1,118 | | 241 | | 455 | | 138 | | 78 | | 8,714 | |
| – net | | 8 | | 1 | | 3,898 | | 118 | | 403 | | 102 | | 93 | | 70 | | 16 | | 4,709 | |
| Oil and natural gas acreage at 31 December 2020 | | | | | | thousands of acres |
| Developed | – gross | | 86 | | 64 | | 3,645 | | 144 | | 1,364 | | 850 | | 8,210 | | 1,281 | | 181 | | 15,824 | |
| – net | | 50 | | 19 | | 2,200 | | 63 | | 365 | | 303 | | 1,459 | | 285 | | 44 | | 4,788 | |
Undevelopede | – gross | | 1,892 | | 140 | | 4,590 | | 14,948 | | 23,683 | | 34,246 | | 442,967 | | 9,662 | | 7,571 | | 539,699 | |
| – net | | 1,010 | | 42 | | 3,518 | | 7,887 | | 8,358 | | 19,817 | | 85,477 | | 2,520 | | 3,299 | | 131,928 | |
|
| | | | | | | | | | | | | | | | | | | | | | |
| | | | Europe | North America | South America | Africa | Asia | Australasia | Totalb |
|
| | | | UK |
| Rest of Europe |
| US |
| Rest of North America |
| | | Russiaa |
| Rest of Asia |
| | |
| Number of productive wells at 31 December 2019 | | | | | | | |
Oil wellsc | – gross | | 117 |
| 80 |
| 2,775 |
| 177 |
| 5,526 |
| 290 |
| 66,696 |
| 2,067 |
| 12 |
| 77,740 |
|
| | – net | | 70 |
| 24 |
| 1,152 |
| 48 |
| 2,528 |
| 65 |
| 13,278 |
| 477 |
| 2 |
| 17,644 |
|
Gas wellsd | – gross | | 36 |
| 1 |
| 18,552 |
| 238 |
| 1,119 |
| 220 |
| 447 |
| 129 |
| 78 |
| 20,820 |
|
| | – net | | 7 |
| — |
| 8,811 |
| 118 |
| 401 |
| 91 |
| 92 |
| 60 |
| 16 |
| 9,596 |
|
| Oil and natural gas acreage at 31 December 2019 | | | | | | thousands of acres | |
| Developed | – gross | | 75 |
| 81 |
| 6,232 |
| 143 |
| 1,354 |
| 823 |
| 7,709 |
| 1,322 |
| 173 |
| 17,912 |
|
| | – net | | 44 |
| 24 |
| 3,658 |
| 62 |
| 361 |
| 287 |
| 1,377 |
| 292 |
| 41 |
| 6,146 |
|
Undevelopede | – gross | | 2,851 |
| 150 |
| 5,311 |
| 14,953 |
| 23,892 |
| 51,105 |
| 439,848 |
| 9,793 |
| 4,022 |
| 551,925 |
|
| | – net | | 1,594 |
| 45 |
| 3,749 |
| 7,890 |
| 8,456 |
| 33,683 |
| 84,689 |
| 2,430 |
| 1,889 |
| 144,425 |
|
| |
ab Because of rounding, some totals may not exactly agree with the sum of their component parts. c Includes approximately 6,978 gross (1,343 net) multiple completion wells (more than one formation producing into the same well bore). d Includes approximately 430 gross (203 net) multiple completion wells. If one of the multiple completions in a well is an oil completion, the well is classified as an oil well. e Undeveloped acreage includes leases and concessions. | Based on information received from Rosneft as at 31 December 2019. |
| |
b
| Because of rounding, some totals may not exactly agree with the sum of their component parts. |
| |
c
| Includes approximately 6,916 gross (1,314 net) multiple completion wells (more than one formation producing into the same well bore). |
| |
d
| Includes approximately 2,618 gross (1,265 net) multiple completion wells. If one of the multiple completions in a well is an oil completion, the well is classified as an oil well. |
| |
e
| Undeveloped acreage includes leases and concessions. |
Net oil and gas wells completed or abandoned
The following table shows the number of net productive and dry exploratory and development oil and natural gas wells completed or abandoned in the years indicated by the group and its equity-accounted entities. Productive wells include wells in which hydrocarbons were encountered and the drilling or completion of which, in the case of exploratory wells, has been suspended pending further drilling or evaluation. A dry well is one found to be incapable of producing hydrocarbons in sufficient quantities to justify completion.
| | | | | | | | | | | | | | | | | | | | | | | | | | | | | | | | | | | |
| | Europe | North
America | South
America | Africa | Asia | Australasia | Totala |
| | UK | Rest of
Europe | US | Rest of
North
America | | | Russia | Rest of
Asia | | |
| 2020 | | | | | | | | | | | |
| Exploratory | | | | | | | | | | | |
| Productive | | — | | — | | 1.1 | | 0.8 | | — | | 0.6 | | 14.3 | | 0.4 | | — | | 17.2 | |
| Dry | | — | | — | | 1.8 | | — | | — | | — | | — | | 0.2 | | — | | 2.0 | |
| Development | | | | | | | | | | | |
| Productive | | 5.3 | | 3.1 | | 114.6 | | 0.4 | | 61.7 | | 4.4 | | 199.1 | | 40.3 | | 2.0 | | 430.9 | |
| Dry | | — | | — | | 3.0 | | — | | 1.0 | | — | | — | | 0.6 | | — | | 4.6 | |
| 2019 | | | | | | | | | | | |
| Exploratory | | | | | | | | | | | |
| Productive | | — | | 0.2 | | 0.8 | | 0.8 | | 3.5 | | 2.3 | | 11.6 | | 5.2 | | — | | 24.4 | |
| Dry | | 1.0 | | 0.3 | | 1.6 | | 0.5 | | 1.1 | | 0.3 | | 0.5 | | 0.4 | | 0.2 | | 5.9 | |
| Development | | | | | | | | | | | |
| Productive | | 1.7 | | 2.4 | | 193.0 | | 0.2 | | 110.7 | | 6.0 | | 230.8 | | 49.6 | | 0.4 | | 594.8 | |
| Dry | | — | | 0.3 | | 10.0 | | — | | 0.6 | | — | | — | | 1.0 | | — | | 11.9 | |
| 2018 | | | | | | | | | | | |
| Exploratory | | | | | | | | | | | |
| Productive | | 0.3 | | — | | 1.7 | | — | | 2.0 | | — | | 15.0 | | 5.0 | | — | | 24.0 | |
| Dry | | — | | — | | — | | 0.5 | | 2.0 | | 2.4 | | — | | — | | — | | 4.9 | |
| Development | | | | | | | | | | | |
| Productive | | 1.4 | | 0.6 | | 142.7 | | 5.0 | | 103.9 | | 14.4 | | 137.3 | | 53.5 | | 1.3 | | 460.1 | |
| Dry | | — | | — | | 6.8 | | — | | 3.6 | | — | | — | | 2.6 | | — | | 13.0 | |
|
| | | | | | | | | | | | | | | | | | | | | |
| | | Europe | North America | South America | Africa | Asia | Australasia | Totala |
|
| | | UK |
| Rest of Europe |
| US |
| Rest of North America |
| | | Russia |
| Rest of Asia |
| | |
| 2019 | | | | | | | | | | | |
| Exploratory | | | | | | | | | | | |
| Productive | | — |
| 0.2 |
| 0.8 |
| 0.8 |
| 3.5 |
| 2.3 |
| 11.6 |
| 5.2 |
| — |
| 24.4 |
|
| Dry | | 1.0 |
| 0.3 |
| 1.6 |
| 0.5 |
| 1.1 |
| 0.3 |
| 0.5 |
| 0.4 |
| 0.2 |
| 5.9 |
|
| Development | | | | | | | | | | | |
| Productive | | 1.7 |
| 2.4 |
| 193.0 |
| 0.2 |
| 110.7 |
| 6.0 |
| 230.8 |
| 49.6 |
| 0.4 |
| 594.8 |
|
| Dry | | — |
| 0.3 |
| 10.0 |
| — |
| 0.6 |
| — |
| — |
| 1.0 |
| — |
| 11.9 |
|
| 2018 | | | | | | | | | | | |
| Exploratory | | | | | | | | | | | |
| Productive | | 0.3 |
| — |
| 1.7 |
| — |
| 2.0 |
| — |
| 15.0 |
| 5.0 |
| — |
| 24.0 |
|
| Dry | | — |
| — |
| — |
| 0.5 |
| 2.0 |
| 2.4 |
| — |
| — |
| — |
| 4.9 |
|
| Development | | | | | | | | | | | |
| Productive | | 1.4 |
| 0.6 |
| 142.7 |
| 5.0 |
| 103.9 |
| 14.4 |
| 137.3 |
| 53.5 |
| 1.3 |
| 460.1 |
|
| Dry | | — |
| — |
| 6.8 |
| — |
| 3.6 |
| — |
| — |
| 2.6 |
| — |
| 13.0 |
|
| 2017 | | | | | | | | | | | |
| Exploratory | | | | | | | | | | | |
| Productive | | 2.8 |
| 0.1 |
| 1.5 |
| 1.2 |
| 3.2 |
| 2.6 |
| 9.4 |
| 1.4 |
| — |
| 22.2 |
|
| Dry | | 2.4 |
| — |
| — |
| — |
| — |
| 2.9 |
| — |
| 1.0 |
| — |
| 6.3 |
|
| Development | | | | | | | | | | | |
| Productive | | 2.5 |
| 0.5 |
| 124.0 |
| 8.0 |
| 103.7 |
| 16.5 |
| 282.7 |
| 43.6 |
| 1.1 |
| 582.6 |
|
| Dry | | — |
| — |
| 0.5 |
| — |
| 1.6 |
| 2.1 |
| — |
| 0.8 |
| — |
| 5.0 |
|
| |
a
| Because of rounding, some totals may not exactly agree with the sum of their component parts. |
a Because of rounding, some totals may not exactly agree with the sum of their component parts.
|
| | | | | | | | | | | | | |
258 | | BPbp Annual Report and Form 20-F 2019
2020 | | 257 |
Operational and statistical information – continued
Drilling and production activities in progress
The following table shows the number of exploratory and development oil and natural gas wells in the process of being drilled by the group and its equity-accounted entities as of 31 December 2019.2020. Suspended development wells and long-term suspended exploratory wells are also included in the table.
| | | | | | | | | | | | | | | | | | | | | | | | | | | | | | | | | | | |
| | Europe | North
America | South
America | Africa | Asia | Australasia | Totala |
| | UK | Rest of
Europe | US | Rest of
North
America | | | Russia | Rest of
Asia | | |
| At 31 December 2020 | | | | | | | | | | | |
| Exploratory | | | | | | | | | | | |
| Gross | | — | | — | | 5.0 | | 1.0 | | 2.0 | | 7.0 | | — | | 4.0 | | 1.0 | | 20.0 | |
| Net | | — | | — | | 3.1 | | 0.4 | | 0.1 | | 3.2 | | — | | 0.8 | | 0.4 | | 8.0 | |
| Development | | | | | | | | | | | |
| Gross | | 2.0 | | 0.7 | | 166.0 | | 6.0 | | 13.0 | | 19.0 | | — | | 198.0 | | 2.0 | | 406.7 | |
| Net | | 0.7 | | 0.2 | | 104.8 | | 3.0 | | 4.7 | | 4.8 | | — | | 25.0 | | 0.8 | | 144.0 | |
|
| | | | | | | | | | | | | | | | | | | | | |
| | | Europe | North America | South America | Africa | Asia | Australasia | Totala |
|
| | | UK |
| Rest of Europe |
| US |
| Rest of North America |
| | | Russia |
| Rest of Asia |
| | |
| At 31 December 2019 | | | | | | | | | | | |
| Exploratory | | | | | | | | | | | |
| Gross | | — |
| — |
| 8.0 |
| — |
| 2.0 |
| 4.0 |
| — |
| 5.0 |
| — |
| 19.0 |
|
| Net | | — |
| — |
| 4.9 |
| — |
| 0.5 |
| 1.6 |
| — |
| 0.5 |
| — |
| 7.5 |
|
| Development | | | | | | | | | | | |
| Gross | | 6.0 |
| 3.6 |
| 213.0 |
| 6.0 |
| 13.0 |
| 26.0 |
| — |
| 216.0 |
| 2.0 |
| 485.6 |
|
| Net | | 2.0 |
| 1.1 |
| 140.0 |
| 3.0 |
| 4.1 |
| 14.5 |
| — |
| 29.1 |
| 0.8 |
| 194.6 |
|
| |
a
| Because of rounding, some totals may not exactly agree with the sum of their component parts. |
a Because of rounding, some totals may not exactly agree with the sum of their component parts.
|
| | | | | | | | | | | | | |
| 258 | BP
| bp Annual Report and Form 20-F 20192020 | | 259 |
Pages 260-296259-300 have been removed as they do not form part of BP'sbp's Annual Report on Form 20-F as filed with the SEC.
| | | | | | | | | | | | | | |
| | bp Annual Report and Form 20-F 2020 | | 259 |
| | | | | | | | | | | | | | |
| | | | |
| Additional disclosures | | |
| | | | |
| | | |
| | | |
| | | |
| | | |
260 | | | | |
|
| | | | | | | | | | | | | | | | | | | | | | | | | | | | | | | | | | Principal accountant’s fees and services | | | | | | | | | | | | | | | | | | | | | | | | | | | | | | | | | | | | | | | | | | | | | | | | | | | | | | | | | | | | | | | | | | | | | | | | | | | | | | | | | | | | | | | | | | | | | | | | | | | | | | | | |
| | | | | | | | | | | | | | | | | bp Annual Report and Form 20-F 20192020 | | 297301 |
Selected financial information This information has been extracted or derived from the audited consolidated financial statements of the BPbp group. Note 1 to the financial statements includes details on the basis of preparation of these financial statements. The selected information should be read in conjunction with the audited financial statements and related notes. The audited consolidated financial statements and related notes as of 31 December 20192020 and 20182019 and for the three years ended 31 December 20192020 are presented on page 146.150. | | | | | | | | | | | | | | | | | | | | | | | $ million except per share amounts | | | 2020 | 2019 | 2018 | 2017 | 2016 | | Income statement data | | | | | | | | Sales and other operating revenues | | 180,366 | | 278,397 | | 298,756 | | 240,208 | | 183,008 | | | Profit (loss) before interest and taxation | | (21,740) | | 11,706 | | 19,378 | | 9,474 | | (430) | | | Finance costs and net finance expense relating to pensions and other post-retirement benefits | | (3,148) | | (3,552) | | (2,655) | | (2,294) | | (1,865) | | | Taxation | | 4,159 | | (3,964) | | (7,145) | | (3,712) | | 2,467 | | | Non-controlling interests | | 424 | | (164) | | (195) | | (79) | | (57) | | Profit (loss) for the yeara | | (20,305) | | 4,026 | | 9,383 | | 3,389 | | 115 | | Inventory holding (gains) losses«, before tax | | 2,868 | | (667) | | 801 | | (853) | | (1,597) | | | Taxation charge (credit) on inventory holding gains and losses | | (667) | | 156 | | (198) | | 225 | | 483 | | RC profit (loss)« for the year | | (18,104) | | 3,515 | | 9,986 | | 2,761 | | (999) | | Net (favourable) adverse impact of non-operating items« b and fair value accounting effects« b, before tax | | 16,649 | | 8,263 | | 3,380 | | 3,730 | | 6,746 | | | Taxation charge (credit) on non-operating items and fair value accounting effects, and certain foreign exchange impacts on the group’s tax charge for the period | | (4,235) | | (1,788) | | (643) | | (325) | | (3,162) | | Underlying RC profit« for the year | | (5,690) | | 9,990 | | 12,723 | | 6,166 | | 2,585 | | Earnings per sharec – cents | | | | | | | Profit (loss) for the yeara per ordinary share | | | | | | | | Basic | | (100.42) | | 19.84 | | 46.98 | | 17.20 | | 0.61 | | | Diluted | | (100.42) | | 19.73 | | 46.67 | | 17.10 | | 0.60 | | RC profit (loss) for the year per ordinary share« | | (89.53) | | 17.32 | | 50.00 | | 14.02 | | (5.33) | | Underlying RC profit for the year per ordinary share« | | (28.14) | | 49.24 | | 63.70 | | 31.31 | | 13.79 | | | Dividends paid per share – cents | | 31.50 | | 41.00 | | 40.50 | | 40.00 | | 40.00 | | | – pence | | 24.458 | | 31.977 | | 30.568 | | 30.979 | | 29.418 | | | | | | | | | | | | | | | | Capital expenditure« d | | | | | | | Organic capital expenditure« | | 12,034 | | 15,238 | | 15,140 | | 16,501 | | 16,675 | | Inorganic capital expenditure« | | 2,021 | | 4,183 | | 9,948 | | 1,339 | | 777 | | | | 14,055 | | 19,421 | | 25,088 | | 17,840 | | 17,452 | | | Balance sheet data (at 31 December) | | | | | | | | Total assets | | 267,654 | | 295,194 | | 282,176 | | 276,515 | | 263,316 | | | Net assets | | 85,568 | | 100,708 | | 101,548 | | 100,404 | | 96,843 | | | Share capital | | 5,383 | | 5,404 | | 5,402 | | 5,343 | | 5,284 | | | bp shareholders’ equity | | 71,250 | | 98,412 | | 99,444 | | 98,491 | | 95,286 | | | Finance debt due after more than one year | | 63,305 | | 57,237 | | 55,803 | | 54,873 | | 51,073 | | Gearing« | | 31.3% | 31.1% | 30.0% | 27.0% | 26.5% | Ordinary share datae | | Share million | | Basic weighted average number of shares | | 20,222 | | 20,285 | | 19,970 | | 19,693 | | 18,745 | | | Diluted weighted average number of shares | | 20,222 | | 20,400 | | 20,102 | | 19,816 | | 18,855 | |
| | | | | | | | | | | | | | | | $ million except per share amounts | | | | | 2019 |
| 2018 |
| 2017 |
| 2016 |
| 2015 |
| | Income statement data | | | | | | | | Sales and other operating revenues | | 278,397 |
| 298,756 |
| 240,208 |
| 183,008 |
| 222,894 |
| | Profit (loss) before interest and taxation | | 11,706 |
| 19,378 |
| 9,474 |
| (430 | ) | (7,918 | ) | | Finance costs and net finance expense relating to pensions and other post-retirement benefits | | (3,552 | ) | (2,655 | ) | (2,294 | ) | (1,865 | ) | (1,653 | ) | | Taxation | | (3,964 | ) | (7,145 | ) | (3,712 | ) | 2,467 |
| 3,171 |
| | Non-controlling interests | | (164 | ) | (195 | ) | (79 | ) | (57 | ) | (82 | ) | Profit (loss) for the yeara | | 4,026 |
| 9,383 |
| 3,389 |
| 115 |
| (6,482 | ) | Inventory holding (gains) losses«, before tax | | (667 | ) | 801 |
| (853 | ) | (1,597 | ) | 1,889 |
| | Taxation charge (credit) on inventory holding gains and losses | | 156 |
| (198 | ) | 225 |
| 483 |
| (569 | ) | RC profit (loss)«for the year | | 3,515 |
| 9,986 |
| 2,761 |
| (999 | ) | (5,162 | ) | Net (favourable) adverse impact of non-operating items« and fair value accounting effects«, before taxb | | 8,263 |
| 3,380 |
| 3,730 |
| 6,746 |
| 15,067 |
| | Taxation charge (credit) on non-operating items and fair value accounting effects | | (1,788 | ) | (643 | ) | (325 | ) | (3,162 | ) | (4,000 | ) | Underlying RC profit«for the year | | 9,990 |
| 12,723 |
| 6,166 |
| 2,585 |
| 5,905 |
| Earnings per sharec – cents | | | | | | | Profit (loss) for the yeara per ordinary share | | | | | | | | Basic | | 19.84 |
| 46.98 |
| 17.20 |
| 0.61 |
| (35.39 | ) | | Diluted | | 19.73 |
| 46.67 |
| 17.10 |
| 0.60 |
| (35.39 | ) | RC profit (loss) for the year per ordinary share« | | 17.32 |
| 50.00 |
| 14.02 |
| (5.33 | ) | (28.18 | ) | Underlying RC profit for the year per ordinary share« | | 49.24 |
| 63.70 |
| 31.31 |
| 13.79 |
| 32.22 |
| | Dividends paid per share – cents | | 41.00 |
| 40.50 |
| 40.00 |
| 40.00 |
| 40.00 |
| | – pence | | 31.977 |
| 30.568 |
| 30.979 |
| 29.418 |
| 26.383 |
| Capital expenditure«d | | | | | | | Organic capital expenditure« | | 15,238 |
| 15,140 |
| 16,501 |
| 16,675 |
| N/A |
| Inorganic capital expenditure« | | 4,183 |
| 9,948 |
| 1,339 |
| 777 |
| N/A |
| | | | 19,421 |
| 25,088 |
| 17,840 |
| 17,452 |
| 20,202 |
| | Balance sheet data (at 31 December) | | | | | | | | Total assets | | 295,194 |
| 282,176 |
| 276,515 |
| 263,316 |
| 261,832 |
| | Net assets | | 100,708 |
| 101,548 |
| 100,404 |
| 96,843 |
| 98,387 |
| | Share capital | | 5,404 |
| 5,402 |
| 5,343 |
| 5,284 |
| 5,049 |
| | BP shareholders’ equity | | 98,412 |
| 99,444 |
| 98,491 |
| 95,286 |
| 97,216 |
| | Finance debt due after more than one year | | 57,237 |
| 55,803 |
| 54,873 |
| 51,073 |
| 45,567 |
| Gearing« | | 31.1% | 30.0% | 27.0% | 26.5% | 21.2% | Ordinary share datae | | Share million | | | Basic weighted average number of shares | | 20,285 |
| 19,970 |
| 19,693 |
| 18,745 |
| 18,324 |
| | Diluted weighted average number of shares | | 20,400 |
| 20,102 |
| 19,816 |
| 18,855 |
| 18,324 |
|
| | a
| Profit attributable to BP shareholders. |
| | b
| See pages 300 and 344 for further analysis of these items. |
| | c
| A reconciliation to GAAP information is provided on page 344. |
| | d
| From 2017 onwards BP reports organic, inorganic and total capital expenditure on a cash basis which were previously reported on an accruals basis. This aligns with BP's financial framework and is consistent with other financial metrics used when comparing sources and uses of cash. An analysis of capital expenditure on a cash basis for 2015 is not available. |
| | e
| The number of ordinary shares shown has been used to calculate the per share amounts. |
a Profit attributable to bp shareholders.
b See pages 304 and 305 for further analysis of these items.
c A reconciliation to GAAP information is provided on page 348.
d From 2017 onwards bp reports organic, inorganic and total capital expenditure on a cash basis which were previously reported on an accruals basis. This aligns with bp's financial framework and is consistent with other financial metrics used when comparing sources and uses of cash.
e The number of ordinary shares shown has been used to calculate the per share amounts.
| | | | | | | | | | | | | | | 298302 | | «See Glossary
| BPbp Annual Report and Form 20-F 2019
2020 | | «See Glossary |
Additional information Capital expenditure | | | | | | | | | | | | | | | | | | | $ million | | | 2020 | 2019 | 2018 | | Capital expenditure | | | | | | Organic capital expenditure | | 12,034 | | 15,238 | | 15,140 | | Inorganic capital expenditureab | | 2,021 | | 4,183 | | 9,948 | | | | 14,055 | | 19,421 | | 25,088 | | | | | | | | | | | $ million | | | 2020 | 2019 | 2018 | | Organic capital expenditure by segment | | | | | | Upstream | | | | | | US | | 3,341 | | 4,019 | | 3,482 | | | Non-US | | 6,009 | | 7,885 | | 8,545 | | | | 9,350 | | 11,904 | | 12,027 | | | Downstream | | | | | | US | | 632 | | 913 | | 877 | | | Non-US | | 1,698 | | 2,084 | | 1,904 | | | | 2,330 | | 2,997 | | 2,781 | | | Other businesses and corporate | | | | | | US | | 80 | | 47 | | 54 | | | Non-US | | 274 | | 290 | | 278 | | | | 354 | | 337 | | 332 | | | | 12,034 | | 15,238 | | 15,140 | | | Organic capital expenditure by geographical area | | | | | | US | | 4,053 | | 4,979 | | 4,413 | | | Non-US | | 7,981 | | 10,259 | | 10,727 | | | | 12,034 | | 15,238 | | 15,140 | |
| | | | | | | | | | | | | | $ million |
| | | | 2019 |
| 2018 |
| 2017 |
| | Capital expenditure | | | | | | Organic capital expenditure | | 15,238 |
| 15,140 |
| 16,501 |
| Inorganic capital expenditurea | | 4,183 |
| 9,948 |
| 1,339 |
| | | | 19,421 |
| 25,088 |
| 17,840 |
| | | | | | | | | | | | $ million |
| | | | 2019 |
| 2018 |
| 2017 |
| | Organic capital expenditure by segment | | | | | | Upstream | | | | | | US | | 4,019 |
| 3,482 |
| 2,999 |
| | Non-US | | 7,885 |
| 8,545 |
| 10,764 |
| | | | 11,904 |
| 12,027 |
| 13,763 |
| | Downstream | | | | | | US | | 913 |
| 877 |
| 809 |
| | Non-US | | 2,084 |
| 1,904 |
| 1,590 |
| | | | 2,997 |
| 2,781 |
| 2,399 |
| | Other businesses and corporate | |
|
|
|
|
|
| | US | | 47 |
| 54 |
| 64 |
| | Non-US | | 290 |
| 278 |
| 275 |
| | | | 337 |
| 332 |
| 339 |
| | | | 15,238 |
| 15,140 |
| 16,501 |
| | Organic capital expenditure by geographical area | | | | | | US | | 4,979 |
| 4,413 |
| 3,872 |
| | Non-US | | 10,259 |
| 10,727 |
| 12,629 |
| | | | 15,238 |
| 15,140 |
| 16,501 |
|
a On 31 October 2018, BPbp acquired from BHP Billiton Petroleum (North America) Inc. 100% of the issued share capital of Petrohawk Energy Corporation, a wholly owned subsidiary of BHP that holds a portfolio of unconventional onshore US oil and gas assets. The entire consideration payable of $10,268 million, after customary closing adjustments, was paid in instalments between July 2018 and April 2019. The amounts presented as inorganic capital expenditure include $3,480 million for 2019 and $6,788 million for 2018 relating to this transaction. 2018 includes $1,739 million relating to the purchase of an additional 16.5% interest in the Clair field west of Shetland in the North Sea, as part of the agreements with Conoco-Phillips in which Conoco-Philips simultaneously purchased BP'sbp's entire 39.2% interest in the Greater Kuparuk Area on the North Slope of Alaska. 2020, 2019 and 2018 also include amounts relating to the 25-year extension to our ACG production-sharing agreement*agreement« in Azerbaijan. 2017 b 2020 includes amounts paida $500 million deposit in respect of the strategic partnership with Equinor and $1 billion relating to acquire interestsan investment in Mauritania and Senegal anda 49% interest in the Zohr gas field in Egypt.group's Indian fuels and mobility venture with Reliance industries. .
| | | | | | | | | | | | | | | «See Glossary | BP
| bp Annual Report and Form 20-F 20192020 | «See Glossary
| | 299303 |
Non-operating items Non-operating items are charges and credits included in the financial statements that BPbp discloses separately because it considers such disclosures to be meaningful and relevant to investors. They are items that management considers not to be part of underlying business operations and are disclosed in order to enable investors to understand better and evaluate the group’s reported financial performance. An analysis of non-operating items is shown in the table below. | | | | | | | | | | | | | | | | | | | $ million | | | 2020 | 2019 | 2018 | | Upstream | | | | | Gain on sale of businesses and fixed assetsa | | 360 | | 143 | | 437 | | Impairment and losses on sale of businesses and fixed assetsa b | | (13,214) | | (7,036) | | (527) | | | Environmental and other provisions | | (2) | | (32) | | (35) | | Restructuring, integration and rationalization costsc | | (401) | | (89) | | (131) | | | Fair value gain (loss) on embedded derivatives | | — | | — | | 17 | | Otherd e | | (2,511) | | 67 | | 56 | | | | (15,768) | | (6,947) | | (183) | | | Downstream | | | | | Gain on sale of businesses and fixed assetsa f | | 2,320 | | 50 | | 15 | | Impairment and losses on sale of businesses and fixed assetsa | | (1,136) | | (122) | | (69) | | | Environmental and other provisions | | (33) | | (78) | | (83) | | Restructuring, integration and rationalization costsc | | (633) | | 85 | | (405) | | | Fair value gain (loss) on embedded derivatives | | — | | — | | — | | | Other | | (39) | | (12) | | (174) | | | | 479 | | (77) | | (716) | | | Rosneft | | | | | | | | | | | | | | | | | | | | | | | | | | | | | | | Other | | (205) | | (103) | | (95) | | | | (205) | (103) | (95) | | Other businesses and corporate | | | | | Gain on sale of businesses and fixed assetsa | | 194 | | — | | 4 | | Impairment and losses on sale of businesses and fixed assetsa g | | (19) | | (917) | | (264) | | Environmental and other provisionsh | | (177) | | (231) | | (640) | | Restructuring, integration and rationalization costsc | | (262) | | 6 | | (190) | | | Fair value gain (loss) on embedded derivatives | | — | | — | | — | | | Gulf of Mexico oil spill response | | (255) | | (319) | | (714) | | Otheri | | 201 | | (30) | | (159) | | | | (318) | (1,491) | (1,963) | | Total before interest and taxation | | (15,812) | | (8,618) | | (2,957) | | Finance costsj | | (625) | | (511) | | (479) | | | Total before taxation | | (16,437) | | (9,129) | | (3,436) | | | Taxation credit (charge) on non-operating items | | 4,345 | | 1,943 | | 510 | | Taxation - impact of US tax reformk | | — | | — | | 121 | | Taxation - impact of foreign exchangel | | (99) | | — | | — | | | Total after taxation | | (12,191) | | (7,186) | | (2,805) | |
| | | | | | | | | | | | | | $ million |
| | | | 2019 |
| 2018 |
| 2017 |
| | Upstream | | | | | Impairment and gain (loss) on sale of businesses and fixed assetsa b | | (6,893 | ) | (90 | ) | (563 | ) | | Environmental and other provisions | | (32 | ) | (35 | ) | 1 |
| Restructuring, integration and rationalization costsc | | (89 | ) | (131 | ) | (24 | ) | | Fair value gain (loss) on embedded derivatives | | — |
| 17 |
| 33 |
| Otherd | | 67 |
| 56 |
| (118 | ) | | | | (6,947 | ) | (183 | ) | (671 | ) | | Downstream | | | | | Impairment and gain (loss) on sale of businesses and fixed assetsa e | | (72 | ) | (54 | ) | 579 |
| | Environmental and other provisions | | (78 | ) | (83 | ) | (19 | ) | Restructuring, integration and rationalization costsc | | 85 |
| (405 | ) | (171 | ) | | Fair value gain (loss) on embedded derivatives | | — |
| — |
| — |
| | Other | | (12 | ) | (174 | ) | — |
| | | | (77 | ) | (716 | ) | 389 |
| | Rosneft | | | | | | Impairment and gain (loss) on sale of businesses and fixed assets | | (103 | ) | (95 | ) | — |
| | Environmental and other provisions | | — |
| — |
| — |
| | Restructuring, integration and rationalization costs | | — |
| — |
| — |
| | Fair value gain (loss) on embedded derivatives | | — |
| — |
| — |
| | Other | | — |
| — |
| — |
| | | | (103 | ) | (95 | ) | — |
| | Other businesses and corporate | | | | | Impairment and gain (loss) on sale of businesses and fixed assetsa f | | (917 | ) | (260 | ) | (22 | ) | Environmental and other provisionsg | | (231 | ) | (640 | ) | (156 | ) | Restructuring, integration and rationalization costsc | | 6 |
| (190 | ) | (72 | ) | | Fair value gain (loss) on embedded derivatives | | — |
| — |
| — |
| | Gulf of Mexico oil spill response | | (319 | ) | (714 | ) | (2,687 | ) | | Other | | (30 | ) | (159 | ) | 90 |
| | | | (1,491 | ) | (1,963 | ) | (2,847 | ) | | Total before interest and taxation | | (8,618 | ) | (2,957 | ) | (3,129 | ) | Finance costsh | | (511 | ) | (479 | ) | (493 | ) | | Total before taxation | | (9,129 | ) | (3,436 | ) | (3,622 | ) | Taxation credit (charge) on non-operating itemsi | | 1,943 |
| 510 |
| 1,172 |
| Taxation - impact of US tax reformj | | — |
| 121 |
| (859 | ) | | Total after taxation | | (7,186 | ) | (2,805 | ) | (3,309 | ) |
| | a
| See Financial statements – Note 4 for further information. |
| | b
| 2019 includes impairments charges principally resulting from the announcements to dispose of certain assets in the US and Egypt. 2018 includes an impairment reversal for assets in the North Sea and Angola. 2017 includes an impairment charge relating to BPX Energy (previously known as the US Lower 48 business), partially offset by gains associated with asset divestments. In addition, 2017 includes an impairment charge arising following the announcement of the agreement to sell the Forties Pipeline System business to INEOS. |
| | c
| Restructuring charges are classified as non-operating items where they relate to an announced major group restructuring. A major group restructuring is a restructuring programme affecting more than one of the group’s operating segments that is expected to result in charges of more than $1 billion over a defined period. Following the Gulf of Mexico oil spill in 2010 and since the fall in oil prices in late 2014, major group restructuring programmes were initiated.The group's restructuring programme, originally announced in 2014, was completed in 2018. |
| | d
| 2018 and 2017 include exploration write-offs of $124 million and $145 million respectively in relation to the value ascribed to certain licences in the deepwater Gulf of Mexico as part of the accounting for the acquisition of upstream assets from Devon Energy in 2011. 2017 also includes BP’s share of an impairment reversal recognized by the Angola LNG equity-accounted entity, partially offset by other items. |
| | e
| 2017 primarily reflects the disposal of our shareholding in the SECCO joint venture. |
b 2020 impairment charges for Upstream include $156 million in relation to the likely disposal of an exploration asset. 2019 includes impairments charges principally resulting from the announcements to dispose of certain assets in the US and Egypt. 2018 includes an impairment reversal for assets in the North Sea and Angola. c Restructuring charges are classified as non-operating items where they relate to an announced major group restructuring. A major group restructuring is a restructuring programme affecting more than one of the group’s operating segments that is expected to result in charges of more than $1 billion over a defined period. 2020 includes recognized provisions for restructuring costs for plans that were formalized during the year. 2018 includes amounts related to the programme originally announced in 2014 that was completed in 2018. d2020 includes exploration write-offs of $1,974 million relating to fair value ascribed to certain licences as part of the accounting at the time of acquisition of upstream assets in Brazil, India and the Gulf of Mexico and the impairment of certain intangible assets in Mauritania and Senegal. 2018 includes exploration write-offs of $124 million in relation to the value ascribed to certain licences in the deepwater Gulf of Mexico as part of the accounting for the acquisition of upstream assets from Devon Energy in 2011. e 2020 includes $545 million net impairments reported by equity-accounted entities. f 2020 includes a gain of $2.3 billion on the sale of our petrochemicals business. g2019 includes $877 million relating to the reclassification of accumulated foreign exchange losses from reserves to the income statement upon the contribution of our Brazilian biofuels bussinessbusiness to BP Bunge Bioenergia. | | g
| 2019 and 2018 primarily reflects charges due to the annual update of environmental provisions, including asbestos-related provisions for past operations, together with updates of non-Gulf of Mexico oil spill related legal provisions. |
| | h
| Relates to the unwinding of discounting effects relating to Gulf of Mexico oil spill payables. |
| | i
| 2017 includes the tax effect of the increase in the provision in the fourth quarter for business economic loss and other claims associated with the Deepwater Horizon Court Supervised Settlement Program (DHCSSP) at the new US tax rate. |
| | j
| In 2017 the US tax reform reduced the US federal corporate income tax rate from 35% to 21%, effective from 1 January 2018. The impact disclosed has been calculated as the change in deferred tax balances at 31 December 2017, excluding the increase in the provision in the fourth quarter for business economic loss and other claims associated with the DHCSSP, which arises following the reduction in the tax rate. 2018 reflects a further impact following a clarification of the tax reform. The impact of the US tax reform has been treated as a non-operating item because it is not considered to be part of underlying business operations, has a material impact upon the reported result and is substantially impacted by Gulf of Mexico oil spill charges, which are also treated as non-operating items. Separate disclosure is considered meaningful and relevant to investors. |
h All periods primarily reflect charges due to the annual update of environmental provisions, including asbestos-related provisions for past operations, together with updates of non-Gulf of Mexico oil spill related legal provisions.
i From 2020, BP is presenting temporary valuation differences associated with the group’s interest rate and foreign currency exchange risk management of finance debt as non-operating items. These amounts represent: (i) the impact of ineffectiveness and the amortisation of cross currency basis resulting from the application of fair value hedge accounting; and (ii) the net impact of foreign currency exchange movements on finance debt and associated derivatives where hedge accounting is not applied. Relevant amounts in the comparative periods presented were not material. j All periods presented include the unwinding of discounting effects relating to Gulf of Mexico oil spill payables. 2020 also includes the income statement impact associated with the buyback of finance debt. See Note 26 for further information. k In 2017 the US tax reform reduced the US federal corporate income tax rate from 35% to 21%, effective from 1 January 2018. 2018 reflects a further impact following a clarification of the tax reform. The impact of the US tax reform has been treated as a non-operating item because it is not considered to be part of underlying business operations, has a material impact upon the reported result and is substantially impacted by Gulf of Mexico oil spill charges, which are also treated as non-operating items. Separate disclosure is considered meaningful and relevant to investors. l From 2020, bp is presenting certain foreign exchange effects on tax as non-operating items. These amounts represent the impact of: (i) foreign exchange on deferred tax balances arising from the conversion of local currency tax base amounts into functional currency, and (ii) taxable gains and losses from the retranslation of US dollar-denominated intra-group loans to local currency. Relevant amounts in the comparative periods presented were not material. | | | | | | | | | | | | | | | 300304 | | «See Glossary
| BPbp Annual Report and Form 20-F 2019
2020 | | «See Glossary |
Non-GAAP information on fair value accounting effects The impacts of fair value accounting effects, relative to management’s internal measure of performance, and a reconciliation to GAAP information is set out below. Further information on fair value accounting effects is provided on page 344. | | | | | | | | | | | | | | | | | | | $ million | | | 2020 | 2019 | 2018 | | Upstream | | | | | Unrecognized (gains) losses brought forward from previous perioda | | 253 | | (455) | | (419) | | | Favourable (adverse) impact relative to management’s measure of performance | | (738) | | 706 | | (39) | | | Exchange translation gains (losses) on fair value accounting effects | | — | | 2 | | 3 | | | Unrecognized (gains) losses carried forward | | (485) | | 253 | | (455) | | | Downstream | | | | | Unrecognized (gains) losses brought forward from previous perioda | | 104 | | (56) | | (151) | | | Favourable (adverse) impact relative to management’s measure of performance | | (149) | | 160 | | 95 | | | | | | | | Unrecognized (gains) losses carried forward | | (45) | | 104 | | (56) | | | Other businesses and corporate | | | | | | | | | | Favourable (adverse) impact relative to management’s measure of performanceb | | 675 | — | — | | | | | | | Unrecognized (gains) losses carried forward | | 675 | | — | | — | | | Favourable (adverse) impact relative to management’s measure of performance – by region | | | | | | Upstream | | | | | | US | | 198 | | (179) | | (35) | | | Non-US | | (936) | | 885 | | (4) | | | | (738) | | 706 | | (39) | | | Downstream | | | | | | US | | 27 | | 148 | | (155) | | | Non-US | | (176) | | 12 | | 250 | | | | (149) | | 160 | | 95 | | | Other businesses and corporate | | | | | | US | | — | | — | | — | | | Non-US | | 675 | | — | | — | | | | 675 | | — | | — | | | | (212) | | 866 | | 56 | | | Taxation credit (charge) | | (11) | | (155) | | 12 | | | | (223) | | 711 | | 68 | |
a 2018 brought forward fair value accounting effect balances include a $55-million adjustment between Upstream and Downstream as part of the transfer of the NGL business between segments. b From 2020 fair value accounting effects include changes in the fair value of derivatives entered into by the group to manage currency exposure and interest rate risks relating to hybrid bonds to their respective first call periods. For further information see page 344.
Net debt including leases Net debt including leases« is shown in the table below. | | | | | | | | | | | | | | | $ million | | At 31 December | | 2020 | 2019 | Net debt« | | 38,941 | | 45,442 | | | Lease liabilities | | 9,262 | | 9,722 | | Net partner (receivable) payable for leases entered into on behalf of joint operations« | | (7) | | (158) | | | Net debt including leases | | 48,196 | | 55,006 | | | Total equity | | 85,568 | | 100,708 | | Gearing including leases« | | 36.0% | 35.3% |
| | | | | | | | | | | | | | | «See Glossary | | bp Annual Report and Form 20-F 2020 | | 305 |
Liquidity and capital resources Financial framework BP’sbp has a resilient financial framework setsthat, taken together with our strategy, creates a number of parameters in support of growing shareholder value,compelling investor proposition offering committed distributions, and returns, while maintaining a strong balance sheet. BP’s objective over time is to grow sustainable free cash flow« through a combination of operating cash flow«profitable growth and sustainable value. The framework comprises a coherent approach to capital discipline,allocation, a resilient balance sheet, a disciplined approach to investment allocation and a relentless focus on executing bp’s business plan.
bp’s approach to capital allocation leads to a clear set of priorities – funding our resilient dividend as the first priority, deleveraging the balance sheet, investment in servicelow carbon« and convenience and mobility to advance our energy transition strategy, investment in resilient hydrocarbons to generate sustainable cash flow, and then returning surplus cash« as share buybacks. In a period of growinglow prices, the group has the flexibility to reduce cash costs and to reduce or defer capital investment, as appropriate. Our shareholder distributions overdistribution policy reflects these priorities for the long term. We maintain our progressive dividend policy that reflectsuses of cash alongside an ongoing consideration of factors, including changes in the environment, the underlying performance of the business, the outlook for the group financial framework, and other market factors which may vary quarter to quarter.
In a constant price environment, surplus organic free cash flowNet debt« at 31 December 2020 was $38.9 billion and is expected to grow and be used to ensure the right balance between deleveraging the balance sheet, growing distributions and disciplined investment, depending on the context and outlook at the time. In a period of low prices, the group has the flexibility to reduce cash costs and to reduce or defer capital investment, as appropriate.
Gulf of Mexico oil spill payments were $2.4 billion on a post-tax basis in 2019 and are expected to step down to around $1 billion per annum thereafter. In 2020, we expect to meet our target of $10 billion divestment and other proceeds and plan a further $5 billion of agreed disposals by mid-2021. In 2020, divestment proceeds« will be primarily focussed on reducing gearing«.
We continue to target a gearing band of 20-30%. In 2019, gearing moved to 31.1%, above the top end of the band, reflecting the impact of completing the acquisition of BHP’s onshore US assets using available cash. Gearing may increase in the short-term with the impact of lower prices, but is expected to reduce again in line with the receipt of divestment proceeds.proceeds and the growth in operating cash flow« . bp is targeting $25 billion of proceeds by 2025 (from mid 2020), and at the end of 2020 bp had completed or agreed transactions for over half of this target.
We expect operating cash flow to cover capital expenditure« and the dividend, with capital expenditure initially in a range of $13-15 billion, before increasing to $14-16 billion once net debt reaches $35 billion. Capital expenditure is expected to be at the lower end of the initial range in 2021. Looking further out across 2021-25, bp's cash balancing point is expected to average around $40 per barrel (assuming an average refining marker margin of around $11 and Henry Hub gas price at $3) in 2020 real terms. Gulf of Mexico oil spill payments on a post-tax basis were just over $1.6 billion in 2020 and are expected to be around $1 billion in 2021. In 2019,2020, the return on average capital employed« was 8.9%(3.8)%a at an average of $64$42 per barrel. At $55 per barrel 2017 real,The return on average capital employed is targeted to improvegrow to over 10%12-14% by 2021,2025 at $50 to 60 per barrel in 2020 real terms, and assuming bp planning assumptions, as we continue to growexecute our underlying business.strategy. This is supported by an expected 7-9% growth in earnings before interest, tax, depreciation and amortization (compound annual growth rate) across the same period and subject to the same price and planning assumptions. a Nearest equivalent GAAP measures: Numerator – ProfitLoss attributable to BPbp shareholders $4.0 billion;$(20.3); Denominator – Average capital employed $167.6$163.3 billion. Dividends and other distributions to shareholders The dividend is determined in US dollars, the economic currency of BP,bp, and the dividend level is reviewed by the board each quarter. The quarterly dividend was increasedreset to 10.505.25 cents per ordinary share for the fourthper quarter as part of 2019, having been increaseda wider distribution policy announced in August 2020, and is intended to 10.25 cents from 10.00 cents per share in the third quarter of 2018.remain fixed at this level. The total dividend distributed to BPbp shareholders in 20192020 was $8.3$6.4 billion (2018 $8.1(2019 $8.3 billion). Prior to its suspensionThis dividend was all paid in the fourth quarter of 2019,cash as shareholders hadno longer have the option to receive a scrip dividend in place of receiving cash. Included in the distribution policy is a commitment that, once net debt reaches $35 billion and subject to maintaining a strong investment grade credit rating, at least 60% of surplus cash and in 2019 the total dividend paid in cash was $6.9 billion (2018 $6.7 billion). The impact of the scrip dilution since the third quarter of 2017 was fully offset in January 2020.will be distributed to shareholders through share buybacks. Details of share repurchases to satisfy the requirements of certain employee share-based payment plans are set out on page 334.
The share buyback programme to offset the dilutive impact of the legacy scrip dividend concluded in January 2020 and purchased 235120 million ordinary shares in 20192020 at a cost of $776 million (2019 $1.5 billion (2018 $355 million)billion), including fees and stamp duty. Financing the group’s activities The group’s principal commodities, oil and gas, are priced internationally in US dollars. Group policy has generally been to minimize economic exposure to currency movements by financing operations with US dollar debt. Where debt isand hybrid bonds are issued in other currencies, including euros, it isthey are generally swapped back to US dollars using derivative contracts, or else hedged by maintaining offsetting cash positions in the same currency. Cash balances of the group are mainly held in US dollars or swapped to US dollars and holdings are well diversified to reduce concentration risk. The group is not, therefore, exposed to significant currency risk regarding its cash or borrowings. Also see Risk factors on page 7067 for further information on risks associated with prices and markets and Financial statements – Note 29. The group’s finance debt at 31 December 20192020 amounted to $72.7 billion (2019 $67.7 billion (2018 $65.1 billionb)billion). Of the total finance debt, $10.5$9.4 billion is classified as short term at the end of 2019 (2018 $9.32020 (2019 $10.5 billion). See Financial statements – Note 26 for more information on the short-term balance. Net debt« was $45.4$38.9 billion at the end of 2019, an increase2020, a decrease of $1.9$6.5 billion from the 20182019 year-end position of $43.5 billionb.$45.4 billion. On 17 June 2020, a group subsidiary« issued perpetual subordinated hybrid bonds in EUR, GBP and USD for a US dollar equivalent amount of $11.9 billion. As the group has the unconditional right to avoid transferring cash or another financial asset in relation to these hybrid bonds, they are classified as equity instruments and reported within non-controlling interests. The ratio of finance debt to finance debt plus total equity at 31 December 20192020 was 45.9% (2019 40.2% (2018 39.1%b). The ratio of net debt to net debt plus total equity«Gearing was 31.1%31.3% at the end of 2019 (2018 30.0%b2020 (2019 31.1%). See Financial statements – Note 27 for finance debt, which is the nearest equivalent measure on an IFRS basis, and for further information on net debt. Cash and cash equivalents of $22.5$31.1 billion at 31 December 2019 (20182020 (2019 $22.5 billion) are included in net debt. We manage our cash position so that the group has adequate cover to respond to potential short-term market illiquidity,liquidity, short term price environment volatility and expect to maintain a robust cash position. The group also has an undrawn committed $10$8 billion credit facility and undrawn committed bank facilities of $7.6$4 billion (see Financial statements – Note 29 for more information). We believe that the group has sufficient working capital for foreseeable requirements, taking into account the amounts of undrawn borrowing facilities and levels of cash and cash equivalents, and its ongoing ability to generate cash. BPbp utilizes various arrangements in order to manage its working capital including discounting of receivables and, in the supply and trading business, the active management of supplier payment terms, inventory and collateral.
Standard & Poor’s Ratings’ long-term credit rating for BP p.l.c. is A- (positive(negative outlook) and, the Moody’s Investors Service rating is A1 (stable(negative outlook) and the Fitch Ratings’ long-term credit rating is A (stable). The group’s sources of funding, its access to capital markets and maintaining a strong cash position are described in Financial statements – Note 25 and Note 29. Further information on the management of liquidity risk and credit risk, and the maturity profile and fixed/floating rate characteristics of the group’s debt are also provided in Financial statements –statements– Note 26 and Note 29. b As a result of the adoption of IFRS 16 ‘Leases’, leases that were previously classified as finance leases under IAS 17 are now presented as ‘Lease liabilities’ on the group balance sheet and therefore do not form part of finance debt. Comparative information for finance debt (previously termed ‘gross debt’), net debt and gearing (previously termed 'net debt ratio') have been amended to be on a consistent basis with amounts presented for 2019.
The information above contains forward-looking statements, which by their nature involve risk and uncertainty because they relate to events and depend on circumstances that will or may occur in the future and are outside the control of BP.bp. You are urged to read the Cautionary statement on page 324329 and Risk factors on page 70,67, which describe the risks and uncertainties that may cause actual results and developments to differ materially from those expressed or implied by these forward-looking statements.
| | | | | | | | | | | | | | | | 306 | BP
| bp Annual Report and Form 20-F 20192020 | | «See Glossary | | 301 |
Off-balance sheet arrangements At 31 December 2019,2020, the group’s share of third-party finance debt of equity-accounted entities was $17.3$19.9 billion (2018 $16.1(2019 $17.3 billion). These amounts are not reflected in the group’s debt on the balance sheet. The group has issued third-party guarantees under which amounts outstanding, incremental to amounts recognized on the balance sheet, at 31 December 20192020 were $692$1,405 million (2018 $696(2019 $692 million) in respect of liabilities of joint ventures«and associates«and $523$661 million (2018 $432(2019 $523 million) in respect of liabilities of other third parties. Of these amounts, $681$1,393 million (2018 $684(2019 $681 million) of the joint ventures and associates guarantees relate to borrowings and for other third-party guarantees, $494$568 million (2018 $423(2019 $494 million) relate to guarantees of borrowings. Contractual obligations The following table summarizes the group’s capital expenditure commitments for property, plant and equipment at 31 December 20192020 and the proportion of that expenditure for which contracts have been placed. | | | | | | | | | | | | | | | | | | | | | | | | | | | | | | | | | | | $ million | | | | | | | | Payments due by period | | Capital expenditure | | Total | 2021 | 2022 | 2023 | 2024 | 2025 | 2026 and thereafter | | Committed | | 18,025 | | 9,016 | | 5,467 | | 1,747 | | 747 | | 505 | | 543 | | | of which is contracted | | 8,009 | | 4,878 | | 2,805 | | 166 | | 65 | | 27 | | 68 | |
| | | | | | | | | | | | | | | | | | | | | | | | | | $ million |
| | | | | | | | | Payments due by period | | | Capital expenditure | | Total |
| 2020 |
| 2021 |
| 2022 |
| 2023 |
| 2024 |
| 2025 and thereafter |
| | Committed | | 24,853 |
| 12,745 |
| 7,070 |
| 2,599 |
| 1,398 |
| 396 |
| 645 |
| | of which is contracted | | 11,382 |
| 7,497 |
| 3,388 |
| 347 |
| 52 |
| 27 |
| 71 |
|
Capital expenditure is considered to be committed when the project has received the appropriate level of internal management approval. For joint operations«, the net BPbp share is included in the amounts above. In addition, at 31 December 2019,2020, the group had committed to capital expenditure relating to investments in equity-accounted entities amounting to $1,156$3,774 million. Contracts were in place for $864$1,270 million of this total. The following table summarizes the group’s principal contractual obligations at 31 December 2019,2020, distinguishing between those for which a liability is recognized on the balance sheet and those for which no liability is recognized. Further information on borrowings is given in Financial statements – Note 26 and more information on leases is given in Financial statements – Note 28. | | | | | | | | | | | | | | | | | | | | | | | | | | | | | | | | | | | $ million | | | | | | | | Payments due by period | | Expected payments by period under contractual obligations | | Total | 2021 | 2022 | 2023 | 2024 | 2025 | 2026 and thereafter | | Balance sheet obligations | | | | | | | | | Borrowingsa | | 81,076 | | 13,981 | | 7,541 | | 8,146 | | 9,001 | | 7,445 | | 34,962 | | Lease liabilitiesb | | 10,884 | | 2,262 | | 1,672 | | 1,340 | | 1,025 | | 878 | | 3,707 | | Decommissioning liabilitiesc | | 22,466 | | 470 | | 244 | | 279 | | 233 | | 221 | | 21,019 | | Environmental liabilitiesc | | 1,880 | | 272 | | 290 | | 242 | | 196 | | 157 | | 723 | | Gulf of Mexico oil spill liabilitiesd | | 14,569 | | 1,409 | | 1,278 | | 1,222 | | 1,141 | | 1,136 | | 8,383 | | Pensions and other post-retirement benefitse | | 17,448 | | 1,039 | | 978 | | 946 | | 922 | | 917 | | 12,646 | | | | 148,323 | | 19,433 | | 12,003 | | 12,175 | | 12,518 | | 10,754 | | 81,440 | | | Off-balance sheet obligations | | | | | | | | | Unconditional purchase obligationsf | | | | | | | | | | Crude oil and oil products | | 44,322 | | 35,702 | | 4,495 | | 1,988 | | 993 | | 477 | | 667 | | | Natural gas and LNG | | 35,337 | | 11,255 | | 4,779 | | 3,155 | | 2,442 | | 1,465 | | 12,241 | | | Chemicals and other refinery feedstocks | | 684 | | 422 | | 70 | | 63 | | 54 | | 53 | | 22 | | | Power | | 4,240 | | 2,124 | | 730 | | 364 | | 176 | | 193 | | 653 | | | Utilities | | 762 | | 91 | | 91 | | 53 | | 51 | | 50 | | 426 | | | Transportation | | 19,270 | | 1,792 | | 1,529 | | 1,459 | | 1,357 | | 1,189 | | 11,944 | | | Use of facilities and services | | 19,830 | | 2,810 | | 2,010 | | 1,628 | | 1,358 | | 1,207 | | 10,817 | | | | 124,445 | | 54,196 | | 13,704 | | 8,710 | | 6,431 | | 4,634 | | 36,770 | | | Total | | 272,768 | | 73,629 | | 25,707 | | 20,885 | | 18,949 | | 15,388 | | 118,210 | |
| | | | | | | | | | | | | | | | | | | | | | | | | | $ million |
| | | | | | | | | Payments due by period | | | Expected payments by period under contractual obligations | | Total |
| 2020 |
| 2021 |
| 2022 |
| 2023 |
| 2024 |
| 2025 and thereafter |
| | Balance sheet obligations | | | | | | | | | Borrowingsa | | 75,567 |
| 14,166 |
| 8,119 |
| 9,156 |
| 8,030 |
| 8,363 |
| 27,733 |
| Lease liabilitiesb | | 11,299 |
| 2,514 |
| 1,839 |
| 1,364 |
| 1,105 |
| 876 |
| 3,601 |
| Decommissioning liabilitiesc | | 25,964 |
| 395 |
| 218 |
| 80 |
| 196 |
| 146 |
| 24,929 |
| Environmental liabilitiesc | | 1,867 |
| 278 |
| 276 |
| 224 |
| 206 |
| 170 |
| 713 |
| Gulf of Mexico oil spill liabilitiesd | | 16,129 |
| 1,628 |
| 1,355 |
| 1,267 |
| 1,219 |
| 1,141 |
| 9,519 |
| Pensions and other post-retirement benefitse | | 18,016 |
| 1,127 |
| 1,155 |
| 1,076 |
| 1,072 |
| 1,048 |
| 12,538 |
| | | | 148,842 |
| 20,108 |
| 12,962 |
| 13,167 |
| 11,828 |
| 11,744 |
| 79,033 |
| | Off-balance sheet obligations | | | | | | | | | Unconditional purchase obligationsf | | | | | | | | | | Crude oil and oil products | | 64,486 |
| 48,954 |
| 6,720 |
| 3,919 |
| 2,016 |
| 1,288 |
| 1,589 |
| | Natural gas and LNG | | 39,097 |
| 12,182 |
| 4,478 |
| 3,247 |
| 2,692 |
| 2,183 |
| 14,315 |
| | Chemicals and other refinery feedstocks | | 5,009 |
| 2,918 |
| 927 |
| 922 |
| 118 |
| 53 |
| 71 |
| | Power | | 5,001 |
| 2,673 |
| 1,164 |
| 394 |
| 204 |
| 121 |
| 445 |
| | Utilities | | 964 |
| 144 |
| 123 |
| 103 |
| 67 |
| 64 |
| 463 |
| | Transportation | | 20,526 |
| 1,650 |
| 1,637 |
| 1,428 |
| 1,361 |
| 1,332 |
| 13,118 |
| | Use of facilities and services | | 20,855 |
| 2,565 |
| 2,132 |
| 1,767 |
| 1,460 |
| 1,252 |
| 11,679 |
| | | | 155,938 |
| 71,086 |
| 17,181 |
| 11,780 |
| 7,918 |
| 6,293 |
| 41,680 |
| | Total | | 304,780 |
| 91,194 |
| 30,143 |
| 24,947 |
| 19,746 |
| 18,037 |
| 120,713 |
|
| | b Expected payments include interest totalling $1,622 million ($275 million in 2021, $228 million in 2022, $190 million in 2023, $156 million in 2024, $126 million in 2025 and $647 million thereafter). c The amounts presented are undiscounted. d The amounts presented are undiscounted. Gulf of Mexico oil spill liabilities are included in the group balance sheet, on a discounted basis, within other payables. See Financial statements – Note 22 for further information. e Represents the expected future contributions to funded pension plans and payments by the group for unfunded pension plans and the expected future payments for other post-retirement benefits. f Represents any agreement to purchase goods or services that is enforceable and legally binding and that specifies all significant terms (such as fixed or minimum purchase volumes, timing of purchase and pricing provisions). Agreements that do not specify all significant terms, or that are not enforceable, are excluded. The amounts shown include arrangements to secure long-term access to supplies of crude oil, natural gas, feedstocks and pipeline systems. In addition, the amounts shown for 2021 include purchase commitments existing at 31 December 2020 entered into principally to meet the group’s short-term manufacturing and marketing requirements. The price risk associated with these crude oil, natural gas and power contracts is discussed in Financial statements – Note 29. | Expected payments include interest totalling $7,843 million ($1,730 million in 2020, $1,393 million in 2021, $1,207 million in 2022, $1,008 million in 2023, $809 million in 2024 and $1,696 million thereafter). |
| | b
| Expected payments include interest totalling $1,577 million ($307 million in 2020, $248 million in 2021, $202 million in 2022, $164 million in 2023, $133 million in 2024 and $523 million thereafter). |
| | c
| The amounts presented are undiscounted. |
| | d
| The amounts presented are undiscounted. Gulf of Mexico oil spill liabilities are included in the group balance sheet, on a discounted basis, within other payables. See Financial statements – Note 22 for further information. |
| | e
| Represents the expected future contributions to funded pension plans and payments by the group for unfunded pension plans and the expected future payments for other post-retirement benefits. |
| | f
| Represents any agreement to purchase goods or services that is enforceable and legally binding and that specifies all significant terms (such as fixed or minimum purchase volumes, timing of purchase and pricing provisions). Agreements that do not specify all significant terms, or that are not enforceable, are excluded. The amounts shown include arrangements to secure long-term access to supplies of crude oil, natural gas, feedstocks and pipeline systems. In addition, the amounts shown for 2020 include purchase commitments existing at 31 December 2019 entered into principally to meet the group’s short-term manufacturing and marketing requirements. The price risk associated with these crude oil, natural gas and power contracts is discussed in Financial statements – Note 29. |
Commitments for the delivery of oil and gas We sell crude oil, natural gas and liquefied natural gas under a variety of contractual obligations. Some of these contracts specify the delivery of fixed and determinable quantities. For the period from 20202021 to 20222023 worldwide, we are contractually committed to deliver approximately 292228 million barrels of oil, 8,6008,500 billion cubic feet of natural gas, and 3637 million tonnes of liquefied natural gas. The commitments principally relate to group subsidiaries« based in Canada, Egypt, Singapore, United Kingdom and United States. We expect to fulfil these delivery commitments with production from our proved developed reserves and supplies from existing contracts, supplemented by market purchases as necessary.
| | | | | | | | | | | | | | | 302 | | «See Glossary | BP
| bp Annual Report and Form 20-F 20192020 | | 307 |
Upstream analysisOil and gas disclosures for the group
Analysis by region Our upstreamoil and gas operations are set out below by geographical area, with associated significant events for 2019. BP’s2020. bp’s percentage working interest in oil and gas assets is shown in brackets. Working interest is the cost-bearing ownership share of an oil or gas lease. Consequently, the percentages disclosed for certain agreements do not necessarily reflect the percentage interests in proved reserves, and production.production or revenue. See page 320 for more information on Rosneft. In addition to exploration, development and production activities, our upstreamUpstream business also includes certain midstream and liquefied natural gas (LNG) supply activities. Midstream activities involve the ownership and management of crude oil and natural gas pipelines, processing facilities and export terminals, LNG processing facilities and transportation, and our natural gas liquids (NGLs) processing business. Our LNG supply activities are located in Abu Dhabi, Angola, Australia, Indonesia and Trinidad. In 20192020 we marketed around 4.65.0 million tonnes of our LNG production from these assets to IST which usessupplements equity production with merchant third party volumes to build a global trading portfolio. The LNG is marketed through contractual rights to access import terminal capacity in the liquid markets of Italy (Rovigo), the Netherlands (Gate), Spain (Bilbao), theEurope, UK (the Isle of Grain) and the US, (Cove Point), with the remainder marketedand relationships to market directly to end user customers or trading entities. LNG is supplied to customers into markets includingall major LNG demand centres for example Argentina, Brazil, Caribbean, China, the Dominican Republic, European Union,Croatia, Mediterranean and North West Europe, India, Israel, Japan, Kuwait, Singapore, South Korea, Taiwan, Thailand, Turkey and Turkey.the UK. Europe BPbp is active in the North Sea and the Norwegian Sea. In 2019 BP’s2020 bp’s production came from three key areas: the Shetland area comprising the Clair, Foinaven, and Schiehallion fields; the central area comprising the Andrew area, Culzean, ETAP Kinnoull and Shearwater fields; and Norway, through our equity accounted 30% interest in Aker BP.
•On 29 March, bp confirmed completion of the restructuring of contractual arrangements for the Petrojari Foinaven floating production, storage and offloading vessel on the Foinaven field to the west of the Shetlands (bp 72% and operator). •During the year, impairment charges of $2,796 million were recognized in respect of certain North Sea assets, primarily as a result of changes to the group's long-term price assumptions. •In March 2019 a final investment decision2020, EnQuest, the Thistle field operator, announced it no longer expected to re-start production at the Thistle field (bp 82%) . A Cessation of Production application was made on Seagull (BP 50%), a development tieback to ETAPapproved by the regulator in July, with an effective decommissioning date of 31 May 2020. •During the third quarter, bp was awarded eight operated and three non-operated blocks in the centralNorth Sea as part of the UK North Sea.Oil & Gas Authority 32nd offshore licensing round. In June BP•On 6 October, bp confirmed that the start-upplanned divestment to Premier Oil of gas production from the Total operated Culzean field (BP 32%)its interests in the central UK North Sea.
Also in June, BP was awarded a new exploration licence in the 31st Offshore Licensing Round in the West of Shetland AreaAndrew area and Shearwater assets, both located in the UK North Sea, for one licence covering 10 blocks (BP 50%would not proceed following the announcement of a proposed merger between Chrysaor and operator).
In October production started at the Equinor operated Johan Sverdrup field (Aker BP 11.57%).
The Alligin field commenced production through the Glen Lyon facility in December 2019.
Development of the Vorlich field continued with two wells successfully drilled during the year. Production is expected to commence in 2020.
In January 2020 BP announced that it had agreed terms to sell its interests in the Andrew Area and non-operated interest in Shearwater to Premier Oil. bp had announced this divestment in January 2020. The deal coversdivestment was to cover the Andrew, Arundel, Cyrus, Farragon and Kinnoull fields plus ourbp's interest in Shearwater. BP currently owns 62.75%Marketing of Andrew, 100%both assets continues.
•On 26 November, bp announced that production had started at the Vorlich field (bp 66%), just two years after the project was sanctioned. Vorlich is the latest in a programme of Arundel, 100% of Cyrus, 50% of Farragonfast-paced, high-return subsea tiebacks in the UK North Sea. bp and 77.06% of Kinnoull. We have a 27.50% sharepartner Ithaca Energy invested £230 million to develop the field, which was discovered in Shearwater. Under the terms of the agreement, Premier Oil will pay BP $625m. The transaction is expected to complete2014 and received regulatory approval for development in 2020.2018. North America Our upstream activities in North America are located in fivefour areas: deepwater Gulf of Mexico, the Lower 48 states, Alaska, Canada and Mexico. Our interests in Alaska were disposed of during the year, further details are provided below. BP
bp has around 290260 lease blocks in the Gulf of Mexico and operates four production hubs. In February 2019 we announced•On 25 August, bp confirmed it started production at Atlantis Phase 3 in the start-upUS Gulf of the Constellation project (BP 66.67%), operated by Anadarko.Mexico (bp 56% and operator).
On 6 May BP announced the final investment decision for•Construction and installation at the Thunder Horse South Expansion Phase 2 project is underway and drilling set to commence in the USfirst half of 2021. First oil from the project is expected in the third quarter of 2021.
•bp was awarded 12 leases in the lease sale conducted in March and 10 leases in the sale held in November. •The Mad Dog 2 project execute timeline was impacted by both COVID-19 and delays to fabrication of the floating production unit. The unit has now set sail from Korea, and wells activity and subsea installation are once again progressing. First oil is now expected in the second quarter of 2022. •During the year, exploration write-offs of $2,643 million were recognized in relation to certain Gulf of Mexico (BP operator 75%, ExxonMobil 25%). This project will add two new subsea production units approximately two miles assets, primarily due to the southmanagement's re-assessment of expectations to extract value from certain exploration prospects as a result of a review of the existing Thunder Horse platform with two new production wellsgroup's long-term strategic plan and changes in the near term. Eventually eight wells will be drilled as part of the overall development, with first oil expected in 2021.
In June BP confirmed the discovery of King Embayment in the Mars corridor, in the US Gulf of Mexico (BP 28.5%).
BP participated in two lease sales in 2019. In March we were awarded 23 leases in lease sale 252, and in August we were awarded 21 leases in lease sale 253.
We have interests in three Paleogene fields: Tiber, Guadalupe, and Kaskida. Over the next few years we will be running subsurface work to better understand and define the concept development for these fields. BP has history with the development of technology required to develop such high pressure, deepwater fields and will continue to connect with the market to understand the options we will have available for the development of these fields.group's long-term price assumptions.
See also Financial Statements – Note 1 for further information on exploration leases. BPX Energy, BP'sbpx energy, bp's onshore oil and gas business in the Lower 48 states, has significant operated and non-operated activities across Colorado, Louisiana, New Mexico, Oklahoma, Texas and Wyoming producing natural gas, oil, NGLs and condensate, with primary focus on developing unconventional resources in Texas. It had a 1.5 billion boe proved reserve base at 31 December 2019,2020, predominantly in unconventional reservoirs (tight gas«, shale gas and coalbed methane, and newly acquired shale oil). This resource spans 3.4BPX Energy's assets span 2.1 million net developed acres and has approximately 10,000it had over 7,000 operated gross wells at 31 December 2020, with daily net production around 500mboe/370mboe/d.
BPX Energy operatesbpx energy operated as a separate business in 2020 while remaining part of ourthe Upstream segment. With its own governance, systems and processes, it is structured to increase competitive performance through swift decision making and innovation, while maintaining BP’sbp’s commitment to safe, reliable and compliant operations.
On 1 March BPX Energy assumed physical control•During the year, impairment charges of all Petrohawk Energy Corporation operations from BHP following acquisition$1,444 million were recognized in respect of thesecertain bpx energy assets, in 2018. BPX is making progress towards its goal of achieving $400 million of annual synergies by 2021, when integration is completed. BPX surpassed the 2019 savings estimate of $90m, delivering $240m in the first year after the acquisition.
In November 2019 BPX Energy confirmed agreements to sell its oil and gas interests in the San Juan basin in Colorado and New Mexico and the Arkoma basin in Oklahoma. These disposals completed in March 2020. Additionally, in December 2019 BPX Energy completed divestments in certain fields within the Anadarko basin in Oklahoma and Texas and the Haynesville basin in Texas. Primarilyprimarily as a result of changes to the divestment program of heritage assets, BPX Energy incurred $4.7 billiongroup's long term price assumptions.
•In December bp announced that it had reached agreement to sell its interest in impairment charges. Proceeds of $642 million were receivedthe Wamsutter asset in 2019, including performance deposits for the disposals that closedWyoming to Williams Field Services LLC. The transaction completed in 2020.January 2021. BP’sbp’s onshore US crude oil and product pipelines and related transportation assets arewere included in the Downstream segment.segment in 2020.
In Alaska, BP Exploration (Alaska) Inc. (BPXA) operated nine North Slope oilfields in the Greater Prudhoe Bay area at the end of the year. BP owns significantand held interests in three producing fields operated by others, as well as a non-operating interest in the Liberty development project.project prior to the completion in the second quarter of 2020 of the divestment of its Upstream business to Hilcorp Energy announced in 2019. BP Pipelines (Alaska) Inc. (BPPA) ownsowned a 49% interest in the Trans-Alaska Pipeline System (TAPS). TAPS transports crude oil from Prudhoe Bay on prior to completion in the Alaska North Slope tofourth quarter of 2020 of the portdivestment of Valdez in southcentral Alaska. In April 2012 Unocal (1.37%) gave notice to the other TAPS owners of their intention to withdraw as an owner of TAPS. The remaining Owners and Unocal reached agreement in mid-2019 to settle ongoing litigation and transfer Unocal’s interest in TAPS to the other owners. The Parties are seeking regulatory approval at the state and federal level. On 27 August BP announced an agreement to sell the entirety ofits Midstream interests in its Alaska operations to Hilcorp Energy including upstream and midstream businesses, for a headline price of $5.6
| | | | | | | BP Annual Report and Form 20-F 2019
| «See Glossary
| | 303 |
billion. BP will retain decommissioning liabilities associated with TAPS as part of the transaction. Subject to regulatory approval, the transaction is expected to completeannounced in 2020.2019. As part of this transaction BP recognized impairments of circa $1 billion$1,002 million were recognized in 2019.2020. bp retained the decommissioning liability relating to its interest in TAPS which will be partially offset by a 30% reimbursement of costs incurred from Hilcorp.
In Canada BPbp is focused on oil sands development as well as pursuing offshore exploration opportunities.opportunities and its Sunrise Oil Sands operations. We utilize in-situhave offshore exploration licences in Nova Scotia, Newfoundland and Labrador and the Canadian Beaufort Sea. In addition to Sunrise Oil Sands we hold interests in two further oil sands lease areas through the Terre de Grace partnership and the Pike Oil Sands joint operation«. In-situ steam-assisted gravity drainage (SAGD) technology is utilized in our existing oil sands developments,operations, which uses the injection of steam into the reservoir to warm the bitumen so that it can flow to the surface through producing wells. We hold interests in three oil sands lease areas through the Sunrise Oil Sands and Terre de Grace partnerships and the Pike Oil Sands joint operation«. In addition, we have offshore exploration licences in Nova Scotia, Newfoundland and Labrador and the Canadian Beaufort Sea. | | | | | | | | | | | | | | | | 308 | | bp Annual Report and Form 20-F 2020 | | «See Glossary |
•The order issued by the government of Canada issued an orderin 2019 prohibiting any work or activity authorized under the Canada Oil and Gas Operations Act on frontier lands that are situated in Canadian Arctic offshore waters. This includes the Beaufort Sea. The order will remainwaters remains in effect until 31 December 2021. BP currently holds an intangible balance •During the year, impairment charges of $64$865 million relatedwere recognized in respect of certain assets in Canada, primarily as a result of changes to two blocks operated by othersthe group's long-term price assumptions. •Also during the year, exploration write-offs of $2,539 million were recognized in this area.relation to certain assets in Canada following management's re-assessment of expectations to extract value from certain exploration prospects as a result of a review of the group's long-term strategic plan and changes in the group's long-term price assumptions. A $247-million write-off was also recognized in relation to a prepayment for the Pike access pipeline. •On 29 October, bp confirmed oil discoveries at the Cappahayden and Cambriol prospects in the Flemish Pass basin (bp 40%), offshore Newfoundland. In Mexico, we have interests in two exploration joint operations in the Salina Basin with Equinor and Total, Block 1 (BP(bp 33% and operator) and Block 3 (BP(bp 33%), and in one exploration joint operation in the Sureste Basin with Total and Hokchi, a subsidiary of Pan American Energy Group (PAEG), Block 34 (BP(bp 42.5% and operator). Following approval from Comisión Nacional de Hidrocarburos (CNH), the Mexican regulator, of the exploration plans for both Salina Basin operations in March 2018, seismic interpretation and well planning activities continued in 2019. These activities are expected to ramp up in 2020 with tentative plans to commence drilling in the first half of 2021.
The Sureste Basin operation received exploration plan approval in July 2019 from CNH. Seismic licensing and reprocessing activities were initiated in 2019 and are expected to continue in 2020 with plans for drilling to commence in 2022.
In November we signed a swap agreement with Equinor covering our interests in Blocks 1 and 3 in the Salina Basin. Subject to receipt of Government approvals expected in the second half of 2020, BP’s interests are expected to be 56.67% in Block 1 and 10% in Block 3.
South America BPbp has upstream activities in Argentina, Brazil and Trinidad & Tobago and through PAEG, in Argentina, and Bolivia and Uruguay.
In Argentina bp and Total are partners on a 50/50 basis in two offshore exploration concessions. Total is the operator. In Brazil BPbp has interests in 2622 exploration concessions across five basins. •During the year, exploration write-offs of $2,141 million were recognized in relation to certain assets in Brazil following management's re-assessment of expectations to extract value from certain exploration prospects as a result of a review of the group's long-term strategic plan and changes in the group's long-term price assumptions. •In the North CamposFoz do Amazonas basin, BP is now formally the operator of BM-C-30 and BM-C-32 blocks following Anadarko's withdrawal from both blocks and the transfer of their interest. The Brazilian National Petroleum Agency (ANP) approved the joint venture’sTotal's request for a postponement of declaration of commerciality. In the Foz de Amazonas basin Total as operator oflicense extension for blocks FZA-M-57, 86, 88, 125 and 127 is analysing127was approved by the next steps following IBAMA’s license denial. The Foz do AmazonasBrazilian regulatory authorities. Following their resignation from operatorship in August, Total reached agreement in October to transfer its working interest in these blocks are eligible forto Petrobras. This transfer was also approved by the regulatory authorities.
•In FZA-M-59 block, bp requested a 2-yeartwo year license extension according to May 2022 which was approved by the ANP in June, based on Resolution 708,708/2017. bp also transferred its operatorship of this block to Petrobras, and this was approved by the deadlineANP in October. •bp reached an agreement to request such extensionsell Itaipu and Wahoo exploration assets to PetroRio for $100 million to be paid in instalments from 2021 onwards; a further $40 million payment is May 2020 for the Total-operated blocks. In the BP-operated block FZA-M-59, the extension deadlinecontingent on pre-agreed conditions. The completion of this transaction is March 2020, environmental licensing process is ongoing and the extension has been requested. All blocks may also be subject to further extensions should ANP agree. In the South Campos basin ANP approved a revised plan of appraisal forapproval from the BM-C-35 block. The agreement includes a commitment to drill an exploratory well in 2021 with a deadline to declare commerciality or end the appraisal period by 1 March 2022.
In the Pau Brasil block the consortium group is undertaking seismic reprocessing to aid in subsurface description.
In the Potiguar basin blocks ANP approved the consortium's request to modify the appraisal plan timelines.
In October, in the 16th bid round, BP was awarded exploration and production rights to block C-M-477 offshore Brazil in the Campos Basin (BP 30%) and to block S-M-1500 (BP 100%) in the Santos Basin.Brazilian regulatory authorities.
PAEG, a joint venture that is owned by BPbp (50%) and Bridas Corporation (50%), has activities mainly in Argentina and Mexico, but is also present in Uruguay and Bolivia. During•On 24 May, the second quarter, BPHokchi project in Mexico, operated by PAEG, achieved new accessfirst oil, producing 1.2mboe/d in Argentina’s first offshore licensing round blocks, obtaining the CAN-111 and CAN-113 blocks (BP 50%).2020.
In Trinidad & Tobago BPbp holds interests in exploration and production licences and production-sharing contracts«(PSCs) covering 1.6 million acres offshore of the east and north-east coast. Facilities include 15 offshore platforms and two onshore processing facilities. Production comprises gas and associated liquids. BPbp also holds interests in the Atlantic LNG facility. BP’sbp’s shareholding averages 39% across four LNG trains« with a combined capacity of approximately 15 million tonnes per annum. We sellDuring 2020 we sold gas to trains 1, 2 and 3 and processprocessed gas in train 4. Most of the LNG produced from BPbp gas supplied to trains 2, 3 and 4 is sold to third parties under long- term contracts. BP sells approximately one third of its gas production
•The Cassia Compression project, a new compression platform with a 1.2bcf/d capacity bridge-linked to the National Gas Company who supplyCassia B processing platform was expected to start up in 2021 but is delayed to 2022 as a result of COVID-19 impacting delivery lines. •Impairment charges of $2,416 million were recognized in 2020 in respect of certain assets in Trinidad, primarily as a result of changes to the volumes intogroup's long-term price assumptions. •bp holds a 30% interest in two deepwater blocks, Block 23(a) and TTDAA14, with BHP as the petrochemical, powerOperator holding a 70% interest. There were four successful exploration wells drilled in 2019 and other industrial markets. The remainder BP sells to third parties under long-term contracts.appraisal work is ongoing on these discoveries. Production started at the Angelin project (BP 100% and operator) in February 2019.
BP confirmed the following hydrocarbon discoveries during the year: Bélé-1 in April, Tuk-1 in May, Hi-Hat-1 in June, Boom-1 in September, and Ginger in November, all located offshore Trinidad and Tobago (BP 30%).
The•bp’s initial gas sales and LNG offtake arrangements for Atlantic LNG Train 1 ended in September 20182018. Subsequently, short term gas sales and gas is currently sold into Train 1 on a short-term basisLNG offtake arrangements were established and rolled over up until December 2020, with BPbp lifting the majority of the LNG produced. The National Gas Company of Trinidad & Tobago (NGC) has agreed to fund the operating cost of Train 1 gas supply arrangements are under discussionup to the end of December 2021 for the period April 2020 onwards.right but not the obligation to supply gas into Train 1 and offtake 100% of the resultant LNG.
•On 28 September, BP Trinidad and Tobago LLC started up the Galeota expansion project in Trinidad. The project comprises a new produced water handling facility, a new flare system, relocation of the control room away from production and upgrades to the existing condensate stabilization facility. •bp is operator of the Manakin Block which was discovered in 1998 and is a cross border reservoir field with the Venezuelan reservoir, Cocuina. Manakin declared commerciality in January 2018 however cross border commercial agreementsdiscussions have not progressed due to the impact of US sanctions. Africa BP’sbp’s upstream activities in Africa are located in Algeria, Angola, Côte d'Ivoire, Egypt, The Gambia, Libya, Madagascar, Mauritania, São Tomé & Príncipe and Senegal. bp's interest in Madagascar was relinquished in 2020.
In Algeria BP,bp, Sonatrach and Equinor are partners in the In Salah (BP(bp 33.15%) and In Amenas (BP(bp 45.89%) non-operated joint ventures that supply gas to the domestic and European markets. In Angola, BPbp owns an interest in five major deepwater offshore licences and is operator in two of these, Blocks 18 and 31, that are producing. We also have an equity interest in the Angola LNG plant (BP(bp 13.6%). On 6 June BP announced an agreement•During the year, exploration write-offs of $832 million were recognized in relation to extendcertain assets in Angola following management's re-assessment of expectations to extract value from certain exploration prospects as a result of a review of the production- sharing agreement«(PSA) for Block 15 to 2032group's long-term strategic plan and to provide for Sonangol to take a 10% equity interestchanges in the Block. The transaction completed on 27 January 2020.
group's long-term price assumptions.•Also during the year, impairment charges of $316 million were recognized in relation to certain assets in Angola, primarily as a result of changes to the group's long-term price assumptions. •Development progressed at the Total-operated Zinia 2 deep offshore development project in Block 17 (BP 16.67%(bp 15.84%). At the end of 2019 construction activities were underway, with and first production is expected in 2021. Development progressed•During the year, construction activity started at the Platina project in Block 18, with construction activities expected to commence in 2020 and first production expected in 2021.2022.
In November BP agreed to join•Following the New Gas Consortium (NGC), subject to completionsigning of certain conditions precedent. This will be the first upstream natural gas partnership in Angola and will be operated by ENI (BP 11.8%).
| | | | | | 304 | | «See Glossary
| BP Annual Report and Form 20-F 2019
| |
In December the Total-operated Block 17 contractor group signed an agreement in December 2019 by bp and its partners with the national agency ANPG (AgêAgência Nacional de Petróleo, Gás e Biocombustíveis) and Sonangol,veis (ANPG), to extend allthe production-sharing agreement« (PSA) for Block 17 production licenses upuntil 2045, all conditions precedent relating to 2045, subjectthe agreement were met in the second quarter of 2020 and the new agreement became effective on 1 April 2020. Under the agreement the state-owned company Sonangol acquired a 5% equity interest in the block on the effective date with a further 5% to Government approval. As part ofbe transferred in 2036.
• In June 2019, bp and the extensioncontractor group signed an agreement with ANPG, extending the PSA for Block 15 until 2032. Under the agreement Sonangol will becomeacquired a 5% holder10% equity interest in Block 17 from 2020 with an additional 5%the block, reducing bp’s interest from 2036.26.67% to 24%. All conditions precedent relating to the agreement were met on 27 January 2020 and the new agreement became effective as from 1 October 2019. | | | | | | | | | | | | | | | «See Glossary | | bp Annual Report and Form 20-F 2020 | | 309 |
•In December 2018, bp and the contractor group signed an agreement with ANPG, extending the Block 18 PSA until 2032. Under the agreement, effective from 1 July 2020, Sonangol acquired an 8% equity interest in the block, reducing bp’s interest from 50% to 46%. All conditions precedent relating to the agreement were met on 17 December 2020. In Côte d’Ivoire, BPbp has interests in five offshore oil blocks with Kosmos Energy (KE) under agreements with the government of Côte d'Ivoire and the state oil company Société Nationale d'Operations Pétrolières de la Côte d'Ivoire (PETROCI) (BP(bp 45%). Seismic reprocessing and interpretation are ongoing and are expected to be completed by the end of 2020. In Egypt, BPbp and its partners currently produce 60% of Egypt’s gas production. In February 2019 production started at•During the Gizayear, exploration write-offs of $952 million were recognized in relation to certain assets in Egypt following management's re-assessment of expectations to extract value from certain exploration prospects as a result of a review of the group's long-term strategic plan and Fayoum fieldschanges in the West Nile Delta development (BP 82.75%group's long-term price assumptions.
•In July, bp confirmed the Bashrush gas discovery, located offshore Egypt in the North El Hammad concession (bp 37.5%). In March 2019 BP•On 16 September, bp confirmed a gas discovery with the Nidoco NW-1 exploratory well in the ENI operated Nour North SinaiAbu Madi West development lease, offshore prospect (BPEgypt (bp 25%) in the Egyptian Eastern Mediterranean. Technical studies are currently being progressed by the operator..
In June BP•On 26 October bp announced an agreement to sell its interests in Gulf of Suez oil concessions in Egypt, including BP’s interest in the Gulf of Suez Production Company (GUPCO), to Dragon Oil. The agreement, completed in October 2019.
In September BP confirmed the start-up of gas production from the offshore Baltim South WestQattameya gas field in Egypt (BP 50%the North Damietta offshore concession (bp 100%). Qattameya, whose discovery was announced in 2017, is located approximately 45 km west of the Ha’py platform and is tied back to the Ha’py and Tuart field development via a new 50km pipeline.
•Work continues aton the West Nile Delta Raven project which(BP 82.75%) is mechanicallyalmost complete, and currently addressing issues identified during commissioning. Startwith start up is now expected in the second halffirst quarter of 2020.2021. Raven is the third project in North Alexandria and West Mediterranean deepwater offshore blocks. In the Gambia, BPbp has a 90% interest in offshore block A1 with the state oil company, Gambia National Petroleum Corporation. An exploration well is expected to be drilled during the first two years of the licence. In Libya, BPbp partners with the Libyan Investment Authority (LIA) in an exploration and production-sharingproduction sharing agreement (EPSA) to explore acreage in the onshore Ghadames and offshore Sirt basins (BP(bp 85%). BPbp wrote off all balances associated with the Libya EPSA in 2015. BP,•bp, LIA and Eni continue to work with the NOC towards Eni acquiring a 42.5% interest in the BP-operatedbp-operated EPSA in Libya. On completion, Eni would become operator of the EPSA. The companies are continuing to work together to finalize and complete all agreements.
In Mauritania and Senegal, BPbp has a 62% participating interest in the C6, C8, C12 and C13 exploration blocks in Mauritania and a 60% participating interest in the Cayar Profond Offshore and St Louis Profond OfshoreOffshore exploration blocks in Senegal. We relinquished our interest in the C6 exploration block in October. Together thesethe remaining blocks cover approximately 24,30019,700 square kilometres. BP also had a 15% interest in the Total operated C18 exploration block until exit in May 2019. For the Greater Tortue Ahmeyin (GTA) Unit across the border of Mauritania and Senegal, BPbp has a 56% participating interest. The Phase 1 Executeconstruction activity has continuedfor the GTA major project« was severely affected by COVID-19 and the 2020 weather window for installation works was not met resulting in a delay to rampstart up followingof around one year. A force majeure (FM) notice was issued under the exploitation license grantlease and operate agreement with Golar LNG over the provision of a floating liquified natural gas vessel, where due to the FM event the lessee was not able to meet the connection date. On 1 October, bp confirmed force majeure was lifted on 20th February 2019.the project. In July BP confirmed that•During the GTA-1 (BP 56%first quarter, bp executed a gas sale and operator) appraisal well, located offshore Senegal, encountered approximately 30 metres of net gas pay in high-quality Albian reservoir confirming gas resource expectations.
In September BP confirmed the Yakaar-2 appraisal wellpurchase agreement with partners in the Cayar Profond block (BP 60%Greater Tortue Ahmeyim (GTA) project.
•During the year, impairment charges and Operator), located offshore Senegal, encountered approximately 22 metresan exploration write-off totalling $2,260 million were recognized in respect of net gas paycertain assets in the reservoir confirming gas resource. In December BP confirmed the successfulregion, primarily as a result of changes to the Orca-1 appraisal well located in block C8 (BP 62% and operator) in the Bir Allah appraisal area offshore Mauritania. The well successfully encountered all five of the gas sands originally targeted. The well
was then further deepened to reach an additional target, which also encountered gas.group's long-term price assumptions.
In Madagascar, BP hasduring the second quarter, following management's re-assessment of expectations to extract value from certain exploration prospects as a result of a review of the group's long-term strategic plan and changes in the group's long-term price assumptions, bp relinquished its interest in fourthree PSCs (the fourth was relinquished in February 2020) for exploration licences situated offshore northwest Madagascar, under agreements with the government of Madagascar represented by Office des Mines Nationales et des Industries Stratégiques (OMNIS) (BP(bp 100%). A baseline monitoring survey is underway as part of Phase 1 of the exploration period. In São Tomé & Príncipe, BPbp is operator in two offshore blocks under PSAs with Shell who acquired the interests of KE in December 2020, and the state oil company Agencia Nacional do Petroleo (BP(bp 50%). Following the acquisition and analysis of baseline environmental data, seismic acquisition is ongoing and expected to be completed by mid-2020. Asia BPbp has activities in Abu Dhabi, Azerbaijan, China, India, Indonesia, Iraq, Kuwait, Oman and Russia.
In China we have a 30% equity stake in the Guangdong LNG regasification terminal and trunkline project with a total storage capacity of 640,000 cubic metres. The project is supplied under a long-term contract with Australia’s North West Shelf venture (BP(bp 16.67%). In the first quarter of 2019 BP relinquished its interest in its two PSCs for shale gas exploration, development and production in the Neijiang-Dazu block and Rong Chang Bei block in the Sichuan basin, resulting in a $141m exploration write-off. Exit was fully completed in the fourth quarter of 2019 when a termination agreement was formally executed with CNPC. In Azerbaijan, BPbp operates two PSAs, Azeri-Chirag-Gunashli (ACG) (BP(bp 30.37%) and Shah Deniz (BP(bp 28.83%) and also holds a number of other exploration leases.
•Naftiran Intertrade Co Ltd (NICO), a subsidiary of the National Iranian Oil Company, holds a 10% interest in the Shah Deniz joint venture. For information on the exclusion of this project from EU and US trade sanctions, or exemptions from such trade sanctions in relation to this project, see International trade sanctions on page 320. 325.•During the year, impairment charges of $537 million were recognized in respect of certain assets in the region, primarily as a result of changes to the group's long-term price assumptions. •In April a final investment decision was madeJanuary 2020 bp announced that drilling of the first well on the Azeri Central East (ACE) project, the next stageShafag-Asiman offshore block had commenced. The drilling of the Azeri-Chirag-Deepwater Gunashli (ACG) field. The $6 billion development includes a new offshore platformSAX01 well continued in 2020 and facilities designedwe expect it to process up to 100,000 barrelsreach the target depth in the first half of oil per day. The project is expected to achieve first production in 2023.2021. BPbp holds a 30.1% interest in and operates the Baku-Tbilisi-Ceyhan oil pipeline. The 1,768-kilometre pipeline transports oil from the BP-operatedbp-operated ACG oilfield and gas condensate from the Shah Deniz gas field in the Caspian Sea, along with other third-party oil, to the eastern Mediterranean port of Ceyhan. The pipeline has a capacity of 1mmboe/d, with an average throughput in 20192020 of 643mboe/570mboe/d.
BPbp (as operator of Azerbaijan International Operating Company) also operates the Western Route Export Pipeline that transports ACG oil to Supsa on the Black Sea coast of Georgia, with an average throughput of 76mboe/85mboe/d in 2019.2020.
BP is technical operator of, and currentlybp holds a 28.83% interest in and performs some operations for the 693 kilometre South Caucasus Pipeline. The pipeline takes gas from Azerbaijan through Georgia to the Turkish border and has a capacity of 440mboe/d (including expansion), with average throughput in 20192020 of 177mboe/210mboe/d.
BPbp also holds a 12% interest in the Trans Anatolian Natural Gas Pipeline.Pipeline (TANAP). In the first phase, which commenced in 2018, gas from Shah Deniz is transported from Georgia to EskishehirEskisehir in Turkey. The capacity of the pipeline during the first phase is 100mboe/d and the average throughput in 20192020 was 47mboe/80mboe/d. The second phase will taketakes gas from Eskishehirfurther to theTANAP's connection with the Trans Adriatic Pipeline (TAP) in Greece. BPat the Turkey-Greece border. bp has a 20% interest in TAP, that will taketakes gas through Greece and Albania into Italy. Commercial deliveries of gas via TAP commenced at the end of 2020.
In Oman BPbp operates Block 61, the Khazzanlargest tight gas« development in the Middle East (bp 60%), and is a 50% owner in Block 77. •The Block 77 Exploration and PSA was approved by Royal Decree in the first quarter of 2020, with a plan to process seismic and drill one exploration well within the next three years. ENI (50%) is operator during the exploration phase and bp will be the operator of any potential development. •On 12 October, bp announced production had begun from the Block 61 Phase 2 Ghazeer gas field, around 33 months after bp and its partners approved the development. bp brought the project online ahead of the original planned start-up in early 2021, and under budget. •On 1 February 2021 bp announced that it had agreed to sell a 20% participating interest in Block 61 (BP 60%). Progress on the Ghazeer project, phase two of the Khazzan development, is on track for first gas in 2021.to PTT Exploration and Production
| | | | | | | | | | | | | | | | 310 | BP
| bp Annual Report and Form 20-F 20192020 | | «See Glossary | | 305 |
In July BP and Eni signed an EPSAPublic Company Limited (PTTEP) of Thailand for Block 77 (BP 50%) in central Oman with the Ministrya total consideration of Oil and Gas$2.6 billion. Following completion of the Sultanate of Oman. Approval bysale, which is subject to Royal Decree, is still pending.bp will remain operator of the block with a 40% interest.
In Abu Dhabi, BPbp holds a 10% interest in the ADNOC Onshore concession. We also have a 10% equity shareholding in ADNOC LNG and a 10% shareholding in the shipping company NGSCO. ADNOC LNG supplied approximately 65.69 million tonnes of LNG (0.786bcfed(0.748bcfe/d regasified) in 2019.2020. Our interest in the ADNOC Onshore concession expires at the end of 2054. In March 2019 ADNOC and ADNOC LNG agreed to extend the gas supply agreement to 2040. The new agreement took effect from 1 April 2019, and replaced an existing agreement which expired on 31 March 2019. Also in March 2019 ADNOC LNG and NGSCO agreed to extend the transportation agreements and the shipping services agreement to 2022. The new agreements took effect from 1 April 2019, and replaced an existing agreement which expired on 31 March 2019.
In 2016 BPbp signed an enhanced technical service agreement for south and east Kuwait conventional oilfields, which includes the Burgan field, with Kuwait Oil Company. Target performance forDelivery of the 2018-192019-2020 plan was deliveredabove target performance and implementation of the 2019-202020-21 plan is underway.
In India we have a participating interest in two oil and gas PSAs (KG D6 33.33% and NEC25 33.33%), and one oil and gas block under a Revenue Sharing Contract (KG-UDWHP-2018/1)1 40%), all operated by Reliance Industries Limited (RIL). We also have a 50% stake in a 50:50 joint venture (IndiaIndia Gas Solutions Private Limited)Limited, a joint venture with RIL, for the sourcing and marketing of gas in India. In June BP•On 3 February, bp and RIL confirmed that they had completed the safe cessation of production in a planned manner, from the D1 D3 field in Block KG D6, off the east coast of India (bp 33.33%).
•During the year, impairment charges of $1,313 million were recognized in respect of certain assets in India, primarily as a result of changes to the group's long-term price assumptions. •Also during the year, exploration write-offs of $333 million were recognized in relation to certain assets in India following management's re-assessment of expectations to extract value from certain exploration prospects as a result of a review of the group's long-term strategic plan and changes in the group's long-term price assumptions. •On 18 December, bp and RIL announced the sanctionstart of gas production from R-Series, the first of the MJ gas development project (also known as D55)three projects in Block KG D6, offshore the east coast of India. MJ is the third of three newD6. The other two projects in the Block KG D6 integrated development plan. All three KG D6 Projects (R-Series, Satellites(Satellites Cluster and MJ) are under development with first gas production phased over 2020-2022. R-Series,2021-2022.
In Indonesia bp successfully completed the firstpurchase of the three projects, is expected to begin production in 2020. BP and its partner RIL have been awarded the ultra deep-water Block KG-UDWHP-2018/1 (RIL operator 60%, BP 40%) adjacent to Block KG D6 in India’s Open Acreage Licensing Policy round 2 and both RIL and BP have entered into a Revenue Sharing Contract with the Government of India (GoI).
Pursuant to government approval, Niko (NECO) Limited’s 10% participating30% non-operated working interest in Block KG D6 has been assigned to BP and RIL proportionatelythe Andaman II PSC from KrisEnergy in April. Andaman II is a deep-water block covering 7,400 square kilometres area in the ratio of their existing interests (RIL 6.67%North Sumatra basin, offshore from Aceh. Other interest holders are Premier Oil (40%, BP 3.33%), in compliance with the PSCoperator) and JOA requirements.Mubadala Petroleum (30%).
In Iraq BPbp holds a 47.6% working interest and is the lead contractor in the Rumaila technical service contract in southern Iraq. The technical services contract runs to December 2034. Rumaila is one of the world’s largest oil fields, comprising five producing reservoirs. BP'sbp's activities have not been materially impacted by the continued political instability and public protests which have occurred in 2019.2020. In Russia in addition to its 19.75% equity interest in Rosneft BPas detailed on page 320, bp holds a 20% interest in Taas-Yuryakh Neftegazodobycha (Taas) together with Rosneft (50.1%) and a consortium comprising Oil India Limited, Indian Oil Corporation Limited and Bharat PetroResources Limited (29.9%). Taas is developing the Srednebotuobinskoye oil and gas condensate field in East Siberia. Also with Rosneft, we hold a 49% interest in Kharampurneftegaz LLC (Kharampur) to develop subsoil resources within the Kharampurskoe and Festivalnoye licence areas in Yamalo-Nenets. Rosneft (51%) and BPbp (49%) jointly own Yermak Neftegaz LLC (Yermak), which conducts onshore exploration in the West Siberian and Yenisei-Khatanga basins and currently holds fivesix exploration and production licences. See Rosneft on page 61 for further details. In April•During the right to explore two additional oilyear bp received $86 million of dividends net of withholding taxes and gas licence areas located$51 million of distribution of paid in Sakha (Yakutia) was transferred to a Yermak wholly owned subsidiary.capital from Taas.
Australasia BPbp has activities in Australia and Eastern Indonesia.
In Australia BPbp is one of seven participants in the North West Shelf (NWS) venture, which has been producing LNG, pipeline gas, condensate, LPG and oil since the 1980s. Six partners (including BP)bp) hold an equal 16.67% interest in the gas infrastructure and an equal 15.78% interest in the gas and condensate reserves, with a seventh partner owning the remaining 5.32%. BPbp also has a 16.67% interest in some of the NWS oil reserves and related infrastructure. The NWS venture is currently the largest single source supplier to the domestic market in Western Australia and one of the largest LNG export projects in the region, with five LNG trains in operation. BP’sbp’s net share of the capacity of NWS LNG trains 1-5 is 2.7 million tonnes of LNG per year. BPbp is also one of five participants in the Browse LNG venture (operated by Woodside) and holds a 17.33% interest.
•The Browse joint venture participants are progressingcontinue to progress the development of Browse by connecting it via a 900km pipeline to the NWS Venture's Karratha Gas Plant. A final investment decision is expected in late 2021. During the second quarter BP achieved new access with a farm-in to an exploration permit WA-359-P offshore Western Australia (BP 42.5% and operator).
In September BP confirmed the award of the WA-541 acreage permit in Western Australia’s offshore Northern Carnarvon basin (BP 50%).
In Papua Barat, Eastern Indonesia, BPbp operates the Tangguh LNG plant (BP(bp 40.22%). The asset currently comprises 16 producing wells, two offshore platforms, two pipelines and an LNG plant with two production trains. It has a total capacity of 7.6 million tonnes of LNG per annum. Tangguh supplies LNG to customers in Indonesia, Mexico, China, South Korea, and Japan through a combination of long, medium and short-term contracts. The Tangguh expansion project comprises a third LNG processing train, two offshore platforms, 1310 new production wells, an expanded LNG loading facility, and supporting infrastructure. The project will add 3.8 million tonnes per annum (mtpa) of production capacity to the existing facility, bringing total plant capacity to 11.4mtpa. The installation of offshore platformsDue to COVID-19 and pipelines has completed while the multi-year drilling campaign continues afterneed to relocate personnel from the completion ofremote project, the first production well. The construction of the LNG processing trainstart-up is in progress with expected start-up in 2021.to be delayed to 2022. .
| | | | | | | | | | | | | | | 306 | | «See Glossary | BP
| bp Annual Report and Form 20-F 20192020 | | 311 |
Downstream plant capacity
The following tablea summarizes BP group’s interests in refineries and average daily crude distillation capacities as at 31 December 2019.
| | | | | | | | | | | | | | Crude distillation capacitiesbc | | | Fuels value chain | Country | Refinery | | Group interestd (%) |
| BP share thousand barrels per day |
| | US | | | | | | | US North West | US | Cherry Point | | 100 |
| 251 |
| | US East of Rockies | | Whiting | | 100 |
| 440 |
| | | | Toledo | | 50 |
| 80 |
| | | | | | | 771 |
| | Europe | | | | | | | Rhine | Germany | Gelsenkirchen | | 100 |
| 265 |
| | | | Lingen | | 100 |
| 97 |
| | | Netherlands | Rotterdam | | 100 |
| 387 |
| | Iberia | Spain | Castellón | | 100 |
| 110 |
| | | | | | | 859 |
| | Rest of world | | | | | | | Australia | Australia | Kwinana | | 100 |
| 152 |
| | New Zealand | New Zealand | Whangareief | | 10.1 |
| 34 |
| | Southern Africa | South Africa | Durbane | | 50 |
| 90 |
| | | | | | | 276 |
| | Total BP share of capacity at 31 December 2019 | | | 1,906 |
|
a This does not include BP’s interest in Pan American Energy Group.
b Crude distillation capacity is gross rated capacity, which is defined as the highest average sustained unit rate for a consecutive 30-day period under normal operational conditions.
c On 31 December 2019 we completed the sale of our interest in the German Bayernoil refinery.
d BP share of equity, which is not necessarily the same as BP share of processing entitlements.
e Indicates refineries not operated by BP.
f Reflects BP share of processing entitlement, which is not the same as BP share of equity.
Petrochemicals production capacitya
The following table summarizes BP group’s share of petrochemicals production capacities as at 31 December 2019.
| | | | | | | | | | | | | | | | | | | | | | | BP share of capacity thousand tonnes per annumb | | | | | | | | Product |
| | Geographical area | Site | Group interestc (%) |
| | PTA |
| PX |
| Acetic acid |
| Olefins and derivatives |
| Others |
| | US | | | | | | | | | | | Cooper River | 100 |
| | 1,400 |
| — |
| — |
| — |
| — |
| | | Texas Cityd | 100 |
| | — |
| 900 |
| 600 |
| — |
| 100 |
| | | | | | 1,400 |
| 900 |
| 600 |
| — |
| 100 |
| | Europe | | | | | | | | | | UK | Hull | 100 |
| | — |
| — |
| 500 |
| — |
| 200 |
| | Belgium | Geel | 100 |
| | 1,400 |
| 700 |
| — |
| — |
| — |
| | Germany | Gelsenkirchene | 100 |
| | — |
| — |
| — |
| 3,300 |
| — |
| | | Mülheime | 100 |
| | — |
| — |
| — |
| — |
| 200 |
| | | | | | 1,400 |
| 700 |
| 500 |
| 3,300 |
| 400 |
| | Rest of world | | | | | | | | | | Trinidad & Tobago | Point Lisas | 36.9 |
| | — |
| — |
| — |
| — |
| 700 |
| | China | Chongqing | 51 |
| | — |
| — |
| 200 |
| — |
| 100 |
| | | Nanjing | 50 |
| | — |
| — |
| 300 |
| — |
| — |
| | | Zhuhaif | 91.9 |
| | 2,500 |
| — |
| — |
| — |
| — |
| | Indonesia | Merak | 100 |
| | 500 |
| — |
| — |
| — |
| — |
| | South Korea | Ulsang | 34-51 |
| | — |
| — |
| 300 |
| — |
| 100 |
| | Malaysia | Kertih | 70 |
| | — |
| — |
| 400 |
| — |
| — |
| | Taiwan | Mai Liao | 50 |
| | — |
| — |
| 200 |
| — |
| — |
| | | Taichung | 61.4 |
| | 500 |
| — |
| — |
| — |
| — |
| | | | | | 3,500 |
| — |
| 1,400 |
| — |
| 900 |
| | | | | | 6,300 |
| 1,600 |
| 2,500 |
| 3,300 |
| 1,400 |
| | Total BP share of capacity at 31 December 2019 | | | |
|
| 15,100 |
|
| | a
| Petrochemicals production capacity is the proven maximum sustainable daily rate (MSDR) multiplied by the number of days in the respective period, where MSDR is the highest average daily rate ever achieved over a sustained period. |
| | b
| Capacities are shown to the nearest hundred thousand tonnes per annum. |
| | c
| Includes BP share of non-operated equity-accounted entities, as indicated. |
| | d
| For acetic acid, group interest is quoted at 100%, reflecting the capacity entitlement which is marketed by BP. |
| | e
| Due to the integrated nature of these plants with our Gelsenkirchen refinery, the income and expenditure of these plants is managed and reported through the fuels business. |
| | f
| BP Zhuhai Chemical Company Ltd is a subsidiary«of BP, the capacity of which is shown above at 100%.
|
| | g
| Group interest varies by product. |
| | | | | | | BP Annual Report and Form 20-F 2019
| «See Glossary
| | 307 |
Oil and natural gas disclosures for the group Resource progression BPbp manages its hydrocarbon resources in three major categories: prospect inventory, contingent resources and reserves. When a discovery is made, volumes usually transfer from the prospect inventory to the contingent resources category. The contingent resources move through various sub-categories as their technical and commercial maturity increases through appraisal activity.
At the point of final investment decision, most proved reserves will be categorized as proved undeveloped (PUD). Volumes will subsequently be recategorized from PUD to proved developed (PD) as a consequence of development activity. When part of a well’s proved reserves depends on a later phase of activity, only that portion of proved reserves associated with existing, available facilities and infrastructure moves to PD. The first PD bookings will typically occur at the point of first oil or gas production. Major development projects typically take one to five years from the time of initial booking of PUD to the start of production. Changes to proved reserves bookings may be made due to analysis of new or existing data concerning production, reservoir performance, commercial factors and additional reservoir development activity. Volumes can also be added or removed from our portfolio through acquisition or divestment of properties and projects. When we dispose of an interest in a property or project, the volumes associated with our adopted plan of development for which we have a final investment decision will be removed from our proved reserves upon completion of the transaction. When we acquire an interest in a property or project, the volumes associated with the existing development and any committed projects will be added to our proved reserves if BPbp has made a final investment decision and they satisfy the SEC’s criteria for attribution of proved status. Following the acquisition, additional volumes may be progressed to proved reserves from non-proved reserves or contingent resources. Non-proved reserves and contingent resources in a field will only be recategorized as proved reserves when all the criteria for attribution of proved status have been met and the volumes are included in the business plan and scheduled for development, typically within five years. BPbp will only book proved reserves where development is scheduled to commence after more than five years, if these proved reserves satisfy the SEC’s criteria for attribution of proved status and BPbp management has reasonable certainty that these proved reserves will be produced. At the end of 2019 BP2020 bp had material volumes of proved undeveloped reserves held for more than five years in Russia, Trinidad, Gulf of Mexico, Azerbaijan, Indonesia and the North Sea. These are part of ongoing infrastructure-led development activities for which BPbp has a historical track record of completing comparable projects in these countries. We have no proved undeveloped reserves held for more than five years in our onshore US developments. In each case the volumes are being progressed as part of an adopted development plan where there are physical limits to the development timing such as infrastructure limitations, contractual limits including gas delivery commitments, late life compression and the complex nature of working in remote locations, or where there are significant commitments on delivery to the relevant authority. Over the past five years, BPbp has annually progressed a weighted average 19%17% (19% for 20182019 five-year average) of our group proved undeveloped reserves (including the impact of disposals and price acceleration effects in PSAs) to proved developed reserves. This equates to a turnover time of less than five and a halfsix years. We expect the turnover time to remain near this level and anticipate the volume of proved undeveloped reserves held for more than five years to remain about the same. Proved reserves as estimated at the end of 20192020 meet BP’sbp’s criteria for project sanctioning and SEC tests for proved reserves. We have not halted or changed our commitment to proceed with any material project to which proved undeveloped reserves have been attributed. In 20192020 we progressed 1,328mmboe897 mmboe of proved undeveloped reserves (561mmboe(512 mmboe for our subsidiaries« alone) to proved developed reserves through ongoing investment in our subsidiaries’ and equity-accounted entities’ upstream development activities. Total development expenditure, excluding midstream activities, was $15,206$11,041 million in 20192020 ($10,8157,650 million for subsidiaries and $4,391$3,391 million for equity-accounted entities). The major areas with progressed volumes in 20192020 were Russia, US, Trinidad, Egypt Azerbaijan, Argentina, Oman and UAE.Oman. Revisions of previous estimates for proved undeveloped reserves are due to changes relating to field performance, well results or changes in commercial conditions including price impacts. There were material net negative revisions in the US Lower 48 due to reducing price impacts and changes in our development plan to incorporate activity associated with the purchase of new assets partially offset by material net positive revisions to our proved undeveloped resources in Russia as a result of development drilling results. The following tables describe the changes to our proved undeveloped reserves position through the year for our subsidiaries and equity-accounted entities and for our subsidiaries alone. | | | | | | | Subsidiaries and equity-accounted entities | volumes in mmboea |
| Proved undeveloped reserves at 1 January 20192020 | 8,9088,152 |
| | Revisions of previous estimates | (320298 | ) | | Improved recovery | 316133 |
| | Discoveries and extensions | 563436 |
| | Purchases | 17442 |
| | Sales | (35(940) | ) | | Total in year proved undeveloped reserves changes | 541369 |
| | Proved developed reserves reclassified as undeveloped | 31247 |
| | Progressed to proved developed reserves by development activities (e.g. drilling/completion) | (1,328(897) | ) | Proved undeveloped reserves at 31 December 20192020 | 8,1527,871 |
| | | | Subsidiaries only | volumes in mmboea |
| Proved undeveloped reserves at 1 January 20192020 | 4,4473,771 |
| | Revisions of previous estimates | (54542 | ) | | Improved recovery | 309122 |
| | Discoveries and extensions | 13084 |
| | Purchases | 10— |
| | Sales | (29(8) | ) | | Total in year proved undeveloped reserves changes | (127240 | ) | | Proved developed reserves reclassified as undeveloped | 13173 |
| | Progressed to proved developed reserves by development activities (e.g. drilling/completion) | (561(512) | ) | Proved undeveloped reserves at 31 December 20192020 | 3,7713,673 |
|
| | a
| Because of rounding, some totals may not agree exactly with the sum of their component parts. |
a Because of rounding, some totals may not agree exactly with the sum of their component parts.
BP
bp bases its proved reserves estimates on the requirement of reasonable certainty with rigorous technical and commercial assessments based on conventional industry practice and regulatory requirements. BPbp only applies technologies that have been field tested and have been demonstrated to provide reasonably certain results with consistency and repeatability in the formation being evaluated or in an analogous formation. BPbp applies high-resolution seismic data for the identification of reservoir extent and fluid contacts only where there is an overwhelming track record of success in its local application. In certain cases BPbp uses numerical simulation as part of a holistic assessment of recovery factor for its fields, where these simulations have been field tested and have been demonstrated to provide reasonably certain results with consistency and repeatability in the formation being evaluated or in an analogous formation. In certain deepwater fields BPbp has booked proved reserves before production flow tests are conducted, in part because of the significant safety, cost and environmental implications of conducting these tests. The industry has made substantial technological improvements in understanding, measuring and delineating reservoir properties without the need for flow tests. To determine reasonable
| | | | | | 308 | | «See Glossary
| BP Annual Report and Form 20-F 2019
| |
certainty of commercial recovery, BPbp employs a general method of reserves assessment that relies on the integration of three types of data: •well data used to assess the local characteristics and conditions of reservoirs and fluids •field scale seismic data to allow the interpolation and extrapolation of these characteristics outside the immediate area of the local well control •data from relevant analogous fields. Well data includes appraisal wells or sidetrack holes, full logging suites, core data and fluid samples. BPbp considers the integration of this data in certain cases to be superior to a flow test in providing understanding of overall reservoir performance. The collection of data from logs, cores, wireline formation testers, pressures and fluid samples calibrated to each other and to the seismic data can allow reservoir properties to be | | | | | | | | | | | | | | | | 312 | | bp Annual Report and Form 20-F 2020 | | «See Glossary |
determined over a greater volume than the localized volume of investigation associated with a short-term flow test. There is a strong track record of proved reserves recorded using these methods, validated by actual production levels. Governance BP’sbp’s centrally controlled process for proved reserves estimation approval forms part of a holistic and integrated system of internal control. It consists of the following elements:
•Accountabilities of certain officers of the group to ensure that there is review and approval of proved reserves bookings independent of the operating business and that there are effective controls in the approval process and verification that the proved reserves estimates and the related financial impacts are reported in a timely manner. •Capital allocation processes, whereby delegated authority is exercised to commit to capital projects that are consistent with the delivery of the group’s business plan. A formal review process exists to ensure that both technical and commercial criteria are met prior to the commitment of capital to projects. •Group audit, whose role is to consider whether the group’s system of internal control is adequately designed and operating effectively to respond appropriately to the risks that are significant to BP.bp. •Approval hierarchy, whereby proved reserves changes above certain threshold volumes require immediate review and all proved reserves require annual central authorization and have scheduled periodic reviews. The frequency of periodic review ensures that 100% of the BPbp proved reserves base undergoes central review every three years. BP’sbp’s vice president of segment reserves is the petroleum engineerindividual primarily responsible for overseeing the preparation of the reserves estimate. He has more than 3527 years of diversified industry experience in reserves estimation with 14the past 2 years spent managing the governance and compliance of BP’s reserves estimation.compliance. He is a past memberChairman of the Society of Petroleum Engineers Oil(Russia & Caspian) and Gas Reserves Committee and of the American Association of Petroleum Geologists Committee on Resource Evaluation and is the current chair of the bureaua member of the United Nations Economic Commission for Europe Expert Group on Resource Management.
No specific portion of compensation bonuses for senior management is directly related to proved reserves targets. Additions to proved reserves is one of several indicators by which the performance of the Upstream segment is assessed by the remuneration committee for the purposes of determining compensation bonuses for the executive directors. Other indicators include a number of financial and operational measures. BP’sbp’s variable pay programme for the other senior managers in the Upstream segment is based on individual performance contracts. Individual performance contracts are based on agreed items from the business performance plan, one of which, if chosen, could relate to proved reserves.
Compliance International Financial Reporting Standards (IFRS) do not provide specific guidance on reserves disclosures. BPbp estimates proved reserves in accordance with SEC Rule 4-10 (a) of Regulation S-X and relevant Compliance and Disclosure Interpretations (C&DI) and Staff Accounting Bulletins as issued by the SEC staff. By their nature, there is always some risk involved in the ultimate development and production of proved reserves including, but not limited to: final regulatory approval; the installation of new or additional infrastructure, as well as changes in oil and gas prices; changes in operating and development costs; and the continued availability of additional development capital. All the group’s proved reserves held in subsidiaries and equity-accounted entities are estimated by the group’s petroleum engineers or by independent petroleum engineering consulting firms and then assured by the group’s petroleum engineers. DeGolyer & MacNaughton (D&M), an independent petroleum engineering consulting firm, has estimated the net proved crude oil, condensate, natural gas liquids (NGLs) and natural gas reserves, as of 31 December 2019,2020, of certain properties owned by Rosneft as part of our equity-accounted proved reserves. The properties evaluated by D&M account for 100% of Rosneft’s net proved reserves as of 31 December 2019.2020. The net proved reserves estimates prepared by D&M were prepared in accordance with the reserves definitions of Rule 4-10(a)(1)-(32) of Regulation S-X. All reserves estimates involve some degree of uncertainty. BPbp has filed D&M’s independent report on its reserves estimates as an exhibit to this Annual Report on Form 20-F filed with the SEC. Netherland, Sewell & Associates (NSAI), an independent petroleum engineering consulting firm, has estimated the net proved crude oil, condensate, natural gas liquids (NGLs) and natural gas reserves, as of 31 December 2019,2020, of certain properties owned by BPbp in the US Lower 48. The properties evaluated by NSAI account for 100% of BP’sbp’s net proved reserves in the US Lower 48 as of 31 December 2019.2020. The net proved reserves estimates prepared by NSAI were prepared in accordance with the reserves definitions of Rule 4-10(a)(1)-(32) of Regulation S-X. All reserves estimates involve some degree of uncertainty. BPbp has filed NSAI’s independent report on its reserves estimates as an exhibit to this Annual Report on Form 20-F filed with the SEC. Our proved reserves are associated with both concessions (tax and royalty arrangements) and agreements where the group is exposed to the upstream risks and rewards of ownership, but where our entitlement to the hydrocarbons« is calculated using a more complex formula, such as with PSAs. In a concession, the consortium of which we are a part is entitled to the proved reserves that can be produced over the licence period, which may be the life of the field. In a PSA, we are entitled to recover volumes that equate to costs incurred to develop and produce the proved reserves and an agreed share of the remaining volumes or the economic equivalent. As part of our entitlement is driven by the monetary amount of costs to be recovered, price fluctuations will have an impact on both production volumes and reserves. We disclose our share of proved reserves held in equity-accounted entities (joint ventures« and associates«), although we do not control these entities or the assets held by such entities. BP’sbp’s estimated net proved reserves and proved reserves replacement
91%92% of our total proved reserves of subsidiaries at 31 December 20192020 were held through joint operations«(89% (91% in 2018)2019), and 28%31% of the proved reserves were held through such joint operations where we were not the operator (34%(28% in 2018)2019).
| | | | | | | BP Annual Report and Form 20-F 2019
| «See Glossary
| | 309 |
Estimated net proved reserves of crude oil at 31 December 20192020a b c | | | | | | | | | | | | | | million barrels | | Developed | Undeveloped | Total | | UK | 162 | | 148 | | 309 | | | | | | USd | 697 | | 742 | | 1,438 | | Rest of North Americad | 37 | | 195 | | 232 | | South Americae | 8 | | 9 | | 16 | | | Africa | 116 | | 21 | | 137 | | | Rest of Asia | 1,100 | | 547 | | 1,647 | | | Australasia | 34 | | 5 | | 38 | | | Subsidiaries | 2,154 | | 1,666 | | 3,819 | | | Equity-accounted entities | 3,517 | | 2,776 | | 6,293 | | | Total | 5,671 | | 4,441 | | 10,112 | |
| | | | | | | | | | | million barrels | | | | Developed | Undeveloped |
| Total |
| | UK | 206 |
| 200 |
| 406 |
| USd | 1,063 |
| 842 |
| 1,905 |
| Rest of North Americae | 40 |
| 179 |
| 218 |
| South Americaf | 7 |
| 5 |
| 12 |
| | Africa | 156 |
| 40 |
| 196 |
| | Rest of Asia | 1,074 |
| 525 |
| 1,599 |
| | Australasia | 26 |
| 4 |
| 30 |
| | Subsidiaries | 2,572 |
| 1,794 |
| 4,367 |
| | Equity-accounted entities | 3,567 |
| 2,847 |
| 6,415 |
| | Total | 6,140 |
| 4,642 |
| 10,781 |
|
Estimated net proved reserves of natural gas liquids at 31 December 20192020a b | | | | | | | | | | | | | | million barrels | | Developed | Undeveloped | Total | | UK | 7 | | — | | 7 | | | | | | | US | 115 | | 218 | | 333 | | | Rest of North America | — | | — | | — | | | South America | 2 | | 19 | | 21 | | | Africa | 13 | | 1 | | 14 | | | Rest of Asia | — | | — | | — | | | Australasia | 2 | | — | | 2 | | | Subsidiaries | 139 | | 237 | | 376 | | | Equity-accounted entities | 129 | | 44 | | 172 | | | Total | 268 | | 281 | | 549 | |
| | | | | | | | | | | million barrels | | | | Developed | Undeveloped |
| Total |
| | UK | 8 |
| 5 |
| 13 |
| | US | 229 |
| 250 |
| 479 |
| | Rest of North America | — |
| — |
| — |
| | South America | 2 |
| 21 |
| 23 |
| | Africa | 12 |
| 4 |
| 16 |
| | Rest of Asia | — |
| — |
| — |
| | Australasia | 4 |
| — |
| 4 |
| | Subsidiaries | 255 |
| 280 |
| 535 |
| | Equity-accounted entities | 107 |
| 55 |
| 162 |
| | Total | 363 |
| 334 |
| 697 |
|
| | | | | | | | | | | | | | | «See Glossary | | bp Annual Report and Form 20-F 2020 | | 313 |
Estimated net proved reserves of liquids« | | | | | | | | | | | | | | million barrels | | Developed | Undeveloped | Total | Subsidiariese | 2,293 | | 1,903 | | 4,196 | | Equity-accounted entitiesf | 3,645 | | 2,819 | | 6,465 | | | Total | 5,938 | | 4,722 | | 10,661 | |
| | | | | | | | | | | million barrels | | | | Developed | Undeveloped |
| Total |
| Subsidiariesf | 2,828 |
| 2,074 |
| 4,902 |
| Equity-accounted entitiesg | 3,675 |
| 2,902 |
| 6,576 |
| | Total | 6,502 |
| 4,976 |
| 11,478 |
|
Estimated net proved reserves of natural gas at 31 December 20192020a b | | | | | | | | | | | | | billion cubic feet | | Developed | Undeveloped | Total | | UK | 306 | | 51 | | 358 | | | | | | | US | 1,921 | | 3,423 | | 5,344 | | | Rest of North America | — | | — | | — | | South Americag | 1,567 | | 1,964 | | 3,531 | | | Africa | 1,382 | | 158 | | 1,541 | | | Rest of Asia | 3,883 | | 3,641 | | 7,524 | | | Australasia | 2,058 | | 1,029 | | 3,087 | | | Subsidiaries | 11,118 | | 10,267 | | 21,385 | | Equity-accounted entitiesh | 13,088 | | 7,994 | | 21,082 | | | Total | 24,206 | | 18,260 | | 42,467 | |
| | | | | | | | | | billion cubic feet | | | | Developed |
| Undeveloped |
| Total |
| | UK | 493 |
| 207 |
| 700 |
| | US | 6,330 |
| 2,127 |
| 8,458 |
| | Rest of North America | — |
| — |
| — |
| South Americah | 2,192 |
| 2,235 |
| 4,427 |
| | Africa | 1,163 |
| 742 |
| 1,905 |
| | Rest of Asia | 3,667 |
| 3,401 |
| 7,068 |
| | Australasia | 2,256 |
| 1,132 |
| 3,389 |
| | Subsidiaries | 16,101 |
| 9,844 |
| 25,946 |
| Equity-accounted entitiesi | 11,079 |
| 8,576 |
| 19,656 |
| | Total | 27,181 |
| 18,421 |
| 45,601 |
|
Estimated net proved reserves on an oil equivalent basisji | | | | | | | | | | | | | million barrels of oil equivalent | | Developed | Undeveloped | Total | | Subsidiaries | 4,210 | | 3,673 | | 7,883 | | | Equity-accounted entities | 5,902 | | 4,198 | | 10,100 | | | Total | 10,112 | | 7,871 | | 17,982 | |
| | | | | | | | | | million barrels of oil equivalent | | | | Developed | Undeveloped |
| Total |
| | Subsidiaries | 5,604 |
| 3,771 |
| 9,375 |
| | Equity-accounted entities | 5,585 |
| 4,381 |
| 9,965 |
| | Total | 11,189 |
| 8,152 |
| 19,341 |
|
| | a
| Proved reserves exclude royalties due to others, whether payable in cash or in kind, where the royalty owner has a direct interest in the underlying production and the option and ability to make lifting and sales arrangements independently, and include non-controlling interests in consolidated operations. We disclose our share of reserves held in joint ventures and associates that are accounted for by the equity method although we do not control these entities or the assets held by such entities. |
| | b
| The 2019 marker prices used were Brent« $62.74/bbl (2018 $71.43/bbl and 2017 $54.36/bbl) and Henry Hub« $2.58/mmBtu (2018 $3.10/mmBtu and 2017 $2.96/mmBtu).
|
| | d
| Proved reserves in the Prudhoe Bay field in Alaska include an estimated 4.5 million barrels on which a net profits royalty will be payable over the life of the field under the terms of the BP Prudhoe Bay Royalty Trust. |
| | e
| All of the reserves in Canada are bitumen. |
a Proved reserves exclude royalties due to others, whether payable in cash or in kind, where the royalty owner has a direct interest in the underlying production and the option and ability to make lifting and sales arrangements independently, and include non-controlling interests in consolidated operations. We disclose our share of reserves held in joint ventures and associates that are accounted for by the equity method although we do not control these entities or the assets held by such entities.b The 2020 marker prices used were Brent« $41.31/bbl (2019 $62.74/bbl and 2018 $71.43/bbl) and Henry Hub« $1.94/mmBtu (2019 $2.58/mmBtu and 2018 $3.10/mmBtu). | | f
| Includes 11 million barrels of liquids in respect of the 30% non-controlling interest in BP Trinidad and Tobago LLC. |
| | g
| Includes 357 million barrels of liquids in respect of the non-controlling interest in Rosneft held assets in Russia including 26 million barrels held through BP’s interests in Russia other than Rosneft. |
| | h
| Includes 1,330 billion cubic feet of natural gas in respect of the 30% non-controlling interest in BP Trinidad and Tobago LLC. |
| | i
| Includes 1,430 billion cubic feet of natural gas in respect of the non-controlling interest in Rosneft held assets in Russia including 569 billion cubic feet held through BP’s interests in Russia other than Rosneft. |
j cIncludes 982condensate.
d All of the reserves in Canada are bitumen. e Includes 11 million barrels of liquids in respect of the 30% non-controlling interest in BP Trinidad and Tobago LLC. f Includes 405 million barrels in respect of the non-controlling interest in Rosneft, including 19mmboe held through bp’s interests in Russia other than Rosneft. g Includes 1,059 billion cubic feet of natural gas in respect of the 30% non-controlling interest in BP Trinidad and Tobago LLC. h Includes 1,640 billion cubic feet of natural gas in respect of the 10.01% non-controlling interest in Rosneft including 614 billion cubic feet held through bp’s interests in Russia other than Rosneft. i Includes 264 million barrels of oil equivalent associated with Assets heldHeld for saleSale in the US.Oman.
Because of rounding, some totals may not agree exactly with the sum of their component parts.
Proved reserves replacement Total hydrocarbon proved reserves at 31 December 2019,2020, on an oil equivalent basis including equity-accounted entities, decreased by 3% (decrease of 8% for subsidiaries and increase of 2% for equity-accounted entities)7% compared with 31 December 2018.2019. Natural gas represented about 41% (48%(47% for subsidiaries and 34%36% for equity-accounted entities) of these reserves. The change includes a net decrease from acquisitions and disposals of 133mmboe1,069mmboe (decrease of 134mmboe1,072mmboe within our subsidiaries and increase of 1mmboe3mmboe within our equity-accounted entities). Acquisition and divestment activity occurred in our subsidiaries occurredequity-accounted entities in India,Russia, and divestment activity in our subsidiaries in the US and Egypt. There were no material acquisitions or divestments in our equity-accounted entities.including Alaska. The proved reserves replacement ratio« is the extent to which production is replaced by proved reserves additions. This ratio is expressed in oil equivalent terms and includes changes resulting from revisions to previous estimates, improved recovery, and extensions and discoveries. For 2019,2020, the proved reserves replacement ratio excluding acquisitions and disposals was 67% (100%78% (67% in 20182019 and 143%100% in 2017)2018) for subsidiaries and equity-accounted entities, 25%47% for subsidiaries alone and 141%127% for equity-accounted entities alone. There was a net decrease (221mmboe)(373mmboe) of reserves due to lower gas and oil prices mainly within the US, Lower 48 (-206mmboe). The total loss wasNorth Sea and Angola partly offset by increases related to price in reserves insome of our PSAs principally in Azerbaijan, Iraq and Angola.Azerbaijan. In 20192020 net additions to the group’s proved reserves (excluding production and sales and purchases of reserves-in-place) amounted to 939mmboe (230mmboe1,006mmboe (380mmboe for subsidiaries and 709mmboe626mmboe for equity-accounted entities), through revisions to previous estimates including price, improved recovery from, and extensions to, existing fields and discoveries of new fields. The subsidiary additions were through improved recovery from, and extensions to, existing fields and discoveries of new fields where they represented a mixture of proved developed and proved undeveloped reserves. Volumes added in 20192020 principally resulted from the application of conventional technologies and extensions of field size by development drilling. The principal proved reserves additions in our subsidiaries by region were in the US, Oman, UAE, Azerbaijan and India. We had material reductions in our proved reserves in US Lower 48 principally due to lower oil and gas prices.Angola. The principal reserves additions in our equity-accounted entities were in Rosneft and Pan American Energy Group, Rosneft and Kharampurneftegaz LLC.Group. 15%16% of our proved reserves are associated with PSAs. The countries in which we produced under PSAs in 20192020 were Algeria, Angola, Azerbaijan, Egypt, India, Indonesia and Oman. In addition, the technical service contract (TSC) governing our investment in the Rumaila field in Iraq functions as a PSA.
The group holds no licences due to expire within the next three years that would have a significant impact on BP’sbp’s reserves or production. BPbp holds reserves classified as Assets held for sale within the US associated with our announced divestment of our Alaska and San Juan fields.in Oman. For further information on our reserves see page 239.238.
| | | | | | | | | | | | | | | 310314 | | «See Glossary
| BPbp Annual Report and Form 20-F 2019
2020 | | «See Glossary |
bp’s net production by country – crude oila and natural gas liquids | | | | | | | | | | | | | | | | | | | | | | | | | | | | | thousand barrels per day | | | | | | bp net share of productionb | | | | Crude oil | | | | Natural gas
liquids | | 2020 | 2019 | 2018 | | 2020 | 2019 | 2018 | | Subsidiaries | | | | | | | | UKc d | 96 | | 100 | | 101 | | | 5 | | 3 | | 5 | | | | | | | | | | | | | | | | | | | Total Europe | 96 | | 100 | | 101 | | | 5 | | 3 | | 5 | | Alaskac | 38 | | 71 | | 106 | | | — | | — | | — | | Lower 48 onshorec | 72 | | 66 | | 18 | | | 59 | | 58 | | 37 | | Gulf of Mexico deepwaterc | 235 | | 263 | | 261 | | | 20 | | 24 | | 23 | | | Total US | 345 | | 400 | | 385 | | | 79 | | 81 | | 60 | | Canadae | 22 | | 24 | | 24 | | | — | | — | | — | | | Total Rest of North America | 22 | | 24 | | 24 | | | — | | — | | — | | | Total North America | 367 | | 424 | | 408 | | | 79 | | 81 | | 60 | | | Trinidad & Tobago | 7 | | 7 | | 7 | | | 7 | | 9 | | 9 | | | Total South America | 7 | | 7 | | 7 | | | 7 | | 9 | | 9 | | | Angola | 108 | | 115 | | 147 | | | — | | — | | — | | Egyptc | 9 | | 34 | | 49 | | | — | | — | | — | | | Algeria | 6 | | 7 | | 9 | | | 8 | | 8 | | 11 | | | Total Africa | 123 | | 156 | | 204 | | | 8 | | 8 | | 11 | | | Abu Dhabi | 158 | | 180 | | 169 | | | — | | — | | — | | | Azerbaijan | 97 | | 79 | | 72 | | | — | | — | | — | | | | | | | | | | | Iraq | 100 | | 64 | | 54 | | | — | | — | | — | | | | | | | | | | | Oman | 21 | | 20 | | 17 | | | — | | — | | — | | | Total Rest of Asia | 375 | | 343 | | 313 | | | — | | — | | — | | | Total Asia | 375 | | 343 | | 313 | | | — | | — | | — | | | Australia | 13 | | 15 | | 16 | | | 2 | | 2 | | 2 | | | Eastern Indonesia | 2 | | 2 | | 2 | | | — | | — | | — | | | Total Australasia | 15 | | 17 | | 17 | | | 2 | | 2 | | 2 | | | Total subsidiaries | 983 | | 1,046 | | 1,051 | | | 101 | | 104 | | 88 | | | Equity-accounted entities (bp share) | | | | | | | | Rosneftf (Russia, Venezuela) | 873 | | 920 | | 919 | | | 3 | | 3 | | 4 | | | Abu Dhabi | — | | — | | 16 | | | — | | — | | — | | | Argentina | 52 | | 54 | | 52 | | | 1 | | 1 | | — | | | Mexico | 0 | | — | | — | | | — | | — | | — | | | Bolivia | 2 | | 2 | | 3 | | | — | | — | | — | | Egyptc | — | | — | | — | | | 2 | | 3 | | 3 | | | Norway | 50 | | 35 | | 34 | | | 3 | | 2 | | 2 | | Russiac | 30 | | 35 | | 14 | | | — | | — | | — | | | Angola | 1 | | 1 | | 1 | | | 5 | | 5 | | 3 | | | | | | | | | | | Total equity-accounted entities | 1,009 | | 1,047 | | 1,040 | | | 14 | | 14 | | 12 | | Total subsidiaries and equity-accounted entitiesg | 1,991 | | 2,093 | | 2,091 | | | 115 | | 118 | | 100 | |
| | | | | | | | | | | | | | | | | | | | | thousand barrels per day | | | | | | | | BP net share of productionb | | | | | | Crude oil |
| | | | Natural gas liquids |
| | | 2019 |
| 2018 |
| 2017 |
| | 2019 |
| 2018 |
| 2017 |
| | Subsidiaries | | | | | | | | UKc d | 100 |
| 101 |
| 80 |
| | 3 |
| 5 |
| 6 |
| | Total Europe | 100 |
| 101 |
| 80 |
| | 3 |
| 5 |
| 6 |
| Alaskac | 71 |
| 106 |
| 109 |
| | — |
| — |
| — |
| Lower 48 onshorec | 66 |
| 18 |
| 10 |
| | 58 |
| 37 |
| 34 |
| | Gulf of Mexico deepwater | 263 |
| 261 |
| 251 |
| | 24 |
| 23 |
| 21 |
| | Total US | 400 |
| 385 |
| 370 |
| | 81 |
| 60 |
| 56 |
| Canadae | 24 |
| 24 |
| 20 |
| | — |
| — |
| — |
| | Total Rest of North America | 24 |
| 24 |
| 20 |
| | — |
| — |
| — |
| | Total North America | 424 |
| 408 |
| 390 |
| | 81 |
| 60 |
| 56 |
| Trinidad & Tobagoc | 7 |
| 7 |
| 12 |
| | 9 |
| 9 |
| 10 |
| | Total South America | 7 |
| 7 |
| 12 |
| | 9 |
| 9 |
| 10 |
| | Angola | 115 |
| 147 |
| 192 |
| | — |
| — |
| — |
| Egyptc | 34 |
| 49 |
| 40 |
| | — |
| — |
| — |
| | Algeria | 7 |
| 9 |
| 9 |
| | 8 |
| 11 |
| 10 |
| | Total Africa | 156 |
| 204 |
| 241 |
| | 8 |
| 11 |
| 10 |
| Abu Dhabic | 180 |
| 169 |
| 158 |
| | — |
| — |
| — |
| | Azerbaijan | 79 |
| 72 |
| 90 |
| | — |
| — |
| — |
| | Iraq | 64 |
| 54 |
| 73 |
| | — |
| — |
| — |
| | India | — |
| — |
| 1 |
| | — |
| — |
| — |
| | Oman | 20 |
| 17 |
| 2 |
| | — |
| — |
| — |
| | Total Rest of Asia | 343 |
| 313 |
| 325 |
| | — |
| — |
| — |
| | Total Asia | 343 |
| 313 |
| 325 |
| | — |
| — |
| — |
| Australiac | 15 |
| 16 |
| 15 |
| | 2 |
| 2 |
| 2 |
| Eastern Indonesiac | 2 |
| 2 |
| 1 |
| | — |
| — |
| — |
| | Total Australasia | 17 |
| 17 |
| 17 |
| | 2 |
| 2 |
| 2 |
| | Total subsidiaries | 1,046 |
| 1,051 |
| 1,064 |
| | 104 |
| 88 |
| 85 |
| | Equity-accounted entities (BP share) | | | | | | |
| | Rosneft (Russia, Canada, Venezuela, Vietnam) | 920 |
| 919 |
| 900 |
| | 3 |
| 4 |
| 4 |
| | Abu Dhabi | — |
| 16 |
| 99 |
| | — |
| — |
| — |
| Argentinac | 54 |
| 52 |
| 60 |
| | 1 |
| — |
| — |
| Boliviac | 2 |
| 3 |
| 3 |
| | — |
| — |
| — |
| | Egypt | — |
| — |
| — |
| | 3 |
| 3 |
| 2 |
| Norwayc | 35 |
| 34 |
| 31 |
| | 2 |
| 2 |
| 2 |
| Russiac | 35 |
| 14 |
| 5 |
| | — |
| — |
| — |
| | Angola | 1 |
| 1 |
| 1 |
| | 5 |
| 3 |
| 4 |
| | Other | — |
| — |
| — |
| | — |
| — |
| — |
| | Total equity-accounted entities | 1,047 |
| 1,040 |
| 1,099 |
| | 14 |
| 12 |
| 12 |
| Total subsidiaries and equity-accounted entitiesf | 2,093 |
| 2,091 |
| 2,163 |
| | 118 |
| 100 |
| 97 |
| | | | | | | | | |
| | b
| Production excludes royalties due to others whether payable in cash or in kind where the royalty owner has a direct interest in the underlying production and the option and ability to make lifting and sales arrangements independently. |
| | c
| In 2019, BP completed the sale of its interest in the Gulf of Suez Petroleum Company (GUPCO) in Egypt and certain US assets in Lower 48 onshore and disposed of its interests in the Gulf of Mexico Santiago and Santa Cruz wells. In 2018, BP acquired various interests in the Permian Basin, Eagle Ford and Haynesville Shales in Lower 48 onshore as a result of the acquisition of BHP’s US unconventional assets, increased its interest in the Clair asset in the UK North Sea, and acquired an interest in LLC Kharampurneftegaz in Russia, and in certain US offshore assets. It also disposed of its interests in the Greater Kuparuk Area in Alaska, the Magnus field in the UK North Sea, and in certain other assets in the UK North Sea and US onshore assets. In 2017, BP renewed its onshore concession of the United Arab Emirates that grants BP 10% interest in ADCO onshore concession. It also decreased its interest in Magnus field in North Sea and completed the formation of Pan American Energy Group (PAEG) (BP 50%, Bridas Corporation 50%), which is a combination of Pan American Energy and Axion Energy with an effective decrease in interest. |
| | d
| Volumes relate to six BP-operated fields within ETAP. BP has no interests in the remaining three ETAP fields, which are operated by Shell. |
| | e
| All of the production from Canada in Subsidiaries is bitumen. |
| | f
| Includes 3 net mboe/d of NGLs from processing plants in which BP has an interest (2018 3mboe/d and 2017 3mboe/d). |
a Includes condensate.
Because of rounding, some totals may not agree exactly with the sum of their component parts.
| | | | | | | BP Annual Report and Form 20-F 2019
| «See Glossary
| | 311 |
BP’s net production by country – natural gas
| | | | | | | | | | | | million cubic feet per day | | | | | BP net share of productiona | | | | | 2019 |
| 2018 |
| 2017 |
| Subsidiaries UKb | | 129 |
| 152 |
| 182 |
| | Total Europe | | 129 |
| 152 |
| 182 |
| Lower 48 onshoreb | | 2,175 |
| 1,705 |
| 1,467 |
| | Gulf of Mexico deepwater | | 179 |
| 190 |
| 186 |
| | Alaska | | 4 |
| 5 |
| 5 |
| | Total US | | 2,358 |
| 1,900 |
| 1,659 |
| | Canada | | 2 |
| 7 |
| 9 |
| | Total Rest of North America | | 2 |
| 7 |
| 9 |
| | Total North America | | 2,361 |
| 1,907 |
| 1,667 |
| Trinidad & Tobagob | | 1,977 |
| 2,136 |
| 1,936 |
| | Total South America | | 1,977 |
| 2,136 |
| 1,936 |
| Egyptb | | 952 |
| 878 |
| 745 |
| | Algeria | | 186 |
| 183 |
| 205 |
| | Total Africa | | 1,138 |
| 1,061 |
| 949 |
| | Azerbaijan | | 367 |
| 256 |
| 232 |
| | India | | 15 |
| 32 |
| 60 |
| | Oman | | 594 |
| 538 |
| 79 |
| | Total Rest of Asia | | 976 |
| 826 |
| 371 |
| | Total Asia | | 976 |
| 826 |
| 371 |
| Australiab | | 411 |
| 437 |
| 426 |
| Eastern Indonesiab | | 375 |
| 382 |
| 357 |
| | Total Australasia | | 786 |
| 819 |
| 783 |
| Total subsidiariesc | | 7,366 |
| 6,900 |
| 5,889 |
| | Equity-accounted entities (BP share) | | | | | | Rosneft (Russia, Canada, Egypt, Venezuela, Vietnam) | | 1,279 |
| 1,286 |
| 1,308 |
| | Argentina | | 250 |
| 264 |
| 329 |
| | Bolivia | | 64 |
| 71 |
| 89 |
| Norwayb | | 56 |
| 59 |
| 53 |
| | Angola | | 87 |
| 80 |
| 77 |
| | Western Indonesia | | — |
| — |
| — |
| Total equity-accounted entitiesc | | 1,736 |
| 1,760 |
| 1,855 |
| | Total subsidiaries and equity-accounted entities | | 9,102 |
| 8,659 |
| 7,744 |
|
ab Production excludes royalties due to others whether payable in cash or in kind where the royalty owner has a direct interest in the underlying production and the option and ability to make lifting and sales arrangements independently.
bc In 2020, bp disposed of its Alaska interests and certain Lower 48 onshore interests in the US. In 2019, BPbp completed the sale of its interest in the Gulf of Suez Petroleum Company (GUPCO) in Egypt and certain US assets in Lower 48 onshore and disposed of its interests in the Gulf of Mexico Santiago and Santa Cruz wells. In 2018, BPbp acquired various interests in the Permian Basin, Eagle Ford and Haynesville Shales in Lower 48 onshore as a result of the acquisition of BHP’s US unconventional assets, increased its interest in the Clair asset in the UK North Sea, and acquired an interest in LLC Kharampurneftegaz in Russia, and in certain US offshore assets. It also disposed of its interests in the Greater Kuparuk Area in Alaska, the Magnus field in the UK North Sea, and in certain other assets in the UK North Sea and US onshore assets.
d Volumes relate to six bp-operated fields within ETAP. bp has no interests in the remaining three ETAP fields, which are operated by Shell. e All of the production from Canada in Subsidiaries is bitumen. f Includes production in respect of the non-controlling interest in Rosneft, including production held through bp’s interests in Russia other than Rosneft. g Includes 3 net mboe/d of NGLs from processing plants in which bp has an interest (2019 3mboe/d and 2018 3mboe/d).
Because of rounding, some totals may not agree exactly with the sum of their component parts. | | | | | | | | | | | | | | | «See Glossary | | bp Annual Report and Form 20-F 2020 | | 315 |
bp’s net production by country – natural gas | | | | | | | | | | | | | | | | | million cubic feet per day | | | bp net share of productiona | | | 2020 | 2019 | 2018 | Subsidiaries UKb | | 221 | | 129 | | 152 | | | | | | | | | | | | | Total Europe | | 221 | | 129 | | 152 | | Lower 48 onshoreb | | 1,405 | | 2,175 | | 1,705 | | Gulf of Mexico deepwaterb | | 154 | | 179 | | 190 | | Alaskab | | 3 | | 4 | | 5 | | | Total US | | 1,561 | | 2,358 | | 1,900 | | | Canada | | 2 | | 2 | | 7 | | | Total Rest of North America | | 2 | | 2 | | 7 | | | Total North America | | 1,563 | | 2,361 | | 1,907 | | | Trinidad & Tobago | | 1,695 | | 1,977 | | 2,136 | | | Total South America | | 1,695 | | 1,977 | | 2,136 | | Egyptb | | 782 | | 952 | | 878 | | | Algeria | | 141 | | 186 | | 183 | | | Total Africa | | 923 | | 1,138 | | 1,061 | | | Azerbaijan | | 413 | | 367 | | 256 | | | | | | | | India | | 2 | | 15 | | 32 | | | Oman | | 550 | | 594 | | 538 | | | Total Rest of Asia | | 966 | | 976 | | 826 | | | Total Asia | | 966 | | 976 | | 826 | | | Australia | | 396 | | 411 | | 437 | | | Eastern Indonesia | | 399 | | 375 | | 382 | | | Total Australasia | | 795 | | 786 | | 819 | | Total subsidiariesc | | 6,163 | | 7,366 | | 6,900 | | | Equity-accounted entities (bp share) | | | | | Rosneftd (Russia, Canada, Egypt, Vietnam) | | 1,286 | | 1,279 | | 1,286 | | | Argentina | | 230 | | 250 | | 264 | | | Bolivia | | 56 | | 64 | | 71 | | | Mexico | | 0 | | — | | — | | | Norway | | 61 | | 56 | | 59 | | Russiab | | 41 | | — | | — | | | Angola | | 92 | | 87 | | 80 | | | | | | | Total equity-accounted entitiesc | | 1,765 | | 1,736 | | 1,760 | | | Total subsidiaries and equity-accounted entities | | 7,929 | | 9,102 | | 8,659 | |
a Production excludes royalties due to others whether payable in cash or in kind where the royalty owner has a direct interest in the underlying production and the option and ability to make lifting and sales arrangements independently. b In 2017, BP decreased2020, bp disposed of its Alaska interests and certain Lower 48 onshore interests in the US. In 2019, bp completed the sale of its interest in the Gulf of Suez Petroleum Company (GUPCO) in Egypt and certain US assets in Lower 48 onshore and disposed of its interests in the Gulf of Mexico Santiago and Santa Cruz wells. In 2018, bp acquired various interests in the Permian Basin, Eagle Ford and Haynesville Shales in Lower 48 onshore as a result of the acquisition of BHP’s US unconventional assets, increased its interest in the Clair asset in the UK North Sea, and acquired an interest in LLC Kharampurneftegaz in Russia, and in certain US offshore assets. It also disposed of its interests in the Greater Kuparuk Area in Alaska, the Magnus field in the UK North Sea, and completedin certain other assets in the formation of Pan American Energy Group (PAEG) (BP 50%, Bridas Corporation 50%), which is a combination of Pan American EnergyUK North Sea and Axion Energy with an effective decrease in interest.US onshore assets. c Natural gas production volumes exclude gas consumed in operations within the lease boundaries of the producing field, but the related reserves are included in the group’s reserves.
d Includes production in respect of the non-controlling interest in Rosneft, including production held through bp’s interests in Russia other than Rosneft.
Because of rounding, some totals may not agree exactly with the sum of their component parts.
| | | | | | | | | | | | | | | 312316 | | «See Glossary
| BPbp Annual Report and Form 20-F 2019
2020 | | «See Glossary |
The following tables provide additional data and disclosures in relation to our oil and gas operations. Average sales price per unit of production (realizations«)a | | | | | | | | | | | | | | | | | | | | | | | | | | | | | | | | | | | | | | | | | | | | | | $ per unit of production | | | Europe | North
America | South
America | Africa | Asia | Australasia | Total
group
average | | | UK | Rest of
Europe | US | Rest of
North
America | | | Russiab | Rest of
Asia | | | | Subsidiaries | | | | | | | | | | | | | 2020 | | | | | | | | | | | | Crude oilc | | 42.70 | | — | | 38.14 | | 26.70 | | 42.27 | | 41.60 | | — | | 37.76 | | 33.21 | | 38.46 | | | Natural gas liquids | | 25.31 | | — | | 10.22 | | — | | 16.49 | | 25.39 | | — | | — | | 24.73 | | 12.91 | | | Gas | | 3.13 | | — | | 1.30 | | 1.70 | | 1.86 | | 3.89 | | — | | 3.91 | | 4.66 | | 2.75 | | | 2019 | | | | | | | | | | | | Crude oilc | | 65.44 | | — | | 59.19 | | 40.92 | | 63.30 | | 63.75 | | — | | 64.39 | | 59.65 | | 61.56 | | | Natural gas liquids | | 29.58 | | — | | 14.67 | | — | | 25.86 | | 31.89 | | — | | — | | 38.11 | | 18.23 | | | Gas | | 4.01 | | — | | 1.93 | | 0.75 | | 2.78 | | 4.59 | | — | | 3.99 | | 6.86 | | 3.39 | | | 2018 | | | | | | | | | | | | Crude oilc | | 71.28 | | — | | 67.11 | | 33.57 | | 69.17 | | 68.81 | | — | | 70.80 | | 67.54 | | 67.81 | | | Natural gas liquids | | 31.63 | | — | | 25.81 | | — | | 35.74 | | 39.14 | | — | | — | | 52.14 | | 29.42 | | | Gas | | 7.71 | | — | | 2.43 | | 0.83 | | 3.08 | | 4.82 | | — | | 3.85 | | 7.97 | | 3.92 | | Equity-accounted entitiesd | | | | | | | | | | | | | 2020 | | | | | | | | | | | | Crude oilc | | — | | 40.00 | | — | | — | | 40.41 | | — | | 35.10 | | — | | — | | 35.94 | | Natural gas liquidse | | — | | — | | — | | — | | 15.93 | | — | | N/A | — | | — | | 15.93 | | | Gas | | — | | 3.76 | | — | | — | | 2.88 | | — | | 1.51 | | — | | — | | 1.85 | | | 2019 | | | | | | | | | | | | Crude oilc | | — | | 64.75 | | — | | — | | 56.85 | | — | | 56.52 | | — | | — | | 56.96 | | Natural gas liquidse | | — | | — | | — | | — | | 18.14 | | — | | N/A | — | | — | | 18.14 | | | Gas | | — | | 5.01 | | — | | — | | 3.98 | | — | | 1.83 | | — | | — | | 2.38 | | | 2018 | | | | | | | | | | | | Crude oilc | | — | | 70.24 | | — | | — | | 62.35 | | — | | 62.51 | | 39.49 | | — | | 62.29 | | Natural gas liquidse | | — | | — | | — | | — | | — | | — | | N/A | — | | — | | — | | | Gas | | — | | 7.93 | | — | | — | | 4.36 | | — | | 1.70 | | — | | — | | 2.50 | |
| | | | | | | | | | | | | | | | | | | | | | | | | | | | | | | | | | $ per unit of production | | | | | Europe | North America | South America |
| Africa | Asia | Australasia | Total group average |
| | | | UK |
| Rest of Europe |
| US |
| Rest of North Americab |
| | | Russia |
| Rest of Asia |
| | | | Subsidiaries | | | | | | | | | | | | | 2019 | | | | | | | | | | | | Crude oilc | | 65.44 |
| — |
| 59.19 |
| 40.92 |
| 63.30 |
| 63.75 |
| — |
| 64.39 |
| 59.65 |
| 61.56 |
| | Natural gas liquids | | 29.58 |
| — |
| 14.67 |
| — |
| 25.86 |
| 31.89 |
| — |
| — |
| 38.11 |
| 18.23 |
| | Gas | | 4.01 |
| — |
| 1.93 |
| — |
| 2.78 |
| 4.59 |
| — |
| 3.99 |
| 6.86 |
| 3.39 |
| | 2018 | | | | | | | | | | | | Crude oilc | | 71.28 |
| — |
| 67.11 |
| 33.57 |
| 69.17 |
| 68.81 |
| — |
| 70.80 |
| 67.54 |
| 67.81 |
| | Natural gas liquids | | 31.63 |
| — |
| 25.81 |
| — |
| 35.74 |
| 39.14 |
| — |
| 92.47 |
| 52.14 |
| 29.42 |
| | Gas | | 7.71 |
| — |
| 2.43 |
| — |
| 3.08 |
| 4.82 |
| — |
| 3.85 |
| 7.97 |
| 3.92 |
| | 2017 | | | | | | | | | | | | Crude oilc | | 53.67 |
| — |
| 49.98 |
| 36.80 |
| 55.44 |
| 53.61 |
| — |
| 52.88 |
| 53.26 |
| 51.71 |
| | Natural gas liquids | | 32.77 |
| — |
| 22.42 |
| — |
| 26.79 |
| 36.48 |
| — |
| — |
| 39.39 |
| 26.00 |
| | Gas | | 5.09 |
| — |
| 2.36 |
| — |
| 2.25 |
| 3.82 |
| — |
| 3.44 |
| 6.14 |
| 3.19 |
| Equity-accounted entitiesd | | | | | | | | | | | | | 2019 | | | | | | | | | | | | Crude oilc | | — |
| 64.75 |
| — |
| — |
| 56.85 |
| — |
| 57.00 |
| — |
| — |
| 57.36 |
| Natural gas liquidse | | — |
| — |
| — |
| — |
| 18.14 |
| — |
| N/A |
| — |
| — |
| 20.40 |
| | Gas | | — |
| 5.01 |
| — |
| — |
| 3.98 |
| — |
| 1.83 |
| — |
| — |
| 3.39 |
| | 2018 | | | | | | | | | | | | Crude oilc | | — |
| 70.24 |
| — |
| — |
| 62.35 |
| — |
| 62.46 |
| 39.49 |
| — |
| 62.24 |
| Natural gas liquidse | | — |
| — |
| — |
| — |
| — |
| — |
| N/A |
| — |
| — |
| — |
| | Gas | | — |
| 7.93 |
| — |
| — |
| 4.36 |
| — |
| 1.70 |
| — |
| — |
| 2.50 |
| | 2017 | | | | | | | | | | | | Crude oilc | | — |
| 55.08 |
| — |
| — |
| 49.97 |
| — |
| 45.66 |
| 15.61 |
| — |
| 42.33 |
| Natural gas liquidse | | — |
| — |
| — |
| — |
| — |
| — |
| N/A |
| — |
| — |
| — |
| | Gas | | — |
| 5.78 |
| — |
| — |
| 4.49 |
| — |
| 1.63 |
| — |
| — |
| 2.47 |
|
Average production cost per unit of productionf | | | | | | | | | | | | | | | | | | | | | | | | | | | | | | | | | | | | | | | | | | | | | | $ per unit of production | | | Europe | North
America | South
America | Africa | Asia | Australasia | Total
group
average | | | UK | Rest of
Europe | US | Rest of
North
America | | | Russiac | Rest of
Asia | | | Subsidiaries | | | | | | | | | | | | | 2020 | | 12.49 | | — | | 8.11 | | 12.46 | | 3.76 | | 7.71 | | — | | 4.41 | | 2.02 | | 6.39 | | | 2019 | | 13.22 | | — | | 8.46 | | 13.36 | | 3.36 | | 7.95 | | — | | 5.15 | | 2.33 | | 6.84 | | | 2018 | | 13.76 | | — | | 9.63 | | 13.10 | | 3.08 | | 7.31 | | — | | 5.72 | | 2.35 | | 7.15 | | | Equity-accounted entities | | | | | | | | | | | | | 2020 | | — | | 8.14 | | — | | — | | 12.71 | | — | | 3.54 | | — | | — | | 4.55 | | | 2019 | | — | | 12.51 | | — | | — | | 11.50 | | — | | 3.45 | | — | | — | | 4.50 | | | 2018 | | — | | 12.15 | | — | | — | | 10.61 | | — | | 3.37 | | 5.92 | | — | | 4.38 | |
| | | | | | | | | | | | | | | | | | | | | | | | | | | | | | | | | | $ per unit of production | | | | | Europe | North America | South America | Africa | Asia | Australasia | Total group average |
| | | | UK |
| Rest of Europe |
| US |
| Rest of North America |
| | | Russia |
| Rest of Asia |
| | | Subsidiaries | | | | | | | | | | | | | 2019 | | 13.22 |
| — |
| 8.46 |
| 13.36 |
| 3.36 |
| 7.95 |
| — |
| 5.15 |
| 2.33 |
| 6.84 |
| | 2018 | | 13.76 |
| — |
| 9.63 |
| 13.10 |
| 3.08 |
| 7.31 |
| — |
| 5.72 |
| 2.35 |
| 7.15 |
| | 2017 | | 14.58 |
| — |
| 8.68 |
| 15.02 |
| 4.41 |
| 6.47 |
| — |
| 6.37 |
| 2.79 |
| 7.11 |
| | Equity-accounted entities | | | | | | | | | | | | | 2019 | | — |
| 12.51 |
| — |
| — |
| 11.50 |
| 10.40 |
| 3.07 |
| — |
| — |
| 5.13 |
| | 2018 | | — |
| 12.15 |
| — |
| — |
| 10.61 |
| — |
| 3.09 |
| 5.92 |
| — |
| 4.16 |
| | 2017 | | — |
| 10.33 |
| — |
| — |
| 11.92 |
| — |
| 3.19 |
| 3.27 |
| — |
| 4.32 |
|
a Units of production are barrels for liquids and thousands of cubic feet for gas. Realizations include transfers between businesses, except in the case of Russia. b All of An amendment has been made to 2019 and 2018 to align with the disclosures for oil and natural gas exploration and production from Canada in Subsidiaries is bitumen.activities. c Includes condensate. d In certain countries it is common for equity-accounted entities’ agreements to include pricing clauses that require selling a significant portion of the entitled production to local governments or markets at discounted prices. e Natural gas liquids for Russia are included in crude oil. f Units of production are barrels for liquids and thousands of cubic feet for gas. Amounts do not include ad valorem and severance taxes.
| | | | | | | | | | | | | | | «See Glossary | BP
| bp Annual Report and Form 20-F 20192020 | | 317 |
Additional information for Downstream Refinery throughputsa b | | | | | | | | | | | | | | | | | | | thousand barrels per day | | | 2020 | 2019 | 2018 | | US | | 693 | 737 | 703 | | Europe | | 742 | 787 | 781 | | Rest of the world | | 192 | 225 | 241 | | Total | | 1,627 | 1,749 | 1,725 | | | | | | | | | | % | Refining availability« | | 96.0 | 94.9 | 95.0 |
a This does not include bp’s interest in Pan American Energy Group. b Refinery throughputs reflect crude oil and other feedstock volumes. Sales volume | | | | | | | | | | | | | | | | | | | thousand barrels per day | | | 2020 | 2019 | 2018 | Marketing salesa | | 2,275 | 2,727 | 2,736 | Trading/supply salesb | | 3,026 | 3,268 | 3,194 | | Total refined product sales | | 5,301 | 5,995 | 5,930 | Crude oilc | | 2,397 | 2,713 | 2,624 | | Total | | 7,698 | 8,708 | 8,554 |
a Marketing sales include branded and unbranded sales of refined fuel products and lubricants to business-to-business and business-to-consumer customers, including service station dealers, jobbers, airlines, small and large resellers such as hypermarkets, and the military. b Trading/supply sales are fuel sales to large unbranded resellers and other oil companies. c Crude oil sales relate to transactions executed by our integrated supply and trading function, primarily for optimizing crude oil supplies to our refineries and in other trading. 2020 includes 44 thousand barrels per day relating to revenues reported by the Upstream segment.
Sales volumes reported in the table above are for those transactions that are reported as gross sales in the group income statement. From 2021, certain sales and purchase transactions that have previously been reported gross in the group income statement will be reported on a net basis in the income statement. The volumes for 2020 transactions that would have been subject to potential netting in the income statement but are presented gross in this table are approximately 2,063 thousand barrels a day of crude oil, 2,613 thousand barrels a day of trading/supply sales, and 126 thousand barrels a day of marketing sales. Retail sitesa | | | | | | | | | | | | | | | | | | | Number of bp-branded retail sites | | | 2020 | 2019 | 2018 | | US | | 7,300 | 7,200 | 7,200 | | Europe | | 8,200 | 8,200 | 8,200 | | Rest of the world | | 4,800 | 3,500 | 3,300 | | Total | | 20,300 | 18,900 | 18,700 |
a Reported to the nearest 100. Includes sites operated by dealers, jobbers, franchisees, brand licensees or JV partners, under the bp brand. These may move to and from the bp brand as their fuel supply agreement or brand licence agreement expires and are renegotiated in the normal course of business. Retail sites are primarily branded bp, ARCO, Amoco, Aral and Thorntons, and also include sites in India through our Jio-bp JV.
Reconciliation of RC profit before interest and tax to gross margin for convenience, retail fuels and electrification | | | | | | | | | | | | | | | $ billion | | | 2020 | 2019 | | RC profit before interest and tax for Downstream | | 3.4 | 6.5 | Net (favourable) adverse impact of non-operating items« and fair value accounting effects« | | (0.3) | (0.1) | | Underlying RC profit before interest and tax for Downstream | | 3.1 | 6.4 | | Subtract underlying RC profit (loss) for petrochemicals, refining and trading, and lubricants | | 1.0 | 3.9 | | Add back: | | | | | Fuels (excluding refining and trading) depreciation, depletion and amortization | | 1.0 | 1.0 | | Fuels (excluding refining and trading) production and manufacturing, distribution and administration expenses and adjusted for aviation, B2B and midstream gross margin | | 1.9 | 1.8 | | Adjusted for earnings from equity-accounted entities in fuels (excluding refining and trading) | | (0.2) | (0.3) | Gross margin for convenience, retail fuels and electrification« | | 4.8 | 5.0 | | Of which: | | | | | Convenience gross margin | | 1.3 | 1.2 | | Retail fuels gross margin | | 3.5 | 3.7 | | Electrification gross margin | | 0.0 | 0.0 |
| | | | | | | | | | | | | | | | 318 | | bp Annual Report and Form 20-F 2020 | | «See Glossary | | 313 |
Refinery capacity The following tablea summarizes bp group’s interests in refineries and average daily crude distillation capacities as at 31 December 2020. | | | | | | | | | | | | | | | | | | | | | | Crude distillation capacitiesb | | Fuels value chain | Country | Refinery | | Group interestc (%) | BP share
thousand barrels
per day | | US | | | | | | | US North West | US | Cherry Point | | 100 | 251 | | US East of Rockies | | Whiting | | 100 | 440 | | | | Toledo | | 50 | 80 | | | | | | | 771 | | Europe | | | | | | | | | | | | | Rhine | Germany | Gelsenkirchen | | 100 | 265 | | | Lingen | | 100 | 97 | | Netherlands | Rotterdam | | 100 | 390 | | Iberia | Spain | Castellón | | 100 | 110 | | | | | | | 862 | | Rest of world | | | | | | | Australia | Australia | Kwinanad | | 100 | 152 | | New Zealand | New Zealand | Whangareief | | 10.1 | 34 | | Southern Africa | South Africa | Durbane | | 50 | 90 | | | | | | 276 | | Total bp share of capacity at 31 December 2020 | | | 1,909 | |
a This does not include bp’s interest in Pan American Energy Group. b Crude distillation capacity is gross rated capacity, which is defined as the highest average sustained unit rate for a consecutive 30-day period under normal operational conditions. c bp share of equity, which is not the same as bp share of processing entitlements. d In the fourth quarter 2020, we announced plans to cease fuel production at our Kwinana Refinery and convert it to an import terminal. e Indicates refineries not operated by bp. f Reflects bp share of processing entitlement, which is not the same as bp share of equity.
| | | | | | | | | | | | | | | «See Glossary | | bp Annual Report and Form 20-F 2020 | | 319 |
Additional information for Rosneft About Rosneft Rosneft is the largest oil company in Russia, with a strong portfolio of current and future opportunities. Russia has one of the largest and lowest-cost hydrocarbon resource bases in the world and its resources play an important role in long-term energy supply to the global economy. Rosneft is one of the largest publicly traded oil companies in the world based on hydrocarbon production volume. And it has a major resource base of hydrocarbons onshore and offshore, with assets in all of Russia’s key hydrocarbon regions and abroad. bp's share of Rosneft hydrocarbon production in 2020 was 1,098mboe/d, compared with 1,144mboe/d in 2019. Rosneft is a member of the Methane Guiding Principles initiative that aims to reduce methane emissions along the natural gas value chain. It reaffirmed its commitment to the 17 UN Sustainable Development Goals and the core principles of the UN Global Compact. Rosneft is the leading Russian refining company based on throughput. It owns and operates 13 refineries in Russia and holds stakes in three refineries in Germany, one in India and one in Belarus. Rosneft refinery throughput in 2020 was 2,103mb/d, compared with 2,236mb/d in 2019. Downstream operations include jet fuel, bunkering, bitumen and lubricants. Rosneft also owns and operates over 3,055 retail service stations in Russia and abroad. These includes Rosneft-branded sites, as well as bp-branded sites operating under a licensing agreement. Rosneft’s largest shareholder is Rosneftegaz JSC (Rosneftegaz), which is wholly owned by the Russian government. At 31 December 2020, Rosneftegaz held 40.4% (2019: 50% plus one share) of the voting share capital of Rosneft. 2020 summary bp remains committed to our strategic investment in Rosneft, while complying with all relevant sanctions. bp’s two nominees, Bernard Looney and Bob Dudley, were elected to Rosneft’s board at Rosneft's annual general meeting (AGM) in June. Bob Dudley is a chairman of the Rosneft board’s Strategy and Sustainable Development Committee. At the AGM, shareholders also approved a resolution to pay a dividend. bp received a payment of $480 million, after the deduction of withholding tax, in July. On 30 April, Rosneft completed a transaction to transfer all of its interest and cease participation in its Venezuelan businesses to a company owned by the government of the Russian Federation. In consideration, it received shares equal to a 9.6% share of its own equity. The shares are held by a 100% subsidiary of Rosneft and accounted for as treasury shares. Rosneft also has an approved programme of share buybacks under which shares are being repurchased. Those shares are also accounted for as treasury shares. bp retains 19.75% of the voting rights at meetings of Rosneft shareholders and continues to be entitled to dividends based on that shareholding. bp’s economic interest as of 31 December 2020, however, has increased to 22.03% as a result of its indirect interest in the shares held by the subsidiaries of Rosneft. bp’s share of profit or loss of Rosneft reflects its economic interest. On 14 December 2020, Rosneft announced the sale of a 49% stake in Krasgeonats to Equinor for approximately $550 million. Krasgeonats owns 12 licences for exploration and production in Eastern Siberia, including the recently launched North-Danilovskoye field. On 28 December, Rosneft announced completion of the acquisition of 100% stakes in JSC Taimyrneftegaz and LLC Taimyrburservis, and the sale of a 10% interest in LLC Vostok Oil to Trafigura for Euro 7 billion. In December, Rosneft announced that it has developed a 2035 Carbon Management Plan, a long-term framework for its development in the context of transitioning to a low carbon economy, including management of climate risks and identification of opportunities related to future energy demand. 2020 marked the 10th anniversary of Rosneft’s participation in UN Global Compact, the world’s largest sustainability initiative. In 2020, Rosneft presented its public statement regarding human rights and the Declaration on Human Rights for interacting with suppliers of goods, works and services. In February 2021,Rosneft and bp signed a Strategic Collaboration Agreement focused on supporting carbon management and sustainability activities of both companies. The agreement builds on bp’s longstanding strategic partnership with Rosneft and will explore opportunities for new investment and collaboration in Russia across several key focus areas: •Developing industry methodologies and standards on carbon management, including methane reduction initiatives and energy efficiency applications. •Evaluating new projects in renewables, carbon capture and hydrogen. •Assessing opportunities in the downstream including advanced fuels, natural forest sinks and carbon offset credits. •Sustainable development and social investment, including biodiversity.
| | | | | | | | | | | | | | | | 320 | | bp Annual Report and Form 20-F 2020 | | «See Glossary |
Environmental expenditure | | | | | | | | | | | | $ million | | | | | $ million |
| | | 2020 | 2019 | 2018 | | | | 2019 |
| 2018 |
| 2017 |
| | | Operating expenditure | | 511 |
| 501 |
| 441 |
| Operating expenditure | | 531 | | 511 | | 501 | | | Capital expenditure | | 468 |
| 449 |
| 487 |
| Capital expenditure | | 241 | | 468 | | 449 | | | Clean-ups | | 23 |
| 31 |
| 22 |
| Clean-ups | | 29 | | 23 | | 31 | | | Additions to environmental remediation provision | | 272 |
| 428 |
| 249 |
| Additions to environmental remediation provision | | 297 | | 272 | | 428 | | | Increase (decrease) in decommissioning provision | | 1,045 |
| 137 |
| (228 | ) | Increase (decrease) in decommissioning provision | | (686) | | 1,045 | | 137 | |
Operating and capital expenditure on the prevention, control, treatment or elimination of air and water emissions and solid waste is often not incurred as a separately identifiable transaction. Instead, it forms part of a larger transaction that includes, for example, normal operations and maintenance expenditure. The figures for environmental operating and capital expenditure in the table are therefore estimates, based on the definitions and guidelines of the American Petroleum Institute. Environmental operating expenditure of $511$531 million in 2019 (2018 $5012020 (2019 $511 million) showed an overall increase of 2%4%, with increases in Upstream costs (due in large part to increases inBP Products and Shipping expenditure associated with the acquisitions of BHP assets into BPX Energy) largely balanced out by slight reductionsa reduction in costsexpenditure for Downstream and Shipping.BPX Energy. Environmental capital expenditure of $241 million in 20192020 was slightly higher overall than in 2018significantly down (2019 $468 million) largely due to increased costsdecreased expenditure in Upstream, due in large part to increases in expenditure associated with the acquisitions of BHP assets into BPX Energy.Energy and BP Products North America business. Clean-up costs were $23$29 million in 2019 (2018 $312020 (2019 $23 million) representing oil spill clean-up costs and other associated remediation and disposal costs. The reductionincrease compared to 20182019 results largely from the downstream business where clean-up costsincreased expenditure in three businesses, namely BP Pipelines (North America) were significantly lower than in 2018., Alaska and Remediation Management. In addition to operating and capital expenditure, we also establish provisions for future environmental remediation work. Expenditure against such provisions normally occurs in subsequent periods and is not included in environmental operating expenditure reported for such periods. Provisions for environmental remediation are made when a clean-up is probable and the amount of the obligation can be reliably estimated. Generally, this coincides with the commitment to a formal plan of action or, if earlier, on divestment or on closure of inactive sites. The extent and cost of future environmental restoration, remediation and abatement programmes are inherently difficult to estimate. They often depend on the extent of contamination, and the associated impact and timing of the corrective actions required, technological feasibility and BP’sbp’s share of liability. Though the costs of future programmes could be significant and may be material to the results of operations in the period in which they are recognized, it is not expected that such costs will be material to the group’s overall results of operations or financial position. Additions to our environmental remediation provision was similar to prior years and also reflects scope reassessments of the remediation plans of a number of our sites in the US and Canada.US. The charge for environmental remediation provisions in 20192020 included $9$8 million in respect of provisions for new sites (2018 $8(2019 $9 million and 20172018 $8 million). In addition, we make provisions on installation of our oil and gas producing assets and related pipelines to meet the cost of eventual decommissioning. On installation of an oil or natural gas production facility, a provision is established that represents the discounted value of the expected future cost of decommissioning the asset. In 2019,2020, the net increasedecrease in the decommissioning provision was due to a change in the discount rate and a detailed reviews of expected future costs.change in cost estimate assumptions. We undertake periodic reviews of existing provisions. These reviews take account of revised cost assumptions, changes in decommissioning requirements and any technological developments. Provisions for environmental remediation and decommissioning are usually established on a discounted basis, as required by IAS 37 ‘Provisions, Contingent Liabilities and Contingent Assets’. Further details of decommissioning and environmental provisions appear in Financial statements – Note 23. Regulation of the group’s business BP’s activitiesOur businesses and operations are subject to a broad range of EU, US, international, national, regional, and local legislationthe laws and regulations including legislation that implements international conventions and protocols.applicable in each country, state or other regional or local area in which they occur. These cover virtually all aspects of BP’sbp’s activities and include matters such as licence acquisition, production rates, royalties, environmental, health and safety protection, fuel specifications and transportation, trading, pricing, anti-trust, export, taxes, and foreign exchange.exchange.
Following the UK’s exit from the European Union on 31 January 2020, the UK has now entered a transition period which, unless extended, is due to run until 31 December 2020. During the transition period, most EU law will continue to apply to the UKOil and therefore to BP’s UK business during that period. The vast majority of environment-related statutory instruments passed by the UK Government in anticipation of Brexit have included no substantive changes to the current EU underlying regime, but rather seek to make the amendments required to allow their continued operation after the transition period. The UK Government’s Environment Bill and 25 Year Plan will be central to the UK’s environmental regime going forward but further changes are as yet uncertain. The following section describes EU laws and regulations relevant to our business both in the UK and the EU.
Upstreamgas contractual and regulatory framework
The terms and conditions of the leases, licences and contracts under which our upstream oil and gas interests are held vary from country to country. These leases, licences and contracts are generally granted by or entered into with a government entity or state-owned or controlled company and are sometimes entered into with private property owners. Arrangements with governmental or state entities usually take the form of licences or production-sharing agreements«(PSAs), although arrangements with private entities and the US government entities are usually by lease. Arrangements with private property owners are also usually in the form of leases. Licences (or concessions) give the holder the right to explore for, develop and produce a commercial discovery. Under a licence, the holder bears the risk of exploration, development and production activities and provides the financing for these operations. In principle, the licence holder is entitled to all production, minus any royalties that are payable in kind. A licence holder is generally required to pay production taxes or royalties, which may be in cash or in kind. In certain countries, separate licences are required for exploration and production activities, and in some cases production licences are limited to only a portion of the area covered by the original exploration licence. Both exploration and production licences are generally for a specified period of time. In the US, leases from the US government typically remain in effect for a specified term, but may be extended beyond that term as long as there is production in paying quantities. The term of BP’s licences and the extent to which these licences may be renewed vary from country to country. PSAs entered into with a government entity or state-owned or controlled company generally require BPbp (alone or with other contracting companies) to provide all the financing and bear the risk of exploration and production activities in exchange for a share of the production remaining after royalties, if any. Less typically, BPbp may explore for, develop and produce hydrocarbons under a service agreement with the host entity in exchange for reimbursement of costs and/or a fee paid in cash rather than production. BPbp frequently conducts its exploration and production activities in joint arrangements«or co-ownership arrangements with other international oil companies, state-owned or controlled companies and/or private companies. These joint arrangements may be incorporated or unincorporated arrangements, while the co- ownerships are typically unincorporated. Whether incorporated or unincorporated, relevant agreements set out each party’s level of
| | | | | | 314 | | «See Glossary
| BP Annual Report and Form 20-F 2019
| |
participation or ownership interest in the joint arrangement or co- ownership. Conventionally, all costs, benefits, rights, obligations, liabilities and risks incurred in carrying out joint arrangement or co-ownership operations under a lease, licence or PSA are shared among the joint arrangement or co-owning parties according to these agreed ownership interests. Ownership of joint arrangement or co-owned property and hydrocarbons to which the joint arrangement or co-ownership is entitled is also shared in these proportions.interests among them. To the extent that any liabilities arise, whether to governments or third parties, or as between the joint arrangement parties or co-owners themselves, each joint arrangement party or co-owner will generally be liable to meet these in proportion to its ownership interest. In many upstream operations, a party (known as the operator) will be appointed (pursuant to a joint operating agreement) to carry out day-to-dayday to-day operations on behalf of the joint arrangement or co-ownership. The operator is typically one of the joint arrangement parties or a co- ownerco-owner and will carry out its duties either through its own staff, or by contracting out various elements to third-party contractors or service providers. BPbp acts as operator on behalf of joint arrangements and co- ownershipsco-ownerships in a number of countries.
Frequently, work (including drilling and related activities) will be contracted out to third-party service providers. The relevant contract will specify the work, the remuneration, and typically the risk allocation between the parties. Depending on the service to be provided, the contract may also contain provisions allocating risks and liabilities associated with pollution and environmental damage, damage to a well or hydrocarbon reservoirs and for claims from third parties or other losses. The allocation of those risks vary among contracts and are determined through negotiation between the parties.parties. | | | | | | | | | | | | | | | «See Glossary | | bp Annual Report and Form 20-F 2020 | | 321 |
In general, BPbp incurs income tax on income generated from production activities (whether under a licence or PSA). In addition, depending on the area, BP’sbp’s production activities may be subject to a range of other taxes, levies and assessments, including special petroleum taxes and revenue taxes. The taxes imposed on oil and gas production profits and activities may be substantially higher than those imposed on other activities, for example in Abu Dhabi, Angola, Egypt, Norway, the UK, the US, Russia and Trinidad & Tobago. Sustainable finance On 12 July 2020, elements of Regulation (EU) 2020/852 on the establishment of a framework to facilitate sustainable investment (Taxonomy Regulation) entered into force and form part of UK law pursuant to the European Union (Withdrawal) Act of 2018. The Taxonomy Regulation establishes a classification system for determining whether an economic activity is environmentally sustainable for the purposes of guiding investors in financial products which are marketed as promoting environmental objectives. Although the UK government has expressed its intention to retain the overall taxonomy framework and objectives as set forth in the Taxonomy Regulation, it is not yet clear to what extent UK law will align with elements of the Taxonomy Regulation which were not in effect as of the end of the Brexit transition period on 31 December 2020. bp may in the future be required to comply with the Taxonomy Regulation or any parallel or similar legislation which may come into force in the UK. Greenhouse gas regulation In December 2015, nearly 200 nations at the United Nations climate change conference in Paris (COP21) agreed the Paris Agreement for implementation post-2020. The Paris Agreementwhich aims to hold the increase in the global average temperature to well below 2°C above pre-industrial levels and to pursue efforts to limit the temperature increase to 1.5°C above pre-industrial levels. There is no quantitative long-term emissions goal. However, countriesSignatories aim to reach global peaking of greenhouse gas (GHG) emissions as soon as possible and to undertake rapid reductions thereafter, so as to achieve a balance between human caused emissions by sources and removals by sinks of GHGs in the second half of this century. The Paris Agreement commits all partiessignatories to submit Nationally Determined Contributions (NDCs) (i.e. pledges or plans of climate action) and pursue domestic measures aimed at achieving the objectives of their NDCs. Developed country NDCs should include absolute emission reduction targets, and developing countriesSignatories are encouraged to move towards absolute emission reduction targets over time. The Paris Agreement places binding commitments on countries to report on their emissions and progress made on their NDCs and to undergo international review of collective progress. It also requires countriesrequired to submit revised NDCs every five years, whichand the revised NDC’s are expected to be more ambitious with each revision. Global assessments of progress will occur every five years, starting in 2023. On 1 June 2017, the US announced that it will withdraw from the Paris Agreement. The process for withdrawal can be completed no earlier than 4 November 2020. Recent annual United Nations climate change conferences have established a ‘Paris Rulebook’ defining how some elementsAgreement of the Paris Agreement will be implemented. Rules for implementing Article 6,rules which could enable international carbon trading to assist in meeting NDCs, have not been agreed. This has now been deferred to COP26 which is expected to take place in Glasgow, Scotland in November 2020.
2021. More stringent national and regional measures relating to the transition to a lower carbon economy, such as the UK's 2050 net zero carbon emissions commitment, can be expected in the future. These measures could increase BP’sbp’s production costs for certain products, increase compliance and litigation costs, increase demand for competing energy alternatives or products with lower-carbon intensity, and affect the sales and specifications of many of BP’sbp’s products. Further, such measures could lead to constraints on production and supply and access to new reserves, particularly due to the long term nature of many of BP’sbp’s projects. CurrentCertain current and announced GHG measures and developments potentially affecting BP’sbp’s businesses include the following:in various markets in which bp operates are summarized below. For information on steps that bp is taking in relation to climate change issues and for details of bp’s GHG reporting, see Sustainability – Net zero aims on page 49. United States In the US, BP'sbp's operations are affected by GHG regulation in a number of ways. The federal Clean Air Act (CAA), for example, regulates air emissions, permitting, fuel specifications and other aspects of our production, refining, distribution and marketing activities. Environmental Protection Agency (EPA) regulations aimed at limiting methane emissions from new and modified sources in the oil and natural gas sector in the US by 40-45% from 2012 levels by 2025 were introduced by the Obama administration. Insubject of an August 2019, however,2020, EPA final ‘policy rule’ intended to significantly revise that regulation. This rule is the EPA issued a new proposed rule to that would both rescind certain methane regulations and potentially remove storage and transmission facilities fromsubject of litigation in the regulatory scheme.D.C. Circuit. In addition, the Bureau of Land Management (BLM) in 2018 issued a new waste prevention rule which rescinded the prior 2017 rule regarding methane regulation on federal lands. The EPA rule andWhile litigation around both rules is expected to continue, the new BLM rule are being challenged by states and NGOs. The final outcome of the rule revisions and legal challengesBiden administration has taken executive action with respect to Federal regulations promulgated during the Trump administration relating to climate change, including a review of both of these rules. Other EPA GHG regulations which may affect electricity generation practices and BLM rules is uncertain. prices and have an impact on the market for fuels used to generate electricity and on renewable energy installations are in flux due to changes in approach between presidential administrations, as well as lawsuits challenging proposed regulations. In 2019, the EPA issued the final Affordable Clean Energy (ACE)(ACE) Rule, which is intended to address GHG emissions from certain existing sources in the electricity sector, and which is intended to replace the Obama-administration’sObama administration’s Clean Power Plan (CPP). A number of lawsuits have been filed regarding the legality of the ACE Rule and the repeal of the CPP regulations.regulations, and on 19 January 2021, the DC Circuit struck down the ACE rule in its entirety. The outcome with respect to these rulesBiden administration may affect electricity generation practices and prices, reliability of electricity supply, and regulatory requirements affecting other GHG emission sources in other sectors and have potential impacts on combined heat and power installations.develop new regulations that more closely mirror the CPP. The Energy Policy Act of 2005 and the Energy Independence and Security Act of 2007 impose the Renewable Fuel Standard (RFS), requiring transportation fuel sold in the United States to contain a minimum volume of renewable fuels. Certain state initiatives impose lower GHG emissions thresholds for transportation fuels (e.g., in California and Oregon). In 2019,2020, EPA promulgated regulations easing volatilitychanged its approach to Small Refinery Exemptions based on court activity. EPA is behind schedule in setting RFS requirements for certain categories2021 and we expect the administration to begin the process of gasolinesetting 2023 and revising certain elements of the RFS credit-trading programme, which is the open market for renewables credit trading.beyond volumes in 2021 as well. The GHG mandatory reporting rule, (GHGMRR), requires operators of certain facilities and producers and importers/exporters of petroleum products to file annual GHG emissions reports to be filed with the EPA. In addition toEPA quantifying direct emissions from affected facilities, producers and importers/exportersas well as volumes of petroleum products, certain natural gas liquids and GHG products are required to report product volumes and notional GHG emissions as if these products were fully combusted. A number of states, municipalities and regional organizations have responded to current and proposed federal changes easing environmental regulation with separate initiatives that affect our US operations. For example, the California cap and trade programme started in January 2012 and expanded to cover emissions from transportation fuels in 2015. The State of Washington has adopted a carbon cap rule although the state’s supreme courtSupreme Court has modified the rule to exclude coverage of sales and distribution of petroleum fuels. We expect a number of states to advance economy-wide and transport/fuels specific regulations in 2021. Our US businesses are subject to increased GHG and other environmental requirements and regulatory uncertainty, including that the Biden or any future US administrations could revise or revoke current or prior administration programs, as well as increased expenditures in having to comply with numerousdiverse and non-uniform regulatory initiatives at the state and local level. US fuel markets are affected by EPA regulation of light, medium and heavy duty vehicle emissions (both fuel economy and tailpipe standards) as well as for non-road engines and vehicles and certain large GHG stationary emission sources. California also imposes Low Emission Vehicle (LEV) and Zero Emission Vehicle (ZEV) standards on vehicle manufacturers and a number of other states, as allowed by CAA authority, have adopted standards identical to California’s standards. These regulations may impact bp’s product mix and demand for particular products in those states. In August 2020, California also entered into agreements with several carmakers to meet more demanding emissions standards in California. In 2019 the Trump administration issued the Safer Affordable Fuel-Efficient Vehicles rule rolling back the Obama administration’s fuel economy and tailpipe carbon dioxide emissions standards for passenger cars and light trucks covering model years (MY) 2021 through 2026 by locking in the 2020 standards until 2026. It has also proposed eliminating the waiver allowing California to set its own LEV and ZEV standards and for other states to adopt those standards. Litigation challenging these regulations is ongoing although the Biden | | | | | | | | | | | | | | | | 322 | | bp Annual Report and Form 20-F 2020 | | «See Glossary |
administration is expected to restore the California waiver and commence rulemaking to reinstate the stricter fuel economy and tailpipe carbon dioxide emissions standards. In January 2020, EPA solicited on a proposed rulemaking known as the Cleaner Trucks Initiative. The rule would, among other things, establish new emission standards for oxides of nitrogen (NOx) and other pollutants for highway heavy-duty engines and the Biden administration is expected to modify and continue this proposed rulemaking. California has also adopted a “Heavy-Duty Low NOx Omnibus Regulation” which will require manufacturers to comply with stricter emissions standards. The rule is being phased in, with the first phase effective in 2024. bp continues to monitor these rules for implications for fuels. European Union •The EU hasand its member states have adopted various measures seeking to reduce GHG emissions and encourage renewables. A set of regulatory
| | | | | | | BP Annual Report and Form 20-F 2019
| «See Glossary
| | 315 |
measures were adopted which included:by the EU include: a collective national reduction target for emissions not covered by the EU Emissions Trading System (EU ETS) Directive; binding national renewable energy targets (including targets in the transport sector) under the Renewable Energy Directive; and a legal framework to promote carbon capture and storage (CCS).storage. •In 2014, EU leaders adopted a climate and energy framework setting targets for the year 2030 including at least 40% cutsreductions in GHG emissions from 1990 levels. The GHG reductionlevels and in December 2020 the Council agreed an increase to a 55% reductions target from 1990 levels which is to be achieved by a 43% reduction of emissions from sectors covered bypending before the EU ETS, and a 30% GHG reduction by Member States for all other GHG emissions. Measures to achieve the 2030 targets include a significant revision of the EU ETS for Phase 4 addressing surplus allowances and the amount of free allocation for sectors prone to international competition. In November 2018 a 32% share of renewable energy and a 32.5% increase in energy efficiency was agreed which must be met by EU Member States by 2030. It also sets a renewable energy target of 14% for the transportation sector.European Parliament. •In December 2019, the European Commission proposed an ambitious ‘European Green Deal’. These proposals, willwhich require formal approval by EuropeanEU Member States to be adopted and include:include climate neutrality and increased GHG reduction targets, tightening of the emissions caps in the EU ETS, extending the EU ETS to include the maritime sector and reducing allowances allocated to airlines, implement a carbon border tax adjustment and harmonise energy taxation across the EU Member States. | | – | a climate neutrality commitment for 2050 and raising the 2030 ambition to at least 50% GHG reductions by 2030 from 1990 levels, up from the 40% currently agreed; |
| | – | a proposal to enshrine the 2050 climate-neutrality target into legislation; |
| | – | a plan to extend the Emissions Trading System to include the maritime sector and reduce the allowances allocated for free to airlines; |
| | – | a proposal to implement a carbon border tax adjustment to protect European industry from carbon leakage; and |
| | – | a review of the Energy Taxation Directive, with the aim of harmonising and directing energy taxation across the member states. |
•In October 2020 the European Commission presented an EU strategy to reduce methane emissions. The Medium Combustion Plants Directive 2015 (MCPD) regulates sulphur dioxide (SO2), nitrogen oxides (NOx)strategy sets out measures to cut methane emissions in Europe and particulatesinternationally. It presents legislative and non-legislative actions in the energy, agriculture and waste sectors, which account for around 95% of methane emissions associated with human activity worldwide. •European regulations also establish passenger car performance standards for CO2 tailpipe emissions (European Regulation (EC) No 443/2009). By 2021, the European passenger fleet emissions target for new vehicles will be 95 grams of CO2 per kilometre. This target will be achieved by manufacturing fuel efficient vehicles and monitoringvehicles using alternative, low carbon fuels such as hydrogen and electricity. •In 2019, the European Parliament and the Council adopted Regulation (EU) 2019/631 setting CO2 emission performance standards for new passenger cars and for new light commercial vehicles (vans) in the EU for the period after 2020. From a 2021 baseline, it requires EU fleet-wide reductions of carbon monoxide (CO) emissions from certain mid-size plants. It applies to new plants and15% by 2025 orand 37.5% by 2030 to existing plants, depending on their size.for passenger cars, and 15% by 2025 and 31% by 2030 for new light commercial vehicles. The National Emission Ceilings Directive 2016 (NECD) introduces stricter emissions limits from 2020 and 2030, with new indicative national targets applying from 2025. NECD has been implemented in the UK by the National Emission Ceilings Regulations 2018. Each EU Member State was also required to produce a National Air Pollution Control Programme setting out the measures it will take to ensure compliance with the 2020 and 2030 reduction commitments.
•The EU Fuel Quality Directive affects our production and marketing of transport fuels. Revisions adopted in 2009 mandatefuels including mandating reductions in the life cycle GHG emissions per unit of energy and tighter environmental fuel quality standards for petrol and diesel. •Germany is expected to launch a national emissions trading system in 2021 for transport and heating fuels. Impacted fuel suppliers in Germany will pay a fixed price for emissions certificates of EUR 25 per tonne CO2 in 2021 rising to EUR 55 per tonne by 2025. In 2026, emissions certificates will be auctioned but with prices limited between EUR 55 and EUR 65 per tonne CO2 emitted. A review of the system is expected to take place in 2025 to determine the position beyond 2026. Other •In December 20192020 the Dutch Supreme Court (De Hoge Raad) ruled that the DutchUK Government must reduce gross GHG Emissionsannounced a targeted reduction in the NetherlandsUK’s GHG emissions of at least 68% by 25% based on2030, compared to 1990 levels. The Dutch Government is expected to publish its policy proposals to achieveUK also announced an emissions trading system from 1 January 2021 onwards which would include the 25% targetsame installations in early 2020. | | • | The German Government has passed a national emissions trading law that will in a first phase include limits on emissions from transport and heating fuels. Impacted fuel suppliers in Germany will pay a fixed price for emissions certificates of EUR 25 per tonne CO2 in 2021 rising to EUR 55 per tonne by 2025. From 2026 emissions certificates will be auctioned but with prices limited between EUR 55 and EUR 65 per tonne CO2 emitted.
|
Other
Alberta Province has adopted large facility carbon emission regulations requiring reductions in carbon intensity year-on-year which can be met by improving emissions intensity, the purchase
of offsets or payments into a provincial emissions technology fund. Emissions not covered under these regulations areUK that were previously subject to escalating Federal carbon emissions backstop pricing. Additional requirements are in place relating to electricity generation sources and limits on overall oil sands emissions.the EU ETS.
The Canadian federal climate change regulations include a national backstop carbon price starting at C$20/tonne in 2019 and escalating to C$50/tonne by 2022 (or equivalent system for provinces with cap-and-trade systems), with provincial implementation of the price and associated large emitters pricing system, use of any funds generated, and outcome reporting. Newfoundland & Labrador and Nova Scotia have implemented regulations that meet equivalency requirements of the Federal regulations via economy wide carbon taxes on fuels and large emitter programs (intensity based for Newfoundland & Labrador and cap and trade for Nova Scotia).
•China is operating emission trading pilot programmes in five cities and three provinces. One of BP'sbp's subsidiaries« and one of BP’sbp’s joint venture« companies in China are participating in these schemes. China launched its national emissions trading market (initially(National ETS), initially covering the power sector only)only, politically in 2017 with a three-step roadmap (“National ETS”). The2017. On 31 December 2020, China promulgated the national regulation on National ETS will not supersede the above eight pilot programmes immediately but allow those pilot schemes to be incorporated into the national scheme gradually. In the short term, the existing pilot schemes are expected to operate in parallel covering the non-power sectors. In March 2018, the new Ministry of Ecology and Environment was established as part of the overall ministerial restructuring which absorbs the climate change responsibilities previously under the National Development and Reform Commission and takes charge of the development of the National ETS. As of December 2019,became effective on 1 February 2021, when the National ETS is still at the first phase (infrastructure development phase) and preparing for the second phase (simulation trading phase)was officially launched. •China has also adopted more stringent vehicle tailpipe emission standards and vehicle efficiency standards to address air pollution and GHG emissions. These standards will have an impact on transportation fuel product mix and overall demand. In addition, China has also introduced a mandate for sales of new energy vehicles (NEVs) commencing in 2020. This has been accelerating NEV penetration into the light vehicle sector and impact light fuel demand. For information on the steps that BP is taking in relation to climate change issues and for details of BP’s GHG reporting, see Sustainability – Environment on page 40.
Other environmental regulation CurrentIn addition to GHG regulations including current and proposed fuel and product specifications and emission controls (including control of vehicle emissions), referred to above, climate change programmes and regulation of unconventional oil and gas extraction under a number of environmental laws may have a significant effect on the production, sale and profitability of many of BP’sbp’s products.
Environmental laws also require BPbp to remediate and restore areas affected by the release of hazardous substances or hydrocarbons associated with our operations or properties. These laws may apply to sites that BPbp currently owns or operates, sites that it previously owned or operated, or sites used for the disposal of its and other parties’ waste. See Financial Statements – Note 23 for information on provisions for environmental restoration and remediation. A number of pending or anticipated governmental proceedings against certain BPbp group companies under environmental laws could result in monetary or other sanctions. Group companies are also subject to environmental claims for personal injury and property damage alleging the release of, or exposure to, hazardous substances. The costs associated with future environmental remediation obligations, governmental proceedings and claims could be significant and may be material to the results of operations in the period in which they are recognized. We cannot accurately predict the effects of future developments, such as stricter environmental laws and regulations or enforcement policies, or future events at our facilities, on the group, and there can be no assurance that material liabilities and costs will not be incurred in the future. For a discussion of the group’s environmental expenditure, see page 314321 and for a discussion of legal proceedings, see page 319.
| | | | | | 316 | | «See Glossary
| BP Annual Report and Form 20-F 2019
| |
A significant proportion of our fixed assets are located in the US and the EU. US and EU environmental, health and safety regulations significantly affect BP’s operations. Significant legislation and regulation in the US and the EU affecting our businesses and profitability, in addition to those referred to above, include the following:
United States The Trump administration has issued a number of Executive Orders affecting federal permitting and rulemaking processes that seek to reduce regulatory burdens placed on manufacturing generally and the energy industry specifically. It is not clear how much or how quickly these regulatory requirements will be reduced given statutory and rulemaking constraints and the likely legal challenges to some of these initiatives which can result in regulatory uncertainty and compliance challenges for our operations.
The National Environmental Policy Act (NEPA) requires an environmental analysis prior to undertaking any major federal action that significantly affects the environment, which includes the issuance of federal permits. The environmental reviews required by NEPA can delay, modify or block projects. State law analogues to NEPA could also limit or delay our projects. The Trump administration has taken steps to significantly modify and streamline the NEPA review process for major infrastructure projects including energy production, pipeline and transmission systems. The timing and effect on our operations remain uncertain and any final rule is likely to face legal challenges.
As discussed above under ‘Greenhouse gas regulation’, US fuel markets are affected by EPA regulation of light, medium and heavy duty vehicle emissions (both fuel economy and tailpipe standards) as well as for non-road engines and vehicles and certain large GHG stationary emission sources. California also imposes Low Emission Vehicle (LEV) and Zero Emission Vehicle (ZEV) standards on vehicle manufacturers and a number of other states, as allowed by CAA authority, have adopted standards identical to California’s standards. These regulations may impact fuel demand and product mix in California and those states adopting LEV and ZEV standards and may impact BP’s product mix and demand for particular products. The Trump administration has challenged California’s authority to impose stricter vehicle emission standards, which are followed by numerous other states, and the outcome of this challenge remains uncertain.
In 2018 the Trump administration proposed rolling back the Obama administration’s fuel economy and tailpipe carbon dioxide emissions standards for passenger cars and light trucks covering model years (MY) 2021 through 2026 by locking in the 2020 standards until 2026. It has also proposed eliminating the waiver allowing California to set its own LEV and ZEV standards and for other states to adopt standards identical to California. In September 2019, NHTSA and EPA issued part one of One National Program for fuel economy regulation by announcing EPA's decision to withdraw California's waiver of pre-emption for its LEV and ZEV standards and finalizing the Department of Transportation’s regulatory text relating to pre-emption of state fuel economy standards. California and twenty-five states and cities filed a lawsuit challenging those regulations. The outcome of that litigation is uncertain.
In January 2020, EPA issued an Advance Notice of Proposed Rule (ANPR) soliciting pre-proposal comments on a rulemaking known as the Cleaner Trucks Initiative. The rule would establish new emission standards for oxides of nitrogen (NOx) and other pollutants for highway heavy-duty engines. It would seek to streamline and improve certification procedures to reduce costs for engine manufacturers. California is also working on tighter heavy-duty engine NOx standards. EPA has not notified fuels suppliers of any expected fuel specification changes that would be included with these new engine standards and BP continues to monitor this rule for implications for fuels.
•The Clean Water Act regulates wastewater and other effluent discharges from BP’sbp’s facilities, and BPbp is required to obtain discharge permits, install control equipment and implement operational controls and preventative measures. •The Resource Conservation and Recovery Act regulates the generation, storage, transportation and disposal of wastes associated with our operations and can require corrective action at locations where such wastes have been disposed of or released. bp has incurred, or is likely to incur, liability under RCRA or similar state laws in connection with sites bp operates or previously operated. •The Comprehensive Environmental Response, Compensation, and Liability Act (CERCLA) can, in certain circumstances, impose the entire cost of investigation and remediation on a party who owned or operated a site contaminated with a hazardous substance, or who arranged for disposal of a hazardous substance at a site. BPbp has incurred, or is likely to incur, liability under CERCLA or similar state laws, including costs attributed to insolvent or unidentified parties. BPbp is also subject to claims for remediation costs and natural resource damages under CERCLA and other federal and state laws which also require notification of spills to designated government agencies.laws. | | | | | | | | | | | | | | | «See Glossary | | bp Annual Report and Form 20-F 2020 | | 323 |
•The Emergency Planning and Community Right-to-Know Act requires reporting on the storage, use and releases of certain quantities of listed hazardous substances to designated government agencies. •The Toxic Substances Control Act (TSCA) regulates BP’sbp’s manufacture, import, export, sale and use of chemical substances and products. In addition, EPA has revised processes and procedures for prioritizationprioritisation of existing chemicals for risk evaluation, assessment and management. Agency actions and announcements are monitored regularly to identify developments with potential impacts on chemical substances important to BPbp products and operations. Thus far, bp has identified two substances have been identified for specific ongoing monitoring of developments and impacts. •The Occupational Safety and Health Act imposes workplace safety and health requirements on BPbp operations along with significant process safety management obligations, (PSM), requiring continuous evaluation and improvement of operational practices to enhance safety and reduce workplace emissions at gas processing, refining and other regulated facilities. The US Occupational Safety and Health Administration (OSHA) conducts inspections under the National Emphasis Program to ensure compliance with PSM requirements in both refineries and chemical plants. •The Oil Pollution Act 1990 (OPA) imposes operational requirements, liability standards and other obligations governing the transportation of petroleum products in US waters. States may impose additional obligations. Alaska and the West Coast states currently have the most demanding state requirements. •The Outer Continental Shelf Land Act, the MLAMineral Leasing Act and other statutes give the Department of Interior (DOI) and the BLM authority to regulate operations and air emissions, including equipment and testing, on offshore and onshore operations on federal lands subject to DOI authority.authority. •The Endangered Species Act (ESA) and Marine Mammal Protection Act protect certain species’ habitats from adverse human impacts by restricting operations or development at certain times and in certain places. With an increasing numberIn 2020, the US Fish and Wildlife Service published two proposed rules impacting designations under ESA, but on 20 January 2021 the Biden administration announced a review of species being protected, we have experienced increasing restrictions on our activities.these proposed rules reducing the scope of habitat protections. European Union •The Industrial Emissions Directive (IED) 2010 provides the framework for granting permits for major industrial sites. It lays down rules on integrated prevention and control of air, water and soil pollution arising from industrial activities. As part of the IED framework, additional emission limit values are informed by sector specific and cross-sector Best Available Technology (BAT) Conclusions. These include the BAT Conclusions for the refining sector, for large combustion plants as well as common wastewater and waste gas treatment and management systems in the chemical sector thesesector. These may require BPbp to further reduce its emissions, particularly its air and water emissions.emissions. •The EU regulationRegulation on substances that deplete the ozone depleting substanceslayer 2009 (ODS Regulation) requires companies to reduce the use of ozone depleting substances (ODSs) and phase out use of certain ODSs.
| | | | | | | BP Annual Report and Form 20-F 2019
| «See Glossary
| | 317 |
BP bp continues to replace ODSs in refrigerants and/or equipment in the EU and elsewhere, in accordance with the Montreal Protocol and related legislation.
•The Kigali AmendmentMedium Combustion Plants Directive 2015 (MCPD) regulates sulphur dioxide (SO2), nitrogen oxides (NOx) and particulates emissions and monitoring of carbon monoxide (CO) emissions from certain mid-size plants. It applies to the Montreal Protocol (which aimsnew plants and by 2025 or 2030 to reduce hydrofluorocarbons) came into forceexisting plants, depending on 1 January 2019. In addition, the EU regulation on fluorinated GHGstheir size. •The National Emission Ceilings Directive 2016 (NECD) introduces stricter emissions limits from 2020 and 2030, with high global warming potential (the F-gas Regulations) require a phase-out of certain hydrofluorocarbons, based on global warming potential. European regulations also establish passenger car performance standards for CO2 tailpipe emissions (European Regulation (EC) No 443/2009). By 2021, the European passenger fleet emissions target for new vehicles will be 95 grams of CO2 per kilometre. This target will be achieved by manufacturing fuel efficient vehicles and vehicles using alternative, low carbon fuels such as hydrogen and electricity. In addition, vehicle emission test cycles and vehicle type approval procedures are being updated to improve accuracy of emission and efficiency measurements. European vehicle CO2 emission regulations also impact the fuel efficiency of vans. By 2020, the EU fleet of newly registered vans must meet a target of 147 grams of CO2 per kilometre, which is 19% below the 2012 fleet average.
In 2019, the European Parliament and the Council adopted Regulation (EU) 2019/631 setting CO2 emission performance standards for new passenger cars and for new light commercial vehicles (vans)indicative national targets applying from 2025. NECD has been implemented in the UK by the National Emission Ceilings Regulations 2018. Each EU forMember State was also required to produce a National Air Pollution Control Programme setting out the period after 2020. From a 2021 baseline,measures it requires EU fleet-wide reductions of 15% by 2025will take to ensure compliance with the 2020 and 37.5% by 2030 for passenger cars, and 15% by 2025 and 31% by 2030 for new light commercial vehicles.reduction commitments.
•The EU Registration, Evaluation Authorization and Restriction of Chemicals (REACH) Regulation 2006 requires registration of chemical substances manufactured in or imported into the EU, together with the submission of relevant hazard and risk data. REACH affects our manufacturing or trading/import operations in the EU. BPbp maintains compliance by checking whether imports are covered by the registrations of non-EU suppliers’ representatives, preparing and submitting registration dossiers to cover new manufactured and imported substances, and updating previously submitted registrations as required. Some substances registered previously, including substances supplied to us by third parties for our use, are now subject to evaluation and review for potential authorization or restriction procedures, and possible banning, by the European Chemicals Agency and EU member stateMember State authorities. In addition, BP’sbp’s facilities and operations in several EU countries continue to undergo REACH compliance inspections by the competent authority for the respective EU member state.Member State. An amendment to the Annex of the Regulation on classification, labelling and packaging of substances and mixture (CLP Regulation) requires harmonized notification of information on hazardous materials (certain lubricant and fuel formations) to EU member stateMember State poison centres. The uniform notification rules will apply as of January 2020 for consumer products, from 2021 for professional and 2024 for industrial uses. •The EU Offshore Safety Directive was adopted in 2013. Its purpose is to introduce a harmonized regime aimed at reducing the potential environmental, health and safety impacts of the offshore oil and gas industry throughout EU waters. The Directive has been implemented in the UK primarily through the Offshore Installations (Offshore Safety Directive) (Safety Case etc.) Regulations 2015. •The Water Framework Directive (WFD) published in 2000 aims to protect the quantity and quality of ground and surface waters of the EU member states.Member States. The implementation in the EU member statesMember States is still ongoing, planned to be finalised by 2027. At the moment aA Fitness Check (comprehensive policy evaluation) of the EU Water Legislation is ongoing, also coveringlaunched in 2019 concluded that the WFD and its daughter directives (Groundwater Directive and Environmental Quality Standards Directive). The outcomeis broadly fit for purpose. Future proceedings on the determination of pollutants/priority substances as well as environmental quality standards in line with the policy evaluation, expected to be published in 2020,WFD may require additional compliance efforts and increased costs for managing freshwater withdrawals and discharges from BP’sbp’s EU operations. United Kingdom Following the UK’s exit from the European Union on 31 January 2020, the UK entered a transition period which ran until 31 December 2020. During the transition period, most EU law continued to apply to the UK and therefore to bp’s UK business during that period. From 1 January 2021, operative EU laws were retained in UK law by the European Union (Withdrawal) Act 2018. The vast majority of environment related statutory instruments passed by the UK Government in anticipation of Brexit have included no substantive changes to the current EU underlying regime, but rather seek to make the amendments required to allow their continued operation after the transition period. The UK Government’s Environment Bill and 25 Year Plan will be central to the UK’s environmental regime going forward but further changes are as yet uncertain. Other countries and regions Turkey has published REACH-like regulations, known as KKDIK, as well as related implementation schedules and substance registrations.
Regulations governing the discharge of treated water have also been developed in countries outside of the US and EU. This includes regulations in Trinidad and Angola.Angola which impacts bp’s production operations in those countries. In Trinidad, BP is upgrading itsbp commissioned a new waste water treatment facilitiesplant in 2020 to meet consent levels agreed with the regulators to apply water discharge rules arising from the Certificate of Environmental Clearance (CEC) Regulations 2001 and associated Water Pollution Rules 2007. In Angola, BPbp has upgraded produced water treatment systems to meet revised oil in water limits for produced water discharge under Executive Decree ED 97-14. The Abidjan Convention, along with the Additional Protocol published in 2012, sets environmental quality standards for the discharge of chemicals to the marine environment. The convention and associated protocols has been ratified by 19 African nations including Senegal and Mauritania. BPbp is currently designingconstructing the offshore facilities to include produced water management systems to meet the environmental quality standards for our future gas operations in Mauritania and Senegal. | | | | | | | | | | | | | | | | 324 | | bp Annual Report and Form 20-F 2020 | | «See Glossary |
Environmental maritime regulations BP’sbp’s shipping operations are subject to extensive national and international regulations governing liability, operations, training, spillpollution prevention, liability, and insurance. These include:
•Liability and spill prevention and planning requirements governing, among others, tankers, barges, and offshore facilities are imposed by OPA in US waters. OPA also mandates a levy on imported and domestically produced oil to fund oil spill responses. Some states, including Alaska, Washington, Oregon and California, impose additional liability for oil spills. Outside US territorial waters, BP Shippingbp shipping tankers are subject to international pollution prevention, liability, spill response and preparedness regulations underdeveloped through the UN’s International Maritime Organization (IMO), including the International Convention on Civil Liability for Oil Pollution Damage, the International Convention for the Prevention of Pollution from Ships (MARPOL), the International Convention on Oil Pollution, Preparedness, Response and Co-operation, and the International Convention on Civil Liability for Bunker Oil Pollution Damage. In April 2010, the Hazardous and Noxious Substance (HNS) Protocol 2010 was adopted to address issues that have inhibited ratification of the International Convention on Liability and Compensation for Damage in Connection with the Carriage of Hazardous and Noxious Substances by Sea 1996. As at 31 December 2019,2020, the HNS Convention had not entered into force. •A global sulphur cap of 0.5% applies to marine fuel under MARPOL. In order to comply, ships will either need to consume low sulphur marine fuels, operate on alternative low sulphur fuels such as LNG or implement approved abatement technology to enable them to meet the low sulphur emissions requirements while continuing to use higher sulphur fuel. This new global cap willdoes not alter the lower limits that apply in the sulphur oxides Emissions Control Areas established by the IMO. In December 2019 EPA finalized measures to facilitate smooth implementation of IMO 2020. EPA finalized technical corrections that will allow fuel suppliers to distribute distillate diesel fuel that complies with the 5,000 ppm international sulphur standard for ships instead of the fuel standards that otherwise apply to distillate diesel fuel in the United States. The EPA clarified that fuel meeting the 5,000 ppm global sulphur cap may not be used inside of Emission Control Area (ECA) boundaries.
•The Convention for the Protection of the Marine Environment of the North-East Atlantic (OSPAR), aims to protect the marine environment of the North-East Atlantic. The OSPAR 2012 Recommendation 2001/1 regulates the management of produced water from offshore installations in the North Sea including reductions in the total quantity of oil in produced water and a performance standard for dispersed oil in produced water discharged into the sea. GuidelinesGuideline for the implementation of a risk-based approach to the management of produced water discharges from offshore installations in the North Sea supports a key goal of achievingworking towards eliminating harmful discharges. In 2020 the International Association of Oil and Gas Producers issued a reductionreport “Oil And Gas Risk Based Assessment of oilOffshore Produced Water Discharges” which presents industry good practice and aims to broaden the understanding and acceptance of Risk Based Assessment (RBA) techniques internationally and improve consistency in produced water discharged into the sea by 2020 to a level which
| | | | | | 318 | | «See Glossary
| BP Annual Report and Form 20-F 2019
| |
will adequately ensure that eachapplication of those discharges will present no harm to the marine environment.assumptions, levels of conservatism, and selection of risk endpoints.
To meet its financial responsibility requirements, BPbp Shipping maintains marine oil pollution liability insurance in respect of its operated ships to a maximum limit of $1 billion for each occurrence through mutual insurance associations (P&I Clubs), although there can be no assurance that a spill willwould necessarily be adequately covered by insurance or that liabilities willwould not exceed insurance recoveries. Legal proceedings
Proceedings relating to the Deepwater Horizon oil spill
Introduction
BP Exploration & Production Inc. (BPXP) was lease operator of Mississippi Canyon, Block 252 in the Gulf of Mexico, where the semi-submersible rig Deepwater Horizon was deployed at the time of the 20 April 2010 explosion and fire and resulting oil spill (the Incident). Lawsuits and claims arising from the Incident were brought principally in US federal and state courts.
Many of the lawsuits in federal court relating to the Incident were consolidated into two multi-district litigation proceedings, one in federal district court in Houston for the securities cases (MDL 2185) and another in federal district court in New Orleans for the remaining cases (MDL 2179). A Plaintiffs’ Steering Committee (PSC) was established to act on behalf of individual and business plaintiffs in MDL 2179. All federal and state governmental claims in relation to the Incident have now been settled or dismissed and the 2014 administrative agreement with the US Environmental Protection Agency and BP’s obligations thereunder ended in March 2019. The remaining proceedings arising from the Incident are discussed below.
PSC settlements
PSC settlements – Economic and Property Damages Settlement Agreement
In 2012 the Economic and Property Damages Settlement was entered into with the PSC to resolve certain economic and property damage claims.
The economic and property damages claims process, which is under court supervision through the settlement claims process established by the Economic and Property Damages Settlement, continued in 2019. Only a very small number of business economic loss claims remain to be determined, although certain business economic loss claims continue to be appealed by BP and/or the claimants.
PSC settlements – Medical Benefits Class Action Settlement
In 2012 the Medical Benefits Class Action Settlement (Medical Settlement) was entered into with the PSC. It involves payments to qualifying class members based on a matrix for certain Specified Physical Conditions (SPCs), as well as a 21-year Periodic Medical Consultation Program (PMCP) for qualifying class members, and also includes provisions regarding class members pursuing claims for later-manifested physical conditions (LMPCs).
The deadline for submitting SPC and PMCP claims was 12 February 2015. A total of 37,226 claims have been submitted. As of 31 December 2019, 27,604 claims (comprising 22,831 SPC claims and 4,773 PMCP claims) have been approved for compensation totalling approximately $67 million; 9,621 claims have been denied; and 1 claim is pending determination.
In order to seek compensation from BP for an LMPC, class members must file a notice with the Medical Claims Administrator within 4 years after the date of first diagnosis of the LMPC. As of 31 December 2019, there were 2,701 pending lawsuits brought by class members claiming LMPCs.
Other civil complaints – economic loss
The vast majority of economic loss and property damage claims from individuals and businesses that either opted out of the 2012 PSC settlement and/or were excluded from that settlement have
been settled or dismissed. On 19 July 2017 the district court held that maritime claims by 215 plaintiffs would be subject to further proceedings in MDL 2179 under OPA 90 and under general maritime law. Most of these have now been either settled or dismissed. On 5 February 2019, the district court issued a case management order addressing the 184 remaining plaintiffs in MDL 2179 with claims for economic loss or property damage. The district court ordered BP and 69 of those plaintiffs to undertake mandatory mediation and so far this has resulted in settlement of more than 40 plaintiffs’ claims. The district court ordered that BP file any dispositive motions as to the other 115 plaintiffs (principally Mexican-resident plaintiffs who are fishermen or fishing cooperatives) by 7 March 2019. BP moved to dismiss those 115 claims on 7 March 2019, and its motion remains pending.
Other civil complaints – personal injury
The vast majority of post-explosion clean-up, medical monitoring and personal injury claims from individuals that either opted out of the 2012 PSC settlement and/or were excluded from that settlement have been dismissed.
In 2019, the district court in MDL 2179 determined in a series of proceedings that 923 plaintiffs had post-explosion clean-up, medical monitoring and personal injury claims that complied with the court’s prior order to show cause why their claims should not be dismissed. Five plaintiffs have appealed their dismissal to the Fifth Circuit. Briefing is ongoing and oral argument and a decision are expected in 2020.
Individual securities litigation
Following court approval of the settlement of a securities class action brought on behalf of a class of post-explosion American depository share (ADS) holders in 2017, there remained individual cases filed in state and federal courts by pension funds, investment funds and advisers. These were against BP entities and several current and former officers and directors seeking damages for alleged losses those funds suffered because of their purchases and/or holdings of BP ordinary shares and, in certain cases, ADSs. The funds assert claims under English law and, for plaintiffs purchasing ADSs, federal securities law. All of the cases, with the exception of one case that has been stayed, were transferred to MDL 2185. As at 31 December 2019, 28 actions on behalf of 115 plaintiffs remained pending in MDL 2185. Pursuant to a scheduling order issued by the district court, fact and expert discovery with respect to 16 representative plaintiffs is scheduled to proceed through to August 2020 and dispositive motions are scheduled to be filed by 27 October 2020.
Canadian class actions
Following various legal proceedings, on 26 February 2016, a plaintiff seeking to assert claims under Canadian law against BP on behalf of a class of Canadian residents who allegedly suffered losses because of their purchase of BP ordinary shares and ADSs filed a motion in the Court of Appeal for Ontario to lift a stay on the action. The plaintiff’s motion was granted on 29 July 2016. On 1 September 2017 the court granted in part and denied in part BP’s motion for summary judgment, limiting the case to three alleged misstatements and narrowing the class period. On 3 April 2018, the Court of Appeal for Ontario affirmed that decision. On 24 June 2019, the plaintiff filed an amended complaint adding fraud claims. On 8 November 2019, the court granted BP’s motion to dismiss the case in its entirety. On 6 December 2019, the plaintiff appealed that decision.
Non-US government lawsuits
On 18 October 2012, before a Mexican Federal District Court located in Mexico City, a class action complaint was filed against BP America Production Company (BPAPC) and other BP subsidiaries. The plaintiffs, who allegedly are fishermen, are seeking, among other things, compensatory damages for the class members who allegedly suffered economic losses, as well as an order requiring BP to remediate environmental damage resulting from the Incident, to provide funding for the preservation of the environment and to conduct environmental impact studies in the Gulf of Mexico for the next 10 years. On 27 June 2018, BP answered the complaint by seeking dismissal on various grounds including that no oil reached Mexican waters or land and there was no economic or environmental harm in Mexico.
| | | | | | | BP Annual Report and Form 20-F 2019
| «See Glossary
| | 319 |
On 3 December 2015 and 29 March 2016, Acciones Colectivas de Sinaloa (ACS) filed two class actions (which have since been consolidated) in a Mexican Federal District Court on behalf of several Mexican states against BPXP, BPAPC, and other purported BP subsidiaries. In these class actions, plaintiffs seek an order requiring the BP defendants to repair the damage to the Gulf of Mexico, to pay penalties, and to compensate plaintiffs for damage to property, to health and for economic loss. BPXP and BPAPC opposed class certification and sought dismissal, principally on the basis that no oil reached Mexican waters or land and there was no economic or environmental harm in Mexico. On 25 September 2019, the court certified the class. On 15 October 2019, BP appealed that decision.
Other legal proceedings
FERC and CFTC matters
Following an investigation by the US Federal Energy Regulatory Commission (FERC) and the US Commodity Futures Trading Commission (CFTC) of several BP entities, the Administrative Law Judge of the FERC ruled on 13 August 2015 that BP manipulated the market by selling next-day, fixed price natural gas at Houston Ship Channel in 2008 in order to suppress the Gas Daily index and benefit its financial position. On 11 July 2016 the FERC issued an Order affirming the initial decision and directing BP to pay a civil penalty of $20.16 million and to disgorge $207,169 in unjust profits. On 10 August 2016, BP filed a request for rehearing with the FERC. BP strongly disagrees with the FERC’s decision and will ultimately appeal to the US Court of Appeals if necessary.
Lead paint matters
Since 1987, Atlantic Richfield Company (Atlantic Richfield), a subsidiary of BP, has been named as a co-defendant in numerous lawsuits brought in the US alleging injury to persons and property caused by lead pigment in paint. The majority of the lawsuits have been abandoned or dismissed against Atlantic Richfield. Atlantic Richfield is named in these lawsuits as alleged successor to International Smelting and Refining and another company that manufactured lead pigment during the period 1920-1946. The plaintiffs include individuals and governmental entities. Several of the lawsuits purport to be class actions. The lawsuits seek various remedies including compensation to lead-poisoned children, cost to find and remove lead paint from buildings, medical monitoring and screening programmes, public warning and education of lead hazards, reimbursement of government healthcare costs and special education for lead-poisoned citizens and punitive damages. No lawsuit against Atlantic Richfield has been settled nor has Atlantic Richfield been subject to a final adverse judgment in any proceeding. The amounts claimed and, if such suits were successful, the costs of implementing the remedies sought in the various cases could be substantial. While it is not possible to predict the outcome of these legal actions, Atlantic Richfield believes that it has valid defences. It intends to defend such actions vigorously and believes that the incurrence of liability is remote. Consequently, BP believes that the impact of these lawsuits on the group’s results, financial position or liquidity will not be material.
Scharfstein v. BP West Coast Products, LLC
A class action lawsuit was filed against BP West Coast Products, LLC (BPWCP) in Oregon State Court under the Oregon Unlawful Trade Practices Act on behalf of customers who used a debit card at ARCO gasoline stations in Oregon during the period 1 January 2011 to 30 August 2013, alleging that ARCO sites in Oregon failed to provide sufficient notice of the 35 cents per transaction debit card fee. In January 2014, the jury rendered a verdict against BPWCP and awarded statutory damages of $200 per class member. On 25 August 2015, the trial court determined the size of the class to be slightly in excess of two million members. On 31 May 2016 the trial court entered a judgment against BPWCP for the amount of $417.3 million. On 31 May 2018 the Oregon Court of Appeals affirmed the trial court’s ruling. In March 2019, BP and the Plaintiffs agreed to a settlement of the class action lawsuit, subject to final court approval. On 4 June 2019 the court granted final approval of the settlement agreement. The judgment dismissing the case was entered on 13 June 2019. No appeal was taken from the judgment on or before the
14 July 2019 deadline. On 15 July 2019, BP made its first payment under the terms of the settlement agreement. The second and final payment is due in July 2020.
Climate change
BP p.l.c., BP America Inc. and BP Products North America Inc. are co-defendants with other oil and gas companies in multiple lawsuits brought in various state courts on behalf of several US cities and counties, one state, and a crab fishing industry association. In the lawsuits, the plaintiffs generally plead a variety of legal theories seeking to hold the defendant companies responsible for impacts allegedly caused by and/or relating to climate change and claim damages. All of the cases remain at relatively early stages.
Louisiana Coastal restoration
Six coastal parishes and the State of Louisiana have filed over 40 separate lawsuits in state courts in Louisiana against various oil and gas companies seeking damages for coastal erosion. BP entities are defendants in 17 of these cases. The lawsuits allege that the defendants' historical operations in oil fields within the Louisiana onshore coastal zone failed to comply with state permits and/or were conducted without the required coastal use permits. The plaintiffs seek unspecified statutory penalties and damages, including the costs of restoring coastal wetlands allegedly impacted by oil field operations. All of the cases are at relatively early stages.
In addition, four private landowners have filed separate claims in the state courts in Jefferson and Plaquemines Parishes of Louisiana for restoration damages related to alleged impacts to their marshlands associated with historic oil field operations. BP entities are defendants in three of these private landowner cases.
International trade sanctions During the period covered by this report, non-US subsidiaries«, or other non-US entities of BP, conducted limited activities in, or with persons from, certain countries identified by the US Department of State as State Sponsors of Terrorism or otherwise subject to US and EU sanctions (Sanctioned Countries). Sanctions restrictions continue to be insignificant to the group’s financial condition and results of operations. BP monitors its activities with Sanctioned Countries, persons from Sanctioned Countries and individuals and companies subject to US, EU and EU(following the end of the Brexit transition period) UK sanctions and seeks to comply with applicable sanctions laws and regulations. BP has a 28.8%28.83% interest in and operates the Azerbaijan Shah Deniz field in Azerbaijan (Shah Deniz), has a 28.83% interest in and performs some operations for a related gas pipeline entity, South Caucasus Pipeline Company Limited (SCPC), and has a 23% non-operating interest in a related gas marketing entity, Azerbaijan Gas Supply Company Limited (AGSC). Naftiran Intertrade Co. Limited and NICO SPV Limited (collectively, NICO) have a 10% non-operating interest in each of Shah Deniz and SCPC and an 8% non-operating interest in AGSC. Shah Deniz, SCPC and AGSC continue in operation as they were excluded from the main operative provisions of the EU regulations as well as from the application of the US sanctions and fall within the exception for certain natural gas projects under Section 603 of the Iran Threat Reduction and Syria Human Rights Act of 2012 (ITRA). On 3 December 2018 BP entered into an agreement with, among others, SOCAR and NICO pursuant to which SOCAR shall paypays to BP Exploration Shah Deniz(Shah Deniz) Limited (BPXSD), as the Shah Deniz Operator, an amount in respect ofoperator, compensation for NICO’s waiver of its right to lift its share of Shah Deniz condensate. Such amounts shall beare used to cover cash calls to NICO in respect of operating costs due from NICO to BPXSD. On 27 November 2019,26 October 2020, OFAC issued a newan amended licence in relation to these arrangements. Following the imposition in 2011 of further US and EU sanctions against Syria, BP terminated all sales of crude oil and petroleum products into Syria, though BP continues to supply aviation fuel to non-governmental Syrian resellers outside of Syria. BP has a joint arrangement in Cuba which imports, manufactures, markets and sells lubricants. During 2014, the US and the EU imposed sanctions on certain sectors of the Russian activities,economy (energy, finance and defence/military) and on certain individuals and entities, including Rosneft. CertainThese sectoral sanctions also apply to entities in which entitiesinclude restrictions on the relevant
| | | | | | 320 | | «See Glossary
| BP Annual Report and Form 20-F 2019
| |
sectoralAdditional US sanctions list own ahave been imposed since 2014, broadening the scope of US sanctions on Russia-related activity to include certain percentage interest. In August 2017, Russia related sanctions were passed ininternational deep water, shale, and offshore Arctic projects as well as the US which target among other things: (i)provision of goods and services for Russian energy export pipelines; (ii) privatisationpipelines. As of state owned assets in Russia; and (iii) certain international offshore Arctic, deepwater and/or shale exploration and production oil projects. 1 January 2021, as a result of the UK’s exit from the EU, the UK has also imposed Russian-related sanctions, which are broadly similar to existing EU sanctions.
We are not aware of any material adverse effect on our current income and investment in Russia or elsewhere as a consequence of thosethese sanctions. BP maintains bank accounts and has registered and paid required fees to maintain registrations of patents and trademarks in certain Sanctioned Countries. BP has equity interests in non-operated joint arrangements«with air fuel sellers, resellers, and fuel delivery services around the world. From time to time, the joint arrangement operator or other partners may sell or deliver fuel to airlines from Sanctioned Countries or flights to Sanctioned Countries, without BP's involvement. BP has no control over the activities non-controlled associates«may undertake in Sanctioned Countries or with persons from Sanctioned Countries. Disclosure pursuant to ITRA Section 219 To our knowledge, none of BP’s activities, transactions or dealings are required to be disclosed pursuant to ITRA Section 219.219, with the following possible exceptions. On 17 July 2018, BP Iran Limited terminated its lease of an office in Tehran. The office had been used for administrative activities. In 2020, taxes with an aggregate US dollar equivalent value of approximately $20,000 were paid from a BP trust account held with Tadvin Co. to Iranian public entities. No gross revenues or net profits were attributable to these activities. BP has a 29.3% interest in Middle East Lubricants Company LLC (Melubco), which is established and manufactures lubricants in the United Arab Emirates. In May 2020, Melubco successfully appealed an Iranian court judgment obtained against it in absentia for non-payment of shipping fees. The applicant, an Iranian shipping company, had confused Melubco with an unrelated, but similarly named, Iranian entity. In order to do so, Melubco paid court filing fees equivalent to approximately $3,000 to the Tehran Judicial Services Office. Melubco does not, and has never, done business in Iran.
| | | | | | | | | | | | | | | «See Glossary | | bp Annual Report and Form 20-F 2020 | | 325 |
Material contracts On 4 April 2016 the district court approved the Consent Decree among BP Exploration & Production Inc., BP Corporation North America Inc., BP p.l.c., the United States and the states of Alabama, Florida, Louisiana, Mississippi and Texas (the Gulf states) which fully and finally resolved any and all natural resource damages (NRD) claims of the United States, the Gulf states, and their respective natural resource trustees and all Clean Water Act (CWA) penalty claims, and certain other claims of the United States and the Gulf states. Concurrently, the definitive Settlement Agreement that BPbp entered into with the Gulf states (Settlement Agreement) with respect to State claims for economic, property and other losses became effective. BPbp has filed the Consent Decree and the Settlement Agreement as exhibits to its Annual Report on Form 20-F 20192020 filed with the SEC. For further details of the Consent Decree and the Settlement Agreement, see Legal proceedings in BP bp Annual Report and Form 20-F 2015.
Property, plant and equipment BPbp has freehold and leasehold interests in real estate and other tangible assets in numerous countries, but no individual property is significant to the group as a whole. For more on the significant subsidiaries« of the group at 31 December 20192020 and the group percentage of ordinary share capital see Financial statements – Note 37. For information on significant joint ventures« and associates« of the group see Financial statements – Notes 16 and 17.
Related-party transactions Transactions between the group and its significant joint ventures and associates are summarized in Financial statements – Note 16 and Note 17. In the ordinary course of its business, the group enters into transactions with various organizations with which some of its directors or executive officers are associated. Except as described in this report, the group did not have any material transactions or transactions of an unusual nature with, and did not make loans to, related parties in the period commencing 1 January 20192020 to 32 March 2020.2021. Corporate governance practices In the US, BPbp ADSs are listed on the New York Stock Exchange (NYSE). The significant differences between BP’sbp’s corporate governance practices as a UK company and those required by NYSE listing standards for US companies are listed as follows: Independence BP has adopted a robust set ofIn 2020 bp continued to apply its board governance principles, whichprinciples. These reflect the UK Corporate Governance Code approach to corporate governance. As such, the way in which BPbp makes determinations of directors’ independence differs from the NYSE rules. As set out on page 88, from 1 January 2021 bp has adopted terms of reference for the board and each of its committees.
BP’sbp’s board governance principles require that all non-executive directors be determined by the board to be ‘independent in character and judgement and free from any business or other relationship which could materially interfere with the exercise of their judgement’. The BPbp board has determined that, in its judgement, all of the non-executive directors are independent. In doing so, however, the board did not explicitly take into consideration the independence requirements outlined in the NYSE’s listing standards.
Committees BPbp has a number of board committees that are broadly comparable in purpose and composition to those required by NYSE rules for domestic US companies. For instance, BPbp has a chairman’s (rather than executive) committee and remuneration (rather than a compensation) committee. BPbp also has an audit committee, which NYSE rules require for both US companies and foreign private issuers. These committees are composed solely of non-executive directors whom the board has determined to be independent, in the manner described above.
The BPbp board governance principles prescribe the composition, main tasks and requirements of each of the committees (see the board committee reports on pages 90-99)92-102 and 105). BP hasTherefore, during 2020 bp did not therefore, adoptedhave separate charters for each committee butcommittee. As from the start of 2021 each of the board will focus on developing a new corporate governance framework as the successor to the BP governance principles. This framework will reinforce the effectivenesscommittees has adopted its own terms of the internal control frameworkreference which set out their respective roles and be more closely aligned with BP’s new purpose and ambition.responsibilities. Under US securities law and the listing standards of the NYSE, BPbp is required to have an audit committee that satisfies the requirements of Rule 10A-3 under the Exchange Act and Section 303A.06 of the NYSE Listed Company Manual. BP’sbp’s audit committee complies with these requirements. The BPbp audit committee does not have direct responsibility for the appointment, reappointment or removal of the independent auditors. Instead, it follows the UK Companies Act 2006 and the UK Corporate Governance code 2018 by making recommendations to the board on these matters for it to put forward for shareholder approval at the AGM. One of the NYSE’s additional requirements for the audit committee states that at least one member of the audit committee is to have ‘accounting or related financial management expertise’. The board determined that Brendan Nelson possesses such expertise and also possesses the financial and audit committee experiences set forth in both the UK Corporate Governance Code and SEC rules (see Audit committee report on page 91)94). Mr Nelson is the audit committee financial expert as defined in Item 16A of Form 20-F. Shareholder approval of equity compensation plans The NYSE rules for US companies require that shareholders must be given the opportunity to vote on all equity-compensation plans and material revisions to those plans. BPbp complies with UK requirements that are similar to the NYSE rules. The board, however, does not explicitly take into consideration the NYSE’s detailed definition of what are considered ‘material revisions’. Code of ethics The NYSE rules require that US companies adopt and disclose a code of business conduct and ethics for directors, officers and employees. BPbp has adopted a code of conduct, which applies to all employees and members of the board, and has board governance principles that address the conduct of directors. In addition BPbp has adopted a code of ethics for senior financial officers as required by the SEC. BPbp considers that these codes and policies address the matters specified in the NYSE rules for US companies.
| | | | | | | BP Annual Report and Form 20-F 2019
| «See Glossary
| | 321 |
Code of ethics The company has adopted a code of ethics for its group chief executive, chief financial officer, group controller, group head of audit and chief accounting officer as required by the provisions of Section 406 of the Sarbanes-Oxley Act of 2002 and the rules issued by the SEC. There have been no waivers from the code of ethics relating to any officers. BPbp also has a code of conduct, which is applicable to all employees, officers and members of the board. This was updated (and published) in July 2014.
Controls and procedures Evaluation of disclosure controls and procedures The company maintains ‘disclosure controls and procedures’, as such term is defined in Exchange Act Rule 13a-15(e), that are designed to ensure that information required to be disclosed in reports the company files or submits under the Exchange Act is recorded, processed, summarized and reported within the time periods specified in the Securities and Exchange Commission rules and forms, and that such information is accumulated and communicated to management, including the company’s group chief executive and chief financial officer, as appropriate, to allow timely decisions regarding required disclosure. In designing and evaluating our disclosure controls and procedures, our management, including the group chief executive and chief financial officer, recognize that any controls and procedures, no matter how well designed and operated, can provide only reasonable, not absolute, assurance that the objectives of the disclosure controls and procedures are met. Because of the inherent limitations in all control systems, no evaluation of controls can provide absolute assurance that all control issues and instances of fraud within the company, if any, have been | | | | | | | | | | | | | | | | 326 | | bp Annual Report and Form 20-F 2020 | | «See Glossary |
detected. Further, in the design and evaluation of our disclosure controls and procedures our management necessarily was required to apply its judgement in evaluating the costs and benefits of possible control and procedure design options. Also, we have investments in unconsolidated entities. As we do not control these entities, our disclosure controls and procedures with respect to such entities are necessarily substantially more limited than those we maintain with respect to our consolidated subsidiaries.subsidiaries«. Because of the inherent limitations in a cost-effective control system, misstatements due to error or fraud may occur and not be detected. The company’s disclosure controls and procedures have been designed to meet, and management believes that they meet, reasonable assurance standards. The company’s management, with the participation of the company’s group chief executive and chief financial officer, has evaluated the effectiveness of the company’s disclosure controls and procedures pursuant to Exchange Act Rule 13a-15(b) as of the end of the period covered by this annual report. Based on that evaluation, the group chief executive and chief financial officer have concluded that the company’s disclosure controls and procedures were effective at a reasonable assurance level. Management’s report on internal control over financial reporting Management of BPbp is responsible for establishing and maintaining adequate internal control over financial reporting. BP’sbp’s internal control over financial reporting is a process designed under the supervision of the principal executive and financial officers to provide reasonable assurance regarding the reliability of financial reporting and the preparation of BP’sbp’s financial statements for external reporting purposes in accordance with IFRS. As of the end of the 20192020 fiscal year, management conducted an assessment of the effectiveness of internal control over financial reporting in accordance with the criteria in the UK Financial Reporting Council’s Guidance on Risk Management, Internal Control and Related Financial and Business Reporting relating to internal control over financial reporting. Based on this assessment, management has determined that BP’sbp’s internal control over financial reporting as of 31 December 20192020 was effective. The company’s internal control over financial reporting includes policies and procedures that pertain to the maintenance of records that, in reasonable detail, accurately and fairly reflect transactions and dispositions of assets; provide reasonable assurances that transactions are recorded as necessary to permit preparation of financial statements in accordance with IFRS and that receipts and expenditures are being made only in accordance with authorizations of management and the directors of BP;bp; and provide reasonable assurance regarding prevention or timely detection of unauthorized acquisition, use or disposition of BP’sbp’s assets that could have a material effect on our financial statements. BP’sbp’s internal control over financial reporting as of 31 December 20192020 has been audited by Deloitte LLP, an independent registered public accounting firm, as stated in their report appearing on page 151154 of BP bp Annual Report and Form 20-F 20192020. Changes in internal control over financial reporting There were no changes in the group’s internal control over financial reporting that occurred during the period covered by the Form 20-F that have materially affected or are reasonably likely to materially affect our internal control over financial reporting. Principal accountant's fees and services The audit committee has established policies and procedures for the engagement of the independent registered public accounting firm, Deloitte LLP, to render audit and certain assurance services. The policies provide for pre-approval by the audit committee of specifically defined audit, audit-related, non-audit and other services that are not prohibited by regulatory or other professional requirements. Deloitte is engaged for these services when its expertise and experience of BPbp are important. Most of this work is of an audit nature. The committee regularly reviews the policy, including in 2019,2020, when it was updated to assesses whetherreflect changes resulting from the policy remains fit for purpose against the latest ethical standards and guidance. The committee will review the policy again in 2020 and the policy will be updated in line with the revised FRC 2019 Ethical Standards.Standard (December 2019). Under the policy, pre-approval is given for specific services within the following categories: advice on accounting, auditing and financial reporting matters; internal accounting and risk management control reviews (excluding any services relating to information systems design and implementation); non-statutory audit; project assurance and advice on business and accounting process improvement (excluding any services relating to information systems design and implementation relating to BP’sbp’s financial statements or accounting records); due diligence in connection with acquisitions, disposals and joint arrangements« (excluding valuation or involvement in prospective financial information); provision of, or access to, Deloitte publications, workshops, seminars and other training materials; provision of reports from data gathered on non-financial policies and information; provision of the independent third party audit in accordance with US Generally Accepted Government Auditing Standards, over the company’s Conflict Minerals Report – where such a report is required under the SEC rule ‘Conflict Minerals’, issued in accordance with Section 1502 of the Dodd Frank Act; and assistance with understanding non-financial regulatory requirements. BPbp operates a two-tier system for audit and non-audit services. For audit related services, the audit committee has a pre-approved aggregate level, within which specific work may be approved by management. Non-audit services are pre-approved for management to authorize per individual engagement, but above a defined level must be approved by the chairman of the audit committee or the full committee. In response to the revised regulatory guidelines of the UK Financial Reporting Council, the audit committee reviewed and updated its policies with effect from 1 January 2017 and in 2018 further updated its policies to clarify the engagement of the incoming auditor, Deloitte, and the outgoing auditor (and auditor of Rosneft) Ernst & Young to ensure independence. The defined maximum level for pre-approval has been reduced in line with FRC guidance on ‘non-trivial’ engagements. The audit committee has delegated to the chairman of the audit committee authority to approve permitted services provided that the chairman reports any decisions to the committee at its next scheduled meeting. Any proposed service not included in the
| | | | | | 322 | | «See Glossary
| BP Annual Report and Form 20-F 2019
| |
approved service list must be approved in advance by the audit committee chairman and reported to the committee, or approved by the full audit committee in advance of commencement of the engagement. The audit committee evaluates the performance of the auditor each year. The audit fees payable to Deloitte are reviewed by the committee in the context of other global companies for cost effectiveness. The committee keeps under review the scope and results of audit work and the independence and objectivity of the auditor. External regulation and BPbp policy requires the auditor to rotate its lead audit partner every five years. See Financial statements – Note 36 and Audit committee report on page 9394 for details of fees for services provided by the auditor. Directors’ report information This section of BP bp Annual Report and Form 20-F2019 2020forms part of, and includes certain disclosures which are required by law to be included in, the Directors’ report. Indemnity provisions In accordance with BP’s Articles of Association, on appointment each director is granted an indemnity from the company in respect of liabilities incurred as a result of their office, to the extent permitted by law. These indemnities were in force throughout the financial year and at the date of this report. In respect of those liabilities for which directors may not be indemnified, the company maintained a directors’ and officers’ liability insurance policy throughout 2019.2020. During the year, a review of the terms and scope of the policy was undertaken. The policy was renewed during 2018 and continued into 2019.undertaken as part of the annual renewal. Although their defence costs may be met, neither the company’s indemnity nor insurance provides cover in the event that the director is proved to have acted fraudulently or dishonestly. Certain subsidiaries« are trustees of the group’s pension schemes. Each director of these subsidiaries«is granted an indemnity from the company in respect of liabilities incurred as a result of such a subsidiary’s activities as a trustee of the pension scheme, to the extent permitted by law. These indemnities were in force throughout the financial year and at the date of this report. | | | | | | | | | | | | | | | «See Glossary | | bp Annual Report and Form 20-F 2020 | | 327 |
Financial risk management objectives and policies The disclosures in relation to financial risk management objectives and policies, including the policy for hedging, are included in How we manage risk on page 68,64, Liquidity and capital resources on page 301306 and Financial statements – Notes 29 and 30. Exposure to price risk, credit risk, liquidity risk and cash flow risk The disclosures in relation to exposure to price risk, credit risk, liquidity risk and cash flow risk are included in Financial statements – Note 29. Important events since the end of the financial year Disclosures of the particulars of the important events affecting BPbp which have occurred since the end of the financial year are included in the Strategic report as well as in other places in the Directors’ report. Likely future developments in the business An indication of the likely future developments in the business of the company is included in the Strategic report. Research and development Indications of our activities in the field of research and development are provided throughout the Strategic report and the Directors’ report including examples on pages 15 (technology16 (developing next-gen mobility solutions), 17 (driving digital innovation including through bp ventures and innovation)Launchpad), 16 (creating low carbon businesses)19 (partnering to develop a project to produce hydrogen from water), 2836 (innovation and 65 (venturing), 31 (modernizing the group)engineering) and 57 (BP Infinia)63 (collaborating with universities and academic research). See also page 180183 for our expenditure on research and development. Branches As a global group our interests and activities are held or operated through subsidiaries, branches, joint arrangements« or associates« established in – and subject to the laws and regulations of – many different jurisdictions. Employees Disclosures in respect of how the directors have engaged with employees and had regard to their interests are included in How the board has engaged with shareholders, the workforce and other stakeholders on page 8886 and section 172 statement on page 66.pages 63, 82 and 83. The disclosures concerning policies in relation to the employment of disabled persons and employee involvement are included in Sustainability – Our peoplePeople and society on page 47.57. Employee share schemes Certain shares held as a result of participation in some employee share plans carry voting rights. Voting rights in respect of such shares are exercisable via a nominee. Dividend waivers are in place in respect of unallocated shares held in employee share plan trusts. Suppliers, customers and others Disclosures in respect of how the directors have engaged with suppliers, customers and others in business relationships with the company are included in How the board has engaged with shareholders, the workforce and other stakeholders on page 8886 and section 172 statement on page 66.pages 63, 82 and 83. Change of control provisions On 5 October 2015, the United States lodged with the district court in MDL 2179 a proposed Consent Decree between the United States, the Gulf states, BP Exploration & Production Inc., BP Corporation North America Inc. and BP p.l.c., to fully and finally resolve any and all natural resource damages claims of the United States, the Gulf states and their respective natural resource trustees and all Clean Water Act penalty claims, and certain other claims of the United States and the Gulf states. Concurrently, BPbp entered into a definitive Settlement Agreement with the five Gulf states (Settlement Agreement) with respect to state claims for economic, property and other losses. On 4 April 2016, the district court approved the Consent Decree, at which time the Consent Decree and Settlement Agreement became effective. The federal government and the Gulf states may jointly elect to accelerate the payments under the Consent Decree in the event of a change of control or insolvency of BP p.l.c., and the Gulf states individually have similar acceleration rights under the Settlement Agreement. For further details of the Consent Decree and the Settlement Agreement, see Legal proceedings in BP Annual Report and Form 20-F 2015. Greenhouse gas emissions, energy consumption and energy efficiency The disclosuresDisclosures in relation to greenhouse gas emissions, energy consumption and energy efficiency are included in Sustainability – Climate change on page 40.50.
Disclosures required under Listing Rule 9.8.4R The information required to be disclosed by Listing Rule 9.8.4R can be located as set out below: | | | | Information required | Page |
| (1) Amount of interest capitalized | 180 |
| (2) – (11) | Not applicable |
| (12), (13) Dividend waivers | 323 |
| (14) | Not applicable |
|
| | | | | | | Information required | Page | | (1) Amount of interest capitalized | 183 | | | (2) – (4) | Not applicable | | (5), (6) Waiver of director emoluments | 121 | | (7) – (11) | Not applicable | | (12), (13) Dividend waivers | 328 | | | (14) | Not applicable |
BP | | | | | | | | | | | | | | | | 328 | | bp Annual Report and Form 20-F 20192020 | | «See Glossary | | 323 |
Cautionary statement In order to utilize the ‘safe harbor’ provisions of the United States Private Securities Litigation Reform Act of 1995 (the ‘PSLRA’) and the general doctrine of cautionary statements, BPbp is providing the following cautionary statement. This document contains certain forecasts, projections and forward-looking statements - that is, statements related to future, not past, events and circumstancesircumstances - with respect to the financial condition, results of operations and businesses of BPbp and certain of the plans and objectives of BPbp with respect to these items. These statements may generally, but not always, be identified by the use of words such as ‘will’, ‘expects’, ‘is expected to’, ‘aims’, ‘should’, ‘may’, ‘objective’, ‘is likely to’, ‘intends’, ‘believes’, ‘anticipates’, ‘plans’, ‘we see’ or similar expressions. In particular, among other statements, (i) certain statements in the Chairman’s letter (pages 2-3)4-5), the Chief executive officer’sGroup chief executive’s letter (pages 4-5)6-7), the Strategic report (inside cover and pages 1-71)1-70), Additional disclosures (pages 297-325)301-330) and Shareholder information (pages 327-336)331-340), including but not limited to statements under the headings ‘Our ambition for the energy transition’Energy Outlook’, ‘Our‘Reinventing bp – our business model’, ‘Our strategy’‘Reinventing bp – our strategic focus areas’, ‘Reinventing bp – our financial frame’, ‘2021 guidance’ and ‘Measuring our progress’‘Reinventing bp – in line with the Paris goals’ and including but not limited to statements regarding: the coronavirus pandemic (COVID19), its impact, consequences and challenges and how BP is prepared for and responding to this; plans and expectations relating to operating cash flow, capital expenditure (including total capital expenditure, organic capital expenditure and inorganic capital expenditure), maintaining a strong financial frame, deleveraging ourbp’s balance sheet, working capital and operating cash flows, liquidity, capital discipline, growth infuture sustainable free cash flow and shareholder distributions, allocation of capital to bp’s energy transition strategy, amount or timing of payments related to divestment proceeds, net debt, gearing and future dividend payments; BP's newpayments and share buybacks; bp’s ambition to be a net zero company by 2050 or sooner, and help the world get to net zero, including its aims regarding Scope 1, Scope 2 and Scope 3 emissions, across operations,its expectations for the energy transition and the carbon content of its oil and gas production;production, while operating a 50% cut in the carbon intensity of products BP sells, methane measurement at major oilhigh-quality base business; bp’s plan to amplify value by focusing on integrating energy systems, partnering with countries, cities and gas processing sites by 2023industries, and subsequent reduction of methane intensity of operations, and aims to increase the proportion of investment into non-oil and gas businesses over time; aims to help the world get to net zero; plans for incentivising BP's global workforce; plans for a wide-ranging restructuring of the business; the aim to build a more agile, innovative and efficient BP; continuing commitment to safe and reliable operations; commitment to continuing to perform as BP transforms; continuing commitment to the investor proposition and commitment to transparency and advocacy for a low carbon world; plans anddriving digital innovation; expectations regarding medium and long-term oil prices, the new leadership structure, including timingconsistency of its implementationpricing assumptions with scenarios that are consistent with the Paris goals and areas of focus; plansbp’s resilience to focus on developing a new corporate governance framework; plans and expectations regarding our relationships with trade associations; plans to advance a low-carbon future through the reduce, improve, create framework; plans and expectations regarding BP’s level of investment in energy sources and technologies other than oil and gas resources and reserves;Paris-consistent pathways; expectations regarding world energy demand, including the growth in relative demand for renewables, oil and gas, and the proportional growth of renewables; expectations regarding bp’s short, medium- and long-term targets and aims for emissions and carbon intensity of bp’s production and marketed products, and statements regarding the resilience of bp’s strategy and portfolio across multiple climate scenarios and the uncertainties in the energy transition; plans and expectations regarding bp’s level of investment in energy sources and technologies other than oil and gas resources and reserves, including plans to increase investment in low carbon from around $750 million in 2020 to $3-4 billion by 2025 and to around $5 billion a year in 2030, with transition capital spend to be as much as 50% of capex in 2030; plans and expectations to significantly increase bp’s investment in low carbon activities in this decade, while also operating a high-quality base business; plans and expectations regarding bp’s five aims to get bp to net zero, including the aim to be net zero across its entire operations on an absolute basis by 2050 or sooner, the aim to be net zero on an absolute basis across the carbon in its upstream oil and gas production by 2050 or sooner, the aim to cut the carbon intensity of products sold by 50% by 2050 or sooner, the aim to install methane measurement at all existing major oil and gas processing sites by 2023, publish the data, and then drive a 50% reduction in methane intensity of operations, and the aim to increase the proportion of investment bp makes into its non-oil and gas businesses; plans and expectations regarding bp’s five aims to get the world to net zero carbon emissions, including the aim to more actively advocate for policies that are consistentsupport net zero, including carbon pricing, the aim to incentivize bp’s global workforce to deliver on these aims and mobilize them to become advocates for net zero, the aim to set new expectations for relationships with trade associations around the Paris goals;globe, the aim to be recognized as an industry leader for the transparency of its reporting and the aim to launch a new team to create integrated clean energy and mobility solutions; expectations with respect to oil and gas supply and demand and prices; expectations with respect to the world energy mix, production, consumption and emissions; plans and expectations with respect to low carbon spend in 2021; expectations with respect to transition capital, and the percentage of capital expenditure that will be low-carbon; expectations that the aftermath of the pandemic will accelerate the pace of transition to a lower carbon economy and energy system; expectations that the Empire Wind project in New York state will have 2GW generating capacity once operational and Beacon Wind will have 2.4GW generating capacity once operational; expectations regarding future legislative or regulatory action related to greenhouse gases, including emissions to 2040;disclosure, emissions trading, and fuel-specific regulations, and their impact on bp; expectations regarding pensions and other post-retirement benefits, including contributions; expectations regarding payments under contractual obligations and sales commitments; expectations that around 10,000 employees will leave bp by early 2022; plans and expectations regarding BP’sbp’s workforce, including bp’s targets regarding diversity, inclusion and equality; expectations regarding bp’s ability to prevent violations of its code of conduct, including its anti-bribery and corruption policies and procedures; plans and expectations regarding the new leadership structure and governance framework, including areas of focus and effectiveness; plans for incentivising bp’s global workforce; policies and goals related to risk management plans; plans and expectations regarding control deficiencies; expectations regarding bp’s ability to prevent, respond to and recover from cyberattacks or hostile actions; plans and projections regarding oil and gas reserves, including the turnover time of proved undeveloped reserves to proved developed reserves and volume of turnover; expectations regarding the costs of environmental restoration, remediation and abatement programmes; plans and expectations regarding bp’s portfolio, including to maintain a focused portfolio, to manage the portfolio through disciplined investment to support growing returns and to focus on highest-quality barrels; expectations that by 2030 bp’s hydrocarbon production will be around 40% lower relative to 2019 due to active management and high-grading of the portfolio, including divestment of non-core assets; plans and expectations to deliver 2021 financial targets;that bp will not undertake exploration activity in new countries; expectations regarding contingent liabilities and their impact on bp; expectations regarding the future value of assets; expectations with respect to reserves bookings from new discoveries; plans and expectations regarding BP’s quality of execution, including to get more from a unit of capital compared to peers; plans and expectations with regard to the supply and trading function, the fuels lubricants and the petrochemicalslubricants businesses; plans and expectations with regard to new technologies, including their efficiency and impact on production; plans and expectations regarding the retail business, including BP Chargemaster, and to roll-out electric vehicle charging networks in China, Germany and the UK; plans to develop a number of digital platforms to connect consumers with local, low carbon electricity and to enhance productivity through digital solutions; plans and expectations regarding BP’s role in OGCI’s Net Zero Teesside project; plans and expectations regarding BP’s advancing low carbon accreditation programme; plans and expectations with respect to the commercial optimization programme; plans and expectations regarding BPX Energy, including for it to achieve $400 million of annual synergies by 2021; plans and expectations with respect to the Alternative Energy portfolio, including for Lightsource BP to have 10GW of developed assets by the end of 2023, Grid Edge’s impact on energy use and carbon emissions of buildings and expectations for Brazil’s ethanol demand to increase up to 55% by 2030; plans and expectations regarding BP Launchpad, including to quickly create multiple businesses valued over $1 billion; plans and expectations regarding BP Ventures, including to grow advanced mobility, power and storage, carbon management, bio and low carbon products and its investment in Finite Resources; plans and expectations regarding the Other business and corporate annual charge and underlying quarterly charge in 2020; plans and expectations relating to divestments and disposals, including expectations that BP will meet its target of $10 billion of divestment proceeds by the end of 2020 and a further $5 billion of agreed disposals by mid-2021; expectations with respect to completion and the timing of receipt of proceeds of agreed divestments and disposals including the sale of BP’s Alaska operations to Hilcorp Energy and the sale of BP’s interests in the Andrew Area and Shearwater to Premier Oil; expectations regarding the determination of business economic loss claims in respect of the 2012 PSC settlement and expectations with respect to the timing and amount of future payments relating to the Gulf of Mexico oil spill including 2012 PSC settlement payments; plans and expectations regarding sales commitments of BPbp and its equity-accounted entities; expectations regarding underlying production and capital investment; plans and expectations with respect to gearing including to target gearing within a 20-30% band, for divestment proceeds to be primarily focused on reducing gearingROACE and for gearing to increase in the short-termearnings before interest, tax, depreciation and subsequently reduce in line with divestment proceeds; expectations regarding oil prices, including for prices to be challenging in 2020; expectations for return on average capital employed to improve to over 10% by 2021; plans with regard to BP’s exploration budget; expectations regarding depreciation, depletion and amortization charges; expectations regarding the effective tax rate in 2020; plans to produce 900,000boe/d from new projects by 2021 and expectations regarding operating cash margins of this production; plans to start up four projects in 2020; plans and expectations for the Raven project to come onstream at the end of 2020; plans and expectations with respect to a joint venture with ZPCC to build an acetic acid plant;amortisation; plans and expectations regarding investment, development, and production levels and the timing thereof with respect to projects and partnerships in Angola, Australia, Azerbaijan, Brazil, Egypt, the Gambia, India, Indonesia, Mexico, Russia, São Tomé and Príncipe, Turkey, Oman, the UK North Sea, the Gulf of Mexico, and the continental United States; expectations regarding the Trans Anatolian Natural Gas Pipeline; plans and expectations regarding relationships with governments, customers, partners, suppliers, communities and key stakeholders, including working with the Washington state legislature to advance a new carbon bill; plans and expectations with respect to BP’s public reporting of ambitions, plans, progress and reporting structure; plans and expectations regarding the effectiveness of the group’s foreign currency exchange risk management; plans and expectations regarding plant reliability and base decline, including for base decline to remain between 3-5%; plans and expectations regarding business models in sustainable chemicals and plastics, including with respect to BP Infinia technology and to build a $25-million pilot plant to prove the technology; plans and expectations regarding the Tangguh gas facility; expectations regarding refining margins, North American heavy crude oil discounts and refining turnarounds;margins; plans to undertake joint exploration and development with Rosneft including to create a joint venture investment fund; expectations regarding pensions and other post-retirement benefits, including contributions; expectations regarding payments under contractual obligations and sales commitments; plans and expectations regarding BP’s workforce, includingfor the aim to attract, developStrategic Collaboration Agreement signed between Rosneft and retain the best talent, to create a diverse inclusive working environment and an open culture and to ensure equal opportunity in recruitment; policies and goals related to risk management plans; aim to help countries around the world grow their domestic energy supplies and boost energy security; plans and projections regarding oil and gas reserves, including the turnover time of proved undeveloped reserves to proved developed reserves and volume of turnover;bp; expectations regarding the costs of environmental restoration programmes; expectations regarding contingent liabilities and their impact on BP; expectations
| | | | | | 324 | | «See Glossary
| BP Annual Report and Form 20-F 2019
| |
regarding the future value of assets; expectations regarding futuregovernment action, regulations and policy, their impact on BP’sbp’s business and plans regarding compliance with such regulations; and expectations regarding legal and trial proceedings, court decisions, potential investigations and civil actions by regulators, government entities and/or other entities or parties, and the timing and potential impact of such proceedings and BP’sbp’s intentions in respect thereof; plans and expectations regarding relationships with governments, customers, partners, suppliers, communities and key stakeholders; plans to produce 900,000boe/d from new projects by 2021 and expectations regarding operating cash margins of this production; plans and expectations for bp’s Jio-bp joint venture with Reliance, including the expectation for 5,500 Jio-bp retail sites by 2025; plans and expectations to deliver 2021 financial targets; plans to increase investment in low carbon to $3-4 billion by 2025 and to around $5 billion a year in 2030; expectations related to delivery and execution of Atlantis Phase 3 in the US Gulf of Mexico; expectations regarding customer touchpoints, number of strategic convenience sites, number of retail sites in growth markets, Castrol sales and other operating revenues, number of electric vehicle charge points, margin share from convenience and electrification, unit production costs, Upstream production, Upstream plant reliability, refining throughout, refining availability, developed renewables to final investment decision, bioenergy production, LNG portfolio, and traded electricity;
| | | | | | | | | | | | | | | «See Glossary | | bp Annual Report and Form 20-F 2020 | | 329 |
expectations regarding oil prices, including for long-term prices to be affected by the enduring impact of the COVID-19 pandemic, the decisions of OPEC+, confidence in efforts to manage the rollout of vaccination and further virus control measures; expectations regarding Upstream reported production excluding Rosneft , total capital expenditure, depreciation, depletion and amortisation charges, Gulf of Mexico oil spill payments (post-tax), the Other business and corporate annual charge and underlying quarterly charge, and the effective tax rate and the underlying effective tax rate; plans and expectations regarding the effectiveness of the group’s foreign currency exchange risk management; expectations regarding bp’s partnership with Equinor for offshore wind in the US, including bp’s expectation of pursuing further opportunities for offshore wind in the US, and regarding bp’s partnership with Ørsted on an industrial-scale project to produce hydrogen from water, powered by wind; expectations regarding the US gas market in 2021 as supply declines and demand for LNG exports recovers and that the current tightness on global LNG markets and higher US gas prices will lift other regional gas prices; expectations for limited growth in oil supply from non-OPEC+ countries coupled with active market management from OPEC+ leading to normalization of the currently high inventory levels, with prices subject to the decisions of OPEC+; expectations that US gas markets are likely to benefit from lower production and a recovery in international LNG demand driven by demand in Asia; expectations that demand for refined products will remain strong over the remaining useful life of existing assets; expectations that the majority of bp’s Upstream oil and gas properties will start decommissioning within the next two decades; expectations that the majority of bp’s reserves and resources that support the carrying value of the group’s existing oil and gas properties are expected to be produced over the next 10 years; expectations that reported production will be lower due to the impact of the ongoing divestment programme; expectations regarding level and volatility of other businesses and corporate charges for 2021; plans and expectations regarding bp’s in-scope projects’ impact on biodiversity; expectation’s regarding bp’s impact on air emissions and water use and management; expectations regarding fulfillment of existing delivery commitments for oil and gas; expectations regarding Gulf of Mexico oil spill payments; expectations that first oil from the Thunder Horse South Expansion will be reached in the third quarter of 2021 and that first oil for the Mad Dog 2 project will be reached in the second quarter of 2022; expectations that the Cassia Compression project will start up in 2022; expectations that first production from the Total-operated Zinia 2 deep offshore development project will occur in 2021; expectation that first production from the Platina project will occur in 2021; expectation for start-up of the West Nile Delta Raven project in the first quarter of 2021; expectations that the Tangguh expansion project will start-up in 2022; and plans and expectations regarding bp Ventures and Launchpad; and (ii) certain statements in Corporate governance (pages 72-99)71-102) and the Directors’ remuneration report (pages 100-127)103-126) with regard toto: the anticipated future composition of the board of directors and the effects thereof; the board’s goals and areas of focus, including changes to KPIs and those goals stemming from the board’s annual evaluation; plans and expectations regarding directors’ share ownership and remuneration; plans regarding the governance and remuneration processes; and goals, activities and areas of focus of board committees, are all forward looking in nature. By their nature, forward-looking statements involve risk and uncertainty because they relate to events and depend on circumstances that will or may occur in the future and are outside the control of BP.bp. Actual results may differ materially from those expressed in such statements, depending on a variety of factors, including: the specific factors identified in the discussions accompanying such forward looking statements; the effects of the COVID-19 pandemic and uncertainties about its impact and duration; the receipt of relevant third party and/or regulatory approvals; the timing and level of maintenance and/or turnaround activity; the timing and volume of refinery additions and outages; the timing of bringing new projects onstream; the timing, quantum and nature of certain acquisitions and divestments; future levels of industry product supply, demand and pricing, including supply growth in North America; OPECOPEC+ quota restrictions; production-sharing agreements effects; operational and safety problems; potential lapses in product quality; economic and financial market conditions generally or in various countries and regions; political stability and economic growth in relevant areas of the world; changes in laws and governmental regulations and policies, including related to climate change; changes in social attitudes and customer preferences; regulatory or legal actions including the types of enforcement action pursued and the nature of remedies sought or imposed; the actions of prosecutors, regulatory authorities and courts; delays in the processes for resolving claims; amounts ultimately determined to be payable and the timing of payments relating to the Gulf of Mexico oil spill; exchange rate fluctuations; development and use of new technology; recruitment and retention of a skilled workforce; the success or otherwise of partnering; the actions of competitors, trading partners, contractors, subcontractors, creditors, rating agencies and others; ourbp’s access to future credit resources; business disruption and crisis management; the impact on ourbp’s reputation of ethical misconduct and non-compliancenoncompliance with regulatory obligations; trading losses; major uninsured losses; decisions by Rosneft’s management and board of directors; the actions of contractors; natural disasters and adverse weather conditions; changes in public expectations and other changes to business conditions; public health situations (including an outbreak of an epidemic or pandemic); wars and acts of terrorism; cyberattacks or sabotage; and other factors discussed elsewhere in this report including under Risk factors (pages 70-71)67-70). In addition to factors set forth elsewhere in this report, those set out above are important factors, although not exhaustive, that may cause actual results and developments to differ materially from those expressed or implied by these forward-looking statements. Statements regarding competitive position Statements referring to BP’sbp’s competitive position are based on the company’s belief and, in some cases, rely on a range of sources, including investment analysts’ reports, independent market studies and BP’sbp’s internal assessments of market share based on publicly available information about the financial results and performance of market participants.
| | | | | | | | | | | | | | | | 330 | | bp Annual Report and Form 20-F 2020 | | «See Glossary |
| | | | | | | | | | | | | | | | | | | | | BP Annual Report and Form 20-F 2019
Shareholder information | «See Glossary
| | 325 |
THIS PAGE HAS BEEN LEFT BLANK INTENTIONALLY
| | | | | | 326 | | «See Glossary
| BP Annual Report and Form 20-F 2019
| |
| | | | | | | | Shareholder
information
| | | | | | | | | | | | | | | | | | | | | | | | | | | | | | | | | | | | | | | | | | | | | | | | | | | | | | | | | | | | | | 2021 Shareholder calendar | | 2020 Shareholder calendar | | | | | | | | | | | | | | | | | | | | | | | | | | | | | | | | | | | | | | | | | | | | | | | | | | | | | | | | | | | | | | | | | | | | | | | | | | | | | | | | | | | | | | | | | | | | | | | | | | | | | | | | | | | | | | | | | | | | | | | | | | | | | | | | | | | | | | | | | | | | | | | | | | | | | | | | | | | |
| | | | | | | | | | | | | | | | BP
| bp Annual Report and Form 20-F 20192020 | | 327331 |
Share prices and listings Markets and market prices The primary market for the company’s ordinary shares (trading symbol 'BP.'), 8% cumulative first preference shares (trading symbol 'BP.A') and 9% cumulative second preference shares (trading symbol 'BP.B') is the London Stock Exchange (LSE). The company’s ordinary shares are a constituent element of the Financial Times Stock Exchange 100 Index. In the US, the company’s securities are listed and traded on the New York Stock Exchange (NYSE) in the form of ADSs (trading symbol 'BP'), for which JPMorgan Chase Bank, N.A. is the depositary (the Depositary) and transfer agent. The Depositary’s principal office is 383 Madison Avenue, Floor 11, New York, NY, 10179, US. Each ADS represents six ordinary shares. ADSs are evidenced by American depositary receipts (ADRs), which may be issued in either certificated or book entry form. The company's ordinary shares are also traded in the form of a global depositary certificate representing the company's ordinary shares on the Frankfurt, Hamburg and Dusseldorf Stock Exchanges. On 2725 February 2020, 916,049,3772021, 849,802,947 ADSs (equivalent to approximately 5,496,296,2625,098,817,682 ordinary shares or some 27.15%25.06% of the total issued share capital, excluding shares held in treasury) were outstanding and were held by approximately 77,42472,535 ADS holders. Of these, about 76,53571,703 had registered addresses in the US at that date. One of the registered holders of ADSs represents some 1,237,693approximately 1,087,342 underlying holders. On 2725 February 20202021, there were approximately 229,193225,319 ordinary shareholders. Of these shareholders, around 1,5351,539 had registered addresses in the US and held a total of some 4,094,1544,381,925 ordinary shares. Since a number of the ordinary shares and ADSs were held by brokers and other nominees, the number of holders in the US may not be representative of the number of beneficial holders or their respective country of residence. Dividends The company’s current policy is to pay interim dividends on a quarterly basis on its ordinary shares. Its policy is also to announce dividends for ordinary shares in US dollars and state an equivalent sterling dividend. Dividends on the company's ordinary shares will be paid in sterling and on the company's ADSs in US dollars. The rate of exchange used to determine the sterling amount equivalent is the average of the market exchange rates in London over the four business days prior to the sterling equivalent announcement date. The directors may choose to declare dividends in any currency provided that a sterling equivalent is announced. It is not the company’s intention to change its current policy of announcing dividends on ordinary shares in US dollars. Information regarding dividends announced and paid by the company on ordinary shares and preference shares is provided in Financial statements – Note 10. A Scrip Dividend Programme (Scrip Programme) was approved by shareholders in 2010 and was renewed for a further three years at the 2018 AGM. It is proposed that the Scrip Programme be renewed for a further three years at the 2021 AGM. It enabled the company's ordinary shareholders and ADS holders to elect to receive dividends by way of new fully paid ordinary shares (or ADSs in the case of ADS holders) instead of cash. The operation of the Scrip Programme is always subject to the directors’ decision to make the Scrip Programme offer available in respect of any particular dividend. The company announced on 29 October 2019 and 4 February 2020as part of all subsequent quarterly results announcements made since that the board had suspended the Scrip Programme in respect of the third quarter 2019 and fourth quarter 2019those quarterly dividends. Ordinary shareholders and ADS holders (subject to certain exceptions) may be able to participate in dividend reinvestment plans. Any decisions with respect to future dividends will be made by the board of BP p.l.c. following the end of each quarter. Future dividends will be dependent on future earnings, the financial condition of the group, the Risk factors set out on page 7067 and other matters that may affect the business of the group set out in Our strategy on page 1615 and in Liquidity and capital resources on page 301.306. The following table shows dividends announced and paid by the company per ADS for the past five years. | | | | | | | | | | | | | | | | | | | | | Dividends per ADSa | March | June | September | December | Total | | | | | | | | | | | | | | | | | | | | | | | | | | | | | | | | | | | | | | | | | | | | 2016 | UK pence | 42.08 | | 41.50 | | 45.35 | | 47.59 | | 176.52 | | | US cents | 60 | | 60 | | 60 | | 60 | | 240 | | | 2017 | UK pence | 48.95 | | 46.54 | | 45.73 | | 44.66 | | 185.88 | | | US cents | 60 | | 60 | | 60 | | 60 | | 240 | | | 2018 | UK pence | 43.01 | | 44.66 | | 47.58 | | 48.15 | | 183.40 | | | US cents | 60 | | 60 | | 61.50 | | 61.50 | | 243 | | | 2019 | UK pence | 46.43 | | 48.39 | | 50.09 | | 46.95 | | 191.86 | | | US cents | 61.50 | | 61.50 | | 61.50 | | 61.50 | | 246 | | | 2020 | UK pence | 48.94 | | 50.05 | | 24.26 | | 23.50 | | 146.75 | | | US cents | 63.00 | | 63.00 | | 31.50 | | 31.50 | | 189 | |
| | | | | | | | | | | | | Dividends per ADSa | March |
| June |
| September |
| December |
| Total |
| | 2015 | UK pence | 40.00 |
| 39.18 |
| 39.29 |
| 39.81 |
| 158.28 |
| | | US cents | 60 |
| 60 |
| 60 |
| 60 |
| 240 |
| | 2016 | UK pence | 42.08 |
| 41.50 |
| 45.35 |
| 47.59 |
| 176.52 |
| | | US cents | 60 |
| 60 |
| 60 |
| 60 |
| 240 |
| | 2017 | UK pence | 48.95 |
| 46.54 |
| 45.73 |
| 44.66 |
| 185.88 |
| | | US cents | 60 |
| 60 |
| 60 |
| 60 |
| 240 |
| | 2018 | UK pence | 43.01 |
| 44.66 |
| 47.58 |
| 48.15 |
| 183.40 |
| | US cents | 60 |
| 60 |
| 61.50 |
| 61.50 |
| 243 |
| | 2019 | UK pence | 46.43 |
| 48.39 |
| 50.09 |
| 46.95 |
| 191.86 |
| | US cents | 61.50 |
| 61.50 |
| 61.50 |
| 61.50 |
| 246 |
|
| | a
| Dividends announced and paid by the company on ordinary and preference shares are provided in Financial statements – Note 10. |
There are currently no UK foreign exchange controls or restrictions on remittances of dividends on the ordinary shares or on the conduct of the company’s operations, other than restrictions applicable to certain countries and persons subject to EU economic sanctions or those sanctions adopted by the UK government which implement resolutions of the Security Council of the United Nations. Shareholder taxation information This section describes the material US federal income tax and UK taxation consequences of owning ordinary shares or ADSs to a US holder who holds the ordinary shares or ADSs as capital assets for tax purposes. It does not apply, however, inter alia to members of special classes of holders some of which may be subject to other rules, including: tax-exempt entities, life insurance companies, dealers in securities, traders in securities that elect a mark-to-market method of accounting for securities holdings, investors liable for alternative minimum tax, holders that, directly or indirectly, hold 10% or more of the company’s shares (as measured by voting stock,power or value), holders that hold the shares or ADSs as part of a straddle or a hedging or conversion transaction, holders that purchase or sell the shares or ADSs as part of a wash sale for US federal income tax purposes, or holders whose functional currency is not the US dollar. In addition, if a partnership holds the shares or ADSs, the US federal income tax treatment of a partner will generally depend on the status of the partner and the tax treatment of the partnership and may not be described fully below. A US holder is any beneficial owner of ordinary shares or ADSs that is for US federal income tax purposes (1) a citizen or resident of the US, (2) a US domestic corporation, (3) an estate whose income is subject to US federal income taxation regardless of its source, or (4) a trust if a US court can exercise primary supervision over the trust’s administration and one or more US persons are authorized to control all substantial decisions of the trust. This section is based on the tax laws of the United States, including the Internal Revenue Code of 1986, as amended, its legislative history, existing and proposed US Treasury regulations thereunder, published rulings and court decisions, and the taxation laws of the UK, all as currently in effect, as well as the income tax convention between the US and the UK that entered into force on 31 March 2003 (the ‘Treaty’). These laws are subject to change, possibly on a retroactive basis. This section further assumes that each obligation under the terms of the deposit agreement relating to BPbp ADSs and any related agreement will be performed in accordance with its terms. For purposes of the Treaty and the estate and gift tax Convention (the ‘Estate Tax Convention’) and for US federal income tax and UK taxation purposes, a holder of ADRs evidencing ADSs will be treated as the owner of the company’s ordinary shares represented by those ADRs. Exchanges of ordinary shares for ADRs and ADRs for ordinary shares generally will not be subject to US federal income tax or to UK
| | | | | | 328 | | «See Glossary
| BP Annual Report and Form 20-F 2019
| |
taxation other than stamp duty or stamp duty reserve tax, as described below. | | | | | | | | | | | | | | | | 332 | | bp Annual Report and Form 20-F 2020 | | «See Glossary |
Investors should consult their own tax adviser regarding the US federal, state and local, UK and other tax consequences of owning and disposing of ordinary shares and ADSs in their particular circumstances, and in particular whether they are eligible for the benefits of the Treaty in respect of their investment in the shares or ADSs. Taxation of dividends UK taxation Under current UK taxation law, no withholding tax will be deducted from dividends paid by the company, including dividends paid to US holders. A shareholder that is a company resident for tax purposes in the UK or trading in the UK through a permanent establishment generally will not be taxable in the UK on a dividend it receives from the company. A shareholder who is an individual resident for tax purposes in the UK is subject to UK tax on dividends received from the company, including dividends received under the dividend reinvestment plan (DRIP) for ordinary shareholders, but until 5 April 2016, was entitled to a tax credit on cash dividends paid on ordinary shares or ADSs of the company equal to one-ninth of the cash dividend. From 6 April 2016 the dividend tax credit was replaced by a new tax-free dividend allowance and dividends paid by the company on or after 6 April 2016 do not carry a UK tax credit. The dividend allowance was £5,000 but this has been reduced to £2,000 as of 6 April 2018. The dividend allowance of £2,000 means there is no UK tax due on the first £2,000 of dividends received. Dividends above this level are subject to tax at 7.5% for basic tax payers, 32.5% for higher rate tax payers and 38.1% for additional rate tax payers. Although the first £2,000 of dividend income is not subject to UK income tax, it does not reduce the total income for tax purposes. Dividends within the dividend allowance still count towards basic or higher rate bands, and may therefore affect the rate of tax paid on dividends received in excess of the £2,000 allowance. For instance, if an individual has an annual gross salary of £50,000 and also receives a dividend of £12,000 they will be subject to the following scenario. The individual's personal allowance and the basic rate tax band will be used up by the gross salary. The remaining part of the salary and the whole of the dividend will be subject to tax at the higher rate, although the dividend allowance will reduce the amount of dividend subject to tax. The dividend of £12,000 will be reduced by the dividend allowance of £2,000 leaving taxable dividend income of £10,000. The dividend will be taxed at 32.5% so that the total tax payable on the dividends is £3,250. How the shareholder pays the tax arising on the dividend income depends on the amount of dividend income and salary they receive in the tax year. If less than £2,000 they will not need to report anything or pay any tax. If between £2,000 and £10,000, the shareholder can pay what they owe by: contacting the helpline; asking HMRC to change their tax code – the tax will be taken from their wages or pension or through completion of the ‘Dividends’ section of their tax return, where one is being filed. If over £10,000 they will be required to file a self-assessment tax return and should complete the ‘Dividends’ section with details of the amounts received. US federal income taxation A US holder is subject to US federal income taxation on the gross amount of any dividend paid by the company (including dividends paid but reinvested received under the Global Invest Direct (GID) Dividend Reinvestment Plan for ADS holders) out of its current or accumulated earnings and profits (as determined for US federal income tax purposes). Dividends paid to a non-corporate US holder that constitute qualified dividend income will be taxable to the holder at a preferential rate, provided that the holder has a holding period in the ordinary shares or ADSs of more than 60 days during the 121-day period beginning 60 days before the ex-dividend date and meets other holding period requirements. Dividends paid by the company with respect to the ordinary shares or ADSs will generally be qualified dividend income. For US federal income tax purposes, a dividend must be included in income when the US holder, in the case of ordinary shares, or the Depositary, in the case of ADSs, actually or constructively receives the dividend and will not be eligible for the dividends-received deduction generally allowed to US corporations in respect of dividends received from other US corporations. US ADS holders should consult their own tax adviser regarding the US tax treatment of the dividend fee in respect of dividends. Dividends will be income from sources outside the US and generally will be ‘passive category income’ or, in the case of certain US holders, ‘general category income’, each of which is treated separately for purposes of computing a US holder’s foreign tax credit limitation. As noted above in UK taxation, a US holder will not be subject to UK withholding tax. Accordingly, the receipt of a dividend will not entitle the US holder to a foreign tax credit. The amount of the dividend distribution on the ordinary shares that is paid in pounds sterling will be the US dollar value of the pounds sterling payments made, determined at the spot pounds sterling/US dollar rate on the date the dividend distribution is includible in income, regardless of whether the payment is, in fact, converted into US dollars. Generally, any gain or loss resulting from currency exchange fluctuations during the period from the date the pounds sterling dividend payment is includible in income to the date the payment is converted into US dollars will be treated as ordinary income or loss and will not be eligible for the preferential tax rate on qualified dividend income. The gain or loss generally will be income or loss from sources within the US for foreign tax credit limitation purposes. Distributions in excess of the company’s earnings and profits, as determined for US federal income tax purposes, will be treated as a return of capital to the extent of the US holder’s basis in the ordinary shares or ADSs and thereafter as capital gain, subject to taxation as described in Taxation of capital gains – US federal income taxation section below. In addition, the taxation of dividends may be subject to the rules for passive foreign investment companies (PFIC), described below under ‘Taxation of capital gains – US federal income taxation’. Distributions made by a PFIC do not constitute qualified dividend income and are not eligible for the preferential tax rate applicable to such income. Taxation of capital gains UK taxation A US holder may be liable for both UK and US tax in respect of a gain on the disposal of ordinary shares or ADSs if the US holder is (1) resident for tax purposes in the United Kingdom at the date of disposal, (2) if he or she has left the UK for a period not exceeding five complete tax years between the year of departure from and the year of return to the UK and acquired the shares before leaving the UK and was resident in the UK in the previous four out of seven tax years before the year of departure, (3) a US domestic corporation resident in the UK by reason of its business being managed or controlled in the UK or (4) a citizen of the US that carries on a trade or profession or vocation in the UK through a branch or agency or a corporation that carries on a trade, profession or vocation in the UK, through a permanent establishment, and that has used, held, or acquired the ordinary shares or ADSs for the purposes of such trade, profession or vocation of such branch, agency or permanent establishment. However, such persons may be entitled to a tax credit against their US federal income tax liability for the amount of UK capital gains tax or UK corporation tax on chargeable gains (as the case may be) that is paid in respect of such gain. Under the Treaty, capital gains on dispositions of ordinary shares or ADSs generally will be subject to tax only in the jurisdiction of residence of the relevant holder as determined under both the laws of the UK and the US and as required by the terms of the Treaty. Under the Treaty, individuals who are residents of either the UK or the US and who have been residents of the other jurisdiction (the US or the UK, as the case may be) at any time during the six years immediately preceding the relevant disposal of ordinary shares or ADSs may be subject to tax with respect to capital gains arising from a disposition of ordinary shares or ADSs of the company not only in the jurisdiction of which the holder is resident at the time of the disposition but also in the other jurisdiction. For gains on or after 23 June 2010, the UK Capital Gains Tax rate will be dependent on the level of an individual’s taxable income. Where total taxable income and gains after all allowable deductions are less than the upper limit of the basic rate income tax band of £37,500 (for
| | | | | | | BP Annual Report and Form 20-F 2019
| «See Glossary
| | 329 |
2019/20) 2020/21), the rate of Capital Gains Tax will be 10%. For gains (and any parts of gains) above that limit the rate will be 20%.
| | | | | | | | | | | | | | | «See Glossary | | bp Annual Report and Form 20-F 2020 | | 333 |
From 6 April 2008, entitlement to the annual exemption is based on an individual’s circumstances (taking into account Domicile status, remittance basis of taxation and number of years in the UK). For individuals who are entitled to the exemption for 2019/20,2020/21, this has been set at £12,000.£12,300. Corporation tax on chargeable gains is levied at 19 per cent for companies from 1 April 2017. US federal income taxation A US holder who sells or otherwise disposes of ordinary shares or ADSs will recognize a capital gain or loss for US federal income tax purposes equal to the difference between the US dollar value of the amount realized on the disposition and the US holder’s tax basis, determined in US dollars, in the ordinary shares or ADSs. Any such capital gain or loss generally will be long-term gain or loss, subject to tax at a preferential rate for a non-corporate US holder, if the US holder’s holding period for such ordinary shares or ADSs exceeds one year. The tax basis of shares acquired through reinvested dividends under the GID Dividend Reinvestment Plan for ADS holders) is equal to the fair market value of the stock on the investment date. The holding period for shares acquired under the plan begins the day after the applicable investment date. Gain or loss from the sale or other disposition of ordinary shares or ADSs will generally be income or loss from sources within the US for foreign tax credit limitation purposes. The deductibility of capital losses is subject to limitations. We do not believe that ordinary shares or ADSs will be treated as stock of a passive foreign investment company (PFIC) for US federal income tax purposes, but this conclusion is a factual determination that is made annually and thus is subject to change. If we are treated as a PFIC, unless a US holder elects to be taxed annually on a mark-to-market basis with respect to ordinary shares or ADSs, any gain realized on the sale or other disposition of ordinary shares or ADSs would in general not be treated as capital gain. Instead, a US holder would be treated as if he or she had realized such gain rateably over the holding period for ordinary shares or ADSs and would be taxed at the highest tax rate in effect for each such year to which the gain was allocated, in addition to which an interest charge in respect of the tax attributable to each such year would apply. Certain ‘excess distributions’ would be similarly treated if we were treated as a PFIC. Additional tax considerations Scrip Programme Until the publication of the 2019 third quarter results, the company had an optional Scrip Programme, wherein holders of BPbp ordinary shares or ADSs could elect to receive any dividends in the form of new fully paid ordinary shares or ADSs of the company instead of cash. Please consult your tax adviser for the consequences to you. UK inheritance tax The Estate Tax Convention applies to inheritance tax. ADSs held by an individual who is domiciled for the purposes of the Estate Tax Convention in the US and is not for the purposes of the Estate Tax Convention a national of the UK will not be subject to UK inheritance tax on the individual’s death or on transfer during the individual’s lifetime unless, among other things, the ADSs are part of the business property of a permanent establishment situated in the UK used for the performance of independent personal services. In the exceptional case where ADSs are subject to both inheritance tax and US federal gift or estate tax, the Estate Tax Convention generally provides for tax payable in the US to be credited against tax payable in the UK or for tax paid in the UK to be credited against tax payable in the US, based on priority rules set forth in the Estate Tax Convention. UK stamp duty and stamp duty reserve tax The statements below relate to what is understood to be the current practice of HM Revenue & Customs in the UK under existing law. Provided that any instrument of transfer is not executed in the UK and remains at all times outside the UK and the transfer does not relate to any matter or thing done or to be done in the UK, no UK stamp duty is payable on the acquisition or transfer of ADSs. Neither will an agreement to transfer ADSs in the form of ADRs give rise to a liability to stamp duty reserve tax. Purchases of ordinary shares, as opposed to ADSs, through the CREST system of paperless share transfers will be subject to stamp duty reserve tax at 0.5%. The charge will arise as soon as there is an agreement for the transfer of the shares (or, in the case of a conditional agreement, when the condition is fulfilled). The stamp duty reserve tax will apply to agreements to transfer ordinary shares even if the agreement is made outside the UK between two non-residents. Purchases of ordinary shares outside the CREST system are subject either to stamp duty at a rate of £5 per £1,000 (or part, unless the stamp duty is less than £5, when no stamp duty is charged), or stamp duty reserve tax at 0.5%. Stamp duty and stamp duty reserve tax are generally the liability of the purchaser. A subsequent transfer of ordinary shares to the Depositary’s nominee will give rise to further stamp duty at the rate of £1.50 per £100 (or part) or stamp duty reserve tax at the rate of 1.5% of the value of the ordinary shares at the time of the transfer. For ADR holders electing to receive ADSs instead of cash, after the 2012 first quarter dividend payment, HM Revenue & Customs no longer seeks to impose 1.5% stamp duty reserve tax on issues of UK shares and securities to non-EU clearance services and depositary receipt systems. US Medicare Tax
A US holder that is an individual or estate, or a trust that does not fall into a special class of trusts that is exempt from such tax, is subject to a 3.8% tax on the lesser of (1) the US holder’s ‘net investment income’ (or ‘undistributed net investment income’ in the case of an estate or trust) for the relevant taxable year and (2) the excess of the US holder’s modified adjusted gross income for the taxable year over a certain threshold (which in the case of individuals is between $125,000 and $250,000, depending on the individual’s circumstances). A holder’s net investment income generally includes its dividend income and its net gains from the disposition of shares or ADSs, unless such dividend income or net gains are derived in the ordinary course of the conduct of a trade or business (other than a trade or business that consists of certain passive or trading activities). If you are a US holder that is an individual, estate or trust, you are urged to consult your tax advisers regarding the applicability of the Medicare tax to your income and gains in respect of your investment in the shares or ADSs.
Major shareholders The disclosure of certain major and significant shareholdings in the share capital of the company is governed by the Companies Act 2006, the UK Financial Conduct Authority’s Disclosure Guidance and Transparency Rules (DTR) and the US Securities Exchange Act of 1934. Register of members holding BPbp ordinary shares as at 31 December 20192020 | | | | | | | | | | | | | Range of holdings | Number of ordinary
shareholders | Percentage of total
ordinary shareholders | Percentage of total ordinary share capital
excluding shares
held in treasury | | 1-200 | 52,385 | | 23.06 | | 0.01 | | | 201-1,000 | 75,742 | | 33.35 | | 0.21 | | | 1,001-10,000 | 86,759 | | 38.20 | | 1.36 | | | 10,001-100,000 | 10,733 | | 4.73 | | 1.10 | | | 100,001-1,000,000 | 824 | | 0.36 | | 1.45 | | Over 1,000,000a | 674 | | 0.30 | | 95.87 | | | Totals | 227,117 | | 100.00 | | 100.00 | |
| | | | | | | Range of holdings | Number of ordinary shareholders |
| Percentage of total ordinary shareholders | Percentage of total ordinary share capital excluding shares held in treasury | | 1-200 | 52,926 |
| 22.96 | 0.01 | | 201-1,000 | 77,165 |
| 33.47 | 0.21 | | 1,001-10,000 | 88,204 |
| 38.26 | 1.37 | | 10,001-100,000 | 10,640 |
| 4.61 | 1.10 | | 100,001-1,000,000 | 928 |
| 0.40 | 1.68 | Over 1,000,000a | 693 |
| 0.30 | 95.63 | | Totals | 230,556 |
| 100.00 | 100.00 |
| | a
| Includes JPMorgan Chase Bank, N.A. holding 27.04% of the total ordinary issued share capital (excluding shares held in treasury) as the approved depositary for ADSs, a breakdown of which is shown in the table below. |
| | | | | | 330 | | «See Glossary
| BP Annual Report and Form 20-F 2019
| |
Register of holders of American depositary shares (ADSs) as at 31 December 20192020a | | | | | | | | | | | | | Range of holdings | Number of
ADS holders | Percentage of
total ADS holders | Percentage of
total ADSs | | 1-200 | 43,236 | | 59.04 | | 0.27 | | | 201-1,000 | 19,362 | | 26.44 | | 1.07 | | | 1,001-10,000 | 10,198 | | 13.92 | | 3.06 | | | 10,001-100,000 | 432 | | 0.59 | | 0.82 | | | 100,001-1,000,000 | 7 | | 0.01 | | 0.22 | | Over 1,000,000b | 1 | | 0.00 | | 94.56 | | | Totals | 73,236 | | 100.00 | | 100.00 | |
| | | | | | | Range of holdings | Number of ADS holders |
| Percentage of total ADS holders | Percentage of total ADSs | | 1-200 | 46,802 |
| 59.80 | 0.27 | | 201-1,000 | 20,337 |
| 25.98 | 1.05 | | 1,001-10,000 | 10,654 |
| 13.61 | 3.00 | | 10,001-100,000 | 466 |
| 0.60 | 0.84 | | 100,001-1,000,000 | 7 |
| 0.01 | 0.14 | Over 1,000,000b | 1 |
| 0.00 | 94.70 | | Totals | 78,267 |
| 100.00 | 100.00 |
| | ab One holder of ADSs represents 1,056,393 approx. underlying shareholders. | One ADS represents six 25 cent ordinary shares. |
| | b
| One holder of ADSs represents 1,231,543 underlying shareholders. |
As at 31 December 20192020 there were also 1,2361,212 preference shareholders. Preference shareholders represented 0.41%0.42% and ordinary shareholders represented 99.59%99.58% of the total issued nominal share capital of the company (excluding shares held in treasury) as at that date. As at 31 December 2019, we2020, the company had been notifiednot received any notifications pursuant to DTR5 that BlackRock, Inc. held 7.37% of the voting rights attached to the issued share capital of the company. DTR5. The company also did not receive any notifications pursuant to DTR5 between 1 January 20202021 and 2725 February 2020.2021. Under the US Securities Exchange Act of 1934 BPbp is aware of the following interests as at 2725 February 2020:2021: | | | | | | | | | | | | | | | | 334 | | bp Annual Report and Form 20-F 2020 | | «See Glossary |
| | | | | | Holder | Holding of ordinary shares |
| Percentage of ordinary share capital excluding shares held in treasury | | JPMorgan Chase Bank N.A., depositary for ADSs, through its nominee Guaranty Nominees Limited | 5,496,296,263 |
| 27.13 | | BlackRock, Inc. | 1,531,724,983 |
| 7.60 | | The Vanguard Group, Inc | 813,197,253 |
| 4.00 |
| | | | | | | | | | Holder | Holding of ordinary shares | Percentage of ordinary share capital excluding shares held in treasury | | JPMorgan Chase Bank N.A., depositary for ADSs, through its nominee Guaranty Nominees Limited | 5,098,817,683 | | 25.06 | | | BlackRock, Inc. | 1,514,099,140 | | 7.69 | | | The Vanguard Group, Inc | 763,396,544 | | 3.75 | |
The company’s major shareholders do not have different voting rights. The company has also been notified of the following interests in preference shares as at 2725 February 2020:2021: | | | | | | | | | | Holder | Holding of 8%
cumulative first
preference shares | Percentage
of class | | The National Farmers Union Mutual Insurance Society Limited | 945,000 | | 13.07 | | | Hargreaves Lansdown Asset Management Limited | 698,778 | | 9.66 | | | Interactive Investor Share Dealing Services | 573,177 | | 7.92 | | | M & G Investment Management Ltd. | 528,150 | | 7.30 | | | Canaccord Genuity Group Inc. | 504,162 | | 6.97 | | | Halifax Share Dealing Services | 416,661 | | 5.76 | |
| | | | | | Holder | Holding of 8% cumulative first preference shares |
| Percentage of class | | The National Farmers Union Mutual Insurance Society Limited | 945,000 |
| 13.10 | | Hargreaves Lansdown Asset Management Limited | 644,225 |
| 8.90 | | Canaccord Genuity Group Inc. | 544,163 |
| 7.50 | | M&G Investment Management Ltd. | 528,150 |
| 7.30 | | Interactive Investor Share Dealing Services | 513,068 |
| 7.10 | | A J Bell Securities Limited | 390,807 |
| 5.40 |
| | | Holder | Holding of 9% cumulative second preference shares |
| Percentage of class |
| Holder | Holding of 9%
cumulative second
preference shares | Percentage
of class | | The National Farmers Union Mutual Insurance Society Limited | 987,000 |
| 18.00 |
| The National Farmers Union Mutual Insurance Society Limited | 987,000 | | 18.03 | | | M&G Investment Management Ltd. | 644,450 |
| 11.80 |
| | | M & G Investment Management Ltd. | | M & G Investment Management Ltd. | 644,450 | | 11.77 | | | Safra Group | 385,000 |
| 7.00 |
| Safra Group | 385,000 | | 7.03 | | | Canaccord Genuity Group Inc. | 273,135 |
| 5.00 |
| Canaccord Genuity Group Inc. | 306,605 | | 5.60 | | | Barclays PLC | 271,080 |
| 5.00 |
| | |
As at 2725 February 2020,2021, the total preference shares in issue comprised only 0.42% of the company’s total issued nominal share capital (excluding shares held in treasury), the rest being ordinary shares. Annual general meeting The 20202021 AGM willis scheduled to be held on Wednesday 2712 May 20202021 at 11.00am. A separate notice convening the meeting is distributed to shareholders, which includes an explanation of the items of business to be considered at the meeting. All resolutions for which notice has been given will be decided on a poll. Deloitte LLP have expressed their willingness to continue in office as auditors and a resolution for their reappointment is included in the Notice of BPbp Annual General Meeting 20202021. Memorandum and Articles of Association The following summarizes certain provisions of the company’s Memorandum and Articles of Association and applicable English law. This summary is qualified in its entirety by reference to the UK Companies Act 2006 (the Act) and the company’s Memorandum and Articles of Association. The Memorandum and Articles of Association are available online at bp.com/usefuldocs. The company’s Articles of Association may be amended by a special resolution at a general meeting of the shareholders. At the annual general meeting (AGM) held on 21 May 2018 shareholders voted to adopt new Articles of Association to reflect developments in market practice and to provide clarification and additional flexibility where necessary or appropriate. Objects and purposes BP
bp is a public company limited by shares, incorporated under the name BP p.l.c. and is registered in England and Wales with the registered number 102498. The provisions regulating the operations of the company, known as its ‘objects’, were historically stated in a company’s memorandum. The Act abolished the need to have object provisions and so at the AGM held on 15 April 2010 shareholders approved the removal of its objects clause together with all other provisions of its Memorandum that, by virtue of the Act, are treated as forming part of the company’s Articles of Association. Directors and secretary The business and affairs of BPbp shall be managed by the directors. The company’s Articles of Association provide that directors may be appointed by the existing directors or by the shareholders in a general meeting. Any person appointed by the directors will hold office only until the next general meeting, notice of which is first given after their appointment and will then be eligible for re-election by the shareholders. A director may be removed by BPbp as provided for by applicable law and shall vacate office in certain circumstances as set out in the Articles of Association. In addition the company may, by special resolution, remove a director before the expiration of his/her period of office and, subject to the Articles of Association, may by ordinary resolution appoint another person to be a director instead. There is no requirement for a director to retire on reaching any age. The Articles of Association place a general prohibition on a director voting in respect of any contract or arrangement in which the director has a material interest other than by virtue of such director’s interest in shares in the company. However, in the absence of some other material interest not indicated below, a director is entitled to vote and to be counted in a quorum for the purpose of any vote relating to a resolution concerning the following matters: •The giving of security or indemnity with respect to any money lent or obligation taken by the director at the request or benefit of the company or any of its subsidiary undertakings. •Any proposal in which the director is interested, concerning the underwriting of company securities or debentures or the giving of any security to a third party for a debt or obligation of the company or any of its subsidiary undertakings. •Any proposal concerning any other company in which the director is interested, directly or indirectly (whether as an officer or shareholder or otherwise) provided that the director and persons connected with such director are not the holder or holders of 1% or more of the voting interest in the shares of such company.
| | | | | | | BP Annual Report and Form 20-F 2019
| «See Glossary
| | 331 |
•Any proposal concerning the purchase or maintenance of any insurance policy under which the director may benefit. •Any proposal concerning the giving to the director of any other indemnity which is on substantially the same terms as indemnities given or to be given to all of the other directors or to the funding by the company of his expenditure on defending proceedings or the doing by the company of anything to enable the director to avoid incurring such expenditure where all other directors have been given or are to be given substantially the same arrangements. •Any proposal concerning an arrangement for the benefit of the employees and directors or former employees and former directors of the company or any of its subsidiary undertakings, including but without being limited to a retirement benefits scheme and an employees’ share scheme, which does not accord to any director any privilege or advantage not generally accorded to the employees or former employees to whom the arrangement relates. The Act requires a director of a company who is in any way interested in a contract or proposed contract with the company to declare the nature of the director’s interest at a meeting of the directors of the company. The definition of ‘interest’ includes the interests of spouses, children, companies and trusts. The Act also requires that a director must avoid a situation where a director has, or could have, a direct or indirect interest that conflicts, or possibly may conflict, with the company’s interests. The Act allows directors of public companies to authorize such conflicts where appropriate, if a company’s Articles of Association so permit. BP’sbp’s Articles of Association permit the authorization of such conflicts. The directors may exercise all the powers of the company to borrow money, except | | | | | | | | | | | | | | | «See Glossary | | bp Annual Report and Form 20-F 2020 | | 335 |
that the amount remaining undischarged of all moneys borrowed by the company shall not, without approval of the shareholders, exceed two times the amount paid up on the share capital plus the aggregate of the amount of the capital and revenue reserves of the company. Variation of the borrowing power of the board may only be affected by amending the Articles of Association. Remuneration of non-executive directors shall be determined in the aggregate by resolution of the shareholders. Remuneration of executive directors is determined by the remuneration committee. This committee is made up of non-executive directors only. There is no requirement of share ownership for a director’s qualification. The Articles of Association provide entitlement to the directors’ pensions and death and disability benefits to the directors’ relations and dependants respectively. The circumstances in which a director’s office will automatically terminate include: when a director ceases to hold an executive office of the company and the directors resolve that he should cease to be a director; if a medical practitioner provides an opinion that a director has become incapable of acting as a director and may remain so incapable for a further three months and the directors resolve that he should cease to be a director; and if all of the other directors vote in favour of a resolution stating that the person should cease to be a director. The company secretary has express powers to delegate any of the powers or discretions conferred on him or her. Dividend rights; other rights to share in company profits; capital calls If recommended by the directors of BP,bp, shareholders of BPbp may, by resolution, declare dividends but no such dividend may be declared in excess of the amount recommended by the directors. The directors may also pay interim dividends without obtaining shareholder approval. No dividend may be paid other than out of profits available for distribution, as determined under IFRS and the Act. Dividends on ordinary shares are payable only after payment of dividends on BPbp preference shares. Any dividend unclaimed after a period of 10 years from the date of declaration of such dividend shall be forfeited and reverts to BP.bp. If the company exercises its right to forfeit shares and sells shares belonging to an untraced shareholder then any entitlement to claim dividends or other monies unclaimed in respect of those shares will be for a period of twelve months after the sale. The company may take such steps as the directors decide are appropriate in the circumstances to trace the member entitled and the sale may be made at such time and on such terms as the directors may decide. The directors have the power to declare and pay dividends in any currency provided that a sterling equivalent is announced. It is not the company’s intention to change its current policy of paying dividends in US dollars. At the company’s AGM held on 15 April 2010, shareholders approved the introduction of a Scrip Dividend Programme (Scrip Programme) and to include provisions in the Articles of Association to enable the company to operate the Scrip Programme. The Scrip Programme was renewed at the company’s AGM held on 21 May 2018 for a further three years. The Scrip Programme enables ordinary shareholders and BPbp ADS holders to elect to receive new fully paid ordinary shares (or BPbp ADSs in the case of BPbp ADS holders) instead of cash. The operation of the Scrip Programme is always subject to the directors’ decision to make the scrip offer available in respect of any particular dividend. Should the directors decide not to offer the scrip in respect of any particular dividend, cash will automatically be paid instead. The directors may determine in relation to any scrip dividend plan or programme how the costs of the programme will be met, the minimum number of ordinary shares required in order to be able to participate in the programme and any arrangements to deal with legal and practical difficulties in any particular territory. Apart from shareholders’ rights to share in BP’sbp’s profits by dividend (if any is declared or announced), the Articles of Association provide that the directors may set aside: •A special reserve fund out of the balance of profits each year to make up any deficit of cumulative dividend on the BPbp preference shares. •A general reserve out of the balance of profits each year, which shall be applicable for any purpose to which the profits of the company may properly be applied. This may include capitalization of such sum, pursuant to an ordinary shareholders’ resolution, and distribution to shareholders as if it were distributed by way of a dividend on the ordinary shares or in paying up in full unissued ordinary shares for allotment and distribution as bonus shares. Any such sums so deposited may be distributed in accordance with the manner of distribution of dividends as described above. Holders of shares are not subject to calls on capital by the company, provided that the amounts required to be paid on issue have been paid off. All shares are fully paid. Share transfers and share certificates The directors may permit transfers to be effected other than by an instrument in writing and that share certificates will not be required to be issued by the company if they are not required by law. The company may charge an administrative fee in the event that a shareholder wishes to replace two or more certificates representing shares with a single certificate or wishes to surrender a single certificate and replace it with two or more certificates. All certificates are sent at the member’s risk. Voting rights The Articles of Association of the company provide that voting on resolutions at a shareholders’ meeting will be decided on a poll other than resolutions of a procedural nature, which may be decided on a show of hands. If voting is on a poll, every shareholder who is present in person or by proxy has one vote for every ordinary share held and two votes for every £5 in nominal amount of BPbp preference shares held. If voting is on a show of hands, each shareholder who is present at the meeting in person or whose duly appointed proxy is present in person will have one vote, regardless of the number of shares held, unless a poll is requested. Shareholders do not have cumulative voting rights. For the purposes of determining which persons are entitled to attend or vote at a shareholders’ meeting and how many votes such persons may cast, the company may specify in the notice of the meeting a time, not more than 48 hours before the time of the meeting, by which a person who holds shares in registered form must be entered on the company’s register of members in order to have the right to attend or vote at the meeting or to appoint a proxy to do so.
| | | | | | 332 | | «See Glossary
| BP Annual Report and Form 20-F 2019
| |
Holders on record of ordinary shares may appoint a proxy, including a beneficial owner of those shares, to attend, speak and vote on their behalf at any shareholders’ meeting, provided that a duly completed proxy form is received not less than 48 hours (or such shorter time as the directors may determine) before the time of the meeting or adjourned meeting or, where the poll is to be taken after the date of the meeting, not less than 24 hours (or such shorter time as the directors may determine) before the time of the poll. Record holders of BPbp ADSs are also entitled to attend, speak and vote at any shareholders’ meeting of BPbp by the appointment by the approved depositary, JPMorgan Chase Bank N.A., of them as proxies in respect of the ordinary shares represented by their ADSs. Each such proxy may also appoint a proxy. Alternatively, holders of BPbp ADSs are entitled to vote by supplying their voting instructions to the depositary, who will vote the ordinary shares represented by their ADSs in accordance with their instructions. Proxies may be delivered electronically. Corporations who are members of the company may appoint one or more persons to act as their representative or representatives at any shareholders’ meeting provided that the company may require a corporate representative to produce a certified copy of the resolution appointing them before they are permitted to exercise their powers. Matters are transacted at shareholders’ meetings by the proposing and passing of resolutions, of which there are two types: ordinary or special. An ordinary resolution requires the affirmative vote of a majority of the votes of those persons voting at a meeting at which there is a quorum. A special resolution requires the affirmative vote of not less than three quarters of the persons voting at a meeting at which there is a quorum. Any AGM requires 21 clear days’ notice. The notice period for any other general meeting is 14 clear days subject to the company obtaining annual shareholder approval, failing which, a 21 clear day notice period will apply. | | | | | | | | | | | | | | | | 336 | | bp Annual Report and Form 20-F 2020 | | «See Glossary |
Liquidation rights; redemption provisions In the event of a liquidation of BP,bp, after payment of all liabilities and applicable deductions under UK laws and subject to the payment of secured creditors, the holders of BPbp preference shares would be entitled to the sum of (1) the capital paid up on such shares plus, (2) accrued and unpaid dividends and (3) a premium equal to the higher of (a) 10% of the capital paid up on the BPbp preference shares and (b) the excess of the average market price over par value of such shares on the LSE during the previous six months. The remaining assets (if any) would be divided pro rata among the holders of ordinary shares. Without prejudice to any special rights previously conferred on the holders of any class of shares, BPbp may issue any share with such preferred, deferred or other special rights, or subject to such restrictions as the shareholders by resolution determine (or, in the absence of any such resolutions, by determination of the directors), and may issue shares that are to be or may be redeemed. Variation of rights The rights attached to any class of shares may be varied with the consent in writing of holders of 75% of the shares of that class or on the adoption of a special resolution passed at a separate meeting of the holders of the shares of that class. At every such separate meeting, all of the provisions of the Articles of Association relating to proceedings at a general meeting apply, except that the quorum with respect to a meeting to change the rights attached to the preference shares is 10% or more of the shares of that class, and the quorum to change the rights attached to the ordinary shares is one third or more of the shares of that class. Shareholders’ meetings and notices Shareholders must provide BPbp with a postal or electronic address in the UK to be entitled to receive notice of shareholders’ meetings. Holders of BPbp ADSs are entitled to receive notices under the terms of the deposit agreement relating to BPbp ADSs. The substance and timing of notices are described above under the heading Voting rights. Under the Act, the AGM of shareholders must be held once every year, within each six month period beginning with the day following the company’s accounting reference date. All general meetings shall be held at a time and place determined by the directors. If any shareholders’ meeting is adjourned for lack of quorum, notice of the time and place of the adjourned meeting may be given in any lawful manner, including electronically. Powers exist for action to be taken either before or at the meeting by authorized officers to ensure its orderly conduct and safety of those attending. The directors have power to convene a general meeting which is a hybrid meeting, that is to provide facilities for shareholders to attend a meeting which is being held at a physical place by electronic means as well (but not to convene a purely electronic meeting). The provisions of the Articles of Association in relation to satellite meetings permit facilities being provided by electronic means to allow those persons at each place to participate in the meeting. Limitations on voting and shareholding There are no limitations, either under the laws of the UK or under the company’s Articles of Association, restricting the right of non-resident or foreign owners to hold or vote BPbp ordinary or preference shares in the company other than limitations that would generally apply to all of the shareholders and limitations applicable to certain countries and persons subject to EU economic sanctions or those sanctions adopted by the UK government which implement resolutions of the Security Council of the United Nations. Disclosure of interests in shares The Act permits a public company to give notice to any person whom the company believes to be or, at any time during the three years prior to the issue of the notice, to have been interested in its voting shares requiring them to disclose certain information with respect to those interests. Failure to supply the information required may lead to disenfranchisement of the relevant shares and a prohibition on their transfer and receipt of dividends and other payments in respect of those shares and any new shares in the company issued in respect of those shares. In this context the term ‘interest’ is widely defined and will generally include an interest of any kind whatsoever in voting shares, including any interest of a holder of BPbp ADSs. Called-up share capital Details of the allotted, called-up and fully-paid share capital at 31 December 20192020 are set out in Financial statements – Note 31. In accordance with institutional investor guidelines, the company deems it appropriate to grant authority to the directors to allot shares and other securities and to disapply pre-emption rights by way of shareholders' resolutions at each AGM in place of authority granted by virtue of the company's Articles of Association. At the AGM on 2127 May 2019,2020, authorization was given to the directors to allot shares in the company and to grant rights to subscribe for, or to convert any security into, shares in the company up to an aggregate nominal amount as set out in the Notice of Meeting 2019.2020. These authorities were given for the period until the next AGM in 20202021 or 2127 August 2020,2021, whichever is the earlier. These authorities are renewed annually at the AGM. Company records and service of notice In relation to notices not covered by the Act, the reference to notice by advertisement in a national newspaper also includes advertisements via other means such as a public announcement.
| | | | | | | | | | | | | | | «See Glossary | BP
| bp Annual Report and Form 20-F 20192020 | «See Glossary
| | 333337 |
Purchases of equity securities by the issuer and affiliated purchasers In November 2017 BPbp began a share repurchase or buyback programme (the programme). The sole purpose of the programme iswas to reduce the issued share capital of the company to offset the ongoing dilutive effect of scrip dividends over time, as announced by the company on 31 October 2017. In January 2020 the share dilution buyback programme had fully offset the impact of scrip dilution since the third quarter 2017. Authorization for the company to make market purchases (as defined in section 693(4) of the Companies Act 2006) of ordinary shares with a nominal value of $0.25 each in the company was renewed at the company’s 20192020 AGM covering the period until the date of the company's 20202021 AGM or 2127 August 2020,2021, whichever is earlier. The maximum number of ordinary shares to be purchased under this authority will not exceed 2,025,988,3132,025,610,110 ordinary shares. The shares purchased will be cancelled. The following table provides details of ordinary share purchases made (1) under the programme and (2) by the Employee Share Ownership Plans (ESOPs) and other purchases of ordinary shares and ADSs made to satisfy the requirements of certain employee share-based payment plans. | | | | | | | | | | | | | | | | | | | | | | | Total number of shares purchaseda | Average price
paid per share
$ | Number of shares purchased by ESOPs or for certain employee share-based plansb | Number of shares purchased as part of the buyback programmec | Maximun approximate dollar value of shares yet to be purchased under the programme
$ million | | 2020 | | | | | | | | January 7 - January 28 | | 120,057,464 | | 6.47 | | Nil | 120,057,464 | | N/A | | February | | Nil | | | | N/A | | March | | Nil | | | | N/A | | April | | Nil | | | | N/A | | May | | Nil | | | | N/A | | June | | Nil | | | | N/A | | July | | Nil | | | | N/A | | August | | Nil | | | | N/A | | September | | Nil | | | | N/A | | October | | Nil | | | | N/A | | November | | Nil | | | | N/A | | December | | Nil | | | | N/A | | 2021 | | | | | | | | January 11 | | 285,552 | | 3.98 | | 285,552 | | Nil | N/A | | | | | | | | | February (to February 26) | | Nil | | | | N/A |
| | | | | | | | | | | | | | | Total number of shares purchaseda |
| Average price paid per share $ |
| Number of shares
purchased
by ESOPs or for
certain employee
share-based plansb |
| Number of shares purchased as part of the buyback programmec |
| Maximun approximate dollar value of shares yet to be purchased under the programme $ million | | 2019 | | | | | | | | January | | Nil |
| | | | N/A | | February 5 – February 21 | | 2,753,983 |
| 7.10 |
| 120,000 |
| 2,633,983 |
| N/A | | March 11 – March 29 | | 4,260,056 |
| 7.29 |
| Nil |
| 4,260,056 |
| N/A | | April 30 | | 120,000 |
| 7.32 |
| 120,000 |
| Nil |
| N/A | | May 8 – May 31 | | 5,012,700 |
| 6.97 |
| Nil |
| 5,012,700 |
| N/A | | June 3 – June 25 | | 5,763,677 |
| 6.96 |
| Nil |
| 5,763,677 |
| N/A | | July | | Nil |
| | | | N/A | | August 5 – August 29 | | 18,852,607 |
| 6.11 |
| Nil |
| 18,852,607 |
| N/A | | September 2 – September 24 | | 16,867,892 |
| 6.24 |
| 878,000 |
| 15,989,892 |
| N/A | | October 7 - October 31 | | 103,926,413 |
| 6.33 |
| Nil |
| 103,926,413 |
| N/A | | November 1 – November 29 | | 55,589,904 |
| 6.53 |
| Nil |
| 55,589,904 |
| N/A | | December 2 - December 19 | | 23,921,618 |
| 6.25 |
| Nil |
| 23,921,618 |
| N/A | | 2020 | | | | | | | | January 7 - January 28 | | 120,057,464 |
| 6.47 |
| Nil |
| 120,057,464 |
| N/A | | February (to February 26) | | Nil |
| | | | N/A |
| | a
| All share purchases were of ordinary shares of 25 cents each and/or ADSs (each representing six ordinary shares) and were on/open market transactions. |
| | b
| Transactions represent the purchase of ordinary shares by ESOPs and other purchases of ordinary shares and ADSs made to satisfy requirements of certain employee share-based payment plans. |
| | c
| The company announced its intent to commence the programme on 31 October 2017 and announced further details and commencement of the programme on 15 November 2017. At the AGM on 21 May 2019, authorization was given to the company to repurchase up to 2,025,988,313 ordinary shares, for the period ending on the date of the AGM in 2020 or 21 August 2020, whichever is the earlier. This authorization is renewed annually at the AGM. The total number of ordinary shares repurchased during 2019 under the programme was 235,950,850 at a cost of $1,511 million (including fees and stamp duty) representing 1.16% of the company’s issued share capital excluding shares held in treasury on 31 December 2019. All ordinary shares repurchased in 2019 under the programme were cancelled in order to reduce the company’s issued share capital. |
bTransactions represent the purchases of ADSs made to satisfy requirements of certain employee share-based payment plans.
c The company announced its intent to commence the programme on 31 October 2017 and announced further details and commencement of the programme on 15 November 2017. The programme was completed in January 2020. At the AGM on 27 May 2020, authorization was given to the company to repurchase up to 2,025,610,110 ordinary shares, for the period ending on the date of the AGM in 2021 or 27 August 2021, whichever is the earlier. This authorization is renewed annually at the AGM. The total number of ordinary shares repurchased during 2020 under the programme was 120,057,464 at a cost of $776 million (including fees and stamp duty) representing 0.59% of the company’s issued share capital excluding shares held in treasury on 31 December 2020. All ordinary shares repurchased in 2020 under the programme were cancelled in order to reduce the company’s issued share capital. | | | | | | | | | | | | | | | 334338 | | «See Glossary
| BPbp Annual Report and Form 20-F 2019
2020 | | «See Glossary |
Fees and charges payable by ADS holders The Depositary collects fees for delivery and surrender of ADSs directly from investors depositing shares or surrendering ADSs for the purpose of withdrawal or from intermediaries acting for them. The Depositary collects fees for making distributions to investors by deducting those fees from the amounts distributed or by selling a portion of the distributable property to pay the fees. The charges of the Depositary payable by investors are as follows: | | | | | | | | | | Type of service | Depositary actions | Fee | | Depositing or substituting the underlying shares | Issuance of ADSs against the deposit of shares, including deposits and issuances in respect of: • Share distributions, stock splits, rights, merger.• Exchange of securities or other transactions or event or other distribution affecting the ADSs or deposited securities. | $5.00 per 100 ADSs (or portion thereof) evidenced by the new ADSs delivered. | | Selling or exercising rights | Distribution or sale of securities, the fee being an amount equal to the fee for the execution and delivery of ADSs that would have been charged as a result of the deposit of such securities. | $5.00 per 100 ADSs (or portion thereof). | | Withdrawing an underlying share | Acceptance of ADSs surrendered for withdrawal of deposited securities. | $5.00 for each 100 ADSs (or portion thereof) evidenced by the ADSs surrendered. | | Expenses of the Depositary | Expenses incurred on behalf of holders in connection with: • Stock transfer or other taxes and governmental charges.• Delivery by cable, telex, electronic and facsimile transmission.• Transfer or registration fees, if applicable, for the registration of transfers of underlying shares.• Expenses of the Depositary in connection with the conversion of foreign currency into US dollars (which are paid out of such foreign currency). | Expenses payable are subject to agreement between the company and the Depositary by billing holders or by deducting charges from one or more cash dividends or other cash distributions. | | Dividend fees | ADS holders who receive a cash dividend are charged a fee which BPbp uses to offset the costs associated with administering the ADS programme. | The Deposit Agreement provides that a fee of $0.05 or less per ADS can be charged. The current fee is $0.02 per BPbp ADS per calendar year (equivalent to $0.005 per BPbp ADS per quarter per cash distribution). | | Global Invest Direct (GID) Plan | New investors and existing ADS holders can buy, sell or reinvest dividends into further BPbp ADSs by enrolling in BP’sbp’s GID Plan, sponsored and administered by the Depositary. | Cost per transaction is $2.00 for recurring, $2.00 for one-time automatic investments, and $5.00 for investment made by check. Dividend reinvestment is 5% of the dividend amount up to a maximum of $5.00. Purchase trading commission is $0.12 per share. |
Fees and payments made by the Depositary to the issuer The Depositary has agreed to reimburse certain company expenses related to the company’s ADS programme and incurred by the company in connection with the ADS programme arising during the year ended 31 December 2019.2020. The Depositary reimbursed to the company, or paid amounts on the company’s behalf to third parties, or waived its fees and expenses, of $15,923,592.90$18,936,081.43 for the year ended 31 December 2019.2020. The table below sets out the types of expenses that the Depositary has agreed to reimburse and the fees it has agreed to waive for standard costs associated with the administration of the ADS programme relating to the year ended 31 December 2019. | | | | | | Category of expense reimbursed,
waived or paid directly to third parties
| Amount reimbursed, waived or paid directly to third parties for the year ended 31 December 2019 $
|
2020
| Fees for delivery and surrender of BPbp ADSs | 169,235.12 |
| Dividend feesa
| 15,754,357.78 |
| Total | 15,923,592.90 |
|
| 1,267,682.60 | | Dividend feesa | Dividend fees are charged to ADS holders who receive a cash distribution, which BP uses to offset the costs associated with administering the ADS programme.17,668,398.83 | | | Total | 18,936,081.43 | |
a Dividend fees are charged to ADS holders who receive a cash distribution, which bp uses to offset the costs associated with administering the ADS programme. Under certain circumstances, including removal of the Depositary or termination of the ADR programme by the company, the company is required to repay the Depositary certain amounts reimbursed and/or expenses paid to or on behalf of the company during the 12-month period prior to notice of removal or termination.
Documents on display BPThe bp Annual Report and Form 20-F 20192020 is available online at bp.com/annualreport. To obtain a hard copy of BP’sbp’s complete audited financial statements, free of charge, UK based shareholders should contact BPbp Distribution Services by calling +44 (0) 800 037 2172 or by emailing bpdistributionservices@bp.com. If based in the US or Canada shareholders should contact Issuer Direct by calling +1 888 301 2505 or by emailing bpreports@issuerdirect.com.
The company is subject to the information requirements of the US Securities Exchange Act of 1934 applicable to foreign private issuers. In accordance with these requirements, the company files its Annual Report and Form 20-F and other related documents with the SEC. The SEC maintains an internet site at www.sec.gov that contains reports and other information regarding issuers, including BP,bp, that file electronically with the SEC. BP'sbp's SEC filings are also available at bp.com/sec. BPbp discloses in this report (see Corporate governance practices (Form 20-F Item 16G) on page 321)326) significant ways (if any) in which its corporate governance practices differ from those mandated for US companies under NYSE listing standards.
| | | | | | | | | | | | | | | «See Glossary | BP
| bp Annual Report and Form 20-F 20192020 | «See Glossary
| | 335339 |
Shareholding administration If you have any queries about the administration of shareholdings, such as change of address, change of ownership, dividend payment options or to change the way you receive your company documents (such as the BPbp Annual Report and Form 20-Fand Notice of BPbp Annual General Meeting) please contact the BPbp Registrar or the BPbp ADS Depositary. Ordinary and preference shareholders The BPbp Registrar, Link Asset ServicesGroup, Central Square, The Registry, 34 Beckenham Road, Beckenham, Kent BR3 4TU, UK29 Wellington Street,
Leeds, LS1 4DL Freephone in UK 0800 701107 From outside the UK +44 (0)371 277 1014
ADS holders BPbp Shareowner Services
PO Box 64504, St Paul, MN 55164-0504, US Toll-free in US and Canada +1 877 638 5672 From outside the US and Canada +1 651 306 4383 2020
2021 shareholder calendara | | | | | | 2726 Mar 20202021 | Fourth quarter interim dividend payment for 20192020 | 2827 April 20202021 | First quarter results announced | 117 May 20202021 | Record date (to be eligible for the first quarter interim dividend) | 2712 May 20202021 | Annual general meeting | 1918 Jun 20202021 | First quarter interim dividend payment for 20202021 | 32 Jul 20202021 | 8% and 9% preference shares record date | 2827 Jul 20202021 | Second quarter results announced | 3130 Jul 20202021 | 8% and 9% preference shares dividend payment | 76 Aug 20202021 | Record date (to be eligible for the second quarter interim dividend) | 1824 Sep 20202021 | Second quarter interim dividend payment for 20202021 | 27 Oct 20202 Nov 2021 | Third quarter results announced | 612 Nov 20202021 | Record date (to be eligible for the third quarter interim dividend) | 1817 Dec 20202021 | Third quarter interim dividend payment for 20202021 |
| | a
| All future dates are provisional and may be subject to change. For the full calendar see bp.com/financialcalendar.
|
a All future dates are provisional and may be subject to change. For the full calendar see bp.com/financialcalendar.
| | | | | | | | | | | | | | | 336340 | | «See Glossary
| BPbp Annual Report and Form 20-F 2019
2020 | | «See Glossary |
Glossary Abbreviations ADR American depositary receipt. ADS American depositary share. 1 ADS = 6 ordinary shares. Barrel (bbl) 159 litres, 42 US gallons. bcf/dbcf
Billion cubic feet per day.feet. bcfe Billion cubic feet equivalent. b/dEVP
Barrels per day.
boe/d
Barrels of oil equivalent per day.Executive vice president.
FPSO Floating production, storage and offloading. GAAP Generally accepted accounting practice. Gas Natural gas. gCO2e/MJ Grams of carbon dioxide equivalent per megajoule of energy. GHG Greenhouse gas. GRI Global Reporting Initiative. GtCO2 Gigatonnes of carbon dioxide. GWh Gigawatt hour. HSSE Health, safety, security and environment. IFRS International Financial Reporting Standards. Kb/d Thousand barrels per day. KPIs Key performance indicators. kt Thousand tonnes. LNG Liquefied natural gas. LPG Liquefied petroleum gas. mb/d Thousand barrels per day. Mbbl Million barrels. mboe/d Thousand barrels of oil equivalent per day. mmb/d or Mb/d Million barrels per day. mmboe/d Million barrels of oil equivalent per day. mmBtu Million British thermal units. mmcf/d Million cubic feet per day. mmte or Mte
Million tonnes. MteCO2e MteCO2
Million tonnes of CO2 equivalent. MWMtpa
Megawatt.Million tonnes per annum.
NGLs Natural gas liquids. PSA Production-sharing agreement. PTA Purified terephthalic acid. RC Replacement cost. SEC The United States Securities and Exchange Commission. TWh Terawatt hour. SVP Senior vice president. Definitions Unless the context indicates otherwise, the definitions for the following glossary terms are given below. Non-GAAP measures are sometimes referred to as alternative performance measures. CA100+ resolution glossary CA100+ resolution The CA100+ resolution means the special resolution requisitioned by Climate Action 100+ and passed at BP’sbp’s 2019 Annual General Meeting, the text of which is set out below. Special resolution: Climate Action 100+ shareholder resolution on climate change disclosures. That in order to promote the long term success of the company, given the recognised risks and opportunities associated with climate change, we as shareholders direct the company to include in its strategic report and/or other corporate reports, as appropriate, for the year ending 2019 onwards, a description of its strategy which the board considers, in good faith, to be consistent with the goals of Articles 2.1(a)(1) and 4.1(2) of the Paris Agreement(3) (the ‘Paris goals’), as well as: (1)Capital expenditure: how the company evaluates the consistency of each new material capex investment, including in the exploration, acquisition or development of oil and gas resources and reserves and other energy sources and technologies, with (a) the Paris goals and separately (b) a range of other outcomes relevant to its strategy. (2) Metrics and targets: the company’s principal metrics and relevant targets or goals over the short, medium and/or long-term, consistent with the Paris goals, together with disclosure of: a. The anticipated levels of investment in (i) oil and gas resources and reserves; and (ii) other energy sources and technologies. b. The company’s targets to promote reductions in its operational greenhouse gas emissions, to be reviewed in line with changing protocols and other relevant factors c. The estimated carbon intensity of the company’s energy products | | | | | | | | | | | | | | | (1) | Capital expenditure: how the company evaluates the consistency of each new material capex investment, including in the exploration, acquisition or development of oil | bp Annual Report and gas resources and reserves and other energy sources and technologies, with (a) the Paris goals and separately (b) a range of other outcomes relevant to its strategy.Form 20-F 2020 | | 341 |
| | (2) | Metrics and targets: the company’s principal metrics and relevant targets or goals over the short, medium and/or long-term, consistent with the Paris goals, together with disclosure of: |
| | a. | The anticipated levels of investment in (i) oil and gas resources and reserves; and (ii) other energy sources and technologies. |
| | b. | The company’s targets to promote reductions in its operational greenhouse gas emissions, to be reviewed in line with changing protocols and other relevant factors |
| | c. | The estimated carbon intensity of the company’s energy products and progress on carbon intensity over time. |
| | d. | Any linkage between the above targets and executive remuneration. |
| | (3) | Progress reporting: an annual review of progress against (1) and (2) above. |
and progress on carbon intensity over time. d. Any linkage between the above targets and executive remuneration. (3) Progress reporting: an annual review of progress against (1) and (2) above. Such disclosure and reporting to include the criteria and summaries of the methodology and core assumptions used, and to omit commercially confidential or competitively sensitive information and be prepared at reasonable cost; and provided that nothing in this resolution shall limit the company’s powers to set and vary its strategy, or associated targets or metrics, or to take any action which
| | | | | | BP Annual Report and Form 20-F 2019
| | 337 |
it believes in good faith, would best promote the long-term success of the company. The Paris goals | | (1) | Article 2.1(a) of the Paris Agreement states the goal of ‘Holding the increase in the global average temperature to well below 2°C above pre-industrial levels and pursuing efforts to limit the temperature increase to 1.5°C above pre-industrial levels, recognizing that this would significantly reduce the risks and impacts of climate change’. |
| | (2) | Article 4.1 of the Paris Agreement: In order to achieve the long-term temperature goal set out in Article 2, parties aim to reach global peaking of greenhouse gas emissions as soon as possible, recognizing that peaking will take longer for developing country parties, and to undertake rapid reductions thereafter in accordance with best available science, so as to achieve a balance between anthropogenic emissions by sources and removals by sinks of greenhouse gases in the second half of this century, on the basis of equity, and in the context of sustainable development and efforts to eradicate poverty. |
| | (3) | U.N. Framework Convention on Climate Change Conference of Parties, Twenty-First Session, Adoption of the Paris Agreement, U.N. Doc. FCCC/CP/2015/L.9/Rev.1 (Dec. 12, 2015). |
(1) Article 2.1(a) of the Paris Agreement states the goal of ‘Holding the increase in the global average temperature to well below 2°C above pre-industrial levels and pursuing efforts to limit the temperature increase to 1.5°C above pre-industrial levels, recognizing that this would significantly reduce the risks and impacts of climate change’. (2) Article 4.1 of the Paris Agreement: In order to achieve the long-term temperature goal set out in Article 2, parties aim to reach global peaking of greenhouse gas emissions as soon as possible, recognizing that peaking will take longer for developing country parties, and to undertake rapid reductions thereafter in accordance with best available science, so as to achieve a balance between anthropogenic emissions by sources and removals by sinks of greenhouse gases in the second half of this century, on the basis of equity, and in the context of sustainable development and efforts to eradicate poverty. (3) U.N. Framework Convention on Climate Change Conference of Parties, Twenty-First Session, Adoption of the Paris Agreement, U.N. Doc. FCCC/CP/2015/L.9/Rev.1 (Dec. 12, 2015). New material capex investment For the purposes of the 20192020 evaluation discussed on pages 19-22,28-32, ‘new material capex investment’ means a decision taken by the resource commitment meeting (RCM) in 20192020 to incur inorganic or organic investments greater than $250 million that relate to a new project or asset, extending an existing project or asset, or acquiring or increasing a share in a project, asset or entity. There were eightthree investments that met the above criteria in 2019.2020. Material capex evaluation: Paris-consistency quantitative tests. For the purposes of evaluating material capex investments for consistency with the Paris goals, two quantitative tests were applied, see page 22.32. | | 1. | Operational carbon intensity (CI) |
1.Operational carbon intensity (CI) The annual average operational GHG emissions (TeCO2e/unit), divided by the relevant unit of output: •per thousand barrels of oil equivalent in Upstream •per utilized equivalent distillation capacity in refining •per thousand tonnes in petrochemicals. | | 2. | Profitability index (PI) |
Operating cash flow divided by investment required (both on a present value basis).
‘Investment required’ means economic resources including capital investment, decommissioning expenditure and the value of any credit support to third parties (e.g. partner carry).
Average emissions intensity of marketed energy products
The weighted average GHG emissions per unit of energy delivered grams CO2e/MJ, estimated in respect of marketing sales of energy products. GHG emissions are estimated on a lifecycle basis covering production, distribution and use of the relevant products, assuming full stoichiometric combustion to CO2.
Net zero aims and ambition glossary Net zero References to global net zero in the phrase, 'to help the world get to net zero', means achieving '...a balance between anthropogenic emissions by sources and removals by sinks of greenhouse gases...on the basis of equity, and in the context of sustainable development and efforts to eradicate poverty', as set out in Article 4(1) of the Paris Agreement. References to net zero for BPbp in the context of our ambition and Aims 1 and 2 as set out on page 749 (such as 'be a net zero company by 2050 or sooner'), means achieving a balance between (a) the relevant Scope 1 and 2 emissions (for our Aim 1), or Scope 3 emissions (for our Aim 2), and (b) the aggregate of applicable deductions from qualifying activities such as sinks under our methodology at the applicable time. Emissions from the carbon in our Upstream oil and gas production Estimated CO2 emissions from the combustion of upstream production of crude oil, natural gas and natural gas liquids (NGLs) on a BPbp equity-share basis based on BP’sbp’s net share of production, excluding BP’sbp’s share of Rosneft production and assuming that all produced volumes undergo full stoichiometric combustion to CO2. Adjusted 2015 baselineAverage emissions intensity of marketed energy products
In accordance with our zero net growth methodology, the starting direct and indirectThe weighted average GHG emissions baseline (endper unit of 2015)energy delivered (in grams CO2e/MJ), estimated in respect of marketing sales of energy products. GHG emissions are estimated on a lifecycle basis covering production, distribution and use of the relevant products (assuming full stoichiometric combustion of the product to CO2).
Methane intensity Methane intensity refers to the amount of methane emissions from bp’s operated upstream oil and gas assets as a percentage of the total gas that goes to market from those operations. Our methodology is adjusted ataligned with the end of eachOil and Gas Climate Initiative’s (OGCI). Sustainable emissions reductions (SER) SERs result from actions or interventions that have led to ongoing reductions in Scope 1 (direct) and/or Scope 2 (indirect) greenhouse gas (GHG) emissions (carbon dioxide and methane) such that GHG emissions would have been higher in the reporting year for any qualifying changes (being changes due to (a) acquisitions, divestments, outsourcing or insourcing whereif the total for the year is greater than 5% the total direct and indirectintervention had not taken place. SERs must meet three criteria: a specific intervention that has reduced GHG emissions, in the previous year or (b) methodology or protocol changes).
reduction must be quantifiable and the reduction is expected to be ongoing. Reductions are reportable for a 12-month period from the start of the intervention/action. Adjusted EBIDA Non-GAAP measure. Adjusted EBIDA is defined as underlying replacement cost profit before interest and tax, add back depreciation, depletion and amortization and exploration expenditure written-off (net of non-operating items), less taxation on an underlying RC basis. bp believes that adjusted EBIDA is a useful measure for investors because it is a measure closely tracked by management to evaluate bp’s operating performance and to make financial, strategic and operating decisions and because it may help investors to understand and evaluate, in the same manner as management, the underlying trends in bp’s operational performance on a comparable basis, period on period. The nearest equivalent measure on an IFRS basis is profit or loss before interest and tax. Adjusted EBIDA per share is calculated based on the shares in issue at period-end. Adjusted effective tax rate (ETR) Non-GAAP measure. The adjusted ETR is calculated by dividing taxation on an underlying replacement cost (RC) basis excluding the impact of reductions in the rate of the UK North Sea supplementary charge (inin 2016 and 2015) by underlying RC profit or loss before tax. Taxation on an underlying RC basis is taxation on a RC basis for the period adjusted for taxation on non-operating items and fair value accounting effects.effects, and certain foreign exchange impacts on the group’s tax charge for the period. Information on underlying RC profit or loss is provided below. BPbp believes it is helpful to disclose the adjusted ETR because this measure may help investors to understand and evaluate, in the same manner as management, the underlying trends in BP’sbp’s operational performance on a comparable basis, period on period. The nearest equivalent measure on an IFRS basis is the ETR on profit or loss for the period. A reconciliation to GAAP information is provided on page 344.348. Associate An entity over which the group has significant influence and that is neither a subsidiary nor a joint arrangement of the group. Significant influence is the power to participate in the financial and operating policy decisions of the investee but is not control or joint control over those policies. Bioenergy production Bioenergy production is average thousands of barrels of biofuel production per day during the period covered, net to bp. This includes equivalent ethanol production, bp Bunge biopower for grid export, biogas and refining co-processing and standalone hydrogenated vegetable oil (HVO). | | | | | | | | | | | | | | | | 342 | | bp Annual Report and Form 20-F 2020 | | |
Brent A trading classification for North Sea crude oil that serves as a major benchmark price for purchases of oil worldwide. Capital expenditure Total cash capital expenditure as stated in the group cash flow statement. Consolidation adjustment – UPIICastrol sales and other operating revenues
Unrealized profit in inventory arising on inter-segment transactions.Castrol sales and other operating revenues, are sales and other operating revenues generated by our Castrol business.
Commodity trading contracts BP’s Upstream and Downstream segments both participatebp participates in regional and global commodity trading markets in order to manage, transact and hedge the crude oil, refined products and natural gas that the group either produces or consumes in its manufacturing operations. These physical trading activities, together with associated incremental trading opportunities, are discussed in Upstream on page 50 and in Downstream on page 56. The range of contracts the group enters into in its commodity trading operations is described below. Using these contracts, in combination with rights to access storage and transportation capacity, allows the group to access advantageous pricing differences between locations, time periods and arbitrage between markets.grades.
| | | | | 338 | | BP Annual Report and Form 20-F 2019
| |
Exchange-traded commodity derivatives Contracts that are typically in the form of futures and options traded on a recognized exchange, such as Nymex and ICE. Such contracts are traded in standard specifications for the main marker crude oils, such as Brent and West Texas Intermediate; the main product grades, such as gasoline and gasoil; and for natural gas and power. Gains and losses, otherwise referred to as variation margin, are generally settled on a daily basis with the relevant exchange. These contracts are used for the trading and risk management of crude oil, refined products, and natural gas and power. Realized and unrealized gains and losses on exchange-traded commodity derivatives are included in sales and other operating revenues for accounting purposes. Over-the-counter (OTC) contracts Contracts that are typically in the form of forwards, swaps and options. Some of these contracts are traded bilaterally between counterparties or through brokers, others may be cleared by a central clearing counterparty. These contracts can be used both for trading and risk management activities. Realized and unrealized gains and losses on over-the-counter (OTC)OTC contracts are included in sales and other operating revenues for accounting purposes. Many grades of crude oil bought and sold use standard contracts including US domestic light sweet crude oil, commonly referred to as West Texas Intermediate, and a standard North Sea crude blend – Brent, Forties, Oseberg and Ekofisk (BFOE). Forward contracts are used in connection with the purchase of crude oil supplies for refineries productsand for marketing and sales of the group’s oil production and refined products. The contracts typically contain standard delivery and settlement terms. These transactions call for physical delivery of oil with consequent operational and price risk. However, various means exist and are used from time to time, to settle obligations under the contracts in cash rather than through physical delivery. Because the physicallyPhysically settled transactions areBFOE contracts delivered by cargo the BFOE contract additionally specifiesspecify a standard volume and tolerance. Gas and power OTC markets are highly developed in North America and the UK, where commodities can be bought and sold for delivery in future periods. These contracts are negotiated between two parties to purchase and sell gas and power at a specified price, with delivery and settlement at a future date. Typically, the contracts specify delivery terms for the underlying commodity. Some of these transactions are not settled physically as they can be achievednet settled by transacting offsetting sale or purchase contracts for the same location and delivery period that are offset during the scheduling of delivery or dispatch.period. The contracts contain standard terms such as delivery point, pricing mechanism, settlement terms and specification of the commodity. Typically, volume, price and term (e.g. daily, monthly and balance of month) are the main variable contract terms. Swaps are oftentypically contractual obligations to exchange cash flows between two parties. A typical swap transaction usually references a floating price and a fixed price with the net difference of the cash flows being settled. Options give the holder the right, but not the obligation, to buy or sell crude, oil products, natural gas or power at a specified price on or before a specific future date. Amounts under these derivative financial instruments are settled at expiry. Typically, netting agreements are used to limit credit exposure and support liquidity. Spot and term contracts Spot contracts are contracts to purchase or sell a commodity at the market price prevailing on or around the delivery date when title to the inventory is taken. Term contracts are contracts to purchase or sell a commodity at regular intervals over an agreed term. Though spot and term contracts may have a standard form, there is no offsetting mechanism in place. TheseAs such, these transactions result in physical delivery with operational and price risk. Spot and term contracts typically relate to purchases of crude for a refinery, products for marketing, or third-party natural gas, or sales of the group’s oil production, oil products or gas production to third parties. For accounting purposes, spot and term sales are included in sales and other operating revenues when title passes. Similarly, spot and term purchases are included in purchases for accounting purposes. Consolidation adjustment – UPII Unrealized profit in inventory arising on inter-segment transactions. Convenience gross margin Non-GAAP measure. Convenience gross margin comprises store gross margin as well as other merchandise and service contribution, not considered as retail fuels or store gross margin, received from the retail service stations operated under a bp brand, excluding equity-accounted entities. Convenience, retail fuels and electrification gross margin Non-GAAP measure. Convenience, retail fuels and electrification gross margin is RC profit before interest and tax for Downstream, adjusted for non-operating items and fair value accounting effects to derive underlying RC profit before interest and tax. Downstream underlying RC profit before interest and tax is further adjusted by subtracting underlying RC profit before interest and tax for the petrochemicals, refining and trading and lubricants businesses; adding-back depreciation, depletion and amortization, production and manufacturing, distribution and administration expenses for fuels (excluding refining and trading); subtracting earnings from equity-accounted entities in fuels (excluding refining and trading) and gross margin for aviation, B2B and midstream businesses. Margin share for convenience and electrification is the ratio of convenience and electrification gross margin to total consumer energy (retail fuels and electrification) and convenience gross margin. bp believes it is helpful to disclose the margin share from convenience and electrification because this measure may help investors to understand and evaluate, in the same way as management, our progress against our strategic objectives of redefining convenience and scaling up our next-gen mobility solutions. The nearest GAAP measures of the numerator and denominator are RC profit before interest and tax. A reconciliation to GAAP information is provided on page 318. We are unable to present forward-looking information of the nearest GAAP measures of the numerator and denominator for margin share for convenience and electrification, because without unreasonable efforts, we are unable to forecast accurately certain adjusting items required to calculate a meaningful comparable GAAP forward-looking financial measure. These items include inventory holding gains or losses, that is difficult to predict in advance in order to include in a GAAP estimate. Cumulative cash costs reductions Non-GAAP measure. Cash costs are a subset of production and manufacturing expenses plus distribution and administration expenses and they exclude costs that are classified as non-operating items. They represent the substantial majority of the remaining expenses in these line items but exclude certain costs that are variable, primarily with volumes (such as freight costs). Management believes that cash costs is a performance measure that provides investors with useful information regarding the company’s financial performance, because it considers these expenses to be the principal operating and overhead expenses that are most directly under their control although they also include certain foreign exchange and commodity price effects. Cumulative cash cost reductions in 2021 compared to 2019, as applicable to the directors’ remuneration usage, are further defined as 2021 exit rate, less agreed portfolio changes compared to 2019 baseline. | | | | | | | | | | | | | | | | | bp Annual Report and Form 20-F 2020 | | 343 |
Customer touchpoints Customer touchpoints are the number of retail customer transactions per day on bp forecourts globally. These include transactions involving fuel and/or convenience across all channels of trade. Developed renewables to final investment decision (FID) Total generating capacity for assets developed to FID by all entities where bp has an equity share (proportionate to equity share). If asset is subsequently sold bp will continue to record capacity as developed to FID. If bp equity share increases developed capacity to FID will increase proportionately to share increase for any assets where bp held equity at the point of FID. Divestment proceeds Disposal proceeds as per the group cash flow statement. Dividend yield Sum of the four quarterly dividends announced in respect of the year as a percentage of the year-end share price on the respective exchange.price. Effective tax rate (ETR) on replacement cost (RC) profit or loss Non-GAAP measure. The ETR on RC profit or loss is calculated by dividing taxation on a RC basis by RC profit or loss before tax. Information on RC profit or loss is provided below. BPbp believes it is helpful to disclose the ETR on RC profit or loss because this measure excludes the impact of price changes on the replacement of inventories and allows for more meaningful comparisons between reporting periods. The nearest equivalent measure on an IFRS basis is the ETR on profit or loss for the period. A reconciliation to GAAP information is provided on page 344.348. Electric vehicle charge points Defined as charge points operated by either bp or a bp joint venture. Fair value accounting effects Non-GAAP adjustments to our IFRS profit or loss. We use derivative instruments to manage the economic exposure relating to inventories above normal operating requirements of crude oil, natural gas and petroleum products. Under IFRS, these inventories are recorded at historical cost. The related derivative instruments, however, are required to be recorded at fair value with gains and losses recognized in the income statement. This is because hedge accounting is either not permitted or not followed, principally due to the impracticality of effectiveness-testing requirements. Therefore, measurement differences in relation to recognition of gains and losses occur. Gains and losses on these inventories are not recognized until the commodity is sold in a subsequent accounting period. Gains and losses on the related derivative commodity contracts are recognized in the income statement, from the time the derivative commodity contract is entered into, on a fair value basis using forward prices consistent with the contract maturity. BPbp enters into physical commodity contracts to meet certain business requirements, such as the purchase of crude for a refinery or the sale of BP’sbp’s gas production. Under IFRS these physical contracts are treated as derivatives and are required to be fair valued when they are managed as part of a larger portfolio of similar transactions. Gains and losses arising are recognized in the income statement from the time the derivative commodity contract is entered into.
IFRS require that inventory held for trading is recorded at its fair value using period-end spot prices, whereas any related derivative commodity instruments are required to be recorded at values based on forward prices consistent with the contract maturity. Depending on market conditions, these forward prices can be either higher or lower than spot prices, resulting in measurement differences. BPbp enters into contracts for pipelines and other transportation, storage capacity, oil and gas processing and liquefied natural gas (LNG) that, under IFRS, are recorded on an accruals basis. These contracts are risk-managed using a variety of derivative instruments that are fair valued under IFRS. This results in measurement differences in relation to recognition of gains and losses.
The way that BPbp manages the economic exposures described above, and measures performance internally, differs from the way these activities are measured under IFRS. BPbp calculates this difference for consolidated entities by comparing the IFRS result with management’s internal measure of performance. Under management’s internal measure of performance the inventory, transportation and capacity contracts in question are valued based on fair value using relevant forward prices prevailing at the end of the period. The fair values of derivative instruments used to risk manage certain oil, gas and other contracts, are deferred to match with the underlying exposure and the commodity contracts for business requirements are accounted for on an accruals basis. We believe that disclosing management’s estimate of this difference provides useful information for investors because it enables investors to see the economic effect of these activities as a whole. In addition, from 2018 fairFair value accounting effects also include changes in the fair value of the near-term portions of LNG contracts that fall within BP’sbp’s risk management framework. LNG contracts are not considered derivatives, because there is insufficient market liquidity, and they are therefore accrual accounted under IFRS. However, oil
| | | | | | BP Annual Report and Form 20-F 2019
| | 339 |
and natural gas derivative financial instruments (used to risk manage the near-term portions of the LNG contracts) are fair valued under IFRS. The fair value accounting effect reduces timing differences between recognition of the derivative financial instruments used to risk manage the LNG contracts and the recognition of the LNG contracts themselves, which therefore gives a better representation of performance in each period. Comparative information has In addition, from 2020 fair value accounting effects include changes in the fair value of derivatives entered into by the group to manage currency exposure and interest rate risks relating to hybrid bonds to their respective first call periods. The hybrid bonds which were issued on 17 June 2020 are classified as equity instruments and were recorded in the balance sheet at that date at their USD equivalent issued value. Under IFRS these equity instruments are not been restated onremeasured from period to period, and do not qualify for application of hedge accounting. The derivative instruments relating to the basishybrid bonds, however, are required to be recorded at fair value with mark to market gains and losses recognized in the income statement. Therefore, measurement differences in relation to the recognition of gains and losses occur. The fair value accounting effect, which is reported in the Other businesses and corporate segment, eliminates the fair value gains and losses of these derivative financial instruments that are recognized in the income statement. We believe that this gives a better representation of performance, by more appropriately reflecting the economic effect was not material.of these risk management activities, in each period. Finance debt ratio Finance debt ratio is defined as the ratio of finance debt to the total of finance debt plus total equity. Free cash flow Operating cash flow less net cash used in investing activities and lease liability payments included in financing activities, as presented in the group cash flow statement. Gearing and net debt Non-GAAP measures. Net debt is calculated as finance debt, as shown in the balance sheet, plus the fair value of associated derivative financial instruments that are used to hedge foreign currency exchange and interest rate risks relating to finance debt, for which hedge accounting is applied, less cash and cash equivalents. Gearing is defined as the ratio of net debt to the total of net debt plus total equity. BPbp believes these measures provide useful information to investors. Net debt enables investors to see the economic effect of finance debt, related hedges and cash and cash equivalents in total. Gearing enables investors to see how significant net debt is relative to total equity. The derivatives are reported on the balance sheet within the headings ‘Derivative financial instruments’. See Financial statements – Note 27 for information on finance debt, which is the nearest equivalent measure to net debt on an IFRS basis. The nearest equivalent GAAP measure to gearing on an IFRS basis is finance debt ratio. We are unable to present reconciliations of forward-looking information for gearing to finance debt ratio, because without unreasonable efforts, we are unable to forecast accurately certain adjusting items required to present a meaningful comparable GAAP forward-looking financial measure. These items include fair value asset (liability) of hedges related to finance debt and cash and cash equivalents, that are difficult to predict in advance in order to include in a GAAP estimate. | | | | | | | | | | | | | | | | 344 | | bp Annual Report and Form 20-F 2020 | | |
Gearing including leases and net debt including leases Non-GAAP measure. Net debt including leases is calculated as net debt plus lease liabilities, less the net amount of partner receivables and payables relating to leases entered into on behalf of joint operations. Gearing including leases is defined as the ratio of net debt including leases to the total of net debt including leases plus total equity. bp believes these measures provide useful information to investors as they enable investors to understand the impact of the group’s lease portfolio on net debt and gearing. See Financial statements – Note 27 for information on finance debt, which is the nearest equivalent measure to net debt including leases on an IFRS basis. The nearest equivalent GAAP measure to gearing including leases on an IFRS basis is finance debt ratio. Henry Hub A distribution hub on the natural gas pipeline system in Erath, Louisiana, that lends its name to the pricing point for natural gas futures contracts traded on the New York Mercantile Exchange and the over-the-counter swaps traded on Intercontinental Exchange. Hydrocarbons Liquids and natural gas. Natural gas is converted to oil equivalent at 5.8 billion cubic feet = 1 million barrels. Inorganic capital expenditure A subset of capital expenditure on a cash basis and is a non-GAAP measure. Inorganic capital expenditure comprises consideration in business combinations and certain other significant investments made by the group. It is reported on a cash basis. BPbp believes that this measure provides useful information as it allows investors to understand how BP’sbp’s management invests funds in projects which expand the group’s activities through acquisition. Further information and a reconciliation to GAAP information is provided on page 299.303. Inventory holding gains and losses The difference between the cost of sales calculated using the replacement cost of inventory and the cost of sales calculated on the first-in first-out (FIFO) method after adjusting for any changes in provisions where the net realizable value of the inventory is lower than its cost. Under the FIFO method, which we use for IFRS reporting, the cost of inventory charged to the income statement is based on its historical cost of purchase or manufacture, rather than its replacement cost. In volatile energy markets, this can have a significant distorting effect on reported income. The amounts disclosed represent the difference between the charge to the income statement for inventory on a FIFO basis (after adjusting for any related movements in net realizable value provisions) and the charge that would have arisen based on the replacement cost of inventory. For this purpose, the replacement cost of inventory is calculated using data from each operation’s production and manufacturing system, either on a monthly basis, or separately for each transaction where the system allows this approach. The amounts disclosed are not separately reflected in the financial statements as a gain or loss. No adjustment is made in respect of the cost of inventories held as part of a trading position and certain other temporary inventory positions. See Replacement cost (RC) profit or loss definition below. Joint arrangement An arrangement in which two or more parties have joint control. Joint control Contractually agreed sharing of control over an arrangement, which exists only when decisions about the relevant activities require the unanimous consent of the parties sharing control. Joint operation A joint arrangement whereby the parties that have joint control of the arrangement have rights to the assets, and obligations for the liabilities, relating to the arrangement. Joint venture A joint arrangement whereby the parties that have joint control of the arrangement have rights to the net assets of the arrangement. Liquids Comprises crude oil, condensate and natural gas liquids. For the Upstream segment, it also includes bitumen. LNG portfolio LNG portfolio refers to bp group’s LNG equity production plus additional long-term merchant LNG volumes. LNG train An LNG train is a processing facility used to liquefy and purify natural gas in the formation of LNG. Low carbon energy / low carbon technologies Low carbon (renewable) electricity; bio-energy; electrification; future mobility solutions; carbon capture, use and storage (CCUS); “blue” or “green” hydrogen; and trading in low carbon products. Note that, while there is some overlap, these terms do not mean the same as bp’s strategic focus area of “low carbon electricity and energy”. Low carbon investment / investment in low carbon energy / investment in low carbon Capital expenditure on low carbon energy or technologies. Low carbon and other energy transition activities Low carbon energy / technologies as described above, together with convenience; integrated gas and power; bp Ventures and Launchpad. Major projects Have a BPbp net investment of at least $250 million, or are considered to be of strategic importance to BPbp or of a high degree of complexity. Net debt including leasesMargin share for convenience and electrification
Non-GAAP measure. Net debt including leases is calculated as net debt plus lease liabilities, less the net amount of partner receivablesSee Convenience, retail fuels and payables relating to leases entered into on behalf of joint operations. BP believes this measure provides useful information to investors as it enables investors to understand the impact of the group’s lease portfolio on net debt. See Financial statements – Note 27 for information on finance debt, which is the nearest equivalent measure to net debt on an IFRS basis. Net generating capacity
The sum of the rated capacities of the assets/turbines that have entered into commercial operation, including BP’s share of equity-accounted entities. Theelectrification gross data is the equivalent capacity on a gross-joint venture basis, which includes 100% of the capacity of equity-accounted entities where BP has partial ownership.margin definition.
| | | | | 340 | | BP Annual Report and Form 20-F 2019
| |
Non-operating items Charges and credits are included in the financial statements that BPbp discloses separately because it considers such disclosures to be meaningful and relevant to investors. They are items that management considers not to be part of underlying business operations and are disclosed in order to enable investors better to understand and evaluate the group’s reported financial performance. Non-operating items within equity-accounted earnings are reported net of incremental income tax reported by the equity-accounted entity. An analysis of non-operating items by segment and type is shown on page 300.304. Operating cash flow Net cash provided by (used in) operating activities as stated in the group cash flow statement. When used in the context of a segment rather than the group, the terms refer to the segment’s share thereof. Operating cash flow excluding Gulf of Mexico oil spill payments Non-GAAP measure. It is calculated by excluding post-tax operating cash flows relating to the Gulf of Mexico oil spill from net cash provided by operating activities as reported in the group cash flow statement. BPbp believes net cash provided by operating activities excluding amounts related to the Gulf of Mexico oil spill is a useful measure as it allows for more meaningful comparisons between reporting periods. The nearest equivalent measure on an IFRS basis is net cash provided by operating activities. Organic free cash flow is operating cash flow excluding Gulf of Mexico oil spill payments less organic capital expenditure.
Operating cash margin
Operating cash margin is operating cash flow divided by the applicable number of barrels of oil equivalent produced, at $52/bbl flat oil prices. Expected operating cash margins are calculated over the period 2016-2025.
Operating management system (OMS) BP’sbp’s OMS helps us manage risks in our operating activities by setting out BP’sbp’s principles for good operating practice. It brings together BPbp requirements on health, safety, security, the environment, social responsibility and operational reliability, as well as related issues, such as maintenance, contractor relations and organizational learning, into a common management system.
Organic capital expenditure A subset of capital expenditure on a cash basis and is a non-GAAP measure. Organic capital expenditure comprises capital expenditure less inorganic capital expenditure. BPbp believes that this measure provides useful information as it allows investors to understand how BP’sbp’s management invests funds in developing and maintaining the group’s assets. An analysis of organic capital expenditure by segment and region, and a reconciliation to GAAP information is provided on page 299.303. We are unable to present reconciliations of forward-looking information for organic capital expenditure to total cash capital expenditure, because without unreasonable efforts, we are unable to forecast accurately the | | | | | | | | | | | | | | | | | bp Annual Report and Form 20-F 2020 | | 345 |
adjusting item, inorganic capital expenditure, that is difficult to predict in advance in order to derive the nearest GAAP estimate. Organic sources of cash and organic uses of cash
Non-GAAP measure. Organic sources of cash is the sum of operating cash flow, excluding Gulf of Mexico oil spill payments, and proceeds of loan repayments. Organic uses of cash is the sum of organic capital expenditure, dividends and share buybacks. The nearest equivalent measure on an IFRS basis for organic sources of cash is net cash provided by operating activities and the nearest equivalent measures on an IFRS basis for organic uses of cash are total cash capital expenditure, dividends paid to BP shareholders and net issue (repurchase) of shares.
Production-sharing agreement / contract (PSA / PSC) An arrangement through which an oil and gas company bears the risks and costs of exploration, development and production. In return, if exploration is successful, the oil company receives entitlement to variable physical volumes of hydrocarbons, representing recovery of the costs incurred and a stipulated share of the production remaining after such cost recovery. Readily marketable inventory (RMI) RMI is inventory held and price risk-managed by our integrated supply and trading function (IST) which could be sold to generate funds if required. It comprises oil and oil products for which liquid markets are available and excludes inventory which is required to meet operational requirements and other inventory which is not price risk-managed. RMI is reported at fair value. Inventory held by the Downstream fuels business for the purpose of sales and marketing, and all inventories relating to the lubricants and petrochemicals businesses, are not included in RMI. BPbp believes that disclosing the amounts of RMI and paid-up RMI is useful to investors as it enables them to better understand and evaluate the group’s inventories and liquidity position by enabling them to see the level of discretionary inventory held by IST and to see builds or releases of liquid trading inventory. Paid-up RMI excludes RMI which has not yet been paid for. For inventory that is held in storage, a first-in first-out (FIFO) approach is used to determine whether inventory has been paid for or not. Unpaid RMI is RMI which has not yet been paid for by BP.bp. RMI at fair value, Paid-up RMI and Unpaid RMI are non-GAAP measures. A reconciliation of total inventory as reported on the group balance sheet to paid-up RMI is provided on page 346.349. Realizations Realizations are the result of dividing revenue generated from hydrocarbon sales, excluding revenue generated from purchases made for resale and royalty volumes, by revenue generating hydrocarbon production volumes. Revenue generating hydrocarbon production reflects the BPbp share of production as adjusted for any production which does not generate revenue. Adjustments may include losses due to shrinkage, amounts consumed during processing, and contractual or regulatory host committed volumes such as royalties. For the Upstream segment, realizations include transfers between businesses. Refining availability Represents Solomon Associates’ operational availability for BP-operatedbp-operated refineries, which is defined as the percentage of the year that a unit is available for processing after subtracting the annualized time lost due to turnaround activity and all planned mechanical, process and regulatory downtime. Refining marker margin (RMM) The average of regional indicator margins weighted for BP’sbp’s crude refining capacity in each region. Each regional marker margin is based on product yields and a marker crude oil deemed appropriate for the region. The regional indicator margins may not be representative of the margins achieved by BPbp in any period because of BP’sbp’s particular refinery configurations and crude and product slate. Refining net cash margin per barrel
Refining net cash margin is defined by Solomon Associates as the net margin achieved after subtracting cash operating expenses and adding any refinery revenue from other sources. Net cash margin is expressed in US dollars per barrel of net refinery input.
Refinery utilization
Refinery utilization is calculated as annual throughput (thousands of barrels per day) divided by crude distillation capacity.
Replacement cost (RC) profit or loss Reflects the replacement cost of inventories sold in the period and is arrived at by excluding inventory holding gains and losses from profit or loss. RC profit or loss is the measure of profit or loss that is required to be disclosed for each operating segment under IFRS. RC profit or loss for the group is a non-GAAP measure. Management believes this measure is useful to illustrate to investors the fact that crude oil and product prices can vary significantly from period to period and that the impact on our reported result under IFRS can be significant. Inventory holding gains and losses vary from period to period due to changes in prices as well as changes in underlying inventory levels. In order for investors to understand the operating performance of the group excluding the impact of price changes on the replacement of inventories, and to make comparisons of operating performance between reporting periods, BP’sbp’s management
| | | | | | BP Annual Report and Form 20-F 2019
| | 341 |
believes it is helpful to disclose this measure. The nearest equivalent measure on an IFRS basis is profit or loss attributable to BP bp shareholders. See Financial statements – Note 5. A reconciliation to GAAP information is provided on page 298.302. RC profit or loss per share Non-GAAP measure. Earnings per share is defined in Financial statements – Note 11. RC profit or loss per share is calculated using the same denominator. The numerator used is RC profit or loss attributable to BPbp shareholders rather than profit or loss attributable to BPbp shareholders. BPbp believes it is helpful to disclose the RC profit or loss per share because this measure excludes the impact of price changes on the replacement of inventories and allows for more meaningful comparisons between reporting periods. The nearest equivalent measure on an IFRS basis is basic earnings per share based on profit or loss for the period attributable to BPbp shareholders. A reconciliation to GAAP information is provided on page 344.348. Renewables pipeline Renewable projects satisfying criteria below to the point they can be considered developed to FID : Site based projects have obtained land exclusivity rights, or for PPA based projects an offer has been made to the counterparty, or for auction projects pre-qualification criteria has been met, or for acquisition projects post a binding offer being accepted. Reserves replacement ratio The extent to which the year’s production has been replaced by proved reserves added to our reserve base. The ratio is expressed in oil-equivalent terms and includes changes resulting from discoveries, improved recovery and extensions and revisions to previous estimates, but excludes changes resulting from acquisitions and disposals. Retail sites Retail sites include sites operated by dealers, jobbers, franchisees or brand licensees or joint venture (JV) partners, under the bp brand. These may move to and from the bp brand as their fuel supply agreement or brand licence agreement expires and are renegotiated in the normal course of business. Retail sites are primarily branded bp, ARCO, Amoco, Aral and Thorntons, and also includes sites in India through our Jio-bp JV. Retail sites in growth markets These are retail sites that are either bp branded or co-branded with our partners in China, Mexico and Indonesia and also include sites in India through our Jio-bp JV. Return on average capital employed Non-GAAP measure. Return on average capital employed (ROACE) is underlying replacement cost profit, after adding back non-controlling interest and interest expense net of tax (for 2015, 2016 and 2017 interest expense was net of notional tax at an assumed 35%), divided by average capital employed (total equity plus finance debt), excluding cash and cash equivalents and goodwill. Interest expense is finance costs excluding lease interest and the unwinding of the discount on provisions and other payables before tax. BPbp believes it is helpful to disclose the ROACE because this measure gives an indication of the company's capital efficiency. The nearest GAAP measures of the numerator and denominator are profit or loss for the period attributable to BPbp shareholders and average capital employedtotal equity respectively. The reconciliation of the numerator and denominator is provided on page 345.349. We are unable to present forward-looking information of the nearest GAAP measures of the numerator and denominator for ROACE, because without unreasonable efforts, we are unable to forecast accurately certain adjusting items required to calculate a meaningful comparable GAAP forward-looking financial measure. These items include inventory holding gains or losses and interest net of tax, that are difficult to predict in advance in order to include in a GAAP estimate. Strategic convenience sites Strategic convenience sites are retail sites, within the bp portfolio, which both sell bp branded fuel and carry one of the strategic convenience brands (e.g. M&S, Rewe to Go). To be considered a strategic convenience brand the convenience offer should be a strategic differentiator in the market in which it operates. Strategic convenience site count includes sites under a pilot phase. | | | | | | | | | | | | | | | | 346 | | bp Annual Report and Form 20-F 2020 | | |
Subsidiary An entity that is controlled by the BPbp group. Control of an investee exists when an investor is exposed, or has rights, to variable returns from its involvement with the investee and has the ability to affect those returns through its power over the investee. Surplus cash Surplus cash refers to surplus of sources of cash including operating cash flow, joint venture loan repayments and divestment proceeds, over uses, including leases, Gulf of Mexico oil spill payments, hybrid servicing costs, dividend payments and cash capital expenditure. Tier 1 and tier 2 process safety events Tier 1 events are losses of primary containment from a process of greatest consequence – causing harm to a member of the workforce, damage to equipment from a fire or explosion, a community impact or exceeding defined quantities. Tier 2 events are those of lesser consequence. These represent reported incidents occurring within BP’sbp’s operational HSSE reporting boundary. That boundary includes BP’sbp’s own operated facilities and certain other locations or situations. Tight oil and gas Natural oil and gas reservoirs locked in hard sandstone rocks with low permeability, making the underground formation extremely tight. Traded electricity Traded electricity refers to sales data for physically delivered electricity. Transition and low carbon investments Capital expenditure on low carbon or other energy transition activities. UK National Balancing Point A virtual trading location for sale, purchase and exchange of UK natural gas. It is the pricing and delivery point for the Intercontinental Exchange natural gas futures contract. Unconventionals Resources found in geographic accumulations over a large area, that usually present additional challenges to development such as low permeability or high viscosity. Examples include shale gas and oil, coalbed methane, gas hydrates and natural bitumen deposits. These typically require specialized extraction technology such as hydraulic fracturing or steam injection. Underlying effective tax rate (ETR) Non-GAAP measure. The underlying ETR is calculated by dividing taxation on an underlying replacement cost (RC) basis by underlying RC profit or loss before tax. Taxation on an underlying RC basis is taxation on a RC basis for the period adjusted for taxation on non-operating items and fair value accounting effects.effects, and certain foreign exchange impacts on the group’s tax charge for the period. Information on underlying RC profit or loss is provided below. BPbp believes it is helpful to disclose the underlying ETR because this measure may help investors to understand and evaluate, in the same manner as management, the underlying trends in BP’sbp’s operational performance on a comparable basis, period on period. The nearest equivalent measure on an IFRS basis is the ETR on profit or loss for the period. A reconciliation to GAAP information is provided on page 344.348. We are unable to present reconciliations of forward-looking information for underlying ETR to ETR on profit or loss for the period, because without unreasonable efforts, we are unable to forecast accurately certain adjusting items required to present a meaningful comparable GAAP forward-looking financial measure. These items include the taxation on inventory holding gains and losses, non-operating items and fair value accounting effects, that are difficult to predict in advance in order to include in a GAAP estimate. Underlying production Production after adjusting for acquisitions and divestments and entitlement impacts in our production-sharing agreements (PSAs). 20192021 underlying production, when compared with 2018,2020, is production after adjusting for BPX Energy, other acquisitions and divestments, curtailments, and entitlement impacts in our PSAs.production-sharing agreements/contracts and technical service contract. Underlying RCreplacement cost (RC) profit or loss Non-GAAP measure. RC profit or loss after adjusting for non-operating items and fair value accounting effects. Fair value accounting effects are non-GAAP adjustments. See page 300pages 304 and 344305 for additional information on the non-operating items and fair value accounting effects that are used to arrive at underlying RC profit or loss in order to enable a full understanding of the events and their financial impact. BPbp believes that underlying RC profit or loss is a useful measure for investors because it is a measure closely tracked by management to evaluate BP’sbp’s operating performance and to make financial, strategic and operating decisions and because it may help investors to understand and evaluate, in the same manner as management, the underlying trends in BP’sbp’s operational performance on a comparable basis, year on year, by adjusting for the effects of these non-operating items and fair value accounting effects. The nearest equivalent measure on an IFRS basis for the group is profit or loss for the year attributable to BPbp shareholders. The nearest equivalent measure on an IFRS basis for segments is RC profit or loss before interest and taxation. Underlying profit in the chief executive officer’s letter on page 4 refers to full year underlying RC profit for the group. A reconciliation to GAAP information is provided on page 298.302. Underlying replacement cost (RC) profit or loss per share Non-GAAP measure. Earnings per share is defined Financial statements – Note 11. Underlying RC profit or loss per share is calculated using the same denominator. The numerator used is underlying RC profit or loss attributable to BPbp shareholders rather than profit or loss attributable to BPbp shareholders. BPbp believes it is helpful to disclose the underlying RC profit or loss per share because this measure may help investors to understand and evaluate, in the same manner as management, the underlying trends in BP’sbp’s operational performance on a comparable basis, period on period. The nearest equivalent measure on an IFRS basis is basic earnings per share based on profit or loss for the period attributable to BPbp shareholders. A reconciliation to GAAP information is provided on page 344.348.
| | | | | 342 | | BP Annual Report and Form 20-F 2019
| |
Upstream plant reliability BP-operatedbp-operated Upstream plant reliability is calculated taking 100% less the ratio of total unplanned plant deferrals divided by installed production capacity. Unplanned plant deferrals are associated with the topside plant and where applicable the subsea equipment (excluding wells and reservoir). Unplanned plant deferrals include breakdowns, which does not include Gulf of Mexico weather related downtime.
Upstream unit production costcosts Upstream unit production cost iscosts are calculated as production costcosts divided by units of production. Production cost doescosts do not include ad valorem and severance taxes. Units of production are barrels for liquids and thousands of cubic feet for gas. Amounts disclosed are for BPbp subsidiaries only and do not include BP’sbp’s share of equity-accounted entities. Wellwork
Activities undertaken on previously completed wells with the primary objective to restore or increase production.
West Texas Intermediate (WTI) A light sweet crude oil, priced at Cushing, Oklahoma, which serves as a benchmark price for purchases of oil in the US. Working capital Movements in inventories and other current and non-current assets and liabilities as stated in the group cash flow statement. Trade marks Trade marks of the BPbp group appear throughout this report. They include: Aral, ARCO, BP, BP Infinia, BPme, BPme Rewards,bp pulse, Castrol, Amoco, Thorntons Trade marks: ButamaxAmazon Web Services – a registered trade marktrademark of Butamax Advance Biofuels LLC.
Fulcrum BioEnergy – registered trade marks of Fulcrum BioEnergy, Inc.
M&S Simply Food – a registered trade mark of Marks & Spencer plc.amazon.com, inc
REWE to Go – a registered trade mark of REWE.
| | | | | | | | | | | | | | | | BP
| bp Annual Report and Form 20-F 20192020 | | 343347 |
Non-GAAP measures reconciliations Non-GAAP information on fair value accounting effects
The impacts of fair value accounting effects, relative to management’s internal measure of performance, and a reconciliation to GAAP information is set out below. Further information on fair value accounting effects is provided on page 339.
| | | | | | | | | | | | | | $ million |
| | | | 2019 |
| 2018 |
| 2017 |
| | Upstream | | | | | Unrecognized (gains) losses brought forward from previous perioda | | (455 | ) | (419 | ) | (393 | ) | | Favourable (adverse) impact relative to management’s measure of performance | | 706 |
| (39 | ) | 27 |
| | Exchange translation gains (losses) on fair value accounting effects | | 2 |
| 3 |
| 2 |
| | Unrecognized (gains) losses carried forward | | 253 |
| (455 | ) | (364 | ) | Downstreamb | |
|
| | Unrecognized (gains) losses brought forward from previous perioda | | (56 | ) | (151 | ) | (71 | ) | | Favourable (adverse) impact relative to management’s measure of performance | | 160 |
| 95 |
| (135 | ) | | Unrecognized (gains) losses carried forward | | 104 |
| (56 | ) | (206 | ) | | | | | | | | Favourable (adverse) impact relative to management’s measure of performance – by region | | | | | | Upstream | | | | | | US | | (179 | ) | (35 | ) | 192 |
| | Non-US | | 885 |
| (4 | ) | (165 | ) | | | | 706 |
| (39 | ) | 27 |
| Downstreamb | |
|
| | | US | | 148 |
| (155 | ) | (29 | ) | | Non-US | | 12 |
| 250 |
| (106 | ) | | | | 160 |
| 95 |
| (135 | ) | | | | 866 |
| 56 |
| (108 | ) | | Taxation credit (charge) | | (155 | ) | 12 |
| 12 |
| | | | 711 |
| 68 |
| (96 | ) |
| | a
| 2018 brought forward fair value accounting effect balances include a $55-million adjustment between Upstream and Downstream as part of the transfer of the NGL business between segments. |
| | b
| Fair value accounting effects arise solely in the fuels business. |
Reconciliation of basic earnings per ordinary share to RC profit (loss) per share and to underlying RC profit per share | | | | | | | | | | | | | | | | | | | | | | | Per ordinary share – cents | | | 2020 | 2019 | 2018 | 2017 | 2016 | Profit (loss) for the yeara | | (100.42) | | 19.84 | | 46.98 | | 17.20 | | 0.61 | | | Inventory holding (gains) losses, before tax | | 14.18 | | (3.29) | | 4.01 | | (4.32) | | (8.52) | | | Taxation charge (credit) on inventory holding gains and losses | | (3.29) | | 0.77 | | (0.99) | | 1.14 | | 2.58 | | | RC profit (loss) for the year | | (89.53) | | 17.32 | | 50.00 | | 14.02 | | (5.33) | | | Net (favourable) adverse impact of non-operating items and fair value accounting effects, before tax | | 82.33 | | 40.73 | | 16.93 | | 18.94 | | 35.99 | | | Taxation charge (credit) on non-operating items and fair value accounting effects | | (20.94) | | (8.81) | | (3.23) | | (1.65) | | (16.87) | | | Underlying RC profit for the year | | (28.14) | | 49.24 | | 63.70 | | 31.31 | | 13.79 | |
| | | | | | | | | | | | | | | | Per ordinary share – cents | | | | | 2019 |
| 2018 |
| 2017 |
| 2016 |
| 2015 |
| Profit (loss) for the yeara | | 19.84 |
| 46.98 |
| 17.20 |
| 0.61 |
| (35.39 | ) | | Inventory holding (gains) losses, before tax | | (3.29 | ) | 4.01 |
| (4.32 | ) | (8.52 | ) | 10.31 |
| | Taxation charge (credit) on inventory holding gains and losses | | 0.77 |
| (0.99 | ) | 1.14 |
| 2.58 |
| (3.10 | ) | | RC profit (loss) for the year | | 17.32 |
| 50.00 |
| 14.02 |
| (5.33 | ) | (28.18 | ) | | Net (favourable) adverse impact of non-operating items and fair value accounting effects, before tax | | 40.73 |
| 16.93 |
| 18.94 |
| 35.99 |
| 82.23 |
| | Taxation charge (credit) on non-operating items and fair value accounting effects | | (8.81 | ) | (3.23 | ) | (1.65 | ) | (16.87 | ) | (21.83 | ) | | Underlying RC profit for the year | | 49.24 |
| 63.70 |
| 31.31 |
| 13.79 |
| 32.22 |
|
| | a
| Profit attributable to BP shareholders. |
a Profit attributable to bp shareholders.
| | | | | | 344 | | «See Glossary
| BP Annual Report and Form 20-F 2019
| |
Reconciliation of effective tax rate (ETR) to ETR on RC profit or loss and adjusted ETR Taxation (charge) credit | | | | | $ million | | | | $ million | | | | 2019 |
| 2018 |
| 2017 |
| 2016 |
| 2015 |
| | | 2020 | 2019 | 2018 | 2017 | 2016 | | Taxation on profit or loss for the year | | (3,964 | ) | (7,145 | ) | (3,712 | ) | 2,467 |
| 3,171 |
| Taxation on profit or loss for the year | | 4,159 | | (3,964) | | (7,145) | | (3,712) | | 2,467 | | | Adjusted for taxation on inventory holding gains and losses | | (156 | ) | 198 |
| (225 | ) | (483 | ) | 569 |
| Adjusted for taxation on inventory holding gains and losses | | 667 | | (156) | | 198 | | (225) | | (483) | | | Taxation on a RC profit or loss basis | | (3,808 | ) | (7,343 | ) | (3,487 | ) | 2,950 |
| 2,602 |
| Taxation on a RC profit or loss basis | | 3,492 | | (3,808) | | (7,343) | | (3,487) | | 2,950 | | | Adjusted for taxation on non-operating items and fair value accounting effects | | 1,788 |
| 522 |
| 1,184 |
| 3,162 |
| 4,000 |
| | | Adjusted for taxation on non-operating items and fair value accounting effects, and certain foreign exchange impacts on the group’s tax charge for the period | | Adjusted for taxation on non-operating items and fair value accounting effects, and certain foreign exchange impacts on the group’s tax charge for the period | | 4,235 | | 1,788 | | 522 | | 1,184 | | 3,162 | | | Adjusted for the impact of US tax reform | | — |
| 121 |
| (859 | ) | — |
| — |
| Adjusted for the impact of US tax reform | | — | | — | | 121 | | (859) | | — | | | Taxation on an underlying RC basis | | Taxation on an underlying RC basis | | (743) | | (5,596) | | (7,986) | | (3,812) | | (212) | | | Adjusted for the impact of the reduction in the rate of the UK North Sea supplementary charge | | — |
| — |
| — |
| 434 |
| 915 |
| Adjusted for the impact of the reduction in the rate of the UK North Sea supplementary charge | | — | | — | | — | | — | | 434 | | | Adjusted taxation | | (5,596 | ) | (7,986 | ) | (3,812 | ) | (646 | ) | (2,313 | ) | Adjusted taxation | | (743) | | (5,596) | | (7,986) | | (3,812) | | (646) | |
Effective tax rate | | | | | | | | | | | | | | | | | | | | | | | % | | | 2020 | 2019 | 2018 | 2017 | 2016 | | ETR on profit or loss for the year | | 17 | | 49 | | 43 | | 52 | | 107 | | | Adjusted for inventory holding gains and losses | | (1) | | 2 | | (1) | | 3 | | (31) | | | ETR on RC profit or loss | | 16 | | 51 | | 42 | | 55 | | 76 | | | Adjusted for non-operating items and fair value accounting effects, and certain foreign exchange impacts on the group’s tax charge for the period | | (30) | | (15) | | (5) | | (9) | | (69) | | | Adjusted for the impact of US tax reform | | — | | — | | 1 | | (8) | | — | | | Underlying ETR | | (14) | | 36 | | 38 | | 38 | | 7 | | | Adjusted for the impact of the reduction in the rate of the UK North Sea supplementary charge | | — | | — | | — | | — | | 16 | | | Adjusted ETR | | (14) | | 36 | | 38 | | 38 | | 23 | |
| | | | | | | | | | | | | | | | % | | | | | 2019 |
| 2018 |
| 2017 |
| 2016 |
| 2015 |
| | ETR on profit or loss for the year | | 49 |
| 43 |
| 52 |
| 107 |
| 33 |
| | Adjusted for inventory holding gains and losses | | 2 |
| (1 | ) | 3 |
| (31 | ) | 1 |
| | ETR on RC profit or loss | | 51 |
| 42 |
| 55 |
| 76 |
| 34 |
| | Adjusted for non-operating items and fair value accounting effects | | (15 | ) | (5 | ) | (9 | ) | (69 | ) | (15 | ) | | Adjusted for the impact of US tax reform | | — |
| 1 |
| (8 | ) | — |
| — |
| | Adjusted for the impact of the reduction in the rate of the UK North Sea supplementary charge | | — |
| — |
| — |
| 16 |
| 12 |
| | Adjusted ETR | | 36 |
| 38 |
| 38 |
| 23 |
| 31 |
|
| | | | | | | | | | | | | | | | 348 | | bp Annual Report and Form 20-F 2020 | | « See Glossary |
Return on average capital employed (ROACE) | | | | | | | | | | | | | | | | | | | | | | | | $ million | | | 2020 | 2019 | 2018 | 2017 | 2016 | | Profit (loss) for the year attributable to bp shareholders | | (20,305) | | 4,026 | | 9,383 | | 3,389 | | 115 | | | Inventory holding (gains) losses, net of tax | | 2,201 | | (511) | | 603 | | (628) | | (1,114) | | | Non-operating items and fair value accounting effects, net of tax | | 12,414 | | 6,475 | | 2,737 | | 3,405 | | 3,584 | | | Underlying RC profit | | (5,690) | | 9,990 | | 12,723 | | 6,166 | | 2,585 | | Interest expense, net of taxa | | 1,402 | | 1,744 | | 1,583 | | 924 | | 635 | | | Non-controlling interests (NCI) | | (424) | | 164 | | 195 | | 79 | | 57 | | | Underlying RC profit attributable to bp shareholders and NCI, excluding interest expense net of tax | | (4,712) | | 11,898 | | 14,501 | | 7,169 | | 3,277 | | | Total equity | | 85,568 | | 100,708 | | 101,548 | | 100,404 | | 96,843 | | | Finance debt | | 72,664 | | 67,724 | | 65,132 | | 62,574 | | 57,665 | | | Capital employed (2020 average $163,332 million) | | 158,232 | | 168,432 | | 166,680 | | 162,978 | | 154,508 | | | Less: Goodwill | | 12,480 | | 11,868 | | 12,204 | | 11,551 | | 11,194 | | | Cash and cash equivalents | | 31,111 | | 22,472 | | 22,468 | | 25,586 | | 23,484 | | | | 114,641 | | 134,092 | | 132,008 | | 125,841 | | 119,830 | | | Average capital employed excluding goodwill and cash and cash equivalents | | 124,367 | | 133,050 | | 128,925 | | 122,836 | | 116,333 | | | ROACE | | (3.8) | % | 8.9 | % | 11.2 | % | 5.8 | % | 2.8 | % |
| | | | | | | | | | | | | | | | | $ million |
| | | | 2019 |
| 2018 |
| 2017 |
| 2016 |
| 2015 |
| | Profit (loss) for the year attributable to BP shareholders | | 4,026 |
| 9,383 |
| 3,389 |
| 115 |
| (6,482 | ) | | Inventory holding (gains) losses, net of tax | | (511 | ) | 603 |
| (628 | ) | (1,114 | ) | 1,320 |
| | Non-operating items and fair value accounting effects, net of tax | | 6,475 |
| 2,737 |
| 3,405 |
| 3,584 |
| 11,067 |
| | Underlying RC profit | | 9,990 |
| 12,723 |
| 6,166 |
| 2,585 |
| 5,905 |
| Interest expense, net of taxa | | 1,744 |
| 1,583 |
| 924 |
| 635 |
| 576 |
| | Non-controlling interests | | 164 |
| 195 |
| 79 |
| 57 |
| 82 |
| | Adjusted underlying RC profit | | 11,898 |
| 14,501 |
| 7,169 |
| 3,277 |
| 6,563 |
| | Total equity | | 100,708 |
| 101,548 |
| 100,404 |
| 96,843 |
| 98,387 |
| | Finance debt | | 67,724 |
| 65,132 |
| 62,574 |
| 57,665 |
| 52,465 |
| | Capital employed (2019 average $167,556 million) | | 168,432 |
| 166,680 |
| 162,978 |
| 154,508 |
| 150,852 |
| | Less: Goodwill | | 11,868 |
| 12,204 |
| 11,551 |
| 11,194 |
| 11,627 |
| | Cash and cash equivalents | | 22,472 |
| 22,468 |
| 25,586 |
| 23,484 |
| 26,389 |
| | | | 134,092 |
| 132,008 |
| 125,841 |
| 119,830 |
| 112,836 |
| | Average capital employed excluding goodwill and cash and cash equivalents | | 133,050 |
| 128,925 |
| 123,481 |
| 117,002 |
| 118,702 |
| | ROACE | | 8.9 | % | 11.2 | % | 5.8 | % | 2.8 | % | 5.5 | % |
| | a
| Calculated on a post-tax basis (for 2017 and earlier interest expense was net of notional tax at an assumed 35%). |
a Calculated on a post-tax basis (for 2017 and earlier interest expense was net of notional tax at an assumed 35%).
| | | | | | | BP Annual Report and Form 20-F 2019
| «See Glossary
| | 345 |
Readily marketable inventory (RMI) Readily marketable inventory (RMI) is oil and oil products inventory held and price risk-managed by BP`sbp's integrated supply and trading function (IST) which could be sold to generate funds if required. Details of RMI balances and a reconciliation to GAAP information is set out below. Further information on RMI, RMI at fair value, paid-up RMI and unpaid RMI is provided on page 341.345. | | | At 31 December | | | $ million |
| At 31 December | | | $ million | | | | 2019 |
| 2018 |
| | | 2020 | 2019 | | RMI at fair value | | 6,837 |
| 4,202 |
| RMI at fair value | | 6,528 | | 6,837 | | | Paid-up RMI | | 3,217 |
| 1,641 |
| Paid-up RMI | | 3,365 | | 3,217 | |
Reconciliation of non-GAAP information | | | | | | | | | | | | | At 31 December | | | $ million | | | 2020 | 2019 | | Reconciliation of total inventory to paid-up RMI | | | | | Inventories as reported on the group balance sheet | | 16,873 | | 20,880 | | | Less: (a) inventories which are not oil and oil products and (b) oil and oil product inventories which are not risk-managed by IST | | (10,810) | | (14,280) | | RMI on IFRS basis | | 6,063 | | 6,600 | | | Plus: difference between RMI at fair value and RMI on an IFRS basis | | 465 | | 237 | | RMI at fair value | | 6,528 | | 6,837 | | | Less: unpaid RMI at fair value | | (3,163) | | (3,620) | | | Paid-up RMI | | 3,365 | | 3,217 | |
| | | | | | | | At 31 December | | | $ million |
| | | | 2019 |
| 2018 |
| | Reconciliation of total inventory to paid-up RMI | | | | | Inventories as reported on the group balance sheet | | 20,880 |
| 17,988 |
| | Less: (a) inventories which are not oil and oil products and (b) oil and oil product inventories which are not risk-managed by IST | | (14,280 | ) | (14,066 | ) | | RMI on IFRS basis | | 6,600 |
| 3,922 |
| | Plus: difference between RMI at fair value and RMI on an IFRS basis | | 237 |
| 280 |
| | RMI at fair value | | 6,837 |
| 4,202 |
| | Less: unpaid RMI at fair value | | (3,620 | ) | (2,561 | ) | | Paid-up RMI | | 3,217 |
| 1,641 |
|
The Directors’ report on pages 72-99, 10171-102, 105 (in respect of the remuneration committee report shown in greengrey only), 130, 232-259231-258 and 297-346301-349 was approved by the board and signed on its behalf by Ben J. S. Mathews, company secretary on 1822 March 2020.2021. BP p.l.c. Registered in England and Wales No. 102498
| | | | | | | | | | | | | | | 346 | | «See Glossary | BP
| bp Annual Report and Form 20-F 20192020 | | 349 |
Signatures The registrant hereby certifies that it meets all of the requirements for filing on Form 20-F and that it has duly caused and authorized the undersigned to sign this annual report on its behalf.
BP p.l.c. (Registrant)
/s/ Ben J. S. Mathews Company secretary 1822 March 20202021
| | | | | | | | | | | | | | | | 350 | BP
| bp Annual Report and Form 20-F 20192020 | | 347 |
Cross reference to Form 20-F | | | | | | | | | | | | | | | | | | | | | | | | | | | | | | | | | | Page | | Item 1. | | | | Identity of Directors, Senior Management and Advisors | | n/a | | Item 2. | | | | Offer Statistics and Expected Timetable | | n/a | | Item 3. | | | | Key Information | | | | | A. | | Selected financial data | | 298, 328302, 332 | | | B. | | Capitalization and indebtedness | | n/a | | | C. | | Reasons for the offer and use of proceeds | | n/a | | | D. | | Risk factors | | 70-7167-70 | | Item 4. | | | | Information on the Company | | | | | A. | | History and development of the company | | 23, 36-38, 50-65, 174-176, 181, 187, 189-191, 303-306, 33133, 38, 42-47, 177-180, 184, 190, 192-195, 308-320 | | | B. | | Business overview | | 8-9, 13, 36-38, 50-65, 177-180, 303-306, 314-319, 3258-14, 15-19, 25, 36, 38, 42-47, 108-112, 180-183, 230, 308-311, 318-319, 321-325, 330 | | | C. | | Organizational structure | | 222230 | | | D. | | Property, plants and equipment | | 33, 55, 58, 186, 257-259, 301-313, 32339-41, 45, 189, 190-191, 256-258, 308-321, 326 | | Item 4A. | | | | Unresolved Staff Comments | | None | | Item 5. | | | | Operating and Financial Review and Prospects | | | | | A. | | Operating results | | 36-38, 50-65, 70, 180, 189-191, 200, 202-214, 314-3208-14, 15-19, 25, 38, 42-47, 67-70, 108-109, 111-112, 192-194, 204, 206-219, 308-325 | | | B. | | Liquidity and capital resources | | 156, 187, 200-207, 301-302158-159, 190, 204-225, 304-305 | | | C. | | Research and development, patent and licenses | | 180, 323183, 326 | | | D. | | Trend information | | 36-38, 50-658-19, 25, 38, 42-47, 108-109, 111-112, 308-320 | | | E. | | Off-balance sheet arrangements | | 177-179, 189-191, 301180-183, 192-194, 307 | | | F. | | Tabular disclosure of contractual commitments | | 301307 | | | G. | | Safe harbor | | 324-325329-330 | | Item 6. | | | | Directors, Senior Management and Employees | | | | | A. | | Directors and senior management | | 74-8174-79 | | | B. | | Compensation | | 32-35, 101-127, 194-199, 220-22139-41, 103-128, 197-203, 228-229 | | | C. | | Board practices | | 74-77, 88-95, 100, 11494-99, 105 | | | D. | | Employees | | 47, 22157-58, 229 | | | E. | | Share ownership | | 47, 113, 194-199, 220-22057-58, 103-126, 197-203, 228 | | Item 7. | | | | Major Shareholders and Related Party Transactions | | | | | A. | | Major shareholders | | 330-331334-335 | | | B. | | Related party transactions | | 189, 321192-194, 326 | | | C. | | Interests of experts and counsel | | n/a | | Item 8. | | | | Financial Information | | | | | A. | | Consolidated statements and other financial information | | 146-149, 152, 154-156, 157-259, 319-320, 328130-258, 332 | | | B. | | Significant changes | | n/a | | Item 9. | | | | The Offer and Listing | | | | | A. | | Offer and listing details | | 328332 | | | B. | | Plan of distribution | | n/a | | | C. | | Markets | | 328332 | | | D. | | Selling shareholders | | n/a | | | E. | | Dilution | | n/a | | | F. | | Expenses of the issue | | n/a | | Item 10. | | | | Additional Information | | | | | A. | | Share capital | | n/a | | | B. | | Memorandum and articles of association | | 331-333335-337 | | | C. | | Material contracts | | 321326 | | | D. | | Exchange controls | | 328332 | | | E. | | Taxation | | 328-330332-334 | | | F. | | Dividends and paying agents | | n/a | | | G. | | Statements by experts | | n/a | | | H. | | Documents on display | | 335339 | | | I. | | Subsidiary information | | n/a | | Item 11. | | | | Quantitative and Qualitative Disclosures about Market Risk | | 202-207206-211 | | Item 12. | | | | Description of securities other than equity securities | | | | | A. | | Debt Securities | | n/a | | | B. | | Warrants and Rights | | n/a | | | C. | | Other Securities | | n/a | | | D. | | American Depositary Shares | | 335339 | | Item 13. | | | | Defaults, Dividend Arrearages and Delinquencies | | None | | Item 14. | | | | Material Modifications to the Rights of Security Holders and Use of Proceeds | | None | | Item 15. | | | | Controls and Procedures | | 150, 322154, 326-327 | | Item 16A. | | | | Audit Committee Financial Expert | | 77, 86, 9176, 94-99 | | Item 16B. | | | | Code of Ethics | | 322326 | | Item 16C. | | | | Principal Accountant Fees and Services | | 93, 221, 32296-97, 229, 327 | | Item 16D. | | | | Exemptions from the Listing Standards for Audit Committees | | n/a | | Item 16E. | | | | Purchases of Equity Securities by the Issuer and Affiliated Purchasers | | 334338 | | Item 16F. | | | | Change in Registrant’s Certifying Accountant | | n/a | | Item 16G. | | | | Corporate governance | | 321326 | | Item 17. | | | | Financial Statements | | n/a | | Item 18. | | | | Financial Statements | | 152-156155-159 | | Item 19. | | | | Exhibits | | 349352 |
| | | | | | | | | | | | | | | 348 | | BPbp Annual Report and Form 20-F 2019
2020 | | 351 |
Information about this report This document constitutes the Annual Report and Accounts in accordance with UK requirements and the Annual Report on Form 20-F in accordance with the US Securities Exchange Act of 1934, for BP p.l.c. for the year ended 31 December 2019.2020. A cross reference to Form 20-F requirements is included on page 348.351.
This document contains the Strategic report on the inside front cover and pages 1-711-70 and the Directors’ report on pages 72-99, 10171-102, 105 (in part only), 130, 232-259231-258 and 297-346.301-349. The Strategic report and the Directors’ report together include the management report required by DTR 4.1 of the UK Financial Conduct Authority’s Disclosure Guidance and Transparency Rules. The Directors’ remuneration report is on pages 100-127.103-126. The consolidated financial statements of the group are on pages 131-231129-230 and the corresponding reports of the auditor are on pages 146-151.150-154.
BPbp Annual Report and Form 20-F2019 2020 may be downloaded from bp.com/annualreport. No material on the BPbp website, other than the items identified as BP bp Annual Report and Form 20-F2019 2020, forms any part of this document. References in this document to other documents on the BPbp website, such as BPbp Energy Outlook, BPbp Sustainability Report, BPbp Statistical Review of World Energy and BPbp Technology Outlook are included as an aid to their location and are not incorporated by reference into this document.
BP p.l.c. is the parent company of the BPbp group of companies. The company was incorporated in 1909 in England and Wales and changed its name to BP p.l.c. in 2001. Where we refer to the company, we mean BP p.l.c. The company and each of its subsidiaries« are separate legal entities. Unless otherwise stated or the context otherwise requires, the term “BP” or "bp" and terms such as “we”, “us” and “our” are used in this report for convenience to refer to one or more of the members of the BPbp group instead of identifying a particular entity or entities. Information in this document reflects 100% of the assets and operations of the company and its subsidiaries that were consolidated at the date or for the periods indicated, including non-controlling interests.
The company’s primary share listing is the London Stock Exchange. In the US, the company’s securities are traded on the New York Stock Exchange (NYSE) in the form of ADSs (see page 328332 for more details) and in Germany in the form of a global depositary certificate representing BPbp ordinary shares traded on the Frankfurt, Hamburg and Dusseldorf Stock Exchanges.
The term ‘shareholder’ in this report means, unless the context otherwise requires, investors in the equity capital of BP p.l.c., both direct and indirect. As the company's shares, in the form of ADSs, are listed on the NYSE, an Annual Report on Form 20-F is filed with the SEC. Ordinary shares are ordinary fully paid shares in BP p.l.c. of 25 cents each. Preference shares are cumulative first preference shares and cumulative second preference shares in BP p.l.c. of £1 each. | | | | | | Registered office and our worldwide headquarters: BP p.l.c. 1 St James’s Square London SW1Y 4PD UK Tel +44 (0)20 7496 4000 | Our agent in the US:
BP America Inc. 501 Westlake Park Boulevard Houston, Texas 77079 US Tel +1 281 366 2000 | Registered in England and Wales No. 102498.
London Stock Exchange symbol ‘BP.’
|
Exhibits The following documents are filed in the Securities and Exchange Commission (SEC) EDGAR system, as part of this Annual Report on Form 20-F, and can be viewed on the SEC’s website. | | | | | | | | | | | Memorandum and Articles of Association of BP p.l.c.*******† | | | Description of rights of each class of securities registered under Section 12 of the Securities Exchange Act of 1934† | | | The BP Executive Directors’ Incentive Plan******† | | | Director’s Service Agreement for B Looney†Looney****† | | | Director’s Service Contract for Dr B Gilvary***†M Auchincloss† | | | The BP Share Award Plan 2015*******† | | | Subsidiaries (included as Note 37 to the Financial Statements) | | | Code of Ethics*† | | | Rule 13a – 14(a) Certifications† | | | Rule 13a – 14(b) Certifications#† | | | Consent of DeGolyer and MacNaughton† | | | Report of DeGolyer and MacNaughton† | | | Consent of Netherland, Sewell & Associates† | | | Report of Netherland, Sewell & Associates† | | | Consent Decree*******† | | | Gulf states Settlement Agreement*******† | | | | | | Consent of Ernst & Young LLP† | | | Consent of Deloitte LLP† | | | Consent of Ernst & Young LLC regarding opinion in Exhibit 99.1† | | | Consolidated financial statements of Rosneft Oil Company as at and for the years ended 31 December 2020 (unaudited) and 2019† | | | Consolidated financial statements of Rosneft Oil Company as at and for the years ended 31 December 2018 (unaudited) and 2017 (unaudited)† | | Exhibit 101 | | InteractiveInline XBRL data files | | Exhibit 104 | | Cover page interactive data file (formatted as Inline XBRL and contained in Exhibit 101) |
| | | | | | | | | | * | | Incorporated by reference to the company’s Annual Report on Form 20-F for the year ended 31 December 2009. | ** | | Incorporated by reference to the company’s Annual Report on Form 20-F for the year ended 31 December 2010. | | | | | | | *** | | Incorporated by reference to the company’s Annual Report on Form 20-F for the year ended 31 December 2011. | ***** | | Incorporated by reference to the company’s Annual Report on Form 20-F for the year ended 31 December 2013. | ****** | | Incorporated by reference to the company’s Annual Report on Form 20-F for the year ended 31 December 2014. | ******* | | Incorporated by reference to the company’s Annual Report on Form 20-F for the year ended 31 December 2015. | | **** | | Incorporated by reference to the company’s Annual Report on Form 20-F for the year ended 31 December 2019. | | # | | Furnished only. | | † | | Included only in the annual report filed in the Securities and Exchange Commission EDGAR system. | | | |
The total amount of long-term securities of BP p.l.c. and its subsidiaries under any one instrument does not exceed 10% of their total assets on a consolidated basis. The company agrees to furnish copies of any or all such instruments to the SEC on request.
Paper: Nautilus Super White is a premium ecological paper. It is made from 100% post-consumer waste recycled paper and is FSC® (Forest Stewardship Council®) certified. The paper also holds the EU Ecolabel certification. The manufacturing mill also holds ISO 14001 environmental certification. Printed in the UK by Pureprint Group.
| | | | | | | | | | | | | | | | 352 | BP
| bp Annual Report and Form 20-F 20192020 | | «See Glossary | | 349 |

  BP’sb p A n n u al R e p o rt an d F o rm 2 0 -F 2 0 2 0 © BP p.l.c. 2021 bp’s corporate reporting suite includes information about our financial and operating performance, sustainability performance and also on global energy trends and projections. Annual Report Sustainability Financial and Operating and Form 20-F 2019 Report 2019 Information 2015-20192020 Details of our financial and operating performance in print and online. bp.com/annualreport Energy Outlook Provides our projections of future energy trends and factors that could affect them. bp.com/energyoutlook Sustainability Report 2020 Details of our sustainability How technology could and operating performance performance with additional influence the way we meet in print and online. information online. the energy challenge into the future. bp.com/annualreport bp.com/sustainability bp.com/financialandoperating BP Energy Outlook Statistical Review Provides our projections of World Energy 2020 of future energy trends An objective review of and factors that could key global energy trends. affect them out to 2040. bp.com/statisticalreview Financial and Operating Information 2016-2020 Five-year financial and operating data in PDF and Excel format. bp.com/energyoutlookfinancialandoperating Copies You can order bp’s printed publications free of charge from bp.com/annualreport. US and Canada Feedback You can order BP’s Issuer Direct Your feedback is important printed publications Toll-free: +1 888 301 2505 bpreports@issuerdirect.com Feedback Your feedback is important to us. You can emailcontact the free of charge from bpreports@issuerdirect.com corporate reporting team at bp.com/annualreport. corporatereporting@bp.com UK and rest of world BPbp Distribution Services You can also telephone Tel: +44 (0)870 241 3269 +44 (0)20 7496 4000 bpdistributionservices@bp.com or write to Corporate reporting BP p.l.c. 1 St James’s Square London SW1Y 4PD, UK © BP p.l.c. 2020
|