the expectations of stakeholders, hinder access to capital or expose AngloGold Ashanti to additional risks, including disinvestment and litigation.
Companies across all industries are facing increasing scrutiny related to ESG issues, including their internal ESG policies and governance practices. Investor advocacy groups, certain institutional investors, investment funds, lenders and other market participants are increasingly focused on ESG-related matters and in recent years have placed increasing importance on the environmental and social costs and impact of their investments. The increased focus and activism related to ESG and similar matters may hinder access to capital, as investors and lenders may decide to reallocate capital or to not commit capital as a result of their assessment of a company’s ESG practices. In addition, host communities, as well as certain governmental and non-governmental actors, are increasingly focused on a company’s ability to operate in a sustainable manner and to mitigate related risks, as well as the public commitments and quantitative metrics used to demonstrate performance and track progress. For AngloGold Ashanti, this includes, in particular, the safe operation of its mines, mitigating its impact to local environments and affected communities and reducing GHG emissions in line with the Company’s voluntary commitments. If AngloGold Ashanti’s performance fails to meet internal or adopted external ESG standards, or AngloGold Ashanti otherwise fails to satisfy stakeholder expectations with respect to its commitments and performance, regardless of whether there is a legal requirement to do so, such failure could result in reputational damage to and litigation against the Company and its business, financial condition, and/or stock price could be materially and adversely affected.
In particular, AngloGold Ashanti faces increasing pressures from stakeholders, who are increasingly focused on climate change, to prioritise energy efficiency in its operations, reduce its carbon footprint and improve water and other resource consumption, as well as to be transparent about how climate-related risks and opportunities are managed throughout the supply chain to foster and promote business resiliency, accountability and stakeholder value. AngloGold Ashanti has implemented numerous initiatives since 2008 to reduce its GHG emissions by installing new technology, such as heat pumps and underground cooling and water treatment systems, reducing power consumption and improving energy efficiency. AngloGold Ashanti has also made certain voluntary commitments to take future actions, including to achieve net zero Scope 1 and 2 GHG emissions by 2050, to achieve a 30% absolute reduction in Scope 1 and 2 GHG emissions by 2030 (as compared to a 2021 baseline), and, in partnership with value chain partners, to set Scope 3 GHG reduction targets, if not by the end of 2023, as soon as possible thereafter. AngloGold Ashanti continues to enhance its governance around climate-related risks and opportunities, including implementing the action plans of its Climate Change Strategy, which was approved by its board in November 2021. Nevertheless, AngloGold Ashanti may be required to implement even more stringent ESG practices or standards to meet the expectations of existing and future stakeholders and, if the Company fails to achieve these objectives or to adhere to internal or adopted external standards, or is perceived to be insufficiently committed to addressing ESG concerns across all of its operations and activities, the Company’s reputation and brand image could be damaged, it could lose the trust of its stakeholders (including governments, NGOs, investors, customers and employees) or be subject to litigation brought by those stakeholders, and its business, financial condition and results of operations could be adversely impacted.
AngloGold Ashanti’s inability to maintain an effective system of internal control over financial reporting may have an adverse effect on investors’ confidence in the reliability of its financial statements.
Internal control over financial reporting is a process designed to provide reasonable assurance regarding the reliability of financial reporting and the preparation of the company’sAngloGold Ashanti’s financial statements for external purposes in accordance with International Financial Reporting Standards (IFRS)(“IFRS”) as issued by the International Accounting Standards Board (IASB)(“IASB”). Disclosure controls and procedures are designed to ensure that information required to be disclosed by a company in reports that it files or submits under the Exchange Act is recorded, processed, summarised and reported within the time periods specified in the rules and forms of the SEC. These disclosure controls and procedures include without limitation, controls and procedures designed to ensure that information required to be disclosed by the companyCompany in reports that it files or submits under the Exchange Act is accumulated and communicated to the company’sCompany’s management, including its chief executive officer and chief financial officer, as appropriate to allow timely decisions regarding disclosure. A control system, no matter how well designed and operated, can provide only reasonable, not absolute, assurance with respect to the reliability of financial reporting and financial statement preparation. If AngloGold Ashanti is unable to maintain an effective system of internal control over financial reporting or disclosure controls and procedures, investors may lose confidence in the reliability of its financial statements and this may have an adverse impact on investors’ abilitiesability to make decisions about their investment in AngloGold Ashanti. See “Item 15: Controls and Procedures”.
Breaches in cybersecurity and violations of data protection laws may adversely impact or disrupt AngloGold Ashanti’s business.
AngloGold Ashanti maintains global information, digital technology (IT)(“DT”) and communication networks and applications to support its business activities. AngloGold Ashanti outsources several information technologiesdigital technology functions and applications to third-party vendors and these engagements may have an impact on the overall cybersecurity position of the company.Company. The primary company systems managed by third-party vendors include, but are not limited to, cloud infrastructure, data centre management, server/personal computing support, enterprise resource planning business applications, email and digital documents and the Cyber Security Operations Centre.
47
AngloGold Ashanti must continuously monitor the solutions implemented to support its global informationdigital technology and communication networks and applications to maintain a suitable and well-managed environment. There can be no assurance that these efforts will always be successful.
The sophistication and magnitude of cybersecurity incidents are increasing and include malicious software, attempts to gain unauthorised access to data and other electronic security and protected information breaches that could lead to production downtimes, operational delays, safety incidents, the compromising of confidential or otherwise protected information, destruction or corruption of data, other manipulation or improper use of AngloGold Ashanti’s systems and networks or financial losses from remedial actions. For example, in late 2020, a threat to the company’sCompany’s computer systems was detected and neutralised within hours in connection with the SolarWinds supply chain compromise which affected over 18,000 companies. The systems affected were limited to network monitoring applications in Brazil which monitored certain technology systems across the local network. In addition, there was a notable increase in phishing campaigns linked to COVID-19 in the second half of 2020 which continued through the year.first half of 2021. A sharp increase in ransomware-related threats have also been recorded throughout the mining industry with several high-profile organisations experiencing disruptions.
The interpretation and application of consumer and data protection laws in South Africa, the United States and elsewhere are evolving. It is possible that these laws may be interpreted and applied in a manner that is inconsistent with AngloGold Ashanti’s data practices. Complying with these various laws is essential and could cause the companyCompany to incur substantial costs or require it to change its business practices in a manner adverse to its business.
For example, the penalties for failure to comply with the South African Protection of Personal Information Act, No. 4 of 2013 (POPIA)(“POPIA”) are severe and may include an administrative fine of up to R10 million or imprisonment of up to ten years. The European General Data Protection Regulation (GDPR)(“GDPR”) may lead to administrative fines of up to €20 million or four percent of a company’s total worldwide annual turnover of the preceding financial year, whichever is higher. Also, the GDPR has a scope that extends beyond the borders of the EU and does not only affect EU operations.
U.S. securities laws do not require AngloGold Ashanti to disclose as much information to investors as a U.S. issuer is required to disclose, and investors may receive less information about the companyCompany than they might otherwise receive from a comparable U.S. company.
AngloGold Ashanti is subject to the periodic reporting requirements of the SEC and the New York Stock Exchange that apply to “foreign private issuers”. The periodic disclosure required of foreign private issuers under applicable rules is more limited than the periodic disclosure required of U.S. issuers. Accordingly, there may be less publicly available information concerning the companyAngloGold Ashanti than there is for U.S. public companies. For example, in 2016, AngloGold Ashanti announced that it would no longer voluntarilyhas a half-yearly reporting cycle and does not publish reviewed financial statements and analyses of operating and financial results for the quarters ended 31 March and 30 September of each year. As a result of this transition to half-yearly reporting, investors will receive less information about AngloGold Ashanti than they had in years preceding that change. In addition, AngloGold Ashanti is not required to file periodic
reports and financial statements with the SEC as frequently or as promptly as U.S. companies whose securities are registered under the U.S. Securities Exchange Act of 1934, as amended (Exchange Act)(the “Exchange Act”). As a result, investors will also receive less timely financial reports than they otherwise might receive from a comparable U.S. company or from certain of the company’sCompany’s peers in the industry. This may have an adverse impact on investors’ abilitiesability to make decisions about their investment in AngloGold Ashanti.
48
ITEM 4: INFORMATION ON THE COMPANY
4A. HISTORY AND DEVELOPMENT OF THE COMPANY
GROUP INFORMATION
AngloGold Limited was formed in June 1998 with the consolidation of the gold mining interests of Anglo American plc. AngloGold Ashanti Limited, as the companyCompany exists today, was formed on 26 April 2004 following the business combination between AngloGold Limited and Ashanti Goldfields Company Limited.
CURRENT PROFILE
AngloGold Ashanti Limited, a Company incorporated under the laws of the Republic of South Africa, is headquartered in Johannesburg, South Africa. The companyCompany (Registration number 1944/017354/06) was incorporated in the Republic of South Africa in 1944 under the name of Vaal Reefs Exploration and Mining Company Limited and operates under the South African Companies Act, No. 71 of 2008, as amended (the “SA Companies Act)Act”).
The Company’s legal and commercial name is AngloGold Ashanti Limited. Its registered office is at 76 Rahima Moosa Street, Newtown,112 Oxford Road, Houghton Estate, Johannesburg, 2001,2198, South Africa. The general telephone number is +27 11 637 6000 and the internet address is
https://www.anglogoldashanti.com. No material on the AngloGold Ashanti website forms any part of, or is incorporated by reference into, this annual report on Form 20-F. References herein to the Company’s website shall not be deemed to cause such incorporation.
While AngloGold Ashanti’s primary listing is on the Johannesburg Stock Exchange (JSE), the companyCompany is also listed on the New York Stock Exchange (NYSE), the Ghana Stock Exchange (GhSE) and the Australian Securities Exchange (ASX). AngloGold Ashanti was approved for a secondary listing on A2X Markets (A2X) in South Africa and its shares were admitted to trading on A2X on 6 June 2022. AngloGold Ashanti’s issued share capital will be unaffected by the additional listing on A2X. Our agent for service of process in the United States is AngloGold Ashanti North America Inc., 4601 DTC Boulevard, Suite 550, Denver, CO 80237. The U.S. Securities and Exchange Commission (SEC) maintains a public internet site that contains AngloGold Ashanti’s filings with the SEC and reports, proxy and information statements, and other information regarding issuers that file electronically with the SEC (http://www.sec.gov).
HISTORY AND SIGNIFICANT DEVELOPMENTS
Below are highlights of key corporate activities from 1998:
1998
•Formation of AngloGold Limited through the consolidation of East Rand Gold and Uranium Company Limited; Eastvaal Gold Holdings Limited; Southvaal Holdings Limited; Free State Consolidated Gold Mines Limited; Elandsrand Gold Mining Company Limited; H.J. Joel Gold Mining Company Limited and Western Deep Levels Limited into a single, focused, independent gold mining company. Vaal Reefs Exploration and Mining Company Limited (Vaal Reefs), the vehicle for the consolidation, changed its name to AngloGold Limited and increased its authorised share capital, effective 30 March 1998.
1998-2004
•Expansion of AngloGold Limited’s operations outside of South Africa.
2004
•Conclusion of the business combination with Ashanti Goldfields Company Limited, at which time the companyCompany changed its name to AngloGold Ashanti Limited.
2007
•Sale by Anglo American plc of 69,100,000 ordinary shares of AngloGold Ashanti, thereby reducing Anglo American’s shareholding in AngloGold Ashanti from 41.7 percent to 16.6 percent.
2009
•Sale by Anglo American plc of its remaining shareholding in AngloGold Ashanti to Paulson & Co. Inc.
2010
•Elimination of AngloGold Ashanti’s hedge book, thereby gaining full exposure to spot gold prices.
49
2012
•Acquisition of the remaining 50 percent interest in Serra Grande in Brazil for $215 million.
•Acquisition of 100 percent of First Uranium (Proprietary) Limited for $335 million.
2013
•Commission of two new gold projects -— Tropicana and Kibali -— in the second half of 2013.
2015
•Sale of the Cripple Creek & Victor gold mine in theColorado, USA for $819 million.
2017
•South Africa region restructured -— TauTona mine placed on orderly closure. Negotiations of the sales of Moab Khotsong and Kopanang mines.
2018
•Completion of the sales of the Moab Khotsong and Kopanang mines in South Africa for $300 million and $9 million, respectively.
2019
•Announcement of a review of divestment options for assets in South Africa, Mali and Argentina.
2020
•Sale of the remaining South African producing assets and related liabilities to Harmony for $200 million plus deferred consideration based on future production at the Mponeng mine.
•Completion of the sales of the Sadiola and Morila mines in Mali for cash proceeds of $25 million and $1 million, respectively.
2021
•Announcement of offer to purchase Corvus Gold Inc. (“Corvus Gold”), in Nevada USA.
2022
•Acquisition of the remaining 80.5 percent interest in Corvus Gold, for a cash consideration of $365 million.
•Acquisition of 100 percent of Coeur Sterling, Inc. (“Coeur Sterling”), in Nevada, USA for a cash consideration of $152 million.
2023 YTD
•On 16 March 2023, AngloGold Ashanti and Gold Fields Limited (“Gold Fields”) announced that they have agreed the key terms of a proposed joint venture in Ghana between Gold Fields' Tarkwa and AngloGold Ashanti's neighbouring Iduapriem Mines.
CAPITAL EXPENDITURE AND DIVESTITURES
For information concerning the company’sCompany’s principal capital expenditures currently in progress, including the distribution of these investments geographically and the method of financing, refer to “Item“Item 4B: Business Overview—AngloGold Ashanti Global Operations: 2020”2022”, “Item 5A: Operating Results—Capital expenditure”Comparison of capital expenditure in 2022, 2021 and 2020” and “Item 5B: Liquidity and Capital Resources”.
For information concerning the company’sCompany’s divestitures, including the sale of the remaining South African producing assets and related liabilities announced on 12 February 2020 and completed on 30 September 2020, refer to “Item 5A:“Item 5: Operating Results—Discontinued operations”, “Item 18:and Financial Statements—Note 9—Discontinued operationsReview and assets and liabilities held for sale”Prospects—Overview”.
50
4B. BUSINESS OVERVIEW
AngloGold Ashanti Limited (AngloGold Ashanti) is an independent, global gold mining company with a diverse portfolio of operations, projects and exploration activities across nine countries on four continents. While gold is our principal product, we also produce silver (Argentina) and sulphuric acid (Brazil) as by-products. We are currently developing two projects in Colombia, including the Quebradona mine that is expected to produce both gold and copper, and continuing exploration activities in the United States. The Company is headquartered in Johannesburg, South Africa. Measured by production, AngloGold Ashanti is the third largest gold mining company in the world.
PRODUCTS
AngloGold Ashanti’s main product is gold. Once mined, the gold ore is processed into doré (unrefined gold bars) on site and then dispatched to precious metals refineries for refining to a purity of at least 99.5%,99.5 percent, in accordance with the standards of ‘good delivery’ as determined by the London Bullion Market Association (LBMA). This refined gold is then sold directly to bullion banks.
By-products of our gold mining operations, often a function of local geological characteristics, include silver in Argentina and sulphuric acid in Brazil.
OPERATIONS
Our operations and projects are grouped regionally as follows:
•Africa region (Democratic Republic of the Congo,(DRC, Ghana, Guinea and Tanzania and Mali - sold during 2020)ania);
•Americas (Argentina and Brazil, and projects in the United States and Colombia); and
•Australia (Australia).
EXPLORATION
Our exploration programme is focused on creating significant value for the company'sCompany’s stakeholders by providing long-term optionality and improving the quality of our asset portfolio.
Greenfields and brownfields exploration takes place in both established and new gold-producing regions through managed and non-managed joint ventures,arrangements, strategic alliances and wholly-ownedwholly owned ground holdings. AngloGold Ashanti’s discoveries include La Colosa Gramalote and Quebradona (Nuevo Chaquiro) in Colombia.Colombia and Silicon, North Bullfrog, Mother Lode and Sterling in Nevada, USA.
GOLD MARKET AND JEWELLERY DEMAND
According to the World Gold Council, (WGC), global2022 was the strongest year for gold demand in over a decade and saw an annual average market spot gold price of $1,802 per ounce. Demand for gold rose 18 percent to 4,741 tonnes in 2022, with a ten percent increase in investment demand grew 40which reached 1,107 tonnes and a two percent increase in demand for gold bars and coins to 1,217 tonnes. Demand for gold in technology saw a record annual highfull year decline of 1,773.2 tonnes. Global gold-backed ETFs holdings grewseven percent as deteriorating global economic conditions hampered demand for consumer electronics and jewellery consumption softened by 877.1 tonnes during 2020, reaching record year-end holdings of 3,751.5 tonnes. Bar and coin investment of 896.1 tonnes was three percent higher year-on-year, with consistent growth coming throughat 2,086 tonnes as the gold price surged in the second halffourth quarter of the year.2022.
For more information, see “Item 5A: Operating Results—Introduction”.
51
COMPETITION
As gold mining is a mature and regulated industry, and very significant volumes of gold and gold derivatives trade in the world markets independent of gold mine supply, AngloGold Ashanti does not consider that competition for sales plays any role in its operations as a gold producer. For more information on a geographical analysis of gold income by destination, refer to “Item“Item 18: Financial Statements—Note 2—Segmental Information”.
However, gold producers do compete against each other for acquisition of mining assets, exploration opportunities and human resources. See “Item“Item 3D: Risk Factors—Mining companies faceAngloGold Ashanti faces strong competition and industry consolidation”.
SEASONALITY
Subject to other factors and unforeseen circumstances, in the first quarter production is generally lower than production during the rest of the year as a result of the ramp-up of operations after annual holiday production declines.
RAW MATERIALS
AngloGold Ashanti uses chemicals, including cyanide and lime, in the production of gold. These chemicals are available from a large number of suppliers and do not represent a material portion of the company’sCompany’s costs. We are not currently experiencing any supply shortages on critical consumables utilised in the production of gold across our global operations. In addition, our stocking strategies account for potential lead time variation and supply constraints, thus minimising the risk of changes in the marketplace. While commodity pricing is subject to volatility over time, we are currently realising stable pricing, and our contractual terms limit future changes. However the war in Ukraine has led to a sharp increase in oil and energy prices, which are important costs for the Company's business. In 2022, prices for several hard and soft commodities had reached their highest levels in a decade or more, or in some cases had set records. The higher cost for basic commodities used in our host countries and communities, and as key production inputs, could impact the costs of our raw materials.
STRATEGY
We have five key areas, namely: people, safety and sustainability; ensuring financial flexibility; actively managing all expenditures; improving the quality of our portfolio; and maintaining long-term optionality. These strategic focus areas which enable us to deliver on our overall strategy which is to create value. They guide decision-making and are aimed at generating increased cash flows; extending mine lives; creating an organic pipeline of economically viable orebodies; and enhancing our social licence to operate. The overall aim is creating and preserving value.
Strategic focus areas
AngloGold Ashanti’s five strategic focus areas are set out below:
•Focus onPrioritise people, safety, health, environment and sustainabilitycommunities. People areThis strategic focus area embodies our corporate ethos and encompasses our sustainability performance. It underpins our business strategy and the foundationdelivery of our business. To remain sustainable in the long term, we must livesustained, long-term value creation and is aligned with our values in the conduct ofand responsibilities as a corporate citizen. This strategic focus area covers our business. This encompasses being accountable for our actionsemployees, their safety, health and decisions, and respecting all, including employees,wellbeing, communities and the environment. ESG principles are integrated into every aspect of our business.
•PromoteMaintain financial flexibility. We must ensure our balance sheet always remainsis able to meet our core funding needs.
•Optimise overhead costs and capital expenditure. All spending decisions must be thoroughly scrutinised to ensure they are optimally structured and necessary to fulfil our core business objective.objectives.
•Improve portfolio quality. AngloGold Ashanti builds on its portfolio quality through projects such as our FP programme to ensure optimal mine performance. We have a portfolio of assets that must be actively managed to improveare flexible in delivering on our mine plans, allowing for the overall mix ofbest results, as we progress our projects and replace our production base as we strive forwith a competitive valuation as a business.growing Mineral Reserve and Mineral Resource base.
•Maintain long-term optionality. While we areAs part of focused on ensuring the most efficient day-to-day operationand responsible management of our Mineral Resource and Mineral Reserve, our exploration programme and related planning is vital in optimising the operating lives of our portfolio. Through continued exploration and the acquisition of properties that are a good fit with our business and offer reserve potential, we must keep an eye on creating a competitive pipelineadd to the long-term sustainability of long-term opportunities.AngloGold Ashanti.
INTELLECTUAL PROPERTY
AngloGold Ashanti, as a group, is not dependent on intellectual property (including patents or licences), industrial, commercial or financial contracts (including contracts with customers or suppliers) or new manufacturing processes for the conduct of its business as a whole.
52
THE REGULATORY ENVIRONMENT ENABLING ANGLOGOLD ASHANTI TO MINE
AngloGold Ashanti’s rights to own and exploit Oredevelop Mineral Reserve and deposits are governed by the laws and regulations of the jurisdictions in which these mineral properties lie.are located.
AngloGold Ashanti is subject to a wide range of laws and regulations governing all aspects of its operations, including such areas aswith respect to environmental protection, reclamation, exploration, development, production, taxes, immigration, labour standards and employment issues, occupational health, mine safety, dam safety, toxic substances and wastes, securities and foreign corrupt practices. AngloGold Ashanti has made, and expects to make in the future, significant expenditures to comply with these laws and regulations. Non-compliance can result in violations and legal claims, as well as substantial fines, penalties, reputational damage and delays in or suspension of day-to-day operations. Pending or proposed changes to existing laws and regulations, as well as any proposed or contemplated new laws or regulations, could also have significant impacts on AngloGold Ashanti’s business and results of operations, the extent of which cannot always be predicted.
There are in some cases certain restrictions on AngloGold Ashanti’s ability to independently move assets out of certain countries in which it has operations, or transfer assets within the group,Group, without the prior consent of the local government or minority shareholders involved. See “Item“Item 10D: Exchange controls” for details.
For more information on the risks and uncertainties associated with AngloGold Ashanti’s mining rights, see “Item“Item 3D: Risk factors”Factors”, in particular the risk factors entitled “AngloGold Ashanti’s mining rights in the countries in which it operates could be altered, suspended or cancelled for a variety of reasons, including breaches in its obligations in respect of such mining rights”, “Failure to comply with laws, regulations, standards and contractual obligations, breaches in governance processes or fraud, bribery and corruption may lead to regulatory penalties, loss of licences or permits, negative effects on AngloGold Ashanti’s reported financial results, and adversely affect its reputation”, “Title to AngloGold Ashanti’s properties may be uncertain and subject to challenge”, “AngloGold Ashanti’s mineral deposits, OreMineral Reserve, and mining operations are located in countries where political, tax and economic laws and policies may change rapidly and unpredictably and such changes and policies may adversely affect both the terms of its mining concessions, as well as its ability to conduct operations in certain countries” and “AngloGold Ashanti’s OreMineral Reserve, deposits and mining operations are located in countries that face instability and security risks that may adversely affect both the terms of its mining concessions, as well as its ability to conduct operations in certain countries”.
SOUTH AFRICA
As part of the South African asset sale, AngloGold Ashanti Limited sold its remaining three mining rights in South Africa to Golden Core Trade and Invest (Pty) Ltd (Golden Core)(“Golden Core”) and Harmony Gold Mining Company Limited pursuant to a sale agreement concluded on or about 12 February 2020, as amended and reinstated from time to time (SA(the “SA Sale Agreement)Agreement”). These mining rights relate to operations in the West Wits area. For further information on the South African asset sale, see “Item 18: Financial Statements—Note 9—Discontinued operations and assets and liabilities held for sale—South African asset sale”.
The Deed of Cession has been lodged for registration at the Mineral and Petroleum Titles Registration Office (MPTRO) to transfer such mining rights from AngloGold Ashanti to Golden Core. While the registration of the Deed of Cession is still pending, the risk in, benefit of, and ownership of these mining rights between the parties shall be deemed to have passed to the cessionary on 30 September 2020, the date of the notarial execution of the Deed of Cession, pursuant to clause 2 of the Deed of Cession.MPRDA
The Mining Chartermining charter
53
2021, the South African Department of Mineral Resources and Energy (“DMRE”) informed the parliamentary portfolio committee on mineral resources and energy that it does not intend to appeal the outcome of the judgement, but instead will consider steps to achieve the empowerment objectives through legislative amendments to the MPRDA.
The BBBEEB-BBEE Act
The Broad-Based Black Economic Empowerment Act, No. 53 of 2003 (BBBEE Act)(the “B-BBEE Act”) is a law of general application in respect of Broad-Based Black Economic Empowerment (BBBEE)(“B-BBEE”) and enables the Minister of Trade and Industryto drive BBBEEB-BBEE across all sectors of the economy. On 23 JanuaryIn 2014, the President of South Africa assented to the Broad-Based Black Economic Empowerment Amendment Act, No. 46 of 2013 (BBBEE(the “B-BBEE Amendment Act). The BBBEE Amendment ActAct”) came into effect on 24 October 2014 with the object of amending the BBBEEB-BBEE Act to provide a framework of principles, strategies and guidelines aimed at promoting the broad-based socio-economic empowerment of HDSAs across the South African economy and society in the form of ownership, management, employment equity, skills development, preferential procurement, enterprise development and socio-economic development.
Environmental laws relating to mining
The MPRDAA repealed the sections in the MPRDA providing for environmental regulation of mining and prospecting operations. This was the first step in migrating environmental regulation provisions from the MPRDA into National Environmental Management Act, No. 107 of 1998, (NEMA). NEMA was thenas amended by the National Environmental Management Amendment Act, No. 62 of 2008 and then again by the National Environmental Management Laws Amendment Act, No. 25 of 2014, and now(the “NEMA”) includes provisions to deal with environmental regulation of mining and prospecting, which provisions are administered by the MRE Minister. Pursuant to section 24N(8) of NEMA, directors of a company are jointly and severally liable for any negative impact on the environment, whether advertently or inadvertently caused by the company they represent, including damage, degradation and pollution. See also “Item 4B: Business Overview—Mine Site Rehabilitation and Closure” and “Item 4B: Business Overview—Environmental, Health and Safety Matters”.
From an environmental perspective, given the wide scope of the statutory duty of care in South African environmental law, erstwhile land owners may be held liable for historic contamination by the regulatory authorities. The duty of care primarily applies to persons responsible for or in control of the activity that caused the pollution, which includes erstwhile landowners and operators. The “polluter pays” principle in South Africa enables the competent authority to seek recourse against various responsible parties based on their historical or current relationship to the source and receptor of degradation or pollution. The duty of care also applies retrospectively to significant pollution or degradation that occurred before the entry into force of NEMA (i.e., 29 January 1999), as well as significant pollution or degradation that arises or is likely to arise at a different time from the actual activity that caused the contamination (e.g., latent or residual impact) or arises through an act or activity of a person that exacerbates pre-existing contamination. The authorities can also seek compensation in respect of clean-up measures that it is required to take on behalf of the responsible parties and apportion liability amongst the responsible parties, which could technically include a historic landowner or mining company that caused the pollution. Although the purchasers of AngloGold Ashanti’s assets in South Africa have contractually assumed all environmental liability associated with its former South African operations and agreed to indemnify AngloGold Ashanti for the same, there remains a risk, at least theoretically, of statutory liability to the state.
AngloGold Ashanti’s rights and permits
Pursuant to the SA Sale Agreement, AngloGold Ashanti and Golden Core executed a notarial deed of cession of the mining rights with DMRE references GP 30/5/1/2/2/01 MR and GP 30/5/1/2/2/248 MR to transfer and cede these mining rights to Golden Core (the “Deed of Cession”). On 14 June 2021, the Deed of Cession was registered at the Mineral and Petroleum Titles Registration Office (the “MPTRO”).
With respect to the mining right held under DMRE reference GP 30/5/1/2/2/11 MR, AngloGold Ashanti and Golden Core agreed to make an application in terms of section 102 of the MPRDA at the DMRE after the closing date of the SA Sale Agreement requesting, among other matters, the incorporation of this mining right into the mining right with DMRE reference GP 30/5/1/2/2/01 MR (the “Harmony Consolidation Application”). AngloGold Ashanti also executed a notarial conditional deed of abandonment pursuant to which it conditionally abandons this mining right in terms of section 56(f) of the MPRDA (the “Deed of Abandonment”) on condition that ministerial consent is granted in respect of the Harmony Consolidation Application. The Harmony Consolidation Application, which was submitted to the DMRE on 17 January 2022, is still pending. On the date of the grant of the Harmony Consolidation Application, AngloGold Ashanti will cease to be a holder of any mining rights in South Africa. Once the transaction has been fully implemented, the general laws relating to mining outlined above will no longer be applicable to the Company, other than the statutory duty of care in terms of NEMA as described above.
AFRICA REGION
Democratic Republic of the Congo (DRC)
General laws relating to mining
The mining industry in the DRC is primarily regulated by Law No. 007/2002 dated 11 July 2002 (2002(the “2002 DRC Code)Code”), as amended and supplemented by Law No. 18/001 dated 29 January9 March 2018 (Reformed(the “Reformed DRC Mining Code)Code”) and Decree No. 038/2003 dated 26 March 2003, as amended and supplemented by Decree No. 18/024 dated 8 June 2018 (Reformed(the “Reformed DRC Mining Regulations)Regulations”).
54
With respect to the application of the Reformed DRC Mining Code and Reformed DRC Mining Regulations, Kibali Goldmines S.A. (Kibali)(“Kibali Goldmines”) has reserved and continues reserving its rights, including, without limitation, its stability rights under, among other legal sources, the 2002 DRC Code. Discussions with the DRC government on these issues and the possible application of incentives that may be available under the Reformed DRC Mining Code and Reformed DRC Mining Regulations, in particular under article 220 of the Reformed DRC Mining Code which provides that the Prime Minister of the DRC may grant a number of incentives to provinces with infrastructure deficits to encourage economic development from mining resources, are ongoing.
Companies holding mining titles issued prior to the entry into force of the Reformed DRC Mining Code and Reformed DRC Mining Regulations have claims to a 10-yearten-year stability provision in accordance with prior mining legislation. Notwithstanding the adoption of the new regulatory regime, their rights with respect to such stability provision are reserved.
The Reformed DRC Mining Code grants the DRC Minister of Mines the authority to grant, refuse, suspend or terminate mineral rights, subject to conditions set out in the Reformed DRC Mining Code. Mineral rights may be granted in the form of exploration permits for an initial period of five years renewable once for a further five-year period or in the form of miningexploitation permits which are granted for an initial period of 25 years. Anyears, renewable several times for 15-year periods until the end of the mine’s life. Prior to commencing exploration work, the holder of an exploration permit may, at any time before expiry, be transformed partially intomust submit for approval a mining permit or a small-scale mining permit. Miningmitigation and rehabilitation plan pursuant to which it must undertake to carry out certain mitigation measures of the impact of its activities on the environment, as well as rehabilitation measures. Exploitation permits are granted upon successful completion of exploration and satisfaction of certain requirements, including approval of a feasibility study, an environmental and social impact study and an environmental and social management plan. To protect and enforce rights acquired under an exploration or mining permit, the Reformed DRC Mining Code provides, depending on the nature of a dispute or threat, administrative, judicial and national or international arbitral recourses.
The holder of a miningan exploitation permit is required to commence development and mine construction within three years of the awardgrant of such permit. Failure to do so may lead to forfeiture of the miningexploitation permit. ATo protect and enforce rights acquired under an exploration or exploitation permit, holder must comply with specific rules relating to, amongst other things, protectionthe Reformed DRC Mining Code provides, depending on the nature of the environment, cultural heritage, healthdispute or controversy, administrative, judicial and safety, construction and infrastructure planning. Mining and exploration activities are required to be undertaken in a way that minimizes the impact on the interests of lawful occupants of land and surface rights holders, including their customary rights. The exercise of mineral rights by title holders which effectively deprivesnational or interferes with the rights of occupants and surface rights holders requires payment of fair compensation by the mineral title holder.international arbitral recourses.
Mining companies are required to grant a free-carried and non-contributory participation to the DRC government. The DRC government’s free participation was originally set at 5five percent, which was increased to 10ten percent in respect of mining titlesexploitation permits issued after the entry into force of the Reformed DRC Mining Code. All mining companies are required to grant an additional 5five percent free-carried participation to the DRC government upon each renewal of their exploitation permit. Under the Reformed DRC Mining Code, a 10ten percent local contributory participation is also mandatory for mining titlesexploitation permits issued after its entry into force.
Tax laws relating to mining
The Reformed DRC Mining Code sets out an exclusive and comprehensive tax and customs regime that is applicable to mining activities. Mining title holders are subject, amongst other things, to a corporate income tax of 30 percent, a windfall tax of 50 percent (subject to certain prerequisites) and are required to pay mining royalties to the DRC government. The royalty rate applicable to gold has been set at 3.5 percent. Mining title holders are also required to contribute a minimum of 0.3 percent of total turnover to community development.
The standard rate of VAT is 16 percent and is applicable to all mining companies. In the DRC, Kibali Goldmines is due certain refunds of VAT which, to date, remain outstanding. During 2020,2022, AngloGold Ashanti recovered $2.23 million in the form ofdid not recover any VAT offsets and refunds from its operations in the DRC. We believe that our attributable share of the net recoverable VAT balance (including recoverable fuel duty and after discounting provisions) owed to us by the DRC government amounted to $69$86 million as of 31 December 2020.2022. While an agreement was reached with the DRC government on the reimbursement of the refundable VAT in the last quarter of 2018, uncertainty remains regarding the timing and level of cash receipts and offsets against other taxes for purposes of the recovery of our VAT receivables in the DRC.
The Reformed DRC Mining Code also provides for a level of fiscal stability. A stability clause stipulates that existing tax, customs and exchange control provisions applicable to mining activities are guaranteed to remain unchanged for a period of five years from the enactment of the Reformed DRC Mining Code.
Foreign exchange control regime
The Reformed DRC Mining Code imposed new exchange control rules requiring that mining title holders repatriate onshore 60 percent of sale revenues received during the investment amortizationamortisation period and 100 percent once the investment amortizationamortisation is completed. As a result of these new rules, we were not able to fully repatriate dividends from our DRC operations to date.
During 2020,2022, AngloGold Ashanti repatriated $140$694 million from its operations in the DRC, in the form of dividends received from Kibali (Jersey) Limited. Kibali (Jersey) Limited received such cash from Kibali Goldmines in the form of loan repayments (net of bank fees) (AngloGold Ashanti’s attributable share: $658 million) and dividends (net of withholding taxes) (AngloGold Ashanti’s attributable share: $36 million). Our attributable share of the outstanding cash balances awaiting repatriation from the DRC amounted to $424$40 million as of 31 December 2020. Our joint venture partner, Barrick Gold Corporation, which operates2022. The cash is fully available for the operational requirements of Kibali gold mine, continuesGoldmines. The cash and cash equivalents held at Kibali Goldmines are subject to engage withvarious steps before they can be distributed to Kibali (Jersey) Limited and are held across four banks in the DRC, government regarding the Reformed DRC Mining Code and the cash repatriation.including two domestic banks.
55
AngloGold Ashanti’s rights and permits
AngloGold Ashanti holds a significant stake in the Kibali gold mine which is located in the north-eastern part of the DRC. The Kibali gold mine is owned by Kibali Goldmines S.A. (Kibali) which is a joint venture between Barrick Gold Corporation (45 percent), AngloGold Ashanti (45 percent) and Société Minière de Kilo-Moto S.A. (SOKIMO)(“SOKIMO”) (10 percent) which represents the interest of the DRC government. AngloGold Ashanti and Barrick Gold Corporation each have a 50 percent interest in Kibali (Jersey) Limited which holds our effective 45%their respective 45 percent interest in Kibali. The Kibali gold mine is operated by Barrick Gold Corporation.Goldmines.
The Kibali gold project is operated by Barrick Gold Corporation and comprises ten exploitation permits, of which seveneight expire in 2029 and threetwo in 2030. Those exploitation permits (11447, 11467, 11468, 11469, 11470, 11471, 11472, 5052, 5073, and 5088) cover an area of approximately 1,836 km2in the Moto goldfields.
Ghana
General laws relating to mining
Control of minerals and mining companies
The Constitution of Ghana as well as the Minerals and Mining Act, 2006 (Act 703) (GMM Act)(the “GMM Act”) provide that all minerals in Ghana in their natural state are the property of the State and title to them is vested in the President on behalf of and in trust for the people of Ghana, with rights of reconnaissance, prospecting, recovery and associated land usage being granted under licence or lease.
The grant of a mining lease by the Ghana Minister of Lands and Natural Resources (LNR Minister)(the “LNR Minister”) upon the advice of the Minerals Commission is subject to parliamentary ratification unless the mining lease falls into a class of transactions exempted by the Ghanaian Parliament.
The LNR Minister has the power to object to a person becoming or remaining a controller of a company which has been granted a mining lease if the LNR Minister believes, on reasonable grounds, that the public interest would be prejudiced by the person concerned becoming, or remaining, such a controller.
Stability and development agreements
The GMM Act provides for stability and development agreements. Stability agreements asguarantee for a mechanism to guaranteeperiod of 15 years certain terms and conditions mainly fiscal,(mainly fiscal) to which a company’s operations are subject for a period of 15 years. Stabilitysubject. Development agreements are subject to ratification by Parliament. A development agreement, as provided for by the GMM Act, may be made availablegranted to a mineral right holder with a proposed investment exceeding USD 500 million.that proposes to invest over $500 million in its mineral operations in Ghana. The GMM Act also provides that the terms of apermits stability provisions to be incorporated into development agreement may contain stability terms as provided for in stability agreements. AStability and development agreement isagreements are subject to parliamentary ratification.
In January 2020, the Minerals Commissionit was proposed certain amendments tothat the GMM Act including, among other measures, the abolishment ofbe amended by abolishing development agreements and shortening the shorteningmaximum term of stability agreements from a period not exceeding 15 years to a period of five years (with a possible extension of anotherfor a further five years). The Minerals Commission is currently engaging with stakeholders on If the GMM Act were amended along these proposed amendments. Following this engagement, the Minerals Commission may present the proposedlines, such amendments to the LNR Minister who can then decide to submit a draft bill to Parliament. If such bill were to be adopted by Parliament, it would not apply retroactively. As a result, the proposed amendments willretroactively and would therefore not have an impact on existing development agreements, including the Obuasi Development Agreement (as described below). Those amendments to the GMM Act have not yet been adopted.
Ghana Stability Agreement
In 2004, AngloGold Limited and the Government of Ghana signed a stability agreement (Ghana Stability Agreement) governing certain aspects of the fiscal and regulatory framework under which the company would operate in Ghana for a period of 15 years following the implementation of the business combination between AngloGold Limited and Ashanti Goldfields Company Limited. Under the Ghana Stability Agreement,Limited, AngloGold Limited and the Government of Ghana agreed, among other matters, to extend the termsigned a stability agreement (the “Ghana Stability Agreement”) governing certain aspects of the mining lease relating tofiscal and regulatory framework within which the Obuasi mine until 2054 on terms existing prior to the business combination.
company would operate in Ghana for a period of 15 years. In June 2018, the Ghana Stability Agreement ceased to apply to the Obuasi mine as a resultbecause of the parliamentary ratification of a new development agreement and a new tax concession agreement in relation to thethat mine (as described below). However, the
The Ghana Stability Agreement continued to apply to the Iduapriem mine until it expired in April 2019. Since then, AngloGold Ashanti (Iduapriem) Limited (AGA Iduapriem)(“AGA Iduapriem”) no longer benefits from the Ghana Stability Agreement. Relevant engagements are currently ongoing between AGA Iduapriem benefits from certain concessions under two deeds of warranty, including exemptions from withholding taxes on dividends, interest and the Minerals Commission to obtain a new agreementpayments for the Iduapriem mine.foreign services, and allowable deductions.
Obuasi Development Agreement
AngloGold Ashanti (Ghana) Limited (AGA Ghana)(“AGA Ghana”) negotiated a new development agreement in relation to the Obuasi mine (Obuasi DA)(the “Obuasi DA”) with the Government of Ghana. On 21 June 2018, the Ghanaian Parliament ratified the Obuasi DA which contains stability terms as provided for in stability agreements.
The Obuasi DA confers the followinga number of rights and obligations on AGA Ghana with respect to the Obuasi mine:
56
Obuasi Tax Concession Agreement
The key termsObuasi TCA contains a number of tax concessions for AGA Ghana with respect to the Obuasi TCA are as follows:
Government’s Golden Share
Section 60(1) of the GMM Act provides that the Government of Ghana can require a mining company to issue for no consideration to the Republic of Ghana for no consideration a special share (Golden Share) by notice in writing to such mining company.(a “Golden Share”). A Golden Share may only be held by or transferred to a Minister of the Government or any person acting on behalf of such Government and authorised in writing by such Minister. The Government of Ghana holds a Golden Share in AGA Ghana was issued to the Government of Ghana and the Obuasi DA confirms that the Government’s rights with respect to its Golden Share apply only in respect of AGA Ghana’s assets and operations in Ghana.
The following matters require, and will not be effective without,Golden Share confers certain rights on the Government in respect of AGA Ghana. For example, written consent of the holder of the Golden Share:
Tax laws relating to mining
Currently, the main tax laws in Ghana include the following acts and regulations:regulations, which have been frequently amended over the years:
•Income Tax Act, 2015 (Act 896) (as amended) and Income Tax Regulations, 2016 (L.I. 2244);
•Customs Act, 2015 (Act 891) (as amended) and Customs Regulations, 2016 (L.I. 2248);
•Value Added Tax, 2013 (Act 870) (as amended) and Value Added Tax Regulations, 2016 (L.I. 2243); and
•Revenue Administration Act, 2016 (Act 915).
The provision of goods and services is liable to Value Added Tax (VAT) at a revised rate of 12.5 percent. In addition, there are separate levies, including a 2.5 percent National Health Insurance Levy and a 2.5 percent Ghana Education Trust Fund Levy.
Furthermore, mining companies must pay ground rent and royalties. Ground rent (mineral concession rent)
is payable annually and is calculated based on the number of cadastral units of land held. Royalties are calculated as a percentage of total revenue from minerals obtained by the mining company. The Fees and Charges (Amendment) Instrument, 2015 (L.I. 2208) was passed by Parliament on 23 December 2015 and fixed, among other things, the paymentGovernment of ground rent byGhana currently applies a five percent royalty rate to mining companies at GHS 15 cedis per acre per annum.
who have not agreed a different royalty rate under an agreement with the State. AGA Ghana is paying $670 (GHS 3,705 cedis) per km2 per annumpays royalties on a sliding scale ranging between three percent and five percent as provided for allby the AGA Ghana leases. The Obuasi DA protects AGA Ghana from any increase in ground rent for the duration of that development agreement.TCA. AGA Iduapriem is also paying $670 (GHS 3,705 cedis) per km2 per annum for all the AGA Iduapriem leases.
The companyprovision of goods and services is requiredliable to value added tax (“VAT”) at a revised rate of 15 percent. In addition, there are separate levies, including a 2.5 percent National Health Insurance Levy (“NHIL”), a 2.5 percent Ghana Education Trust Fund Levy (“GetFund Levy”) and a one percent COVID-19 Levy. By virtue of the Obuasi TCA, AGA Ghana is exempt from the payment of the NHIL and GetFund Levy. In addition, while AGA Ghana is technically exempt from the payment of the COVID-19 Levy (as it became operational subsequent to the effective date of the Obuasi DA), the Company decided to pay ground rent to the GovernmentCOVID-19 Levy voluntarily. AGA Iduapriem is not exempt from any of Ghana (as described above) as well as such other fees as are prescribed by legislation, including royalties on timber felled within the lease area.
The Minerals Income Investment FundExemptions Act, 20182022 (Act 978), which was amended1083) (“Exemptions Act”) defines the scope of tax exemptions that may be granted under Ghanaian law, and sets out the administrative process for obtaining a tax exemption. The Exemptions Act requires a person with the benefit of an existing tax exemption to apply to the Ghana Minister of Finance by 11 March 2023 in order to continue to benefit from that tax exemption. The requirement to apply to the Minerals Income Investment Fund (Amendment) Act, 2020 (Act 1024), establishes a fundMinister of Finance does not affect AGA Ghana (as, by virtue of the Obuasi DA, AGA Ghana is stabilized against the adverse effects of, or obligations imposed by, any new laws). By contrast, AGA Iduapriem is subject to receive mineral royalties and related income from mineral rights holders and also provides for the disbursement and managementprovisions of such royalties and related income. The Minerals Income Investment Fund also acts as a special purpose vehicle holding the Ghanaian Government’s carried interests in mining companies. No additional burdens are imposed on mining companies as the effect of this legislation is merely to substitute the legal person holding the Government’s carried interests.Exemptions Act.
Environmental laws relating to mining
adverse effects of the mining operations, for submission to the Ghana EPA. The Minerals and Mining (Health, Safety and Technical) Regulations, 2012 (L.I. 2182) also impose further obligations to obtain the necessary permits from the Inspectorate Division of the Minerals Commission for the operation of mines. The environmental permits of AGA Ghana (for the Obuasi redevelopment project and for the construction and operation of tailings and water infrastructure projects) are valid until June 2024. The environmental permits for AGA Iduapriem in connection with (i) gold mining and processing, (ii) the re-mining of Block 5 and for the tertiary crusher installation project and (iii) the construction and operation of a tailings storage facility (“TSF”) expired in August 2021, July 2022 and January 2023, respectively. The renewal process for the AGA Iduapriem environmental permits, which was commenced in advance of the expiry of the permits, is underway.
Environmental laws in Ghana also require mining operators to rehabilitate land negatively impacted by mining operations according to an environmental cost reclamation plan agreed with the Ghana EPA. The environmental cost reclamation plan includes two cost estimates, namely the cost of rehabilitating the mining area at the end of the life of the mine as well as the cost of rehabilitating the mine as at the date of the reclamation plan. These estimates are reviewed annually and updated every two years. Each mining company is typically required to secure a percentage (typically between 50 percent and 100 percent) of the estimated rehabilitation costs by posting reclamation bonds underwritten by banks and restricted cash. The terms of each reclamation bond are determined by a reclamation security agreement between that company and the Ghana EPA. Both AGA Ghana and AGA Iduapriem have bank guarantees in place for environmental reclamation liabilities as well as escrow accounts with joint signatories from the Ghana EPA. The guarantees for AGA Iduapriem expired in October 2022, whereas the guarantees for AGA Ghana expired in December 2022. Renewal of the bank guarantees (which commenced in advance of the expiry of the existing guarantees) has not yet been completed due to the continued depreciation of the Ghanaian cedi and its impact on the Bank of Ghana’s single obligor limit. AGA Ghana and AGA Iduapriem have notified the Ghana EPA of the resultant delays.
Foreign exchange, export and other rules
Retention of foreign earnings
Rules regarding the export of gold and diamonds
The Bank of Ghana introduced new measures to regulate and monitor the export of gold and diamonds from Ghana in 2015. From 15 September 2015, all exports of gold and diamonds must be carried out through the Precious Minerals Marketing Company Ltd (PMMC)(“PMMC”), except where the exporter is the holder of a licence that permits it to export directly. The Ghana Revenue Authority (Customs Division) only permits gold to be exported by a licensed gold exporter who has a completed Form FEX A4 bearing Bank of Ghana’s embossment. The export measures do not apply to AngloGold Ashanti because the companyCompany holds a licence granted by the LNR Minister to sell and export its production.
In November 2016, the Ministry of Lands and Natural Resources issued a ministerial directive appointing the PMMC as designated laboratory for assaying in Ghana. The directive requests all persons holding export licenseslicences for gold to submit all gold
to be exported to the PMMC for assay before export. Mining businesses, including AngloGold Ashanti, acting through the Ghana Chamber of Mines were opposed to this directive due to its potential negative impact on mining companies in the region. As a result, the Chamber initiated proceedings to reverse or modify the directive. Following discussions in respect of the mining industry’s concerns, the Chamber and Government agreed on the modalities for implementing the national assaying policy and it was introduced in February 2018 following a one-month pilot among certain mining companies. A final documentSubsequently, in June 2019, the LNR Minister released a statement reiterating the Government of Ghana’s plans to locally refine 30 percent of the gold produced in the country. Discussions between the Ghana Chamber of Mines and the Government of Ghana’s economic management team in 2019 led to the Chamber agreeing to consider the proposal and for the implementation ofparties to discuss detailed modalities to ensure that a move to locally refined gold does not become detrimental to the program will be executed once the Chamber and the PMMC address a few outstanding issues regarding assaying methodologies.mining industry.
Mining companies must submit a detailed programme for the recruitment and training of Ghanaians with a view to achieving “localisation”, which is the replacement of expatriate personnel in a company’s Ghanaian operations by Ghanaian personnel. In addition, mining companies must give preference to Ghanaian products and personnel, to the maximum extent possible, consistent with safety, efficiency and economies. The Minerals and Mining (General) Regulations, 2012 (L.I. 2173) give further details on the localisation policy. On 15 October 2020, theThe Minerals and Mining (Local Content and Local Participation) Regulations, 2020 (L.I. 2431) were adopted in order to expandcame into force on 22 December 2020 with the scopepurpose of local content requirementsdeveloping Ghanaian participation in the mining industry. The Minerals Commission is taskedindustry value chain by imposing an obligation on mining companies to publish a local procurement list ofprocure goods and services that must havewith Ghanaian content. Mining companies must also submit a five-year procurement plancontent to the Minerals Commission. Technical and engineering services generally must be provided by Ghanaian-owned companies subject to limited exceptions. Only the services of financial institutions incorporated in Ghana are to be procured and not less than 25 percent of transactions are required to be undertaken with financial institutions owned by Ghanaian citizens. Other services such as haulage, security, contract mining services for small-scale mining operations and supply of fuel are required to be provided by Ghanaians. Furthermore, if the planned capital expenditures of a holder of a mineral right exceeds certain limits set by the LNR Minister, it is required to list at least 20 percent of its equity on the Ghana Stock Exchange within five years after commencement of mining operations. In addition, there are also restrictions on the number of expatriates that can be employed by mineral rights holders and mine support service providers in a bid to enhance the participation of Ghanaians in the mining industry.maximum extent possible.
58
The Government’s election to purchase gold
In June 2021, the Bank of Ghana launched a “Domestic Gold Purchase Programme” through which the Bank of Ghana intends to purchase refined gold from AGA Ghana, AGA Iduapriem and other large-scale mining companies through voluntary arrangements pursuant to the Bank of Ghana Act, 2002 (Act 612). The LNR Minister indicated in November 2022 that the Government of Ghana intended to exercise its statutory right of pre-emption pursuant to the GMM Act to compel large-scale mining companies to sell 20 percent of their Ghana gold production and/or the resultant refined gold to the Bank of Ghana in exchange for Ghanaian cedis. Each of AGA Ghana and AGA Iduapriem executed voluntary gold purchase agreements with the Bank of Ghana on 29 December 2022. As at 10 March 2020,2023, the ImpositionGovernment of Restrictions Act, 2020 (Act 1012) was enacted to put in place measures to address the COVID-19 pandemic. It gives the President power to impose restrictions on personsGhana had not exercised its statutory right of pre-emption as prescribed in the event of an emergency, disaster or similar circumstance to ensure public safety, public health and protection. Numerous executive instruments have been issued in exercise of this power conferred on the President pursuant to this legislation to manage the pandemic.GMM Act.
AngloGold Ashanti’s rights and permits
Obuasi
The currentObuasi mine originally held four contiguous mining lease forleases, namely, the Obuasi, areaBinsere 1, Binsere 2 and Binsere 3 Mining Leases. The Obuasi Mining Lease was granted by the Government of Ghana on 5 March 1994. It grants mining concessions to land with1994, covering an area of approximately 338 km2 in the Amansie East and Adansi West districts of the Ashanti region, for a term of 30 years from the date of the agreement. In addition, a mining lease overThe Binsere Mining Leases were granted on 9 April 1998, covering an adjacentarea of 140 km2 was also granted, resulting, for a term of 30 years from the date of the agreement. All leases in respect of the total area underObuasi mine had been duly ratified in accordance with Ghanaian law. In March 2007, the mining lease increasing to 474 km2. The Government of Ghana agreed to extend the term of the mining lease relating to the Obuasi mine until 2054.Mining Lease for a further term of 30 years. The mining leaseamended Obuasi Mining Lease was formallyalso ratified by Parliament on 23 October 2008. The Obuasi Mining Lease will expire in March 2054 and the Binsere Mining Leases in April 2028. The mining leases are renewable. On 3 March 2016, the Minerals Commission approved AGA Ghana’s application to surrender approximately 273.54 km2 of the area to the Government of Ghana, reducing the combined area under AGA Ghana’s lease areas to 201.46 km2. The remaining parcel of land that will be subject to the mining lease is situated within various villages and townships in the region but excludes the municipality of Obuasi. On 15 January 2021, the Minerals Commission approved AGA Ghana’s application to relinquishsurrender a further 60.24 km2 of lease area, thereby reducing the total lease areasarea to 141.22 km2 under three mining leases, namely, the Obuasi Mining Lease (87.48 km2), in order to avoid encroachmentthe Binsere 1 Mining Lease (29.03 km2) and illegalthe Binsere 2 Mining Lease (24.71 km2). These mining activities within the mine’s footprint while maintaining its social license to operate.
Iduapriem
The Iduapriem mine operates under four different mining leases:leases, namely, the Iduapriem Mining Lease (LVB1539/89) (36.47 km2), the Ajopa Mining Lease (LVB/WR326/09) (46.12 km2), the Teberebie Mining Lease (LVB3722H/92) (28.53 km2) and the Ajopa South Mining Lease (LR#1109/1999) (28.10 km2). Prior to all four mining leases expiring in 2018 and 2019, AGA Iduapriem submitted all relevant documents to apply for renewal of the leases. On 17 February 2020, the mining leases were extended for a further period of 15 years and such leases will now expire in February 2035. The Ajopa Mining Lease and the Ajopa South Mining Lease were ratified by the Ghanaian Parliament on 15 July 2020. The Iduapriem Mining Lease and the Teberebie Mining Lease were both ratified on 22 December 2020.
Guinea
General laws relating to mining
In Guinea, all mineral substances are the property of the State. Mining activities aremining industry is primarily regulated by Law L/2011/006/CNT dated 9 September 2011 as amended by Law L/2013/053/CNT dated 8 April 2013 and promulgated by Decree D/2013/075/PRG/SGG dated 17 April 2013 (together, the Guinea“Guinea Mining Code)Code”).
The Guinea Mining Code is implemented by various decrees and orders, including Decree D/2014/015/PRG/SGG adopting a model of mining convention, dated 17 January 2014, Order A/2016/1584/MMG/SGG related to the administration’s capacities for the management of integrated mining projects (PARCA-GPI) and its steering committee, dated 6 June 2016, and Decree D/2016/163/PRG/SGG on the national agency for the development of mining infrastructures (ANAIM), dated 13 June 2016, and Decree D/2016/215/PRG/SRG on the appointment of executives to the Ministry of Mines and Geology, dated 8 July 2016.
In 2017, Decree D/2017/285/PRG/SGG was adopted, which sets forth the conditions for the constitution and management of the Local Development Fund (Fodel)(“Fodel”), as well as Joint Order A/2017/6326/MMG/MATD/SGG, which sets forth the conditions for the use, management and control of the Fodel. Together, these set forth the use of the mining companies’ financial contribution to the development of the local communities and the rules applying to the Fodel, which was created under the Guinea Mining Code. In addition, Joint Order AC/2017/3228/MATD/MMG/SGG, issued by the Ministry of Territorial Administration and Decentralisation and the Ministry of Mines and Geology and dated 21 July 2017, updates the act on the establishment, attribution and functioning of the coordination committees in mining communities (CCLMS). The main purpose of the CCLMs, in which all concerned mining companies are represented, is to prevent and settle disputes that may arise in mining communities. On 13 July 2018, a Joint Order A/2018/5212/MEF/MMG/MB/MATD/SGG was issued, which regulates the use, management and monitoring of the resources allocated to local authorities pursuant to article 165 of the Guinea Mining Code. In 2019, an inter-ministerial committee was created to supervise and control the Fodel through the adoption of Joint Order AC/2019/089/MMG/MATD/SGG setting out the conditions for the constitution, powers and management of said inter-ministerial committee. On 6 September 2019, Decree D/2019/263/PRG/SGG was issued, which sets forth local content requirements in the framework of the implementation of public and private projects in Guinea. On 27 May 2021, Order A/2021/1229/MMG/SGG was issued to establish the Steering Committee for local content in the mining sector. On 21 October 2022, Law L/2022/010/CNT, dated 22 September 2022, setting up the legal framework for local content in public and private projects was enacted (the “Local Content Act”). In particular, the Local Content Act regulates local employment, procurement of goods and services, and subcontracting
59
requirements. As the Local Content Act does not expressly repeal the provisions of Decree D/2019/263/PRG/SGG, those provisions remain in force to the extent that they do not conflict with the Local Content Act.
On 16 June 2020, a new procedure for the export of gold by mining companies was enacted through the adoption of Decree D/2020/113/PRG/SGG, which sets out, amongst other things: (i) when the industrial production tax referred to in article 161-1 of the Guinea Mining Code shall be paid, and (ii) the process to be followed to export gold bullion.
On 27 April 2021, a Joint Order AC/2021/824/MMG/BCRG/SGG was issued establishing the fees and costs charged by the Guinean mining authorities and the Guinean Central Bank in connection with the administrative procedures for the export of gold by industrial and semi-industrial companies.
AngloGold Ashanti’s rights and permits
The right to undertake mining operations in Guinea can only be obtained by one of the following mining titles: surveying permit, small-scale mining licence, exploration licence, mining licence or mining concession.
Key elements of the Revised Mining Convention de Base include the following:
•a duration of 25 years, expiring 23 January 2042, subject to further renewal if mining operations continue;
•the term of the Mining Concession is aligned with the term of the Revised Mining Convention de Base such thatsince the Republic of Guinea committed to maintain the Mining Concession will be renewed as long asfor the entire duration of the Revised Convention de Base remains in force;Mining Convention;
•SAG’s operations remain governed by the 1995 Guinea Mining Code (the prior mining code) and are only subject to the provisions of the Guinea Mining Code to the extent they are expressly set out in the Revised Convention de Base;Mining Convention;
•the stability of the customs and tax regime is guaranteed for the entire initial term of the Revised Mining Convention, de Base, and subject to certain conditions being met, any renewal period(s);
•the Republic of Guinea holds a 15 percent free-carried/non-contributory interest;
•the Republic of Guinea is entitled to a royalty on gold of 5five percent based on a spot gold price as per LBMA fixing (PM) up until the date of steady state commercial production of the first phase of the Expansion, after which the royalty rate applicable to gold will vary depending on threshold prices as per LBMA fixing (PM), namely: 3three percent if the gold price is USD 1,300$1,300 or less, 5five percent, if above USD 1,300$1,300 and up to USD 2,000$2,000 and 7seven percent if above USD 2,000;$2,000;
•SAG benefits from 5-year income tax holiday from the beginning of steady state commercial production of the first phase of the Expansion, after which the income tax rate is set at 30 percent;
•a local development tax of 0.4 percent is payable on the sale price for gold and silver received by SAG up until 31 December 2027, after which it will be increased to 0.6 percent;
•salaries of expatriate employees are subject to a 10ten percent income tax;
•goods imported into Guinea for purposes related to the construction and commissioning of the first phase of the Expansion are exempt from all customs taxes and duties; and
•SAG is committed to adopting and progressively implementing a plan for the effective rehabilitation of the mining areas disturbed or affected by its operations.
The Mining Concession covers an area divided into four blocks totalingtotalling approximately 1,495 km2. SAG has the exclusive right to explore and mine in any part of the concession area for the duration of the Revised Convention de Base.Mining Convention. The Revised Mining Convention de Base also grants SAG the option to secure certain land rights over additional areas currently covered by exploration permits, but to which SAG may need access for purposes of establishing roads or storage of tailings. While the Mining Concession expired on 4 August 2022, a renewal request had been filed prior to its expiry in accordance with the provisions of the Revised Mining Convention on 1 February 2022. Pursuant to the Revised Mining Convention, the Mining Concession can be renewed for one or more period(s) that cannot exceed ten years each as long as the Revised Mining Convention is in force.
The Revised Mining Convention de Base is subject to early termination if the parties formally and expressly agree to it, if the last of the mining title held by SAG expires or is relinquished without any renewal application having been filed, if all project activities are voluntarily suspended for a continuous period of 12 months or are permanently abandoned by SAG, or if SAG goes into voluntary liquidation or is placed into liquidation by a court of competent jurisdiction.
60
Mali
General laws relating to mining
The mining industry in Mali is primarily regulated by Ordinance No. 2019-022/P-RM dated 27 September 2019 containing the new mining code of the Republic of Mali (2019 Mali(the “Mali Mining Code)Code”) and Decree No. 2020-0177/PT-RM dated 12 November 2020 implementing the 2019 Mali Mining Code. On 8 December 2020, Decree No. 2020-0288/PM-RM enacted the new model mining convention referred to in Decree No. 2020-0177/PT-RM.
The 2019 Mali Mining Code applies to the mining operations previously carried out by AngloGold Ashanti entities in Mali (as further described below) except with respect to the validity, scope and duration of their exploitation permits and the provisions on tax and customs regime contained in their mining conventions (conventions d’établissement) for their remaining duration. In this regard, the transitory rules of the 2019 Mali Mining Code specify that mining conventions in force remain valid for their remaining term and their holders continue to benefit from the stability of the tax and customs regime set out therein.
Exploration and prospecting activities are carried out under exploration authorisations (autorisation d’exploration)(autorisation d’exploration) or exploration permits (permis(permis de recherche). Exploration authorisations and exploration permitsrecherche), which give their holder the exclusive right to carry out exploration activities over a given area. Exploration authorisations are granted by the Mining Administration (Administration chargée des Mines) for a non-renewable period of three months, while exploration permits are granted by Ministerial Order for a period of three years renewable twice for additional 3-year periods. Applications for exploration authorisations and exploration permits must contain various documents attesting to the financial and technical capacity of the applicant as well as a detailed works and costs programme. Exploration authorisations are granted by the Mining Administration (Administration chargée des Mines) while exploration permits are granted by Ministerial Order.
A large scale permit exploitation permit (permis(permis d’exploitation de grande mine)mine) is required to mine a deposit located within the area of an exploration permit. The large scale exploitation permit and grants the holder an exclusive right to exploit the named substances and proceed with the processing and commercialisation of the substances extracted within its perimeter. Large scale exploitation permits are granted by decree of the Head of Government for a maximum period of 12 years renewable for 10ten year-periods until depletion of the deposits. The large scale exploitation permit is granted only to the holder of an exploration permit and covers only the area governed by the exploration permit. An application must be submitted to the Mining Administration (Administration(Administration chargée des Mines)Mines) and must contain various documents attesting to the financial and technical capacity of the applicant, a feasibility study, a detailed environmental study in respect of the impact of the project on the environment, an environmental permit, a closure and rehabilitation plan as well as a community development plan. The large scale exploitation permit is granted by decree of the Head of Government. As soon as the large scale exploitation permit is granted, the permit holder must incorporate a company under the laws of Mali. The permit holder willMali and assign the large scale exploitation permit for free to this company. The State will have a 10ten percent free-carried interest in the company. This interest will be converted into priority shares and the State’s participation will not be diluted in case of an increase in capital. In addition, the company is required to ensure that private Malian investors are offered the possibility to acquire 5five percent of their capital.
All mining titles mentioned above (save for the exploration authorisation) require an establishmenta mining convention (convention(convention d’établissement)tablissement) to be signed by the State and the titleholder defining their rights and obligations, the duration of which is 20 years.
AngloGold Ashanti’s rights and permits
Historically, AngloGold Ashanti had interests in the Morila, Sadiola and Yatela gold mines, all of which were governed by establishmentmining conventions (conventions d’établissement) covering exploration, mining, treatment and marketing in a comprehensive document. These documents include general provisions regarding exploration (work programme, fiscal and customs framework) and exploitation (formation of a local limited liability mining company, State interest, fiscal and customs framework governing construction and exploitation phases, exchange controls, marketing of the product, accounting regime, training programmes for local labour, protection of the environment, reclamation, safety, hygiene and dispute settlement).
In April 2017, Société d’Exploitation des Mines d’Or de Yatela S.A. (Yatela)(“Yatela”), the company operating the Yatela gold mine, began the implementation of a closure plan in order to relinquish the property. In February 2019, AngloGold Ashanti and its joint venture partner IAMGOLD Corporation announced an agreement to sell each of their 40%40 percent interests in Yatela to the Government of Mali, which holds the remaining 20%20 percent interest. TheCompletion of the transaction is subject to the fulfilment or waiver of a number of conditions precedent and AngloGold Ashanti remains committedhas been delayed several times since 2019 due to its completion despite recent political instability and related events in Mali which have delayed completion ofas well as the sale from the originally anticipated timeline.COVID-19 pandemic. Yatela’s exploitation permit covers approximately 212 km2. Yatela has a 30-year permit which expires in 2030.
Tanzania
General laws relating to mining
Tanzania Mining Act and Tanzania Mining Regulations
Mineral rights in the United Republic of Tanzania are principally governed by the Mining Act, 2010 (No. 14) (Tanzania Mining Act) as amended in 2017 by the Written Laws (Miscellaneous Amendments) Act, 2017 (No. 7) and which was revised and published by the Attorney General of Tanzania on 30 October 2018 as the Mining Act, Chapter 123 (R.E. 2018)2019), as amended (the “Tanzania Mining Act”) and the Mining Regulations, 2010 (Tanzania2018 (the “Tanzania Mining Regulations), as amended in 2018, which include: Mining (Mineral Beneficiation) Regulations, 2018 as amended in 2019; Mining (Minerals and Mineral Concentrates Trading) Regulations, 2018 as amended in 2019; Mining (Radioactive Minerals) Regulations, 2018; Mining (Local Content) Regulations, 2018 as amended in 2019; Mining (Geological Survey) Regulations, 2018; Mining (Audit and Inspection of Records) Regulations, 2018; and Mining (Designated Minerals Certification) Regulations, 2019. Other regulations are: Mining (Environmental Protection For Small Scale Mining) Regulations, 2010; Mining (Safety, Occupational Health and Environmental Protection) Regulations, 2010; Mining (Mineral and Gem Houses) Regulations, 2019; Mining (Mining Shareholding and Public Offering) Regulations, 2016 as amended in 2017; Mining (Diamond Trading) Regulation, 2019; Natural Wealth and Resources (Permanent Sovereignty) Code of Conduct for Investors in Natural Resources Regulations, 2020 (Permanent Sovereignty Regulations); andRegulations”). The Natural Wealth Contracts (Review and Re-Negotiation of Unconscionable Terms) Regulations, 2020. The application of the Code of Conduct under the Permanent Sovereignty Regulations extends to employees, agents, suppliers and consultants and requires them to comply with other binding instruments and decisions made based on such instruments, in addition to policies, laws and regulations. The Permanent Sovereignty Regulations make it mandatory to seek the advice of an office bearer or the office of Attorney General, if the requirements of the Code, provisions of the Mining Act or other instruments relating to natural wealth and resources become ambiguous, unclear or in conflict resulting into uncertainty. Further, the Code of Conduct requires investors to conduct periodic reviews in respect of their compliance with such legislation in order to prevent the occurrence of matters prohibited by the laws of Tanzania. The Code also requires every investor to sign and submit an integrity pledge.Tanzania
61
Mining Act and the Tanzania Mining Regulations came into force in November 2010 followed by amendments to the Tanzania Mining Act in 2017 and subsequent amendments to the Tanzania Mining Regulations in 2018 and 2019.
Minimum shareholding and public offering
was adopted. The regulations set out the requirement to sell shares to Tanzanian nationals, by way of a public offering and listing on the Dar es Salaam Stock Exchange, which will apply to companies that are carrying out large scale mining operations. The regulations also require all existing holders of a special mining licence to list a minimum of 30 percent of their shares on either the Main Investment Market or the Enterprise Growth Market Segment of the Dar es Salaam Stock Exchange within 6six months of the regulations coming into force, which was on 24 February 2017. However, the companyCompany believes the listing requirement conflicts with the mining development agreement.
In September 2020, the Government of Tanzania published the Mining (Minimum Shareholding and Public Offering) (Amendment) Regulations, 2020, by means of Government Notice No. 181, which exempts companies holding special mining licences from local listing requirements if such mining company has entered into an agreement with the Government of Tanzania that provides for a non-dilutable free-carried interest in such mining company and an economic benefits sharing arrangement.
Arbitration
Along with other major mining companies, AngloGold Ashanti’s subsidiaries are seeking a constructive dialogue with the Government of Tanzania to gain assurances that the Geita gold mine will not be affected by therecent legal and fiscal changes mentioned above, givenadopted by the Government in light of their mining development agreements which guarantee (i) fiscal and regulatory stability, as well asand (ii) an agreement between all parties before material legal and regulatory changes are made. As a precautionary step to safeguard its interests, AngloGold Ashanti commenced international arbitration proceedings against the Government of Tanzania in connection with the enactment of this legislation in July 2017. These arbitral proceedings were stayed until 12 March 2021 in order to afford the parties the opportunity to achieve an amicable resolution of the dispute and as a result of the impact of the COVID-19 pandemic. On 15 March 2021, and due to continuing COVID-19 issues in sub-Saharan Africa, we requested a further extension to stay the proceedings. This requestDeclaratory relief is pending with the arbitral tribunal.
Categories of mineral right licences
Ownership of and control over minerals on, in or under the land vest in the President of the United Republic of Tanzania. No person is allowed to prospect for minerals or carry on mining operations except pursuant to the authority of a mineral right licence granted, or deemed to have been granted, under the Tanzania Mining Act or its predecessor acts. To enable a company to prospect or mine, the Tanzania Ministry of Minerals (MEM)Mining Commission (“MC”) initially grants an exclusive prospecting licence. Upon presentation of a feasibility study, together with certain other environmental, social and financial assurances, the MEMMC may then grant a form of licence for mining. Licensing decisions take into account the abilities of the company (including its mining, financial and technical capabilities), projected rehabilitation programmes, environmental compliance and the payment of royalties.
Three categories of licences can be applied for under the Tanzania Mining Act: licences for exploration, licences for mining, and licences for ancillary activities. Licences for exploration include prospecting licences and gemstone prospecting licences. Licences for mining include special mining licences (if the proposed capital investment is equal to at least USD 100$100 million), mining licences (if the proposed capital investment is equal to between USD 100,000$100,000 and USD 100$100 million) and primary mining licences (reserved for Tanzanian citizens). Licences for ancillary activities include processing licences, smelting licences and refining licences. For purposes of AngloGold Ashanti’s Geita gold mine, only prospecting and special mining licences are relevant.
A prospecting licence grants the holder the exclusive right to prospect in the area covered by the licence for all minerals within the class of minerals applied for. The classes that can be applied for include, amongst others, metallic minerals, energy minerals, gemstones other than kimberlitic diamonds and kimberlitic diamonds. Holder of prospecting licences have the obligations to: (i) commence prospecting operations within three months or such further period as the Mining Commission may allow from the date of the grant of the licence or the date as stated in the licence as commencement date; (ii) give notice to the Mining Commission on discovery of any mineral deposit of potential commercial value; and (iii) adhere to the prospecting programme which is attached to the licence and expend on prospecting operations not less than the amount prescribed.
An application for a prospecting licence is made to the Mining Commission and the licence, once granted, is valid for an initial term of four years. After the initial term, the licence is renewable for a further period of three years, with no option for renewal thereafter. Upon renewal, 50 percent of the area covered by the licence must be relinquished. A company applying for a prospecting licence must, amongst other things, state the financial and technical resources available to it. A prospecting licence is not freely transferable and requires the Mining Commission to register any transfer of a prospecting licence. The Mining Commission will refuse to register the transfer unless the transferee proves that it meets the financial and technical capability criteria required to apply for such licences. Holders of prospecting licences over a tenement will not automatically have first right to any mining licence granted over that tenement. However, in practice, they will be best positioned to meet the requirements to be granted a form of licence for mining.
Mining is mainly carried out through either a mining licence or a special mining licence, both of which confer on the holder the exclusive right to conduct mining operations in or on the area covered by the licence. A special mining licence is granted for the shorter of either the estimated life of the ore body indicated in the feasibility study report or such period as the applicant may request. It is renewableThe holder of a special mining licence may apply for renewal of its licence at any time but no later than one year before the expiry of the licence and such renewal shall not be for a further period not exceeding the estimatedestimate life of the remaining ore body. Special
62
mining licences have certain fiscal and other advantages over mining licences, as the holder of a special mining licence may enter into a mining development agreement with the Government of Tanzania to guarantee the fiscal stability of a long-term mining project and make special provision for the payment of royalties, taxes, fees and other fiscal imposts. A special mining licence holder may, in certain circumstances, unilaterally amend the programme of the mining operations agreed with the MEM.
Tax laws relating to mining
Effective 20 July 2017, the Value Added Tax Act, 2014 (No. 5) (VAT Act)(the “VAT Act”) was amended by the Written Laws (Miscellaneous Amendments) Act, 2017 (No. 7) in order to restrict VAT relief for VAT input tax paid by mining companies on goods and services. Prior to the enactment of this amendment to the VAT Act, mining companies were entitled to 100%100 percent VAT relief in respect of the goods and services they purchased. The amendment prohibits refunds for VAT input tax incurred on a series of raw products, including the exportation of “raw minerals”. Subsequently, the Tanzania Revenue Authority (TRA)(“TRA”) denied our applications for VAT input credit refunds, which amounted to a total of $139$153 million (after discounting provisions) as of 31 December 2020,2022, covering the period from July 2017 onwards, on the basis that all of the gold doré that we export constitutes “raw minerals” for purposes of the VAT Act. In response, the company filed formal notices of objection with the TRA stating that the exportation of gold doré is, in its view, not covered by the restriction since doré does not fall within the category of “raw minerals” as used in the VAT Act. On 22 February 2019, the Tanzania Mining Act was amended by the Written Laws (Miscellaneous Amendments) Act, 2019 (No. 2) to introduce a definition for “raw minerals” which supports our interpretation that gold doré is excluded from the prohibition. On 1 July 2020, the Finance Act, 2020 (No. 8), amended the VAT Act, without retrospective effect, in order to remove the restrictions on VAT input tax credits for the exportation of “raw minerals” as well as a series of other raw products. This recent amendment confirms the technical basis for VAT input tax recovery for mineral exporters from July 2020 onwards. VAT claims from July 2020 onwards are subject to verification procedures by the TRA before any refunds will be received. In 2022, the company was able to offset $45 million of verified VAT claims (from July 2020 onwards) against its corporate tax liability in Tanzania. Discussions with the TRA are ongoing to resolve our historical claims for VAT input credit refunds for the period from July 2017 to June 2020, while VAT claims from July 2020 onwards are subject to verification procedures by the TRA before any refunds will be received.2020.
Natural resources legislation
The Natural Resources lawsLaws provide that Tanzania has sovereignty over its natural resources and require that all arrangements or agreements that relate to “natural wealth and resources” are subject to review by the National Assembly. Such agreements must fully secureAssembly to ensure that they are in the interests of the people of Tanzania. During a review all unconscionable terms as interpreted in accordance with the law are expunged from the agreement. The laws also require that new natural resources agreements are reviewed by the Government. The natural wealth and resources of Tanzania shall be inalienable and remain as the property of the people of Tanzania held in trust by the President.
In addition, under the laws, disputes over natural wealth and resources will not be subject to any proceedings in any foreign court or tribunal. As a result, investors are restricted from accessing international dispute resolution mechanisms. Accordingly, companies are now required to adopt Tanzanian law and local dispute resolution in all mining agreements. As such, all disputes will be handles by Tanzanian judicial bodies or any other Tanzania government body vested with powers to resolve disputes.
Section 6 of the Unconscionable Terms Act specifically provides that where there is an unconscionable term, the National Assembly may pass a resolution for re-negotiation of the agreement whereupon the Government shall serve notice to the investor to re-negotiate the term or agreement. The Government and the particular investor have 90 days from the notice date to re-negotiate the term or agreement. This period can be extended if both parties consent. If both parties fail to revise the unconscionable term, the term will be deemed removed from the agreement.
A term is considered “unconscionable” under the Unconscionable Terms Act if, among other grounds, the requirements or provisions of the agreement restrict the right of the state to exercise authority over foreign investment within the country and in accordance with the laws of Tanzania, are inequitable and onerous to the state, secure preferential treatment designed to create a separate legal regime to be applied discriminatorily for the benefit of a particular investor, deprive the people of Tanzania of the economic benefits derived from subjecting natural wealth and resources to beneficiation in the country, or subject the state to the jurisdiction of foreign laws and foreign courts or tribunals.
63
On 23 September 2022, the Mining (State Participation) Regulations, 2022 (the “SPR 2022”) came into force. The SPR 2022 required every mining licence or special mining licence holder to give notice to the MC to initiate negotiations to enable the Government of Tanzania to acquire a shareholding in the mining operation by 23 December 2022. On 9 December 2022, the company notified the MC that it had already initiated negotiations with the Government of Tanzania prior to the coming into force of the Tanzania Shipping Agencies Act, 2017 (No. 14), which include minerals, mineral concentratesSPR 2022. The Government’s equity interest must consist of a non-dilutable free-carried interest in the mining operation ranging between 16 percent and products50 percent depending, in part, on the quantification of tax expenditures enjoyed by the mining entity during its establishment and extracts relatedon the extent of Government development of public infrastructure servicing the mining operation. The free-carried interest shares (the “FCI shares”) will be regarded as preferred shares and will entitle the Government to minerals, shall exclusively be handled by TASAC. Concerned abouta dividend. Further, the impact on their operations,FCI shares give the Government the right to appoint two directors (out of five) of the company engaged in the mining companies as well as other interested parties lodged an appealoperation and the right to approve at least two suitable persons to the Minister of Transportation. As a result, the effective datetop executive management of the notice was delayedcompany engaged in the mining operation as may be agreed in the shareholders agreement. Any other management positions created by the company engaged in the mining operation shall be shared with the Government on a ratio of 3:1. The SPR 2022 also provides for the non-deductibility of royalty payments in the calculation of corporate income tax.
Local participation policy
On 15 September 2015, the Non-Citizens (Employment Regulation) Act, 2015 (No. 1) (the “Non-Citizens Act”) came into force which vests powers concerning work permits with the Labour Commissioner. Therefore, non-citizens wishing to be employed in the country are required to apply and be granted a work permit before applying for a residence permit. Before granting the work permit, the Labour Commissioner must be satisfied that all efforts have been explored to acquire a local expert. Further, the company is required to submit a succession plan to both the Labour Commissioner and the impositionMC which sets out a well-articulated plan for the transfer of prescribed fees was suspended, while TASAC continuedthe non-citizen’s knowledge and expertise to provide servicesTanzanian citizens. Moreover, the Commissioner General of Immigration is required to its clients. take into consideration conditions of the work permit issued by the Labour Commissioner when granting a residence permit.
The Tanzania Investment Act No. 10 of 2022
On 5 February 2021,2 December 2022, the Tanzania Investment Act, 2022 (No. 10) (the “Investment Act”) came into force. The Investment Act restores the right to international arbitration and grants foreign investors access to settle disputes with the Tanzania Investment Centre or the Government publishedof Tanzania through arbitration. Pursuant to the Tanzania Shipping Agencies (Shipping Business Fees, Charges and Commission) Order inInvestment Act, parties to a dispute may agree to the Government Gazette through Government Notice No. 181use of 2021, which reduced the prescribed fees and eliminates certain other charges for the clearing and forwarding services provided by TASAC, including in connection with the handling of the company’s export of gold bullion and import of certain goods.a local or foreign arbitration venue.
AngloGold Ashanti’s rights and permits
The Geita gold mine is located in the Lake Victoria goldfields of the Mwanza region of Tanzania. AngloGold Ashanti has concluded a mining development agreement with the Ministry of Minerals on 24 June 1999 and was issued a special mining licence (SML45/99) covering approximately 196 km2 for a period of 25 years, which expires on 26 August 2024.
The internal renewal process for the special mining licence (SML45/99) is underway with a view to submitting an application for renewal prior to its expiry date. On 9 October 2014, an addendum to the mining development agreement was entered into ratifying, the following changes:
2012. In March 2020, Geita Gold Mining Limited received the consent of the Minister of Minerals to change the mining method under its special mining licenselicence from open pit to underground method, subject to the requisite terms and conditions. Within the special mining licence area, there are also seven primary mining licences of approximately 0.63 km2 in total which belong to third parties. Furthermore, AngloGold Ashanti holds prospecting licences covering (i) an area of 120 km2 in the immediate vicinity of its special mining licence area, and (ii) an area of 690 km2 located in the Dodoma, Singida and Shinyanga regions, but none of these areas contain any Mineral Reserve. All licences are in good standing.
AUSTRALIA
General laws relating to mining
In Australia, with a few exceptions, all onshore minerals are owned by the Crown. The respective Minister for each state and territory is responsible for administering the relevant mining legislation enacted by the states and territories.
Native title legislation applies to certain mining tenements within Australia. Australia recognises and protects a form of native title that reflects the entitlement of Aboriginal people to their traditional lands in accordance with their traditional custom and laws. Should native title claims or determinations exist, certain native title processes and procedures will apply under the Native Title Act 1993 (Cth) (Native(the “Native Title Act)Act”) before the tenure is granted. Tenure may be granted subject to conditions relating to native title rights. In the mining context, native title matters are managed as part of the tenement grant process. If disputes arise in relation to the grant of a particular tenement, they can be referred to the National Native Title Tribunal, established under the Native Title Act, for resolution. Native title legislation also provides a framework for compensation to be paid for acts that affect native title rights and interests. Ordinarily, the relevant Commonwealth or State government is liable to pay compensation for acts attributable to it. However, in the state of Western Australia, the Mining Act 1978 (WA) provides that an applicant for the grant of, or the holder of, a mining tenement is responsible for native title compensation, if determined to be payable, to native title holders.
64
Federal, state and territory Aboriginal and non-Aboriginal heritage laws operate in parallel to the native title legislation. State and territory heritage laws exist predominantly for the purposes of managing the impact of developments on sites, objects and areas of heritage significance. In Western Australia, impacts to Aboriginal cultural heritage are regulated by the Aboriginal Heritage Act 1972 (WA). However, this legislation will be repealed and replaced by the Aboriginal Cultural Heritage Act 2021 (WA) (the “ACH Act”) which was enacted in 2021. The regulations, management code and various guidelines which underpin the ACH Act are being co-designed by the State government, traditional owners, industry and other stakeholders. The ACH Act will not become fully operational until the co-design process is complete in mid-2023 at the earliest. Where an area of heritage significance is placed on the national or world heritage registers, federal approval processes may also apply. To date, there has not been any significant impact on any of AngloGold Ashanti’s tenure due to native title or heritage legislation.legislation and, at this stage, it is not possible to predict any significant impact that may result in the future from the final regulations, management code and various guidelines under the ACH Act, once adopted.
AngloGold Ashanti’s operating properties are located in the state of Western Australia where tenure is issued under, and mining operations are governed by, the Mining Act 1978 (WA). The most common forms of tenure in Western Australia are exploration and prospecting licences, mining leases, miscellaneous licences and general purpose leases. In most Australian states, if the holder of an exploration licence establishes indications of an economic mineral deposit in the area covered by the exploration licence and complies with the conditions of the grant, the holder of the exploration licence has a priority right against all others to be granted a mining lease which gives the holder exclusive mining rights with respect to minerals on the property. In Western Australia, a general purpose lease may also be granted for one or more of a number of permitted purposes. These purposes include erecting, placing and operating machinery and plants in connection with mining operations, depositing or treating minerals or tailings and using the land for any other specified purpose directly connected with mining operations.
It is possible for an individual or entity to own an area of land (including for infrastructure purposes) and for another individual or entity to be granted the right to explore for or mine any minerals located on or under the surface of the same area. The maximum initial term of a mining lease in Western Australia is 21 years and the holder has the right to renew the lease for an additional 21
years. Subsequent renewals are granted at the discretion of the respective state or territory’s minister responsible for mining rights. In Western Australia, mining leases can only be assigned with the prior written consent of the minister.
Tax laws relating to mining
Government royalties are payable by the holder of mining tenure in respect of minerals obtained from the relevant area of land at the rates specified in the relevant legislation in each state or territory. The royalty on gold production in Western Australia is payable quarterly at a fixed rate of 2.5 percent of the royalty value of gold metal produced. The royalty value is calculated by multiplying the amount of gold produced during a given month by the average gold spot price for that month. In addition, the holder of a mining tenement is required to pay annual rent in respect of the tenement. In Western Australia there is a minimum annual expenditure requirement for prospecting and exploration licences and mining leases. Exemptions from the expenditure requirement can be obtained if certain conditions are satisfied.
Environmental laws relating to mining
Mining tenements will be granted with endorsements and conditions relating to protection of the environment. Exploration and mining operations may also require separate approval from the state, territory or federal environment minister, which may require completion of an environmental impact assessment (including a public consultation period) pursuant to applicable environmental protection legislation prior to commencement. Further, a works 'construction' approval and an operating licence under the relevant environmental protection legislation in the state or territory may also be required for certain mine processing or mining-related operations. In Western Australia, legislation removing the distinction between “works approvals” and “licenses” is expected to enter into force in December 2023 such that, following the effective date, only a “license” will be required for “prescribed activities”, which include relevant works and operations on a mining lease, and not a separate “works approval”. Depending on the jurisdiction, further separate approvaladditional approvals may be required for the removal of native vegetation within the tenement, and the taking and use of water for exploration and mining operations.
AngloGold Ashanti’s rights and permits
AngloGold Ashanti has been granted 21-year term mining leases with rights of renewal to all of its mining areas in Australia, including its proportionate share of joint venture operations and accordingly it has, together with its joint venture partners where applicable, the exclusive right to mine in those areas. Both the groupGroup and its joint venture partners are fully authorised to conduct operations in accordance with relevant laws and regulations. The mining leases and rights of renewal cover the current life-of-mine at AngloGold Ashanti’s operations in Australia.
At Sunrise Dam, one mining lease (M39/1116) covers the deposit is now situated upon two mining leases covering approximatelyand mine infrastructure (approximately 7,808 hectareshectares) and another mining lease of(M39/1117) covers the water extraction infrastructure used to supply the operation with water (approximately 1,768 hectares contains related infrastructure.hectares). Both leases are currently in good standing, with expiry dates in 2038.
The Butcher Well joint venture has security of tenure for all current exploration licences and for the contiguous mining leases that covers its Mineral Resource. There are three mining leases: mining lease (M39/165) which covers 602.35 hectares with expiry date in 2030, mining lease (M39/166) which covers 990 hectares with expiry date in 2030 and mining lease (M39/230) which covers 446.4 hectares with expiry date in 2032.
65
At Tropicana, the deposit is situated upon a single mining lease (M39/1096) covering approximately 27,228 hectares, which is currently in good standing, with an expiry date in 2036.
AngloGold Ashanti Australia Limited is also conducting early stage exploration activities in Queensland under the Mineral Resources Act 1989 (QLD). AngloGold Ashanti holds 1315 exploration permits covering 358,700316,851 hectares. Each permit is granted with an initial term of five years, renewable for two further periods of not more than five years each.
AMERICAS
Argentina
General laws relating to mining and land ownership
Mining regime
The Argentinean Mining Code governs mining activity in the country. Special regimes exist for hydrocarbons and nuclear minerals. In the case of most minerals, the Argentinean Mining Code establishes that the owner of the land is not the owner of the mineral rights; these are held by the national or provincial governments (depending on the location of the minerals). The national or provincial government, as applicable, is required by the Argentinean Mining Code to grant whomever discovers a new mine title to the mining concession.
The Argentinean Mining Code regulates exploration permits andas well as mining concessions.concessions, or exploitation rights. Exploration permits grant their holders exclusivity rights to any mineral discoveries, including those made by a third party within the exploration area covered by the permit. Exploration permits are limited in time and as to the extent of the exploration area, are subject to the payment of a single-time fee, and also require a minimum exploration work programme and schedule to keep the permit in force.
Argentinean Mining Code. Approval and registration of the legal survey by the provincial mining authority constitutes formal title to the mining concession.
Holders of mining concessions must comply with three main conditions: payment of an annual fee, investment of a minimum amount of capital, and the carrying out of a reasonable level of exploitation. Failure to do so could lead to forfeiture of the mining concession, which would then revert back to the Province.
In addition to the Argentinean Mining Code, between 1993 and 1995, Argentina implemented several federal laws to offer foreign companies attractive incentives for exploration and mining in Argentina, the Mining Investment Law (Law No. 24, 196), as amended (Mining(the “Mining Investment Law)Law”), and related legal provisions being the most important one. Such incentives include, amongst others,among other matters, import duty exemptions, accelerated depreciation of fixed assets, a three percent cap on provincial royalties set at pit-head value on the mineral extracted, value added tax refunds for exploration-related expenses incurred by companies registered under the Mining Investment Law, and, subject to the filing of a feasibility study for the relevant mining project, a 30-year stability as to the tax burden on the project and the customs and foreign exchange regimes and duties. Cerro Vanguardia S.A. (CVSA)(“CVSA”) obtained its tax, customs and foreign exchange stability certificate in 1996.
Glacier Law
On 30 September 2010, the National Law on Minimum Requirements for the Protection of Glaciers (Law No. 26, 639) (Glacier Law)(the “Glacier Law”) was enacted in Argentina, banning new mining exploration and exploitation activities on glaciers and “peri-glacial” areas. The Glacier Law also subjects on-going mining activities in those areas to an environmental audit. If such audit results in material impacts on glaciers and “peri-glacial” areas, the relevant authority is empowered to take action, including suspension or relocation of the activity. The Glacier Law establishes a broad definition of “peri-glacial” areas that, together with glacial areas, must be surveyed by an existing national government agency specifically appointed to this end every five years. The area where the Cerro Vanguardia project is located does not include any glaciers or peri-glacial areas according to the inventory of glaciers which was published in June 2018. The constitutionality of the Glacier Law has been challenged by some mining companies along with the Province of San Juan (which hosts large mining projects), but the National Supreme Court of Justice of Argentina rejected these claims on 4 June 2019.
Rural Land Law
On 27 December 2011, the Argentinean National Congress passed a law on the Regime for Protection of National Domain over Ownership, Possession or Tenure of Rural Land (Law No. 26, 737) (Rural(the “Rural Land Law)Law”) which implemented a set of rules restricting the ownership of rural land by foreigners (including foreign individuals or any kind of legal entity controlled by foreign individuals or legal entities). The main restrictions are as follows: (i) foreigners cannot own in the aggregate more than 15 percent of the entire rural land of Argentina, the same cap being applicable to each Province and Municipality; (ii) foreigners will not be allowed to purchase more than 1,000 hectares in the so-called “zona núcleo”, which comprises the main agricultural areas of central Argentina or an “equivalent” surface depending on the location of the land and its productive potential; and (iii) foreigners will not be allowed to buy land that contains, or is adjacent to, relevant and permanent water bodies (such as rivers and lakes). Although exploration permits and mining concessions are not the subject matter of the restrictions placed by the Rural Land Law, certain rights granted to foreign mining companies under the Argentinean Mining Code may be restricted by this
66
new law. For example, the right that holders of mining concessions currently have to force the surface owner to sell the land to the holder of the mining concession might be restricted if the concession holder is a foreign individual or a legal entity controlled by foreigners.
Federal Mining Agreement
On 13 June 2017, the national government and the provinces in whose territories the main mining projects of Argentina are located, signed the New Federal Mining Agreement (FMA)(“FMA”). The purpose of the FMA is, amongst other things, to increase provincial revenues from the mining industry by creating legal entities owned by provincial governments that would work in association with private mining companies. This scheme is not new in Argentina and it has been used by some provincial governments, amongst them the Santa Cruz Province (through Fomicruz), in which the Cerro Vanguardia project is located. The FMA also contemplates other forms of revenues such as the formation of special trusts to be funded by mining companies in order to finance education, health and other programmes. Additionally, the FMA included setting forth mining royalties up to three percent of the gross value of commercialised minerals, without any deductions other than VAT. As the FMA has not yet been converted into law by the National Congress, its provisions are neither binding nor enforceable.
In Argentina, the current regulatory regime of royalty payments is expected to change and several different options and payment thresholds have been discussed. In December 2012, the Santa Cruz Province changed the mining royalty from one percent to three percent calculated at pit-head value of the mineral extracted thus bringing it to the cap of the Mining Investment Law.
Foreign exchange control regimeand export rules
Foreign exchange controls
On 1 September 2019, by means of Executive Decree No. 609/2019 (Decree)(the “Export Controls Decree”), the Argentinean national government reinstated foreign exchange and export controls. The Export Controls Decree and related regulations of the Central Bank of Argentina impose, among other
measures, the obligation of Argentinean residents to transfer to Argentina and/or sell for Argentinean pesos in the Argentinean foreign exchange market (mercado(mercado de cambios)cambios) the countervalue (contravalor)(contravalor) from their exports of goods within a specified time period. This period depends on the goods exported and the relationship between the Argentinean exporter and the foreign importer and ranges from 15 to 365 calendar days counted as of the date on which the Argentinean customs authorities certify the shipment to the export destination. Regardless of the applicable maximum term, the proceeds from the export must be transferred and sold in the Argentinean foreign exchange market no later than five business days from the date of collection.
The export of goods is regulated by Communication “A” 6882 ofthe Consolidated Text on “Foreign Trade and Exchange” issued by the Argentinean Central Bank (as modified)amended from time to time) which establishes the specific regulatory requirements in order to implement the measures adopted by the national government in this area. In accordance with these Central Bank regulations, the exporter shall select a financial institution to track each export transaction through the SECOEXPO (Seguimiento de las negociaciones de divisas por exportaciones de bienes) tracking system which is administered by the Argentinean Central Bank. The selected financial institution must determine the amount and deadline to settle the export proceeds and shall register the amounts allocated to each export transaction in the tracking system. Upon the expiration of the applicable term to transfer and sell the export proceeds, the designated financial institution must inform the Argentinean Central Bank, through the SECOEXPO tracking system, if the exporter has complied with its obligations or not.
In October 2022, the Argentinean national government implemented the Argentinean System of Imports (Sistema de Importaciones de la República Argentina) (“SIRA”) and the amountArgentinean System of “liquid external assets” available atImports and Foreign Payments of Services (Sistema de Importaciones de la República Argentina y Pagos de Servicios al Exterior). Importers must obtain a SIRA approval in the beginningform of a SIRA certificate for the day in whichimport of goods and to access to the foreign exchange market is effected is lower than the equivalent of $100,000. “Liquid external assets” include, among others: holdings of foreign currency bills and coins, coined or good delivery gold, demand deposits in foreign financial institutions and other investments which allow for immediate liquidity in foreign currency (such as investments in foreign government securities, funds in investment accounts held abroad, crypto-assets, funds in payment service providers, etc.). Reserve or guarantee funds created under financing transactions or derivatives transactions entered into abroad are not considered liquid external assets. There are also certain circumstances in which the $100,000 limit will not be considered to have been exceeded. Furthermore, the Argentinean Central Bank is not required to give prior approval when a commitment is given to settle through the foreign exchange market, within five business days of their availability, any funds received abroad as collection of (i) loans granted to third parties, (ii) term deposits, or (iii) the sale of any kind of asset, when each of such had been granted, created or purchased after 28 May 2020. In addition, no prior approval is required when the client files an affidavit stating that: (i) as of the date on which access to the foreign exchange market is requested it has not sold securities against foreign currency in Argentina or transferred such securities to depository entities abroad in the past 90 calendar days, and (ii) undertakes not to arrange sales of securities against foreign currency in Argentina or transfers thereof to depository entities abroad from the moment it requires access and for the subsequent 90 calendar days.
CVSA had a cash balance of $137equivalent to $116 million equivalent as at 31 December 2020, of which $50 million2022. The cash balance is currently eligibleavailable to be paid to AngloGold Ashanti’s offshore ($105 million (equivalent)) and onshore ($15 million (equivalent)) investment holding companies in the form of declared as dividends. Application hasApplications have been made to the Argentinean Central Bank to approve $11 millionthe purchase of this eligible amountU.S. dollars in order to be paiddistribute offshore dividends related to the company, however, approval2019, 2020 and 2021 financial years of $105 million (equivalent) to AngloGold Ashanti. Also, under a special regime established for dividend payments, a new petition to distribute a portion of the offshore dividends applied for, in the amount of $54 million (equivalent), was submitted to the Argentinean Central Bank during the third quarter of 2022. In December 2022, the Argentinean Central Bank approved, based on the applications submitted under this special regime, the payment of $17 million (equivalent) to AngloGold Ashanti. As a result, during 2022, AngloGold Ashanti received offshore dividends from CVSA in a total amount of $17 million (net of withholding taxes) paid in U.S. dollars. While the remaining approvals are pending, the cash remains pending. The cash is fully available for CVSA’s operational and exploration requirements.
Export duties
On 21 December 2019, the National Law on Social Solidarity and Productive Reactivation (Law No. 27, 541) (Solidarity Law)(the “Solidarity Law”) was enacted. The Solidarity Law grantsgranted the national government power until 31 December 2021 to impose export duties which may not exceed certain caps. For example, the Solidarity Law provides that export duties on mining exports cannot exceed eight percent of the taxable value or official FOB price. On 2 October 2020, the national government published Decree No. 785/2020
67
On 26 February 2019, the Argentinean tax and mining authorities published a resolution (RC 4428/2019) establishing an administrative procedure to be followed in order to obtain the reimbursement or compensation of federal taxes paid in excess of the total tax burden provided for by the applicable tax stability guarantee.guarantee (the “2019 Procedure”). CVSA initiated this new procedure in orderthe 2019 Procedure to claim compensation for the export duties it paid in 2018, 2019 and 20192020 as export duties are not contemplated by its tax stability guarantee. Prior to the publication of RC 4428/2019, CVSA had already submitted to the tax authorities claims for reimbursement of the export duties it paid from 2008 to 2015.
Pursuant to the new administrative procedure,2019 Procedure, the National Mining Secretariat issued a favorable opinionopinions regarding CVSA’s claimclaims in respect of fiscal yearyears 2018 and 2019, which amounted to approximately $4.0$2.0 million and $6.3 million, respectively, as of 31 December 2020. This claim is2022. These claims are currently under review by the relevant customs authorities. On 14 July 2021, CVSA submitted its claim in respect of fiscal year 2020, which amounted to approximately $12.4 million as of 31 December 2022. The National Mining SecretariatSecretary has not yet issued an opinion in respect of CVSA’s claim in respect of fiscal year 2019, which amounted to approximately $12.3 million as of 31 December 2020.regarding this claim.
Furthermore, CVSA has requested the tax authorities to apply the procedure provided for in RC 4428/2019 Procedure in respect of its historical claims for fiscal years 2008 to 2015 during which the imposition of export duties also exceeded CVSA’s total tax burden under its tax stability guarantee. However, these claims, which amounted to approximately $6.1$3.1 million as of 31 December 2020,2022, are still being reviewed under the rules to challenge export duties instead of the new procedure provided for in RC 4428/2019.2019 Procedure. CVSA has appealed the application of those rules and a decision on this issue is pending.
On 9 June 2022, the Argentinean tax and mining authorities published a resolution (RC 5205/2022) establishing a new administrative procedure to be followed to obtain the reimbursement or compensation of federal taxes paid in excess of the total tax burden provided for by the applicable tax stability guarantee (the “2022 Procedure”). This 2022 Procedure replaces the 2019 Procedure established by RC 4428/2019. On 20 September 2022, CVSA submitted its claim for compensation for the export duties in respect of fiscal year 2021, which amounted to approximately $11.2 million as of 31 December 2022, pursuant to the 2022 Procedure. This claim is currently under review by the National Mining Secretary.
In total, AngloGold Ashanti’s net export duty receivables (after discounting provisions) in Argentina amounted to $9 million as of 31 December 2022.
Environmental laws relating to mining
Any mining company wishing to commence or modify any mining-related activity, as defined by the Argentinean Mining Code, including prospecting, exploration, exploitation, development, preparation, extraction, and storage of mineral substances, as well as property abandonment or mine closure activity, is required to prepare and submit to the competent provincial environmental authority an Environmental Impact Assessment (EIA)(“EIA”) prior to commencing the work. Each EIA is required to describe the nature of the proposed work, its potential risk to the environment, and the measures that will be taken to mitigate that risk. If accepted by the competent authority, the EIA is used as the basis to create a Declaration of Environmental Impact (DEI)(“DEI”) to which the mining company is required to adhere during the mining-related activity at issue. The DEI is required to be updated at least on a biannual basis. Sanctions and penalties for non-compliance with the DEI are outlined in the Environmental Protection section of the Argentinean Mining Code, and may include warnings, fines, suspension of quality certifications, restoration ofobligations to restore the environment, temporary or permanent closure of activities, and withdrawal of authorisation to conduct mining-related activities.
AngloGold Ashanti’s rights and permits
Brazil
General laws relating to mining and land ownership
The Brazilian Constitution of 1934 states that, for purposes of exploration and exploitation, deposits and other Mineral Resources constitute property separate from the soil and belong to the Federal Union. Exploration and exploitation of such Mineral Resources may take place only with the Federal Union’s concession and in such a way as to protect the national interest. Federal law sets out penal and administrative sanctions for conduct and activities deemed harmful to the environment.
In Brazil, the National Mining Agency (ANM)(“ANM”) is the state body within the Mines and Energy Ministry (MME)(“MME”) that is responsible for: (i) the registration of mining titles, (ii) the grant of authorisations and concessions, (iii) the supervision of mining activities and mining titleholders, and (iv) the issuance of supplementary rules in relation to mining activity.
68
Under the current Brazilian Mining Code, there are two kinds of mines: (i) claimstake mines (minas manifestadas)(minas manifestadas), for which rights were acquired before 1934 and exist independently of any mining licence or authorisation from the Federal Government and for which the Mineral Resources constitute property of the landowner, and (ii) granted mines, which are those that rely on grants from the Federal Government for mineral exploration or exploitation (pursuant to the Brazilian Constitution of 1988). AngloGold Ashanti’s operations in Brazil consist of both claimstake mines and granted mines.
Mining activities in granted mines must be performed in two defined stages: (i) exploration, which entails defining and evaluating the deposit and determining the feasibility of exploitation, and (ii) exploitation, which involves coordinating operations aimed at the industrial exploitation of the mineral deposit, from the extraction of useful minerals to their processing. Exploration authorisations issued by the ANM are valid for one to threefour years. ExtensionsOne extension can be obtained if necessary,automatically as long as it is justified. For more than one extension, the extension request will have to satisfy specific legal requirements. In contrast, exploitation rights, once granted, are valid for the lifetime of the deposit, provided the mining titleholder complies with all legal requirements. Pursuant to these requirements, for example, titleholders must (i) start work on mineral exploitation within six months from the date of publication of the Exploitation Concession, (ii) continue their mining activities until the mineral deposit has been exhausted, in accordance with the Economic Exploitation Plan (Plano(Plano de Aproveitamento Econômico)mico) approved by the ANM, and (iii) refrain from suspending mining activities without prior notice to the ANM.
Tax laws relating to mining
During the exploration period, the mining titleholder has to pay an Annual Rate per Hectare (Taxa(Taxa Annual por Hectare or TAH)“TAH”), subject to a maximum value set by law. In the exploitation period, regardless of the legal regime governing the project (whether claimstake or granted mines), the mining titleholder has to pay the Financial Compensation for Exploiting Mineral Resources (Compensaç(Compensação Financeira pela Exploração Mineral or CFEM)“CFEM”). The CFEM which is 1.5 percent for gold is currently calculated based on revenues.
At the end of 2011 and the beginning of 2012, the states of Minas Gerais, Pará, Amapá and Mato Grosso do Sul each created a new “inspection and control” tax (duty) on research, extraction and exploration activities as well as on the use of Mineral Resource carried out in those states. This tax could range from BRL3.00 to BRL6.50 per ton of ore extracted. In the state of Minas Gerais, gold ore isand silver ore are exempted from the collection of this new duty. At the end of 2020, the state of Goiás created a new “inspection and control” tax (duty) on research, extraction and exploration activities carried out in this state, at a rate of BRL10.38 per ton of ore sold, which currently still needs to be implemented. The constitutionality of these “inspection and control” taxes was upheld by the Supreme Court of Brazil on 1 August 2022.
Environmental laws relating to mining
Following the catastrophic failure of a tailings storage facility (TSF) operated(“TSF”) at the Córrego do Feijão iron ore mine owned by Vale at Brumadinho in the state of Minas Gerais in Brazil in January 2019, executive, legislative and judiciary bodies, both at the federal and state levels, have generally increased scrutiny of mining operations in Brazil, and of TSFs in particular, and have been considering, and in some cases have adopted, stricter laws and regulations applicable to the approval, licensing, construction, management, closure and decommissioning of TSFs in Brazil.
At the federal level, the ANM issued Resolution No. 13/19 in August 2019 (replacing its earlier Resolution No. 4/19) which adopted additional regulatory measures to ensure the stability of TSFs, in particular those built or heightened by the upstream method or by any method declared as “unknown”. Among other things, ANM Resolution No. 13/19 prohibits the upstream method for the construction or heightening of tailings dams throughout the national territory of Brazil. It further requires operators to cease all storage and disposal activities at TSFs (known as “deactivation” or “desativaç“desativação”o”) constructed or heightened upstream or by an “unknown” method by 15 September 2021 as well as to decommission such TSFs by 15 AugustSeptember 2022 to 15 September 2027 (depending on the capacity volume). ANM Resolution No. 13/19 does not require complete removal of tailings material from TSFs (a process known as “decharacterization” or “descaracterização”). As a result, the Serra Grande mine in the state of Goiás is in the process of reinforcing the dam walls of its upstream TSF in advance of its expected deactivation by 15 September 2021. To comply with the terms of ANM Resolution No. 13/19, the mine will also need to decommission the Serra Grande tailings dam in the state of Goiás must be decommissioned by 15 September 2025. The company has begunSerra Grande mine completed the process of transitioningreinforcing the dam walls of its upstream TSF, deactivating the TSF and migrating to dry-stacking operations, for tailings storage.each by the 15 September 2021 deadline.
Furthermore, Federal Law No. 14.066/20, adopted in SeptemberOctober 2020, also imposes requirements on companies to close and decommission upstream TSFs, including ourthe Serra Grande tailings dam, by 25 February 2022 (which date is earlier than required by ANM Resolution No. 13/19). However, Federal Law No. 14.066/20 does permit extensions of the compliance deadline, with the consent of the ANM based on the technical plan for decommissioning. NeitherSerra Grande submitted timely requests to obtain an extension of the compliance deadline until 2025 in line with the timeline set forth in ANM Resolution No. 13/19 nor Federal Law No. 14.066/20 requires removal of all tailings material in connection withand presented its technical plan for decommissioning. On 26 May 2022, the decommissioning of TSFs. AngloGold Ashanti expects to transition to dry-stacking operations at Serra Grande in advance ofANM issued a technical note allowing the required closure deadline for the Serra Grande tailings dam.extension until 2025. With respect to downstream (or “centerline”) TSFs, Federal Law No. 14.066/20 requires companies, to the extent that communities are located in the self-rescue zone of those TSFs, to implement one of the following measures for such structures: either (i) the structure must be deactivated and decommissioned, (ii) the population must be relocated, with reparations for loss of cultural heritage, or (iii) reinforcement works that guarantee the effective stability of the structure must be carried out, by decision of the public authorities, taking into account the previous nature of the dam in relation to the occupation and technical-financial viability of the alternatives. Even if reinforcement works are completed, deactivation and decommissioning of those TSFs will be required at the end of the life of the mine. All of the TSFs operated by AngloGold Ashanti in Brazil have communities located in self-rescue zones.
69
As of 31 December 2022, AngloGold Ashanti expects to transitionhas fully transitioned to dry-stacking operations for tailings storage at each location in BrazilBrazil. Capital expenditures required in the near term and to decommission each of these dams in accordance with their closure plans. According to current estimates, capital expenditures in 2021 required2022 to implement this new technology amounted to approximately $83 million. Capital expenditures for work required to comply with TSF-related requirements during the period 2023-2025 are expected to be material but, based on preliminary estimates to date, AngloGold Ashanti anticipates that annual expenditures for each of these years will be less than in excessprior years and will decline over time. Neither ANM Resolution No. 13/19 nor Federal Law No. 14.066/20 requires removal of $70 million.all tailings material in connection with the decommissioning of TSFs (a process known as “decharacterisation” or “descaracterização”).
At the state level, the state legislator in the state of Minas Gerais adopted Law No. 23.291/19 in February 2019 which containedcontains the state’s policy on TSF safety and should be implemented in conjunction with the equivalent federal policy. Among other things, Law No. 23.291/19 determines the criteria for licensing and inspecting TSF structures, prohibits TSFs constructed or heightened
using the upstream method, establishes bond requirements and holds management liable for non-compliance with its provisions. The government of Minas Gerais adopted several decrees in furtherance of this legislation.
In addition, ANM Resolution No. 95/22, which became effective on 22 February 2022, effectively consolidates prior federal resolutions on TSFs, including ANM Resolution No. 13/19, and establishes new criteria for the operational management of TSF structures, changes the criteria related to the risk classification of TSF structures and emergency levels and sets new criteria for the suspension, embargo (order to stop operations) and interdiction of TSF activities. Operators of TSFs were mandated to conduct and submit risk assessments to the ANM by December 2022 and are required to update those risk assessments every two years. Operators are also required, on an annual basis, to obtain certifications from external consultants of the geotechnical stability of TSF structures and the adequacy of emergency response plans. In late 2022, tailings deposition was required to be suspended due to embargos at five of AngloGold Ashanti’s TSFs in Brazil pending certification by external consultants of on-site emergency response plans (Declaração de Conformidade e Operacionalidade (“DCO”)) as well as, at one such TSF, certification by external consultants of geotechnical stability (Declaração de Condição de Estabilidade (“DCE”)) consistent with the new standards. In addition, at the Calcinados TSF, a risk assessment conducted in December 2022 with oversight from external consultants, as required by Brazilian regulations, concluded that additional buttressing should be completed to align the TSF’s post liquefaction factor of safety with international standards currently considered best practice. Construction at the Calcinados TSF is expected to begin later in 2023, and the timeline for completion will be determined once the engineering and geotechnical work has been completed by external consultants. Tailings deposition at the Calcinados TSF, as well as processing of gold concentrate at the Queiroz plant, which services the Cuiabá mine complex, is suspended until additional buttressing of the Calcinados TSF impoundment is complete.
On 1 December 2022, the ANM published ANM Resolution No. 122/22, which relates to administrative sanctions for non-compliance with mining and dam safety regulations and which, in addition to significantly increasing the values of applicable fines and penalties, establishes procedures and parameters for available sanctions including seizures of ore, goods and equipment, suspension of mining activities, demolition of mine infrastructure and invalidation or cancellation of title and exploration licences.
Further amendments to the regulatory requirements in Brazil governing such TSFs and related dams are expected to implement certain provisions of Law No. 23.291/19 have not yet been issued.be adopted in 2023.
AngloGold Ashanti’s rights and permits
At AGA Mineraçao, Cuiabá has a single mining concession (No. 000.323/1973) covering a total area of 3,662 hectares,hectares. In February 2022, two additional mining concessions for Cuiabá (Nos. 830.937/1979 and 831.027/1980) were published, which cover an additional area of 816.2 hectares. Lamego is covered by three geographically contiguous concessions totallyhas a single mining concession (No. 932.710/2017) covering a total area of 1,622 hectares andhectares. Córrego do Sítio is hosted by five geographically contiguous mining concessions (i.e., Nos. 930.556/2000, 930.181/2008, 830.129/1982, 833.472/2003 and 830.943/1979) covering a total area of 6,017 hectares. All of these are in good standing.
At Serra Grande, the companyCompany has interests in or agreements over 61,50025,719.94 hectares in Crixas Greentonethe Crixás greenstone belt, representing approximately 87 percent of the relevant tenements that correspond to all current exploration and mining activities. These have been held since 1987. The mining concessions include mining concession No. 002.286/1935 covering an area of 4,206.88 hectares, mining concession No. 960.658/1987 covering an area of 1,946.89 hectares, mining concession No. 860.746/2005 covering an area of 88.28 hectares, mining concession No. 862.103/1994 covering an area of 125.41 hectares and mining concession No. 804.366/1975 covering an area of 196.05 hectares.
All of the Company’s mining concessions in Brazil are currently active, in good legal and operational standing, and free of liabilities and/or major obligations. Brazilian mining concessions remain valid up to the depletion of the OreMineral Reserve and Mineral Resource pursuant to the Economic Exploitation Plan approved by the ANM and in accordance with the required environmental permits, and as a result do not have an explicit expiry datedate.
70
Colombia
General laws relating to mining and land ownership
General regime
The Colombian Constitution declares that the sub-soil and the non-renewable natural resources located within the Colombian territory are the property of the Colombian State. The underlying principle of Colombian mining legislation for the granting of mining concession contracts over free areas is first in time, first in law. Mining activities are regulated by the Colombian Mining Code, Act 685, 2001.
The filing of an exploration and exploitation proposal triggers a right of preference to obtain rights over the targeted area, provided it is available. Such area cannot exceed 10,000 hectares. Upon receipt of a proposal, the relevant government agency determines whether another proposal or contract already governs the area. If there are no pre-existing claims, the government agency grants the applicant a “free area”.
With respect to land ownership, a mining concession in Colombia does not grant the rights over the surface required to develop a mining project. Therefore, in order to develop a mining project,, it is required to acquire and secure access to the land (soil). This can be achieved in several ways, such as (i) purchase of the land, (ii) a transit easement, (iii) a mining easement, and (iv) the special acquisition process or expropriation.
Concession contract
As the sub-soil and the non-renewable natural resources located within the Colombian territory are property of the Colombian State, the Colombian Mining Authority (Agencia Nacional de Minería) grants the authorizationauthorisation to explore and exploit minerals through a concession contract.
Such concessions allow concessionaires to conduct the studies, works and facilities necessary to establish the existence of minerals and to organise their exploitation. Upon being awarded a mining concession, a company must take out an insurance policy to cover the costs associated with potential environmental damage as well as breaches of its mining obligations. It may then proceed with exploration activities. Once the exploration phase is complete, the concessionaire files a new plan regarding proposed works and facilities. With the award of the mining concession or tenement contract, there are specified timelines for the completion of the various phases of a mining project, e.g. exploration, construction, exploitation. The company must comply with these timelines unless performance is suspended, for example, due to force majeure or extensionsthese timelines are extended or modifications to the timelines.modified. A grant of force majeure is for one year and must be renewed on an annual basis. If the company does not comply with the specified timelines for the completion of the various phases of a mining project, the mining authority may revoke the company's concession contracts or mining licenses.licences. As a general matter, any company that wishes to obtain a renewal of its concession contract must be up to date in all its legal and contractual obligations and must present a new plan of works and facilities to be implemented after the contract is renewed.renewed.
PINES programprogramme
In 2013,, the national government instituted the PINES programprogramme designed to aid promoting certain projects that are deemed to have a national interest. This designation provides for greater oversight from the national government. All of our three advanced exploration projects (La Colosa, Quebradona and Gramalote) were considered of national strategic interest. Currently, Quebradona and Gramalote remain in the PINES program,programme, but La Colosa was temporarily removed as such (until the force majeure is over).
Tax laws relating to mining
From the moment the concession contract is registered with the Mining Register, the concessionaire has several financial obligations, including the payment of (i) a surface fee during the exploration, construction and assembly stage and (ii) royalties.
Once exploration is complete and the mining infrastructure in place, the concessionaire must begin paying royalties to the Colombian government, consisting of a percentage of the primary product and sub-products being exploited. The percentage of the royalty depends on the regulation in force when the concession contract is registered. In the case of the Quebradona project, the deposit mainly consists of copper followed by gold and silver. There is a 5five percent royalty for copper on the production value at the mine’s or well’s edge (i.e. when extracted from the subsoil). In case of gold and silver, a royalty of 4four percent on the production valued at the mine’s or well’s edge (i.e. when extracted from the subsoil) was established.
Furthermore, Colombian law establishes that once the environmental licenselicence is granted the concessionaire must invest 1one percent of the project’s value to benefit the basins covered by the environmental license.licence.
71
Environmental laws relating to mining
In order to obtain an authorization fromauthorisation to carry out a mining project, a company must prepare an Environmental Impact Study (“EIA”) for approval by the National Environmental Licensing Authority of Colombia to carry out a project, the company must prepare an Environmental Impact Study (E.I.A.(Autoridad Nacional de Licencias Ambientales or “ANLA”) for approval by this authority.
. Global environmental licenseslicences are granted for the entire life of the project and cover all phases: construction, assembly, operation, maintenance, dismantling, final restoration, abandonment and/or termination. Construction and assembly permits (Plan de Trabajos y Obras or “PTO”) are granted by the mining authority with jurisdiction over the project.
AngloGold Ashanti’s rights and permits
The La Colosa project managed by AngloGold Ashanti Colombia S.A. (AGA Colombia)S.A.S. (“AGA Colombia”) remains in force majeure due to the delays in the granting of the environmental permits by thenational and local environmental authority,authorities, thereby preventing AGA Colombia from undertaking further exploration activities. The currentmost recent one-year grant of force majeure, during which time the specified timelines for completing the various phases of the mining project under the concession contract are suspended, will expire on 22 June 2021.2023. AGA Colombia applied for a mining area integration (consolidation) of its concession contracts related to La Colosa, in respect of which AGA Colombia was not in compliance with some of the specified timelines. The application for mining area integration (consolidation) was approved in March 2017, which remedied the non-compliance of each consolidated concession and reset the specified timelines. La Colosa now has a single integrated mining concession contract (EIG-163) which covers a total area of 9,210 hectares and expires on 28 February 2037.
Minera de Cobre Quebradona S.A.S. B.I.C. (MCQ)(“MCQ”) which manages the Quebradona project, obtained the integration of concession agreement 5881 in October 2016 and registered in December 2016. As a result, MCQ was granted the exclusive right to explore, take ownership and dispose of the mineral reserves (ore) extracted from the concession area. MCQ has the right to request an extension of up to 30 years, at least two years before the expiration of the operating period. This extension is not automatic, and the request must be filed with new technical, economic, environmental and social studies that demonstrate the status of the mineral resources. Currently, concessionConcession contract 5881 initially covered a total area of 7,593 hectares, which was reduced to 4,881.89 hectares by the relevant mining authority (Secretaría de Minas de Antioquia) on 4 March 2022. It will expire in May 2037 and is currently in its fifthseventh year of the integrated exploration phase. TheIn September 2021, the permits for the construction and mining operation are currently being assessedwere approved by the relevant mining authority (Secretarí(Secretaría de Minas de Antioquia). On 4 November 2021, ANLA officially notified AngloGold Ashanti of its decision to ‘archive’ the environmental licence application relating to the Quebradona project. ANLA has neither denied nor granted the licence, but deemed that the information provided by AngloGold Ashanti is not enough for this authority to take a substantive decision. On 18 November 2021, AngloGold Ashanti appealed the archiving decision in order to secure further details on the specific additional information ANLA requires to make a determination. ANLA denied the appeal on 29 April 2022 and the Nationalarchiving decision was confirmed. AngloGold Ashanti is in the process of preparing a new Environmental Licensing Authority of Colombia (ANLA) is reviewingImpact Assessment for the Quebradona project to submit to ANLA in connection with its environmental study.licence application.
The Gramalote project is organised as a joint ventureoperation between AngloGold Ashanti (through AGA Colombia Holdings Limited and AngloGold Ashanti Holdings plc) and B2Gold (through B2Gold Corp. and Graminvest Ventures Limited). Gramalote Limited, a
company incorporated under the laws of British Virgin Islands which is the legal vehicle operating the joint venture,operation, established a Colombian branch, Gramalote Colombia Limited (GCL)(“GCL”), to carry out activities in Colombia and obtain the mining concession contracts necessary to develop the Gramalote project. The Gramalote joint ventureoperation has been operated by B2Gold since January 2020. Pursuant to an integrated mining concession contract No. 14292, GCL was granted the exclusive right to explore, take ownership and dispose of the mineral reserves (ore) extracted from the concession area (which covers a total area of 8,720.71 hectares and includes the Gramalote and Monjas anomalies) until April 2043. GCL has the right to request an extension of the operating period for up to 20 years, and, if exercised, such request to extend must include new technical, economic, environmental and social studies that demonstrate the status of the mineral resources. Currently, concession contract
72
No. 14292 is in the phase of construction and assembly, pending resettlement of communities and the formal start of construction activities. GCL has received an environmental licence granted by the National Environmental Licensing Authority of Colombia (ANLA)ANLA and permits for the construction and mining operation which were approved by the relevant mining authority (Secretarí(Secretaría de Minas de Antioquia).
United States of America (Nevada)
General regime
Mineral and surface rights in the United States are owned by private parties, state governments or the federal government. The majority of land utilised for precious metals exploration, development and mining in the western United States is owned by the federal government, and often the state government will have an ownership interest in minerals, regardless of whether the state is the surface owner.government. The right to mine on such federal land in western states is governed by the U.S. General Mining Law of 1872, as amended (General(the “General Mining Law).Law”), as well as relevant state statutes and regulations. The General Mining Law allows mining claims (for mining and mining-related activities) on certain federal lands upon the discovery of a valuable mineral deposit andafter proper compliance with claim location and maintenance requirements.
Mineral exploration activities in Nevada are also generally subject to applicable federal, state, and local permitting requirements, but the specific regulatory authorizationsauthorisations required for the company’s activities are based on the nature and location of the exploratory work. Many of AngloGold Ashanti (U.S.A.) Exploration Inc.’sthe company’s Nevada operations are currently conducted under what is generally referred to under federal law as a notice-level operation subject to 43 CFR § 3809.21. The3809.21, while projects that are more advanced require additional permitting, including a Plan of Operations approved by the federal Bureau of Land Management (BLM) issued a Notice(“BLM”). The State of Decision for the Silicon Project approving the proposed exploration operations on 1 November 2017. Four amendments to the NoticeNevada Division of Decision have been authorized by the BLM in letters dated 31 January 2018, 2 April 2018, 4 October 2018, and 4 March 2020.
Potential regulatory changes
Over the years, the U.S. Congress has considered a number of proposed amendments to the General Mining Law and other federal statutes relating to mining. Among the significant features contained in previously proposed legislation were a production royalty obligation, new and more stringent environmental standards and conditions, additional reclamation requirements, extensive new procedural steps which would likely result in extended permitting timelines, and granting counties and other entities the ability to petition the U.S. Secretary of the Interior to make certain areas unavailable for the location of unpatented mining claims. The U.S. Environmental Protection Agency has also proposed potential revisions to financial assurance requirements relating to mineral development activities. In June 2020, former President Trump signed an executive order directing certain federal agencies to streamline the review processes associated with permitting of infrastructure and natural resources projects. Many of those policies have subsequently been rescinded by the Biden administration. While thiscertain other executive orderorders may favorably affect the timing of our permit and project approvals, itsthe impact is yet to be determined and remains uncertain.
There are a number of bills being proposed to the Nevada state legislature during the 2023 legislative session that could impact the company’s planned operations. These include proposed legislation that would alter the way water rights are administered by the state, as well as a bill that would, if enacted, impose additional requirements for environmental review of mineral development projects in Nevada. At this stage, it is not possible to evaluate whether these bills will be enacted in any form by the Nevada state legislature or, if passed, what impact any might have on AGA.
AGA is currently unaware of any other new federal or state legislative or regulatory changes or rule-making that has been proposed or enacted that would adversely affect its current exploration programs.programmes. If any requirements, standards or conditions were adopted in the future that imposed additional or new obligations or costs on AGA in connection with our exploration or extraction activities in the United States, the company’s operations in Nevada could be adversely affected.
AngloGold Ashanti’s rights and permits
In Nevada, the company’s wholly-owned subsidiaries hold a significant number of unpatented mining claims on federal lands. The Silicon project consists of approximately 950 unpatented mining claims. The North Bullfrog project consists of 45 patented and approximately 1,600 unpatented mining claims (covering approximately 32,000 acres) situated in the Bullfrog mining district. There are also nine mining leases within the North Bullfrog project the majority of which continue in perpetuity so long as the company meets certain minimal requirements for use of the land. One mining lease is scheduled to expire in 2031. The Mother
73
Lode project consists of 13 unpatented mining claims. The North Bullfrog and Mother Lode projects are now controlled by the company as a result of its acquisition of all of the outstanding stock of Corvus Gold Inc., which closed on 18 January 2022. The southern claim block, encompassing the Sterling mine and other properties in the same general area, consists of approximately 1,900 unpatented claims (covering approximately 35,000 acres), which are now controlled by the company as a result of its acquisition of all of the outstanding stock of Coeur Sterling, Inc. (a subsidiary of Coeur Mining, Inc.), which closed on 4 November 2022. As a result of this acquisition, the company now controls a past-producing mine site in southern Nevada known as the Sterling mine, which has one applicable mining lease that expires in 2029, with the option to extend the lease for an additional ten-year period. Although the Sterling mine is currently in care and maintenance status, it remains subject to complex permitting and regulatory requirements, including compliance with relevant provisions of the U.S. Federal Mine Safety and Health Act of 1977 and oversight by the U.S. Department of Labor’s Mine Safety and Health Administration (“MSHA”).
MINE SITE REHABILITATION AND CLOSURE
Closure, an integral part of operations
All mining operations eventually cease. An integral aspect of operating AngloGold Ashanti’s mines is ongoing planning for site closure and, where feasible, implementation of concurrent rehabilitation, together with an estimate of associated liability costs and the placement of adequate financial provisions and assurances to cover these costs.
AngloGold Ashanti revised its groupintegrates mine closure planning management standard in 2013 and all of its operations are required to comply with the standard, as well as applicable law and regulations, as their closure plans are reviewed and updated.
•New projects includeExploration stage: developing a plan and programme for cessation and closure plan which takes into account futureof exploration activities in a manner that meets local laws and AngloGold Ashanti's mine closure and associated rehabilitation and other costs.planning standard.
•TheProject phase: developing conceptual closure plans and cost estimates for all projects and including them in project feasibility studies, designs and evaluations.
•Operational phase: developing and periodically updating mine closure plans and cost estimates with increasing levels of detail and confidence over the operational phase as part of the business planning process. Closure plan is reviewed annually and updated every three years (annually in the final three years of a mine’s life) or whenever significant changes are made, takingupdates take into account operational conditions, planning and regulatory requirements international protocols, technological developments andas well as advances in practice.
•Closure period: implementing the final closure plan starting at cessation of operations through a period of decommissioning, dismantling and rehabilitation until the point in time where management of the site is largely limited to monitoring and maintenance.
The company’sCompany’s group mine closure planning standard stipulates that closure planning must be undertaken in consultation with the community.stakeholders. In the course of these consultations, different issues are raised which require site-specific solutions. Livelihood preservationEach mine closure plan includes a social transition plan which seeks to minimise social impacts and maximise opportunities for local communities, including human resource, social infrastructure, are often key requirements. Communities also require information oneconomic and financial assets with the company’s rehabilitationaim of enhancing the landscape and on any lasting environmental impacts. Long-term remediation obligations, including decommissioning and restoration liabilities relating to past operations, are based on environmental management plans and compliance with current environmental and regulatory requirements.self-sustainability of mine communities after mine closure.
Provisions for decommissioning and rehabilitationrestoration costs are made when there is a present obligation, it is probable that expenditure on decommissioning and rehabilitationrestoration work will be required and the cost can be estimated within a reasonable range of possible outcomes. These costs are based on currently available facts, technology expected to be available at the time of the clean-up,rehabilitation, laws and regulations presently or virtually certain to be enacted and previous experience in the rehabilitation of mine sites.
Decommissioning costs and restoration costs are provided at the present value of the expenditures expected to settle the obligation, using estimated cash flows based on current prices. Estimates are discounted at a pre-tax rate that reflects current market assessments of the time value of money.
SUSTAINABILITY AND ENVIRONMENTAL, SOCIAL AND GOVERNANCE (“ESG”) MATTERS
AngloGold Ashanti’s sustainability approach is fundamental to how the Company operates its business, as well as its ability to create long-term value for its shareholders, employees and social partners through safely and responsibly exploring, mining and marketing its products. Sustainability and safety are integrated into the Company’s business and operations at all levels through various frameworks, standards and policies, and the Company measures its performance in achieving its goals against its sustainability and other ESG metrics, as well as its engagement with stakeholders.
In mitigating the risks and impacts that are an inherent part of its business, AngloGold Ashanti is informed by an annual assessment of its key ESG issues. This process is aligned with guidance published by the International Integrated Reporting Council (“IIRC”), the Sustainability Accounting Standards Board (“SASB”), the Global Reporting Initiative (“GRI”) Standards and
the Accountability AA1000 Stakeholder Management Standard. This assessment is annually reviewed by AngloGold Ashanti’s senior leadership and approved by the Social, Ethics and Sustainability Committee (the “SES Committee”).
AngloGold Ashanti’s board of directors, assisted by the SES Committee, has ultimate responsibility over environmental, safety, health and ethical matters and for the integration of sustainability objectives into AngloGold Ashanti’s business. This includes oversight of the Company’s stakeholder engagement framework and structures, which apply to investors, employees, governments, suppliers and communities, at every stage of its business from exploration to mine closure. Group Corporate Affairs and Sustainability is responsible for development of management systems and supports the Company’s general managers in the day-to-day implementation of its sustainability strategy.
AngloGold Ashanti maintains a set of policies and procedures to guide the Company in acting as a responsible corporate citizen, including the Code of Business Principles and Ethics which sets requirements for the implementation of key corporate policies and guidelines and applies to all management and employees, and to maintain compliance with applicable environmental, health and safety (“EHS”) laws. In addition2022, AngloGold Ashanti continued with the implementation of the Integrated Sustainability Information Management System (“iSIMS”), in order to post-mining land rehabilitationimprove internal reporting and closurebetter integrate, manage and monitor sustainability activities with respect to its broader business. This common management and reporting application for all sustainability disciplines, from safety, health and security to community and environmental management, is expected to help provide timely information in each of these areas, and to facilitate transparency and decision-making in its processes and practices.
Significant EHS requirements and ESG risks and trends affecting the Company’s mining and processing operations are described below.
EHS Regulatory Compliance
AngloGold Ashanti is subject to extensive environmental, health and safety (EHS)EHS laws and regulations in the various jurisdictions in which the companyCompany operates. These requirements govern, among other things, extraction, use, conservation and discharge of water; air emissions (including dust control and GHGs)greenhouse gases (“GHGs”)); mine and dam safety, regulatory and community reporting; clean-up of contamination; land use and conservation of protected areas; rehabilitation and closure of mined land; worker health and safety and community health; and the generation, transportation, storage and disposal of solid and hazardous wastes, such as reagents, radioactive materials, and mine tailings. Environmental laws and regulations applicable to ourthe Company’s operations, including the requirements contained in environmental permits, are generally becoming more restrictive. Significant EHS requirements, risks and trends affecting our mining and processing operations are described below.
Capital and operating costs to comply with EHS laws and regulations have been, and are expected to continue to be, significant to AngloGold Ashanti. In addition, AngloGold Ashanti could incur fines, penalties and other sanctions, environmental clean-up costs, and third-party claims for personal injury or property or natural resources damages; suffer reputational damage; and be required to install costly pollution control equipment or to modify or suspend facilities, such as TSFs, or operations, as a result of actual or alleged violations of, or liabilities under, EHS laws and regulations. Failure to comply with applicable EHS laws and regulations may also result in the suspension or revocation of permits and, in some jurisdictions, ourthe right to mine a given concession. AngloGold Ashanti’s ability to obtain and maintain permits and other approvals and to successfully operate near particular host communities may be adversely impacted by real or perceived effects on the environment or human health and safety associated with AngloGold Ashanti’s or other mining companies’ activities. In addition, unknown environmental hazards may exist at the company’sCompany’s properties which may have been caused by previous owners or operators.
Water Management
AngloGold Ashanti’s mining and processing operations are heavily dependent upon access to substantial volumes of water required for such operations. Typically,use in the mining and extractive processes and typically are subject to water-use permits or water rights in each country impose limits on the quantity ofto extract water that can be extracted from certain natural sources that govern usage and require, among other things, that wastewater from mining operations meetmaintain certain water quality criteria if discharged to the environment.upon discharge. Water supply, quality and usage are areas of interest globally, but are particularly significant forconcern across all of the Company’s operations, including with respect to the Company’s mining operations in Brazil and Ghana and for explorationBrazil, its mine development projects in Colombia, where there is significant potential environmental and social impact and a high level of stakeholder scrutiny.Nevada, as well as its mine development project at Quebradona in Colombia. Any failure by the Company to secure access to suitable water supplies, or achieve and maintain compliance with theapplicable requirements of ourthe permits or licenses,licences, could result in curtailment or suspensionhalting of production at the affected operation.operations. Incidents of water pollution or shortage can, in extremecertain cases, lead to community protest and ultimately result into the withdrawal of community and government support for AngloGold Ashanti’s operations. A failure by the company’sCompany to comply with water contamination related directives may result in further, more stringent, directives being issued against the Company, which may, in some cases, result in a temporary or partial shutdown of some of the Company’s operations.
Where feasible, the companyCompany operates a “closed loop” system which recycles the water used in its operations without discharging it to the environment. In some areas, however, such as Ghana and Brazil, high levels of rainfall and surface water runoff mean that a closed loop system is not feasible and that discharges, after water treatment where necessary, must take place.
75
Waste Management
During open-pit mining, large volumes of soil and/or rock (overburden) are mined to expose the ore body. Similarly, waste rock is mined during drilling and developing access to underground ore bodies. Overburden and waste rock typically contain sub-economic levels of gold and are deposited as large waste rock facilities. Mine tailings are the process waste generated once grinding and extraction of gold from the ore is completed in the milling process and are typically deposited as slurry in large tailing storage facilities (“TSFs”) specifically designed for this purpose.
The impact of dust generation, breach, leak, or other failure of a waste rock facility or TSF, including any associated dam, can be significant, and the companyCompany therefore monitors such facilities closely in accordance with the company’sCompany’s internal standards, independent review, national regulatory requirements, industry standards and commitments made to local communities. The occasional well-publicised failure of a third-party TSF and the potential impact of such failure also mean that these facilities are generally tightly regulated. AnA safety or environmental incident at the company’sCompany’s operations could result, among other things, in enforcement, including mandatory shutdown of a TSF and related facilities, obligations to remediate environmental contamination, negative press coverage, and claims for property or natural resources damages and
personal injury by adjacent communities. Incidents at other mining companies’ operations could result in governmental action to tighten regulatory requirements and restrict certain mining activities, in particular with respect to TSFs, also in respect of other mine operators in that region.
For example, following the catastrophic failure of a TSF at anthe Córrego do Feijão iron ore mine owned by Vale at Brumadinho in the state of Minas Gerais in Brazil in January 2019, tailings were discharged into the mine’s administrative area and part of the local community, reportedly resulting in deaths and injuriesdeath or injury to hundreds of people. As a result of this incident, there has been considerably increased regulatory scrutiny in Brazil and other areas on mining operations generally, and the requirements applicable to the approval, licensing, construction, management, closure and decommissioning of TSFs have generally become far more stringent. In particular,For example, in Brazil, new TSFs in the upstream design method have been prohibited both by the Brazilian National Mining Agency (ANM) Resolution No. 13/19, issued in August 2019, and by Federal Law No. 14.066/20, adopted in September 2020, and decommissioninglate 2022, tailings deposition was suspended at five of all existing upstream TSFs has been ordered. As a result, we will be required to reinforce, and to cease storage and disposal activities at, the TSF (known as “deactivation” or “desativação”) at our Serra Grande mine, located in the state of Goiás, by 15 September 2021. In addition, the Serra Grande mine TSF must be decommissioned by 15 February 2022, though that deadline could potentially be extended, up to 15 September 2025, with the consent of the ANM based on the technical plan for decommissioning. The incremental costs for reinforcing the walls of this facility and, ultimately, for deactivating and decommissioning the TSF in compliance with new legislation and regulations are expected to be material. We will also be required to reinforce or decommission allAngloGold Ashanti’s TSFs in Brazil constructed basedpending certification by external consultants of on-site emergency response plans (“DCO”) and/or geotechnical stability (“DCE”) consistent with new regulatory standards enacted in early 2022. In addition, at the Calcinados TSF, a risk assessment conducted in December 2022 with oversight from external consultants, as required by Brazilian regulations, concluded that additional buttressing should be completed to align the TSF’s post liquefaction factor of safety with international standards currently considered best practice. The timeline for completion will be determined once the engineering and geotechnical work has been completed by external consultants. For further information on the downstream or “centerline” design method. AngloGold Ashanti expects to transition to dry-stacking operations for tailings storage at each locationregulatory framework governing TSFs in Brazil, in the near term and to decommission each of these dams in accordance with their closure plans. According to current estimates, capital expenditures in 2021 required to implement this new technology will be in excess of $70 million. Neither ANM Resolution No. 13/19 nor Federal Law No. 14.066/20 requires complete removal of tailings material (a process known as “decharacterization” or “see descaracterização”) from TSFs. Further amendments to the regulatory requirements in Brazil governing such TSFs and related dams may be adopted in 2021. See “Item“Item 4B: Business Overview—The Regulatory Environment Enabling AngloGold Ashanti to Mine”Mine—Americas—Brazil”.
In addition, AngloGold Ashanti has committed to implement a new Global Industry Standard on Tailings Management (“GISTM”) was established in August 2020 by a panel comprised of industry and NGO experts,non-governmental organisation (“NGO”) experts. AngloGold Ashanti has committed to comply with the GISTM at all of its 22 TSFs in Africa, Australiaby August 2025, and Brazil within the next five years, the costs of whichrelated to meeting such standard are not expected to be material to AngloGold Ashanti.
In addition, AngloGold Ashanti could incur liabilities, or material costs to manage solid and hazardous waste generated by its mining activities, including dust and residual chemicals and metals. For example, AngloGold Ashanti expects to incur approximately $25 million to $30 million in capital expenditure and operating costs during 2023-2026 in connection with treatment and disposal of a quantity of legacy arsenic trioxide waste located at the Obuasi mine.
Groundwater Impacts and Environmental Remediation
As AngloGold Ashanti or its predecessors have a long history of mining operations in certain regions, issues may arise regarding historical, as well as potential future, environmental or health impacts in those areas, for which AGA, as the current owner/operator, may be legally responsible. For example, AngloGold Ashanti has identified groundwater contamination plumes at certain of its operations. Numerous scientific, technical and legal studies have been undertaken to assist in determining the magnitude of the impact and to find sustainable remediation solutions. Based on those studies as well as discussion with regulators, the companyCompany has taken steps, including monitored natural attenuation and phyto-technologies, to address soil and groundwater contamination. For example,contamination, including in Tanzania, a concept study forwhere an in-situ bioremediation project which uses naturally-occurring bacteria to reduce sulphate and nitrates in groundwater was undertaken in 2020 downstream of Geita mine’s TSF. Early results are encouraging, and the plans to roll out a phasedremediation project to address sulfate in groundwater downstream of the TSF arecommenced operations in process.2022.
Subject to the completion of site-specific trials and the technologypotential technologies being a provenconfirmed as viable remediation technique,techniques, no reliable estimate can be made at this time for the obligation. Should these obligations be significant, this could have a material adverse impact upon AngloGold Ashanti’s results and its financial condition.
Climate Change and GHG Regulation
76
In 2021, AngloGold Ashanti committed to the International Council on Mining & Metals (“ICMM”) target of achieving net zero Scope 1 and Scope 2 GHG emissions by 2050. AngloGold Ashanti has also committed to achieving a result30 percent reduction in absolute Scope 1 and 2 emissions by 2030 (as compared to a 2021 baseline), and, in partnership with value chain partners, to set Scope 3 GHG reduction targets, if not by the end of commitments made at the UN Climate Change Conference in Durban, South Africa in2023, as soon as possible thereafter.
In December 2011,2015, certain members of the international community negotiated a treaty at the Conference of the Parties of the UN Framework Convention on Climate Change in Paris in December 2015 (Paris Agreement)(the “Paris Agreement”). The Paris Agreement, which came into force on 4 November 2016, requires developed countries to set targets for emissions reductions. AdditionalAs a result, measures designed to limit or reduce GHG emissions, both mandatory and voluntary, mayhave been, and are expected to be, implemented at national or internationalregional levels in various countries.
For example, in 2010, Brazil launched the National Climate Change Policy, which established a voluntary national GHG reduction target of 36.1 percent to 38.9 percent below the projected emissions in 2020 for “business as usual”. The policy required the development of sector-specific plans in order to meet the target. Amongst other plans, it was intended to reduce
In addition, in Australia, the Commonwealth Government introduced the Safeguard Mechanism (Rule 2015), through the existing National Greenhouse and Energy Reporting (NGER)(“NGER”) scheme, to provideprovides a framework for Australia’s largest emitters to measure, report and manage their emissions. It does this by encouraging large facilities, whose net emissions exceed the safeguard threshold, to keep their emissions at or below emissions baselines set by the Clean Energy Regulator. The safeguard mechanismSafeguard Mechanism applies to facilities with Scope 1 covered GHG emissions of more than 100,000 tonnes of CO2-ee per fiscal year. The Australian mining operations (Sunrise Dam and Tropicana) had emissions baselines set in 2016 for a 3-year period (expired in 2019) which were reported annually through the NGER scheme. During the 2018/19 fiscal year, Tropicana’s emissions were within its authorised threshold and Sunrise Dam was required to purchase offsets for emissions that were 0.8 percent above its safeguard threshold, the cost of which was immaterial. Two recent amendments to the Safeguard Mechanism (Rule 2015) enacted in March 2019 and May 2020 allowed for the application of transitional calculated baselines using estimated CO2-eCO2-e emissions intensities. Based on the production and emissions forecasts, the Australian mining operations applied to use transitional calculated baselines in 2020 for Sunrise Dam and Tropicana, which were approved by the Clean Energy Regulator effective 1 July 2019 to 30 June 2022 for both operations. Accordingly, assuming our operations (and resultant emissions) are consistent with the forecasts in our current business plan,Thereafter, the Australian mining operations shouldwill be ablerequired to avoid purchasingapply production-adjusted baselines and, if actual emissions exceed the baseline, to purchase emissions offsets for the business during this period.business. In any event, the cost of such offsets, if ultimately required to be purchased, including due to a change in ourthe operations under ourthe business plan prior to June 2022, are not anticipatedexpected to be material to ourthe Company’s business.
In addition to more stringent requirements and commitments, AngloGold Ashanti’s operations are subject to a number of physical risks from climate change, such as changes in rainfall rates or patterns resulting in floods or droughts, rising sea levels, reduced water availability, higher temperatures and extreme weather events. Such events or conditions, particularly including flooding or inadequate water supplies, could disrupt mining and transport operations, mineral processing and rehabilitation efforts, create resource or energy shortages or damage the company’sCompany’s property or equipment and increase health and safety risks on site. Under the CCWG’s leadership and inIn consultation with external consultants, physical climate risk assessments were undertaken in 2020 for all our operations using current climate models for different projectedthe business and various decarbonisation scenarios and climate adaptation plans were outlined. These adaptation plansphysical climate risks will continue to be further reviewed and refined in 2021.
Occupational and Community Safety and Health and Tropical Diseases
In some of the jurisdictions in which AngloGold Ashanti operates, the government enforces compulsory shutdowns of operations to enable investigations into the cause of accidents and introduce corrective measures at those operations.
AngloGold Ashanti’s Group Safety remains a top priority for AngloGold Ashanti. We pursueStrategy, which is updated every three years, seeks to integrate operational risk management and continually adapt strategies in linekey performance indicators at all levels of the organisation and maintain alignment with recognised leading practice in global safety standards and systems in working towards our 2030 goalstandards. The SES
77
Committee oversees the revisionimplementation of the Group Safety Strategy, a number of areas were considered: looking at eliminating both high consequence low-frequency events and low consequence high-frequency incidents through critical control management; introducing engineering and higher order controls; and improving organizational culture and behaviour. We are aligned with global standards and are rolling outStrategy. All operations, have been certified to ISO 45001:2018, which has replaced the OHSAS 18001:2007 series. All our operating mines are OHSAS 18001:2007 certified and are in the process of migration to ISO 45001:2018. Geita, Iduapriem, Siguiri, Cerro Vanguardia, Sunrise Dam and Tropicana mines have already achieved ISO 45001:2018 certification, with the remainder to follow during 2021. The certification process has been delayed due to COVID-19 travel restrictions.
AngloGold Ashanti is also subject to health and safety regulations relating to occupational disease. The primary areas of focus in respect of occupational health of employees within the company’sCompany’s operations are noise-induced hearing loss (NIHL)(“NIHL”) and
occupational lung diseases (OLD)(“OLD”). OLD includes occupational tuberculosis and silicosis in individuals exposed to silica dust. Silicosis has been particularly prevalent in South Africa and has also arisen at the company’sCompany’s Africa region and Brazilian operations, albeit to a far lesser extent. AngloGold Ashanti provides occupational health services to its employees at its occupational health centres, clinics, and through outsourced service centres. The companyCompany continues to improveexpand preventative occupational hygiene initiatives, such as implementing various control measures to prevent hazardous exposures, and providing employees with Personal Protective Equipment.
In addition to OLD, HIV and AIDS and associated diseases remain major health care challenges faced by AngloGold Ashanti’s Africa region operations. AngloGold Ashanti continues to implement programmes to help those infected with HIV and prevent new infections from spreading.
Malaria and other tropical diseases also pose health risks at all of the company’sCompany’s operations in Central, West and East Africa where such diseases may assume epidemic proportions because of ineffective national control programmes. Malaria is a major cause of death in young children and pregnant women butand also gives rise to deaths and absenteeism in adult men.adults. All affected companyCompany operations in Africa have malaria control programmes in place. The Ghana Obuasi malaria control programme continues to roll-out indoor residual spraying programmesactivities have been completed in 16 districts of Ghana as planned for 2022 and a new cycle of indoor residual spraying will commence in 2023; in partnership with the Global Fund and the Ghana Department of Health.
In 2020,2022, the COVID-19 pandemic took an unprecedented toll on businessessubsided significantly with decreases in reporting of severe disease or deaths. Nevertheless, AngloGold Ashanti continued to direct resources for close surveillance and socio-economic systems acrossmaintenance of controls within the globe. This forced businessescompany with a view to take extraordinary measures to protect the healthensure continuity of people, maintainits operations and contributeavoid any potential disruption in the event of a re-emergence of the pandemic. Universal access to global control efforts. Similarly, the pandemic required significant focussafe and resources across AngloGold Ashantieffective vaccines provided an additional layer of protection, especially against severe forms of disease, hospitalisation and death. The company endeavoured to continue to provide prompt access to approved and available vaccines for all workers, especially employees considered to be at high risk as throughout the year we worked to limit the spread and maintain operations. Given the interdependence of employee and community health, measures to ensure the health of ourwell as employees and those in our communities remained our focus.with critical skills.
The emergence of COVID-19 however also assisted to better integrate broad health risk management beyond occupational health into the overall business strategy, to contribute to productivity as well as the social licenselicence to operate. We putoperate and to improve various prevention and risk management protocols in place to address the potential risk of an epidemic or pandemic, particularly after ourthe company’s experience with Ebola in Guinea in 2014 and 2015 – our health team made sure that we were better prepared than many to address the situation.2015.
Diversity and Inclusion (“D&I”)
With more than 30,000 employees (including contractor employees) on four continents, AngloGold Ashanti believes that having a diverse and inclusive workforce is important to continuing to attract talent in order to maintain competitiveness and the long-term sustainability of its business. In addition, the Company strives to have a workforce that represents the societies in which AngloGold Ashanti operates in connection with maintaining its social licence to operate.
AngloGold Ashanti’s D&I approach is aligned to the United Nation Sustainable Development Goals (“UNSDGs”) (SDG 5, 8 and 10) and the United Nations Global Compact (“UNGC”). The Company has developed a Diversity & Inclusion Framework, which aims to foster the empowerment of all staff, irrespective of race, gender, ethnicity, religion and sexual orientation and has established specific priorities and actions for the next two to five years to foster the inclusion of D&I objectives in its processes. Leadership teams are responsible for meeting defined diversity targets. In 2022, AngloGold Ashanti cannot guarantee that any current or future medical programme will be successful in preventing or reducingconducted an analysis of global gender data across job level, function and country. The analysis was carried out to inform AngloGold Ashanti’s D&I strategy.
78
Human Rights and Indigenous Peoples
In its commitment to respecting and promoting human rights, AngloGold Ashanti supports the injuryUnited Nations Guiding Principles for Business and illness rates amongstHuman Rights (“UNGP”) and other international initiatives, including the UNGC and the Voluntary Principles on Security and Human Rights (“VPSHR”). The VPSHR, which seeks to balance safety and security needs against respect for human rights and fundamental freedoms, were developed through multi-stakeholder participation between governments, extractive industry members and NGOs. Community and security related matters, including with respect to illegal and artisanal and small-scale mining and related intrusions into the Company’s operational areas, are addressed at board of directors-level by the SES Committee. AngloGold Ashanti’s internal Human Rights Framework includes numerous policies, management standards and guidance documents which apply to all of its employees, or in affecting consequent morbidity or mortality rates. AngloGold Ashanti may incur significant costs in addressing this issuecontractors and suppliers and require reporting of, and redress for, human rights violations and related allegations.
The Company is aligned with the ICMM Position Statement on Indigenous Peoples and the International Finance Corporation’s Performance Standard 7 on Indigenous Peoples and other international standards and treaties in the future, which could also adversely impact the company’s resultsarea of operations and financial condition.Indigenous Peoples’ rights.
79
ANGLOGOLD ASHANTI GLOBAL FOOTPRINT: 2022
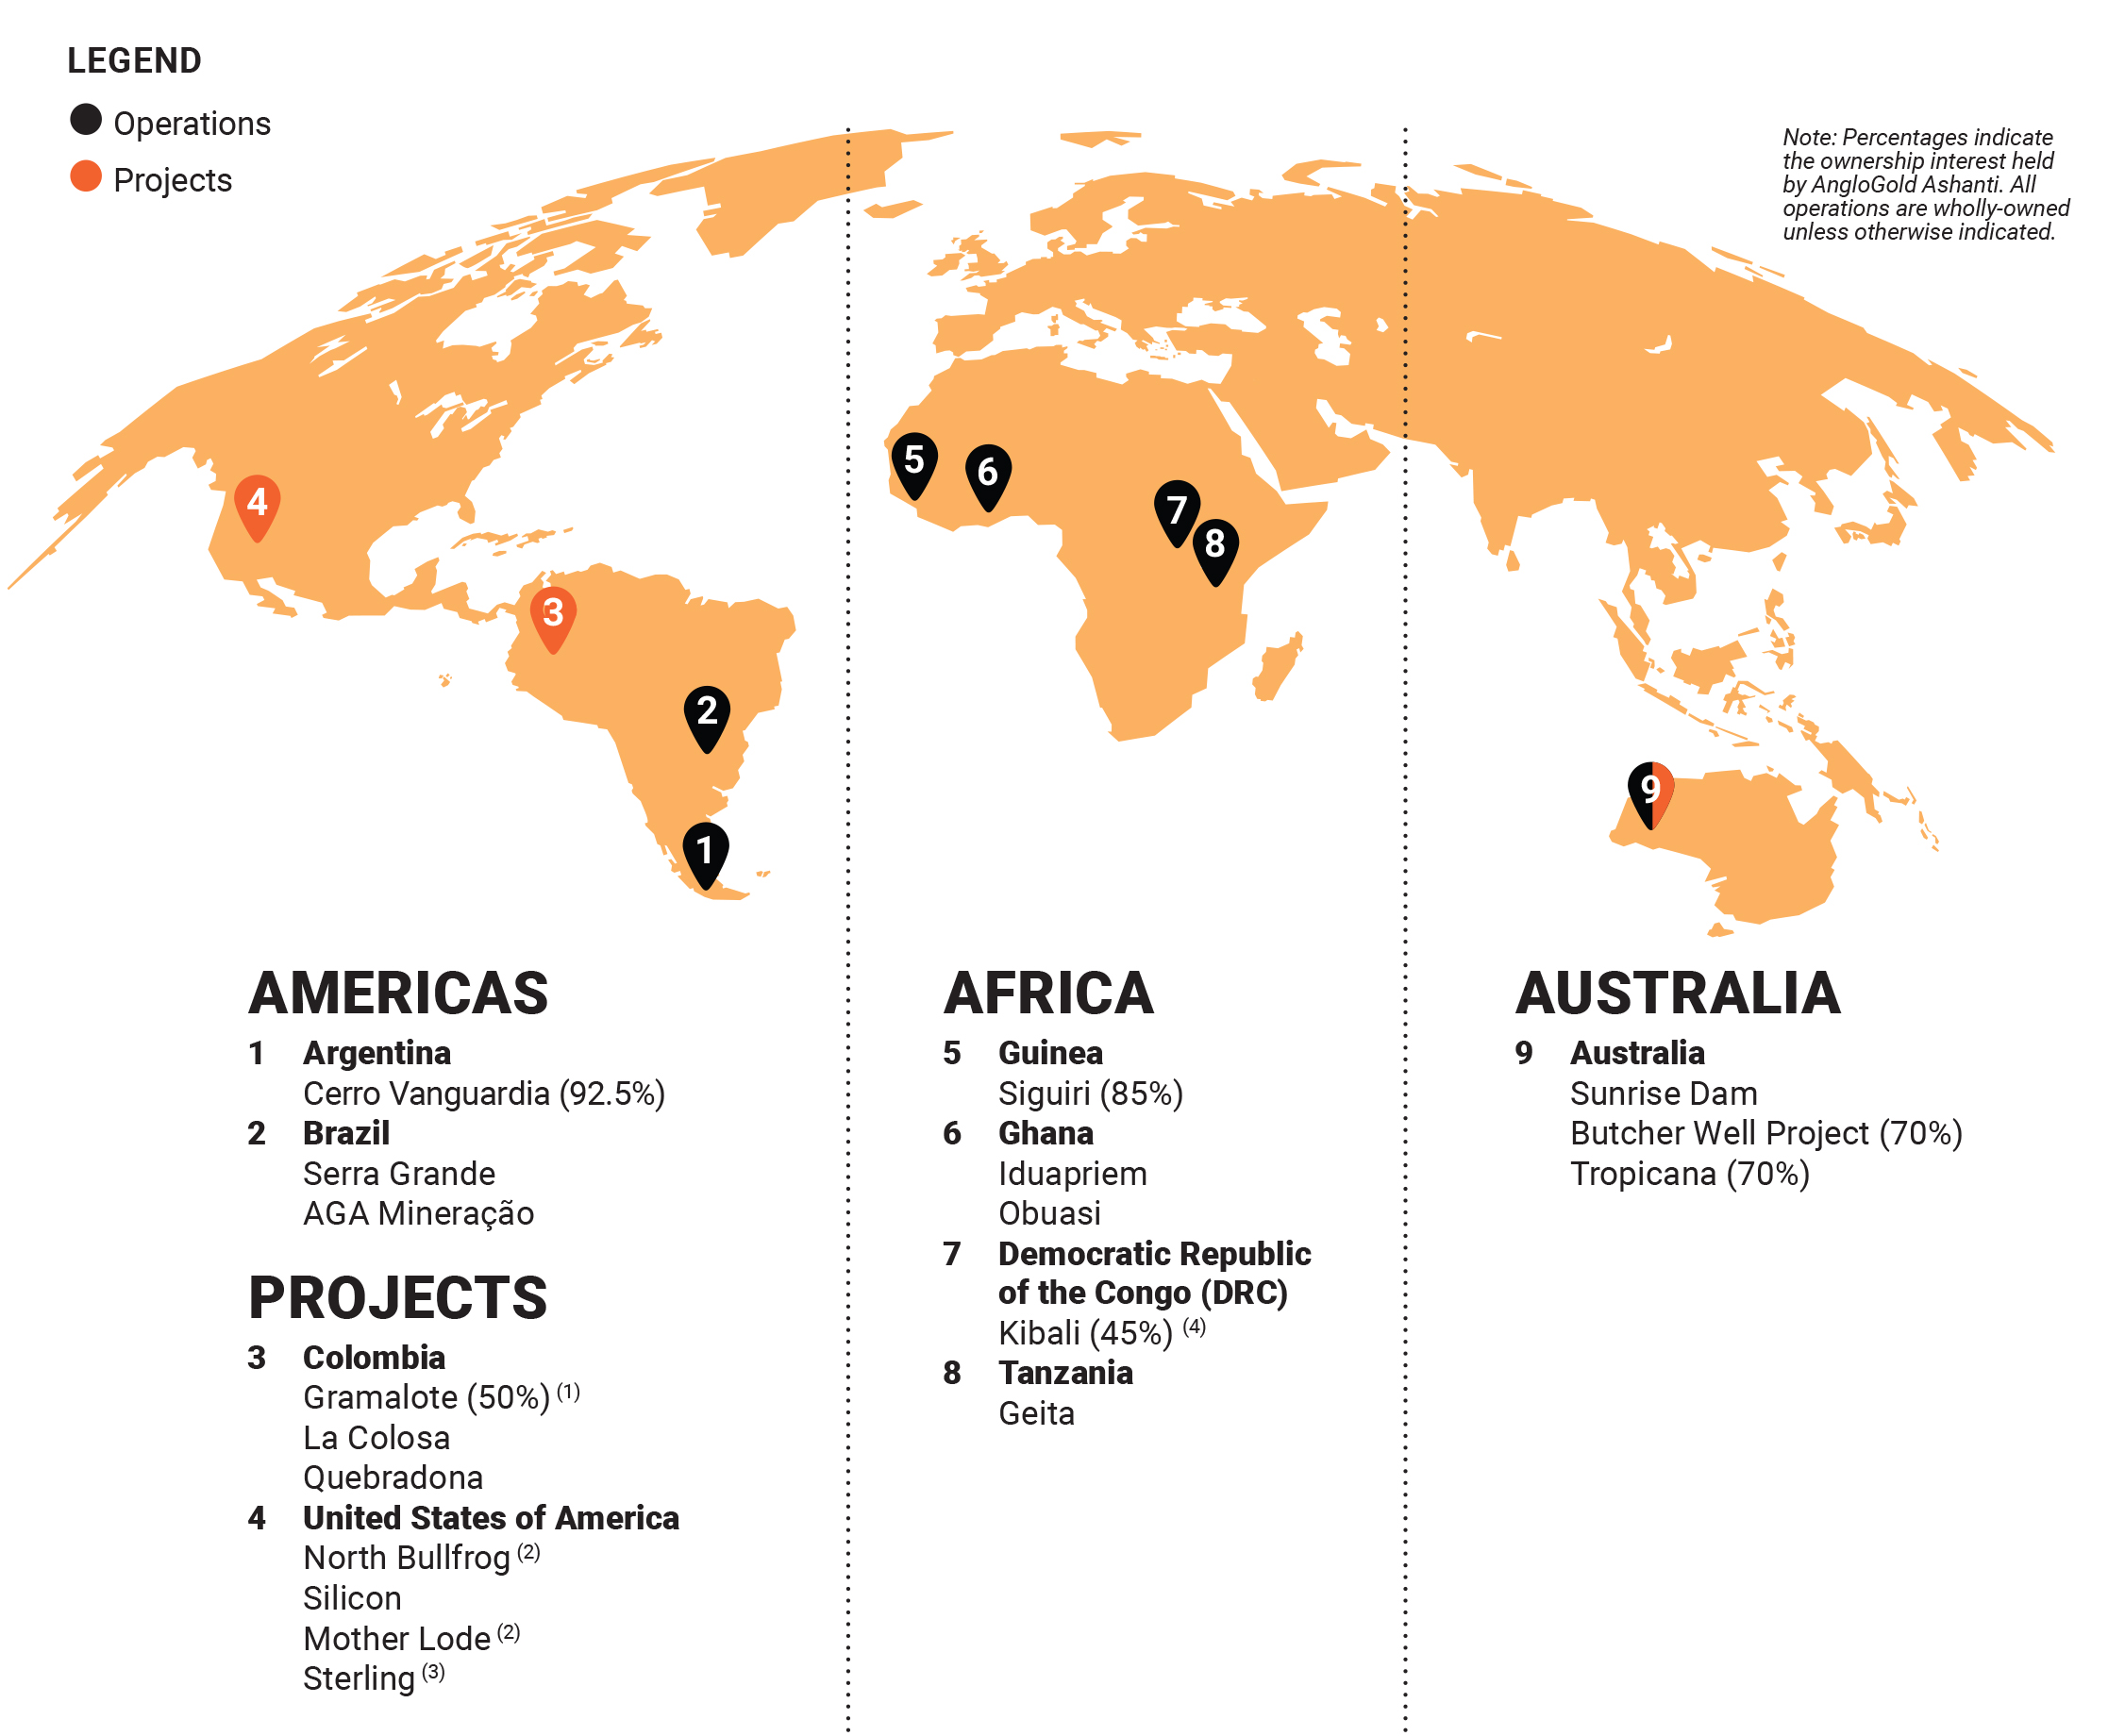
Operations and projects
Notes
(1) Gramalote is managed by B2Gold Corp ("B2Gold").
(2) AngloGold Ashanti acquired North Bullfrog and Mother Lode as part of the Corvus Gold Inc. ("Corvus Gold") acquisition in January 2022.
(3) AngloGold Ashanti acquired Sterling through the Coeur Sterling, Inc. ("Coeur Sterling") acquisition in November 2022.
(4) Kibali is operated by Barrick Gold Corporation ("Barrick").
80
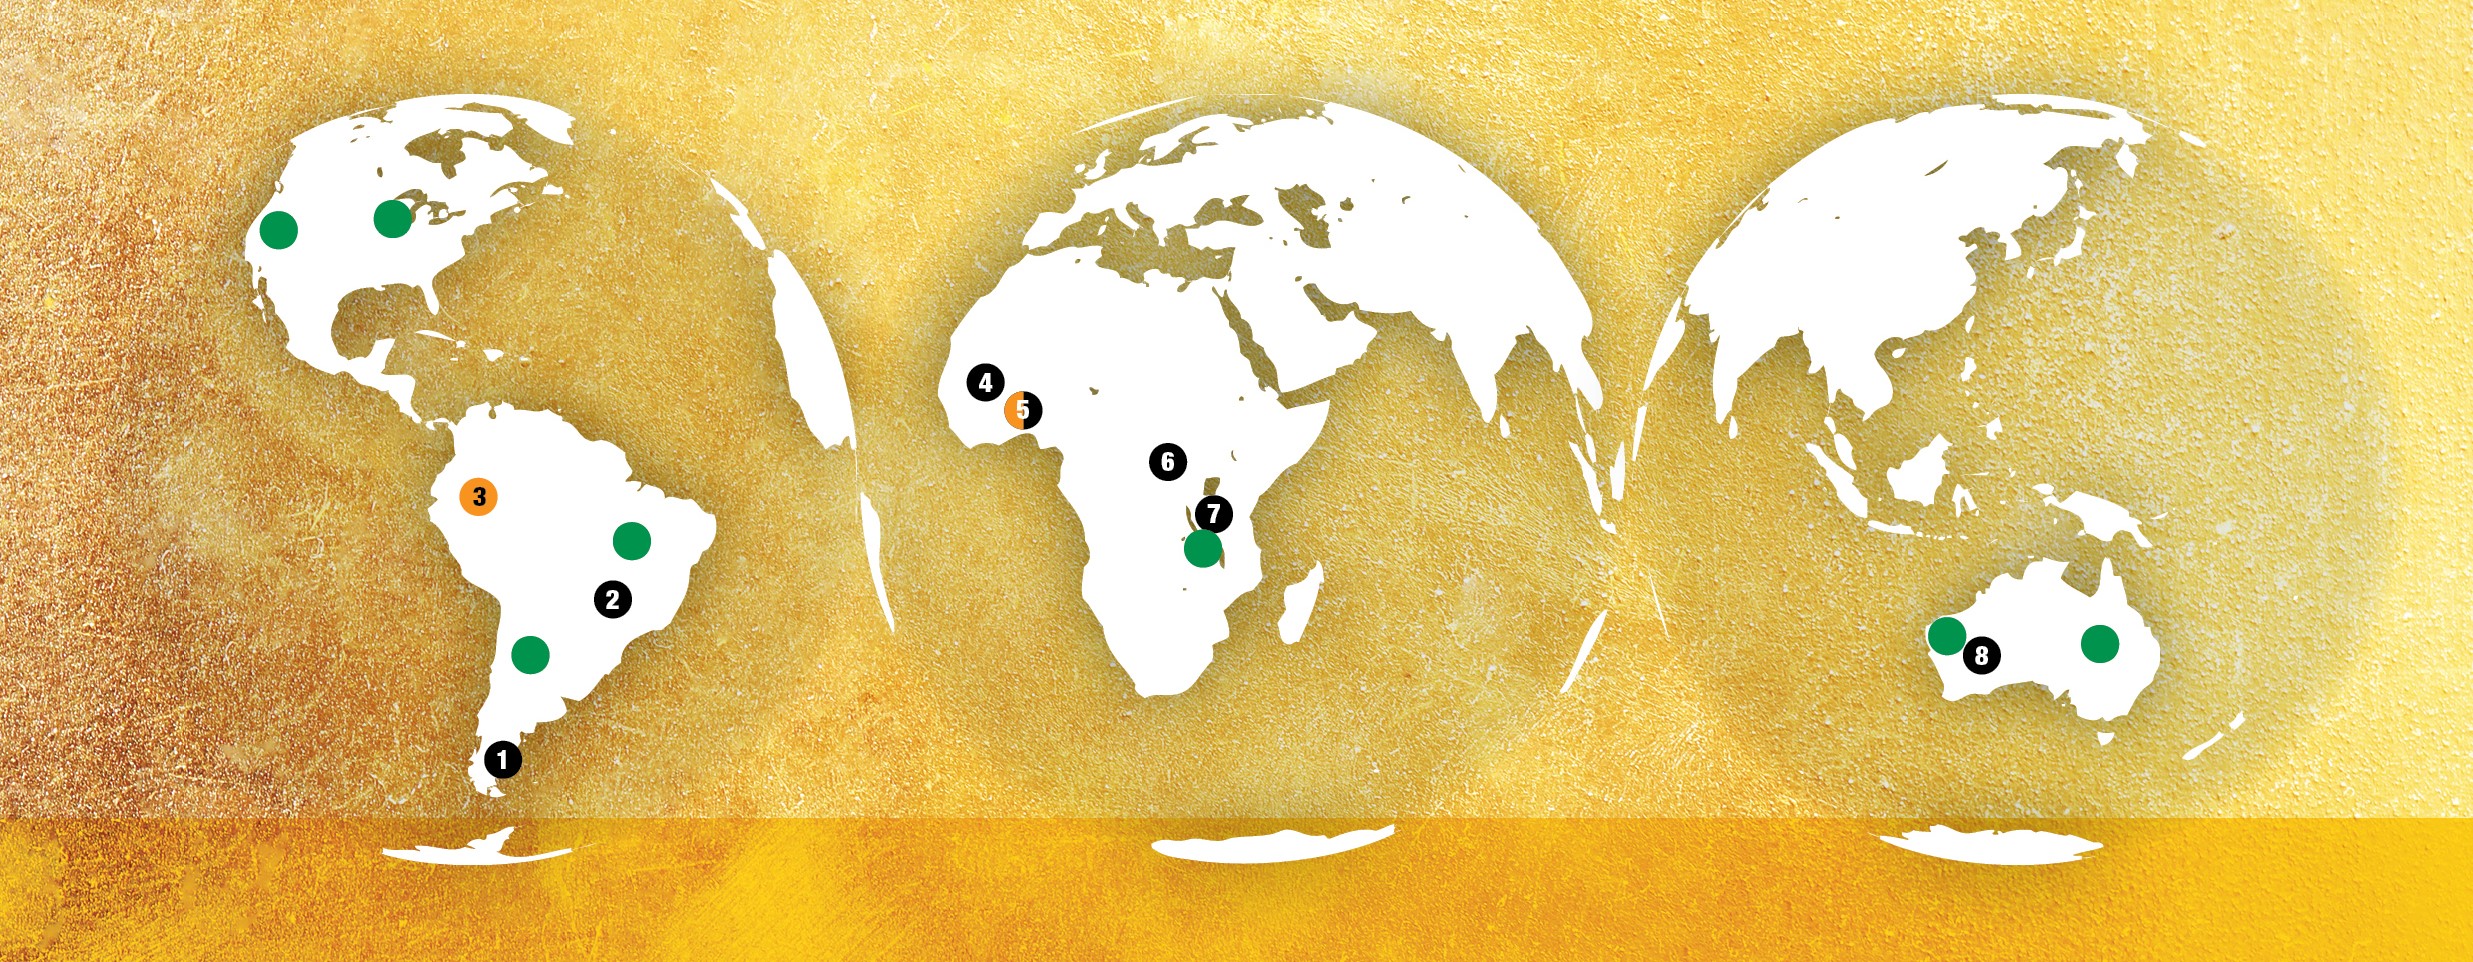
| AMERICAS | AFRICA REGION | AUSTRALIA | |||||||||||||||
| 1 | Argentina | 4 | Guinea | 8 | Australia | ||||||||||||
| Cerro Vanguardia (92.5%) | Siguiri (85%) | Sunrise Dam | |||||||||||||||
| 2 | Brazil | 5 | Ghana | Tropicana (70%) | |||||||||||||
| Serra Grande | Iduapriem | ||||||||||||||||
| AGA Mineração | Obuasi(4) | ||||||||||||||||
| 3 | Colombia | 6 | DRC | ||||||||||||||
Gramalote (50%)(1) | Kibali (45%)(5) | ||||||||||||||||
| La Colosa | 7 | Tanzania | |||||||||||||||
| Quebradona | Geita | ||||||||||||||||
| United States (exploration) | |||||||||||||||||
In 2020, our portfolioAustralia, with a few exceptions, all onshore minerals are owned by the Crown. The respective Minister for each state and territory is responsible for administering the relevant mining legislation enacted by the states and territories. Native title legislation applies to certain mining tenements within Australia. Australia recognises and protects a form of ten operationsnative title that reflects the entitlement of Aboriginal people to their traditional lands in eight countries, includes long-life operating assetsaccordance with differing ore body types locatedtheir traditional custom and laws. Should native title claims or determinations exist, certain native title processes and procedures will apply under the Native Title Act 1993 (Cth) (the “Native Title Act”) before the tenure is granted. Tenure may be granted subject to conditions relating to native title rights. In the mining context, native title matters are managed as part of the tenement grant process. If disputes arise in key gold-producing regions aroundrelation to the world. These operating assets were supported by three greenfields projects in Colombiagrant of a particular tenement, they can be referred to the National Native Title Tribunal, established under the Native Title Act, for resolution. Native title legislation also provides a framework for compensation to be paid for acts that affect native title rights and a focused global exploration programme, including explorationinterests. Ordinarily, the relevant Commonwealth or State government is liable to pay compensation for acts attributable to it. However, in the United States.state of Western Australia, the Mining Act 1978 (WA) provides that an applicant for the grant of, or the holder of, a mining tenement is responsible for native title compensation, if determined to be payable, to native title holders.
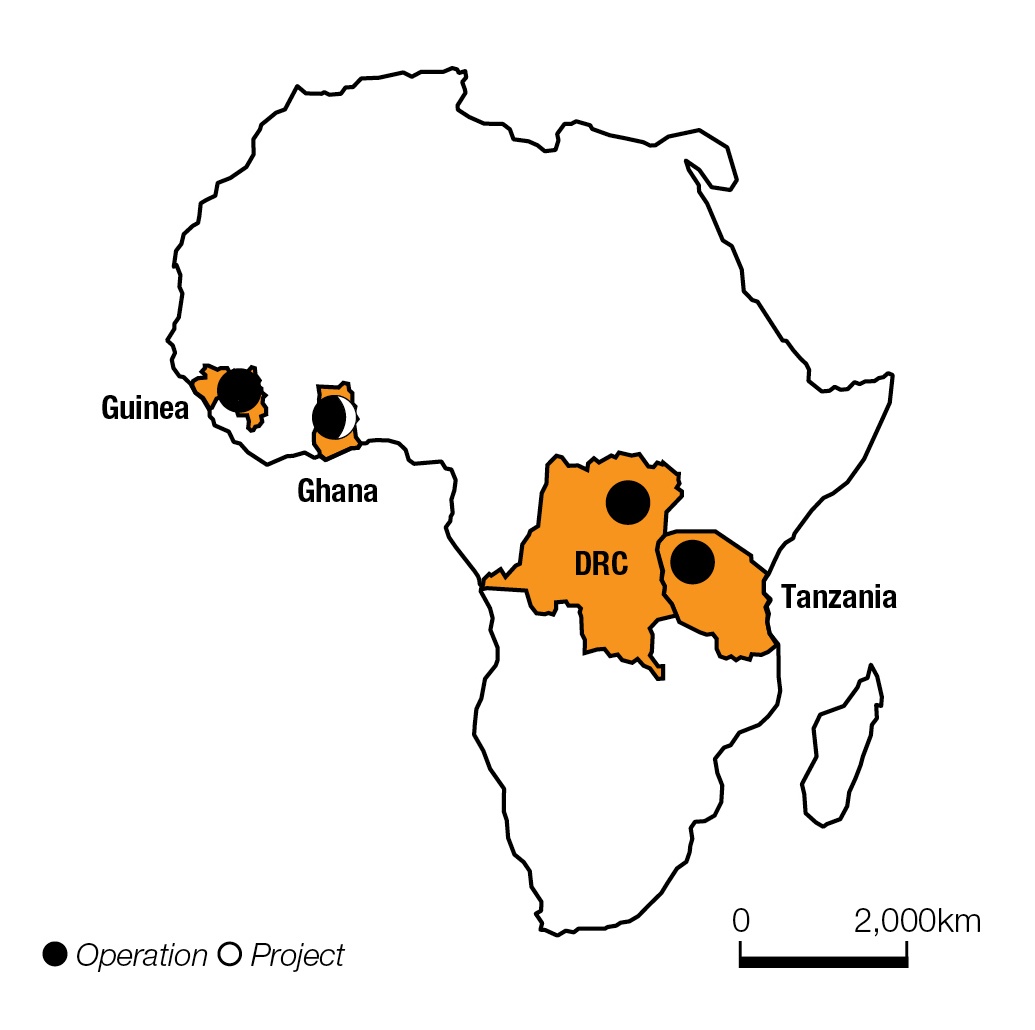 |  | ||||
AngloGold Ashanti’s operating properties are located in the state of Western Australia where tenure is issued under, and mining operations are governed by, the Mining Act 1978 (WA). The most common forms of tenure in Western Australia are exploration and prospecting licences, mining leases, miscellaneous licences and general purpose leases. In most Australian states, if the holder of an exploration licence establishes indications of an economic mineral deposit in the area covered by the exploration licence and complies with the conditions of the grant, the holder of the exploration licence has a priority right against all others to be granted a mining lease which gives the holder exclusive mining rights with respect to minerals on the property.
It is possible for an individual or entity to own an area of land (including for infrastructure purposes) and for another individual or entity to be granted the right to explore for or mine any minerals located on or under the surface of the same area. The maximum initial term of a mining lease in Western Australia is 21 years and the holder has the right to renew the lease for an additional 21 years. Subsequent renewals are granted at the discretion of the respective state or territory’s minister responsible for mining rights. In Western Australia, mining leases can only be assigned with the prior written consent of the minister.
Tax laws relating to mining
Government royalties are payable by the holder of mining tenure in respect of minerals obtained from the relevant area of land at the rates specified in the relevant legislation in each state or territory. The royalty on gold production in Western Australia is payable quarterly at a fixed rate of 2.5 percent of the royalty value of gold metal produced. The royalty value is calculated by multiplying the amount of gold produced during a given month by the average gold spot price for that month. In addition, the holder of a mining tenement is required to pay annual rent in respect of the tenement. In Western Australia there is a minimum annual expenditure requirement for prospecting and exploration licences and mining leases. Exemptions from the expenditure requirement can be obtained if certain conditions are satisfied.
Environmental laws relating to mining
Mining tenements will be granted with endorsements and conditions relating to protection of the environment. Exploration and mining operations may also require separate approval from the state, territory or federal environment minister, which may require completion of an environmental impact assessment (including a public consultation period) pursuant to applicable environmental protection legislation prior to commencement. Further, a works 'construction' approval and an operating licence under the relevant environmental protection legislation in the state or territory may also be required for certain mine processing or mining-related operations. In Western Australia, legislation removing the distinction between “works approvals” and “licenses” is expected to enter into force in December 2023 such that, following the effective date, only a “license” will be required for “prescribed activities”, which include relevant works and operations on a mining lease, and not a separate “works approval”. Depending on the jurisdiction, additional approvals may be required for the removal of native vegetation within the tenement, and the taking and use of water for exploration and mining operations.
AngloGold Ashanti’s rights and permits
AngloGold Ashanti has been granted 21-year term mining leases with rights of renewal to all of its mining areas in Australia, including its proportionate share of joint venture operations and accordingly it has, together with its joint venture partners where applicable, the exclusive right to mine in those areas. Both the Group and its joint venture partners are fully authorised to conduct operations in accordance with relevant laws and regulations. The mining leases and rights of renewal cover the current life-of-mine at AngloGold Ashanti’s operations in Australia.
At year end, AngloGold Ashanti had five operationsSunrise Dam, one mining lease (M39/1116) covers the deposit and mine infrastructure (approximately 7,808 hectares) and another mining lease (M39/1117) covers the water extraction infrastructure used to supply the operation with water (approximately 1,768 hectares). Both leases are currently in the Africa region, four of which we manage and one of which is managed by Barrick. The Obuasi redevelopment project, which was commissionedgood standing, with expiry dates in 2020, is on track to achieve steady-state production during 2021. The sale of Morila was completed on 10 November 2020 and the sale of Sadiola was completed on 30 December 2020.2038.
| Attributable gold production (000oz) | Average number of employees | ||||||||||
| Subsidiary operations | |||||||||||
| Ghana | |||||||||||
| Iduapriem | 275 | 1,774 | |||||||||
| Obuasi | 30 | 4,210 | |||||||||
| Guinea | |||||||||||
| Attr. Siguiri 85% | 215 | 3,016 | |||||||||
| Tanzania | |||||||||||
| Geita | 623 | 5,496 | |||||||||
| Joint venture operations | |||||||||||
| Democratic Republic of the Congo | |||||||||||
| Attr. Kibali 45% | 364 | 2,333 | |||||||||
65
At Tropicana, the deposit is situated upon a single mining lease (M39/1096) covering approximately 27,228 hectares, which is currently in good standing, with an expiry date in 2036.
| Unit | 2020 | 2019 | 2018 | ||||||||||||||||||||
| Subsidiary operations | |||||||||||||||||||||||
| Tonnes treated/milled | Mt | 20.1 | 19.1 | 19.5 | |||||||||||||||||||
| Pay limit | oz/t | 0.034 | 0.039 | 0.040 | |||||||||||||||||||
| g/t | 1.160 | 1.330 | 1.372 | ||||||||||||||||||||
| Recovered grade | oz/t | 0.052 | 0.060 | 0.049 | |||||||||||||||||||
| g/t | 1.77 | 1.77 | 1.69 | ||||||||||||||||||||
| Gold production (attributable) | 000oz | 1,143 | 1,094 | 1,060 | |||||||||||||||||||
| Cost of sales | $m | 1,232 | 1,173 | 1,127 | |||||||||||||||||||
Total cash costs (1) | $/oz | 797 | 801 | 813 | |||||||||||||||||||
All-in sustaining costs (1) | $/oz | 975 | 947 | 941 | |||||||||||||||||||
| Capital expenditure | $m | 345 | 359 | 246 | |||||||||||||||||||
| Safety | |||||||||||||||||||||||
| Number of fatalities | 2 | 0 | 0 | ||||||||||||||||||||
| AIFR | Per million hours worked | 0.55 | 0.62 | 0.51 | |||||||||||||||||||
| People | |||||||||||||||||||||||
| Average no of employees: Total | 14,496 | 12,847 | 11,490 | ||||||||||||||||||||
| Permanent employees | 5,433 | 4,939 | 4,625 | ||||||||||||||||||||
| Contractors | 9,063 | 7,908 | 6,865 | ||||||||||||||||||||
| Unit | 2020 | 2019 | 2018 | ||||||||||||||||||||
| Joint venture operations | |||||||||||||||||||||||
| Tonnes treated/milled | Mt | 3.4 | 7.5 | 7.8 | |||||||||||||||||||
| Pay limit | oz/t | 0.048 | 0.037 | 0.041 | |||||||||||||||||||
| g/t | 1.640 | 1.255 | 1.403 | ||||||||||||||||||||
| Recovered grade | oz/t | 0.096 | 0.060 | 0.053 | |||||||||||||||||||
| g/t | 3.29 | 1.85 | 1.81 | ||||||||||||||||||||
| Gold production (attributable) | 000oz | 364 | 445 | 452 | |||||||||||||||||||
| Cost of sales | $m | 340 | 428 | 480 | |||||||||||||||||||
Total cash costs (1) | $/oz | 629 | 657 | 680 | |||||||||||||||||||
All-in sustaining costs (1) | $/oz | 810 | 767 | 820 | |||||||||||||||||||
| Capital expenditure | $m | 52 | 51 | 67 | |||||||||||||||||||
| Safety | |||||||||||||||||||||||
Number of fatalities(2) | n/a | 0 | 0 | ||||||||||||||||||||
AIFR (2) | Per million hours worked | n/a | 0.65 | 0.29 | |||||||||||||||||||
| People | |||||||||||||||||||||||
| Average no of employees: Total | 2,333 | 2,939 | 3,343 | ||||||||||||||||||||
| Permanent employees | 824 | 1,192 | 1,072 | ||||||||||||||||||||
| Contractors | 1,509 | 1,747 | 2,271 | ||||||||||||||||||||
AMERICAS
Argentina
General laws relating to mining and all-in sustaining costsland ownership
Mining regime
The Argentinean Mining Code governs mining activity in the country. Special regimes exist for hydrocarbons and nuclear minerals. In the case of most minerals, the Argentinean Mining Code establishes that the owner of the land is not the owner of the mineral rights; these are non-GAAP measures. For further informationheld by the national or provincial governments (depending on these non-GAAP measures, see “Item 5A: Operating Results-Non-GAAP analysis”the location of the minerals). The national or provincial government, as applicable, is required by the Argentinean Mining Code to grant whomever discovers a new mine title to the mining concession.
Holders of mining concessions must comply with three main conditions: payment of an annual fee, investment of a minimum amount of capital, and the carrying out of a reasonable level of exploitation. Failure to do so could lead to forfeiture of the mining concession, which would then revert back to the Province.
In addition to the Argentinean Mining Code, between 1993 and 1995, Argentina implemented several federal laws to offer foreign companies attractive incentives for exploration and mining in Argentina, the Mining Investment Law (Law No. 24, 196), as amended (the “Mining Investment Law”), and related legal provisions being the most important one. Such incentives include, among other matters, import duty exemptions, accelerated depreciation of fixed assets, a three percent cap on provincial royalties set at pit-head value on the mineral extracted, value added tax refunds for exploration-related expenses incurred by companies registered under the Mining Investment Law, and, subject to the filing of a feasibility study for the relevant mining project, a 30-year stability as to the tax burden on the project and the customs and foreign exchange regimes and duties. Cerro Vanguardia S.A. (“CVSA”) obtained its tax, customs and foreign exchange stability certificate in 1996.
Glacier Law
On 30 September 2010, the National Law on Minimum Requirements for the Protection of Glaciers (Law No. 26, 639) (the “Glacier Law”) was enacted in Argentina, banning new mining exploration and exploitation activities on glaciers and “peri-glacial” areas. The Glacier Law establishes a broad definition of “peri-glacial” areas that, together with glacial areas, must be surveyed by an existing national government agency specifically appointed to this end every five years. The area where the Cerro Vanguardia project is managed by Barrick andlocated does not AngloGold Ashanti. For years priorinclude any glaciers or peri-glacial areas according to 2020, amounts are inclusivethe inventory of amounts pertaining to Sadiola,glaciers which was soldpublished in 2020.June 2018.
Rural Land Law
On 27 December 2011, the Argentinean National Congress passed a law on the Regime for Protection of National Domain over Ownership, Possession or Tenure of Rural Land (Law No. 26, 737) (the “Rural Land Law”) which implemented a set of rules restricting the ownership of rural land by foreigners (including foreign individuals or any kind of legal entity controlled by foreign individuals or legal entities). The main restrictions are as follows: (i) foreigners cannot own in the aggregate more than 15 percent of the entire rural land of Argentina, the same cap being applicable to each Province and Municipality; (ii) foreigners will not be allowed to purchase more than 1,000 hectares in the so-called “zona núcleo”, which comprises the main agricultural areas of central Argentina or an “equivalent” surface depending on the location of the land and its productive potential; and (iii) foreigners will not be allowed to buy land that contains, or is adjacent to, relevant and permanent water bodies (such as rivers and lakes). Although exploration permits and mining concessions are not the subject matter of the restrictions placed by the Rural Land Law, certain rights granted to foreign mining companies under the Argentinean Mining Code may be restricted by this
Foreign exchange and export rules
Foreign exchange controls
On 1 September 2019, by means of Executive Decree No. 609/2019 (the “Export Controls Decree”), the Argentinean national government reinstated foreign exchange and export controls. The Export Controls Decree and related regulations of the Central Bank of Argentina impose, among other measures, the obligation of Argentinean residents to transfer to Argentina and/or sell for Argentinean pesos in the Argentinean foreign exchange market (mercado de cambios) the countervalue (contravalor) from their exports of goods within a specified period. The export of goods is regulated by the Consolidated Text on “Foreign Trade and Exchange” issued by the Argentinean Central Bank (as amended from time to time) which establishes the specific regulatory requirements to implement the measures adopted by the national government in this area. Prior approval of the Argentinean Central Bank is generally required to access the foreign exchange market for transactions relating to the outflow of funds, except in certain circumstances.
In October 2022, the Argentinean national government implemented the Argentinean System of Imports (Sistema de Importaciones de la República Argentina) (“SIRA”) and the Argentinean System of Imports and Foreign Payments of Services (Sistema de Importaciones de la República Argentina y Pagos de Servicios al Exterior). Importers must obtain a SIRA approval in the form of a SIRA certificate for the import of goods and to access the foreign exchange market for payments in connection with the import of goods. Additionally, from 1 January 2023, Argentinean residents, such as CVSA, must comply with certain supplementary provisions in order to access the foreign exchange market without prior approval of the Argentinean Central Bank, unless an exception applies.
CVSA had a solid performance with gold productioncash balance equivalent to $116 million at 31 December 2022. The cash balance is available to be paid to AngloGold Ashanti’s offshore ($105 million (equivalent)) and onshore ($15 million (equivalent)) investment holding companies in the form of 275,000oz maintainingdeclared dividends. Applications have been made to the record production levelArgentinean Central Bank to approve the purchase of U.S. dollars in order to distribute offshore dividends related to the 2019, 2020 and 2021 financial years of $105 million (equivalent) to AngloGold Ashanti. Also, under a special regime established for dividend payments, a new petition to distribute a portion of the previous year. This performanceoffshore dividends applied for, in the amount of $54 million (equivalent), was primarily duesubmitted to the 2% improvement in plant feed, supported by higher grades following implementationArgentinean Central Bank during the third quarter of 2022. In December 2022, the grade improvement project during 2020. Improved grades were partly offset by a 2% decline in tonnes treated dueArgentinean Central Bank approved, based on the applications submitted under this special regime, the payment of $17 million (equivalent) to challenges experienced in treating harder ore material. An additional tertiary ore crushing stage is being constructed to reduce the feed size to the milling circuit to deal with the increased rock hardness as deeper ore is extracted. In the second half of 2020, a decision was made to accelerate waste stripping at the Teberebie Cut 2 at the Block 7 and 8 pit, with some of the waste stripping planned for 2021 brought forward to the fourth quarter in 2020.AngloGold Ashanti. As a result, mined volumes increased onduring 2022, AngloGold Ashanti received offshore dividends from CVSA in a total amount of $17 million (net of withholding taxes) paid in U.S. dollars. While the back of this investment, withremaining approvals are pending, the operation on track to accelerate ore delivery to the mill. Waste stripping here will continue into 2021. This strategic investment will assist the operation to reach the ore zone earlier, thus increasing confidence in planned gold productioncash remains fully available for 2021.CVSA’s operational and exploration requirements.
On 9 June 2022, the Argentinean tax and mining authorities published a resolution (RC 5205/2022) establishing a new administrative procedure to be followed to obtain the reimbursement or compensation of federal taxes paid in excess of the total tax burden provided for by the applicable tax stability guarantee (the “2022 Procedure”). This 2022 Procedure replaces the 2019 Procedure established by RC 4428/2019. On 20 September 2022, CVSA submitted its claim for compensation for the export duties in respect of fiscal year 2021, which amounted to approximately $11.2 million as of 31 December 2022, pursuant to the 2022 Procedure. This claim is currently under review by the National Mining Secretary.
In total, AngloGold Ashanti’s net export duty receivables (after discounting provisions) in Argentina amounted to $9 million as of 31 December 2022.
Environmental laws relating to mining
Any mining company wishing to commence or modify any mining-related activity, as defined by the Argentinean Mining Code, including prospecting, exploration, exploitation, development, preparation, extraction, and storage of mineral substances, as well as property abandonment or mine closure activity, is required to prepare and submit to the competent provincial environmental authority an Environmental Impact Assessment (“EIA”) prior to commencing the work. Each EIA is required to describe the nature of the proposed work, its potential risk to the environment, and the measures that will be taken to mitigate that risk. If accepted by the competent authority, the EIA is used as the basis to create a Declaration of Environmental Impact (“DEI”) to which the mining company is required to adhere during the mining-related activity at issue. The DEI is required to be updated at least on a biannual basis. Sanctions and penalties for non-compliance with the DEI are outlined in the Environmental Protection section of the Argentinean Mining Code, and may include warnings, fines, suspension of quality certifications, obligations to restore the environment, temporary or permanent closure of activities, and withdrawal of authorisation to conduct mining-related activities.
AngloGold Ashanti’s rights and permits
The mining concession holder of Cerro Vanguardia, the Company’s operation in Argentina, is AngloGold Ashanti’s partner, Fomento Minero de Santa Cruz S.E. (“Fomicruz”), which is wholly owned by the Santa Cruz Province. On 27 December 1996, Fomicruz entered into a usufruct agreement whereby CVSA was granted an irrevocable right to exploit the Cerro Vanguardia deposit (encompassing an area of approximately 543 km2) for a 40-year period. The mining licence (402642/CV/97), which covers the full Mineral Reserve, expires on 26 December 2036. CVSA is a corporation incorporated in Argentina indirectly controlled by AngloGold Ashanti (92.5 percent), with Fomicruz as minority shareholder (7.5 percent). On 14 August 1996, CVSA obtained its tax, customs and foreign exchange stability certificate, which expires in 2026.
Brazil
General laws relating to mining and land ownership
The total attributable Africa Region Ore Reserve was 19.12 million ounces (2019: 17.93 million ounces). This amountsBrazilian Constitution of 1934 states that, for purposes of exploration and exploitation, deposits and other Mineral Resources constitute property separate from the soil and belong to 65 percentthe Federal Union. Exploration and exploitation of such Mineral Resources may take place only with the group’s Ore Reserve.Federal Union’s concession and in such a way as to protect the national interest. Federal law sets out penal and administrative sanctions for conduct and activities deemed harmful to the environment.
Under the current Brazilian Mining Code, there are two kinds of mines: (i) claimstake mines (minas manifestadas), for which rights were acquired before 1934 and exist independently of any mining licence or authorisation from the Federal Government and for which the Mineral Resources constitute property of the landowner, and (ii) granted mines, which are those that rely on grants from the Federal Government for mineral exploration or exploitation (pursuant to the Brazilian Constitution of 1988). AngloGold Ashanti’s operations in parallel with the construction scheduleBrazil consist of both claimstake mines and progress is being made in the second production area at Block 8-Lower.granted mines.
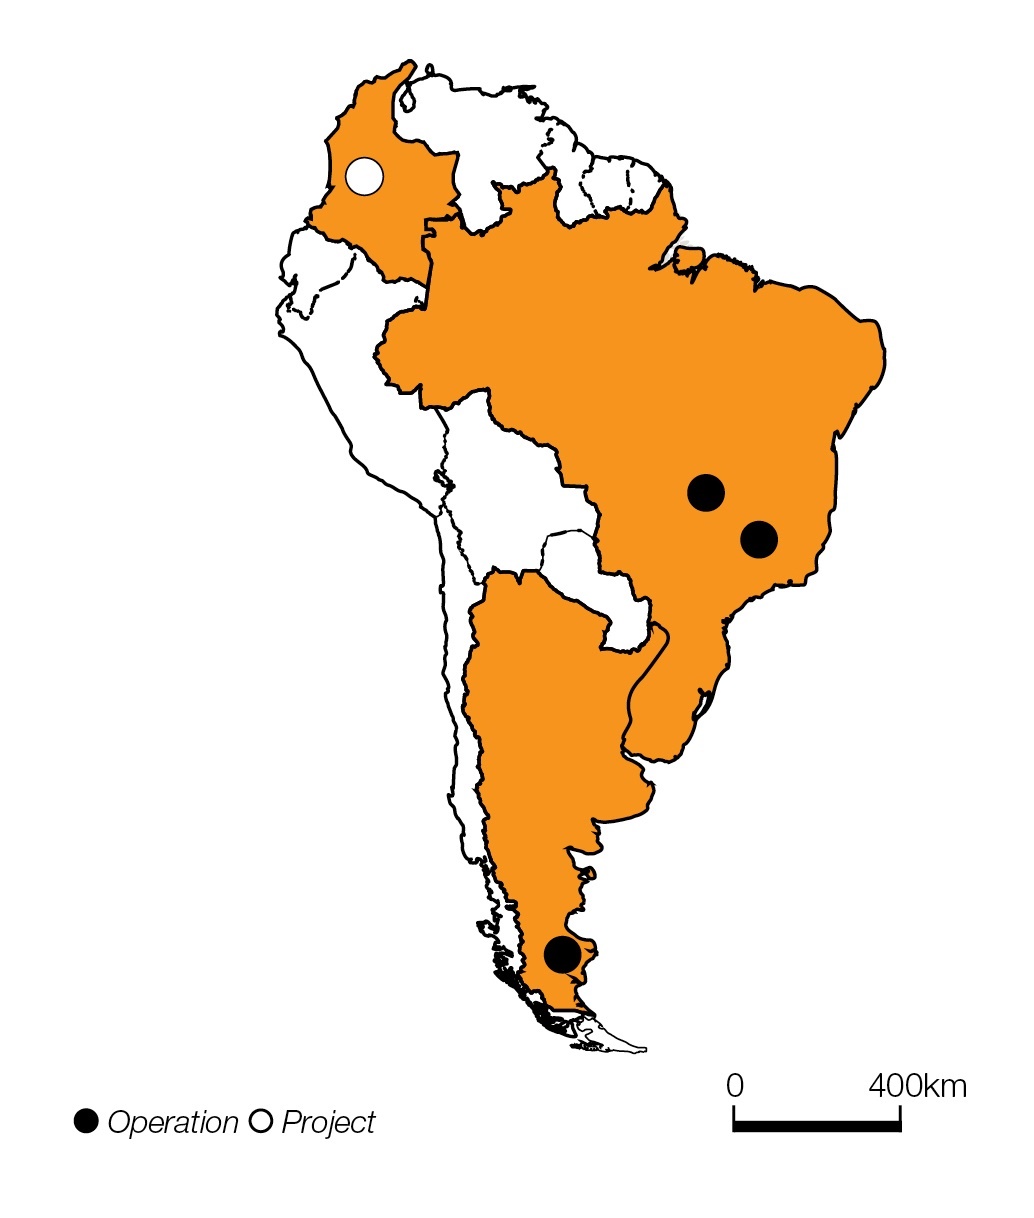 |  | ||||
| Attributable gold production (000oz) | Average number of employees | ||||||||||
| Operations | |||||||||||
1. Argentina | |||||||||||
| Cerro Vanguardia (Attr. 92.5%) | 173 | 1,566 | |||||||||
2. Brazil | |||||||||||
| AGA Mineração | 362 | 5,528 | |||||||||
| Serra Grande | 114 | 1,695 | |||||||||
| Unit | 2020 | 2019 | 2018 | ||||||||||||||||||||
| Operation | |||||||||||||||||||||||
| Tonnes treated/milled | Mt | 7.5 | 7.2 | 6.8 | |||||||||||||||||||
| Pay limit | oz/t | 0.07 | 0.11 | 0.12 | |||||||||||||||||||
| g/t | 2.46 | 3.79 | 4.14 | ||||||||||||||||||||
| Recovered grade | oz/t | 0.081 | 0.089 | 0.103 | |||||||||||||||||||
| g/t | 2.77 | 3.04 | 3.55 | ||||||||||||||||||||
| Gold production (Attributable) | 000oz | 649 | 710 | 776 | |||||||||||||||||||
| Silver (attributable) | Moz | 3.3 | 3.4 | 5.9 | |||||||||||||||||||
| Cost of sales | $m | 764 | 822 | 838 | |||||||||||||||||||
Total cash costs (1) | $/oz | 721 | 736 | 624 | |||||||||||||||||||
All-in sustaining costs (1) | $/oz | 1,003 | 1,032 | 855 | |||||||||||||||||||
Capital expenditure (2) | $m | 217 | 195 | 176 | |||||||||||||||||||
| Safety | |||||||||||||||||||||||
| Number of fatalities | 0 | 0 | 1 | ||||||||||||||||||||
| AIFR | Per million hours worked | 3.68 | 3.50 | 3.97 | |||||||||||||||||||
| People | |||||||||||||||||||||||
| Average no of employees: Total | 8,789 | 8,114 | 7,973 | ||||||||||||||||||||
| Permanent employees | 6,158 | 5,869 | 5,755 | ||||||||||||||||||||
| Contractors | 2,631 | 2,245 | 2,218 | ||||||||||||||||||||
At the end of 2011 and the beginning of 2012, the states of Minas Gerais, Pará, Amapá and Mato Grosso do Sul each created a new “inspection and control” tax (duty) on extraction and exploration activities as well as on the use of Mineral Resource carried out in those states. In the state of Minas Gerais, gold ore and silver ore are exempted from the collection of this new duty. At the end of 2020, the total attributable Ore Reserve forstate of Goiás created a new “inspection and control” tax (duty) on extraction and exploration activities carried out in this state, which currently still needs to be implemented. The constitutionality of these “inspection and control” taxes was upheld by the Americas region was 7.52 million ounces (2019: 7.2 million ounces). This is approximately 25 percentSupreme Court of the group’s total Ore Reserve.Brazil on 1 August 2022.
Following the catastrophic failure of a tailings storage facility (“TSF”) at the Córrego do Feijão iron ore mine owned by Vale at Brumadinho in the state of Minas Gerais in Brazil in January 2019, executive, legislative and improvementjudiciary bodies, both at the federal and state levels, have generally increased scrutiny of mining operations in Brazil, and of TSFs in particular, and have been considering, and in some cases have adopted, stricter laws and regulations applicable to the approval, licensing, construction, management, closure and decommissioning of TSFs in Brazil.
At the federal level, the ANM issued Resolution No. 13/19 in August 2019 (replacing its earlier Resolution No. 4/19) which adopted additional regulatory measures to ensure the stability of TSFs, in particular those built or heightened by the upstream method or by any method declared as “unknown”. Among other things, ANM Resolution No. 13/19 prohibits the upstream method for the construction or heightening of tailings dams throughout the national territory of Brazil. It further requires operators to cease all storage and disposal activities at TSFs (known as “deactivation” or “desativação”) constructed or heightened upstream or by an “unknown” method by 15 September 2021 as well as to decommission such TSFs by 15 September 2022 to 15 September 2027 (depending on the capacity volume). To comply with the terms of ANM Resolution No. 13/19, the Serra Grande tailings dam in the state of Goiás must be decommissioned by 15 September 2025. The Serra Grande mine completed the process of reinforcing the dam walls of its upstream TSF, deactivating the TSF and migrating to dry-stacking operations, each by the 15 September 2021 deadline.
Furthermore, Federal Law No. 14.066/20, adopted in October 2020, also imposes requirements on companies to decommission upstream TSFs, including the Serra Grande tailings dam, by 25 February 2022 (which date is earlier than required by ANM Resolution No. 13/19). However, Federal Law No. 14.066/20 does permit extensions of the compliance deadline, with the consent of the ANM based on the technical plan for decommissioning. Serra Grande submitted timely requests to obtain an extension of the compliance deadline until 2025 in line with the timeline set forth in ANM Resolution No. 13/19 and presented its technical plan for decommissioning. On 26 May 2022, the ANM issued a technical note allowing the extension until 2025. With respect to downstream (or “centerline”) TSFs, Federal Law No. 14.066/20 requires companies, to the extent that communities are located in the self-rescue zone of those TSFs, to implement one of the following measures for such structures: either (i) the structure must be deactivated and decommissioned, (ii) the population must be relocated, with reparations for loss of cultural heritage, or (iii) reinforcement works that guarantee the effective stability of the structure must be carried out, by decision of the public authorities, taking into account the previous nature of the dam in relation to the occupation and technical-financial viability of the alternatives. Even if reinforcement works are completed, deactivation and decommissioning of those TSFs will be required at the end of the life of the mine. All of the TSFs operated by AngloGold Ashanti in Brazil have communities located in self-rescue zones.
69
As of 31 December 2022, AngloGold Ashanti has fully transitioned to dry-stacking operations for tailings storage at each location in Brazil. Capital expenditures required in 2022 to implement this new technology amounted to approximately $83 million. Capital expenditures for work required to comply with TSF-related requirements during the period 2023-2025 are expected to be material but, based on preliminary estimates to date, AngloGold Ashanti anticipates that annual expenditures for each of these years will be less than in prior years and will decline over time. Neither ANM Resolution No. 13/19 nor Federal Law No. 14.066/20 requires removal of all tailings material in connection with the decommissioning of TSFs (a process known as “decharacterisation” or “descaracterização”).
At the state level, the state legislator in the state of Minas Gerais adopted Law No. 23.291/19 in February 2019 which contains the state’s policy on TSF safety and should be implemented in conjunction with the equivalent federal policy. Among other things, Law No. 23.291/19 determines the criteria for licensing and inspecting TSF structures, prohibits TSFs constructed or heightened using the upstream method, establishes bond requirements and holds management liable for non-compliance with its provisions. The government of Minas Gerais adopted several decrees in furtherance of this legislation.
In addition, ANM Resolution No. 95/22, which became effective on 22 February 2022, effectively consolidates prior federal resolutions on TSFs, including ANM Resolution No. 13/19, and establishes new criteria for the operational management of TSF structures, changes the criteria related to the risk classification of TSF structures and emergency levels and sets new criteria for the suspension, embargo (order to stop operations) and interdiction of TSF activities. Operators of TSFs were mandated to conduct and submit risk assessments to the ANM by December 2022 and are required to update those risk assessments every two years. Operators are also required, on an annual basis, to obtain certifications from external consultants of the geotechnical stability of TSF structures and the adequacy of emergency response plans. In late 2022, tailings deposition was required to be suspended due to embargos at five of AngloGold Ashanti’s TSFs in Brazil pending certification by external consultants of on-site emergency response plans (Declaração de Conformidade e Operacionalidade (“DCO”)) as well as, at one such TSF, certification by external consultants of geotechnical stability (Declaração de Condição de Estabilidade (“DCE”)) consistent with the new standards. In addition, at the Calcinados TSF, a risk assessment conducted in December 2022 with oversight from external consultants, as required by Brazilian regulations, concluded that additional buttressing should be completed to increase gold production are underway. Productivityalign the TSF’s post liquefaction factor of safety with international standards currently considered best practice. Construction at the Calcinados TSF is expected to improvebegin later in 2023, and the timeline for completion will be determined once the engineering and geotechnical work has been completed by external consultants. Tailings deposition at the Calcinados TSF, as a resultwell as processing of gold concentrate at the Queiroz plant, which services the Cuiabá mine complex, is suspended until additional buttressing of the Operational Excellence initiatives that are underway. The strategy to enhance mining flexibility through focused development, that began delivering results in 2019, continued in 2020 andCalcinados TSF impoundment is key for the upcoming year.complete.
Further amendments to the regulatory requirements in the year, an increase of 17% from 2019 (16,563m), together with the processing of record volumes at the plant, 1.905Mt in 2020 versus 1.799Mt in 2019. These results are outcomes of an Operational Excellence strategy conducted in 2020. As part of the long-term growth strategy, the potential for new orebodies is being investigated in regional targets, along with plans for the deepening of the Cuiabá mine and the building of orebody knowledge at depthBrazil governing such TSFs and related modelling of geological behaviour.dams are expected to be adopted in 2023.
AngloGold Ashanti’s rights and permits
At AGA Mineraçao, Cuiabá has a single mining concession (No. 000.323/1973) covering a total area of 3,662 hectares. In February 2022, two additional mining concessions for Cuiabá (Nos. 830.937/1979 and 831.027/1980) were published, which cover an additional area of 816.2 hectares. Lamego has a single mining concession (No. 932.710/2017) covering a total area of 1,622 hectares. Córrego do Sítio (CdS)is hosted by five geographically contiguous mining concessions (i.e., the focus remains in advancing the exploration drilling campaign to enable reserve addition to support mine flexibilityNos. 930.556/2000, 930.181/2008, 830.129/1982, 833.472/2003 and support830.943/1979) covering a future expansion. In the long term, replacementtotal area of the Lamego Ore Reserve will provide expansion opportunities at the CdS complex. In the short-to-medium term, exploration, evaluation and implementation of additional production sources are expected at both Cuiabá and CdS II.6,017 hectares.
At Serra Grande, the Company has interests in or agreements over 25,719.94 hectares in the Crixás greenstone belt, representing approximately 87 percent of the relevant tenements that correspond to all current exploration and Ore Reserve development will create options to further scale-up production, extend the lifemining activities. These have been held since 1987. The mining concessions include mining concession No. 002.286/1935 covering an area of mine4,206.88 hectares, mining concession No. 960.658/1987 covering an area of 1,946.89 hectares, mining concession No. 860.746/2005 covering an area of 88.28 hectares, mining concession No. 862.103/1994 covering an area of 125.41 hectares and sustain higher margins. Exploration and Ore Reserve development will create options to increase production, extend mine life and improve margins. An exploration drill campaign has successfully confirmed the down-plunge continuitymining concession No. 804.366/1975 covering an area of the underground mines. In addition, the discovery of other new orebodies, including Palmeiras Sul, has consistently grown the Mineral Resource. There is also opportunity for unlocking the open pit potential in the greenstone belt.196.05 hectares.
70
Colombia
General laws relating to mining and land ownership
General regime
The Colombian Constitution declares that the sub-soil and the non-renewable natural resources located within the Colombian territory are the property of the Colombian State. The underlying principle of Colombian mining legislation for the granting of mining concession contracts over free areas is first in time, first in law. Mining activities are regulated by the Colombian Mining Code, Act 685, 2001.
The filing of an exploration and exploitation proposal triggers a right of preference to obtain rights over the targeted area, provided it is available. Such area cannot exceed 10,000 hectares. Upon receipt of a proposal, the relevant government agency determines whether another proposal or contract already governs the area. If there are no pre-existing claims, the government agency grants the applicant a “free area”.
With respect to land ownership, a mining concession in Colombia does not grant the rights over the surface required to develop a mining project. Therefore, in order to develop a mining project, it is required to acquire and secure access to the land (soil). This can be achieved in several ways, such as (i) purchase of the land, (ii) a transit easement, (iii) a mining easement, and (iv) the special acquisition process or expropriation.
Concession contract
As the sub-soil and the non-renewable natural resources located within the Colombian territory are property of the Colombian State, the Colombian Mining Authority (Agencia Nacional de Minería) grants the authorisation to explore and exploit minerals through a concession contract.
Such concessions allow concessionaires to conduct the studies, works and facilities necessary to establish the existence of minerals and to organise their exploitation. Upon being awarded a mining concession, a company must take out an insurance policy to cover the costs associated with potential environmental damage as well as breaches of its mining obligations. It may then proceed with exploration activities. Once the exploration phase is complete, the concessionaire files a new plan regarding proposed works and facilities. With the award of the mining concession or tenement contract, there are specified timelines for the completion of the various phases of a mining project, e.g. exploration, construction, exploitation. The company must comply with these timelines unless performance is suspended, for example, due to force majeure or these timelines are extended or modified. A grant of force majeure is for one year and must be renewed on an annual basis. If the company does not comply with the specified timelines for the completion of the various phases of a mining project, the mining authority may revoke the company's concession contracts or mining licences. As a general matter, any company that wishes to obtain a renewal of its concession contract must be up to date in all its legal and contractual obligations and must present a new plan of works and facilities to be implemented after the contract is renewed.
PINES programme
In 2013, the national government instituted the PINES programme designed to aid promoting certain projects that are deemed to have a national interest. This designation provides for greater oversight from the national government. All of our three advanced exploration projects (La Colosa, Quebradona and Gramalote) were considered of national strategic interest. Currently, Quebradona and Gramalote remain in the PINES programme, but La Colosa was temporarily removed as such (until the force majeure is over).
Tax laws relating to mining
From the moment the concession contract is registered with the Mining Register, the concessionaire has several financial obligations, including the payment of (i) a surface fee during the exploration, construction and assembly stage and (ii) royalties.
Once exploration is complete and the mining infrastructure in place, the concessionaire must begin paying royalties to the Colombian government, consisting of a percentage of the primary product and sub-products being exploited. The percentage of the royalty depends on the regulation in force when the concession contract is registered. In the case of the Quebradona project, the deposit mainly consists of copper followed by gold and silver. There is a five percent royalty for copper on the production value at the mine’s or well’s edge (i.e. when extracted from the subsoil). In case of gold and silver, a royalty of four percent on the production valued at the mine’s or well’s edge (i.e. when extracted from the subsoil) was established.
Furthermore, Colombian law establishes that once the environmental licence is granted the concessionaire must invest one percent of the project’s value to benefit the basins covered by the environmental licence.
71
Environmental laws relating to mining
In order to obtain an authorisation to carry out a mining project, a company must prepare an Environmental Impact Study (“EIA”) for approval by the National Environmental Licensing Authority of Colombia (Autoridad Nacional de Licencias Ambientales or “ANLA”). Global environmental licences are granted for the entire life of the project and cover all phases: construction, assembly, operation, maintenance, dismantling, final restoration, abandonment and/or termination. Construction and assembly permits (Plan de Trabajos y Obras or “PTO”) are granted by the mining authority with jurisdiction over the project.
In Colombia, the mining authority has the discretion to declare the underlying concession void if the specific company which holds the concession breaches applicable environmental laws or regulations. If the mining authority were to exercise such discretion, a company whose concession was voided would be required to abandon its projects and all of its other existing mining concession contracts. Pending proposals for new mining concession contracts would also be cancelled and the company would be banned from doing business with the Colombian government for a period of five years. As a result, the company would be unable to conduct any mining exploration or development activities during such period. However, this would not affect other subsidiaries of the company operating in Colombia, if those concession contracts are held singularly or in concert with joint venture partners.
Mining activity is prohibited in national parks, regional parks, protected forest reserves, paramos (included in Act 1753, introduced in 2015) and wetlands, pursuant to the Ramsar Convention on Wetlands of International Importance. Some forest reserves are not “protected” but are set aside for active forestry purposes and the concessionaire must obtain a specific permit to partially and temporarily change the use of the soil before pursuing exploration activities. In addition, Resolution 1987/2016, passed by the national government in late 2016, identifies areas that the Ministry of the Environment has determined to be “paramos” areas, or paramos transition areas. In these areas there are limitations on industrial or commercial work being performed, including mining. The regulation also specifies a process to determine what work, if any, can be performed in a paramos-designated area.
AngloGold Ashanti’s rights and permits
The La Colosa project managed by AngloGold Ashanti Colombia S.A.S. (“AGA Colombia”) remains in force majeure due to delays in granting environmental permits by national and local environmental authorities, thereby preventing AGA Colombia from undertaking further exploration activities. The most recent one-year grant of force majeure, during which time the specified timelines for completing the various phases of the mining project under the concession contract are suspended, will expire on 22 June 2023. AGA Colombia applied for a mining area integration (consolidation) of its concession contracts related to La Colosa, in respect of which AGA Colombia was not in compliance with some of the specified timelines. The application for mining area integration (consolidation) was approved in March 2017, which remedied the non-compliance of each consolidated concession and reset the specified timelines. La Colosa now has a single integrated mining concession contract (EIG-163) which covers a total area of 9,210 hectares and expires on 28 February 2037.
Minera de Cobre Quebradona S.A.S. B.I.C. (“MCQ”) which manages the Quebradona project, obtained the integration of concession agreement 5881 in October 2016 and registered in December 2016. As a result, MCQ was granted the exclusive right to explore, take ownership and dispose of the mineral reserves (ore) extracted from the concession area. MCQ has the right to request an extension of up to 30 years, at least two years before the expiration of the operating period. This extension is not automatic, and the request must be filed with new technical, economic, environmental and social studies that demonstrate the status of the mineral resources. Concession contract 5881 initially covered a total area of 7,593 hectares, which was reduced to 4,881.89 hectares by the relevant mining authority (Secretaría de Minas de Antioquia) on 4 March 2022. It will expire in May 2037 and is currently in its seventh year of the integrated exploration phase. In September 2021, the permits for the construction and mining operation were approved by the relevant mining authority (Secretaría de Minas de Antioquia). On 4 November 2021, ANLA officially notified AngloGold Ashanti of its decision to ‘archive’ the environmental licence application relating to the Quebradona project. ANLA has neither denied nor granted the licence, but deemed that the information provided by AngloGold Ashanti is not enough for this authority to take a substantive decision. On 18 November 2021, AngloGold Ashanti appealed the archiving decision in order to secure further details on the specific additional information ANLA requires to make a determination. ANLA denied the appeal on 29 April 2022 and the archiving decision was confirmed. AngloGold Ashanti is in the process of preparing a new Environmental Impact Assessment for the Quebradona project to submit to ANLA in connection with its environmental licence application.
The Gramalote project is organised as a joint operation between AngloGold Ashanti (through AGA Colombia Holdings Limited and AngloGold Ashanti Holdings plc) and B2Gold (through B2Gold Corp. and Graminvest Ventures Limited). Gramalote Limited, a company incorporated under the laws of British Virgin Islands which is the legal vehicle operating the joint operation, established a Colombian branch, Gramalote Colombia Limited (“GCL”), to carry out activities in Colombia and obtain the mining concession contracts necessary to develop the Gramalote project. The Gramalote joint operation has been operated by B2Gold since January 2020. Pursuant to an integrated mining concession contract No. 14292, GCL was granted the exclusive right to explore, take ownership and dispose of the mineral reserves (ore) extracted from the concession area (which covers a total area of 8,720.71 hectares and includes the Gramalote and Monjas anomalies) until April 2043. GCL has the right to request an extension of the operating period for up to 20 years, and, if exercised, such request to extend must include new technical, economic, environmental and social studies that demonstrate the status of the mineral resources. Currently, concession contract
72
No. 14292 is in the phase of construction and assembly, pending resettlement of communities and the formal start of construction activities. GCL has received an environmental licence granted by ANLA and permits for the construction and mining operation which were approved by the relevant mining authority (Secretaría de Minas de Antioquia). GCL also holds an exploration concession No. 4894 (which covers a total area of 2,279.32 hectares and includes the Trinidad anomaly) which expires in 2044 and an exploration concession No. QHQ-16081 (which covers a total area of 9.78 hectares) which expires in 2052. Following the completion of the feasibility study in the second half of 2022, AngloGold Ashanti and B2Gold determined that the Gramalote project does not meet their investment thresholds for development. Following a comprehensive review of the alternatives relating to the project, both joint operation parties commenced a joint sales process for the Gramalote project, which is currently ongoing.
United States of America (Nevada)
General laws relating to mining and land ownership
General regime
Mineral and surface rights in the United States are owned by private parties, state governments or the federal government. The majority of land utilised for precious metals exploration, development and mining in the western United States is owned by the federal government. The right to mine on such federal land in western states is governed by the U.S. General Mining Law of 1872, as amended (the “General Mining Law”), as well as relevant state statutes and regulations. The General Mining Law allows mining claims (for mining and mining-related activities) on certain federal lands after proper compliance with claim location and maintenance requirements.
Mineral exploration activities in Nevada are also generally subject to applicable federal, state, and local permitting requirements, but the specific regulatory authorisations required for the company’s activities are based on the nature and location of the exploratory work. Many of the company’s Nevada operations are currently conducted under what is generally referred to under federal law as a notice-level operation subject to 43 CFR § 3809.21, while projects that are more advanced require additional permitting, including a Plan of Operations approved by the federal Bureau of Land Management (“BLM”). The State of Nevada Division of Environmental Protection’s Bureau of Mining Regulation and Reclamation (“BMRR”) also regulates mining within the state of Nevada. However, exploration projects of five acres or less on federal land, the scope of a notice-level operation under federal law, are exempt from BMRR regulation. Certain of the company’s early-stage exploration activities fall within this exemption.
The company is currently engaged in exploration activities on certain of its unpatented claims that include, but are not limited to, geological and spectral mapping, surface geochemical sampling, geophysical surveying and RC and/or diamond drilling.
Potential regulatory changes
Over the years, the U.S. Congress has considered a number of proposed amendments to the General Mining Law and other federal statutes relating to mining. Among the significant features contained in previously proposed legislation were a production royalty obligation, new and more stringent environmental standards and conditions, additional reclamation requirements, extensive new procedural steps which would likely result in extended permitting timelines, and granting counties and other entities the ability to petition the U.S. Secretary of the Interior to make certain areas unavailable for the location of unpatented mining claims. In June 2020, former President Trump signed an executive order directing certain federal agencies to streamline the review processes associated with permitting of infrastructure and natural resources projects. Many of those policies have subsequently been rescinded by the Biden administration. While certain other executive orders may favorably affect the timing of our permit and project approvals, the impact is yet to be determined and remains uncertain.
There are a number of bills being proposed to the Nevada state legislature during the 2023 legislative session that could impact the company’s planned operations. These include proposed legislation that would alter the way water rights are administered by the state, as well as a bill that would, if enacted, impose additional requirements for environmental review of mineral development projects in Nevada. At this stage, it is not possible to evaluate whether these bills will be enacted in any form by the Nevada state legislature or, if passed, what impact any might have on AGA.
AGA is currently unaware of any other new federal or state legislative or regulatory changes or rule-making that has been proposed or enacted that would adversely affect its current exploration programmes. If any requirements, standards or conditions were adopted in the future that imposed additional or new obligations or costs on AGA in connection with our exploration or extraction activities in the United States, the company’s operations in Nevada could be adversely affected.
AngloGold Ashanti’s rights and permits
In Nevada, the company’s wholly-owned subsidiaries hold a significant number of unpatented mining claims on federal lands. The Silicon project consists of approximately 950 unpatented mining claims. The North Bullfrog project consists of 45 patented and approximately 1,600 unpatented mining claims (covering approximately 32,000 acres) situated in the Bullfrog mining district. There are also nine mining leases within the North Bullfrog project the majority of which continue in perpetuity so long as the company meets certain minimal requirements for use of the land. One mining lease is scheduled to expire in 2031. The Mother
73
Lode project consists of 13 unpatented mining claims. The North Bullfrog and Mother Lode projects are now controlled by the company as a result of its acquisition of all of the outstanding stock of Corvus Gold Inc., which closed on 18 January 2022. The southern claim block, encompassing the Sterling mine and other properties in the same general area, consists of approximately 1,900 unpatented claims (covering approximately 35,000 acres), which are now controlled by the company as a result of its acquisition of all of the outstanding stock of Coeur Sterling, Inc. (a subsidiary of Coeur Mining, Inc.), which closed on 4 November 2022. As a result of this acquisition, the company now controls a past-producing mine site in southern Nevada known as the Sterling mine, which has one applicable mining lease that expires in 2029, with the option to extend the lease for an additional ten-year period. Although the Sterling mine is currently in care and maintenance status, it remains subject to complex permitting and regulatory requirements, including compliance with relevant provisions of the U.S. Federal Mine Safety and Health Act of 1977 and oversight by the U.S. Department of Labor’s Mine Safety and Health Administration (“MSHA”).
MINE SITE REHABILITATION AND CLOSURE
Closure, an integral part of operations
All mining operations eventually cease. An integral aspect of operating AngloGold Ashanti’s mines is ongoing planning for site closure and, where feasible, implementation of concurrent rehabilitation, together with an estimate of associated liability costs and the placement of adequate financial provisions and assurances to cover these costs.
AngloGold Ashanti integrates mine closure planning throughout the mine life cycle as follows:
•Exploration stage: developing a plan and programme for cessation and closure of exploration activities in a manner that meets local laws and AngloGold Ashanti's mine closure planning standard.
•Project phase: developing conceptual closure plans and cost estimates for all projects and including them in project feasibility studies, designs and evaluations.
•Operational phase: developing and periodically updating mine closure plans and cost estimates with increasing levels of detail and confidence over the operational phase as part of the business planning process. Closure plan updates take into account operational conditions, planning and regulatory requirements as well as advances in technology and international industry good practice (e.g., the ICMM Integrated Mine Closure Good Practice Guide). Concurrent rehabilitation, which is carried out while a mine is still operational, is a good practice that serves to decrease the final rehabilitation and closure work as well as the ultimate liability.
•Closure period: implementing the final closure plan starting at cessation of operations through a period of decommissioning, dismantling and rehabilitation until the point in time where management of the site is largely limited to monitoring and maintenance.
The Company’s group mine closure planning standard stipulates that closure planning must be undertaken in consultation with the stakeholders. In the course of these consultations, different issues are raised which require site-specific solutions. Each mine closure plan includes a social transition plan which seeks to minimise social impacts and maximise opportunities for local communities, including human resource, social infrastructure, economic and financial assets with the aim of enhancing the self-sustainability of mine communities after mine closure.
Provisions for decommissioning and restoration costs are made when there is a present obligation, it is probable that expenditure on decommissioning and restoration work will be required and the cost can be estimated within a reasonable range of possible outcomes. These costs are based on currently available facts, technology expected to be available at the time of the rehabilitation, laws and regulations presently or virtually certain to be enacted and previous experience in the rehabilitation of mine sites.
Decommissioning costs and restoration costs are provided at the present value of the expenditures expected to settle the obligation, using estimated cash flows based on current prices. Estimates are discounted at a pre-tax rate that reflects current market assessments of the time value of money.
Total provisions for decommissioning and for environmental restoration activities (excluding joint ventures) decreased by $95 million from $673 million in 2021 to $578 million in 2022. This decrease was mainly due to changes in estimates resulting from changes in discount rates, changes in global economic assumptions, changes in mine plans resulting in a change in cash flows as well as changes in the design of TSFs.
SUSTAINABILITY AND ENVIRONMENTAL, SOCIAL AND GOVERNANCE (“ESG”) MATTERS
AngloGold Ashanti’s sustainability approach is fundamental to how the Company operates its business, as well as its ability to create long-term value for its shareholders, employees and social partners through safely and responsibly exploring, mining and marketing its products. Sustainability and safety are integrated into the Company’s business and operations at all levels through various frameworks, standards and policies, and the Company measures its performance in achieving its goals against its sustainability and other ESG metrics, as well as its engagement with stakeholders.
In mitigating the risks and impacts that are an inherent part of its business, AngloGold Ashanti is informed by an annual assessment of its key ESG issues. This process is aligned with guidance published by the International Integrated Reporting Council (“IIRC”), the Sustainability Accounting Standards Board (“SASB”), the Global Reporting Initiative (“GRI”) Standards and
74
the Accountability AA1000 Stakeholder Management Standard. This assessment is annually reviewed by AngloGold Ashanti’s senior leadership and approved by the Social, Ethics and Sustainability Committee (the “SES Committee”).
AngloGold Ashanti’s board of directors, assisted by the SES Committee, has ultimate responsibility over environmental, safety, health and ethical matters and for the integration of sustainability objectives into AngloGold Ashanti’s business. This includes oversight of the Company’s stakeholder engagement framework and structures, which apply to investors, employees, governments, suppliers and communities, at every stage of its business from exploration to mine closure. Group Corporate Affairs and Sustainability is responsible for development of management systems and supports the Company’s general managers in the day-to-day implementation of its sustainability strategy.
AngloGold Ashanti maintains a set of policies and procedures to guide the Company in acting as a responsible corporate citizen, including the Code of Business Principles and Ethics which sets requirements for the implementation of key corporate policies and guidelines and applies to all management and employees, and to maintain compliance with applicable environmental, health and safety (“EHS”) laws. In 2022, AngloGold Ashanti continued with the implementation of the Integrated Sustainability Information Management System (“iSIMS”), in order to improve internal reporting and better integrate, manage and monitor sustainability activities with respect to its broader business. This common management and reporting application for all sustainability disciplines, from safety, health and security to community and environmental management, is expected to help provide timely information in each of these areas, and to facilitate transparency and decision-making in its processes and practices.
Significant EHS requirements and ESG risks and trends affecting the Company’s mining and processing operations are described below.
EHS Regulatory Compliance
AngloGold Ashanti is subject to extensive EHS laws and regulations in the various jurisdictions in which the Company operates. These requirements govern, among other things, extraction, use, conservation and discharge of water; air emissions (including dust control and greenhouse gases (“GHGs”)); mine and dam safety, regulatory and community reporting; clean-up of contamination; land use and conservation of protected areas; rehabilitation and closure of mined land; worker health and safety and community health; and the generation, transportation, storage and disposal of solid and hazardous wastes, such as reagents, radioactive materials, and mine tailings. Environmental laws and regulations applicable to the Company’s operations, including the requirements contained in environmental permits, are generally becoming more restrictive.
Capital and operating costs to comply with EHS laws and regulations have been, and are expected to continue to be, significant to AngloGold Ashanti. In addition, AngloGold Ashanti could incur fines, penalties and other sanctions, environmental clean-up costs, and third-party claims for personal injury or property or natural resources damages; suffer reputational damage; and be required to install costly pollution control equipment or to modify or suspend facilities, such as TSFs, or operations, as a result of actual or alleged violations of, or liabilities under, EHS laws and regulations. Failure to comply with applicable EHS laws and regulations may also result in the suspension or revocation of permits and, in some jurisdictions, the right to mine a given concession. AngloGold Ashanti’s ability to obtain and maintain permits and other approvals and to successfully operate near host communities may be adversely impacted by real or perceived effects on the environment or human health and safety associated with AngloGold Ashanti’s or other mining companies’ activities. In addition, unknown environmental hazards may exist at the Company’s properties which may have been caused by previous owners or operators.
Water Management
AngloGold Ashanti’s operations are heavily dependent upon access to substantial volumes of water for use in the mining and extractive processes and typically are subject to water-use permits or rights to extract water from certain natural sources that govern usage and require, among other things, that mining operations maintain certain water quality upon discharge. Water supply, quality and usage are areas of concern across all of the Company’s operations, including with respect to the Company’s mining operations in Ghana and Brazil, its mine development projects in Nevada, as well as its mine development project at Quebradona in Colombia. Any failure by the Company to secure access to suitable water supplies, or achieve and maintain compliance with applicable requirements of the permits or licences, could result in curtailment or halting of production at the affected operations. Incidents of water pollution or shortage can, in certain cases, lead to community protest and ultimately to the withdrawal of community and government support for AngloGold Ashanti’s operations. A failure by the Company to comply with water contamination related directives may result in further, more stringent, directives being issued against the Company, which may, in some cases, result in a temporary or partial shutdown of some of the Company’s operations.
Where feasible, the Company operates a “closed loop” system which recycles the water used in its operations without discharging it to the environment. In some areas, however, such as Ghana and Brazil, high levels of rainfall and surface water runoff mean that a closed loop system is not feasible and that discharges, after water treatment where necessary, must take place.
75
Waste Management
During open-pit mining, large volumes of soil and/or rock (overburden) are mined to expose the ore body. Similarly, waste rock is mined during drilling and developing access to underground ore bodies. Overburden and waste rock typically contain sub-economic levels of gold and are deposited as large waste rock facilities. Mine tailings are the process waste generated once grinding and extraction of gold from the ore is completed in the milling process and are typically deposited as slurry in large tailing storage facilities (“TSFs”) specifically designed for this purpose.
The impact of dust generation, breach, leak, or other failure of a waste rock facility or TSF, including any associated dam, can be significant, and the Company therefore monitors such facilities closely in accordance with the Company’s internal standards, independent review, national regulatory requirements, industry standards and commitments made to local communities. The occasional well-publicised failure of a third-party TSF and the potential impact of such failure also mean that these facilities are generally tightly regulated. A safety or environmental incident at the Company’s operations could result, among other things, in enforcement, including mandatory shutdown of a TSF and related facilities, obligations to remediate environmental contamination, negative press coverage, and claims for property or natural resources damages and personal injury by adjacent communities. Incidents at other mining companies’ operations could result in governmental action to tighten regulatory requirements and restrict certain mining activities, in particular with respect to TSFs, also in respect of other mine operators in that region.
For example, following the catastrophic failure of a TSF at the Córrego do Feijão iron ore mine owned by Vale at Brumadinho in the state of Minas Gerais in Brazil in January 2019, tailings were discharged into the mine’s administrative area and part of the local community, reportedly resulting in death or injury to hundreds of people. As a result of this incident, there has been considerably increased regulatory scrutiny in Brazil and other areas on mining operations generally, and the requirements applicable to the approval, licensing, construction, management, closure and decommissioning of TSFs have generally become far more stringent. For example, in late 2022, tailings deposition was suspended at five of AngloGold Ashanti’s TSFs in Brazil pending certification by external consultants of on-site emergency response plans (“DCO”) and/or geotechnical stability (“DCE”) consistent with new regulatory standards enacted in early 2022. In addition, at the Calcinados TSF, a risk assessment conducted in December 2022 with oversight from external consultants, as required by Brazilian regulations, concluded that additional buttressing should be completed to align the TSF’s post liquefaction factor of safety with international standards currently considered best practice. The timeline for completion will be determined once the engineering and geotechnical work has been completed by external consultants. For further information on the regulatory framework governing TSFs in Brazil, see “Item 4B: Business Overview—The Regulatory Environment Enabling AngloGold Ashanti to Mine—Americas—Brazil”.
In addition, a new Global Industry Standard on Tailings Management (“GISTM”) was established in August 2020 by a panel comprised of industry and non-governmental organisation (“NGO”) experts. AngloGold Ashanti has committed to comply with the GISTM at all of its TSFs by August 2025, and the costs related to meeting such standard are not expected to be material to AngloGold Ashanti.
In addition, AngloGold Ashanti could incur liabilities, or material costs to manage solid and hazardous waste generated by its mining activities, including dust and residual chemicals and metals. For example, AngloGold Ashanti expects to incur approximately $25 million to $30 million in capital expenditure and operating costs during 2023-2026 in connection with treatment and disposal of a quantity of legacy arsenic trioxide waste located at the Obuasi mine.
Groundwater Impacts and Environmental Remediation
As AngloGold Ashanti or its predecessors have a long history of mining operations in certain regions, issues may arise regarding historical, as well as potential future, environmental or health impacts in those areas, for which AGA, as the current owner/operator, may be legally responsible. For example, AngloGold Ashanti has identified groundwater contamination plumes at certain of its operations. Numerous scientific, technical and legal studies have been undertaken to assist in determining the magnitude of the impact and to find sustainable remediation solutions. Based on those studies as well as discussion with regulators, the Company has taken steps, including monitored natural attenuation and phyto-technologies, to address soil and groundwater contamination, including in Tanzania, where an in-situ remediation project to address sulfate in groundwater commenced operations in 2022.
Subject to the completion of site-specific trials and potential technologies being confirmed as viable remediation techniques, no reliable estimate can be made at this time for the obligation. Should these obligations be significant, this could have a material adverse impact upon AngloGold Ashanti’s results and its financial condition.
Climate Change and GHG Regulation
At AngloGold Ashanti, climate change is a board of directors-level governance issue, overseen by the SES Committee and the Audit and Risk Committee. AngloGold Ashanti’s Climate Change Strategy, which was approved by the board of directors in November 2021, seeks to embed the management of physical, regulatory and transition climate change-related risks, as well as climate change-related opportunities, into the Company’s strategic and operational planning processes.
76
In 2021, AngloGold Ashanti committed to the International Council on Mining & Metals (“ICMM”) target of achieving net zero Scope 1 and Scope 2 GHG emissions by 2050. AngloGold Ashanti has also committed to achieving a 30 percent reduction in absolute Scope 1 and 2 emissions by 2030 (as compared to a 2021 baseline), and, in partnership with value chain partners, to set Scope 3 GHG reduction targets, if not by the end of 2023, as soon as possible thereafter.
In December 2015, certain members of the international community negotiated a treaty at the Conference of the Parties of the UN Framework Convention on Climate Change in Paris (the “Paris Agreement”). The Paris Agreement, which came into force on 4 November 2016, requires developed countries to set targets for emissions reductions. As a result, measures designed to limit or reduce GHG emissions, both mandatory and voluntary, have been, and are expected to be, implemented at national or regional levels in various countries.
New regulatory requirements, or changes required to effectively transition to a low-carbon economy, could require AngloGold Ashanti to reduce its direct GHG emissions or energy use, change its fuel mix or incur significant costs for GHG emissions permits or taxes, including for those costs or taxes passed on by electricity utilities which supply the Company’s operations. AngloGold Ashanti could also incur significant costs associated with capital equipment, GHG monitoring and reporting and other obligations to comply with applicable requirements. The most likely source of these obligations is through nation state-level implementation of new emissions or financial obligations pursuant to evolving climate change regulatory regimes.
For example, in 2010, Brazil launched the National Climate Change Policy, which established a voluntary national GHG reduction target of 36.1 percent to 38.9 percent below the projected emissions in 2020 for “business as usual”. The policy required the development of sector-specific plans in order to meet the target and provided for a Brazilian GHG trading scheme, which is yet to be designed. While Brazil is not yet requiring mandatory GHG emissions reporting at the national level, some state environmental agencies have requested companies to voluntarily submit GHG emissions management plans. However, the states of Goiás and Minas Gerais (in which AngloGold Ashanti operates) do not currently require GHG emissions management plans for mining projects. In 2015, Brazil announced, in connection with its commitments under the Paris Agreement, economy-wide absolute mitigation targets providing for a 37 percent reduction in GHG emissions by 2025, as compared to 2005, and a goal to reduce GHG emissions by 43 percent by 2030 compared to 2005 levels.
In addition, in Australia, the Safeguard Mechanism (Rule 2015), through the National Greenhouse and Energy Reporting (“NGER”) scheme, provides a framework for Australia’s largest emitters to measure, report and manage their emissions. The Safeguard Mechanism applies to facilities with Scope 1 covered GHG emissions of more than 100,000 tonnes of CO2e per fiscal year. During the 2018/19 fiscal year, Tropicana’s emissions were within its authorised threshold and Sunrise Dam was required to purchase offsets for emissions that were 0.8 percent above its safeguard threshold, the cost of which was immaterial. Two amendments to the Safeguard Mechanism (Rule 2015) enacted in March 2019 and May 2020 allowed for the application of transitional calculated baselines using estimated CO2-e emissions intensities. Based on the production and emissions forecasts, the Australian mining operations applied to use transitional calculated baselines in 2020 for Sunrise Dam and Tropicana, which were approved by the Clean Energy Regulator effective 1 July 2019 to 30 June 2022 for both operations. Thereafter, the Australian mining operations will be required to apply production-adjusted baselines and, if actual emissions exceed the baseline, to purchase emissions offsets for the business. In any event, the cost of such offsets, if ultimately required to be purchased, including due to a change in the operations under the business plan prior to June 2022, are not expected to be material to the Company’s business.
In addition to more stringent requirements and commitments, AngloGold Ashanti’s operations are subject to a number of physical risks from climate change, such as changes in rainfall rates or patterns resulting in floods or droughts, reduced water availability, higher temperatures and extreme weather events. Such events or conditions, particularly including flooding or inadequate water supplies, could disrupt mining and transport operations, mineral processing and rehabilitation efforts, create resource or energy shortages or damage the Company’s property or equipment and increase health and safety risks on site. In consultation with external consultants, physical climate risk assessments were undertaken for all operations using current climate models for the business and various decarbonisation scenarios and climate adaptation plans were outlined. These physical climate risks will be further reviewed and refined in 2023.
Occupational Safety and Health
AngloGold Ashanti is subject to a variety of laws and regulations in each of the jurisdictions where the Company operates that are designed to protect and improve the safety and health of employees. In some of the jurisdictions in which AngloGold Ashanti operates, the government enforces compulsory shutdowns of operations to enable investigations into the cause of accidents and introduce corrective measures at those operations.
Safety remains a priority for AngloGold Ashanti and a focus of AngloGold Ashanti’s long-term sustainability approach, as well as the Company’s continuing efforts to manage the risks inherent to its operations, to model critical controls and to strengthen safety protocols and preventative measures. AngloGold Ashanti has made significant strides in improving safety. In 2022, there was a 41 percent reduction in year-on-year total recordable injury frequency rate, and no fatalities at any of the mines operated by AngloGold Ashanti.
AngloGold Ashanti’s Group Safety Strategy, which is updated every three years, seeks to integrate operational risk management and key performance indicators at all levels of the organisation and maintain alignment with global safety standards. The SES
77
Committee oversees the implementation of the Group Safety Strategy. All operations, have been certified to ISO 45001:2018, which has replaced the OHSAS 18001:2007 series.
Community Health and Tropical Diseases
AngloGold Ashanti is also subject to health and safety regulations relating to occupational disease. The primary areas of focus in respect of occupational health of employees within the Company’s operations are noise-induced hearing loss (“NIHL”) and occupational lung diseases (“OLD”). OLD includes occupational tuberculosis and silicosis in individuals exposed to silica dust. Silicosis has been particularly prevalent in South Africa and has also arisen at the Company’s Africa region and Brazilian operations, albeit to a far lesser extent. AngloGold Ashanti provides occupational health services to its employees at its occupational health centres, clinics, and through outsourced service centres. The Company continues to expand preventative occupational hygiene initiatives, such as implementing various control measures to prevent hazardous exposures, and providing employees with Personal Protective Equipment.
In 2019, the Johannesburg High Court approved the settlement of existing silicosis and tuberculosis class actions against AngloGold Ashanti and other gold mining companies in South Africa. The recent sale of the Company’s South African operating assets and liabilities did not include the silicosis or tuberculosis settlement obligations relating to South African employees, which were retained by AngloGold Ashanti. For further information, see “Item 18: Financial Statements—Note 1.2—Statement of Compliance—Significant Accounting Judgements and Estimates—Provision for silicosis”.
In addition to OLD, HIV and AIDS and associated diseases remain major health care challenges faced by AngloGold Ashanti’s Africa region operations. AngloGold Ashanti continues to implement programmes to help those infected with HIV and prevent new infections from spreading.
Malaria and other tropical diseases also pose health risks at all of the Company’s operations in Central, West and East Africa where such diseases may assume epidemic proportions because of ineffective national control programmes. Malaria is a major cause of death in young children and pregnant women and also gives rise to deaths and absenteeism in adults. All affected Company operations in Africa have malaria control programmes in place. The Ghana Obuasi malaria control programme activities have been completed in 16 districts of Ghana as planned for 2022 and a new cycle of indoor residual spraying will commence in 2023; in partnership with the Global Fund and the Ghana Department of Health.
In 2022, the COVID-19 pandemic subsided significantly with decreases in reporting of severe disease or deaths. Nevertheless, AngloGold Ashanti continued to direct resources for close surveillance and maintenance of controls within the company with a view to ensure continuity of its operations and avoid any potential disruption in the event of a re-emergence of the pandemic. Universal access to safe and effective vaccines provided an additional layer of protection, especially against severe forms of disease, hospitalisation and death. The company endeavoured to continue to provide prompt access to approved and available vaccines for all workers, especially employees considered to be at high risk as well as employees with critical skills.
The emergence of COVID-19 however also assisted to better integrate broad health risk management beyond occupational health into the overall business strategy, to contribute to productivity as well as the social licence to operate and to improve various prevention and risk management protocols in place to address the potential risk of an epidemic or pandemic, particularly after the company’s experience with Ebola in Guinea in 2014 and 2015.
The company focused on optimising mental wellbeing, minimising non-communicable diseases associated with lifestyle as well as the need for systematic contribution to health system strengthening, local skill development and overall community development in the jurisdictions in which it operates. Such risks impair the health of workers and negatively affect productivity and profitability as a result of workers’ diminished focus or skill, absenteeism, treatment costs and allocated resources. As part of AngloGold Ashanti’s continuing efforts, the company recently approved the newly updated health, hygiene and wellbeing standards based on identified major health hazards or risks which include gender, cultural and other applicable diversity considerations for risk management and controls.
Diversity and Inclusion (“D&I”)
With more than 30,000 employees (including contractor employees) on four continents, AngloGold Ashanti believes that having a diverse and inclusive workforce is important to continuing to attract talent in order to maintain competitiveness and the long-term sustainability of its business. In addition, the Company strives to have a workforce that represents the societies in which AngloGold Ashanti operates in connection with maintaining its social licence to operate.
AngloGold Ashanti’s D&I approach is aligned to the United Nation Sustainable Development Goals (“UNSDGs”) (SDG 5, 8 and 10) and the United Nations Global Compact (“UNGC”). The Company has developed a Diversity & Inclusion Framework, which aims to foster the empowerment of all staff, irrespective of race, gender, ethnicity, religion and sexual orientation and has established specific priorities and actions for the next two to five years to foster the inclusion of D&I objectives in its processes. Leadership teams are responsible for meeting defined diversity targets. In 2022, AngloGold Ashanti conducted an analysis of global gender data across job level, function and country. The analysis was carried out to inform AngloGold Ashanti’s D&I strategy.
78
Human Rights and Indigenous Peoples
In its commitment to respecting and promoting human rights, AngloGold Ashanti supports the United Nations Guiding Principles for Business and Human Rights (“UNGP”) and other international initiatives, including the UNGC and the Voluntary Principles on Security and Human Rights (“VPSHR”). The VPSHR, which seeks to balance safety and security needs against respect for human rights and fundamental freedoms, were developed through multi-stakeholder participation between governments, extractive industry members and NGOs. Community and security related matters, including with respect to illegal and artisanal and small-scale mining and related intrusions into the Company’s operational areas, are addressed at board of directors-level by the SES Committee. AngloGold Ashanti’s internal Human Rights Framework includes numerous policies, management standards and guidance documents which apply to all of its employees, contractors and suppliers and require reporting of, and redress for, human rights violations and related allegations.
The Company is aligned with the ICMM Position Statement on Indigenous Peoples and the International Finance Corporation’s Performance Standard 7 on Indigenous Peoples and other international standards and treaties in the area of Indigenous Peoples’ rights.
79
ANGLOGOLD ASHANTI GLOBAL FOOTPRINT: 2022
Operations and projects
Notes
(1) Gramalote is managed by B2Gold Corp ("B2Gold").
(2) AngloGold Ashanti acquired North Bullfrog and Mother Lode as part of the Corvus Gold Inc. ("Corvus Gold") acquisition in January 2022.
(3) AngloGold Ashanti acquired Sterling through the Coeur Sterling, Inc. ("Coeur Sterling") acquisition in November 2022.
(4) Kibali is operated by Barrick Gold Corporation ("Barrick").
80
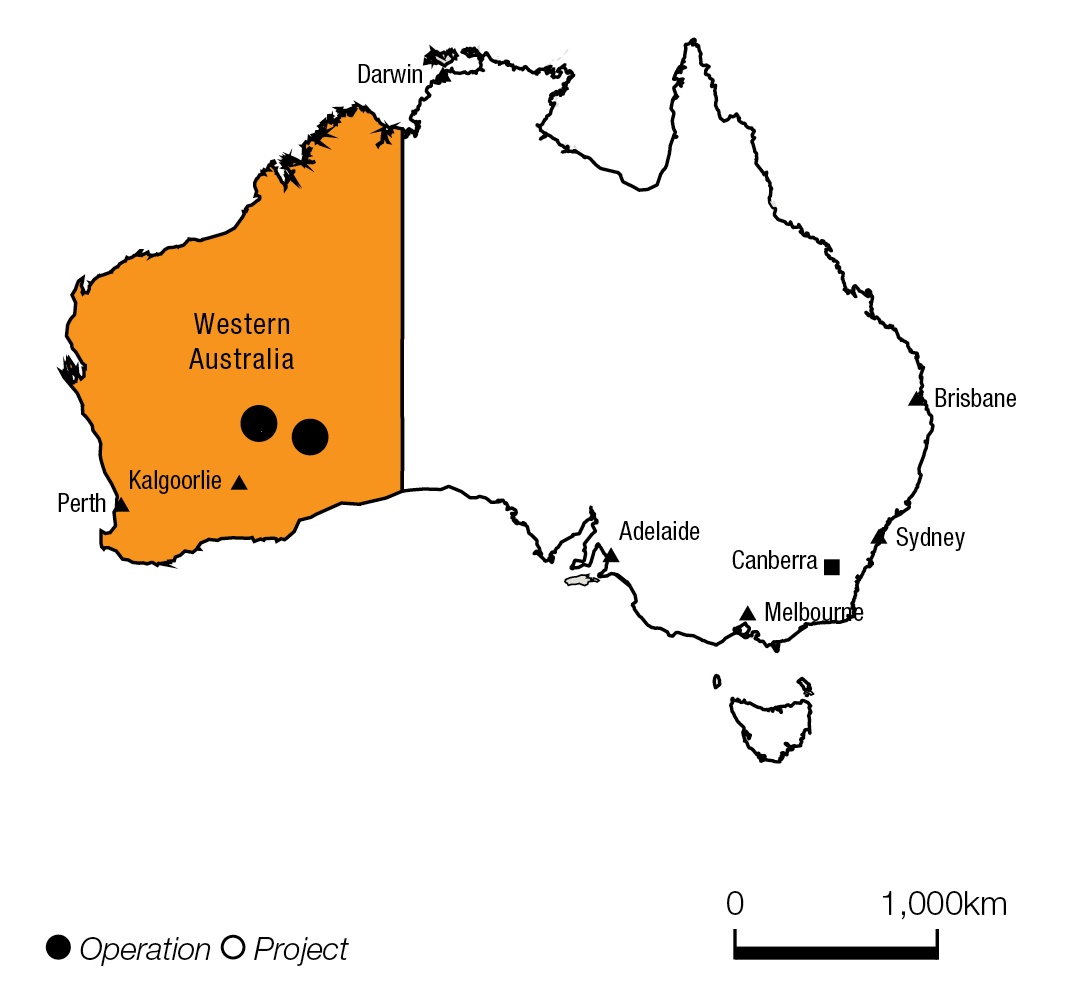 |  | ||||
| Attributable gold production (000oz) | Average number of employees | ||||||||||
| Operations | |||||||||||
| Australia | |||||||||||
| 1. Sunrise Dam | 256 | 622 | |||||||||
| 2. Tropicana 70% | 298 | 608 | |||||||||
| Unit | 2020 | 2019 | 2018 | ||||||||||||||||||||
| Operation | |||||||||||||||||||||||
| Tonnes treated/milled | Mt | 10.2 | 10.1 | 9.5 | |||||||||||||||||||
| Pay limit | oz/t | 0.06 | 0.06 | 0.07 | |||||||||||||||||||
| g/t | 1.95 | 1.95 | 2.10 | ||||||||||||||||||||
| Recovered grade | oz/t | 0.054 | 0.060 | 0.065 | |||||||||||||||||||
| g/t | 1.69 | 1.87 | 2.01 | ||||||||||||||||||||
| Gold production (attributable) | 000oz | 554 | 614 | 625 | |||||||||||||||||||
| Cost of sales | $m | 705 | 632 | 622 | |||||||||||||||||||
Total cash costs (1) | $/oz | 968 | 730 | 762 | |||||||||||||||||||
All-in sustaining costs (1) | $/oz | 1,225 | 990 | 1,038 | |||||||||||||||||||
| Capital expenditure | $m | 143 | 149 | 156 | |||||||||||||||||||
| Safety | |||||||||||||||||||||||
| Number of fatalities | 0 | 0 | 0 | ||||||||||||||||||||
| AIFR | Per million hours worked | 3.74 | 7.33 | 9.14 | |||||||||||||||||||
| People | |||||||||||||||||||||||
| Average no of employees: Total | 1,230 | 1,140 | 1,051 | ||||||||||||||||||||
| Permanent employees | 259 | 249 | 238 | ||||||||||||||||||||
| Contractors | 971 | 891 | 813 | ||||||||||||||||||||
The mining charter
Since 2004, a series of mining charters have been adopted in South Africa with the main purpose of transferring part of the ownership of mining assets to black or historically disadvantaged South Africans (“HDSAs”) within a certain time period. Such mining charters also set targets for, amongst other things, the advancement of HDSAs into management positions, the employment of women, procurement of goods and services from HDSA-owned companies, training, community development and the upgrading of mine housing. In 2004, the Broad-Based Socio-Economic Empowerment Charter for the South African Mining Industry, 2004 was published and, in September 2018, the Broad-Based Socio-Economic Empowerment Charter for the Mining and Minerals Industry, 2018 (the “2018 Mining Charter”) was published, repealing all prior mining charters. In September 2021, the High Court of South Africa (Gauteng Division) held that the 2018 Mining Charter is a policy document and does not, per se, bind holders of mining titles. The High Court also set aside various provisions of the 2018 Mining Charter. In November
The region’s capital expenditure of $142.6 million in 2020 remained in line with 2019 capital expenditure of $149.2 million. A total of $89.5 million was spent at Tropicana including $25.3 million of growth capital to complete the Boston Shaker underground project on time and on budget. Deferred waste and capitalised prestripping, representing 52% of the total in 2020, remains the focus at Tropicana.
The company holds 880 square kilometresBroad-Based Black Economic Empowerment Act, No. 53 of tenements2003 (the “B-BBEE Act”) is a law of general application in this highly prospective district, somerespect of Broad-Based Black Economic Empowerment (“B-BBEE”) and enables the Minister of Trade and Industry to drive B-BBEE across all sectors of the economy. In 2014, the Broad-Based Black Economic Empowerment Amendment Act, No. 46 of 2013 (the “B-BBEE Amendment Act”) came into effect amending the B-BBEE Act to provide a framework of principles, strategies and guidelines aimed at promoting the broad-based socio-economic empowerment of HDSAs across the South African economy and society in the Butcher Well joint venture with Northern Starform of ownership, management, employment equity, skills development, preferential procurement, enterprise development and some in its own right. Drilling will continue in 2021.socio-economic development.
The National Environmental Management Act, No. 107 of 1998, as amended (the “NEMA”) includes provisions to deal with environmental regulation of mining and prospecting, which provisions are administered by the MRE Minister. Pursuant to section 24N(8) of NEMA, directors of a company are jointly and severally liable for any negative impact on the environment, whether advertently or inadvertently caused by the company they represent, including damage, degradation and pollution.
From an environmental perspective, given the wide scope of the statutory duty of care in South African environmental law, erstwhile land owners may be held liable for historic contamination by the regulatory authorities. The “polluter pays” principle in South Africa enables the competent authority to seek recourse against various responsible parties based on their historical or current relationship to the source and receptor of degradation or pollution. The duty of care also applies retrospectively to significant potential to unlock known extensionspollution or degradation that occurred before the entry into force of mineralisation beneath the Tropicana and Havana open pitsNEMA (i.e., 29 January 1999), as well as extensionssignificant pollution or degradation that arises or is likely to arise at deptha different time from the actual activity that caused the contamination (e.g., latent or residual impact) or arises through an act or activity of a person that exacerbates pre-existing contamination. The authorities can also seek compensation in respect of clean-up measures that it is required to take on behalf of the Boston Shaker underground.responsible parties and apportion liability amongst the responsible parties, which could technically include a historic landowner or mining company that caused the pollution. Although the purchasers of AngloGold Ashanti’s assets in South Africa have contractually assumed all environmental liability associated with its former South African operations and agreed to indemnify AngloGold Ashanti for the same, there remains a risk, at least theoretically, of statutory liability to the state.
AFRICA REGION
Democratic Republic of the mine at SpringbokCongo (DRC)
General laws relating to mining
The mining industry in the DRC is primarily regulated by Law No. 007/2002 dated 11 July 2002 (the “2002 DRC Code”), as amended and Angel Eyes, to the south at Rusty Nailsupplemented by Law No. 18/001 dated 9 March 2018 (the “Reformed DRC Mining Code”) and further south at MadrasDecree No. 038/2003 dated 26 March 2003, as amended and New Zebra.supplemented by Decree No. 18/024 dated 8 June 2018 (the “Reformed DRC Mining Regulations”).
54
With respect to the application of the Reformed DRC Mining Code and Reformed DRC Mining Regulations, Kibali Goldmines S.A. (“Kibali Goldmines”) has reserved and continues reserving its rights, including, without limitation, its stability rights under, among other legal sources, the 2002 DRC Code. Discussions with the DRC government on these issues and the possible application of incentives that may be available under the Reformed DRC Mining Code and Reformed DRC Mining Regulations, in particular under article 220 of the Reformed DRC Mining Code which provides that the Prime Minister of the DRC may grant a number of incentives to provinces with infrastructure deficits to encourage economic development from mining resources, are ongoing.
Companies holding mining titles issued prior to the entry into force of the Reformed DRC Mining Code and Reformed DRC Mining Regulations have claims to a ten-year stability provision in accordance with prior mining legislation. Notwithstanding the adoption of the new regulatory regime, their rights with respect to such stability provision are reserved.
The Reformed DRC Mining Code grants the DRC Minister of Mines the authority to grant, refuse, suspend or terminate mineral rights, subject to conditions set out in the Reformed DRC Mining Code. Mineral rights may be granted in the form of exploration permits for an initial period of five years renewable once for a further five-year period or in the form of exploitation permits which are granted for an initial period of 25 years, renewable several times for 15-year periods until the end of the mine’s life. Prior to commencing exploration work, the holder of an exploration permit must submit for approval a mitigation and rehabilitation plan pursuant to which it must undertake to carry out certain mitigation measures of the impact of its activities on the environment, as well as rehabilitation measures. Exploitation permits are granted upon successful completion of exploration and satisfaction of certain requirements, including approval of a feasibility study, an environmental and social impact study and an environmental and social management plan. The holder of an exploitation permit is required to commence development and mine construction within three years of the grant of such permit. Failure to do so may lead to forfeiture of the exploitation permit. To protect and enforce rights acquired under an exploration or exploitation permit, the Reformed DRC Mining Code provides, depending on the nature of the dispute or controversy, administrative, judicial and national or international arbitral recourses.
Mining companies are required to grant a free-carried and non-contributory participation to the DRC government. The DRC government’s free participation was originally set at five percent, which was increased to ten percent in respect of exploitation permits issued after the entry into force of the Reformed DRC Mining Code. All mining companies are required to grant an additional five percent free-carried participation to the DRC government upon each renewal of their exploitation permit. Under the Reformed DRC Mining Code, a ten percent local contributory participation is also mandatory for exploitation permits issued after its entry into force.
Tax laws relating to mining
The Reformed DRC Mining Code sets out an exclusive and comprehensive tax and customs regime that is applicable to mining activities. Mining title holders are subject, amongst other things, to a corporate income tax of 30 percent, a windfall tax of 50 percent (subject to certain prerequisites) and are required to pay mining royalties to the DRC government. The royalty rate applicable to gold has been set at 3.5 percent. Mining title holders are also required to contribute a minimum of 0.3 percent of total turnover to community development.
The standard rate of VAT is 16 percent and is applicable to all mining companies. In the DRC, Kibali Goldmines is due certain refunds of VAT which, to date, remain outstanding. During 2022, AngloGold Ashanti did not recover any VAT offsets and refunds from its operations in the DRC. We believe that our attributable share of the net recoverable VAT balance (including recoverable fuel duty and after discounting provisions) owed to us by the DRC government amounted to $86 million as of 31 December 2022. While an agreement was reached with the DRC government on the reimbursement of the refundable VAT in 2018, uncertainty remains regarding the timing and level of cash receipts and offsets against other taxes for purposes of the recovery of our VAT receivables in the DRC.
The Reformed DRC Mining Code also provides for a level of fiscal stability. A stability clause stipulates that existing tax, customs and exchange control provisions applicable to mining activities are guaranteed to remain unchanged for a period of five years from the enactment of the Reformed DRC Mining Code.
Foreign exchange control regime
The Reformed DRC Mining Code imposed new exchange control rules requiring that mining title holders repatriate onshore 60 percent of sale revenues received during the investment amortisation period and 100 percent once the investment amortisation is completed.
During 2022, AngloGold Ashanti repatriated $694 million from its operations in the DRC, in the form of dividends from Kibali (Jersey) Limited. Kibali (Jersey) Limited received such cash from Kibali Goldmines in the form of loan repayments (net of bank fees) (AngloGold Ashanti’s attributable share: $658 million) and dividends (net of withholding taxes) (AngloGold Ashanti’s attributable share: $36 million). Our attributable share of the outstanding cash balances awaiting repatriation from the DRC amounted to $40 million as of 31 December 2022. The cash is fully available for the operational requirements of Kibali Goldmines. The cash and cash equivalents held at Kibali Goldmines are subject to various steps before they can be distributed to Kibali (Jersey) Limited and are held across four banks in the DRC, including two domestic banks.
55
AngloGold Ashanti’s rights and permits
AngloGold Ashanti holds a significant stake in the Kibali gold mine which is located in the north-eastern part of the DRC. The Kibali gold mine is owned by Kibali Goldmines which is a joint venture between Barrick Gold Corporation (45 percent), AngloGold Ashanti (45 percent) and Société Minière de Kilo-Moto S.A. (“SOKIMO”) (10 percent) which represents the interest of the DRC government. AngloGold Ashanti and Barrick Gold Corporation each have a 50 percent interest in Kibali (Jersey) Limited which holds their respective 45 percent interest in Kibali Goldmines.
The Kibali gold project is operated by Barrick Gold Corporation and comprises ten exploitation permits, of which eight expire in 2029 and two in 2030. Those exploitation permits (11447, 11467, 11468, 11469, 11470, 11471, 11472, 5052, 5073, and 5088) cover an area of approximately 1,836 km2 in the Moto goldfields.
Ghana
General laws relating to mining
Control of minerals and mining companies
The Constitution of Ghana as well as the Minerals and Mining Act, 2006 (Act 703) (the “GMM Act”) provide that all minerals in Ghana in their natural state are the property of the State and title to them is vested in the President on behalf of and in trust for the people of Ghana, with rights of reconnaissance, prospecting, recovery and associated land usage being granted under licence or lease. The grant of a mining lease by the Ghana Minister of Lands and Natural Resources (the “LNR Minister”) upon the advice of the Minerals Commission is subject to parliamentary ratification unless the mining lease falls into a class of transactions exempted by the Ghanaian Parliament. The LNR Minister has the power to object to a person becoming or remaining a controller of a company which has been granted a mining lease if the LNR Minister believes, on reasonable grounds, that the public interest would be prejudiced by the person concerned becoming, or remaining, a controller.
Stability and development agreements
The GMM Act provides for stability and development agreements. Stability agreements guarantee for a period of 15 years certain terms and conditions (mainly fiscal) to which a company’s operations are subject. Development agreements may be granted to a mineral right holder that proposes to invest over $500 million in its mineral operations in Ghana. The GMM Act permits stability provisions to be incorporated into development agreements. Stability and development agreements are subject to parliamentary ratification. In January 2020, it was proposed that the GMM Act be amended by abolishing development agreements and shortening the maximum term of stability agreements from 15 years to five years (with a possible extension for a further five years). If the GMM Act were amended along these lines, such amendments would not apply retroactively and would therefore not have an impact on existing development agreements, including the Obuasi Development Agreement (as described below). Those amendments to the GMM Act have not yet been adopted.
Ghana Stability Agreement
In 2004, following the implementation of the business combination between AngloGold Limited and Ashanti Goldfields Company Limited, AngloGold Limited and the Government of Ghana signed a stability agreement (the “Ghana Stability Agreement”) governing certain aspects of the fiscal and regulatory framework within which the company would operate in Ghana for a period of 15 years. In June 2018, the Ghana Stability Agreement ceased to apply to the Obuasi mine because of the parliamentary ratification of a new development agreement and a new tax concession agreement in relation to that mine (as described below).
The Ghana Stability Agreement continued to apply to the Iduapriem mine until it expired in April 2019. Since then, AngloGold Ashanti (Iduapriem) Limited (“AGA Iduapriem”) no longer benefits from the Ghana Stability Agreement. AGA Iduapriem benefits from certain concessions under two deeds of warranty, including exemptions from withholding taxes on dividends, interest and payments for foreign services, and allowable deductions.
Obuasi Development Agreement
AngloGold Ashanti (Ghana) Limited (“AGA Ghana”) negotiated a new development agreement in relation to the Obuasi mine (the “Obuasi DA”) with the Government of Ghana. On 21 June 2018, the Ghanaian Parliament ratified the Obuasi DA which contains stability terms as provided for in stability agreements. The Obuasi DA confers a number of rights and obligations on AGA Ghana with respect to the Obuasi mine, including, among other matters, (i) the stabilisation of the fiscal and regulatory framework (except for enactments promoting the use of Ghanaian goods and services) for a period of ten years (with a potential of it being extended for five years); (ii) the right to hold up to 80 percent of proceeds received from exporting minerals in foreign currencies outside of Ghana; (iii) obligation to give preference to materials and goods made in Ghana as well as services provided by Ghanaians; and (iv) the right to peaceful enjoyment and protection against expropriation.
56
Obuasi Tax Concession Agreement
Fiscal terms, which would ordinarily form part of a single stabilisation document, were separated from the Obuasi DA. Hence a separate tax concession agreement in relation to the Obuasi mine (the “Obuasi TCA”) was signed with the Government. On 21 June 2018, the Ghanaian Parliament ratified the Obuasi TCA with a concession period until 31 December 2027. The Obuasi TCA contains a number of tax concessions for AGA Ghana with respect to the Obuasi mine, including, among other matters, (i) a corporate income tax rate of 32.5 percent or such lower rates as may be fixed by law (instead of the current statutory rate of 35 percent); (ii) exemption of certain transactions from capital gains tax; (iii) a sliding scale royalty rate ranging from three percent to five percent for a price ranging from $1,300 up to $2,000 and above per ounce (instead of the current flat rate of five percent); and (iv) certain VAT exemptions and refunds.
Government’s Golden Share
Section 60(1) of the GMM Act provides that the Government of Ghana can require a mining company to issue to the Republic of Ghana for no consideration a special share (a “Golden Share”). A Golden Share in AGA Ghana was issued to the Government of Ghana and the Obuasi DA confirms that the Government’s rights with respect to its Golden Share apply only in respect of AGA Ghana’s assets and operations in Ghana. The Golden Share confers certain rights on the Government in respect of AGA Ghana. For example, written consent of the holder of the Golden Share is required for, among other matters, (i) any amendment of the rights and restrictions in respect of the Golden Share; (ii) the voluntary winding-up or voluntary liquidation of AGA Ghana; (iii) the disposal of any mining lease held by AGA Ghana; and (iv) the disposal of all or substantially all of the assets of AGA Ghana. The holder of the Golden Share does not have the right to participate in the profits or assets of AGA Ghana (by way of dividend or other capital issuances), but is entitled to attend any general meeting of shareholders.
Tax laws relating to mining
Currently, the main tax laws in Ghana include the following acts and regulations, which have been frequently amended over the years:
•Income Tax Act, 2015 (Act 896) (as amended) and Income Tax Regulations, 2016 (L.I. 2244);
•Customs Act, 2015 (Act 891) (as amended) and Customs Regulations, 2016 (L.I. 2248);
•Value Added Tax, 2013 (Act 870) (as amended) and Value Added Tax Regulations, 2016 (L.I. 2243);
•Revenue Administration Act, 2016 (Act 915) (as amended); and
•Exemptions Act, 2022 (Act 1083).
The Income Tax Act, 2015 (Act 896) ringfences and taxes income derived from mining operations at the rate of 35 percent. The Obuasi TCA for AGA Ghana provides for a stabilised income tax rate of 32.5 percent. AGA Iduapriem currently pays income tax at the rate of 35 percent.
Furthermore, mining companies must pay ground rent and royalties. Ground rent is payable annually and is calculated based on the number of cadastral units of land held. Royalties are calculated as a percentage of total revenue from minerals obtained by the mining company. The Government of Ghana currently applies a five percent royalty rate to mining companies who have not agreed a different royalty rate under an agreement with the State. AGA Ghana pays royalties on a sliding scale ranging between three percent and five percent as provided for by the Obuasi TCA. AGA Iduapriem pays royalties at a rate of five percent.
The provision of goods and services is liable to value added tax (“VAT”) at a revised rate of 15 percent. In addition, there are separate levies, including a 2.5 percent National Health Insurance Levy (“NHIL”), a 2.5 percent Ghana Education Trust Fund Levy (“GetFund Levy”) and a one percent COVID-19 Levy. By virtue of the Obuasi TCA, AGA Ghana is exempt from the payment of the NHIL and GetFund Levy. In addition, while AGA Ghana is technically exempt from the payment of the COVID-19 Levy (as it became operational subsequent to the effective date of the Obuasi DA), the Company decided to pay the COVID-19 Levy voluntarily. AGA Iduapriem is not exempt from any of these levies.
The Exemptions Act, 2022 (Act 1083) (“Exemptions Act”) defines the scope of tax exemptions that may be granted under Ghanaian law, and sets out the administrative process for obtaining a tax exemption. The Exemptions Act requires a person with the benefit of an existing tax exemption to apply to the Ghana Minister of Finance by 11 March 2023 in order to continue to benefit from that tax exemption. The requirement to apply to the Minister of Finance does not affect AGA Ghana (as, by virtue of the Obuasi DA, AGA Ghana is stabilized against the adverse effects of, or obligations imposed by, any new laws). By contrast, AGA Iduapriem is subject to the provisions of the Exemptions Act.
Environmental laws relating to mining
Mining companies are required, under the GMM Act, Environmental Assessment Regulations, 1999 (L.I. 1652), Environmental Protection (Mining in Forest Reserves) Regulations, 2022 (L.I. 2462) and Water Use Regulations, 2001 (L.I. 1692), to obtain all necessary approvals from the Environmental Protection Agency (the “Ghana EPA”) and, in appropriate cases, the Water Resources Commission, the Forestry Commission and/or the Minerals Commission before undertaking mining operations. This includes undergoing an environmental impact assessment process and, following the issuance of the environmental permit, periodically preparing environmental management plans, which include details of the likely impacts of mining operations on the environment and local communities, as well as a comprehensive plan and timetable for actions to mitigate and remediate any
57
adverse effects of the mining operations, for submission to the Ghana EPA. The Minerals and Mining (Health, Safety and Technical) Regulations, 2012 (L.I. 2182) also impose further obligations to obtain the necessary permits from the Inspectorate Division of the Minerals Commission for the operation of mines. The environmental permits of AGA Ghana (for the Obuasi redevelopment project and for the construction and operation of tailings and water infrastructure projects) are valid until June 2024. The environmental permits for AGA Iduapriem in connection with (i) gold mining and processing, (ii) the re-mining of Block 5 and for the tertiary crusher installation project and (iii) the construction and operation of a tailings storage facility (“TSF”) expired in August 2021, July 2022 and January 2023, respectively. The renewal process for the AGA Iduapriem environmental permits, which was commenced in advance of the expiry of the permits, is underway.
Environmental laws in Ghana also require mining operators to rehabilitate land negatively impacted by mining operations according to an environmental cost reclamation plan agreed with the Ghana EPA. The environmental cost reclamation plan includes two cost estimates, namely the cost of rehabilitating the mining area at the end of the life of the mine as well as the cost of rehabilitating the mine as at the date of the reclamation plan. These estimates are reviewed annually and updated every two years. Each mining company is typically required to secure a percentage (typically between 50 percent and 100 percent) of the estimated rehabilitation costs by posting reclamation bonds underwritten by banks and restricted cash. The terms of each reclamation bond are determined by a reclamation security agreement between that company and the Ghana EPA. Both AGA Ghana and AGA Iduapriem have bank guarantees in place for environmental reclamation liabilities as well as escrow accounts with joint signatories from the Ghana EPA. The guarantees for AGA Iduapriem expired in October 2022, whereas the guarantees for AGA Ghana expired in December 2022. Renewal of the bank guarantees (which commenced in advance of the expiry of the existing guarantees) has not yet been completed due to the continued depreciation of the Ghanaian cedi and its impact on the Bank of Ghana’s single obligor limit. AGA Ghana and AGA Iduapriem have notified the Ghana EPA of the resultant delays.
Foreign exchange, export and other rules
Retention of foreign earnings
The Obuasi mine is permitted to retain 80 percent of its foreign exchange earnings in an offshore foreign exchange account, whereas the Iduapriem mine is allowed to retain up to 75 percent. In addition, the Company has permission from the Bank of Ghana to retain and use U.S. dollars outside of Ghana to fulfil payment obligations to the Company’s hedge counterparties which cannot be met from the cash resources of its treasury company.
Rules regarding the export of gold and diamonds
The Bank of Ghana introduced new measures to regulate and monitor the export of gold and diamonds from Ghana in 2015. From September 2015, all exports of gold and diamonds must be carried out through the Precious Minerals Marketing Company Ltd (“PMMC”), except where the exporter is the holder of a licence that permits it to export directly. The Ghana Revenue Authority (Customs Division) only permits gold to be exported by a licensed gold exporter who has a completed Form FEX A4 bearing Bank of Ghana’s embossment. The export measures do not apply to AngloGold Ashanti because the Company holds a licence granted by the LNR Minister to sell and export its production.
Local assaying and refinement policies
In November 2016, the Ministry of Lands and Natural Resources issued a ministerial directive appointing the PMMC as designated laboratory for assaying in Ghana. The directive requests all persons holding export licences for gold to submit all gold to be exported to the PMMC for assay before export. Mining businesses, including AngloGold Ashanti, acting through the Ghana Chamber of Mines were opposed to this directive due to its potential negative impact on mining companies in the region. As a result, the Chamber initiated proceedings to reverse or modify the directive. Following discussions in respect of the mining industry’s concerns, the Chamber and Government agreed on the modalities for implementing the national assaying policy and it was introduced in February 2018 following a one-month pilot among certain mining companies. Subsequently, in June 2019, the LNR Minister released a statement reiterating the Government of Ghana’s plans to locally refine 30 percent of the gold produced in the country. Discussions between the Ghana Chamber of Mines and the Government of Ghana’s economic management team in 2019 led to the Chamber agreeing to consider the proposal and for the parties to discuss detailed modalities to ensure that a move to locally refined gold does not become detrimental to the mining industry.
Local content and local participation policy
Mining companies must submit a detailed programme for the recruitment and training of Ghanaians with a view to achieving “localisation”, which is the replacement of expatriate personnel in a company’s Ghanaian operations by Ghanaian personnel. In addition, mining companies must give preference to Ghanaian products and personnel, to the maximum extent possible, consistent with safety, efficiency and economies. The Minerals and Mining (General) Regulations, 2012 (L.I. 2173) give further details on the localisation policy. The Minerals and Mining (Local Content and Local Participation) Regulations, 2020 (L.I. 2431) came into force on 22 December 2020 with the purpose of developing Ghanaian participation in the mining industry value chain by imposing an obligation on mining companies to procure goods and services with Ghanaian content to the maximum extent possible.
58
The Government’s election to purchase gold
In June 2021, the Bank of Ghana launched a “Domestic Gold Purchase Programme” through which the Bank of Ghana intends to purchase refined gold from AGA Ghana, AGA Iduapriem and other large-scale mining companies through voluntary arrangements pursuant to the Bank of Ghana Act, 2002 (Act 612). The LNR Minister indicated in November 2022 that the Government of Ghana intended to exercise its statutory right of pre-emption pursuant to the GMM Act to compel large-scale mining companies to sell 20 percent of their Ghana gold production and/or the resultant refined gold to the Bank of Ghana in exchange for Ghanaian cedis. Each of AGA Ghana and AGA Iduapriem executed voluntary gold purchase agreements with the Bank of Ghana on 29 December 2022. As at 10 March 2023, the Government of Ghana had not exercised its statutory right of pre-emption as prescribed in the GMM Act.
AngloGold Ashanti’s rights and permits
Obuasi
The Obuasi mine originally held four contiguous mining leases, namely, the Obuasi, Binsere 1, Binsere 2 and Binsere 3 Mining Leases. The Obuasi Mining Lease was granted by the Government of Ghana on 5 March 1994, covering an area of approximately 338 km2 in the Amansie East and Adansi West districts of the Ashanti region, for a term of 30 years from the date of the agreement. The Binsere Mining Leases were granted on 9 April 1998, covering an area of 140 km2, for a term of 30 years from the date of the agreement. All leases in respect of the Obuasi mine had been duly ratified in accordance with Ghanaian law. In March 2007, the Government of Ghana agreed to extend the term of the Obuasi Mining Lease for a further term of 30 years. The amended Obuasi Mining Lease was also ratified by Parliament on 23 October 2008. The Obuasi Mining Lease will expire in March 2054 and the Binsere Mining Leases in April 2028. The mining leases are renewable. On 3 March 2016, the Minerals Commission approved AGA Ghana’s application to surrender approximately 273.54 km2 of the area to the Government of Ghana, reducing the combined area under AGA Ghana’s lease areas to 201.46 km2. The remaining parcel of land that will be subject to the mining lease is situated within various villages and townships in the region but excludes the municipality of Obuasi. On 15 January 2021, the Minerals Commission approved AGA Ghana’s application to surrender a further 60.24 km2 of lease area, thereby reducing the total lease area to 141.22 km2 under three mining leases, namely, the Obuasi Mining Lease (87.48 km2), the Binsere 1 Mining Lease (29.03 km2) and the Binsere 2 Mining Lease (24.71 km2). These mining leases are covered by the Obuasi DA and Obuasi TCA.
Iduapriem
The Iduapriem mine operates under four different mining leases, namely, the Iduapriem Mining Lease (LVB1539/89) (36.47 km2), the Ajopa Mining Lease (LVB/WR326/09) (46.12 km2), the Teberebie Mining Lease (LVB3722H/92) (28.53 km2) and the Ajopa South Mining Lease (LR#1109/1999) (28.10 km2). On 17 February 2020, the mining leases were extended for a further period of 15 years and such leases will now expire in February 2035. All leases in respect of the Iduapriem mine have been duly ratified in accordance with Ghanaian law.
Guinea
General laws relating to mining
In Guinea, the mining industry is primarily regulated by Law L/2011/006/CNT dated 9 September 2011 as amended by Law L/2013/053/CNT dated 8 April 2013 and promulgated by Decree D/2013/075/PRG/SGG dated 17 April 2013 (together, the “Guinea Mining Code”).
The Guinea Mining Code is implemented by various decrees and orders, including Decree D/2014/015/PRG/SGG adopting a model of mining convention, dated 17 January 2014, Order A/2016/1584/MMG/SGG related to the administration’s capacities for the management of integrated mining projects (PARCA-GPI) and its steering committee, dated 6 June 2016, and Decree D/2016/163/PRG/SGG on the national agency for the development of mining infrastructures (ANAIM), dated 13 June 2016.
In 2017, Decree D/2017/285/PRG/SGG was adopted, which sets forth the conditions for the constitution and management of the Local Development Fund (“Fodel”), as well as Joint Order A/2017/6326/MMG/MATD/SGG, which sets forth the conditions for the use, management and control of the Fodel. Together, these set forth the use of the mining companies’ financial contribution to the development of the local communities and the rules applying to the Fodel, which was created under the Guinea Mining Code. On 13 July 2018, a Joint Order A/2018/5212/MEF/MMG/MB/MATD/SGG was issued, which regulates the use, management and monitoring of the resources allocated to local authorities pursuant to article 165 of the Guinea Mining Code. In 2019, an inter-ministerial committee was created to supervise and control the Fodel through the adoption of Joint Order AC/2019/089/MMG/MATD/SGG setting out the conditions for the constitution, powers and management of said inter-ministerial committee. On 6 September 2019, Decree D/2019/263/PRG/SGG was issued, which sets forth local content requirements in the framework of the implementation of public and private projects in Guinea. On 27 May 2021, Order A/2021/1229/MMG/SGG was issued to establish the Steering Committee for local content in the mining sector. On 21 October 2022, Law L/2022/010/CNT, dated 22 September 2022, setting up the legal framework for local content in public and private projects was enacted (the “Local Content Act”). In particular, the Local Content Act regulates local employment, procurement of goods and services, and subcontracting
59
requirements. As the Local Content Act does not expressly repeal the provisions of Decree D/2019/263/PRG/SGG, those provisions remain in force to the extent that they do not conflict with the Local Content Act.
On 16 June 2020, a new procedure for the export of gold by mining companies was enacted through the adoption of Decree D/2020/113/PRG/SGG, which sets out, amongst other things: (i) when the industrial production tax referred to in article 161-1 of the Guinea Mining Code shall be paid, and (ii) the process to be followed to export gold bullion.
On 27 April 2021, a Joint Order AC/2021/824/MMG/BCRG/SGG was issued establishing the fees and costs charged by the Guinean mining authorities and the Guinean Central Bank in connection with the administrative procedures for the export of gold by industrial and semi-industrial companies.
AngloGold Ashanti’s rights and permits
The Group’s Guinean subsidiary, Société AngloGold Ashanti de Guinée S.A. (“SAG”), has title to the Siguiri mine in the form of a mining concession, granted by virtue of Presidential Decree D/97/171/PRG/SGG, dated 4 August 1997, for a period of 25 years (the “Mining Concession”). The Mining Concession covers exploration and mining for gold, silver, diamonds and associated ores, and was originally covered by a mining convention entered into with the Republic of Guinea in 1993 and amended in 2005. On 28 June 2016, SAG and the Government of Guinea concluded a revised and consolidated mining convention (Convention de Base Révisée et Consolidée) (the “Revised Mining Convention”) which encompasses a renewal of the term of the original mining convention and other amendments necessary to support an expansion project to extend the life of the Siguiri mine (the “Expansion”). In compliance with the provisions of the Guinea Mining Code, the Revised Mining Convention was ratified by the Guinean National Assembly (Law L/2016/N°067/AN dated 30 December 2016, promulgated by Decree D/2017/015/PRG/SGG dated 24 January 2017), submitted to the Guinean Supreme Court which rendered a favourable opinion (Judgement N°AC 005 dated 16 January 2017), and ratified by the President of the Republic of Guinea (Decree D/2017/021/PRG/SGG dated 24 January 2017), following which it replaced the original mining convention and became effective on 24 January 2017.
Key elements of the Revised Mining Convention include the following:
•a duration of 25 years, expiring 23 January 2042, subject to further renewal if mining operations continue;
•the term of the Mining Concession is aligned with the term of the Revised Mining Convention since the Republic of Guinea committed to maintain the Mining Concession for the entire duration of the Revised Mining Convention;
•SAG’s operations remain governed by the 1995 Guinea Mining Code (the prior mining code) and are only subject to the provisions of the Guinea Mining Code to the extent they are expressly set out in the Revised Mining Convention;
•the stability of the customs and tax regime is guaranteed for the entire initial term of the Revised Mining Convention, and subject to certain conditions being met, any renewal period(s);
•the Republic of Guinea holds a 15 percent free-carried/non-contributory interest;
•the Republic of Guinea is entitled to a royalty on gold of five percent based on a spot gold price as per LBMA fixing (PM) up until the date of steady state commercial production of the first phase of the Expansion, after which the royalty rate applicable to gold will vary depending on threshold prices as per LBMA fixing (PM), namely: three percent if the gold price is $1,300 or less, five percent, if above $1,300 and up to $2,000 and seven percent if above $2,000;
•SAG benefits from 5-year income tax holiday from the beginning of steady state commercial production of the first phase of the Expansion, after which the income tax rate is set at 30 percent;
•a local development tax of 0.4 percent is payable on the sale price for gold and silver received by SAG up until 31 December 2027, after which it will be increased to 0.6 percent;
•salaries of expatriate employees are subject to a ten percent income tax;
•goods imported into Guinea for purposes related to the construction and commissioning of the first phase of the Expansion are exempt from all customs taxes and duties; and
•SAG is committed to adopting and progressively implementing a plan for the effective rehabilitation of the mining areas disturbed or affected by its operations.
The Mining Concession covers an area divided into four blocks totalling approximately 1,495 km2. SAG has the exclusive right to explore and mine in any part of the concession area for the duration of the Revised Mining Convention. The Revised Mining Convention also grants SAG the option to secure certain land rights over additional areas currently covered by exploration permits, but to which SAG may need access for purposes of establishing roads or storage of tailings. While the Mining Concession expired on 4 August 2022, a renewal request had been filed prior to its expiry in accordance with the provisions of the Revised Mining Convention on 1 February 2022. Pursuant to the Revised Mining Convention, the Mining Concession can be renewed for one or more period(s) that cannot exceed ten years each as long as the Revised Mining Convention is in force.
The Revised Mining Convention is subject to early termination if the parties formally and expressly agree to it, if the last of the mining title held by SAG expires or is relinquished without any renewal application having been filed, if all project activities are voluntarily suspended for a continuous period of 12 months or are permanently abandoned by SAG, or if SAG goes into voluntary liquidation or is placed into liquidation by a court of competent jurisdiction.
60
Mali
General laws relating to mining
The mining industry in Mali is primarily regulated by Ordinance No. 2019-022/P-RM dated 27 September 2019 containing the new mining code of the Republic of Mali (the “Mali Mining Code”) and Decree No. 2020-0177/PT-RM dated 12 November 2020 implementing the Mali Mining Code. On 8 December 2020, Decree No. 2020-0288/PM-RM enacted the new model mining convention referred to in Decree No. 2020-0177/PT-RM.
The Mali Mining Code applies to the mining operations previously carried out by AngloGold Ashanti entities in Mali (as further described below) except with respect to the validity, scope and duration of their exploitation permits and the provisions on tax and customs regime contained in their mining conventions (conventions d’établissement) for their remaining duration. In this regard, the transitory rules of the Mali Mining Code specify that mining conventions in force remain valid for their remaining term and their holders continue to benefit from the stability of the tax and customs regime set out therein.
Exploration and prospecting activities are carried out under exploration authorisations (autorisation d’exploration) or exploration permits (permis de recherche), which give their holder the exclusive right to carry out exploration activities over a given area. Exploration authorisations are granted by the Mining Administration (Administration chargée des Mines) for a non-renewable period of three months, while exploration permits are granted by Ministerial Order for a period of three years renewable twice for additional 3-year periods. Applications for exploration authorisations and exploration permits must contain various documents attesting to the financial and technical capacity of the applicant as well as a detailed works and costs programme.
A large scale permit exploitation permit (permis d’exploitation de grande mine) is required to mine a deposit located within the area of an exploration permit and grants the holder an exclusive right to exploit the named substances and proceed with the processing and commercialisation of the substances extracted within its perimeter. Large scale exploitation permits are granted by decree of the Head of Government for a maximum period of 12 years renewable for ten year-periods until depletion of the deposits. An application must be submitted to the Mining Administration (Administration chargée des Mines) and must contain various documents attesting to the financial and technical capacity of the applicant, a feasibility study, a detailed environmental study in respect of the impact of the project on the environment, an environmental permit, a closure and rehabilitation plan as well as a community development plan. As soon as the large scale exploitation permit is granted, the permit holder must incorporate a company under the laws of Mali and assign the permit for free to this company. The State will have a ten percent free-carried interest in the company. This interest will be converted into priority shares and the State’s participation will not be diluted in case of an increase in capital. In addition, the company is required to ensure that private Malian investors are offered the possibility to acquire five percent of their capital.
All mining titles mentioned above (save for the exploration authorisation) require a mining convention (convention d’établissement) to be signed by the State and the titleholder defining their rights and obligations, the duration of which is 20 years.
AngloGold Ashanti’s rights and permits
Historically, AngloGold Ashanti had interests in the Morila, Sadiola and Yatela gold mines, all of which were governed by mining conventions (conventions d’établissement) covering exploration, mining, treatment and marketing in a comprehensive document. These documents include general provisions regarding exploration (work programme, fiscal and customs framework) and exploitation (formation of a local limited liability mining company, State interest, fiscal and customs framework governing construction and exploitation phases, exchange controls, marketing of the product, accounting regime, training programmes for local labour, protection of the environment, reclamation, safety, hygiene and dispute settlement). The Morila and Sadiola gold mines were sold in November and December 2020, respectively.
In April 2017, Société d’Exploitation des Mines d’Or de Yatela S.A. (“Yatela”), the company operating the Yatela gold mine, began the implementation of a closure plan in order to relinquish the property. In February 2019, AngloGold Ashanti and its joint venture partner IAMGOLD Corporation announced an agreement to sell each of their 40 percent interests in Yatela to the Government of Mali, which holds the remaining 20 percent interest. Completion of the transaction is subject to the fulfilment or waiver of a number of conditions precedent and has been delayed several times since 2019 due to political instability and related events in Mali as well as the COVID-19 pandemic. Yatela’s exploitation permit covers approximately 212 km2. Yatela has a 30-year permit which expires in 2030.
Tanzania
General laws relating to mining
Tanzania Mining Act and Tanzania Mining Regulations
Mineral rights in the United Republic of Tanzania are principally governed by the Mining Act, Chapter 123 (R.E. 2019), as amended (the “Tanzania Mining Act”) and the Mining Regulations, 2018 (the “Tanzania Mining Regulations”). The Tanzania
61
Mining Act and the Tanzania Mining Regulations came into force in November 2010 followed by amendments to the Tanzania Mining Act in 2017 and subsequent amendments to the Tanzania Mining Regulations in 2018 and 2019. The Mining (Local Content) Regulations were amended and came into force on 23 September 2022. Those amendments, together with an Executive Order, introduced, among other matters, (i) the Tanzania Mining Commission; (ii) local content requirements in employment and for procurement of goods and services; (iii) Mining Licence requirements of five percent of a licencee’s equity to be held by Tanzanians, with at least 80 percent of its managerial positions to be held by Tanzanians and 100 percent of non-managerial and other positions to be held by Tanzanians, in addition to the shareholding of the Government of Tanzania pursuant to Section 10 of the Tanzania Mining Act (i.e. free-carried interest); and (iv) regulations for the government warehousing of minerals prior to export/sale.
Minimum shareholding and public offering
In 2016, the Mining (Minimum Shareholding and Public Offering) Regulations, 2016, as amended, was adopted. The regulations set out the requirement to sell shares to Tanzanian nationals, by way of a public offering and listing on the Dar es Salaam Stock Exchange, which will apply to companies that are carrying out large scale mining operations. The regulations also require all existing holders of a special mining licence to list a minimum of 30 percent of their shares on either the Main Investment Market or the Enterprise Growth Market Segment of the Dar es Salaam Stock Exchange within six months of the regulations coming into force, which was on 24 February 2017. However, the Company believes the listing requirement conflicts with the mining development agreement. In September 2020, the Government of Tanzania published the Mining (Minimum Shareholding and Public Offering) (Amendment) Regulations, 2020, which exempts companies holding special mining licences from local listing requirements if such mining company has entered into an agreement with the Government of Tanzania that provides for a non-dilutable free-carried interest in such mining company and an economic benefits sharing arrangement.
Arbitration
Along with other major mining companies, AngloGold Ashanti’s subsidiaries are seeking a constructive dialogue with the Government of Tanzania to gain assurances that the Geita gold mine will not be affected by recent legal and fiscal changes adopted by the Government in light of their mining development agreements which guarantee (i) fiscal and regulatory stability, and (ii) an agreement between all parties before material legal and regulatory changes are made. As a precautionary step to safeguard its interests, AngloGold Ashanti commenced international arbitration proceedings against the Government of Tanzania in connection with the enactment of this legislation in July 2017. Declaratory relief is sought in accordance with the terms of the company’s existing mining development agreement to preserve its and its shareholders’ rights and interests in the Geita gold mine. AngloGold Ashanti is seeking confirmation from the Government of Tanzania that, as a result of its existing mining development agreement, the company does not fall within the scope of the new mining legislation that includes, among other things, (i) listing requirements; (ii) an increase in the rate of revenue royalties from four to six percent and a one percent clearance fee; and (iii) a right for the Government of Tanzania to (a) renegotiate existing mining agreements at its discretion, (b) receive a non-dilutable, free-carried interest of no less than 16 percent in all mining projects, and (c) acquire up to 50 percent of the shares of the mining company commensurate with the total tax expenditure incurred by the Government in favour of the mining company. AngloGold Ashanti can provide no assurance that the new mining legislation, including the listing requirements, will not apply to its operations in Tanzania and the outcome of the arbitration action may have a material adverse impact on the company’s results of operations and financial condition. See also “Item 8A: Legal Proceedings-Tanzania”.
Categories of mineral right licences
Ownership of and control over minerals on, in or under the land vest in the President of the United Republic of Tanzania. No person is allowed to prospect for minerals or carry on mining operations except pursuant to the authority of a mineral right licence granted, or deemed to have been granted, under the Tanzania Mining Act or its predecessor acts. To enable a company to prospect or mine, the Tanzania Mining Commission (“MC”) initially grants an exclusive prospecting licence. Upon presentation of a feasibility study, together with certain other environmental, social and financial assurances, the MC may then grant a form of licence for mining. Three categories of licences can be applied for under the Tanzania Mining Act: licences for exploration, licences for mining, and licences for ancillary activities. Licences for exploration include prospecting licences and gemstone prospecting licences. Licences for mining include special mining licences (if the proposed capital investment is equal to at least $100 million), mining licences (if the proposed capital investment is equal to between $100,000 and $100 million) and primary mining licences (reserved for Tanzanian citizens).
A prospecting licence grants the holder the exclusive right to prospect in the area covered by the licence for all minerals within the class of minerals applied for. An application for a prospecting licence is made to the Mining Commission and the licence, once granted, is valid for an initial term of four years. After the initial term, the licence is renewable for a further period of three years, with no option for renewal thereafter. Upon renewal, 50 percent of the area covered by the licence must be relinquished.
Mining is mainly carried out through either a mining licence or a special mining licence, both of which confer on the holder the exclusive right to conduct mining operations in or on the area covered by the licence. A special mining licence is granted for the shorter of either the estimated life of the ore body indicated in the feasibility study report or such period as the applicant may request. The holder of a special mining licence may apply for renewal of its licence at any time but no later than one year before the expiry of the licence and such renewal shall not be for a period exceeding the estimate life of the remaining ore body. Special
62
mining licences have certain fiscal and other advantages over mining licences, as the holder of a special mining licence may enter into a mining development agreement with the Government of Tanzania to guarantee the fiscal stability of a long-term mining project and make special provision for the payment of royalties, taxes, fees and other fiscal imposts. A special mining licence holder may, in certain circumstances, amend the programme of the mining operations agreed with the MC.
Tax laws relating to mining
Currently, the main tax laws in Tanzania comprise the Finance Act, 2015 (No. 16), which came into force on 1 July 2015, the Finance Act, 2017 (No. 4), which came into force on 1 July 2017, and currently the Finance Act, 2022 (No. 5), which came into force on 1 July 2022. All tax laws impose and revise certain taxes, duties, levies and fees. Among other provisions, inspection or clearance fees on the exportation or domestic use of minerals were introduced. Such exportation or domestic use is restricted unless such minerals have been inspected or cleared at the mining areas, ports, airports, border or posts and the clearing fee of one percent of the gross value of the minerals has been paid by the exporter or any other person in possession thereof. Local government levies and environmental management fees and charges apply as well.
Effective 20 July 2017, the Value Added Tax Act, 2014 (No. 5) (the “VAT Act”) was amended in order to restrict VAT relief for VAT input tax paid by mining companies on goods and services. Prior to the enactment of this amendment to the VAT Act, mining companies were entitled to 100 percent VAT relief in respect of the goods and services they purchased. The amendment prohibits refunds for VAT input tax incurred on a series of raw products, including the exportation of “raw minerals”. Subsequently, the Tanzania Revenue Authority (“TRA”) denied our applications for VAT input credit refunds, which amounted to a total of $153 million (after discounting provisions) as of 31 December 2022, covering the period from July 2017 onwards, on the basis that all of the gold doré that we export constitutes “raw minerals” for purposes of the VAT Act. In response, the company filed formal notices of objection with the TRA stating that the exportation of gold doré is, in its view, not covered by the restriction since doré does not fall within the category of “raw minerals” as used in the VAT Act. On 22 February 2019, the Tanzania Mining Act was amended to introduce a definition for “raw minerals” which supports our interpretation that gold doré is excluded from the prohibition. On 1 July 2020, the Finance Act, 2020 (No. 8), amended the VAT Act, without retrospective effect, in order to remove the restrictions on VAT input tax credits for the exportation of “raw minerals” as well as a series of other raw products. This recent amendment confirms the technical basis for VAT input tax recovery for mineral exporters from July 2020 onwards. VAT claims from July 2020 onwards are subject to verification procedures by the TRA before any refunds will be received. In 2022, the company was able to offset $45 million of verified VAT claims (from July 2020 onwards) against its corporate tax liability in Tanzania. Discussions with the TRA are ongoing to resolve our historical claims for VAT input credit refunds for the period from July 2017 to June 2020.
Natural resources, export and other rules
Natural resources legislation
In Tanzania, two laws in respect of natural resources came into force in July 2017: the Natural Wealth and Resources Contracts (Review and Re-negotiation of Unconscionable Terms) Act, 2017 (No. 6) (the “Unconscionable Terms Act”) and the Natural Wealth and Resources (Permanent Sovereignty) Act, 2017 (No. 5) (the “Permanent Sovereignty Act” and together with the Unconscionable Terms Act, the “Natural Resources Laws”). Implementing regulations were published in January 2020. The Natural Resources Laws provide that Tanzania has sovereignty over its natural resources and that all arrangements or agreements that relate to “natural wealth and resources” are subject to review by the National Assembly to ensure that they are in the interests of the people of Tanzania. During a review all unconscionable terms as interpreted in accordance with the law are expunged from the agreement. In addition, under the laws, disputes over natural wealth and resources will not be subject to any proceedings in any foreign court or tribunal. As a result, investors are restricted from accessing international dispute resolution mechanisms. Accordingly, companies are now required to adopt Tanzanian law and local dispute resolution in all mining agreements. As such, all disputes will be handles by Tanzanian judicial bodies or any other Tanzania government body vested with powers to resolve disputes. In addition, to ensure that the Government and the people of Tanzania obtain an equitable stake in the exploitation of mining resources, all project earnings must be retained in Tanzanian banks. Investors are also prevented from freely exporting raw minerals and repatriating funds.
Section 6 of the Unconscionable Terms Act specifically provides that where there is an unconscionable term, the National Assembly may pass a resolution for re-negotiation of the agreement whereupon the Government shall serve notice to the investor to re-negotiate the term or agreement. The Government and the particular investor have 90 days from the notice date to re-negotiate the term or agreement. If both parties fail to revise the unconscionable term, the term will be deemed removed from the agreement. A term is considered “unconscionable” under the Unconscionable Terms Act if, among other grounds, the requirements or provisions of the agreement restrict the right of the state to exercise authority over foreign investment within the country and in accordance with the laws of Tanzania, are inequitable and onerous to the state, secure preferential treatment designed to create a separate legal regime to be applied discriminatorily for the benefit of a particular investor, deprive the people of Tanzania of the economic benefits derived from subjecting natural wealth and resources to beneficiation in the country, or subject the state to the jurisdiction of foreign laws and foreign courts or tribunals.
63
State participation
On 23 September 2022, the Mining (State Participation) Regulations, 2022 (the “SPR 2022”) came into force. The SPR 2022 required every mining licence or special mining licence holder to give notice to the MC to initiate negotiations to enable the Government of Tanzania to acquire a shareholding in the mining operation by 23 December 2022. On 9 December 2022, the company notified the MC that it had already initiated negotiations with the Government of Tanzania prior to the coming into force of the SPR 2022. The Government’s equity interest must consist of a non-dilutable free-carried interest in the mining operation ranging between 16 percent and 50 percent depending, in part, on the quantification of tax expenditures enjoyed by the mining entity during its establishment and on the extent of Government development of public infrastructure servicing the mining operation. The free-carried interest shares (the “FCI shares”) will be regarded as preferred shares and will entitle the Government to a dividend. Further, the FCI shares give the Government the right to appoint two directors (out of five) of the company engaged in the mining operation and the right to approve at least two suitable persons to the top executive management of the company engaged in the mining operation as may be agreed in the shareholders agreement. Any other management positions created by the company engaged in the mining operation shall be shared with the Government on a ratio of 3:1. The SPR 2022 also provides for the non-deductibility of royalty payments in the calculation of corporate income tax.
Local participation policy
On 15 September 2015, the Non-Citizens (Employment Regulation) Act, 2015 (No. 1) (the “Non-Citizens Act”) came into force which vests powers concerning work permits with the Labour Commissioner. Therefore, non-citizens wishing to be employed in the country are required to apply and be granted a work permit before applying for a residence permit. Before granting the work permit, the Labour Commissioner must be satisfied that all efforts have been explored to acquire a local expert. Further, the company is required to submit a succession plan to both the Labour Commissioner and the MC which sets out a well-articulated plan for the transfer of the non-citizen’s knowledge and expertise to Tanzanian citizens. Moreover, the Commissioner General of Immigration is required to take into consideration conditions of the work permit issued by the Labour Commissioner when granting a residence permit.
The Tanzania Investment Act No. 10 of 2022
On 2 December 2022, the Tanzania Investment Act, 2022 (No. 10) (the “Investment Act”) came into force. The Investment Act restores the right to international arbitration and grants foreign investors access to settle disputes with the Tanzania Investment Centre or the Government of Tanzania through arbitration. Pursuant to the Investment Act, parties to a dispute may agree to the use of a local or foreign arbitration venue.
AngloGold Ashanti’s rights and permits
The Geita gold mine is located in the Lake Victoria goldfields of the Mwanza region of Tanzania. AngloGold Ashanti has concluded a mining development agreement with the Ministry of Minerals on 24 June 1999 and was issued a special mining licence (SML45/99) covering approximately 196 km2 for a period of 25 years, which expires on 26 August 2024. The internal renewal process for the special mining licence (SML45/99) is underway with a view to submitting an application for renewal prior to its expiry date. On 9 October 2014, an addendum to the mining development agreement was entered into ratifying, among other matters, an increase in the royalty rate from three percent to four percent with effect from 1 May 2012. In March 2020, Geita Gold Mining Limited received the consent of the Minister of Minerals to change the mining method under its special mining licence from open pit to underground method, subject to the requisite terms and conditions. Within the special mining licence area, there are also seven primary mining licences of approximately 0.63 km2 in total which belong to third parties. Furthermore, AngloGold Ashanti holds prospecting licences covering (i) an area of 120 km2 in the immediate vicinity of its special mining licence area, and (ii) an area of 690 km2 located in the Dodoma, Singida and Shinyanga regions, but none of these areas contain any Mineral Reserve. All licences are in good standing.
SOUTH AFRICA
As part of the South African asset sale, AngloGold Ashanti Limited sold its remaining three mining rights in South Africa to Golden Core Trade and Invest (Pty) Ltd (“Golden Core”) and Harmony Gold Mining Company Limited pursuant to a sale agreement concluded on or about 12 February 2020, as amended and reinstated from time to time (the “SA Sale Agreement”). These mining rights relate to operations in the West Wits area.
General laws relating to mining
The MPRDA
The Mineral and Petroleum Resources Development Act, No. 28 of 2002 (the “MPRDA”) came into effect on 1 May 2004. The objectives of the MPRDA are, amongst other things, to allow for state sovereignty over all mineral and petroleum resources in the country, to promote economic growth and the development of these resources and to expand opportunities for the historically disadvantaged and to ensure security of tenure for the respective operations concerning prospecting, exploration, mining and production. By virtue of the provisions of the MPRDA, the state ensures that holders of mining and prospecting rights contribute to the socioeconomic development of the areas in which they operate. The Mineral and Petroleum Resources Development Amendment Act, No. 49 of 2008 (the “MPRDAA”) became effective on 7 June 2013. On 23 April 2004, the Minister of Mineral Resources and Energy (the “MRE Minister”) published, under the terms of the MPRDA, the Mineral and Petroleum Resources Development Regulations in order to implement the provisions of the MPRDA and MPRDAA. These implementation regulations were amended on 27 March 2020.
The mining charter
Since 2004, a series of mining charters have been adopted in South Africa with the main purpose of transferring part of the ownership of mining assets to black or historically disadvantaged South Africans (“HDSAs”) within a certain time period. Such mining charters also set targets for, amongst other things, the advancement of HDSAs into management positions, the employment of women, procurement of goods and services from HDSA-owned companies, training, community development and the upgrading of mine housing. In 2004, the Broad-Based Socio-Economic Empowerment Charter for the South African Mining Industry, 2004 was published and, in September 2018, the Broad-Based Socio-Economic Empowerment Charter for the Mining and Minerals Industry, 2018 (the “2018 Mining Charter”) was published, repealing all prior mining charters. In September 2021, the High Court of South Africa (Gauteng Division) held that the 2018 Mining Charter is a policy document and does not, per se, bind holders of mining titles. The High Court also set aside various provisions of the 2018 Mining Charter. In November
53
2021, the South African Department of Mineral Resources and Energy (“DMRE”) informed the parliamentary portfolio committee on mineral resources and energy that it does not intend to appeal the outcome of the judgement, but instead will consider steps to achieve the empowerment objectives through legislative amendments to the MPRDA.
The B-BBEE Act
The Broad-Based Black Economic Empowerment Act, No. 53 of 2003 (the “B-BBEE Act”) is a law of general application in respect of Broad-Based Black Economic Empowerment (“B-BBEE”) and enables the Minister of Trade and Industry to drive B-BBEE across all sectors of the economy. In 2014, the Broad-Based Black Economic Empowerment Amendment Act, No. 46 of 2013 (the “B-BBEE Amendment Act”) came into effect amending the B-BBEE Act to provide a framework of principles, strategies and guidelines aimed at promoting the broad-based socio-economic empowerment of HDSAs across the South African economy and society in the form of ownership, management, employment equity, skills development, preferential procurement, enterprise development and socio-economic development.
Environmental laws relating to mining
The National Environmental Management Act, No. 107 of 1998, as amended (the “NEMA”) includes provisions to deal with environmental regulation of mining and prospecting, which provisions are administered by the MRE Minister. Pursuant to section 24N(8) of NEMA, directors of a company are jointly and severally liable for any negative impact on the environment, whether advertently or inadvertently caused by the company they represent, including damage, degradation and pollution.
From an environmental perspective, given the wide scope of the statutory duty of care in South African environmental law, erstwhile land owners may be held liable for historic contamination by the regulatory authorities. The “polluter pays” principle in South Africa enables the competent authority to seek recourse against various responsible parties based on their historical or current relationship to the source and receptor of degradation or pollution. The duty of care also applies retrospectively to significant pollution or degradation that occurred before the entry into force of NEMA (i.e., 29 January 1999), as well as significant pollution or degradation that arises or is likely to arise at a different time from the actual activity that caused the contamination (e.g., latent or residual impact) or arises through an act or activity of a person that exacerbates pre-existing contamination. The authorities can also seek compensation in respect of clean-up measures that it is required to take on behalf of the responsible parties and apportion liability amongst the responsible parties, which could technically include a historic landowner or mining company that caused the pollution. Although the purchasers of AngloGold Ashanti’s assets in South Africa have contractually assumed all environmental liability associated with its former South African operations and agreed to indemnify AngloGold Ashanti for the same, there remains a risk, at least theoretically, of statutory liability to the state.
AngloGold Ashanti’s rights and permits
Pursuant to the SA Sale Agreement, AngloGold Ashanti and Golden Core executed a notarial deed of cession of the mining rights with DMRE references GP 30/5/1/2/2/01 MR and GP 30/5/1/2/2/248 MR to transfer and cede these mining rights to Golden Core (the “Deed of Cession”). On 14 June 2021, the Deed of Cession was registered at the Mineral and Petroleum Titles Registration Office (the “MPTRO”).
With respect to the mining right held under DMRE reference GP 30/5/1/2/2/11 MR, AngloGold Ashanti and Golden Core agreed to make an application in terms of section 102 of the MPRDA at the DMRE after the closing date of the SA Sale Agreement requesting, among other matters, the incorporation of this mining right into the mining right with DMRE reference GP 30/5/1/2/2/01 MR (the “Harmony Consolidation Application”). AngloGold Ashanti also executed a notarial conditional deed of abandonment pursuant to which it conditionally abandons this mining right in terms of section 56(f) of the MPRDA (the “Deed of Abandonment”) on condition that ministerial consent is granted in respect of the Harmony Consolidation Application. The Harmony Consolidation Application, which was submitted to the DMRE on 17 January 2022, is still pending. On the date of the grant of the Harmony Consolidation Application, AngloGold Ashanti will cease to be a holder of any mining rights in South Africa. Once the transaction has been fully implemented, the general laws relating to mining outlined above will no longer be applicable to the Company, other than the statutory duty of care in terms of NEMA as described above.
AFRICA REGION
Democratic Republic of the Congo (DRC)
General laws relating to mining
The mining industry in the DRC is primarily regulated by Law No. 007/2002 dated 11 July 2002 (the “2002 DRC Code”), as amended and supplemented by Law No. 18/001 dated 9 March 2018 (the “Reformed DRC Mining Code”) and Decree No. 038/2003 dated 26 March 2003, as amended and supplemented by Decree No. 18/024 dated 8 June 2018 (the “Reformed DRC Mining Regulations”).
54
With respect to the application of the Reformed DRC Mining Code and Reformed DRC Mining Regulations, Kibali Goldmines S.A. (“Kibali Goldmines”) has reserved and continues reserving its rights, including, without limitation, its stability rights under, among other legal sources, the 2002 DRC Code. Discussions with the DRC government on these issues and the possible application of incentives that may be available under the Reformed DRC Mining Code and Reformed DRC Mining Regulations, in particular under article 220 of the Reformed DRC Mining Code which provides that the Prime Minister of the DRC may grant a number of incentives to provinces with infrastructure deficits to encourage economic development from mining resources, are ongoing.
Companies holding mining titles issued prior to the entry into force of the Reformed DRC Mining Code and Reformed DRC Mining Regulations have claims to a ten-year stability provision in accordance with prior mining legislation. Notwithstanding the adoption of the new regulatory regime, their rights with respect to such stability provision are reserved.
The Reformed DRC Mining Code grants the DRC Minister of Mines the authority to grant, refuse, suspend or terminate mineral rights, subject to conditions set out in the Reformed DRC Mining Code. Mineral rights may be granted in the form of exploration permits for an initial period of five years renewable once for a further five-year period or in the form of exploitation permits which are granted for an initial period of 25 years, renewable several times for 15-year periods until the end of the mine’s life. Prior to commencing exploration work, the holder of an exploration permit must submit for approval a mitigation and rehabilitation plan pursuant to which it must undertake to carry out certain mitigation measures of the impact of its activities on the environment, as well as rehabilitation measures. Exploitation permits are granted upon successful completion of exploration and satisfaction of certain requirements, including approval of a feasibility study, an environmental and social impact study and an environmental and social management plan. The holder of an exploitation permit is required to commence development and mine construction within three years of the grant of such permit. Failure to do so may lead to forfeiture of the exploitation permit. To protect and enforce rights acquired under an exploration or exploitation permit, the Reformed DRC Mining Code provides, depending on the nature of the dispute or controversy, administrative, judicial and national or international arbitral recourses.
Mining companies are required to grant a free-carried and non-contributory participation to the DRC government. The DRC government’s free participation was originally set at five percent, which was increased to ten percent in respect of exploitation permits issued after the entry into force of the Reformed DRC Mining Code. All mining companies are required to grant an additional five percent free-carried participation to the DRC government upon each renewal of their exploitation permit. Under the Reformed DRC Mining Code, a ten percent local contributory participation is also mandatory for exploitation permits issued after its entry into force.
Tax laws relating to mining
The Reformed DRC Mining Code sets out an exclusive and comprehensive tax and customs regime that is applicable to mining activities. Mining title holders are subject, amongst other things, to a corporate income tax of 30 percent, a windfall tax of 50 percent (subject to certain prerequisites) and are required to pay mining royalties to the DRC government. The royalty rate applicable to gold has been set at 3.5 percent. Mining title holders are also required to contribute a minimum of 0.3 percent of total turnover to community development.
The standard rate of VAT is 16 percent and is applicable to all mining companies. In the DRC, Kibali Goldmines is due certain refunds of VAT which, to date, remain outstanding. During 2022, AngloGold Ashanti did not recover any VAT offsets and refunds from its operations in the DRC. We believe that our attributable share of the net recoverable VAT balance (including recoverable fuel duty and after discounting provisions) owed to us by the DRC government amounted to $86 million as of 31 December 2022. While an agreement was reached with the DRC government on the reimbursement of the refundable VAT in 2018, uncertainty remains regarding the timing and level of cash receipts and offsets against other taxes for purposes of the recovery of our VAT receivables in the DRC.
The Reformed DRC Mining Code also provides for a level of fiscal stability. A stability clause stipulates that existing tax, customs and exchange control provisions applicable to mining activities are guaranteed to remain unchanged for a period of five years from the enactment of the Reformed DRC Mining Code.
Foreign exchange control regime
The Reformed DRC Mining Code imposed new exchange control rules requiring that mining title holders repatriate onshore 60 percent of sale revenues received during the investment amortisation period and 100 percent once the investment amortisation is completed.
During 2022, AngloGold Ashanti repatriated $694 million from its operations in the DRC, in the form of dividends from Kibali (Jersey) Limited. Kibali (Jersey) Limited received such cash from Kibali Goldmines in the form of loan repayments (net of bank fees) (AngloGold Ashanti’s attributable share: $658 million) and dividends (net of withholding taxes) (AngloGold Ashanti’s attributable share: $36 million). Our attributable share of the outstanding cash balances awaiting repatriation from the DRC amounted to $40 million as of 31 December 2022. The cash is fully available for the operational requirements of Kibali Goldmines. The cash and cash equivalents held at Kibali Goldmines are subject to various steps before they can be distributed to Kibali (Jersey) Limited and are held across four banks in the DRC, including two domestic banks.
55
AngloGold Ashanti’s rights and permits
AngloGold Ashanti holds a significant stake in the Kibali gold mine which is located in the north-eastern part of the DRC. The Kibali gold mine is owned by Kibali Goldmines which is a joint venture between Barrick Gold Corporation (45 percent), AngloGold Ashanti (45 percent) and Société Minière de Kilo-Moto S.A. (“SOKIMO”) (10 percent) which represents the interest of the DRC government. AngloGold Ashanti and Barrick Gold Corporation each have a 50 percent interest in Kibali (Jersey) Limited which holds their respective 45 percent interest in Kibali Goldmines.
The Kibali gold project is operated by Barrick Gold Corporation and comprises ten exploitation permits, of which eight expire in 2029 and two in 2030. Those exploitation permits (11447, 11467, 11468, 11469, 11470, 11471, 11472, 5052, 5073, and 5088) cover an area of approximately 1,836 km2 in the Moto goldfields.
Ghana
General laws relating to mining
Control of minerals and mining companies
The Constitution of Ghana as well as the Minerals and Mining Act, 2006 (Act 703) (the “GMM Act”) provide that all minerals in Ghana in their natural state are the property of the State and title to them is vested in the President on behalf of and in trust for the people of Ghana, with rights of reconnaissance, prospecting, recovery and associated land usage being granted under licence or lease. The grant of a mining lease by the Ghana Minister of Lands and Natural Resources (the “LNR Minister”) upon the advice of the Minerals Commission is subject to parliamentary ratification unless the mining lease falls into a class of transactions exempted by the Ghanaian Parliament. The LNR Minister has the power to object to a person becoming or remaining a controller of a company which has been granted a mining lease if the LNR Minister believes, on reasonable grounds, that the public interest would be prejudiced by the person concerned becoming, or remaining, a controller.
Stability and development agreements
The GMM Act provides for stability and development agreements. Stability agreements guarantee for a period of 15 years certain terms and conditions (mainly fiscal) to which a company’s operations are subject. Development agreements may be granted to a mineral right holder that proposes to invest over $500 million in its mineral operations in Ghana. The GMM Act permits stability provisions to be incorporated into development agreements. Stability and development agreements are subject to parliamentary ratification. In January 2020, it was proposed that the GMM Act be amended by abolishing development agreements and shortening the maximum term of stability agreements from 15 years to five years (with a possible extension for a further five years). If the GMM Act were amended along these lines, such amendments would not apply retroactively and would therefore not have an impact on existing development agreements, including the Obuasi Development Agreement (as described below). Those amendments to the GMM Act have not yet been adopted.
Ghana Stability Agreement
In 2004, following the implementation of the business combination between AngloGold Limited and Ashanti Goldfields Company Limited, AngloGold Limited and the Government of Ghana signed a stability agreement (the “Ghana Stability Agreement”) governing certain aspects of the fiscal and regulatory framework within which the company would operate in Ghana for a period of 15 years. In June 2018, the Ghana Stability Agreement ceased to apply to the Obuasi mine because of the parliamentary ratification of a new development agreement and a new tax concession agreement in relation to that mine (as described below).
The Ghana Stability Agreement continued to apply to the Iduapriem mine until it expired in April 2019. Since then, AngloGold Ashanti (Iduapriem) Limited (“AGA Iduapriem”) no longer benefits from the Ghana Stability Agreement. AGA Iduapriem benefits from certain concessions under two deeds of warranty, including exemptions from withholding taxes on dividends, interest and payments for foreign services, and allowable deductions.
Obuasi Development Agreement
AngloGold Ashanti (Ghana) Limited (“AGA Ghana”) negotiated a new development agreement in relation to the Obuasi mine (the “Obuasi DA”) with the Government of Ghana. On 21 June 2018, the Ghanaian Parliament ratified the Obuasi DA which contains stability terms as provided for in stability agreements. The Obuasi DA confers a number of rights and obligations on AGA Ghana with respect to the Obuasi mine, including, among other matters, (i) the stabilisation of the fiscal and regulatory framework (except for enactments promoting the use of Ghanaian goods and services) for a period of ten years (with a potential of it being extended for five years); (ii) the right to hold up to 80 percent of proceeds received from exporting minerals in foreign currencies outside of Ghana; (iii) obligation to give preference to materials and goods made in Ghana as well as services provided by Ghanaians; and (iv) the right to peaceful enjoyment and protection against expropriation.
56
Obuasi Tax Concession Agreement
Fiscal terms, which would ordinarily form part of a single stabilisation document, were separated from the Obuasi DA. Hence a separate tax concession agreement in relation to the Obuasi mine (the “Obuasi TCA”) was signed with the Government. On 21 June 2018, the Ghanaian Parliament ratified the Obuasi TCA with a concession period until 31 December 2027. The Obuasi TCA contains a number of tax concessions for AGA Ghana with respect to the Obuasi mine, including, among other matters, (i) a corporate income tax rate of 32.5 percent or such lower rates as may be fixed by law (instead of the current statutory rate of 35 percent); (ii) exemption of certain transactions from capital gains tax; (iii) a sliding scale royalty rate ranging from three percent to five percent for a price ranging from $1,300 up to $2,000 and above per ounce (instead of the current flat rate of five percent); and (iv) certain VAT exemptions and refunds.
Government’s Golden Share
Section 60(1) of the GMM Act provides that the Government of Ghana can require a mining company to issue to the Republic of Ghana for no consideration a special share (a “Golden Share”). A Golden Share in AGA Ghana was issued to the Government of Ghana and the Obuasi DA confirms that the Government’s rights with respect to its Golden Share apply only in respect of AGA Ghana’s assets and operations in Ghana. The Golden Share confers certain rights on the Government in respect of AGA Ghana. For example, written consent of the holder of the Golden Share is required for, among other matters, (i) any amendment of the rights and restrictions in respect of the Golden Share; (ii) the voluntary winding-up or voluntary liquidation of AGA Ghana; (iii) the disposal of any mining lease held by AGA Ghana; and (iv) the disposal of all or substantially all of the assets of AGA Ghana. The holder of the Golden Share does not have the right to participate in the profits or assets of AGA Ghana (by way of dividend or other capital issuances), but is entitled to attend any general meeting of shareholders.
Tax laws relating to mining
Currently, the main tax laws in Ghana include the following acts and regulations, which have been frequently amended over the years:
•Income Tax Act, 2015 (Act 896) (as amended) and Income Tax Regulations, 2016 (L.I. 2244);
•Customs Act, 2015 (Act 891) (as amended) and Customs Regulations, 2016 (L.I. 2248);
•Value Added Tax, 2013 (Act 870) (as amended) and Value Added Tax Regulations, 2016 (L.I. 2243);
•Revenue Administration Act, 2016 (Act 915) (as amended); and
•Exemptions Act, 2022 (Act 1083).
The Income Tax Act, 2015 (Act 896) ringfences and taxes income derived from mining operations at the rate of 35 percent. The Obuasi TCA for AGA Ghana provides for a stabilised income tax rate of 32.5 percent. AGA Iduapriem currently pays income tax at the rate of 35 percent.
Furthermore, mining companies must pay ground rent and royalties. Ground rent is payable annually and is calculated based on the number of cadastral units of land held. Royalties are calculated as a percentage of total revenue from minerals obtained by the mining company. The Government of Ghana currently applies a five percent royalty rate to mining companies who have not agreed a different royalty rate under an agreement with the State. AGA Ghana pays royalties on a sliding scale ranging between three percent and five percent as provided for by the Obuasi TCA. AGA Iduapriem pays royalties at a rate of five percent.
The provision of goods and services is liable to value added tax (“VAT”) at a revised rate of 15 percent. In addition, there are separate levies, including a 2.5 percent National Health Insurance Levy (“NHIL”), a 2.5 percent Ghana Education Trust Fund Levy (“GetFund Levy”) and a one percent COVID-19 Levy. By virtue of the Obuasi TCA, AGA Ghana is exempt from the payment of the NHIL and GetFund Levy. In addition, while AGA Ghana is technically exempt from the payment of the COVID-19 Levy (as it became operational subsequent to the effective date of the Obuasi DA), the Company decided to pay the COVID-19 Levy voluntarily. AGA Iduapriem is not exempt from any of these levies.
The Exemptions Act, 2022 (Act 1083) (“Exemptions Act”) defines the scope of tax exemptions that may be granted under Ghanaian law, and sets out the administrative process for obtaining a tax exemption. The Exemptions Act requires a person with the benefit of an existing tax exemption to apply to the Ghana Minister of Finance by 11 March 2023 in order to continue to benefit from that tax exemption. The requirement to apply to the Minister of Finance does not affect AGA Ghana (as, by virtue of the Obuasi DA, AGA Ghana is stabilized against the adverse effects of, or obligations imposed by, any new laws). By contrast, AGA Iduapriem is subject to the provisions of the Exemptions Act.
Environmental laws relating to mining
Mining companies are required, under the GMM Act, Environmental Assessment Regulations, 1999 (L.I. 1652), Environmental Protection (Mining in Forest Reserves) Regulations, 2022 (L.I. 2462) and Water Use Regulations, 2001 (L.I. 1692), to obtain all necessary approvals from the Environmental Protection Agency (the “Ghana EPA”) and, in appropriate cases, the Water Resources Commission, the Forestry Commission and/or the Minerals Commission before undertaking mining operations. This includes undergoing an environmental impact assessment process and, following the issuance of the environmental permit, periodically preparing environmental management plans, which include details of the likely impacts of mining operations on the environment and local communities, as well as a comprehensive plan and timetable for actions to mitigate and remediate any
57
adverse effects of the mining operations, for submission to the Ghana EPA. The Minerals and Mining (Health, Safety and Technical) Regulations, 2012 (L.I. 2182) also impose further obligations to obtain the necessary permits from the Inspectorate Division of the Minerals Commission for the operation of mines. The environmental permits of AGA Ghana (for the Obuasi redevelopment project and for the construction and operation of tailings and water infrastructure projects) are valid until June 2024. The environmental permits for AGA Iduapriem in connection with (i) gold mining and processing, (ii) the re-mining of Block 5 and for the tertiary crusher installation project and (iii) the construction and operation of a tailings storage facility (“TSF”) expired in August 2021, July 2022 and January 2023, respectively. The renewal process for the AGA Iduapriem environmental permits, which was commenced in advance of the expiry of the permits, is underway.
Environmental laws in Ghana also require mining operators to rehabilitate land negatively impacted by mining operations according to an environmental cost reclamation plan agreed with the Ghana EPA. The environmental cost reclamation plan includes two cost estimates, namely the cost of rehabilitating the mining area at the end of the life of the mine as well as the cost of rehabilitating the mine as at the date of the reclamation plan. These estimates are reviewed annually and updated every two years. Each mining company is typically required to secure a percentage (typically between 50 percent and 100 percent) of the estimated rehabilitation costs by posting reclamation bonds underwritten by banks and restricted cash. The terms of each reclamation bond are determined by a reclamation security agreement between that company and the Ghana EPA. Both AGA Ghana and AGA Iduapriem have bank guarantees in place for environmental reclamation liabilities as well as escrow accounts with joint signatories from the Ghana EPA. The guarantees for AGA Iduapriem expired in October 2022, whereas the guarantees for AGA Ghana expired in December 2022. Renewal of the bank guarantees (which commenced in advance of the expiry of the existing guarantees) has not yet been completed due to the continued depreciation of the Ghanaian cedi and its impact on the Bank of Ghana’s single obligor limit. AGA Ghana and AGA Iduapriem have notified the Ghana EPA of the resultant delays.
Foreign exchange, export and other rules
Retention of foreign earnings
The Obuasi mine is permitted to retain 80 percent of its foreign exchange earnings in an offshore foreign exchange account, whereas the Iduapriem mine is allowed to retain up to 75 percent. In addition, the Company has permission from the Bank of Ghana to retain and use U.S. dollars outside of Ghana to fulfil payment obligations to the Company’s hedge counterparties which cannot be met from the cash resources of its treasury company.
Rules regarding the export of gold and diamonds
The Bank of Ghana introduced new measures to regulate and monitor the export of gold and diamonds from Ghana in 2015. From September 2015, all exports of gold and diamonds must be carried out through the Precious Minerals Marketing Company Ltd (“PMMC”), except where the exporter is the holder of a licence that permits it to export directly. The Ghana Revenue Authority (Customs Division) only permits gold to be exported by a licensed gold exporter who has a completed Form FEX A4 bearing Bank of Ghana’s embossment. The export measures do not apply to AngloGold Ashanti because the Company holds a licence granted by the LNR Minister to sell and export its production.
Local assaying and refinement policies
In November 2016, the Ministry of Lands and Natural Resources issued a ministerial directive appointing the PMMC as designated laboratory for assaying in Ghana. The directive requests all persons holding export licences for gold to submit all gold to be exported to the PMMC for assay before export. Mining businesses, including AngloGold Ashanti, acting through the Ghana Chamber of Mines were opposed to this directive due to its potential negative impact on mining companies in the region. As a result, the Chamber initiated proceedings to reverse or modify the directive. Following discussions in respect of the mining industry’s concerns, the Chamber and Government agreed on the modalities for implementing the national assaying policy and it was introduced in February 2018 following a one-month pilot among certain mining companies. Subsequently, in June 2019, the LNR Minister released a statement reiterating the Government of Ghana’s plans to locally refine 30 percent of the gold produced in the country. Discussions between the Ghana Chamber of Mines and the Government of Ghana’s economic management team in 2019 led to the Chamber agreeing to consider the proposal and for the parties to discuss detailed modalities to ensure that a move to locally refined gold does not become detrimental to the mining industry.
Local content and local participation policy
Mining companies must submit a detailed programme for the recruitment and training of Ghanaians with a view to achieving “localisation”, which is the replacement of expatriate personnel in a company’s Ghanaian operations by Ghanaian personnel. In addition, mining companies must give preference to Ghanaian products and personnel, to the maximum extent possible, consistent with safety, efficiency and economies. The Minerals and Mining (General) Regulations, 2012 (L.I. 2173) give further details on the localisation policy. The Minerals and Mining (Local Content and Local Participation) Regulations, 2020 (L.I. 2431) came into force on 22 December 2020 with the purpose of developing Ghanaian participation in the mining industry value chain by imposing an obligation on mining companies to procure goods and services with Ghanaian content to the maximum extent possible.
58
The Government’s election to purchase gold
In June 2021, the Bank of Ghana launched a “Domestic Gold Purchase Programme” through which the Bank of Ghana intends to purchase refined gold from AGA Ghana, AGA Iduapriem and other large-scale mining companies through voluntary arrangements pursuant to the Bank of Ghana Act, 2002 (Act 612). The LNR Minister indicated in November 2022 that the Government of Ghana intended to exercise its statutory right of pre-emption pursuant to the GMM Act to compel large-scale mining companies to sell 20 percent of their Ghana gold production and/or the resultant refined gold to the Bank of Ghana in exchange for Ghanaian cedis. Each of AGA Ghana and AGA Iduapriem executed voluntary gold purchase agreements with the Bank of Ghana on 29 December 2022. As at 10 March 2023, the Government of Ghana had not exercised its statutory right of pre-emption as prescribed in the GMM Act.
AngloGold Ashanti’s rights and permits
Obuasi
The Obuasi mine originally held four contiguous mining leases, namely, the Obuasi, Binsere 1, Binsere 2 and Binsere 3 Mining Leases. The Obuasi Mining Lease was granted by the Government of Ghana on 5 March 1994, covering an area of approximately 338 km2 in the Amansie East and Adansi West districts of the Ashanti region, for a term of 30 years from the date of the agreement. The Binsere Mining Leases were granted on 9 April 1998, covering an area of 140 km2, for a term of 30 years from the date of the agreement. All leases in respect of the Obuasi mine had been duly ratified in accordance with Ghanaian law. In March 2007, the Government of Ghana agreed to extend the term of the Obuasi Mining Lease for a further term of 30 years. The amended Obuasi Mining Lease was also ratified by Parliament on 23 October 2008. The Obuasi Mining Lease will expire in March 2054 and the Binsere Mining Leases in April 2028. The mining leases are renewable. On 3 March 2016, the Minerals Commission approved AGA Ghana’s application to surrender approximately 273.54 km2 of the area to the Government of Ghana, reducing the combined area under AGA Ghana’s lease areas to 201.46 km2. The remaining parcel of land that will be subject to the mining lease is situated within various villages and townships in the region but excludes the municipality of Obuasi. On 15 January 2021, the Minerals Commission approved AGA Ghana’s application to surrender a further 60.24 km2 of lease area, thereby reducing the total lease area to 141.22 km2 under three mining leases, namely, the Obuasi Mining Lease (87.48 km2), the Binsere 1 Mining Lease (29.03 km2) and the Binsere 2 Mining Lease (24.71 km2). These mining leases are covered by the Obuasi DA and Obuasi TCA.
Iduapriem
The Iduapriem mine operates under four different mining leases, namely, the Iduapriem Mining Lease (LVB1539/89) (36.47 km2), the Ajopa Mining Lease (LVB/WR326/09) (46.12 km2), the Teberebie Mining Lease (LVB3722H/92) (28.53 km2) and the Ajopa South Mining Lease (LR#1109/1999) (28.10 km2). On 17 February 2020, the mining leases were extended for a further period of 15 years and such leases will now expire in February 2035. All leases in respect of the Iduapriem mine have been duly ratified in accordance with Ghanaian law.
Guinea
General laws relating to mining
In Guinea, the mining industry is primarily regulated by Law L/2011/006/CNT dated 9 September 2011 as amended by Law L/2013/053/CNT dated 8 April 2013 and promulgated by Decree D/2013/075/PRG/SGG dated 17 April 2013 (together, the “Guinea Mining Code”).
The Guinea Mining Code is implemented by various decrees and orders, including Decree D/2014/015/PRG/SGG adopting a model of mining convention, dated 17 January 2014, Order A/2016/1584/MMG/SGG related to the administration’s capacities for the management of integrated mining projects (PARCA-GPI) and its steering committee, dated 6 June 2016, and Decree D/2016/163/PRG/SGG on the national agency for the development of mining infrastructures (ANAIM), dated 13 June 2016.
In 2017, Decree D/2017/285/PRG/SGG was adopted, which sets forth the conditions for the constitution and management of the Local Development Fund (“Fodel”), as well as Joint Order A/2017/6326/MMG/MATD/SGG, which sets forth the conditions for the use, management and control of the Fodel. Together, these set forth the use of the mining companies’ financial contribution to the development of the local communities and the rules applying to the Fodel, which was created under the Guinea Mining Code. On 13 July 2018, a Joint Order A/2018/5212/MEF/MMG/MB/MATD/SGG was issued, which regulates the use, management and monitoring of the resources allocated to local authorities pursuant to article 165 of the Guinea Mining Code. In 2019, an inter-ministerial committee was created to supervise and control the Fodel through the adoption of Joint Order AC/2019/089/MMG/MATD/SGG setting out the conditions for the constitution, powers and management of said inter-ministerial committee. On 6 September 2019, Decree D/2019/263/PRG/SGG was issued, which sets forth local content requirements in the framework of the implementation of public and private projects in Guinea. On 27 May 2021, Order A/2021/1229/MMG/SGG was issued to establish the Steering Committee for local content in the mining sector. On 21 October 2022, Law L/2022/010/CNT, dated 22 September 2022, setting up the legal framework for local content in public and private projects was enacted (the “Local Content Act”). In particular, the Local Content Act regulates local employment, procurement of goods and services, and subcontracting
59
requirements. As the Local Content Act does not expressly repeal the provisions of Decree D/2019/263/PRG/SGG, those provisions remain in force to the extent that they do not conflict with the Local Content Act.
On 16 June 2020, a new procedure for the export of gold by mining companies was enacted through the adoption of Decree D/2020/113/PRG/SGG, which sets out, amongst other things: (i) when the industrial production tax referred to in article 161-1 of the Guinea Mining Code shall be paid, and (ii) the process to be followed to export gold bullion.
On 27 April 2021, a Joint Order AC/2021/824/MMG/BCRG/SGG was issued establishing the fees and costs charged by the Guinean mining authorities and the Guinean Central Bank in connection with the administrative procedures for the export of gold by industrial and semi-industrial companies.
AngloGold Ashanti’s rights and permits
The Group’s Guinean subsidiary, Société AngloGold Ashanti de Guinée S.A. (“SAG”), has title to the Siguiri mine in the form of a mining concession, granted by virtue of Presidential Decree D/97/171/PRG/SGG, dated 4 August 1997, for a period of 25 years (the “Mining Concession”). The Mining Concession covers exploration and mining for gold, silver, diamonds and associated ores, and was originally covered by a mining convention entered into with the Republic of Guinea in 1993 and amended in 2005. On 28 June 2016, SAG and the Government of Guinea concluded a revised and consolidated mining convention (Convention de Base Révisée et Consolidée) (the “Revised Mining Convention”) which encompasses a renewal of the term of the original mining convention and other amendments necessary to support an expansion project to extend the life of the Siguiri mine (the “Expansion”). In compliance with the provisions of the Guinea Mining Code, the Revised Mining Convention was ratified by the Guinean National Assembly (Law L/2016/N°067/AN dated 30 December 2016, promulgated by Decree D/2017/015/PRG/SGG dated 24 January 2017), submitted to the Guinean Supreme Court which rendered a favourable opinion (Judgement N°AC 005 dated 16 January 2017), and ratified by the President of the Republic of Guinea (Decree D/2017/021/PRG/SGG dated 24 January 2017), following which it replaced the original mining convention and became effective on 24 January 2017.
Key elements of the Revised Mining Convention include the following:
•a duration of 25 years, expiring 23 January 2042, subject to further renewal if mining operations continue;
•the term of the Mining Concession is aligned with the term of the Revised Mining Convention since the Republic of Guinea committed to maintain the Mining Concession for the entire duration of the Revised Mining Convention;
•SAG’s operations remain governed by the 1995 Guinea Mining Code (the prior mining code) and are only subject to the provisions of the Guinea Mining Code to the extent they are expressly set out in the Revised Mining Convention;
•the stability of the customs and tax regime is guaranteed for the entire initial term of the Revised Mining Convention, and subject to certain conditions being met, any renewal period(s);
•the Republic of Guinea holds a 15 percent free-carried/non-contributory interest;
•the Republic of Guinea is entitled to a royalty on gold of five percent based on a spot gold price as per LBMA fixing (PM) up until the date of steady state commercial production of the first phase of the Expansion, after which the royalty rate applicable to gold will vary depending on threshold prices as per LBMA fixing (PM), namely: three percent if the gold price is $1,300 or less, five percent, if above $1,300 and up to $2,000 and seven percent if above $2,000;
•SAG benefits from 5-year income tax holiday from the beginning of steady state commercial production of the first phase of the Expansion, after which the income tax rate is set at 30 percent;
•a local development tax of 0.4 percent is payable on the sale price for gold and silver received by SAG up until 31 December 2027, after which it will be increased to 0.6 percent;
•salaries of expatriate employees are subject to a ten percent income tax;
•goods imported into Guinea for purposes related to the construction and commissioning of the first phase of the Expansion are exempt from all customs taxes and duties; and
•SAG is committed to adopting and progressively implementing a plan for the effective rehabilitation of the mining areas disturbed or affected by its operations.
The Mining Concession covers an area divided into four blocks totalling approximately 1,495 km2. SAG has the exclusive right to explore and mine in any part of the concession area for the duration of the Revised Mining Convention. The Revised Mining Convention also grants SAG the option to secure certain land rights over additional areas currently covered by exploration permits, but to which SAG may need access for purposes of establishing roads or storage of tailings. While the Mining Concession expired on 4 August 2022, a renewal request had been filed prior to its expiry in accordance with the provisions of the Revised Mining Convention on 1 February 2022. Pursuant to the Revised Mining Convention, the Mining Concession can be renewed for one or more period(s) that cannot exceed ten years each as long as the Revised Mining Convention is in force.
The Revised Mining Convention is subject to early termination if the parties formally and expressly agree to it, if the last of the mining title held by SAG expires or is relinquished without any renewal application having been filed, if all project activities are voluntarily suspended for a continuous period of 12 months or are permanently abandoned by SAG, or if SAG goes into voluntary liquidation or is placed into liquidation by a court of competent jurisdiction.
60
Mali
General laws relating to mining
The mining industry in Mali is primarily regulated by Ordinance No. 2019-022/P-RM dated 27 September 2019 containing the new mining code of the Republic of Mali (the “Mali Mining Code”) and Decree No. 2020-0177/PT-RM dated 12 November 2020 implementing the Mali Mining Code. On 8 December 2020, Decree No. 2020-0288/PM-RM enacted the new model mining convention referred to in Decree No. 2020-0177/PT-RM.
The Mali Mining Code applies to the mining operations previously carried out by AngloGold Ashanti entities in Mali (as further described below) except with respect to the validity, scope and duration of their exploitation permits and the provisions on tax and customs regime contained in their mining conventions (conventions d’établissement) for their remaining duration. In this regard, the transitory rules of the Mali Mining Code specify that mining conventions in force remain valid for their remaining term and their holders continue to benefit from the stability of the tax and customs regime set out therein.
Exploration and prospecting activities are carried out under exploration authorisations (autorisation d’exploration) or exploration permits (permis de recherche), which give their holder the exclusive right to carry out exploration activities over a given area. Exploration authorisations are granted by the Mining Administration (Administration chargée des Mines) for a non-renewable period of three months, while exploration permits are granted by Ministerial Order for a period of three years renewable twice for additional 3-year periods. Applications for exploration authorisations and exploration permits must contain various documents attesting to the financial and technical capacity of the applicant as well as a detailed works and costs programme.
A large scale permit exploitation permit (permis d’exploitation de grande mine) is required to mine a deposit located within the area of an exploration permit and grants the holder an exclusive right to exploit the named substances and proceed with the processing and commercialisation of the substances extracted within its perimeter. Large scale exploitation permits are granted by decree of the Head of Government for a maximum period of 12 years renewable for ten year-periods until depletion of the deposits. An application must be submitted to the Mining Administration (Administration chargée des Mines) and must contain various documents attesting to the financial and technical capacity of the applicant, a feasibility study, a detailed environmental study in respect of the impact of the project on the environment, an environmental permit, a closure and rehabilitation plan as well as a community development plan. As soon as the large scale exploitation permit is granted, the permit holder must incorporate a company under the laws of Mali and assign the permit for free to this company. The State will have a ten percent free-carried interest in the company. This interest will be converted into priority shares and the State’s participation will not be diluted in case of an increase in capital. In addition, the company is required to ensure that private Malian investors are offered the possibility to acquire five percent of their capital.
All mining titles mentioned above (save for the exploration authorisation) require a mining convention (convention d’établissement) to be signed by the State and the titleholder defining their rights and obligations, the duration of which is 20 years.
AngloGold Ashanti’s rights and permits
Historically, AngloGold Ashanti had interests in the Morila, Sadiola and Yatela gold mines, all of which were governed by mining conventions (conventions d’établissement) covering exploration, mining, treatment and marketing in a comprehensive document. These documents include general provisions regarding exploration (work programme, fiscal and customs framework) and exploitation (formation of a local limited liability mining company, State interest, fiscal and customs framework governing construction and exploitation phases, exchange controls, marketing of the product, accounting regime, training programmes for local labour, protection of the environment, reclamation, safety, hygiene and dispute settlement). The Morila and Sadiola gold mines were sold in November and December 2020, respectively.
In April 2017, Société d’Exploitation des Mines d’Or de Yatela S.A. (“Yatela”), the company operating the Yatela gold mine, began the implementation of a closure plan in order to relinquish the property. In February 2019, AngloGold Ashanti and its joint venture partner IAMGOLD Corporation announced an agreement to sell each of their 40 percent interests in Yatela to the Government of Mali, which holds the remaining 20 percent interest. Completion of the transaction is subject to the fulfilment or waiver of a number of conditions precedent and has been delayed several times since 2019 due to political instability and related events in Mali as well as the COVID-19 pandemic. Yatela’s exploitation permit covers approximately 212 km2. Yatela has a 30-year permit which expires in 2030.
Tanzania
General laws relating to mining
Tanzania Mining Act and Tanzania Mining Regulations
Mineral rights in the United Republic of Tanzania are principally governed by the Mining Act, Chapter 123 (R.E. 2019), as amended (the “Tanzania Mining Act”) and the Mining Regulations, 2018 (the “Tanzania Mining Regulations”). The Tanzania
61
Mining Act and the Tanzania Mining Regulations came into force in November 2010 followed by amendments to the Tanzania Mining Act in 2017 and subsequent amendments to the Tanzania Mining Regulations in 2018 and 2019. The Mining (Local Content) Regulations were amended and came into force on 23 September 2022. Those amendments, together with an Executive Order, introduced, among other matters, (i) the Tanzania Mining Commission; (ii) local content requirements in employment and for procurement of goods and services; (iii) Mining Licence requirements of five percent of a licencee’s equity to be held by Tanzanians, with at least 80 percent of its managerial positions to be held by Tanzanians and 100 percent of non-managerial and other positions to be held by Tanzanians, in addition to the shareholding of the Government of Tanzania pursuant to Section 10 of the Tanzania Mining Act (i.e. free-carried interest); and (iv) regulations for the government warehousing of minerals prior to export/sale.
Minimum shareholding and public offering
In 2016, the Mining (Minimum Shareholding and Public Offering) Regulations, 2016, as amended, was adopted. The regulations set out the requirement to sell shares to Tanzanian nationals, by way of a public offering and listing on the Dar es Salaam Stock Exchange, which will apply to companies that are carrying out large scale mining operations. The regulations also require all existing holders of a special mining licence to list a minimum of 30 percent of their shares on either the Main Investment Market or the Enterprise Growth Market Segment of the Dar es Salaam Stock Exchange within six months of the regulations coming into force, which was on 24 February 2017. However, the Company believes the listing requirement conflicts with the mining development agreement. In September 2020, the Government of Tanzania published the Mining (Minimum Shareholding and Public Offering) (Amendment) Regulations, 2020, which exempts companies holding special mining licences from local listing requirements if such mining company has entered into an agreement with the Government of Tanzania that provides for a non-dilutable free-carried interest in such mining company and an economic benefits sharing arrangement.
Arbitration
Along with other major mining companies, AngloGold Ashanti’s subsidiaries are seeking a constructive dialogue with the Government of Tanzania to gain assurances that the Geita gold mine will not be affected by recent legal and fiscal changes adopted by the Government in light of their mining development agreements which guarantee (i) fiscal and regulatory stability, and (ii) an agreement between all parties before material legal and regulatory changes are made. As a precautionary step to safeguard its interests, AngloGold Ashanti commenced international arbitration proceedings against the Government of Tanzania in connection with the enactment of this legislation in July 2017. Declaratory relief is sought in accordance with the terms of the company’s existing mining development agreement to preserve its and its shareholders’ rights and interests in the Geita gold mine. AngloGold Ashanti is seeking confirmation from the Government of Tanzania that, as a result of its existing mining development agreement, the company does not fall within the scope of the new mining legislation that includes, among other things, (i) listing requirements; (ii) an increase in the rate of revenue royalties from four to six percent and a one percent clearance fee; and (iii) a right for the Government of Tanzania to (a) renegotiate existing mining agreements at its discretion, (b) receive a non-dilutable, free-carried interest of no less than 16 percent in all mining projects, and (c) acquire up to 50 percent of the shares of the mining company commensurate with the total tax expenditure incurred by the Government in favour of the mining company. AngloGold Ashanti can provide no assurance that the new mining legislation, including the listing requirements, will not apply to its operations in Tanzania and the outcome of the arbitration action may have a material adverse impact on the company’s results of operations and financial condition. See also “Item 8A: Legal Proceedings-Tanzania”.
Categories of mineral right licences
Ownership of and control over minerals on, in or under the land vest in the President of the United Republic of Tanzania. No person is allowed to prospect for minerals or carry on mining operations except pursuant to the authority of a mineral right licence granted, or deemed to have been granted, under the Tanzania Mining Act or its predecessor acts. To enable a company to prospect or mine, the Tanzania Mining Commission (“MC”) initially grants an exclusive prospecting licence. Upon presentation of a feasibility study, together with certain other environmental, social and financial assurances, the MC may then grant a form of licence for mining. Three categories of licences can be applied for under the Tanzania Mining Act: licences for exploration, licences for mining, and licences for ancillary activities. Licences for exploration include prospecting licences and gemstone prospecting licences. Licences for mining include special mining licences (if the proposed capital investment is equal to at least $100 million), mining licences (if the proposed capital investment is equal to between $100,000 and $100 million) and primary mining licences (reserved for Tanzanian citizens).
A prospecting licence grants the holder the exclusive right to prospect in the area covered by the licence for all minerals within the class of minerals applied for. An application for a prospecting licence is made to the Mining Commission and the licence, once granted, is valid for an initial term of four years. After the initial term, the licence is renewable for a further period of three years, with no option for renewal thereafter. Upon renewal, 50 percent of the area covered by the licence must be relinquished.
Mining is mainly carried out through either a mining licence or a special mining licence, both of which confer on the holder the exclusive right to conduct mining operations in or on the area covered by the licence. A special mining licence is granted for the shorter of either the estimated life of the ore body indicated in the feasibility study report or such period as the applicant may request. The holder of a special mining licence may apply for renewal of its licence at any time but no later than one year before the expiry of the licence and such renewal shall not be for a period exceeding the estimate life of the remaining ore body. Special
62
mining licences have certain fiscal and other advantages over mining licences, as the holder of a special mining licence may enter into a mining development agreement with the Government of Tanzania to guarantee the fiscal stability of a long-term mining project and make special provision for the payment of royalties, taxes, fees and other fiscal imposts. A special mining licence holder may, in certain circumstances, amend the programme of the mining operations agreed with the MC.
Tax laws relating to mining
Currently, the main tax laws in Tanzania comprise the Finance Act, 2015 (No. 16), which came into force on 1 July 2015, the Finance Act, 2017 (No. 4), which came into force on 1 July 2017, and currently the Finance Act, 2022 (No. 5), which came into force on 1 July 2022. All tax laws impose and revise certain taxes, duties, levies and fees. Among other provisions, inspection or clearance fees on the exportation or domestic use of minerals were introduced. Such exportation or domestic use is restricted unless such minerals have been inspected or cleared at the mining areas, ports, airports, border or posts and the clearing fee of one percent of the gross value of the minerals has been paid by the exporter or any other person in possession thereof. Local government levies and environmental management fees and charges apply as well.
Effective 20 July 2017, the Value Added Tax Act, 2014 (No. 5) (the “VAT Act”) was amended in order to restrict VAT relief for VAT input tax paid by mining companies on goods and services. Prior to the enactment of this amendment to the VAT Act, mining companies were entitled to 100 percent VAT relief in respect of the goods and services they purchased. The amendment prohibits refunds for VAT input tax incurred on a series of raw products, including the exportation of “raw minerals”. Subsequently, the Tanzania Revenue Authority (“TRA”) denied our applications for VAT input credit refunds, which amounted to a total of $153 million (after discounting provisions) as of 31 December 2022, covering the period from July 2017 onwards, on the basis that all of the gold doré that we export constitutes “raw minerals” for purposes of the VAT Act. In response, the company filed formal notices of objection with the TRA stating that the exportation of gold doré is, in its view, not covered by the restriction since doré does not fall within the category of “raw minerals” as used in the VAT Act. On 22 February 2019, the Tanzania Mining Act was amended to introduce a definition for “raw minerals” which supports our interpretation that gold doré is excluded from the prohibition. On 1 July 2020, the Finance Act, 2020 (No. 8), amended the VAT Act, without retrospective effect, in order to remove the restrictions on VAT input tax credits for the exportation of “raw minerals” as well as a series of other raw products. This recent amendment confirms the technical basis for VAT input tax recovery for mineral exporters from July 2020 onwards. VAT claims from July 2020 onwards are subject to verification procedures by the TRA before any refunds will be received. In 2022, the company was able to offset $45 million of verified VAT claims (from July 2020 onwards) against its corporate tax liability in Tanzania. Discussions with the TRA are ongoing to resolve our historical claims for VAT input credit refunds for the period from July 2017 to June 2020.
Natural resources, export and other rules
Natural resources legislation
In Tanzania, two laws in respect of natural resources came into force in July 2017: the Natural Wealth and Resources Contracts (Review and Re-negotiation of Unconscionable Terms) Act, 2017 (No. 6) (the “Unconscionable Terms Act”) and the Natural Wealth and Resources (Permanent Sovereignty) Act, 2017 (No. 5) (the “Permanent Sovereignty Act” and together with the Unconscionable Terms Act, the “Natural Resources Laws”). Implementing regulations were published in January 2020. The Natural Resources Laws provide that Tanzania has sovereignty over its natural resources and that all arrangements or agreements that relate to “natural wealth and resources” are subject to review by the National Assembly to ensure that they are in the interests of the people of Tanzania. During a review all unconscionable terms as interpreted in accordance with the law are expunged from the agreement. In addition, under the laws, disputes over natural wealth and resources will not be subject to any proceedings in any foreign court or tribunal. As a result, investors are restricted from accessing international dispute resolution mechanisms. Accordingly, companies are now required to adopt Tanzanian law and local dispute resolution in all mining agreements. As such, all disputes will be handles by Tanzanian judicial bodies or any other Tanzania government body vested with powers to resolve disputes. In addition, to ensure that the Government and the people of Tanzania obtain an equitable stake in the exploitation of mining resources, all project earnings must be retained in Tanzanian banks. Investors are also prevented from freely exporting raw minerals and repatriating funds.
Section 6 of the Unconscionable Terms Act specifically provides that where there is an unconscionable term, the National Assembly may pass a resolution for re-negotiation of the agreement whereupon the Government shall serve notice to the investor to re-negotiate the term or agreement. The Government and the particular investor have 90 days from the notice date to re-negotiate the term or agreement. If both parties fail to revise the unconscionable term, the term will be deemed removed from the agreement. A term is considered “unconscionable” under the Unconscionable Terms Act if, among other grounds, the requirements or provisions of the agreement restrict the right of the state to exercise authority over foreign investment within the country and in accordance with the laws of Tanzania, are inequitable and onerous to the state, secure preferential treatment designed to create a separate legal regime to be applied discriminatorily for the benefit of a particular investor, deprive the people of Tanzania of the economic benefits derived from subjecting natural wealth and resources to beneficiation in the country, or subject the state to the jurisdiction of foreign laws and foreign courts or tribunals.
63
State participation
On 23 September 2022, the Mining (State Participation) Regulations, 2022 (the “SPR 2022”) came into force. The SPR 2022 required every mining licence or special mining licence holder to give notice to the MC to initiate negotiations to enable the Government of Tanzania to acquire a shareholding in the mining operation by 23 December 2022. On 9 December 2022, the company notified the MC that it had already initiated negotiations with the Government of Tanzania prior to the coming into force of the SPR 2022. The Government’s equity interest must consist of a non-dilutable free-carried interest in the mining operation ranging between 16 percent and 50 percent depending, in part, on the quantification of tax expenditures enjoyed by the mining entity during its establishment and on the extent of Government development of public infrastructure servicing the mining operation. The free-carried interest shares (the “FCI shares”) will be regarded as preferred shares and will entitle the Government to a dividend. Further, the FCI shares give the Government the right to appoint two directors (out of five) of the company engaged in the mining operation and the right to approve at least two suitable persons to the top executive management of the company engaged in the mining operation as may be agreed in the shareholders agreement. Any other management positions created by the company engaged in the mining operation shall be shared with the Government on a ratio of 3:1. The SPR 2022 also provides for the non-deductibility of royalty payments in the calculation of corporate income tax.
Local participation policy
On 15 September 2015, the Non-Citizens (Employment Regulation) Act, 2015 (No. 1) (the “Non-Citizens Act”) came into force which vests powers concerning work permits with the Labour Commissioner. Therefore, non-citizens wishing to be employed in the country are required to apply and be granted a work permit before applying for a residence permit. Before granting the work permit, the Labour Commissioner must be satisfied that all efforts have been explored to acquire a local expert. Further, the company is required to submit a succession plan to both the Labour Commissioner and the MC which sets out a well-articulated plan for the transfer of the non-citizen’s knowledge and expertise to Tanzanian citizens. Moreover, the Commissioner General of Immigration is required to take into consideration conditions of the work permit issued by the Labour Commissioner when granting a residence permit.
The Tanzania Investment Act No. 10 of 2022
On 2 December 2022, the Tanzania Investment Act, 2022 (No. 10) (the “Investment Act”) came into force. The Investment Act restores the right to international arbitration and grants foreign investors access to settle disputes with the Tanzania Investment Centre or the Government of Tanzania through arbitration. Pursuant to the Investment Act, parties to a dispute may agree to the use of a local or foreign arbitration venue.
AngloGold Ashanti’s rights and permits
The Geita gold mine is located in the Lake Victoria goldfields of the Mwanza region of Tanzania. AngloGold Ashanti has concluded a mining development agreement with the Ministry of Minerals on 24 June 1999 and was issued a special mining licence (SML45/99) covering approximately 196 km2 for a period of 25 years, which expires on 26 August 2024. The internal renewal process for the special mining licence (SML45/99) is underway with a view to submitting an application for renewal prior to its expiry date. On 9 October 2014, an addendum to the mining development agreement was entered into ratifying, among other matters, an increase in the royalty rate from three percent to four percent with effect from 1 May 2012. In March 2020, Geita Gold Mining Limited received the consent of the Minister of Minerals to change the mining method under its special mining licence from open pit to underground method, subject to the requisite terms and conditions. Within the special mining licence area, there are also seven primary mining licences of approximately 0.63 km2 in total which belong to third parties. Furthermore, AngloGold Ashanti holds prospecting licences covering (i) an area of 120 km2 in the immediate vicinity of its special mining licence area, and (ii) an area of 690 km2 located in the Dodoma, Singida and Shinyanga regions, but none of these areas contain any Mineral Reserve. All licences are in good standing.
AUSTRALIA
General laws relating to mining
In Australia, with a few exceptions, all onshore minerals are owned by the Crown. The respective Minister for each state and territory is responsible for administering the relevant mining legislation enacted by the states and territories. Native title legislation applies to certain mining tenements within Australia. Australia recognises and protects a form of native title that reflects the entitlement of Aboriginal people to their traditional lands in accordance with their traditional custom and laws. Should native title claims or determinations exist, certain native title processes and procedures will apply under the Native Title Act 1993 (Cth) (the “Native Title Act”) before the tenure is granted. Tenure may be granted subject to conditions relating to native title rights. In the mining context, native title matters are managed as part of the tenement grant process. If disputes arise in relation to the grant of a particular tenement, they can be referred to the National Native Title Tribunal, established under the Native Title Act, for resolution. Native title legislation also provides a framework for compensation to be paid for acts that affect native title rights and interests. Ordinarily, the relevant Commonwealth or State government is liable to pay compensation for acts attributable to it. However, in the state of Western Australia, the Mining Act 1978 (WA) provides that an applicant for the grant of, or the holder of, a mining tenement is responsible for native title compensation, if determined to be payable, to native title holders.
64
Federal, state and territory Aboriginal and non-Aboriginal heritage laws operate in parallel to the native title legislation. State and territory heritage laws exist predominantly for the purposes of managing the impact of developments on sites, objects and areas of heritage significance. In Western Australia, impacts to Aboriginal cultural heritage are regulated by the Aboriginal Heritage Act 1972 (WA). However, this legislation will be repealed and replaced by the Aboriginal Cultural Heritage Act 2021 (WA) (the “ACH Act”) which was enacted in 2021. The regulations, management code and various guidelines which underpin the ACH Act are being co-designed by the State government, traditional owners, industry and other stakeholders. The ACH Act will not become fully operational until the co-design process is complete in mid-2023 at the earliest. Where an area of heritage significance is placed on the national or world heritage registers, federal approval processes may also apply. To date, there has not been any significant impact on any of AngloGold Ashanti’s tenure due to native title or heritage legislation and, at this stage, it is not possible to predict any significant impact that may result in the future from the final regulations, management code and various guidelines under the ACH Act, once adopted.
AngloGold Ashanti’s operating properties are located in the state of Western Australia where tenure is issued under, and mining operations are governed by, the Mining Act 1978 (WA). The most common forms of tenure in Western Australia are exploration and prospecting licences, mining leases, miscellaneous licences and general purpose leases. In most Australian states, if the holder of an exploration licence establishes indications of an economic mineral deposit in the area covered by the exploration licence and complies with the conditions of the grant, the holder of the exploration licence has a priority right against all others to be granted a mining lease which gives the holder exclusive mining rights with respect to minerals on the property.
It is possible for an individual or entity to own an area of land (including for infrastructure purposes) and for another individual or entity to be granted the right to explore for or mine any minerals located on or under the surface of the same area. The maximum initial term of a mining lease in Western Australia is 21 years and the holder has the right to renew the lease for an additional 21 years. Subsequent renewals are granted at the discretion of the respective state or territory’s minister responsible for mining rights. In Western Australia, mining leases can only be assigned with the prior written consent of the minister.
Tax laws relating to mining
Government royalties are payable by the holder of mining tenure in respect of minerals obtained from the relevant area of land at the rates specified in the relevant legislation in each state or territory. The royalty on gold production in Western Australia is payable quarterly at a fixed rate of 2.5 percent of the royalty value of gold metal produced. The royalty value is calculated by multiplying the amount of gold produced during a given month by the average gold spot price for that month. In addition, the holder of a mining tenement is required to pay annual rent in respect of the tenement. In Western Australia there is a minimum annual expenditure requirement for prospecting and exploration licences and mining leases. Exemptions from the expenditure requirement can be obtained if certain conditions are satisfied.
Environmental laws relating to mining
Mining tenements will be granted with endorsements and conditions relating to protection of the environment. Exploration and mining operations may also require separate approval from the state, territory or federal environment minister, which may require completion of an environmental impact assessment (including a public consultation period) pursuant to applicable environmental protection legislation prior to commencement. Further, a works 'construction' approval and an operating licence under the relevant environmental protection legislation in the state or territory may also be required for certain mine processing or mining-related operations. In Western Australia, legislation removing the distinction between “works approvals” and “licenses” is expected to enter into force in December 2023 such that, following the effective date, only a “license” will be required for “prescribed activities”, which include relevant works and operations on a mining lease, and not a separate “works approval”. Depending on the jurisdiction, additional approvals may be required for the removal of native vegetation within the tenement, and the taking and use of water for exploration and mining operations.
AngloGold Ashanti’s rights and permits
AngloGold Ashanti has been granted 21-year term mining leases with rights of renewal to all of its mining areas in Australia, including its proportionate share of joint venture operations and accordingly it has, together with its joint venture partners where applicable, the exclusive right to mine in those areas. Both the Group and its joint venture partners are fully authorised to conduct operations in accordance with relevant laws and regulations. The mining leases and rights of renewal cover the current life-of-mine at AngloGold Ashanti’s operations in Australia.
At Sunrise Dam, one mining lease (M39/1116) covers the deposit and mine infrastructure (approximately 7,808 hectares) and another mining lease (M39/1117) covers the water extraction infrastructure used to supply the operation with water (approximately 1,768 hectares). Both leases are currently in good standing, with expiry dates in 2038.
The Butcher Well joint venture has security of tenure for all current exploration licences and for the contiguous mining leases that covers its Mineral Resource. There are three mining leases: mining lease (M39/165) which covers 602.35 hectares with expiry date in 2030, mining lease (M39/166) which covers 990 hectares with expiry date in 2030 and mining lease (M39/230) which covers 446.4 hectares with expiry date in 2032.
65
At Tropicana, the deposit is situated upon a single mining lease (M39/1096) covering approximately 27,228 hectares, which is currently in good standing, with an expiry date in 2036.
AngloGold Ashanti Australia Limited is also conducting early stage exploration activities in Queensland under the Mineral Resources Act 1989 (QLD). AngloGold Ashanti holds 15 exploration permits covering 316,851 hectares. Each permit is granted with an initial term of five years, renewable for two further periods of not more than five years each.
AMERICAS
Argentina
General laws relating to mining and land ownership
Mining regime
The Argentinean Mining Code governs mining activity in the country. Special regimes exist for hydrocarbons and nuclear minerals. In the case of most minerals, the Argentinean Mining Code establishes that the owner of the land is not the owner of the mineral rights; these are held by the national or provincial governments (depending on the location of the minerals). The national or provincial government, as applicable, is required by the Argentinean Mining Code to grant whomever discovers a new mine title to the mining concession.
The Argentinean Mining Code regulates exploration permits as well as mining concessions, or exploitation rights. Exploration permits grant their holders exclusivity rights to any mineral discoveries, including those made by a third party within the exploration area covered by the permit. Exploration permits are limited in time and as to the extent of the exploration area, are subject to the payment of a single-time fee, and also require a minimum exploration work programme and schedule to keep the permit in force. Priority for receiving a mining concession is given to the registered discoverer of the mine, which holds the exploration permit. Once the application for a mine has been submitted, the applicant may commence works and must submit a legal survey of the units requested for the new mine. The application and the legal survey may be opposed by third parties following specific proceedings set forth in the Argentinean Mining Code. Approval and registration of the legal survey by the provincial mining authority constitutes formal title to the mining concession.
Holders of mining concessions must comply with three main conditions: payment of an annual fee, investment of a minimum amount of capital, and the carrying out of a reasonable level of exploitation. Failure to do so could lead to forfeiture of the mining concession, which would then revert back to the Province.
In addition to the Argentinean Mining Code, between 1993 and 1995, Argentina implemented several federal laws to offer foreign companies attractive incentives for exploration and mining in Argentina, the Mining Investment Law (Law No. 24, 196), as amended (the “Mining Investment Law”), and related legal provisions being the most important one. Such incentives include, among other matters, import duty exemptions, accelerated depreciation of fixed assets, a three percent cap on provincial royalties set at pit-head value on the mineral extracted, value added tax refunds for exploration-related expenses incurred by companies registered under the Mining Investment Law, and, subject to the filing of a feasibility study for the relevant mining project, a 30-year stability as to the tax burden on the project and the customs and foreign exchange regimes and duties. Cerro Vanguardia S.A. (“CVSA”) obtained its tax, customs and foreign exchange stability certificate in 1996.
Glacier Law
On 30 September 2010, the National Law on Minimum Requirements for the Protection of Glaciers (Law No. 26, 639) (the “Glacier Law”) was enacted in Argentina, banning new mining exploration and exploitation activities on glaciers and “peri-glacial” areas. The Glacier Law establishes a broad definition of “peri-glacial” areas that, together with glacial areas, must be surveyed by an existing national government agency specifically appointed to this end every five years. The area where the Cerro Vanguardia project is located does not include any glaciers or peri-glacial areas according to the inventory of glaciers which was published in June 2018.
Rural Land Law
On 27 December 2011, the Argentinean National Congress passed a law on the Regime for Protection of National Domain over Ownership, Possession or Tenure of Rural Land (Law No. 26, 737) (the “Rural Land Law”) which implemented a set of rules restricting the ownership of rural land by foreigners (including foreign individuals or any kind of legal entity controlled by foreign individuals or legal entities). The main restrictions are as follows: (i) foreigners cannot own in the aggregate more than 15 percent of the entire rural land of Argentina, the same cap being applicable to each Province and Municipality; (ii) foreigners will not be allowed to purchase more than 1,000 hectares in the so-called “zona núcleo”, which comprises the main agricultural areas of central Argentina or an “equivalent” surface depending on the location of the land and its productive potential; and (iii) foreigners will not be allowed to buy land that contains, or is adjacent to, relevant and permanent water bodies (such as rivers and lakes). Although exploration permits and mining concessions are not the subject matter of the restrictions placed by the Rural Land Law, certain rights granted to foreign mining companies under the Argentinean Mining Code may be restricted by this
66
new law. For example, the right that holders of mining concessions currently have to force the surface owner to sell the land to the holder of the mining concession might be restricted if the concession holder is a foreign individual or a legal entity controlled by foreigners.
Federal Mining Agreement
On 13 June 2017, the national government and the provinces in whose territories the main mining projects of Argentina are located, signed the New Federal Mining Agreement (“FMA”). The purpose of the FMA is, amongst other things, to increase provincial revenues from the mining industry by creating legal entities owned by provincial governments that would work in association with private mining companies. This scheme is not new in Argentina and it has been used by some provincial governments, amongst them the Santa Cruz Province (through Fomicruz), in which the Cerro Vanguardia project is located. The FMA also contemplates other forms of revenues such as the formation of special trusts to be funded by mining companies to finance education, health and other programmes. Additionally, the FMA included setting forth mining royalties up to three percent of the gross value of commercialised minerals, without any deductions other than VAT. As the FMA has not yet been converted into law by the National Congress, its provisions are neither binding nor enforceable.
In Argentina, the current regulatory regime of royalty payments is expected to change and several different options and payment thresholds have been discussed. In December 2012, the Santa Cruz Province changed the mining royalty from one percent to three percent calculated at pit-head value of the mineral extracted thus bringing it to the cap of the Mining Investment Law.
Foreign exchange and export rules
Foreign exchange controls
On 1 September 2019, by means of Executive Decree No. 609/2019 (the “Export Controls Decree”), the Argentinean national government reinstated foreign exchange and export controls. The Export Controls Decree and related regulations of the Central Bank of Argentina impose, among other measures, the obligation of Argentinean residents to transfer to Argentina and/or sell for Argentinean pesos in the Argentinean foreign exchange market (mercado de cambios) the countervalue (contravalor) from their exports of goods within a specified period. The export of goods is regulated by the Consolidated Text on “Foreign Trade and Exchange” issued by the Argentinean Central Bank (as amended from time to time) which establishes the specific regulatory requirements to implement the measures adopted by the national government in this area. Prior approval of the Argentinean Central Bank is generally required to access the foreign exchange market for transactions relating to the outflow of funds, except in certain circumstances.
In October 2022, the Argentinean national government implemented the Argentinean System of Imports (Sistema de Importaciones de la República Argentina) (“SIRA”) and the Argentinean System of Imports and Foreign Payments of Services (Sistema de Importaciones de la República Argentina y Pagos de Servicios al Exterior). Importers must obtain a SIRA approval in the form of a SIRA certificate for the import of goods and to access the foreign exchange market for payments in connection with the import of goods. Additionally, from 1 January 2023, Argentinean residents, such as CVSA, must comply with certain supplementary provisions in order to access the foreign exchange market without prior approval of the Argentinean Central Bank, unless an exception applies.
CVSA had a cash balance equivalent to $116 million at 31 December 2022. The cash balance is available to be paid to AngloGold Ashanti’s offshore ($105 million (equivalent)) and onshore ($15 million (equivalent)) investment holding companies in the form of declared dividends. Applications have been made to the Argentinean Central Bank to approve the purchase of U.S. dollars in order to distribute offshore dividends related to the 2019, 2020 and 2021 financial years of $105 million (equivalent) to AngloGold Ashanti. Also, under a special regime established for dividend payments, a new petition to distribute a portion of the offshore dividends applied for, in the amount of $54 million (equivalent), was submitted to the Argentinean Central Bank during the third quarter of 2022. In December 2022, the Argentinean Central Bank approved, based on the applications submitted under this special regime, the payment of $17 million (equivalent) to AngloGold Ashanti. As a result, during 2022, AngloGold Ashanti received offshore dividends from CVSA in a total amount of $17 million (net of withholding taxes) paid in U.S. dollars. While the remaining approvals are pending, the cash remains fully available for CVSA’s operational and exploration requirements.
Export duties
On 21 December 2019, the National Law on Social Solidarity and Productive Reactivation (Law No. 27, 541) (the “Solidarity Law”) was enacted. The Solidarity Law granted the national government power until 31 December 2021 to impose export duties which may not exceed certain caps. For example, the Solidarity Law provides that export duties on mining exports cannot exceed eight percent of the taxable value or official FOB price. On 2 October 2020, the national government published Decree No. 785/2020 (the “Export Duties Decree”) which sets an export duty rate of eight percent for certain goods, including doré bars and gold alloys, and revoked the provisions of Decree No. 793/2018 which had previously set the export duty at 12 percent ad valorem. While the Export Duties Decree was set to expire at the end of 2021, on 31 December 2021, the national government published Decree No. 908/2021, extending the deadline of export duties on certain goods, including doré bars and gold alloys, until 31 December 2023. It is uncertain whether the national government is empowered to extend such deadline beyond the date set forth in the Solidarity Law. These export duties, if not compensated with other tax reductions, affect the tax stability guarantee granted to CVSA in 1996 in light of the fact that at the time export duties were zero percent.
67
On 26 February 2019, the Argentinean tax and mining authorities published a resolution (RC 4428/2019) establishing an administrative procedure to be followed to obtain the reimbursement or compensation of federal taxes paid in excess of the total tax burden provided for by the applicable tax stability guarantee (the “2019 Procedure”). CVSA initiated the 2019 Procedure to claim compensation for the export duties it paid in 2018, 2019 and 2020 as export duties are not contemplated by its tax stability guarantee. Prior to the publication of RC 4428/2019, CVSA had already submitted to the tax authorities claims for reimbursement of the export duties it paid from 2008 to 2015.
Pursuant to the 2019 Procedure, the National Mining Secretariat issued favorable opinions regarding CVSA’s claims in respect of fiscal years 2018 and 2019, which amounted to approximately $2.0 million and $6.3 million, respectively, as of 31 December 2022. These claims are currently under review by the relevant customs authorities. On 14 July 2021, CVSA submitted its claim in respect of fiscal year 2020, which amounted to approximately $12.4 million as of 31 December 2022. The National Mining Secretary has not yet issued an opinion regarding this claim.
Furthermore, CVSA has requested the tax authorities to apply the 2019 Procedure in respect of its historical claims for fiscal years 2008 to 2015 during which the imposition of export duties also exceeded CVSA’s total tax burden under its tax stability guarantee. However, these claims, which amounted to approximately $3.1 million as of 31 December 2022, are still being reviewed under the rules to challenge export duties instead of the 2019 Procedure. CVSA has appealed the application of those rules and a decision on this issue is pending.
On 9 June 2022, the Argentinean tax and mining authorities published a resolution (RC 5205/2022) establishing a new administrative procedure to be followed to obtain the reimbursement or compensation of federal taxes paid in excess of the total tax burden provided for by the applicable tax stability guarantee (the “2022 Procedure”). This 2022 Procedure replaces the 2019 Procedure established by RC 4428/2019. On 20 September 2022, CVSA submitted its claim for compensation for the export duties in respect of fiscal year 2021, which amounted to approximately $11.2 million as of 31 December 2022, pursuant to the 2022 Procedure. This claim is currently under review by the National Mining Secretary.
In total, AngloGold Ashanti’s net export duty receivables (after discounting provisions) in Argentina amounted to $9 million as of 31 December 2022.
Environmental laws relating to mining
Any mining company wishing to commence or modify any mining-related activity, as defined by the Argentinean Mining Code, including prospecting, exploration, exploitation, development, preparation, extraction, and storage of mineral substances, as well as property abandonment or mine closure activity, is required to prepare and submit to the competent provincial environmental authority an Environmental Impact Assessment (“EIA”) prior to commencing the work. Each EIA is required to describe the nature of the proposed work, its potential risk to the environment, and the measures that will be taken to mitigate that risk. If accepted by the competent authority, the EIA is used as the basis to create a Declaration of Environmental Impact (“DEI”) to which the mining company is required to adhere during the mining-related activity at issue. The DEI is required to be updated at least on a biannual basis. Sanctions and penalties for non-compliance with the DEI are outlined in the Environmental Protection section of the Argentinean Mining Code, and may include warnings, fines, suspension of quality certifications, obligations to restore the environment, temporary or permanent closure of activities, and withdrawal of authorisation to conduct mining-related activities.
AngloGold Ashanti’s rights and permits
The mining concession holder of Cerro Vanguardia, the Company’s operation in Argentina, is AngloGold Ashanti’s partner, Fomento Minero de Santa Cruz S.E. (“Fomicruz”), which is wholly owned by the Santa Cruz Province. On 27 December 1996, Fomicruz entered into a usufruct agreement whereby CVSA was granted an irrevocable right to exploit the Cerro Vanguardia deposit (encompassing an area of approximately 543 km2) for a 40-year period. The mining licence (402642/CV/97), which covers the full Mineral Reserve, expires on 26 December 2036. CVSA is a corporation incorporated in Argentina indirectly controlled by AngloGold Ashanti (92.5 percent), with Fomicruz as minority shareholder (7.5 percent). On 14 August 1996, CVSA obtained its tax, customs and foreign exchange stability certificate, which expires in 2026.
Brazil
General laws relating to mining and land ownership
The Brazilian Constitution of 1934 states that, for purposes of exploration and exploitation, deposits and other Mineral Resources constitute property separate from the soil and belong to the Federal Union. Exploration and exploitation of such Mineral Resources may take place only with the Federal Union’s concession and in such a way as to protect the national interest. Federal law sets out penal and administrative sanctions for conduct and activities deemed harmful to the environment.
In Brazil, the National Mining Agency (“ANM”) is the state body within the Mines and Energy Ministry (“MME”) that is responsible for: (i) the registration of mining titles, (ii) the grant of authorisations and concessions, (iii) the supervision of mining activities and mining titleholders, and (iv) the issuance of supplementary rules in relation to mining activity.
68
Under the current Brazilian Mining Code, there are two kinds of mines: (i) claimstake mines (minas manifestadas), for which rights were acquired before 1934 and exist independently of any mining licence or authorisation from the Federal Government and for which the Mineral Resources constitute property of the landowner, and (ii) granted mines, which are those that rely on grants from the Federal Government for mineral exploration or exploitation (pursuant to the Brazilian Constitution of 1988). AngloGold Ashanti’s operations in Brazil consist of both claimstake mines and granted mines.
Mining activities in granted mines must be performed in two defined stages: (i) exploration, which entails defining and evaluating the deposit and determining the feasibility of exploitation, and (ii) exploitation, which involves coordinating operations aimed at the industrial exploitation of the mineral deposit, from the extraction of useful minerals to their processing. Exploration authorisations issued by the ANM are valid for one to four years. One extension can be obtained automatically as long as it is justified. For more than one extension, the extension request will have to satisfy specific legal requirements. In contrast, exploitation rights, once granted, are valid for the lifetime of the deposit, provided the mining titleholder complies with all legal requirements. Pursuant to these requirements, for example, titleholders must (i) start work on mineral exploitation within six months from the date of publication of the Exploitation Concession, (ii) continue their mining activities until the mineral deposit has been exhausted, in accordance with the Economic Exploitation Plan (Plano de Aproveitamento Econômico) approved by the ANM, and (iii) refrain from suspending mining activities without prior notice to the ANM.
Tax laws relating to mining
During the exploration period, the mining titleholder has to pay an Annual Rate per Hectare (Taxa Annual por Hectare or “TAH”), subject to a maximum value set by law. In the exploitation period, regardless of the legal regime governing the project (whether claimstake or granted mines), the mining titleholder has to pay the Financial Compensation for Exploiting Mineral Resources (Compensação Financeira pela Exploração Mineral or “CFEM”). The CFEM which is 1.5 percent for gold is currently calculated based on revenues.
At the end of 2011 and the beginning of 2012, the states of Minas Gerais, Pará, Amapá and Mato Grosso do Sul each created a new “inspection and control” tax (duty) on extraction and exploration activities as well as on the use of Mineral Resource carried out in those states. In the state of Minas Gerais, gold ore and silver ore are exempted from the collection of this new duty. At the end of 2020, the state of Goiás created a new “inspection and control” tax (duty) on extraction and exploration activities carried out in this state, which currently still needs to be implemented. The constitutionality of these “inspection and control” taxes was upheld by the Supreme Court of Brazil on 1 August 2022.
Environmental laws relating to mining
Following the catastrophic failure of a tailings storage facility (“TSF”) at the Córrego do Feijão iron ore mine owned by Vale at Brumadinho in the state of Minas Gerais in Brazil in January 2019, executive, legislative and judiciary bodies, both at the federal and state levels, have generally increased scrutiny of mining operations in Brazil, and of TSFs in particular, and have been considering, and in some cases have adopted, stricter laws and regulations applicable to the approval, licensing, construction, management, closure and decommissioning of TSFs in Brazil.
At the federal level, the ANM issued Resolution No. 13/19 in August 2019 (replacing its earlier Resolution No. 4/19) which adopted additional regulatory measures to ensure the stability of TSFs, in particular those built or heightened by the upstream method or by any method declared as “unknown”. Among other things, ANM Resolution No. 13/19 prohibits the upstream method for the construction or heightening of tailings dams throughout the national territory of Brazil. It further requires operators to cease all storage and disposal activities at TSFs (known as “deactivation” or “desativação”) constructed or heightened upstream or by an “unknown” method by 15 September 2021 as well as to decommission such TSFs by 15 September 2022 to 15 September 2027 (depending on the capacity volume). To comply with the terms of ANM Resolution No. 13/19, the Serra Grande tailings dam in the state of Goiás must be decommissioned by 15 September 2025. The Serra Grande mine completed the process of reinforcing the dam walls of its upstream TSF, deactivating the TSF and migrating to dry-stacking operations, each by the 15 September 2021 deadline.
Furthermore, Federal Law No. 14.066/20, adopted in October 2020, also imposes requirements on companies to decommission upstream TSFs, including the Serra Grande tailings dam, by 25 February 2022 (which date is earlier than required by ANM Resolution No. 13/19). However, Federal Law No. 14.066/20 does permit extensions of the compliance deadline, with the consent of the ANM based on the technical plan for decommissioning. Serra Grande submitted timely requests to obtain an extension of the compliance deadline until 2025 in line with the timeline set forth in ANM Resolution No. 13/19 and presented its technical plan for decommissioning. On 26 May 2022, the ANM issued a technical note allowing the extension until 2025. With respect to downstream (or “centerline”) TSFs, Federal Law No. 14.066/20 requires companies, to the extent that communities are located in the self-rescue zone of those TSFs, to implement one of the following measures for such structures: either (i) the structure must be deactivated and decommissioned, (ii) the population must be relocated, with reparations for loss of cultural heritage, or (iii) reinforcement works that guarantee the effective stability of the structure must be carried out, by decision of the public authorities, taking into account the previous nature of the dam in relation to the occupation and technical-financial viability of the alternatives. Even if reinforcement works are completed, deactivation and decommissioning of those TSFs will be required at the end of the life of the mine. All of the TSFs operated by AngloGold Ashanti in Brazil have communities located in self-rescue zones.
69
As of 31 December 2022, AngloGold Ashanti has fully transitioned to dry-stacking operations for tailings storage at each location in Brazil. Capital expenditures required in 2022 to implement this new technology amounted to approximately $83 million. Capital expenditures for work required to comply with TSF-related requirements during the period 2023-2025 are expected to be material but, based on preliminary estimates to date, AngloGold Ashanti anticipates that annual expenditures for each of these years will be less than in prior years and will decline over time. Neither ANM Resolution No. 13/19 nor Federal Law No. 14.066/20 requires removal of all tailings material in connection with the decommissioning of TSFs (a process known as “decharacterisation” or “descaracterização”).
At the state level, the state legislator in the state of Minas Gerais adopted Law No. 23.291/19 in February 2019 which contains the state’s policy on TSF safety and should be implemented in conjunction with the equivalent federal policy. Among other things, Law No. 23.291/19 determines the criteria for licensing and inspecting TSF structures, prohibits TSFs constructed or heightened using the upstream method, establishes bond requirements and holds management liable for non-compliance with its provisions. The government of Minas Gerais adopted several decrees in furtherance of this legislation.
In addition, ANM Resolution No. 95/22, which became effective on 22 February 2022, effectively consolidates prior federal resolutions on TSFs, including ANM Resolution No. 13/19, and establishes new criteria for the operational management of TSF structures, changes the criteria related to the risk classification of TSF structures and emergency levels and sets new criteria for the suspension, embargo (order to stop operations) and interdiction of TSF activities. Operators of TSFs were mandated to conduct and submit risk assessments to the ANM by December 2022 and are required to update those risk assessments every two years. Operators are also required, on an annual basis, to obtain certifications from external consultants of the geotechnical stability of TSF structures and the adequacy of emergency response plans. In late 2022, tailings deposition was required to be suspended due to embargos at five of AngloGold Ashanti’s TSFs in Brazil pending certification by external consultants of on-site emergency response plans (Declaração de Conformidade e Operacionalidade (“DCO”)) as well as, at one such TSF, certification by external consultants of geotechnical stability (Declaração de Condição de Estabilidade (“DCE”)) consistent with the new standards. In addition, at the Calcinados TSF, a risk assessment conducted in December 2022 with oversight from external consultants, as required by Brazilian regulations, concluded that additional buttressing should be completed to align the TSF’s post liquefaction factor of safety with international standards currently considered best practice. Construction at the Calcinados TSF is expected to begin later in 2023, and the timeline for completion will be determined once the engineering and geotechnical work has been completed by external consultants. Tailings deposition at the Calcinados TSF, as well as processing of gold concentrate at the Queiroz plant, which services the Cuiabá mine complex, is suspended until additional buttressing of the Calcinados TSF impoundment is complete.
On 1 December 2022, the ANM published ANM Resolution No. 122/22, which relates to administrative sanctions for non-compliance with mining and dam safety regulations and which, in addition to significantly increasing the values of applicable fines and penalties, establishes procedures and parameters for available sanctions including seizures of ore, goods and equipment, suspension of mining activities, demolition of mine infrastructure and invalidation or cancellation of title and exploration licences.
Further amendments to the regulatory requirements in Brazil governing such TSFs and related dams are expected to be adopted in 2023.
AngloGold Ashanti’s rights and permits
At AGA Mineraçao, Cuiabá has a single mining concession (No. 000.323/1973) covering a total area of 3,662 hectares. In February 2022, two additional mining concessions for Cuiabá (Nos. 830.937/1979 and 831.027/1980) were published, which cover an additional area of 816.2 hectares. Lamego has a single mining concession (No. 932.710/2017) covering a total area of 1,622 hectares. Córrego do Sítio is hosted by five geographically contiguous mining concessions (i.e., Nos. 930.556/2000, 930.181/2008, 830.129/1982, 833.472/2003 and 830.943/1979) covering a total area of 6,017 hectares.
At Serra Grande, the Company has interests in or agreements over 25,719.94 hectares in the Crixás greenstone belt, representing approximately 87 percent of the relevant tenements that correspond to all current exploration and mining activities. These have been held since 1987. The mining concessions include mining concession No. 002.286/1935 covering an area of 4,206.88 hectares, mining concession No. 960.658/1987 covering an area of 1,946.89 hectares, mining concession No. 860.746/2005 covering an area of 88.28 hectares, mining concession No. 862.103/1994 covering an area of 125.41 hectares and mining concession No. 804.366/1975 covering an area of 196.05 hectares.
All of the Company’s mining concessions in Brazil are currently active, in good legal and operational standing, and free of liabilities and/or major obligations. Brazilian mining concessions remain valid up to the depletion of the Mineral Reserve and Mineral Resource pursuant to the Economic Exploitation Plan approved by the ANM and in accordance with the required environmental permits, and as a result do not have an explicit expiry date.
70
Colombia
General laws relating to mining and land ownership
General regime
The Colombian Constitution declares that the sub-soil and the non-renewable natural resources located within the Colombian territory are the property of the Colombian State. The underlying principle of Colombian mining legislation for the granting of mining concession contracts over free areas is first in time, first in law. Mining activities are regulated by the Colombian Mining Code, Act 685, 2001.
The filing of an exploration and exploitation proposal triggers a right of preference to obtain rights over the targeted area, provided it is available. Such area cannot exceed 10,000 hectares. Upon receipt of a proposal, the relevant government agency determines whether another proposal or contract already governs the area. If there are no pre-existing claims, the government agency grants the applicant a “free area”.
With respect to land ownership, a mining concession in Colombia does not grant the rights over the surface required to develop a mining project. Therefore, in order to develop a mining project, it is required to acquire and secure access to the land (soil). This can be achieved in several ways, such as (i) purchase of the land, (ii) a transit easement, (iii) a mining easement, and (iv) the special acquisition process or expropriation.
Concession contract
As the sub-soil and the non-renewable natural resources located within the Colombian territory are property of the Colombian State, the Colombian Mining Authority (Agencia Nacional de Minería) grants the authorisation to explore and exploit minerals through a concession contract.
Such concessions allow concessionaires to conduct the studies, works and facilities necessary to establish the existence of minerals and to organise their exploitation. Upon being awarded a mining concession, a company must take out an insurance policy to cover the costs associated with potential environmental damage as well as breaches of its mining obligations. It may then proceed with exploration activities. Once the exploration phase is complete, the concessionaire files a new plan regarding proposed works and facilities. With the award of the mining concession or tenement contract, there are specified timelines for the completion of the various phases of a mining project, e.g. exploration, construction, exploitation. The company must comply with these timelines unless performance is suspended, for example, due to force majeure or these timelines are extended or modified. A grant of force majeure is for one year and must be renewed on an annual basis. If the company does not comply with the specified timelines for the completion of the various phases of a mining project, the mining authority may revoke the company's concession contracts or mining licences. As a general matter, any company that wishes to obtain a renewal of its concession contract must be up to date in all its legal and contractual obligations and must present a new plan of works and facilities to be implemented after the contract is renewed.
PINES programme
In 2013, the national government instituted the PINES programme designed to aid promoting certain projects that are deemed to have a national interest. This designation provides for greater oversight from the national government. All of our three advanced exploration projects (La Colosa, Quebradona and Gramalote) were considered of national strategic interest. Currently, Quebradona and Gramalote remain in the PINES programme, but La Colosa was temporarily removed as such (until the force majeure is over).
Tax laws relating to mining
From the moment the concession contract is registered with the Mining Register, the concessionaire has several financial obligations, including the payment of (i) a surface fee during the exploration, construction and assembly stage and (ii) royalties.
Once exploration is complete and the mining infrastructure in place, the concessionaire must begin paying royalties to the Colombian government, consisting of a percentage of the primary product and sub-products being exploited. The percentage of the royalty depends on the regulation in force when the concession contract is registered. In the case of the Quebradona project, the deposit mainly consists of copper followed by gold and silver. There is a five percent royalty for copper on the production value at the mine’s or well’s edge (i.e. when extracted from the subsoil). In case of gold and silver, a royalty of four percent on the production valued at the mine’s or well’s edge (i.e. when extracted from the subsoil) was established.
Furthermore, Colombian law establishes that once the environmental licence is granted the concessionaire must invest one percent of the project’s value to benefit the basins covered by the environmental licence.
71
Environmental laws relating to mining
In order to obtain an authorisation to carry out a mining project, a company must prepare an Environmental Impact Study (“EIA”) for approval by the National Environmental Licensing Authority of Colombia (Autoridad Nacional de Licencias Ambientales or “ANLA”). Global environmental licences are granted for the entire life of the project and cover all phases: construction, assembly, operation, maintenance, dismantling, final restoration, abandonment and/or termination. Construction and assembly permits (Plan de Trabajos y Obras or “PTO”) are granted by the mining authority with jurisdiction over the project.
In Colombia, the mining authority has the discretion to declare the underlying concession void if the specific company which holds the concession breaches applicable environmental laws or regulations. If the mining authority were to exercise such discretion, a company whose concession was voided would be required to abandon its projects and all of its other existing mining concession contracts. Pending proposals for new mining concession contracts would also be cancelled and the company would be banned from doing business with the Colombian government for a period of five years. As a result, the company would be unable to conduct any mining exploration or development activities during such period. However, this would not affect other subsidiaries of the company operating in Colombia, if those concession contracts are held singularly or in concert with joint venture partners.
Mining activity is prohibited in national parks, regional parks, protected forest reserves, paramos (included in Act 1753, introduced in 2015) and wetlands, pursuant to the Ramsar Convention on Wetlands of International Importance. Some forest reserves are not “protected” but are set aside for active forestry purposes and the concessionaire must obtain a specific permit to partially and temporarily change the use of the soil before pursuing exploration activities. In addition, Resolution 1987/2016, passed by the national government in late 2016, identifies areas that the Ministry of the Environment has determined to be “paramos” areas, or paramos transition areas. In these areas there are limitations on industrial or commercial work being performed, including mining. The regulation also specifies a process to determine what work, if any, can be performed in a paramos-designated area.
AngloGold Ashanti’s rights and permits
The La Colosa project managed by AngloGold Ashanti Colombia S.A.S. (“AGA Colombia”) remains in force majeure due to delays in granting environmental permits by national and local environmental authorities, thereby preventing AGA Colombia from undertaking further exploration activities. The most recent one-year grant of force majeure, during which time the specified timelines for completing the various phases of the mining project under the concession contract are suspended, will expire on 22 June 2023. AGA Colombia applied for a mining area integration (consolidation) of its concession contracts related to La Colosa, in respect of which AGA Colombia was not in compliance with some of the specified timelines. The application for mining area integration (consolidation) was approved in March 2017, which remedied the non-compliance of each consolidated concession and reset the specified timelines. La Colosa now has a single integrated mining concession contract (EIG-163) which covers a total area of 9,210 hectares and expires on 28 February 2037.
Minera de Cobre Quebradona S.A.S. B.I.C. (“MCQ”) which manages the Quebradona project, obtained the integration of concession agreement 5881 in October 2016 and registered in December 2016. As a result, MCQ was granted the exclusive right to explore, take ownership and dispose of the mineral reserves (ore) extracted from the concession area. MCQ has the right to request an extension of up to 30 years, at least two years before the expiration of the operating period. This extension is not automatic, and the request must be filed with new technical, economic, environmental and social studies that demonstrate the status of the mineral resources. Concession contract 5881 initially covered a total area of 7,593 hectares, which was reduced to 4,881.89 hectares by the relevant mining authority (Secretaría de Minas de Antioquia) on 4 March 2022. It will expire in May 2037 and is currently in its seventh year of the integrated exploration phase. In September 2021, the permits for the construction and mining operation were approved by the relevant mining authority (Secretaría de Minas de Antioquia). On 4 November 2021, ANLA officially notified AngloGold Ashanti of its decision to ‘archive’ the environmental licence application relating to the Quebradona project. ANLA has neither denied nor granted the licence, but deemed that the information provided by AngloGold Ashanti is not enough for this authority to take a substantive decision. On 18 November 2021, AngloGold Ashanti appealed the archiving decision in order to secure further details on the specific additional information ANLA requires to make a determination. ANLA denied the appeal on 29 April 2022 and the archiving decision was confirmed. AngloGold Ashanti is in the process of preparing a new Environmental Impact Assessment for the Quebradona project to submit to ANLA in connection with its environmental licence application.
The Gramalote project is organised as a joint operation between AngloGold Ashanti (through AGA Colombia Holdings Limited and AngloGold Ashanti Holdings plc) and B2Gold (through B2Gold Corp. and Graminvest Ventures Limited). Gramalote Limited, a company incorporated under the laws of British Virgin Islands which is the legal vehicle operating the joint operation, established a Colombian branch, Gramalote Colombia Limited (“GCL”), to carry out activities in Colombia and obtain the mining concession contracts necessary to develop the Gramalote project. The Gramalote joint operation has been operated by B2Gold since January 2020. Pursuant to an integrated mining concession contract No. 14292, GCL was granted the exclusive right to explore, take ownership and dispose of the mineral reserves (ore) extracted from the concession area (which covers a total area of 8,720.71 hectares and includes the Gramalote and Monjas anomalies) until April 2043. GCL has the right to request an extension of the operating period for up to 20 years, and, if exercised, such request to extend must include new technical, economic, environmental and social studies that demonstrate the status of the mineral resources. Currently, concession contract
72
No. 14292 is in the phase of construction and assembly, pending resettlement of communities and the formal start of construction activities. GCL has received an environmental licence granted by ANLA and permits for the construction and mining operation which were approved by the relevant mining authority (Secretaría de Minas de Antioquia). GCL also holds an exploration concession No. 4894 (which covers a total area of 2,279.32 hectares and includes the Trinidad anomaly) which expires in 2044 and an exploration concession No. QHQ-16081 (which covers a total area of 9.78 hectares) which expires in 2052. Following the completion of the feasibility study in the second half of 2022, AngloGold Ashanti and B2Gold determined that the Gramalote project does not meet their investment thresholds for development. Following a comprehensive review of the alternatives relating to the project, both joint operation parties commenced a joint sales process for the Gramalote project, which is currently ongoing.
United States of America (Nevada)
General laws relating to mining and land ownership
General regime
Mineral and surface rights in the United States are owned by private parties, state governments or the federal government. The majority of land utilised for precious metals exploration, development and mining in the western United States is owned by the federal government. The right to mine on such federal land in western states is governed by the U.S. General Mining Law of 1872, as amended (the “General Mining Law”), as well as relevant state statutes and regulations. The General Mining Law allows mining claims (for mining and mining-related activities) on certain federal lands after proper compliance with claim location and maintenance requirements.
Mineral exploration activities in Nevada are also generally subject to applicable federal, state, and local permitting requirements, but the specific regulatory authorisations required for the company’s activities are based on the nature and location of the exploratory work. Many of the company’s Nevada operations are currently conducted under what is generally referred to under federal law as a notice-level operation subject to 43 CFR § 3809.21, while projects that are more advanced require additional permitting, including a Plan of Operations approved by the federal Bureau of Land Management (“BLM”). The State of Nevada Division of Environmental Protection’s Bureau of Mining Regulation and Reclamation (“BMRR”) also regulates mining within the state of Nevada. However, exploration projects of five acres or less on federal land, the scope of a notice-level operation under federal law, are exempt from BMRR regulation. Certain of the company’s early-stage exploration activities fall within this exemption.
The company is currently engaged in exploration activities on certain of its unpatented claims that include, but are not limited to, geological and spectral mapping, surface geochemical sampling, geophysical surveying and RC and/or diamond drilling.
Potential regulatory changes
Over the years, the U.S. Congress has considered a number of proposed amendments to the General Mining Law and other federal statutes relating to mining. Among the significant features contained in previously proposed legislation were a production royalty obligation, new and more stringent environmental standards and conditions, additional reclamation requirements, extensive new procedural steps which would likely result in extended permitting timelines, and granting counties and other entities the ability to petition the U.S. Secretary of the Interior to make certain areas unavailable for the location of unpatented mining claims. In June 2020, former President Trump signed an executive order directing certain federal agencies to streamline the review processes associated with permitting of infrastructure and natural resources projects. Many of those policies have subsequently been rescinded by the Biden administration. While certain other executive orders may favorably affect the timing of our permit and project approvals, the impact is yet to be determined and remains uncertain.
There are a number of bills being proposed to the Nevada state legislature during the 2023 legislative session that could impact the company’s planned operations. These include proposed legislation that would alter the way water rights are administered by the state, as well as a bill that would, if enacted, impose additional requirements for environmental review of mineral development projects in Nevada. At this stage, it is not possible to evaluate whether these bills will be enacted in any form by the Nevada state legislature or, if passed, what impact any might have on AGA.
AGA is currently unaware of any other new federal or state legislative or regulatory changes or rule-making that has been proposed or enacted that would adversely affect its current exploration programmes. If any requirements, standards or conditions were adopted in the future that imposed additional or new obligations or costs on AGA in connection with our exploration or extraction activities in the United States, the company’s operations in Nevada could be adversely affected.
AngloGold Ashanti’s rights and permits
In Nevada, the company’s wholly-owned subsidiaries hold a significant number of unpatented mining claims on federal lands. The Silicon project consists of approximately 950 unpatented mining claims. The North Bullfrog project consists of 45 patented and approximately 1,600 unpatented mining claims (covering approximately 32,000 acres) situated in the Bullfrog mining district. There are also nine mining leases within the North Bullfrog project the majority of which continue in perpetuity so long as the company meets certain minimal requirements for use of the land. One mining lease is scheduled to expire in 2031. The Mother
73
Lode project consists of 13 unpatented mining claims. The North Bullfrog and Mother Lode projects are now controlled by the company as a result of its acquisition of all of the outstanding stock of Corvus Gold Inc., which closed on 18 January 2022. The southern claim block, encompassing the Sterling mine and other properties in the same general area, consists of approximately 1,900 unpatented claims (covering approximately 35,000 acres), which are now controlled by the company as a result of its acquisition of all of the outstanding stock of Coeur Sterling, Inc. (a subsidiary of Coeur Mining, Inc.), which closed on 4 November 2022. As a result of this acquisition, the company now controls a past-producing mine site in southern Nevada known as the Sterling mine, which has one applicable mining lease that expires in 2029, with the option to extend the lease for an additional ten-year period. Although the Sterling mine is currently in care and maintenance status, it remains subject to complex permitting and regulatory requirements, including compliance with relevant provisions of the U.S. Federal Mine Safety and Health Act of 1977 and oversight by the U.S. Department of Labor’s Mine Safety and Health Administration (“MSHA”).
MINE SITE REHABILITATION AND CLOSURE
Closure, an integral part of operations
All mining operations eventually cease. An integral aspect of operating AngloGold Ashanti’s mines is ongoing planning for site closure and, where feasible, implementation of concurrent rehabilitation, together with an estimate of associated liability costs and the placement of adequate financial provisions and assurances to cover these costs.
AngloGold Ashanti integrates mine closure planning throughout the mine life cycle as follows:
•Exploration stage: developing a plan and programme for cessation and closure of exploration activities in a manner that meets local laws and AngloGold Ashanti's mine closure planning standard.
•Project phase: developing conceptual closure plans and cost estimates for all projects and including them in project feasibility studies, designs and evaluations.
•Operational phase: developing and periodically updating mine closure plans and cost estimates with increasing levels of detail and confidence over the operational phase as part of the business planning process. Closure plan updates take into account operational conditions, planning and regulatory requirements as well as advances in technology and international industry good practice (e.g., the ICMM Integrated Mine Closure Good Practice Guide). Concurrent rehabilitation, which is carried out while a mine is still operational, is a good practice that serves to decrease the final rehabilitation and closure work as well as the ultimate liability.
•Closure period: implementing the final closure plan starting at cessation of operations through a period of decommissioning, dismantling and rehabilitation until the point in time where management of the site is largely limited to monitoring and maintenance.
The Company’s group mine closure planning standard stipulates that closure planning must be undertaken in consultation with the stakeholders. In the course of these consultations, different issues are raised which require site-specific solutions. Each mine closure plan includes a social transition plan which seeks to minimise social impacts and maximise opportunities for local communities, including human resource, social infrastructure, economic and financial assets with the aim of enhancing the self-sustainability of mine communities after mine closure.
Provisions for decommissioning and restoration costs are made when there is a present obligation, it is probable that expenditure on decommissioning and restoration work will be required and the cost can be estimated within a reasonable range of possible outcomes. These costs are based on currently available facts, technology expected to be available at the time of the rehabilitation, laws and regulations presently or virtually certain to be enacted and previous experience in the rehabilitation of mine sites.
Decommissioning costs and restoration costs are provided at the present value of the expenditures expected to settle the obligation, using estimated cash flows based on current prices. Estimates are discounted at a pre-tax rate that reflects current market assessments of the time value of money.
Total provisions for decommissioning and for environmental restoration activities (excluding joint ventures) decreased by $95 million from $673 million in 2021 to $578 million in 2022. This decrease was mainly due to changes in estimates resulting from changes in discount rates, changes in global economic assumptions, changes in mine plans resulting in a change in cash flows as well as changes in the design of TSFs.
SUSTAINABILITY AND ENVIRONMENTAL, SOCIAL AND GOVERNANCE (“ESG”) MATTERS
AngloGold Ashanti’s sustainability approach is fundamental to how the Company operates its business, as well as its ability to create long-term value for its shareholders, employees and social partners through safely and responsibly exploring, mining and marketing its products. Sustainability and safety are integrated into the Company’s business and operations at all levels through various frameworks, standards and policies, and the Company measures its performance in achieving its goals against its sustainability and other ESG metrics, as well as its engagement with stakeholders.
In mitigating the risks and impacts that are an inherent part of its business, AngloGold Ashanti is informed by an annual assessment of its key ESG issues. This process is aligned with guidance published by the International Integrated Reporting Council (“IIRC”), the Sustainability Accounting Standards Board (“SASB”), the Global Reporting Initiative (“GRI”) Standards and
74
the Accountability AA1000 Stakeholder Management Standard. This assessment is annually reviewed by AngloGold Ashanti’s senior leadership and approved by the Social, Ethics and Sustainability Committee (the “SES Committee”).
AngloGold Ashanti’s board of directors, assisted by the SES Committee, has ultimate responsibility over environmental, safety, health and ethical matters and for the integration of sustainability objectives into AngloGold Ashanti’s business. This includes oversight of the Company’s stakeholder engagement framework and structures, which apply to investors, employees, governments, suppliers and communities, at every stage of its business from exploration to mine closure. Group Corporate Affairs and Sustainability is responsible for development of management systems and supports the Company’s general managers in the day-to-day implementation of its sustainability strategy.
AngloGold Ashanti maintains a set of policies and procedures to guide the Company in acting as a responsible corporate citizen, including the Code of Business Principles and Ethics which sets requirements for the implementation of key corporate policies and guidelines and applies to all management and employees, and to maintain compliance with applicable environmental, health and safety (“EHS”) laws. In 2022, AngloGold Ashanti continued with the implementation of the Integrated Sustainability Information Management System (“iSIMS”), in order to improve internal reporting and better integrate, manage and monitor sustainability activities with respect to its broader business. This common management and reporting application for all sustainability disciplines, from safety, health and security to community and environmental management, is expected to help provide timely information in each of these areas, and to facilitate transparency and decision-making in its processes and practices.
Significant EHS requirements and ESG risks and trends affecting the Company’s mining and processing operations are described below.
EHS Regulatory Compliance
AngloGold Ashanti is subject to extensive EHS laws and regulations in the various jurisdictions in which the Company operates. These requirements govern, among other things, extraction, use, conservation and discharge of water; air emissions (including dust control and greenhouse gases (“GHGs”)); mine and dam safety, regulatory and community reporting; clean-up of contamination; land use and conservation of protected areas; rehabilitation and closure of mined land; worker health and safety and community health; and the generation, transportation, storage and disposal of solid and hazardous wastes, such as reagents, radioactive materials, and mine tailings. Environmental laws and regulations applicable to the Company’s operations, including the requirements contained in environmental permits, are generally becoming more restrictive.
Capital and operating costs to comply with EHS laws and regulations have been, and are expected to continue to be, significant to AngloGold Ashanti. In addition, AngloGold Ashanti could incur fines, penalties and other sanctions, environmental clean-up costs, and third-party claims for personal injury or property or natural resources damages; suffer reputational damage; and be required to install costly pollution control equipment or to modify or suspend facilities, such as TSFs, or operations, as a result of actual or alleged violations of, or liabilities under, EHS laws and regulations. Failure to comply with applicable EHS laws and regulations may also result in the suspension or revocation of permits and, in some jurisdictions, the right to mine a given concession. AngloGold Ashanti’s ability to obtain and maintain permits and other approvals and to successfully operate near host communities may be adversely impacted by real or perceived effects on the environment or human health and safety associated with AngloGold Ashanti’s or other mining companies’ activities. In addition, unknown environmental hazards may exist at the Company’s properties which may have been caused by previous owners or operators.
Water Management
AngloGold Ashanti’s operations are heavily dependent upon access to substantial volumes of water for use in the mining and extractive processes and typically are subject to water-use permits or rights to extract water from certain natural sources that govern usage and require, among other things, that mining operations maintain certain water quality upon discharge. Water supply, quality and usage are areas of concern across all of the Company’s operations, including with respect to the Company’s mining operations in Ghana and Brazil, its mine development projects in Nevada, as well as its mine development project at Quebradona in Colombia. Any failure by the Company to secure access to suitable water supplies, or achieve and maintain compliance with applicable requirements of the permits or licences, could result in curtailment or halting of production at the affected operations. Incidents of water pollution or shortage can, in certain cases, lead to community protest and ultimately to the withdrawal of community and government support for AngloGold Ashanti’s operations. A failure by the Company to comply with water contamination related directives may result in further, more stringent, directives being issued against the Company, which may, in some cases, result in a temporary or partial shutdown of some of the Company’s operations.
Where feasible, the Company operates a “closed loop” system which recycles the water used in its operations without discharging it to the environment. In some areas, however, such as Ghana and Brazil, high levels of rainfall and surface water runoff mean that a closed loop system is not feasible and that discharges, after water treatment where necessary, must take place.
75
Waste Management
During open-pit mining, large volumes of soil and/or rock (overburden) are mined to expose the ore body. Similarly, waste rock is mined during drilling and developing access to underground ore bodies. Overburden and waste rock typically contain sub-economic levels of gold and are deposited as large waste rock facilities. Mine tailings are the process waste generated once grinding and extraction of gold from the ore is completed in the milling process and are typically deposited as slurry in large tailing storage facilities (“TSFs”) specifically designed for this purpose.
The impact of dust generation, breach, leak, or other failure of a waste rock facility or TSF, including any associated dam, can be significant, and the Company therefore monitors such facilities closely in accordance with the Company’s internal standards, independent review, national regulatory requirements, industry standards and commitments made to local communities. The occasional well-publicised failure of a third-party TSF and the potential impact of such failure also mean that these facilities are generally tightly regulated. A safety or environmental incident at the Company’s operations could result, among other things, in enforcement, including mandatory shutdown of a TSF and related facilities, obligations to remediate environmental contamination, negative press coverage, and claims for property or natural resources damages and personal injury by adjacent communities. Incidents at other mining companies’ operations could result in governmental action to tighten regulatory requirements and restrict certain mining activities, in particular with respect to TSFs, also in respect of other mine operators in that region.
For example, following the catastrophic failure of a TSF at the Córrego do Feijão iron ore mine owned by Vale at Brumadinho in the state of Minas Gerais in Brazil in January 2019, tailings were discharged into the mine’s administrative area and part of the local community, reportedly resulting in death or injury to hundreds of people. As a result of this incident, there has been considerably increased regulatory scrutiny in Brazil and other areas on mining operations generally, and the requirements applicable to the approval, licensing, construction, management, closure and decommissioning of TSFs have generally become far more stringent. For example, in late 2022, tailings deposition was suspended at five of AngloGold Ashanti’s TSFs in Brazil pending certification by external consultants of on-site emergency response plans (“DCO”) and/or geotechnical stability (“DCE”) consistent with new regulatory standards enacted in early 2022. In addition, at the Calcinados TSF, a risk assessment conducted in December 2022 with oversight from external consultants, as required by Brazilian regulations, concluded that additional buttressing should be completed to align the TSF’s post liquefaction factor of safety with international standards currently considered best practice. The timeline for completion will be determined once the engineering and geotechnical work has been completed by external consultants. For further information on the regulatory framework governing TSFs in Brazil, see “Item 4B: Business Overview—The Regulatory Environment Enabling AngloGold Ashanti to Mine—Americas—Brazil”.
In addition, a new Global Industry Standard on Tailings Management (“GISTM”) was established in August 2020 by a panel comprised of industry and non-governmental organisation (“NGO”) experts. AngloGold Ashanti has committed to comply with the GISTM at all of its TSFs by August 2025, and the costs related to meeting such standard are not expected to be material to AngloGold Ashanti.
In addition, AngloGold Ashanti could incur liabilities, or material costs to manage solid and hazardous waste generated by its mining activities, including dust and residual chemicals and metals. For example, AngloGold Ashanti expects to incur approximately $25 million to $30 million in capital expenditure and operating costs during 2023-2026 in connection with treatment and disposal of a quantity of legacy arsenic trioxide waste located at the Obuasi mine.
Groundwater Impacts and Environmental Remediation
As AngloGold Ashanti or its predecessors have a long history of mining operations in certain regions, issues may arise regarding historical, as well as potential future, environmental or health impacts in those areas, for which AGA, as the current owner/operator, may be legally responsible. For example, AngloGold Ashanti has identified groundwater contamination plumes at certain of its operations. Numerous scientific, technical and legal studies have been undertaken to assist in determining the magnitude of the impact and to find sustainable remediation solutions. Based on those studies as well as discussion with regulators, the Company has taken steps, including monitored natural attenuation and phyto-technologies, to address soil and groundwater contamination, including in Tanzania, where an in-situ remediation project to address sulfate in groundwater commenced operations in 2022.
Subject to the completion of site-specific trials and potential technologies being confirmed as viable remediation techniques, no reliable estimate can be made at this time for the obligation. Should these obligations be significant, this could have a material adverse impact upon AngloGold Ashanti’s results and its financial condition.
Climate Change and GHG Regulation
At AngloGold Ashanti, climate change is a board of directors-level governance issue, overseen by the SES Committee and the Audit and Risk Committee. AngloGold Ashanti’s Climate Change Strategy, which was approved by the board of directors in November 2021, seeks to embed the management of physical, regulatory and transition climate change-related risks, as well as climate change-related opportunities, into the Company’s strategic and operational planning processes.
76
In 2021, AngloGold Ashanti committed to the International Council on Mining & Metals (“ICMM”) target of achieving net zero Scope 1 and Scope 2 GHG emissions by 2050. AngloGold Ashanti has also committed to achieving a 30 percent reduction in absolute Scope 1 and 2 emissions by 2030 (as compared to a 2021 baseline), and, in partnership with value chain partners, to set Scope 3 GHG reduction targets, if not by the end of 2023, as soon as possible thereafter.
In December 2015, certain members of the international community negotiated a treaty at the Conference of the Parties of the UN Framework Convention on Climate Change in Paris (the “Paris Agreement”). The Paris Agreement, which came into force on 4 November 2016, requires developed countries to set targets for emissions reductions. As a result, measures designed to limit or reduce GHG emissions, both mandatory and voluntary, have been, and are expected to be, implemented at national or regional levels in various countries.
New regulatory requirements, or changes required to effectively transition to a low-carbon economy, could require AngloGold Ashanti to reduce its direct GHG emissions or energy use, change its fuel mix or incur significant costs for GHG emissions permits or taxes, including for those costs or taxes passed on by electricity utilities which supply the Company’s operations. AngloGold Ashanti could also incur significant costs associated with capital equipment, GHG monitoring and reporting and other obligations to comply with applicable requirements. The most likely source of these obligations is through nation state-level implementation of new emissions or financial obligations pursuant to evolving climate change regulatory regimes.
For example, in 2010, Brazil launched the National Climate Change Policy, which established a voluntary national GHG reduction target of 36.1 percent to 38.9 percent below the projected emissions in 2020 for “business as usual”. The policy required the development of sector-specific plans in order to meet the target and provided for a Brazilian GHG trading scheme, which is yet to be designed. While Brazil is not yet requiring mandatory GHG emissions reporting at the national level, some state environmental agencies have requested companies to voluntarily submit GHG emissions management plans. However, the states of Goiás and Minas Gerais (in which AngloGold Ashanti operates) do not currently require GHG emissions management plans for mining projects. In 2015, Brazil announced, in connection with its commitments under the Paris Agreement, economy-wide absolute mitigation targets providing for a 37 percent reduction in GHG emissions by 2025, as compared to 2005, and a goal to reduce GHG emissions by 43 percent by 2030 compared to 2005 levels.
In addition, in Australia, the Safeguard Mechanism (Rule 2015), through the National Greenhouse and Energy Reporting (“NGER”) scheme, provides a framework for Australia’s largest emitters to measure, report and manage their emissions. The Safeguard Mechanism applies to facilities with Scope 1 covered GHG emissions of more than 100,000 tonnes of CO2e per fiscal year. During the 2018/19 fiscal year, Tropicana’s emissions were within its authorised threshold and Sunrise Dam was required to purchase offsets for emissions that were 0.8 percent above its safeguard threshold, the cost of which was immaterial. Two amendments to the Safeguard Mechanism (Rule 2015) enacted in March 2019 and May 2020 allowed for the application of transitional calculated baselines using estimated CO2-e emissions intensities. Based on the production and emissions forecasts, the Australian mining operations applied to use transitional calculated baselines in 2020 for Sunrise Dam and Tropicana, which were approved by the Clean Energy Regulator effective 1 July 2019 to 30 June 2022 for both operations. Thereafter, the Australian mining operations will be required to apply production-adjusted baselines and, if actual emissions exceed the baseline, to purchase emissions offsets for the business. In any event, the cost of such offsets, if ultimately required to be purchased, including due to a change in the operations under the business plan prior to June 2022, are not expected to be material to the Company’s business.
In addition to more stringent requirements and commitments, AngloGold Ashanti’s operations are subject to a number of physical risks from climate change, such as changes in rainfall rates or patterns resulting in floods or droughts, reduced water availability, higher temperatures and extreme weather events. Such events or conditions, particularly including flooding or inadequate water supplies, could disrupt mining and transport operations, mineral processing and rehabilitation efforts, create resource or energy shortages or damage the Company’s property or equipment and increase health and safety risks on site. In consultation with external consultants, physical climate risk assessments were undertaken for all operations using current climate models for the business and various decarbonisation scenarios and climate adaptation plans were outlined. These physical climate risks will be further reviewed and refined in 2023.
Occupational Safety and Health
AngloGold Ashanti is subject to a variety of laws and regulations in each of the jurisdictions where the Company operates that are designed to protect and improve the safety and health of employees. In some of the jurisdictions in which AngloGold Ashanti operates, the government enforces compulsory shutdowns of operations to enable investigations into the cause of accidents and introduce corrective measures at those operations.
Safety remains a priority for AngloGold Ashanti and a focus of AngloGold Ashanti’s long-term sustainability approach, as well as the Company’s continuing efforts to manage the risks inherent to its operations, to model critical controls and to strengthen safety protocols and preventative measures. AngloGold Ashanti has made significant strides in improving safety. In 2022, there was a 41 percent reduction in year-on-year total recordable injury frequency rate, and no fatalities at any of the mines operated by AngloGold Ashanti.
AngloGold Ashanti’s Group Safety Strategy, which is updated every three years, seeks to integrate operational risk management and key performance indicators at all levels of the organisation and maintain alignment with global safety standards. The SES
77
Committee oversees the implementation of the Group Safety Strategy. All operations, have been certified to ISO 45001:2018, which has replaced the OHSAS 18001:2007 series.
Community Health and Tropical Diseases
AngloGold Ashanti is also subject to health and safety regulations relating to occupational disease. The primary areas of focus in respect of occupational health of employees within the Company’s operations are noise-induced hearing loss (“NIHL”) and occupational lung diseases (“OLD”). OLD includes occupational tuberculosis and silicosis in individuals exposed to silica dust. Silicosis has been particularly prevalent in South Africa and has also arisen at the Company’s Africa region and Brazilian operations, albeit to a far lesser extent. AngloGold Ashanti provides occupational health services to its employees at its occupational health centres, clinics, and through outsourced service centres. The Company continues to expand preventative occupational hygiene initiatives, such as implementing various control measures to prevent hazardous exposures, and providing employees with Personal Protective Equipment.
In 2019, the Johannesburg High Court approved the settlement of existing silicosis and tuberculosis class actions against AngloGold Ashanti and other gold mining companies in South Africa. The recent sale of the Company’s South African operating assets and liabilities did not include the silicosis or tuberculosis settlement obligations relating to South African employees, which were retained by AngloGold Ashanti. For further information, see “Item 18: Financial Statements—Note 1.2—Statement of Compliance—Significant Accounting Judgements and Estimates—Provision for silicosis”.
In addition to OLD, HIV and AIDS and associated diseases remain major health care challenges faced by AngloGold Ashanti’s Africa region operations. AngloGold Ashanti continues to implement programmes to help those infected with HIV and prevent new infections from spreading.
Malaria and other tropical diseases also pose health risks at all of the Company’s operations in Central, West and East Africa where such diseases may assume epidemic proportions because of ineffective national control programmes. Malaria is a major cause of death in young children and pregnant women and also gives rise to deaths and absenteeism in adults. All affected Company operations in Africa have malaria control programmes in place. The Ghana Obuasi malaria control programme activities have been completed in 16 districts of Ghana as planned for 2022 and a new cycle of indoor residual spraying will commence in 2023; in partnership with the Global Fund and the Ghana Department of Health.
In 2022, the COVID-19 pandemic subsided significantly with decreases in reporting of severe disease or deaths. Nevertheless, AngloGold Ashanti continued to direct resources for close surveillance and maintenance of controls within the company with a view to ensure continuity of its operations and avoid any potential disruption in the event of a re-emergence of the pandemic. Universal access to safe and effective vaccines provided an additional layer of protection, especially against severe forms of disease, hospitalisation and death. The company endeavoured to continue to provide prompt access to approved and available vaccines for all workers, especially employees considered to be at high risk as well as employees with critical skills.
The emergence of COVID-19 however also assisted to better integrate broad health risk management beyond occupational health into the overall business strategy, to contribute to productivity as well as the social licence to operate and to improve various prevention and risk management protocols in place to address the potential risk of an epidemic or pandemic, particularly after the company’s experience with Ebola in Guinea in 2014 and 2015.
The company focused on optimising mental wellbeing, minimising non-communicable diseases associated with lifestyle as well as the need for systematic contribution to health system strengthening, local skill development and overall community development in the jurisdictions in which it operates. Such risks impair the health of workers and negatively affect productivity and profitability as a result of workers’ diminished focus or skill, absenteeism, treatment costs and allocated resources. As part of AngloGold Ashanti’s continuing efforts, the company recently approved the newly updated health, hygiene and wellbeing standards based on identified major health hazards or risks which include gender, cultural and other applicable diversity considerations for risk management and controls.
Diversity and Inclusion (“D&I”)
With more than 30,000 employees (including contractor employees) on four continents, AngloGold Ashanti believes that having a diverse and inclusive workforce is important to continuing to attract talent in order to maintain competitiveness and the long-term sustainability of its business. In addition, the Company strives to have a workforce that represents the societies in which AngloGold Ashanti operates in connection with maintaining its social licence to operate.
AngloGold Ashanti’s D&I approach is aligned to the United Nation Sustainable Development Goals (“UNSDGs”) (SDG 5, 8 and 10) and the United Nations Global Compact (“UNGC”). The Company has developed a Diversity & Inclusion Framework, which aims to foster the empowerment of all staff, irrespective of race, gender, ethnicity, religion and sexual orientation and has established specific priorities and actions for the next two to five years to foster the inclusion of D&I objectives in its processes. Leadership teams are responsible for meeting defined diversity targets. In 2022, AngloGold Ashanti conducted an analysis of global gender data across job level, function and country. The analysis was carried out to inform AngloGold Ashanti’s D&I strategy.
78
Human Rights and Indigenous Peoples
In its commitment to respecting and promoting human rights, AngloGold Ashanti supports the United Nations Guiding Principles for Business and Human Rights (“UNGP”) and other international initiatives, including the UNGC and the Voluntary Principles on Security and Human Rights (“VPSHR”). The VPSHR, which seeks to balance safety and security needs against respect for human rights and fundamental freedoms, were developed through multi-stakeholder participation between governments, extractive industry members and NGOs. Community and security related matters, including with respect to illegal and artisanal and small-scale mining and related intrusions into the Company’s operational areas, are addressed at board of directors-level by the SES Committee. AngloGold Ashanti’s internal Human Rights Framework includes numerous policies, management standards and guidance documents which apply to all of its employees, contractors and suppliers and require reporting of, and redress for, human rights violations and related allegations.
The Company is aligned with the ICMM Position Statement on Indigenous Peoples and the International Finance Corporation’s Performance Standard 7 on Indigenous Peoples and other international standards and treaties in the area of Indigenous Peoples’ rights.
79
ANGLOGOLD ASHANTI GLOBAL FOOTPRINT: 2022
Operations and projects
Notes
(1) Gramalote is managed by B2Gold Corp ("B2Gold").
(2) AngloGold Ashanti acquired North Bullfrog and Mother Lode as part of the Corvus Gold Inc. ("Corvus Gold") acquisition in January 2022.
(3) AngloGold Ashanti acquired Sterling through the Coeur Sterling, Inc. ("Coeur Sterling") acquisition in November 2022.
(4) Kibali is operated by Barrick Gold Corporation ("Barrick").
80
OPERATING PERFORMANCE
Group description
AngloGold Ashanti is an independent global gold mining company with a diverse high-quality portfolio of operations, projects and exploration activities and is headquartered in Johannesburg, South Africa.
In 2022, our portfolio of ten operations in seven countries includes long-life operating assets with differing ore body types located in key gold-producing regions around the world. These operating assets were supported by greenfields projects in Colombia and a focused global exploration programme, including exploration in the United States.
Our operations and projects are grouped into the following regions: Africa, Americas and Australia.
On 12 February 2020, the Company announced that it had reached an agreement with Harmony to sell all its remaining South African producing assets and related liabilities. The sale closed on 30 September 2020. On 10 November 2020, the Company announced that it had completed the sale of its interest in the Morila mine in Mali and on 30 December 2020, the Company announced that it had completed the sale of its interest in the Sadiola Mine in Mali.
AngloGold Ashanti’s operations and joint arrangements employed, on average, 32,594 people (including contractors) in 2022 (2021: 30,561).
Performance
In 2022, AngloGold Ashanti produced attributable 2.742 million ounces of gold (2021: 2.472 million ounces), as well as 3.2 million ounces of silver and 352 tonnes of sulphuric acid as by-products.
Production of 2.742 million ounces of gold was achieved in 2022 at a cost of sales of $3.4 billion for subsidiaries and $342 million for equity-accounted joint venture operations, and an all-in sustaining cost of $1,439 per ounce for subsidiaries and $979 per ounce for equity-accounted joint venture operations, compared to a production of 2.472 million ounces in 2021 at a cost of sales of $2.9 billion for subsidiaries and $350 million for equity-accounted joint venture operations, and an all-in sustaining cost of $1,441 per ounce for subsidiaries and $856 per ounce for equity-accounted joint venture operations.
Gold
The AngloGold Ashanti gold Mineral Reserve increased from 28.1 million ounces as at 31 December 2021 to 28.8 million ounces as at 31 December 2022. This excludes Gramalote as the JV partner has decided not to publish the Mineral Reserve. This annual net increase of 0.7 million ounces includes additions due to exploration and modelling changes of 2.9 million ounces and changes in economic assumptions of 1.0 million ounces. This increase was partially offset by depletion of 2.9 million ounces and reductions due to other factors of 0.3 million ounces. The Mineral Reserve was estimated using a gold price of $1,400 per ounce, unless otherwise stated (2021: $1,200 per ounce). See “Item 4D Property, Plants and Equipment—Mineral Resource and Mineral Reserve”.
Copper
The AngloGold Ashanti copper Mineral Reserveremained unchanged at 1.47Mt (3,250Mlb) as at 31 December 2022 as a feasibility study optimisation is still ongoing and no additional exploration has been completed at Quebradona. The Mineral Reserve was estimated at a copper price of $2.90/lb, unless otherwise stated (2021: $2.90/lb). See “Item 4D Property, Plants and Equipment—Mineral Resource and Mineral Reserve”.
Capital expenditure, including equity-accounted joint ventures, in 2022 amounted to $1,118 million (2021: $1,100 million).
Safety
No fatal occupational safety incidents at any of the mines operated by the Company were recorded for 2022. The TRIFR was 1.26 per million hours worked in 2022 compared to 2.14 per million hours worked in 2021.
Full Asset Potential Review Programme
The Full Asset Potential (“FP”) programme aims to achieve a step-change in AngloGold Ashanti’s operating and cost performance by the year 2024. This programme includes a comprehensive three-month assessment of each of the Company’s mine sites, which covers every aspect of an operation. The outcome is intended to enhance the Company’s understanding of the relative potential of each asset and includes developing a plan and implementation schedule to achieve the targeted performance over the next six to 24 months. These assessments have now been completed at six operations of the Company (Sunrise Dam, Siguiri, Cuiabá, Tropicana, Serra Grande and Geita), where the relevant site leadership teams have taken full accountability for the delivery on these initiatives.
81
Operational Excellence
Operational Excellence is the continued efforts to maximise value from our assets.
New Operating Model
Our new Operating Model, designed and introduced to employees towards the end of 2021, aims to improve efficiency and support better operating outcomes by focusing only on work required to deliver the strategy, clarifying the mandates of corporate functions, properly resourcing our revenue-generating assets to deliver on their plans, and removing duplicate structures and activities. The implementation of the new Operating Model was completed during 2022.
82
AFRICA REGION
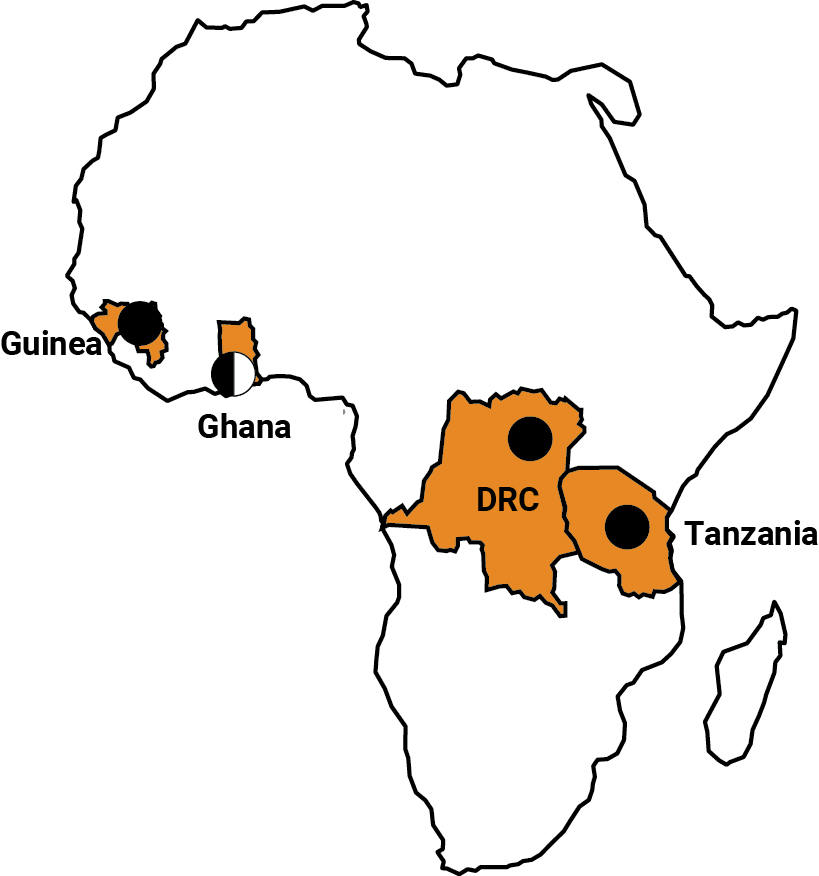 | ||
Africa is currently home to five of our operations, with one – Kibali – managed by Barrick Gold Corporation. These operations, which contributed 60 percent or 1.6 million ounces to total annual group production in 2022, are in Ghana (Iduapriem and Obuasi), Guinea (Siguiri), Tanzania (Geita) and the DRC (Kibali).
| Attributable gold production (000oz) | Average number of employees | ||||||||||
| Subsidiary operations | |||||||||||
| Ghana | |||||||||||
| Iduapriem | 248 | 2,186 | |||||||||
| Obuasi | 250 | 4,403 | |||||||||
| Guinea | |||||||||||
| Attr. Siguiri 85% | 279 | 4,052 | |||||||||
| Tanzania | |||||||||||
| Geita | 521 | 6,435 | |||||||||
| Joint venture operations | |||||||||||
| Democratic Republic of the Congo | |||||||||||
| Attr. Kibali 45% | 337 | 2,731 | |||||||||
83
Africa Region - Key Statistics
| Unit | 2022 | 2021 | 2020 | ||||||||||||||||||||
| Restated | |||||||||||||||||||||||
| Subsidiary operations | |||||||||||||||||||||||
| Tonnes treated/milled | Mt | 21.6 | 21.2 | 20.5 | |||||||||||||||||||
| Pay limit | oz/t | 0.044 | 0.035 | 0.034 | |||||||||||||||||||
| g/t | 1.516 | 1.193 | 1.160 | ||||||||||||||||||||
| Recovered grade | oz/t | 0.054 | 0.045 | 0.052 | |||||||||||||||||||
| g/t | 1.86 | 1.54 | 1.77 | ||||||||||||||||||||
Gold production (a) (attributable) | 000oz | 1,298 | 1,054 | 1,239 | |||||||||||||||||||
| Cost of sales | $m | 1,662 | 1,300 | 1,362 | |||||||||||||||||||
Total cash costs per ounce (1) | $/oz | 1,023 | 991 | 841 | |||||||||||||||||||
All-in sustaining costs per ounce(1) | $/oz | 1,291 | 1,264 | 1,002 | |||||||||||||||||||
| Capital expenditure | $m | 486 | 434 | 383 | |||||||||||||||||||
| Safety | |||||||||||||||||||||||
| Number of fatalities | 0 | 1 | 2 | ||||||||||||||||||||
| TRIFR | Per million hours worked | 0.33 | 0.61 | 0.55 | |||||||||||||||||||
| People | |||||||||||||||||||||||
| Average no of employees: Total | 17,076 | 14,806 | 14,496 | ||||||||||||||||||||
| Permanent employees | 5,780 | 5,619 | 5,433 | ||||||||||||||||||||
| Contractors | 11,296 | 9,187 | 9,063 | ||||||||||||||||||||
(a) Includes Obuasi gold production in 2020, capitalised as part of the project development.
| Unit | 2022 | 2021 | 2020 | ||||||||||||||||||||
| Joint venture operations | |||||||||||||||||||||||
| Tonnes treated/milled | Mt | 3.5 | 3.5 | 3.4 | |||||||||||||||||||
| Pay limit | oz/t | 0.054 | 0.048 | 0.048 | |||||||||||||||||||
| g/t | 1.850 | 1.652 | 1.640 | ||||||||||||||||||||
| Recovered grade | oz/t | 0.087 | 0.095 | 0.096 | |||||||||||||||||||
| g/t | 2.98 | 3.25 | 3.29 | ||||||||||||||||||||
| Gold production (attributable) | 000oz | 337 | 365 | 364 | |||||||||||||||||||
| Cost of sales | $m | 342 | 350 | 340 | |||||||||||||||||||
Total cash costs per ounce (1) | $/oz | 725 | 647 | 629 | |||||||||||||||||||
All-in sustaining costs per ounce(1) | $/oz | 979 | 856 | 810 | |||||||||||||||||||
| Capital expenditure | $m | 90 | 72 | 52 | |||||||||||||||||||
| People | |||||||||||||||||||||||
| Average no of employees: Total | 2,731 | 2,454 | 2,333 | ||||||||||||||||||||
| Permanent employees | 957 | 860 | 824 | ||||||||||||||||||||
| Contractors | 1,774 | 1,594 | 1,509 | ||||||||||||||||||||
(1)“Total cash costs per ounce” and “all-in sustaining costs per ounce” are non-GAAP measures. For further information on these non-GAAP measures, see “Item 5A: Operating Results—Non-GAAP analysis”.
84
Performance summary
Production for the Africa region was up 15 percent for the year ended 31 December 2022 at 1.635 million ounces compared to 1.419 million ounces for the year ended 31 December 2021.
Safety performance improved – there were no occupational fatalities at any of the mines operated by the Company and a TRIFR of 0.33 per million hours worked was recorded (2021: 0.61 per million hours worked).
Regional community investment totalled $10.19 million (2021: $10.5 million).
With Obuasi having received its ISO 45001 (health and safety) certification, all our Africa operations are now certified in terms of ISO 45001, ISO 14001 (environmental management) and the International Cyanide Management Code.
We continued integration of the new Operating Model, the existing Operational Excellence programme, and the Full Asset Potential (FP) review programme launched during 2021.
In the second half of 2022, Geita was part of the FP review programme designed to enhance understanding of the relative potential of each asset and includes developing a plan and implementation schedule to achieve the targeted performance over the next six to 24 months.
Siguiri was the first of the African operations to be involved in the FP review programme with the leadership team focusing on increasing the volume of high-grade oxide ore from Block 2. This increase was successful and is reflected in the year-on-year increase in production. We are starting to see the benefits of the FP review programme at Siguiri and a second contractor was hired to deliver higher volumes of higher-grade oxide ore from Block 2.
For more information regarding production performance in the Africa region, refer to “Item 5A: Operating Results—Key factors affecting results—Production in 2022”.
For more information regarding operating performance in the Africa region, refer to “Item 5A: Operating Results—Comparison of operating performance on a segment basis in 2022 with 2021”
For more information regarding capital expenditure in the Africa region, refer to “Item 5A: Operating Results—Comparison of capital expenditure in 2022, 2021 and 2020—Comparison of capital expenditure in 2022 with 2021”
Obuasi update
Phase 3 of the Obuasi redevelopment project, which relates principally to capital expenditure to refurbish existing infrastructure around the KMS Shaft, as well as to service the mine in deeper production areas, continues to progress.
In 2022, the project achieved the following milestones: hoisting via the KMS rock shaft in November 2022; pumping to drop the water level below 50 level; commissioning of the material handling system from 44 level to surface; completing the new ventilation shaft pilot hole and progressing the KMS shaft down to 44 level.
The Obuasi mine continues on the ramp-up path to its full production run-rate in excess of 400,000 ounces.
85
THE AMERICAS
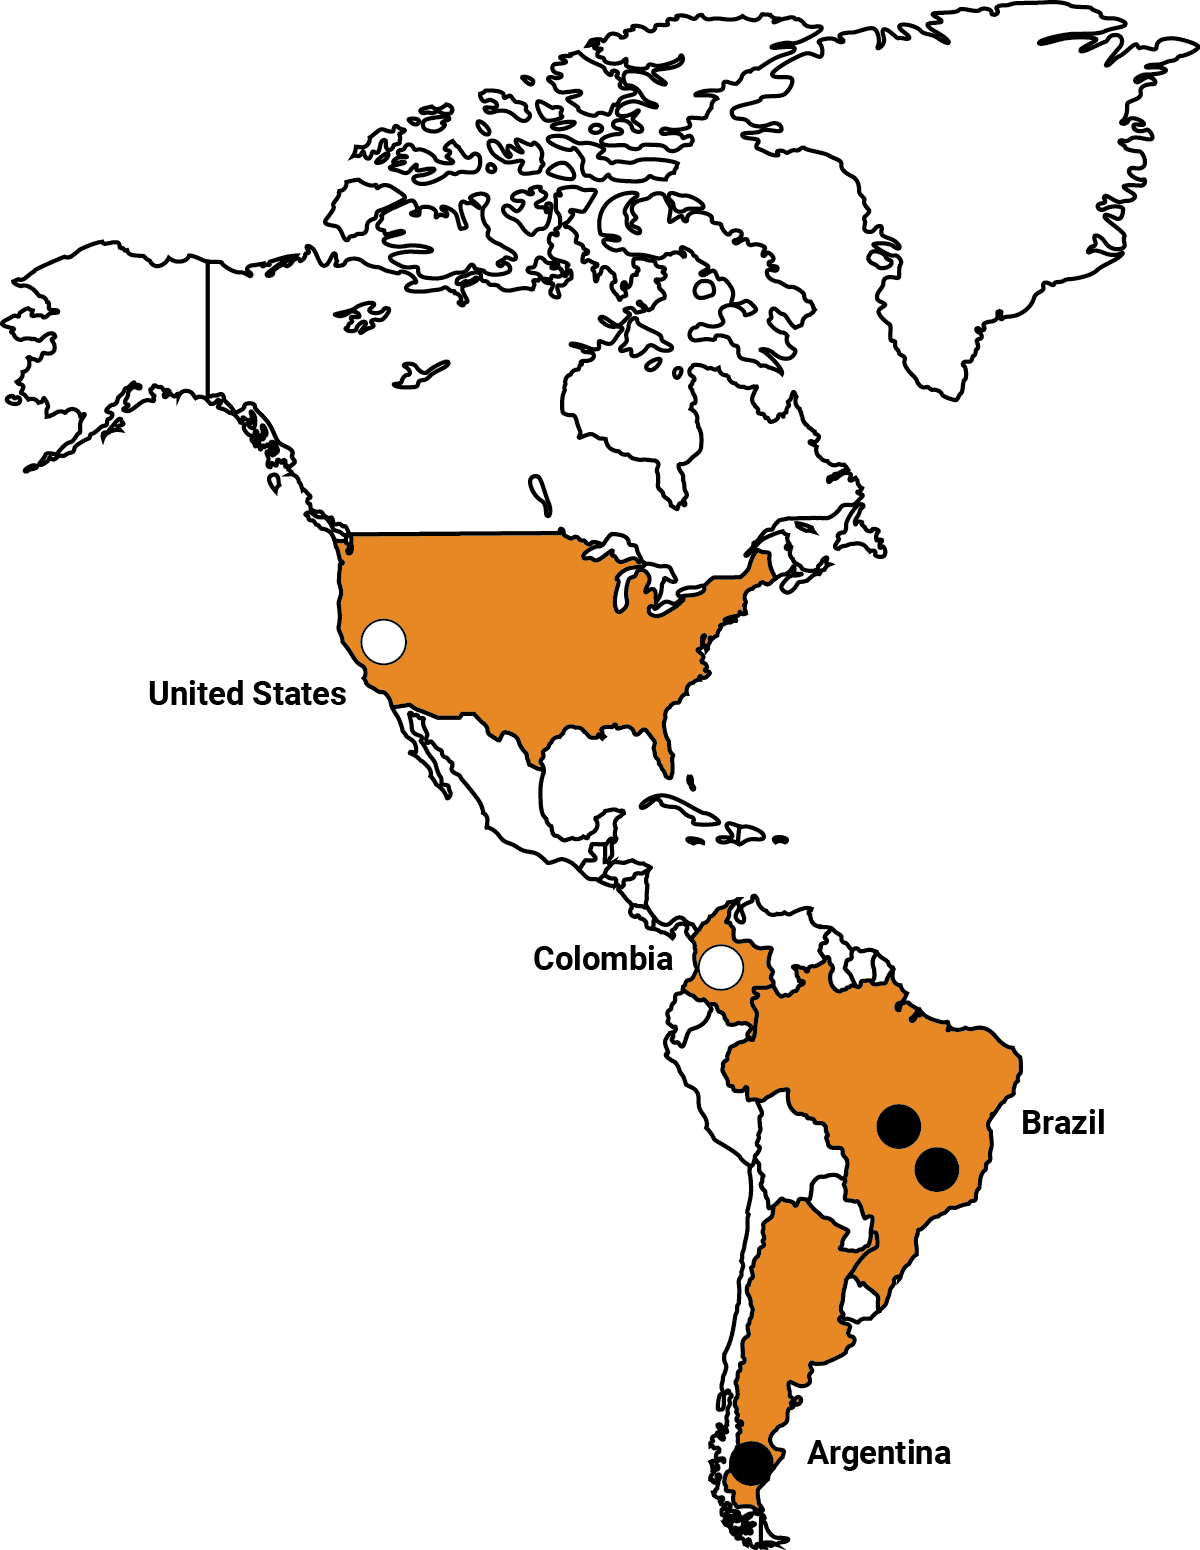 | ||
The Americas hosts three of our operations – one in Argentina and two in Brazil – as well as greenfields projects in Colombia and a significant new greenfields development in Nevada in the United States.
| Attributable gold production (000oz) | Average number of employees | ||||||||||
| Operations | |||||||||||
1. Argentina | |||||||||||
| Cerro Vanguardia (Attr. 92.5%) | 170 | 1,819 | |||||||||
2. Brazil | |||||||||||
| AGA Mineração | 311 | 5,702 | |||||||||
| Serra Grande | 88 | 1,977 | |||||||||
86
Americas - Key Statistics
| Unit | 2022 | 2021 | 2020 | ||||||||||||||||||||
| Operation | |||||||||||||||||||||||
| Tonnes treated/milled | Mt | 7.1 | 7.8 | 7.5 | |||||||||||||||||||
| Pay limit | oz/t | 0.10 | 0.10 | 0.07 | |||||||||||||||||||
| g/t | 3.52 | 3.49 | 2.46 | ||||||||||||||||||||
| Recovered grade | oz/t | 0.070 | 0.066 | 0.081 | |||||||||||||||||||
| g/t | 2.40 | 2.27 | 2.77 | ||||||||||||||||||||
| Gold production (attributable) | 000oz | 569 | 559 | 649 | |||||||||||||||||||
| Silver production (attributable) | Moz | 3.2 | 3.4 | 3.3 | |||||||||||||||||||
| Cost of sales | $m | 913 | 822 | 764 | |||||||||||||||||||
Total cash costs per ounce (1) | $/oz | 1,078 | 921 | 721 | |||||||||||||||||||
All-in sustaining costs per ounce (1) | $/oz | 1,718 | 1,587 | 1,003 | |||||||||||||||||||
Capital expenditure (2) | $m | 339 | 398 | 216 | |||||||||||||||||||
| Safety | |||||||||||||||||||||||
| Number of fatalities | 0 | 1 | 0 | ||||||||||||||||||||
| TRIFR | Per million hours worked | 2.33 | 3.55 | 3.68 | |||||||||||||||||||
| People | |||||||||||||||||||||||
| Average no of employees: Total | 9,498 | 9,972 | 8,789 | ||||||||||||||||||||
| Permanent employees | 6,093 | 6,452 | 6,158 | ||||||||||||||||||||
| Contractors | 3,405 | 3,520 | 2,631 | ||||||||||||||||||||
(1)“Total cash costs per ounce” and “all-in sustaining costs per ounce” are non-GAAP measures. For further information on these non-GAAP measures, see “Item 5A: Operating Results—Non-GAAP analysis”.
(2)100 percent (not attributable) and includes Projects.
Performance summary
Production for the Americas region was up two percent for the year ended 31 December 2022 at 569,000 ounces compared to 559,000 ounces for the year ended 31 December 2021.
Safety – no occupational fatalities and the TRIFR improved to 2.33 per million hours worked (2021: 3.55 per million hours worked).
Community investment amounted to $6.4 million (2021: $5.8 million).
All operations in the Americas maintained their certification in terms of International Cyanide Management Code, ISO 45000 (health and safety) and ISO 14001 (environmental management).
During the second half of 2022, Cuiabá and Serra Grande completed assessments to identify performance improvement initiatives as part of the FP review programme. The FP programme initiatives implemented at Cuiabá have seen ore tonnes consistently above full potential target. At Serra Grande, the FP team identified several enhancement opportunities and it is following implementation plans with timelines for delivery.
In December 2022, the company suspended filtered tailings deposition on the Calcinados TSF and processing of gold concentrate at the Queiroz plant (both of which service the Cuiabá mine complex). For further information, refer to “Item 4B: Business Overview—The Regulatory Environment Enabling AngloGold Ashanti to Mine—Americas—Brazil” and “Item 3D: Risk Factors—Compliance with tailings management requirements and standards, and potential liabilities in the event of a failure to timely comply with these requirements or an incident involving a tailings storage facility, could adversely impact AngloGold Ashanti's financial condition, results of operations and reputation”.
For more information regarding production performance in the Americas region, refer to “Item 5A: Operating Results—Key factors affecting results—Production in 2022”.
For more information regarding operating performance in the Americas region, refer to “Item 5A: Operating Results—Comparison of operating performance on a segment basis in 2022 with 2021”.
For more information regarding capital expenditure in the Americas region, refer to “Item 5A: Operating Results—Comparison of capital expenditure in 2022, 2021 and 2020—Comparison of capital expenditure in 2022 with 2021”.
Nevada strategy
87
In Nevada, during 2022, AngloGold Ashanti’s project team integrated the Corvus Gold assets and project data into the AngloGold Ashanti evaluation framework. The Company completed planning for feasibility study work at North Bullfrog and also commenced a pre-feasibility study at Silicon along with further drilling at the Merlin deposit. Following the acquisition of Coeur Sterling’s mining properties in the fourth quarter of 2022, AngloGold Ashanti’s project team commenced integrating these assets into the broader evaluation studies.
88
AUSTRALIA
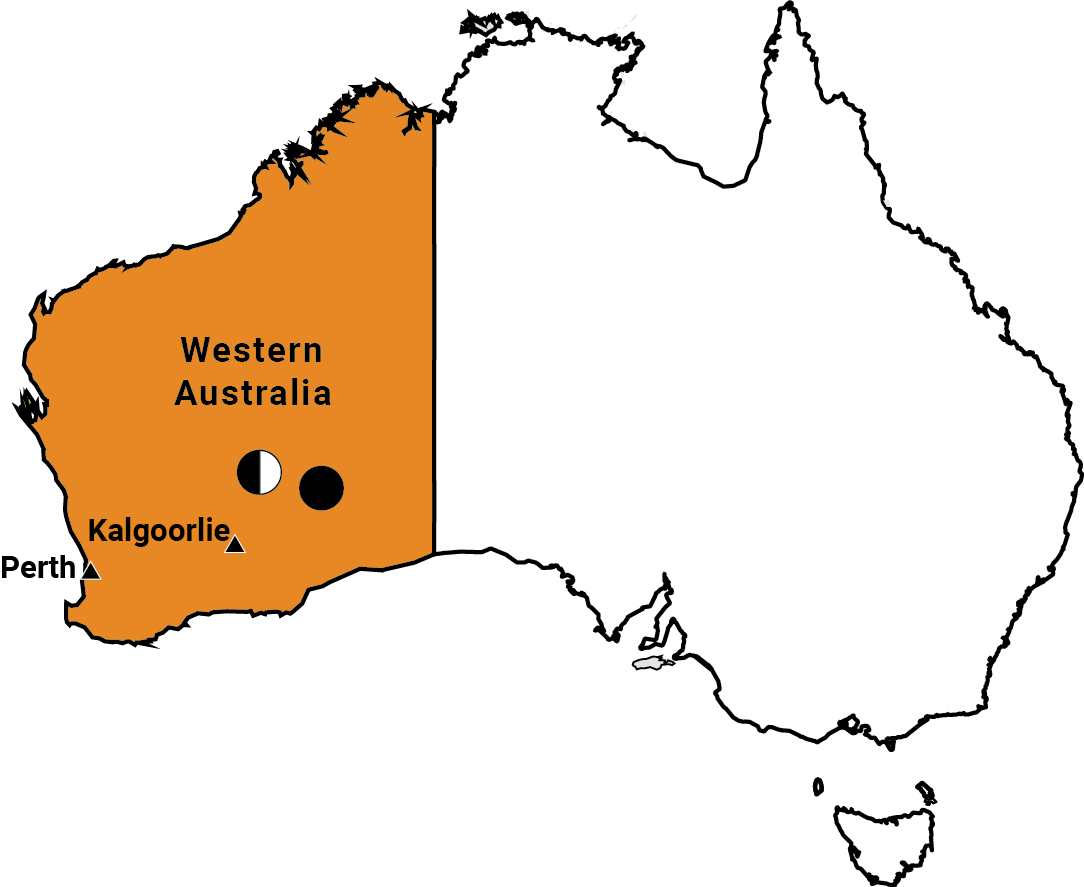 | ||
| Attributable gold production (000oz) | Average number of employees | ||||||||||
| Operations | |||||||||||
| Australia | |||||||||||
| 1. Sunrise Dam | 232 | 725 | |||||||||
| 2. Tropicana 70% | 306 | 807 | |||||||||
The two AngloGold Ashanti operations in Australia are Sunrise Dam and Tropicana, both of which are in the north-eastern goldfields in the state of Western Australia. Sunrise Dam is wholly owned. We have a 70 percent holding in, and manage, Tropicana. Regis Resources Ltd, our partner in Tropicana, holds the balance. Sunrise Dam includes the Butcher Well project (70 percent).
89
Australia - Key Statistics
| Unit | 2022 | 2021 | 2020 | ||||||||||||||||||||
| Operation | |||||||||||||||||||||||
| Tonnes treated/milled | Mt | 10.7 | 10.5 | 10.2 | |||||||||||||||||||
| Pay limit | oz/t | 0.05 | 0.06 | 0.06 | |||||||||||||||||||
| g/t | 1.69 | 1.89 | 1.95 | ||||||||||||||||||||
| Recovered grade | oz/t | 0.050 | 0.047 | 0.054 | |||||||||||||||||||
| g/t | 1.56 | 1.47 | 1.68 | ||||||||||||||||||||
| Gold production (attributable) | 000oz | 538 | 494 | 554 | |||||||||||||||||||
| Cost of sales | $m | 783 | 740 | 705 | |||||||||||||||||||
Total cash costs per ounce (1) | $/oz | 1,157 | 1,196 | 968 | |||||||||||||||||||
All-in sustaining costs per ounce(1) | $/oz | 1,345 | 1,500 | 1,225 | |||||||||||||||||||
| Capital expenditure | $m | 202 | 185 | 142 | |||||||||||||||||||
| Safety | |||||||||||||||||||||||
| Number of fatalities | 0 | 0 | 0 | ||||||||||||||||||||
| TRIFR | Per million hours worked | 3.82 | 6.59 | 3.74 | |||||||||||||||||||
| People | |||||||||||||||||||||||
| Average no of employees: Total | 1,532 | 1,332 | 1,230 | ||||||||||||||||||||
| Permanent employees | 314 | 288 | 259 | ||||||||||||||||||||
| Contractors | 1,218 | 1,044 | 971 | ||||||||||||||||||||
(1)“Total cash costs per ounce” and “all-in sustaining costs per ounce” are non-GAAP measures. For further information on these non-GAAP measures, see “Item 5A: Operating Results—Non-GAAP analysis”.
Performance summary
Production for the Australia region was up nine percent for the year ended 31 December 2022 at 538,000 ounces compared to 494,000 ounces for the year ended 31 December 2021.
Safety performance improved – there were no occupational fatalities and a TRIFR of 3.82 per million hours worked was recorded (2021: 6.59 per million hours worked).
Regional community investment amounted to $0.99 million (2021: $1.01 million).
Sunrise Dam and Tropicana are certified under the Cyanide Code, ISO 45000 (health and safety) and ISO 14001 (environmental management).
The first site to complete an assessment as part of the FP review programme was Sunrise Dam, where the biggest opportunity is to increase productivity in development and achieve a step-change in underground production. The proposed improvements include an underground workshop to lift jumbo utilisation and improvements to planning and scheduling which, together are expected to support an increase in underground volumes. During the second half of 2022, Tropicana also completed an assessment to identify performance improvement initiatives as part of the FP review programme.
For more information regarding production performance in the Australia region, refer to “Item 5A: Operating Results—Key factors affecting results—Production in 2022”.
For more information regarding operating performance in the Australia region, refer to “Item 5A: Operating Results—Comparison of operating performance on a segment basis in 2022 with 2021”.
For more information regarding capital expenditure in the Australia region, refer to “Item 5A: Operating Results—Comparison of capital expenditure in 2022, 2021 and 2020—Comparison of capital expenditure in 2022 with 2021”.
90
SOUTH AFRICA
 |  | ||||
The sale of the South African assets to Harmony closed on 30 September 2020. As a result, the figures in this section relate
to the nine months ended on 30 September 2020, unless the context indicates otherwise.
| Gold production (000oz) | Average number of employees | ||||||||||
| Operations | |||||||||||
| South Africa | |||||||||||
1. West Wits | |||||||||||
| Mponeng | 134 | 5,040 | |||||||||
2. Surface operations (1) | 107 | 2,254 | |||||||||
South Africa Key Statistics
| Unit | 2020 | 2019 | 2018 | ||||||||||||||||||||
| Operation | |||||||||||||||||||||||
| Tonnes treated/milled | Mt | 0.4 | 35.1 | 34.9 | |||||||||||||||||||
Pay limit (1) | oz/t | 0.40 | 0.33 | 0.44 | |||||||||||||||||||
| g/t | 14.60 | 11.90 | 16.11 | ||||||||||||||||||||
Recovered grade (1) | oz/t | 0.120 | 0.183 | 0.219 | |||||||||||||||||||
| g/t | 3.75 | 5.69 | 6.82 | ||||||||||||||||||||
| Gold production | 000oz | 241 | 419 | 487 | |||||||||||||||||||
| Cost of sales | $m | 287 | 479 | 590 | |||||||||||||||||||
Total cash costs (2) | $/oz | 1,149 | 981 | 1,033 | |||||||||||||||||||
All-in sustaining costs (2) | $/oz | 1,296 | 1,132 | 1,178 | |||||||||||||||||||
| Capital expenditure | $m | 35 | 57 | 73 | |||||||||||||||||||
| Safety | |||||||||||||||||||||||
| Number of fatalities | 4 | 0 | 2 | ||||||||||||||||||||
| AIFR | Per million hours worked | 6.12 | 10.00 | 10.25 | |||||||||||||||||||
| People | |||||||||||||||||||||||
| Average no of employees: Total | 7,294 | 6,975 | 17,308 | ||||||||||||||||||||
| Permanent employees | 6,418 | 6,202 | 15,557 | ||||||||||||||||||||
| Contractors | 876 | 773 | 1,751 | ||||||||||||||||||||
| Unit | 2022 | 2021 | 2020 | ||||||||||||||||||||
| Operation | |||||||||||||||||||||||
| Tonnes treated/milled | Mt | 0.4 | |||||||||||||||||||||
Pay limit (1) | oz/t | 0.40 | |||||||||||||||||||||
| g/t | 14.60 | ||||||||||||||||||||||
Recovered grade (1) | oz/t | 0.120 | |||||||||||||||||||||
| g/t | 3.75 | ||||||||||||||||||||||
| Gold production | 000oz | 241 | |||||||||||||||||||||
| Cost of sales | $m | 287 | |||||||||||||||||||||
Total cash costs per ounce (2) | $/oz | 1,149 | |||||||||||||||||||||
All-in sustaining costs per ounce(2) | $/oz | 1,296 | |||||||||||||||||||||
| Capital expenditure | $m | 35 | |||||||||||||||||||||
| Safety | |||||||||||||||||||||||
| Number of fatalities | 4 | ||||||||||||||||||||||
| TRIFR | Per million hours worked | 6.12 | |||||||||||||||||||||
| People | |||||||||||||||||||||||
| Average no of employees: Total | 8,297 | ||||||||||||||||||||||
| Permanent employees | 7,012 | ||||||||||||||||||||||
| Contractors | 1,285 | ||||||||||||||||||||||
(1)Refers to underground operations only.
(2)“Total cash costs per ounce” and all-in“all-in sustaining costs per ounce” are non-GAAP measures. For further information on these non-GAAP measures, see “Item 5A: Operating Results-Non-GAAPResults—Non-GAAP analysis”.
EXPLORATION REVIEW
Our greenfields exploration is focused on two of our strategic focus areas: creating value by providing long-term optionality and improving portfolio quality. Our exploration programme covers greenfields and brownfields exploration.
Greenfields exploration
Americas
In all, 80,541mthe United States, following the handover of the Silicon discovery to the Beatty Project team in the first quarter of 2022, the greenfields exploration function shifted its focus to seven, 100 percent-owned, earlier-stage greenfields projects located elsewhere in the Great Basin of Nevada. Work completed at these various projects included prospect mapping, surface sampling and geophysical surveys. Diamond drilling is planned for the Midnight Star and CR projects during 2023.
In Brazil, 1,330 stream sediments, 1,200 soil samples and 1,060 rock chip samples were collected. From the SBB terrane in the state of Minas Gerais, four districts have been identified by stream sediment sampling. Infill sampling is in progress to define projects in these districts. At the WBC terrane, which is located in the state of Matto Grosso do Sul to the south-west of Minas Gerais, one project has been advanced and will be considered for drilling in 2023.
In Argentina, an option agreement was signed with Latin Metals for the Organullo project in Salta Province. Work completed globally with total expendituresince June 2022 included soil sampling, mapping, acquisition of $31.2m overvarious spectral data sets and community engagement. At the year.100 percent-held El Cori project, four drilling targets were identified from surface exploration.
Africa
In Guinea, we received six reconnaissance permits for the Shira district in the Siguiri Basin of Guinea. Community engagement work has started and field exploration is scheduled for the first quarter of 2023.
In Tanzania, target generation activities continued.
Australia
Brownfields exploration
In 2022, our brownfields exploration teams across the globe completed 799km of capital and 358km of expensed drilling at a cost of $79 million and $67 million, respectively. The drilled metre achievement was ten percent below the 2022 budget of 1,281km with the gap closing each quarter after slow start ups at a few operations. Total expenditure of $146 million was 12 percent below budget.
Brownfields exploration activities resulting in the most notable economic intercepts, by operation, for 2022 are listed below by region.
Africa
•Geita: The key area drilled was Geita Hill which is split into six blocks. The drilling was conducted from both surface and underground and was designed to upgrade the underground project and to prepare for mining. Other significant intercepts were drilled at Star and Comet underground at Cut 3 and Ridge 8, extending the potential of the underground complex at Star and Comet. Drilling at the Nyamulilima open pit expanded and further defined the mineralisation.
•Obuasi: Drilling at Block 8, Block 10 and Sansu continued to define the limits of mineralisation and prepare these areas for mining. Late in the year drilling started at Cote D’Or examining the potential to open a second mining area.
•Siguiri: The key exploration activities were undertaken acrossat Kounkoun (Block 3) where infill and definition drilling continue as part of the globe. Brownfields exploration completed 1,409kmoverall assessment of Block 3 as a future mining area. Drilling to extend and define the known mineralisation in Blocks 1 and 2 was conducted.
•Kibali: Two notable drilling with a total expenditure of $63.1m (capital)intercepts, at Mengu Hill and $67.7m (expensed) forOere, were recorded during the year.
92
Americas
•AGA Mineração, CdS: Drilling of drilling was completedunderground opportunities at both CdS I and II delivered significant intercepts at Sangue De Boi, Mutuca, Rosalino, Pinta Bem and Pneu.
•AGA Mineração, Cuiabá: Drilling to extend the depth extents of Fonte Grande Sul below 21 level continued while at a cost of $4.4m.shallower depth drilling to define the satellite ore bodies continued to deliver.
during the year.
Australia
Dam:
Following the decision of Colombia’s national environmental agency (ANLA) in November 2021 to archive the Company’s environmental licence application for the Quebradona project, AngloGold Ashanti filed an appeal seeking to secure further details on the specific additional information required for ANLA to make a decision on AngloGold Ashanti’s licence submission. On 29 April 2022, ANLA dismissed the appeal and confirmed its decision to archive the Company’s application. AngloGold Ashanti continues to review and analyse the additional information identified as part of ANLA’s decision. The objective is to prepare, submit and process a new environmental licence request for Quebradona deposit is situated in the Middle Cáuca regionfollowing completion of Colombia, in the Department of Antioquia, 60km southwest
Following completion of the feasibility study on the Gramalote gold project, will be submitteda joint operation with B2Gold, both partners have determined that the Gramalote project does not meet their investment thresholds for board approval in the second quarter of 2021, following which will be the receipt of the environmental and mining licences to operate.development. The project is expectedcontinues to treat 6.2Mt annually to produce 3 billion pounds of copper, 1.5Moz of goldbenefit from federal and 21Moz of Silver over a potential 23-year life. First production is expected to start in the second half of 2025. Quebradona will be a copper mine with gold and silverlocal government support as by-products. Simultaneously, work continued on incorporating all findings from peer reviews and promoting the ‘#Miningwithpurpose’ campaign, which seeks to highlight the integration of social, environmental and economic imperatives into the project and subsequent mining operations. Local stakeholderwell as continuing support from the Jericó community tends to be stable with the most recent survey conducted indicating that 68% of residents support the project.local communities.
93
4C. ORGANISATIONAL STRUCTURE
GROUP STRUCTURE
AngloGold Ashanti’s operations are divided into the following regions:
•Africa –— operations in Ghana, Guinea and Tanzania and a joint venture operationsoperation in the DRC and Mali (the Morila and Sadiola Mines in Mali were sold during 2020);DRC;
•Australia –— operations in Australia; and
•Americas –— operations in Argentina and Brazil, and exploration projects in Colombia and the United States.States and Colombia.
The above four regions also correspond to AngloGold Ashanti’s four business segments. The South Africa region is recognised for financial statement purposes as discontinued operations as we sold our remaining South African producing assets and related liabilities in 2020. In addition, a discontinued operation.new segment, Projects has been introduced from the implementation of the new Operating Model (previously reported under the America’s segment). The Projects segment comprises all the major non-sustaining capital projects with the potential to be developed into operating entities.
Day-to-day management of the groupGroup is entrusted to AngloGold Ashanti’s executive management team, chaired by the Chief Executive Officer. See “Item“Item 6: Directors, Senior Management and Employees”.
Support is provided to the executive management team in managing AngloGold Ashanti’s corporate activities at both the central and local levels.
SUBSIDIARIES
AngloGold Ashanti Limited has investments in principal subsidiaries and joint venture interests, see “Item“Item 19: Exhibits—Exhibits to Form 20-F—Exhibit 19.8 List of AngloGold Ashanti Limited subsidiaries at 31 December 2020”subsidiaries” for details.
On 16 March 2023, AngloGold Ashanti and Gold Fields announced that they have agreed the key terms of a proposed joint venture in Ghana between Gold Fields' Tarkwa and AngloGold Ashanti's neighbouring Iduapriem Mines (the “Proposed Joint Venture”). There can be no certainty that the parties will enter into a definitive agreement with respect to the Proposed Joint Venture or about the timing, terms and conditions of any such definitive agreement. Implementation of the Proposed Joint Venture is subject to, among other matters, reaching agreement with the Government of Ghana regarding the Proposed Joint Venture, conclusion of confirmatory due diligence and securing all requisite regulatory approvals. For further information, refer to “Item 18: Financial Statements—Note 35—Subsequent Events”.
94
4D. PROPERTY, PLANTS AND EQUIPMENT
Notes:
(1) Gramalote is managed by B2Gold Corp ("B2Gold").
(2) AngloGold Ashanti to Mine”acquired North Bullfrog and Mother Lode as part of the Corvus Gold Inc.("Corvus Gold") acquisition in January 2022.
(3) AngloGold Ashanti acquired Sterling (which includes the Crown Block deposits of SNA, Secret Pass and Daisy) through the Coeur Sterling, Inc. ("Coeur Sterling") acquisition in November 2022.
(4) Kibali is operated by Barrick Gold Corporation ("Barrick").
The locations of AngloGold Ashanti’s properties are used interchangeably.shown above. Percentages indicate the ownership interest held by AngloGold Ashanti. All operations are 100 percent ownedwholly-owned unless otherwise indicated.
Overview of mining properties and operations
The overview for each mining property is disclosed below and includes information on the following items:
•Location of the properties;
•For each material property, locality maps showing the location of such properties as well as infrastructure and licences;
•Type and amount of ownership interests;
•Identity of the operator or operators;
•Titles, mineral rights, leases or options and acreage involved;
•Stages of the properties (exploration, development or production);
•Key permit conditions;
•Mine types and mineralisation styles; and
•Processing plants and other available facilities.
95
Please refer to “Item 5A: Operating Results—Key factors affecting results—Production in 2022” for the aggregate annual production for each of the Company's mining properties during each of the fiscal years ended 31 December 2022, 2021 and 2020. For more information about AngloGold Ashanti’s mines, including a summary of the Company’s titles, mining rights, leases and licences with acreage, please refer to “Item 4B: Business Overview—The Regulatory Environment Enabling AngloGold Ashanti to Mine”.
In its annual report on Form 20-F for the fiscal year ended 31 December 2021, AngloGold Ashanti complied for the first time with the new mining property disclosure requirements for mining registrants set forth in Subpart 1300 of Regulation S-K (17 CFR § 229.1300) (“Regulation S-K 1300”) and reported on, and filed Technical Report Summaries for, all of its mining properties. During 2022, AngloGold Ashanti developed a process to determine which properties are material to its business or financial condition for purposes of the individual property disclosure requirements of Item 1304 of Regulation S-K (17 CFR § 229.1304). The key considerations taken into account by AngloGold Ashanti in its materiality assessment include (i) certain quantitative factors such as contribution to the Mineral Resource and Mineral Reserve, actual and planned production and Net Present Value, as well as (ii) certain qualitative factors, which are assessed in the context of the Company’s overall business and financial condition. The materiality assessment covers all of the Company’s mining properties (regardless of the stage of the mining property) and all of its mining and related activities from exploration through extraction, and will be reviewed by the Company on an annual basis. Based on these considerations, AngloGold Ashanti has determined that its material properties for purposes of Regulation S-K 1300 are Geita, Kibali and Obuasi. With respect to Geita, an updated Technical Report Summary (effective date: 31 December 2022) has been prepared by the relevant Qualified Persons, and is filed as Exhibit 19.15.4 hereto. With respect to Kibali and Obuasi, AngloGold Ashanti has determined that (i) there are no material changes to the Mineral Reserve or Mineral Resource reported in the Technical Report Summaries for these properties (effective date: 31 December 2021) which were filed as exhibits to AngloGold Ashanti’s annual report on Form 20-F for the fiscal year ended 31 December 2021, and (ii) all material assumptions and information pertaining to the disclosure of the Mineral Resource and Mineral Reserve for Kibali and Obuasi remain current in all material respects as of 31 December 2022, based on all facts and circumstances, both quantitative and qualitative. As a result, the Technical Report Summaries for Kibali and Obuasi (effective date: 31 December 2021), which were initially filed as exhibits to AngloGold Ashanti’s annual report on Form 20-F for the fiscal year ended 31 December 2021, are filed as Exhibits 19.15.7 and 19.15.5, respectively, hereto.
AngloGold Ashanti’s operating mines are all accessible by road.road, although for some, personnel access is better achieved by air.
This annual report on Form 20-F is not being submitted in support of the disclosure of exploration results and therefore no disclosure of drilling or sample results is provided. AngloGold Ashanti has elected not to provide drilling results for its operating mines as drilling at its brownfields operations is generally intended to provide incremental additions, or conversions to already reported Mineral Resource and therefore they are not seen as material. While drilling at the Company’s brownfields operations increases confidence in its Mineral Resource as well as adds LOM extensions, the incremental additions that occur on a yearly basis are not material to that operation or the Company as a whole. In cases where the drilling projects are supporting a non-sustaining addition, these projects are commented on. In the Company’s major greenfields projects, if any single drill result is considered material and may change the reported Mineral Resource significantly then it is reported. Refer to “Item 4B: Business Overview—Exploration review”.
96
AFRICA
AngloGold Ashanti has five mining operations within the Africa region. region:
•Kibali Gold Mine in the Democratic Republic of the Congo ("DRC"), a joint venture (“JV”) between AngloGold Ashanti (45%), Barrick Gold Corporation (“Barrick”) (following its merger with Randgold Resources Limited (“Randgold”)) (45%), and Société Minière de Kilo-Moto S.A. (“SOKIMO”), a state-owned gold mining company (10%);
•Iduapriem Gold Mine ("Iduapriem") and Obuasi Gold Mine ("Obuasi") in Ghana;
•Siguiri Gold Mine (“Siguiri”) in Guinea, co-owned by AngloGold Ashanti (85%) and the government of Guinea (15%); and
•Geita Gold Mine ("GGM" or "Geita") in Tanzania.
Mining is from both open pit and underground, with Obuasi (in Ghana) being an underground mine, in a redevelopment phase, Iduapriem (in Ghana) and Siguiri (in Guinea) being open pit mines, and Kibali (in DRC) and Geita (in Tanzania) being a combination of open pit and underground mines. The Morila and Sadiola Mines were sold during 2020. The sale of the company’s interests in the Yatela mine (in Mali) to the Government of Mali, announced in 2019, is pending fulfilment or waiver of a number of conditions precedent.
DRC
For additional information, please refer to the Technical Report Summary for Kibali (effective date: 31 December 2021) filed as Exhibit 19.15.7 hereto.
Property description
Kibali is a joint venture co-owned by AngloGold Ashanti (45%), Barrick (45%), and SOKIMO (10%). SOKIMO is wholly-owned by the DRC government. The consolidated lease is made up of ten exploitation permits. The metallurgical plant comprises a twin-circuit sulphide and oxide plant with conventional carbon-in-leach ("CIL"), including gravity recovery as well as a float and ultra-fine grind circuit. Barrick operates the mine, which comprises both open pit and underground operations.
Kibali Gold Mine,is a gold mining, processing and exploration project. Operations currently focus on open pit and underground mining. The mine was originally developed and operated by Randgold. Following the completion of the merger of Randgold and Barrick in 2019, Barrick became the operator at Kibali for both exploration and mining. Kibali is currently a production stage property.
Location
Kibali is located in the north-easternnortheastern part of the DRC near the international borders with Uganda and South Sudan,is the sole operation in the DRC.
The operational area falls within the administrative territory of Watsa in Haut UéHaut-Uélé province.
Mineralisation style
Gold deposits of the Kibali district are classified as Archaean orogenic gold deposits. At Kibali, the gold deposits are largely hosted in siliciclastic rocks, banded iron formations (“BIFs”) and chert that were deformed, altered and transposed during several events. This occurred at or near greenschist metamorphic conditions. Ore-forming H2O-CO2-rich fluids migrated along a linked network of gently northeast-dipping shears and north-northeast plunging fold axes that are commonly referred to as the KZ Trend. The auriferous KZ Trend is a complexly deformed fault system specifically developed along the boundary between the younger sedimentary basin in the west of the belt that juxtaposes the older rocks to the east. Mineralisation occurred during the later stages of subsequent regional deformation which resulted in inversion of the basin and the development of reverse faults and folds. Ongoing deformation during hydrothermal activity resulted in the development of lodes in a variety of related structural settings within the KZ Trend.
History
On 15 October 2009, AngloGold Ashanti acquired a 50 percent indirect interest in Moto Goldmines Limited through a JV with Randgold, with Moto holding a 70 percent stake in Kibali and the DRC parastatal SOKIMO holding the remaining 30 percent stake. On 21 December 2009, Randgold and AngloGold Ashanti increased their JV interest in Kibali to 90 percent, while SOKIMO retained a 10 percent holding. On 2 January 2019, Randgold merged with Barrick, and the JV is now held by the combined company, trading as Barrick.
Legal aspects and tenure
Refer to “Item 4B: Business Overview—The Regulatory Environment Enabling AngloGold Ashanti to Mine—Africa Region—Democratic Republic of the Congo (DRC)—AngloGold Ashanti’s rights and permits”.
97
Mining method
The operation comprises both open pit and underground mining. FirstOpen pit mining is carried out using conventional drill, blast, load and haul surface mining methods. From 2022 onwards, open pit production will come from the Sessenge, Aerodrome, Pamao, Gorumbwa, Megi-Marakeke-Sayi, Kalimva-Ikamva, Oere, Pakaka, and Karagba, Chauffeur and Durba (“KCD”) deposits. Open pit mining is conducted by contractor Kibali Mining Services, a local subsidiary of DTP Terrassement, using either free-dig or conventional drill, blast, load and haul methods.
For the underground operation, longitudinal and transverse longitudinal stoping methods with paste backfill are the nominated mining methods. The Kibali KCD underground mine is designed to extract the KCD deposit directly beneath the KCD open pit. A 50m crown pillar separates the pit bottom from the top of the underground mine. The first gold was poured in September 2013 from the open pit operations. The underground mine has both a rampoperations and shaft system, with the shaft reaching a depth of 740 metres. Developmentdevelopment of the underground mine commenced in 2013, with the first underground developmentsame year. Stoping commenced in 2015 and ore minedproduction has ramped up to 3.8Mt in 2013 and stoping commencing in 2015.2022. Initial production was viatruck hauled by a twin decline fromto surface. In 2017, the haulage shaft (740m deep) and materials handling system was commissioned. From 2018 onwards, the majority ofunderground ore washas predominantly been hoisted up the shaft. The decline to surface now beingwill continue to be used to haul ore from some of the shallower zones and to supplement shaft haulage.
Processing plants and other available facilities
Infrastructure in the DRC is generally poor as a result of limited investment in maintenance, upgrades and extensions of the road networks established during colonial times. The mine site is located within 160km of the border with Uganda and all transport links take place through Uganda to Kenya or Tanzania. Access by air to Kibali involves a commercial flight to Entebbe in Uganda followed by a charter flight to Doko airport, situated on the mine property. The Doko airstrip was upgraded by Kibali and is equipped with runway lights and precision approach path indicator lights. For the number of persons employed at the mine, refer to “Item 4B: Business Overview—Operating Performance—Africa Region”.
Kibali is a large-scale gold mining operation, with a number of sources of ore, that has been in operation since 2013. The physical condition of the equipment, facilities, and infrastructure at Kibali is in good working order, with the mine investing heavily in maintaining and upgrading its assets to ensure that they remain reliable and efficient. Surface infrastructure associated with the overall Kibali operation includes a processing plant, capabletailings storage facility ("TSF"), camp, airstrip, underground shaft, workshops and offices. Power to the mine is self-generated by a combination of producing an averagehydroelectric and diesel generators. The underground mine has also been extensively developed, with the construction of 800kozboth shaft and portal and strategically placed development drives that access and further explore the gold-bearing ore.
The “Property, Plant, and Equipment” as of gold per annum31 December 2022, including lease assets, buildings and mine infrastructure, mining assets, mineral rights and dumps, decommissioning assets, capitalised exploration costs and deferred stripping, had a carrying value of $983 million (reported as attributable; 45% owned by treating 7.5Mtpa. AngloGold Ashanti).
Mineral processing
The current processing plant can treat both oxide and fresh sulphide material and is configured foruses flotation andwith ultra-fine grind of the flotation concentrate, a treatment that is required for the sulphide ore type before leaching. PowerKibali has a processing operation capable of producing an average of 730kozpa of gold for 10 years treating at least 7.2Mtpa throughput. The ore is blended using both KCD underground ore plus ore sourced from satellite open pits at Kibali.
Mineral Resource
Refer to the minebelow table, prepared in accordance with Table 1 to Paragraph (D)(1) of Item 1304 of Regulation S-K, which summarises the gold Mineral Resource (exclusive of Mineral Reserve) for Kibali at the end of the fiscal year ended 31 December 2022, based on a gold price estimate of $1,700/oz. Refer to “—Material Assumptions for the Mineral Resource—Key Parameters (Open Pit and Underground)” for additional information on cut-off grades and metallurgical recovery.
| Mineral Resource | Category | Tonnes | Grade | Contained Gold | |||||||||||||
| as at 31 December 2022 | million | g/t | tonnes | Moz | |||||||||||||
| Kibali (45 percent) | Measured | 7.22 | 3.18 | 22.97 | 0.74 | ||||||||||||
| Indicated | 22.15 | 2.64 | 58.44 | 1.88 | |||||||||||||
| Measured & Indicated | 29.37 | 2.77 | 81.41 | 2.62 | |||||||||||||
| Inferred | 13.16 | 2.61 | 34.43 | 1.11 | |||||||||||||
Notes:
Rounding of numbers may result in computational discrepancies in the Mineral Resource tabulations. The Mineral Resource estimates with respect to our material properties have been prepared by the Qualified Persons (employed by AngloGold Ashanti unless stated otherwise). The net difference between the Mineral Resource at the end of the last completed fiscal year and the preceding fiscal year is self generated by a combination of hydroelectric and diesel generators.detailed in the table below. To
98
reflect that figures are not precise calculations and that there is uncertainty in their estimation, AngloGold Ashanti reports tonnage, grade and content for gold to two decimals. All ounces are Troy ounces. “Moz” refers to million ounces.
1.All disclosure of Mineral Resource is exclusive of Mineral Reserve. The Mineral Resource exclusive of Mineral Reserve (“Exclusive Mineral Resource”) is defined as the inclusive Mineral Resource less the Mineral Reserve before dilution and Ore Reserveother factors are coveredapplied.
2.Mineral Resource attributable to AngloGold Ashanti’s percentage interest shown.
3.“Tonnes” refers to a metric tonne which is equivalent to 1,000 kilograms.
4.Operated by exploitation permits (11447, 11467, 11468, 11469, 11470, 11471, 11472, 5052, 5073Barrick. AngloGold Ashanti has recognised that in preparing this annual report, the Qualified Persons have relied on information provided by Barrick. Based on a gold price of $1,700/oz.
5.Property currently in a production stage.
6.Refer to “—Material Assumptions for the Mineral Resource—Key Parameters (Open Pit and 5088) totalling 1,836kmUnderground)”2. The Kibali Gold Mine was granted the 10 exploitation permits under the applicable DRC mining code, seven of which are valid until 2029 for additional information on cut-off grades and three of which are valid until 2030.metallurgical recovery.
Year on year changes in Mineral Resource - Moz
| as at 31 December 2022 | Kibali | |||||||||||||
| Category | Measured | Indicated | Measured and Indicated total | Inferred | ||||||||||
| Previous Year | 0.78 | 1.76 | 2.54 | 0.89 | ||||||||||
| Depletion | (0.01) | — | (0.01) | — | ||||||||||
| Exploration | 0.01 | — | 0.01 | 0.10 | ||||||||||
| Methodology | — | — | — | — | ||||||||||
| Price | 0.03 | 0.16 | 0.19 | 0.13 | ||||||||||
| Cost | (0.01) | (0.02) | (0.03) | (0.02) | ||||||||||
| Geotechnical | (0.07) | (0.02) | (0.09) | — | ||||||||||
| Metallurgical | — | 0.01 | 0.01 | 0.01 | ||||||||||
| Acquisition / Disposal | — | — | — | — | ||||||||||
| Other | — | — | — | — | ||||||||||
| Current Year | 0.74 | 1.88 | 2.62 | 1.11 | ||||||||||
| Net Difference | (0.04) | 0.12 | 0.08 | 0.22 | ||||||||||
| % Difference | (5) | 7 | 3 | 24 | ||||||||||
Notes:
All figures are expressed on an attributable basis unless otherwise indicated. AngloGold Ashanti has recognised that in preparing this annual report, the Qualified Persons have relied on information provided by Barrick.
Changes were driven both by exploration and an increase in the Mineral Resource gold price from $1,500/oz as at 31 December 2021 to $1,700/oz as at 31 December 2022, with gains seen from the open pits, specifically Ikamva, Oere and Gorumbwa, as well as from continued definition of the 11000 lode in the KCD underground. A maiden underground Inferred Mineral Resource at Gorumbwa was also reported.
Material Assumptions for the Mineral Resource
Key Parameters (Open Pit and Underground)
| Kibali | Unit | Open Pit | ||||||
| Costs | ||||||||
| Waste cost | $/tonne mined | 2.92-3.09(1) | ||||||
| Extra Ore Cost – Grade Control + Ore – Rehandle + Overhaul | $/tonne mined | 1.27 | ||||||
| Grade Control cost | $/tonne mined | 0.75 | ||||||
| Dilution | % | 10 | ||||||
| Ore Loss | % | 3 | ||||||
| Processing cost | $/tonne milled | 15.04-17.85(1) | ||||||
| G&A | $/tonne milled | 8.47 | ||||||
| Other Parameters | ||||||||
| Gold Royalties (4.7%) | $/oz | 70.50 | ||||||
| Metallurgical Recovery Factor | %MetRF | 86.1-90.1(1) | ||||||
| Mineral Resource cut-off grade | g/t | 0.6-0.7(1) | ||||||
99
| Kibali | Unit | Open Pit | ||||||
| Mineral Resource price | $/oz | 1,700 (2) | ||||||
Notes: AngloGold Ashanti has recognised that in preparing this annual report, the Qualified Persons have relied on information provided by Barrick. (1) Vary according to rock type. (2) AngloGold Ashanti has determined that there is no material change to the Mineral Resource reported in the 2021 Technical Report Summary for Kibali (effective date: 31 December 2021) filed as Exhibit 19.15.7 hereto if this updated gold price is used (instead of $1,500, the gold price used to estimate the Mineral Resource in 2021). | ||||||||
| Kibali | Unit | Underground | ||||||
| Costs | ||||||||
| Mine Production | $/tonne ore mined | 36.17 | ||||||
| Capital | $/tonne ore mined | 3.97 | ||||||
| G&A | $/tonne ore milled | 8.47 | ||||||
| Processing cost | $/tonne ore milled | 17.85 | ||||||
| Other Parameters | ||||||||
| Gold Royalties (4.7%) | $/oz | 70.50 | ||||||
| Mining cut-off grade | g/t | 1.62 | ||||||
| Mineral Resource price | $/oz | 1,700 (1) | ||||||
| Metallurgical Recovery Factor | %MetRF | 90 | ||||||
Notes: AngloGold Ashanti has recognised that in preparing this report, the Qualified Persons have relied on information provided by Barrick. (1) AngloGold Ashanti has determined that there is no material change to the Mineral Resource reported in the 2021 Technical Report Summary for Kibali (effective date: 31 December 2021) filed as Exhibit 19.15.7 hereto if this updated gold price is used (instead of $1,500, the gold price used to estimate the Mineral Resource in 2021). | ||||||||
Estimation
Mineral Resource estimation is undertaken by Barrick in-house technical experts or by approved external consultants. The results of both diamond drilling ("DD") and reverse circulation ("RC") drilling are used in the estimation process. 3D mineralised envelopes are established using grade and geology, and these are then statistically verified to confirm their validity for use in grade estimation. Appropriate domaining of homogeneous zones is conducted whereby high-grade central core areas are modelled separately from the lower-grade surrounding halos. Volumes are filled with block model cells and interpolated for density, rock type and grade – the latter using ordinary kriging.
Grade top cuts and restricted searches are applied to drill hole data to prevent the spread of high-grades during the estimation process. Drill hole spacing is used to guide the Mineral Resource classification. The open pit Mineral Resource is quoted within a limiting shell. The underground Mineral Resource is constrained by the application of optimised mineable Mineral Resource shapes, which applies reasonable mineability constraints including a minimum mining width, a reasonable distance from current or planned development, and a measure of assumed profitability at the related Mineral Resource cut-off grade.
Mineral Reserve
Refer to the below table, prepared in accordance with Table 2 to Paragraph (D)(1) of Item 1304 of Regulation S-K, which summarises the gold Mineral Reserve for Kibali Gold Mine is located withinat the Moto Greenstone Belt, which consistsend of Archean Kibalian volcano-sedimentary rocksthe fiscal year ended 31 December 2022, based on a gold price estimate of $1,300/oz. Refer to “—Material Assumptions for the Mineral Reserve—Modifying factors and ironstone-chert horizons thatprice estimates” for additional information on cut-off grades and metallurgical recovery.
| Mineral Reserve | Category | Tonnes | Grade | Contained Gold | |||||||||||||
| as at 31 December 2022 | million | g/t | tonnes | Moz | |||||||||||||
| Kibali (45 percent) | Proven | 14.49 | 3.47 | 50.33 | 1.62 | ||||||||||||
| Probable | 29.17 | 3.15 | 91.86 | 2.95 | |||||||||||||
| Total | 43.67 | 3.26 | 142.19 | 4.57 | |||||||||||||
Notes:
1.Rounding of numbers may result in computational discrepancies in the Mineral Reserve tabulations. The Mineral Reserve estimates with respect to our material properties have been metamorphosedprepared by the Qualified Persons (employed by AngloGold Ashanti unless stated otherwise). The net difference between the Mineral Reserve at the end of the last completed fiscal year and the preceding fiscal year is detailed in the table below. To reflect that figures are not precise calculations and that there is uncertainty in their estimation, AngloGold Ashanti reports tonnage, grade and content for gold to greenschist facies.two decimals. All ounces are Troy ounces. “Moz” refers to million ounces.
2.Mineral Reserve attributable to AngloGold Ashanti’s percentage interest shown.
3.“Tonnes” refers to a metric tonne which is equivalent to 1,000 kilograms.
100
4.Operated by Barrick. AngloGold Ashanti has recognised that in preparing this annual report, the Qualified Persons have relied on information provided by Barrick. Open Pits and underground were based on a gold price of $1,300/oz, with the exception of the Pamoa Main pit (based on a gold price of $1,400/oz) and the Pamoa South pit (based on a gold price of $1,500/oz).
5.Property currently in a production stage.
6.Refer to “—Material Assumptions for the Mineral Reserve—Modifying factors and price estimates” for additional information on cut-off grades and metallurgical recovery.
Year on year changes in Mineral Reserve - Moz
| as at 31 December 2022 | Kibali | ||||||||||
| Category | Proven | Probable | Total | ||||||||
| Previous Year | 1.74 | 2.59 | 4.33 | ||||||||
| Depletion | (0.28) | (0.12) | (0.40) | ||||||||
| Exploration | 0.11 | 0.42 | 0.53 | ||||||||
| Methodology | — | — | — | ||||||||
| Price | 0.03 | 0.12 | 0.15 | ||||||||
| Cost | (0.01) | (0.03) | (0.04) | ||||||||
| Geotechnical | — | — | — | ||||||||
| Metallurgical | — | — | — | ||||||||
| Operational | 0.03 | — | 0.03 | ||||||||
| Other | — | (0.03) | (0.03) | ||||||||
| Acquisition / Disposal | — | — | — | ||||||||
| Current Year | 1.62 | 2.95 | 4.57 | ||||||||
| Net Difference | (0.12) | 0.36 | 0.24 | ||||||||
| % Difference | (7) | 14 | 6 | ||||||||
Notes:
All figures are expressed on an attributable basis unless otherwise indicated. AngloGold Ashanti has recognised that in preparing this annual report, the Qualified Persons have relied on information provided by Barrick.
The combined Karagba, Chauffeurincrease in Mineral Reserve was primarily as a result of the conversion of the 11000 lode in the KCD underground, and Durba (KCD) deposit is hostgrowth in the Ikamva and Oere pits due to exploration successes. The gold price used for pit optimisation changed from $1,200/oz as at 31 December 2021 to $1,300/oz as at 31 December 2022 which also contributed to the majority ofincrease seen.
Material Assumptions for the currently definedMineral Reserve
Modifying factors and price estimates
| as at 31 December 2022 | Kibali | |||||||
| Primary Commodity Price | $/oz | 1,300(1)(6) | ||||||
| Cut-off grade | g/t | 1.50(3)(5); 1.96(4) | ||||||
| Stoping width | cm | 2990(4) | ||||||
| Dilution | % | 2.0-12.5(4); 10(5) | ||||||
| Mining Recovery Factor | MRF based on tonnes (%) | 91.6(4); 97(5) | ||||||
| Mine Call Factor | MCF (%) | 97 | ||||||
| Metallurgical Recovery Factor | MetRF (%) | 89-90(2) | ||||||
Notes: AngloGold Ashanti has recognised that in preparing this annual report, the Qualified Persons have, relied on information provided by Barrick. (1) AngloGold Ashanti has determined that there is no material change to the Mineral Reserve reported in the 2021 Technical Report Summary for Kibali (effective date: 31 December 2021) filed as Exhibit 19.15.7 hereto if this updated gold price is used (instead of $1,200, the gold price used to estimate the Mineral Reserve in 2021). (2) Vary according to rock type. (3) Stockpile. (4) Underground. (5) Open pit. (6) Open Pits and underground were based on a gold price of $1,300/oz, with the exception of the Pamoa Main pit (based on a gold price of $1,400/oz) and the Pamoa South pit (based on a gold price of $1,500/oz). | ||||||||
Estimation
The open pit Mineral Reserve shell optimisations were run on the Mineral Resource models. The process incorporated the mining layout, operating factors, stripping ratio, relevant cut-off grades and Ore Reserve, as well asmodifying factors for
101
reporting the currentMineral Reserve. An open pit underground interface was set at 5,685 metres relative level (“mRL") between the KCD open pit and underground mining operations. KCD is hosted within a mineralised corridor that also hosts the Sessenge, Gorumbwa and Pakaka deposits and a number of exploration prospects.mine.
A cut-off grade analysis of $1,300/oz was used to determine a cut-off grade of 1.96g/t for the underground mine. Longitudinal and transverse longhole open stoping methods with paste backfill are the current preferred mining methods. Underground stope designs were updated from the previously reported Mineral Reserve using the latest Mineral Resource models. Modifying factors for planned and unplanned rock dilution, backfill dilution and ore loss were applied to obtain the reported Mineral Reserve.
Metallurgical, environmental, social, legal, marketing and economic factors were adequately considered in the Kibali feasibility study and have been updated as the project has developed.
Map showing Kibali planned infrastructure and licences
Below is a map that shows Kibali infrastructure and licences, with the total mining lease area insert shown in the top right corner. The known depositscoordinates of the Kibali project are hosted along a reactivated thrust plane that creates plunging lodes of mineralisationmine, as exemplifiedrepresented by the KCD deposit. The majority of gold mineralisation identified to date is disseminated style, hosted within a sequence of coarse volcaniclasticplant, are depicted on the map and sedimentary rocks. The mineralisation is generally stratigraphically bound and associated with carbonate-silica-albite alteration with minor sulphide.are in the geographic coordinate system.
102

GHANA
AngloGold Ashanti has two mines in Ghana:Ghana. Obuasi currently in a redevelopment phase,and Iduapriem are both wholly-owned and operated by AngloGold Ashanti.
Obuasi is an underground mine andoperating at depths of up to 1,500m with a continuous history of mining dating back to the 1890s. Iduapriem is an open pit mine.
103
Obuasi is located in the Ashanti region of southern Ghana, – Iduapriemapproximately 60km south of Kumasi. Mining was temporarily suspended at the end of 2014 while a series of economic studies progressed. Obuasi underground development restarted in the first half of 2019, with the first gold produced in December 2019. The ramp-up of the redevelopment project was delayed by the temporary stoppage of underground activities after a fall of ground incident in May 2021. Production remained suspended for several months to allow for reviews and investigations, but slowly resumed in the latter part of 2021.
OBUASI
For additional information, refer to the Technical Report Summary for Obuasi (effective date: 31 December 2021) filed as Exhibit 19.15.5 hereto.
Property description
Obuasi is wholly-owned by AngloGold Ashanti and is a production stage property. All required mineral rights to the property are held by the Company. The mine is an underground operation, and it has been in operation since 1897 (more than 120 years). It has been operated by AngloGold Ashanti since 2004.
Location
The mine is in the municipality of Obuasi, in the Ashanti region of Ghana, about 240km northwest of the capital, Accra, and 60km south of Kumasi.
Mineralisation style
Geologically, Obuasi is in the Ashanti belt on the eastern margin of the Pre-Cambrian West African craton. This craton consists of Lower Proterozoic volcanic and flysch sediments which make up the Birimian system, overlain in part by the molasse sediments of the Middle Proterozoic Tarkwaian. The Ashanti belt is the most prominent of the five Birimian Supergroup gold belts found in Ghana.
Gold mineralisation is associated with shear zones and pervasive silica, carbonate and sulphide hydrothermal alteration which occur in tightly folded Lower Birimian schists, phyllites, meta-greywackes, and tuffs, along the eastern limb of the Kumasi anticlinorium. They are found near the contact with harder metamorphosed and metasomatically altered intermediate to basic upper Birimian volcanics. There are two broad styles of gold mineralisation including free milling quartz vein gold and sulphide-rich, disseminated and refractory gold which form alteration haloes around the quartz vein lodes. Sulphide mineralisation is dominated by arsenopyrite and quartz mineralisation, which is associated with spatially variable, but exceptionally high-grade visible gold in quartz veins.
History
Obuasi has a long mining history dating back to 1897. It has been owned and operated by various operators during this time. The current operator became involved in 2004 following the merger of former AngloGold Limited of South Africa and the Ashanti Goldfields Company Limited of Ghana. However, for several years leading up to 2014, the mine began to struggle due to ailing infrastructure and outdated methodologies. The company realised that significant rationalisation and/or replacement of current infrastructure would be necessary to enable the delivery of better utilisation and productivity metrics.
In 2014, a feasibility study commenced that considered the optimum mining methodology and schedules for the underground mine, based on modern mechanised mining methods and refurbishment of underground, surface and process plant infrastructure. During this time, Obuasi operated in a limited operating phase with underground activities essentially restricted to the continued development of the Obuasi deeps decline and underground infill drilling. The limited operating phase was brought to a halt after an incursion by illegal miners on Obuasi's concession in February 2016, at which point the mine was placed under care and maintenance. However, the study continued and in 2017, a favourable feasibility study was completed and indicated a strong technical and economic case with an anticipated 20-year life of mine ("LOM"). In 2018, approval was received from the AngloGold Ashanti board and the government of Ghana to proceed with the project.
The redevelopment project began in late 2018 and first gold was poured during the fourth quarter of 2019. Phase 1 of the redevelopment project was completed by the end of September 2007,2020, and the mine began commercial production on 1 October 2020. Phase 2 of the redevelopment project, which focused on construction and mine development, was completed in 2021. Phase 3 of the redevelopment project is situatedcurrently underway to develop the infrastructure necessary to support the planned ramp-up in production.
104
Legal aspects and tenure
Refer to “Item 4B: Business Overview—The Regulatory Environment Enabling AngloGold Ashanti to Mine—Africa Region—Ghana—AngloGold Ashanti’s rights and permits”.
Mining method
Obuasi is an underground operation, utilising both vertical shafts and declines as main access routes to the underground workings. The mine has seen extensive historical mining activities with varying applications of different mining methods to date. The current LOM design employs mostly the Long Hole Open Stoping ("LHOS") mining method for ore extraction. LHOS is a highly selective and productive method of mining that can be employed for orebodies of varying thicknesses and dips. The main distinct variations of the LHOS used at Obuasi are longitudinal retreat stoping (“LRS”), and transverse open stoping (“TOS”). The blind upper stoping is a form of LRS or TOS used for partial sill pillar recovery.
Processing plants and other available facilities
All significant surface activities, including ore processing, environmental management and community engagement are carried out by Obuasi staff. Existing infrastructure includes a recently refurbished and upgraded 2.2Mtpa processing plant with flotation and bacterial oxidation ("BIOX"), extensive underground development, hoisting shafts and associated infrastructure, mine ventilation and refrigeration facilities, emergency standby power and water reticulation, office complexes, workshops, and company housing estates. Power is supplied to the mine by the Volta River Authority and Ghana Grid Company Limited (“GRIDCo”). There is a focus mine development plan supported by the existing infrastructure, and ongoing upgrades of critical underground infrastructure to sustain the operations. The mine can be accessed by paved road network from Kumasi and by road or chartered air transport from the capital, Accra. For the number of persons employed at the mine, refer to “Item 4B: Business Overview—Operating Performance—Africa Region”.
The “Property, Plant, and Equipment” as of 31 December 2022, including buildings and mine infrastructure, mining assets, decommissioning assets and assets under construction, had a carrying value of $1,009 million.
Mineral processing
The plant is configured for both conventional and flash flotation and BIOX treatment which is required for the refractory sulphide ore. The gravity gold recovery system is also integrated with Knelson concentrators and inline leach reactors.
Mineral Resource
Refer to the below table, prepared in accordance with Table 1 to Paragraph (D)(1) of Item 1304 of Regulation S-K, which summarises the gold Mineral Resource (exclusive of Mineral Reserve) for Obuasi at the end of the fiscal year ended 31 December 2022, based on a gold price estimate of $1,750/oz for underground and $1,600 for open pit Mineral Resource. Refer to “—Material Assumptions for the Mineral Resource—Key Parameters” for additional information on cut-off grades and metallurgical recovery.
| Mineral Resource | Category | Tonnes | Grade | Contained Gold | |||||||||||||
| as at 31 December 2022 | million | g/t | tonnes | Moz | |||||||||||||
| Obuasi | Measured | 1.96 | 8.44 | 16.59 | 0.53 | ||||||||||||
| Indicated | 27.66 | 6.06 | 167.59 | 5.39 | |||||||||||||
| Measured & Indicated | 29.63 | 6.22 | 184.18 | 5.92 | |||||||||||||
| Inferred | 39.80 | 8.50 | 338.17 | 10.87 | |||||||||||||
Notes:
Rounding of numbers may result in computational discrepancies in the Mineral Resource tabulations. The Mineral Resource estimates with respect to our material properties have been prepared by the Qualified Persons (employed by AngloGold Ashanti unless stated otherwise). The net difference between the Mineral Resource at the end of the last completed fiscal year and the preceding fiscal year is detailed in the table below. To reflect that figures are not precise calculations and that there is uncertainty in their estimation, AngloGold Ashanti reports tonnage, grade and content for gold to two decimals. All ounces are Troy ounces. “Moz” refers to million ounces.
1.All disclosure of Mineral Resource is exclusive of Mineral Reserve. The Mineral Resource exclusive of Mineral Reserve (“Exclusive Mineral Resource”) is defined as the inclusive Mineral Resource less the Mineral Reserve before dilution and other factors are applied.
2.“Tonnes” refers to a metric tonne which is equivalent to 1,000 kilograms.
3.Property currently in a production stage.
4.Refer to “—Material Assumptions for the Mineral Resource—Key Parameters” for additional information on cut-off grades and metallurgical recovery.
5.Open pit based on a gold price of $1,600/oz, underground based on a gold price of $1,750/oz.
105
Year on year changes in Mineral Resource - Moz
| as at 31 December 2022 | Obuasi | |||||||||||||
| Category | Measured | Indicated | Measured and Indicated total | Inferred | ||||||||||
| Previous Year | 0.66 | 5.84 | 6.50 | 12.05 | ||||||||||
| Depletion | — | — | — | — | ||||||||||
| Exploration | — | — | — | (0.06) | ||||||||||
| Methodology | 0.02 | 0.28 | 0.30 | (0.53) | ||||||||||
| Price | 0.02 | 0.58 | 0.60 | 1.11 | ||||||||||
| Cost | (0.17) | (0.97) | (1.14) | (1.31) | ||||||||||
| Geotechnical | — | — | — | — | ||||||||||
| Metallurgical | — | — | — | — | ||||||||||
| Acquisition / Disposal | — | — | — | — | ||||||||||
| Other | — | (0.33) | (0.33) | (0.37) | ||||||||||
| Current Year | 0.53 | 5.39 | 5.92 | 10.87 | ||||||||||
| Net Difference | (0.12) | (0.45) | (0.57) | (1.17) | ||||||||||
| % Difference | (19) | (8) | (9) | (10) | ||||||||||
Notes:
All figures are expressed on an attributable basis unless otherwise indicated.
The decrease in Mineral Resource is mainly due to depletion attributed to mining from Sansu, and Blocks 8 and 10 and an increase in costs which resulted in higher cut-off grades as well as the sterilisation of stopes in the depletion process. The decrease was partially offset by model changes primarily from the inclusion of new drilling data from ongoing operational drilling activities and the increase in Mineral Resource price.
Material Assumptions for the Mineral Resource
Key Parameters
| Obuasi | Unit | Underground | ||||||
| Costs | ||||||||
| Mining cost | $/tonne mined | 64.26-79.44(1) | ||||||
| Processing cost | $/tonne treated | 42.57 | ||||||
| G&A | $/tonne treated | 21.96 | ||||||
| Other Parameters | ||||||||
| Royalties | % | 3.0 | ||||||
MSO(2) optimising cut-off | g/t | 3.43-3.75(1) | ||||||
| Mineral Resource cut-off grade | g/t | 3.43-3.75(1) | ||||||
| Mineral Resource price | $/oz | 1,600-1,750(3)(4) | ||||||
| Metallurgical Recovery Factor | %MetRF | 87 | ||||||
Notes: (1) Vary according to area. (2) Datamine Mineable Shape Optimiser ("MSO"). (3) Open pit based on a gold price of $1,600/oz, Underground based on a gold price of $1,750/oz. (4) AngloGold Ashanti has determined that there is no material change to the Mineral Resource reported in the 2021 Technical Report Summary for Obuasi (effective date: 31 December 2021) filed as Exhibit 19.15.5 hereto if this updated gold price is used (instead of $1,500, the gold price used to estimate the Mineral Resource in 2021). | ||||||||
Estimation
The estimation technique is ordinary kriging and the primary estimation unit size is 20m x 5m x 15m. This estimation unit size is representative of the underground mining units and is considered appropriate given the style of mineralisation and mining methods. Compositing by length is employed and the influence of extreme grades is restricted by grade capping. Sample spacing is highly variable across the deposit and ranges from 10m x 10m (for grade control areas) up to 200m x 200m (for exploration targets). However, for the Mineral Resource, the maximum extrapolation from data points is 100m. Any areas beyond this are not classified and are considered to be upside potential rather than Mineral Resource.
106
Mineral Reserve
Refer to the below table, prepared in accordance with Table 2 to Paragraph D(1) of Item 1304 ofRegulation S-K, which summarises the gold Mineral Reserve for Obuasi at the end of the fiscal year ended 31 December 2022, based on a gold price estimate of $1,400/oz. Refer to “—Material Assumptions for the Mineral Reserve—Modifying factors and price estimates” for additional information on cut-off grades and metallurgical recovery.
| Mineral Reserve | Category | Tonnes | Grade | Contained Gold | |||||||||||||
| as at 31 December 2022 | million | g/t | tonnes | Moz | |||||||||||||
| Obuasi | Proven | 4.47 | 9.55 | 42.73 | 1.37 | ||||||||||||
| Probable | 21.25 | 9.26 | 196.67 | 6.32 | |||||||||||||
| Total | 25.72 | 9.31 | 239.40 | 7.70 | |||||||||||||
Notes:
1.Rounding of numbers may result in computational discrepancies in the Mineral Reserve tabulations. The Mineral Reserve estimates with respect to our material properties have been prepared by the Qualified Persons (employed by AngloGold Ashanti unless stated otherwise). The net difference between the Mineral Reserve at the end of the last completed fiscal year and the preceding fiscal year is detailed in the table below. To reflect that figures are not precise calculations and that there is uncertainty in their estimation, AngloGold Ashanti reports tonnage, grade and content for gold to two decimals. All ounces are Troy ounces. “Moz” refers to million ounces.
2.“Tonnes” refers to a metric tonne which is equivalent to 1,000 kilograms.
3.Property currently in a production stage.
4.Refer to “—Material Assumptions for the Mineral Reserve—Modifying factors and price estimates” for additional information on cut-off grades and metallurgical recovery.
5.Based on a gold price of $1,400/oz.
Year on year changes in Mineral Reserve - Moz
| as at 31 December 2022 | Obuasi | ||||||||||
| Category | Proven | Probable | Total | ||||||||
| Previous Year | 1.19 | 7.08 | 8.26 | ||||||||
| Depletion | (0.23) | — | (0.23) | ||||||||
| Exploration | — | (0.77) | (0.77) | ||||||||
| Methodology | 0.54 | — | 0.54 | ||||||||
| Price | 0.11 | 1.49 | 1.60 | ||||||||
| Cost | (0.23) | (1.48) | (1.71) | ||||||||
| Geotechnical | — | — | — | ||||||||
| Metallurgical | — | — | — | ||||||||
| Operational | — | — | — | ||||||||
| Other | — | — | — | ||||||||
| Acquisition / Disposal | — | — | — | ||||||||
| Current Year | 1.37 | 6.32 | 7.70 | ||||||||
| Net Difference | 0.19 | (0.75) | (0.57) | ||||||||
| % Difference | 16 | (11) | (7) | ||||||||
Notes:
All figures are expressed on an attributable basis unless otherwise indicated.
The key changes were primarily associated with depletion, exploration, block model changes, and economic parameters. Depletion was mainly due to mining, while exploration changes were as a result of Mineral Resource drilling. This was offset by changes in the block model methodology involving estimation parameters, interpretations, classification and density. The economic factors that also influenced the changes to the Obuasi Mineral Reserve included an increased gold price assumption which was partially offset by an increase in mining cost and sustaining capital.
Material Assumptions for the Mineral Reserve
Modifying factors and price estimates
| as at 31 December 2022 | Obuasi | |||||||
| Primary Commodity Price | $/oz | 1400(1) | ||||||
| Cut-off grade | g/t | 4.29-4.69(2) | ||||||
107
| as at 31 December 2022 | Obuasi | |||||||
| Dilution | % | 12-17(2) | ||||||
| Mining Recovery Factor | %MRF based on tonnes | 95-98(2) | ||||||
| Mining Recovery Factor | %MRF based on g/t | 100 | ||||||
| Mine Call Factor | %MCF | 100 | ||||||
| Metallurgical Recovery Factor | %MetRF | 87 | ||||||
Notes: (1) AngloGold Ashanti has determined that there is no material change to the Mineral Reserve reported in the 2021 Technical Report Summary for Obuasi (effective date: 31 December 2021) filed as Exhibit 19.15.5 hereto if this updated gold price is used (instead of $1,200, the gold price used to estimate the Mineral Reserve in 2021). (2) Vary according to area. | ||||||||
Estimation
The Mineral Reserve estimation considers mining criteria for the economic cut-off grade and minimum mining width for the anticipated mining method. All design and scheduling work is undertaken to an applicable level of detail by mine planning engineers in consultation with other technical specialists using Datamine Studio UGTM and Enhanced Production SchedulerTM ("EPS") software.
The cut-off grade parameters used include projected mining, processing, and general and administrative costs. A Mineral Reserve gold price of $1,400/oz was used. The cut-off grade also considers the metallurgical recovery factor (87 percent applied for all blocks), mining dilution and recovery, tonne-kilometre haulage cost from all blocks, as well as the backfill type.
Stopes are designed using the Datamine Mineable Shape Optimiser ("MSO") Software where the outputs are further optimised by manual edits. The stope shapes are generated at section intervals of 15m to 20m based on geotechnical guidance for each block. The MSO allows the class field to be assigned to each stope generated. The mine design is reviewed taking into consideration the updated stope shapes, existing development and future infrastructure need. A LOM plan is generated which considers fleet and infrastructure capacities. All mining blocks are designed for the LHOS mining method. The Mineral Reserve is reported from the LOM plan and only includes Measured and Indicated Mineral Resource.
Map showing Obuasi planned infrastructure and licences
Below is a map that shows the location, infrastructure and mining licence area for Obuasi. The coordinates of the mine, as represented by the plant, are depicted on the map and are in the geographic coordinate system.
108
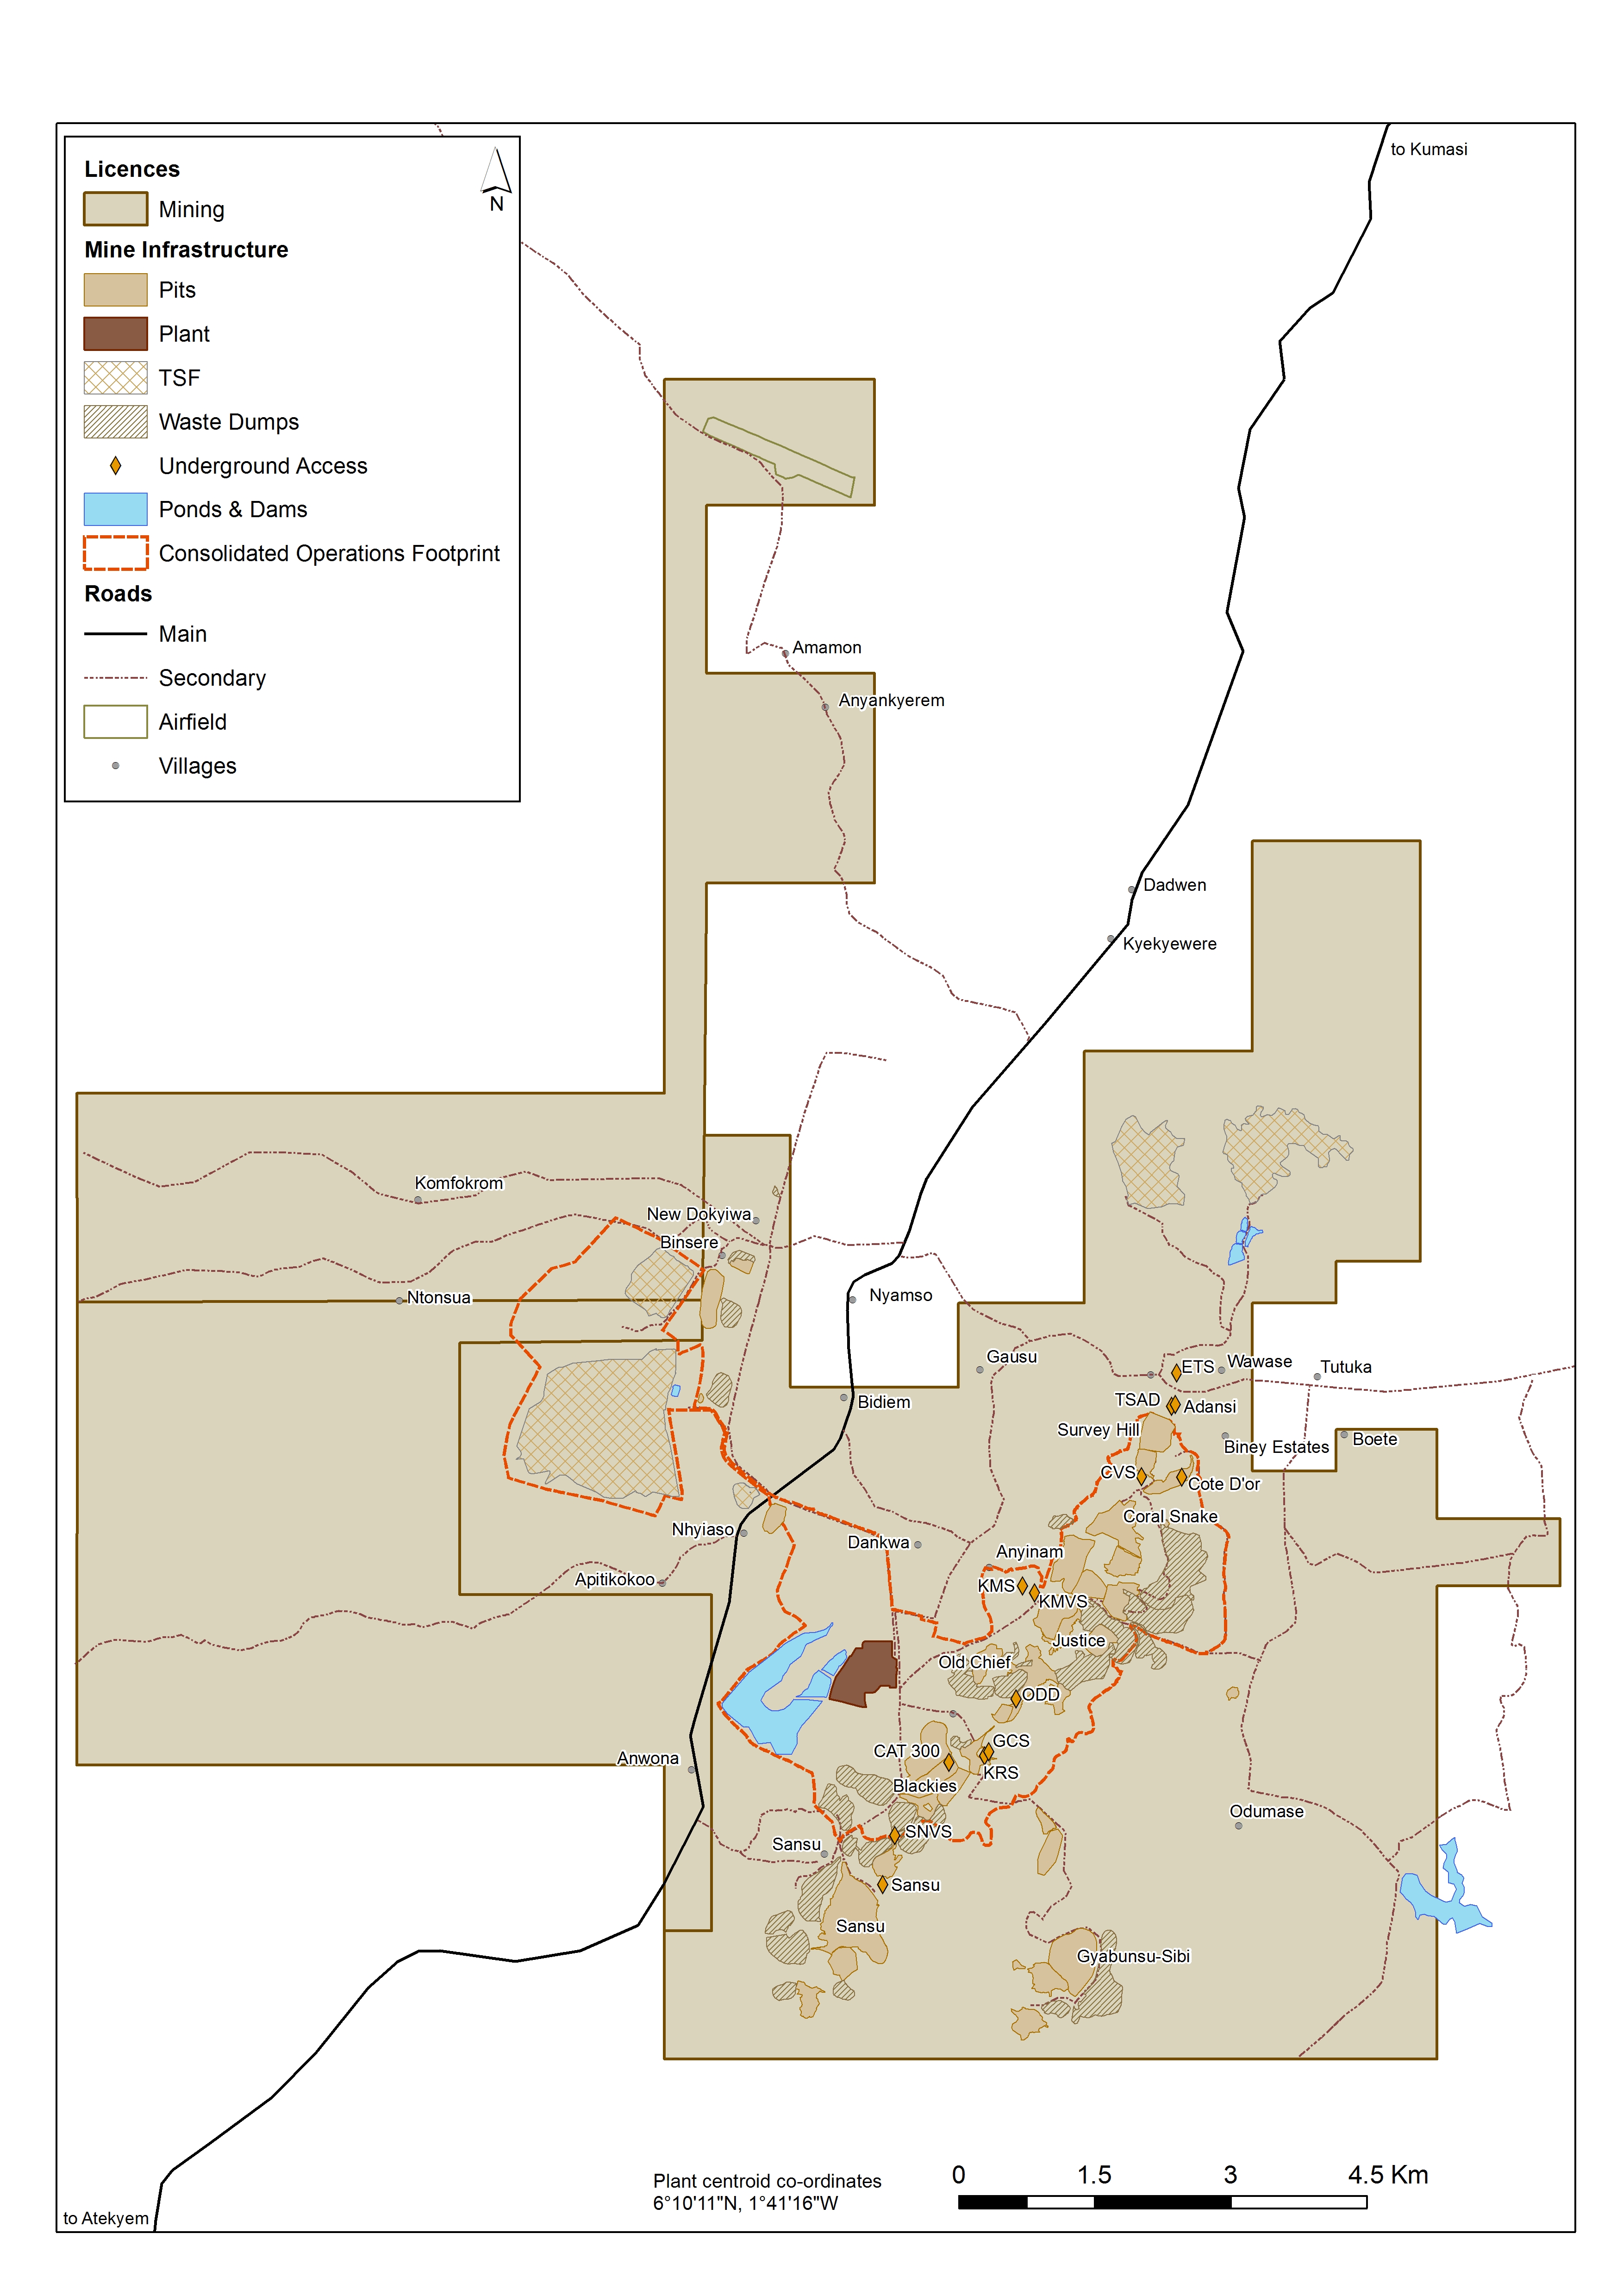
109
IDUAPRIEM
Property description
Iduapriem mine is wholly-owned and operated by AngloGold Ashanti and a production stage property. The mine is a multiple open pit operation that currently sources ore from the Block 3W, Block 5, Ajopa, and Blocks 7 and 8 pits.
Location
The mine is located in the western region of Ghana, some 70km north of the coastal city of Takoradi and approximately 10km southwest of the town of Tarkwa. The Iduapriem mine is bordered to the north by Gold Fields Ghana Limited (Tarkwa Mine) and to the east by the Ghana Manganese Company Limited (a manganese mine in existence since the 1920s).
There are four recognised conglomerate reefs namely A, B, C and D, which are equivalent to the Tarkwaian Sub-basal, Basal (or Main), Middle (or West), and Breccia Reefs, respectively. The B and C Reefs are oligomictic and consist of well-sorted conglomerates and have been mined underground in some areas more than a century ago. The A and D Reefs have a lower gold tenor and are polymictic, containing both well-rounded and angular fragments. Gold is found within the matrix that binds the pebbles together. The gold content is a multiple open pitfunction of the size and amount (packing) of quartz pebbles present within a conglomeratic unit. The gold is fine-grained, particulate and free-milling.
Legal aspects and tenure
Refer to “Item 4B: Business Overview—The Regulatory Environment Enabling AngloGold Ashanti to Mine—Africa Region—Ghana—AngloGold Ashanti’s rights and permits”.
Processing plants and other available facilities
Surface infrastructure associated with Iduapriem’s operation that currently sources ore fromincludes a primary crusher, overland conveyor, CIL processing plant next to the Ajopamain office building, a TSF and Block 7four camp areas for contractors and 8 pits. The Iduapriem treatment plant has two semi-autogenous grinding mills and two ball mills which run in two parallel circuits, each with a semi-autogenous grinding mill and a ball mill. The carbon-in-pulp plant has a capacity of 5.1Mtpa.company employees. Tarkwa town is also adjacent to the tenement. Power is supplied to the mine by the Volta River Authority (VRA) and GRIDCo.
Mineral processing
The current processing plant treats free-milling material from open pit mining, by a conventional crush with a semi-autogenous ball milling circuit and cyanide leach. Iduapriem comprisesoperates a two-stage crushing circuit consisting of a Metso Superior MKIII primary gyratory crusher and two GP550 gyratory crushers for secondary crushing. The Iduapriem treatment plant has two semi-autogenous grinding mills ("SAG mills") and two ball mills which run in two parallel circuits,each with a SAG mill and a ball mill. The second ball mill, a new thickener, a cluster of cyclones and a Knelson concentrator were commissioned in March 2009. In July 2017, three of the Iduapriem, Ajopa, Ajopa Southfour leach tanks were converted into CIL tanks by introducing carbon into the each of the tanks with the installation of inter-tank screens and Teberebie mining leases on a 139.67km2 concession. The renewalcarbon recovery screens. Carbon for elution is harvested from one of all four mining leases has been obtainedthe leach tanks to the acid wash column, and these leases are valid until February 2035.the carbon recovery screen underflow is pumped back to the leach tanks.
Guinea (15 percent). The gold deposits at Obuasi are part ofmine is a prominent gold belt of Proterozoic (Birimian) volcano-sedimentary and igneous formations which extend for a distance of approximately 300 kilometres in a north-east/south-west trend in southwestern Ghana. Obuasi mineralisation is shear-zone related and there are three main structural trends hosting gold mineralisation: the Obuasi trend, the Gyabunsu trend and the Binsere trend.
Siguiri Gold Mine is 85 percent owned anda production stage property, operated by AngloGold AshantiAshanti. Gold-bearing ore is mined from several pits (generally three pits at any one time). Mining occurs primarily in Kami and 15 percent byBidini pits in Block 1, as well as Saraya pit in Block 2. The pre-feasibility study level of work on the government of Guinea. geotechnical design for Sanutinti pit is ongoing.
Location
Siguiri is located approximately 850 kilometres850km north-northeast of Conakry, 25 kilometres25km northwest of the town of Siguiri and 220 kilometres southwest220km southeast of the Malian capital Bamako, near the Malian border.
110
Mineralisation style
Siguiri is currently a multi-pit fresh rock and oxide gold mining operation, operated by a contract miner. Processingsituated in the northern part of the Siguiri Basin of Guinea, and is underlain by Lower Proterozoic rocks of the Birimian metasedimentary and volcano-sedimentary formations. Primary gold mineralisation occurs in all three lithostratigraphic units of the Siguiri region, although most of the known mineralisation is found in the central and more competent Fatoya Formation. In some deposits, the mineralisation shows strong lithological control and is preferentially developed in coarser-grained units with higher fracture or vein densities than fine-grained rocks. Mineralised veins are more intensely developed along major structural trends, with quartz-carbonate-sulphide veining developed along structures. Some of these structures have developed as incipient faults and are represented by discrete stockworks of mineralised quartz-carbonate veins occurring along a trend instead of clearly defined continuous structures.
Legal aspects and tenure
Refer to “Item 4B: Business Overview—The Regulatory Environment Enabling AngloGold Ashanti to Mine—Africa Region—Guinea—AngloGold Ashanti’s rights and permits”.
Processing plants and other available facilities
Siguiri includes a processing plant, a TSF, and other infrastructure such as a mine village, a water supply system, roads, power supply by on-site generators and communications systems. Additional infrastructure includes on-site offices, accommodation and workshops to support remote mining. Power to the mine is self-generated using heavy fuel oil.
The town of Siguiri can be accessed via a small airfield and a well-paved road that connects Siguiri to Bamako in the north and Kouroussa in the south. Access to the mine via roads and to Siguiri is easily passable through most of the year, although some secondary roads are seasonal with limited access during the wet season. While Siguiri encounters encroachment of villages onto, and artisanal and small-scale mining invasion in, its mining areas as well as increasing community demands and expectations, mitigation plans are in place to significantly reduce the impact of these issues.
Mineral processing
The mined ore is done byprocessed using a hybrid carbon-in-leach (CIL)CIL circuit processing plant converted from carbon-in-pulp (CIP) in 2018. The plant is capable of treating 50%and can treat 50 percent hard ore post the commissioningpost-commissioning of a new ball mill and 3 stagethree-stage crushing plant in 2019. Unit operations include comminution, leaching, carbon adsorption and desorption, smelting and tailings disposal. Further modification of three leach tanks to CIL tanks was carried out in the firstfourth quarter of 2019. Power for2020, giving a total of seven tanks in the hybrid circuit. The combination plant treats up to 50 percent fresh rock and 50 percent soft ore, with a total throughput of 11.4Mt per annum. The recovery of Bidini, which has been impacted by the presence of carbonaceous ore and the performance of the combination plant to achieve the required mill throughput and recovery, could have an impact on the economic extraction of the estimated Mineral Resource and Mineral Reserve until the plant stabilises. There are mitigation plans in place to address any TSF capacity issues and the mine is self-generated.
TANZANIA
GEITA
For additional information, see the Technical Report Summary for Geita Gold Mine is wholly owned by AngloGold Ashanti and is AngloGold Ashanti's sole operation in Tanzania.(effective date: 31 December 2022) filed as Exhibit 19.15.4 hereto.
GGM is wholly-owned and operated by AngloGold Ashanti. GGM currently has three underground mines (Star and Comet, Nyankanga and Geita Hill) and one open pit (Nyamulilima Cuts 1, 2 and 3) which is in production since 2021. The property is currently in a production stage.
Location
GGM is located approximately 1,200km from the main Tanzanian commercial citybusiness centre of Dar es Salaam. It has beenfalls within the Lake Zone of northwestern Tanzania, approximately 120km west of Mwanza and 4km west of the town of Geita. The mining lease area falls within the Archaean Sukumaland Greenstone Belt of the Lake Victoria goldfields.
111
Mineralisation style
Geita is hosted in the Geita Greenstone Belt, which is a northern segment of the Sukumaland Greenstone Belt, located in the north-western part of the Tanzania Craton and south of Lake Victoria. Gold mineralisation occurred late in the tectonic history of the greenstone belt, synchronous with the development of brittle-ductile shear zones. Mineralisation is dominantly sulfide replacement of magnetite-rich layers in ironstone, with local replacement of ferromagnesian phases and magnetite in the diorite intrusions. Primary gold mineralisation is associated with the intersection of the brittle-ductile shear zones and pre-existing fold hinges, with higher grade concentrations associated with banded iron formation lithologies and with diorite dyke and sill contacts.
History
Gold mineralisation is reported to be first discovered in the Geita district in 1898 by a German prospector. A regional survey by a Kenyan company, Saragura Prospecting Syndicate, followed in 1930. The first mine was developed in 1934, and between 1936 and 1966, Geita was the largest gold mine in East Africa, producing 1Moz of gold from underground operations.
In 1996, Ashanti Goldfields Company Limited acquired the Geita tenure through the acquisition of Cluff Resources, and acquired the Kukuluma and Matandani in 1998 from Samax Resources Limited. In December 2000, Ashanti Goldfields Company Limited reached an agreement to sell a 50 percent interest in Geita to AngloGold Limited for $324 million. AngloGold Limited added its neighbouring Nyamulilima Hill deposits into the JV company. In 2004, the merger of AngloGold Limited and Ashanti Goldfields Company Limited resulted in the operation since 1996.being wholly run by the combined company AngloGold Ashanti.
GGM commenced open pit mining in 1999, with open pit mining at Nyankanga between 1999 and 2020, at Geita Hill between 2001 and 2019, at Kukuluma and Matandani between 2002 and 2007, and at Star and Comet between 2007 and 2014. In 2015, a decision was taken to go underground at Star and Comet, and the underground development started in 2016. In 2017, the Nyankanga underground operation commenced and in 2020 the Geita Hill underground commenced and is scheduled to ramp up to full production by the end of 2023.
The Nyankanga open pit, the only remaining operating pit at the time, was mined to completion in September 2020. In April 2021, the Nyamulilima open pit commenced operations.
Legal aspects and tenure
Refer to “Item 4B: Business Overview—The Regulatory Environment Enabling AngloGold Ashanti to Mine—Africa Region—Tanzania—AngloGold Ashanti’s rights and permits”.
Mining method
Mining at Geita is byuses both open pit and underground mining methods. Historically, other pits such as Star and Comet, Matandani and Kukuluma have contributed to the ore feed. Current sources of ore are from the NyankangaThe Nyamulilima open pit mine stockpile (wherecommenced production in April 2021 and reached full production during 2022. Open pit mining ended in September 2020)is by conventional truck and Starshovel methods, where production mining equipment is operated by GGM with Capital Mining Services Tanzania Limited providing production and Cometgrade control drilling services, and Nyankanga underground mines. In 2016, undergroundOrica providing blasting and explosives services. Underground mining commenced at Star and Comet in 2016 and subsequently at Nyankanga in 2017, and most recently Geita Hill in 2020. Star and Comet underground has successfully transitioned to provide oreowner mining and the mining contractor African Underground Mining Services is used at Nyankanga and Geita Hill for underground development and stoping. The underground mining method is a combination of LOS and TOS. Cemented aggregate fill backfill is used at Nyankanga to fill the primary stopes and allows for the mining of secondary stopes. Ore is hauled from the Nyamulilima open pit (22km) and from Star and Comet (17km), Nyankanga (4km) and Geita Hill (2km) underground operations to the processing plant. This was joined in 2017central run-of-mine ("ROM") pad by the Nyankanga underground operations. The Geita Gold Mine is currently serviced by an average ofsurface mining fleet.
Processing plants and other available facilities
Surface infrastructure associated with the overall Geita operation includes a 5.2Mtpa CIL processing plant.plant, a TSF, a camp, an airstrip, open pit and underground workshops and offices, contractor yards, backfill plants and explosives suppliers. Power to the mine is self-generated at Geita's 40MW power plant using diesel generators, however, there is planned construction of a 33kV hydropower station by Tanzania Electric Supply Company Limited ("TANESCO"). The physical condition of the equipment, facilities, and infrastructure at GGM is generally considered to be in good working order. The mine has invested heavily in maintaining and upgrading its assets to ensure they remain reliable and efficient. The underground development of the mine has also been extensively developed, with the construction of a number of portals, declines and strategically placed development drives that access and further explore the gold-bearing ore. Overall, the GGM is a well-established operation implementing fit-for-purpose technologies once proven in the market. For the number of persons employed at the mine, refer to “Item 4B: Business Overview—Operating Performance—Africa Region”.
112
The “Property, Plant, and Equipment” as of 31 December 2022, including lease assets, buildings and mine infrastructure, mining assets, capitalised exploration costs, decommissioning assets, assets under construction and deferred stripping, had a carrying value of $418m.
Mineral processing
Geita’s ore processing method is a conventional CIL process with a throughput capacity of 5.2Mtpa. The circuit contains a primary gyratory crusher, secondary and tertiary crushers, a semi-autogenousSAG mill, a ball mill and 12 leach tanks. This is coupled with a gravity circuit using two knelsonKnelson concentrators. In planning the plant feed blend material, hardness grade, oxide and sulphide content are considered in order to optimise throughput and recovery. Power to the mine is self-generated.
Mineral Resource
The special mining licence (SML45/99) covers approximately 196.17km2 and expires on 26 August 2024. There are a further 120km2below table, prepared in accordance with Table 1 to Paragraph (D)(1) of prospecting licences inItem 1304 of Regulation S-K, summarises the immediate vicinity togold Mineral Resource (exclusive of Mineral Reserve) for Geita at the special mining licence which do not contain any Ore Reserve. In March 2020, Geita Gold Mining Limited received the consentend of the Ministerfiscal year ended 31 December 2022, based on a gold price estimate of Minerals$1,750/oz. Refer to change “—Material Assumptions for the mining method under its special mining license from open pit to underground method, subject to the requisite termsMineral Resource—Key Parameters” for additional information on cut-off grades and conditions.metallurgical recovery.
| Mineral Resource | Category | Tonnes | Grade | Contained Gold | |||||||||||||
| as at 31 December 2022 | million | g/t | tonnes | Moz | |||||||||||||
| Geita | Measured | 1.80 | 4.15 | 7.50 | 0.24 | ||||||||||||
| Indicated | 40.32 | 2.03 | 81.96 | 2.63 | |||||||||||||
| Measured & Indicated | 42.12 | 2.12 | 89.45 | 2.88 | |||||||||||||
| Inferred | 36.21 | 2.64 | 95.71 | 3.08 | |||||||||||||
Notes:
Rounding of numbers may result in computational discrepancies in the Mineral Resource tabulations. The Mineral Resource estimates with respect to our material properties have been prepared by the Qualified Persons (employed by AngloGold Ashanti unless stated otherwise). The net difference between the Mineral Resource at the end of the last completed fiscal year and the preceding fiscal year is detailed in the table below. To reflect that figures are not precise calculations and that there is uncertainty in their estimation, AngloGold Ashanti reports tonnage, grade and content for gold to two decimals. All ounces are Troy ounces. “Moz” refers to million ounces.
1.All disclosure of Mineral Resource is exclusive of Mineral Reserve. The Mineral Resource exclusive of Mineral Reserve (“Exclusive Mineral Resource”) is defined as the inclusive Mineral Resource less the Mineral Reserve before dilution and other factors are applied.
2.“Tonnes” refers to a metric tonne which is equivalent to 1,000 kilograms.
3.Property currently in a production stage.
4.Refer to “—Material Assumptions for the Mineral Resource—Key Parameters” for additional information on cut-off grades and metallurgical recovery.
5.Based on a gold price of $1,750/oz.
Year on year changes in Mineral Resource - Moz
| as at 31 December 2022 | Geita | |||||||||||||
| Category | Measured | Indicated | Measured and Indicated total | Inferred | ||||||||||
| Previous Year | 0.21 | 1.87 | 2.08 | 3.26 | ||||||||||
| Depletion | — | — | — | — | ||||||||||
| Exploration | 0.02 | 0.09 | 0.11 | 0.12 | ||||||||||
| Methodology | 0.03 | 0.49 | 0.52 | (0.57) | ||||||||||
| Price | 0.01 | 0.17 | 0.18 | 0.19 | ||||||||||
| Cost | (0.03) | 0.19 | 0.16 | 0.07 | ||||||||||
| Geotechnical | — | — | — | — | ||||||||||
| Metallurgical | — | 0.02 | 0.02 | 0.02 | ||||||||||
| Acquisition / Disposal | — | — | — | — | ||||||||||
| Other | — | (0.20) | (0.20) | — | ||||||||||
| Current Year | 0.24 | 2.63 | 2.88 | 3.08 | ||||||||||
| Net Difference | 0.03 | 0.77 | 0.80 | (0.18) | ||||||||||
| % Difference | 16 | 41 | 38 | (6) | ||||||||||
Notes:
All figures are expressed on an attributable basis unless otherwise indicated.
The terrainincrease is Archaeanlargely as a result of exploration success due to accelerated drilling activities because of the planned reinvestment, and changes in agemethodology were as a result of revised estimation parameters, and generally characterised by greenschist metamorphism, although amphibolitic metamorphism occursrefined ore wireframes. The increase in places. Ore zones are usually associated with Banded Iron Formation (BIF) or other iron rich rocksthe Mineral Resource price and typically when they arefavourable cost reductions in contact with intrusive rocks such as diorites. These contacts have been deformed and act as fluid pathways for the mineralising fluids. Gold mineralisation is associated with alteration that includes sulphides such as pyrite and arsenopyrite, whilst other minerals such as hematite, magnetite, quartz, calcite, dolomite, biotite and chlorite also occur.open pit haulage, general
and administrative expenses and new underground contract rates led to lower cut-off grades resulting in additional Mineral Resource, which was partially offset by depletion.
Material Assumptions for the Mineral Resource
Key Parameters
| Geita | Unit | Open Pit | ||||||
| Costs | ||||||||
| Ore mining cost | $/tonne mined | 3.3 | ||||||
| Waste mining cost | $/tonne mined | 3.3 | ||||||
| Material handling | $/tonne mined | 2.03 | ||||||
| Processing cost | $/tonne treated | 18.63 | ||||||
| G&A | $/tonne treated | 8.43 | ||||||
| Other Parameters | ||||||||
| Metallurgical Recovery Factor | %MetRF | 89 | ||||||
| Slope angles | degree | 55 | ||||||
| Mineral Resource cut-off grade | g/t | 0.65 | ||||||
| Mineral Resource price | $/oz | 1,750 | ||||||
| Royalties | % | 7.3 | ||||||
| Geita | Unit | Underground | ||||||
| Costs | ||||||||
| Production (Mining cost) | $/tonne ore mined | 47.68-82.88(1) | ||||||
| Mine Services | $/tonne ore mined | 21.97-25.78(1) | ||||||
| Processing cost | $/tonne treated | 18.46-19.11(2) | ||||||
| Other Parameters | ||||||||
| Mineral Resource cut-off grade | g/t | 1.86-3.01(2) | ||||||
| Mineral Resource price | $/oz | 1,750 | ||||||
| Metallurgical Recovery Factor | %MetRF | 70.4-91.4(1) | ||||||
| Royalties | % | 7.3 | ||||||
Notes: (1) Mining cost includes backfilling at Nyankanga, and material handling costs. (2) Variable according to area. (3) %MetRF: Ridge 8, 70.4%, Star and Comet Cut 5, 80.4%, Star and Comet Cut 2, 88.3%, Star and Comet Cut 3, 88.4%, Geita Hill 87.2%, Nyankanga Block 5, 89.8%, Nyankanga Block 1, 2, 3 and 4, 91.4%. (4) Datamine Mineable Shape Optimiser ("MSO"). | ||||||||
Estimation
For the open pits, mineralisation boundaries for the individual deposits are defined from detailed logging of all geological drill holes. This information is validated and then geological wireframes are interpreted to create a 3D geological model. The Americas includes mining operationsgeological model is subsequently used in two countries, Brazilconjunction with an appropriately dimensioned block model. Ordinary kriging is used to interpolate values into block models, and Argentina, advanced greenfields projects in Colombiauniform conditioning ("UC") and exploration activitieslocalised uniform conditioning ("LUC") methods are used to generate a recoverable Mineral Resource block model, which estimates the proportion of ore that occurs above the Mineral Resource cut-off grade assuming a specified SMU. The open pit Mineral Resource is reported within a $1,750/oz optimised pit shell and above the calculated mineralised waste cut-off grade per pit.
For the underground Mineral Resource, the geological model is generated in the United States. Miningsame way as for the open pits. However, a high-grade wireframe is from both open pitdelineated within the broader, lower-grade mineralised envelope. In this instance, all geological controls are adhered to when determining this domain. Ordinary kriging models are then constructed within the low- and high-grade domains, and numerous validation exercises are completed to ensure robust estimates are achieved. The underground with AGA Mineração Cuiabá and Lamego beingMineral Resource is reported inside a MSO volume generated using a unique underground mines and Cerro Vanguardia, Serra Grande and AGA Mineração Córrego do Sítio being a combination of open pit and underground mines.cut-off grade for each deposit.
114
The ultimate open pit designs are used as the limiting boundaries between the open pits and underground during model compilation. The underground stopes and development are evaluated using the ordinary kriging block models and the open pit designs are evaluated using the LUC block models.
Stockpiled material above mineralised waste cut-off grade is included in the Mineral Resource.
Mineral Reserve
The below table, prepared in accordance with Table 2 to Paragraph (D)(1) of Item 1304 of Regulation S-K, summarises the gold Mineral Reserve for Geita at the end of the fiscal year ended 31 December 2022, based on a gold price estimate of $1,400/oz. Refer to “—Material Assumptions for the Mineral Reserve—Modifying factors and price estimates” for additional information on cut-off grades and metallurgical recovery.
| Mineral Reserve | Category | Tonnes | Grade | Contained Gold | |||||||||||||
| as at 31 December 2022 | million | g/t | tonnes | Moz | |||||||||||||
| Geita | Proven | 9.54 | 1.02 | 9.70 | 0.31 | ||||||||||||
| Probable | 38.95 | 2.60 | 101.19 | 3.25 | |||||||||||||
| Total | 48.49 | 2.29 | 110.89 | 3.57 | |||||||||||||
Notes:
1.Rounding of numbers may result in computational discrepancies in the Mineral Reserve tabulations. The Mineral Reserve estimates with respect to our material properties have been prepared by the Qualified Persons (employed by AngloGold Ashanti unless stated otherwise). The net difference between the Mineral Reserve at the end of the last completed fiscal year and the preceding fiscal year is detailed in the table below. To reflect that figures are not precise calculations and that there is uncertainty in their estimation, AngloGold Ashanti reports tonnage, grade and content for gold to two decimals. All ounces are Troy ounces. “Moz” refers to million ounces.
2.“Tonnes” refers to a metric tonne which is equivalent to 1,000 kilograms.
3.Property currently in a production stage.
4.Refer to “—Material Assumptions for the Mineral Reserve—Modifying factors and price estimates” for additional information on cut-off grades and metallurgical recovery.
5.Based on a gold price of $1,400/oz.
Year on year changes in Mineral Reserve - Moz
| as at 31 December 2022 | Geita | ||||||||||
| Category | Proven | Probable | Total | ||||||||
| Previous Year | 0.09 | 2.55 | 2.65 | ||||||||
| Depletion | (0.06) | (0.49) | (0.55) | ||||||||
| Exploration | — | 0.87 | 0.87 | ||||||||
| Methodology | — | — | — | ||||||||
| Price | — | 0.40 | 0.40 | ||||||||
| Cost | 0.18 | 0.06 | 0.25 | ||||||||
| Geotechnical | — | — | — | ||||||||
| Metallurgical | — | — | — | ||||||||
| Operational | 0.04 | (0.10) | (0.06) | ||||||||
| Other | 0.06 | (0.04) | 0.02 | ||||||||
| Acquisition / Disposal | — | — | — | ||||||||
| Current Year | 0.31 | 3.25 | 3.57 | ||||||||
| Net Difference | 0.22 | 0.70 | 0.92 | ||||||||
| % Difference | 241 | 27 | 35 | ||||||||
Notes:
All figures are expressed on an attributable basis unless otherwise indicated.
The increase is mainly due to ongoing exploration drilling success resulting in larger pit designs at Nyamulilima and in the first-time reporting of the Geita Hill underground Mineral Reserve based on a feasibility study currently being completed. An increase in the Mineral Reserve price and reduced costs mostly by reductions in hauling cost on surface and contractor rates is partially offset by depletion and operational changes.
115
Material Assumptions for the Mineral Reserve
Modifying factors and price estimates
| as at 31 December 2022 | Geita | |||||||
| Primary Commodity Price | $/oz | 1,400 | ||||||
| Cut-off grade | g/t | 0.70(2)-4.20(3) | ||||||
| Stoping width | cm | 450-2,500(3) | ||||||
| Dilution | % | 11.6(2);10-17(3) | ||||||
| Resource Modification Factor | %RMF based on tonnes | 99.5(2)-100(3) | ||||||
| Resource Modification Factor | %RMF based on g/t | 93(2)-100(3) | ||||||
| Mining Recovery Factor | %MRF based on tonnes | 86-100(1) | ||||||
| Mining Recovery Factor | %MRF based on g/t | 86-100(1) | ||||||
| Mine Call Factor | %MCF | 100 | ||||||
| Metallurgical Recovery Factor | %MetRF | 80.4-91.4(1) | ||||||
Notes: (1) Vary according to rock type / area. (2) Open pit. (3) Underground. | ||||||||
Estimation
The Mineral Resource models are used as the basis for Mineral Reserve estimation. Input parameters for estimating the Mineral Reserve include gold price, mining dilution and recovery, geotechnical information, stay-in-business capital, operating costs, metallurgical recovery, processing capacity and mining equipment capacities.
Appropriate Mineral Reserve cut-off grades are applied and optimised pit shells are generated for the open pit sources. Pit designs are then done on selected shells and signed off by all relevant parties to ensure compliance to specifications. Underground designs are completed and evaluated. These designs are incorporated into the production and treatment scheduling stages to yield ore tonnes and grades. Financial evaluations are completed for production and treatment schedules to check the cash flow analysis from the estimated Mineral Reserve.
The Mineral Reserve for Geita's operating and prospective pits, as well as underground mine areas is estimated using updated economic factors, latest Mineral Resource models, geological, geotechnical, mining engineering and metallurgical parameters. Environmental, sociopolitical, legal and regulatory factors are also considered.
Map showing Geita planned infrastructure and licences
Below is a map that shows the location, infrastructure and mining license area for Geita. The coordinates of the mine, as represented by the plant, are depicted on the map and are in the geographic coordinate system.
116
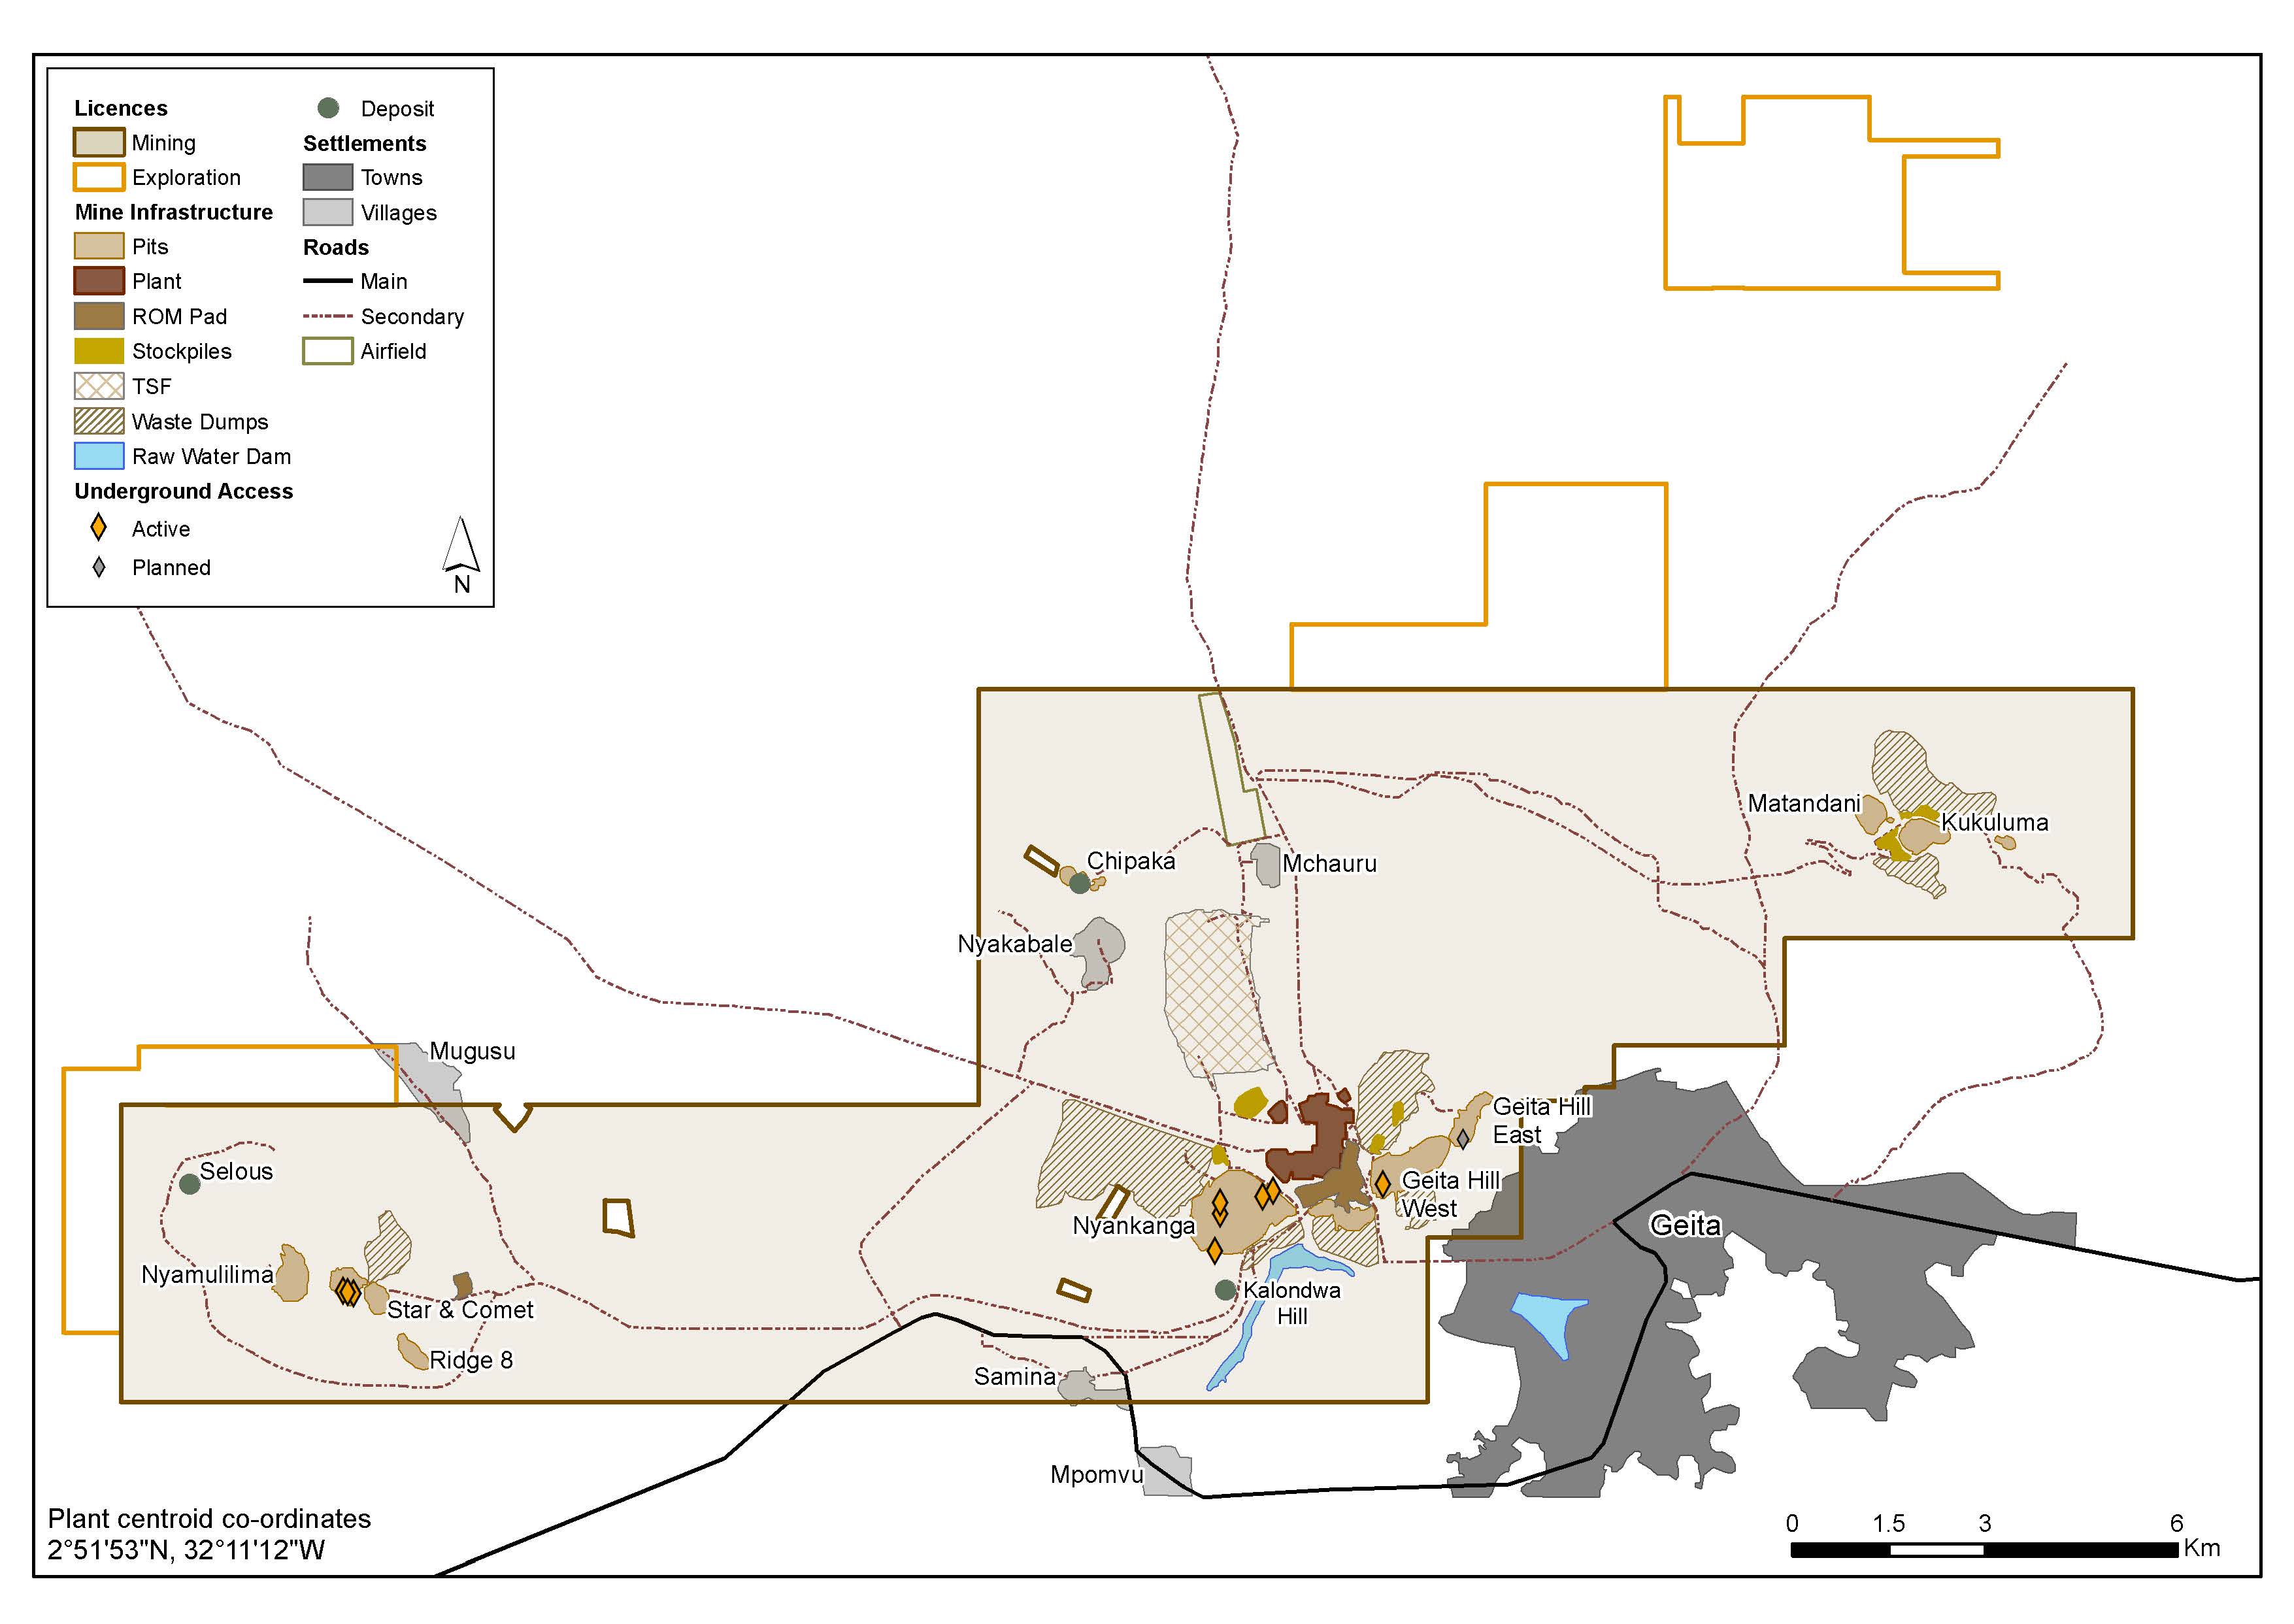
117
AMERICAS
The Americas region includes the mining jurisdictions Brazil and Argentina, in which AngloGold Ashanti has three operations. In Argentina, the Company has one mining operation: the Cerro Vanguardia Mine, co-owned by AngloGold Ashanti (92.5%) and Fomento Minero de Santa Cruz Sociedad del Estado (“Fomicruz SE”) (7.5%). In Brazil, the Company has two mining operations: (i) the AngloGold Ashanti Córrego do Sítio Mineração operations (“AGA Mineração”) which include the Cuiabá, Lamego and Córrego do Sítio (“CdS”) mines, and (ii) Mineração Serra Grande (“Serra Grande”).
ARGENTINA
CERRO VANGUARDIA
Property description
Cerro Vanguardia, in which AngloGold Ashanti has a 92.5 percent stake,production stage gold-silver operation, is ourthe Company’s sole operation in Argentina. Fomicruz, a state company, owns the remaining 7.5 percent. The operationmine is operated by AngloGold Ashanti.
Cerro Vanguardia S.A. ("CVSA"), which is located approximately 110 kilometres north-northwest of the coastal town of Puerto San Juliana company formed by AngloGold Ashanti (92.5%) and Fomicruz SE, a state-owned company operating in the province of Santa Cruz.Cruz (7.5%). The climate is semi-arid and although snow does occur, winter is mild and exploration activities are normally possible all year round. Cerro Vanguardia is a gold-silver mine withoperates multiple small open pits with high stripping ratios and multiple narrow-vein underground mines located at different parts ofwithin the property butand mined simultaneously. Cerro Vanguardia has been in operation for more than 20 years. Silver is produced as a by-product.
Location
Cerro Vanguardia commencedis located in the Santa Cruz province, southern Patagonia, Argentina, approximately 110km north-northwest of the coastal town of Puerto San Julián. Access to the area is by aircraft from Buenos Aires to Comodoro Rivadavia (380km) or Rio Gallegos (510km) and then by road to the mine site.
Mineralisation style
Cerro Vanguardia is in the core of the 60,000km2 Deseado Massif, one of the most extensive volcanic complexes in southern Patagonia. The Deseado Massif is deposited over Paleozoic low-grade metamorphic basement rocks. The mineralisation is concentrated in steeply-dipping quartz veins that cut the flat-lying ignimbrites and volcanoclastic rocks. The Cerro Vanguardia district contains more than 100 gold and silver-bearing epithermal veins for a cumulative exposed vein strike extension of more than 240km, of which 55 veins are currently known to contain economic gold and silver mineralisation. The veins at Cerro Vanguardia consist mainly of quartz and adularia and contain minor electrum, native gold, silver sulphides and native silver as an open pit operationfine-grained disseminations.
Legal aspects and tenure
Refer to “Item 4B: Business Overview—The Regulatory Environment Enabling AngloGold Ashanti to Mine—Americas—Argentina—AngloGold Ashanti’s rights and permits”.
Processing plants and other available facilities
Infrastructure for Cerro Vanguardia is mostly located on-site. It includes a camp site with a capacity of 1,300 people, a Merrill Crowe plant, heap leaching facilities, cyanide recycling plant, mine laboratory, maintenance facilities, warehouses and sewage processing plant. Four natural gas power generators, fed by a 40km long pipeline, provide electricity to the operation. Natural gas is also used for heating. Mine office facilities are located in 1998the main mining area.
Dewatering supplies water for use both as processing water and this was supplementedcamp consumption. Due to the particular features of the mine, and in 2010order to optimise hauling, all pits have local, single or multiple waste dumps. The TSF is located in and is contained by a natural depression.
Mineral processing
The metallurgical plant has a daily capacity estimated at 3,500tpd (1.2Mtpa), with gold and silver grade of around 4.25g/t and 120g/t, respectively. The plant comprises the start of shallow underground miningfollowing stages: crushing, milling, conventional leaching in tanks, counter current decant system in thickeners (“CCD circuit”), a CIL process, acid wash, elution, conventional Merrill Crowe process to access high-grade material. To complementrecover gold and silver with metallic zinc, and a cyanide recovery plant ("Cyanisorb"). The tailings go directly to a conventional TSF, where there is also a reclaim water system for the already existing goldplant.
In addition to the processing plant there is a heap leach operation was started in 2012. The mine has been operated by AngloGold Ashanti since 1998. The orebodies comprise a series of epithermal vein deposits containing gold and large quantities of silver, which is mined as a by-product. The metallurgical plant includes a cyanide recovery facility. Productionpad, with an annual capacity of the heap leach facility, which was commissioned in 20121.5Mtpa, and processes lower-grade material, is around 1.5Mtpa at gold and silver grades of around 0.65g/0.7g/t and 17g/20g/t, respectively. Eight natural gas power generators (two as a back-up) fed by a 40 kilometre long pipeline provide electricityThe pregnant solution from this process goes directly to the operation.CCD circuit in the process plant and to the Merrill Crowe process for gold and silver recovery.
BRAZIL
AngloGold Ashanti’s operations in Brazil comprise AngloGold Ashanti Córrego do SítioAGA Mineração (AGA Mineração) in the Quadrilátero Ferrífero, Minas Gerais state and Mineração Serra Grande (MSG) in the Goiás state. All operations are wholly owned by AngloGold Ashanti. AngloGold Ashanti generates part of the power for its operations in Brazil at the Rio de Peixe hydroelectric plants and through its stake in the Igarapava consortium. The balance is purchased on the open market in long term contracts to secure supply.
Serra Grande comprises three mechanised underground mines, Mina III, Mina Nova and Mina Palmeiras, and an open pit as well as a dedicated metallurgical plant.
AGA MINERAÇÃO
AGA Mineração encompasses mining operations at Cuiabá, Lamego and CdS. The AGA Mineração mining complex is located in southeastern Brazil in the state of Minas Gerais. Operations are 30km from the capital of the state (Belo Horizonte) in the case of Cuiabá and Lamego, and approximately 100km in the case of CdS.
AGA MINERAÇÃO - CÓRREGO DO SÍTIO
Property description
CdS is wholly-owned by AngloGold Ashanti. It has been in operation since 1989 and consists of multiple open pit (conventional bench mining) and underground mines (mainly using sub-level stoping). The property is currently in a production stage and operated by AGA Mineração.
Location
The CdS complex is located in the municipalitesmunicipalities of Santa Bárbara and Barão de Cocais, 90 kilometresthat are located 100km east of the city of Belo Horizonte in the state of Minas Gerais, state, in the southeast of Brazil. These operations are included in an important mining district referred to as the Quadrilátero Ferrífero (Iron Quadrangle), the second biggest Brazilian area for the production of iron, gold and manganese.
Mineralisation style
The CdS gold complex has beendeposit is located in operation since 1989the eastern part of the lower to middle greenschist facies of the Rio das Velhas Archaean, in the Iron Quadrangle region, on the southern margin of the São Francisco Craton in Brazil. CdS is an orogenic gold deposit hosted in intensely deformed clastic, volcanoclastic, carbonaceous schists and metagreywackes in an approximately 30km northeast-southwest striking shear zone. Hydrothermal alteration phases associated with the mineralisation are dominated by sericite and carbonate.
The CdS I, II and III, gold deposits and associated targets are located in a gold trend that extends for approximately 14km in a north-easterly direction, from Grota Funda (CdS I) in the south to Anomalia (CdS III) in the north, which developed in a compressional tectonic regime. Gold is associated with quartz and fine grained acicular arsenopyrite. The main gold targets and deposits are distributed over three trends, namely the CdS Trend and the Cristina Trend hosted in metasedimentary rocks, and the Donana Trend hosted in BIF.
Legal aspects and tenure
Refer to “Item 4B: Business Overview—The Regulatory Environment Enabling AngloGold Ashanti to Mine—Americas—Brazil—AngloGold Ashanti’s rights and permits”.
Processing plants and other available facilities
CdS infrastructure consists of two operations:the sulphide plant at CdS II (used to process refractory sulphide material), and the heap leach plant at CdS I (for oxide ore mined by open pit). The site also has an ore sorting plant, a TSF for the sulphide plant, a neutralised tailings deposit for the oxide material and numerous waste dumps for the open pit mines at CdS I. For further information on the regulatory framework governing TSFs in Brazil, see “Item 4B: Business Overview—The Regulatory Environment Enabling AngloGold Ashanti to Mine—Americas—Brazil”.
Ancillary facilities comprise a water treatment facility, effluent treatment facilities, equipment workshops, laboratory, warehouses, explosives and accessories magazines, fuel stations, electric substations as well as offices, medical
119
clinic, mess rooms, dressing rooms, bathrooms, storerooms, garage, fuel stations, a centre of environmental studies, nursery and other facilities required to operate the mine.
Water is primarily sourced from recycling the underground mine water and two sulphide underground mines known as CdS Isupplementary water catchment wells. The power for the operations is supplied and CdSII. purchased on the open market. Good communication infrastructure is available in the area.
Mineral processing
There are two metallurgical plants inat CdS: the heap leach plant for oxide ore and the sulphide plant. The sulphide process consists of crushing, grinding and gravity concentration, flotation, thickening, acidulation, pressure oxidation (POX autoclave), CIL extraction, elution, neutralisation, electro-winningelectrowinning and tailings disposal.dry stack tailings. The sulphide plant and POX circuit have a capacity of 600ktpa.900ktpa. The heap leaching process consists of crushing, agglomeration, stacking, leaching, adsorption, elution and electrowinning, with a total capacity of 650ktpa. Total capacity of the complete circuit is 1.5Mtpa.860ktpa.
AGA MINERAÇÃO - CUIABÁ
Property description
Cuiabá is coveredan underground operation (mainly using sub-level long hole open stoping), wholly-owned by a single concession granted byAngloGold Ashanti, within one of the Brazilian National Mining Agency (ANM), namely 000.323/1973 held by AGA Mineração, covering a total area of 3,662ha. Lamego is covered by three geographically contiguous ANM concessions granted to AGA Mineração, namely concession 830.720/1981, 831.554/1983 and 832.238/2003 covering a total area of 1,622.68ha. CdS is covered by four ANM concessions, namely 930.556/2000; 930.181/2008; 830.129/1982 and 833.472/2003 covering a total of 5,461.07ha. According to Brazilian mining laws, expiry of claims, licenses, and other tenure rights coincide with the depletion of Ore Reserves, cessation of mining operations and legally required post-operations activities (e.g. mine closure), provided all annual reports have been approved by the ANM.
Location
Cuiabá is located 30km to the east of Belo Horizonte in the state of Minas Gerais, in the southeast of Brazil.
Mineralisation style
Cuiabá mine is located in the Iron Quadrangle, which is a geotectonic unit on the southern edge of the São Francisco Craton, comprising Archaean and Proterozoic terrains, and bordered by Neoproterozoic mobile belts. From a regional viewpoint, Cuiabá mine is located in the eastern extension of the Serra do Curral inverted homocline, located on the northeastern edge of the Iron QuadrangleQuadrangle. The mine lithostratigraphy consists of an intermediate metavolcanic sedimentary sequence of the greenstone belt type and is composed of Proterozoic and Archaean volcano‑sedimentary sequences and Pre‑Cambrian granitic complexes. The host tohosted in the gold mineralisation is the volcano-sedimentary Nova Lima Group (NLG) that occurs at the basebottom of the Rio das Velhas Supergroup (RDVS). The upper sequence of the RDVSSupergroup.
Gold mineralisation is the meta-sedimentary Maquiné Group. Cuiabá mine, located at Sabara Municipality, has gold mineralisation associated with sulphides and quartz veins in Banded Ironstone Formation (BIF)BIF and volcanic sequences. At this mine, structuralStructural control and fluidsfluid flow are the most important factors for gold mineralisation with a common association withbetween large-scale shear zones and their associated structures. Where BIF is mineralised, the ore appears strongly stratiform due to the selective sulphidation of the iron richiron-rich layers. Steeply plunging shear zones tend to control the ore shoots, which commonly plunge parallel to intersections between the shears and other structures. Mineralisation is hosted in the limbs of a fold system.
Legal aspects and tenure
Refer to “Item 4B: Business Overview—The controlling mineralisation structures are the apparent intersection of thrust faults with tight isoclinal folds in a ductile environment. The host rocks at Cuiabá are BIF, Lapa SecaRegulatory Environment Enabling AngloGold Ashanti to Mine—Americas—Brazil—AngloGold Ashanti’s rights and mafic volcanics (principally basaltic)permits”. Mineralisation is due to the interaction of low salinity carbon dioxide rich fluids with the high-iron BIF, basalts and carbonaceous graphitic schists. Sulphide mineralisation consists of pyrrhotite and pyrite with subordinate arsenopyrite and chalcopyrite; the latter tends to occur as a late-stage fracture fill and is not associated with gold mineralisation. Wall rock alteration is typically carbonate, potassic and silicic.
The metallurgical plants (Cuiabá gold plant and Queiroz plant) are connected by an aerial ropeway and power to the mine is provided by a set of small hydropower plants (Rio de Peixe hydroelectric complex). Cuiabá mine has a shaft system (846m deep) for production and personnel transport, the current nominal airflow capacity for which is 1,035m3/s, of which 320m3/s are refrigerated. Tailings deposition is at one of four sites located at Cuiabá, Calcinados, Rapaunha and Cocuruto. Refer to “Item 4B: Business Overview—The Regulatory Environment Enabling AngloGold Ashanti to Mine—Americas—Brazil” for further information on the Company’s TSFs in Brazil. The Rio de Peixe hydroelectric complex is a set of seven small hydropower plants that generate energy from three dams (Ingleses, Miguelo and Codorna), and are directly connected to the Queiroz plant.
Mineral processing
Cuiabá and Lamego mines feed the Cuiabá gold (crushing, milling and flotation) and Queiroz (roaster, carbon circuit and refinery) plants, currently at 1.9Mtpa with a metallurgical recovery of 91.8 percent for the combined feed. At the Cuiabá gold plant, ore is crushed and milled followed by flotation and filtration to produce a concentrate (32 percent sulphur), which is transported by an aerial ropeway to Queiroz for further treatment. Approximately 30 percent of gold is recovered through a gravity circuit at the Cuiabá gold plant. The concentrate, transported by aerial ropeway, is received at the Queiroz plant which is located in Nova Lima and comprises the refractory ore circuit (from Cuiabá or
120
Lamego) with facilities for pyrometallurgy and hydrometallurgy. The concentrate is roasted and the calcine proceeds to a carbon-in-pulp ("CIP") with Merrill Crowe circuits for further refining. The sulphide gas is captured for processing at the acid plant. Sulphuric acid is produced as a by-product.
AGA MINERAÇÃO - LAMEGO
Property description
Lamego is an underground operation (mainly using long hole stoping) that is wholly-owned by AngloGold Ashanti, within one of the most important metallogenetic provinces in Brazil, known as the Iron Quadrangle. This region is an important producer of iron, manganese and gold in Brazil. The property is currently in a production stage and operated by AGA Mineração.
Location
Lamego is located 30km to the east of Belo Horizonte in the state of Minas Gerais, in the southeast of Brazil.
Mineralisation style
The Lamego mine is located in the Iron Quadrangle, which is a geotectonic unit at the southern edge of the São Francisco Craton, comprising Archaean and Proterozoic terrains, and bordered by Neoproterozoic mobile belts. From a regional viewpoint, the Lamego mine is located in the eastern partextension of the lowerSerra do Curral inverted homocline, located on the northern edge of the Iron Quadrangle.
Gold mineralisation is characterised by orebodies associated with two horizons of chemical sedimentary rocks: BIF and metachert, with shear zones containing abundant quartz veinlets. The proportions of these lithotypes vary substantially from one deposit to middle greenschist facies archean Rio das Velhas greenstone belt. The CdS I, II and IIIanother. In the BIF, sulphide mineralisation is associated with gold, deposits and associated targets are located in a gold trend that extends for about 14 kilometres in a north-easterly direction, from Grota Funda (CdS I)while in the south to Jambeiro (CdS III) in the north. CdSII is the north portion of the Corrego do Sítio gold trend. The main gold targets and deposits are distributed over three trends, namely the CdS trend, the Donana Trend and the Cristina Trend. At CdSI, the main orebodies are Rosalino, Cachorro Bravo, Laranjeiras and
Refer to “Item 4B: Business Overview—The Regulatory Environment Enabling AngloGold Ashanti to Mine—Americas—Brazil—AngloGold Ashanti’s rights and permits”.
Processing plants and other available facilities
Lamego operates as a satellite mine to the Cuiabá mine. Ore is transported to surface via ramps where it is crushed, stockpiled and transported daily to the Cuiabá gold plant, where it is blended with Cuiabá ore on the ROM pad.
The two plants (Cuiabá gold plant and Queiroz plant) are connected by an aerial ropeway. Power to the mine is provided by a set of small hydropower plants (Rio de Peixe hydroelectric complex) and supplied by Cemig, a state-owned company. The Rio de Peixe hydroelectric complex is a set of seven small hydropower plants that generate energy from three dams (Ingleses, Miguelo and Codorna), and are directly connected to the Queiroz plant. Tailings deposition is at one of four sites located at Cuiabá, Calcinados, Rapaunha and Cocuruto. Refer to “Item 4B: Business Overview—The Regulatory Environment Enabling AngloGold Ashanti to Mine—Americas—Brazil” for further information on the Company’s TSFs in Brazil.
Lamego has a natural water supply system and a plant for water and sewage treatment.
Mineral processing
Cuiabá and Lamego mines feed the Cuiabá gold (crushing, milling and flotation) and Queiroz (roaster, carbon circuit and refinery) plants, currently at 1.9Mtpa with a metallurgical recovery of 91.8 percent for the combined feed. At the Cuiabá gold plant, ore is crushed and milled followed by flotation and filtration to produce a concentrate (32 percent sulphur), which is transported by an aerial ropeway to Queiroz for further treatment. Approximately 30 percent of gold is recovered through a gravity circuit at the Cuiabá gold plant. The concentrate, transported by aerial ropeway, is received at the Queiroz plant which is located in Nova Lima and comprises the refractory ore circuit (from Cuiabá or Lamego) with facilities for pyrometallurgy and hydrometallurgy. The concentrate is roasted and the calcine proceeds to a CIP with Merrill Crowe circuits for further refining. The sulphide gas is captured for processing at the acid plant. Sulphuric acid is produced as a by-product.
SERRA GRANDE
Property description
Mineração Serra Grande (S.A.)
121
stoping (bottom-up and top-down), cut-and-fill and room-and-pillar mining methods) and two open pit mines. The property is currently in a production stage.
Location
Serra Grande is located 5km south of the citytown of Crixás, and 420km from the Brazilian capital, Brasilia. ItBrasília and approximately 350km from the state capital of Goiás, Goiánia. The employment of 1,120 persons in this largely rural area makes mining the principal economic activity in the region.
Mineralisation style
The Serra Grande gold deposit is an orogenic mesothermal deposit, associated with the development of shear zones that belong to the Upper Archaean Crixás Group. Gold mineralisation is associated with metasediments and metavolcanics from the Ribeirão das Antas and Rio Vermelho Formations respectively. The Crixás Greenstone Belt is surrounded by granitic gneiss terrains from the Ribeirão das Antas and Caiamar complexes and metasedimentary rocks from the Santa Terezinha Group, which is part of the Goiás magmatic arc. Mineralisation at Serra Grande is associated with quartz veins and massive to disseminated sulphides in metasedimentary, metavolcanoclastic and metabasalt rocks, with variable degrees of hydrothermal alteration developed over orogenic stacked thrust layers (duplexes).
Legal aspects and tenure
Refer to “Item 4B: Business Overview—The Regulatory Environment Enabling AngloGold Ashanti to Mine—Americas—Brazil—AngloGold Ashanti’s rights and permits”.
Processing plants and other available facilities
Serra Grande operates threea single TSF, which will support the LOM production and has government environmental licensing in place. The water used in metallurgical processing comes from the underground mines. The state road GO-337 passes close to the operation providing access for logistics. The power for the mine is supplied and twopurchased in the open pit mines. Three mining methods used underground are: sub-level stoping (bottom-upmarket (grid electricity) and top-down), room and pillar. diesel self-generation. Refer to “Item 4B: Business Overview—The Regulatory Environment Enabling AngloGold Ashanti to Mine—Americas—Brazil” for further information on the Company’s TSFs in Brazil.
Mineral processing
The metallurgical plant has the capacity ofto process 1.5Mtpa, and combinescombining CIL and gravimetric circuits. The ore is blended to feed the crushing circuit, withwhich has a capacity of 3,800tpd.4,500tpd. There are two mills in operation, and 20 leachingleach tanks with a capacity of 4,800m34,800m3 divided between prelimingpre-liming and cyanidation stages. About 58% freeApproximately 45 percent of gold is captured in the parallel gravity circuit. The tailings are filtered and stacked in piles. The rest of the gold is recovered by the CIL process to form the bulliondoré that is sent to the Nova Lima refinery.for refining. The mine became operational in 1989total gold recovery is approximately 93.4 percent.
AUSTRALIA
AngloGold Ashanti operates two mines and has been operatedone new project in Western Australia.
Sunrise Dam, wholly-owned by AngloGold Ashanti, since 1999.is located 205km north-northeast of Kalgoorlie and 55km south of Laverton.
The stratigraphyButcher Well project is a joint venture between AngloGold Ashanti (70 percent) and Northern Star Resources Limited (“Northern Star Resources”) (30 percent). The project is managed by AngloGold Ashanti. Butcher Well is located 20km southwest of the beltSunrise Dam mine and is dominated by basics and ultrabasics of the lower sequences with volcano sedimentary units forming the upper successions.considered to be a potential satellite operation.
Property description
Sunrise Dam is a production stage property with an active underground (using sub-level open stoping methods and narrow open-stoping methods) and open pit mine that is wholly-owned and operated by AngloGold Ashanti. AngloGold Ashanti conducts all brownfield exploration activities on the site and all tenements and permits are hosted in a sequence of schists, meta volcanics and dolomites occurring in a typical greenstone belt structural setting. Gold mineralisation is associated with massive sulphides and vein quartz material associated with carbonaceous and sericitic schists and dolomites. The oreshoots plunge to the north-west with dipping between 6 and 35 degrees. The stratigraphy is overturned and thrusted towards the east, with recognised shear and thrust structures that are stacked. These control the mineralisation and behave as frontal and lateral ramps and horses.good standing.
122
Location
Sunrise Dam is approximately 205km north-northeast of Kalgoorlie and 55km south of Laverton in Western Australia.
Mineralisation style
Sunrise Dam is a mesothermal gold deposit located in the Archaean greenstone belts of Western Australia. The deposit is complex and structurally controlled with multiple ore zones displaying differing characteristics, from ductile shear zones to brittle stockwork complexes to intrusive hosted mineralisation. Mineralisation is typically hosted within quartz-carbonate veins with varying quantities of pyrite and arsenopyrite. Strong alteration of the country host rock is common proximal to controlling structures.
Legal aspects and tenure
Refer to “Item 4B: Business Overview—The Regulatory Environment Enabling AngloGold Ashanti to Mine—Australia—AngloGold Ashanti’s rights and permits”.
Processing plants and other available facilities
All required infrastructure is in place including a fully functional camp, process plant, tailings facility, gas pipeline, power plant and electrical reticulation, offices, airstrip and road system. The underground infrastructure caters for all ventilation and dewatering needs with provisions made in the budget for extensions and upgrades.
Mineral processing
Processing at Sunrise Dam is via a conventional three-stage crushing / two-stage milling, CIL circuit, with a pyrite flotation and ultrafine grinding circuit commissioned in 2018. The gravity circuit recovers approximately 30 percent of the gold, with the CIL circuit, AcaciaTM reactor and Anglo American Research Laboratories ("AARL") elution used to recover the remainder. Electrowinning recovers gold from the Acacia reactor and is eluted to produce gold doré. Plant throughput at Sunrise Dam is approximately 4.1Mtpa.
BUTCHER WELL
Property description
Butcher Well is a joint venture between AngloGold Ashanti (70 percent) and Northern Star Resources (30 percent). Butcher Well encompasses two tenement packages, Butcher Well and Lake Carey, covering approximately 339.56km2. AngloGold Ashanti also holds a significant tenement package adjacent to the Northern Star joint venture properties.
The project is in the exploration stage in the early stages of study, with no Mineral Reserve declared. An Inferred Mineral Resource is stated, which has been the focus of a conceptual study. As the project is still in a concept study phase, no mining has taken place. Both open pit and underground mining options (using transverse longhole open stoping) are being explored.
Location
The Butcher Well project is located in the Laverton district of Western Australia, 20km southwest of AngloGold Ashanti's Sunrise Dam mine and 180km northeast of Kalgoorlie. Butcher Well is considered as a potential satellite operation to Sunrise Dam.
The Sunrise Dam airstrip is approximately 70km by road from the project, with a travel time of approximately 90 minutes on the road on the circumference of the southern part of Lake Carey. Lake Carey is a large salt lake that covers a part of the western project area,with Sunrise Dam located to the east of the lake and the Butcher Well project located on the western shore.
Mineralisation style
The Butcher Well Mineral Resource is an orogenic-style gold system hosted within the Laverton Greenstone Belt. The mineralisation is hosted within a basalt and is spatially associated with syenite dykes. Gold mineralisation within fresh rock principally occurs within steeply dipping north-south trending panels. Supergene gold dispersion and enrichment broadens the mineralised envelope within the near-surface saprolitic material. Much of this material has been previously exploited in shallow open pits.
Legal aspects and tenure
Refer to “Item 4B: Business Overview—The Regulatory Environment Enabling AngloGold Ashanti to Mine—Australia—AngloGold Ashanti’s rights and permits”.
123
Processing plants and other available facilities
Power is likely to be generated on-site via diesel generators. Water can be sourced from the existing flooded pits or bores. Ore material will be trucked to Sunrise Dam via existing secondary roads.
Mineral processing
Ore from Butcher Well will be processed at AngloGold Ashanti's Sunrise Dam processing plant. Processing at Sunrise Dam is via a conventional three-stage crushing, two-stage milling CIL circuit, with a pyrite flotation and ultrafine grinding circuit commissioned in 2018. The gravity circuit recovers approximately 30 percent of the gold, with the CIL circuit and AARL elution used to recover the remainder. Electrowinning recovers gold from the Acacia reactor and eluate to produce gold doré. Plant throughput at Sunrise Dam is 4.1Mtpa, and Butcher Well ore will supplement ore production from the Sunrise Dam underground mine to maintain the mill throughput.
TROPICANA
Property description
Tropicana mine is a currently operating gold mine, and is a production stage property. It produces gold bearing ore from a number of open pits named from north to south: Boston Shaker, Tropicana, Havana and Havana South, and from an underground mine beneath the Boston Shaker and Tropicana open pits. The project is a joint operationbetween AngloGold Ashanti (70 percent), as operator, and AFB Resources Pty Limited, a subsidiary of Regis Resources Limited (30 percent).
Location
Tropicana is located 330km northeast of Kalgoorlie and 200km east of Laverton, Western Australia.
Mineralisation style
The Tropicana deposit is hosted in an Archaen quartz-feldspathic gneiss within a major tectonic suture zone between the Yilgarn Craton and the Albany-Fraser Orogen. Mineralisation is associated with a strong hydrothermal alteration assemblege of biotite-sericite-pyrite, which post-dates peak graulite facies metamorphism. Gold is found within the pyrite.
Legal aspects and tenure
Refer to “Item 4B: Business Overview—The Regulatory Environment Enabling AngloGold Ashanti to Mine—Australia—AngloGold Ashanti’s rights and permits”.
Processing plants and other available facilities
All surface infrastructure facilities are in place and operational. The processing plant and TSF are operating well, consistent with design specifications. The infrastructure includes, but is not limited to water supply, processing plant, mine, dewatering infrastructure, TSF, workshops, camp facilities and airstrips. Power is supplied to the mine by on-site gas and diesel power stations, and natural gas is supplied via an APA Operations (Pty) Limited pipeline. Underground development and production is ongoing.
Mineral processing
The processing plant has a capacity of 9.3Mtpa. The crushing circuit consists of a primary gyratory crusher, feeding a set of secondary cone crushers and tertiary rolls crushers. A 14MW and 6MW ball mill in parallel completes the grinding circuit. A CIL circuit is used to extract the gold from the ore, and a standard AARL elution and recovery systems is used to form gold doré bars.
The power provider, Kalgoorlie Power Systems, has built a dedicated power station consisting of a combination of diesel and gas powered generators with a capacity of 48.5MW.
PROJECTS
The projects in Colombia form a significant contribution to AngloGold Ashanti’s Mineral Resource with the three projects: La Colosa, Minera de Cobre Quebradona ("Quebradona") and Gramalote, the latter of which is a joint operationbetween AngloGold Ashanti (50 percent) and B2Gold Corp. (“B2 Gold”) (50 percent). Mineral Reserve was declared for the first time at Quebradona in 2018.
During 2022, the Company's project team in the United States integrated the Mineral Resource resulting from AngloGold Ashanti's acquisitions of Corvus Gold Inc. (“Corvus Gold”) and Coeur Sterling, Inc. (“Coeur Sterling”) using the Company’s evaluation framework. AngloGold Ashanti acquired North Bullfrog and Mother Lode as part of the Corvus Gold acquisition in January 2022 and Sterling (which includes the Crown Block deposits of SNA, Secret Pass and Daisy) through the acquisition of Coeur Sterling in November 2022.
124
In Australia, with a few exceptions, all onshore minerals are owned by the Crown. The respective Minister for each state and territory is responsible for administering the relevant mining legislation enacted by the states and territories. Native title legislation applies to certain mining tenements within Australia. Australia recognises and protects a form of native title that reflects the entitlement of Aboriginal people to their traditional lands in accordance with their traditional custom and laws. Should native title claims or determinations exist, certain native title processes and procedures will apply under the Native Title Act 1993 (Cth) (the “Native Title Act”) before the tenure is granted. Tenure may be granted subject to conditions relating to native title rights. In the mining context, native title matters are managed as part of the tenement grant process. If disputes arise in relation to the grant of a particular tenement, they can be referred to the National Native Title Tribunal, established under the Native Title Act, for resolution. Native title legislation also provides a framework for compensation to be paid for acts that affect native title rights and interests. Ordinarily, the relevant Commonwealth or State government is liable to pay compensation for acts attributable to it. However, in the state of Western Australia, the Mining Act 1978 (WA) provides that an applicant for the grant of, or the holder of, a mining tenement is responsible for native title compensation, if determined to be payable, to native title holders.
64
Federal, state and territory Aboriginal and non-Aboriginal heritage laws operate in parallel to the native title legislation. State and territory heritage laws exist predominantly for the purposes of managing the impact of developments on sites, objects and areas of heritage significance. In Western Australia, impacts to Aboriginal cultural heritage are regulated by the Aboriginal Heritage Act 1972 (WA). However, this legislation will be repealed and replaced by the Aboriginal Cultural Heritage Act 2021 (WA) (the “ACH Act”) which was enacted in 2021. The regulations, management code and various guidelines which underpin the ACH Act are being co-designed by the State government, traditional owners, industry and other stakeholders. The ACH Act will not become fully operational until the co-design process is complete in mid-2023 at the earliest. Where an area of heritage significance is placed on the national or world heritage registers, federal approval processes may also apply. To date, there has not been any significant impact on any of AngloGold Ashanti’s tenure due to native title or heritage legislation and, at this stage, it is not possible to predict any significant impact that may result in the future from the final regulations, management code and various guidelines under the ACH Act, once adopted.
AngloGold Ashanti’s operating properties are located in the state of Western Australia where tenure is issued under, and mining operations are governed by, the Mining Act 1978 (WA). The most common forms of tenure in Western Australia are exploration and prospecting licences, mining leases, miscellaneous licences and general purpose leases. In most Australian states, if the holder of an exploration licence establishes indications of an economic mineral deposit in the area covered by the exploration licence and complies with the conditions of the grant, the holder of the exploration licence has a priority right against all others to be granted a mining lease which gives the holder exclusive mining rights with respect to minerals on the property.
It is possible for an individual or entity to own an area of land (including for infrastructure purposes) and for another individual or entity to be granted the right to explore for or mine any minerals located on or under the surface of the same area. The maximum initial term of a mining lease in Western Australia is 21 years and the holder has the right to renew the lease for an additional 21 years. Subsequent renewals are granted at the discretion of the respective state or territory’s minister responsible for mining rights. In Western Australia, mining leases can only be assigned with the prior written consent of the minister.
Tax laws relating to mining
Government royalties are payable by the holder of mining tenure in respect of minerals obtained from the relevant area of land at the rates specified in the relevant legislation in each state or territory. The royalty on gold production in Western Australia is payable quarterly at a fixed rate of 2.5 percent of the royalty value of gold metal produced. The royalty value is calculated by multiplying the amount of gold produced during a given month by the average gold spot price for that month. In addition, the holder of a mining tenement is required to pay annual rent in respect of the tenement. In Western Australia there is a minimum annual expenditure requirement for prospecting and exploration licences and mining leases. Exemptions from the expenditure requirement can be obtained if certain conditions are satisfied.
Environmental laws relating to mining
Mining tenements will be granted with endorsements and conditions relating to protection of the environment. Exploration and mining operations may also require separate approval from the state, territory or federal environment minister, which may require completion of an environmental impact assessment (including a public consultation period) pursuant to applicable environmental protection legislation prior to commencement. Further, a works 'construction' approval and an operating licence under the relevant environmental protection legislation in the state or territory may also be required for certain mine processing or mining-related operations. In Western Australia, legislation removing the distinction between “works approvals” and “licenses” is expected to enter into force in December 2023 such that, following the effective date, only a “license” will be required for “prescribed activities”, which include relevant works and operations on a mining lease, and not a separate “works approval”. Depending on the jurisdiction, additional approvals may be required for the removal of native vegetation within the tenement, and the taking and use of water for exploration and mining operations.
AngloGold Ashanti’s rights and permits
AngloGold Ashanti has been granted 21-year term mining leases with rights of renewal to all of its mining areas in Australia, including its proportionate share of joint venture operations and accordingly it has, together with its joint venture partners where applicable, the exclusive right to mine in those areas. Both the Group and its joint venture partners are fully authorised to conduct operations in accordance with relevant laws and regulations. The mining leases and rights of renewal cover the current life-of-mine at AngloGold Ashanti’s operations in Australia.
At Sunrise Dam, one mining lease (M39/1116) covers the deposit and mine infrastructure (approximately 7,808 hectares) and another mining lease (M39/1117) covers the water extraction infrastructure used to supply the operation with water (approximately 1,768 hectares). Both leases are currently in good standing, with expiry dates in 2038.
The Butcher Well joint venture has security of tenure for all current exploration licences and for the contiguous mining leases that covers its Mineral Resource. There are three mining leases: mining lease (M39/165) which covers 602.35 hectares with expiry date in 2030, mining lease (M39/166) which covers 990 hectares with expiry date in 2030 and mining lease (M39/230) which covers 446.4 hectares with expiry date in 2032.
65
At Tropicana, the deposit is situated upon a single mining lease (M39/1096) covering approximately 27,228 hectares, which is currently in good standing, with an expiry date in 2036.
AngloGold Ashanti Australia Limited is also conducting early stage exploration activities in Queensland under the Mineral Resources Act 1989 (QLD). AngloGold Ashanti holds 15 exploration permits covering 316,851 hectares. Each permit is granted with an initial term of five years, renewable for two advanced Greenfields Projectsfurther periods of not more than five years each.
AMERICAS
Argentina
General laws relating to mining and land ownership
Mining regime
The Argentinean Mining Code governs mining activity in the country. Special regimes exist for hydrocarbons and nuclear minerals. In the case of most minerals, the Argentinean Mining Code establishes that the owner of the land is not the owner of the mineral rights; these are held by the national or provincial governments (depending on the location of the minerals). The national or provincial government, as applicable, is required by the Argentinean Mining Code to grant whomever discovers a new mine title to the mining concession.
The Argentinean Mining Code regulates exploration permits as well as mining concessions, or exploitation rights. Exploration permits grant their holders exclusivity rights to any mineral discoveries, including those made by a third party within the exploration area covered by the permit. Exploration permits are limited in time and as to the extent of the exploration area, are subject to the payment of a single-time fee, and also require a minimum exploration work programme and schedule to keep the permit in force. Priority for receiving a mining concession is given to the registered discoverer of the mine, which holds the exploration permit. Once the application for a mine has been submitted, the applicant may commence works and must submit a legal survey of the units requested for the new mine. The application and the legal survey may be opposed by third parties following specific proceedings set forth in the Argentinean Mining Code. Approval and registration of the legal survey by the provincial mining authority constitutes formal title to the mining concession.
Holders of mining concessions must comply with Ore Reserve declaration, Quebradonathree main conditions: payment of an annual fee, investment of a minimum amount of capital, and Gramalote,the carrying out of a reasonable level of exploitation. Failure to do so could lead to forfeiture of the mining concession, which would then revert back to the Province.
In addition to the Argentinean Mining Code, between 1993 and 1995, Argentina implemented several federal laws to offer foreign companies attractive incentives for exploration and mining in Argentina, the Mining Investment Law (Law No. 24, 196), as amended (the “Mining Investment Law”), and related legal provisions being the most important one. Such incentives include, among other matters, import duty exemptions, accelerated depreciation of fixed assets, a three percent cap on provincial royalties set at pit-head value on the mineral extracted, value added tax refunds for exploration-related expenses incurred by companies registered under the Mining Investment Law, and, subject to the filing of a feasibility study for the relevant mining project, a 30-year stability as to the tax burden on the project and the customs and foreign exchange regimes and duties. Cerro Vanguardia S.A. (“CVSA”) obtained its tax, customs and foreign exchange stability certificate in 1996.
Glacier Law
On 30 September 2010, the National Law on Minimum Requirements for the Protection of Glaciers (Law No. 26, 639) (the “Glacier Law”) was enacted in Argentina, banning new mining exploration and exploitation activities on glaciers and “peri-glacial” areas. The Glacier Law establishes a broad definition of “peri-glacial” areas that, together with glacial areas, must be surveyed by an existing national government agency specifically appointed to this end every five years. The area where the Cerro Vanguardia project is located does not include any glaciers or peri-glacial areas according to the inventory of glaciers which was published in June 2018.
Rural Land Law
On 27 December 2011, the Argentinean National Congress passed a law on the Regime for Protection of National Domain over Ownership, Possession or Tenure of Rural Land (Law No. 26, 737) (the “Rural Land Law”) which implemented a set of rules restricting the ownership of rural land by foreigners (including foreign individuals or any kind of legal entity controlled by foreign individuals or legal entities). The main restrictions are as follows: (i) foreigners cannot own in the aggregate more than 15 percent of the entire rural land of Argentina, the same cap being applicable to each Province and Municipality; (ii) foreigners will not be allowed to purchase more than 1,000 hectares in the so-called “zona núcleo”, which comprises the main agricultural areas of central Argentina or an “equivalent” surface depending on the location of the land and its productive potential; and (iii) foreigners will not be allowed to buy land that contains, or is adjacent to, relevant and permanent water bodies (such as rivers and lakes). Although exploration permits and mining concessions are not the subject matter of the restrictions placed by the Rural Land Law, certain rights granted to foreign mining companies under the Argentinean Mining Code may be restricted by this
66
new law. For example, the right that holders of mining concessions currently have to force the surface owner to sell the land to the holder of the mining concession might be restricted if the concession holder is a foreign individual or a legal entity controlled by foreigners.
Federal Mining Agreement
On 13 June 2017, the national government and the provinces in whose territories the main mining projects of Argentina are located, signed the New Federal Mining Agreement (“FMA”). The purpose of the FMA is, amongst other things, to increase provincial revenues from the mining industry by creating legal entities owned by provincial governments that would work in association with private mining companies. This scheme is not new in Argentina and it has been used by some provincial governments, amongst them the Santa Cruz Province (through Fomicruz), in which the Cerro Vanguardia project is located. The FMA also contemplates other forms of revenues such as the formation of special trusts to be funded by mining companies to finance education, health and other programmes. Additionally, the FMA included setting forth mining royalties up to three percent of the gross value of commercialised minerals, without any deductions other than VAT. As the FMA has not yet been converted into law by the National Congress, its provisions are neither binding nor enforceable.
In Argentina, the current regulatory regime of royalty payments is expected to change and several different options and payment thresholds have been discussed. In December 2012, the Santa Cruz Province changed the mining royalty from one percent to three percent calculated at pit-head value of the mineral extracted thus bringing it to the cap of the Mining Investment Law.
Foreign exchange and export rules
Foreign exchange controls
On 1 September 2019, by means of Executive Decree No. 609/2019 (the “Export Controls Decree”), the Argentinean national government reinstated foreign exchange and export controls. The Export Controls Decree and related regulations of the Central Bank of Argentina impose, among other measures, the obligation of Argentinean residents to transfer to Argentina and/or sell for Argentinean pesos in the Argentinean foreign exchange market (mercado de cambios) the countervalue (contravalor) from their exports of goods within a specified period. The export of goods is regulated by the Consolidated Text on “Foreign Trade and Exchange” issued by the Argentinean Central Bank (as amended from time to time) which establishes the specific regulatory requirements to implement the measures adopted by the national government in this area. Prior approval of the Argentinean Central Bank is generally required to access the foreign exchange market for transactions relating to the outflow of funds, except in certain circumstances.
In October 2022, the Argentinean national government implemented the Argentinean System of Imports (Sistema de Importaciones de la República Argentina) (“SIRA”) and the Argentinean System of Imports and Foreign Payments of Services (Sistema de Importaciones de la República Argentina y Pagos de Servicios al Exterior). Importers must obtain a SIRA approval in the form of a SIRA certificate for the import of goods and to access the foreign exchange market for payments in connection with the import of goods. Additionally, from 1 January 2023, Argentinean residents, such as CVSA, must comply with certain supplementary provisions in order to access the foreign exchange market without prior approval of the Argentinean Central Bank, unless an exception applies.
CVSA had a cash balance equivalent to $116 million at 31 December 2022. The cash balance is available to be paid to AngloGold Ashanti’s offshore ($105 million (equivalent)) and onshore ($15 million (equivalent)) investment holding companies in the form of declared dividends. Applications have been made to the Argentinean Central Bank to approve the purchase of U.S. dollars in order to distribute offshore dividends related to the 2019, 2020 and 2021 financial years of $105 million (equivalent) to AngloGold Ashanti. Also, under a special regime established for dividend payments, a new petition to distribute a portion of the offshore dividends applied for, in the amount of $54 million (equivalent), was submitted to the Argentinean Central Bank during the third quarter of 2022. In December 2022, the Argentinean Central Bank approved, based on the applications submitted under this special regime, the payment of $17 million (equivalent) to AngloGold Ashanti. As a result, during 2022, AngloGold Ashanti received offshore dividends from CVSA in a total amount of $17 million (net of withholding taxes) paid in U.S. dollars. While the remaining approvals are pending, the cash remains fully available for CVSA’s operational and exploration requirements.
Export duties
On 21 December 2019, the National Law on Social Solidarity and Productive Reactivation (Law No. 27, 541) (the “Solidarity Law”) was enacted. The Solidarity Law granted the national government power until 31 December 2021 to impose export duties which may not exceed certain caps. For example, the Solidarity Law provides that export duties on mining exports cannot exceed eight percent of the taxable value or official FOB price. On 2 October 2020, the national government published Decree No. 785/2020 (the “Export Duties Decree”) which sets an export duty rate of eight percent for certain goods, including doré bars and gold alloys, and revoked the provisions of Decree No. 793/2018 which had previously set the export duty at 12 percent ad valorem. While the Export Duties Decree was set to expire at the end of 2021, on 31 December 2021, the national government published Decree No. 908/2021, extending the deadline of export duties on certain goods, including doré bars and gold alloys, until 31 December 2023. It is uncertain whether the national government is empowered to extend such deadline beyond the date set forth in the Solidarity Law. These export duties, if not compensated with other tax reductions, affect the tax stability guarantee granted to CVSA in 1996 in light of the fact that at the time export duties were zero percent.
67
On 26 February 2019, the Argentinean tax and mining authorities published a resolution (RC 4428/2019) establishing an administrative procedure to be followed to obtain the reimbursement or compensation of federal taxes paid in excess of the total tax burden provided for by the applicable tax stability guarantee (the “2019 Procedure”). CVSA initiated the 2019 Procedure to claim compensation for the export duties it paid in 2018, 2019 and 2020 as export duties are not contemplated by its tax stability guarantee. Prior to the publication of RC 4428/2019, CVSA had already submitted to the tax authorities claims for reimbursement of the export duties it paid from 2008 to 2015.
Pursuant to the 2019 Procedure, the National Mining Secretariat issued favorable opinions regarding CVSA’s claims in respect of fiscal years 2018 and 2019, which amounted to approximately $2.0 million and $6.3 million, respectively, as of 31 December 2022. These claims are currently under review by the relevant customs authorities. On 14 July 2021, CVSA submitted its claim in respect of fiscal year 2020, which amounted to approximately $12.4 million as of 31 December 2022. The National Mining Secretary has not yet issued an opinion regarding this claim.
Furthermore, CVSA has requested the tax authorities to apply the 2019 Procedure in respect of its historical claims for fiscal years 2008 to 2015 during which the imposition of export duties also exceeded CVSA’s total tax burden under its tax stability guarantee. However, these claims, which amounted to approximately $3.1 million as of 31 December 2022, are still being reviewed under the rules to challenge export duties instead of the 2019 Procedure. CVSA has appealed the application of those rules and a third Greenfielddecision on this issue is pending.
On 9 June 2022, the Argentinean tax and mining authorities published a resolution (RC 5205/2022) establishing a new administrative procedure to be followed to obtain the reimbursement or compensation of federal taxes paid in excess of the total tax burden provided for by the applicable tax stability guarantee (the “2022 Procedure”). This 2022 Procedure replaces the 2019 Procedure established by RC 4428/2019. On 20 September 2022, CVSA submitted its claim for compensation for the export duties in respect of fiscal year 2021, which amounted to approximately $11.2 million as of 31 December 2022, pursuant to the 2022 Procedure. This claim is currently under review by the National Mining Secretary.
In total, AngloGold Ashanti’s net export duty receivables (after discounting provisions) in Argentina amounted to $9 million as of 31 December 2022.
Environmental laws relating to mining
Any mining company wishing to commence or modify any mining-related activity, as defined by the Argentinean Mining Code, including prospecting, exploration, exploitation, development, preparation, extraction, and storage of mineral substances, as well as property abandonment or mine closure activity, is required to prepare and submit to the competent provincial environmental authority an Environmental Impact Assessment (“EIA”) prior to commencing the work. Each EIA is required to describe the nature of the proposed work, its potential risk to the environment, and the measures that will be taken to mitigate that risk. If accepted by the competent authority, the EIA is used as the basis to create a Declaration of Environmental Impact (“DEI”) to which the mining company is required to adhere during the mining-related activity at issue. The DEI is required to be updated at least on a biannual basis. Sanctions and penalties for non-compliance with the DEI are outlined in the Environmental Protection section of the Argentinean Mining Code, and may include warnings, fines, suspension of quality certifications, obligations to restore the environment, temporary or permanent closure of activities, and withdrawal of authorisation to conduct mining-related activities.
AngloGold Ashanti’s rights and permits
The mining concession holder of Cerro Vanguardia, the Company’s operation in Argentina, is AngloGold Ashanti’s partner, Fomento Minero de Santa Cruz S.E. (“Fomicruz”), which is wholly owned by the Santa Cruz Province. On 27 December 1996, Fomicruz entered into a usufruct agreement whereby CVSA was granted an irrevocable right to exploit the Cerro Vanguardia deposit (encompassing an area of approximately 543 km2) for a 40-year period. The mining licence (402642/CV/97), which covers the full Mineral Reserve, expires on 26 December 2036. CVSA is a corporation incorporated in Argentina indirectly controlled by AngloGold Ashanti (92.5 percent), with Fomicruz as minority shareholder (7.5 percent). On 14 August 1996, CVSA obtained its tax, customs and foreign exchange stability certificate, which expires in 2026.
Brazil
General laws relating to mining and land ownership
The Brazilian Constitution of 1934 states that, for purposes of exploration and exploitation, deposits and other Mineral Resources constitute property separate from the soil and belong to the Federal Union. Exploration and exploitation of such Mineral Resources may take place only with the Federal Union’s concession and in such a way as to protect the national interest. Federal law sets out penal and administrative sanctions for conduct and activities deemed harmful to the environment.
In Brazil, the National Mining Agency (“ANM”) is the state body within the Mines and Energy Ministry (“MME”) that is responsible for: (i) the registration of mining titles, (ii) the grant of authorisations and concessions, (iii) the supervision of mining activities and mining titleholders, and (iv) the issuance of supplementary rules in relation to mining activity.
68
Under the current Brazilian Mining Code, there are two kinds of mines: (i) claimstake mines (minas manifestadas), for which rights were acquired before 1934 and exist independently of any mining licence or authorisation from the Federal Government and for which the Mineral Resources constitute property of the landowner, and (ii) granted mines, which are those that rely on grants from the Federal Government for mineral exploration or exploitation (pursuant to the Brazilian Constitution of 1988). AngloGold Ashanti’s operations in Brazil consist of both claimstake mines and granted mines.
Mining activities in granted mines must be performed in two defined stages: (i) exploration, which entails defining and evaluating the deposit and determining the feasibility of exploitation, and (ii) exploitation, which involves coordinating operations aimed at the industrial exploitation of the mineral deposit, from the extraction of useful minerals to their processing. Exploration authorisations issued by the ANM are valid for one to four years. One extension can be obtained automatically as long as it is justified. For more than one extension, the extension request will have to satisfy specific legal requirements. In contrast, exploitation rights, once granted, are valid for the lifetime of the deposit, provided the mining titleholder complies with all legal requirements. Pursuant to these requirements, for example, titleholders must (i) start work on mineral exploitation within six months from the date of publication of the Exploitation Concession, (ii) continue their mining activities until the mineral deposit has been exhausted, in accordance with the Economic Exploitation Plan (Plano de Aproveitamento Econômico) approved by the ANM, and (iii) refrain from suspending mining activities without prior notice to the ANM.
Tax laws relating to mining
During the exploration period, the mining titleholder has to pay an Annual Rate per Hectare (Taxa Annual por Hectare or “TAH”), subject to a maximum value set by law. In the exploitation period, regardless of the legal regime governing the project La Colosa, voluntarily(whether claimstake or granted mines), the mining titleholder has to pay the Financial Compensation for Exploiting Mineral Resources (Compensação Financeira pela Exploração Mineral or “CFEM”). The CFEM which is 1.5 percent for gold is currently calculated based on revenues.
At the end of 2011 and the beginning of 2012, the states of Minas Gerais, Pará, Amapá and Mato Grosso do Sul each created a new “inspection and control” tax (duty) on extraction and exploration activities as well as on the use of Mineral Resource carried out in those states. In the state of Minas Gerais, gold ore and silver ore are exempted from the collection of this new duty. At the end of 2020, the state of Goiás created a new “inspection and control” tax (duty) on extraction and exploration activities carried out in this state, which currently still needs to be implemented. The constitutionality of these “inspection and control” taxes was upheld by the Supreme Court of Brazil on 1 August 2022.
Environmental laws relating to mining
Following the catastrophic failure of a tailings storage facility (“TSF”) at the Córrego do Feijão iron ore mine owned by Vale at Brumadinho in the state of Minas Gerais in Brazil in January 2019, executive, legislative and judiciary bodies, both at the federal and state levels, have generally increased scrutiny of mining operations in Brazil, and of TSFs in particular, and have been considering, and in some cases have adopted, stricter laws and regulations applicable to the approval, licensing, construction, management, closure and decommissioning of TSFs in Brazil.
At the federal level, the ANM issued Resolution No. 13/19 in August 2019 (replacing its earlier Resolution No. 4/19) which adopted additional regulatory measures to ensure the stability of TSFs, in particular those built or heightened by the upstream method or by any method declared as “unknown”. Among other things, ANM Resolution No. 13/19 prohibits the upstream method for the construction or heightening of tailings dams throughout the national territory of Brazil. It further requires operators to cease all storage and disposal activities at TSFs (known as “deactivation” or “desativação”) constructed or heightened upstream or by an “unknown” method by 15 September 2021 as well as to decommission such TSFs by 15 September 2022 to 15 September 2027 (depending on the capacity volume). To comply with the terms of ANM Resolution No. 13/19, the Serra Grande tailings dam in the state of Goiás must be decommissioned by 15 September 2025. The Serra Grande mine completed the process of reinforcing the dam walls of its upstream TSF, deactivating the TSF and migrating to dry-stacking operations, each by the 15 September 2021 deadline.
Furthermore, Federal Law No. 14.066/20, adopted in October 2020, also imposes requirements on companies to decommission upstream TSFs, including the Serra Grande tailings dam, by 25 February 2022 (which date is earlier than required by ANM Resolution No. 13/19). However, Federal Law No. 14.066/20 does permit extensions of the compliance deadline, with the consent of the ANM based on the technical plan for decommissioning. Serra Grande submitted timely requests to obtain an extension of the compliance deadline until 2025 in line with the timeline set forth in ANM Resolution No. 13/19 and presented its technical plan for decommissioning. On 26 May 2022, the ANM issued a technical note allowing the extension until 2025. With respect to downstream (or “centerline”) TSFs, Federal Law No. 14.066/20 requires companies, to the extent that communities are located in the self-rescue zone of those TSFs, to implement one of the following measures for such structures: either (i) the structure must be deactivated and decommissioned, (ii) the population must be relocated, with reparations for loss of cultural heritage, or (iii) reinforcement works that guarantee the effective stability of the structure must be carried out, by decision of the public authorities, taking into account the previous nature of the dam in relation to the occupation and technical-financial viability of the alternatives. Even if reinforcement works are completed, deactivation and decommissioning of those TSFs will be required at the end of the life of the mine. All of the TSFs operated by AngloGold Ashanti in Brazil have communities located in self-rescue zones.
69
As of 31 December 2022, AngloGold Ashanti has fully transitioned to dry-stacking operations for tailings storage at each location in Brazil. Capital expenditures required in 2022 to implement this new technology amounted to approximately $83 million. Capital expenditures for work required to comply with TSF-related requirements during the period 2023-2025 are expected to be material but, based on preliminary estimates to date, AngloGold Ashanti anticipates that annual expenditures for each of these years will be less than in prior years and will decline over time. Neither ANM Resolution No. 13/19 nor Federal Law No. 14.066/20 requires removal of all tailings material in connection with the decommissioning of TSFs (a process known as “decharacterisation” or “descaracterização”).
At the state level, the state legislator in the state of Minas Gerais adopted Law No. 23.291/19 in February 2019 which contains the state’s policy on TSF safety and should be implemented in conjunction with the equivalent federal policy. Among other things, Law No. 23.291/19 determines the criteria for licensing and inspecting TSF structures, prohibits TSFs constructed or heightened using the upstream method, establishes bond requirements and holds management liable for non-compliance with its provisions. The government of Minas Gerais adopted several decrees in furtherance of this legislation.
In addition, ANM Resolution No. 95/22, which became effective on 22 February 2022, effectively consolidates prior federal resolutions on TSFs, including ANM Resolution No. 13/19, and establishes new criteria for the operational management of TSF structures, changes the criteria related to the risk classification of TSF structures and emergency levels and sets new criteria for the suspension, embargo (order to stop operations) and interdiction of TSF activities. Operators of TSFs were mandated to conduct and submit risk assessments to the ANM by December 2022 and are required to update those risk assessments every two years. Operators are also required, on an annual basis, to obtain certifications from external consultants of the geotechnical stability of TSF structures and the adequacy of emergency response plans. In late 2022, tailings deposition was required to be suspended since 2017 due to force majeure recognizedembargos at five of AngloGold Ashanti’s TSFs in Brazil pending certification by external consultants of on-site emergency response plans (Declaração de Conformidade e Operacionalidade (“DCO”)) as well as, at one such TSF, certification by external consultants of geotechnical stability (Declaração de Condição de Estabilidade (“DCE”)) consistent with the new standards. In addition, at the Calcinados TSF, a risk assessment conducted in December 2022 with oversight from external consultants, as required by Brazilian regulations, concluded that additional buttressing should be completed to align the TSF’s post liquefaction factor of safety with international standards currently considered best practice. Construction at the Calcinados TSF is expected to begin later in 2023, and the timeline for completion will be determined once the engineering and geotechnical work has been completed by external consultants. Tailings deposition at the Calcinados TSF, as well as processing of gold concentrate at the Queiroz plant, which services the Cuiabá mine complex, is suspended until additional buttressing of the Calcinados TSF impoundment is complete.
On 1 December 2022, the ANM published ANM Resolution No. 122/22, which relates to administrative sanctions for non-compliance with mining and dam safety regulations and which, in addition to significantly increasing the values of applicable fines and penalties, establishes procedures and parameters for available sanctions including seizures of ore, goods and equipment, suspension of mining activities, demolition of mine infrastructure and invalidation or cancellation of title and exploration licences.
Further amendments to the regulatory requirements in Brazil governing such TSFs and related dams are expected to be adopted in 2023.
AngloGold Ashanti’s rights and permits
At AGA Mineraçao, Cuiabá has a single mining concession (No. 000.323/1973) covering a total area of 3,662 hectares. In February 2022, two additional mining concessions for Cuiabá (Nos. 830.937/1979 and 831.027/1980) were published, which cover an additional area of 816.2 hectares. Lamego has a single mining concession (No. 932.710/2017) covering a total area of 1,622 hectares. Córrego do Sítio is hosted by five geographically contiguous mining concessions (i.e., Nos. 930.556/2000, 930.181/2008, 830.129/1982, 833.472/2003 and 830.943/1979) covering a total area of 6,017 hectares.
At Serra Grande, the Company has interests in or agreements over 25,719.94 hectares in the Crixás greenstone belt, representing approximately 87 percent of the relevant tenements that correspond to all current exploration and mining activities. These have been held since 1987. The mining concessions include mining concession No. 002.286/1935 covering an area of 4,206.88 hectares, mining concession No. 960.658/1987 covering an area of 1,946.89 hectares, mining concession No. 860.746/2005 covering an area of 88.28 hectares, mining concession No. 862.103/1994 covering an area of 125.41 hectares and mining concession No. 804.366/1975 covering an area of 196.05 hectares.
All of the Company’s mining concessions in Brazil are currently active, in good legal and operational standing, and free of liabilities and/or major obligations. Brazilian mining concessions remain valid up to the depletion of the Mineral Reserve and Mineral Resource pursuant to the Economic Exploitation Plan approved by the Colombia national mining authority, relating toANM and in accordance with the required environmental permits, required to continue the exploration activities.and as a result do not have an explicit expiry date.
70
Colombia -
General laws relating to mining and land ownership
General regime
The Colombian Constitution declares that the sub-soil and the non-renewable natural resources located within the Colombian territory are the property of the Colombian State. The underlying principle of Colombian mining legislation for the granting of mining concession contracts over free areas is first in time, first in law. Mining activities are regulated by the Colombian Mining Code, Act 685, 2001.
The filing of an exploration and exploitation proposal triggers a right of preference to obtain rights over the targeted area, provided it is available. Such area cannot exceed 10,000 hectares. Upon receipt of a proposal, the relevant government agency determines whether another proposal or contract already governs the area. If there are no pre-existing claims, the government agency grants the applicant a “free area”.
With respect to land ownership, a mining concession in Colombia does not grant the rights over the surface required to develop a mining project. Therefore, in order to develop a mining project, it is required to acquire and secure access to the land (soil). This can be achieved in several ways, such as (i) purchase of the land, (ii) a transit easement, (iii) a mining easement, and (iv) the special acquisition process or expropriation.
Concession contract
As the sub-soil and the non-renewable natural resources located within the Colombian territory are property of the Colombian State, the Colombian Mining Authority (Agencia Nacional de Minería) grants the authorisation to explore and exploit minerals through a concession contract.
Such concessions allow concessionaires to conduct the studies, works and facilities necessary to establish the existence of minerals and to organise their exploitation. Upon being awarded a mining concession, a company must take out an insurance policy to cover the costs associated with potential environmental damage as well as breaches of its mining obligations. It may then proceed with exploration activities. Once the exploration phase is complete, the concessionaire files a new plan regarding proposed works and facilities. With the award of the mining concession or tenement contract, there are specified timelines for the completion of the various phases of a mining project, e.g. exploration, construction, exploitation. The company must comply with these timelines unless performance is suspended, for example, due to force majeure or these timelines are extended or modified. A grant of force majeure is for one year and must be renewed on an annual basis. If the company does not comply with the specified timelines for the completion of the various phases of a mining project, the mining authority may revoke the company's concession contracts or mining licences. As a general matter, any company that wishes to obtain a renewal of its concession contract must be up to date in all its legal and contractual obligations and must present a new plan of works and facilities to be implemented after the contract is renewed.
PINES programme
In 2013, the national government instituted the PINES programme designed to aid promoting certain projects that are deemed to have a national interest. This designation provides for greater oversight from the national government. All of our three advanced exploration projects (La Colosa, Quebradona and Gramalote) were considered of national strategic interest. Currently, Quebradona and Gramalote remain in the PINES programme, but La Colosa was temporarily removed as such (until the force majeure is over).
Tax laws relating to mining
From the moment the concession contract is registered with the Mining Register, the concessionaire has several financial obligations, including the payment of (i) a surface fee during the exploration, construction and assembly stage and (ii) royalties.
Once exploration is complete and the mining infrastructure in place, the concessionaire must begin paying royalties to the Colombian government, consisting of a percentage of the primary product and sub-products being exploited. The percentage of the royalty depends on the regulation in force when the concession contract is registered. In the case of the Quebradona project, the deposit mainly consists of copper followed by gold and silver. There is a five percent royalty for copper on the production value at the mine’s or well’s edge (i.e. when extracted from the subsoil). In case of gold and silver, a royalty of four percent on the production valued at the mine’s or well’s edge (i.e. when extracted from the subsoil) was established.
Furthermore, Colombian law establishes that once the environmental licence is granted the concessionaire must invest one percent of the project’s value to benefit the basins covered by the environmental licence.
71
Environmental laws relating to mining
In order to obtain an authorisation to carry out a mining project, a company must prepare an Environmental Impact Study (“EIA”) for approval by the National Environmental Licensing Authority of Colombia (Autoridad Nacional de Licencias Ambientales or “ANLA”). Global environmental licences are granted for the entire life of the project and cover all phases: construction, assembly, operation, maintenance, dismantling, final restoration, abandonment and/or termination. Construction and assembly permits (Plan de Trabajos y Obras or “PTO”) are granted by the mining authority with jurisdiction over the project.
In Colombia, the mining authority has the discretion to declare the underlying concession void if the specific company which holds the concession breaches applicable environmental laws or regulations. If the mining authority were to exercise such discretion, a company whose concession was voided would be required to abandon its projects and all of its other existing mining concession contracts. Pending proposals for new mining concession contracts would also be cancelled and the company would be banned from doing business with the Colombian government for a period of five years. As a result, the company would be unable to conduct any mining exploration or development activities during such period. However, this would not affect other subsidiaries of the company operating in Colombia, if those concession contracts are held singularly or in concert with joint venture partners.
Mining activity is prohibited in national parks, regional parks, protected forest reserves, paramos (included in Act 1753, introduced in 2015) and wetlands, pursuant to the Ramsar Convention on Wetlands of International Importance. Some forest reserves are not “protected” but are set aside for active forestry purposes and the concessionaire must obtain a specific permit to partially and temporarily change the use of the soil before pursuing exploration activities. In addition, Resolution 1987/2016, passed by the national government in late 2016, identifies areas that the Ministry of the Environment has determined to be “paramos” areas, or paramos transition areas. In these areas there are limitations on industrial or commercial work being performed, including mining. The regulation also specifies a process to determine what work, if any, can be performed in a paramos-designated area.
AngloGold Ashanti’s rights and permits
The La Colosa project managed by AngloGold Ashanti Colombia S.A.S. (“AGA Colombia”) remains in force majeure due to delays in granting environmental permits by national and local environmental authorities, thereby preventing AGA Colombia from undertaking further exploration activities. The most recent one-year grant of force majeure, during which time the specified timelines for completing the various phases of the mining project under the concession contract are suspended, will expire on 22 June 2023. AGA Colombia applied for a mining area integration (consolidation) of its concession contracts related to La Colosa, in respect of which AGA Colombia was not in compliance with some of the specified timelines. The application for mining area integration (consolidation) was approved in March 2017, which remedied the non-compliance of each consolidated concession and reset the specified timelines. La Colosa now has a single integrated mining concession contract (EIG-163) which covers a total area of 9,210 hectares and expires on 28 February 2037.
Minera de Cobre Quebradona S.A.S. B.I.C. (“MCQ”) which manages the Quebradona project, obtained the integration of concession agreement 5881 in October 2016 and registered in December 2016. As a result, MCQ was granted the exclusive right to explore, take ownership and dispose of the mineral reserves (ore) extracted from the concession area. MCQ has the right to request an extension of up to 30 years, at least two years before the expiration of the operating period. This extension is not automatic, and the request must be filed with new technical, economic, environmental and social studies that demonstrate the status of the mineral resources. Concession contract 5881 initially covered a total area of 7,593 hectares, which was reduced to 4,881.89 hectares by the relevant mining authority (Secretaría de Minas de Antioquia) on 4 March 2022. It will expire in May 2037 and is currently in its seventh year of the integrated exploration phase. In September 2021, the permits for the construction and mining operation were approved by the relevant mining authority (Secretaría de Minas de Antioquia). On 4 November 2021, ANLA officially notified AngloGold Ashanti of its decision to ‘archive’ the environmental licence application relating to the Quebradona project. ANLA has neither denied nor granted the licence, but deemed that the information provided by AngloGold Ashanti is not enough for this authority to take a substantive decision. On 18 November 2021, AngloGold Ashanti appealed the archiving decision in order to secure further details on the specific additional information ANLA requires to make a determination. ANLA denied the appeal on 29 April 2022 and the archiving decision was confirmed. AngloGold Ashanti is in the process of preparing a new Environmental Impact Assessment for the Quebradona project to submit to ANLA in connection with its environmental licence application.
The Gramalote project is organised as a joint arrangementoperation between AngloGold Ashanti (through AGA Colombia Holdings Limited and AngloGold Ashanti Holdings plc) and B2Gold Corp (B2Gold)(through B2Gold Corp. and Graminvest Ventures Limited). SinceGramalote Limited, a company incorporated under the beginninglaws of 2020, B2GoldBritish Virgin Islands which is responsible for the management oflegal vehicle operating the joint operation, established a Colombian branch, Gramalote Colombia Limited (“GCL”), to carry out activities in Colombia and obtain the mining concession contracts necessary to develop the Gramalote project. The Gramalote joint operation has been operated by B2Gold since January 2020. Pursuant to an integrated mining concession contract No. 14292, GCL was granted the exclusive right to explore, take ownership and AngloGold Ashanti and B2Gold now each hold 50 percentdispose of the attributable shares in Gramalote Limited.
72
General laws relating to mining and La Sola. Nuevo Chaquiroland ownership
General regime
Mineral and surface rights in the United States are owned by private parties, state governments or the federal government. The majority of land utilised for precious metals exploration, development and mining in the western United States is owned by the most advancedfederal government. The right to mine on such federal land in western states is governed by the U.S. General Mining Law of 1872, as amended (the “General Mining Law”), as well as relevant state statutes and regulations. The General Mining Law allows mining claims (for mining and mining-related activities) on certain federal lands after proper compliance with claim location and maintenance requirements.
Mineral exploration activities in Nevada are also generally subject to applicable federal, state, and local permitting requirements, but the specific regulatory authorisations required for the company’s activities are based on the nature and location of the targets. Nuevo Chaquiro,exploratory work. Many of the company’s Nevada operations are currently conducted under what is generally referred to under federal law as a notice-level operation subject to 43 CFR § 3809.21, while projects that are more advanced require additional permitting, including a Plan of Operations approved by the federal Bureau of Land Management (“BLM”). The State of Nevada Division of Environmental Protection’s Bureau of Mining Regulation and Reclamation (“BMRR”) also regulates mining within the state of Nevada. However, exploration projects of five acres or less on federal land, the scope of a notice-level operation under federal law, are exempt from BMRR regulation. Certain of the company’s early-stage exploration activities fall within this exemption.
The company is currently engaged in exploration activities on certain of its unpatented claims that include, but are not limited to, geological and spectral mapping, surface geochemical sampling, geophysical surveying and RC and/or diamond drilling.
Potential regulatory changes
Over the years, the U.S. Congress has considered a number of proposed amendments to the General Mining Law and other federal statutes relating to mining. Among the significant features contained in previously proposed legislation were a production royalty obligation, new and more stringent environmental standards and conditions, additional reclamation requirements, extensive new procedural steps which would likely result in extended permitting timelines, and granting counties and other entities the ability to petition the U.S. Secretary of the Interior to make certain areas unavailable for the location of unpatented mining claims. In June 2020, former President Trump signed an executive order directing certain federal agencies to streamline the review processes associated with permitting of infrastructure and natural resources projects. Many of those policies have subsequently been rescinded by the Biden administration. While certain other executive orders may favorably affect the timing of our permit and project approvals, the impact is yet to be determined and remains uncertain.
There are a number of bills being proposed to the Nevada state legislature during the 2023 legislative session that could impact the company’s planned operations. These include proposed legislation that would alter the way water rights are administered by the state, as well as a bill that would, if enacted, impose additional requirements for environmental review of mineral development projects in Nevada. At this stage, it is not possible to evaluate whether these bills will be enacted in any form by the Nevada state legislature or, if passed, what impact any might have on AGA.
AGA is currently unaware of any other new federal or state legislative or regulatory changes or rule-making that has been proposed or enacted that would adversely affect its current exploration programmes. If any requirements, standards or conditions were adopted in the future that imposed additional or new obligations or costs on AGA in connection with our exploration or extraction activities in the United States, the company’s operations in Nevada could be adversely affected.
AngloGold Ashanti’s rights and permits
In Nevada, the company’s wholly-owned subsidiaries hold a significant copper-gold porphyry, is onenumber of five known porphyry centresunpatented mining claims on the propertyfederal lands. The Silicon project consists of approximately 950 unpatented mining claims. The North Bullfrog project consists of 45 patented and has been the focus of exploration activities since the beginning of 2011 with more than 75 kilometres of drilling completed. Nuevo Chaquiro was the sole deposit consideredapproximately 1,600 unpatented mining claims (covering approximately 32,000 acres) situated in the feasibility study.Bullfrog mining district. There are also nine mining leases within the North Bullfrog project the majority of which continue in perpetuity so long as the company meets certain minimal requirements for use of the land. One mining lease is scheduled to expire in 2031. The Mother
73
Lode project consists of 13 unpatented mining claims. The North Bullfrog and Mother Lode projects are now controlled by the company as a result of its acquisition of all of the outstanding stock of Corvus Gold Inc., which closed on 18 January 2022. The southern claim block, encompassing the Sterling mine and other properties in the same general area, consists of approximately 1,900 unpatented claims (covering approximately 35,000 acres), which are now controlled by the company as a result of its acquisition of all of the outstanding stock of Coeur Sterling, Inc. (a subsidiary of Coeur Mining, Inc.), which closed on 4 November 2022. As a result of this acquisition, the company now controls a past-producing mine site in southern Nevada known as the Sterling mine, which has one applicable mining lease that expires in 2029, with the option to extend the lease for an additional ten-year period. Although the Sterling mine is currently in care and maintenance status, it remains subject to complex permitting and regulatory requirements, including compliance with relevant provisions of the U.S. Federal Mine Safety and Health Act of 1977 and oversight by the U.S. Department of Labor’s Mine Safety and Health Administration (“MSHA”).
AngloGold Ashanti integrates mine closure planning throughout the mine life cycle as follows:
•Exploration stage: developing a plan and programme for cessation and closure of exploration activities in a manner that meets local laws and AngloGold Ashanti's mine closure planning standard.
•Project phase: developing conceptual closure plans and cost estimates for all projects and including them in project feasibility studies, designs and evaluations.
•Operational phase: developing and periodically updating mine closure plans and cost estimates with increasing levels of detail and confidence over the operational phase as part of the business planning process. Closure plan updates take into account operational conditions, planning and regulatory requirements as well as advances in technology and international industry good practice (e.g., the ICMM Integrated Mine Closure Good Practice Guide). Concurrent rehabilitation, which is carried out while a mine is still operational, is a good practice that serves to decrease the final rehabilitation and closure work as well as the ultimate liability.
•Closure period: implementing the final closure plan starting at cessation of operations through a period of decommissioning, dismantling and rehabilitation until the point in time where management of the site is largely limited to monitoring and maintenance.
The host rock geology of Nuevo Chaquiro comprises a volcaniclastic sequence of Miocene age (ash, tuffs, agglomerates and andesites) intruded by small dykes of diorite and quartz diorite, also of Miocene age. The intrusions are by various pulses of dioritesCompany’s group mine closure planning standard stipulates that closure planning must be undertaken in consultation with the primary intrusive beingstakeholders. In the course of these consultations, different issues are raised which require site-specific solutions. Each mine closure plan includes a finesocial transition plan which seeks to medium grained quartz diorite. Mostminimise social impacts and maximise opportunities for local communities, including human resource, social infrastructure, economic and financial assets with the aim of enhancing the self-sustainability of mine communities after mine closure.
Provisions for decommissioning and restoration costs are made when there is a present obligation, it is probable that expenditure on decommissioning and restoration work will be required and the cost can be estimated within a reasonable range of possible outcomes. These costs are based on currently available facts, technology expected to be available at the time of the intrusives do not outcrop. These intrusivesrehabilitation, laws and regulations presently or virtually certain to be enacted and previous experience in the rehabilitation of mine sites.
Decommissioning costs and restoration costs are categorisedprovided at the present value of the expenditures expected to settle the obligation, using estimated cash flows based on current prices. Estimates are discounted at a pre-tax rate that reflects current market assessments of the time value of money.
Total provisions for decommissioning and for environmental restoration activities (excluding joint ventures) decreased by $95 million from $673 million in 2021 to $578 million in 2022. This decrease was mainly due to changes in estimates resulting from changes in discount rates, changes in global economic assumptions, changes in mine plans resulting in a change in cash flows as well as changes in the design of TSFs.
SUSTAINABILITY AND ENVIRONMENTAL, SOCIAL AND GOVERNANCE (“ESG”) MATTERS
AngloGold Ashanti’s sustainability approach is fundamental to how the Company operates its business, as well as its ability to create long-term value for its shareholders, employees and social partners through safely and responsibly exploring, mining and marketing its products. Sustainability and safety are integrated into pre-mineral, early, intra-mineralthe Company’s business and late, according to cross cutting relations, localityoperations at all levels through various frameworks, standards and copper-gold values. The developed alteration follows apolicies, and the Company measures its performance in achieving its goals against its sustainability and other ESG metrics, as well zoned porphyry type alteration system ranging from a high temperature, potassium silicate central zone (biotite, magnetite, chalcopyrite,as its engagement with stakeholders.
In mitigating the risks and molybdenite)impacts that are an inherent part of its business, AngloGold Ashanti is informed by an annual assessment of its key ESG issues. This process is aligned with guidance published by the International Integrated Reporting Council (“IIRC”), which trends into an overlying sericitic alteration zone (muscovite, chlorite, quartz, pyrite,+-tourmaline) surrounded by more distal propylitic alteration (chlorite, epidote, illite, carbonate). There is also an inner core of calcic-potassic alteration featuring biotite, actinolite, epidote,the Sustainability Accounting Standards Board (“SASB”), the Global Reporting Initiative (“GRI”) Standards and anhydrite with lower copper, gold and molybdenum values. The mineralised zone is characterised by fine stock works, disseminations and veinlets of quartz, magnetite, pyrite, chalcopyrite and molybdenite.
74
the Accountability AA1000 Stakeholder Management Standard. This assessment is annually reviewed by AngloGold Ashanti’s senior leadership and approved by the Social, Ethics and Sustainability Committee (the “SES Committee”).
AngloGold Ashanti’s board of directors, assisted by the SES Committee, has ultimate responsibility over environmental, safety, health and ethical matters and for the integration of sustainability objectives into AngloGold Ashanti’s business. This includes oversight of the Company’s stakeholder engagement framework and structures, which apply to investors, employees, governments, suppliers and communities, at every stage of its business from exploration to mine closure. Group Corporate Affairs and Sustainability is responsible for development of management systems and supports the Company’s general managers in the day-to-day implementation of its sustainability strategy.
AngloGold Ashanti maintains a set of policies and procedures to guide the Company in acting as a responsible corporate citizen, including the Code of Business Principles and Ethics which sets requirements for the implementation of key corporate policies and guidelines and applies to all management and employees, and to maintain compliance with applicable environmental, health and safety (“EHS”) laws. In 2022, AngloGold Ashanti continued with the implementation of the Integrated Sustainability Information Management System (“iSIMS”), in order to improve internal reporting and better integrate, manage and monitor sustainability activities with respect to its broader business. This common management and reporting application for all sustainability disciplines, from safety, health and security to community and environmental management, is expected to help provide timely information in each of these areas, and to facilitate transparency and decision-making in its processes and practices.
Significant EHS requirements and ESG risks and trends affecting the Company’s mining and processing operations are described below.
EHS Regulatory Compliance
AngloGold Ashanti is subject to extensive EHS laws and regulations in the various jurisdictions in which the Company operates. These requirements govern, among other things, extraction, use, conservation and discharge of water; air emissions (including dust control and greenhouse gases (“GHGs”)); mine and dam safety, regulatory and community reporting; clean-up of contamination; land use and conservation of protected areas; rehabilitation and closure of mined land; worker health and safety and community health; and the generation, transportation, storage and disposal of solid and hazardous wastes, such as reagents, radioactive materials, and mine tailings. Environmental laws and regulations applicable to the Company’s operations, including the requirements contained in environmental permits, are generally becoming more restrictive.
Capital and operating costs to comply with EHS laws and regulations have been, and are expected to continue to be, significant to AngloGold Ashanti. In addition, AngloGold Ashanti could incur fines, penalties and other sanctions, environmental clean-up costs, and third-party claims for personal injury or property or natural resources damages; suffer reputational damage; and be required to install costly pollution control equipment or to modify or suspend facilities, such as TSFs, or operations, as a result of actual or alleged violations of, or liabilities under, EHS laws and regulations. Failure to comply with applicable EHS laws and regulations may also result in the suspension or revocation of permits and, in some jurisdictions, the right to mine a given concession. AngloGold Ashanti’s ability to obtain and maintain permits and other approvals and to successfully operate near host communities may be adversely impacted by real or perceived effects on the environment or human health and safety associated with AngloGold Ashanti’s or other mining companies’ activities. In addition, unknown environmental hazards may exist at the Company’s properties which may have been caused by previous owners or operators.
Water Management
AngloGold Ashanti’s operations are heavily dependent upon access to substantial volumes of water for use in the mining and extractive processes and typically are subject to water-use permits or rights to extract water from certain natural sources that govern usage and require, among other things, that mining operations maintain certain water quality upon discharge. Water supply, quality and usage are areas of concern across all of the Company’s operations, including with respect to the Company’s mining operations in Ghana and Brazil, its mine development projects in Nevada, as well as its mine development project at Quebradona in Colombia. Any failure by the Company to secure access to suitable water supplies, or achieve and maintain compliance with applicable requirements of the permits or licences, could result in curtailment or halting of production at the affected operations. Incidents of water pollution or shortage can, in certain cases, lead to community protest and ultimately to the withdrawal of community and government support for AngloGold Ashanti’s operations. A failure by the Company to comply with water contamination related directives may result in further, more stringent, directives being issued against the Company, which may, in some cases, result in a temporary or partial shutdown of some of the Company’s operations.
Where feasible, the Company operates a “closed loop” system which recycles the water used in its operations without discharging it to the environment. In some areas, however, such as Ghana and Brazil, high levels of rainfall and surface water runoff mean that a closed loop system is not feasible and that discharges, after water treatment where necessary, must take place.
75
Waste Management
During open-pit mining, large volumes of soil and/or rock (overburden) are mined to expose the ore body. Similarly, waste rock is mined during drilling and developing access to underground ore bodies. Overburden and waste rock typically contain sub-economic levels of gold and are deposited as large waste rock facilities. Mine tailings are the process waste generated once grinding and extraction of gold from the ore is completed in the milling process and are typically deposited as slurry in large tailing storage facilities (“TSFs”) specifically designed for this purpose.
The impact of dust generation, breach, leak, or other failure of a waste rock facility or TSF, including any associated dam, can be significant, and the Company therefore monitors such facilities closely in accordance with the Company’s internal standards, independent review, national regulatory requirements, industry standards and commitments made to local communities. The occasional well-publicised failure of a third-party TSF and the potential impact of such failure also mean that these facilities are generally tightly regulated. A safety or environmental incident at the Company’s operations could result, among other things, in enforcement, including mandatory shutdown of a TSF and related facilities, obligations to remediate environmental contamination, negative press coverage, and claims for property or natural resources damages and personal injury by adjacent communities. Incidents at other mining companies’ operations could result in governmental action to tighten regulatory requirements and restrict certain mining activities, in particular with respect to TSFs, also in respect of other mine operators in that region.
For example, following the catastrophic failure of a TSF at the Córrego do Feijão iron ore mine owned by Vale at Brumadinho in the state of Minas Gerais in Brazil in January 2019, tailings were discharged into the mine’s administrative area and part of the local community, reportedly resulting in death or injury to hundreds of people. As a result of this incident, there has been considerably increased regulatory scrutiny in Brazil and other areas on mining operations generally, and the requirements applicable to the approval, licensing, construction, management, closure and decommissioning of TSFs have generally become far more stringent. For example, in late 2022, tailings deposition was suspended at five of AngloGold Ashanti’s TSFs in Brazil pending certification by external consultants of on-site emergency response plans (“DCO”) and/or geotechnical stability (“DCE”) consistent with new regulatory standards enacted in early 2022. In addition, at the Calcinados TSF, a risk assessment conducted in December 2022 with oversight from external consultants, as required by Brazilian regulations, concluded that additional buttressing should be completed to align the TSF’s post liquefaction factor of safety with international standards currently considered best practice. The timeline for completion will be determined once the engineering and geotechnical work has been completed by external consultants. For further information on the regulatory framework governing TSFs in Brazil, see “Item 4B: Business Overview—The Regulatory Environment Enabling AngloGold Ashanti to Mine—Americas—Brazil”.
In addition, a new Global Industry Standard on Tailings Management (“GISTM”) was established in August 2020 by a panel comprised of industry and non-governmental organisation (“NGO”) experts. AngloGold Ashanti has committed to comply with the GISTM at all of its TSFs by August 2025, and the costs related to meeting such standard are not expected to be material to AngloGold Ashanti.
In addition, AngloGold Ashanti could incur liabilities, or material costs to manage solid and hazardous waste generated by its mining activities, including dust and residual chemicals and metals. For example, AngloGold Ashanti expects to incur approximately $25 million to $30 million in capital expenditure and operating costs during 2023-2026 in connection with treatment and disposal of a quantity of legacy arsenic trioxide waste located at the Obuasi mine.
Groundwater Impacts and Environmental Remediation
As AngloGold Ashanti or its predecessors have a long history of mining operations in certain regions, issues may arise regarding historical, as well as potential future, environmental or health impacts in those areas, for which AGA, as the current owner/operator, may be legally responsible. For example, AngloGold Ashanti has identified groundwater contamination plumes at certain of its operations. Numerous scientific, technical and legal studies have been undertaken to assist in determining the magnitude of the impact and to find sustainable remediation solutions. Based on those studies as well as discussion with regulators, the Company has taken steps, including monitored natural attenuation and phyto-technologies, to address soil and groundwater contamination, including in Tanzania, where an in-situ remediation project to address sulfate in groundwater commenced operations in 2022.
Subject to the completion of site-specific trials and potential technologies being confirmed as viable remediation techniques, no reliable estimate can be made at this time for the obligation. Should these obligations be significant, this could have a material adverse impact upon AngloGold Ashanti’s results and its financial condition.
Climate Change and GHG Regulation
At AngloGold Ashanti, climate change is a board of directors-level governance issue, overseen by the SES Committee and the Audit and Risk Committee. AngloGold Ashanti’s Climate Change Strategy, which was approved by the board of directors in November 2021, seeks to embed the management of physical, regulatory and transition climate change-related risks, as well as climate change-related opportunities, into the Company’s strategic and operational planning processes.
76
In 2021, AngloGold Ashanti committed to the International Council on Mining & Metals (“ICMM”) target of achieving net zero Scope 1 and Scope 2 GHG emissions by 2050. AngloGold Ashanti has also committed to achieving a 30 percent reduction in absolute Scope 1 and 2 emissions by 2030 (as compared to a 2021 baseline), and, in partnership with value chain partners, to set Scope 3 GHG reduction targets, if not by the end of 2023, as soon as possible thereafter.
In December 2015, certain members of the international community negotiated a treaty at the Conference of the Parties of the UN Framework Convention on Climate Change in Paris (the “Paris Agreement”). The Paris Agreement, which came into force on 4 November 2016, requires developed countries to set targets for emissions reductions. As a result, measures designed to limit or reduce GHG emissions, both mandatory and voluntary, have been, and are expected to be, implemented at national or regional levels in various countries.
New regulatory requirements, or changes required to effectively transition to a low-carbon economy, could require AngloGold Ashanti to reduce its direct GHG emissions or energy use, change its fuel mix or incur significant costs for GHG emissions permits or taxes, including for those costs or taxes passed on by electricity utilities which supply the Company’s operations. AngloGold Ashanti could also incur significant costs associated with capital equipment, GHG monitoring and reporting and other obligations to comply with applicable requirements. The most likely source of these obligations is through nation state-level implementation of new emissions or financial obligations pursuant to evolving climate change regulatory regimes.
For example, in 2010, Brazil launched the National Climate Change Policy, which established a voluntary national GHG reduction target of 36.1 percent to 38.9 percent below the projected emissions in 2020 for “business as usual”. The policy required the development of sector-specific plans in order to meet the target and provided for a Brazilian GHG trading scheme, which is yet to be designed. While Brazil is not yet requiring mandatory GHG emissions reporting at the national level, some state environmental agencies have requested companies to voluntarily submit GHG emissions management plans. However, the states of Goiás and Minas Gerais (in which AngloGold Ashanti operates) do not currently require GHG emissions management plans for mining projects. In 2015, Brazil announced, in connection with its commitments under the Paris Agreement, economy-wide absolute mitigation targets providing for a 37 percent reduction in GHG emissions by 2025, as compared to 2005, and a goal to reduce GHG emissions by 43 percent by 2030 compared to 2005 levels.
In addition, in Australia, the Safeguard Mechanism (Rule 2015), through the National Greenhouse and Energy Reporting (“NGER”) scheme, provides a framework for Australia’s largest emitters to measure, report and manage their emissions. The Safeguard Mechanism applies to facilities with Scope 1 covered GHG emissions of more than 100,000 tonnes of CO2e per fiscal year. During the 2018/19 fiscal year, Tropicana’s emissions were within its authorised threshold and Sunrise Dam was required to purchase offsets for emissions that were 0.8 percent above its safeguard threshold, the cost of which was immaterial. Two amendments to the Safeguard Mechanism (Rule 2015) enacted in March 2019 and May 2020 allowed for the application of transitional calculated baselines using estimated CO2-e emissions intensities. Based on the production and emissions forecasts, the Australian mining operations applied to use transitional calculated baselines in 2020 for Sunrise Dam and Tropicana, which were approved by the Clean Energy Regulator effective 1 July 2019 to 30 June 2022 for both operations. Thereafter, the Australian mining operations will be required to apply production-adjusted baselines and, if actual emissions exceed the baseline, to purchase emissions offsets for the business. In any event, the cost of such offsets, if ultimately required to be purchased, including due to a change in the operations under the business plan prior to June 2022, are not expected to be material to the Company’s business.
In addition to more stringent requirements and commitments, AngloGold Ashanti’s operations are subject to a number of physical risks from climate change, such as changes in rainfall rates or patterns resulting in floods or droughts, reduced water availability, higher temperatures and extreme weather events. Such events or conditions, particularly including flooding or inadequate water supplies, could disrupt mining and transport operations, mineral processing and rehabilitation efforts, create resource or energy shortages or damage the Company’s property or equipment and increase health and safety risks on site. In consultation with external consultants, physical climate risk assessments were undertaken for all operations using current climate models for the business and various decarbonisation scenarios and climate adaptation plans were outlined. These physical climate risks will be further reviewed and refined in 2023.
Occupational Safety and Health
AngloGold Ashanti is subject to a variety of laws and regulations in each of the jurisdictions where the Company operates that are designed to protect and improve the safety and health of employees. In some of the jurisdictions in which AngloGold Ashanti operates, the government enforces compulsory shutdowns of operations to enable investigations into the cause of accidents and introduce corrective measures at those operations.
Safety remains a priority for AngloGold Ashanti and a focus of AngloGold Ashanti’s long-term sustainability approach, as well as the Company’s continuing efforts to manage the risks inherent to its operations, to model critical controls and to strengthen safety protocols and preventative measures. AngloGold Ashanti has made significant strides in improving safety. In 2022, there was a 41 percent reduction in year-on-year total recordable injury frequency rate, and no fatalities at any of the mines operated by AngloGold Ashanti.
AngloGold Ashanti’s Group Safety Strategy, which is updated every three years, seeks to integrate operational risk management and key performance indicators at all levels of the organisation and maintain alignment with global safety standards. The SES
77
Committee oversees the implementation of the Group Safety Strategy. All operations, have been certified to ISO 45001:2018, which has replaced the OHSAS 18001:2007 series.
Community Health and Tropical Diseases
AngloGold Ashanti is also subject to health and safety regulations relating to occupational disease. The primary areas of focus in respect of occupational health of employees within the Company’s operations are noise-induced hearing loss (“NIHL”) and occupational lung diseases (“OLD”). OLD includes occupational tuberculosis and silicosis in individuals exposed to silica dust. Silicosis has been particularly prevalent in South Africa and has also arisen at the Company’s Africa region and Brazilian operations, albeit to a far lesser extent. AngloGold Ashanti provides occupational health services to its employees at its occupational health centres, clinics, and through outsourced service centres. The Company continues to expand preventative occupational hygiene initiatives, such as implementing various control measures to prevent hazardous exposures, and providing employees with Personal Protective Equipment.
In 2019, the Johannesburg High Court approved the settlement of existing silicosis and tuberculosis class actions against AngloGold Ashanti and other gold mining companies in South Africa. The recent sale of the Company’s South African operating assets and liabilities did not include the silicosis or tuberculosis settlement obligations relating to South African employees, which were retained by AngloGold Ashanti. For further information, see “Item 18: Financial Statements—Note 1.2—Statement of Compliance—Significant Accounting Judgements and Estimates—Provision for silicosis”.
In addition to OLD, HIV and AIDS and associated diseases remain major health care challenges faced by AngloGold Ashanti’s Africa region operations. AngloGold Ashanti continues to implement programmes to help those infected with HIV and prevent new infections from spreading.
Malaria and other tropical diseases also pose health risks at all of the Company’s operations in Central, West and East Africa where such diseases may assume epidemic proportions because of ineffective national control programmes. Malaria is a major cause of death in young children and pregnant women and also gives rise to deaths and absenteeism in adults. All affected Company operations in Africa have malaria control programmes in place. The Ghana Obuasi malaria control programme activities have been completed in 16 districts of Ghana as planned for 2022 and a new cycle of indoor residual spraying will commence in 2023; in partnership with the Global Fund and the Ghana Department of Health.
In 2022, the COVID-19 pandemic subsided significantly with decreases in reporting of severe disease or deaths. Nevertheless, AngloGold Ashanti continued to direct resources for close surveillance and maintenance of controls within the company with a view to ensure continuity of its operations and avoid any potential disruption in the event of a re-emergence of the pandemic. Universal access to safe and effective vaccines provided an additional layer of protection, especially against severe forms of disease, hospitalisation and death. The company endeavoured to continue to provide prompt access to approved and available vaccines for all workers, especially employees considered to be at high risk as well as employees with critical skills.
The emergence of COVID-19 however also assisted to better integrate broad health risk management beyond occupational health into the overall business strategy, to contribute to productivity as well as the social licence to operate and to improve various prevention and risk management protocols in place to address the potential risk of an epidemic or pandemic, particularly after the company’s experience with Ebola in Guinea in 2014 and 2015.
The company focused on optimising mental wellbeing, minimising non-communicable diseases associated with lifestyle as well as the need for systematic contribution to health system strengthening, local skill development and overall community development in the jurisdictions in which it operates. Such risks impair the health of workers and negatively affect productivity and profitability as a result of workers’ diminished focus or skill, absenteeism, treatment costs and allocated resources. As part of AngloGold Ashanti’s continuing efforts, the company recently approved the newly updated health, hygiene and wellbeing standards based on identified major health hazards or risks which include gender, cultural and other applicable diversity considerations for risk management and controls.
Diversity and Inclusion (“D&I”)
With more than 30,000 employees (including contractor employees) on four continents, AngloGold Ashanti believes that having a diverse and inclusive workforce is important to continuing to attract talent in order to maintain competitiveness and the long-term sustainability of its business. In addition, the Company strives to have a workforce that represents the societies in which AngloGold Ashanti operates in connection with maintaining its social licence to operate.
AngloGold Ashanti’s D&I approach is aligned to the United Nation Sustainable Development Goals (“UNSDGs”) (SDG 5, 8 and 10) and the United Nations Global Compact (“UNGC”). The Company has developed a Diversity & Inclusion Framework, which aims to foster the empowerment of all staff, irrespective of race, gender, ethnicity, religion and sexual orientation and has established specific priorities and actions for the next two to five years to foster the inclusion of D&I objectives in its processes. Leadership teams are responsible for meeting defined diversity targets. In 2022, AngloGold Ashanti conducted an analysis of global gender data across job level, function and country. The analysis was carried out to inform AngloGold Ashanti’s D&I strategy.
78
Human Rights and Indigenous Peoples
In its commitment to respecting and promoting human rights, AngloGold Ashanti supports the United Nations Guiding Principles for Business and Human Rights (“UNGP”) and other international initiatives, including the UNGC and the Voluntary Principles on Security and Human Rights (“VPSHR”). The VPSHR, which seeks to balance safety and security needs against respect for human rights and fundamental freedoms, were developed through multi-stakeholder participation between governments, extractive industry members and NGOs. Community and security related matters, including with respect to illegal and artisanal and small-scale mining and related intrusions into the Company’s operational areas, are addressed at board of directors-level by the SES Committee. AngloGold Ashanti’s internal Human Rights Framework includes numerous policies, management standards and guidance documents which apply to all of its employees, contractors and suppliers and require reporting of, and redress for, human rights violations and related allegations.
The Company is aligned with the ICMM Position Statement on Indigenous Peoples and the International Finance Corporation’s Performance Standard 7 on Indigenous Peoples and other international standards and treaties in the area of Indigenous Peoples’ rights.
79
ANGLOGOLD ASHANTI GLOBAL FOOTPRINT: 2022
Operations and projects
Notes
(1) Gramalote is managed by B2Gold Corp ("B2Gold").
(2) AngloGold Ashanti acquired North Bullfrog and Mother Lode as part of the Corvus Gold Inc. ("Corvus Gold") acquisition in January 2022.
(3) AngloGold Ashanti acquired Sterling through the Coeur Sterling, Inc. ("Coeur Sterling") acquisition in November 2022.
(4) Kibali is operated by Barrick Gold Corporation ("Barrick").
80
OPERATING PERFORMANCE
Group description
AngloGold Ashanti is an independent global gold mining company with a diverse high-quality portfolio of operations, projects and exploration activities and is headquartered in Johannesburg, South Africa.
In 2022, our portfolio of ten operations in seven countries includes long-life operating assets with differing ore body types located in key gold-producing regions around the world. These operating assets were supported by greenfields projects in Colombia and a focused global exploration programme, including exploration in the United States.
Our operations and projects are grouped into the following regions: Africa, Americas and Australia.
On 12 February 2020, the Company announced that it had reached an agreement with Harmony to sell all its remaining South African producing assets and related liabilities. The sale closed on 30 September 2020. On 10 November 2020, the Company announced that it had completed the sale of its interest in the Morila mine in Mali and on 30 December 2020, the Company announced that it had completed the sale of its interest in the Sadiola Mine in Mali.
AngloGold Ashanti’s operations and joint arrangements employed, on average, 32,594 people (including contractors) in 2022 (2021: 30,561).
Performance
In 2022, AngloGold Ashanti produced attributable 2.742 million ounces of gold (2021: 2.472 million ounces), as well as 3.2 million ounces of silver and 352 tonnes of sulphuric acid as by-products.
Production of 2.742 million ounces of gold was achieved in 2022 at a cost of sales of $3.4 billion for subsidiaries and $342 million for equity-accounted joint venture operations, and an all-in sustaining cost of $1,439 per ounce for subsidiaries and $979 per ounce for equity-accounted joint venture operations, compared to a production of 2.472 million ounces in 2021 at a cost of sales of $2.9 billion for subsidiaries and $350 million for equity-accounted joint venture operations, and an all-in sustaining cost of $1,441 per ounce for subsidiaries and $856 per ounce for equity-accounted joint venture operations.
Gold
The AngloGold Ashanti gold Mineral Reserve increased from 28.1 million ounces as at 31 December 2021 to 28.8 million ounces as at 31 December 2022. This excludes Gramalote as the JV partner has decided not to publish the Mineral Reserve. This annual net increase of 0.7 million ounces includes additions due to exploration and modelling changes of 2.9 million ounces and changes in economic assumptions of 1.0 million ounces. This increase was partially offset by depletion of 2.9 million ounces and reductions due to other factors of 0.3 million ounces. The Mineral Reserve was estimated using a gold price of $1,400 per ounce, unless otherwise stated (2021: $1,200 per ounce). See “Item 4D Property, Plants and Equipment—Mineral Resource and Mineral Reserve”.
Copper
The AngloGold Ashanti copper Mineral Reserveremained unchanged at 1.47Mt (3,250Mlb) as at 31 December 2022 as a feasibility study optimisation is still ongoing and no additional exploration has been completed at Quebradona. The Mineral Reserve was estimated at a copper price of $2.90/lb, unless otherwise stated (2021: $2.90/lb). See “Item 4D Property, Plants and Equipment—Mineral Resource and Mineral Reserve”.
Capital expenditure, including equity-accounted joint ventures, in 2022 amounted to $1,118 million (2021: $1,100 million).
Safety
No fatal occupational safety incidents at any of the mines operated by the Company were recorded for 2022. The TRIFR was 1.26 per million hours worked in 2022 compared to 2.14 per million hours worked in 2021.
Full Asset Potential Review Programme
The Full Asset Potential (“FP”) programme aims to achieve a step-change in AngloGold Ashanti’s operating and cost performance by the year 2024. This programme includes a comprehensive three-month assessment of each of the Company’s mine sites, which covers every aspect of an operation. The outcome is intended to enhance the Company’s understanding of the relative potential of each asset and includes developing a plan and implementation schedule to achieve the targeted performance over the next six to 24 months. These assessments have now been completed at six operations of the Company (Sunrise Dam, Siguiri, Cuiabá, Tropicana, Serra Grande and Geita), where the relevant site leadership teams have taken full accountability for the delivery on these initiatives.
81
Operational Excellence
Operational Excellence is the continued efforts to maximise value from our assets.
New Operating Model
Our new Operating Model, designed and introduced to employees towards the end of 2021, aims to improve efficiency and support better operating outcomes by focusing only on work required to deliver the strategy, clarifying the mandates of corporate functions, properly resourcing our revenue-generating assets to deliver on their plans, and removing duplicate structures and activities. The implementation of the new Operating Model was completed during 2022.
82
AFRICA REGION
| ||
Africa is currently home to five of our operations, with one – Kibali – managed by Barrick Gold Corporation. These operations, which contributed 60 percent or 1.6 million ounces to total annual group production in 2022, are in Ghana (Iduapriem and Obuasi), Guinea (Siguiri), Tanzania (Geita) and the DRC (Kibali).
| Attributable gold production (000oz) | Average number of employees | ||||||||||
| Subsidiary operations | |||||||||||
| Ghana | |||||||||||
| Iduapriem | 248 | 2,186 | |||||||||
| Obuasi | 250 | 4,403 | |||||||||
| Guinea | |||||||||||
| Attr. Siguiri 85% | 279 | 4,052 | |||||||||
| Tanzania | |||||||||||
| Geita | 521 | 6,435 | |||||||||
| Joint venture operations | |||||||||||
| Democratic Republic of the Congo | |||||||||||
| Attr. Kibali 45% | 337 | 2,731 | |||||||||
83
Africa Region - Key Statistics
| Unit | 2022 | 2021 | 2020 | ||||||||||||||||||||
| Restated | |||||||||||||||||||||||
| Subsidiary operations | |||||||||||||||||||||||
| Tonnes treated/milled | Mt | 21.6 | 21.2 | 20.5 | |||||||||||||||||||
| Pay limit | oz/t | 0.044 | 0.035 | 0.034 | |||||||||||||||||||
| g/t | 1.516 | 1.193 | 1.160 | ||||||||||||||||||||
| Recovered grade | oz/t | 0.054 | 0.045 | 0.052 | |||||||||||||||||||
| g/t | 1.86 | 1.54 | 1.77 | ||||||||||||||||||||
Gold production (a) (attributable) | 000oz | 1,298 | 1,054 | 1,239 | |||||||||||||||||||
| Cost of sales | $m | 1,662 | 1,300 | 1,362 | |||||||||||||||||||
Total cash costs per ounce (1) | $/oz | 1,023 | 991 | 841 | |||||||||||||||||||
All-in sustaining costs per ounce(1) | $/oz | 1,291 | 1,264 | 1,002 | |||||||||||||||||||
| Capital expenditure | $m | 486 | 434 | 383 | |||||||||||||||||||
| Safety | |||||||||||||||||||||||
| Number of fatalities | 0 | 1 | 2 | ||||||||||||||||||||
| TRIFR | Per million hours worked | 0.33 | 0.61 | 0.55 | |||||||||||||||||||
| People | |||||||||||||||||||||||
| Average no of employees: Total | 17,076 | 14,806 | 14,496 | ||||||||||||||||||||
| Permanent employees | 5,780 | 5,619 | 5,433 | ||||||||||||||||||||
| Contractors | 11,296 | 9,187 | 9,063 | ||||||||||||||||||||
(a) Includes Obuasi gold production in 2020, capitalised as part of the project development.
| Unit | 2022 | 2021 | 2020 | ||||||||||||||||||||
| Joint venture operations | |||||||||||||||||||||||
| Tonnes treated/milled | Mt | 3.5 | 3.5 | 3.4 | |||||||||||||||||||
| Pay limit | oz/t | 0.054 | 0.048 | 0.048 | |||||||||||||||||||
| g/t | 1.850 | 1.652 | 1.640 | ||||||||||||||||||||
| Recovered grade | oz/t | 0.087 | 0.095 | 0.096 | |||||||||||||||||||
| g/t | 2.98 | 3.25 | 3.29 | ||||||||||||||||||||
| Gold production (attributable) | 000oz | 337 | 365 | 364 | |||||||||||||||||||
| Cost of sales | $m | 342 | 350 | 340 | |||||||||||||||||||
Total cash costs per ounce (1) | $/oz | 725 | 647 | 629 | |||||||||||||||||||
All-in sustaining costs per ounce(1) | $/oz | 979 | 856 | 810 | |||||||||||||||||||
| Capital expenditure | $m | 90 | 72 | 52 | |||||||||||||||||||
| People | |||||||||||||||||||||||
| Average no of employees: Total | 2,731 | 2,454 | 2,333 | ||||||||||||||||||||
| Permanent employees | 957 | 860 | 824 | ||||||||||||||||||||
| Contractors | 1,774 | 1,594 | 1,509 | ||||||||||||||||||||
(1)“Total cash costs per ounce” and “all-in sustaining costs per ounce” are non-GAAP measures. For further information on these non-GAAP measures, see “Item 5A: Operating Results—Non-GAAP analysis”.
84
Performance summary
Production for the Africa region was up 15 percent for the year ended 31 December 2022 at 1.635 million ounces compared to 1.419 million ounces for the year ended 31 December 2021.
Safety performance improved – there were no occupational fatalities at any of the mines operated by the Company and a TRIFR of 0.33 per million hours worked was recorded (2021: 0.61 per million hours worked).
Regional community investment totalled $10.19 million (2021: $10.5 million).
With Obuasi having received its ISO 45001 (health and safety) certification, all our Africa operations are now certified in terms of ISO 45001, ISO 14001 (environmental management) and the International Cyanide Management Code.
We continued integration of the new Operating Model, the existing Operational Excellence programme, and the Full Asset Potential (FP) review programme launched during 2021.
In the second half of 2022, Geita was part of the FP review programme designed to enhance understanding of the relative potential of each asset and includes developing a plan and implementation schedule to achieve the targeted performance over the next six to 24 months.
Siguiri was the first of the African operations to be involved in the FP review programme with the leadership team focusing on increasing the volume of high-grade oxide ore from Block 2. This increase was successful and is reflected in the year-on-year increase in production. We are starting to see the benefits of the FP review programme at Siguiri and a second contractor was hired to deliver higher volumes of higher-grade oxide ore from Block 2.
For more information regarding production performance in the Africa region, refer to “Item 5A: Operating Results—Key factors affecting results—Production in 2022”.
For more information regarding operating performance in the Africa region, refer to “Item 5A: Operating Results—Comparison of operating performance on a segment basis in 2022 with 2021”
For more information regarding capital expenditure in the Africa region, refer to “Item 5A: Operating Results—Comparison of capital expenditure in 2022, 2021 and 2020—Comparison of capital expenditure in 2022 with 2021”
Obuasi update
Phase 3 of the Obuasi redevelopment project, which relates principally to capital expenditure to refurbish existing infrastructure around the KMS Shaft, as well as to service the mine in deeper production areas, continues to progress.
In 2022, the project achieved the following milestones: hoisting via the KMS rock shaft in November 2022; pumping to drop the water level below 50 level; commissioning of the material handling system from 44 level to surface; completing the new ventilation shaft pilot hole and progressing the KMS shaft down to 44 level.
The Obuasi mine continues on the ramp-up path to its full production run-rate in excess of 400,000 ounces.
85
THE AMERICAS
| ||
The Americas hosts three of our operations – one in Argentina and two in Brazil – as well as greenfields projects in Colombia and a significant new greenfields development in Nevada in the United States.
| Attributable gold production (000oz) | Average number of employees | ||||||||||
| Operations | |||||||||||
1. Argentina | |||||||||||
| Cerro Vanguardia (Attr. 92.5%) | 170 | 1,819 | |||||||||
2. Brazil | |||||||||||
| AGA Mineração | 311 | 5,702 | |||||||||
| Serra Grande | 88 | 1,977 | |||||||||
86
Americas - Key Statistics
| Unit | 2022 | 2021 | 2020 | ||||||||||||||||||||
| Operation | |||||||||||||||||||||||
| Tonnes treated/milled | Mt | 7.1 | 7.8 | 7.5 | |||||||||||||||||||
| Pay limit | oz/t | 0.10 | 0.10 | 0.07 | |||||||||||||||||||
| g/t | 3.52 | 3.49 | 2.46 | ||||||||||||||||||||
| Recovered grade | oz/t | 0.070 | 0.066 | 0.081 | |||||||||||||||||||
| g/t | 2.40 | 2.27 | 2.77 | ||||||||||||||||||||
| Gold production (attributable) | 000oz | 569 | 559 | 649 | |||||||||||||||||||
| Silver production (attributable) | Moz | 3.2 | 3.4 | 3.3 | |||||||||||||||||||
| Cost of sales | $m | 913 | 822 | 764 | |||||||||||||||||||
Total cash costs per ounce (1) | $/oz | 1,078 | 921 | 721 | |||||||||||||||||||
All-in sustaining costs per ounce (1) | $/oz | 1,718 | 1,587 | 1,003 | |||||||||||||||||||
Capital expenditure (2) | $m | 339 | 398 | 216 | |||||||||||||||||||
| Safety | |||||||||||||||||||||||
| Number of fatalities | 0 | 1 | 0 | ||||||||||||||||||||
| TRIFR | Per million hours worked | 2.33 | 3.55 | 3.68 | |||||||||||||||||||
| People | |||||||||||||||||||||||
| Average no of employees: Total | 9,498 | 9,972 | 8,789 | ||||||||||||||||||||
| Permanent employees | 6,093 | 6,452 | 6,158 | ||||||||||||||||||||
| Contractors | 3,405 | 3,520 | 2,631 | ||||||||||||||||||||
(1)“Total cash costs per ounce” and “all-in sustaining costs per ounce” are non-GAAP measures. For further information on these non-GAAP measures, see “Item 5A: Operating Results—Non-GAAP analysis”.
(2)100 percent (not attributable) and includes Projects.
Performance summary
Production for the Americas region was up two percent for the year ended 31 December 2022 at 569,000 ounces compared to 559,000 ounces for the year ended 31 December 2021.
Safety – no occupational fatalities and the TRIFR improved to 2.33 per million hours worked (2021: 3.55 per million hours worked).
Community investment amounted to $6.4 million (2021: $5.8 million).
All operations in the Americas maintained their certification in terms of International Cyanide Management Code, ISO 45000 (health and safety) and ISO 14001 (environmental management).
During the second half of 2022, Cuiabá and Serra Grande completed assessments to identify performance improvement initiatives as part of the FP review programme. The FP programme initiatives implemented at Cuiabá have seen ore tonnes consistently above full potential target. At Serra Grande, the FP team identified several enhancement opportunities and it is following implementation plans with timelines for delivery.
In December 2022, the company suspended filtered tailings deposition on the Calcinados TSF and processing of gold concentrate at the Queiroz plant (both of which service the Cuiabá mine complex). For further information, refer to “Item 4B: Business Overview—The Regulatory Environment Enabling AngloGold Ashanti to Mine—Americas—Brazil” and “Item 3D: Risk Factors—Compliance with tailings management requirements and standards, and potential liabilities in the event of a failure to timely comply with these requirements or an incident involving a tailings storage facility, could adversely impact AngloGold Ashanti's financial condition, results of operations and reputation”.
For more information regarding production performance in the Americas region, refer to “Item 5A: Operating Results—Key factors affecting results—Production in 2022”.
For more information regarding operating performance in the Americas region, refer to “Item 5A: Operating Results—Comparison of operating performance on a segment basis in 2022 with 2021”.
For more information regarding capital expenditure in the Americas region, refer to “Item 5A: Operating Results—Comparison of capital expenditure in 2022, 2021 and 2020—Comparison of capital expenditure in 2022 with 2021”.
Nevada strategy
87
In Nevada, during 2022, AngloGold Ashanti’s project team integrated the Corvus Gold assets and project data into the AngloGold Ashanti evaluation framework. The Company completed planning for feasibility study work at North Bullfrog and also commenced a pre-feasibility study at Silicon along with further drilling at the Merlin deposit. Following the acquisition of Coeur Sterling’s mining properties in the fourth quarter of 2022, AngloGold Ashanti’s project team commenced integrating these assets into the broader evaluation studies.
88
AUSTRALIA
| ||
| Attributable gold production (000oz) | Average number of employees | ||||||||||
| Operations | |||||||||||
| Australia | |||||||||||
| 1. Sunrise Dam | 232 | 725 | |||||||||
| 2. Tropicana 70% | 306 | 807 | |||||||||
The two AngloGold Ashanti operations in Australia are Sunrise Dam and Tropicana, both of which are in the north-eastern goldfields in the state of Western Australia. Sunrise Dam is wholly owned. We have a 70 percent holding in, and manage, Tropicana. Regis Resources Ltd, our partner in Tropicana, holds the balance. Sunrise Dam includes the Butcher Well project (70 percent).
89
Australia - Key Statistics
| Unit | 2022 | 2021 | 2020 | ||||||||||||||||||||
| Operation | |||||||||||||||||||||||
| Tonnes treated/milled | Mt | 10.7 | 10.5 | 10.2 | |||||||||||||||||||
| Pay limit | oz/t | 0.05 | 0.06 | 0.06 | |||||||||||||||||||
| g/t | 1.69 | 1.89 | 1.95 | ||||||||||||||||||||
| Recovered grade | oz/t | 0.050 | 0.047 | 0.054 | |||||||||||||||||||
| g/t | 1.56 | 1.47 | 1.68 | ||||||||||||||||||||
| Gold production (attributable) | 000oz | 538 | 494 | 554 | |||||||||||||||||||
| Cost of sales | $m | 783 | 740 | 705 | |||||||||||||||||||
Total cash costs per ounce (1) | $/oz | 1,157 | 1,196 | 968 | |||||||||||||||||||
All-in sustaining costs per ounce(1) | $/oz | 1,345 | 1,500 | 1,225 | |||||||||||||||||||
| Capital expenditure | $m | 202 | 185 | 142 | |||||||||||||||||||
| Safety | |||||||||||||||||||||||
| Number of fatalities | 0 | 0 | 0 | ||||||||||||||||||||
| TRIFR | Per million hours worked | 3.82 | 6.59 | 3.74 | |||||||||||||||||||
| People | |||||||||||||||||||||||
| Average no of employees: Total | 1,532 | 1,332 | 1,230 | ||||||||||||||||||||
| Permanent employees | 314 | 288 | 259 | ||||||||||||||||||||
| Contractors | 1,218 | 1,044 | 971 | ||||||||||||||||||||
(1)“Total cash costs per ounce” and “all-in sustaining costs per ounce” are non-GAAP measures. For further information on these non-GAAP measures, see “Item 5A: Operating Results—Non-GAAP analysis”.
Performance summary
Production for the Australia region was up nine percent for the year ended 31 December 2022 at 538,000 ounces compared to 494,000 ounces for the year ended 31 December 2021.
Safety performance improved – there were no occupational fatalities and a TRIFR of 3.82 per million hours worked was recorded (2021: 6.59 per million hours worked).
Regional community investment amounted to $0.99 million (2021: $1.01 million).
Sunrise Dam and Tropicana are certified under the Cyanide Code, ISO 45000 (health and safety) and ISO 14001 (environmental management).
The first site to complete an assessment as part of the FP review programme was Sunrise Dam, where the biggest opportunity is to increase productivity in development and achieve a step-change in underground production. The proposed improvements include an underground workshop to lift jumbo utilisation and improvements to planning and scheduling which, together are expected to support an increase in underground volumes. During the second half of 2022, Tropicana also completed an assessment to identify performance improvement initiatives as part of the FP review programme.
For more information regarding production performance in the Australia region, refer to “Item 5A: Operating Results—Key factors affecting results—Production in 2022”.
For more information regarding operating performance in the Australia region, refer to “Item 5A: Operating Results—Comparison of operating performance on a segment basis in 2022 with 2021”.
For more information regarding capital expenditure in the Australia region, refer to “Item 5A: Operating Results—Comparison of capital expenditure in 2022, 2021 and 2020—Comparison of capital expenditure in 2022 with 2021”.
90
SOUTH AFRICA
| ||
The sale of the South African assets to Harmony closed on 30 September 2020. As a result, the figures in this section relate
to the nine months ended on 30 September 2020, unless the context indicates otherwise.
South Africa Key Statistics
| Unit | 2022 | 2021 | 2020 | ||||||||||||||||||||
| Operation | |||||||||||||||||||||||
| Tonnes treated/milled | Mt | 0.4 | |||||||||||||||||||||
Pay limit (1) | oz/t | 0.40 | |||||||||||||||||||||
| g/t | 14.60 | ||||||||||||||||||||||
Recovered grade (1) | oz/t | 0.120 | |||||||||||||||||||||
| g/t | 3.75 | ||||||||||||||||||||||
| Gold production | 000oz | 241 | |||||||||||||||||||||
| Cost of sales | $m | 287 | |||||||||||||||||||||
Total cash costs per ounce (2) | $/oz | 1,149 | |||||||||||||||||||||
All-in sustaining costs per ounce(2) | $/oz | 1,296 | |||||||||||||||||||||
| Capital expenditure | $m | 35 | |||||||||||||||||||||
| Safety | |||||||||||||||||||||||
| Number of fatalities | 4 | ||||||||||||||||||||||
| TRIFR | Per million hours worked | 6.12 | |||||||||||||||||||||
| People | |||||||||||||||||||||||
| Average no of employees: Total | 8,297 | ||||||||||||||||||||||
| Permanent employees | 7,012 | ||||||||||||||||||||||
| Contractors | 1,285 | ||||||||||||||||||||||
(1)Refers to underground operations only.
(2)“Total cash costs per ounce” and “all-in sustaining costs per ounce” are non-GAAP measures. For further information on these non-GAAP measures, see “Item 5A: Operating Results—Non-GAAP analysis”.
91
EXPLORATION REVIEW
Our greenfields exploration programmes are designed to discover new Mineral Resource that will ultimately lead to the development of new, stand-alone gold mines and support the sustainability of our business.
In 2022, the Silicon and Merlin prospects in Nevada were handed over to our Beatty project team, following which the greenfields exploration team refocused its efforts on the discovery of the next significant project to add to the AngloGold Ashanti portfolio.
Greenfields exploration
In 2022, $29 million was spent on greenfields exploration. Our greenfields exploration tenements cover over 9,500km2 of highly prospective ground in six countries – Australia, Argentina, Brazil, Guinea, Tanzania, and the United States.
Americas
In the United States, following the handover of the Silicon discovery to the Beatty Project team in the first quarter of 2022, the greenfields exploration function shifted its focus to seven, 100 percent-owned, earlier-stage greenfields projects located elsewhere in the Great Basin of Nevada. Work completed at these various projects included prospect mapping, surface sampling and geophysical surveys. Diamond drilling is planned for the Midnight Star and CR projects during 2023.
In Brazil, 1,330 stream sediments, 1,200 soil samples and 1,060 rock chip samples were collected. From the SBB terrane in the state of Minas Gerais, four districts have been identified by stream sediment sampling. Infill sampling is in progress to define projects in these districts. At the WBC terrane, which is located in the state of Matto Grosso do Sul to the south-west of Minas Gerais, one project has been advanced and will be considered for drilling in 2023.
In Argentina, an option agreement was signed with Latin Metals for the Organullo project in Salta Province. Work completed since June 2022 included soil sampling, mapping, acquisition of various spectral data sets and community engagement. At the 100 percent-held El Cori project, four drilling targets were identified from surface exploration.
Africa
In Guinea, we received six reconnaissance permits for the Shira district in the Siguiri Basin of Guinea. Community engagement work has started and field exploration is scheduled for the first quarter of 2023.
In Tanzania, target generation activities continued.
Australia
In Australia, we carried out exploration work in the Laverton District and, in Queensland, greenfields exploration took place at the Chillagoe and Georgetown projects.
Brownfields exploration
In the Beatty District, brownfields exploration continued at North Bullfrog, and successfully defined and expanded the Silicon and Merlin targets. Elsewhere across our operations, exploration continued, on one hand to add confidence to the mine plans by upgrading the Mineral Resource and on the other to search for new Mineral Resource with a high likelihood for conversion to Mineral Reserve.
In 2022, our brownfields exploration teams across the globe completed 799km of capital and 358km of expensed drilling at a cost of $79 million and $67 million, respectively. The drilled metre achievement was ten percent below the 2022 budget of 1,281km with the gap closing each quarter after slow start ups at a few operations. Total expenditure of $146 million was 12 percent below budget.
Brownfields exploration activities resulting in the most notable economic intercepts, by operation, for 2022 are listed below by region.
Africa
•Geita: The key area drilled was Geita Hill which is split into six blocks. The drilling was conducted from both surface and underground and was designed to upgrade the underground project and to prepare for mining. Other significant intercepts were drilled at Star and Comet underground at Cut 3 and Ridge 8, extending the potential of the underground complex at Star and Comet. Drilling at the Nyamulilima open pit expanded and further defined the mineralisation.
•Obuasi: Drilling at Block 8, Block 10 and Sansu continued to define the limits of mineralisation and prepare these areas for mining. Late in the year drilling started at Cote D’Or examining the potential to open a second mining area.
•Siguiri: The key exploration activities were at Kounkoun (Block 3) where infill and definition drilling continue as part of the overall assessment of Block 3 as a future mining area. Drilling to extend and define the known mineralisation in Blocks 1 and 2 was conducted.
•Kibali: Two notable drilling intercepts, at Mengu Hill and Oere, were recorded during the year.
92
Americas
•Cerro Vanguardia: Numerous veins were drilled and later in the year emphasis moved to the northwest of the property and onto the Condor ground.
•AGA Mineração, CdS: Drilling of underground opportunities at both CdS I and II delivered significant intercepts at Sangue De Boi, Mutuca, Rosalino, Pinta Bem and Pneu.
•AGA Mineração, Cuiabá: Drilling to extend the depth extents of Fonte Grande Sul below 21 level continued while at a shallower depth drilling to define the satellite ore bodies continued to deliver.
•Serra Grande: One significant intercept, at Angicão, was drilled during the year.
•Beatty: Definition and infill drilling continued at Silicon and Merlin in Nevada. Drilling at North Bullfrog started to deliver later in the year.
Australia
•Sunrise Dam: The key areas delivering significant intercepts were at Frankie and Vogue as part of programmes designed to define and extend mineralisation in these areas. As is typical of the Sunrise Dam mineralisation, most drilling programmes drilled significant intercepts which reflect the nuggety nature of the mineralisation.
•Tropicana: Successful drilling was aimed at the three underground projects, namely, Boston Shaker, Havana and Tropicana.
While many of the significant economic intersections are for unmined underground opportunities, Nevada is delivering significant intersections that will most likely be excavated through open pit mining.
PROJECTS
Quebradona
Following the decision of Colombia’s national environmental agency (ANLA) in November 2021 to archive the Company’s environmental licence application for the Quebradona project, AngloGold Ashanti filed an appeal seeking to secure further details on the specific additional information required for ANLA to make a decision on AngloGold Ashanti’s licence submission. On 29 April 2022, ANLA dismissed the appeal and confirmed its decision to archive the Company’s application. AngloGold Ashanti continues to review and analyse the additional information identified as part of ANLA’s decision. The objective is to prepare, submit and process a new environmental licence request for Quebradona following completion of a new environmental impact assessment.
Gramalote
Following completion of the feasibility study on the Gramalote gold project, a joint operation with B2Gold, both partners have determined that the Gramalote project does not meet their investment thresholds for development. The project continues to benefit from federal and local government support as well as continuing support from local communities.
AngloGold Ashanti and B2Gold have completed a comprehensive review of the alternatives and consider that it would be in the best interest of all stakeholders for a new party to own the Gramalote project. The partners appointed a corporate advisor in the fourth quarter of 2022 to assist with the sale process for the Gramalote project, which is currently ongoing.
93
4C. ORGANISATIONAL STRUCTURE
GROUP STRUCTURE
AngloGold Ashanti’s operations are divided into the following regions:
•Africa — operations in Ghana, Guinea and Tanzania and a joint venture operation in the DRC;
•Australia — operations in Australia; and
•Americas — operations in Argentina and Brazil, and exploration projects in the United States and Colombia.
The above regions correspond to AngloGold Ashanti’s business segments. The South Africa region is recognised for financial statement purposes as discontinued operations as we sold our remaining South African producing assets and related liabilities in 2020. In addition, a new segment, Projects has been introduced from the implementation of the new Operating Model (previously reported under the America’s segment). The Projects segment comprises all the major non-sustaining capital projects with the potential to be developed into operating entities.
Day-to-day management of the Group is entrusted to AngloGold Ashanti’s executive management team, chaired by the Chief Executive Officer. See “Item 6: Directors, Senior Management and Employees”.
Support is provided to the executive management team in managing AngloGold Ashanti’s corporate activities at both the central and local levels.
SUBSIDIARIES
AngloGold Ashanti Limited has investments in principal subsidiaries and joint venture interests, see “Item 19: Exhibits to Form 20-F—Exhibit 19.8 List of AngloGold Ashanti Limited subsidiaries” for details.
On 16 March 2023, AngloGold Ashanti and Gold Fields announced that they have agreed the key terms of a proposed joint venture in Ghana between Gold Fields' Tarkwa and AngloGold Ashanti's neighbouring Iduapriem Mines (the “Proposed Joint Venture”). There can be no certainty that the parties will enter into a definitive agreement with respect to the Proposed Joint Venture or about the timing, terms and conditions of any such definitive agreement. Implementation of the Proposed Joint Venture is subject to, among other matters, reaching agreement with the Government of Ghana regarding the Proposed Joint Venture, conclusion of confirmatory due diligence and securing all requisite regulatory approvals. For further information, refer to “Item 18: Financial Statements—Note 35—Subsequent Events”.
94
4D. PROPERTY, PLANTS AND EQUIPMENT
Locations of properties
Notes:
(1) Gramalote is managed by B2Gold Corp ("B2Gold").
(2) AngloGold Ashanti acquired North Bullfrog and Mother Lode as part of the Corvus Gold Inc.("Corvus Gold") acquisition in January 2022.
(3) AngloGold Ashanti acquired Sterling (which includes the Crown Block deposits of SNA, Secret Pass and Daisy) through the Coeur Sterling, Inc. ("Coeur Sterling") acquisition in November 2022.
(4) Kibali is operated by Barrick Gold Corporation ("Barrick").
The locations of AngloGold Ashanti’s properties are shown above. Percentages indicate the ownership interest held by AngloGold Ashanti. All operations are 100 percent wholly-owned unless otherwise indicated.
Overview of mining properties and operations
The overview for each mining property is disclosed below and includes information on the following items:
•Location of the properties;
•For each material property, locality maps showing the location of such properties as well as infrastructure and licences;
•Type and amount of ownership interests;
•Identity of the operator or operators;
•Titles, mineral rights, leases or options and acreage involved;
•Stages of the properties (exploration, development or production);
•Key permit conditions;
•Mine types and mineralisation styles; and
•Processing plants and other available facilities.
95
Please refer to “Item 5A: Operating Results—Key factors affecting results—Production in 2022” for the aggregate annual production for each of the Company's mining properties during each of the fiscal years ended 31 December 2022, 2021 and 2020. For more information about AngloGold Ashanti’s mines, including a summary of the Company’s titles, mining rights, leases and licences with acreage, please refer to “Item 4B: Business Overview—The Regulatory Environment Enabling AngloGold Ashanti to Mine”.
In its annual report on Form 20-F for the fiscal year ended 31 December 2021, AngloGold Ashanti complied for the first time with the new mining property disclosure requirements for mining registrants set forth in Subpart 1300 of Regulation S-K (17 CFR § 229.1300) (“Regulation S-K 1300”) and reported on, and filed Technical Report Summaries for, all of its mining properties. During 2022, AngloGold Ashanti developed a process to determine which properties are material to its business or financial condition for purposes of the individual property disclosure requirements of Item 1304 of Regulation S-K (17 CFR § 229.1304). The key considerations taken into account by AngloGold Ashanti in its materiality assessment include (i) certain quantitative factors such as contribution to the Mineral Resource and Mineral Reserve, actual and planned production and Net Present Value, as well as (ii) certain qualitative factors, which are assessed in the context of the Company’s overall business and financial condition. The materiality assessment covers all of the Company’s mining properties (regardless of the stage of the mining property) and all of its mining and related activities from exploration through extraction, and will be reviewed by the Company on an annual basis. Based on these considerations, AngloGold Ashanti has determined that its material properties for purposes of Regulation S-K 1300 are Geita, Kibali and Obuasi. With respect to Geita, an updated Technical Report Summary (effective date: 31 December 2022) has been prepared by the relevant Qualified Persons, and is filed as Exhibit 19.15.4 hereto. With respect to Kibali and Obuasi, AngloGold Ashanti has determined that (i) there are no material changes to the Mineral Reserve or Mineral Resource reported in the Technical Report Summaries for these properties (effective date: 31 December 2021) which were filed as exhibits to AngloGold Ashanti’s annual report on Form 20-F for the fiscal year ended 31 December 2021, and (ii) all material assumptions and information pertaining to the disclosure of the Mineral Resource and Mineral Reserve for Kibali and Obuasi remain current in all material respects as of 31 December 2022, based on all facts and circumstances, both quantitative and qualitative. As a result, the Technical Report Summaries for Kibali and Obuasi (effective date: 31 December 2021), which were initially filed as exhibits to AngloGold Ashanti’s annual report on Form 20-F for the fiscal year ended 31 December 2021, are filed as Exhibits 19.15.7 and 19.15.5, respectively, hereto.
AngloGold Ashanti’s operating mines are all accessible by road, although for some, personnel access is better achieved by air.
AngloGold Ashanti’s exploration programmes are based on consistent standards and processes across its portfolio and are guided by peer review. Part of AngloGold Ashanti's investment strategy is focused on exploration drilling and Mineral Reserve development to grow the Mineral Resource and by converting these, the Company allows for expansion of the Mineral Reserve. The process involves identifying the best group of drill targets and prioritising those that have the highest potential for success to be advanced first. Greenfields exploration aims to discover large, high-value Mineral Resource, which will eventually lead to the development of new gold mines. Brownfields exploration focuses on delivering value through accretive additions to the Mineral Reserve at existing mines as well as new discoveries in defined areas around operations.
This annual report on Form 20-F is not being submitted in support of the disclosure of exploration results and therefore no disclosure of drilling or sample results is provided. AngloGold Ashanti has elected not to provide drilling results for its operating mines as drilling at its brownfields operations is generally intended to provide incremental additions, or conversions to already reported Mineral Resource and therefore they are not seen as material. While drilling at the Company’s brownfields operations increases confidence in its Mineral Resource as well as adds LOM extensions, the incremental additions that occur on a yearly basis are not material to that operation or the Company as a whole. In cases where the drilling projects are supporting a non-sustaining addition, these projects are commented on. In the Company’s major greenfields projects, if any single drill result is considered material and may change the reported Mineral Resource significantly then it is reported. Refer to “Item 4B: Business Overview—Exploration review”.
96
AFRICA
AngloGold Ashanti has five mining operations within the Africa region:
•Kibali Gold Mine in the Democratic Republic of the Congo ("DRC"), a joint venture (“JV”) between AngloGold Ashanti (45%), Barrick Gold Corporation (“Barrick”) (following its merger with Randgold Resources Limited (“Randgold”)) (45%), and Société Minière de Kilo-Moto S.A. (“SOKIMO”), a state-owned gold mining company (10%);
•Iduapriem Gold Mine ("Iduapriem") and Obuasi Gold Mine ("Obuasi") in Ghana;
•Siguiri Gold Mine (“Siguiri”) in Guinea, co-owned by AngloGold Ashanti (85%) and the government of Guinea (15%); and
•Geita Gold Mine ("GGM" or "Geita") in Tanzania.
Mining is from both open pit and underground, with Obuasi being an underground mine, Iduapriem and Siguiri being open pit mines, and Kibali and Geita being a combination of open pit and underground mines.
DRC
KIBALI
For additional information, please refer to the Technical Report Summary for Kibali (effective date: 31 December 2021) filed as Exhibit 19.15.7 hereto.
Property description
Kibali is a joint venture co-owned by AngloGold Ashanti (45%), Barrick (45%), and SOKIMO (10%). SOKIMO is wholly-owned by the DRC government. The consolidated lease is made up of ten exploitation permits. The metallurgical plant comprises a twin-circuit sulphide and oxide plant with conventional carbon-in-leach ("CIL"), including gravity recovery as well as a float and ultra-fine grind circuit. Barrick operates the mine, which comprises both open pit and underground operations.
Kibali is a gold mining, processing and exploration project. Operations currently focus on open pit and underground mining. The mine was originally developed and operated by Randgold. Following the completion of the merger of Randgold and Barrick in 2019, Barrick became the operator at Kibali for both exploration and mining. Kibali is currently a production stage property.
Location
Kibali is located in the northeastern part of the DRC near the international borders with Uganda and South Sudan. The mine is located adjacent to the village of Doko, which is located to the west of the lease area. Kibali is approximately 210km by road from Arua and immediately north of the district capital of Watsa. The operational area falls within the administrative territory of Watsa in Haut-Uélé province.
Mineralisation style
Gold deposits of the Kibali district are classified as Archaean orogenic gold deposits. At Kibali, the gold deposits are largely hosted in siliciclastic rocks, banded iron formations (“BIFs”) and chert that were deformed, altered and transposed during several events. This occurred at or near greenschist metamorphic conditions. Ore-forming H2O-CO2-rich fluids migrated along a linked network of gently northeast-dipping shears and north-northeast plunging fold axes that are commonly referred to as the KZ Trend. The auriferous KZ Trend is a complexly deformed fault system specifically developed along the boundary between the younger sedimentary basin in the west of the belt that juxtaposes the older rocks to the east. Mineralisation occurred during the later stages of subsequent regional deformation which resulted in inversion of the basin and the development of reverse faults and folds. Ongoing deformation during hydrothermal activity resulted in the development of lodes in a variety of related structural settings within the KZ Trend.
History
On 15 October 2009, AngloGold Ashanti acquired a 50 percent indirect interest in Moto Goldmines Limited through a JV with Randgold, with Moto holding a 70 percent stake in Kibali and the DRC parastatal SOKIMO holding the remaining 30 percent stake. On 21 December 2009, Randgold and AngloGold Ashanti increased their JV interest in Kibali to 90 percent, while SOKIMO retained a 10 percent holding. On 2 January 2019, Randgold merged with Barrick, and the JV is now held by the combined company, trading as Barrick.
Legal aspects and tenure
Refer to “Item 4B: Business Overview—The Regulatory Environment Enabling AngloGold Ashanti to Mine—Africa Region—Democratic Republic of the Congo (DRC)—AngloGold Ashanti’s rights and permits”.
97
Mining method
The operation comprises both open pit and underground mining. Open pit mining is carried out using conventional drill, blast, load and haul surface mining methods. From 2022 onwards, open pit production will come from the Sessenge, Aerodrome, Pamao, Gorumbwa, Megi-Marakeke-Sayi, Kalimva-Ikamva, Oere, Pakaka, and Karagba, Chauffeur and Durba (“KCD”) deposits. Open pit mining is conducted by contractor Kibali Mining Services, a local subsidiary of DTP Terrassement, using either free-dig or conventional drill, blast, load and haul methods.
For the underground operation, longitudinal and transverse longitudinal stoping methods with paste backfill are the nominated mining methods. The Kibali KCD underground mine is designed to extract the KCD deposit directly beneath the KCD open pit. A 50m crown pillar separates the pit bottom from the top of the underground mine. The first gold was poured in September 2013 from the open pit operations and development of the underground mine commenced in the same year. Stoping commenced in 2015 and ore production has ramped up to 3.8Mt in 2022. Initial production was truck hauled by a twin decline to surface. In 2017, the haulage shaft (740m deep) and materials handling system was commissioned. From 2018 onwards, underground ore has predominantly been hoisted up the shaft. The decline to surface will continue to be used to haul some of the shallower zones and to supplement shaft haulage.
Processing plants and other available facilities
Infrastructure in the DRC is generally poor as a result of limited investment in maintenance, upgrades and extensions of the road networks established during colonial times. The mine site is located within 160km of the border with Uganda and all transport links take place through Uganda to Kenya or Tanzania. Access by air to Kibali involves a commercial flight to Entebbe in Uganda followed by a charter flight to Doko airport, situated on the mine property. The Doko airstrip was upgraded by Kibali and is equipped with runway lights and precision approach path indicator lights. For the number of persons employed at the mine, refer to “Item 4B: Business Overview—Operating Performance—Africa Region”.
Kibali is a large-scale gold mining operation, with a number of sources of ore, that has been in operation since 2013. The physical condition of the equipment, facilities, and infrastructure at Kibali is in good working order, with the mine investing heavily in maintaining and upgrading its assets to ensure that they remain reliable and efficient. Surface infrastructure associated with the overall Kibali operation includes a processing plant, tailings storage facility ("TSF"), camp, airstrip, underground shaft, workshops and offices. Power to the mine is self-generated by a combination of hydroelectric and diesel generators. The underground mine has also been extensively developed, with the construction of both shaft and portal and strategically placed development drives that access and further explore the gold-bearing ore.
The “Property, Plant, and Equipment” as of 31 December 2022, including lease assets, buildings and mine infrastructure, mining assets, mineral rights and dumps, decommissioning assets, capitalised exploration costs and deferred stripping, had a carrying value of $983 million (reported as attributable; 45% owned by AngloGold Ashanti).
Mineral processing
The current processing plant can treat both oxide and fresh sulphide material and uses flotation with ultra-fine grind of the flotation concentrate, a treatment that is required for the sulphide ore type before leaching. Kibali has a processing operation capable of producing an average of 730kozpa of gold for 10 years treating at least 7.2Mtpa throughput. The ore is blended using both KCD underground ore plus ore sourced from satellite open pits at Kibali.
Mineral Resource
Refer to the below table, prepared in accordance with Table 1 to Paragraph (D)(1) of Item 1304 of Regulation S-K, which summarises the gold Mineral Resource (exclusive of Mineral Reserve) for Kibali at the end of the fiscal year ended 31 December 2022, based on a gold price estimate of $1,700/oz. Refer to “—Material Assumptions for the Mineral Resource—Key Parameters (Open Pit and Underground)” for additional information on cut-off grades and metallurgical recovery.
| Mineral Resource | Category | Tonnes | Grade | Contained Gold | |||||||||||||
| as at 31 December 2022 | million | g/t | tonnes | Moz | |||||||||||||
| Kibali (45 percent) | Measured | 7.22 | 3.18 | 22.97 | 0.74 | ||||||||||||
| Indicated | 22.15 | 2.64 | 58.44 | 1.88 | |||||||||||||
| Measured & Indicated | 29.37 | 2.77 | 81.41 | 2.62 | |||||||||||||
| Inferred | 13.16 | 2.61 | 34.43 | 1.11 | |||||||||||||
Notes:
Rounding of numbers may result in computational discrepancies in the Mineral Resource tabulations. The Mineral Resource estimates with respect to our material properties have been prepared by the Qualified Persons (employed by AngloGold Ashanti unless stated otherwise). The net difference between the Mineral Resource at the end of the last completed fiscal year and the preceding fiscal year is detailed in the table below. To
98
reflect that figures are not precise calculations and that there is uncertainty in their estimation, AngloGold Ashanti reports tonnage, grade and content for gold to two decimals. All ounces are Troy ounces. “Moz” refers to million ounces.
1.All disclosure of Mineral Resource is exclusive of Mineral Reserve. The Mineral Resource exclusive of Mineral Reserve (“Exclusive Mineral Resource”) is defined as the inclusive Mineral Resource less the Mineral Reserve before dilution and other factors are applied.
2.Mineral Resource attributable to AngloGold Ashanti’s percentage interest shown.
3.“Tonnes” refers to a metric tonne which is equivalent to 1,000 kilograms.
4.Operated by Barrick. AngloGold Ashanti has recognised that in preparing this annual report, the Qualified Persons have relied on information provided by Barrick. Based on a gold price of $1,700/oz.
5.Property currently in a production stage.
6.Refer to “—Material Assumptions for the Mineral Resource—Key Parameters (Open Pit and Underground)” for additional information on cut-off grades and metallurgical recovery.
Year on year changes in Mineral Resource - Moz
| as at 31 December 2022 | Kibali | |||||||||||||
| Category | Measured | Indicated | Measured and Indicated total | Inferred | ||||||||||
| Previous Year | 0.78 | 1.76 | 2.54 | 0.89 | ||||||||||
| Depletion | (0.01) | — | (0.01) | — | ||||||||||
| Exploration | 0.01 | — | 0.01 | 0.10 | ||||||||||
| Methodology | — | — | — | — | ||||||||||
| Price | 0.03 | 0.16 | 0.19 | 0.13 | ||||||||||
| Cost | (0.01) | (0.02) | (0.03) | (0.02) | ||||||||||
| Geotechnical | (0.07) | (0.02) | (0.09) | — | ||||||||||
| Metallurgical | — | 0.01 | 0.01 | 0.01 | ||||||||||
| Acquisition / Disposal | — | — | — | — | ||||||||||
| Other | — | — | — | — | ||||||||||
| Current Year | 0.74 | 1.88 | 2.62 | 1.11 | ||||||||||
| Net Difference | (0.04) | 0.12 | 0.08 | 0.22 | ||||||||||
| % Difference | (5) | 7 | 3 | 24 | ||||||||||
Notes:
All figures are expressed on an attributable basis unless otherwise indicated. AngloGold Ashanti has recognised that in preparing this annual report, the Qualified Persons have relied on information provided by Barrick.
Changes were driven both by exploration and an increase in the Mineral Resource gold price from $1,500/oz as at 31 December 2021 to $1,700/oz as at 31 December 2022, with gains seen from the open pits, specifically Ikamva, Oere and Gorumbwa, as well as from continued definition of the 11000 lode in the KCD underground. A maiden underground Inferred Mineral Resource at Gorumbwa was also reported.
Material Assumptions for the Mineral Resource
Key Parameters (Open Pit and Underground)
| Kibali | Unit | Open Pit | ||||||
| Costs | ||||||||
| Waste cost | $/tonne mined | 2.92-3.09(1) | ||||||
| Extra Ore Cost – Grade Control + Ore – Rehandle + Overhaul | $/tonne mined | 1.27 | ||||||
| Grade Control cost | $/tonne mined | 0.75 | ||||||
| Dilution | % | 10 | ||||||
| Ore Loss | % | 3 | ||||||
| Processing cost | $/tonne milled | 15.04-17.85(1) | ||||||
| G&A | $/tonne milled | 8.47 | ||||||
| Other Parameters | ||||||||
| Gold Royalties (4.7%) | $/oz | 70.50 | ||||||
| Metallurgical Recovery Factor | %MetRF | 86.1-90.1(1) | ||||||
| Mineral Resource cut-off grade | g/t | 0.6-0.7(1) | ||||||
99
| Kibali | Unit | Open Pit | ||||||
| Mineral Resource price | $/oz | 1,700 (2) | ||||||
Notes: AngloGold Ashanti has recognised that in preparing this annual report, the Qualified Persons have relied on information provided by Barrick. (1) Vary according to rock type. (2) AngloGold Ashanti has determined that there is no material change to the Mineral Resource reported in the 2021 Technical Report Summary for Kibali (effective date: 31 December 2021) filed as Exhibit 19.15.7 hereto if this updated gold price is used (instead of $1,500, the gold price used to estimate the Mineral Resource in 2021). | ||||||||
| Kibali | Unit | Underground | ||||||
| Costs | ||||||||
| Mine Production | $/tonne ore mined | 36.17 | ||||||
| Capital | $/tonne ore mined | 3.97 | ||||||
| G&A | $/tonne ore milled | 8.47 | ||||||
| Processing cost | $/tonne ore milled | 17.85 | ||||||
| Other Parameters | ||||||||
| Gold Royalties (4.7%) | $/oz | 70.50 | ||||||
| Mining cut-off grade | g/t | 1.62 | ||||||
| Mineral Resource price | $/oz | 1,700 (1) | ||||||
| Metallurgical Recovery Factor | %MetRF | 90 | ||||||
Notes: AngloGold Ashanti has recognised that in preparing this report, the Qualified Persons have relied on information provided by Barrick. (1) AngloGold Ashanti has determined that there is no material change to the Mineral Resource reported in the 2021 Technical Report Summary for Kibali (effective date: 31 December 2021) filed as Exhibit 19.15.7 hereto if this updated gold price is used (instead of $1,500, the gold price used to estimate the Mineral Resource in 2021). | ||||||||
Estimation
Mineral Resource estimation is undertaken by Barrick in-house technical experts or by approved external consultants. The results of both diamond drilling ("DD") and reverse circulation ("RC") drilling are used in the estimation process. 3D mineralised envelopes are established using grade and geology, and these are then statistically verified to confirm their validity for use in grade estimation. Appropriate domaining of homogeneous zones is conducted whereby high-grade central core areas are modelled separately from the lower-grade surrounding halos. Volumes are filled with block model cells and interpolated for density, rock type and grade – the latter using ordinary kriging.
Grade top cuts and restricted searches are applied to drill hole data to prevent the spread of high-grades during the estimation process. Drill hole spacing is used to guide the Mineral Resource classification. The open pit Mineral Resource is quoted within a limiting shell. The underground Mineral Resource is constrained by the application of optimised mineable Mineral Resource shapes, which applies reasonable mineability constraints including a minimum mining width, a reasonable distance from current or planned development, and a measure of assumed profitability at the related Mineral Resource cut-off grade.
Mineral Reserve
Refer to the below table, prepared in accordance with Table 2 to Paragraph (D)(1) of Item 1304 of Regulation S-K, which summarises the gold Mineral Reserve for Kibali at the end of the fiscal year ended 31 December 2022, based on a gold price estimate of $1,300/oz. Refer to “—Material Assumptions for the Mineral Reserve—Modifying factors and price estimates” for additional information on cut-off grades and metallurgical recovery.
| Mineral Reserve | Category | Tonnes | Grade | Contained Gold | |||||||||||||
| as at 31 December 2022 | million | g/t | tonnes | Moz | |||||||||||||
| Kibali (45 percent) | Proven | 14.49 | 3.47 | 50.33 | 1.62 | ||||||||||||
| Probable | 29.17 | 3.15 | 91.86 | 2.95 | |||||||||||||
| Total | 43.67 | 3.26 | 142.19 | 4.57 | |||||||||||||
Notes:
1.Rounding of numbers may result in computational discrepancies in the Mineral Reserve tabulations. The Mineral Reserve estimates with respect to our material properties have been prepared by the Qualified Persons (employed by AngloGold Ashanti unless stated otherwise). The net difference between the Mineral Reserve at the end of the last completed fiscal year and the preceding fiscal year is detailed in the table below. To reflect that figures are not precise calculations and that there is uncertainty in their estimation, AngloGold Ashanti reports tonnage, grade and content for gold to two decimals. All ounces are Troy ounces. “Moz” refers to million ounces.
2.Mineral Reserve attributable to AngloGold Ashanti’s percentage interest shown.
3.“Tonnes” refers to a metric tonne which is equivalent to 1,000 kilograms.
100
4.Operated by Barrick. AngloGold Ashanti has recognised that in preparing this annual report, the Qualified Persons have relied on information provided by Barrick. Open Pits and underground were based on a gold price of $1,300/oz, with the exception of the Pamoa Main pit (based on a gold price of $1,400/oz) and the Pamoa South pit (based on a gold price of $1,500/oz).
5.Property currently in a production stage.
6.Refer to “—Material Assumptions for the Mineral Reserve—Modifying factors and price estimates” for additional information on cut-off grades and metallurgical recovery.
Year on year changes in Mineral Reserve - Moz
| as at 31 December 2022 | Kibali | ||||||||||
| Category | Proven | Probable | Total | ||||||||
| Previous Year | 1.74 | 2.59 | 4.33 | ||||||||
| Depletion | (0.28) | (0.12) | (0.40) | ||||||||
| Exploration | 0.11 | 0.42 | 0.53 | ||||||||
| Methodology | — | — | — | ||||||||
| Price | 0.03 | 0.12 | 0.15 | ||||||||
| Cost | (0.01) | (0.03) | (0.04) | ||||||||
| Geotechnical | — | — | — | ||||||||
| Metallurgical | — | — | — | ||||||||
| Operational | 0.03 | — | 0.03 | ||||||||
| Other | — | (0.03) | (0.03) | ||||||||
| Acquisition / Disposal | — | — | — | ||||||||
| Current Year | 1.62 | 2.95 | 4.57 | ||||||||
| Net Difference | (0.12) | 0.36 | 0.24 | ||||||||
| % Difference | (7) | 14 | 6 | ||||||||
Notes:
All figures are expressed on an attributable basis unless otherwise indicated. AngloGold Ashanti has recognised that in preparing this annual report, the Qualified Persons have relied on information provided by Barrick.
The increase in Mineral Reserve was primarily as a result of the conversion of the 11000 lode in the KCD underground, and growth in the Ikamva and Oere pits due to exploration successes. The gold price used for pit optimisation changed from $1,200/oz as at 31 December 2021 to $1,300/oz as at 31 December 2022 which also contributed to the increase seen.
Material Assumptions for the Mineral Reserve
Modifying factors and price estimates
| as at 31 December 2022 | Kibali | |||||||
| Primary Commodity Price | $/oz | 1,300(1)(6) | ||||||
| Cut-off grade | g/t | 1.50(3)(5); 1.96(4) | ||||||
| Stoping width | cm | 2990(4) | ||||||
| Dilution | % | 2.0-12.5(4); 10(5) | ||||||
| Mining Recovery Factor | MRF based on tonnes (%) | 91.6(4); 97(5) | ||||||
| Mine Call Factor | MCF (%) | 97 | ||||||
| Metallurgical Recovery Factor | MetRF (%) | 89-90(2) | ||||||
Notes: AngloGold Ashanti has recognised that in preparing this annual report, the Qualified Persons have, relied on information provided by Barrick. (1) AngloGold Ashanti has determined that there is no material change to the Mineral Reserve reported in the 2021 Technical Report Summary for Kibali (effective date: 31 December 2021) filed as Exhibit 19.15.7 hereto if this updated gold price is used (instead of $1,200, the gold price used to estimate the Mineral Reserve in 2021). (2) Vary according to rock type. (3) Stockpile. (4) Underground. (5) Open pit. (6) Open Pits and underground were based on a gold price of $1,300/oz, with the exception of the Pamoa Main pit (based on a gold price of $1,400/oz) and the Pamoa South pit (based on a gold price of $1,500/oz). | ||||||||
Estimation
The open pit Mineral Reserve shell optimisations were run on the Mineral Resource models. The process incorporated the mining layout, operating factors, stripping ratio, relevant cut-off grades and modifying factors for
101
reporting the Mineral Reserve. An open pit underground interface was set at 5,685 metres relative level (“mRL") between the KCD open pit and underground mine.
A cut-off grade analysis of $1,300/oz was used to determine a cut-off grade of 1.96g/t for the underground mine. Longitudinal and transverse longhole open stoping methods with paste backfill are the current preferred mining methods. Underground stope designs were updated from the previously reported Mineral Reserve using the latest Mineral Resource models. Modifying factors for planned and unplanned rock dilution, backfill dilution and ore loss were applied to obtain the reported Mineral Reserve.
Metallurgical, environmental, social, legal, marketing and economic factors were adequately considered in the Kibali feasibility study and have been updated as the project has developed.
Map showing Kibali planned infrastructure and licences
Below is a map that shows Kibali infrastructure and licences, with the total mining lease area insert shown in the top right corner. The coordinates of the mine, as represented by the plant, are depicted on the map and are in the geographic coordinate system.
102
GHANA
AngloGold Ashanti has two mines in Ghana. Obuasi and Iduapriem are both wholly-owned and operated by AngloGold Ashanti.
Obuasi is an underground mine operating at depths of up to 1,500m with a continuous history of mining dating back to the 1890s. Iduapriem is an open pit mine.
103
Obuasi is located in the Ashanti region of southern Ghana, approximately 60km south of Kumasi. Mining was temporarily suspended at the end of 2014 while a series of economic studies progressed. Obuasi underground development restarted in the first half of 2019, with the first gold produced in December 2019. The ramp-up of the redevelopment project was delayed by the temporary stoppage of underground activities after a fall of ground incident in May 2021. Production remained suspended for several months to allow for reviews and investigations, but slowly resumed in the latter part of 2021.
Iduapriem is located in western Ghana, some 85km from the coast and south of Obuasi, near the town of Tarkwa.
OBUASI
For additional information, refer to the Technical Report Summary for Obuasi (effective date: 31 December 2021) filed as Exhibit 19.15.5 hereto.
Property description
Obuasi is wholly-owned by AngloGold Ashanti and is a production stage property. All required mineral rights to the property are held by the Company. The mine is an underground operation, and it has been in operation since 1897 (more than 120 years). It has been operated by AngloGold Ashanti since 2004.
Location
The mine is in the municipality of Obuasi, in the Ashanti region of Ghana, about 240km northwest of the capital, Accra, and 60km south of Kumasi.
Mineralisation style
Geologically, Obuasi is in the Ashanti belt on the eastern margin of the Pre-Cambrian West African craton. This craton consists of Lower Proterozoic volcanic and flysch sediments which make up the Birimian system, overlain in part by the molasse sediments of the Middle Proterozoic Tarkwaian. The Ashanti belt is the most prominent of the five Birimian Supergroup gold belts found in Ghana.
Gold mineralisation is associated with shear zones and pervasive silica, carbonate and sulphide hydrothermal alteration which occur in tightly folded Lower Birimian schists, phyllites, meta-greywackes, and tuffs, along the eastern limb of the Kumasi anticlinorium. They are found near the contact with harder metamorphosed and metasomatically altered intermediate to basic upper Birimian volcanics. There are two broad styles of gold mineralisation including free milling quartz vein gold and sulphide-rich, disseminated and refractory gold which form alteration haloes around the quartz vein lodes. Sulphide mineralisation is dominated by arsenopyrite and quartz mineralisation, which is associated with spatially variable, but exceptionally high-grade visible gold in quartz veins.
History
Obuasi has a long mining history dating back to 1897. It has been owned and operated by various operators during this time. The current operator became involved in 2004 following the merger of former AngloGold Limited of South Africa and the Ashanti Goldfields Company Limited of Ghana. However, for several years leading up to 2014, the mine began to struggle due to ailing infrastructure and outdated methodologies. The company realised that significant rationalisation and/or replacement of current infrastructure would be necessary to enable the delivery of better utilisation and productivity metrics.
In 2014, a feasibility study commenced that considered the optimum mining methodology and schedules for the underground mine, based on modern mechanised mining methods and refurbishment of underground, surface and process plant infrastructure. During this time, Obuasi operated in a limited operating phase with underground activities essentially restricted to the continued development of the Obuasi deeps decline and underground infill drilling. The limited operating phase was brought to a halt after an incursion by illegal miners on Obuasi's concession in February 2016, at which point the mine was placed under care and maintenance. However, the study continued and in 2017, a favourable feasibility study was completed and indicated a strong technical and economic case with an anticipated 20-year life of mine ("LOM"). In 2018, approval was received from the AngloGold Ashanti board and the government of Ghana to proceed with the project.
The redevelopment project began in late 2018 and first gold was poured during the fourth quarter of 2019. Phase 1 of the redevelopment project was completed by the end of September 2020, and the mine began commercial production on 1 October 2020. Phase 2 of the redevelopment project, which focused on construction and mine development, was completed in 2021. Phase 3 of the redevelopment project is currently underway to develop the infrastructure necessary to support the planned ramp-up in production.
104
Legal aspects and tenure
Refer to “Item 4B: Business Overview—The Regulatory Environment Enabling AngloGold Ashanti to Mine—Africa Region—Ghana—AngloGold Ashanti’s rights and permits”.
Mining method
Obuasi is an underground operation, utilising both vertical shafts and declines as main access routes to the underground workings. The mine has seen extensive historical mining activities with varying applications of different mining methods to date. The current LOM design employs mostly the Long Hole Open Stoping ("LHOS") mining method for ore extraction. LHOS is a highly selective and productive method of mining that can be employed for orebodies of varying thicknesses and dips. The main distinct variations of the LHOS used at Obuasi are longitudinal retreat stoping (“LRS”), and transverse open stoping (“TOS”). The blind upper stoping is a form of LRS or TOS used for partial sill pillar recovery.
Processing plants and other available facilities
All significant surface activities, including ore processing, environmental management and community engagement are carried out by Obuasi staff. Existing infrastructure includes a recently refurbished and upgraded 2.2Mtpa processing plant with flotation and bacterial oxidation ("BIOX"), extensive underground development, hoisting shafts and associated infrastructure, mine ventilation and refrigeration facilities, emergency standby power and water reticulation, office complexes, workshops, and company housing estates. Power is supplied to the mine by the Volta River Authority and Ghana Grid Company Limited (“GRIDCo”). There is a focus mine development plan supported by the existing infrastructure, and ongoing upgrades of critical underground infrastructure to sustain the operations. The mine can be accessed by paved road network from Kumasi and by road or chartered air transport from the capital, Accra. For the number of persons employed at the mine, refer to “Item 4B: Business Overview—Operating Performance—Africa Region”.
The “Property, Plant, and Equipment” as of 31 December 2022, including buildings and mine infrastructure, mining assets, decommissioning assets and assets under construction, had a carrying value of $1,009 million.
Mineral processing
The plant is configured for both conventional and flash flotation and BIOX treatment which is required for the refractory sulphide ore. The gravity gold recovery system is also integrated with Knelson concentrators and inline leach reactors.
Mineral Resource
Refer to the below table, prepared in accordance with Table 1 to Paragraph (D)(1) of Item 1304 of Regulation S-K, which summarises the gold Mineral Resource (exclusive of Mineral Reserve) for Obuasi at the end of the fiscal year ended 31 December 2022, based on a gold price estimate of $1,750/oz for underground and $1,600 for open pit Mineral Resource. Refer to “—Material Assumptions for the Mineral Resource—Key Parameters” for additional information on cut-off grades and metallurgical recovery.
| Mineral Resource | Category | Tonnes | Grade | Contained Gold | |||||||||||||
| as at 31 December 2022 | million | g/t | tonnes | Moz | |||||||||||||
| Obuasi | Measured | 1.96 | 8.44 | 16.59 | 0.53 | ||||||||||||
| Indicated | 27.66 | 6.06 | 167.59 | 5.39 | |||||||||||||
| Measured & Indicated | 29.63 | 6.22 | 184.18 | 5.92 | |||||||||||||
| Inferred | 39.80 | 8.50 | 338.17 | 10.87 | |||||||||||||
Notes:
Rounding of numbers may result in computational discrepancies in the Mineral Resource tabulations. The Mineral Resource estimates with respect to our material properties have been prepared by the Qualified Persons (employed by AngloGold Ashanti unless stated otherwise). The net difference between the Mineral Resource at the end of the last completed fiscal year and the preceding fiscal year is detailed in the table below. To reflect that figures are not precise calculations and that there is uncertainty in their estimation, AngloGold Ashanti reports tonnage, grade and content for gold to two decimals. All ounces are Troy ounces. “Moz” refers to million ounces.
1.All disclosure of Mineral Resource is exclusive of Mineral Reserve. The Mineral Resource exclusive of Mineral Reserve (“Exclusive Mineral Resource”) is defined as the inclusive Mineral Resource less the Mineral Reserve before dilution and other factors are applied.
2.“Tonnes” refers to a metric tonne which is equivalent to 1,000 kilograms.
3.Property currently in a production stage.
4.Refer to “—Material Assumptions for the Mineral Resource—Key Parameters” for additional information on cut-off grades and metallurgical recovery.
5.Open pit based on a gold price of $1,600/oz, underground based on a gold price of $1,750/oz.
105
Year on year changes in Mineral Resource - Moz
| as at 31 December 2022 | Obuasi | |||||||||||||
| Category | Measured | Indicated | Measured and Indicated total | Inferred | ||||||||||
| Previous Year | 0.66 | 5.84 | 6.50 | 12.05 | ||||||||||
| Depletion | — | — | — | — | ||||||||||
| Exploration | — | — | — | (0.06) | ||||||||||
| Methodology | 0.02 | 0.28 | 0.30 | (0.53) | ||||||||||
| Price | 0.02 | 0.58 | 0.60 | 1.11 | ||||||||||
| Cost | (0.17) | (0.97) | (1.14) | (1.31) | ||||||||||
| Geotechnical | — | — | — | — | ||||||||||
| Metallurgical | — | — | — | — | ||||||||||
| Acquisition / Disposal | — | — | — | — | ||||||||||
| Other | — | (0.33) | (0.33) | (0.37) | ||||||||||
| Current Year | 0.53 | 5.39 | 5.92 | 10.87 | ||||||||||
| Net Difference | (0.12) | (0.45) | (0.57) | (1.17) | ||||||||||
| % Difference | (19) | (8) | (9) | (10) | ||||||||||
Notes:
All figures are expressed on an attributable basis unless otherwise indicated.
The decrease in Mineral Resource is mainly due to depletion attributed to mining from Sansu, and Blocks 8 and 10 and an increase in costs which resulted in higher cut-off grades as well as the sterilisation of stopes in the depletion process. The decrease was partially offset by model changes primarily from the inclusion of new drilling data from ongoing operational drilling activities and the increase in Mineral Resource price.
Material Assumptions for the Mineral Resource
Key Parameters
| Obuasi | Unit | Underground | ||||||
| Costs | ||||||||
| Mining cost | $/tonne mined | 64.26-79.44(1) | ||||||
| Processing cost | $/tonne treated | 42.57 | ||||||
| G&A | $/tonne treated | 21.96 | ||||||
| Other Parameters | ||||||||
| Royalties | % | 3.0 | ||||||
MSO(2) optimising cut-off | g/t | 3.43-3.75(1) | ||||||
| Mineral Resource cut-off grade | g/t | 3.43-3.75(1) | ||||||
| Mineral Resource price | $/oz | 1,600-1,750(3)(4) | ||||||
| Metallurgical Recovery Factor | %MetRF | 87 | ||||||
Notes: (1) Vary according to area. (2) Datamine Mineable Shape Optimiser ("MSO"). (3) Open pit based on a gold price of $1,600/oz, Underground based on a gold price of $1,750/oz. (4) AngloGold Ashanti has determined that there is no material change to the Mineral Resource reported in the 2021 Technical Report Summary for Obuasi (effective date: 31 December 2021) filed as Exhibit 19.15.5 hereto if this updated gold price is used (instead of $1,500, the gold price used to estimate the Mineral Resource in 2021). | ||||||||
Estimation
The estimation technique is ordinary kriging and the primary estimation unit size is 20m x 5m x 15m. This estimation unit size is representative of the underground mining units and is considered appropriate given the style of mineralisation and mining methods. Compositing by length is employed and the influence of extreme grades is restricted by grade capping. Sample spacing is highly variable across the deposit and ranges from 10m x 10m (for grade control areas) up to 200m x 200m (for exploration targets). However, for the Mineral Resource, the maximum extrapolation from data points is 100m. Any areas beyond this are not classified and are considered to be upside potential rather than Mineral Resource.
106
Mineral Reserve
Refer to the below table, prepared in accordance with Table 2 to Paragraph D(1) of Item 1304 ofRegulation S-K, which summarises the gold Mineral Reserve for Obuasi at the end of the fiscal year ended 31 December 2022, based on a gold price estimate of $1,400/oz. Refer to “—Material Assumptions for the Mineral Reserve—Modifying factors and price estimates” for additional information on cut-off grades and metallurgical recovery.
| Mineral Reserve | Category | Tonnes | Grade | Contained Gold | |||||||||||||
| as at 31 December 2022 | million | g/t | tonnes | Moz | |||||||||||||
| Obuasi | Proven | 4.47 | 9.55 | 42.73 | 1.37 | ||||||||||||
| Probable | 21.25 | 9.26 | 196.67 | 6.32 | |||||||||||||
| Total | 25.72 | 9.31 | 239.40 | 7.70 | |||||||||||||
Notes:
1.Rounding of numbers may result in computational discrepancies in the Mineral Reserve tabulations. The Mineral Reserve estimates with respect to our material properties have been prepared by the Qualified Persons (employed by AngloGold Ashanti unless stated otherwise). The net difference between the Mineral Reserve at the end of the last completed fiscal year and the preceding fiscal year is detailed in the table below. To reflect that figures are not precise calculations and that there is uncertainty in their estimation, AngloGold Ashanti reports tonnage, grade and content for gold to two decimals. All ounces are Troy ounces. “Moz” refers to million ounces.
2.“Tonnes” refers to a metric tonne which is equivalent to 1,000 kilograms.
3.Property currently in a production stage.
4.Refer to “—Material Assumptions for the Mineral Reserve—Modifying factors and price estimates” for additional information on cut-off grades and metallurgical recovery.
5.Based on a gold price of $1,400/oz.
Year on year changes in Mineral Reserve - Moz
| as at 31 December 2022 | Obuasi | ||||||||||
| Category | Proven | Probable | Total | ||||||||
| Previous Year | 1.19 | 7.08 | 8.26 | ||||||||
| Depletion | (0.23) | — | (0.23) | ||||||||
| Exploration | — | (0.77) | (0.77) | ||||||||
| Methodology | 0.54 | — | 0.54 | ||||||||
| Price | 0.11 | 1.49 | 1.60 | ||||||||
| Cost | (0.23) | (1.48) | (1.71) | ||||||||
| Geotechnical | — | — | — | ||||||||
| Metallurgical | — | — | — | ||||||||
| Operational | — | — | — | ||||||||
| Other | — | — | — | ||||||||
| Acquisition / Disposal | — | — | — | ||||||||
| Current Year | 1.37 | 6.32 | 7.70 | ||||||||
| Net Difference | 0.19 | (0.75) | (0.57) | ||||||||
| % Difference | 16 | (11) | (7) | ||||||||
Notes:
All figures are expressed on an attributable basis unless otherwise indicated.
The key changes were primarily associated with depletion, exploration, block model changes, and economic parameters. Depletion was mainly due to mining, while exploration changes were as a result of Mineral Resource drilling. This was offset by changes in the block model methodology involving estimation parameters, interpretations, classification and density. The economic factors that also influenced the changes to the Obuasi Mineral Reserve included an increased gold price assumption which was partially offset by an increase in mining cost and sustaining capital.
Material Assumptions for the Mineral Reserve
Modifying factors and price estimates
| as at 31 December 2022 | Obuasi | |||||||
| Primary Commodity Price | $/oz | 1400(1) | ||||||
| Cut-off grade | g/t | 4.29-4.69(2) | ||||||
107
| as at 31 December 2022 | Obuasi | |||||||
| Dilution | % | 12-17(2) | ||||||
| Mining Recovery Factor | %MRF based on tonnes | 95-98(2) | ||||||
| Mining Recovery Factor | %MRF based on g/t | 100 | ||||||
| Mine Call Factor | %MCF | 100 | ||||||
| Metallurgical Recovery Factor | %MetRF | 87 | ||||||
Notes: (1) AngloGold Ashanti has determined that there is no material change to the Mineral Reserve reported in the 2021 Technical Report Summary for Obuasi (effective date: 31 December 2021) filed as Exhibit 19.15.5 hereto if this updated gold price is used (instead of $1,200, the gold price used to estimate the Mineral Reserve in 2021). (2) Vary according to area. | ||||||||
Estimation
The Mineral Reserve estimation considers mining criteria for the economic cut-off grade and minimum mining width for the anticipated mining method. All design and scheduling work is undertaken to an applicable level of detail by mine planning engineers in consultation with other technical specialists using Datamine Studio UGTM and Enhanced Production SchedulerTM ("EPS") software.
The cut-off grade parameters used include projected mining, processing, and general and administrative costs. A Mineral Reserve gold price of $1,400/oz was used. The cut-off grade also considers the metallurgical recovery factor (87 percent applied for all blocks), mining dilution and recovery, tonne-kilometre haulage cost from all blocks, as well as the backfill type.
Stopes are designed using the Datamine Mineable Shape Optimiser ("MSO") Software where the outputs are further optimised by manual edits. The stope shapes are generated at section intervals of 15m to 20m based on geotechnical guidance for each block. The MSO allows the class field to be assigned to each stope generated. The mine design is reviewed taking into consideration the updated stope shapes, existing development and future infrastructure need. A LOM plan is generated which considers fleet and infrastructure capacities. All mining blocks are designed for the LHOS mining method. The Mineral Reserve is reported from the LOM plan and only includes Measured and Indicated Mineral Resource.
Map showing Obuasi planned infrastructure and licences
Below is a map that shows the location, infrastructure and mining licence area for Obuasi. The coordinates of the mine, as represented by the plant, are depicted on the map and are in the geographic coordinate system.
108
109
IDUAPRIEM
Property description
Iduapriem mine is wholly-owned and operated by AngloGold Ashanti and a production stage property. The mine is a multiple open pit operation that currently sources ore from the Block 3W, Block 5, Ajopa, and Blocks 7 and 8 pits.
Location
The mine is located in the western region of Ghana, some 70km north of the coastal city of Takoradi and approximately 10km southwest of the town of Tarkwa. The Iduapriem mine is bordered to the north by Gold Fields Ghana Limited (Tarkwa Mine) and to the east by the Ghana Manganese Company Limited (a manganese mine in existence since the 1920s).
Mineralisation style
There are four recognised conglomerate reefs namely A, B, C and D, which are equivalent to the Tarkwaian Sub-basal, Basal (or Main), Middle (or West), and Breccia Reefs, respectively. The B and C Reefs are oligomictic and consist of well-sorted conglomerates and have been mined underground in some areas more than a century ago. The A and D Reefs have a lower gold tenor and are polymictic, containing both well-rounded and angular fragments. Gold is found within the matrix that binds the pebbles together. The gold content is a function of the size and amount (packing) of quartz pebbles present within a conglomeratic unit. The gold is fine-grained, particulate and free-milling.
Legal aspects and tenure
Refer to “Item 4B: Business Overview—The Regulatory Environment Enabling AngloGold Ashanti to Mine—Africa Region—Ghana—AngloGold Ashanti’s rights and permits”.
Processing plants and other available facilities
Surface infrastructure associated with Iduapriem’s operation includes a primary crusher, overland conveyor, CIL processing plant next to the main office building, a TSF and four camp areas for contractors and company employees. Tarkwa town is also adjacent to the tenement. Power is supplied to the mine by the Volta River Authority and GRIDCo.
Mineral processing
The current processing plant treats free-milling material from open pit mining, by a conventional crush with a semi-autogenous ball milling circuit and cyanide leach. Iduapriem operates a two-stage crushing circuit consisting of a Metso Superior MKIII primary gyratory crusher and two GP550 gyratory crushers for secondary crushing. The Iduapriem treatment plant has two semi-autogenous grinding mills ("SAG mills") and two ball mills which run in two parallel circuits,each with a SAG mill and a ball mill. The second ball mill, a new thickener, a cluster of cyclones and a Knelson concentrator were commissioned in March 2009. In July 2017, three of the four leach tanks were converted into CIL tanks by introducing carbon into the each of the tanks with the installation of inter-tank screens and carbon recovery screens. Carbon for elution is harvested from one of the leach tanks to the acid wash column, and the carbon recovery screen underflow is pumped back to the leach tanks.
GUINEA
SIGUIRI
Property description
Siguiri is AngloGold Ashanti’s only operation in the Republic of Guinea. The mine is co-owned by AngloGold Ashanti (85 percent) and the government of Guinea (15 percent). The mine is a conventional open pit operation situated in the Siguiri district in the northeast of Guinea.
Siguiri is a production stage property, operated by AngloGold Ashanti. Gold-bearing ore is mined from several pits (generally three pits at any one time). Mining occurs primarily in Kami and Bidini pits in Block 1, as well as Saraya pit in Block 2. The pre-feasibility study level of work on the geotechnical design for Sanutinti pit is ongoing.
Location
Siguiri is located approximately 850km north-northeast of Conakry, 25km northwest of the town of Siguiri and 220km southeast of the Malian capital Bamako, near the Malian border.
110
Mineralisation style
Siguiri is situated in the northern part of the Siguiri Basin of Guinea, and is underlain by Lower Proterozoic rocks of the Birimian metasedimentary and volcano-sedimentary formations. Primary gold mineralisation occurs in all three lithostratigraphic units of the Siguiri region, although most of the known mineralisation is found in the central and more competent Fatoya Formation. In some deposits, the mineralisation shows strong lithological control and is preferentially developed in coarser-grained units with higher fracture or vein densities than fine-grained rocks. Mineralised veins are more intensely developed along major structural trends, with quartz-carbonate-sulphide veining developed along structures. Some of these structures have developed as incipient faults and are represented by discrete stockworks of mineralised quartz-carbonate veins occurring along a trend instead of clearly defined continuous structures.
Legal aspects and tenure
Refer to “Item 4B: Business Overview—The Regulatory Environment Enabling AngloGold Ashanti to Mine—Africa Region—Guinea—AngloGold Ashanti’s rights and permits”.
Processing plants and other available facilities
Siguiri includes a processing plant, a TSF, and other infrastructure such as a mine village, a water supply system, roads, power supply by on-site generators and communications systems. Additional infrastructure includes on-site offices, accommodation and workshops to support remote mining. Power to the mine is self-generated using heavy fuel oil.
The town of Siguiri can be accessed via a small airfield and a well-paved road that connects Siguiri to Bamako in the north and Kouroussa in the south. Access to the mine via roads and to Siguiri is easily passable through most of the year, although some secondary roads are seasonal with limited access during the wet season. While Siguiri encounters encroachment of villages onto, and artisanal and small-scale mining invasion in, its mining areas as well as increasing community demands and expectations, mitigation plans are in place to significantly reduce the impact of these issues.
Mineral processing
The mined ore is processed using a hybrid CIL circuit plant and can treat 50 percent hard ore post-commissioning of a new ball mill and three-stage crushing plant in 2019. Unit operations include comminution, leaching, carbon adsorption and desorption, smelting and tailings disposal. Further modification of three leach tanks to CIL tanks was carried out in the fourth quarter of 2020, giving a total of seven tanks in the hybrid circuit. The combination plant treats up to 50 percent fresh rock and 50 percent soft ore, with a total throughput of 11.4Mt per annum. The recovery of Bidini, which has been impacted by the presence of carbonaceous ore and the performance of the combination plant to achieve the required mill throughput and recovery, could have an impact on the economic extraction of the estimated Mineral Resource and Mineral Reserve until the plant stabilises. There are mitigation plans in place to address any TSF capacity issues and the mine is also doing further optimisation work.
TANZANIA
GEITA
For additional information, see the Technical Report Summary for Geita (effective date: 31 December 2022) filed as Exhibit 19.15.4 hereto.
Property description
Geita (“GGM”), one of AngloGold Ashanti’s flagship mines, is located in northwestern Tanzania, in the Lake Victoria goldfields of the Mwanza region, about 120km from Mwanza and 4km west of the town of Geita. The Geita gold deposits are mined as a multiple open pit and underground operation, with ore production from Star and Comet, Nyankanga and Geita Hill underground mines, and from Nyamulilima open pit. The mine is currently serviced by a CIL processing plant with an annual capacity of 5.2Mt.
GGM is wholly-owned and operated by AngloGold Ashanti. GGM currently has three underground mines (Star and Comet, Nyankanga and Geita Hill) and one open pit (Nyamulilima Cuts 1, 2 and 3) which is in production since 2021. The property is currently in a production stage.
Location
GGM is located approximately 1,200km from the main Tanzanian business centre of Dar es Salaam. It falls within the Lake Zone of northwestern Tanzania, approximately 120km west of Mwanza and 4km west of the town of Geita. The mining lease area falls within the Archaean Sukumaland Greenstone Belt of the Lake Victoria goldfields.
111
Mineralisation style
Geita is hosted in the Geita Greenstone Belt, which is a northern segment of the Sukumaland Greenstone Belt, located in the north-western part of the Tanzania Craton and south of Lake Victoria. Gold mineralisation occurred late in the tectonic history of the greenstone belt, synchronous with the development of brittle-ductile shear zones. Mineralisation is dominantly sulfide replacement of magnetite-rich layers in ironstone, with local replacement of ferromagnesian phases and magnetite in the diorite intrusions. Primary gold mineralisation is associated with the intersection of the brittle-ductile shear zones and pre-existing fold hinges, with higher grade concentrations associated with banded iron formation lithologies and with diorite dyke and sill contacts.
History
Gold mineralisation is reported to be first discovered in the Geita district in 1898 by a German prospector. A regional survey by a Kenyan company, Saragura Prospecting Syndicate, followed in 1930. The first mine was developed in 1934, and between 1936 and 1966, Geita was the largest gold mine in East Africa, producing 1Moz of gold from underground operations.
In 1996, Ashanti Goldfields Company Limited acquired the Geita tenure through the acquisition of Cluff Resources, and acquired the Kukuluma and Matandani in 1998 from Samax Resources Limited. In December 2000, Ashanti Goldfields Company Limited reached an agreement to sell a 50 percent interest in Geita to AngloGold Limited for $324 million. AngloGold Limited added its neighbouring Nyamulilima Hill deposits into the JV company. In 2004, the merger of AngloGold Limited and Ashanti Goldfields Company Limited resulted in the operation being wholly run by the combined company AngloGold Ashanti.
GGM commenced open pit mining in 1999, with open pit mining at Nyankanga between 1999 and 2020, at Geita Hill between 2001 and 2019, at Kukuluma and Matandani between 2002 and 2007, and at Star and Comet between 2007 and 2014. In 2015, a decision was taken to go underground at Star and Comet, and the underground development started in 2016. In 2017, the Nyankanga underground operation commenced and in 2020 the Geita Hill underground commenced and is scheduled to ramp up to full production by the end of 2023.
The Nyankanga open pit, the only remaining operating pit at the time, was mined to completion in September 2020. In April 2021, the Nyamulilima open pit commenced operations.
Legal aspects and tenure
Refer to “Item 4B: Business Overview—The Regulatory Environment Enabling AngloGold Ashanti to Mine—Africa Region—Tanzania—AngloGold Ashanti’s rights and permits”.
Mining method
Mining at Geita uses both open pit and underground mining methods. The Nyamulilima open pit commenced production in April 2021 and reached full production during 2022. Open pit mining is by conventional truck and shovel methods, where production mining equipment is operated by GGM with Capital Mining Services Tanzania Limited providing production and grade control drilling services, and Orica providing blasting and explosives services. Underground mining commenced at Star and Comet in 2016 and subsequently at Nyankanga in 2017, and most recently Geita Hill in 2020. Star and Comet underground has successfully transitioned to owner mining and the mining contractor African Underground Mining Services is used at Nyankanga and Geita Hill for underground development and stoping. The underground mining method is a combination of LOS and TOS. Cemented aggregate fill backfill is used at Nyankanga to fill the primary stopes and allows for the mining of secondary stopes. Ore is hauled from the Nyamulilima open pit (22km) and from Star and Comet (17km), Nyankanga (4km) and Geita Hill (2km) underground operations to the central run-of-mine ("ROM") pad by the Geita surface mining fleet.
Processing plants and other available facilities
Surface infrastructure associated with the overall Geita operation includes a 5.2Mtpa CIL processing plant, a TSF, a camp, an airstrip, open pit and underground workshops and offices, contractor yards, backfill plants and explosives suppliers. Power to the mine is self-generated at Geita's 40MW power plant using diesel generators, however, there is planned construction of a 33kV hydropower station by Tanzania Electric Supply Company Limited ("TANESCO"). The physical condition of the equipment, facilities, and infrastructure at GGM is generally considered to be in good working order. The mine has invested heavily in maintaining and upgrading its assets to ensure they remain reliable and efficient. The underground development of the mine has also been extensively developed, with the construction of a number of portals, declines and strategically placed development drives that access and further explore the gold-bearing ore. Overall, the GGM is a well-established operation implementing fit-for-purpose technologies once proven in the market. For the number of persons employed at the mine, refer to “Item 4B: Business Overview—Operating Performance—Africa Region”.
112
The “Property, Plant, and Equipment” as of 31 December 2022, including lease assets, buildings and mine infrastructure, mining assets, capitalised exploration costs, decommissioning assets, assets under construction and deferred stripping, had a carrying value of $418m.
Mineral processing
Geita’s ore processing method is a conventional CIL process with a throughput capacity of 5.2Mtpa. The circuit contains a primary gyratory crusher, secondary and tertiary crushers, a SAG mill, a ball mill and 12 leach tanks. This is coupled with a gravity circuit using two Knelson concentrators. In planning the plant feed blend material, hardness grade, oxide and sulphide content are considered in order to optimise throughput and recovery.
Mineral Resource
The below table, prepared in accordance with Table 1 to Paragraph (D)(1) of Item 1304 of Regulation S-K, summarises the gold Mineral Resource (exclusive of Mineral Reserve) for Geita at the end of the fiscal year ended 31 December 2022, based on a gold price estimate of $1,750/oz. Refer to “—Material Assumptions for the Mineral Resource—Key Parameters” for additional information on cut-off grades and metallurgical recovery.
| Mineral Resource | Category | Tonnes | Grade | Contained Gold | |||||||||||||
| as at 31 December 2022 | million | g/t | tonnes | Moz | |||||||||||||
| Geita | Measured | 1.80 | 4.15 | 7.50 | 0.24 | ||||||||||||
| Indicated | 40.32 | 2.03 | 81.96 | 2.63 | |||||||||||||
| Measured & Indicated | 42.12 | 2.12 | 89.45 | 2.88 | |||||||||||||
| Inferred | 36.21 | 2.64 | 95.71 | 3.08 | |||||||||||||
Notes:
Rounding of numbers may result in computational discrepancies in the Mineral Resource tabulations. The Mineral Resource estimates with respect to our material properties have been prepared by the Qualified Persons (employed by AngloGold Ashanti unless stated otherwise). The net difference between the Mineral Resource at the end of the last completed fiscal year and the preceding fiscal year is detailed in the table below. To reflect that figures are not precise calculations and that there is uncertainty in their estimation, AngloGold Ashanti reports tonnage, grade and content for gold to two decimals. All ounces are Troy ounces. “Moz” refers to million ounces.
1.All disclosure of Mineral Resource is exclusive of Mineral Reserve. The Mineral Resource exclusive of Mineral Reserve (“Exclusive Mineral Resource”) is defined as the inclusive Mineral Resource less the Mineral Reserve before dilution and other factors are applied.
2.“Tonnes” refers to a metric tonne which is equivalent to 1,000 kilograms.
3.Property currently in a production stage.
4.Refer to “—Material Assumptions for the Mineral Resource—Key Parameters” for additional information on cut-off grades and metallurgical recovery.
5.Based on a gold price of $1,750/oz.
Year on year changes in Mineral Resource - Moz
| as at 31 December 2022 | Geita | |||||||||||||
| Category | Measured | Indicated | Measured and Indicated total | Inferred | ||||||||||
| Previous Year | 0.21 | 1.87 | 2.08 | 3.26 | ||||||||||
| Depletion | — | — | — | — | ||||||||||
| Exploration | 0.02 | 0.09 | 0.11 | 0.12 | ||||||||||
| Methodology | 0.03 | 0.49 | 0.52 | (0.57) | ||||||||||
| Price | 0.01 | 0.17 | 0.18 | 0.19 | ||||||||||
| Cost | (0.03) | 0.19 | 0.16 | 0.07 | ||||||||||
| Geotechnical | — | — | — | — | ||||||||||
| Metallurgical | — | 0.02 | 0.02 | 0.02 | ||||||||||
| Acquisition / Disposal | — | — | — | — | ||||||||||
| Other | — | (0.20) | (0.20) | — | ||||||||||
| Current Year | 0.24 | 2.63 | 2.88 | 3.08 | ||||||||||
| Net Difference | 0.03 | 0.77 | 0.80 | (0.18) | ||||||||||
| % Difference | 16 | 41 | 38 | (6) | ||||||||||
Notes:
All figures are expressed on an attributable basis unless otherwise indicated.
The increase is largely as a result of exploration success due to accelerated drilling activities because of the planned reinvestment, and changes in methodology were as a result of revised estimation parameters, and refined ore wireframes. The increase in the Mineral Resource price and favourable cost reductions in open pit haulage, general
113
and administrative expenses and new underground contract rates led to lower cut-off grades resulting in additional Mineral Resource, which was partially offset by depletion.
Material Assumptions for the Mineral Resource
Key Parameters
| Geita | Unit | Open Pit | ||||||
| Costs | ||||||||
| Ore mining cost | $/tonne mined | 3.3 | ||||||
| Waste mining cost | $/tonne mined | 3.3 | ||||||
| Material handling | $/tonne mined | 2.03 | ||||||
| Processing cost | $/tonne treated | 18.63 | ||||||
| G&A | $/tonne treated | 8.43 | ||||||
| Other Parameters | ||||||||
| Metallurgical Recovery Factor | %MetRF | 89 | ||||||
| Slope angles | degree | 55 | ||||||
| Mineral Resource cut-off grade | g/t | 0.65 | ||||||
| Mineral Resource price | $/oz | 1,750 | ||||||
| Royalties | % | 7.3 | ||||||
| Geita | Unit | Underground | ||||||
| Costs | ||||||||
| Production (Mining cost) | $/tonne ore mined | 47.68-82.88(1) | ||||||
| Mine Services | $/tonne ore mined | 21.97-25.78(1) | ||||||
| Processing cost | $/tonne treated | 18.46-19.11(2) | ||||||
| Other Parameters | ||||||||
| Mineral Resource cut-off grade | g/t | 1.86-3.01(2) | ||||||
| Mineral Resource price | $/oz | 1,750 | ||||||
| Metallurgical Recovery Factor | %MetRF | 70.4-91.4(1) | ||||||
| Royalties | % | 7.3 | ||||||
Notes: (1) Mining cost includes backfilling at Nyankanga, and material handling costs. (2) Variable according to area. (3) %MetRF: Ridge 8, 70.4%, Star and Comet Cut 5, 80.4%, Star and Comet Cut 2, 88.3%, Star and Comet Cut 3, 88.4%, Geita Hill 87.2%, Nyankanga Block 5, 89.8%, Nyankanga Block 1, 2, 3 and 4, 91.4%. (4) Datamine Mineable Shape Optimiser ("MSO"). | ||||||||
Estimation
For the open pits, mineralisation boundaries for the individual deposits are defined from detailed logging of all geological drill holes. This information is validated and then geological wireframes are interpreted to create a 3D geological model. The geological model is subsequently used in conjunction with an appropriately dimensioned block model. Ordinary kriging is used to interpolate values into block models, and uniform conditioning ("UC") and localised uniform conditioning ("LUC") methods are used to generate a recoverable Mineral Resource block model, which estimates the proportion of ore that occurs above the Mineral Resource cut-off grade assuming a specified SMU. The open pit Mineral Resource is reported within a $1,750/oz optimised pit shell and above the calculated mineralised waste cut-off grade per pit.
For the underground Mineral Resource, the geological model is generated in the same way as for the open pits. However, a high-grade wireframe is delineated within the broader, lower-grade mineralised envelope. In this instance, all geological controls are adhered to when determining this domain. Ordinary kriging models are then constructed within the low- and high-grade domains, and numerous validation exercises are completed to ensure robust estimates are achieved. The underground Mineral Resource is reported inside a MSO volume generated using a unique underground cut-off grade for each deposit.
114
The ultimate open pit designs are used as the limiting boundaries between the open pits and underground during model compilation. The underground stopes and development are evaluated using the ordinary kriging block models and the open pit designs are evaluated using the LUC block models.
Stockpiled material above mineralised waste cut-off grade is included in the Mineral Resource.
Mineral Reserve
The below table, prepared in accordance with Table 2 to Paragraph (D)(1) of Item 1304 of Regulation S-K, summarises the gold Mineral Reserve for Geita at the end of the fiscal year ended 31 December 2022, based on a gold price estimate of $1,400/oz. Refer to “—Material Assumptions for the Mineral Reserve—Modifying factors and price estimates” for additional information on cut-off grades and metallurgical recovery.
| Mineral Reserve | Category | Tonnes | Grade | Contained Gold | |||||||||||||
| as at 31 December 2022 | million | g/t | tonnes | Moz | |||||||||||||
| Geita | Proven | 9.54 | 1.02 | 9.70 | 0.31 | ||||||||||||
| Probable | 38.95 | 2.60 | 101.19 | 3.25 | |||||||||||||
| Total | 48.49 | 2.29 | 110.89 | 3.57 | |||||||||||||
Notes:
1.Rounding of numbers may result in computational discrepancies in the Mineral Reserve tabulations. The Mineral Reserve estimates with respect to our material properties have been prepared by the Qualified Persons (employed by AngloGold Ashanti unless stated otherwise). The net difference between the Mineral Reserve at the end of the last completed fiscal year and the preceding fiscal year is detailed in the table below. To reflect that figures are not precise calculations and that there is uncertainty in their estimation, AngloGold Ashanti reports tonnage, grade and content for gold to two decimals. All ounces are Troy ounces. “Moz” refers to million ounces.
2.“Tonnes” refers to a metric tonne which is equivalent to 1,000 kilograms.
3.Property currently in a production stage.
4.Refer to “—Material Assumptions for the Mineral Reserve—Modifying factors and price estimates” for additional information on cut-off grades and metallurgical recovery.
5.Based on a gold price of $1,400/oz.
Year on year changes in Mineral Reserve - Moz
| as at 31 December 2022 | Geita | ||||||||||
| Category | Proven | Probable | Total | ||||||||
| Previous Year | 0.09 | 2.55 | 2.65 | ||||||||
| Depletion | (0.06) | (0.49) | (0.55) | ||||||||
| Exploration | — | 0.87 | 0.87 | ||||||||
| Methodology | — | — | — | ||||||||
| Price | — | 0.40 | 0.40 | ||||||||
| Cost | 0.18 | 0.06 | 0.25 | ||||||||
| Geotechnical | — | — | — | ||||||||
| Metallurgical | — | — | — | ||||||||
| Operational | 0.04 | (0.10) | (0.06) | ||||||||
| Other | 0.06 | (0.04) | 0.02 | ||||||||
| Acquisition / Disposal | — | — | — | ||||||||
| Current Year | 0.31 | 3.25 | 3.57 | ||||||||
| Net Difference | 0.22 | 0.70 | 0.92 | ||||||||
| % Difference | 241 | 27 | 35 | ||||||||
Notes:
All figures are expressed on an attributable basis unless otherwise indicated.
The increase is mainly due to ongoing exploration drilling success resulting in larger pit designs at Nyamulilima and in the first-time reporting of the Geita Hill underground Mineral Reserve based on a feasibility study currently being completed. An increase in the Mineral Reserve price and reduced costs mostly by reductions in hauling cost on surface and contractor rates is partially offset by depletion and operational changes.
115
Material Assumptions for the Mineral Reserve
Modifying factors and price estimates
| as at 31 December 2022 | Geita | |||||||
| Primary Commodity Price | $/oz | 1,400 | ||||||
| Cut-off grade | g/t | 0.70(2)-4.20(3) | ||||||
| Stoping width | cm | 450-2,500(3) | ||||||
| Dilution | % | 11.6(2);10-17(3) | ||||||
| Resource Modification Factor | %RMF based on tonnes | 99.5(2)-100(3) | ||||||
| Resource Modification Factor | %RMF based on g/t | 93(2)-100(3) | ||||||
| Mining Recovery Factor | %MRF based on tonnes | 86-100(1) | ||||||
| Mining Recovery Factor | %MRF based on g/t | 86-100(1) | ||||||
| Mine Call Factor | %MCF | 100 | ||||||
| Metallurgical Recovery Factor | %MetRF | 80.4-91.4(1) | ||||||
Notes: (1) Vary according to rock type / area. (2) Open pit. (3) Underground. | ||||||||
Estimation
The Mineral Resource models are used as the basis for Mineral Reserve estimation. Input parameters for estimating the Mineral Reserve include gold price, mining dilution and recovery, geotechnical information, stay-in-business capital, operating costs, metallurgical recovery, processing capacity and mining equipment capacities.
Appropriate Mineral Reserve cut-off grades are applied and optimised pit shells are generated for the open pit sources. Pit designs are then done on selected shells and signed off by all relevant parties to ensure compliance to specifications. Underground designs are completed and evaluated. These designs are incorporated into the production and treatment scheduling stages to yield ore tonnes and grades. Financial evaluations are completed for production and treatment schedules to check the cash flow analysis from the estimated Mineral Reserve.
The Mineral Reserve for Geita's operating and prospective pits, as well as underground mine areas is estimated using updated economic factors, latest Mineral Resource models, geological, geotechnical, mining engineering and metallurgical parameters. Environmental, sociopolitical, legal and regulatory factors are also considered.
Map showing Geita planned infrastructure and licences
Below is a map that shows the location, infrastructure and mining license area for Geita. The coordinates of the mine, as represented by the plant, are depicted on the map and are in the geographic coordinate system.
116
117
AMERICAS
The Americas region includes the mining jurisdictions Brazil and Argentina, in which AngloGold Ashanti has three operations. In Argentina, the Company has one mining operation: the Cerro Vanguardia Mine, co-owned by AngloGold Ashanti (92.5%) and Fomento Minero de Santa Cruz Sociedad del Estado (“Fomicruz SE”) (7.5%). In Brazil, the Company has two mining operations: (i) the AngloGold Ashanti Córrego do Sítio Mineração operations (“AGA Mineração”) which include the Cuiabá, Lamego and Córrego do Sítio (“CdS”) mines, and (ii) Mineração Serra Grande (“Serra Grande”).
ARGENTINA
CERRO VANGUARDIA
Property description
Cerro Vanguardia, a production stage gold-silver operation, is the Company’s sole operation in Argentina. The mine is operated by Cerro Vanguardia S.A. ("CVSA"), which is a company formed by AngloGold Ashanti (92.5%) and Fomicruz SE, a state-owned company operating in the province of Santa Cruz (7.5%). The climate is semi-arid and although snow does occur, winter is mild and exploration activities are normally possible all year round. Cerro Vanguardia operates multiple small open pits with high stripping ratios and multiple narrow-vein underground mines located within the property and mined simultaneously. Cerro Vanguardia has been in operation for more than 20 years. Silver is produced as a by-product.
Location
Cerro Vanguardia is located in the Santa Cruz province, southern Patagonia, Argentina, approximately 110km north-northwest of the coastal town of Puerto San Julián. Access to the area is by aircraft from Buenos Aires to Comodoro Rivadavia (380km) or Rio Gallegos (510km) and then by road to the mine site.
Mineralisation style
Cerro Vanguardia is in the core of the 60,000km2 Deseado Massif, one of the most extensive volcanic complexes in southern Patagonia. The Deseado Massif is deposited over Paleozoic low-grade metamorphic basement rocks. The mineralisation is concentrated in steeply-dipping quartz veins that cut the flat-lying ignimbrites and volcanoclastic rocks. The Cerro Vanguardia district contains more than 100 gold and silver-bearing epithermal veins for a cumulative exposed vein strike extension of more than 240km, of which 55 veins are currently known to contain economic gold and silver mineralisation. The veins at Cerro Vanguardia consist mainly of quartz and adularia and contain minor electrum, native gold, silver sulphides and native silver as fine-grained disseminations.
Legal aspects and tenure
Refer to “Item 4B: Business Overview—The Regulatory Environment Enabling AngloGold Ashanti to Mine—Americas—Argentina—AngloGold Ashanti’s rights and permits”.
Processing plants and other available facilities
Infrastructure for Cerro Vanguardia is mostly located on-site. It includes a camp site with a capacity of 1,300 people, a Merrill Crowe plant, heap leaching facilities, cyanide recycling plant, mine laboratory, maintenance facilities, warehouses and sewage processing plant. Four natural gas power generators, fed by a 40km long pipeline, provide electricity to the operation. Natural gas is also used for heating. Mine office facilities are located in the main mining area.
Dewatering supplies water for use both as processing water and camp consumption. Due to the particular features of the mine, and in order to optimise hauling, all pits have local, single or multiple waste dumps. The TSF is located in and is contained by a natural depression.
Mineral processing
The metallurgical plant has a daily capacity estimated at 3,500tpd (1.2Mtpa), with gold and silver grade of around 4.25g/t and 120g/t, respectively. The plant comprises the following stages: crushing, milling, conventional leaching in tanks, counter current decant system in thickeners (“CCD circuit”), a CIL process, acid wash, elution, conventional Merrill Crowe process to recover gold and silver with metallic zinc, and a cyanide recovery plant ("Cyanisorb"). The tailings go directly to a conventional TSF, where there is also a reclaim water system for the plant.
In addition to the processing plant there is a heap leach pad, with an annual capacity of 1.5Mtpa, and gold and silver grades of around 0.7g/t and 20g/t, respectively. The pregnant solution from this process goes directly to the CCD circuit in the process plant and to the Merrill Crowe process for gold and silver recovery.
118
BRAZIL
AngloGold Ashanti’s operations in Brazil comprise AGA Mineração in the Quadrilátero Ferrífero, Minas Gerais state and Serra Grande in the Goiás state. AGA Mineração consists of several operations, namely Cuiabá, Lamego, and CdS.
Ore from the Cuiabá and Lamego underground mines is processed at the Cuiabá gold plant. The concentrate produced is transported by aerial ropeway to the Queiroz plant for processing and refining. The Queiroz hydrometallurgical plant also produces sulphuric acid as a by-product.
CdS consists of open pit and underground mines. The oxide ore mined is treated by heap leach and a pressure leaching plant treats sulphide ore. The distance from the main underground mine to the metallurgical plant is around 15km.
Serra Grande comprises three mechanised underground mines, Mina III, Mina Nova and Mina Palmeiras, and an open pit as well as a dedicated metallurgical plant.
AGA MINERAÇÃO
AGA Mineração encompasses mining operations at Cuiabá, Lamego and CdS. The AGA Mineração mining complex is located in southeastern Brazil in the state of Minas Gerais. Operations are 30km from the capital of the state (Belo Horizonte) in the case of Cuiabá and Lamego, and approximately 100km in the case of CdS.
AGA MINERAÇÃO - CÓRREGO DO SÍTIO
Property description
CdS is wholly-owned by AngloGold Ashanti. It has been in operation since 1989 and consists of multiple open pit (conventional bench mining) and underground mines (mainly using sub-level stoping). The property is currently in a production stage and operated by AGA Mineração.
Location
The CdS complex is located in the municipalities of Santa Bárbara and Barão de Cocais, that are located 100km east of the city of Belo Horizonte in the state of Minas Gerais, in the southeast of Brazil. These operations are included in an important mining district referred to as the Quadrilátero Ferrífero (Iron Quadrangle), the second biggest Brazilian area for the production of iron, gold and manganese.
Mineralisation style
The CdS gold deposit is located in the eastern part of the lower to middle greenschist facies of the Rio das Velhas Archaean, in the Iron Quadrangle region, on the southern margin of the São Francisco Craton in Brazil. CdS is an orogenic gold deposit hosted in intensely deformed clastic, volcanoclastic, carbonaceous schists and metagreywackes in an approximately 30km northeast-southwest striking shear zone. Hydrothermal alteration phases associated with the mineralisation are dominated by sericite and carbonate.
The CdS I, II and III, gold deposits and associated targets are located in a gold trend that extends for approximately 14km in a north-easterly direction, from Grota Funda (CdS I) in the south to Anomalia (CdS III) in the north, which developed in a compressional tectonic regime. Gold is associated with quartz and fine grained acicular arsenopyrite. The main gold targets and deposits are distributed over three trends, namely the CdS Trend and the Cristina Trend hosted in metasedimentary rocks, and the Donana Trend hosted in BIF.
Legal aspects and tenure
Refer to “Item 4B: Business Overview—The Regulatory Environment Enabling AngloGold Ashanti to Mine—Americas—Brazil—AngloGold Ashanti’s rights and permits”.
Processing plants and other available facilities
CdS infrastructure consists of the sulphide plant at CdS II (used to process refractory sulphide material), and the heap leach plant at CdS I (for oxide ore mined by open pit). The site also has an ore sorting plant, a TSF for the sulphide plant, a neutralised tailings deposit for the oxide material and numerous waste dumps for the open pit mines at CdS I. For further information on the regulatory framework governing TSFs in Brazil, see “Item 4B: Business Overview—The Regulatory Environment Enabling AngloGold Ashanti to Mine—Americas—Brazil”.
Ancillary facilities comprise a water treatment facility, effluent treatment facilities, equipment workshops, laboratory, warehouses, explosives and accessories magazines, fuel stations, electric substations as well as offices, medical
119
clinic, mess rooms, dressing rooms, bathrooms, storerooms, garage, fuel stations, a centre of environmental studies, nursery and other facilities required to operate the mine.
Water is primarily sourced from recycling the underground mine water and supplementary water catchment wells. The power for the operations is supplied and purchased on the open market. Good communication infrastructure is available in the area.
Mineral processing
There are two metallurgical plants at CdS: the heap leach plant for oxide ore and the sulphide plant. The sulphide process consists of crushing, grinding and gravity concentration, flotation, thickening, pressure oxidation (POX autoclave), CIL extraction, elution, neutralisation, electrowinning and dry stack tailings. The sulphide plant and POX circuit have a capacity of 900ktpa. The heap leaching process consists of crushing, agglomeration, stacking, leaching, adsorption, elution and electrowinning, with capacity of 860ktpa.
AGA MINERAÇÃO - CUIABÁ
Property description
Cuiabá is an underground operation (mainly using sub-level long hole open stoping), wholly-owned by AngloGold Ashanti, within one of the most important metallogenetic provinces in Brazil known as the Iron Quadrangle. This region is an important producer of iron ore, manganese and gold in Brazil. The property is currently in a production stage and operated by AGA Mineração.
Location
Cuiabá is located 30km to the east of Belo Horizonte in the state of Minas Gerais, in the southeast of Brazil.
Mineralisation style
Cuiabá mine is located in the Iron Quadrangle, which is a geotectonic unit on the southern edge of the São Francisco Craton, comprising Archaean and Proterozoic terrains, and bordered by Neoproterozoic mobile belts. From a regional viewpoint, Cuiabá mine is located in the eastern extension of the Serra do Curral inverted homocline, located on the northeastern edge of the Iron Quadrangle. The mine lithostratigraphy consists of an intermediate metavolcanic sedimentary sequence of the greenstone belt type and is hosted in the Nova Lima Group at the bottom of the Rio das Velhas Supergroup.
Gold mineralisation is associated with sulphides and quartz veins in BIF and volcanic sequences. Structural control and fluid flow are the most important factors for gold mineralisation with a common association between large-scale shear zones and their associated structures. Where BIF is mineralised, the ore appears strongly stratiform due to the selective sulphidation of the iron-rich layers. Steeply plunging shear zones tend to control the ore shoots, which commonly plunge parallel to intersections between the shears and other structures. Mineralisation is hosted in the limbs of a fold system.
Legal aspects and tenure
Refer to “Item 4B: Business Overview—The Regulatory Environment Enabling AngloGold Ashanti to Mine—Americas—Brazil—AngloGold Ashanti’s rights and permits”.
Processing plants and other available facilities
The metallurgical plants (Cuiabá gold plant and Queiroz plant) are connected by an aerial ropeway and power to the mine is provided by a set of small hydropower plants (Rio de Peixe hydroelectric complex). Cuiabá mine has a shaft system (846m deep) for production and personnel transport, the current nominal airflow capacity for which is 1,035m3/s, of which 320m3/s are refrigerated. Tailings deposition is at one of four sites located at Cuiabá, Calcinados, Rapaunha and Cocuruto. Refer to “Item 4B: Business Overview—The Regulatory Environment Enabling AngloGold Ashanti to Mine—Americas—Brazil” for further information on the Company’s TSFs in Brazil. The Rio de Peixe hydroelectric complex is a set of seven small hydropower plants that generate energy from three dams (Ingleses, Miguelo and Codorna), and are directly connected to the Queiroz plant.
Mineral processing
Cuiabá and Lamego mines feed the Cuiabá gold (crushing, milling and flotation) and Queiroz (roaster, carbon circuit and refinery) plants, currently at 1.9Mtpa with a metallurgical recovery of 91.8 percent for the combined feed. At the Cuiabá gold plant, ore is crushed and milled followed by flotation and filtration to produce a concentrate (32 percent sulphur), which is transported by an aerial ropeway to Queiroz for further treatment. Approximately 30 percent of gold is recovered through a gravity circuit at the Cuiabá gold plant. The concentrate, transported by aerial ropeway, is received at the Queiroz plant which is located in Nova Lima and comprises the refractory ore circuit (from Cuiabá or
120
Lamego) with facilities for pyrometallurgy and hydrometallurgy. The concentrate is roasted and the calcine proceeds to a carbon-in-pulp ("CIP") with Merrill Crowe circuits for further refining. The sulphide gas is captured for processing at the acid plant. Sulphuric acid is produced as a by-product.
AGA MINERAÇÃO - LAMEGO
Property description
Lamego is an underground operation (mainly using long hole stoping) that is wholly-owned by AngloGold Ashanti, within one of the most important metallogenetic provinces in Brazil, known as the Iron Quadrangle. This region is an important producer of iron, manganese and gold in Brazil. The property is currently in a production stage and operated by AGA Mineração.
Location
Lamego is located 30km to the east of Belo Horizonte in the state of Minas Gerais, in the southeast of Brazil.
Mineralisation style
The Lamego mine is located in the Iron Quadrangle, which is a geotectonic unit at the southern edge of the São Francisco Craton, comprising Archaean and Proterozoic terrains, and bordered by Neoproterozoic mobile belts. From a regional viewpoint, the Lamego mine is located in the eastern extension of the Serra do Curral inverted homocline, located on the northern edge of the Iron Quadrangle.
Gold mineralisation is characterised by orebodies associated with two horizons of chemical sedimentary rocks: BIF and metachert, with shear zones containing abundant quartz veinlets. The proportions of these lithotypes vary substantially from one deposit to another. In the BIF, sulphide mineralisation is associated with gold, while in the metachert it is associated with quartz veins. The gold occurs either as native gold or in sulphides. Lamego has a similar rock assemblage to Cuiabá, but with higher structural complexity. The mineralised BIF is more structurally deformed and contains more silica when compared to Cuiabá, which reacted less with the hydrothermal fluid.
Legal aspects and tenure
Refer to “Item 4B: Business Overview—The Regulatory Environment Enabling AngloGold Ashanti to Mine—Americas—Brazil—AngloGold Ashanti’s rights and permits”.
Processing plants and other available facilities
Lamego operates as a satellite mine to the Cuiabá mine. Ore is transported to surface via ramps where it is crushed, stockpiled and transported daily to the Cuiabá gold plant, where it is blended with Cuiabá ore on the ROM pad.
The two plants (Cuiabá gold plant and Queiroz plant) are connected by an aerial ropeway. Power to the mine is provided by a set of small hydropower plants (Rio de Peixe hydroelectric complex) and supplied by Cemig, a state-owned company. The Rio de Peixe hydroelectric complex is a set of seven small hydropower plants that generate energy from three dams (Ingleses, Miguelo and Codorna), and are directly connected to the Queiroz plant. Tailings deposition is at one of four sites located at Cuiabá, Calcinados, Rapaunha and Cocuruto. Refer to “Item 4B: Business Overview—The Regulatory Environment Enabling AngloGold Ashanti to Mine—Americas—Brazil” for further information on the Company’s TSFs in Brazil.
Lamego has a natural water supply system and a plant for water and sewage treatment.
Mineral processing
Cuiabá and Lamego mines feed the Cuiabá gold (crushing, milling and flotation) and Queiroz (roaster, carbon circuit and refinery) plants, currently at 1.9Mtpa with a metallurgical recovery of 91.8 percent for the combined feed. At the Cuiabá gold plant, ore is crushed and milled followed by flotation and filtration to produce a concentrate (32 percent sulphur), which is transported by an aerial ropeway to Queiroz for further treatment. Approximately 30 percent of gold is recovered through a gravity circuit at the Cuiabá gold plant. The concentrate, transported by aerial ropeway, is received at the Queiroz plant which is located in Nova Lima and comprises the refractory ore circuit (from Cuiabá or Lamego) with facilities for pyrometallurgy and hydrometallurgy. The concentrate is roasted and the calcine proceeds to a CIP with Merrill Crowe circuits for further refining. The sulphide gas is captured for processing at the acid plant. Sulphuric acid is produced as a by-product.
SERRA GRANDE
Property description
Mineração Serra Grande ("MSG" or "Serra Grande") is wholly-owned and operated by AngloGold Ashanti and is located in the northwest of the state of Goiás, in central Brazil. It operates three underground mines (using sub-level
121
stoping (bottom-up and top-down), cut-and-fill and room-and-pillar mining methods) and two open pit mines. The property is currently in a production stage.
Location
Serra Grande is located 5km south of the town of Crixás, 420km from the Brazilian capital, Brasília and approximately 350km from the state capital of Goiás, Goiánia. The employment of 1,120 persons in this largely rural area makes mining the principal economic activity in the region.
Mineralisation style
The Serra Grande gold deposit is an orogenic mesothermal deposit, associated with the development of shear zones that belong to the Upper Archaean Crixás Group. Gold mineralisation is associated with metasediments and metavolcanics from the Ribeirão das Antas and Rio Vermelho Formations respectively. The Crixás Greenstone Belt is surrounded by granitic gneiss terrains from the Ribeirão das Antas and Caiamar complexes and metasedimentary rocks from the Santa Terezinha Group, which is part of the Goiás magmatic arc. Mineralisation at Serra Grande is associated with quartz veins and massive to disseminated sulphides in metasedimentary, metavolcanoclastic and metabasalt rocks, with variable degrees of hydrothermal alteration developed over orogenic stacked thrust layers (duplexes).
Legal aspects and tenure
Refer to “Item 4B: Business Overview—The Regulatory Environment Enabling AngloGold Ashanti to Mine—Americas—Brazil—AngloGold Ashanti’s rights and permits”.
Processing plants and other available facilities
Serra Grande operates a single TSF, which will support the LOM production and has government environmental licensing in place. The water used in metallurgical processing comes from the underground mines. The state road GO-337 passes close to the operation providing access for logistics. The power for the mine is supplied and purchased in the open market (grid electricity) and diesel self-generation. Refer to “Item 4B: Business Overview—The Regulatory Environment Enabling AngloGold Ashanti to Mine—Americas—Brazil” for further information on the Company’s TSFs in Brazil.
Mineral processing
The metallurgical plant has the capacity to process 1.5Mtpa, combining CIL and gravimetric circuits. The ore is blended to feed the crushing circuit, which has a capacity of 4,500tpd. There are two mills in operation, and 20 leach tanks with a capacity of 4,800m3 divided between pre-liming and cyanidation stages. Approximately 45 percent of gold is captured in the parallel gravity circuit. The tailings are filtered and stacked in piles. The rest of the gold is recovered by the CIL process to form the doré that is sent to Nova Lima for refining. The total gold recovery is approximately 93.4 percent.
AUSTRALIA
AngloGold Ashanti operates two mines and has one new project in Western Australia.
Sunrise Dam, wholly-owned by AngloGold Ashanti, is located 205km north-northeast of Kalgoorlie and 55km south of Laverton.
Tropicana is a joint operation between AngloGold Ashanti (70 percent and the operator), and AFB Resources Pty Limited (30 percent), a subsidiary of Regis Resources Limited. Tropicana is located 200km east of Laverton and 330km east-northeast of Kalgoorlie in Western Australia.
The Butcher Well project is a joint venture between AngloGold Ashanti (70 percent) and Northern Star Resources Limited (“Northern Star Resources”) (30 percent). The project is managed by AngloGold Ashanti. Butcher Well is located 20km southwest of the Sunrise Dam mine and is considered to be a potential satellite operation.
SUNRISE DAM
Property description
Sunrise Dam is a production stage property with an active underground (using sub-level open stoping methods and narrow open-stoping methods) and open pit mine that is wholly-owned and operated by AngloGold Ashanti. AngloGold Ashanti conducts all brownfield exploration activities on the site and all tenements and permits are in good standing.
122
Location
Sunrise Dam is approximately 205km north-northeast of Kalgoorlie and 55km south of Laverton in Western Australia.
Mineralisation style
Sunrise Dam is a mesothermal gold deposit located in the Archaean greenstone belts of Western Australia. The deposit is complex and structurally controlled with multiple ore zones displaying differing characteristics, from ductile shear zones to brittle stockwork complexes to intrusive hosted mineralisation. Mineralisation is typically hosted within quartz-carbonate veins with varying quantities of pyrite and arsenopyrite. Strong alteration of the country host rock is common proximal to controlling structures.
Legal aspects and tenure
Refer to “Item 4B: Business Overview—The Regulatory Environment Enabling AngloGold Ashanti to Mine—Australia—AngloGold Ashanti’s rights and permits”.
Processing plants and other available facilities
All required infrastructure is in place including a fully functional camp, process plant, tailings facility, gas pipeline, power plant and electrical reticulation, offices, airstrip and road system. The underground infrastructure caters for all ventilation and dewatering needs with provisions made in the budget for extensions and upgrades.
Mineral processing
Processing at Sunrise Dam is via a conventional three-stage crushing / two-stage milling, CIL circuit, with a pyrite flotation and ultrafine grinding circuit commissioned in 2018. The gravity circuit recovers approximately 30 percent of the gold, with the CIL circuit, AcaciaTM reactor and Anglo American Research Laboratories ("AARL") elution used to recover the remainder. Electrowinning recovers gold from the Acacia reactor and is eluted to produce gold doré. Plant throughput at Sunrise Dam is approximately 4.1Mtpa.
BUTCHER WELL
Property description
Butcher Well is a joint venture between AngloGold Ashanti (70 percent) and Northern Star Resources (30 percent). Butcher Well encompasses two tenement packages, Butcher Well and Lake Carey, covering approximately 339.56km2. AngloGold Ashanti also holds a significant tenement package adjacent to the Northern Star joint venture properties.
The project is in the exploration stage in the early stages of study, with no Mineral Reserve declared. An Inferred Mineral Resource is stated, which has been the focus of a conceptual study. As the project is still in a concept study phase, no mining has taken place. Both open pit and underground mining options (using transverse longhole open stoping) are being explored.
Location
The Butcher Well project is located in the Laverton district of Western Australia, 20km southwest of AngloGold Ashanti's Sunrise Dam mine and 180km northeast of Kalgoorlie. Butcher Well is considered as a potential satellite operation to Sunrise Dam.
The Sunrise Dam airstrip is approximately 70km by road from the project, with a travel time of approximately 90 minutes on the road on the circumference of the southern part of Lake Carey. Lake Carey is a large salt lake that covers a part of the western project area,with Sunrise Dam located to the east of the lake and the Butcher Well project located on the western shore.
Mineralisation style
The Butcher Well Mineral Resource is an orogenic-style gold system hosted within the Laverton Greenstone Belt. The mineralisation is hosted within a basalt and is spatially associated with syenite dykes. Gold mineralisation within fresh rock principally occurs within steeply dipping north-south trending panels. Supergene gold dispersion and enrichment broadens the mineralised envelope within the near-surface saprolitic material. Much of this material has been previously exploited in shallow open pits.
Legal aspects and tenure
Refer to “Item 4B: Business Overview—The Regulatory Environment Enabling AngloGold Ashanti to Mine—Australia—AngloGold Ashanti’s rights and permits”.
123
Processing plants and other available facilities
Power is likely to be generated on-site via diesel generators. Water can be sourced from the existing flooded pits or bores. Ore material will be trucked to Sunrise Dam via existing secondary roads.
Mineral processing
Ore from Butcher Well will be processed at AngloGold Ashanti's Sunrise Dam processing plant. Processing at Sunrise Dam is via a conventional three-stage crushing, two-stage milling CIL circuit, with a pyrite flotation and ultrafine grinding circuit commissioned in 2018. The gravity circuit recovers approximately 30 percent of the gold, with the CIL circuit and AARL elution used to recover the remainder. Electrowinning recovers gold from the Acacia reactor and eluate to produce gold doré. Plant throughput at Sunrise Dam is 4.1Mtpa, and Butcher Well ore will supplement ore production from the Sunrise Dam underground mine to maintain the mill throughput.
TROPICANA
Property description
Tropicana mine is a currently operating gold mine, and is a production stage property. It produces gold bearing ore from a number of open pits named from north to south: Boston Shaker, Tropicana, Havana and Havana South, and from an underground mine beneath the Boston Shaker and Tropicana open pits. The project is a joint operationbetween AngloGold Ashanti (70 percent), as operator, and AFB Resources Pty Limited, a subsidiary of Regis Resources Limited (30 percent).
Location
Tropicana is located 330km northeast of Kalgoorlie and 200km east of Laverton, Western Australia.
Mineralisation style
The Tropicana deposit is hosted in an Archaen quartz-feldspathic gneiss within a major tectonic suture zone between the Yilgarn Craton and the Albany-Fraser Orogen. Mineralisation is associated with a strong hydrothermal alteration assemblege of biotite-sericite-pyrite, which post-dates peak graulite facies metamorphism. Gold is found within the pyrite.
Legal aspects and tenure
Refer to “Item 4B: Business Overview—The Regulatory Environment Enabling AngloGold Ashanti to Mine—Australia—AngloGold Ashanti’s rights and permits”.
Processing plants and other available facilities
All surface infrastructure facilities are in place and operational. The processing plant and TSF are operating well, consistent with design specifications. The infrastructure includes, but is not limited to water supply, processing plant, mine, dewatering infrastructure, TSF, workshops, camp facilities and airstrips. Power is supplied to the mine by on-site gas and diesel power stations, and natural gas is supplied via an APA Operations (Pty) Limited pipeline. Underground development and production is ongoing.
Mineral processing
The processing plant has a capacity of 9.3Mtpa. The crushing circuit consists of a primary gyratory crusher, feeding a set of secondary cone crushers and tertiary rolls crushers. A 14MW and 6MW ball mill in parallel completes the grinding circuit. A CIL circuit is used to extract the gold from the ore, and a standard AARL elution and recovery systems is used to form gold doré bars.
The power provider, Kalgoorlie Power Systems, has built a dedicated power station consisting of a combination of diesel and gas powered generators with a capacity of 48.5MW.
PROJECTS
The projects in Colombia form a significant contribution to AngloGold Ashanti’s Mineral Resource with the three projects: La Colosa, Minera de Cobre Quebradona ("Quebradona") and Gramalote, the latter of which is a joint operationbetween AngloGold Ashanti (50 percent) and B2Gold Corp. (“B2 Gold”) (50 percent). Mineral Reserve was declared for the first time at Quebradona in 2018.
During 2022, the Company's project team in the United States integrated the Mineral Resource resulting from AngloGold Ashanti's acquisitions of Corvus Gold Inc. (“Corvus Gold”) and Coeur Sterling, Inc. (“Coeur Sterling”) using the Company’s evaluation framework. AngloGold Ashanti acquired North Bullfrog and Mother Lode as part of the Corvus Gold acquisition in January 2022 and Sterling (which includes the Crown Block deposits of SNA, Secret Pass and Daisy) through the acquisition of Coeur Sterling in November 2022.
124
AUSTRALIA
In Australia, with a few exceptions, all onshore minerals are owned by the Crown. The respective Minister for each state and territory is responsible for administering the relevant mining legislation enacted by the states and territories. Native title legislation applies to certain mining tenements within Australia. Australia Region operates two gold minesrecognises and protects a form of native title that reflects the entitlement of Aboriginal people to their traditional lands in accordance with their traditional custom and laws. Should native title claims or determinations exist, certain native title processes and procedures will apply under the Native Title Act 1993 (Cth) (the “Native Title Act”) before the tenure is granted. Tenure may be granted subject to conditions relating to native title rights. In the mining context, native title matters are managed as part of the tenement grant process. If disputes arise in relation to the grant of a particular tenement, they can be referred to the National Native Title Tribunal, established under the Native Title Act, for resolution. Native title legislation also provides a framework for compensation to be paid for acts that affect native title rights and interests. Ordinarily, the relevant Commonwealth or State government is liable to pay compensation for acts attributable to it. However, in the state of Western Australia, the Mining Act 1978 (WA) provides that an applicant for the grant of, or the holder of, a mining tenement is responsible for native title compensation, if determined to be payable, to native title holders.
64
Federal, state and territory Aboriginal and non-Aboriginal heritage laws operate in parallel to the native title legislation. State and territory heritage laws exist predominantly for the purposes of managing the impact of developments on sites, objects and areas of heritage significance. In Western Australia, impacts to Aboriginal cultural heritage are regulated by the Aboriginal Heritage Act 1972 (WA). However, this legislation will be repealed and replaced by the Aboriginal Cultural Heritage Act 2021 (WA) (the “ACH Act”) which was enacted in 2021. The regulations, management code and various guidelines which underpin the ACH Act are being co-designed by the State government, traditional owners, industry and other stakeholders. The ACH Act will not become fully operational until the co-design process is complete in mid-2023 at the earliest. Where an area of heritage significance is placed on the national or world heritage registers, federal approval processes may also apply. To date, there has not been any significant impact on any of AngloGold Ashanti’s tenure due to native title or heritage legislation and, at this stage, it is not possible to predict any significant impact that may result in the future from the final regulations, management code and various guidelines under the ACH Act, once adopted.
AngloGold Ashanti’s operating properties are located in the state of Western Australia where tenure is issued under, and mining operations are governed by, the Mining Act 1978 (WA). The most common forms of tenure in Western Australia Sunrise Dam, which is wholly owned,are exploration and Tropicana, a JVprospecting licences, mining leases, miscellaneous licences and general purpose leases. In most Australian states, if the holder of an exploration licence establishes indications of an economic mineral deposit in the area covered by the exploration licence and complies with IGO Limited (IGO). AngloGoldthe conditions of the grant, the holder of the exploration licence has a 70% stakepriority right against all others to be granted a mining lease which gives the holder exclusive mining rights with respect to minerals on the property.
It is possible for an individual or entity to own an area of land (including for infrastructure purposes) and for another individual or entity to be granted the right to explore for or mine any minerals located on or under the surface of the same area. The maximum initial term of a mining lease in Western Australia is manager,21 years and IGO holds 30%the holder has the right to renew the lease for an additional 21 years. Subsequent renewals are granted at the discretion of the respective state or territory’s minister responsible for mining rights. In Western Australia, mining leases can only be assigned with the prior written consent of the minister.
Tax laws relating to mining
Government royalties are payable by the holder of mining tenure in respect of minerals obtained from the relevant area of land at the rates specified in the relevant legislation in each state or territory. The royalty on gold production in Western Australia is payable quarterly at a fixed rate of 2.5 percent of the royalty value of gold metal produced. The royalty value is calculated by multiplying the amount of gold produced during a given month by the average gold spot price for that month. In addition, the holder of a mining tenement is required to pay annual rent in respect of the tenement. In Western Australia there is a minimum annual expenditure requirement for prospecting and exploration licences and mining leases. Exemptions from the expenditure requirement can be obtained if certain conditions are satisfied.
Environmental laws relating to mining
Mining tenements will be granted with endorsements and conditions relating to protection of the environment. Exploration and mining operations may also require separate approval from the state, territory or federal environment minister, which may require completion of an environmental impact assessment (including a public consultation period) pursuant to applicable environmental protection legislation prior to commencement. Further, a works 'construction' approval and an operating licence under the relevant environmental protection legislation in the state or territory may also be required for certain mine processing or mining-related operations. In Western Australia, legislation removing the distinction between “works approvals” and “licenses” is expected to enter into force in December 2023 such that, following the effective date, only a “license” will be required for “prescribed activities”, which include relevant works and operations on a mining lease, and not a separate “works approval”. Open pitDepending on the jurisdiction, additional approvals may be required for the removal of native vegetation within the tenement, and undergroundthe taking and use of water for exploration and mining occur at both operations.
At Sunrise Dam, operates within twoone mining leases covering over 7,800ha, which are in good standing withlease (M39/1116) covers the expiry dates in 2038. All Mineral Resource, Ore Reservesdeposit and mine infrastructure are hosted within(approximately 7,808 hectares) and another mining lease M39/1116 while lease M39/1117 hosts(M39/1117) covers the water extraction infrastructure used to supply the operation with water.water (approximately 1,768 hectares). Both leases are currently in good standing, with expiry dates in 2038.
65
At Tropicana, the deposit is situated upon a single mining lease (M39/1096) covering approximately 27,228 hectares, which is currently in good standing, with an expiry date in 2036.
AngloGold Ashanti Australia Limited is also conducting early stage exploration activities in Queensland under the Mineral Resources Act 1989 (QLD). AngloGold Ashanti holds 15 exploration permits covering 316,851 hectares. Each permit is granted with an initial term of five years, renewable for two further periods of not more than five years each.
AMERICAS
Argentina
General laws relating to mining and land ownership
Mining regime
The Argentinean Mining Code governs mining activity in the country. Special regimes exist for hydrocarbons and nuclear minerals. In the case of most minerals, the Argentinean Mining Code establishes that the owner of the land is not the owner of the mineral rights; these are held by the national or provincial governments (depending on the location of the minerals). The national or provincial government, as applicable, is required by the Argentinean Mining Code to grant whomever discovers a new mine title to the mining concession.
The Argentinean Mining Code regulates exploration permits as well as mining concessions, or exploitation rights. Exploration permits grant their holders exclusivity rights to any mineral discoveries, including those made by a third party within the exploration area covered by the permit. Exploration permits are limited in time and as to the extent of the exploration area, are subject to the payment of a single-time fee, and also require a minimum exploration work programme and schedule to keep the permit in force. Priority for receiving a mining concession is given to the registered discoverer of the mine, which holds the exploration permit. Once the application for a mine has been submitted, the applicant may commence works and must submit a legal survey of the units requested for the new mine. The application and the legal survey may be opposed by third parties following specific proceedings set forth in the Argentinean Mining Code. Approval and registration of the legal survey by the provincial mining authority constitutes formal title to the mining concession.
Holders of mining concessions must comply with three main conditions: payment of an annual fee, investment of a minimum amount of capital, and the carrying out of a reasonable level of exploitation. Failure to do so could lead to forfeiture of the mining concession, which would then revert back to the Province.
In addition to the Argentinean Mining Code, between 1993 and 1995, Argentina implemented several federal laws to offer foreign companies attractive incentives for exploration and mining in Argentina, the Mining Investment Law (Law No. 24, 196), as amended (the “Mining Investment Law”), and related legal provisions being the most important one. Such incentives include, among other matters, import duty exemptions, accelerated depreciation of fixed assets, a three percent cap on provincial royalties set at pit-head value on the mineral extracted, value added tax refunds for exploration-related expenses incurred by companies registered under the Mining Investment Law, and, subject to the filing of a feasibility study for the relevant mining project, a 30-year stability as to the tax burden on the project and the customs and foreign exchange regimes and duties. Cerro Vanguardia S.A. (“CVSA”) obtained its tax, customs and foreign exchange stability certificate in 1996.
Glacier Law
On 30 September 2010, the National Law on Minimum Requirements for the Protection of Glaciers (Law No. 26, 639) (the “Glacier Law”) was enacted in Argentina, banning new mining exploration and exploitation activities on glaciers and “peri-glacial” areas. The Glacier Law establishes a broad definition of “peri-glacial” areas that, together with glacial areas, must be surveyed by an existing national government agency specifically appointed to this end every five years. The area where the Cerro Vanguardia project is located does not include any glaciers or peri-glacial areas according to the inventory of glaciers which was published in June 2018.
Rural Land Law
On 27 December 2011, the Argentinean National Congress passed a law on the Regime for Protection of National Domain over Ownership, Possession or Tenure of Rural Land (Law No. 26, 737) (the “Rural Land Law”) which implemented a set of rules restricting the ownership of rural land by foreigners (including foreign individuals or any kind of legal entity controlled by foreign individuals or legal entities). The main restrictions are as follows: (i) foreigners cannot own in the aggregate more than 15 percent of the entire rural land of Argentina, the same cap being applicable to each Province and Municipality; (ii) foreigners will not be allowed to purchase more than 1,000 hectares in the so-called “zona núcleo”, which comprises the main agricultural areas of central Argentina or an “equivalent” surface depending on the location of the land and its productive potential; and (iii) foreigners will not be allowed to buy land that contains, or is adjacent to, relevant and permanent water bodies (such as rivers and lakes). Although exploration permits and mining concessions are not the subject matter of the restrictions placed by the Rural Land Law, certain rights granted to foreign mining companies under the Argentinean Mining Code may be restricted by this
66
new law. For example, the right that holders of mining concessions currently have to force the surface owner to sell the land to the holder of the mining concession might be restricted if the concession holder is a foreign individual or a legal entity controlled by foreigners.
Federal Mining Agreement
On 13 June 2017, the national government and the provinces in whose territories the main mining projects of Argentina are located, signed the New Federal Mining Agreement (“FMA”). The purpose of the FMA is, amongst other things, to increase provincial revenues from the mining industry by creating legal entities owned by provincial governments that would work in association with private mining companies. This leasescheme is M39/1096not new in Argentina and it has been used by some provincial governments, amongst them the Santa Cruz Province (through Fomicruz), in which the Cerro Vanguardia project is located. The FMA also contemplates other forms of revenues such as the formation of special trusts to be funded by mining companies to finance education, health and other programmes. Additionally, the FMA included setting forth mining royalties up to three percent of the gross value of commercialised minerals, without any deductions other than VAT. As the FMA has not yet been converted into law by the National Congress, its provisions are neither binding nor enforceable.
In Argentina, the current regulatory regime of royalty payments is expected to change and several different options and payment thresholds have been discussed. In December 2012, the Santa Cruz Province changed the mining royalty from one percent to three percent calculated at pit-head value of the mineral extracted thus bringing it to the cap of the Mining Investment Law.
Foreign exchange and export rules
Foreign exchange controls
On 1 September 2019, by means of Executive Decree No. 609/2019 (the “Export Controls Decree”), the Argentinean national government reinstated foreign exchange and export controls. The Export Controls Decree and related regulations of the Central Bank of Argentina impose, among other measures, the obligation of Argentinean residents to transfer to Argentina and/or sell for Argentinean pesos in the Argentinean foreign exchange market (mercado de cambios) the countervalue (contravalor) from their exports of goods within a specified period. The export of goods is regulated by the Consolidated Text on “Foreign Trade and Exchange” issued by the Argentinean Central Bank (as amended from time to time) which establishes the specific regulatory requirements to implement the measures adopted by the national government in this area. Prior approval of the Argentinean Central Bank is generally required to access the foreign exchange market for transactions relating to the outflow of funds, except in certain circumstances.
In October 2022, the Argentinean national government implemented the Argentinean System of Imports (Sistema de Importaciones de la República Argentina) (“SIRA”) and the Argentinean System of Imports and Foreign Payments of Services (Sistema de Importaciones de la República Argentina y Pagos de Servicios al Exterior). Importers must obtain a SIRA approval in the form of a SIRA certificate for the import of goods and to access the foreign exchange market for payments in connection with the import of goods. Additionally, from 1 January 2023, Argentinean residents, such as CVSA, must comply with certain supplementary provisions in order to access the foreign exchange market without prior approval of the Argentinean Central Bank, unless an exception applies.
CVSA had a cash balance equivalent to $116 million at 31 December 2022. The cash balance is available to be paid to AngloGold Ashanti’s offshore ($105 million (equivalent)) and onshore ($15 million (equivalent)) investment holding companies in the form of declared dividends. Applications have been made to the Argentinean Central Bank to approve the purchase of U.S. dollars in order to distribute offshore dividends related to the 2019, 2020 and 2021 financial years of $105 million (equivalent) to AngloGold Ashanti. Also, under a special regime established for dividend payments, a new petition to distribute a portion of the offshore dividends applied for, in the amount of $54 million (equivalent), was submitted to the Argentinean Central Bank during the third quarter of 2022. In December 2022, the Argentinean Central Bank approved, based on the applications submitted under this special regime, the payment of $17 million (equivalent) to AngloGold Ashanti. As a result, during 2022, AngloGold Ashanti received offshore dividends from CVSA in a total amount of $17 million (net of withholding taxes) paid in U.S. dollars. While the remaining approvals are pending, the cash remains fully available for CVSA’s operational and exploration requirements.
Export duties
On 21 December 2019, the National Law on Social Solidarity and Productive Reactivation (Law No. 27, 541) (the “Solidarity Law”) was enacted. The Solidarity Law granted the national government power until 31 December 2021 to impose export duties which may not exceed certain caps. For example, the Solidarity Law provides that export duties on mining exports cannot exceed eight percent of the taxable value or official FOB price. On 2 October 2020, the national government published Decree No. 785/2020 (the “Export Duties Decree”) which sets an export duty rate of eight percent for certain goods, including doré bars and gold alloys, and revoked the provisions of Decree No. 793/2018 which had previously set the export duty at 12 percent ad valorem. While the Export Duties Decree was set to expire at the end of 2021, on 31 December 2021, the national government published Decree No. 908/2021, extending the deadline of export duties on certain goods, including doré bars and gold alloys, until 31 December 2023. It is uncertain whether the national government is empowered to extend such deadline beyond the date set forth in the Solidarity Law. These export duties, if not compensated with other tax reductions, affect the tax stability guarantee granted to CVSA in 1996 in light of the fact that at the time export duties were zero percent.
67
On 26 February 2019, the Argentinean tax and mining authorities published a resolution (RC 4428/2019) establishing an administrative procedure to be followed to obtain the reimbursement or compensation of federal taxes paid in excess of the total tax burden provided for by the applicable tax stability guarantee (the “2019 Procedure”). CVSA initiated the 2019 Procedure to claim compensation for the export duties it paid in 2018, 2019 and 2020 as export duties are not contemplated by its tax stability guarantee. Prior to the publication of RC 4428/2019, CVSA had already submitted to the tax authorities claims for reimbursement of the export duties it paid from 2008 to 2015.
Pursuant to the 2019 Procedure, the National Mining Secretariat issued favorable opinions regarding CVSA’s claims in respect of fiscal years 2018 and 2019, which amounted to approximately $2.0 million and $6.3 million, respectively, as of 31 December 2022. These claims are currently under review by the relevant customs authorities. On 14 July 2021, CVSA submitted its claim in respect of fiscal year 2020, which amounted to approximately $12.4 million as of 31 December 2022. The National Mining Secretary has not yet issued an opinion regarding this claim.
Furthermore, CVSA has requested the tax authorities to apply the 2019 Procedure in respect of its historical claims for fiscal years 2008 to 2015 during which the imposition of export duties also exceeded CVSA’s total tax burden under its tax stability guarantee. However, these claims, which amounted to approximately $3.1 million as of 31 December 2022, are still being reviewed under the rules to challenge export duties instead of the 2019 Procedure. CVSA has appealed the application of those rules and a decision on this issue is pending.
On 9 June 2022, the Argentinean tax and mining authorities published a resolution (RC 5205/2022) establishing a new administrative procedure to be followed to obtain the reimbursement or compensation of federal taxes paid in excess of the total tax burden provided for by the applicable tax stability guarantee (the “2022 Procedure”). This 2022 Procedure replaces the 2019 Procedure established by RC 4428/2019. On 20 September 2022, CVSA submitted its claim for compensation for the export duties in respect of fiscal year 2021, which amounted to approximately $11.2 million as of 31 December 2022, pursuant to the 2022 Procedure. This claim is currently under review by the National Mining Secretary.
In total, AngloGold Ashanti’s net export duty receivables (after discounting provisions) in Argentina amounted to $9 million as of 31 December 2022.
Environmental laws relating to mining
Any mining company wishing to commence or modify any mining-related activity, as defined by the Argentinean Mining Code, including prospecting, exploration, exploitation, development, preparation, extraction, and storage of mineral substances, as well as property abandonment or mine closure activity, is required to prepare and submit to the competent provincial environmental authority an Environmental Impact Assessment (“EIA”) prior to commencing the work. Each EIA is required to describe the nature of the proposed work, its potential risk to the environment, and the measures that will be taken to mitigate that risk. If accepted by the competent authority, the EIA is used as the basis to create a Declaration of Environmental Impact (“DEI”) to which the mining company is required to adhere during the mining-related activity at issue. The DEI is required to be updated at least on a biannual basis. Sanctions and penalties for non-compliance with the DEI are outlined in the Environmental Protection section of the Argentinean Mining Code, and may include warnings, fines, suspension of quality certifications, obligations to restore the environment, temporary or permanent closure of activities, and withdrawal of authorisation to conduct mining-related activities.
AngloGold Ashanti’s rights and permits
The mining concession holder of Cerro Vanguardia, the Company’s operation in Argentina, is AngloGold Ashanti’s partner, Fomento Minero de Santa Cruz S.E. (“Fomicruz”), which is wholly owned by the Santa Cruz Province. On 27 December 1996, Fomicruz entered into a usufruct agreement whereby CVSA was granted an irrevocable right to exploit the Cerro Vanguardia deposit (encompassing an area of approximately 543 km2) for a 40-year period. The mining licence (402642/CV/97), which covers the full Mineral Reserve, expires on 26 December 2036. CVSA is a corporation incorporated in Argentina indirectly controlled by AngloGold Ashanti (92.5 percent), with Fomicruz as minority shareholder (7.5 percent). On 14 August 1996, CVSA obtained its tax, customs and foreign exchange stability certificate, which expires in 2026.
Brazil
General laws relating to mining and land ownership
The Brazilian Constitution of 1934 states that, for purposes of exploration and exploitation, deposits and other Mineral Resources constitute property separate from the soil and belong to the Federal Union. Exploration and exploitation of such Mineral Resources may take place only with the Federal Union’s concession and in such a way as to protect the national interest. Federal law sets out penal and administrative sanctions for conduct and activities deemed harmful to the environment.
In Brazil, the National Mining Agency (“ANM”) is the state body within the Mines and Energy Ministry (“MME”) that is responsible for: (i) the registration of mining titles, (ii) the grant of authorisations and concessions, (iii) the supervision of mining activities and mining titleholders, and (iv) the issuance of supplementary rules in relation to mining activity.
68
Under the current Brazilian Mining Code, there are two kinds of mines: (i) claimstake mines (minas manifestadas), for which rights were acquired before 1934 and exist independently of any mining licence or authorisation from the Federal Government and for which the Mineral Resources constitute property of the landowner, and (ii) granted mines, which are those that rely on grants from the Federal Government for mineral exploration or exploitation (pursuant to the Brazilian Constitution of 1988). AngloGold Ashanti’s operations in Brazil consist of both claimstake mines and granted mines.
Mining activities in granted mines must be performed in two defined stages: (i) exploration, which entails defining and evaluating the deposit and determining the feasibility of exploitation, and (ii) exploitation, which involves coordinating operations aimed at the industrial exploitation of the mineral deposit, from the extraction of useful minerals to their processing. Exploration authorisations issued by the ANM are valid for one to four years. One extension can be obtained automatically as long as it is justified. For more than one extension, the extension request will have to satisfy specific legal requirements. In contrast, exploitation rights, once granted, are valid for the lifetime of the deposit, provided the mining titleholder complies with all legal requirements. Pursuant to these requirements, for example, titleholders must (i) start work on mineral exploitation within six months from 11 March 2015the date of publication of the Exploitation Concession, (ii) continue their mining activities until the mineral deposit has been exhausted, in accordance with the Economic Exploitation Plan (Plano de Aproveitamento Econômico) approved by the ANM, and (iii) refrain from suspending mining activities without prior notice to 10 March 2036the ANM.
Tax laws relating to mining
During the exploration period, the mining titleholder has to pay an Annual Rate per Hectare (Taxa Annual por Hectare or “TAH”), subject to a maximum value set by law. In the exploitation period, regardless of the legal regime governing the project (whether claimstake or granted mines), the mining titleholder has to pay the Financial Compensation for Exploiting Mineral Resources (Compensação Financeira pela Exploração Mineral or “CFEM”). The CFEM which is 1.5 percent for gold is currently calculated based on revenues.
At the end of 2011 and the beginning of 2012, the states of Minas Gerais, Pará, Amapá and Mato Grosso do Sul each created a new “inspection and control” tax (duty) on extraction and exploration activities as well as on the use of Mineral Resource carried out in those states. In the state of Minas Gerais, gold ore and silver ore are exempted from the collection of this new duty. At the end of 2020, the state of Goiás created a new “inspection and control” tax (duty) on extraction and exploration activities carried out in this state, which currently still needs to be implemented. The constitutionality of these “inspection and control” taxes was upheld by the Supreme Court of Brazil on 1 August 2022.
Environmental laws relating to mining
Following the catastrophic failure of a tailings storage facility (“TSF”) at the Córrego do Feijão iron ore mine owned by Vale at Brumadinho in the state of Minas Gerais in Brazil in January 2019, executive, legislative and judiciary bodies, both at the federal and state levels, have generally increased scrutiny of mining operations in Brazil, and of TSFs in particular, and have been considering, and in some cases have adopted, stricter laws and regulations applicable to the approval, licensing, construction, management, closure and decommissioning of TSFs in Brazil.
At the federal level, the ANM issued Resolution No. 13/19 in August 2019 (replacing its earlier Resolution No. 4/19) which adopted additional regulatory measures to ensure the stability of TSFs, in particular those built or heightened by the upstream method or by any method declared as “unknown”. Among other things, ANM Resolution No. 13/19 prohibits the upstream method for the construction or heightening of tailings dams throughout the national territory of Brazil. It further requires operators to cease all storage and disposal activities at TSFs (known as “deactivation” or “desativação”) constructed or heightened upstream or by an “unknown” method by 15 September 2021 as well as to decommission such TSFs by 15 September 2022 to 15 September 2027 (depending on the capacity volume). To comply with the terms of ANM Resolution No. 13/19, the Serra Grande tailings dam in the state of Goiás must be decommissioned by 15 September 2025. The Serra Grande mine completed the process of reinforcing the dam walls of its upstream TSF, deactivating the TSF and migrating to dry-stacking operations, each by the 15 September 2021 deadline.
Furthermore, Federal Law No. 14.066/20, adopted in October 2020, also imposes requirements on companies to decommission upstream TSFs, including the Serra Grande tailings dam, by 25 February 2022 (which date is earlier than required by ANM Resolution No. 13/19). However, Federal Law No. 14.066/20 does permit extensions of the compliance deadline, with the consent of the ANM based on the technical plan for decommissioning. Serra Grande submitted timely requests to obtain an extension of the compliance deadline until 2025 in line with the timeline set forth in ANM Resolution No. 13/19 and presented its technical plan for decommissioning. On 26 May 2022, the ANM issued a technical note allowing the extension until 2025. With respect to downstream (or “centerline”) TSFs, Federal Law No. 14.066/20 requires companies, to the extent that communities are located in the self-rescue zone of those TSFs, to implement one of the following measures for such structures: either (i) the structure must be deactivated and decommissioned, (ii) the population must be relocated, with reparations for loss of cultural heritage, or (iii) reinforcement works that guarantee the effective stability of the structure must be carried out, by decision of the public authorities, taking into account the previous nature of the dam in relation to the occupation and technical-financial viability of the alternatives. Even if reinforcement works are completed, deactivation and decommissioning of those TSFs will be required at the end of the life of the mine. All of the TSFs operated by AngloGold Ashanti in Brazil have communities located in self-rescue zones.
69
As of 31 December 2022, AngloGold Ashanti has fully transitioned to dry-stacking operations for tailings storage at each location in Brazil. Capital expenditures required in 2022 to implement this new technology amounted to approximately $83 million. Capital expenditures for work required to comply with TSF-related requirements during the period 2023-2025 are expected to be material but, based on preliminary estimates to date, AngloGold Ashanti anticipates that annual expenditures for each of these years will be less than in prior years and will decline over time. Neither ANM Resolution No. 13/19 nor Federal Law No. 14.066/20 requires removal of all tailings material in connection with the decommissioning of TSFs (a process known as “decharacterisation” or “descaracterização”).
At the state level, the state legislator in the state of Minas Gerais adopted Law No. 23.291/19 in February 2019 which contains the state’s policy on TSF safety and should be implemented in conjunction with the equivalent federal policy. Among other things, Law No. 23.291/19 determines the criteria for licensing and inspecting TSF structures, prohibits TSFs constructed or heightened using the upstream method, establishes bond requirements and holds management liable for non-compliance with its provisions. The government of Minas Gerais adopted several decrees in furtherance of this legislation.
In addition, ANM Resolution No. 95/22, which became effective on 22 February 2022, effectively consolidates prior federal resolutions on TSFs, including ANM Resolution No. 13/19, and establishes new criteria for the operational management of TSF structures, changes the criteria related to the risk classification of TSF structures and emergency levels and sets new criteria for the suspension, embargo (order to stop operations) and interdiction of TSF activities. Operators of TSFs were mandated to conduct and submit risk assessments to the ANM by December 2022 and are required to update those risk assessments every two years. Operators are also required, on an annual basis, to obtain certifications from external consultants of the geotechnical stability of TSF structures and the adequacy of emergency response plans. In late 2022, tailings deposition was required to be suspended due to embargos at five of AngloGold Ashanti’s TSFs in Brazil pending certification by external consultants of on-site emergency response plans (Declaração de Conformidade e Operacionalidade (“DCO”)) as well as, at one such TSF, certification by external consultants of geotechnical stability (Declaração de Condição de Estabilidade (“DCE”)) consistent with the new standards. In addition, at the Calcinados TSF, a risk assessment conducted in December 2022 with oversight from external consultants, as required by Brazilian regulations, concluded that additional buttressing should be completed to align the TSF’s post liquefaction factor of safety with international standards currently considered best practice. Construction at the Calcinados TSF is expected to begin later in 2023, and the timeline for completion will be determined once the engineering and geotechnical work has been completed by external consultants. Tailings deposition at the Calcinados TSF, as well as processing of gold concentrate at the Queiroz plant, which services the Cuiabá mine complex, is suspended until additional buttressing of the Calcinados TSF impoundment is complete.
On 1 December 2022, the ANM published ANM Resolution No. 122/22, which relates to administrative sanctions for non-compliance with mining and dam safety regulations and which, in addition to significantly increasing the values of applicable fines and penalties, establishes procedures and parameters for available sanctions including seizures of ore, goods and equipment, suspension of mining activities, demolition of mine infrastructure and invalidation or cancellation of title and exploration licences.
Further amendments to the regulatory requirements in Brazil governing such TSFs and related dams are expected to be adopted in 2023.
AngloGold Ashanti’s rights and permits
At AGA Mineraçao, Cuiabá has a single mining concession (No. 000.323/1973) covering a total area of 27,228ha.3,662 hectares. In February 2022, two additional mining concessions for Cuiabá (Nos. 830.937/1979 and 831.027/1980) were published, which cover an additional area of 816.2 hectares. Lamego has a single mining concession (No. 932.710/2017) covering a total area of 1,622 hectares. Córrego do Sítio is hosted by five geographically contiguous mining concessions (i.e., Nos. 930.556/2000, 930.181/2008, 830.129/1982, 833.472/2003 and 830.943/1979) covering a total area of 6,017 hectares.
At Serra Grande, the Company has interests in or agreements over 25,719.94 hectares in the Crixás greenstone belt, representing approximately 87 percent of the relevant tenements that correspond to all current exploration and mining activities. These have been held since 1987. The mining concessions include mining concession No. 002.286/1935 covering an area of 4,206.88 hectares, mining concession No. 960.658/1987 covering an area of 1,946.89 hectares, mining concession No. 860.746/2005 covering an area of 88.28 hectares, mining concession No. 862.103/1994 covering an area of 125.41 hectares and mining concession No. 804.366/1975 covering an area of 196.05 hectares.
All of the Company’s mining concessions in Brazil are currently active, in good legal and operational standing, and free of liabilities and/or major obligations. Brazilian mining concessions remain valid up to the depletion of the Mineral Reserve and Mineral Resource pursuant to the Economic Exploitation Plan approved by the ANM and in accordance with the required environmental permits, and as a result do not have an explicit expiry date.
70
Colombia
General laws relating to mining and land ownership
General regime
The Colombian Constitution declares that the sub-soil and the non-renewable natural resources located within the Colombian territory are the property of the Colombian State. The underlying principle of Colombian mining legislation for the granting of mining concession contracts over free areas is first in time, first in law. Mining activities are regulated by the Colombian Mining Code, Act 685, 2001.
The filing of an exploration and exploitation proposal triggers a right of preference to obtain rights over the targeted area, provided it is available. Such area cannot exceed 10,000 hectares. Upon receipt of a proposal, the relevant government agency determines whether another proposal or contract already governs the area. If there are no pre-existing claims, the government agency grants the applicant a “free area”.
With respect to land ownership, a mining concession in Colombia does not grant the rights over the surface required to develop a mining project. Therefore, in order to develop a mining project, it is required to acquire and secure access to the land (soil). This can be achieved in several ways, such as (i) purchase of the land, (ii) a transit easement, (iii) a mining easement, and (iv) the special acquisition process or expropriation.
Concession contract
As the sub-soil and the non-renewable natural resources located within the Colombian territory are property of the Colombian State, the Colombian Mining Authority (Agencia Nacional de Minería) grants the authorisation to explore and exploit minerals through a concession contract.
Such concessions allow concessionaires to conduct the studies, works and facilities necessary to establish the existence of minerals and to organise their exploitation. Upon being awarded a mining concession, a company must take out an insurance policy to cover the costs associated with potential environmental damage as well as breaches of its mining obligations. It may then proceed with exploration activities. Once the exploration phase is complete, the concessionaire files a new plan regarding proposed works and facilities. With the award of the mining concession or tenement contract, there are specified timelines for the completion of the various phases of a mining project, e.g. exploration, construction, exploitation. The company must comply with these timelines unless performance is suspended, for example, due to force majeure or these timelines are extended or modified. A grant of force majeure is for one year and must be renewed on an annual basis. If the company does not comply with the specified timelines for the completion of the various phases of a mining project, the mining authority may revoke the company's concession contracts or mining licences. As a general matter, any company that wishes to obtain a renewal of its concession contract must be up to date in all its legal and contractual obligations and must present a new plan of works and facilities to be implemented after the contract is renewed.
PINES programme
In 2013, the national government instituted the PINES programme designed to aid promoting certain projects that are deemed to have a national interest. This designation provides for greater oversight from the national government. All of our three advanced exploration projects (La Colosa, Quebradona and Gramalote) were considered of national strategic interest. Currently, Quebradona and Gramalote remain in the PINES programme, but La Colosa was temporarily removed as such (until the force majeure is over).
Tax laws relating to mining
From the moment the concession contract is registered with the Mining Register, the concessionaire has several financial obligations, including the payment of (i) a surface fee during the exploration, construction and assembly stage and (ii) royalties.
Once exploration is complete and the mining infrastructure in place, the concessionaire must begin paying royalties to the Colombian government, consisting of a percentage of the primary product and sub-products being exploited. The percentage of the royalty depends on the regulation in force when the concession contract is registered. In the case of the Quebradona project, the deposit mainly consists of copper followed by gold and silver. There is a five percent royalty for copper on the production value at the mine’s or well’s edge (i.e. when extracted from the subsoil). In case of gold and silver, a royalty of four percent on the production valued at the mine’s or well’s edge (i.e. when extracted from the subsoil) was established.
Furthermore, Colombian law establishes that once the environmental licence is granted the concessionaire must invest one percent of the project’s value to benefit the basins covered by the environmental licence.
71
Environmental laws relating to mining
In order to obtain an authorisation to carry out a mining project, a company must prepare an Environmental Impact Study (“EIA”) for approval by the National Environmental Licensing Authority of Colombia (Autoridad Nacional de Licencias Ambientales or “ANLA”). Global environmental licences are granted for the entire life of the project and cover all phases: construction, assembly, operation, maintenance, dismantling, final restoration, abandonment and/or termination. Construction and assembly permits (Plan de Trabajos y Obras or “PTO”) are granted by the mining authority with jurisdiction over the project.
In Colombia, the mining authority has the discretion to declare the underlying concession void if the specific company which holds the concession breaches applicable environmental laws or regulations. If the mining authority were to exercise such discretion, a company whose concession was voided would be required to abandon its projects and all of its other existing mining concession contracts. Pending proposals for new mining concession contracts would also be cancelled and the company would be banned from doing business with the Colombian government for a period of five years. As a result, the company would be unable to conduct any mining exploration or development activities during such period. However, this would not affect other subsidiaries of the company operating in Colombia, if those concession contracts are held singularly or in concert with joint venture partners.
Mining activity is prohibited in national parks, regional parks, protected forest reserves, paramos (included in Act 1753, introduced in 2015) and wetlands, pursuant to the Ramsar Convention on Wetlands of International Importance. Some forest reserves are not “protected” but are set aside for active forestry purposes and the concessionaire must obtain a specific permit to partially and temporarily change the use of the soil before pursuing exploration activities. In addition, Resolution 1987/2016, passed by the national government in late 2016, identifies areas that the Ministry of the Environment has determined to be “paramos” areas, or paramos transition areas. In these areas there are limitations on industrial or commercial work being performed, including mining. The regulation also specifies a process to determine what work, if any, can be performed in a paramos-designated area.
AngloGold Ashanti’s rights and permits
The La Colosa project managed by AngloGold Ashanti Colombia S.A.S. (“AGA Colombia”) remains in force majeure due to delays in granting environmental permits by national and local environmental authorities, thereby preventing AGA Colombia from undertaking further exploration activities. The most recent one-year grant of force majeure, during which time the specified timelines for completing the various phases of the mining project under the concession contract are suspended, will expire on 22 June 2023. AGA Colombia applied for a mining area integration (consolidation) of its concession contracts related to La Colosa, in respect of which AGA Colombia was not in compliance with some of the specified timelines. The application for mining area integration (consolidation) was approved in March 2017, which remedied the non-compliance of each consolidated concession and reset the specified timelines. La Colosa now has a single integrated mining concession contract (EIG-163) which covers a total area of 9,210 hectares and expires on 28 February 2037.
Minera de Cobre Quebradona S.A.S. B.I.C. (“MCQ”) which manages the Quebradona project, obtained the integration of concession agreement 5881 in October 2016 and registered in December 2016. As a result, MCQ was granted the exclusive right to explore, take ownership and dispose of the mineral reserves (ore) extracted from the concession area. MCQ has the right to request an extension of up to 30 years, at least two years before the expiration of the operating period. This extension is not automatic, and the request must be filed with new technical, economic, environmental and social studies that demonstrate the status of the mineral resources. Concession contract 5881 initially covered a total area of 7,593 hectares, which was reduced to 4,881.89 hectares by the relevant mining authority (Secretaría de Minas de Antioquia) on 4 March 2022. It will expire in May 2037 and is currently in its seventh year of the integrated exploration phase. In September 2021, the permits for the construction and mining operation were approved by the relevant mining authority (Secretaría de Minas de Antioquia). On 4 November 2021, ANLA officially notified AngloGold Ashanti of its decision to ‘archive’ the environmental licence application relating to the Quebradona project. ANLA has neither denied nor granted the licence, but deemed that the information provided by AngloGold Ashanti is not enough for this authority to take a substantive decision. On 18 November 2021, AngloGold Ashanti appealed the archiving decision in order to secure further details on the specific additional information ANLA requires to make a determination. ANLA denied the appeal on 29 April 2022 and the archiving decision was confirmed. AngloGold Ashanti is in the process of preparing a new Environmental Impact Assessment for the Quebradona project to submit to ANLA in connection with its environmental licence application.
The Gramalote project is organised as a joint operation between AngloGold Ashanti (through AGA Colombia Holdings Limited and AngloGold Ashanti Holdings plc) and B2Gold (through B2Gold Corp. and Graminvest Ventures Limited). Gramalote Limited, a company incorporated under the laws of British Virgin Islands which is the legal vehicle operating the joint operation, established a Colombian branch, Gramalote Colombia Limited (“GCL”), to carry out activities in Colombia and obtain the mining concession contracts necessary to develop the Gramalote project. The Gramalote joint operation has been operated by B2Gold since January 2020. Pursuant to an integrated mining concession contract No. 14292, GCL was granted the exclusive right to explore, take ownership and dispose of the mineral reserves (ore) extracted from the concession area (which covers a total area of 8,720.71 hectares and includes the Gramalote and Monjas anomalies) until April 2043. GCL has the right to request an extension of the operating period for up to 20 years, and, if exercised, such request to extend must include new technical, economic, environmental and social studies that demonstrate the status of the mineral resources. Currently, concession contract
72
No. 14292 is in the phase of construction and assembly, pending resettlement of communities and the formal start of construction activities. GCL has received an environmental licence granted by ANLA and permits for the construction and mining operation which were approved by the relevant mining authority (Secretaría de Minas de Antioquia). GCL also holds an exploration concession No. 4894 (which covers a total area of 2,279.32 hectares and includes the Trinidad anomaly) which expires in 2044 and an exploration concession No. QHQ-16081 (which covers a total area of 9.78 hectares) which expires in 2052. Following the completion of the feasibility study in the second half of 2022, AngloGold Ashanti and B2Gold determined that the Gramalote project does not meet their investment thresholds for development. Following a comprehensive review of the alternatives relating to the project, both joint operation parties commenced a joint sales process for the Gramalote project, which is currently ongoing.
United States of America (Nevada)
General laws relating to mining and land ownership
General regime
Mineral and surface rights in the United States are owned by private parties, state governments or the federal government. The majority of land utilised for precious metals exploration, development and mining in the western United States is owned by the federal government. The right to mine on such federal land in western states is governed by the U.S. General Mining Law of 1872, as amended (the “General Mining Law”), as well as relevant state statutes and regulations. The General Mining Law allows mining claims (for mining and mining-related activities) on certain federal lands after proper compliance with claim location and maintenance requirements.
Mineral exploration activities in Nevada are also generally subject to applicable federal, state, and local permitting requirements, but the specific regulatory authorisations required for the company’s activities are based on the nature and location of the exploratory work. Many of the company’s Nevada operations are currently conducted under what is generally referred to under federal law as a notice-level operation subject to 43 CFR § 3809.21, while projects that are more advanced require additional permitting, including a Plan of Operations approved by the federal Bureau of Land Management (“BLM”). The State of Nevada Division of Environmental Protection’s Bureau of Mining Regulation and Reclamation (“BMRR”) also regulates mining within the state of Nevada. However, exploration projects of five acres or less on federal land, the scope of a notice-level operation under federal law, are exempt from BMRR regulation. Certain of the company’s early-stage exploration activities fall within this exemption.
The company is currently engaged in exploration activities on certain of its unpatented claims that include, but are not limited to, geological and spectral mapping, surface geochemical sampling, geophysical surveying and RC and/or diamond drilling.
Potential regulatory changes
Over the years, the U.S. Congress has considered a number of proposed amendments to the General Mining Law and other federal statutes relating to mining. Among the significant features contained in previously proposed legislation were a production royalty obligation, new and more stringent environmental standards and conditions, additional reclamation requirements, extensive new procedural steps which would likely result in extended permitting timelines, and granting counties and other entities the ability to petition the U.S. Secretary of the Interior to make certain areas unavailable for the location of unpatented mining claims. In June 2020, former President Trump signed an executive order directing certain federal agencies to streamline the review processes associated with permitting of infrastructure and natural resources projects. Many of those policies have subsequently been rescinded by the Biden administration. While certain other executive orders may favorably affect the timing of our permit and project approvals, the impact is yet to be determined and remains uncertain.
There are a number of bills being proposed to the Nevada state legislature during the 2023 legislative session that could impact the company’s planned operations. These include proposed legislation that would alter the way water rights are administered by the state, as well as a bill that would, if enacted, impose additional requirements for environmental review of mineral development projects in Nevada. At this stage, it is not possible to evaluate whether these bills will be enacted in any form by the Nevada state legislature or, if passed, what impact any might have on AGA.
AGA is currently unaware of any other new federal or state legislative or regulatory changes or rule-making that has been proposed or enacted that would adversely affect its current exploration programmes. If any requirements, standards or conditions were adopted in the future that imposed additional or new obligations or costs on AGA in connection with our exploration or extraction activities in the United States, the company’s operations in Nevada could be adversely affected.
AngloGold Ashanti’s rights and permits
In Nevada, the company’s wholly-owned subsidiaries hold a significant number of unpatented mining claims on federal lands. The Silicon project consists of approximately 950 unpatented mining claims. The North Bullfrog project consists of 45 patented and approximately 1,600 unpatented mining claims (covering approximately 32,000 acres) situated in the Bullfrog mining district. There are also nine mining leases within the North Bullfrog project the majority of which continue in perpetuity so long as the company meets certain minimal requirements for use of the land. One mining lease is scheduled to expire in 2031. The Mother
73
Lode project consists of 13 unpatented mining claims. The North Bullfrog and Mother Lode projects are now controlled by the company as a result of its acquisition of all of the outstanding stock of Corvus Gold Inc., which closed on 18 January 2022. The southern claim block, encompassing the Sterling mine and other properties in the same general area, consists of approximately 1,900 unpatented claims (covering approximately 35,000 acres), which are now controlled by the company as a result of its acquisition of all of the outstanding stock of Coeur Sterling, Inc. (a subsidiary of Coeur Mining, Inc.), which closed on 4 November 2022. As a result of this acquisition, the company now controls a past-producing mine site in southern Nevada known as the Sterling mine, which has one applicable mining lease that expires in 2029, with the option to extend the lease for an additional ten-year period. Although the Sterling mine is currently in care and maintenance status, it remains subject to complex permitting and regulatory requirements, including compliance with relevant provisions of the U.S. Federal Mine Safety and Health Act of 1977 and oversight by the U.S. Department of Labor’s Mine Safety and Health Administration (“MSHA”).
MINE SITE REHABILITATION AND CLOSURE
Closure, an integral part of operations
All mining operations eventually cease. An integral aspect of operating AngloGold Ashanti’s mines is ongoing planning for site closure and, where feasible, implementation of concurrent rehabilitation, together with an estimate of associated liability costs and the placement of adequate financial provisions and assurances to cover these costs.
AngloGold Ashanti integrates mine closure planning throughout the mine life cycle as follows:
•Exploration stage: developing a plan and programme for cessation and closure of exploration activities in a manner that meets local laws and AngloGold Ashanti's mine closure planning standard.
•Project phase: developing conceptual closure plans and cost estimates for all projects and including them in project feasibility studies, designs and evaluations.
•Operational phase: developing and periodically updating mine closure plans and cost estimates with increasing levels of detail and confidence over the operational phase as part of the business planning process. Closure plan updates take into account operational conditions, planning and regulatory requirements as well as advances in technology and international industry good practice (e.g., the ICMM Integrated Mine Closure Good Practice Guide). Concurrent rehabilitation, which is carried out while a mine is still operational, is a good practice that serves to decrease the final rehabilitation and closure work as well as the ultimate liability.
•Closure period: implementing the final closure plan starting at cessation of operations through a period of decommissioning, dismantling and rehabilitation until the point in time where management of the site is largely limited to monitoring and maintenance.
The Company’s group mine closure planning standard stipulates that closure planning must be undertaken in consultation with the stakeholders. In the course of these consultations, different issues are raised which require site-specific solutions. Each mine closure plan includes a social transition plan which seeks to minimise social impacts and maximise opportunities for local communities, including human resource, social infrastructure, economic and financial assets with the aim of enhancing the self-sustainability of mine communities after mine closure.
Provisions for decommissioning and restoration costs are made when there is a present obligation, it is probable that expenditure on decommissioning and restoration work will be required and the cost can be estimated within a reasonable range of possible outcomes. These costs are based on currently available facts, technology expected to be available at the time of the rehabilitation, laws and regulations presently or virtually certain to be enacted and previous experience in the rehabilitation of mine sites.
Decommissioning costs and restoration costs are provided at the present value of the expenditures expected to settle the obligation, using estimated cash flows based on current prices. Estimates are discounted at a pre-tax rate that reflects current market assessments of the time value of money.
Total provisions for decommissioning and for environmental restoration activities (excluding joint ventures) decreased by $95 million from $673 million in 2021 to $578 million in 2022. This decrease was mainly due to changes in estimates resulting from changes in discount rates, changes in global economic assumptions, changes in mine plans resulting in a change in cash flows as well as changes in the design of TSFs.
SUSTAINABILITY AND ENVIRONMENTAL, SOCIAL AND GOVERNANCE (“ESG”) MATTERS
AngloGold Ashanti’s sustainability approach is fundamental to how the Company operates its business, as well as its ability to create long-term value for its shareholders, employees and social partners through safely and responsibly exploring, mining and marketing its products. Sustainability and safety are integrated into the Company’s business and operations at all levels through various frameworks, standards and policies, and the Company measures its performance in achieving its goals against its sustainability and other ESG metrics, as well as its engagement with stakeholders.
In mitigating the risks and impacts that are an inherent part of its business, AngloGold Ashanti is informed by an annual assessment of its key ESG issues. This process is aligned with guidance published by the International Integrated Reporting Council (“IIRC”), the Sustainability Accounting Standards Board (“SASB”), the Global Reporting Initiative (“GRI”) Standards and
74
the Accountability AA1000 Stakeholder Management Standard. This assessment is annually reviewed by AngloGold Ashanti’s senior leadership and approved by the Social, Ethics and Sustainability Committee (the “SES Committee”).
AngloGold Ashanti’s board of directors, assisted by the SES Committee, has ultimate responsibility over environmental, safety, health and ethical matters and for the integration of sustainability objectives into AngloGold Ashanti’s business. This includes oversight of the Company’s stakeholder engagement framework and structures, which apply to investors, employees, governments, suppliers and communities, at every stage of its business from exploration to mine closure. Group Corporate Affairs and Sustainability is responsible for development of management systems and supports the Company’s general managers in the day-to-day implementation of its sustainability strategy.
AngloGold Ashanti maintains a set of policies and procedures to guide the Company in acting as a responsible corporate citizen, including the Code of Business Principles and Ethics which sets requirements for the implementation of key corporate policies and guidelines and applies to all management and employees, and to maintain compliance with applicable environmental, health and safety (“EHS”) laws. In 2022, AngloGold Ashanti continued with the implementation of the Integrated Sustainability Information Management System (“iSIMS”), in order to improve internal reporting and better integrate, manage and monitor sustainability activities with respect to its broader business. This common management and reporting application for all sustainability disciplines, from safety, health and security to community and environmental management, is expected to help provide timely information in each of these areas, and to facilitate transparency and decision-making in its processes and practices.
Significant EHS requirements and ESG risks and trends affecting the Company’s mining and processing operations are described below.
EHS Regulatory Compliance
AngloGold Ashanti is subject to extensive EHS laws and regulations in the various jurisdictions in which the Company operates. These requirements govern, among other things, extraction, use, conservation and discharge of water; air emissions (including dust control and greenhouse gases (“GHGs”)); mine and dam safety, regulatory and community reporting; clean-up of contamination; land use and conservation of protected areas; rehabilitation and closure of mined land; worker health and safety and community health; and the generation, transportation, storage and disposal of solid and hazardous wastes, such as reagents, radioactive materials, and mine tailings. Environmental laws and regulations applicable to the Company’s operations, including the requirements contained in environmental permits, are generally becoming more restrictive.
Capital and operating costs to comply with EHS laws and regulations have been, and are expected to continue to be, significant to AngloGold Ashanti. In addition, AngloGold Ashanti could incur fines, penalties and other sanctions, environmental clean-up costs, and third-party claims for personal injury or property or natural resources damages; suffer reputational damage; and be required to install costly pollution control equipment or to modify or suspend facilities, such as TSFs, or operations, as a result of actual or alleged violations of, or liabilities under, EHS laws and regulations. Failure to comply with applicable EHS laws and regulations may also result in the suspension or revocation of permits and, in some jurisdictions, the right to mine a given concession. AngloGold Ashanti’s ability to obtain and maintain permits and other approvals and to successfully operate near host communities may be adversely impacted by real or perceived effects on the environment or human health and safety associated with AngloGold Ashanti’s or other mining companies’ activities. In addition, unknown environmental hazards may exist at the Company’s properties which may have been caused by previous owners or operators.
Water Management
AngloGold Ashanti’s operations are heavily dependent upon access to substantial volumes of water for use in the mining and extractive processes and typically are subject to water-use permits or rights to extract water from certain natural sources that govern usage and require, among other things, that mining operations maintain certain water quality upon discharge. Water supply, quality and usage are areas of concern across all of the Company’s operations, including with respect to the Company’s mining operations in Ghana and Brazil, its mine development projects in Nevada, as well as its mine development project at Quebradona in Colombia. Any failure by the Company to secure access to suitable water supplies, or achieve and maintain compliance with applicable requirements of the permits or licences, could result in curtailment or halting of production at the affected operations. Incidents of water pollution or shortage can, in certain cases, lead to community protest and ultimately to the withdrawal of community and government support for AngloGold Ashanti’s operations. A failure by the Company to comply with water contamination related directives may result in further, more stringent, directives being issued against the Company, which may, in some cases, result in a temporary or partial shutdown of some of the Company’s operations.
Where feasible, the Company operates a “closed loop” system which recycles the water used in its operations without discharging it to the environment. In some areas, however, such as Ghana and Brazil, high levels of rainfall and surface water runoff mean that a closed loop system is not feasible and that discharges, after water treatment where necessary, must take place.
75
Waste Management
During open-pit mining, large volumes of soil and/or rock (overburden) are mined to expose the ore body. Similarly, waste rock is mined during drilling and developing access to underground ore bodies. Overburden and waste rock typically contain sub-economic levels of gold and are deposited as large waste rock facilities. Mine tailings are the process waste generated once grinding and extraction of gold from the ore is completed in the milling process and are typically deposited as slurry in large tailing storage facilities (“TSFs”) specifically designed for this purpose.
The impact of dust generation, breach, leak, or other failure of a waste rock facility or TSF, including any associated dam, can be significant, and the Company therefore monitors such facilities closely in accordance with the Company’s internal standards, independent review, national regulatory requirements, industry standards and commitments made to local communities. The occasional well-publicised failure of a third-party TSF and the potential impact of such failure also mean that these facilities are generally tightly regulated. A safety or environmental incident at the Company’s operations could result, among other things, in enforcement, including mandatory shutdown of a TSF and related facilities, obligations to remediate environmental contamination, negative press coverage, and claims for property or natural resources damages and personal injury by adjacent communities. Incidents at other mining companies’ operations could result in governmental action to tighten regulatory requirements and restrict certain mining activities, in particular with respect to TSFs, also in respect of other mine operators in that region.
For example, following the catastrophic failure of a TSF at the Córrego do Feijão iron ore mine owned by Vale at Brumadinho in the state of Minas Gerais in Brazil in January 2019, tailings were discharged into the mine’s administrative area and part of the local community, reportedly resulting in death or injury to hundreds of people. As a result of this incident, there has been considerably increased regulatory scrutiny in Brazil and other areas on mining operations generally, and the requirements applicable to the approval, licensing, construction, management, closure and decommissioning of TSFs have generally become far more stringent. For example, in late 2022, tailings deposition was suspended at five of AngloGold Ashanti’s TSFs in Brazil pending certification by external consultants of on-site emergency response plans (“DCO”) and/or geotechnical stability (“DCE”) consistent with new regulatory standards enacted in early 2022. In addition, at the Calcinados TSF, a risk assessment conducted in December 2022 with oversight from external consultants, as required by Brazilian regulations, concluded that additional buttressing should be completed to align the TSF’s post liquefaction factor of safety with international standards currently considered best practice. The timeline for completion will be determined once the engineering and geotechnical work has been completed by external consultants. For further information on the regulatory framework governing TSFs in Brazil, see “Item 4B: Business Overview—The Regulatory Environment Enabling AngloGold Ashanti to Mine—Americas—Brazil”.
In addition, a new Global Industry Standard on Tailings Management (“GISTM”) was established in August 2020 by a panel comprised of industry and non-governmental organisation (“NGO”) experts. AngloGold Ashanti has committed to comply with the GISTM at all of its TSFs by August 2025, and the costs related to meeting such standard are not expected to be material to AngloGold Ashanti.
In addition, AngloGold Ashanti could incur liabilities, or material costs to manage solid and hazardous waste generated by its mining activities, including dust and residual chemicals and metals. For example, AngloGold Ashanti expects to incur approximately $25 million to $30 million in capital expenditure and operating costs during 2023-2026 in connection with treatment and disposal of a quantity of legacy arsenic trioxide waste located at the Obuasi mine.
Groundwater Impacts and Environmental Remediation
As AngloGold Ashanti or its predecessors have a long history of mining operations in certain regions, issues may arise regarding historical, as well as potential future, environmental or health impacts in those areas, for which AGA, as the current owner/operator, may be legally responsible. For example, AngloGold Ashanti has identified groundwater contamination plumes at certain of its operations. Numerous scientific, technical and legal studies have been undertaken to assist in determining the magnitude of the impact and to find sustainable remediation solutions. Based on those studies as well as discussion with regulators, the Company has taken steps, including monitored natural attenuation and phyto-technologies, to address soil and groundwater contamination, including in Tanzania, where an in-situ remediation project to address sulfate in groundwater commenced operations in 2022.
Subject to the completion of site-specific trials and potential technologies being confirmed as viable remediation techniques, no reliable estimate can be made at this time for the obligation. Should these obligations be significant, this could have a material adverse impact upon AngloGold Ashanti’s results and its financial condition.
Climate Change and GHG Regulation
At AngloGold Ashanti, climate change is a board of directors-level governance issue, overseen by the SES Committee and the Audit and Risk Committee. AngloGold Ashanti’s Climate Change Strategy, which was approved by the board of directors in November 2021, seeks to embed the management of physical, regulatory and transition climate change-related risks, as well as climate change-related opportunities, into the Company’s strategic and operational planning processes.
76
In 2021, AngloGold Ashanti committed to the International Council on Mining & Metals (“ICMM”) target of achieving net zero Scope 1 and Scope 2 GHG emissions by 2050. AngloGold Ashanti has also committed to achieving a 30 percent reduction in absolute Scope 1 and 2 emissions by 2030 (as compared to a 2021 baseline), and, in partnership with value chain partners, to set Scope 3 GHG reduction targets, if not by the end of 2023, as soon as possible thereafter.
In December 2015, certain members of the international community negotiated a treaty at the Conference of the Parties of the UN Framework Convention on Climate Change in Paris (the “Paris Agreement”). The Paris Agreement, which came into force on 4 November 2016, requires developed countries to set targets for emissions reductions. As a result, measures designed to limit or reduce GHG emissions, both mandatory and voluntary, have been, and are expected to be, implemented at national or regional levels in various countries.
New regulatory requirements, or changes required to effectively transition to a low-carbon economy, could require AngloGold Ashanti to reduce its direct GHG emissions or energy use, change its fuel mix or incur significant costs for GHG emissions permits or taxes, including for those costs or taxes passed on by electricity utilities which supply the Company’s operations. AngloGold Ashanti could also incur significant costs associated with capital equipment, GHG monitoring and reporting and other obligations to comply with applicable requirements. The most likely source of these obligations is through nation state-level implementation of new emissions or financial obligations pursuant to evolving climate change regulatory regimes.
For example, in 2010, Brazil launched the National Climate Change Policy, which established a voluntary national GHG reduction target of 36.1 percent to 38.9 percent below the projected emissions in 2020 for “business as usual”. The policy required the development of sector-specific plans in order to meet the target and provided for a Brazilian GHG trading scheme, which is yet to be designed. While Brazil is not yet requiring mandatory GHG emissions reporting at the national level, some state environmental agencies have requested companies to voluntarily submit GHG emissions management plans. However, the states of Goiás and Minas Gerais (in which AngloGold Ashanti operates) do not currently require GHG emissions management plans for mining projects. In 2015, Brazil announced, in connection with its commitments under the Paris Agreement, economy-wide absolute mitigation targets providing for a 37 percent reduction in GHG emissions by 2025, as compared to 2005, and a goal to reduce GHG emissions by 43 percent by 2030 compared to 2005 levels.
In addition, in Australia, the Safeguard Mechanism (Rule 2015), through the National Greenhouse and Energy Reporting (“NGER”) scheme, provides a framework for Australia’s largest emitters to measure, report and manage their emissions. The Safeguard Mechanism applies to facilities with Scope 1 covered GHG emissions of more than 100,000 tonnes of CO2e per fiscal year. During the 2018/19 fiscal year, Tropicana’s emissions were within its authorised threshold and Sunrise Dam was required to purchase offsets for emissions that were 0.8 percent above its safeguard threshold, the cost of which was immaterial. Two amendments to the Safeguard Mechanism (Rule 2015) enacted in March 2019 and May 2020 allowed for the application of transitional calculated baselines using estimated CO2-e emissions intensities. Based on the production and emissions forecasts, the Australian mining operations applied to use transitional calculated baselines in 2020 for Sunrise Dam and Tropicana, which were approved by the Clean Energy Regulator effective 1 July 2019 to 30 June 2022 for both operations. Thereafter, the Australian mining operations will be required to apply production-adjusted baselines and, if actual emissions exceed the baseline, to purchase emissions offsets for the business. In any event, the cost of such offsets, if ultimately required to be purchased, including due to a change in the operations under the business plan prior to June 2022, are not expected to be material to the Company’s business.
In addition to more stringent requirements and commitments, AngloGold Ashanti’s operations are subject to a number of physical risks from climate change, such as changes in rainfall rates or patterns resulting in floods or droughts, reduced water availability, higher temperatures and extreme weather events. Such events or conditions, particularly including flooding or inadequate water supplies, could disrupt mining and transport operations, mineral processing and rehabilitation efforts, create resource or energy shortages or damage the Company’s property or equipment and increase health and safety risks on site. In consultation with external consultants, physical climate risk assessments were undertaken for all operations using current climate models for the business and various decarbonisation scenarios and climate adaptation plans were outlined. These physical climate risks will be further reviewed and refined in 2023.
Occupational Safety and Health
AngloGold Ashanti is subject to a variety of laws and regulations in each of the jurisdictions where the Company operates that are designed to protect and improve the safety and health of employees. In some of the jurisdictions in which AngloGold Ashanti operates, the government enforces compulsory shutdowns of operations to enable investigations into the cause of accidents and introduce corrective measures at those operations.
Safety remains a priority for AngloGold Ashanti and a focus of AngloGold Ashanti’s long-term sustainability approach, as well as the Company’s continuing efforts to manage the risks inherent to its operations, to model critical controls and to strengthen safety protocols and preventative measures. AngloGold Ashanti has made significant strides in improving safety. In 2022, there was a 41 percent reduction in year-on-year total recordable injury frequency rate, and no fatalities at any of the mines operated by AngloGold Ashanti.
AngloGold Ashanti’s Group Safety Strategy, which is updated every three years, seeks to integrate operational risk management and key performance indicators at all levels of the organisation and maintain alignment with global safety standards. The SES
77
Committee oversees the implementation of the Group Safety Strategy. All operations, have been certified to ISO 45001:2018, which has replaced the OHSAS 18001:2007 series.
Community Health and Tropical Diseases
AngloGold Ashanti is also subject to health and safety regulations relating to occupational disease. The primary areas of focus in respect of occupational health of employees within the Company’s operations are noise-induced hearing loss (“NIHL”) and occupational lung diseases (“OLD”). OLD includes occupational tuberculosis and silicosis in individuals exposed to silica dust. Silicosis has been particularly prevalent in South Africa and has also arisen at the Company’s Africa region and Brazilian operations, albeit to a far lesser extent. AngloGold Ashanti provides occupational health services to its employees at its occupational health centres, clinics, and through outsourced service centres. The Company continues to expand preventative occupational hygiene initiatives, such as implementing various control measures to prevent hazardous exposures, and providing employees with Personal Protective Equipment.
In 2019, the Johannesburg High Court approved the settlement of existing silicosis and tuberculosis class actions against AngloGold Ashanti and other gold mining companies in South Africa. The recent sale of the Company’s South African operating assets and liabilities did not include the silicosis or tuberculosis settlement obligations relating to South African employees, which were retained by AngloGold Ashanti. For further information, see “Item 18: Financial Statements—Note 1.2—Statement of Compliance—Significant Accounting Judgements and Estimates—Provision for silicosis”.
In addition to OLD, HIV and AIDS and associated diseases remain major health care challenges faced by AngloGold Ashanti’s Africa region operations. AngloGold Ashanti continues to implement programmes to help those infected with HIV and prevent new infections from spreading.
Malaria and other tropical diseases also pose health risks at all of the Company’s operations in Central, West and East Africa where such diseases may assume epidemic proportions because of ineffective national control programmes. Malaria is a major cause of death in young children and pregnant women and also gives rise to deaths and absenteeism in adults. All affected Company operations in Africa have malaria control programmes in place. The Ghana Obuasi malaria control programme activities have been completed in 16 districts of Ghana as planned for 2022 and a new cycle of indoor residual spraying will commence in 2023; in partnership with the Global Fund and the Ghana Department of Health.
In 2022, the COVID-19 pandemic subsided significantly with decreases in reporting of severe disease or deaths. Nevertheless, AngloGold Ashanti continued to direct resources for close surveillance and maintenance of controls within the company with a view to ensure continuity of its operations and avoid any potential disruption in the event of a re-emergence of the pandemic. Universal access to safe and effective vaccines provided an additional layer of protection, especially against severe forms of disease, hospitalisation and death. The company endeavoured to continue to provide prompt access to approved and available vaccines for all workers, especially employees considered to be at high risk as well as employees with critical skills.
The emergence of COVID-19 however also assisted to better integrate broad health risk management beyond occupational health into the overall business strategy, to contribute to productivity as well as the social licence to operate and to improve various prevention and risk management protocols in place to address the potential risk of an epidemic or pandemic, particularly after the company’s experience with Ebola in Guinea in 2014 and 2015.
The company focused on optimising mental wellbeing, minimising non-communicable diseases associated with lifestyle as well as the need for systematic contribution to health system strengthening, local skill development and overall community development in the jurisdictions in which it operates. Such risks impair the health of workers and negatively affect productivity and profitability as a result of workers’ diminished focus or skill, absenteeism, treatment costs and allocated resources. As part of AngloGold Ashanti’s continuing efforts, the company recently approved the newly updated health, hygiene and wellbeing standards based on identified major health hazards or risks which include gender, cultural and other applicable diversity considerations for risk management and controls.
Diversity and Inclusion (“D&I”)
With more than 30,000 employees (including contractor employees) on four continents, AngloGold Ashanti believes that having a diverse and inclusive workforce is important to continuing to attract talent in order to maintain competitiveness and the long-term sustainability of its business. In addition, the Company strives to have a workforce that represents the societies in which AngloGold Ashanti operates in connection with maintaining its social licence to operate.
AngloGold Ashanti’s D&I approach is aligned to the United Nation Sustainable Development Goals (“UNSDGs”) (SDG 5, 8 and 10) and the United Nations Global Compact (“UNGC”). The Company has developed a Diversity & Inclusion Framework, which aims to foster the empowerment of all staff, irrespective of race, gender, ethnicity, religion and sexual orientation and has established specific priorities and actions for the next two to five years to foster the inclusion of D&I objectives in its processes. Leadership teams are responsible for meeting defined diversity targets. In 2022, AngloGold Ashanti conducted an analysis of global gender data across job level, function and country. The analysis was carried out to inform AngloGold Ashanti’s D&I strategy.
78
Human Rights and Indigenous Peoples
In its commitment to respecting and promoting human rights, AngloGold Ashanti supports the United Nations Guiding Principles for Business and Human Rights (“UNGP”) and other international initiatives, including the UNGC and the Voluntary Principles on Security and Human Rights (“VPSHR”). The VPSHR, which seeks to balance safety and security needs against respect for human rights and fundamental freedoms, were developed through multi-stakeholder participation between governments, extractive industry members and NGOs. Community and security related matters, including with respect to illegal and artisanal and small-scale mining and related intrusions into the Company’s operational areas, are addressed at board of directors-level by the SES Committee. AngloGold Ashanti’s internal Human Rights Framework includes numerous policies, management standards and guidance documents which apply to all of its employees, contractors and suppliers and require reporting of, and redress for, human rights violations and related allegations.
The Company is aligned with the ICMM Position Statement on Indigenous Peoples and the International Finance Corporation’s Performance Standard 7 on Indigenous Peoples and other international standards and treaties in the area of Indigenous Peoples’ rights.
79
ANGLOGOLD ASHANTI GLOBAL FOOTPRINT: 2022
Operations and projects
Notes
(1) Gramalote is managed by B2Gold Corp ("B2Gold").
(2) AngloGold Ashanti acquired North Bullfrog and Mother Lode as part of the Corvus Gold Inc. ("Corvus Gold") acquisition in January 2022.
(3) AngloGold Ashanti acquired Sterling through the Coeur Sterling, Inc. ("Coeur Sterling") acquisition in November 2022.
(4) Kibali is operated by Barrick Gold Corporation ("Barrick").
80
OPERATING PERFORMANCE
Group description
AngloGold Ashanti is an independent global gold mining company with a diverse high-quality portfolio of operations, projects and exploration activities and is headquartered in Johannesburg, South Africa.
In 2022, our portfolio of ten operations in seven countries includes long-life operating assets with differing ore body types located in key gold-producing regions around the world. These operating assets were supported by greenfields projects in Colombia and a focused global exploration programme, including exploration in the United States.
Our operations and projects are grouped into the following regions: Africa, Americas and Australia.
On 12 February 2020, the Company announced that it had reached an agreement with Harmony to sell all its remaining South African producing assets and related liabilities. The sale closed on 30 September 2020. On 10 November 2020, the Company announced that it had completed the sale of its interest in the Morila mine in Mali and on 30 December 2020, the Company announced that it had completed the sale of its interest in the Sadiola Mine in Mali.
AngloGold Ashanti’s operations and joint arrangements employed, on average, 32,594 people (including contractors) in 2022 (2021: 30,561).
Performance
In 2022, AngloGold Ashanti produced attributable 2.742 million ounces of gold (2021: 2.472 million ounces), as well as 3.2 million ounces of silver and 352 tonnes of sulphuric acid as by-products.
Production of 2.742 million ounces of gold was achieved in 2022 at a cost of sales of $3.4 billion for subsidiaries and $342 million for equity-accounted joint venture operations, and an all-in sustaining cost of $1,439 per ounce for subsidiaries and $979 per ounce for equity-accounted joint venture operations, compared to a production of 2.472 million ounces in 2021 at a cost of sales of $2.9 billion for subsidiaries and $350 million for equity-accounted joint venture operations, and an all-in sustaining cost of $1,441 per ounce for subsidiaries and $856 per ounce for equity-accounted joint venture operations.
Gold
The AngloGold Ashanti gold Mineral Reserve increased from 28.1 million ounces as at 31 December 2021 to 28.8 million ounces as at 31 December 2022. This excludes Gramalote as the JV partner has decided not to publish the Mineral Reserve. This annual net increase of 0.7 million ounces includes additions due to exploration and modelling changes of 2.9 million ounces and changes in economic assumptions of 1.0 million ounces. This increase was partially offset by depletion of 2.9 million ounces and reductions due to other factors of 0.3 million ounces. The Mineral Reserve was estimated using a gold price of $1,400 per ounce, unless otherwise stated (2021: $1,200 per ounce). See “Item 4D Property, Plants and Equipment—Mineral Resource and Mineral Reserve”.
Copper
The AngloGold Ashanti copper Mineral Reserveremained unchanged at 1.47Mt (3,250Mlb) as at 31 December 2022 as a feasibility study optimisation is still ongoing and no additional exploration has been completed at Quebradona. The Mineral Reserve was estimated at a copper price of $2.90/lb, unless otherwise stated (2021: $2.90/lb). See “Item 4D Property, Plants and Equipment—Mineral Resource and Mineral Reserve”.
Capital expenditure, including equity-accounted joint ventures, in 2022 amounted to $1,118 million (2021: $1,100 million).
Safety
No fatal occupational safety incidents at any of the mines operated by the Company were recorded for 2022. The TRIFR was 1.26 per million hours worked in 2022 compared to 2.14 per million hours worked in 2021.
Full Asset Potential Review Programme
The Full Asset Potential (“FP”) programme aims to achieve a step-change in AngloGold Ashanti’s operating and cost performance by the year 2024. This programme includes a comprehensive three-month assessment of each of the Company’s mine sites, which covers every aspect of an operation. The outcome is intended to enhance the Company’s understanding of the relative potential of each asset and includes developing a plan and implementation schedule to achieve the targeted performance over the next six to 24 months. These assessments have now been completed at six operations of the Company (Sunrise Dam, Siguiri, Cuiabá, Tropicana, Serra Grande and Geita), where the relevant site leadership teams have taken full accountability for the delivery on these initiatives.
81
Operational Excellence
Operational Excellence is the continued efforts to maximise value from our assets.
New Operating Model
Our new Operating Model, designed and introduced to employees towards the end of 2021, aims to improve efficiency and support better operating outcomes by focusing only on work required to deliver the strategy, clarifying the mandates of corporate functions, properly resourcing our revenue-generating assets to deliver on their plans, and removing duplicate structures and activities. The implementation of the new Operating Model was completed during 2022.
82
AFRICA REGION
| ||
Africa is currently home to five of our operations, with one – Kibali – managed by Barrick Gold Corporation. These operations, which contributed 60 percent or 1.6 million ounces to total annual group production in 2022, are in Ghana (Iduapriem and Obuasi), Guinea (Siguiri), Tanzania (Geita) and the DRC (Kibali).
| Attributable gold production (000oz) | Average number of employees | ||||||||||
| Subsidiary operations | |||||||||||
| Ghana | |||||||||||
| Iduapriem | 248 | 2,186 | |||||||||
| Obuasi | 250 | 4,403 | |||||||||
| Guinea | |||||||||||
| Attr. Siguiri 85% | 279 | 4,052 | |||||||||
| Tanzania | |||||||||||
| Geita | 521 | 6,435 | |||||||||
| Joint venture operations | |||||||||||
| Democratic Republic of the Congo | |||||||||||
| Attr. Kibali 45% | 337 | 2,731 | |||||||||
83
Africa Region - Key Statistics
| Unit | 2022 | 2021 | 2020 | ||||||||||||||||||||
| Restated | |||||||||||||||||||||||
| Subsidiary operations | |||||||||||||||||||||||
| Tonnes treated/milled | Mt | 21.6 | 21.2 | 20.5 | |||||||||||||||||||
| Pay limit | oz/t | 0.044 | 0.035 | 0.034 | |||||||||||||||||||
| g/t | 1.516 | 1.193 | 1.160 | ||||||||||||||||||||
| Recovered grade | oz/t | 0.054 | 0.045 | 0.052 | |||||||||||||||||||
| g/t | 1.86 | 1.54 | 1.77 | ||||||||||||||||||||
Gold production (a) (attributable) | 000oz | 1,298 | 1,054 | 1,239 | |||||||||||||||||||
| Cost of sales | $m | 1,662 | 1,300 | 1,362 | |||||||||||||||||||
Total cash costs per ounce (1) | $/oz | 1,023 | 991 | 841 | |||||||||||||||||||
All-in sustaining costs per ounce(1) | $/oz | 1,291 | 1,264 | 1,002 | |||||||||||||||||||
| Capital expenditure | $m | 486 | 434 | 383 | |||||||||||||||||||
| Safety | |||||||||||||||||||||||
| Number of fatalities | 0 | 1 | 2 | ||||||||||||||||||||
| TRIFR | Per million hours worked | 0.33 | 0.61 | 0.55 | |||||||||||||||||||
| People | |||||||||||||||||||||||
| Average no of employees: Total | 17,076 | 14,806 | 14,496 | ||||||||||||||||||||
| Permanent employees | 5,780 | 5,619 | 5,433 | ||||||||||||||||||||
| Contractors | 11,296 | 9,187 | 9,063 | ||||||||||||||||||||
(a) Includes Obuasi gold production in 2020, capitalised as part of the project development.
| Unit | 2022 | 2021 | 2020 | ||||||||||||||||||||
| Joint venture operations | |||||||||||||||||||||||
| Tonnes treated/milled | Mt | 3.5 | 3.5 | 3.4 | |||||||||||||||||||
| Pay limit | oz/t | 0.054 | 0.048 | 0.048 | |||||||||||||||||||
| g/t | 1.850 | 1.652 | 1.640 | ||||||||||||||||||||
| Recovered grade | oz/t | 0.087 | 0.095 | 0.096 | |||||||||||||||||||
| g/t | 2.98 | 3.25 | 3.29 | ||||||||||||||||||||
| Gold production (attributable) | 000oz | 337 | 365 | 364 | |||||||||||||||||||
| Cost of sales | $m | 342 | 350 | 340 | |||||||||||||||||||
Total cash costs per ounce (1) | $/oz | 725 | 647 | 629 | |||||||||||||||||||
All-in sustaining costs per ounce(1) | $/oz | 979 | 856 | 810 | |||||||||||||||||||
| Capital expenditure | $m | 90 | 72 | 52 | |||||||||||||||||||
| People | |||||||||||||||||||||||
| Average no of employees: Total | 2,731 | 2,454 | 2,333 | ||||||||||||||||||||
| Permanent employees | 957 | 860 | 824 | ||||||||||||||||||||
| Contractors | 1,774 | 1,594 | 1,509 | ||||||||||||||||||||
(1)“Total cash costs per ounce” and “all-in sustaining costs per ounce” are non-GAAP measures. For further information on these non-GAAP measures, see “Item 5A: Operating Results—Non-GAAP analysis”.
84
Performance summary
Production for the Africa region was up 15 percent for the year ended 31 December 2022 at 1.635 million ounces compared to 1.419 million ounces for the year ended 31 December 2021.
Safety performance improved – there were no occupational fatalities at any of the mines operated by the Company and a TRIFR of 0.33 per million hours worked was recorded (2021: 0.61 per million hours worked).
Regional community investment totalled $10.19 million (2021: $10.5 million).
With Obuasi having received its ISO 45001 (health and safety) certification, all our Africa operations are now certified in terms of ISO 45001, ISO 14001 (environmental management) and the International Cyanide Management Code.
We continued integration of the new Operating Model, the existing Operational Excellence programme, and the Full Asset Potential (FP) review programme launched during 2021.
In the second half of 2022, Geita was part of the FP review programme designed to enhance understanding of the relative potential of each asset and includes developing a plan and implementation schedule to achieve the targeted performance over the next six to 24 months.
Siguiri was the first of the African operations to be involved in the FP review programme with the leadership team focusing on increasing the volume of high-grade oxide ore from Block 2. This increase was successful and is reflected in the year-on-year increase in production. We are starting to see the benefits of the FP review programme at Siguiri and a second contractor was hired to deliver higher volumes of higher-grade oxide ore from Block 2.
For more information regarding production performance in the Africa region, refer to “Item 5A: Operating Results—Key factors affecting results—Production in 2022”.
For more information regarding operating performance in the Africa region, refer to “Item 5A: Operating Results—Comparison of operating performance on a segment basis in 2022 with 2021”
For more information regarding capital expenditure in the Africa region, refer to “Item 5A: Operating Results—Comparison of capital expenditure in 2022, 2021 and 2020—Comparison of capital expenditure in 2022 with 2021”
Obuasi update
Phase 3 of the Obuasi redevelopment project, which relates principally to capital expenditure to refurbish existing infrastructure around the KMS Shaft, as well as to service the mine in deeper production areas, continues to progress.
In 2022, the project achieved the following milestones: hoisting via the KMS rock shaft in November 2022; pumping to drop the water level below 50 level; commissioning of the material handling system from 44 level to surface; completing the new ventilation shaft pilot hole and progressing the KMS shaft down to 44 level.
The Obuasi mine continues on the ramp-up path to its full production run-rate in excess of 400,000 ounces.
85
THE AMERICAS
| ||
The Americas hosts three of our operations – one in Argentina and two in Brazil – as well as greenfields projects in Colombia and a significant new greenfields development in Nevada in the United States.
| Attributable gold production (000oz) | Average number of employees | ||||||||||
| Operations | |||||||||||
1. Argentina | |||||||||||
| Cerro Vanguardia (Attr. 92.5%) | 170 | 1,819 | |||||||||
2. Brazil | |||||||||||
| AGA Mineração | 311 | 5,702 | |||||||||
| Serra Grande | 88 | 1,977 | |||||||||
86
Americas - Key Statistics
| Unit | 2022 | 2021 | 2020 | ||||||||||||||||||||
| Operation | |||||||||||||||||||||||
| Tonnes treated/milled | Mt | 7.1 | 7.8 | 7.5 | |||||||||||||||||||
| Pay limit | oz/t | 0.10 | 0.10 | 0.07 | |||||||||||||||||||
| g/t | 3.52 | 3.49 | 2.46 | ||||||||||||||||||||
| Recovered grade | oz/t | 0.070 | 0.066 | 0.081 | |||||||||||||||||||
| g/t | 2.40 | 2.27 | 2.77 | ||||||||||||||||||||
| Gold production (attributable) | 000oz | 569 | 559 | 649 | |||||||||||||||||||
| Silver production (attributable) | Moz | 3.2 | 3.4 | 3.3 | |||||||||||||||||||
| Cost of sales | $m | 913 | 822 | 764 | |||||||||||||||||||
Total cash costs per ounce (1) | $/oz | 1,078 | 921 | 721 | |||||||||||||||||||
All-in sustaining costs per ounce (1) | $/oz | 1,718 | 1,587 | 1,003 | |||||||||||||||||||
Capital expenditure (2) | $m | 339 | 398 | 216 | |||||||||||||||||||
| Safety | |||||||||||||||||||||||
| Number of fatalities | 0 | 1 | 0 | ||||||||||||||||||||
| TRIFR | Per million hours worked | 2.33 | 3.55 | 3.68 | |||||||||||||||||||
| People | |||||||||||||||||||||||
| Average no of employees: Total | 9,498 | 9,972 | 8,789 | ||||||||||||||||||||
| Permanent employees | 6,093 | 6,452 | 6,158 | ||||||||||||||||||||
| Contractors | 3,405 | 3,520 | 2,631 | ||||||||||||||||||||
(1)“Total cash costs per ounce” and “all-in sustaining costs per ounce” are non-GAAP measures. For further information on these non-GAAP measures, see “Item 5A: Operating Results—Non-GAAP analysis”.
(2)100 percent (not attributable) and includes Projects.
Performance summary
Production for the Americas region was up two percent for the year ended 31 December 2022 at 569,000 ounces compared to 559,000 ounces for the year ended 31 December 2021.
Safety – no occupational fatalities and the TRIFR improved to 2.33 per million hours worked (2021: 3.55 per million hours worked).
Community investment amounted to $6.4 million (2021: $5.8 million).
All operations in the Americas maintained their certification in terms of International Cyanide Management Code, ISO 45000 (health and safety) and ISO 14001 (environmental management).
During the second half of 2022, Cuiabá and Serra Grande completed assessments to identify performance improvement initiatives as part of the FP review programme. The FP programme initiatives implemented at Cuiabá have seen ore tonnes consistently above full potential target. At Serra Grande, the FP team identified several enhancement opportunities and it is following implementation plans with timelines for delivery.
In December 2022, the company suspended filtered tailings deposition on the Calcinados TSF and processing of gold concentrate at the Queiroz plant (both of which service the Cuiabá mine complex). For further information, refer to “Item 4B: Business Overview—The Regulatory Environment Enabling AngloGold Ashanti to Mine—Americas—Brazil” and “Item 3D: Risk Factors—Compliance with tailings management requirements and standards, and potential liabilities in the event of a failure to timely comply with these requirements or an incident involving a tailings storage facility, could adversely impact AngloGold Ashanti's financial condition, results of operations and reputation”.
For more information regarding production performance in the Americas region, refer to “Item 5A: Operating Results—Key factors affecting results—Production in 2022”.
For more information regarding operating performance in the Americas region, refer to “Item 5A: Operating Results—Comparison of operating performance on a segment basis in 2022 with 2021”.
For more information regarding capital expenditure in the Americas region, refer to “Item 5A: Operating Results—Comparison of capital expenditure in 2022, 2021 and 2020—Comparison of capital expenditure in 2022 with 2021”.
Nevada strategy
87
In Nevada, during 2022, AngloGold Ashanti’s project team integrated the Corvus Gold assets and project data into the AngloGold Ashanti evaluation framework. The Company completed planning for feasibility study work at North Bullfrog and also commenced a pre-feasibility study at Silicon along with further drilling at the Merlin deposit. Following the acquisition of Coeur Sterling’s mining properties in the fourth quarter of 2022, AngloGold Ashanti’s project team commenced integrating these assets into the broader evaluation studies.
88
AUSTRALIA
| ||
| Attributable gold production (000oz) | Average number of employees | ||||||||||
| Operations | |||||||||||
| Australia | |||||||||||
| 1. Sunrise Dam | 232 | 725 | |||||||||
| 2. Tropicana 70% | 306 | 807 | |||||||||
The two AngloGold Ashanti operations in Australia are Sunrise Dam and Tropicana, both of which are in the north-eastern goldfields in the state of Western Australia. Sunrise Dam is wholly owned. We have a 70 percent holding in, and manage, Tropicana. Regis Resources Ltd, our partner in Tropicana, holds the balance. Sunrise Dam includes the Butcher Well project (70 percent).
89
Australia - Key Statistics
| Unit | 2022 | 2021 | 2020 | ||||||||||||||||||||
| Operation | |||||||||||||||||||||||
| Tonnes treated/milled | Mt | 10.7 | 10.5 | 10.2 | |||||||||||||||||||
| Pay limit | oz/t | 0.05 | 0.06 | 0.06 | |||||||||||||||||||
| g/t | 1.69 | 1.89 | 1.95 | ||||||||||||||||||||
| Recovered grade | oz/t | 0.050 | 0.047 | 0.054 | |||||||||||||||||||
| g/t | 1.56 | 1.47 | 1.68 | ||||||||||||||||||||
| Gold production (attributable) | 000oz | 538 | 494 | 554 | |||||||||||||||||||
| Cost of sales | $m | 783 | 740 | 705 | |||||||||||||||||||
Total cash costs per ounce (1) | $/oz | 1,157 | 1,196 | 968 | |||||||||||||||||||
All-in sustaining costs per ounce(1) | $/oz | 1,345 | 1,500 | 1,225 | |||||||||||||||||||
| Capital expenditure | $m | 202 | 185 | 142 | |||||||||||||||||||
| Safety | |||||||||||||||||||||||
| Number of fatalities | 0 | 0 | 0 | ||||||||||||||||||||
| TRIFR | Per million hours worked | 3.82 | 6.59 | 3.74 | |||||||||||||||||||
| People | |||||||||||||||||||||||
| Average no of employees: Total | 1,532 | 1,332 | 1,230 | ||||||||||||||||||||
| Permanent employees | 314 | 288 | 259 | ||||||||||||||||||||
| Contractors | 1,218 | 1,044 | 971 | ||||||||||||||||||||
(1)“Total cash costs per ounce” and “all-in sustaining costs per ounce” are non-GAAP measures. For further information on these non-GAAP measures, see “Item 5A: Operating Results—Non-GAAP analysis”.
Performance summary
Production for the Australia region was up nine percent for the year ended 31 December 2022 at 538,000 ounces compared to 494,000 ounces for the year ended 31 December 2021.
Safety performance improved – there were no occupational fatalities and a TRIFR of 3.82 per million hours worked was recorded (2021: 6.59 per million hours worked).
Regional community investment amounted to $0.99 million (2021: $1.01 million).
Sunrise Dam and Tropicana are certified under the Cyanide Code, ISO 45000 (health and safety) and ISO 14001 (environmental management).
The first site to complete an assessment as part of the FP review programme was Sunrise Dam, where the biggest opportunity is to increase productivity in development and achieve a step-change in underground production. The proposed improvements include an underground workshop to lift jumbo utilisation and improvements to planning and scheduling which, together are expected to support an increase in underground volumes. During the second half of 2022, Tropicana also completed an assessment to identify performance improvement initiatives as part of the FP review programme.
For more information regarding production performance in the Australia region, refer to “Item 5A: Operating Results—Key factors affecting results—Production in 2022”.
For more information regarding operating performance in the Australia region, refer to “Item 5A: Operating Results—Comparison of operating performance on a segment basis in 2022 with 2021”.
For more information regarding capital expenditure in the Australia region, refer to “Item 5A: Operating Results—Comparison of capital expenditure in 2022, 2021 and 2020—Comparison of capital expenditure in 2022 with 2021”.
90
SOUTH AFRICA
| ||
The sale of the South African assets to Harmony closed on 30 September 2020. As a result, the figures in this section relate
to the nine months ended on 30 September 2020, unless the context indicates otherwise.
South Africa Key Statistics
| Unit | 2022 | 2021 | 2020 | ||||||||||||||||||||
| Operation | |||||||||||||||||||||||
| Tonnes treated/milled | Mt | 0.4 | |||||||||||||||||||||
Pay limit (1) | oz/t | 0.40 | |||||||||||||||||||||
| g/t | 14.60 | ||||||||||||||||||||||
Recovered grade (1) | oz/t | 0.120 | |||||||||||||||||||||
| g/t | 3.75 | ||||||||||||||||||||||
| Gold production | 000oz | 241 | |||||||||||||||||||||
| Cost of sales | $m | 287 | |||||||||||||||||||||
Total cash costs per ounce (2) | $/oz | 1,149 | |||||||||||||||||||||
All-in sustaining costs per ounce(2) | $/oz | 1,296 | |||||||||||||||||||||
| Capital expenditure | $m | 35 | |||||||||||||||||||||
| Safety | |||||||||||||||||||||||
| Number of fatalities | 4 | ||||||||||||||||||||||
| TRIFR | Per million hours worked | 6.12 | |||||||||||||||||||||
| People | |||||||||||||||||||||||
| Average no of employees: Total | 8,297 | ||||||||||||||||||||||
| Permanent employees | 7,012 | ||||||||||||||||||||||
| Contractors | 1,285 | ||||||||||||||||||||||
(1)Refers to underground operations only.
(2)“Total cash costs per ounce” and “all-in sustaining costs per ounce” are non-GAAP measures. For further information on these non-GAAP measures, see “Item 5A: Operating Results—Non-GAAP analysis”.
91
EXPLORATION REVIEW
Our greenfields exploration programmes are designed to discover new Mineral Resource that will ultimately lead to the development of new, stand-alone gold mines and support the sustainability of our business.
In 2022, the Silicon and Merlin prospects in Nevada were handed over to our Beatty project team, following which the greenfields exploration team refocused its efforts on the discovery of the next significant project to add to the AngloGold Ashanti portfolio.
Greenfields exploration
In 2022, $29 million was spent on greenfields exploration. Our greenfields exploration tenements cover over 9,500km2 of highly prospective ground in six countries – Australia, Argentina, Brazil, Guinea, Tanzania, and the United States.
Americas
In the United States, following the handover of the Silicon discovery to the Beatty Project team in the first quarter of 2022, the greenfields exploration function shifted its focus to seven, 100 percent-owned, earlier-stage greenfields projects located elsewhere in the Great Basin of Nevada. Work completed at these various projects included prospect mapping, surface sampling and geophysical surveys. Diamond drilling is planned for the Midnight Star and CR projects during 2023.
In Brazil, 1,330 stream sediments, 1,200 soil samples and 1,060 rock chip samples were collected. From the SBB terrane in the state of Minas Gerais, four districts have been identified by stream sediment sampling. Infill sampling is in progress to define projects in these districts. At the WBC terrane, which is located in the state of Matto Grosso do Sul to the south-west of Minas Gerais, one project has been advanced and will be considered for drilling in 2023.
In Argentina, an option agreement was signed with Latin Metals for the Organullo project in Salta Province. Work completed since June 2022 included soil sampling, mapping, acquisition of various spectral data sets and community engagement. At the 100 percent-held El Cori project, four drilling targets were identified from surface exploration.
Africa
In Guinea, we received six reconnaissance permits for the Shira district in the Siguiri Basin of Guinea. Community engagement work has started and field exploration is scheduled for the first quarter of 2023.
In Tanzania, target generation activities continued.
Australia
In Australia, we carried out exploration work in the Laverton District and, in Queensland, greenfields exploration took place at the Chillagoe and Georgetown projects.
Brownfields exploration
In the Beatty District, brownfields exploration continued at North Bullfrog, and successfully defined and expanded the Silicon and Merlin targets. Elsewhere across our operations, exploration continued, on one hand to add confidence to the mine plans by upgrading the Mineral Resource and on the other to search for new Mineral Resource with a high likelihood for conversion to Mineral Reserve.
In 2022, our brownfields exploration teams across the globe completed 799km of capital and 358km of expensed drilling at a cost of $79 million and $67 million, respectively. The drilled metre achievement was ten percent below the 2022 budget of 1,281km with the gap closing each quarter after slow start ups at a few operations. Total expenditure of $146 million was 12 percent below budget.
Brownfields exploration activities resulting in the most notable economic intercepts, by operation, for 2022 are listed below by region.
Africa
•Geita: The key area drilled was Geita Hill which is split into six blocks. The drilling was conducted from both surface and underground and was designed to upgrade the underground project and to prepare for mining. Other significant intercepts were drilled at Star and Comet underground at Cut 3 and Ridge 8, extending the potential of the underground complex at Star and Comet. Drilling at the Nyamulilima open pit expanded and further defined the mineralisation.
•Obuasi: Drilling at Block 8, Block 10 and Sansu continued to define the limits of mineralisation and prepare these areas for mining. Late in the year drilling started at Cote D’Or examining the potential to open a second mining area.
•Siguiri: The key exploration activities were at Kounkoun (Block 3) where infill and definition drilling continue as part of the overall assessment of Block 3 as a future mining area. Drilling to extend and define the known mineralisation in Blocks 1 and 2 was conducted.
•Kibali: Two notable drilling intercepts, at Mengu Hill and Oere, were recorded during the year.
92
Americas
•Cerro Vanguardia: Numerous veins were drilled and later in the year emphasis moved to the northwest of the property and onto the Condor ground.
•AGA Mineração, CdS: Drilling of underground opportunities at both CdS I and II delivered significant intercepts at Sangue De Boi, Mutuca, Rosalino, Pinta Bem and Pneu.
•AGA Mineração, Cuiabá: Drilling to extend the depth extents of Fonte Grande Sul below 21 level continued while at a shallower depth drilling to define the satellite ore bodies continued to deliver.
•Serra Grande: One significant intercept, at Angicão, was drilled during the year.
•Beatty: Definition and infill drilling continued at Silicon and Merlin in Nevada. Drilling at North Bullfrog started to deliver later in the year.
Australia
•Sunrise Dam: The key areas delivering significant intercepts were at Frankie and Vogue as part of programmes designed to define and extend mineralisation in these areas. As is typical of the Sunrise Dam mineralisation, most drilling programmes drilled significant intercepts which reflect the nuggety nature of the mineralisation.
•Tropicana: Successful drilling was aimed at the three underground projects, namely, Boston Shaker, Havana and Tropicana.
While many of the significant economic intersections are for unmined underground opportunities, Nevada is delivering significant intersections that will most likely be excavated through open pit mining.
PROJECTS
Quebradona
Following the decision of Colombia’s national environmental agency (ANLA) in November 2021 to archive the Company’s environmental licence application for the Quebradona project, AngloGold Ashanti filed an appeal seeking to secure further details on the specific additional information required for ANLA to make a decision on AngloGold Ashanti’s licence submission. On 29 April 2022, ANLA dismissed the appeal and confirmed its decision to archive the Company’s application. AngloGold Ashanti continues to review and analyse the additional information identified as part of ANLA’s decision. The objective is to prepare, submit and process a new environmental licence request for Quebradona following completion of a new environmental impact assessment.
Gramalote
Following completion of the feasibility study on the Gramalote gold project, a joint operation with B2Gold, both partners have determined that the Gramalote project does not meet their investment thresholds for development. The project continues to benefit from federal and local government support as well as continuing support from local communities.
AngloGold Ashanti and B2Gold have completed a comprehensive review of the alternatives and consider that it would be in the best interest of all stakeholders for a new party to own the Gramalote project. The partners appointed a corporate advisor in the fourth quarter of 2022 to assist with the sale process for the Gramalote project, which is currently ongoing.
93
4C. ORGANISATIONAL STRUCTURE
GROUP STRUCTURE
AngloGold Ashanti’s operations are divided into the following regions:
•Africa — operations in Ghana, Guinea and Tanzania and a joint venture operation in the DRC;
•Australia — operations in Australia; and
•Americas — operations in Argentina and Brazil, and exploration projects in the United States and Colombia.
The above regions correspond to AngloGold Ashanti’s business segments. The South Africa region is recognised for financial statement purposes as discontinued operations as we sold our remaining South African producing assets and related liabilities in 2020. In addition, a new segment, Projects has been introduced from the implementation of the new Operating Model (previously reported under the America’s segment). The Projects segment comprises all the major non-sustaining capital projects with the potential to be developed into operating entities.
Day-to-day management of the Group is entrusted to AngloGold Ashanti’s executive management team, chaired by the Chief Executive Officer. See “Item 6: Directors, Senior Management and Employees”.
Support is provided to the executive management team in managing AngloGold Ashanti’s corporate activities at both the central and local levels.
SUBSIDIARIES
AngloGold Ashanti Limited has investments in principal subsidiaries and joint venture interests, see “Item 19: Exhibits to Form 20-F—Exhibit 19.8 List of AngloGold Ashanti Limited subsidiaries” for details.
On 16 March 2023, AngloGold Ashanti and Gold Fields announced that they have agreed the key terms of a proposed joint venture in Ghana between Gold Fields' Tarkwa and AngloGold Ashanti's neighbouring Iduapriem Mines (the “Proposed Joint Venture”). There can be no certainty that the parties will enter into a definitive agreement with respect to the Proposed Joint Venture or about the timing, terms and conditions of any such definitive agreement. Implementation of the Proposed Joint Venture is subject to, among other matters, reaching agreement with the Government of Ghana regarding the Proposed Joint Venture, conclusion of confirmatory due diligence and securing all requisite regulatory approvals. For further information, refer to “Item 18: Financial Statements—Note 35—Subsequent Events”.
94
4D. PROPERTY, PLANTS AND EQUIPMENT
Locations of properties
Notes:
(1) Gramalote is managed by B2Gold Corp ("B2Gold").
(2) AngloGold Ashanti acquired North Bullfrog and Mother Lode as part of the Corvus Gold Inc.("Corvus Gold") acquisition in January 2022.
(3) AngloGold Ashanti acquired Sterling (which includes the Crown Block deposits of SNA, Secret Pass and Daisy) through the Coeur Sterling, Inc. ("Coeur Sterling") acquisition in November 2022.
(4) Kibali is operated by Barrick Gold Corporation ("Barrick").
The locations of AngloGold Ashanti’s properties are shown above. Percentages indicate the ownership interest held by AngloGold Ashanti. All operations are 100 percent wholly-owned unless otherwise indicated.
Overview of mining properties and operations
The overview for each mining property is disclosed below and includes information on the following items:
•Location of the properties;
•For each material property, locality maps showing the location of such properties as well as infrastructure and licences;
•Type and amount of ownership interests;
•Identity of the operator or operators;
•Titles, mineral rights, leases or options and acreage involved;
•Stages of the properties (exploration, development or production);
•Key permit conditions;
•Mine types and mineralisation styles; and
•Processing plants and other available facilities.
95
Please refer to “Item 5A: Operating Results—Key factors affecting results—Production in 2022” for the aggregate annual production for each of the Company's mining properties during each of the fiscal years ended 31 December 2022, 2021 and 2020. For more information about AngloGold Ashanti’s mines, including a summary of the Company’s titles, mining rights, leases and licences with acreage, please refer to “Item 4B: Business Overview—The Regulatory Environment Enabling AngloGold Ashanti to Mine”.
In its annual report on Form 20-F for the fiscal year ended 31 December 2021, AngloGold Ashanti complied for the first time with the new mining property disclosure requirements for mining registrants set forth in Subpart 1300 of Regulation S-K (17 CFR § 229.1300) (“Regulation S-K 1300”) and reported on, and filed Technical Report Summaries for, all of its mining properties. During 2022, AngloGold Ashanti developed a process to determine which properties are material to its business or financial condition for purposes of the individual property disclosure requirements of Item 1304 of Regulation S-K (17 CFR § 229.1304). The key considerations taken into account by AngloGold Ashanti in its materiality assessment include (i) certain quantitative factors such as contribution to the Mineral Resource and Mineral Reserve, actual and planned production and Net Present Value, as well as (ii) certain qualitative factors, which are assessed in the context of the Company’s overall business and financial condition. The materiality assessment covers all of the Company’s mining properties (regardless of the stage of the mining property) and all of its mining and related activities from exploration through extraction, and will be reviewed by the Company on an annual basis. Based on these considerations, AngloGold Ashanti has determined that its material properties for purposes of Regulation S-K 1300 are Geita, Kibali and Obuasi. With respect to Geita, an updated Technical Report Summary (effective date: 31 December 2022) has been prepared by the relevant Qualified Persons, and is filed as Exhibit 19.15.4 hereto. With respect to Kibali and Obuasi, AngloGold Ashanti has determined that (i) there are no material changes to the Mineral Reserve or Mineral Resource reported in the Technical Report Summaries for these properties (effective date: 31 December 2021) which were filed as exhibits to AngloGold Ashanti’s annual report on Form 20-F for the fiscal year ended 31 December 2021, and (ii) all material assumptions and information pertaining to the disclosure of the Mineral Resource and Mineral Reserve for Kibali and Obuasi remain current in all material respects as of 31 December 2022, based on all facts and circumstances, both quantitative and qualitative. As a result, the Technical Report Summaries for Kibali and Obuasi (effective date: 31 December 2021), which were initially filed as exhibits to AngloGold Ashanti’s annual report on Form 20-F for the fiscal year ended 31 December 2021, are filed as Exhibits 19.15.7 and 19.15.5, respectively, hereto.
AngloGold Ashanti’s operating mines are all accessible by road, although for some, personnel access is better achieved by air.
AngloGold Ashanti’s exploration programmes are based on consistent standards and processes across its portfolio and are guided by peer review. Part of AngloGold Ashanti's investment strategy is focused on exploration drilling and Mineral Reserve development to grow the Mineral Resource and by converting these, the Company allows for expansion of the Mineral Reserve. The process involves identifying the best group of drill targets and prioritising those that have the highest potential for success to be advanced first. Greenfields exploration aims to discover large, high-value Mineral Resource, which will eventually lead to the development of new gold mines. Brownfields exploration focuses on delivering value through accretive additions to the Mineral Reserve at existing mines as well as new discoveries in defined areas around operations.
This annual report on Form 20-F is not being submitted in support of the disclosure of exploration results and therefore no disclosure of drilling or sample results is provided. AngloGold Ashanti has elected not to provide drilling results for its operating mines as drilling at its brownfields operations is generally intended to provide incremental additions, or conversions to already reported Mineral Resource and therefore they are not seen as material. While drilling at the Company’s brownfields operations increases confidence in its Mineral Resource as well as adds LOM extensions, the incremental additions that occur on a yearly basis are not material to that operation or the Company as a whole. In cases where the drilling projects are supporting a non-sustaining addition, these projects are commented on. In the Company’s major greenfields projects, if any single drill result is considered material and may change the reported Mineral Resource significantly then it is reported. Refer to “Item 4B: Business Overview—Exploration review”.
96
AFRICA
AngloGold Ashanti has five mining operations within the Africa region:
•Kibali Gold Mine in the Democratic Republic of the Congo ("DRC"), a joint venture (“JV”) between AngloGold Ashanti (45%), Barrick Gold Corporation (“Barrick”) (following its merger with Randgold Resources Limited (“Randgold”)) (45%), and Société Minière de Kilo-Moto S.A. (“SOKIMO”), a state-owned gold mining company (10%);
•Iduapriem Gold Mine ("Iduapriem") and Obuasi Gold Mine ("Obuasi") in Ghana;
•Siguiri Gold Mine (“Siguiri”) in Guinea, co-owned by AngloGold Ashanti (85%) and the government of Guinea (15%); and
•Geita Gold Mine ("GGM" or "Geita") in Tanzania.
Mining is from both open pit and underground, with Obuasi being an underground mine, Iduapriem and Siguiri being open pit mines, and Kibali and Geita being a combination of open pit and underground mines.
DRC
KIBALI
For additional information, please refer to the Technical Report Summary for Kibali (effective date: 31 December 2021) filed as Exhibit 19.15.7 hereto.
Property description
Kibali is a joint venture co-owned by AngloGold Ashanti (45%), Barrick (45%), and SOKIMO (10%). SOKIMO is wholly-owned by the DRC government. The consolidated lease is made up of ten exploitation permits. The metallurgical plant comprises a twin-circuit sulphide and oxide plant with conventional carbon-in-leach ("CIL"), including gravity recovery as well as a float and ultra-fine grind circuit. Barrick operates the mine, which comprises both open pit and underground operations.
Kibali is a gold mining, processing and exploration project. Operations currently focus on open pit and underground mining. The mine was originally developed and operated by Randgold. Following the completion of the merger of Randgold and Barrick in 2019, Barrick became the operator at Kibali for both exploration and mining. Kibali is currently a production stage property.
Location
Kibali is located in the northeastern part of the DRC near the international borders with Uganda and South Sudan. The mine is located adjacent to the village of Doko, which is located to the west of the lease area. Kibali is approximately 210km by road from Arua and immediately north of the district capital of Watsa. The operational area falls within the administrative territory of Watsa in Haut-Uélé province.
Mineralisation style
Gold deposits of the Kibali district are classified as Archaean orogenic gold deposits. At Kibali, the gold deposits are largely hosted in siliciclastic rocks, banded iron formations (“BIFs”) and chert that were deformed, altered and transposed during several events. This occurred at or near greenschist metamorphic conditions. Ore-forming H2O-CO2-rich fluids migrated along a linked network of gently northeast-dipping shears and north-northeast plunging fold axes that are commonly referred to as the KZ Trend. The auriferous KZ Trend is a complexly deformed fault system specifically developed along the boundary between the younger sedimentary basin in the west of the belt that juxtaposes the older rocks to the east. Mineralisation occurred during the later stages of subsequent regional deformation which resulted in inversion of the basin and the development of reverse faults and folds. Ongoing deformation during hydrothermal activity resulted in the development of lodes in a variety of related structural settings within the KZ Trend.
History
On 15 October 2009, AngloGold Ashanti acquired a 50 percent indirect interest in Moto Goldmines Limited through a JV with Randgold, with Moto holding a 70 percent stake in Kibali and the DRC parastatal SOKIMO holding the remaining 30 percent stake. On 21 December 2009, Randgold and AngloGold Ashanti increased their JV interest in Kibali to 90 percent, while SOKIMO retained a 10 percent holding. On 2 January 2019, Randgold merged with Barrick, and the JV is now held by the combined company, trading as Barrick.
Legal aspects and tenure
Refer to “Item 4B: Business Overview—The Regulatory Environment Enabling AngloGold Ashanti to Mine—Africa Region—Democratic Republic of the Congo (DRC)—AngloGold Ashanti’s rights and permits”.
97
Mining method
The operation comprises both open pit and underground mining. Open pit mining is carried out using conventional drill, blast, load and haul surface mining methods. From 2022 onwards, open pit production will come from the Sessenge, Aerodrome, Pamao, Gorumbwa, Megi-Marakeke-Sayi, Kalimva-Ikamva, Oere, Pakaka, and Karagba, Chauffeur and Durba (“KCD”) deposits. Open pit mining is conducted by contractor Kibali Mining Services, a local subsidiary of DTP Terrassement, using either free-dig or conventional drill, blast, load and haul methods.
For the underground operation, longitudinal and transverse longitudinal stoping methods with paste backfill are the nominated mining methods. The Kibali KCD underground mine is designed to extract the KCD deposit directly beneath the KCD open pit. A 50m crown pillar separates the pit bottom from the top of the underground mine. The first gold was poured in September 2013 from the open pit operations and development of the underground mine commenced in the same year. Stoping commenced in 2015 and ore production has ramped up to 3.8Mt in 2022. Initial production was truck hauled by a twin decline to surface. In 2017, the haulage shaft (740m deep) and materials handling system was commissioned. From 2018 onwards, underground ore has predominantly been hoisted up the shaft. The decline to surface will continue to be used to haul some of the shallower zones and to supplement shaft haulage.
Processing plants and other available facilities
Infrastructure in the DRC is generally poor as a result of limited investment in maintenance, upgrades and extensions of the road networks established during colonial times. The mine site is located within 160km of the border with Uganda and all transport links take place through Uganda to Kenya or Tanzania. Access by air to Kibali involves a commercial flight to Entebbe in Uganda followed by a charter flight to Doko airport, situated on the mine property. The Doko airstrip was upgraded by Kibali and is equipped with runway lights and precision approach path indicator lights. For the number of persons employed at the mine, refer to “Item 4B: Business Overview—Operating Performance—Africa Region”.
Kibali is a large-scale gold mining operation, with a number of sources of ore, that has been in operation since 2013. The physical condition of the equipment, facilities, and infrastructure at Kibali is in good working order, with the mine investing heavily in maintaining and upgrading its assets to ensure that they remain reliable and efficient. Surface infrastructure associated with the overall Kibali operation includes a processing plant, tailings storage facility ("TSF"), camp, airstrip, underground shaft, workshops and offices. Power to the mine is self-generated by a combination of hydroelectric and diesel generators. The underground mine has also been extensively developed, with the construction of both shaft and portal and strategically placed development drives that access and further explore the gold-bearing ore.
The “Property, Plant, and Equipment” as of 31 December 2022, including lease assets, buildings and mine infrastructure, mining assets, mineral rights and dumps, decommissioning assets, capitalised exploration costs and deferred stripping, had a carrying value of $983 million (reported as attributable; 45% owned by AngloGold Ashanti).
Mineral processing
The current processing plant can treat both oxide and fresh sulphide material and uses flotation with ultra-fine grind of the flotation concentrate, a treatment that is required for the sulphide ore type before leaching. Kibali has a processing operation capable of producing an average of 730kozpa of gold for 10 years treating at least 7.2Mtpa throughput. The ore is blended using both KCD underground ore plus ore sourced from satellite open pits at Kibali.
Mineral Resource
Refer to the below table, prepared in accordance with Table 1 to Paragraph (D)(1) of Item 1304 of Regulation S-K, which summarises the gold Mineral Resource (exclusive of Mineral Reserve) for Kibali at the end of the fiscal year ended 31 December 2022, based on a gold price estimate of $1,700/oz. Refer to “—Material Assumptions for the Mineral Resource—Key Parameters (Open Pit and Underground)” for additional information on cut-off grades and metallurgical recovery.
| Mineral Resource | Category | Tonnes | Grade | Contained Gold | |||||||||||||
| as at 31 December 2022 | million | g/t | tonnes | Moz | |||||||||||||
| Kibali (45 percent) | Measured | 7.22 | 3.18 | 22.97 | 0.74 | ||||||||||||
| Indicated | 22.15 | 2.64 | 58.44 | 1.88 | |||||||||||||
| Measured & Indicated | 29.37 | 2.77 | 81.41 | 2.62 | |||||||||||||
| Inferred | 13.16 | 2.61 | 34.43 | 1.11 | |||||||||||||
Notes:
Rounding of numbers may result in computational discrepancies in the Mineral Resource tabulations. The Mineral Resource estimates with respect to our material properties have been prepared by the Qualified Persons (employed by AngloGold Ashanti unless stated otherwise). The net difference between the Mineral Resource at the end of the last completed fiscal year and the preceding fiscal year is detailed in the table below. To
98
reflect that figures are not precise calculations and that there is uncertainty in their estimation, AngloGold Ashanti reports tonnage, grade and content for gold to two decimals. All ounces are Troy ounces. “Moz” refers to million ounces.
1.All disclosure of Mineral Resource is exclusive of Mineral Reserve. The Mineral Resource exclusive of Mineral Reserve (“Exclusive Mineral Resource”) is defined as the inclusive Mineral Resource less the Mineral Reserve before dilution and other factors are applied.
2.Mineral Resource attributable to AngloGold Ashanti’s percentage interest shown.
3.“Tonnes” refers to a metric tonne which is equivalent to 1,000 kilograms.
4.Operated by Barrick. AngloGold Ashanti has recognised that in preparing this annual report, the Qualified Persons have relied on information provided by Barrick. Based on a gold price of $1,700/oz.
5.Property currently in a production stage.
6.Refer to “—Material Assumptions for the Mineral Resource—Key Parameters (Open Pit and Underground)” for additional information on cut-off grades and metallurgical recovery.
Year on year changes in Mineral Resource - Moz
| as at 31 December 2022 | Kibali | |||||||||||||
| Category | Measured | Indicated | Measured and Indicated total | Inferred | ||||||||||
| Previous Year | 0.78 | 1.76 | 2.54 | 0.89 | ||||||||||
| Depletion | (0.01) | — | (0.01) | — | ||||||||||
| Exploration | 0.01 | — | 0.01 | 0.10 | ||||||||||
| Methodology | — | — | — | — | ||||||||||
| Price | 0.03 | 0.16 | 0.19 | 0.13 | ||||||||||
| Cost | (0.01) | (0.02) | (0.03) | (0.02) | ||||||||||
| Geotechnical | (0.07) | (0.02) | (0.09) | — | ||||||||||
| Metallurgical | — | 0.01 | 0.01 | 0.01 | ||||||||||
| Acquisition / Disposal | — | — | — | — | ||||||||||
| Other | — | — | — | — | ||||||||||
| Current Year | 0.74 | 1.88 | 2.62 | 1.11 | ||||||||||
| Net Difference | (0.04) | 0.12 | 0.08 | 0.22 | ||||||||||
| % Difference | (5) | 7 | 3 | 24 | ||||||||||
Notes:
All figures are expressed on an attributable basis unless otherwise indicated. AngloGold Ashanti has recognised that in preparing this annual report, the Qualified Persons have relied on information provided by Barrick.
Changes were driven both by exploration and an increase in the Mineral Resource gold price from $1,500/oz as at 31 December 2021 to $1,700/oz as at 31 December 2022, with gains seen from the open pits, specifically Ikamva, Oere and Gorumbwa, as well as from continued definition of the 11000 lode in the KCD underground. A maiden underground Inferred Mineral Resource at Gorumbwa was also reported.
Material Assumptions for the Mineral Resource
Key Parameters (Open Pit and Underground)
| Kibali | Unit | Open Pit | ||||||
| Costs | ||||||||
| Waste cost | $/tonne mined | 2.92-3.09(1) | ||||||
| Extra Ore Cost – Grade Control + Ore – Rehandle + Overhaul | $/tonne mined | 1.27 | ||||||
| Grade Control cost | $/tonne mined | 0.75 | ||||||
| Dilution | % | 10 | ||||||
| Ore Loss | % | 3 | ||||||
| Processing cost | $/tonne milled | 15.04-17.85(1) | ||||||
| G&A | $/tonne milled | 8.47 | ||||||
| Other Parameters | ||||||||
| Gold Royalties (4.7%) | $/oz | 70.50 | ||||||
| Metallurgical Recovery Factor | %MetRF | 86.1-90.1(1) | ||||||
| Mineral Resource cut-off grade | g/t | 0.6-0.7(1) | ||||||
99
| Kibali | Unit | Open Pit | ||||||
| Mineral Resource price | $/oz | 1,700 (2) | ||||||
Notes: AngloGold Ashanti has recognised that in preparing this annual report, the Qualified Persons have relied on information provided by Barrick. (1) Vary according to rock type. (2) AngloGold Ashanti has determined that there is no material change to the Mineral Resource reported in the 2021 Technical Report Summary for Kibali (effective date: 31 December 2021) filed as Exhibit 19.15.7 hereto if this updated gold price is used (instead of $1,500, the gold price used to estimate the Mineral Resource in 2021). | ||||||||
| Kibali | Unit | Underground | ||||||
| Costs | ||||||||
| Mine Production | $/tonne ore mined | 36.17 | ||||||
| Capital | $/tonne ore mined | 3.97 | ||||||
| G&A | $/tonne ore milled | 8.47 | ||||||
| Processing cost | $/tonne ore milled | 17.85 | ||||||
| Other Parameters | ||||||||
| Gold Royalties (4.7%) | $/oz | 70.50 | ||||||
| Mining cut-off grade | g/t | 1.62 | ||||||
| Mineral Resource price | $/oz | 1,700 (1) | ||||||
| Metallurgical Recovery Factor | %MetRF | 90 | ||||||
Notes: AngloGold Ashanti has recognised that in preparing this report, the Qualified Persons have relied on information provided by Barrick. (1) AngloGold Ashanti has determined that there is no material change to the Mineral Resource reported in the 2021 Technical Report Summary for Kibali (effective date: 31 December 2021) filed as Exhibit 19.15.7 hereto if this updated gold price is used (instead of $1,500, the gold price used to estimate the Mineral Resource in 2021). | ||||||||
Estimation
Mineral Resource estimation is undertaken by Barrick in-house technical experts or by approved external consultants. The results of both diamond drilling ("DD") and reverse circulation ("RC") drilling are used in the estimation process. 3D mineralised envelopes are established using grade and geology, and these are then statistically verified to confirm their validity for use in grade estimation. Appropriate domaining of homogeneous zones is conducted whereby high-grade central core areas are modelled separately from the lower-grade surrounding halos. Volumes are filled with block model cells and interpolated for density, rock type and grade – the latter using ordinary kriging.
Grade top cuts and restricted searches are applied to drill hole data to prevent the spread of high-grades during the estimation process. Drill hole spacing is used to guide the Mineral Resource classification. The open pit Mineral Resource is quoted within a limiting shell. The underground Mineral Resource is constrained by the application of optimised mineable Mineral Resource shapes, which applies reasonable mineability constraints including a minimum mining width, a reasonable distance from current or planned development, and a measure of assumed profitability at the related Mineral Resource cut-off grade.
Mineral Reserve
Refer to the below table, prepared in accordance with Table 2 to Paragraph (D)(1) of Item 1304 of Regulation S-K, which summarises the gold Mineral Reserve for Kibali at the end of the fiscal year ended 31 December 2022, based on a gold price estimate of $1,300/oz. Refer to “—Material Assumptions for the Mineral Reserve—Modifying factors and price estimates” for additional information on cut-off grades and metallurgical recovery.
| Mineral Reserve | Category | Tonnes | Grade | Contained Gold | |||||||||||||
| as at 31 December 2022 | million | g/t | tonnes | Moz | |||||||||||||
| Kibali (45 percent) | Proven | 14.49 | 3.47 | 50.33 | 1.62 | ||||||||||||
| Probable | 29.17 | 3.15 | 91.86 | 2.95 | |||||||||||||
| Total | 43.67 | 3.26 | 142.19 | 4.57 | |||||||||||||
Notes:
1.Rounding of numbers may result in computational discrepancies in the Mineral Reserve tabulations. The Mineral Reserve estimates with respect to our material properties have been prepared by the Qualified Persons (employed by AngloGold Ashanti unless stated otherwise). The net difference between the Mineral Reserve at the end of the last completed fiscal year and the preceding fiscal year is detailed in the table below. To reflect that figures are not precise calculations and that there is uncertainty in their estimation, AngloGold Ashanti reports tonnage, grade and content for gold to two decimals. All ounces are Troy ounces. “Moz” refers to million ounces.
2.Mineral Reserve attributable to AngloGold Ashanti’s percentage interest shown.
3.“Tonnes” refers to a metric tonne which is equivalent to 1,000 kilograms.
100
4.Operated by Barrick. AngloGold Ashanti has recognised that in preparing this annual report, the Qualified Persons have relied on information provided by Barrick. Open Pits and underground were based on a gold price of $1,300/oz, with the exception of the Pamoa Main pit (based on a gold price of $1,400/oz) and the Pamoa South pit (based on a gold price of $1,500/oz).
5.Property currently in a production stage.
6.Refer to “—Material Assumptions for the Mineral Reserve—Modifying factors and price estimates” for additional information on cut-off grades and metallurgical recovery.
Year on year changes in Mineral Reserve - Moz
| as at 31 December 2022 | Kibali | ||||||||||
| Category | Proven | Probable | Total | ||||||||
| Previous Year | 1.74 | 2.59 | 4.33 | ||||||||
| Depletion | (0.28) | (0.12) | (0.40) | ||||||||
| Exploration | 0.11 | 0.42 | 0.53 | ||||||||
| Methodology | — | — | — | ||||||||
| Price | 0.03 | 0.12 | 0.15 | ||||||||
| Cost | (0.01) | (0.03) | (0.04) | ||||||||
| Geotechnical | — | — | — | ||||||||
| Metallurgical | — | — | — | ||||||||
| Operational | 0.03 | — | 0.03 | ||||||||
| Other | — | (0.03) | (0.03) | ||||||||
| Acquisition / Disposal | — | — | — | ||||||||
| Current Year | 1.62 | 2.95 | 4.57 | ||||||||
| Net Difference | (0.12) | 0.36 | 0.24 | ||||||||
| % Difference | (7) | 14 | 6 | ||||||||
Notes:
All figures are expressed on an attributable basis unless otherwise indicated. AngloGold Ashanti has recognised that in preparing this annual report, the Qualified Persons have relied on information provided by Barrick.
The increase in Mineral Reserve was primarily as a result of the conversion of the 11000 lode in the KCD underground, and growth in the Ikamva and Oere pits due to exploration successes. The gold price used for pit optimisation changed from $1,200/oz as at 31 December 2021 to $1,300/oz as at 31 December 2022 which also contributed to the increase seen.
Material Assumptions for the Mineral Reserve
Modifying factors and price estimates
| as at 31 December 2022 | Kibali | |||||||
| Primary Commodity Price | $/oz | 1,300(1)(6) | ||||||
| Cut-off grade | g/t | 1.50(3)(5); 1.96(4) | ||||||
| Stoping width | cm | 2990(4) | ||||||
| Dilution | % | 2.0-12.5(4); 10(5) | ||||||
| Mining Recovery Factor | MRF based on tonnes (%) | 91.6(4); 97(5) | ||||||
| Mine Call Factor | MCF (%) | 97 | ||||||
| Metallurgical Recovery Factor | MetRF (%) | 89-90(2) | ||||||
Notes: AngloGold Ashanti has recognised that in preparing this annual report, the Qualified Persons have, relied on information provided by Barrick. (1) AngloGold Ashanti has determined that there is no material change to the Mineral Reserve reported in the 2021 Technical Report Summary for Kibali (effective date: 31 December 2021) filed as Exhibit 19.15.7 hereto if this updated gold price is used (instead of $1,200, the gold price used to estimate the Mineral Reserve in 2021). (2) Vary according to rock type. (3) Stockpile. (4) Underground. (5) Open pit. (6) Open Pits and underground were based on a gold price of $1,300/oz, with the exception of the Pamoa Main pit (based on a gold price of $1,400/oz) and the Pamoa South pit (based on a gold price of $1,500/oz). | ||||||||
Estimation
The open pit Mineral Reserve shell optimisations were run on the Mineral Resource models. The process incorporated the mining layout, operating factors, stripping ratio, relevant cut-off grades and modifying factors for
101
reporting the Mineral Reserve. An open pit underground interface was set at 5,685 metres relative level (“mRL") between the KCD open pit and underground mine.
A cut-off grade analysis of $1,300/oz was used to determine a cut-off grade of 1.96g/t for the underground mine. Longitudinal and transverse longhole open stoping methods with paste backfill are the current preferred mining methods. Underground stope designs were updated from the previously reported Mineral Reserve using the latest Mineral Resource models. Modifying factors for planned and unplanned rock dilution, backfill dilution and ore loss were applied to obtain the reported Mineral Reserve.
Metallurgical, environmental, social, legal, marketing and economic factors were adequately considered in the Kibali feasibility study and have been updated as the project has developed.
Map showing Kibali planned infrastructure and licences
Below is a map that shows Kibali infrastructure and licences, with the total mining lease area insert shown in the top right corner. The coordinates of the mine, as represented by the plant, are depicted on the map and are in the geographic coordinate system.
102
GHANA
AngloGold Ashanti has two mines in Ghana. Obuasi and Iduapriem are both wholly-owned and operated by AngloGold Ashanti.
Obuasi is an underground mine operating at depths of up to 1,500m with a continuous history of mining dating back to the 1890s. Iduapriem is an open pit mine.
103
Obuasi is located in the Ashanti region of southern Ghana, approximately 60km south of Kumasi. Mining was temporarily suspended at the end of 2014 while a series of economic studies progressed. Obuasi underground development restarted in the first half of 2019, with the first gold produced in December 2019. The ramp-up of the redevelopment project was delayed by the temporary stoppage of underground activities after a fall of ground incident in May 2021. Production remained suspended for several months to allow for reviews and investigations, but slowly resumed in the latter part of 2021.
Iduapriem is located in western Ghana, some 85km from the coast and south of Obuasi, near the town of Tarkwa.
OBUASI
For additional information, refer to the Technical Report Summary for Obuasi (effective date: 31 December 2021) filed as Exhibit 19.15.5 hereto.
Property description
Obuasi is wholly-owned by AngloGold Ashanti and is a production stage property. All required mineral rights to the property are held by the Company. The mine is an underground operation, and it has been in operation since 1897 (more than 120 years). It has been operated by AngloGold Ashanti since 2004.
Location
The mine is in the municipality of Obuasi, in the Ashanti region of Ghana, about 240km northwest of the capital, Accra, and 60km south of Kumasi.
Mineralisation style
Geologically, Obuasi is in the Ashanti belt on the eastern margin of the Pre-Cambrian West African craton. This craton consists of Lower Proterozoic volcanic and flysch sediments which make up the Birimian system, overlain in part by the molasse sediments of the Middle Proterozoic Tarkwaian. The Ashanti belt is the most prominent of the five Birimian Supergroup gold belts found in Ghana.
Gold mineralisation is associated with shear zones and pervasive silica, carbonate and sulphide hydrothermal alteration which occur in tightly folded Lower Birimian schists, phyllites, meta-greywackes, and tuffs, along the eastern limb of the Kumasi anticlinorium. They are found near the contact with harder metamorphosed and metasomatically altered intermediate to basic upper Birimian volcanics. There are two broad styles of gold mineralisation including free milling quartz vein gold and sulphide-rich, disseminated and refractory gold which form alteration haloes around the quartz vein lodes. Sulphide mineralisation is dominated by arsenopyrite and quartz mineralisation, which is associated with spatially variable, but exceptionally high-grade visible gold in quartz veins.
History
Obuasi has a long mining history dating back to 1897. It has been owned and operated by various operators during this time. The current operator became involved in 2004 following the merger of former AngloGold Limited of South Africa and the Ashanti Goldfields Company Limited of Ghana. However, for several years leading up to 2014, the mine began to struggle due to ailing infrastructure and outdated methodologies. The company realised that significant rationalisation and/or replacement of current infrastructure would be necessary to enable the delivery of better utilisation and productivity metrics.
In 2014, a feasibility study commenced that considered the optimum mining methodology and schedules for the underground mine, based on modern mechanised mining methods and refurbishment of underground, surface and process plant infrastructure. During this time, Obuasi operated in a limited operating phase with underground activities essentially restricted to the continued development of the Obuasi deeps decline and underground infill drilling. The limited operating phase was brought to a halt after an incursion by illegal miners on Obuasi's concession in February 2016, at which point the mine was placed under care and maintenance. However, the study continued and in 2017, a favourable feasibility study was completed and indicated a strong technical and economic case with an anticipated 20-year life of mine ("LOM"). In 2018, approval was received from the AngloGold Ashanti board and the government of Ghana to proceed with the project.
The redevelopment project began in late 2018 and first gold was poured during the fourth quarter of 2019. Phase 1 of the redevelopment project was completed by the end of September 2020, and the mine began commercial production on 1 October 2020. Phase 2 of the redevelopment project, which focused on construction and mine development, was completed in 2021. Phase 3 of the redevelopment project is currently underway to develop the infrastructure necessary to support the planned ramp-up in production.
104
Legal aspects and tenure
Refer to “Item 4B: Business Overview—The Regulatory Environment Enabling AngloGold Ashanti to Mine—Africa Region—Ghana—AngloGold Ashanti’s rights and permits”.
Mining method
Obuasi is an underground operation, utilising both vertical shafts and declines as main access routes to the underground workings. The mine has seen extensive historical mining activities with varying applications of different mining methods to date. The current LOM design employs mostly the Long Hole Open Stoping ("LHOS") mining method for ore extraction. LHOS is a highly selective and productive method of mining that can be employed for orebodies of varying thicknesses and dips. The main distinct variations of the LHOS used at Obuasi are longitudinal retreat stoping (“LRS”), and transverse open stoping (“TOS”). The blind upper stoping is a form of LRS or TOS used for partial sill pillar recovery.
Processing plants and other available facilities
All significant surface activities, including ore processing, environmental management and community engagement are carried out by Obuasi staff. Existing infrastructure includes a recently refurbished and upgraded 2.2Mtpa processing plant with flotation and bacterial oxidation ("BIOX"), extensive underground development, hoisting shafts and associated infrastructure, mine ventilation and refrigeration facilities, emergency standby power and water reticulation, office complexes, workshops, and company housing estates. Power is supplied to the mine by the Volta River Authority and Ghana Grid Company Limited (“GRIDCo”). There is a focus mine development plan supported by the existing infrastructure, and ongoing upgrades of critical underground infrastructure to sustain the operations. The mine can be accessed by paved road network from Kumasi and by road or chartered air transport from the capital, Accra. For the number of persons employed at the mine, refer to “Item 4B: Business Overview—Operating Performance—Africa Region”.
The “Property, Plant, and Equipment” as of 31 December 2022, including buildings and mine infrastructure, mining assets, decommissioning assets and assets under construction, had a carrying value of $1,009 million.
Mineral processing
The plant is configured for both conventional and flash flotation and BIOX treatment which is required for the refractory sulphide ore. The gravity gold recovery system is also integrated with Knelson concentrators and inline leach reactors.
Mineral Resource
Refer to the below table, prepared in accordance with Table 1 to Paragraph (D)(1) of Item 1304 of Regulation S-K, which summarises the gold Mineral Resource (exclusive of Mineral Reserve) for Obuasi at the end of the fiscal year ended 31 December 2022, based on a gold price estimate of $1,750/oz for underground and $1,600 for open pit Mineral Resource. Refer to “—Material Assumptions for the Mineral Resource—Key Parameters” for additional information on cut-off grades and metallurgical recovery.
| Mineral Resource | Category | Tonnes | Grade | Contained Gold | |||||||||||||
| as at 31 December 2022 | million | g/t | tonnes | Moz | |||||||||||||
| Obuasi | Measured | 1.96 | 8.44 | 16.59 | 0.53 | ||||||||||||
| Indicated | 27.66 | 6.06 | 167.59 | 5.39 | |||||||||||||
| Measured & Indicated | 29.63 | 6.22 | 184.18 | 5.92 | |||||||||||||
| Inferred | 39.80 | 8.50 | 338.17 | 10.87 | |||||||||||||
Notes:
Rounding of numbers may result in computational discrepancies in the Mineral Resource tabulations. The Mineral Resource estimates with respect to our material properties have been prepared by the Qualified Persons (employed by AngloGold Ashanti unless stated otherwise). The net difference between the Mineral Resource at the end of the last completed fiscal year and the preceding fiscal year is detailed in the table below. To reflect that figures are not precise calculations and that there is uncertainty in their estimation, AngloGold Ashanti reports tonnage, grade and content for gold to two decimals. All ounces are Troy ounces. “Moz” refers to million ounces.
1.All disclosure of Mineral Resource is exclusive of Mineral Reserve. The Mineral Resource exclusive of Mineral Reserve (“Exclusive Mineral Resource”) is defined as the inclusive Mineral Resource less the Mineral Reserve before dilution and other factors are applied.
2.“Tonnes” refers to a metric tonne which is equivalent to 1,000 kilograms.
3.Property currently in a production stage.
4.Refer to “—Material Assumptions for the Mineral Resource—Key Parameters” for additional information on cut-off grades and metallurgical recovery.
5.Open pit based on a gold price of $1,600/oz, underground based on a gold price of $1,750/oz.
105
Year on year changes in Mineral Resource - Moz
| as at 31 December 2022 | Obuasi | |||||||||||||
| Category | Measured | Indicated | Measured and Indicated total | Inferred | ||||||||||
| Previous Year | 0.66 | 5.84 | 6.50 | 12.05 | ||||||||||
| Depletion | — | — | — | — | ||||||||||
| Exploration | — | — | — | (0.06) | ||||||||||
| Methodology | 0.02 | 0.28 | 0.30 | (0.53) | ||||||||||
| Price | 0.02 | 0.58 | 0.60 | 1.11 | ||||||||||
| Cost | (0.17) | (0.97) | (1.14) | (1.31) | ||||||||||
| Geotechnical | — | — | — | — | ||||||||||
| Metallurgical | — | — | — | — | ||||||||||
| Acquisition / Disposal | — | — | — | — | ||||||||||
| Other | — | (0.33) | (0.33) | (0.37) | ||||||||||
| Current Year | 0.53 | 5.39 | 5.92 | 10.87 | ||||||||||
| Net Difference | (0.12) | (0.45) | (0.57) | (1.17) | ||||||||||
| % Difference | (19) | (8) | (9) | (10) | ||||||||||
Notes:
All figures are expressed on an attributable basis unless otherwise indicated.
The decrease in Mineral Resource is mainly due to depletion attributed to mining from Sansu, and Blocks 8 and 10 and an increase in costs which resulted in higher cut-off grades as well as the sterilisation of stopes in the depletion process. The decrease was partially offset by model changes primarily from the inclusion of new drilling data from ongoing operational drilling activities and the increase in Mineral Resource price.
Material Assumptions for the Mineral Resource
Key Parameters
| Obuasi | Unit | Underground | ||||||
| Costs | ||||||||
| Mining cost | $/tonne mined | 64.26-79.44(1) | ||||||
| Processing cost | $/tonne treated | 42.57 | ||||||
| G&A | $/tonne treated | 21.96 | ||||||
| Other Parameters | ||||||||
| Royalties | % | 3.0 | ||||||
MSO(2) optimising cut-off | g/t | 3.43-3.75(1) | ||||||
| Mineral Resource cut-off grade | g/t | 3.43-3.75(1) | ||||||
| Mineral Resource price | $/oz | 1,600-1,750(3)(4) | ||||||
| Metallurgical Recovery Factor | %MetRF | 87 | ||||||
Notes: (1) Vary according to area. (2) Datamine Mineable Shape Optimiser ("MSO"). (3) Open pit based on a gold price of $1,600/oz, Underground based on a gold price of $1,750/oz. (4) AngloGold Ashanti has determined that there is no material change to the Mineral Resource reported in the 2021 Technical Report Summary for Obuasi (effective date: 31 December 2021) filed as Exhibit 19.15.5 hereto if this updated gold price is used (instead of $1,500, the gold price used to estimate the Mineral Resource in 2021). | ||||||||
Estimation
The estimation technique is ordinary kriging and the primary estimation unit size is 20m x 5m x 15m. This estimation unit size is representative of the underground mining units and is considered appropriate given the style of mineralisation and mining methods. Compositing by length is employed and the influence of extreme grades is restricted by grade capping. Sample spacing is highly variable across the deposit and ranges from 10m x 10m (for grade control areas) up to 200m x 200m (for exploration targets). However, for the Mineral Resource, the maximum extrapolation from data points is 100m. Any areas beyond this are not classified and are considered to be upside potential rather than Mineral Resource.
106
Mineral Reserve
Refer to the below table, prepared in accordance with Table 2 to Paragraph D(1) of Item 1304 ofRegulation S-K, which summarises the gold Mineral Reserve for Obuasi at the end of the fiscal year ended 31 December 2022, based on a gold price estimate of $1,400/oz. Refer to “—Material Assumptions for the Mineral Reserve—Modifying factors and price estimates” for additional information on cut-off grades and metallurgical recovery.
| Mineral Reserve | Category | Tonnes | Grade | Contained Gold | |||||||||||||
| as at 31 December 2022 | million | g/t | tonnes | Moz | |||||||||||||
| Obuasi | Proven | 4.47 | 9.55 | 42.73 | 1.37 | ||||||||||||
| Probable | 21.25 | 9.26 | 196.67 | 6.32 | |||||||||||||
| Total | 25.72 | 9.31 | 239.40 | 7.70 | |||||||||||||
Notes:
1.Rounding of numbers may result in computational discrepancies in the Mineral Reserve tabulations. The Mineral Reserve estimates with respect to our material properties have been prepared by the Qualified Persons (employed by AngloGold Ashanti unless stated otherwise). The net difference between the Mineral Reserve at the end of the last completed fiscal year and the preceding fiscal year is detailed in the table below. To reflect that figures are not precise calculations and that there is uncertainty in their estimation, AngloGold Ashanti reports tonnage, grade and content for gold to two decimals. All ounces are Troy ounces. “Moz” refers to million ounces.
2.“Tonnes” refers to a metric tonne which is equivalent to 1,000 kilograms.
3.Property currently in a production stage.
4.Refer to “—Material Assumptions for the Mineral Reserve—Modifying factors and price estimates” for additional information on cut-off grades and metallurgical recovery.
5.Based on a gold price of $1,400/oz.
Year on year changes in Mineral Reserve - Moz
| as at 31 December 2022 | Obuasi | ||||||||||
| Category | Proven | Probable | Total | ||||||||
| Previous Year | 1.19 | 7.08 | 8.26 | ||||||||
| Depletion | (0.23) | — | (0.23) | ||||||||
| Exploration | — | (0.77) | (0.77) | ||||||||
| Methodology | 0.54 | — | 0.54 | ||||||||
| Price | 0.11 | 1.49 | 1.60 | ||||||||
| Cost | (0.23) | (1.48) | (1.71) | ||||||||
| Geotechnical | — | — | — | ||||||||
| Metallurgical | — | — | — | ||||||||
| Operational | — | — | — | ||||||||
| Other | — | — | — | ||||||||
| Acquisition / Disposal | — | — | — | ||||||||
| Current Year | 1.37 | 6.32 | 7.70 | ||||||||
| Net Difference | 0.19 | (0.75) | (0.57) | ||||||||
| % Difference | 16 | (11) | (7) | ||||||||
Notes:
All figures are expressed on an attributable basis unless otherwise indicated.
The key changes were primarily associated with depletion, exploration, block model changes, and economic parameters. Depletion was mainly due to mining, while exploration changes were as a result of Mineral Resource drilling. This was offset by changes in the block model methodology involving estimation parameters, interpretations, classification and density. The economic factors that also influenced the changes to the Obuasi Mineral Reserve included an increased gold price assumption which was partially offset by an increase in mining cost and sustaining capital.
Material Assumptions for the Mineral Reserve
Modifying factors and price estimates
| as at 31 December 2022 | Obuasi | |||||||
| Primary Commodity Price | $/oz | 1400(1) | ||||||
| Cut-off grade | g/t | 4.29-4.69(2) | ||||||
107
| as at 31 December 2022 | Obuasi | |||||||
| Dilution | % | 12-17(2) | ||||||
| Mining Recovery Factor | %MRF based on tonnes | 95-98(2) | ||||||
| Mining Recovery Factor | %MRF based on g/t | 100 | ||||||
| Mine Call Factor | %MCF | 100 | ||||||
| Metallurgical Recovery Factor | %MetRF | 87 | ||||||
Notes: (1) AngloGold Ashanti has determined that there is no material change to the Mineral Reserve reported in the 2021 Technical Report Summary for Obuasi (effective date: 31 December 2021) filed as Exhibit 19.15.5 hereto if this updated gold price is used (instead of $1,200, the gold price used to estimate the Mineral Reserve in 2021). (2) Vary according to area. | ||||||||
Estimation
The Mineral Reserve estimation considers mining criteria for the economic cut-off grade and minimum mining width for the anticipated mining method. All design and scheduling work is undertaken to an applicable level of detail by mine planning engineers in consultation with other technical specialists using Datamine Studio UGTM and Enhanced Production SchedulerTM ("EPS") software.
The cut-off grade parameters used include projected mining, processing, and general and administrative costs. A Mineral Reserve gold price of $1,400/oz was used. The cut-off grade also considers the metallurgical recovery factor (87 percent applied for all blocks), mining dilution and recovery, tonne-kilometre haulage cost from all blocks, as well as the backfill type.
Stopes are designed using the Datamine Mineable Shape Optimiser ("MSO") Software where the outputs are further optimised by manual edits. The stope shapes are generated at section intervals of 15m to 20m based on geotechnical guidance for each block. The MSO allows the class field to be assigned to each stope generated. The mine design is reviewed taking into consideration the updated stope shapes, existing development and future infrastructure need. A LOM plan is generated which considers fleet and infrastructure capacities. All mining blocks are designed for the LHOS mining method. The Mineral Reserve is reported from the LOM plan and only includes Measured and Indicated Mineral Resource.
Map showing Obuasi planned infrastructure and licences
Below is a map that shows the location, infrastructure and mining licence area for Obuasi. The coordinates of the mine, as represented by the plant, are depicted on the map and are in the geographic coordinate system.
108
109
IDUAPRIEM
Property description
Iduapriem mine is wholly-owned and operated by AngloGold Ashanti and a production stage property. The mine is a multiple open pit operation that currently sources ore from the Block 3W, Block 5, Ajopa, and Blocks 7 and 8 pits.
Location
The mine is located in the western region of Ghana, some 70km north of the coastal city of Takoradi and approximately 10km southwest of the town of Tarkwa. The Iduapriem mine is bordered to the north by Gold Fields Ghana Limited (Tarkwa Mine) and to the east by the Ghana Manganese Company Limited (a manganese mine in existence since the 1920s).
Mineralisation style
There are four recognised conglomerate reefs namely A, B, C and D, which are equivalent to the Tarkwaian Sub-basal, Basal (or Main), Middle (or West), and Breccia Reefs, respectively. The B and C Reefs are oligomictic and consist of well-sorted conglomerates and have been mined underground in some areas more than a century ago. The A and D Reefs have a lower gold tenor and are polymictic, containing both well-rounded and angular fragments. Gold is found within the matrix that binds the pebbles together. The gold content is a function of the size and amount (packing) of quartz pebbles present within a conglomeratic unit. The gold is fine-grained, particulate and free-milling.
Legal aspects and tenure
Refer to “Item 4B: Business Overview—The Regulatory Environment Enabling AngloGold Ashanti to Mine—Africa Region—Ghana—AngloGold Ashanti’s rights and permits”.
Processing plants and other available facilities
Surface infrastructure associated with Iduapriem’s operation includes a primary crusher, overland conveyor, CIL processing plant next to the main office building, a TSF and four camp areas for contractors and company employees. Tarkwa town is also adjacent to the tenement. Power is supplied to the mine by the Volta River Authority and GRIDCo.
Mineral processing
The current processing plant treats free-milling material from open pit mining, by a conventional crush with a semi-autogenous ball milling circuit and cyanide leach. Iduapriem operates a two-stage crushing circuit consisting of a Metso Superior MKIII primary gyratory crusher and two GP550 gyratory crushers for secondary crushing. The Iduapriem treatment plant has two semi-autogenous grinding mills ("SAG mills") and two ball mills which run in two parallel circuits,each with a SAG mill and a ball mill. The second ball mill, a new thickener, a cluster of cyclones and a Knelson concentrator were commissioned in March 2009. In July 2017, three of the four leach tanks were converted into CIL tanks by introducing carbon into the each of the tanks with the installation of inter-tank screens and carbon recovery screens. Carbon for elution is harvested from one of the leach tanks to the acid wash column, and the carbon recovery screen underflow is pumped back to the leach tanks.
GUINEA
SIGUIRI
Property description
Siguiri is AngloGold Ashanti’s only operation in the Republic of Guinea. The mine is co-owned by AngloGold Ashanti (85 percent) and the government of Guinea (15 percent). The mine is a conventional open pit operation situated in the Siguiri district in the northeast of Guinea.
Siguiri is a production stage property, operated by AngloGold Ashanti. Gold-bearing ore is mined from several pits (generally three pits at any one time). Mining occurs primarily in Kami and Bidini pits in Block 1, as well as Saraya pit in Block 2. The pre-feasibility study level of work on the geotechnical design for Sanutinti pit is ongoing.
Location
Siguiri is located approximately 850km north-northeast of Conakry, 25km northwest of the town of Siguiri and 220km southeast of the Malian capital Bamako, near the Malian border.
110
Mineralisation style
Siguiri is situated in the northern part of the Siguiri Basin of Guinea, and is underlain by Lower Proterozoic rocks of the Birimian metasedimentary and volcano-sedimentary formations. Primary gold mineralisation occurs in all three lithostratigraphic units of the Siguiri region, although most of the known mineralisation is found in the central and more competent Fatoya Formation. In some deposits, the mineralisation shows strong lithological control and is preferentially developed in coarser-grained units with higher fracture or vein densities than fine-grained rocks. Mineralised veins are more intensely developed along major structural trends, with quartz-carbonate-sulphide veining developed along structures. Some of these structures have developed as incipient faults and are represented by discrete stockworks of mineralised quartz-carbonate veins occurring along a trend instead of clearly defined continuous structures.
Legal aspects and tenure
Refer to “Item 4B: Business Overview—The Regulatory Environment Enabling AngloGold Ashanti to Mine—Africa Region—Guinea—AngloGold Ashanti’s rights and permits”.
Processing plants and other available facilities
Siguiri includes a processing plant, a TSF, and other infrastructure such as a mine village, a water supply system, roads, power supply by on-site generators and communications systems. Additional infrastructure includes on-site offices, accommodation and workshops to support remote mining. Power to the mine is self-generated using heavy fuel oil.
The town of Siguiri can be accessed via a small airfield and a well-paved road that connects Siguiri to Bamako in the north and Kouroussa in the south. Access to the mine via roads and to Siguiri is easily passable through most of the year, although some secondary roads are seasonal with limited access during the wet season. While Siguiri encounters encroachment of villages onto, and artisanal and small-scale mining invasion in, its mining areas as well as increasing community demands and expectations, mitigation plans are in place to significantly reduce the impact of these issues.
Mineral processing
The mined ore is processed using a hybrid CIL circuit plant and can treat 50 percent hard ore post-commissioning of a new ball mill and three-stage crushing plant in 2019. Unit operations include comminution, leaching, carbon adsorption and desorption, smelting and tailings disposal. Further modification of three leach tanks to CIL tanks was carried out in the fourth quarter of 2020, giving a total of seven tanks in the hybrid circuit. The combination plant treats up to 50 percent fresh rock and 50 percent soft ore, with a total throughput of 11.4Mt per annum. The recovery of Bidini, which has been impacted by the presence of carbonaceous ore and the performance of the combination plant to achieve the required mill throughput and recovery, could have an impact on the economic extraction of the estimated Mineral Resource and Mineral Reserve until the plant stabilises. There are mitigation plans in place to address any TSF capacity issues and the mine is also doing further optimisation work.
TANZANIA
GEITA
For additional information, see the Technical Report Summary for Geita (effective date: 31 December 2022) filed as Exhibit 19.15.4 hereto.
Property description
Geita (“GGM”), one of AngloGold Ashanti’s flagship mines, is located in northwestern Tanzania, in the Lake Victoria goldfields of the Mwanza region, about 120km from Mwanza and 4km west of the town of Geita. The Geita gold deposits are mined as a multiple open pit and underground operation, with ore production from Star and Comet, Nyankanga and Geita Hill underground mines, and from Nyamulilima open pit. The mine is currently serviced by a CIL processing plant with an annual capacity of 5.2Mt.
GGM is wholly-owned and operated by AngloGold Ashanti. GGM currently has three underground mines (Star and Comet, Nyankanga and Geita Hill) and one open pit (Nyamulilima Cuts 1, 2 and 3) which is in production since 2021. The property is currently in a production stage.
Location
GGM is located approximately 1,200km from the main Tanzanian business centre of Dar es Salaam. It falls within the Lake Zone of northwestern Tanzania, approximately 120km west of Mwanza and 4km west of the town of Geita. The mining lease area falls within the Archaean Sukumaland Greenstone Belt of the Lake Victoria goldfields.
111
Mineralisation style
Geita is hosted in the Geita Greenstone Belt, which is a northern segment of the Sukumaland Greenstone Belt, located in the north-western part of the Tanzania Craton and south of Lake Victoria. Gold mineralisation occurred late in the tectonic history of the greenstone belt, synchronous with the development of brittle-ductile shear zones. Mineralisation is dominantly sulfide replacement of magnetite-rich layers in ironstone, with local replacement of ferromagnesian phases and magnetite in the diorite intrusions. Primary gold mineralisation is associated with the intersection of the brittle-ductile shear zones and pre-existing fold hinges, with higher grade concentrations associated with banded iron formation lithologies and with diorite dyke and sill contacts.
History
Gold mineralisation is reported to be first discovered in the Geita district in 1898 by a German prospector. A regional survey by a Kenyan company, Saragura Prospecting Syndicate, followed in 1930. The first mine was developed in 1934, and between 1936 and 1966, Geita was the largest gold mine in East Africa, producing 1Moz of gold from underground operations.
In 1996, Ashanti Goldfields Company Limited acquired the Geita tenure through the acquisition of Cluff Resources, and acquired the Kukuluma and Matandani in 1998 from Samax Resources Limited. In December 2000, Ashanti Goldfields Company Limited reached an agreement to sell a 50 percent interest in Geita to AngloGold Limited for $324 million. AngloGold Limited added its neighbouring Nyamulilima Hill deposits into the JV company. In 2004, the merger of AngloGold Limited and Ashanti Goldfields Company Limited resulted in the operation being wholly run by the combined company AngloGold Ashanti.
GGM commenced open pit mining in 1999, with open pit mining at Nyankanga between 1999 and 2020, at Geita Hill between 2001 and 2019, at Kukuluma and Matandani between 2002 and 2007, and at Star and Comet between 2007 and 2014. In 2015, a decision was taken to go underground at Star and Comet, and the underground development started in 2016. In 2017, the Nyankanga underground operation commenced and in 2020 the Geita Hill underground commenced and is scheduled to ramp up to full production by the end of 2023.
The Nyankanga open pit, the only remaining operating pit at the time, was mined to completion in September 2020. In April 2021, the Nyamulilima open pit commenced operations.
Legal aspects and tenure
Refer to “Item 4B: Business Overview—The Regulatory Environment Enabling AngloGold Ashanti to Mine—Africa Region—Tanzania—AngloGold Ashanti’s rights and permits”.
Mining method
Mining at Geita uses both open pit and underground mining methods. The Nyamulilima open pit commenced production in April 2021 and reached full production during 2022. Open pit mining is by conventional truck and shovel methods, where production mining equipment is operated by GGM with Capital Mining Services Tanzania Limited providing production and grade control drilling services, and Orica providing blasting and explosives services. Underground mining commenced at Star and Comet in 2016 and subsequently at Nyankanga in 2017, and most recently Geita Hill in 2020. Star and Comet underground has successfully transitioned to owner mining and the mining contractor African Underground Mining Services is used at Nyankanga and Geita Hill for underground development and stoping. The underground mining method is a combination of LOS and TOS. Cemented aggregate fill backfill is used at Nyankanga to fill the primary stopes and allows for the mining of secondary stopes. Ore is hauled from the Nyamulilima open pit (22km) and from Star and Comet (17km), Nyankanga (4km) and Geita Hill (2km) underground operations to the central run-of-mine ("ROM") pad by the Geita surface mining fleet.
Processing plants and other available facilities
Surface infrastructure associated with the overall Geita operation includes a 5.2Mtpa CIL processing plant, a TSF, a camp, an airstrip, open pit and underground workshops and offices, contractor yards, backfill plants and explosives suppliers. Power to the mine is self-generated at Geita's 40MW power plant using diesel generators, however, there is planned construction of a 33kV hydropower station by Tanzania Electric Supply Company Limited ("TANESCO"). The physical condition of the equipment, facilities, and infrastructure at GGM is generally considered to be in good working order. The mine has invested heavily in maintaining and upgrading its assets to ensure they remain reliable and efficient. The underground development of the mine has also been extensively developed, with the construction of a number of portals, declines and strategically placed development drives that access and further explore the gold-bearing ore. Overall, the GGM is a well-established operation implementing fit-for-purpose technologies once proven in the market. For the number of persons employed at the mine, refer to “Item 4B: Business Overview—Operating Performance—Africa Region”.
112
The “Property, Plant, and Equipment” as of 31 December 2022, including lease assets, buildings and mine infrastructure, mining assets, capitalised exploration costs, decommissioning assets, assets under construction and deferred stripping, had a carrying value of $418m.
Mineral processing
Geita’s ore processing method is a conventional CIL process with a throughput capacity of 5.2Mtpa. The circuit contains a primary gyratory crusher, secondary and tertiary crushers, a SAG mill, a ball mill and 12 leach tanks. This is coupled with a gravity circuit using two Knelson concentrators. In planning the plant feed blend material, hardness grade, oxide and sulphide content are considered in order to optimise throughput and recovery.
Mineral Resource
The below table, prepared in accordance with Table 1 to Paragraph (D)(1) of Item 1304 of Regulation S-K, summarises the gold Mineral Resource (exclusive of Mineral Reserve) for Geita at the end of the fiscal year ended 31 December 2022, based on a gold price estimate of $1,750/oz. Refer to “—Material Assumptions for the Mineral Resource—Key Parameters” for additional information on cut-off grades and metallurgical recovery.
| Mineral Resource | Category | Tonnes | Grade | Contained Gold | |||||||||||||
| as at 31 December 2022 | million | g/t | tonnes | Moz | |||||||||||||
| Geita | Measured | 1.80 | 4.15 | 7.50 | 0.24 | ||||||||||||
| Indicated | 40.32 | 2.03 | 81.96 | 2.63 | |||||||||||||
| Measured & Indicated | 42.12 | 2.12 | 89.45 | 2.88 | |||||||||||||
| Inferred | 36.21 | 2.64 | 95.71 | 3.08 | |||||||||||||
Notes:
Rounding of numbers may result in computational discrepancies in the Mineral Resource tabulations. The Mineral Resource estimates with respect to our material properties have been prepared by the Qualified Persons (employed by AngloGold Ashanti unless stated otherwise). The net difference between the Mineral Resource at the end of the last completed fiscal year and the preceding fiscal year is detailed in the table below. To reflect that figures are not precise calculations and that there is uncertainty in their estimation, AngloGold Ashanti reports tonnage, grade and content for gold to two decimals. All ounces are Troy ounces. “Moz” refers to million ounces.
1.All disclosure of Mineral Resource is exclusive of Mineral Reserve. The Mineral Resource exclusive of Mineral Reserve (“Exclusive Mineral Resource”) is defined as the inclusive Mineral Resource less the Mineral Reserve before dilution and other factors are applied.
2.“Tonnes” refers to a metric tonne which is equivalent to 1,000 kilograms.
3.Property currently in a production stage.
4.Refer to “—Material Assumptions for the Mineral Resource—Key Parameters” for additional information on cut-off grades and metallurgical recovery.
5.Based on a gold price of $1,750/oz.
Year on year changes in Mineral Resource - Moz
| as at 31 December 2022 | Geita | |||||||||||||
| Category | Measured | Indicated | Measured and Indicated total | Inferred | ||||||||||
| Previous Year | 0.21 | 1.87 | 2.08 | 3.26 | ||||||||||
| Depletion | — | — | — | — | ||||||||||
| Exploration | 0.02 | 0.09 | 0.11 | 0.12 | ||||||||||
| Methodology | 0.03 | 0.49 | 0.52 | (0.57) | ||||||||||
| Price | 0.01 | 0.17 | 0.18 | 0.19 | ||||||||||
| Cost | (0.03) | 0.19 | 0.16 | 0.07 | ||||||||||
| Geotechnical | — | — | — | — | ||||||||||
| Metallurgical | — | 0.02 | 0.02 | 0.02 | ||||||||||
| Acquisition / Disposal | — | — | — | — | ||||||||||
| Other | — | (0.20) | (0.20) | — | ||||||||||
| Current Year | 0.24 | 2.63 | 2.88 | 3.08 | ||||||||||
| Net Difference | 0.03 | 0.77 | 0.80 | (0.18) | ||||||||||
| % Difference | 16 | 41 | 38 | (6) | ||||||||||
Notes:
All figures are expressed on an attributable basis unless otherwise indicated.
The increase is largely as a result of exploration success due to accelerated drilling activities because of the planned reinvestment, and changes in methodology were as a result of revised estimation parameters, and refined ore wireframes. The increase in the Mineral Resource price and favourable cost reductions in open pit haulage, general
113
and administrative expenses and new underground contract rates led to lower cut-off grades resulting in additional Mineral Resource, which was partially offset by depletion.
Material Assumptions for the Mineral Resource
Key Parameters
| Geita | Unit | Open Pit | ||||||
| Costs | ||||||||
| Ore mining cost | $/tonne mined | 3.3 | ||||||
| Waste mining cost | $/tonne mined | 3.3 | ||||||
| Material handling | $/tonne mined | 2.03 | ||||||
| Processing cost | $/tonne treated | 18.63 | ||||||
| G&A | $/tonne treated | 8.43 | ||||||
| Other Parameters | ||||||||
| Metallurgical Recovery Factor | %MetRF | 89 | ||||||
| Slope angles | degree | 55 | ||||||
| Mineral Resource cut-off grade | g/t | 0.65 | ||||||
| Mineral Resource price | $/oz | 1,750 | ||||||
| Royalties | % | 7.3 | ||||||
| Geita | Unit | Underground | ||||||
| Costs | ||||||||
| Production (Mining cost) | $/tonne ore mined | 47.68-82.88(1) | ||||||
| Mine Services | $/tonne ore mined | 21.97-25.78(1) | ||||||
| Processing cost | $/tonne treated | 18.46-19.11(2) | ||||||
| Other Parameters | ||||||||
| Mineral Resource cut-off grade | g/t | 1.86-3.01(2) | ||||||
| Mineral Resource price | $/oz | 1,750 | ||||||
| Metallurgical Recovery Factor | %MetRF | 70.4-91.4(1) | ||||||
| Royalties | % | 7.3 | ||||||
Notes: (1) Mining cost includes backfilling at Nyankanga, and material handling costs. (2) Variable according to area. (3) %MetRF: Ridge 8, 70.4%, Star and Comet Cut 5, 80.4%, Star and Comet Cut 2, 88.3%, Star and Comet Cut 3, 88.4%, Geita Hill 87.2%, Nyankanga Block 5, 89.8%, Nyankanga Block 1, 2, 3 and 4, 91.4%. (4) Datamine Mineable Shape Optimiser ("MSO"). | ||||||||
Estimation
For the open pits, mineralisation boundaries for the individual deposits are defined from detailed logging of all geological drill holes. This information is validated and then geological wireframes are interpreted to create a 3D geological model. The geological model is subsequently used in conjunction with an appropriately dimensioned block model. Ordinary kriging is used to interpolate values into block models, and uniform conditioning ("UC") and localised uniform conditioning ("LUC") methods are used to generate a recoverable Mineral Resource block model, which estimates the proportion of ore that occurs above the Mineral Resource cut-off grade assuming a specified SMU. The open pit Mineral Resource is reported within a $1,750/oz optimised pit shell and above the calculated mineralised waste cut-off grade per pit.
For the underground Mineral Resource, the geological model is generated in the same way as for the open pits. However, a high-grade wireframe is delineated within the broader, lower-grade mineralised envelope. In this instance, all geological controls are adhered to when determining this domain. Ordinary kriging models are then constructed within the low- and high-grade domains, and numerous validation exercises are completed to ensure robust estimates are achieved. The underground Mineral Resource is reported inside a MSO volume generated using a unique underground cut-off grade for each deposit.
114
The ultimate open pit designs are used as the limiting boundaries between the open pits and underground during model compilation. The underground stopes and development are evaluated using the ordinary kriging block models and the open pit designs are evaluated using the LUC block models.
Stockpiled material above mineralised waste cut-off grade is included in the Mineral Resource.
Mineral Reserve
The below table, prepared in accordance with Table 2 to Paragraph (D)(1) of Item 1304 of Regulation S-K, summarises the gold Mineral Reserve for Geita at the end of the fiscal year ended 31 December 2022, based on a gold price estimate of $1,400/oz. Refer to “—Material Assumptions for the Mineral Reserve—Modifying factors and price estimates” for additional information on cut-off grades and metallurgical recovery.
| Mineral Reserve | Category | Tonnes | Grade | Contained Gold | |||||||||||||
| as at 31 December 2022 | million | g/t | tonnes | Moz | |||||||||||||
| Geita | Proven | 9.54 | 1.02 | 9.70 | 0.31 | ||||||||||||
| Probable | 38.95 | 2.60 | 101.19 | 3.25 | |||||||||||||
| Total | 48.49 | 2.29 | 110.89 | 3.57 | |||||||||||||
Notes:
1.Rounding of numbers may result in computational discrepancies in the Mineral Reserve tabulations. The Mineral Reserve estimates with respect to our material properties have been prepared by the Qualified Persons (employed by AngloGold Ashanti unless stated otherwise). The net difference between the Mineral Reserve at the end of the last completed fiscal year and the preceding fiscal year is detailed in the table below. To reflect that figures are not precise calculations and that there is uncertainty in their estimation, AngloGold Ashanti reports tonnage, grade and content for gold to two decimals. All ounces are Troy ounces. “Moz” refers to million ounces.
2.“Tonnes” refers to a metric tonne which is equivalent to 1,000 kilograms.
3.Property currently in a production stage.
4.Refer to “—Material Assumptions for the Mineral Reserve—Modifying factors and price estimates” for additional information on cut-off grades and metallurgical recovery.
5.Based on a gold price of $1,400/oz.
Year on year changes in Mineral Reserve - Moz
| as at 31 December 2022 | Geita | ||||||||||
| Category | Proven | Probable | Total | ||||||||
| Previous Year | 0.09 | 2.55 | 2.65 | ||||||||
| Depletion | (0.06) | (0.49) | (0.55) | ||||||||
| Exploration | — | 0.87 | 0.87 | ||||||||
| Methodology | — | — | — | ||||||||
| Price | — | 0.40 | 0.40 | ||||||||
| Cost | 0.18 | 0.06 | 0.25 | ||||||||
| Geotechnical | — | — | — | ||||||||
| Metallurgical | — | — | — | ||||||||
| Operational | 0.04 | (0.10) | (0.06) | ||||||||
| Other | 0.06 | (0.04) | 0.02 | ||||||||
| Acquisition / Disposal | — | — | — | ||||||||
| Current Year | 0.31 | 3.25 | 3.57 | ||||||||
| Net Difference | 0.22 | 0.70 | 0.92 | ||||||||
| % Difference | 241 | 27 | 35 | ||||||||
Notes:
All figures are expressed on an attributable basis unless otherwise indicated.
The increase is mainly due to ongoing exploration drilling success resulting in larger pit designs at Nyamulilima and in the first-time reporting of the Geita Hill underground Mineral Reserve based on a feasibility study currently being completed. An increase in the Mineral Reserve price and reduced costs mostly by reductions in hauling cost on surface and contractor rates is partially offset by depletion and operational changes.
115
Material Assumptions for the Mineral Reserve
Modifying factors and price estimates
| as at 31 December 2022 | Geita | |||||||
| Primary Commodity Price | $/oz | 1,400 | ||||||
| Cut-off grade | g/t | 0.70(2)-4.20(3) | ||||||
| Stoping width | cm | 450-2,500(3) | ||||||
| Dilution | % | 11.6(2);10-17(3) | ||||||
| Resource Modification Factor | %RMF based on tonnes | 99.5(2)-100(3) | ||||||
| Resource Modification Factor | %RMF based on g/t | 93(2)-100(3) | ||||||
| Mining Recovery Factor | %MRF based on tonnes | 86-100(1) | ||||||
| Mining Recovery Factor | %MRF based on g/t | 86-100(1) | ||||||
| Mine Call Factor | %MCF | 100 | ||||||
| Metallurgical Recovery Factor | %MetRF | 80.4-91.4(1) | ||||||
Notes: (1) Vary according to rock type / area. (2) Open pit. (3) Underground. | ||||||||
Estimation
The Mineral Resource models are used as the basis for Mineral Reserve estimation. Input parameters for estimating the Mineral Reserve include gold price, mining dilution and recovery, geotechnical information, stay-in-business capital, operating costs, metallurgical recovery, processing capacity and mining equipment capacities.
Appropriate Mineral Reserve cut-off grades are applied and optimised pit shells are generated for the open pit sources. Pit designs are then done on selected shells and signed off by all relevant parties to ensure compliance to specifications. Underground designs are completed and evaluated. These designs are incorporated into the production and treatment scheduling stages to yield ore tonnes and grades. Financial evaluations are completed for production and treatment schedules to check the cash flow analysis from the estimated Mineral Reserve.
The Mineral Reserve for Geita's operating and prospective pits, as well as underground mine areas is estimated using updated economic factors, latest Mineral Resource models, geological, geotechnical, mining engineering and metallurgical parameters. Environmental, sociopolitical, legal and regulatory factors are also considered.
Map showing Geita planned infrastructure and licences
Below is a map that shows the location, infrastructure and mining license area for Geita. The coordinates of the mine, as represented by the plant, are depicted on the map and are in the geographic coordinate system.
116
117
AMERICAS
The Americas region includes the mining jurisdictions Brazil and Argentina, in which AngloGold Ashanti has three operations. In Argentina, the Company has one mining operation: the Cerro Vanguardia Mine, co-owned by AngloGold Ashanti (92.5%) and Fomento Minero de Santa Cruz Sociedad del Estado (“Fomicruz SE”) (7.5%). In Brazil, the Company has two mining operations: (i) the AngloGold Ashanti Córrego do Sítio Mineração operations (“AGA Mineração”) which include the Cuiabá, Lamego and Córrego do Sítio (“CdS”) mines, and (ii) Mineração Serra Grande (“Serra Grande”).
ARGENTINA
CERRO VANGUARDIA
Property description
Cerro Vanguardia, a production stage gold-silver operation, is the Company’s sole operation in Argentina. The mine is operated by Cerro Vanguardia S.A. ("CVSA"), which is a company formed by AngloGold Ashanti (92.5%) and Fomicruz SE, a state-owned company operating in the province of Santa Cruz (7.5%). The climate is semi-arid and although snow does occur, winter is mild and exploration activities are normally possible all year round. Cerro Vanguardia operates multiple small open pits with high stripping ratios and multiple narrow-vein underground mines located within the property and mined simultaneously. Cerro Vanguardia has been in operation for more than 20 years. Silver is produced as a by-product.
Location
Cerro Vanguardia is located in the Santa Cruz province, southern Patagonia, Argentina, approximately 110km north-northwest of the coastal town of Puerto San Julián. Access to the area is by aircraft from Buenos Aires to Comodoro Rivadavia (380km) or Rio Gallegos (510km) and then by road to the mine site.
Mineralisation style
Cerro Vanguardia is in the core of the 60,000km2 Deseado Massif, one of the most extensive volcanic complexes in southern Patagonia. The Deseado Massif is deposited over Paleozoic low-grade metamorphic basement rocks. The mineralisation is concentrated in steeply-dipping quartz veins that cut the flat-lying ignimbrites and volcanoclastic rocks. The Cerro Vanguardia district contains more than 100 gold and silver-bearing epithermal veins for a cumulative exposed vein strike extension of more than 240km, of which 55 veins are currently known to contain economic gold and silver mineralisation. The veins at Cerro Vanguardia consist mainly of quartz and adularia and contain minor electrum, native gold, silver sulphides and native silver as fine-grained disseminations.
Legal aspects and tenure
Refer to “Item 4B: Business Overview—The Regulatory Environment Enabling AngloGold Ashanti to Mine—Americas—Argentina—AngloGold Ashanti’s rights and permits”.
Processing plants and other available facilities
Infrastructure for Cerro Vanguardia is mostly located on-site. It includes a camp site with a capacity of 1,300 people, a Merrill Crowe plant, heap leaching facilities, cyanide recycling plant, mine laboratory, maintenance facilities, warehouses and sewage processing plant. Four natural gas power generators, fed by a 40km long pipeline, provide electricity to the operation. Natural gas is also used for heating. Mine office facilities are located in the main mining area.
Dewatering supplies water for use both as processing water and camp consumption. Due to the particular features of the mine, and in order to optimise hauling, all pits have local, single or multiple waste dumps. The TSF is located in and is contained by a natural depression.
Mineral processing
The metallurgical plant has a daily capacity estimated at 3,500tpd (1.2Mtpa), with gold and silver grade of around 4.25g/t and 120g/t, respectively. The plant comprises the following stages: crushing, milling, conventional leaching in tanks, counter current decant system in thickeners (“CCD circuit”), a CIL process, acid wash, elution, conventional Merrill Crowe process to recover gold and silver with metallic zinc, and a cyanide recovery plant ("Cyanisorb"). The tailings go directly to a conventional TSF, where there is also a reclaim water system for the plant.
In addition to the processing plant there is a heap leach pad, with an annual capacity of 1.5Mtpa, and gold and silver grades of around 0.7g/t and 20g/t, respectively. The pregnant solution from this process goes directly to the CCD circuit in the process plant and to the Merrill Crowe process for gold and silver recovery.
118
BRAZIL
AngloGold Ashanti’s operations in Brazil comprise AGA Mineração in the Quadrilátero Ferrífero, Minas Gerais state and Serra Grande in the Goiás state. AGA Mineração consists of several operations, namely Cuiabá, Lamego, and CdS.
Ore from the Cuiabá and Lamego underground mines is processed at the Cuiabá gold plant. The concentrate produced is transported by aerial ropeway to the Queiroz plant for processing and refining. The Queiroz hydrometallurgical plant also produces sulphuric acid as a by-product.
CdS consists of open pit and underground mines. The oxide ore mined is treated by heap leach and a pressure leaching plant treats sulphide ore. The distance from the main underground mine to the metallurgical plant is around 15km.
Serra Grande comprises three mechanised underground mines, Mina III, Mina Nova and Mina Palmeiras, and an open pit as well as a dedicated metallurgical plant.
AGA MINERAÇÃO
AGA Mineração encompasses mining operations at Cuiabá, Lamego and CdS. The AGA Mineração mining complex is located in southeastern Brazil in the state of Minas Gerais. Operations are 30km from the capital of the state (Belo Horizonte) in the case of Cuiabá and Lamego, and approximately 100km in the case of CdS.
AGA MINERAÇÃO - CÓRREGO DO SÍTIO
Property description
CdS is wholly-owned by AngloGold Ashanti. It has been in operation since 1989 and consists of multiple open pit (conventional bench mining) and underground mines (mainly using sub-level stoping). The property is currently in a production stage and operated by AGA Mineração.
Location
The CdS complex is located in the municipalities of Santa Bárbara and Barão de Cocais, that are located 100km east of the city of Belo Horizonte in the state of Minas Gerais, in the southeast of Brazil. These operations are included in an important mining district referred to as the Quadrilátero Ferrífero (Iron Quadrangle), the second biggest Brazilian area for the production of iron, gold and manganese.
Mineralisation style
The CdS gold deposit is located in the eastern part of the lower to middle greenschist facies of the Rio das Velhas Archaean, in the Iron Quadrangle region, on the southern margin of the São Francisco Craton in Brazil. CdS is an orogenic gold deposit hosted in intensely deformed clastic, volcanoclastic, carbonaceous schists and metagreywackes in an approximately 30km northeast-southwest striking shear zone. Hydrothermal alteration phases associated with the mineralisation are dominated by sericite and carbonate.
The CdS I, II and III, gold deposits and associated targets are located in a gold trend that extends for approximately 14km in a north-easterly direction, from Grota Funda (CdS I) in the south to Anomalia (CdS III) in the north, which developed in a compressional tectonic regime. Gold is associated with quartz and fine grained acicular arsenopyrite. The main gold targets and deposits are distributed over three trends, namely the CdS Trend and the Cristina Trend hosted in metasedimentary rocks, and the Donana Trend hosted in BIF.
Legal aspects and tenure
Refer to “Item 4B: Business Overview—The Regulatory Environment Enabling AngloGold Ashanti to Mine—Americas—Brazil—AngloGold Ashanti’s rights and permits”.
Processing plants and other available facilities
CdS infrastructure consists of the sulphide plant at CdS II (used to process refractory sulphide material), and the heap leach plant at CdS I (for oxide ore mined by open pit). The site also has an ore sorting plant, a TSF for the sulphide plant, a neutralised tailings deposit for the oxide material and numerous waste dumps for the open pit mines at CdS I. For further information on the regulatory framework governing TSFs in Brazil, see “Item 4B: Business Overview—The Regulatory Environment Enabling AngloGold Ashanti to Mine—Americas—Brazil”.
Ancillary facilities comprise a water treatment facility, effluent treatment facilities, equipment workshops, laboratory, warehouses, explosives and accessories magazines, fuel stations, electric substations as well as offices, medical
119
clinic, mess rooms, dressing rooms, bathrooms, storerooms, garage, fuel stations, a centre of environmental studies, nursery and other facilities required to operate the mine.
Water is primarily sourced from recycling the underground mine water and supplementary water catchment wells. The power for the operations is supplied and purchased on the open market. Good communication infrastructure is available in the area.
Mineral processing
There are two metallurgical plants at CdS: the heap leach plant for oxide ore and the sulphide plant. The sulphide process consists of crushing, grinding and gravity concentration, flotation, thickening, pressure oxidation (POX autoclave), CIL extraction, elution, neutralisation, electrowinning and dry stack tailings. The sulphide plant and POX circuit have a capacity of 900ktpa. The heap leaching process consists of crushing, agglomeration, stacking, leaching, adsorption, elution and electrowinning, with capacity of 860ktpa.
AGA MINERAÇÃO - CUIABÁ
Property description
Cuiabá is an underground operation (mainly using sub-level long hole open stoping), wholly-owned by AngloGold Ashanti, within one of the most important metallogenetic provinces in Brazil known as the Iron Quadrangle. This region is an important producer of iron ore, manganese and gold in Brazil. The property is currently in a production stage and operated by AGA Mineração.
Location
Cuiabá is located 30km to the east of Belo Horizonte in the state of Minas Gerais, in the southeast of Brazil.
Mineralisation style
Cuiabá mine is located in the Iron Quadrangle, which is a geotectonic unit on the southern edge of the São Francisco Craton, comprising Archaean and Proterozoic terrains, and bordered by Neoproterozoic mobile belts. From a regional viewpoint, Cuiabá mine is located in the eastern extension of the Serra do Curral inverted homocline, located on the northeastern edge of the Iron Quadrangle. The mine lithostratigraphy consists of an intermediate metavolcanic sedimentary sequence of the greenstone belt type and is hosted in the Nova Lima Group at the bottom of the Rio das Velhas Supergroup.
Gold mineralisation is associated with sulphides and quartz veins in BIF and volcanic sequences. Structural control and fluid flow are the most important factors for gold mineralisation with a common association between large-scale shear zones and their associated structures. Where BIF is mineralised, the ore appears strongly stratiform due to the selective sulphidation of the iron-rich layers. Steeply plunging shear zones tend to control the ore shoots, which commonly plunge parallel to intersections between the shears and other structures. Mineralisation is hosted in the limbs of a fold system.
Legal aspects and tenure
Refer to “Item 4B: Business Overview—The Regulatory Environment Enabling AngloGold Ashanti to Mine—Americas—Brazil—AngloGold Ashanti’s rights and permits”.
Processing plants and other available facilities
The metallurgical plants (Cuiabá gold plant and Queiroz plant) are connected by an aerial ropeway and power to the mine is provided by a set of small hydropower plants (Rio de Peixe hydroelectric complex). Cuiabá mine has a shaft system (846m deep) for production and personnel transport, the current nominal airflow capacity for which is 1,035m3/s, of which 320m3/s are refrigerated. Tailings deposition is at one of four sites located at Cuiabá, Calcinados, Rapaunha and Cocuruto. Refer to “Item 4B: Business Overview—The Regulatory Environment Enabling AngloGold Ashanti to Mine—Americas—Brazil” for further information on the Company’s TSFs in Brazil. The Rio de Peixe hydroelectric complex is a set of seven small hydropower plants that generate energy from three dams (Ingleses, Miguelo and Codorna), and are directly connected to the Queiroz plant.
Mineral processing
Cuiabá and Lamego mines feed the Cuiabá gold (crushing, milling and flotation) and Queiroz (roaster, carbon circuit and refinery) plants, currently at 1.9Mtpa with a metallurgical recovery of 91.8 percent for the combined feed. At the Cuiabá gold plant, ore is crushed and milled followed by flotation and filtration to produce a concentrate (32 percent sulphur), which is transported by an aerial ropeway to Queiroz for further treatment. Approximately 30 percent of gold is recovered through a gravity circuit at the Cuiabá gold plant. The concentrate, transported by aerial ropeway, is received at the Queiroz plant which is located in Nova Lima and comprises the refractory ore circuit (from Cuiabá or
120
Lamego) with facilities for pyrometallurgy and hydrometallurgy. The concentrate is roasted and the calcine proceeds to a carbon-in-pulp ("CIP") with Merrill Crowe circuits for further refining. The sulphide gas is captured for processing at the acid plant. Sulphuric acid is produced as a by-product.
AGA MINERAÇÃO - LAMEGO
Property description
Lamego is an underground operation (mainly using long hole stoping) that is wholly-owned by AngloGold Ashanti, within one of the most important metallogenetic provinces in Brazil, known as the Iron Quadrangle. This region is an important producer of iron, manganese and gold in Brazil. The property is currently in a production stage and operated by AGA Mineração.
Location
Lamego is located 30km to the east of Belo Horizonte in the state of Minas Gerais, in the southeast of Brazil.
Mineralisation style
The Lamego mine is located in the Iron Quadrangle, which is a geotectonic unit at the southern edge of the São Francisco Craton, comprising Archaean and Proterozoic terrains, and bordered by Neoproterozoic mobile belts. From a regional viewpoint, the Lamego mine is located in the eastern extension of the Serra do Curral inverted homocline, located on the northern edge of the Iron Quadrangle.
Gold mineralisation is characterised by orebodies associated with two horizons of chemical sedimentary rocks: BIF and metachert, with shear zones containing abundant quartz veinlets. The proportions of these lithotypes vary substantially from one deposit to another. In the BIF, sulphide mineralisation is associated with gold, while in the metachert it is associated with quartz veins. The gold occurs either as native gold or in sulphides. Lamego has a similar rock assemblage to Cuiabá, but with higher structural complexity. The mineralised BIF is more structurally deformed and contains more silica when compared to Cuiabá, which reacted less with the hydrothermal fluid.
Legal aspects and tenure
Refer to “Item 4B: Business Overview—The Regulatory Environment Enabling AngloGold Ashanti to Mine—Americas—Brazil—AngloGold Ashanti’s rights and permits”.
Processing plants and other available facilities
Lamego operates as a satellite mine to the Cuiabá mine. Ore is transported to surface via ramps where it is crushed, stockpiled and transported daily to the Cuiabá gold plant, where it is blended with Cuiabá ore on the ROM pad.
The two plants (Cuiabá gold plant and Queiroz plant) are connected by an aerial ropeway. Power to the mine is provided by a set of small hydropower plants (Rio de Peixe hydroelectric complex) and supplied by Cemig, a state-owned company. The Rio de Peixe hydroelectric complex is a set of seven small hydropower plants that generate energy from three dams (Ingleses, Miguelo and Codorna), and are directly connected to the Queiroz plant. Tailings deposition is at one of four sites located at Cuiabá, Calcinados, Rapaunha and Cocuruto. Refer to “Item 4B: Business Overview—The Regulatory Environment Enabling AngloGold Ashanti to Mine—Americas—Brazil” for further information on the Company’s TSFs in Brazil.
Lamego has a natural water supply system and a plant for water and sewage treatment.
Mineral processing
Cuiabá and Lamego mines feed the Cuiabá gold (crushing, milling and flotation) and Queiroz (roaster, carbon circuit and refinery) plants, currently at 1.9Mtpa with a metallurgical recovery of 91.8 percent for the combined feed. At the Cuiabá gold plant, ore is crushed and milled followed by flotation and filtration to produce a concentrate (32 percent sulphur), which is transported by an aerial ropeway to Queiroz for further treatment. Approximately 30 percent of gold is recovered through a gravity circuit at the Cuiabá gold plant. The concentrate, transported by aerial ropeway, is received at the Queiroz plant which is located in Nova Lima and comprises the refractory ore circuit (from Cuiabá or Lamego) with facilities for pyrometallurgy and hydrometallurgy. The concentrate is roasted and the calcine proceeds to a CIP with Merrill Crowe circuits for further refining. The sulphide gas is captured for processing at the acid plant. Sulphuric acid is produced as a by-product.
SERRA GRANDE
Property description
Mineração Serra Grande ("MSG" or "Serra Grande") is wholly-owned and operated by AngloGold Ashanti and is located in the northwest of the state of Goiás, in central Brazil. It operates three underground mines (using sub-level
121
stoping (bottom-up and top-down), cut-and-fill and room-and-pillar mining methods) and two open pit mines. The property is currently in a production stage.
Location
Serra Grande is located 5km south of the town of Crixás, 420km from the Brazilian capital, Brasília and approximately 350km from the state capital of Goiás, Goiánia. The employment of 1,120 persons in this largely rural area makes mining the principal economic activity in the region.
Mineralisation style
The Serra Grande gold deposit is an orogenic mesothermal deposit, associated with the development of shear zones that belong to the Upper Archaean Crixás Group. Gold mineralisation is associated with metasediments and metavolcanics from the Ribeirão das Antas and Rio Vermelho Formations respectively. The Crixás Greenstone Belt is surrounded by granitic gneiss terrains from the Ribeirão das Antas and Caiamar complexes and metasedimentary rocks from the Santa Terezinha Group, which is part of the Goiás magmatic arc. Mineralisation at Serra Grande is associated with quartz veins and massive to disseminated sulphides in metasedimentary, metavolcanoclastic and metabasalt rocks, with variable degrees of hydrothermal alteration developed over orogenic stacked thrust layers (duplexes).
Legal aspects and tenure
Refer to “Item 4B: Business Overview—The Regulatory Environment Enabling AngloGold Ashanti to Mine—Americas—Brazil—AngloGold Ashanti’s rights and permits”.
Processing plants and other available facilities
Serra Grande operates a single TSF, which will support the LOM production and has government environmental licensing in place. The water used in metallurgical processing comes from the underground mines. The state road GO-337 passes close to the operation providing access for logistics. The power for the mine is supplied and purchased in the open market (grid electricity) and diesel self-generation. Refer to “Item 4B: Business Overview—The Regulatory Environment Enabling AngloGold Ashanti to Mine—Americas—Brazil” for further information on the Company’s TSFs in Brazil.
Mineral processing
The metallurgical plant has the capacity to process 1.5Mtpa, combining CIL and gravimetric circuits. The ore is blended to feed the crushing circuit, which has a capacity of 4,500tpd. There are two mills in operation, and 20 leach tanks with a capacity of 4,800m3 divided between pre-liming and cyanidation stages. Approximately 45 percent of gold is captured in the parallel gravity circuit. The tailings are filtered and stacked in piles. The rest of the gold is recovered by the CIL process to form the doré that is sent to Nova Lima for refining. The total gold recovery is approximately 93.4 percent.
AUSTRALIA
AngloGold Ashanti operates two mines and has one new project in Western Australia.
Sunrise Dam, wholly-owned by AngloGold Ashanti, is located 205km north-northeast of Kalgoorlie and 55km south of Laverton.
Tropicana is a joint operation between AngloGold Ashanti (70 percent and the operator), and AFB Resources Pty Limited (30 percent), a subsidiary of Regis Resources Limited. Tropicana is located 200km east of Laverton and 330km east-northeast of Kalgoorlie in Western Australia.
The Butcher Well project is a joint venture between AngloGold Ashanti (70 percent) and Northern Star Resources Limited (“Northern Star Resources”) (30 percent). The project is managed by AngloGold Ashanti. Butcher Well is located 20km southwest of the Sunrise Dam mine and is considered to be a potential satellite operation.
SUNRISE DAM
Property description
Sunrise Dam is a production stage property with an active underground (using sub-level open stoping methods and narrow open-stoping methods) and open pit mine that is wholly-owned and operated by AngloGold Ashanti. AngloGold Ashanti conducts all brownfield exploration activities on the site and all tenements and permits are in good standing.
122
Location
Sunrise Dam is approximately 205km north-northeast of Kalgoorlie and 55km south of Laverton in Western Australia.
Mineralisation style
Sunrise Dam is a mesothermal gold deposit located in the Archaean greenstone belts of Western Australia. The deposit is complex and structurally controlled with multiple ore zones displaying differing characteristics, from ductile shear zones to brittle stockwork complexes to intrusive hosted mineralisation. Mineralisation is typically hosted within quartz-carbonate veins with varying quantities of pyrite and arsenopyrite. Strong alteration of the country host rock is common proximal to controlling structures.
Legal aspects and tenure
Refer to “Item 4B: Business Overview—The Regulatory Environment Enabling AngloGold Ashanti to Mine—Australia—AngloGold Ashanti’s rights and permits”.
Processing plants and other available facilities
All required infrastructure is in place including a fully functional camp, process plant, tailings facility, gas pipeline, power plant and electrical reticulation, offices, airstrip and road system. The underground infrastructure caters for all ventilation and dewatering needs with provisions made in the budget for extensions and upgrades.
Mineral processing
Processing at Sunrise Dam is via a conventional three-stage crushing / two-stage milling, CIL circuit, with a pyrite flotation and ultrafine grinding circuit commissioned in 2018. The gravity circuit recovers approximately 30 percent of the gold, with the CIL circuit, AcaciaTM reactor and Anglo American Research Laboratories ("AARL") elution used to recover the remainder. Electrowinning recovers gold from the Acacia reactor and is eluted to produce gold doré. Plant throughput at Sunrise Dam is approximately 4.1Mtpa.
BUTCHER WELL
Property description
Butcher Well is a joint venture between AngloGold Ashanti (70 percent) and Northern Star Resources (30 percent). Butcher Well encompasses two tenement packages, Butcher Well and Lake Carey, covering approximately 339.56km2. AngloGold Ashanti also holds a significant tenement package adjacent to the Northern Star joint venture properties.
The project is in the exploration stage in the early stages of study, with no Mineral Reserve declared. An Inferred Mineral Resource is stated, which has been the focus of a conceptual study. As the project is still in a concept study phase, no mining has taken place. Both open pit and underground mining options (using transverse longhole open stoping) are being explored.
Location
The Butcher Well project is located in the Laverton district of Western Australia, 20km southwest of AngloGold Ashanti's Sunrise Dam mine and 180km northeast of Kalgoorlie. Butcher Well is considered as a potential satellite operation to Sunrise Dam.
The Sunrise Dam airstrip is approximately 70km by road from the project, with a travel time of approximately 90 minutes on the road on the circumference of the southern part of Lake Carey. Lake Carey is a large salt lake that covers a part of the western project area,with Sunrise Dam located to the east of the lake and the Butcher Well project located on the western shore.
Mineralisation style
The Butcher Well Mineral Resource is an orogenic-style gold system hosted within the Laverton Greenstone Belt. The mineralisation is hosted within a basalt and is spatially associated with syenite dykes. Gold mineralisation within fresh rock principally occurs within steeply dipping north-south trending panels. Supergene gold dispersion and enrichment broadens the mineralised envelope within the near-surface saprolitic material. Much of this material has been previously exploited in shallow open pits.
Legal aspects and tenure
Refer to “Item 4B: Business Overview—The Regulatory Environment Enabling AngloGold Ashanti to Mine—Australia—AngloGold Ashanti’s rights and permits”.
123
Processing plants and other available facilities
Power is likely to be generated on-site via diesel generators. Water can be sourced from the existing flooded pits or bores. Ore material will be trucked to Sunrise Dam via existing secondary roads.
Mineral processing
Ore from Butcher Well will be processed at AngloGold Ashanti's Sunrise Dam processing plant. Processing at Sunrise Dam is via a conventional three-stage crushing, two-stage milling CIL circuit, with a pyrite flotation and ultrafine grinding circuit commissioned in 2018. The gravity circuit recovers approximately 30 percent of the gold, with the CIL circuit and AARL elution used to recover the remainder. Electrowinning recovers gold from the Acacia reactor and eluate to produce gold doré. Plant throughput at Sunrise Dam is 4.1Mtpa, and Butcher Well ore will supplement ore production from the Sunrise Dam underground mine to maintain the mill throughput.
TROPICANA
Property description
Tropicana mine is a currently operating gold mine, and is a production stage property. It produces gold bearing ore from a number of open pits named from north to south: Boston Shaker, Tropicana, Havana and Havana South, and from an underground mine beneath the Boston Shaker and Tropicana open pits. The project is a joint operationbetween AngloGold Ashanti (70 percent), as operator, and AFB Resources Pty Limited, a subsidiary of Regis Resources Limited (30 percent).
Location
Tropicana is located 330km northeast of Kalgoorlie and 200km east of Laverton, Western Australia.
Mineralisation style
The Tropicana deposit is hosted in an Archaen quartz-feldspathic gneiss within a major tectonic suture zone between the Yilgarn Craton and the Albany-Fraser Orogen. Mineralisation is associated with a strong hydrothermal alteration assemblege of biotite-sericite-pyrite, which post-dates peak graulite facies metamorphism. Gold is found within the pyrite.
Legal aspects and tenure
Refer to “Item 4B: Business Overview—The Regulatory Environment Enabling AngloGold Ashanti to Mine—Australia—AngloGold Ashanti’s rights and permits”.
Processing plants and other available facilities
All surface infrastructure facilities are in place and operational. The processing plant and TSF are operating withinwell, consistent with design specifications. The infrastructure includes, but is not limited to a dedicated gas and diesel power station, water supply, processing plant, mine, dewatering infrastructure, TSF, workshops, camp facilities and airstrips. Tropicana utilises a three-stage crushing circuit, inclusive of energy-efficient high-pressure grinding roll technology, followed by conventional ball mill grinding and a carbon-in-leach gold leach circuit. Throughput in 2020 was 8.83Mtpa. Power is supplied to the mine by an on-site gas and diesel power station, withstations, and natural gas is supplied via an APA Operations (Pty) Limited pipeline. Underground development and production is ongoing.
The processing plant has a capacity of 9.3Mtpa. The crushing circuit consists of a primary gyratory crusher, feeding a set of secondary cone crushers and tertiary rolls crushers. A 14MW and 6MW ball mill in parallel completes the grinding circuit. A CIL circuit is used to extract the gold from the ore, and a standard AARL elution and recovery systems is used to form gold doré bars.
The power provider, Kalgoorlie Power Systems, has built a dedicated power station consisting of a combination of diesel and gas powered generators with a capacity of 48.5MW.
PROJECTS
The projects in Colombia form a significant contribution to AngloGold Ashanti’s Mineral Resource with the three projects: La Colosa, Minera de Cobre Quebradona ("Quebradona") and Gramalote, the latter of which is a joint operationbetween AngloGold Ashanti (50 percent) and B2Gold Corp. (“B2 Gold”) (50 percent). Mineral Reserve was declared for the first time at Quebradona in 2018.
During 2022, the Company's project team in the United States integrated the Mineral Resource resulting from AngloGold Ashanti's acquisitions of Corvus Gold Inc. (“Corvus Gold”) and Coeur Sterling, Inc. (“Coeur Sterling”) using the Company’s evaluation framework. AngloGold Ashanti acquired North Bullfrog and Mother Lode as part of the Corvus Gold acquisition in January 2022 and Sterling (which includes the Crown Block deposits of SNA, Secret Pass and Daisy) through the acquisition of Coeur Sterling in November 2022.
124
COLOMBIA
AngloGold Ashanti Colombia has three greenfields projects: Gramalote, La Colosa and Quebradona.
The Gramalote project is a joint operation between AngloGold Ashanti (50 percent) and B2Gold (50 percent). The project is managed by B2Gold. It is situated in the Department of Antioquia, 124km northeast of Medellín.
The La Colosa project is wholly-owned and managed by AngloGold Ashanti. It is located in the Department of Tolima, 150km west of Bogotá, and 30km west of the major town of Ibagué.
The Quebradona project is wholly-owned and managed by AngloGold Ashanti and comprises the Nuevo Chaquiro deposit, a significant copper-gold porphyry. The Quebradona project is situated in the Middle Cauca region of Colombia, in the Department of Antioquia, 60km southwest of Medellín.
GRAMALOTE
Property description
Gramalote is a joint operation between AngloGold Ashanti (50 percent) and B2Gold (50 percent), with B2Gold being the manager. The property is currently an exploration stage project, with no Mineral Reserve declared. Gramalote is a semi-massive, superficial low-grade gold deposit suitable to be mined as a conventional open pit truck and shovel operation.
Following the completion of a feasibility study optimised work in the second half of 2022, both joint operation partners determined that the Gramalote project does not meet their investment thresholds for development. Following a comprehensive review of the alternatives relating to the project, both parties have commenced a joint sales process for the project, which is currently ongoing.
Location
The Gramalote property is located near the towns of Providencia and San José del Nus within the municipality of San Roque in the Department of Antioquia in the northwest of Colombia. It is approximately 230km northwest of Bogotá and 124km northeast of Medellín, which is the capital of the Antioquia Department.
Mineralisation style
Gramalote is a pluton-related, mesothermal gold deposit genetically related to the host intrusion. The alteration and mineralisation are structurally controlled, restricted to small halos along veins, sheeted veins and stockwork arrays with sulphide content being less than five percent. There are three distinct mineral deposits: Gramalote Central, Monjas West (also referred to as Monjas) and Trinidad. These all have similar mineralisation and alteration styles, with vertical to sub-vertical mineralised zones extending from tens of metres to over 200m width, with variable strike lengths of up to 1km, and extending to depths of several hundred metres. Mineralisation is controlled by northeast to southwest trending strike-slip shear zones, north-northwest to south-southeast trending extensional shear zones and dilatational fractures. Gold mineralisation at Tropicana occursis associated with stockwork veining and in high metamorphic grade gneissic rocks, which dip gentlyparticular quartz with fine pyrite veins, quartz-carbonate veins, and quartz with coarse pyrite veins.
Legal aspects and tenure
Refer to “Item 4B: Business Overview—The Regulatory Environment Enabling AngloGold Ashanti to Mine—Americas—Colombia—AngloGold Ashanti’s rights and permits”.
Processing plants and other available facilities
Key infrastructure planned includes: a TSF, waste rock facility, site water management, a creek diversion, roads and bridges, central workshop, offices and camp, and a process plant. Power is expected to be supplied from the national power grid some 25km away. Access is through a national road located less than 1km from the project.
Mineral processing
A range of treatment options for sulphide ore were investigated in previous studies, including whole ore leaching, heap leaching and a float leach process. The float leach process was selected as offering much better economics. Most of the metallurgical designs have been confirmed during the technical update to the south east. Mineralisationfeasibility study conducted during 2022. The process design is structurally controlledas follows:
•Processing by a semi-autogenous grinding stream treating approximately 11Mtpa of sulphide ore;
•Gold recovery post milling by flotation and occurs within a preferred host unit within the gneissic package. Post mineralisation faulting has separated the once continuous ore zone, with open pits developed on each of the fault bounded blocks.concentrate leach; and
•Conventional tailings deposition.
125
LA COLOSA
Property description
La Colosa is wholly-owned and managed by AngloGold Ashanti. It is currently in force majeure due to delays in granting environmental permits by national and local environmental authorities and, as a result, the project remains on hold. La Colosa is an exploration stage project with no Mineral Reserve declared. However, open pit mining (with potentially some underground mining) is the preferred mining method.
The La Colosa project is currently at an early project stage and has identified a number of Contentspossible technical options all of which are capital intensive. The most recent one year grant of force majeure, during which time the specified timelines for completing the various phases of the mining project under the concession contract are suspended, will expire on 22 June 2023.
Location
The project is located 150km west of Bogotá, and 30km west of the major town of Ibagué, which is the capital of the Tolima Department. Ibagué is the location of local government entities monitoring the project.
Mineralisation style
La Colosa is a large porphyry Au deposit located on the eastern flank of the Central Cordillera of Colombia. Mineralisation is exposed on the surface. The La Colosa site contains an intrusive complex with two magmatic centers known as the La Colosa and San Antonio porphyry stocks, hosted by schistose country rocks. The complex is present over a map area of 3.5km2 and includes a series of porphyry intrusions with compositions ranging from diorite to tonalite. The predominant type of hydrothermal alteration in the early porphyries is moderately intense potassic alteration (secondary biotite+K-feldspar). Pyrite is the most abundant sulphide, followed by pyrrhotite, which is commonly found close to the contacts with the country rocks. Gold mineralisation at La Colosa occurs predominantly as native gold and electrum. Sub-microscopic gold has been observed in sulphides (pyrite, due to its abundance) and iron oxide (magnetite-hematite).
Legal aspects and tenure
Refer to “Item 4B: Business Overview—The Regulatory Environment Enabling AngloGold Ashanti to Mine—Americas—Colombia—AngloGold Ashanti’s rights and permits”.
Processing plants and other available facilities
Currently, the project has field infrastructure that supports access to the Mineral Resource with roads, accommodation, and office and surface infrastructure for pre-logging and organisation of the drilling core. There is a core shed facility in the city of Ibagué where geological and geotechnical logging was performed in the past.
Mineral processing
The project is currently at an early stage. However, flotation of sulphide ore is being considered as a treatment option.
QUEBRADONA
Property description
The Quebradona project is wholly-owned and managed by AngloGold Ashanti and comprises the Nuevo Chaquiro deposit, a significant copper-gold porphyry. The project was previously a joint venture between AngloGold Ashanti and B2Gold. It completed a conceptual study in 2016 as well as a pre-feasibility study in 2018, which supported first-time reporting of a Mineral Reserve. When B2Gold’s participation dropped below five percent during 2019, AngloGold Ashanti became the 100 percent owner and manager of the project. B2Gold will be entitled to a royalty equal to two percent of the net profit generated from the sale of any mineral product by the project.
Quebradona will be a copper mine with gold and silver as by-products and is at a development stage. The preferred mining method is sub-level caving to extract the mineral deposit from underground. While the permits for the construction and mining operation had been approved by the relevant mining authority (Secretaría de Minas de Antioquia), the national environmental authority (Autoridad Nacional de Licencias Ambientales or “ANLA”) archived AngloGold Ashanti's environmental licence application relating to the Quebradona project in November 2021. AngloGold Ashanti is in the process of preparing a new Environmental Impact Assessment for the Quebradona project to submit to ANLA in connection with its environmental licence application.
Location
The Quebradona project is situated in the Middle Cauca region of Colombia, in the Department of Antioquia, 90km southwest (104km commute via the national highway) of Medellín, the capital of the Antioquia Department.
126
Mineralisation style
Five main targets have been identified in the exploration work, namely Nuevo Chaquiro, Aurora, Tenedor, Isabela, and La Sola. Nuevo Chaquiro is the most advanced and the sole mineral deposit considered in the feasibility study and licensing process. Nuevo Chaquiro, a significant copper-gold porphyry-style mineralised system, is one of five known porphyry centres on the property and has been the focus of exploration activities since the beginning of 2011 with more than 75km of drilling. Quebradona will be a copper mine with gold and silver as by-products.
Legal aspects and tenure
Refer to “Item 4B: Business Overview—The Regulatory Environment Enabling AngloGold Ashanti to Mine—Americas—Colombia—AngloGold Ashanti’s rights and permits”.
Processing plants and other available facilities
The Quebradona project site is close to an existing national highway, as well as state and rural roads, and high or medium voltage power infrastructure. The planned underground infrastructure consists of twin adits to access the orebody and number of internal vertical ore passes that gravity feeds to the main ore transfer level. The material will be transferred to a centralised (underground) crusher by load and haul dump vehicles.
Crushed material will then be transferred downhill to surface via a 6km conveyor, through a dedicated adit to a single coarse ore stockpile.
Mineral processing
Feasibility study test work confirmed that the ore will be treated by a typical porphyry copper flotation circuit producing copper and gold concentrate from the processing of approximately 6.2Mtpa of underground ore over a 23-year operating period. Ore extracted from the sub-level cave is crushed underground where tramp metal is removed before loading onto the underground conveyor system for delivery to the surface processing coarse ore stockpile with a 24-hour live capacity (approximately 21,300t).
The feasibility study proposes a processing circuit that includes primary crushing underground, secondary crushing, high pressure grinding rolls, ball milling, rougher-scavenger flotation for all elements (copper, gold, silver as well as pyrite), followed by regrinding of the concentrate and cleaning using a mix of column and mechanically agitated cells. The majority of the pyrite in the ore reports to the cleaner circuit tails and will be stored in a lined and eventually sealed impoundment within the TSF to avoid any potential acid rock drainage from the bulk high volume rougher tails. Molybdenum is present in the ore and is not planned for recovery in the initial stages of production.
UNITED STATES OF AMERICA (NEVADA)
All projects are exploration stage properties wholly-owned by AngloGold Ashanti. The Silicon project is located approximately 12km east of the town of Beatty in Nye County, Nevada, USA. The North Bullfrog project is located approximately 14km northwest of the town of Beatty. The Mother Lode project is located 10km east of the town of Beatty. The Secret Pass and Daisy deposits of the Sterling project are located 6km east of the town of Beatty. The remaining deposits of the Sterling project are located 14km southeast of the town of Beatty.
North Bullfrog and Mother Lode were acquired through the acquisition of Corvus Gold in January 2022. Sterling, which includes the Crown Block deposits of SNA, Secret Pass and Daisy, was acquired through the acquisition of Coeur Sterling in November 2022. The addition of the North Bullfrog project as well as the Mother Lode and Sterling projects into the AngloGold Ashanti North America portfolio, together with the Silicon project and other exploration targets, provides the opportunity to develop a world-class operational cluster within the Beatty district in Nevada.
The North Bullfrog project is the most advanced of AngloGold Ashanti’s exploration properties within the Beatty district, an area with a long history of gold mining. A first-time Mineral Resource at Silicon was declared in 2021. North Bullfrog, Mother Lode and Sterling declared Mineral Resource for the first time in 2022. The North Bullfrog project is currently progressing through a feasibility study, while the Silicon project is progressing through a pre-feasibility study.
NORTH BULLFROG
Property description
The North Bullfrog project is an exploration stage property wholly-owned and managed by AngloGold Ashanti. North Bullfrog is currently progressing through a feasibility study. The proposed mining method is conventional open pit mining. No Mineral Reserve has been declared at North Bullfrog.
127
An additional geotechnical study is underway for feasibility study level pit design slope recommendations. The blast fragmentation size is another area of opportunity to deliver improved value in heap leach ROM ore recovery. The mining rate is an area of notable opportunity, as are selectivity studies.
Further metallurgical testing will be needed during operation to ensure that ore is routed to the correct processing option. The study and definition of the unoxidised mineralised zones below the current mine plan are a significant opportunity and will add value if they are found to be sufficiently amenable to the process flowsheets available in the North Bullfrog project.
Location
The North Bullfrog project is located approximately 14km northwest of the town of Beatty in Nye County, Nevada, USA. The project is within the Bullfrog Hills subdistrict, of the Bullfrog Hills-Bare Mountains District.The Bullfrog Hills-Bare Mountains District is an historic mining centre that produced approximately 3Moz of gold and 4Moz of silver, primarily from the Barrick-owned Bullfrog pit.
Mineralisation style
The project lays within the Walker Lane mineral belt and the Southwestern Nevada Volcanic Field ("SWNVF"). The regional stratigraphy includes a basement of Late Proterozoic to Late Paleozoic metamorphic and sedimentary rocks. The North Bullfrog project is a combination of four mineralised deposits comprised of YellowJacket, Sierra Blanca, Jolly Jane, and Mayflower. The YellowJacket deposit is a very continuous high-grade vein within the moderate-grade stockwork mineralisation. The other three deposits are low to medium-grade.
Gold mineralisation at North Bullfrog is primarily hosted in the middle Miocene Sierra Blanca tuff. Two styles of precious metal epithermal mineralisation are present at the project: high-grade, structurally controlled fissure veins and associated stockwork zones, and low-grade disseminated or replacement deposits within altered volcanic rocks. Two district-scale north striking normal faults are the dominant structural features in the project area, but several smaller-scale faults between them are important controls for distribution of hydrothermal alteration and gold mineralisation.
Legal aspects and tenure
Refer to “Item 4B: Business Overview—The Regulatory Environment Enabling AngloGold Ashanti to Mine—Americas—United States of America (Nevada)—AngloGold Ashanti’s rights and permits”.
Processing plants and other available facilities
Currently, there is minimal infrastructure on-site, as it is an exploration area. Current access roads are unsealed and will require upgrading prior to commencing the project. The North Bullfrog project is in Nevada, which has several large mining operations currently in production, and as such provides access to all required major mining and processing equipment. The transport infrastructure in Nevada is very well established and maintained.
The town of Beatty and urban centres in the region such as Pahrump and Las Vegas offer infrastructure and services that can support the operation.
Mineral processing
Processing will include heap leaching of lower grade oxide ores that have demonstrated amenability to this process during metallurgical characterisation programs. Higher grade material containing some coarse gold will be processed in a mill. The leached tails from the mill will be dewatered and combined with heap leach material delivered from the mine.
SILICON
Property description
The Silicon project is an exploration stage property wholly-owned and managed by AngloGold Ashanti. Mineral Resource conversion drilling was a focus during 2022, which supported an ongoing pre-feasibility study. The nature of the Silicon mineralisation lends itself to conventional large scale open pit mining. No Mineral Reserve has been declared at Silicon.
Location
The Silicon project is located approximately 12km east of the town of Beatty in Nye County, Nevada, USA. The project is within the Bare Mountains subdistrict, of the Bullfrog Hills-Bare Mountains District.
128
The project resides within the southern extension of the Walker Lane trend and overlies the far-western margins of the SWNVF. The main mineralisation event occurred at approximately 11.6Ma in the hiatus between large scale ignimbrite events, in apparent association with rhyolitic volcanism. There is a strong structural control to the higher-grade mineralisation, with it being centred on the Silicon-Tramway faults. Lower-grade disseminated gold mineralisation is hosted in a rhyolite flow ascribed to the rhyolite of Picture Rock. Actual gold deposition appears to have occurred under less acidic and low to intermediate sulphidation conditions. Mineralisation at Silicon exhibits a strong vertical control and is strongly associated with the emplacement of hydrothermal breccias and banded epithermal veins. Pre-existing subvertical faults, particularly centred on the Silicon-Tramway fault system, strongly controlled the emplacement of the quartz ± pyrite veinlet zones. Disseminated adularia-quartz-pyrite mineralisation is a second-order stratigraphic feature and is closely associated with a favourable lava flow unit within the approximately 14Ma rhyolite of Picture Rock.
Legal aspects and tenure
Refer to “Item 4B: Business Overview—The Regulatory Environment Enabling AngloGold Ashanti to Mine—Americas—United States of America (Nevada)—AngloGold Ashanti’s rights and permits”.
Processing plants and other available facilities
The Silicon project area currently has minimal infrastructure on site, as it is an exploration area. Current access roads are unsealed and will require upgrading prior to commencing the project. The scope of the Silicon project is similar to several large mining operations currently in production, and existing suppliers are well established in Nevada to support mining and processing operations. The transport infrastructure in Nevada is very well established and maintained.
The town of Beatty and urban centres in the region such as Pahrump and Las Vegas offer infrastructure and services that can support the operation.
Mineral processing
Mineralised rock from the Silicon project will be processed on heap leach pads. Material found to be amenable to leaching at coarse sizes will be delivered directly to the pad from the mine for leaching (ROM heap leaching). Deeper, less weathered mineralised rock that was found to be more sensitive to the particle size will be crushed as needed to improve the production from the leach facility.
MOTHER LODE
Property description
The Mother Lode project is an exploration stage property wholly-owned and managed by AngloGold Ashanti. A preliminary economic assessment was completed by Corvus Gold in 2020, resulting in the declaration of a Mineral Resource. AngloGold Ashanti acquired Corvus Gold in January 2022. The Mother Lode gold deposits contain mineralisation at or near the surface that is suitable for open pit mining methods. No Mineral Reserve has been declared at Mother Lode.
Location
The Mother Lode project is located approximately 10km east of the town of Beatty in Nye County, Nevada, USA. The project is within the Bare Mountains subdistrict, of the Bullfrog Hills-Bare Mountains District.
Mineralisation style
The project lies within the Walker Lane mineral belt and the SWNVF. Mother Lode is characterised as a sediment, intrusive and locally volcanic-hosted disseminated gold deposit. Mineralisation most closely resembles Carlin-type sediment-hosted gold deposits of north-central Nevada. Mother Lode consists of structurally and stratigraphically-controlled disseminated gold mineralisation hosted primarily in rhyolite porphyry dykes, sedimentary rocks of Joshua Hollow, and to a lesser degree, Paleozoic sedimentary rocks. The primary structural control feeding mineralisation at Mother Lode is a series of north-trending, 50° to 70° west-dipping rhyolite dyke-filled structures. Mineralisation is both semi-tabular and highly irregular as fluids ascended along dyke-filled structures in the underlying Paleozoic rocks through the Tertiary unconformity and expanded upward into the Tertiary section. Mineralising fluids appear to have bled out laterally away from mineralised dykes into favourable permeable lithologies and secondary structures.
129
Legal aspects and tenure
Refer to “Item 4B: Business Overview—The Regulatory Environment Enabling AngloGold Ashanti to Mine—Americas—United States of America (Nevada)—AngloGold Ashanti’s rights and permits”.
Processing plants and other available facilities
The Mother Lode project area currently has minimal infrastructure on-site, as it is an exploration area with a reclaimed overburden facility and a small open pit. Current access roads are unsealed and will require upgrading prior to commencing the project. The Mother Lode project is in Nevada, which has several large mining operations currently in production, and as such provides access to all required major mining and processing equipment. The transport infrastructure in Nevada is very well established and maintained.
The town of Beatty and urban centres in the region such as Pahrump and Las Vegas offer infrastructure and services that can support the operation.
Mineral processing
Previous operations included crushing and heap leaching of oxide ores from the Mother Lode pit. Mineralised material from the expanded pit will be processed either without crushing on a heap leach pad (oxidised material) or in a mill using agitated tank bio-oxidation and cyanidation (sulphide). Although the sulphide mineral samples responded well to this method, additional work will need to be done to ensure that bio-oxidation is the most appropriate pre-oxidation process for this project.
STERLING
Property description
The Sterling project is an exploration stage property, wholly-owned and managed by AngloGold Ashanti. In November 2022, AngloGold Ashanti acquired the Sterling project through its acquisition of Coeur Sterling. The Sterling project includes the Crown Block deposits of SNA, Secret Pass and Daisy, and the tenements surrounding the properties. The elevation of the operation is around 1,200m, on the lower, eastern slopes of Bare Mountain. The local terrain is characterised by rounded or craggy ridges separated by ephemeral washes. The northern “Crown” strip comprises the general area of Fluorspar Canyon. No Mineral Reserve has been declared at Sterling.
Open pit mining of the Sterling mine deposit began in 1980 and continued until 1989. Underground mining began in 1980 and proceeded until mid-1997 when market conditions impacted profitability. The Crown deposits contain mineralisation at or near the surface that is suitable for open pit mining methods.
The Mineral Resource is based on estimates that contain inherent risk and depend upon geological interpretation and statistical inferences drawn from drilling and sampling analyses. Based on uncertainty due to geological interpretation from widespread drill hole information, an Inferred Mineral Resource confidence was applied to all of the Sterling Mineral Resource. Further Mineral Resource drilling and appropriate analyses will be required to upgrade the confidence to an Indicated Mineral Resource.
Location
The Sterling property is situated in southern Nye County, Nevada, near the town of Beatty, about 185 km northwest of Las Vegas. The project is within the Bare Mountains subdistrict, of the Bullfrog Hills-Bare Mountains District. The Secret Pass and Daisy deposits of the Sterling project are located 6km east of the town of Beatty. The remaining deposits of the Sterling project are located 14km southeast of the town of Beatty.
Mineralisation style
The Sterling deposits are characterised as either epithermal deposits (Secret Pass) like the North Bullfrog and Silicon deposits or Carlin type deposits (Daisy, Sterling and SNA). The Carlin-type deposits are sediment-hosted, disseminated precious metal deposits, found in the Great Basin province of eastern Nevada which formed during profound crustal extension and high heat flow beginning in the mid-Tertiary (approximately 35Ma to 40Ma).
Sterling is typical of sediment-hosted, disseminated precious metal deposits also termed Carlin-type deposits. Gold occurs in the rims of microscopic arsenian pyrite grains. Significant mineralisation occurs in:
•Gouge or breccia in the Reudy Fault zone and locally along the dyke margin;
•Adjacent to the fault (on both sides) in Bonanza King silty dolostone or dolostone, and to a lesser degree in underlying Carrara silty limestone or limestone (proximity to the Reudy Fault is not requisite for mineralisation); and
•In hydrothermal breccias derived from the above lithologies.
130
Legal aspects and tenure
Refer to “Item 4B: Business Overview—The Regulatory Environment Enabling AngloGold Ashanti to Mine—Americas—United States of America (Nevada)—AngloGold Ashanti’s rights and permits”.
Processing plants and other available facilities
Sterling is accessible by road from Las Vegas, a distance of 185km via U.S. Highway 95. A good secondary, 13km long gravel road turns off the north side of the highway at mile 45.9, 24km southeast of the town of Beatty. The gravel road is maintained by Nye County and Sterling personnel. Las Vegas is the nearest major airport. Mine buildings consist of several trailers used for office work, geological research and logging, sample preparation (during mining), and personnel facilities. A large steel container is used to securely store 144 Zone drill core, pulps, and rejects. There is also a large mechanical shop for on-site maintenance of equipment and vehicles. Electrical power is provided by a generator on-site. The mine has no living quarters or canteen and is currently on care and maintenance.
The town of Beatty and urban centres in the region such as Pahrump and Las Vegas offer infrastructure and services that can support the operation.
Mineral processing
Previous processing included heap leaching the oxidised Sterling mine ore. After mine production ceased, the heap leach pad continued to be turned over until October 2001, with additional ore from a low-grade stockpile added in early 2001. Gold recovery continued until August 2002 when a final strip was carried out. Mineralised material from the Crown deposits will be processed either without crushing on a heap leach pad (oxidised material) or in a mill using agitated tank bio-oxidation and cyanidation (sulphide).
MINERAL RESOURCE AND MINERAL RESERVE
The underground OreMineral Resource and Mineral Reserve determination isare based on an automated software process called MSO (Mineable Shape Optimiser)the use of reasonable economic assumptions which isprovide a feature withinreasonable basis for establishing the Datamine software package. MSO runs over the grade block model and usesreasonable prospects of economic and mining parameters set by the mining engineer to produce optimal mining volumes which maximiseextraction for the Mineral Resource, extraction. The process runs above a cut-off and caters for practical mining parameters such as minimum and maximum mining width, anticipated wall dilutions, minimum and maximum wall angles, minimum separation distances between parallel and sub-parallel stopes, and minimum and maximum stope heights and widths. The outputs are evaluated byestablishing the mining engineer and adjusted as required to ensure mineability. The process uses all classifications of material, but onlyexpected price for the Measured and Indicated Mineral Resource portions are used to quote the Ore Reserve. A financial test is run whereby all Inferred Mineral Resource is set to zero value and the remaining Measured and Indicated Mineral Resource must still provide a positive financial return.
| 2020 | 2020 | 2019 | Units | ||||||||||||||||||||
| (3 year average) | (Ore Reserve) | (3 year average) | |||||||||||||||||||||
| Ore Reserve Gold Price | 1,479 | 1,200 | 1,307 | $ per ounce | |||||||||||||||||||
| 2020 | 2020 | 2019 | Units | ||||||||||||||||||||||||||||||||
| (3 year average) | (Ore Reserve) | (3 year average) | |||||||||||||||||||||||||||||||||
| Ore Reserve Copper Price | 2.82 | 2.65 | 2.83 | $ per pound | |||||||||||||||||||||||||||||||
techniques including historic price averages, are prepared in-house and reviewed annually. AngloGold Ashanti selects a conservative OreMineral Reserve price relative to its peers, in line with AngloGold Ashanti’speers. This is done to fit into its strategy of including a margin in the mine planning process. The resultant plan is then valued at a higher business planning price.
The following gold prices were used as the basis for estimation, unless otherwise stated:
Local prices of gold(1) | |||||||||||||||||
Gold price(1) | Australia | Brazil | Argentina | Colombia | |||||||||||||
| $/oz | AUD/oz | BRL/oz | ARS/oz | COP/oz | |||||||||||||
| Mineral Reserve | |||||||||||||||||
| 2022 | 1,400 | 1,919 | 7,830 | 208,000 | 4,261,380 | ||||||||||||
| 2021 | 1,200 | 1,633 | 6,182 | 134,452 | 3,849,000 | ||||||||||||
| Mineral Resource | |||||||||||||||||
| 2022 | 1,750 | 2,416 | 9,401 | 253,500 | 6,076,725 | ||||||||||||
| 2021 | 1,500 | 2,072 | 7,940 | 173,065 | 5,336,250 | ||||||||||||
Copper price
The following copper prices(2) were used as the basis for estimation, unless otherwise stated:
Copper price(1)(2) | Local price of copper(1)(2) | |||||||
| $/lb | COP/lb | |||||||
| Mineral Reserve | ||||||||
| 2022 | 2.90 | 9,302 | ||||||
| 2021 | 2.90 | 9,302 | ||||||
| Mineral Resource | ||||||||
| 2022 | 3.50 | 12,451 | ||||||
| 2021 | 3.50 | 12,451 | ||||||
Notes:
(1) Considered over the period 2012 to 2022.
(2) Only applicable to the Quebradona project.
The Mineral Resource, as reported, is exclusive(1) of the Mineral Reserve component. Mineral Resource and Mineral Reserve estimates are reported as at 31 December 2022 and are net of 2022 production depletion.
MINERAL RESOURCE
Gold
The AngloGold Ashanti Oregold Measured and Indicated Mineral Resource(exclusive of Mineral Reserve reduced(*)) increased from 43.8Moz51.7Moz as at 31 December 2021 to 60.6Moz as at 31 December 2022. The net increase of 8.8Moz for Measured and Indicated Mineral Resource includes 3.6Moz in relation to the first-time reporting of the Mineral Resource for North Bullfrog and Mother Lode (following the Corvus Gold acquisition). Increases due to changes in economic assumptions of 1.3Moz, and exploration and modelling changes of 6.6Moz were partially offset by other factors of 2.7Moz.
The AngloGold Ashanti gold Inferred Mineral Resource(exclusive of Mineral Reserve(*)) decreased from 42.3Moz as at 31 December 20192021 to 29.5Moz in40.8Moz as at 31 December 2020. This gross annual2022. The net decrease of 14.3Moz1.6Moz for Inferred Mineral Resource includes depletiondecreases due to exploration and modelling changes of 3.4Moz,3.1Moz and disposalother factors of assets1.3Moz. This decrease was partially offset by an increase of 1.5Moz in relation to the South African regionfirst-time reporting of the Mineral Resource for North Bullfrog, Mother Lode and SadiolaSterling (following the Corvus Gold and Coeur Sterling acquisitions), and changes in economic assumptions of 16.7Moz.1.3Moz.
The Mineral Resource was estimated using a gold price of $1,750/oz, unless otherwise stated (2021: $1,500/oz). Refer to the below table, prepared in accordance with Table 1 to Paragraph (b) of Item 1303 of Regulation S-K.
Copper
The AngloGold Ashanti copper Mineral Resource(exclusive of Mineral Reserve(*)) remained unchanged at 1.32Mt (2,902Mlb) Measured and Indicated Mineral Resource and 1.47Mt (3,231Mlb) Inferred Mineral Resource as at 31 December 2022 as compared to 31 December 2021, as a feasibility study optimisation is still ongoing and no
132
additional exploration has been completed at Quebradona. The Mineral Resource was estimated at a copper price of $3.50/lb, unless otherwise stated (2021: $3.50/lb). Refer to the below table, prepared in accordance with Table 1 to Paragraph (b) of Item 1303 of Regulation S-K.
MINERAL RESERVE
Gold
The AngloGold Ashanti gold Mineral Reserve increased from 28.1Moz as at 31 December 2021 to 28.8Moz as at 31 December 2022. This is offset partly byexcludes Gramalote, as the joint operation partner has decided not to publish the Mineral Reserve. This annual net increase of 0.7Moz includes additions due to exploration and modelling changes of 4.5Moz,2.9Moz and changes in economic assumptions of 1.0Moz1.0Moz. This increase was partially offset by depletion of 2.9Moz and reductions due to other factors of 0.3Moz.The OreMineral Reserve was estimated using the AngloGold Ashantia gold price of US$1,200/$1,400/oz, (2019: US$1,100/unless otherwise stated (2021: $1,200/oz). Refer to the below table, prepared in accordance with Table 2 to Paragraph (b) of Item 1303 of Regulation S-K.
Copper
The principal changes in AngloGold Ashanti’s OreAshanti copper Mineral Reserveremained unchanged at 1.47Mt (3,250Mlb) as at 31 December 2020,2022 as compared with those published as atto 31 December 2019, are2021, as follows:a feasibility study optimisation is still ongoing and no additional exploration has been completed at Quebradona. The Mineral Reserve was estimated at a copper price of $2.90/lb, unless otherwise stated (2021: $2.90/lb). Refer to the below table, prepared in accordance with Table 2 to Paragraph (b) of Item 1303 of Regulation S-K.
(*) The Mineral Resource exclusive of Mineral Reserve (“Exclusive Mineral Resource”) is defined as the Inclusive Mineral Resource less the Mineral Reserve before dilution and other factors are applied. | ||||||||
133
The below table is prepared in accordance with Table 1 to Paragraph (b) of Item 1303 of Regulation S-K - Summary Mineral Resource(1) (exclusive of Mineral Reserve) for gold at the end of the fiscal year ended 31 December 2022, based on an estimated gold price of $1,750/oz, unless otherwise stated.
Mineral Resource (1) | Measured | Indicated | Measured and Indicated Total | Inferred | ||||||||||||||||||||||||||||||||||||||||||||||
| Gold | Tonnes (3) | Grade | Contained Gold | Tonnes (3) | Grade | Contained Gold | Tonnes (3) | Grade | Contained Gold | Tonnes (3) | Grade | Contained Gold | ||||||||||||||||||||||||||||||||||||||
| as at 31 December 2022 | Million | g/t | Tonnes | Moz | Million | g/t | Tonnes | Moz | Million | g/t | Tonnes | Moz | Million | g/t | Tonnes | Moz | ||||||||||||||||||||||||||||||||||
| Africa Region | 11.14 | 4.23 | 47.19 | 1.52 | 259.42 | 1.93 | 499.44 | 16.06 | 270.57 | 2.02 | 546.63 | 17.57 | 201.72 | 3.01 | 607.95 | 19.55 | ||||||||||||||||||||||||||||||||||
| Democratic Republic of the Congo | 7.22 | 3.18 | 22.97 | 0.74 | 22.15 | 2.64 | 58.44 | 1.88 | 29.37 | 2.77 | 81.41 | 2.62 | 13.16 | 2.61 | 34.43 | 1.11 | ||||||||||||||||||||||||||||||||||
Kibali (45 %)(2)(9)(13) | 7.22 | 3.18 | 22.97 | 0.74 | 22.15 | 2.64 | 58.44 | 1.88 | 29.37 | 2.77 | 81.41 | 2.62 | 13.16 | 2.61 | 34.43 | 1.11 | ||||||||||||||||||||||||||||||||||
| Ghana | 2.12 | 7.89 | 16.72 | 0.54 | 82.17 | 2.94 | 241.81 | 7.77 | 84.28 | 3.07 | 258.53 | 8.31 | 73.25 | 5.27 | 385.68 | 12.40 | ||||||||||||||||||||||||||||||||||
Iduapriem(13) | 0.15 | 0.89 | 0.14 | — | 54.50 | 1.36 | 74.21 | 2.39 | 54.66 | 1.36 | 74.35 | 2.39 | 33.45 | 1.42 | 47.52 | 1.53 | ||||||||||||||||||||||||||||||||||
Obuasi(13)(14) | 1.96 | 8.44 | 16.59 | 0.53 | 27.66 | 6.06 | 167.59 | 5.39 | 29.63 | 6.22 | 184.18 | 5.92 | 39.80 | 8.50 | 338.17 | 10.87 | ||||||||||||||||||||||||||||||||||
| Guinea | — | — | — | — | 114.79 | 1.02 | 117.24 | 3.77 | 114.79 | 1.02 | 117.24 | 3.77 | 79.10 | 1.16 | 92.13 | 2.96 | ||||||||||||||||||||||||||||||||||
Siguiri (85 %)(2)(13) | — | — | — | — | 114.79 | 1.02 | 117.24 | 3.77 | 114.79 | 1.02 | 117.24 | 3.77 | 79.10 | 1.16 | 92.13 | 2.96 | ||||||||||||||||||||||||||||||||||
| Tanzania | 1.80 | 4.15 | 7.50 | 0.24 | 40.32 | 2.03 | 81.96 | 2.63 | 42.12 | 2.12 | 89.45 | 2.88 | 36.21 | 2.64 | 95.71 | 3.08 | ||||||||||||||||||||||||||||||||||
Geita(13) | 1.80 | 4.15 | 7.50 | 0.24 | 40.32 | 2.03 | 81.96 | 2.63 | 42.12 | 2.12 | 89.45 | 2.88 | 36.21 | 2.64 | 95.71 | 3.08 | ||||||||||||||||||||||||||||||||||
| Americas Region | 16.88 | 4.20 | 70.94 | 2.28 | 41.41 | 2.77 | 114.85 | 3.69 | 58.29 | 3.19 | 185.78 | 5.97 | 61.85 | 3.57 | 220.98 | 7.10 | ||||||||||||||||||||||||||||||||||
| Argentina | 4.82 | 2.88 | 13.89 | 0.45 | 17.49 | 2.23 | 39.09 | 1.26 | 22.31 | 2.37 | 52.98 | 1.70 | 5.00 | 2.35 | 11.74 | 0.38 | ||||||||||||||||||||||||||||||||||
Cerro Vanguardia (92.5 %)(2)(4)(13) | 4.82 | 2.88 | 13.89 | 0.45 | 17.49 | 2.23 | 39.09 | 1.26 | 22.31 | 2.37 | 52.98 | 1.70 | 5.00 | 2.35 | 11.74 | 0.38 | ||||||||||||||||||||||||||||||||||
| Brazil | 12.06 | 4.73 | 57.05 | 1.83 | 23.92 | 3.17 | 75.76 | 2.44 | 35.98 | 3.69 | 132.80 | 4.27 | 56.85 | 3.68 | 209.24 | 6.73 | ||||||||||||||||||||||||||||||||||
AGA Mineração - Córrego do Sítio(13) | 3.07 | 3.31 | 10.18 | 0.33 | 7.92 | 3.19 | 25.24 | 0.81 | 10.99 | 3.22 | 35.42 | 1.14 | 20.46 | 3.94 | 80.63 | 2.59 | ||||||||||||||||||||||||||||||||||
AGA Mineração - Cuiabá(5)(13) | 4.17 | 7.66 | 31.96 | 1.03 | 2.73 | 5.83 | 15.93 | 0.51 | 6.91 | 6.93 | 47.89 | 1.54 | 12.56 | 4.95 | 62.20 | 2.00 | ||||||||||||||||||||||||||||||||||
AGA Mineração - Lamego(5)(13) | 1.18 | 2.92 | 3.44 | 0.11 | 3.05 | 1.98 | 6.05 | 0.19 | 4.23 | 2.24 | 9.49 | 0.31 | 4.56 | 2.12 | 9.65 | 0.31 | ||||||||||||||||||||||||||||||||||
Serra Grande(13) | 3.63 | 3.15 | 11.46 | 0.37 | 10.21 | 2.79 | 28.54 | 0.92 | 13.85 | 2.89 | 40.01 | 1.29 | 19.26 | 2.95 | 56.76 | 1.82 | ||||||||||||||||||||||||||||||||||
| Australia Region | 38.85 | 1.44 | 55.96 | 1.80 | 30.58 | 1.58 | 48.40 | 1.56 | 69.44 | 1.50 | 104.36 | 3.36 | 55.36 | 2.25 | 124.79 | 4.01 | ||||||||||||||||||||||||||||||||||
Sunrise Dam(13) | 20.31 | 1.64 | 33.27 | 1.07 | 22.79 | 1.56 | 35.60 | 1.14 | 43.09 | 1.60 | 68.87 | 2.21 | 29.28 | 2.02 | 59.19 | 1.90 | ||||||||||||||||||||||||||||||||||
Butcher Well (70 %)(2)(11) | — | — | — | — | — | — | — | — | — | — | — | — | 3.06 | 3.49 | 10.67 | 0.34 | ||||||||||||||||||||||||||||||||||
Tropicana (70 %)(2)(13) | 18.55 | 1.22 | 22.69 | 0.73 | 7.79 | 1.64 | 12.80 | 0.41 | 26.34 | 1.35 | 35.49 | 1.14 | 23.02 | 2.39 | 54.93 | 1.77 | ||||||||||||||||||||||||||||||||||
| Projects | 98.19 | 0.40 | 38.96 | 1.25 | 1,311.77 | 0.77 | 1,007.67 | 32.40 | 1,409.96 | 0.74 | 1,046.63 | 33.65 | 682.59 | 0.46 | 314.29 | 10.10 | ||||||||||||||||||||||||||||||||||
| Colombia | 45.15 | 0.37 | 16.93 | 0.54 | 1,071.76 | 0.78 | 838.58 | 26.96 | 1,116.91 | 0.77 | 855.51 | 27.51 | 558.94 | 0.44 | 244.17 | 7.85 | ||||||||||||||||||||||||||||||||||
Gramalote (50 %)(2)(10)(11) | — | — | — | — | 89.36 | 0.70 | 62.38 | 2.01 | 89.36 | 0.70 | 62.38 | 2.01 | 35.11 | 0.53 | 18.67 | 0.60 | ||||||||||||||||||||||||||||||||||
La Colosa(7)(11) | — | — | — | — | 833.49 | 0.87 | 726.31 | 23.35 | 833.49 | 0.87 | 726.31 | 23.35 | 217.89 | 0.71 | 154.86 | 4.98 | ||||||||||||||||||||||||||||||||||
Quebradona(4)(6)(8)(12) | 45.15 | 0.37 | 16.93 | 0.54 | 148.91 | 0.34 | 49.89 | 1.60 | 194.06 | 0.34 | 66.82 | 2.15 | 305.94 | 0.23 | 70.64 | 2.27 | ||||||||||||||||||||||||||||||||||
| United States of America | 53.04 | 0.42 | 22.04 | 0.71 | 240.01 | 0.70 | 169.09 | 5.44 | 293.05 | 0.65 | 191.12 | 6.14 | 123.65 | 0.57 | 70.13 | 2.25 | ||||||||||||||||||||||||||||||||||
North Bullfrog(4)(11) | 28.71 | 0.24 | 6.77 | 0.22 | 82.54 | 0.37 | 30.18 | 0.97 | 111.25 | 0.33 | 36.95 | 1.19 | 44.35 | 0.25 | 11.07 | 0.36 | ||||||||||||||||||||||||||||||||||
Silicon(4)(11) | — | — | — | — | 121.56 | 0.87 | 105.90 | 3.40 | 121.56 | 0.87 | 105.90 | 3.40 | 36.03 | 0.70 | 25.23 | 0.81 | ||||||||||||||||||||||||||||||||||
Mother Lode(4)(8)(11) | 24.33 | 0.63 | 15.26 | 0.49 | 35.91 | 0.92 | 33.01 | 1.06 | 60.24 | 0.80 | 48.28 | 1.55 | 9.86 | 0.55 | 5.39 | 0.17 | ||||||||||||||||||||||||||||||||||
Sterling(11)(15) | — | — | — | — | — | — | — | — | — | — | — | — | 33.41 | 0.85 | 28.43 | 0.91 | ||||||||||||||||||||||||||||||||||
| AngloGold Ashanti Total | 165.06 | 1.29 | 213.05 | 6.85 | 1,643.18 | 1.02 | 1,670.35 | 53.70 | 1,808.25 | 1.04 | 1,883.40 | 60.55 | 1,001.52 | 1.27 | 1,268.02 | 40.77 | ||||||||||||||||||||||||||||||||||
134
Notes:
Rounding of numbers may result in computational discrepancies in the Mineral Resource tabulations. The Mineral Resource estimates with respect to our material properties have been prepared by the Qualified Persons (employed by AngloGold Ashanti Ore Reserve increased from 1.39Mt (3,068Mlb) in December 2019 to 1.41Mt (3,105Mlb) in December 2020. This gross annual increase of 0.02Mt due to optimisationunless stated otherwise). The net difference between the Mineral Resource at the end of the last completed fiscal year and the preceding fiscal year will be detailed for material properties, if applicable. To reflect that figures are not precise calculations and that there is uncertainty in their estimation, AngloGold Ashanti reports tonnage, grade and content for gold to two decimals. All ounces are Troy ounces. “Moz” refers to million ounces.
(1) All disclosure of Mineral Resource is exclusive of Mineral Reserve. The Mineral Resource exclusive of Mineral Reserve (“Exclusive Mineral Resource”)
is defined as the inclusive Mineral Resource less the Mineral Reserve before dilution and other factors are applied. (2) Mineral Resource attributable to AngloGold Ashanti’s percentage interest shown.
(3) "Tonnes" refers to a metric tonne which is equivalent to 1,000 kilograms.
(4) The inclusive Mineral Resource contains 81.7Moz of silver for Cerro Vanguardia; 92.9Moz of silver for Quebradona; 6.0Moz of silver for North Bullfrog;
17.8Moz of silver for Silicon and 1.9Moz of silver for Mother Lode as a by-product.
(5) The inclusive Mineral Resource contains 1.60 million tonnes of sulphur as a by-product for AGA Mineração - Cuiabá and Lamego.
(6) The inclusive Mineral Resource contains 89.3 kilotonnes of molybdenum as a potential by-product.
(7) Based on a gold price of $1,400/oz.
(8) Based on a gold price of $1,500/oz.
(9) Operated by Barrick Gold Corporation ("Barrick"). AngloGold Ashanti has recognised that in preparing this annual report, the Qualified Persons have, relied on information provided by Barrick. Based on a gold price of $1,700/oz. (10) Managed by B2Gold Corp. Based on a gold price of $1,800/oz.
(11) Property currently in an exploration stage.
(12) Property currently in a development stage.
(13) Property currently in a production levels. stage.
(14) Open pit based on a gold price of $1,600/oz.
(15) Based on a gold price of $1,700/oz.
The Ore Reserve was estimatedbelow table is prepared in accordance with Table 1 to Paragraph (b) of Item 1303 of Regulation S-K - Summary Mineral Resource(1) (exclusive of Mineral Reserve) for copper at the AngloGold Ashantiend of the fiscal year ended 31 December 2022, based on an estimated copper price of US$2.65/$3.50/lb, (2019: US$2.65/lb).unless otherwise stated.
| ORE RESERVE - COPPER | Mt | Mlb | ||||||||||||
| Ore Reserve as at 31 December 2019 | 1.39 | 3,068 | ||||||||||||
| Additions | Due To | |||||||||||||
| Quebradona | Results of the Mineral Resource estimation and mine plan update for the Feasibility study. | 0.02 | 37 | |||||||||||
| Ore Reserve as at 31 December 2020 | 1.41 | 3,105 | ||||||||||||
Mineral Resource (1) | Measured | Indicated | Measured and Indicated Total | Inferred | ||||||||||||||||||||||||||||||||||||||||||||||
| Copper | Tonnes (2) | Grade | Contained Copper | Tonnes (2) | Grade | Contained Copper | Tonnes (2) | Grade | Contained Copper | Tonnes (2) | Grade | Contained Copper | ||||||||||||||||||||||||||||||||||||||
| as at 31 December 2022 | Million | %Cu | Tonnes Million | Pounds Million | Million | %Cu | Tonnes Million | Pounds Million | Million | %Cu | Tonnes Million | Pounds Million | Million | %Cu | Tonnes Million | Pounds Million | ||||||||||||||||||||||||||||||||||
| Americas Region | 45.15 | 0.69 | 0.31 | 684 | 148.91 | 0.68 | 1.01 | 2,218 | 194.06 | 0.68 | 1.32 | 2,902 | 305.94 | 0.48 | 1.47 | 3,231 | ||||||||||||||||||||||||||||||||||
| Colombia | 45.15 | 0.69 | 0.31 | 684 | 148.91 | 0.68 | 1.01 | 2,218 | 194.06 | 0.68 | 1.32 | 2,902 | 305.94 | 0.48 | 1.47 | 3,231 | ||||||||||||||||||||||||||||||||||
Quebradona(3)(4)(5) | 45.15 | 0.69 | 0.31 | 684 | 148.91 | 0.68 | 1.01 | 2,218 | 194.06 | 0.68 | 1.32 | 2,902 | 305.94 | 0.48 | 1.47 | 3,231 | ||||||||||||||||||||||||||||||||||
| AngloGold Ashanti Total | 45.15 | 0.69 | 0.31 | 684 | 148.91 | 0.68 | 1.01 | 2,218 | 194.06 | 0.68 | 1.32 | 2,902 | 305.94 | 0.48 | 1.47 | 3,231 | ||||||||||||||||||||||||||||||||||
Notes:
Rounding of numbers may result in computational discrepancies in the Mineral Resource tabulations. To reflect that figures are not precise calculations and that there is uncertainty in their estimation, AngloGold Ashanti strivesreports tonnage and grade to actively create valuetwo decimals and content for copper with no decimals. “Mlb” refers to million pounds.(1) All disclosure of Mineral Resource is exclusive of Mineral Reserve. The Mineral Resource exclusive of Mineral Reserve (“Exclusive Mineral Resource”)
is defined as the Inclusive Mineral Resource less the Mineral Reserve before dilution and other factors are applied.
(2) "Tonnes" refers to a metric tonne which is equivalent to 1,000 kilograms.
(3) The inclusive Mineral Resource contains 92.9Moz of silver as a by-product.
(4) The inclusive Mineral Resource contains 89.3 kilotonnes of molybdenum as a potential by-product.
(5) Property currently in a development stage.
135
The below table is prepared in accordance with Table 2 to Paragraph (b) of Item 1303 of Regulation S-K - Summary Mineral Reserve for gold at the end of the fiscal year ended 31 December 2022, based on an estimated gold price of $1,400/oz, unless otherwise stated.
| Mineral Reserve | Proven | Probable | Total Mineral Reserve | |||||||||||||||||||||||||||||||||||
| Gold | Tonnes (2) | Grade | Contained Gold | Tonnes (2) | Grade | Contained Gold | Tonnes (2) | Grade | Contained Gold | |||||||||||||||||||||||||||||
| as at 31 December 2022 | Million | g/t | Tonnes | Moz | Million | g/t | Tonnes | Moz | Million | g/t | Tonnes | Moz | ||||||||||||||||||||||||||
| Africa Region | 50.54 | 2.37 | 120.00 | 3.86 | 213.89 | 2.43 | 520.44 | 16.73 | 264.43 | 2.42 | 640.45 | 20.59 | ||||||||||||||||||||||||||
| Democratic Republic of the Congo | 14.49 | 3.47 | 50.33 | 1.62 | 29.17 | 3.15 | 91.86 | 2.95 | 43.67 | 3.26 | 142.19 | 4.57 | ||||||||||||||||||||||||||
Kibali (45 %)(1)(5)(8) | 14.49 | 3.47 | 50.33 | 1.62 | 29.17 | 3.15 | 91.86 | 2.95 | 43.67 | 3.26 | 142.19 | 4.57 | ||||||||||||||||||||||||||
| Ghana | 11.31 | 4.42 | 50.03 | 1.61 | 70.08 | 3.78 | 264.67 | 8.51 | 81.39 | 3.87 | 314.70 | 10.12 | ||||||||||||||||||||||||||
Iduapriem(8) | 6.84 | 1.07 | 7.30 | 0.23 | 48.83 | 1.39 | 68.00 | 2.19 | 55.67 | 1.35 | 75.30 | 2.42 | ||||||||||||||||||||||||||
Obuasi(8) | 4.47 | 9.55 | 42.73 | 1.37 | 21.25 | 9.26 | 196.67 | 6.32 | 25.72 | 9.31 | 239.40 | 7.70 | ||||||||||||||||||||||||||
| Guinea | 15.20 | 0.65 | 9.95 | 0.32 | 75.68 | 0.83 | 62.72 | 2.02 | 90.88 | 0.80 | 72.67 | 2.34 | ||||||||||||||||||||||||||
Siguiri (85 %)(1)(8) | 15.20 | 0.65 | 9.95 | 0.32 | 75.68 | 0.83 | 62.72 | 2.02 | 90.88 | 0.80 | 72.67 | 2.34 | ||||||||||||||||||||||||||
| Tanzania | 9.54 | 1.02 | 9.70 | 0.31 | 38.95 | 2.60 | 101.19 | 3.25 | 48.49 | 2.29 | 110.89 | 3.57 | ||||||||||||||||||||||||||
Geita(8) | 9.54 | 1.02 | 9.70 | 0.31 | 38.95 | 2.60 | 101.19 | 3.25 | 48.49 | 2.29 | 110.89 | 3.57 | ||||||||||||||||||||||||||
| Americas Region | 8.16 | 3.39 | 27.64 | 0.89 | 23.64 | 2.79 | 65.88 | 2.12 | 31.80 | 2.94 | 93.53 | 3.01 | ||||||||||||||||||||||||||
| Argentina | 2.22 | 3.20 | 7.11 | 0.23 | 9.16 | 1.75 | 16.00 | 0.51 | 11.38 | 2.03 | 23.11 | 0.74 | ||||||||||||||||||||||||||
Cerro Vanguardia (92.5 %)(1)(3)(8) | 2.22 | 3.20 | 7.11 | 0.23 | 9.16 | 1.75 | 16.00 | 0.51 | 11.38 | 2.03 | 23.11 | 0.74 | ||||||||||||||||||||||||||
| Brazil | 5.93 | 3.46 | 20.54 | 0.66 | 14.48 | 3.44 | 49.88 | 1.60 | 20.41 | 3.45 | 70.41 | 2.26 | ||||||||||||||||||||||||||
AGA Mineração - Córrego do Sítio(8) | 1.17 | 2.95 | 3.44 | 0.11 | 2.21 | 4.32 | 9.53 | 0.31 | 3.37 | 3.84 | 12.97 | 0.42 | ||||||||||||||||||||||||||
AGA Mineração - Cuiabá(4)(8) | 2.37 | 4.57 | 10.82 | 0.35 | 5.99 | 4.22 | 25.28 | 0.81 | 8.35 | 4.32 | 36.11 | 1.16 | ||||||||||||||||||||||||||
AGA Mineração - Lamego(4)(8) | 0.35 | 2.54 | 0.89 | 0.03 | 1.18 | 2.71 | 3.20 | 0.10 | 1.53 | 2.67 | 4.10 | 0.13 | ||||||||||||||||||||||||||
Serra Grande(8) | 2.05 | 2.63 | 5.38 | 0.17 | 5.10 | 2.32 | 11.86 | 0.38 | 7.15 | 2.41 | 17.24 | 0.55 | ||||||||||||||||||||||||||
| Australia Region | 21.96 | 1.54 | 33.88 | 1.09 | 22.30 | 2.15 | 47.88 | 1.54 | 44.26 | 1.85 | 81.76 | 2.63 | ||||||||||||||||||||||||||
Sunrise Dam(8) | 12.02 | 1.51 | 18.17 | 0.58 | 6.55 | 2.72 | 17.83 | 0.57 | 18.57 | 1.94 | 36.00 | 1.16 | ||||||||||||||||||||||||||
Tropicana (70 %)(1)(8) | 9.94 | 1.58 | 15.71 | 0.51 | 15.74 | 1.91 | 30.05 | 0.97 | 25.69 | 1.78 | 45.76 | 1.47 | ||||||||||||||||||||||||||
| Projects | — | — | — | — | 120.01 | 0.67 | 80.83 | 2.60 | 120.01 | 0.67 | 80.83 | 2.60 | ||||||||||||||||||||||||||
| Colombia | — | — | — | — | 120.01 | 0.67 | 80.83 | 2.60 | 120.01 | 0.67 | 80.83 | 2.60 | ||||||||||||||||||||||||||
Quebradona(3)(6)(7) | — | — | — | — | 120.01 | 0.67 | 80.83 | 2.60 | 120.01 | 0.67 | 80.83 | 2.60 | ||||||||||||||||||||||||||
| AngloGold Ashanti Total | 80.66 | 2.25 | 181.53 | 5.84 | 379.84 | 1.88 | 715.03 | 22.99 | 460.49 | 1.95 | 896.56 | 28.83 | ||||||||||||||||||||||||||
Notes:
Rounding of numbers may result in computational discrepancies in the Mineral Reserve tabulations. The Mineral Reserve estimates with respect to our material properties have been prepared by growing its major assetthe Qualified Persons (employed by AngloGold Ashanti unless stated otherwise). The net difference between the Mineral Reserve at the end of the last completed fiscal year and the preceding fiscal year will be detailed for material properties, if applicable. To reflect that figures are not precise calculations and that there is uncertainty in their estimation, AngloGold Ashanti reports tonnage, grade and content for gold to two decimals. All ounces are Troy ounces. “Moz” refers to million ounces.
(1) Mineral Reserve attributable to AngloGold Ashanti’s percentage interest shown.
(2) "Tonnes" refers to a metric tonne which is equivalent to 1,000 kilograms.
(3) The Mineral Reserve contains 21.9Moz of silver for Cerro Vanguardia and 28.1Moz of silver for Quebradona to be recovered as a by-product.
(4) The Mineral Reserve contains 0.29 million tonnes of sulphur to be recovered as a by-product for AGA Mineração - Cuiabá and Lamego.
136
(5) Operated by Barrick. AngloGold Ashanti has recognised that in preparing this annual report, the Ore Reserve. This drive isQualified Persons have relied on information provided by Barrick. Based on a gold price of $1,300/oz. Pamoa Main pit was based on a well-defined brownfieldsgold price of $1,400/oz and greenfields exploration programme, innovationPamoa South pit was based on a gold price of $1,500/oz. (6) Based on a gold price of $1,200/oz. (7) Property currently in both geological modelling and mine planning and optimization of its asset portfolio.a development stage.
(8) Property currently in a production stage.
The Orebelow table is prepared in accordance with Table 2 to Paragraph (b) of Item 1303 of Regulation S-K - Summary Mineral Reserve estimates in this document includefor copper at the Ore Reserve belowend of the current infrastructurefiscal year ended 31 December 2022, based on an estimated copper price of underground mines. These include mines in Ghana, Australia, Brazil and Colombia.
| Mineral Reserve | Proven | Probable | Total Mineral Reserve | |||||||||||||||||||||||||||||||||||
| Copper | Tonnes (1) | Grade | Contained Copper | Tonnes (1) | Grade | Contained Copper | Tonnes (1) | Grade | Contained Copper | |||||||||||||||||||||||||||||
| as at 31 December 2022 | Million | %Cu | Tonnes Million | Pounds Million | Million | %Cu | Tonnes Million | Pounds Million | Million | %Cu | Tonnes Million | Pounds Million | ||||||||||||||||||||||||||
| Americas Region | — | — | — | — | 120.01 | 1.23 | 1.47 | 3,250 | 120.01 | 1.23 | 1.47 | 3,250 | ||||||||||||||||||||||||||
| Colombia | — | — | — | — | 120.01 | 1.23 | 1.47 | 3,250 | 120.01 | 1.23 | 1.47 | 3,250 | ||||||||||||||||||||||||||
Quebradona(2)(3) | — | — | — | — | 120.01 | 1.23 | 1.47 | 3,250 | 120.01 | 1.23 | 1.47 | 3,250 | ||||||||||||||||||||||||||
| AngloGold Ashanti Total | — | — | — | — | 120.01 | 1.23 | 1.47 | 3,250 | 120.01 | 1.23 | 1.47 | 3,250 | ||||||||||||||||||||||||||
Notes:
Rounding of numbers may result in computational discrepancies in the Mineral Reserve tabulations. To reflect that figures are not precise calculations and that there is uncertainty in their estimation, AngloGold Ashanti sold various assetsreports tonnage and grade to two decimals and content for copper with no decimals. “Mlb” refers to million pounds.(1) "Tonnes" refers to a metric tonne which is equivalent to 1,000 kilograms.
(2) The Mineral Reserve contains 28.1Moz of silver to be recovered as a by-product.
(3)Property currently in South African and Mali during 2020. On conclusion of the sales and after depletions for that period of 2020 the final Mineral Resource and Ore Reserve at the time of the sale are shown below:a development stage.
137
BY-PRODUCTS
Several by-products willare expected to be recovered as a result of processing of the gold OreMineral Reserve and copper OreMineral Reserve. These include 0.41 million tonnes0.29Mt of sulphur from Brazil, 23.89Moz21.9Moz of silver from Argentina and 26.19Moz28.1Moz of silver from Colombia. Molybdenum, at present, is not planned for recovery.recovery at Quebradona. The Quebradona process plant will behas been designed to treat approximately 6.2Mtpa underground ore and to produce copper concentrate over a 23-year mine life with provision of space in the plant site for a molybdenum plant in the future.
AngloGold Ashanti has an established Mineral Resource and OreMineral Reserve StatementLeadership Team ("RRLT") that is responsible for setting and overseeing its Mineral Resource and Mineral Reserve governance framework, and for ensuring that it meets the Company’s goals and objectives while complying with all relevant regulatory codes.
AngloGold Ashanti has developed and implemented a rigorous system of internal and external reviews aimed at providing assurance in respect of Ore ReserveMineral Resource and Mineral ResourceReserve estimates. In 2022, the following operations and projects were subject to an external review on the basis that each operation or project will be reviewed by an independent third-party on average once every three years:
• Mineral Resource and Mineral Reserve at Cerro Vanguardia; and
• Mineral Resource at North Bullfrog project.
In addition, numerous internal Mineral Resource and OreMineral Reserve process reviews were completed by suitably qualified Competent Personstechnical experts from within AngloGold Ashanti and no significant deficiencies were identified. The Mineral Resource and OreMineral Reserve aregovernance framework is underpinned by appropriate Mineral Resource Managementmanagement processes and protocols that ensure adequate corporate governance. These procedures have been developed to be compliant with the guiding principles of the U.S. Sarbanes-Oxley Act of 2002 (SOX)("SOX").
AngloGold Ashanti has also developed an enterprise-wide risk management tool that provides consistent and reliable data that allows for visibility of risks and actions across the group. This tool is used to facilitate, control and monitor material risks to the Mineral Resource and Mineral Reserve, thus ensuring that the appropriate risk management and mitigation plans are in place.
If technical experts involved in the estimation of Mineral Resource or Mineral Reserve feel that their technical advice has been ignored which may represent a risk to the Mineral Resource or Mineral Reserve to be published, they are obliged to inform the RRLT in writing. In addition, AngloGold Ashanti’s “Speak-up” programme can also be used if the technical experts deem they may be compromised in the process. .
QUALIFIED PERSONS
The information in this annual report on Form 20-F relating to Exploration Results, Mineral ResourcesResource and Ore ReservesMineral Reserve on AngloGold Ashanti’s material properties is based on information compiled by, or under the supervision of, the CompetentQualified Persons, as defined in the SAMREC Code.Regulation S-K 1300. All CompetentQualified Persons arewere employed by AngloGold Ashanti exceptat the time of preparing the Technical Report Summaries in respect of AngloGold’s material properties. However, two of the Qualified Persons who provided the information for the Technical Report Summaries (effective date: 31 December 2021) in respect of Kibali (which usesand Obuasi are no longer employed by AngloGold Ashanti as of the date hereof. Mr. Richard Peattie, the Qualified Person providing information in respect of the Mineral Resource at Kibali, is now employed by Barrick, Competent Persons),which has a 45 percent interest in Kibali. Ms. Emmarentia Maritz, the Qualified Person providing information in respect of the Mineral Resource at Obuasi, is now employed by Barrick. Both of these Qualified Persons have
138
provided updated consents to the use of the their names, or any quotation from, or summarisation of, the Technical Report Summaries (effective date: 31 December 2021) prepared by them in this annual report, and to the filing of the Technical Report Summaries (effective date: 31 December 2021) as exhibits hereto. All Qualified Persons have sufficient experience relevant to the style of mineralisation and the type of deposit under consideration, and relevant to the activity which they are undertaking. AngloGold Ashanti has recognised that in preparing this annual report with respect to Kibali, the Qualified Persons have relied on information provided by Barrick. The legal tenure of each operation and projectmaterial property has been verified to the satisfaction of the accountable CompetentQualified Person and all Ore Reserves haveof the Mineral Reserve has been confirmed to be covered by the required mining permits or there exists a realistic expectation that these permits will be issued. The CompetentQualified Persons have provided consent to the inclusion of Exploration Results, Mineral Resource and OreMineral Reserve information in this annual report, in the form and context in which it appears.appears as well as the public filing of the Technical Report Summary for each respective material mining property filed as exhibits hereto.
Qualified Persons
| Responsibility | Qualified Person | Professional organisation | Membership number | Relevant experience | Qualification | ||||||||||||
| Kibali Mineral Resource | Richard Peattie (1) | FAusIMM | 301 029 | 26 years | MPhil (Geostatistics) | ||||||||||||
| Kibali Mineral Reserve | Romulo Sanhueza | MAusIMM | 211 794 | 25 years | BSc Eng (Mining) | ||||||||||||
| Obuasi Mineral Resource | Emmarentia Maritz(1) | SACNASP | 118345 | 19 years | MSc (Mineral Resource Evaluation) | ||||||||||||
| Obuasi Mineral Reserve | Douglas Atanga | MAusIMM | 334 391 | 14 years | BSc (Mining Engineering) | ||||||||||||
| Geita Mineral Resource | Damon Elder | MAusIMM | 208 240 | 26 years | BSc Hons (Geology) | ||||||||||||
| Geita Mineral Reserve | Duan Campbell | ECSA | 202 101 953 | 20 years | BEng (Mining) | ||||||||||||
Notes:
All Qualified Persons were employed by AngloGold Ashanti at the time of preparing the Technical Report Summaries in respect of AngloGold’s material properties.
(1) Two of the Qualified Persons who provided the information for the Technical Report Summaries (effective date: 31 December 2021) in respect of
Kibali and Obuasi Mineral Resource are no longer employed by AngloGold Ashanti as of the date hereof and are currently employed by Barrick.
Accordingly, the ChairmanChairperson of the Mineral Resource and OreMineral Reserve Steering Committee, VA Chamberlain, MSc (Mining Engineering)Leadership Team, Mrs. TM Flitton, Master of Engineering (Mining), BSc (Hons) (Geology)Bachelor of Science (Honours, Geology), MGSSA, FAusIMM,RM SME, Pr.Sci.Nat (SACNASP), FGSSA, assumes responsibility for the Mineral Resource and OreMineral Reserve processes for AngloGold Ashanti and is satisfied that the Competent Persons have fulfilled their responsibilities. VA ChamberlainAshanti. Mrs. TM Flitton has 3321 years’ experience in explorationmining with ten years directly leading and miningmanaging Mineral Resource and Mineral Reserve reporting. She is employed full-time by AngloGold Ashanti and can be contacted at the following address: 76 Rahima Moosa Street, Newtown, 2001,112 Oxford Road, Houghton Estate, Johannesburg, 2198, South Africa.
| Ore Reserve: Imperial | At 31 December 2020 | |||||||||||||||||||||||||||||||||||||||||||||||||||||||||||||
Proven Ore Reserve (1) (2) | Probable Ore Reserve (1) (2) | |||||||||||||||||||||||||||||||||||||||||||||||||||||||||||||
Tons(5) | Grade | Gold Content | Tons (5) | Grade | Gold Content | Metallurgical Recovery Factor | Cut-off Grade | (9) | ||||||||||||||||||||||||||||||||||||||||||||||||||||||
| (million) | (oz/ton) | (Moz) | (million) | (oz/ton) | (Moz) | percent | (oz/ton) | |||||||||||||||||||||||||||||||||||||||||||||||||||||||
| Africa | ||||||||||||||||||||||||||||||||||||||||||||||||||||||||||||||
| Democratic Republic of the Congo | ||||||||||||||||||||||||||||||||||||||||||||||||||||||||||||||
Kibali (45 percent) (3) (10) | 10.06 | 0.127 | 1.27 | 27.87 | 0.107 | 2.97 | 75.9-90.9 | (4) | 0.016-0.061 | (4) | ||||||||||||||||||||||||||||||||||||||||||||||||||||
| Ghana | ||||||||||||||||||||||||||||||||||||||||||||||||||||||||||||||
| Iduapriem | 8.45 | 0.034 | 0.29 | 42.11 | 0.038 | 1.62 | 93.0-95.9 | (4) | 0.016-0.026 | (4) | ||||||||||||||||||||||||||||||||||||||||||||||||||||
Obuasi (2) | — | — | — | 34.76 | 0.251 | 8.73 | 87.0 | 0.111-0.152 | (4) | |||||||||||||||||||||||||||||||||||||||||||||||||||||
| Guinea | ||||||||||||||||||||||||||||||||||||||||||||||||||||||||||||||
Siguiri (85 percent) (3) | 19.34 | 0.018 | 0.35 | 61.72 | 0.025 | 1.54 | 88.0 | (4) | 0.016-0.028 | (4) | ||||||||||||||||||||||||||||||||||||||||||||||||||||
| Mali | ||||||||||||||||||||||||||||||||||||||||||||||||||||||||||||||
Sadiola (41 percent) (3)(8) | — | — | — | — | — | — | — | — | ||||||||||||||||||||||||||||||||||||||||||||||||||||||
| Tanzania | ||||||||||||||||||||||||||||||||||||||||||||||||||||||||||||||
| Geita | — | — | — | 30.91 | 0.076 | 2.34 | 79.1-92.7 | (4) | 0.032-0.097 | (4) | ||||||||||||||||||||||||||||||||||||||||||||||||||||
| South Africa | ||||||||||||||||||||||||||||||||||||||||||||||||||||||||||||||
| West Wits | ||||||||||||||||||||||||||||||||||||||||||||||||||||||||||||||
Mponeng (8) | — | — | — | — | — | — | — | — | ||||||||||||||||||||||||||||||||||||||||||||||||||||||
| Surface | ||||||||||||||||||||||||||||||||||||||||||||||||||||||||||||||
Surface Operations (8) | — | — | — | — | — | — | — | — | ||||||||||||||||||||||||||||||||||||||||||||||||||||||
| Australia | ||||||||||||||||||||||||||||||||||||||||||||||||||||||||||||||
Sunrise Dam (2) | 12.21 | 0.044 | 0.54 | 9.55 | 0.064 | 0.61 | 81.9-92.0 | (4) | 0.022-0.047 | (4) | ||||||||||||||||||||||||||||||||||||||||||||||||||||
Tropicana (70 percent) (2)(3) | 16.91 | 0.033 | 0.55 | 21.00 | 0.064 | 1.33 | 88.1-90.0 | (4) | 0.020-0.079 | (4) | ||||||||||||||||||||||||||||||||||||||||||||||||||||
| Americas | ||||||||||||||||||||||||||||||||||||||||||||||||||||||||||||||
| Argentina | ||||||||||||||||||||||||||||||||||||||||||||||||||||||||||||||
Cerro Vanguardia (92.5 percent)(3)(6) | 3.74 | 0.061 | 0.23 | 7.92 | 0.066 | 0.53 | 66.9-95.2 | (4) | 0.008-0.197 | (4) | ||||||||||||||||||||||||||||||||||||||||||||||||||||
| Brazil | ||||||||||||||||||||||||||||||||||||||||||||||||||||||||||||||
AGA Mineração (2) (7) | 3.46 | 0.108 | 0.37 | 12.04 | 0.113 | 1.36 | 43.7-94.3 | (4) | 0.008-0.125 | (4) | ||||||||||||||||||||||||||||||||||||||||||||||||||||
Serra Grande (2) | 2.98 | 0.080 | 0.24 | 4.73 | 0.082 | 0.39 | 89.5-96.4 | (4) | 0.016-0.043 | (4) | ||||||||||||||||||||||||||||||||||||||||||||||||||||
| Colombia | ||||||||||||||||||||||||||||||||||||||||||||||||||||||||||||||
Gramalote (50 percent) (3) | — | — | — | 68.85 | 0.025 | 1.72 | 83.9-95.0 | (4) | 0.005-0.006 | (4) | ||||||||||||||||||||||||||||||||||||||||||||||||||||
Quebradona (2)(6) | — | — | — | 124.25 | 0.020 | 2.49 | 58.6 | — | ||||||||||||||||||||||||||||||||||||||||||||||||||||||
| Total | 77.15 | 0.050 | 3.84 | 445.71 | 0.058 | 25.63 | ||||||||||||||||||||||||||||||||||||||||||||||||||||||||
| Ore Reserve: Imperial | At 31 December 2020 | |||||||||||||||||||||||||||||||||||||||||||||||||||||||||||||
Proven Ore Reserve (1) (2) | Probable Ore Reserve (1) (2) | |||||||||||||||||||||||||||||||||||||||||||||||||||||||||||||
Tons(5) | Grade | Copper Content | Tons (5) | Grade | Copper Content | Metallurgical Recovery Factor | Cut-off Grade | (9) | ||||||||||||||||||||||||||||||||||||||||||||||||||||||
| (million) | percent | (Mlbs) | (million) | percent | (Mlbs) | percent | ($/t) | |||||||||||||||||||||||||||||||||||||||||||||||||||||||
| Colombia | ||||||||||||||||||||||||||||||||||||||||||||||||||||||||||||||
Quebradona (2)(6) | — | — | — | 124.25 | 1.25 | 3,105 | 93.6 | 30 | (11) | |||||||||||||||||||||||||||||||||||||||||||||||||||||
| Total | — | — | — | 124.25 | 1.25 | 3,105 | ||||||||||||||||||||||||||||||||||||||||||||||||||||||||
•Abbreviations used in this annual report include: gold– Au, copper – Cu, silver – Ag, Sulphur – S, molybdenum – Mo;
•Internal controls are discussed in the case"—Corporate Governance" section above as well as in the “—Mineral Resource and Mineral Reserve Internal Controls Disclosure" section below;
•Maps presented for material properties in this Item 4D show infrastructure, licences and coordinates of the following underground mines currentlymine, as represented by the plant (or stated otherwise), in production:
| Ore Reserve below infrastructure: Imperial | Tons (millions) | Grade (ounces/ton) | Gold Content (million ounces) | |||||||||||||||||||||||
| Obuasi | 2.98 | 0.580 | 1.73 | |||||||||||||||||||||||
| Sunrise Dam | 1.13 | 0.090 | 0.10 | |||||||||||||||||||||||
| Tropicana | 0.88 | 0.100 | 0.09 | |||||||||||||||||||||||
| AGA Mineração | 5.45 | 0.140 | 0.78 | |||||||||||||||||||||||
| Serra Grande | 5.41 | 0.080 | 0.44 | |||||||||||||||||||||||
| Quebradona | 124.25 | 0.020 | 2.49 | |||||||||||||||||||||||
| Total | 140.10 | 0.040 | 5.64 | |||||||||||||||||||||||
| Ore Reserve below infrastructure: Imperial | Tons (millions) | Grade (%) | Copper Content (million pounds) | |||||||||||||||||||||||
| Quebradona | 124.25 | 1.25 | 3,105 | |||||||||||||||||||||||
| Total | 124.25 | 1.25 | 3,105 | |||||||||||||||||||||||
| Ore Reserve: Imperial | At 31 December 2019 | ||||||||||||||||||||||||||||||||||||||||||||||||||||||||||||||||||||||
Proven Ore Reserve (1) (2) | Probable Ore Reserve (1) (2) | ||||||||||||||||||||||||||||||||||||||||||||||||||||||||||||||||||||||
Tons(5) | Grade | Gold Content | Tons (5) | Grade | Gold Content | Metallurgical Recovery Factor | Cut-off Grade | (9) | |||||||||||||||||||||||||||||||||||||||||||||||||||||||||||||||
| (million) | (oz/ton) | (Moz) | (million) | (oz/ton) | (Moz) | percent | (oz/ton) | ||||||||||||||||||||||||||||||||||||||||||||||||||||||||||||||||
| Africa | |||||||||||||||||||||||||||||||||||||||||||||||||||||||||||||||||||||||
| Democratic Republic of the Congo | |||||||||||||||||||||||||||||||||||||||||||||||||||||||||||||||||||||||
Kibali (45 percent) (3) (10) | 10.25 | 0.120 | 1.23 | 23.72 | 0.123 | 2.93 | 84.5-89.8 | (4) | 0.044-0.070 | (4) | |||||||||||||||||||||||||||||||||||||||||||||||||||||||||||||
| Ghana | |||||||||||||||||||||||||||||||||||||||||||||||||||||||||||||||||||||||
| Iduapriem | 3.74 | 0.024 | 0.09 | 42.86 | 0.040 | 1.71 | 93.0-95.9 | (4) | 0.025-0.028 | (4) | |||||||||||||||||||||||||||||||||||||||||||||||||||||||||||||
Obuasi (2) | — | — | — | 26.74 | 0.266 | 7.12 | 87.0 | 0.120-0.152 | (4) | ||||||||||||||||||||||||||||||||||||||||||||||||||||||||||||||
| Guinea | |||||||||||||||||||||||||||||||||||||||||||||||||||||||||||||||||||||||
Siguiri (85 percent) (3) | 20.07 | 0.019 | 0.37 | 59.66 | 0.023 | 1.39 | 88.0-93.0 | (4) | 0.015-0.022 | (4) | |||||||||||||||||||||||||||||||||||||||||||||||||||||||||||||
| Mali | |||||||||||||||||||||||||||||||||||||||||||||||||||||||||||||||||||||||
Morila (40 percent) (3) (10) (11) | — | — | — | — | — | — | |||||||||||||||||||||||||||||||||||||||||||||||||||||||||||||||||
Sadiola (41 percent) (3) | — | — | — | 27.00 | 0.059 | 1.58 | 75.0-94.0 | (4) | 0.015-0.023 | (4) | |||||||||||||||||||||||||||||||||||||||||||||||||||||||||||||
| Tanzania | |||||||||||||||||||||||||||||||||||||||||||||||||||||||||||||||||||||||
| Geita | — | — | — | 14.81 | 0.102 | 1.51 | 77.8-92.7 | (4) | 0.036-0.115 | (4) | |||||||||||||||||||||||||||||||||||||||||||||||||||||||||||||
| South Africa | |||||||||||||||||||||||||||||||||||||||||||||||||||||||||||||||||||||||
| West Wits | |||||||||||||||||||||||||||||||||||||||||||||||||||||||||||||||||||||||
Mponeng (2) | 1.14 | 0.235 | 0.27 | 38.75 | 0.280 | 10.83 | 97.1-97.9 | (4) | 0.167-0.239 | (4) | |||||||||||||||||||||||||||||||||||||||||||||||||||||||||||||
| Surface | |||||||||||||||||||||||||||||||||||||||||||||||||||||||||||||||||||||||
Surface sources (8) | 70.51 | 0.007 | 0.49 | 504.74 | 0.008 | 3.88 | 44.0-90.9 | (4) | 0.006-0.010 | (4) | |||||||||||||||||||||||||||||||||||||||||||||||||||||||||||||
| Australia | |||||||||||||||||||||||||||||||||||||||||||||||||||||||||||||||||||||||
Sunrise Dam (2) | 12.29 | 0.040 | 0.49 | 7.32 | 0.083 | 0.61 | 84.5-85.0 | (4) | 0.020-0.046 | (4) | |||||||||||||||||||||||||||||||||||||||||||||||||||||||||||||
Tropicana (70 percent) (2)(3) | 18.16 | 0.030 | 0.54 | 25.35 | 0.062 | 1.58 | 89.9-90.0 | (4) | 0.020-0.078 | (4) | |||||||||||||||||||||||||||||||||||||||||||||||||||||||||||||
| Americas | |||||||||||||||||||||||||||||||||||||||||||||||||||||||||||||||||||||||
| Argentina | |||||||||||||||||||||||||||||||||||||||||||||||||||||||||||||||||||||||
Cerro Vanguardia (92.5 percent)(3)(6) | 4.52 | 0.037 | 0.17 | 6.50 | 0.081 | 0.52 | 65.8-95.8 | (4) | 0.010-0.159 | (4) | |||||||||||||||||||||||||||||||||||||||||||||||||||||||||||||
| Brazil | |||||||||||||||||||||||||||||||||||||||||||||||||||||||||||||||||||||||
AGA Mineração (2) (7) | 2.48 | 0.123 | 0.31 | 10.68 | 0.136 | 1.46 | 53.0-94.3 | (4) | 0.010-0.155 | (4) | |||||||||||||||||||||||||||||||||||||||||||||||||||||||||||||
Serra Grande (2) | 1.71 | 0.083 | 0.14 | 2.81 | 0.095 | 0.27 | 92.4-95.7 | (4) | 0.027-0.052 | (4) | |||||||||||||||||||||||||||||||||||||||||||||||||||||||||||||
| Colombia | |||||||||||||||||||||||||||||||||||||||||||||||||||||||||||||||||||||||
Gramalote (51 percent) (3) | — | — | — | 70.23 | 0.025 | 1.76 | 83.9-95.0 | (4) | 0.005-0.006 | (4) | |||||||||||||||||||||||||||||||||||||||||||||||||||||||||||||
Quebradona (94.876 percent) (2)(3)(6) | — | — | — | 122.62 | 0.021 | 2.53 | 60.0 | — | |||||||||||||||||||||||||||||||||||||||||||||||||||||||||||||||
| Total | 144.87 | 0.028 | 4.10 | 983.80 | 0.040 | 39.68 | |||||||||||||||||||||||||||||||||||||||||||||||||||||||||||||||||
| Ore Reserve: Imperial | At 31 December 2019 | |||||||||||||||||||||||||||||||||||||||||||||||||||||||||||||
Proven Ore Reserve (1) (2) | Probable Ore Reserve (1) (2) | |||||||||||||||||||||||||||||||||||||||||||||||||||||||||||||
Tons(5) | Grade | Copper Content | Tons (5) | Grade | Copper Content | Metallurgical Recovery Factor | Cut-off Grade | (9) | ||||||||||||||||||||||||||||||||||||||||||||||||||||||
| (million) | percent | (Mlbs) | (million) | percent | (Mlbs) | percent | ($/t) | |||||||||||||||||||||||||||||||||||||||||||||||||||||||
| Colombia | ||||||||||||||||||||||||||||||||||||||||||||||||||||||||||||||
Quebradona (2)(6) | — | — | — | 122.62 | 1.25 | 3,068 | 95.8 | 25-45 | (12) | |||||||||||||||||||||||||||||||||||||||||||||||||||||
| Total | — | — | — | 122.62 | 1.25 | 3,068 | ||||||||||||||||||||||||||||||||||||||||||||||||||||||||
| Ore Reserve below infrastructure: Imperial | Tons (millions) | Grade (ounces/ton) | Gold Content (million ounces) | |||||||||||||||||||||||
| Mponeng | 30.67 | 0.270 | 8.17 | |||||||||||||||||||||||
| Obuasi | 3.08 | 0.560 | 1.72 | |||||||||||||||||||||||
| Sunrise Dam | 1.11 | 0.140 | 0.16 | |||||||||||||||||||||||
| Tropicana | 2.09 | 0.110 | 0.22 | |||||||||||||||||||||||
| AGA Mineração | 6.34 | 0.140 | 0.92 | |||||||||||||||||||||||
| Serra Grande | 2.18 | 0.100 | 0.22 | |||||||||||||||||||||||
| Quebradona | 122.62 | 0.020 | 2.53 | |||||||||||||||||||||||
| Total | 168.10 | 0.080 | 13.93 | |||||||||||||||||||||||
| Ore Reserve below infrastructure: Imperial | Tons (millions) | Grade (%) | Copper Content (million pounds) | |||||||||||||||||||||||
| Quebradona | 122.62 | 1.25 | 3,068 | |||||||||||||||||||||||
| Total | 122.62 | 1.25 | 3,068 | |||||||||||||||||||||||
| Ore Reserve: Metric | At 31 December 2020 | |||||||||||||||||||||||||||||||||||||||||||||||||||||||||||||||||||||||||
Proven Ore Reserve (1) (2) | Probable Ore Reserve (1) (2) | |||||||||||||||||||||||||||||||||||||||||||||||||||||||||||||||||||||||||
Tonnes(5) | Grade | Gold Content | Tonnes (5) | Grade | Gold Content | Metallurgical Recovery Factor | Cut-off Grade | (9) | ||||||||||||||||||||||||||||||||||||||||||||||||||||||||||||||||||
| (million) | (g/t) | (tonnes) | (million) | (g/t) | tonnes | percent | (g/t) | |||||||||||||||||||||||||||||||||||||||||||||||||||||||||||||||||||
| Africa | ||||||||||||||||||||||||||||||||||||||||||||||||||||||||||||||||||||||||||
| Democratic Republic of the Congo | ||||||||||||||||||||||||||||||||||||||||||||||||||||||||||||||||||||||||||
Kibali (45 percent) (3) (10) | 9.12 | 4.34 | 39.58 | 25.28 | 3.66 | 92.51 | 75.9-90.9 | (4) | 0.54-2.09 | (4) | ||||||||||||||||||||||||||||||||||||||||||||||||||||||||||||||||
| Ghana | ||||||||||||||||||||||||||||||||||||||||||||||||||||||||||||||||||||||||||
| Iduapriem | 7.67 | 1.16 | 8.93 | 38.20 | 1.32 | 50.38 | 93.0-95.9 | (4) | 0.55-0.90 | (4) | ||||||||||||||||||||||||||||||||||||||||||||||||||||||||||||||||
Obuasi (2) | — | — | — | 31.53 | 8.62 | 271.63 | 87.0 | 3.82-5.20 | (4) | |||||||||||||||||||||||||||||||||||||||||||||||||||||||||||||||||
| Guinea | ||||||||||||||||||||||||||||||||||||||||||||||||||||||||||||||||||||||||||
Siguiri (85 percent) (3) | 17.55 | 0.62 | 10.94 | 55.99 | 0.86 | 47.90 | 88.0 | 0.55-0.95 | (4) | |||||||||||||||||||||||||||||||||||||||||||||||||||||||||||||||||
| Mali | ||||||||||||||||||||||||||||||||||||||||||||||||||||||||||||||||||||||||||
Sadiola (41 percent) (3) (8) | — | — | — | — | — | — | — | — | ||||||||||||||||||||||||||||||||||||||||||||||||||||||||||||||||||
| Tanzania | ||||||||||||||||||||||||||||||||||||||||||||||||||||||||||||||||||||||||||
| Geita | — | — | — | 28.04 | 2.59 | 72.68 | 79.1-92.7 | (4) | 1.10-3.32 | (4) | ||||||||||||||||||||||||||||||||||||||||||||||||||||||||||||||||
| South Africa | ||||||||||||||||||||||||||||||||||||||||||||||||||||||||||||||||||||||||||
| West Wits | ||||||||||||||||||||||||||||||||||||||||||||||||||||||||||||||||||||||||||
Mponeng (8) | — | — | — | — | — | — | — | — | ||||||||||||||||||||||||||||||||||||||||||||||||||||||||||||||||||
| Surface | ||||||||||||||||||||||||||||||||||||||||||||||||||||||||||||||||||||||||||
Surface sources (8) | — | — | — | — | — | — | — | — | ||||||||||||||||||||||||||||||||||||||||||||||||||||||||||||||||||
| Australia | ||||||||||||||||||||||||||||||||||||||||||||||||||||||||||||||||||||||||||
Sunrise Dam (2) | 11.08 | 1.52 | 16.88 | 8.67 | 2.18 | 18.89 | 81.9-92.0 | (4) | 0.75-1.60 | (4) | ||||||||||||||||||||||||||||||||||||||||||||||||||||||||||||||||
Tropicana (70 percent) (2) (3) | 15.34 | 1.12 | 17.16 | 19.05 | 2.18 | 41.50 | 88.1-90.0 | (4) | 0.70-2.70 | (4) | ||||||||||||||||||||||||||||||||||||||||||||||||||||||||||||||||
| Americas | ||||||||||||||||||||||||||||||||||||||||||||||||||||||||||||||||||||||||||
| Argentina | ||||||||||||||||||||||||||||||||||||||||||||||||||||||||||||||||||||||||||
Cerro Vanguardia (92.5 percent) (3) (6) | 3.39 | 2.10 | 7.13 | 7.18 | 2.28 | 16.34 | 66.9-95.2 | (4) | 0.27-6.76 | (4) | ||||||||||||||||||||||||||||||||||||||||||||||||||||||||||||||||
| Brazil | ||||||||||||||||||||||||||||||||||||||||||||||||||||||||||||||||||||||||||
AGA Mineraçáo (2) (7) | 3.13 | 3.69 | 11.58 | 10.92 | 3.88 | 42.35 | 49.7-94.3 | (4) | 0.29-4.29 | (4) | ||||||||||||||||||||||||||||||||||||||||||||||||||||||||||||||||
Serra Grande (2) | 2.71 | 2.75 | 7.45 | 4.29 | 2.81 | 12.04 | 89.5-96.4 | (4) | 0.54-1.46 | (4) | ||||||||||||||||||||||||||||||||||||||||||||||||||||||||||||||||
| Colombia | ||||||||||||||||||||||||||||||||||||||||||||||||||||||||||||||||||||||||||
Gramalote (50 percent) (3) | — | — | — | 62.46 | 0.86 | 53.60 | 83.9-95.0 | (4) | 0.16-0.22 | (4) | ||||||||||||||||||||||||||||||||||||||||||||||||||||||||||||||||
Quebradona (2) (6) | — | — | — | 112.72 | 0.69 | 77.31 | 58.6 | — | ||||||||||||||||||||||||||||||||||||||||||||||||||||||||||||||||||
| Total | 69.99 | 1.71 | 119.65 | 404.33 | 1.97 | 797.13 | ||||||||||||||||||||||||||||||||||||||||||||||||||||||||||||||||||||
| Ore Reserve: Metric | At 31 December 2020 | |||||||||||||||||||||||||||||||||||||||||||||||||||||||||||||
Proven Ore Reserve (1) (2) | Probable Ore Reserve (1) (2) | |||||||||||||||||||||||||||||||||||||||||||||||||||||||||||||
Tonnes(5) | Grade | Copper Content | Tonnes (5) | Grade | Copper Content | Metallurgical Recovery Factor | Cut-off Grade | (9) | ||||||||||||||||||||||||||||||||||||||||||||||||||||||
| (million) | percent | (tonnes million) | (million) | percent | (tonnes million) | percent | ($/t) | |||||||||||||||||||||||||||||||||||||||||||||||||||||||
| Colombia | ||||||||||||||||||||||||||||||||||||||||||||||||||||||||||||||
Quebradona (2)(6) | — | — | — | 112.72 | 1.25 | 1.41 | 93.6 | 30 | (11) | |||||||||||||||||||||||||||||||||||||||||||||||||||||
| Total | — | — | — | 112.72 | 1.25 | 1.41 | ||||||||||||||||||||||||||||||||||||||||||||||||||||||||
| Ore Reserve below infrastructure: Metric | Tons (millions) | Grade (grams/tonne) | Gold Content (tonnes) | ||||||||||||||||||||||||||||||||
| Obuasi | 2.71 | 19.87 | 53.76 | ||||||||||||||||||||||||||||||||
| Sunrise Dam | 1.02 | 3.17 | 3.24 | ||||||||||||||||||||||||||||||||
| Tropicana | 0.80 | 3.59 | 2.86 | ||||||||||||||||||||||||||||||||
| AGA Mineração | 4.94 | 4.94 | 24.41 | ||||||||||||||||||||||||||||||||
| Serra Grande | 4.91 | 2.80 | 13.75 | ||||||||||||||||||||||||||||||||
| Quebradona | 112.72 | 0.69 | 77.31 | ||||||||||||||||||||||||||||||||
| Total | 127.10 | 1.38 | 175.33 | ||||||||||||||||||||||||||||||||
| Ore Reserve below infrastructure: Metric | Tons (millions) | Grade (%) | Copper Content (million tonnes) | |||||||||||||||||||||||||||||
| Quebradona | 112.72 | 1.25 | 1.41 | |||||||||||||||||||||||||||||
| Total | 112.72 | 1.25 | 1.41 | |||||||||||||||||||||||||||||
| Ore Reserve: Metric | At 31 December 2019 | |||||||||||||||||||||||||||||||||||||||||||||||||||||||||||||||||||||||||
Proven Ore Reserve (1) (2) | Probable Ore Reserve (1) (2) | Metallurgical | Cut-off | |||||||||||||||||||||||||||||||||||||||||||||||||||||||||||||||||||||||
Tonnes(5) | Grade | Gold Content | Tonnes (5) | Grade | Gold Content | Recovery Factor | Grade | (9) | ||||||||||||||||||||||||||||||||||||||||||||||||||||||||||||||||||
| (million) | (g/t) | (tonnes) | (million) | (g/t) | tonnes | percent | (g/t) | |||||||||||||||||||||||||||||||||||||||||||||||||||||||||||||||||||
| Africa | ||||||||||||||||||||||||||||||||||||||||||||||||||||||||||||||||||||||||||
| Democratic Republic of the Congo | ||||||||||||||||||||||||||||||||||||||||||||||||||||||||||||||||||||||||||
Kibali (45 percent) (3) (10) | 9.29 | 4.13 | 38.36 | 21.52 | 4.23 | 90.99 | 84.5-89.8 | (4) | 1.50-2.40 | (4) | ||||||||||||||||||||||||||||||||||||||||||||||||||||||||||||||||
| Ghana | ||||||||||||||||||||||||||||||||||||||||||||||||||||||||||||||||||||||||||
| Iduapriem | 3.40 | 0.84 | 2.85 | 38.88 | 1.36 | 53.05 | 93.0-95.9 | (4) | 0.85-0.95 | (4) | ||||||||||||||||||||||||||||||||||||||||||||||||||||||||||||||||
Obuasi (2) | — | — | — | 24.26 | 9.13 | 221.47 | 87.0 | 4.10-5.20 | (4) | |||||||||||||||||||||||||||||||||||||||||||||||||||||||||||||||||
| Guinea | ||||||||||||||||||||||||||||||||||||||||||||||||||||||||||||||||||||||||||
Siguiri (85 percent) (3) | 18.20 | 0.63 | 11.55 | 54.12 | 0.80 | 43.27 | 88.0-93.0 | (4) | 0.50-0.75 | (4) | ||||||||||||||||||||||||||||||||||||||||||||||||||||||||||||||||
| Mali | ||||||||||||||||||||||||||||||||||||||||||||||||||||||||||||||||||||||||||
Morila (40 percent) (3) (10) (11) | — | — | — | — | — | — | ||||||||||||||||||||||||||||||||||||||||||||||||||||||||||||||||||||
Sadiola (41 percent) (3) | — | — | — | 24.50 | 2.01 | 49.23 | 75.0-94.0 | (4) | 0.51-0.78 | (4) | ||||||||||||||||||||||||||||||||||||||||||||||||||||||||||||||||
| Tanzania | ||||||||||||||||||||||||||||||||||||||||||||||||||||||||||||||||||||||||||
| Geita | — | — | — | 13.44 | 3.50 | 47.03 | 77.8-92.7 | (4) | 1.25-3.95 | (4) | ||||||||||||||||||||||||||||||||||||||||||||||||||||||||||||||||
| South Africa | ||||||||||||||||||||||||||||||||||||||||||||||||||||||||||||||||||||||||||
| West Wits | ||||||||||||||||||||||||||||||||||||||||||||||||||||||||||||||||||||||||||
Mponeng (2) | 1.03 | 8.05 | 8.31 | 35.16 | 9.59 | 337.00 | 97.1-97.9 | (4) | 5.72-8.18 | (4) | ||||||||||||||||||||||||||||||||||||||||||||||||||||||||||||||||
| Surface | ||||||||||||||||||||||||||||||||||||||||||||||||||||||||||||||||||||||||||
Surface sources (8) | 63.97 | 0.24 | 15.18 | 457.89 | 0.26 | 120.83 | 44.0-90.9 | (4) | 0.20-0.34 | (4) | ||||||||||||||||||||||||||||||||||||||||||||||||||||||||||||||||
| Australia | ||||||||||||||||||||||||||||||||||||||||||||||||||||||||||||||||||||||||||
Sunrise Dam (2) | 11.15 | 1.38 | 15.39 | 6.64 | 2.84 | 18.88 | 84.5-85.0 | (4) | 0.70-1.56 | (4) | ||||||||||||||||||||||||||||||||||||||||||||||||||||||||||||||||
Tropicana (70 percent) (2) (3) | 16.48 | 1.02 | 16.89 | 22.99 | 2.13 | 49.07 | 89.9-90.0 | (4) | 0.70-2.69 | (4) | ||||||||||||||||||||||||||||||||||||||||||||||||||||||||||||||||
| Americas | ||||||||||||||||||||||||||||||||||||||||||||||||||||||||||||||||||||||||||
| Argentina | ||||||||||||||||||||||||||||||||||||||||||||||||||||||||||||||||||||||||||
Cerro Vanguardia (92.5 percent) (3) (6) | 4.10 | 1.26 | 5.17 | 5.90 | 2.77 | 16.33 | 65.8-95.8 | (4) | 0.33-5.46 | (4) | ||||||||||||||||||||||||||||||||||||||||||||||||||||||||||||||||
| Brazil | ||||||||||||||||||||||||||||||||||||||||||||||||||||||||||||||||||||||||||
AGA Mineraçáo (2) (7) | 2.25 | 4.23 | 9.50 | 9.69 | 4.68 | 45.33 | 53.0-94.3 | (4) | 0.33-5.31 | (4) | ||||||||||||||||||||||||||||||||||||||||||||||||||||||||||||||||
Serra Grande (2) | 1.55 | 2.83 | 4.40 | 2.55 | 3.27 | 8.32 | 92.4-95.7 | (4) | 0.92-1.77 | (4) | ||||||||||||||||||||||||||||||||||||||||||||||||||||||||||||||||
| Colombia | ||||||||||||||||||||||||||||||||||||||||||||||||||||||||||||||||||||||||||
Gramalote (51 percent) (3) | — | — | — | 63.71 | 0.86 | 54.67 | 83.9-95.0 | (4) | 0.16-0.22 | (4) | ||||||||||||||||||||||||||||||||||||||||||||||||||||||||||||||||
Quebradona (2) (6) | — | — | — | 111.24 | 0.71 | 78.60 | 60.0 | — | ||||||||||||||||||||||||||||||||||||||||||||||||||||||||||||||||||
| Total | 131.42 | 0.97 | 127.60 | 892.49 | 1.38 | 1,234.08 | ||||||||||||||||||||||||||||||||||||||||||||||||||||||||||||||||||||
| Ore Reserve: Metric | At 31 December 2019 | |||||||||||||||||||||||||||||||||||||||||||||||||||||||||||||
Proven Ore Reserve (1) (2) | Probable Ore Reserve (1) (2) | Cut-off | ||||||||||||||||||||||||||||||||||||||||||||||||||||||||||||
Tonnes(5) | Grade | Copper Content | Tonnes (5) | Grade | Copper Content | Recovery Factor | Grade | (9) | ||||||||||||||||||||||||||||||||||||||||||||||||||||||
| (million) | percent | (tonnes million) | (million) | percent | (tonnes million) | percent | ($/t) | |||||||||||||||||||||||||||||||||||||||||||||||||||||||
| Colombia | ||||||||||||||||||||||||||||||||||||||||||||||||||||||||||||||
Quebradona (2) (6) | — | — | — | 111.24 | 1.25 | 1.39 | 95.80 | 25-45 | (12) | |||||||||||||||||||||||||||||||||||||||||||||||||||||
| Total | — | — | — | 111.24 | 1.25 | 1.39 | ||||||||||||||||||||||||||||||||||||||||||||||||||||||||
Refer to the "Glossary of selected terms—Mining terms" for terminology and definitions used in Mineral Resource and Mineral Reserve reporting under Regulation S-K 1300. In addition, the Mineral Resource exclusive of Mineral Reserve (“Exclusive Mineral Resource”) is defined as the Inclusive Mineral Resource less the Mineral Reserve before dilution and other factors are applied. The 2019 Proven and Probable Ore Reserve includes Ore Reserve below infrastructure in the caseExclusive Mineral Resource consists of the following underground mines currentlycomponents:
•Inferred Mineral Resource, including that within the Mineral Reserve design or stope shape;
•Mineral Resource that sits above the Mineral Resource cut-off grade but below the Mineral Reserve cut-off grade that resides within the defined Mineral Reserve volume;
•Mineral Resource that lies between the life of mine (“LOM”) pit shell or mine design and the Mineral Resource pit shell/mine design (this material will become economic if the gold price increases); and
•Mineral Resource in production:which the technical studies to engineer a Mineral Reserve have not yet been completed.
| Ore Reserve below infrastructure: Metric | Tons (millions) | Grade (grams/tonne) | Gold Content (tonnes) | ||||||||||||||||||||||||||||||||
| Mponeng | 27.83 | 9.13 | 254.02 | ||||||||||||||||||||||||||||||||
| Obuasi | 2.80 | 19.14 | 53.54 | ||||||||||||||||||||||||||||||||
| Sunrise Dam | 1.01 | 4.92 | 4.97 | ||||||||||||||||||||||||||||||||
| Tropicana | 1.89 | 3.60 | 6.82 | ||||||||||||||||||||||||||||||||
| AGA Mineração | 5.75 | 4.96 | 28.49 | ||||||||||||||||||||||||||||||||
| Serra Grande | 1.98 | 3.40 | 6.73 | ||||||||||||||||||||||||||||||||
| Quebradona | 111.24 | 0.71 | 78.60 | ||||||||||||||||||||||||||||||||
| Total | 152.50 | 2.84 | 433.17 | ||||||||||||||||||||||||||||||||
| Ore Reserve below infrastructure: Metric | Tons (millions) | Grade (%) | Copper Content (million tonnes) | |||||||||||||||||||||||||||||
| Quebradona | 111.24 | 1.25 | 1.39 | |||||||||||||||||||||||||||||
| Total | 111.24 | 1.25 | 1.39 | |||||||||||||||||||||||||||||
The Ore Reservegeological models are based on combinations of core and/or chip logging, mapping, geophysics, geochemistry and geological understanding and have been developed for each deposit. Most of our deposits have been the subject of research by third-party specialists in the relevant class of gold deposit.
The grade estimation for each deposit has been determined baseddeveloped over the life of the mine, and is constantly reviewed in terms of grade control information and reconciliation with the metallurgical plant. In general, the open pits and shallow underground mines use kriging with post processing by Uniform Conditioning (“UC”) or Localised Uniform Conditioning (“LUC”) to generate a recoverable Mineral Resource model where appropriate.
In order to comply with the economic requirement of the definition of Mineral Resource, all our Mineral Resource is constrained at an upside gold price, with all other parameters being kept the same as used for estimation of the Mineral Reserve. In the underground gold mines, scoping studies are conducted on all coherent blocks of ground that lie above the calculated Mineral Resource cut-off grade. These studies include all cost and capital requirements to access the block. In the case of open pit operations, pit optimisations are conducted at the Mineral Resource gold price and all material outside these shells is excluded from the Mineral Resource unless it is potentially mineable from underground.
It is the opinion of AngloGold Ashanti that the Mineral Resource represents a realistic view of an upside potential to the Mineral Reserve. In interpreting the Mineral Resource it is critical to factor in the following:
•That there is a reasonable expectation of economic extraction;
•The Mineral Resource is quoted in situ and has not been corrected for dilution, mining losses or recovery; and
•Many of the areas lying in the Exclusive Mineral Resource are currently being actively drilled and are the subject of economic and technical studies. It can, however, not be assumed at this stage that the Company has intent to mine these areas.
The Inferred Mineral Resource category is intended to cover situations in which a mineral concentration or occurrence has been identified and limited measurements and sampling have been completed, but in which the data are insufficient to allow the geological or grade continuity to be interpreted with confidence. While it would be reasonable to expect that the majority of Inferred Mineral Resource would upgrade to Indicated Mineral Resource with continued exploration, due to the uncertainty of Inferred Mineral Resource, it should not be assumed that such upgrading will always occur.
In order to reduce this risk, AngloGold Ashanti limits the use of Inferred Mineral Resource in its Mineral Reserve estimation process but the Inferred Mineral Resource is included in the pit shell or underground extraction shape determination. As such the Inferred Mineral Resource may influence the extraction shape. The quoted Mineral Reserve from these volumes includes only the converted Measured and Indicated Mineral Resource and no Inferred Mineral Resource is converted to Mineral Reserve. The cash flow analysis does not include the Inferred Mineral Resource in demonstrating the economic studies.viability of the Mineral Reserve.
AngloGold Ashanti requires that the Mineral Reserve that is an outcome of this process is generated at a minimum of apre-feasibility study level.
140
MINERAL RESOURCE AND MINERAL RESERVE INTERNAL CONTROLS DISCLOSURE
AngloGold Ashanti has a tiered internal review process whereby newly issued Mineral Resource and Mineral Reserve are reviewed at a regional level prior to publication. Selected corporate reviews happen after that process. Each property has an external Mineral Resource and Mineral Reserve audit on a three-year rolling basis, and issues raised in these audits are addressed by a formal audit reply from each mine on which the progress is tracked.
AngloGold Ashanti’s Mineral Reserve is an outcome of the Company’s business planning process which runs annually. This process operates within a comprehensive framework where all inputs, including costs and capital requirements, are generated by the operation, and reviewed at a regional and corporate level within the Company, thereby providing confidence in the estimates.
A group wide Mineral Resource to production reconciliation system is also in place whereby the Mineral Resource mined each month is reconciled all the way to the produced gold doré. Oversight for this process is handled at the group level. A comprehensive sample and assay QC/QA process is in place, and our laboratories are inspected frequently by on-site teams.
| Ore Reserve: Imperial | At 31 December 2020 | |||||||||||||||||||||||||
| Stockpiles | Tons (million) | Grade (ounces/ton) | Gold content (million ounces) | |||||||||||||||||||||||
| Africa | ||||||||||||||||||||||||||
| Democratic Republic of the Congo | ||||||||||||||||||||||||||
Kibali (45 percent) (1) | 0.72 | 0.044 | 0.03 | |||||||||||||||||||||||
| Ghana | ||||||||||||||||||||||||||
| Iduapriem | 17.54 | 0.022 | 0.38 | |||||||||||||||||||||||
| Guinea | ||||||||||||||||||||||||||
Siguiri (85 percent) (1) (2) | 54.57 | 0.017 | 0.91 | |||||||||||||||||||||||
| Tanzania | ||||||||||||||||||||||||||
| Geita | 8.94 | 0.046 | 0.41 | |||||||||||||||||||||||
| Australia | ||||||||||||||||||||||||||
| Sunrise Dam | 8.05 | 0.027 | 0.22 | |||||||||||||||||||||||
Tropicana (70 percent) (1) | 13.89 | 0.025 | 0.35 | |||||||||||||||||||||||
| Americas | ||||||||||||||||||||||||||
| Argentina | ||||||||||||||||||||||||||
Cerro Vanguardia (92.5 percent) (1) | 7.00 | 0.012 | 0.08 | |||||||||||||||||||||||
| Ore Reserve: Imperial | At 31 December 2019 | |||||||||||||||||||||||||
| Stockpiles | Tons (million) | Grade (ounces/ ton) | Gold content (million ounces) | |||||||||||||||||||||||
| Africa | ||||||||||||||||||||||||||
| Democratic Republic of the Congo | ||||||||||||||||||||||||||
Kibali (45 percent) (1) | 1.09 | 0.050 | 0.05 | |||||||||||||||||||||||
| Ghana | ||||||||||||||||||||||||||
| Iduapriem | 16.41 | 0.021 | 0.35 | |||||||||||||||||||||||
| Guinea | ||||||||||||||||||||||||||
Siguiri (85 percent) (1) (3) | 55.29 | 0.017 | 0.93 | |||||||||||||||||||||||
| Mali | ||||||||||||||||||||||||||
Sadiola (41 percent) (1) | 1.46 | 0.068 | 0.10 | |||||||||||||||||||||||
| Tanzania | ||||||||||||||||||||||||||
| Geita | 4.50 | 0.046 | 0.20 | |||||||||||||||||||||||
| South Africa | ||||||||||||||||||||||||||
Surface sources (2) | 575.26 | 0.008 | 4.37 | |||||||||||||||||||||||
| Australia | ||||||||||||||||||||||||||
| Sunrise Dam | 9.40 | 0.028 | 0.26 | |||||||||||||||||||||||
Tropicana (70 percent) (1) | 16.97 | 0.028 | 0.47 | |||||||||||||||||||||||
| Americas | ||||||||||||||||||||||||||
| Argentina | ||||||||||||||||||||||||||
Cerro Vanguardia (92.5 percent) (1) | 6.58 | 0.013 | 0.08 | |||||||||||||||||||||||
| Brazil | ||||||||||||||||||||||||||
| Serra Grande | 0.01 | 0.058 | 0.00 | |||||||||||||||||||||||
| Ore Reserve: Metric | At 31 December 2020 | |||||||||||||||||||||||||
| Stockpiles | Tonnes (million) | Grade (grams/ tonne) | Gold content (tonnes) | |||||||||||||||||||||||
| Africa | ||||||||||||||||||||||||||
| Democratic Republic of the Congo | ||||||||||||||||||||||||||
Kibali (45 percent) (1) | 0.65 | 1.50 | 0.98 | |||||||||||||||||||||||
| Ghana | ||||||||||||||||||||||||||
| Iduapriem | 15.91 | 0.75 | 11.96 | |||||||||||||||||||||||
| Guinea | ||||||||||||||||||||||||||
Siguiri (85 percent) (1) (2) | 49.50 | 0.57 | 28.24 | |||||||||||||||||||||||
| Tanzania | ||||||||||||||||||||||||||
| Geita | 8.11 | 1.57 | 12.76 | |||||||||||||||||||||||
| Australia | ||||||||||||||||||||||||||
| Sunrise Dam | 7.31 | 0.93 | 6.81 | |||||||||||||||||||||||
Tropicana (70 percent) (1) | 12.60 | 0.87 | 11.01 | |||||||||||||||||||||||
| Americas | ||||||||||||||||||||||||||
| Argentina | ||||||||||||||||||||||||||
Cerro Vanguardia (92.5 percent) (1) | 6.35 | 0.41 | 2.61 | |||||||||||||||||||||||
| Ore Reserve: Metric | At 31 December 2019 | |||||||||||||||||||||||||
| Stockpiles | Tonnes (million) | Grade (grams /tonne) | Gold content (tonnes) | |||||||||||||||||||||||
| Africa | ||||||||||||||||||||||||||
| Democratic Republic of the Congo | ||||||||||||||||||||||||||
Kibali (45 percent) (1) | 0.99 | 1.72 | 1.70 | |||||||||||||||||||||||
| Ghana | ||||||||||||||||||||||||||
| Iduapriem | 14.89 | 0.73 | 10.90 | |||||||||||||||||||||||
| Guinea | ||||||||||||||||||||||||||
Siguiri (85 percent) (1) (3) | 50.16 | 0.58 | 28.84 | |||||||||||||||||||||||
| Mali | ||||||||||||||||||||||||||
Sadiola (41 percent) (1) | 1.32 | 2.31 | 3.07 | |||||||||||||||||||||||
| Tanzania | ||||||||||||||||||||||||||
| Geita | 4.08 | 1.56 | 6.37 | |||||||||||||||||||||||
| South Africa | ||||||||||||||||||||||||||
Surface sources (2) | 521.86 | 0.26 | 136.01 | |||||||||||||||||||||||
| Australia | ||||||||||||||||||||||||||
| Sunrise Dam | 8.53 | 0.94 | 8.05 | |||||||||||||||||||||||
Tropicana (70 percent) (1) | 15.40 | 0.94 | 14.52 | |||||||||||||||||||||||
| Americas | ||||||||||||||||||||||||||
| Argentina | ||||||||||||||||||||||||||
Cerro Vanguardia (92.5 percent) (1) | 5.97 | 0.44 | 2.64 | |||||||||||||||||||||||
| Brazil | ||||||||||||||||||||||||||
| Serra Grande | 0.01 | 2.00 | 0.02 | |||||||||||||||||||||||
ITEM 4A: UNRESOLVED STAFF COMMENTS
Not applicable.
142
ITEM 5: OPERATING AND FINANCIAL REVIEW AND PROSPECTS
The following discussion provides information that management believes is relevant to an assessment and understanding of the consolidated financial condition and results of operations of AngloGold Ashanti Limited under IFRS for the three years ended and as at 31 December 2020, 20192022, 2021 and 2018.2020. The discussion of operating and financial results in this “Item 5: Operating and Financial Review and Prospects” relates to the company’sCompany’s continuing operations (unless the context indicates otherwise).
This item should be read in conjunction with the company’sCompany’s consolidated financial statements and the notes thereto which are included under Item 18 of this annual report.
Overview
AngloGold Ashanti is a global gold mining company headquartered in Johannesburg, South Africa. AngloGold Ashanti’s main product is gold. As part of extracting gold the companyCompany also produces silver and sulphuric acid as by-products. The company no longer produces uranium oxide as a by-product following the sale of its Vaal River operations, effective 28 February 2018. By-product revenue from continuing operations amounted to $105$113 million in 2020 (2019: $862022 (2021: $126 million; 2018: $1332020: $105 million) out of total revenue from product sales from continuing operations of $4,427$4,501 million in 2020 (2019: $3,5252022 (2021: $4,029 million; 2018: $3,3362020: $4,595 million). See “Item“Item 18: Financial Statements—Note 3—Revenue from product sales” for additional information. The companyCompany sells its products on world markets.
AngloGold Ashanti has ten continuing mining operations in the following regions: Africa (the Democratic Republic of the Congo (“DRC”), Ghana, Guinea, and Tanzania), Australia and the Americas (Argentina and Brazil) comprising open-pit and underground mines, which are supported by extensive, yet focusedglobal exploration activities. In addition, AngloGold Ashanti has three greenfields projects located in Colombia and exploration activitiesNevada, USA. Until 30 September 2020, AngloGold Ashanti also conducted gold-mining operations in South Africa. On 1 October 2020, Harmony Gold Mining Company Limited (“Harmony”) took effective control of the Company’s remaining South African producing assets and related liabilities, which were recorded as discontinued operations for the year ended and as at 31 December 2020. In addition, AngloGold Ashanti sold its interests in the United States.Morila and Sadiola gold mines in Mali in November and December 2020, respectively. None of our Malian assets were recorded as discontinued operations. For more information on the company’sCompany’s business and operations, see “Item“Item 4B: Business Overview”.
Under the new Operating Model, the manner in which the financial results are reported to the chief operating decision maker and the composition of the operating segments continue to be reported per geographical region (Africa, Australia and the Americas). In addition, a new segment, Projects has been introduced from the implementation of the new Operating Model (previously reported under the Americas segment). The Projects segment comprises all the major non-sustaining capital projects with the potential to be developed into operating entities. The comparative information of the affected operating segment information has been restated. AngloGold Ashanti’s segmental information is described in “Item 18: Financial Statements—Note 2—Segmental Information”.
As at 31 December 2020,2022, the companyCompany reported, on an attributable basis, Proven and Probable OreMineral Reserve for gold of approximately 25.224.25 million ounces in subsidiaries and 4.24.57 million ounces in equity accountedequity-accounted joint ventures. For the year ended 31 December 2020,2022, AngloGold Ashanti reported an attributable gold production of approximately 2.442.41 million ounces from subsidiaries 0.36and 0.34 million ounces from equity accountedequity-accounted joint ventures and 0.24 million ounces from discontinued operations.ventures. As at 31 December 2020,2022, the companyCompany reported an attributable Proven and Probable OreMineral Reserve for copper of 3,105Mlbs.3,250 million pounds. As at 31 December 2022, the Company reported, on an attributable basis, Measured and Indicated Mineral Resource (exclusive of Mineral Reserve(1)) for gold of approximately 57.94 million ounces in subsidiaries and 2.62 million ounces in equity-accounted joint ventures. As at 31 December 2022, the Company reported, on an attributable basis, Inferred Mineral Resource (exclusive of Mineral Reserve(1)) for gold of approximately 39.66 million ounces in subsidiaries and 1.11 million ounces in equity-accounted ventures. As at 31 December 2022, the Company reported an attributable Measured and Indicated Mineral Resource (exclusive of Mineral Reserve(1)) for copper of 2,902 million pounds and Inferred Mineral Resource (exclusive of Mineral Reserve(1)) for copper of 3,231 million pounds. For further information on the Company’s Mineral Resource and Mineral Reserve, see “Item 4D: Property, Plants and Equipment—Mineral Resource and Mineral Reserve Summary Disclosure”.
AngloGold Ashanti’s costs and expenses consist primarily of total cash costs, amortisation, corporate administration, other expenses, and exploration and evaluation costs. Total cash costs include cash operating costs (which include salaries and wages, stores, explosives, timber, reagents, logistics, fuel, power, water and contractors’ costs), royalties and other cash costs. The company’sCompany’s mining operations consist of deep-level underground mines as well as open-pit operations, both of which are labour intensive, therefore salaries and wages are a significant component of total cash costs.
(1) The Mineral Resource exclusive of Mineral Reserve (“Exclusive Mineral Resource”) is defined as the Inclusive Mineral Resource less the Mineral Reserve before dilution and other factors are applied.
143
5A: OPERATING RESULTS
Introduction
The year 2020 was markedUS real gross domestic product rose by a number2.1 percent in 2022, compared with an increase of developments that were historically unprecedented. With respect to5.9 percent in 2021. While many components expanded in the COVID-19 pandemic, there was the speed at which the pandemic escalated globally, the extentlast quarter of 2022, they also showed softening, and severity of related lockdowns in certain countries, and the size of the government stimulus measures globally. At the same time, global equity markets have gained 14 percent over the course of 2020. The year also demonstrated the incredible resilience of people, institutions, and financial markets. Followingexpectations remain for the US elections and the ongoing roll-out of vaccines, investors have become increasingly bullish, pushing the global equity marketseconomy to record highs.slip into a recession in 2023.
Stock markets rounded off a tumultuous year with gains in the fourth quarter of 2022. Asian shares were boosted by China’s relaxation of its zero-Covid policy, and European equities also advanced strongly. As prices fell, government bond yields edged up towards the pandemic unfoldedend of the fourth quarter of 2022. This reflected some market disappointment with major central banks reiterating plans to tighten monetary policy, even as inflation showed signs of peaking. Commodities gained in the fourth quarter of 2022, led by industrial metals.
The year 2022 was the strongest year for gold demand in over a decade and showed how gold’s diverse sources of demand and supply can counterbalance one another, providing gold with its uniquely stable performance as an investment asset. Annual gold demand increased by 18 percent to 4,741 tonnes with investment demand increasing by ten percent and reaching 1,107 tonnes. Demand for gold bars and coins increased by two percent to 1,217 tonnes. The need for wealth protection in the global inflationary environment remained a primary motive for gold investment purchases. Holdings of gold ETFs fell by a smaller amount (down 110 tonnes) than in 2021 (down 189 tonnes).
Central bank net purchases in the fourth quarter of 2022 totalled 417 tonnes increasing full year net purchases to a high of 1,136 tonnes. Geopolitical uncertainty and high inflation were highlighted as key reasons for holding gold by central banks.
Gold jewellery demand softened slightly in 2022 with total annual demand declining by three percent to 2,086 tonnes. Declines in Chinese demand for gold jewellery throughout 2022 had an outsized impact on the world total.
Worsening global economic conditions in the fourth quarter of 2022, together with trade restrictions and supply chain issues generated a seven percent decline in annual demand for gold in technology. Electronics demand mirrored the seven percent annual decline in the broader sector, dropping sharply in the fourth quarter of 2022 in response to the deteriorating global economic picture and supply chain challenges, particularly in China.
Annual mine production increased investors’ risk averseness navigated them towards gold. This influx intoone percent year-on-year although this remains below the record high seen in 2018. Full year recycled gold market drovesupply increased by one percent but remains 30 percent below the market spotall-time high seen in 2012, despite a record annual average gold price up 25in 2022. In the aggregate, total supply of gold increased by two percent year-on-year from approximately $1,517/oz (at 1 January 2020) to approximately $1,896/oz (at 31 December 2020). As a result, market spot gold price volatility skyrocketed, recordingyear-on-year.
For the variance between2022 year, the highest ($2,064/oz) and lowest ($1,469/oz) market spot gold prices during 2020 at 40 percent. 2020 also included a new all-time high for the market spot gold price. The average market spot gold price was recorded at $1,772$1,802 per ounce, for the full year 2020.
over 2022, starting on 1 January 2022 at approximately $1,801 per ounce and ending on 30 December 2022 at approximately $1,824 per ounce. Management uses the market spot gold price and the average gold price received to monitor the performance of the gold price and its effect on the company’sCompany’s results. It gives an investor insight into the performance of the gold price and its impact on company results.
Key factors affecting results
Gold prices
AngloGold Ashanti’s operating results are directly related to the market spot gold price, which can fluctuate widely and is affected by numerous factors beyond its control, including investment, jewellery and industrial demand (particularly in China and India), expectations with respect to the rate of inflation, the strength of the US dollar (the currency in which the price of gold is generally quoted) and of other currencies, interest rates, actual or expected gold sales and purchases by central banks and the International Monetary Fund (IMF)("IMF"), global or regional political or economic events or conditions (such as the war between Russia and Ukraine), production and cost levels in major gold-producing regions and, to a lesser extent during 2022, the impact of global health crises and pandemics such(such as the COVID-19 and production and cost levels in major gold-producing regions.pandemic).
The current demand for and supply of gold may affect gold prices, but not necessarily in the same manner as current supply and demand affects the prices of other commodities. The supply of gold consists of a combination of new production and fabricated gold held by governments, public and private financial institutions, industrial organisations and private individuals. As the global gold production in any single year constitutes a small portion of the total potential supply of gold, short-term variations in current production do not necessarily have a significant impact on the supply of gold or on its price.
The market for gold bullion bar, the company’sCompany’s primary product, is generally limited to the bullion banks. The number of these banks has declined over the last decade. Additionally, due to the diversity and depth of the total gold market, the bullion banks do not possess significant pricing power.
The price of gold is often subject to sharp, short-term changes. The shift in gold demand from physical demand to investment and speculative demand may exacerbate the volatility of gold prices.
Yearly average market spot gold prices received per ounce have changed during the three years under review as follows:
•20182020 - $1,266$1,772 per ounce
•20192021 - $1,394$1,798 per ounce
•2022 - $1,802 per ounce
Gold income of the Company has changed during the three years under review as follows:
•2020 - $4,490 million
•2021 - $3,903 million
•2022 - $4,388 million
Yearly average gold prices received by the Company have changed during the three years under review as follows:
•2020 - $1,778 per ounce
•2021 - $1,796 per ounce
•2022 - $1,793 per ounce
Gold income of the Company increased by $485 million, or 12 percent, from $3,903 million in 2021 to $4,388 million in 2022. The average gold price received by the Company decreased by $3 per ounce, increased by $384 per ounce, or 28 percent, from $1,394$1,796 per ounce for the year ended 31 December 20192021 to $1,778$1,793 per ounce for the year ended 31 December 2020.2022. The average market spot gold price increased by $378$4 per ounce, or 27 percent, from $1,394$1,798 per ounce for the year ended 31 December 20192021 to $1,772$1,802 per ounce for the year ended 31 December 2020.2022.
The market spot gold price has been highly volatile in 2020. After an initial increase in the beginning ofopened the year the market spot gold price decreased from a high of $1,687on 1 January 2022 at $1,801 per ounce (compared to $1,905 per ounce on 6 March 2020 to a low of $1,470 per ounce on 19 March 2020 in the midst of a wider market dislocation related to the COVID-19 pandemic prompting the US Federal Reserve to cut interest rates to zero and announce significant economic stimuli. During the following three months the market spot gold price increased 22 percent to $1,781 per ounce by 30 June 2020.4 January 2021). The market spot gold price continuedin 2022 has been subject to rise and recordedvolatile short-term swings, with a year high of $2,064$2,052 per ounce on 6 August 2020 before stabilising at around $1,9008 March 2022 and a year low of $1,622 per ounce on 26 September 2022. The average market spot gold price for 2022 was $1,802 per ounce. The market spot gold price at closing on 30 December 2022 was $1,824 per ounce (compared to $1,828 per ounce on 31 December 2020 was $1,896 per ounce compared to $1,517 per ounce the prior year.2021). Between 1 January 20212023 and 1910 March 2021,2023, the market spot gold price traded between a low of $1,681.24$1,811 per ounce and a high of $1,949.35$1,950 per ounce. On 1910 March 2021,2023, the afternoonmarket spot gold price for gold on the London Bullion Market was $1,744.74$1,868 per ounce.
If income from gold sales falls for an extended period below the company’sCompany’s total cash costs at its operations, AngloGold Ashanti could determine that it is not economically feasible to continue production at some or all of its operations. Declining gold prices may also force a reassessment of the feasibility of a particular exploration or development project or projects, and could lead to the curtailment or suspension of such projects. A sustained decrease in gold prices may force the companyCompany to change its dividend payment policies, reduce expenditures and undertake measures to address its cost base. In addition, the
145
use of lower gold prices in OreMineral Reserve estimates and life-of-mine plans could result in material write-downswrite downs of the company’sCompany’s investment in mining properties and increase amortisation, environmental rehabilitation and mine closure charges.
Production levels
In addition to gold prices, AngloGold Ashanti’s gold income in any year is also influenced by its level of gold production. Production levels are in turn influenced by grades, tonnages mined and processed through the plant, and metallurgical recoveries. Attributable gold production (including joint ventures) remained fairly consistentfluctuated between 2018 - 2020 to 2022, from 2.91 million ounces in 2018, 2.86 million ounces in 2019 to 2.81 million ounces in 2020.2020 to 2.47 million ounces in 2021 to 2.74 million ounces in 2022. For more information on the company’sCompany’s business and operations, see “Item“Item 4B: Business Overview”.
Operational impacts resulting from the COVID-19 pandemic
The direct impact on the Company’s production from COVID-19 for 2022 was estimated at 19,000 ounces, a decrease of 28,000 ounces, or 60 percent, compared with an estimated production impact of 47,000 ounces for 2021. The direct COVID-19 impact on the Company’s cost of sales was estimated at $6 million for 2022, a decrease of $8 million, or 57 percent, compared to $14 million for 2021. The direct impact from COVID-19 on the Company’s AISC was estimated at $12 per ounce, a decrease of $22 per ounce, or 65 percent, compared with an estimated $34 per ounce for 2021.
The Company remains mindful of the extent to which the COVID-19 pandemic willcould impact the company’sCompany’s results will dependdepending on the scale, duration and geographic reach of future developments, which are highly uncertain and cannot be predicted, including notably the possibility of a recurrence or “multiple waves”multiple waves of the outbreak and new variants.
The impact on revenue from product sales is estimated at $94 million due to lower gold produced of 59,000 ounces from continuing operations. The impact on cost of sales is estimated at $19 million and its impact on all-in sustaining costs was estimated at $35 per ounce, or about three percent. Consumable inventory levels were increased at certain operations to mitigate potential supply chain challenges resulting from the pandemic.
Geopolitical tensions
The geopolitical tensions and war between Russia and Ukraine and the retaliatory measures that have been taken, and could be taken in the future, by the United States, the EU, the United Kingdom, NATO and other jurisdictions have created global security concerns that could result in a regional or global conflict and otherwise have a lasting impact on regional and global economies, any or all of which could adversely affect AngloGold Ashanti’s business. See “Item 3D: Risk Factors—Global political and economic conditions could adversely affect the profitability of operations”.
Climate change and other environmental factors
Rising temperatures, changing rainfall patterns and extremesevere weather conditions believed to be caused by climate change remain growing concerns for businesses, investors, broader society and governments. This has led to growingincreased pressure on companies, including those in the mining sector, to reduce greenhouse gas (“GHG”) emissions consistent with national commitments
made by numerous countries under the Paris Agreement, to promote responsible corporate practices and to increase transparency about the risks and opportunities of transitioning to a low-carbon economy. Pressure from governments, investors and broader society for mining companies to improve environmental stewardship and reduce greenhouse gasGHG emissions, both absolutely and in terms of consumption ratesabsolute emissions and in intensity of emissions per tonne mined, is likely to intensifyincrease in the future.
The Company is also tracking the carbon intensity of its energy mix by measuring GHG emissions per tonne processed,Gigajoule (“GJ”) of energy used. This measure increased by 2.7 percent year-on-year in 2022 asto approximately 65 kilograms of CO2e emitted per GJ of energy compared to 2007. This target2021 as the Company’s direct and indirect energy consumption was metfour percent higher than in 2018. Work2021. Absolute Scope 1 and Scope 2 GHG emissions in 2022 increased by seven percent to 1.47Mt compared to 2021, which is underway during 2021 to setthe Company’s new medium-term targets, and to begin working toward charting a pathway to net zero emissions. In 2020, the company has established a Climate Change Working Group to focus on the related strategy and transition processes, to develop metrics and targets, and to oversee implementation of our strategy.baseline year.
146
Foreign exchange fluctuations
Total cash costs in all business segments are for local procurement largelypartly incurred in local currency where the relevant operation is located. US dollar denominated total cash costs and net income tend to be adversely impacted by local currency strength and favourably impacted by local currency weakness, assuming there are no other offsetting factors. AngloGold Ashanti’s financial results can be influenced significantly by the fluctuations in the Brazilian real, Australian dollar, and, to a lesser extent, the ArgentinianArgentinean peso and other local currencies. As set out below, during the year ended 31 December 2020, the Argentinian peso, Brazilian real and2022, the Australian dollar and Argentinean peso weakened and the Brazilian real strengthened against the US dollar, which collectively had a favourable impact on AngloGold Ashanti’s US dollar denominated total cash costs.
| Average annual exchange rates to the US dollar | Average annual exchange rates to the US dollar | 2020 | 2019 | 2018 | Average annual exchange rates to the US dollar | 2022 | 2021 | 2020 | ||||||||||||||||||||||||||
| Brazilian real | Brazilian real | 5.15 | 3.94 | 3.66 | Brazilian real | 5.16 | 5.40 | 5.15 | ||||||||||||||||||||||||||
| Australian dollar | Australian dollar | 1.45 | 1.44 | 1.34 | Australian dollar | 1.44 | 1.33 | 1.45 | ||||||||||||||||||||||||||
| Argentinian peso | 70.71 | 48.29 | 28.14 | |||||||||||||||||||||||||||||||
| Argentinean peso | Argentinean peso | 130.87 | 95.21 | 70.71 | ||||||||||||||||||||||||||||||
In 2020,2022, the companyCompany derived 5247 percent (45(41 percent including joint ventures) of its revenues from continuing operations from Brazil, Australia and Argentina, and incurred 5349 percent (48(45 percent including joint ventures) of its total cash costs from continuing operations in Brazil, Australia and Argentina. ABased on average exchange rates in 2022, the Company estimates that a one percent strengthening of local currenciesall of the Brazilian real, Argentinean peso, Australian dollar, Ghanaian cedi and the South African rand against the US dollar, will resultother factors remaining equal, would have resulted in an increase in cost of sales and total cash costs incurredper ounce of about $12approximately $13 million or $4and $6 per ounce.ounce, respectively. As a result of the sale of its remaining South African operations, AngloGold Ashanti’s exposure to fluctuations in the strength of the South African rand has been reduced.
Certain exchange controls were in force in emerging markets in which the companyCompany operates during the period under review, including, for example in Argentina. In the case of Argentina, although the exchange rate of the ArgentinianArgentinean peso is primarily market determined, its value at any time may not be considered a true reflection of the underlying value while exchange controls exist. It is not possible to predict whether or when thisthe Argentinean government will occurrelax exchange controls or the future value of the ArgentinianArgentinean peso.
Total cash costs and effects of inflation
Total cash costs include cash operating costs (which include salaries and wages, stores, explosives, timber, reagents, logistics, fuel, power, water and contractors’ costs), royalties and other cash costs. The mining industry continues to experience price inflationincreases for costs of inputs used in the production of gold, which leads to higher total cash costs reported by many gold producers.
AngloGold Ashanti is unable to control the prices at which it sells its gold. Accordingly, in the event of significant inflation in Brazil, Argentina or Australia, without a concurrent devaluation of the local currency or an increase in the price of gold, there could be a material adverse effect upon the company’sCompany’s results and financial condition. See “Item 3D—3D: Risk Factors—Inflation may have a material adverse effect on results of operations”.
At 31 December 2020,2022, AngloGold Ashanti employs over 28,000globally on average approximately 32,594 people, globally,including contractors, most of whom are members of trade unions, particularly in Africa and the Americas. Salaries and wages account for a significant component of local total cash costs and are impacted by annual wage increases. During 2022, COVID-19 continued to – although to a lesser extent than in prior years – present challenges with travel restrictions and shortages of critical skills resulting in higher labour and contractors’ costs at certain operations.
Energy costs, comprising power, fuel and lubricants, are another material component of total cash costs. Due to the remote location of some of its mines in Africa, AngloGold Ashanti uses fuel to generate power and uses fuel and lubricants at its mines to run its fleet and processing plants. The price of Brent crudeCrude oil has decreasedincreased from $71 per barrel in 2018, $65 per barrel in 2019 to $42 per barrel in 2020 to $71 per barrel in 2021 to $97 per barrel in 2022, a 41$55, or a 131 percent decreaseper barrel increase over the three-year period. AngloGold Ashanti estimates that for each $1$1.00 per barrel rise or fall in the oil price, other factors remaining equal, the averagecost of sales and total cash costs per ounce of all its operations increaseschange by
147
AngloGold Ashanti has no influence over the cost of most consumables. Furthermore, there has also been volatility recently in the price of steel, used in the manufacture of most forms of fixed and mobile mining equipment, which is a relatively large contributor to the operating costs and capital expenditure of a mine. Fluctuations in oil and steel prices as well as cost increases in respect of labour, explosives, cyanide and other production inputs have a significant impact on operating costs and capital expenditure. COVID-19 continued to – although to a lesser extent than in prior years – present challenges within the overall logistics sector resulting in higher cost of transportation, warehousing and inventory prices.
Royalties (excluding joint ventures), which are generally calculated as a percentage of revenue, varied over the past three years from $133 million in 2018 to $137 million in 2019 and $181 million in 2020 to $162 million in 2021 to $185 million in 2022, a 36two percent increase over the three-year period, primarily due to the variations in the gold prices received, production and royalty rate increases. Royalties are likely to continue to vary in the coming years due to the variations in the gold prices and the fact that in a number of jurisdictions host governments increasingly seek to obtain a higher share of revenue by increasing the royalty rates for gold mines.
Environmental rehabilitation costs
Total provisions for decommissioning and for environmental restoration activities (excluding joint ventures and discontinued operations) totaled $637totalled $659 million in 2018, $6342020, $673 million in 20192021 and $674$578 million in 2020.2022. During 2019, $96 million was transferred to liabilities related to assets held for sale. During 2020,2021, the provisions for decommissioning and restoration increased by $40$14 million largely due to severalthe recognition of a change in estimates relating to the ongoing transition to dry-stacking operations in Brazil to comply with new legal requirements in Brazil as well as changes in the methodology for calculating such estimates. During 2022, the provisions for decommissioning and restoration decreased by $95 million mainly due to changes in estimates resulting from changes in discount rates, changes in global economic assumptions, changes in mine plans resulting in a change in cash flows as well as changes in the design of tailings storage facilities (“TSFs”). See also “Item 4B: Business Overview—Regulatory Environment Enabling AngloGold Ashanti to Mine”, “Item 4B: Business Overview—Mine Site Rehabilitation and Closure” and “Item 4B: Business Overview—Sustainability and Environmental, Social and Governance ("ESG") Matters”.
Amortisation of assets
Amortisation of tangible assets increased during the 2020 to 2022 period by $25 million, or five percent, from $526 million in 2020 to $551 million in 2022, largely due to the Obuasi redevelopment project continuing to ramp up to full production, increased investment in TSFs at Serra Grande and higher deferred stripping at Tropicana and Iduapriem.
Amortisation of right of use assets, as recognised in accordance with IFRS 16 “Leases”, increased during the 2020 to 2022 period by $34 million, or 72 percent, from $47 million in 2020 to $81 million in 2022, mainly due to additional lease contracts entered into at the Brazilian operations and at the Geita mine.
Amortisation of intangible assets decreased during the 2020 to 2022 period by $1 million, or 50 percent, from $2 million in 2020 to $1 million in 2022.
Exploration and evaluation costs
The Company has expensed exploration expenditure during the years ended 31 December 2020, 2021 and 2022 in order to replenish depleting Mineral Reserve and bring new ore bodies into pre-feasibility or feasibility. The expensed exploration costs incurred over the last three fiscal years amounted to $124 million in 2020, $164 million in 2021 and $205 million in 2022. Exploration expenditure increased during 2022 mainly due to an increase in greenfields exploration in Nevada, United States.
Corporate administration, marketing and related expenses
The corporate administration, marketing and related expenses incurred amounted to $68 million in 2020, $73 million in 2021 and $79 million in 2022. The increase in 2022 of $6 million, or eight percent, was mainly due to the allocation of service costs to corporate costs following the implementation of the new Operating Model. This increase was partly offset by the exchange rate impact of a 11 percent weaker local currency.
Impairment, derecognition of assets and profit (loss) on disposal
For all of the AngloGold Ashanti Group’s cash generating units (“CGUs”) where indicators of impairment or reversal of impairment have been identified, the recoverable amounts of the CGUs were determined. With the exception of Serra Grande, the Córrego do Sítio mining complex (“CdS”) and the Mineração Cuiabá mining complex (“Cuiabá”) in Brazil, the recoverable amounts exceeded the carrying amounts of the CGUs and management has considered the sensitivity of the impairment calculations to various key inputs and assumptions such as the gold price and exchange rates and concluded that reasonably possible changes to these key inputs and assumptions applied would not result in any impairment loss or the reversal of a previous impairment loss to be recognised.
These sensitivities have been taken into consideration in determining the required impairments as disclosed below. Management assumptions for the value in use of tangible assets and goodwill include the gold price assumption, which
148
represents management’s best estimate of the future price of gold. A long-term real gold price of $1,731 per ounce (2021: $1,599 per ounce; 2020: $1,450 per ounce) is based on a range of economic and market conditions that are expected to exist over the remaining useful life of the assets.
In determining the impairment for each CGU, the real post-tax rate was derived from the weighted average cost of capital (“WACC”) using the Capital Asset Pricing Model (“CAPM”) to determine the required return on equity with risk factors consistent with the basis used in 2021. At 31 December 2022, the derived group WACC was 12.2 percent (real post-tax) which is 360 basis points higher than 8.6 percent at 31 December 2021, and is based on the industry average capital structure of the major gold companies considered to be appropriate peers. In determining the WACC for each CGU, sovereign and mining risk factors are considered to determine country specific risks. In certain instances, a specific risk premium was added to large projects being undertaken or the turnaround nature of a specific mine to address uncertainties in the forecast of the cash flows.
Córrego do Sítio (CdS)
CdS is owned and operated by AngloGold Ashanti Mineração (“AGA Mineração”) in Brazil. The CdS mining complex has been in operation since 1989 and consists of open pit and underground mines. The property is currently in a production stage. In line with AngloGold Ashanti's reinvestment strategy, management took a decision during the third quarter of 2022 to carve out the underperforming complex of CdS from the AGA Mineração CGU and to investigate alternative strategic options including either to sell the complex, place the complex under care and maintenance, close the complex or to consider additional capital expenditure to regain profitability of the complex. After the strategic review of CdS, the Company has elected to retain CdS. This decision resulted in the disaggregation of the AGA Mineração CGU into two separate CGUs, being the CdS mining complex CGU and the Cuiabá mining complex CGU. As a result of these impairment indicators, the recoverable amount for the CdS mining complex CGU was determined not to support its carrying values as at 30 September 2022 and an impairment loss of $151 million ($189 million gross of taxes) was recognised and included in the Americas segment. The disaggregation of CGUs did not have an impact on reportable segments in terms of IFRS 8 “Operating Segments” as disclosed in “Item 18: Financial Statements—Note 2—Segmental Information”. The recoverable amount of $5 million was determined with reference to the CGU’s value in use derived from a discounted cash flow model, using a discount rate of 8.5 percent, compared to the CGU’s carrying amount of $156 million.
Cuiabá
Cuiabá is owned and operated by AGA Mineração in Brazil. It has been in operation since 1834 and is an underground mine. The property is currently in the production stage. The Cuiabá mining complex CGU, which was disaggregated from the AGA Mineração CGU, recognised an impairment loss of $57 million ($70 million gross of taxes). This was largely due to the suspension of filtered tailings deposition on the Calcinados TSF and processing of gold concentrate at the Queiroz plant in December 2022 (with both servicing the Cuiabá mining complex). For further information, refer to “Item 4B: Business Overview—The Regulatory Environment Enabling AngloGold Ashanti to Mine—Americas—Brazil” and “Item 3D: Risk Factors—Compliance with tailings management requirements and standards, and potential liabilities in the event of a failure to timely comply with these requirements or an incident involving a tailings storage facility, could adversely impact AngloGold Ashanti’s financial condition, results of operations and reputation”.
The recoverable amount of $304 million (compared to the CGU’s carrying amount of $361 million) was determined with reference to the CGU’s value in use which requires the use of estimates. The impairment result was derived from a discounted cash flow model and a discount rate of 8.5 percent.
Management modelled various scenarios, which included a combination of reasonably possible changes in key assumptions, to determine the impact on the recoverable amount. The impairment assessment required significant judgement and estimation uncertainty. The impairment loss was recognised and included in the Americas segment.
Serra Grande
Mineração Serra Grande (“Serra Grande”) is wholly-owned by AngloGold Ashanti and is located in the northwest of Goiás state, central Brazil. It has been in operation since 1986 and consists of three underground and two open pit mines. The property is currently in the production stage. The Serra Grande CGU recognised an impairment loss of $38 million ($45 million gross of taxes) during December 2022 largely due to a projection of lower grades and ounces and an increase in the interest rates driven by global inflation and country risk which resulted in an increased discount rate. The recoverable amount of $128 million was determined with reference to the CGU’s value in use derived from a discounted cash flow model, using a discount rate of 8.5 percent, compared to the CGU’s carrying amount of $166 million. The impairment loss was recognised and included in the Americas segment.
Other (expenses) income
Other (expenses) income incurred over the last three fiscal years amounted to an expense of $57 million in 2020, an expense of $136 million in 2021 and an expense of $26 million in 2022. The decrease during 2022 was largely due to care and
149
maintenance activities of $45 million incurred in 2021 at the Obuasi mine during the voluntary suspension of underground mining between May and October 2021 following a sill pillar incident, retrenchment and related costs of $18 million incurred in 2021 as part of the transition to the new Operating Model and bond settlement costs of $24 million incurred in 2021 related to the tender offer for, and subsequent redemption of, the $750 million aggregate principal amount of 5.125% notes due 2022, none of which were repeated in 2022. The non-occurrence of the aforementioned costs in 2022 contributed to a decrease in cost of $87 million. Further decreases in other expenses were primarily due to the lower cost of legacy tailings operations of $25 million, mainly at Obuasi, as a result of fewer activities at such legacy tailings operations, and lower value added tax (“VAT”) of $7 million and other duties expensed. These decreases in other expenses were partly offset by higher due diligence project costs of $5 million during 2022.
Taxation
Taxation decreased over the period 2020 to 2022 from an expense of $625 million in 2020 to an expense of $173 million in 2022. Decrease in taxation over the period 2020 to 2022 was largely due to lower earnings in Australia, Ghana, Tanzania and Argentina and higher impairments in Brazil.
Taxation is likely to continue to be volatile in the coming years, due to fluctuations in gold price and production.
Production in 2022
In 2022, AngloGold Ashanti’s total attributable gold production was 2.742 million ounces, an increase of 270,000 ounces, or 11 percent, compared with its total attributable gold production of 2.472 million ounces in 2021. Production was higher year-on-year mainly due to a ten percent increase in recovered grades and the resumption of stoping activities at Obuasi during 2022, following the temporary suspension of underground stoping activities in 2021 due to a sill pillar incident in May 2021. The improving grade profile following the reinvestment programme across the portfolio was a key driver of the overall production increase. For 2022, COVID-19 had a marginal estimated direct impact of 19,000 ounces on the Company’s production. By comparison, for 2021, the direct impact of COVID-19 on the Company’s production was estimated at 47,000 ounces.
In the Africa region, production increased by 216,000 ounces, or 15 percent, from 1,419,000 ounces in 2021 to 1,635,000 ounces in 2022. The increase was mainly due to higher production from Obuasi, Iduapriem, Siguiri and Geita, partly offset by lower production from Kibali. Gold production at Iduapriem increased by 46,000 ounces, or 23 percent, from 202,000 ounces in 2021 to 248,000 ounces in 2022. Gold production was higher year-on-year mainly due to higher ore volumes processed, further supported by higher grades recovered as the mine accesses ore tonnes from Block 5 and Teberebie Cut 2a compared to Block 5 and the drawdown from stockpiles in 2021. Gold production at Obuasi increased by 142,000 ounces, or 131 percent, from 108,000 ounces in 2021 to 250,000 ounces in 2022. Gold production was higher year-on-year mainly due to the resumption of stoping activities during 2022 following the temporary suspension of underground stoping activities in 2021 due to a sill pillar incident in May 2021, as well as the continued ramp-up of the operations . Gold production at Siguiri increased by 21,000 ounces, or eight percent, from 258,000 ounces in 2021 to 279,000 ounces in 2022. Gold production was higher year-on-year mainly due to higher recovered grades, partly offset by lower ore volumes processed (as a result of local community protests related to employment demands which led to mining disruptions and the temporary suspension of mining activities during the month of July 2022). Gold production at Geita increased by 35,000 ounces, or seven percent, from 486,000 ounces in 2021 to 521,000 ounces in 2022. Gold production was higher year-on-year mainly due to higher ore volumes processed as well as higher recovered grades. Gold production at Kibali decreased by 28,000 ounces, or eight percent, from 365,000 ounces in 2021 to 337,000 ounces in 2022. Gold production was lower year-on-year mainly due to lower grades recovered, partly offset by a marginal increase in ore volumes processed.
In the Americas region, production increased by 10,000 ounces, or two percent, from 559,000 ounces in 2021 to 569,000 ounces in 2022. The increase was mainly due to higher production from Serra Grande and Cerro Vanguardia, partly offset by lower production from AGA Mineração. Gold production at AGA Mineração decreased by 20,000 ounces, or six percent, from 331,000 ounces in 2021 to 311,000 ounces in 2022. Gold production was lower year-on-year mainly due to lower ore volumes processed, partly offset by higher grades recovered. In addition, extreme weather including intense rainfalls followed by widespread flooding in the state of Minas Gerais in Brazil during 2022 negatively impacted production. Infrastructure was temporarily inaccessible in and around the mine and employees were confined to their homes in nearby cities during the flooding. Gold production at Serra Grande increased by 5,000 ounces, or six percent, from 83,000 ounces in 2021 to 88,000 ounces in 2022. Gold production was higher year-on-year mainly due to higher recovered grades resulting from changes to the geological model, partly offset by lower ore volumes processed. Production during 2021 was negatively impacted by COVID-19 related restrictions and stabilisation challenges during the conversion of the TSFs to dry-stacking operations to comply with legal requirements in Brazil, which were not repeated in 2022. Gold production at Cerro Vanguardia increased by 25,000 ounces, or 17 percent, from 145,000 ounces in 2021 to 170,000 ounces in 2022. Gold production was higher year-on-year mainly due to a combination of higher ore volumes processed, higher recovered grades and fewer COVID-19 related limitations and restrictions that affected the mine’s ability to operate at full capacity.
In the Australia region, production increased by 44,000 ounces, or nine percent, from 494,000 ounces in 2021 to 538,000 ounces in 2022. This increase was mainly due to higher production from Sunrise Dam and Tropicana. Gold production at Sunrise Dam increased by 3,000 ounces, or one percent, from 229,000 ounces in 2021 to 232,000 ounces in 2022. Gold
150
production was marginally higher year-on-year mainly due to higher recovered grades, partly offset by lower ore volumes processed following COVID-19 related production challenges. Gold production at Tropicana increased by 41,000 ounces, or 15 percent, from 265,000 ounces in 2021 to 306,000 ounces in 2022. Gold production was higher year-on-year mainly due to a combination of higher ore volumes processed from the Boston Shaker open pit and underground mine and higher recovered grades as well as the adverse impact of the wall failure in the Boston Shaker open pit in June 2021, which delayed higher grade ore delivery, and which was not repeated during 2022.
Production in 2021
In 2021, AngloGold Ashanti’s total attributable gold production was 2.472 million ounces, a decrease of 334,000 ounces, or 12 percent, compared with its total attributable gold production of 2.806 million ounces in 2020. Production was lower mainly due to the Company undertaking significant reinvestment across key assets and the temporary suspension of underground mining activities at Obuasi, the direct impact of COVID-19 in the first half of 2021, and secondary impacts of the pandemic, including on the mobility of labour, across 2021. The direct impact on the Company’s production from COVID-19 was estimated at 47,000 ounces for 2021, compared to 59,000 ounces in 2020.
In the Africa region, production decreased by 184,000 ounces, or 11 percent, from 1,603,000 ounces in 2020 to 1,419,000 ounces in 2021. The decrease was mainly due to lower production from Iduapriem, Obuasi and Geita, partly offset by higher production from Siguiri. Gold production at Iduapriem decreased by 73,000 ounces, or 27 percent, from 275,000 ounces in 2020 to 202,000 ounces in 2021. Gold production was lower year-on-year mainly due to lower grades from the depletion of ore in Cut 1 and delayed waste stripping at Cut 2 of the Teberebie pit, as well as the impact of a drawdown on stockpiles. Gold production at Obuasi decreased by 19,000 ounces, or 15 percent, from 127,000 ounces in 2020 to 108,000 ounces in 2021. Gold production was lower year-on-year mainly due to underground mining activities being voluntarily suspended between 18 May 2021 and 15 October 2021, following a sill pillar incident. From 15 October 2021, underground mining resumed to replenish the run-of-mine stockpile without corresponding gold production. Gold production at Siguiri increased by 44,000 ounces, or 21 percent, from 214,000 ounces in 2020 to 258,000 ounces in 2021. Gold production was higher year-on-year mainly due to an improvement in recovered grade which was attributable to improved plant recoveries as a result of the carbon-in-leach (“CIL”) conversion done at the end of 2020 and the commencement of processing Block 2 material in the second half of 2021. Gold production at Geita decreased by 137,000 ounces, or 22 percent, from 623,000 ounces in 2020 to 486,000 ounces in 2021. Gold production was lower year-on-year mainly due to mining lower grades and the drawdown on stockpiles, as significant reinvestments progressed across the Geita lease during 2021. Gold production at Kibali increased by 1,000 ounces, or less than one percent, from 364,000 ounces in 2020 to 365,000 ounces in 2021. Gold production was marginally higher year-on-year as the mine delivered a good overall performance from the metallurgical plant, with increased tonnage during 2021, driven by higher open pit tonnes mined as compared to 2020.
In the Americas region, production decreased by 90,000 ounces, or 14 percent, from 649,000 ounces in 2020 to 559,000 ounces in 2021. Lower production was encountered at AGA Mineração, Serra Grande and Cerro Vanguardia. Gold production at AGA Mineração decreased by 31,000 ounces, or nine percent, from 362,000 ounces in 2020 to 331,000 ounces in 2021. The Córrego do Sítio mining complex was mainly impacted by challenges in the crushing and milling circuit and lower tonnes of ore treated. Production was also adversely impacted by a seven-day strike by mine workers in September 2021. The Cuiabá mining complex recorded an increase in tonnes of ore treated year-on-year, which was partly offset by lower grades. Gold production at Serra Grande decreased by 31,000 ounces, or 27 percent, from 114,000 ounces in 2020 to 83,000 ounces in 2021. Gold production was lower year-on-year mainly due to lower tonnage resulting from various delays in accessing mine stopes, as well as lower feed grades, the negative impact of COVID-19 on mining operations as well as operational impacts of the fatality that occurred in February 2021. The production performance was further impacted by stabilisation challenges during the commissioning of the new filter process in connection with work to convert the TSFs to dry-stacking operations to comply with new legal requirements in Brazil. Gold production at Cerro Vanguardia decreased by 28,000 ounces, or 16 percent, from 173,000 ounces in 2020 to 145,000 ounces in 2021. Gold production was lower year-on-year mainly due to the effect of lower grades as per the mine plan for 2021 as well as COVID-19 related limitations and restrictions that affected the mine’s ability to operate at full capacity.
In the Australia region, production decreased by 60,000 ounces, or 11 percent, from 554,000 ounces in 2020 to 494,000 ounces in 2021. This decrease was mainly due to lower production from Sunrise Dam and Tropicana. Gold production at Sunrise Dam decreased by 27,000 ounces, or 11 percent, from 256,000 ounces in 2020 to 229,000 ounces in 2021. Gold production was lower year-on-year mainly due to lower head grade and a decrease in metallurgical recovery, which was partly offset by higher tonnes mined in the underground mine. Mine-to-mill grade reconciliations stabilised during the second half of 2021 and access to higher-grade underground ore was achieved at the end of 2021 in the newly accessed Frankie orebody. Gold production at Tropicana decreased by 33,000 ounces, or 11 percent, from 298,000 ounces in 2020 to 265,000 ounces in 2021. Gold production was lower year-on-year mainly due to a lower mill feed grade as stockpile drawdowns increased while mining focused on waste removal in the Havana Stage 2 Cutback. Production was also adversely impacted by the wall failure in the Boston Shaker open pit in June 2021, which delayed higher grade ore delivery. Production at Tropicana was also adversely affected by labour market shortages which had an impact on open pit and underground material movement.
151
Comparison of financial performance in 2022, 2021 and 2020
| Financial performance of AngloGold Ashanti | Year ended 31 December | ||||||||||||||||
| (in $ millions) | 2022 | 2021 | 2020 | ||||||||||||||
| Restated | |||||||||||||||||
| Continuing operations | |||||||||||||||||
| Revenue from product sales | 4,501 | 4,029 | 4,595 | ||||||||||||||
| Cost of sales | (3,362) | (2,857) | (2,829) | ||||||||||||||
| Total of all other (expenses) income | (816) | (463) | (417) | ||||||||||||||
| Share of associates and joint ventures’ profit (loss) | 166 | 249 | 278 | ||||||||||||||
| Taxation | (173) | (312) | (625) | ||||||||||||||
| Discontinued operations | |||||||||||||||||
| Profit (loss) from discontinued operations | — | — | 7 | ||||||||||||||
| Profit for the period | 316 | 646 | 1,009 | ||||||||||||||
| Net profit (loss) attributable to equity shareholders | |||||||||||||||||
| - Continuing operations | 297 | 622 | 984 | ||||||||||||||
| - Discontinued operations | — | — | 7 | ||||||||||||||
| Net profit (loss) attributable to non-controlling interests | |||||||||||||||||
| - Continuing operations | 19 | 24 | 18 | ||||||||||||||
Comparison of total cost of sales in 2022, 2021 and 2020
The following table presents cost of sales from continuing operations for the AngloGold Ashanti Group for the three-year period ended 31 December 2022:
| Cost of sales for AngloGold Ashanti | Year ended 31 December | ||||||||||||||||
| (in $ millions) | 2022 | 2021 | 2020 | ||||||||||||||
| Restated | |||||||||||||||||
| Total cost of sales | 3,362 | 2,857 | 2,829 | ||||||||||||||
| Inventory change | 30 | (6) | (14) | ||||||||||||||
| Amortisation of tangible assets | (551) | (411) | (526) | ||||||||||||||
| Amortisation of intangible assets | (1) | (3) | (2) | ||||||||||||||
| Amortisation of right of use assets | (81) | (63) | (47) | ||||||||||||||
| Retrenchment costs | (6) | (2) | (2) | ||||||||||||||
| Rehabilitation and other non-cash costs | — | (38) | (32) | ||||||||||||||
| Total cash costs | 2,753 | 2,334 | 2,206 | ||||||||||||||
Comparison of financial performance in 2022 with 2021
Our gold income is materially impacted by price and volume variances. All of our costs are impacted by the consequences of average exchange rate movements.
Exchange fluctuations in, and the average exchange rates for, the Brazilian real, Australian dollar and, to a lesser extent, the Argentinean peso and other local currencies have effects on the various components that make up our costs based on the level of local procurement of each of these costs. For a discussion of the effect of foreign exchange fluctuations on our financial results, see “Item 5A: Operating Results—Key factors affecting results—Foreign exchange fluctuations”.
Revenue from product sales
Revenue from product sales increased by $472 million, or 12 percent, from $4,029 million in 2021 to $4,501 million in 2022, mainly as a result of an increase in gold income, partly offset by a decrease in by-product revenue. Gold income increased by $485 million, or 12 percent, from $3,903 million in 2021 to $4,388 million in 2022. This increase was mainly due to an increase in ounces of gold sold, partly offset by a decrease in the average gold price received of $3 per ounce. Gold sold increased by
152
269,000 ounces, or 13 percent, from 2.116 million ounces in 2021 to 2.385 million ounces in 2022, which resulted in an increase in gold income of $491 million. The average gold price received decreased by $3 per ounce, from $1,796 per ounce during 2021 to $1,793 per ounce in 2022, which resulted in a decrease in gold income of $6 million. By-product revenue decreased by $13 million, or ten percent, from $126 million in 2021 to $113 million in 2022, mainly due to a decrease in revenue from silver.
Revenue from product sales from the Africa operations (excluding equity-accounted joint ventures) increased by $400 million, or 20 percent, from $1,988 million in 2021 to $2,388 million in 2022, mainly as a result of an increase in gold income. Gold income (excluding equity-accounted joint ventures) increased by $400 million, or 20 percent, from $1,985 million in 2021 to $2,385 million in 2022. This increase was mainly due to higher ounces of gold sold, partly offset by a decrease in the average gold price received. Gold sold increased by 221,000 ounces, or 21 percent, from 1.060 million ounces in 2021 to 1.281 million ounces in 2022, which resulted in an increase in gold income of $403 million. There was an increase in production across all Africa operations in 2022 when compared to 2021. For a discussion of the increase in production at the Africa operations during 2022, see “Item 5A: Operating Results—Key factors affecting results—Production in 2022”. The decrease in the average gold price received resulted in a decrease in gold income of $3 million. By-product revenue (excluding equity-accounted joint ventures) of $3 million in 2022 remained unchanged from $3 million in 2021.
Revenue from product sales from the Americas operations decreased by $5 million, from $1,147 million in 2021 to $1,142 million in 2022, mainly as a result of a decrease in by-product revenue, partly offset by an increase in gold income. Gold income increased by $8 million, or one percent, from $1,028 million in 2021 to $1,036 million in 2022. This increase was mainly due to higher ounces of gold sold, partly offset by a decrease in the average gold price received. Gold sold increased by 4,000 ounces, or one percent, from 561,000 ounces in 2021 to 565,000 ounces in 2022, which resulted in an increase in gold income of $10 million. There was an increase in production at Cerro Vanguardia and Serra Grande, partly offset by a decrease in production at AngloGold Ashanti Mineração. For a discussion of the increase in production at the Americas operations during 2022, see “Item 5A: Operating Results—Key factors affecting results—Production in 2022”. The decrease in average gold price received resulted in a decrease in gold income of $2 million. By-product revenue decreased by $13 million, or 11 percent, from $119 million in 2021 to $106 million in 2022, mainly due to a decrease in silver revenue from lower silver production in Argentina.
Revenue from product sales from the Australia operations increased by $77 million, or nine percent, from $894 million in 2021 to $971 million in 2022, mainly as a result of an increase in gold income. Gold income increased by $77 million, or nine percent, from $890 million in 2021 to $967 million in 2022. This increase was mainly due to higher ounces of gold sold, partly offset by a decrease in the average gold price received. Gold sold increased by 44,000 ounces, or nine percent, from 495,000 ounces in 2021 to 539,000 ounces in 2022, which resulted in an increase in gold income of $79 million. There was an increase in production at Tropicana which was partly offset by a decrease in production at Sunrise Dam. For a discussion of the increase in production at the Australia operations during 2022, see “Item 5A: Operating Results—Key factors affecting results—Production in 2022”. The decrease in the average gold price received resulted in a decrease in gold income of $2 million. By-product revenue of $4 million in 2022 remained unchanged from $4 million in 2021.
Cost of sales
Cost of sales increased by $505 million, or 18 percent from $2,857 million in 2021 to $3,362 million in 2022. The increase was primarily due to an increase in cash operating costs by $394 million, or 18 percent, from $2,160 million in 2021 to $2,554 million in 2022, an increase in amortisation of tangible assets by $140 million, or 34 percent, from $411 million in 2021 to $551 million in 2022, an increase in amortisation of right of use assets by $18 million, or 29 percent, from $63 million in 2021 to $81 million in 2022 and an increase in royalties paid by $23 million, or 14 percent, from $162 million in 2021 to $185 million in 2022, mainly due to higher ounces sold. This increase was partly offset by a decrease in environmental rehabilitation and other non-cash costs by $38 million, or 100 percent, from $38 million in 2021 to nil in 2022, an inventory change of $36 million, or 600 percent, from a charge of $6 million in 2021 to a credit of $30 million in 2022, and a decrease in amortisation of intangible assets by $2 million, or 67 percent, from $3 million in 2021 to $1 million in 2022.
The increase in cash operating costs was mainly due to higher labour and contractors’ costs, commodity prices, logistics costs, consumable stores, services, other charges, fuel and power costs. Higher labour and contractors’ costs were mainly due to the resumption of stoping activities during 2022 at Obuasi, following the temporary suspension of underground mining activities in 2021 due to a sill pillar incident in May 2021. At Geita, with the acceleration of the heavy mobile equipment (“HME”) fleet rebuilds as the open pit mine expanded, higher underground mining contractors’ costs were incurred. Higher labour and contractors’ costs were also due to shortages of critical skills at certain operations. Higher commodity costs were mainly due to an increase in the prices of steel, support and construction materials, explosives, timber and reagents. Higher fuel and power costs were mainly due to the increase in the average price of Brent Crude oil, which increased from $71 per barrel in 2021 to $97 per barrel in 2022, a $26, or a 37 percent, per barrel increase. The increase in amortisation of tangible assets was mainly due to the Obuasi redevelopment project continuing to ramp up to full production, higher deferred stripping amortisation at Tropicana and Iduapriem, and higher Mineral Reserve development amortisation at Tropicana and Geita. The increase in amortisation of right of use assets was mainly due to the business strategy whereby certain heavy mobile equipment is leased, mainly at the Brazil and Africa operations. The increase in royalties paid primarily arose from an increase in ounces of gold sold in 2022 as compared to 2021. The decrease in environmental rehabilitation and other non-cash costs primarily arose from
153
the changes to restoration provision cash flows in 2022 compared to 2021. The change in restoration provision cash flows was attributable to changes in discount rates due to changes in global economic assumptions, changes in mine plans resulting in a change in cash flows, changes in design of tailings storage facilitiesour TSFs in Brazil due to new legal requirements, enacted or formalized in 2020 and changes in the methodology for calculatingused to calculate such estimates in response to comments from the environmental regulatory authorities. See also “Item 4B: Business Overview—Regulatory Environment Enabling AngloGold AshantiThe inventory change was mainly due to Mine”higher gold on hand at Obuasi, Siguiri, Geita, Tropicana and Sunrise Dam related to the timing of gold pours and shipments, lower amortisation of inventories in Brazil due to the suspension of tailings disposal and processing plant effluents treatment and lower amortisation of inventories at Cerro Vanguardia due to a higher volume of gold in process. The decrease in amortisation of intangible assets was mainly due to lower software and licence expenditure at Obuasi as compared to 2021.
In Africa, cost of sales increased by $354 million, or 21 percent, from $1,650 million in 2021 to $2,004 million in 2022. The increase was mainly due to an increase in labour and contractors’ costs, commodity prices, logistics costs, consumable stores, services, other charges, fuel and power costs, royalties paid and amortisation of tangible assets. Higher commodity costs were mainly due to an increase in the prices of steel, support and construction materials, explosives, timber and reagents. Higher fuel and power costs were mainly due to the increase in the price of Brent Crude oil. The increase in cost of sales was partly offset by lower environmental rehabilitation and other non-cash costs and inventory changes in 2022 as compared to 2021.
In the Americas, cost of sales increased by $91 million, or 11 percent, from $822 million in 2021 to $913 million in 2022. The increase was mainly due to an increase in labour and contractors’ costs, commodity prices, logistics costs, consumable stores, amortisation of tangible and right of use assets, services and other charges, power and fuel cost, and write down of inventory. Royalties paid were higher mainly due to an increase in ounces of gold sold in 2022 as compared to 2021. The higher labour and contractors’ costs were mainly due to cost increases resulting from shortages of critical skills. Higher commodity costs were due to an increase in the prices of steel, support and construction materials, explosives, timber and reagents. Higher fuel and power costs were mainly due to the increase in the price of Brent Crude oil. The strengthening of the Brazilian real by four percent against the US dollar further increased costs. The increase in cost of sales was partly offset by lower environmental rehabilitation and other non-cash costs, inventory changes and the weakening of the Argentinean peso by 37 percent against the US dollar, as compared to 2021.
In Australia, cost of sales increased by $43 million, or six percent, from $740 million in 2021 to $783 million in 2022. The increase was mainly due to an increase in labour and contractors’ costs, commodity prices, logistics costs, consumable stores, services and other charges, power and fuel costs, amortisation of tangible assets, and royalties paid mainly due to an increase in ounces of gold sold in 2022 as compared to 2021. The higher labour and contractors’ costs were mainly due to shortages of critical skills. Higher commodity costs were mainly due to an increase in the prices of steel, support and construction materials, explosives, timber and reagents. Higher fuel and power costs were mainly due to the increase in the price of Brent Crude oil. The increase in cost of sales was partly offset by lower environmental rehabilitation and other non-cash costs, and the weakening of the Australian dollar against the US dollar by eight percent as compared to 2021.
Total cash costs
Total cash costs increased by $419 million, or 18 percent, from $2,334 million in 2021 to $2,753 million in 2022. The increase was primarily due to an increase in cash operating costs and royalties paid. Total cash costs include cash operating costs (which include salaries and wages, stores, explosives, reagents, logistics, fuel, power, water and contractors’ costs), “Item 4B: Business Overview—Mine Site royalties and other cash costs. The strengthening of the Brazilian real against the US dollar contributed to the increase in total cash costs, which was partly offset by the weakening of local currencies against the US dollar in Australia and Argentina.
Cash operating costs increased by $394 million, or 18 percent, from $2,160 million in 2021 to $2,554 million in 2022, primarily due to higher labour and contractors’ costs, commodity prices, logistics costs, consumable stores, services and other charges as well as higher fuel and power costs.
The strengthening of the Brazilian real against the US dollar contributed to the increase in total cash costs, which was partly offset by the weakening of local currencies against the US dollar in Australia and Argentina. Cash operating costs include salaries and wages, stores, explosives, reagents, logistics, fuel, power, water and contractors’ costs.
Royalties, which are generally calculated as a percentage of revenue, increased by $23 million, or 14 percent, from $162 million in 2021 to $185 million in 2022. The increase was primarily due to an increase in gold sales across all mining operations with the exception of Sunrise Dam, AGA Mineração and Kibali. The increase was partly offset by a decrease in the average gold price received per ounce.
Retrenchment costs
Retrenchment costs included in cost of sales increased by $4 million, or 200 percent, from $2 million in 2021 to $6 million in 2022.
154
Rehabilitation and Closure”other non-cash costs
Environmental rehabilitation and “Item 4B: Business Overview—Environmental, Healthother non-cash costs decreased by $38 million, or a 100 percent, from $38 million in 2021 to nil in 2022. The decrease was mainly due to changes in mine plans resulting in a change in cash flows, changes in the methodology used to calculate such estimates in response to comments from environmental regulatory authorities and Safety Matters”.changes in global economic assumptions. Lower restoration in Australia was mainly due to the completion of a study into reduced waste capping of waste dumps and TSFs, partly offset by ongoing changes in design of TSFs in Brazil to comply with new legal requirements.
Amortisation of tangible, intangible and right of use assets
Amortisation of tangible, intangible and right of use assets expense increased by $156 million, or 33 percent, from $477 million in 2021 to $633 million in 2022.
Amortisation of tangible assets decreased duringincreased by $140 million, or 34 percent, from $411 million in 2021 to $551 million in 2022. The increase was mainly due to higher amortisation at Iduapriem (mainly due to higher gold production combined with higher deferred stripping amortisation at Teberebie Cut 2a which commenced in 2022), at Tropicana (mainly due to higher deferred stripping amortisation due to mining and depletion of different ore bodies and due to increased capital additions), at Serra Grande (mainly due to higher gold production), at Obuasi (mainly due to higher production and the 2018 - 2020 period, from $553 millionreset of the useful life for the mining fleet), at Geita (mainly due to $521 million, largelythe useful life reset done in 2022 for Mineral Reserve development and heavy mining equipment coming into production), at Cerro Vanguardia (mainly due to lower reserves at the end of 2022 compared with at the end of 2021 and higher deferred stripping amortisation) and at Tropicana, open pit ore being depletedSiguiri (mainly due to higher gold production), partially offset by lower amortisation at GeitaCdS (mainly due to lower gold production and lower productionreduction in asset cost due to the impairment that occurred during 2022) and at Cerro Vanguardia.Sunrise Dam (mainly due to a decrease in Mineral Reserve development due to strategy focusing on exploration activities).
Inventory change
Inventory change was a charge of $6 million in 2020. Exploration expenditure increased during 2020 mainly2021 as compared to a credit of $30 million in 2022, which represents a change of $36 million. This change was primarily due to lower cost of unsold gold at Obuasi of $16 million as a result of timing of shipments, lower cost at Siguiri of $5 million and at Geita of $7 million due to an increase in brownfields exploration and pre-feasibility studies in Colombia.
Impairment, derecognition of assets and profit (loss) on disposal
Other (expenses) income
Other (expenses) income decreased by $110 million, or 81 percent, from an expense of $136 million in 2021 to an expense of $26 million in 2022. The decrease during 2022 was largely due to care and maintenance activities of $45 million incurred in 2021 at the Obuasi mine during the voluntary suspension of underground mining between May and October 2021 following a sill pillar incident, retrenchment and related costs of $18 million incurred in 2021 as part of the transition to predominantly underground operations which resultedthe new Operating Model and bond settlement costs of $24 million incurred in increased tonnes treated at Geita2021 related to the tender offer for, and the continued ramp-upsubsequent redemption of, the Obuasi redevelopment project. Obuasi delivered 127,000 ounces$750 million aggregate principal amount of 5.125% notes due 2022, none of which were repeated in production despite delays2022. The non-occurrence of the aforementioned costs in receiving equipment and2022 contributed to a decrease in the arrivalcost of skilled personnel, critical$87 million. Further decreases in other expenses were primarily due to the project,lower cost of legacy tailings operations, mainly at Obuasi, as a result of COVID-19-related lockdownsfewer activities at such legacy tailings operations, and lower VAT and other duties expensed. These decreases in various jurisdictions during 2020. Increased production at Siguiri was due to the increase in hard rock processing capability resulting in a higher plant throughput during 2020. The higher plant throughput has been partiallyother expenses were partly offset by lower-than-planned recovery rate from high levels of carbon in the ore affecting the capacity to recover gold. Steady performance was achieved at Kibali and Iduapriem. The increase in production was partially offset by the cessation of mining activities at Sadiola and Morila in Mali, and the impact of the COVID-19 pandemic.higher due diligence project costs during 2022.
Share of associates and joint ventures’ profit decreased by two$83 million, or 33 percent, or 26,000 ounces,from a profit of $249 million in 20192021 to a profit of $166 million in 2022, mainly as a result of a decrease in equity earnings of $77 million at Kibali due to lower revenues and higher legal and dividend settlement fees, and $5 million at Rand Refinery (Pty) Limited.
Taxation
A taxation expense of $173 million was recorded in 2022, compared to 2018,a taxation expense of $312 million in the Africa region.2021, which represents a $139 million, or 45 percent, decrease. Charges for current tax in 2022 amounted to $231 million, compared to $248 million in 2021, which represents a $17 million, or seven percent, decrease. The increasedecrease in current tax was mainly due to the transitionlower pre-tax profit in Brazil. Charges for deferred tax in 2022 amounted to predominantly underground operations which resulted in higher grade material and increased tonnes treated at Geita and improved production at Iduapriem due to the Operational Excellence programme which focused on improved grade control practices. The increase in production was partially offset by a decrease at Siguiri due to the integrationdeferred tax credit of the Carbon-in-Leach (CIL) combination plant that was completed during the year with a slower ramp-up than anticipated and lower production from both Sadiola and Morila as these two operations near the end of their mining activities.
Comparison of financial performance in 2020, 2019 and 2018
| Financial performance of AngloGold Ashanti | Year ended 31 December | ||||||||||||||||
| (in $ millions) | 2020 | 2019 | 2018 | ||||||||||||||
| Continuing operations | |||||||||||||||||
| Revenue from product sales | 4,427 | 3,525 | 3,336 | ||||||||||||||
| Cost of sales | (2,699) | (2,626) | (2,584) | ||||||||||||||
| Total of all other (expenses) income | (417) | (448) | (429) | ||||||||||||||
| Share of associates and joint ventures’ profit (loss) | 278 | 168 | 122 | ||||||||||||||
| Taxation | (625) | (250) | (212) | ||||||||||||||
| Discontinued operations | |||||||||||||||||
| Profit (loss) from discontinued operations | 7 | (376) | (83) | ||||||||||||||
| Net profit (loss) attributable to equity shareholders | |||||||||||||||||
| - Continuing operations | 946 | 364 | 216 | ||||||||||||||
| - Discontinued operations | 7 | (376) | (83) | ||||||||||||||
| Net profit (loss) attributable to non-controlling interests | |||||||||||||||||
| - Continuing operations | 18 | 5 | 17 | ||||||||||||||
| Cost of sales for AngloGold Ashanti | Year ended 31 December | ||||||||||||||||
| (in $ millions) | 2020 | 2019 | 2018 | ||||||||||||||
| Total cost of sales | 2,699 | 2,626 | 2,584 | ||||||||||||||
| Inventory change | (21) | (5) | (9) | ||||||||||||||
| Amortisation of tangible assets | (521) | (538) | (553) | ||||||||||||||
| Amortisation of intangible assets | (2) | (3) | (5) | ||||||||||||||
| Amortisation of right of use assets | (47) | (42) | — | ||||||||||||||
| Retrenchment costs | (2) | (4) | (4) | ||||||||||||||
| Rehabilitation and other non-cash costs | (32) | (53) | (17) | ||||||||||||||
| Total cash costs | 2,074 | 1,981 | 1,996 | ||||||||||||||
Our gold income is materially impacted by price and volume variances. All of our costs are impacted by the consequences of average exchange rate movements.
Exchange fluctuations in and the average exchange rates for the South African rand, Brazilian real, Australian dollar and the ArgentinianArgentinean peso have effects on the various components that make up our costs based on the level of local procurement of each of these costs. For a discussion of the effect of foreign exchange fluctuations on our financial results, see “Item“Item 5A: Operating Results—Key factors affecting results—Foreign exchange fluctuations”.
Revenue from product sales
Revenue from product sales increaseddecreased by $902$566 million, or 2612 percent, from $3,525$4,595 million in 20192020 to $4,427$4,029 million in 2020,2021, mainly as a result of thea decrease in gold income, partly offset by an increase in by-product revenue. Gold income decreased by $587 million, or 13 percent, from $4,490 million in 2020 to $3,903 million in 2021. This decrease was mainly due to a decrease in ounces of gold sold, partly offset by an increase in the average gold price received of $384$18 per ounce. Gold income increased by $883 million, or 26 percent, from $3,439 million in 2019 to $4,322 million in 2020, due to the increase in the average gold price received partially offset by the decrease in gold sold. Gold sold decreased by 34,000354,000 ounces, or one14 percent, from 2.4102.470 million ounces in 20192020 to 2.3762.116 million ounces in 2020,2021, which resulted in a decrease in gold income of $49$619 million. The average gold price received increased by $384$18 per ounce, or 28one percent, from $1,394$1,778 per ounce during 20192020 to $1,778$1,796 per ounce in 2020,2021, which resulted in an increase in gold income of $932$32 million. By-product revenue increased by $19$21 million, or 2220 percent, tofrom $105 million from $86in 2020 to $126 million in 2019,2021, mainly due to an increase in revenue from silver.
Revenue from product sales from the Africa operations increased(excluding equity-accounted joint ventures) decreased by $535$305 million, or 3413 percent, to $2,125from $2,293 million in 2020 from $1,590to $1,988 million in 2019,2021, mainly as a result of thea decrease in gold income. Gold income (excluding equity-accounted joint ventures) decreased by $305 million, or 13 percent, from $2,290 million in 2020 to $1,985 million in 2021. This decrease was mainly due to lower ounces of gold sold, partly offset by an increase in the average gold price received,received. Gold sold decreased by 189,000 ounces, or 15 percent, from 1.249 million ounces in 2020 to 1.060 million ounces in 2021, which resulted in an increase of gold income of $443 million. The increase in gold ounces of 59,000 ounces sold contributed to an increasea decrease in gold income of $91$317 million. The increasedecrease was mainly due to the transition to predominantly underground operations which resulted in increased tonnes treatedlower production from Iduapriem, Obuasi and Geita, partly offset by higher production at Geita and the commissioningSiguiri. For a discussion of the Obuasi redevelopment project. Once commissioned, Obuasi sold 27,000 ounces despite delays in the pre-production phase receiving equipment and in the arrival of skilled personnel, critical to the project, as a result of the lockdowns in various jurisdictions during 2020. A marginal increasedecrease in production at Siguiri was due to the increaseAfrica operations during 2021, see “Item 5A: Operating Results—Key factors affecting results—Production in hard rock processing capability resulting in a higher plant throughput during 2020. The higher plant throughput was partially offset by lower than planned recovery rate from high levels of carbon in the ore affecting the capacity to recover gold. Steady production performance was achieved at Iduapriem.
2021”
Revenue from product sales from the Americas operations increaseddecreased by $229$163 million, or 2112 percent, from $1,081 million in 2019 to $1,310 million in 2020 to $1,147 million in 2021, mainly as a result of thea decrease in gold income, partly offset by an increase in by-product revenue. Gold income decreased by $183 million, or 15 percent, from $1,211 million in 2020 to $1,028 million in 2021. This decrease was mainly due to lower ounces of gold sold, partly offset by an increase in the average gold price received which resulted in an increase of gold income of $261 million.received. Gold income increasedsold decreased by $211 million,103,000 ounces, or 2116 percent, from $1,000664,000 million in 2019 to $1,211 million in 2020. The increase was partly offset by a decrease of 36,000 ounces in gold sold2020 to 561,000 ounces in 2020,2021, which resulted in a decrease in gold income of $50$194 million. Gold production primarily decreased at Cerro Vanguardia due to the effect of lower planned grades aligned to the current life-of-mine plan and due to lower tonnes treated asFor a resultdiscussion of the impactdecrease in production at the Americas operations during 2021, see “Item 5A: Operating Results—Key factors affecting results—Production in 2021”. The increase in average gold price received resulted in an increase of the COVID-19 pandemic. Production was also lower at Serra Grande due to lower grades as a resultgold income of geological model changes, grade control changes and operational delays at high grade stope areas, further impacted by absenteeism due to the COVID-19 pandemic. Production was maintained at AGA Mineração despite the impact of stoppages and absenteeism due to COVID-19, unexpected heavier-than-normal rains in the first half of the year, as well as geotechnical issues on the high-grade areas.$11 million. By-product revenue increased by $18$20 million, or 2220 percent, tofrom $99 million from $81in 2020 to $119 million in 2019,2021, mainly due to an increase in revenue from silver.
156
Revenue from product sales from the Australia operations decreased by $98 million, or ten percent, from $992 million in 2020 to $894 million in 2021, mainly as a result of a decrease in gold income, partly offset by an increase in by-product revenue. Gold income decreased by $99 million, or ten percent, from $989 million in 2020 to $890 million in 2021. This decrease was mainly due to lower ounces of gold sold, partly offset by an increase in the average gold price received. Gold sold decreased by 62,000 ounces, or 11 percent, from 557,000 million ounces in 2020 to 495,000 ounces in 2021, which resulted in a decrease in gold income of $108 million. For a discussion of the decrease in production at the Australia operations during 2021, see “Item 5A: Operating Results—Key factors affecting results—Production in 2021”. The increase in the average gold price received resulted in an increase in gold income of $9 million. By-product revenue increased by $1 million, or 33 percent, from $3 million in 2020 to $4 million in 2021, mainly due to an increase in revenue from silver.
Cost of sales
Cost of sales increased by $28 million, or one percent, from $2,626 million in 2019 to $2,699$2,829 million in 2020 which represents a $73to $2,857 million or three percent, increase.in 2021. The increase was primarily due to an increase in cash operating costs by $50$148 million, or threeseven percent, to $1,881 million from $1,831$2,012 million in 2019 and2020 to $2,160 million in 2021, an increase in royalties paid by $44 million, or 32 percent, to $181 million from $137 million in 2019, partly offset by a decrease in environmental rehabilitation and other non-cash costs by $21$6 million, or 4019 percent, tofrom $32 million in 2020 from $53to $38 million in 2019.2021, and an increase in amortisation of right of use assets by $16 million, or 34 percent, from $47 million in 2020 to $63 million in 2021. The increase was partly offset by a decrease in royalties paid by $19 million, or ten percent, from $181 million in 2020 to $162 million in 2021, a decrease in amortisation of tangible assets of $115 million, or 22 percent, from $526 million in 2020 to $411 million in 2021 and an inventory change of $8 million, or 57 percent, from a charge of $14 million in 2020 to a charge of $6 million in 2021. The increase in cash operating costs was mainly due to higher labour and contractorcontractors’ costs, commodity prices, logistics costs, consumable stores, COVID-19 pandemic related spend,expenditure, services, and other charges, partly offset by lower fuel and power costs. Higher labour and contractors’ costs were mainly due to COVID-19 related cost increases resulting from challenges with travel restrictions and shortages of critical skills at certain operations. Higher commodity costs were mainly due to an increase in the prices of steel, support and construction materials, lime and other reagents. COVID-19 presented challenges within the overall logistics sector resulting in higher cost of transportation, warehousing and inventory prices. Higher fuel and power costs were mainly due to the increase in the average price of Brent Crude oil, which increased from $42 per barrel in 2020 to $71 per barrel in 2021, a $29, or a 69 percent, per barrel increase. The decreaseincrease in environmental rehabilitation and other non-cash costs primarily arose from the changes to restoration provision cash flows inflation rates and discount ratesin 2021 compared to 2019.
In Africa, cost of sales decreased by $62 million, or five percent, from $1,362 million in 2020 to $1,300 million in 2021. The decrease was mainly due to lower amortisation of waste stripping and lower royalties paid due to a decrease in ounces of gold sold in 2021 as compared to 2020. The decrease in cost of sales was partly offset by an increase in labour and contractors’ costs, commodity prices, logistics costs, consumable stores, environmental rehabilitation and other non-cash costs, amortisation of right of use assets, services and other charges, power and fuel costs and higher ore stockpile adjustments. Higher commodity costs were mainly due to an increase in the prices of steel, support and construction materials, lime and other reagents. COVID-19 presented challenges within the overall logistics sector resulting in higher cost of transportation, warehousing and inventory prices. The higher fuel and power costs were mainly due to the increase in the price of Brent Crude oil.
In the Americas, cost of sales increased by $58 million, or eight percent, from $764 million in 2020 to $822 million in 2021. The increase was mainly due to an increase in labour and contractors’ costs, commodity prices, logistics costs, consumable stores, amortisation of right of use assets, services and other charges, power and fuel cost, write down of inventory and environmental rehabilitation and other non-cash costs. The higher labour and contractors’ costs were mainly due to COVID-19 related cost increases resulting from challenges with travel restrictions and shortages of critical skills. Higher commodity costs were mainly due to an increase in the prices of steel, support and construction materials, lime and other reagents. COVID-19 presented challenges within the overall logistics sector resulting in higher cost of transportation, warehousing and inventory prices. The higher fuel costs were mainly due to the increase in the price of Brent Crude oil. The increase in cost of sales was partly offset by lower royalties paid due to a decrease in ounces of gold sold in 2021 as compared to 2020, lower amortisation of tangible assets due to a decrease in ounces of gold produced in 2021 as compared to 2020 and the weakening of the local currencies against the US dollar. The Argentinean peso weakened by 35 percent and the Brazilian real by five percent, against the US dollar.
In Australia, cost of sales increased by $35 million, or five percent, from $705 million in 2020 to $740 million in 2021. The increase was mainly due to an increase in labour and contractors’ costs, commodity prices, logistics costs, consumable stores, amortisation of right of use assets, services and other charges, power and fuel costs, ore stockpile adjustments and the strengthening of the Australian dollar against the US dollar by eight percent. The higher labour and contractors’ costs were
157
mainly due to COVID-19 related cost increases resulting from challenges with travel restrictions and shortages of critical skills. Higher commodity costs were mainly due to an increase in the prices of steel, support and construction materials, lime and other reagents. COVID-19 presented challenges within the overall logistics sector resulting in higher cost of transportation, warehousing and inventory prices. The higher fuel costs were mainly due to the increase in the price of Brent Crude oil. The increase in cost of sales was partly offset by lower environmental rehabilitation and other non-cash costs, lower amortisation of waste stripping due to lower levels of stripping in 2021 as compared to 2020 and lower royalties paid due to a decrease in ounces of gold sold in 2021 as compared to 2020.
Total cash costs
Total cash costs increased by $128 million, or six percent, from $2,206 million in 2020 to $2,334 million in 2021. The increase was primarily due to an increase in cash operating costs, partly offset by a decrease in royalties paid. Total cash costs include cash operating costs (which include salaries and wages, stores, explosives, reagents, logistics, fuel, power, water and contractors’ costs), royalties and other cash costs. The strengthening of the Australian dollar against the US dollar contributed to the increase in total cash costs, which was partly offset by the weakening of local currencies against the US dollar in Brazil and Argentina.
Cash operating costs increased by $148 million, or seven percent, from $2,012 million in 2020 to $2,160 million in 2021, primarily due to higher labour and contractors’ costs, commodity prices, logistics costs, consumable stores, COVID-19 pandemic related expenditure, services and other charges as well as higher fuel and power costs. The strengthening of the Australian dollar against the US dollar contributed to the increase in total cash costs, which was partly offset by the weakening of local currencies against the US dollar in Brazil and Argentina. Cash operating costs includes salaries and wages, stores, explosives, reagents, logistics, fuel, power, water and contractors’ costs.
Royalties, which are generally calculated as a percentage of revenue, decreased by $19 million, or ten percent, from $181 million in 2020 to $162 million in 2021. The decrease was primarily due to a decrease in gold sales across all mining operations with the exception of Siguiri and Kibali. The decrease was partly offset by an increased average gold price received per ounce.
Retrenchment costs
Retrenchment costs included in cost of sales remained unchanged at $2 million in 2021 as compared to 2020.
Rehabilitation and other non-cash costs
Environmental rehabilitation and other non-cash costs increased by $6 million, or a 19 percent, from $32 million in 2020 to $38 million in 2021.The increase was mainly due to changes in design of TSFs in Brazil to dry-stacked structures to comply with new legal requirements, changes in mine plans resulting in a change in cash flows and changes in the methodology used to calculate such estimates in response to comments from environmental regulatory authorities and changes in global economic assumptions.
Amortisation of tangible, intangible and right of use assets
Amortisation of tangible, intangible and right of use assets expense decreased by $98 million, or 17 percent, from $583 million in 2019 to $570$575 million in 2020 which represents a $13to $477 million or two percent, decrease. in 2021.
Amortisation of tangible assets decreased by $17$115 million, or three22 percent, from $538 million in 2019 to $521$526 million in 2020 largelyto $411 million in 2021. The decrease was mainly due to lower amortisation at Geita due to lower production at Cerro Vanguardia,and the closure of the Nyankanga Cut 8 open pit in 2021, the reset of useful life in February 2021 for the heavy moving equipment fleet resulting in lower depreciation onamortisation compared to 2020, and the waste stripping asset at Tropicanareset of the useful life in February 2021 for Mineral Reserve development amortisation drivers and lower Mineral Reserve development capital expenditures in 2021 compared to 2020. At Iduapriem, amortisation was lower than in 2020 mainly due to lower ore sourced from open pit while moving into a waste stripping phaseproduction and lower deferred stripping amortisation in 2021 at Serra GrandeTeberebie Cut 1 and Geita. TheCut 3, at AGA Mineração, amortisation was lower mainly due to lower production, and at Tropicana, amortisation was lower mainly due to lower production and lower deferred stripping amortisation, partly offset by higher Mineral Reserve development amortisation. This decrease was partiallypartly offset by an increase in amortisation at Iduapriem due to higher depreciation on the waste stripping asset and commencing amortisation at Obuasi following its commissioning.as the redevelopment project progressed.
Amortisation relatingof intangible assets increased by $1 million, or 50 percent, from $2 million in 2020 to $3 million in 2021, mainly due to higher software and licence expenditure at Obuasi as compared to 2020.
Amortisation of right of use assets increased by $5$16 million, or 1234 percent, from $42 million in 2019 to $47 million in 2020 to $63 million in 2021 largely at AGA Mineração, Serra Grande and Serra Grande.Geita mainly due to a change in business strategy whereby certain heavy mobile equipment is leased at these operations.
158
Inventory change
Inventory increasedchange decreased from $5 million in 2019 to $21a charge of $14 million in 2020 to a charge of $6 million in 2021, which represents a $16$8 million, or 32057 percent, increase, largelydecrease. This decrease was primarily due to inventory movementslower cost and amortisation at Cerro Vanguardia which drew down on stockpiles.of $23 million due to fewer ounces produced and sold than in 2020 and lower cost at Geita of $11 million with fewer ounces produced and sold, partly offset by an inventory valuation upward adjustment at Obuasi of $14 million as a result of timing of shipment.
Impairment, derecognition of assets and profit (loss) on disposal
Other expenses decreased(expenses) income
Other (expenses) income increased by $79 million, or 139 percent, from $83 million in 2019 toan expense of $57 million in 2020 which represents a $26to an expense of $136 million or 31 percent, decrease.in 2021. The decreaseincrease in expenses during 2021 was largely due to the commissioning of the Obuasi redevelopment project with no care and maintenance activities at the Obuasi mine, retrenchment and related costs, incurred duringpremium on settlement of bonds and a refund from an insurance claim in 2020 and the public infrastructure contribution in Guinea during 2019 which was not repeated in 2020,2021. Underground mining activities were voluntarily suspended between 18 May 2021 and 15 October 2021 at the Obuasi mine, following a sill pillar incident. From 15 October 2021, underground mining resumed to replenish the run-of-mine stockpile without corresponding gold production. Since the voluntary suspension of underground mining activities, care and maintenance costs of $45 million were incurred at Obuasi during 2021. Retrenchment and related costs of $18 million were incurred during 2021 as part of the transition to the new Operating Model. Bond settlement costs during 2021 related to costs associated with the tender offer for, and subsequent redemption of, the $750 million aggregate principal amount of 5.125% notes due 2022 and amounted to $24 million. These increases in expenses were partly offset by power grid refunds in Brazil during 2019 which were not repeated in 2020, the refundlower cost of an insurance claimlegacy tailings operations, mainly at Obuasi, due to fewer activities at such legacy tailings operations, lower VAT and increased export-duty receivables at Cerro Vanguardia.other duties expensed.
Finance costs and unwinding of obligations
Finance costs decreased by $5$28 million, or three20 percent, tofrom $138 million in 2020 compared to $143$110 million in 2019,2021, mainly due to an increase in capitalisation of interest against the Obuasi redevelopment project, lower finance costs from borrowings.borrowings and amortisation fees as 2020 included finance costs related to a $1.0 billion standby credit facility not repeated in 2021. Unwinding of obligations increaseddecreased by $10$33 million, or 3485 percent, tofrom $39 million in 2020 compared with $29to $6 million in 2019,2021, mainly due to an increasea decrease in unwinding of other indirect taxes at Geita.
Share of associates and joint ventures’ profit
Share of associates and joint ventures’ profit increaseddecreased by $110$29 million, or 65ten percent, tofrom a profit of $278 million in 2020 compared to a profit of $168$249 million in 2019,2021 mainly as a result of an increasea decrease in equity earnings of $95$7 million at Kibali and $7$5 million at Rand Refinery. On 10 November 2020, AngloGold Ashanti together with its joint venture partner Barrick completedRefinery (Pty) Limited, as well as a profit of $19 million on the sale of the Morila gold mineand Sadiola mines in Mali to Firefinch Limited. On 30 Decemberduring 2020 AngloGold Ashanti together with its joint venture partner IAMGOLD completed the salenot repeated in 2021, partly offset by losses of the Sadiola gold mine in Mali to Allied Gold. See “Item 4B: Business Overview—Regulatory Environment Enabling AngloGold Ashanti to Mine—Africa—Mali”.
Taxation
A taxation expense of $625$312 million was recorded in 2020,2021, compared to ana taxation expense of $250$625 million in 2019,2020, which represents a $375$313 million, or 15050 percent, increase.decrease. Charges for current tax in 20202021 amounted to $248 million, compared to $562 million compared to $298 million in 2019,2020, which represents a $264$314 million, or 8956 percent, increase.decrease. The increasedecrease in current tax iswas mainly due to higher earningslower pre-tax profit in Ghana, Australia, Ghana, TanzaniaBrazil, Argentina and Argentina.Tanzania. Charges for deferred tax in 20202021 amounted to a net deferred tax expense of $63$64 million, compared to a net deferred tax benefit of $48$63 million in 2019,2020, which represents a $111$1 million, or 231two percent, increase. The increase in the deferred taxation expense mainly relates to the derecognition of deferred tax assets in South Africa during the fourth quarter of 2020.
Discontinued operations
A profit from discontinued operations of $7 million was recorded in 2020, compared to a loss of $376 millionwhich was not repeated in 2019, which represents a $383 million increase.2021. The profit of $7 million consists of an operating loss after tax of $9 million and an impairment reversal of $16 million. TheAs a result of the sale of the Company’s remaining South African producing assets and related liabilities in September 2020, the South African operations have beenwere accounted for as discontinued operations. Refer to “Item 18: Financial Statements—Note 9—Discontinued operations and assets and liabilities held for sale” for further details.
159
Comparison of capital expenditure in 2020, 20192022, 2021 and 20182020
The following table presents capital expenditure data from continuing operations for the AngloGold Ashanti groupGroup for the three-year period ended 31 December 2020:2022:
| Capital expenditure data for AngloGold Ashanti | Year ended 31 December | |||||||||||||||||||
| (in $ millions) | 2022 | 2021 | 2020 | |||||||||||||||||
| Restated | ||||||||||||||||||||
| Capital expenditure | 1,118 | 1,100 | 795 | |||||||||||||||||
| - Consolidated entities | 1,028 | 1,028 | 739 | |||||||||||||||||
| - Equity-accounted joint ventures | 90 | 72 | 56 | |||||||||||||||||
| Capital expenditure data for AngloGold Ashanti | Year ended 31 December | |||||||||||||||||||
| (in $ millions) | 2020 | 2019 | 2018 | |||||||||||||||||
| Capital expenditure | 757 | 754 | 645 | |||||||||||||||||
| - Consolidated entities | 701 | 703 | 576 | |||||||||||||||||
| - Equity accounted joint ventures | 56 | 51 | 69 | |||||||||||||||||
Total capital expenditure was $757(including equity-accounted joint ventures) increased by $18 million, or two percent, from $1,100 million in 2020, compared2021 to $754$1,118 million in 2019. This represents a $3 million increase from 2019.2022. This increase iswas mainly due to increased expenditure on existing operationssustaining capital ($91 million) and non-sustaining project capital ($17 million). AngloGold Ashanti embarked on a multi-year initiative at the beginning of 2020 to increase investment in Mineral Reserve development and brownfields exploration. The aim of this investment is to increase the rate of Mineral Reserve conversion, extend the reserve lives of our assets, enhance mining flexibility and further improve our knowledge of the ore bodies in the portfolio.
In Africa (including equity-accounted joint ventures), capital expenditure increased by $70 million, or 14 percent, from $506 million in 2021 to $576 million in 2022. At Iduapriem in Ghana, capital expenditure increased by $41 million from $105 million in 2021 to $146 million in 2022, mainly due to waste stripping at Cut 2 and increased non-sustaining project capital expenditure for work relating to buttressing the TSF, partly offset by reducedlower pre-stripping activities. At Obuasi in Ghana, capital expenditure decreased by $9 million from $168 million in 2021 to $159 million in 2022, mainly due to lower non-sustaining project capital expenditure as construction of Phase 2 of the Obuasi redevelopment project was completed at the end of December 2021. Phase 3 of the Obuasi redevelopment project, which relates principally to capital expenditure to refurbish existing infrastructure around the KMS Shaft, as well as to service the mine in deeper production areas, continues to progress. At Siguiri in Guinea, capital expenditure decreased by $11 million from $38 million in 2021 to $27 million in 2022, mainly due to lower non-sustaining project capital expenditure at Block 2 during 2022 and lower stay-in-business capital expenditure due to expenditure relating to the construction of a haul road by Block 2 during 2021 not being repeated in 2022. At Geita in Tanzania, capital expenditure increased by $31 million from $123 million in 2021 to $154 million in 2022, mainly due to an increase in sustaining capital expenditure, partly offset by lower non-sustaining capital expenditure. Sustaining capital expenditure increased mainly due to an increase in deferred stripping, higher stay-in-business capital expenditure and Mineral Reserve development expenditure as the underground portal development at Geita Hill East progressed according to plan. Lower non-sustaining project capital expenditure was mainly due to the Nyamulilima open pit being commissioned during 2022. At Kibali in the DRC, capital expenditure increased by $18 million from $72 million in 2021 to $90 million in 2022, mainly due to increased sustaining capital expenditure on the cyanide recovery plant and increased non-sustaining exploration.
In the Americas, capital expenditure decreased by $24 million, or seven percent, from $346 million in 2021 to $322 million in 2022. In Brazil, AngloGold Ashanti completed the conversion of existing TSFs to dry-stacking facilities at all mine sites, in a market characterised by increased competition for skills and engineering resources due to the COVID-19 pandemic and the industry-wide requirements to meet regulatory deadlines relating to TSFs. Capital expenditures required in 2022 to implement this new technology amounted to approximately $83 million. At AGA Mineração in Brazil, capital expenditure increased by $4 million from $195 million in 2021 to $199 million in 2022, mainly due to higher sustaining capital expenditure for mine development costs and continuing expenditure on TSFs to meet regulatory requirements. At Serra Grande in Brazil, capital expenditure decreased by $25 million from $82 million in 2021 to $57 million in 2022, mainly due to lower mine development expenditure offset by higher TSF expenditure. At Cerro Vanguardia in Argentina, capital expenditure decreased by $3 million from $69 million in 2021 to $66 million in 2022, mainly due to lower expenditure on TSF embankment raise and lower deferred stripping capital compared to 2021.
In Australia, capital expenditure increased by $17 million, or eight percent, from $185 million in 2021 to $202 million in 2022. At Sunrise Dam in Australia, capital expenditure decreased by $12 million from $62 million in 2021 to $50 million in 2022, mainly due to non-sustaining project capital expenditure incurred on the Golden Delicious open pit growth project having been commissioned in 2021 and not repeated in 2022. At Tropicana in Australia, capital expenditure increased by $30 million from $122 million in 2021 to $152 million in 2022, mainly due to increased non-sustaining project capital expenditure for increased waste mining in the Havana Cutback Project during 2022. At Australia other, capital expenditure decreased by $1 million from $1 million in 2021 to nil in 2022, mainly due to lower exploration equipment expenditure.
In Projects, capital expenditure decreased by $35 million, or 67 percent, from $52 million in 2021 to $17 million in 2022. At Quebradona in Colombia, capital expenditure decreased by $28 million from $33 million in 2021 to $5 million in 2022, mainly due to the higher capitalisation of land and feasibility study costs for the growth project in 2021. At Gramalote in Colombia, capital expenditure decreased by $9 million from $19 million in 2021 to $10 million in 2022, mainly due to the purchase of the
160
La Cascada property in 2021 and higher feasibility study costs of the growth project in 2021. During 2022, there was no capital expenditure at La Colosa in Colombia. In Nevada, USA, capital expenditure increased by $1 million from nil in 2021 to $1 million in 2022, mainly due to pre-feasibility studies, and purchase of light motor vehicles and land.
At the Corporate Office in Johannesburg, capital expenditure decreased by $10 million from $11 million in 2021 to $1 million in 2022, mainly due to expenditure on new furniture and computer equipment in connection with the relocation of the Corporate Office to a new building having been incurred in 2021 and not being repeated in 2022.
Comparison of capital expenditure in 2021 with 2020
Total capital expenditure (including equity-accounted joint ventures) increased by $304 million, or 38 percent, from $796 million in 2020 to $1,100 million in 2021. This increase was mainly due to increased expenditure on sustaining capital ($281 million) and non-sustaining project capital ($623 million). CapitalAngloGold Ashanti embarked on a multi-year initiative at the beginning of 2020 to increase investment in Mineral Reserve development and brownfields exploration. The aim of this investment is to increase the rate of Mineral Reserve conversion, extend the reserve lives of our assets, enhance mining flexibility and further improve our knowledge of the ore bodies in the portfolio.
In Africa (including equity-accounted joint ventures), capital expenditure increased atby $71 million, or 16 percent, from $435 million in 2020 to $506 million in 2021. At Iduapriem in Ghana, capital expenditure increased by $44$45 million from $16 million in 2019 to $60 million in 2020 to $105 million in 2021, mainly due to higher pre-stripping activities and stay-in-business capital. Capitalcapital expenditure. At Obuasi in Ghana, capital expenditure increased by $38 million from $130 million in 2020 to $168 million in 2021, mainly due to a change in scoping activities, the commissioning and ramping up of underground activities and the start of Phase 3 of the Obuasi redevelopment project. Phase 2 construction was completed at the end of December 2021. At Siguiri in Guinea, capital expenditure increased by $8 million from $22 million in 2019 to $30 million in 2020 to resolve the current recovery and throughput challenges of the newly commissioned plant. Capital$38 million in 2021, mainly due to increased stay-in-business capital expenditure increased atincurred to construct a haul road by Block 2. At Geita in Tanzania, capital expenditure increased by $12$36 million from $75 million in 2019 to $87 million in 2020 to $123 million in 2021, mainly due to increased Orean increase in non-sustaining project capital expenditure with the start of the Nyamulilima project, an increase in non-sustaining exploration costs, partly offset by lower stay-in-business capital expenditure mainly related to Mineral Reserve development expenditure. At Kibali in the DRC, capital expenditure increased by $20 million from $52 million in 2020 to $72 million in 2021, mainly due to more underground activitieshigher deferred stripping and more exploration work done in 2020. Capitalnon-sustaining project capital expenditure.
In the Americas, capital expenditure increased by $178 million, or 106 percent, from $168 million in 2020 to $346 million in 2021. In Brazil, AngloGold Ashanti continued its investment to convert existing TSFs to dry-stacking facilities at all mine sites, in a market characterised by increased competition for skills and engineering resources due to the COVID-19 pandemic and the industry-wide requirements to meet regulatory deadlines relating to TSFs. Capital expenditures required in 2021 to implement this new technology amounted to approximately $140 million. At AGA Mineração in Brazil, capital expenditure increased by $92 million from $103 million in 2020 to $195 million in 2021, mainly due to higher mine development costs and higher expenditure on TSFs. At Serra Grande in Brazil, capital expenditure increased by $49 million from $33 million in 2020 to $82 million in 2021, mainly due to higher mine development and TSF expenditures. At Cerro Vanguardia in Argentina, capital expenditure increased by $38 million from $31 million in 2020 to $69 million in 2021, mainly due to higher expenditure on TSF embankment raise and higher deferred stripping capital.
In Australia, capital expenditure increased by $42 million, or 29 percent, from $143 million in 2020 to $185 million in 2021. At Sunrise Dam in Australia, capital expenditure increased by $10$9 million from $43 million in 2019 to $53 million in 2020 to $62 million in 2021, mainly due to increased Ore Reserve developmentnon-sustaining project capital expenditure in new mining areas, asset integrity and start ofincurred on the Golden Delicious open pit growth project. CapitalAt Tropicana in Australia, capital expenditure increased at AGA Mineração in Brazil by $12$33 million from $91 million in 2019 to $103$89 million in 2020 to $122 million in 2021, mainly due to higher deferred stripping, Mineral Reserve and other stay-in-business capital expenditure, as well as increased Ore Reserve developmentnon-sustaining project capital expenditure and spend on tailings storage facilities. Capitalwith the approval of the Havana Cutback Project in 2021. At Australia other, capital expenditure increased by $4$1 million atfrom nil in 2020 to $1 million in 2021, mainly due to exploration equipment expenditure.
In Projects, capital expenditure increased by $3 million, or six percent, from $49 million in 2020 to $52 million in 2021. At Quebradona in Colombia, from $36capital expenditure decreased by $7 million in 2019 tofrom $40 million in 2020 to $33 million in 2021, mainly due to increasedthe higher capitalisation of land for the growth project. Capitalproject in 2020. At Gramalote in Colombia, capital expenditure increased by $8$10 million at Gramalote in Colombia from $1 million in 2019 to $9 million in 2020 to $19 million in 2021, mainly due to increased spend onhigher feasibility study costs of the growth project. CapitalDuring 2021, there was no capital expenditure decreasedat La Colosa in Colombia or in Nevada, USA.
At the Corporate Office in Johannesburg, capital expenditure increased by $78$9 million at Obuasi in Ghana from $246 million in 2019 to $168$2 million in 2020 to $11 million in 2021, mainly due to expenditure on new furniture and computer equipment in connection with the commissioning of phase 1relocation of the redevelopment project on 1 October 2020, capitalisation of pre-production gold revenue against the project and delays asCorporate Office to a result of COVID-19. Capital expenditure decreased by $17 million at Tropicana from $106 million in 2019 to $89 million in 2020, due to lower deferred stripping, partly offset by higher pre-stripping capital and spend on the Boston Shaker growth project.new building.
Comparison of operating performance on a segment basis for 2020, 20192022, 2021 and 20182020
The companyCompany produces gold as its primary product and does not have distinct divisional segments in terms of principal business activity, but manages its business on the basis of different geographic segments. Therefore, information regarding separate geographic segments is provided.
| (in millions) | Year ended 31 December | ||||||||||||||||||||||||||||||||||
| 2020 | 2019 | 2018 | |||||||||||||||||||||||||||||||||
| $ | percent | $ | percent | $ | percent | ||||||||||||||||||||||||||||||
| Geographical analysis of gold income by origin is as follows: | |||||||||||||||||||||||||||||||||||
| Africa | 2,769 | 58 | 2,203 | 55 | 1,983 | 52 | |||||||||||||||||||||||||||||
| Australia | 989 | 21 | 851 | 21 | 780 | 20 | |||||||||||||||||||||||||||||
| Americas | 1,211 | 26 | 1,000 | 25 | 1,021 | 27 | |||||||||||||||||||||||||||||
| 4,969 | 4,054 | 3,784 | |||||||||||||||||||||||||||||||||
| Less : Associates and equity-accounted joint ventures included above | (647) | (14) | (615) | (15) | (581) | (15) | |||||||||||||||||||||||||||||
| Continuing operations | 4,322 | 3,439 | 3,203 | ||||||||||||||||||||||||||||||||
| Discontinued operations | 408 | 9 | 554 | 14 | 602 | 16 | |||||||||||||||||||||||||||||
| 4,730 | 100 | 3,993 | 100 | 3,805 | 100 | ||||||||||||||||||||||||||||||
| (in millions) | Year ended 31 December | ||||||||||||||||||||||||||||||||||
| 2020 | 2019 | 2018 | |||||||||||||||||||||||||||||||||
| $ | percent | $ | percent | $ | percent | ||||||||||||||||||||||||||||||
| Geographical analysis of assets by origin is as follows: | |||||||||||||||||||||||||||||||||||
| South Africa | — | — | 697 | 10 | 1,106 | 17 | |||||||||||||||||||||||||||||
| Africa | 3,956 | 51 | 3,514 | 51 | 3,135 | 47 | |||||||||||||||||||||||||||||
| Australia | 1,044 | 14 | 972 | 14 | 888 | 13 | |||||||||||||||||||||||||||||
| Americas | 1,626 | 21 | 1,427 | 21 | 1,286 | 19 | |||||||||||||||||||||||||||||
| Other, including non-gold producing subsidiaries | 1,046 | 14 | 253 | 4 | 228 | 4 | |||||||||||||||||||||||||||||
| Total assets | 7,672 | 100 | 6,863 | 100 | 6,643 | 100 | |||||||||||||||||||||||||||||
Gold income
| (in millions) | Year ended 31 December | ||||||||||||||||||||||||||||||||||
| 2022 | 2021 | 2020 | |||||||||||||||||||||||||||||||||
| $ | percent | $ | percent | $ | percent | ||||||||||||||||||||||||||||||
| Restated | |||||||||||||||||||||||||||||||||||
| Geographical analysis of gold income by origin is as follows: | |||||||||||||||||||||||||||||||||||
| Africa | 2,981 | 68 | 2,644 | 68 | 2,937 | 60 | |||||||||||||||||||||||||||||
| Australia | 967 | 22 | 890 | 23 | 989 | 20 | |||||||||||||||||||||||||||||
| Americas | 1,036 | 24 | 1,028 | 26 | 1,211 | 25 | |||||||||||||||||||||||||||||
| 4,984 | 4,562 | 5,137 | |||||||||||||||||||||||||||||||||
| Less : Associates and equity-accounted joint ventures included above | (596) | (14) | (659) | (17) | (647) | (13) | |||||||||||||||||||||||||||||
| Continuing operations | 4,388 | 3,903 | 4,490 | ||||||||||||||||||||||||||||||||
| Discontinued operations | — | — | — | — | 408 | 8 | |||||||||||||||||||||||||||||
| 4,388 | 100 | 3,903 | 100 | 4,898 | 100 | ||||||||||||||||||||||||||||||
Assets
| (in millions) | Year ended 31 December | ||||||||||||||||||||||||||||||||||
| 2022 | 2021 | 2020 | |||||||||||||||||||||||||||||||||
| $ | percent | $ | percent | $ | percent | ||||||||||||||||||||||||||||||
| Restated | Restated | ||||||||||||||||||||||||||||||||||
| Geographical analysis of assets by origin is as follows: | |||||||||||||||||||||||||||||||||||
| Africa | 4,083 | 51 | 4,226 | 53 | 3,989 | 52 | |||||||||||||||||||||||||||||
| Australia | 960 | 12 | 1,034 | 13 | 1,044 | 13 | |||||||||||||||||||||||||||||
| Americas | 1,406 | 17 | 1,573 | 20 | 1,370 | 18 | |||||||||||||||||||||||||||||
Projects (1) | 872 | 11 | 313 | 4 | 256 | 3 | |||||||||||||||||||||||||||||
| Other, including non-gold producing subsidiaries | 751 | 9 | 854 | 10 | 1,046 | 14 | |||||||||||||||||||||||||||||
| Total assets | 8,072 | 100 | 8,000 | 100 | 7,705 | 100 | |||||||||||||||||||||||||||||
(1) A new segment for Projects (previously reported under the Americas segment) has been introduced due to the implementation of the new Operating Model which comprises all the major non-sustaining capital projects with the potential to be developed into operating entities. Comparative information has been restated.
At 31 December 2022, 31 December 2021 and 31 December 2020, none of AngloGold Ashanti’s totalproducing assets were located in South Africa, compared with ten percent at 31 December 2019, as a result of the endsale of 2019 due to the Company’s remaining South African producing assets and related liabilities being sold to Harmony.Harmony in September 2020. The remaining operations collectively accounted for approximately 100 percent of AngloGold Ashanti’s total assets at 31 December 20202022 compared to 90 percent at the end of the same period in 2019.
Non-GAAP analysis
All-in sustaining costs and all-in costs
During 2018, the World Gold Council (WGC)(“WGC”), an industry body, published an updated Guidance Note on “all-in sustaining costs” and “all-in costs” metrics, which gold mining companies can use to supplement their overall non-GAAP disclosure. The WGC worked closely with its members (including AngloGold Ashanti) to develop these non-GAAP measures which are intended to provide further transparency into the full cost associated with producing gold. It is expected that these metrics, in particular, the “all-in sustaining cost” and “all-in cost” metrics which AngloGold Ashanti provides in this annual report on Form 20-F, will be helpful to investors, governments, local communities and other stakeholders in understanding the economics of gold mining. “All-in sustaining costs” is a non-GAAP measure which is an extension of the existing “total cash costs net of by-product revenue” metric and incorporates all costs related to sustaining production and in particular, recognises sustaining capital expenditures associated with developing and maintaining gold mines. In addition, this metric includes the cost associated with Corporate Office structures that support these operations, the community and environmental rehabilitation costs attendant with responsible mining and any exploration and evaluation cost associated with sustaining current operations. “All-in sustaining costs per ounce” is arrived at by dividing the dollar value of this cost metric by the ounces of gold sold. “All-in
162
costs” is a non-GAAP measure comprising “all-in sustaining costs” including additional costs which reflect the varying costs of producing gold over the life-cycle of a mine including costs incurred at new operations and costs related to majorgrowth projects at existing operations, which are expected to increase production. “All-in costs per ounce” is arrived at by dividing the dollar value of this cost metric by the ounces of gold sold.
Total cash costs net of by-product revenue
“Total cash costs net of by-product revenue” is calculated in accordance with the guidelines of the Gold Institute industry standard and industry practice and is a non-GAAP measure. The Gold Institute, which has been incorporated into the National Mining Association, is a non-profit international association of miners, refiners, bullion suppliers and manufacturers of gold products, which developed a uniform format for reporting total cash costs on a per ounce basis. The guidance was first adopted in 1996 and revised in November 1999.
“Total cash costs net of by-product revenue” as calculated and reported by AngloGold Ashanti include costs for all mining, processing, onsite administration costs, royalties and production taxes, as well as contributions from by-products, but exclusive ofexclude amortisation of tangible, intangible and right of use assets, rehabilitation costs and other non-cash costs, retrenchment costs, corporate administration, marketing and otherrelated costs, capital costs and exploration costs. “Total cash costs per ounce” is calculated by dividing attributable total cash costs net of by-product revenue by attributable ounces of gold produced.
Average gold price received per ounce
“Average gold price received per ounce” is a non-GAAP measure which gives an indication of revenue earned per unit of gold sold and includes gold income and realised non-hedge derivatives in its calculation and serves as a benchmark of performance against the market spot price of gold.gold price. This metric is calculated by dividing attributable gold income (price received) by attributable ounces of gold sold.
“All-in sustaining costs”, “all-in sustaining costs per ounce”, “all-in costs”, “all-in costs per ounce”, “total cash costs net of by-product revenue”, “total cash costs per ounce” and “average gold price received per ounce” should not be considered by investors in isolation or as alternatives to cost of sales, profit/(loss) applicable to equity shareholders, profit/(loss) before taxation, cash flows from operating activities or any other measure of financial performance presented in accordance with IFRS or as an indicator of the company’sCompany’s performance. While the WGC has published guidance on how to define “all-in sustaining costs” and “all-in costs” and the Gold Institute has provided definitions for the calculation of “total cash costs per ounce”, the calculation of these metrics may vary significantly among gold mining companies, and by themselves do not necessarily provide a basis for comparison with other gold mining companies.
However, AngloGold Ashanti believes that “all-in sustaining costs”, “all-in costs” and “total cash costs net of by-product revenue” in total by mine and per ounce by mine as well as “average gold price received per ounce”, are useful indicators to investors and management as they provide:
•an indication of profitability, efficiency and cash flows;
•the trend in costs as the mining operations mature over time on a consistent basis; and
•an internal benchmark of performance to allow for comparison against other mines, both within the AngloGold Ashanti groupGroup and at other gold mining companies.
Reconciliations
A reconciliation of gold income as included in the company’sCompany’s audited financial statements to “average gold price received per ounce” for each of the three years in the period ended 31 December 20202022 is presented on a total basis in the table below.
| Average gold price received per ounce for AngloGold Ashanti | Average gold price received per ounce for AngloGold Ashanti | Year ended 31 December | Average gold price received per ounce for AngloGold Ashanti | Year ended 31 December | ||||||||||||||||||||||||||||||
| 2022 | 2021 | 2020 | ||||||||||||||||||||||||||||||||
| 2020 | 2019 | 2018 | Restated | |||||||||||||||||||||||||||||||
| Gold income (million US dollars) | Gold income (million US dollars) | 4,322 | 3,439 | 3,203 | Gold income (million US dollars) | 4,388 | 3,903 | 4,490 | ||||||||||||||||||||||||||
| Adjusted for non-controlling interests (million US dollars) | Adjusted for non-controlling interests (million US dollars) | (95) | (77) | (84) | Adjusted for non-controlling interests (million US dollars) | (112) | (103) | (95) | ||||||||||||||||||||||||||
| 4,227 | 3,362 | 3,119 | 4,276 | 3,800 | 4,395 | |||||||||||||||||||||||||||||
| Associates and joint ventures' share of gold income including realised non-hedge derivatives (million US dollars) | 647 | 615 | 581 | |||||||||||||||||||||||||||||||
| Associates and joint ventures’ share of gold income including realised non-hedge derivatives (million US dollars) | Associates and joint ventures’ share of gold income including realised non-hedge derivatives (million US dollars) | 596 | 659 | 647 | ||||||||||||||||||||||||||||||
| Attributable gold income (million US dollars) | Attributable gold income (million US dollars) | 4,874 | 3,977 | 3,700 | Attributable gold income (million US dollars) | 4,872 | 4,459 | 5,042 | ||||||||||||||||||||||||||
| Attributable gold sold excluding pre-production ounces - oz (000) | 2,741 | 2,852 | 2,922 | |||||||||||||||||||||||||||||||
| Attributable gold sold - oz (000) | Attributable gold sold - oz (000) | 2,717 | 2,483 | 2,835 | ||||||||||||||||||||||||||||||
| Average gold price received per ounce ($/oz) | Average gold price received per ounce ($/oz) | 1,778 | 1,394 | 1,266 | Average gold price received per ounce ($/oz) | 1,793 | 1,796 | 1,778 | ||||||||||||||||||||||||||
163
A reconciliation of both cost of sales and total cash costs as included in the company’sCompany’s audited financial statements to “all-in sustaining costs”, “all-in sustaining costs per ounce”, “all-in costs”, “all-in costs per ounce”, “total cash costs net of by-product revenue” and “total cash costs per ounce” for each of the three years in the period ended 31 December 20202022 is presented on a total and segment basis in the tables below.below starting on page 173. In addition, the companyCompany has provided detail of the attributable ounces of gold produced and sold by mine for each of those periods below.
The following table presents selected total operating data from continuing operations for the AngloGold Ashanti groupGroup for the three-year period ended 31 December 20202022:
| Operating data for AngloGold Ashanti operations - Total | Operating data for AngloGold Ashanti operations - Total | Year ended 31 December | Operating data for AngloGold Ashanti operations - Total | Year ended 31 December | ||||||||||||||||||||||||||||||
(continuing operations) | (continuing operations) | 2020 | 2019 | 2018 | (continuing operations) | 2022 | 2021 | 2020 | ||||||||||||||||||||||||||
| Restated | ||||||||||||||||||||||||||||||||||
| Cost of sales (million US dollars) - Subsidiaries | Cost of sales (million US dollars) - Subsidiaries | 2,699 | 2,626 | 2,584 | Cost of sales (million US dollars) - Subsidiaries | 3,362 | 2,857 | 2,829 | ||||||||||||||||||||||||||
| Cost of sales (million US dollars) - Joint Ventures | Cost of sales (million US dollars) - Joint Ventures | 340 | 428 | 480 | Cost of sales (million US dollars) - Joint Ventures | 342 | 350 | 340 | ||||||||||||||||||||||||||
All-in sustaining costs per ounce ($/oz) - Subsidiaries(1) | All-in sustaining costs per ounce ($/oz) - Subsidiaries(1) | 1,072 | 1,017 | 970 | All-in sustaining costs per ounce ($/oz) - Subsidiaries(1) | 1,439 | 1,441 | 1,082 | ||||||||||||||||||||||||||
All-in sustaining costs per ounce ($/oz) - Joint Ventures(1) | All-in sustaining costs per ounce ($/oz) - Joint Ventures(1) | 810 | 767 | 820 | All-in sustaining costs per ounce ($/oz) - Joint Ventures(1) | 979 | 856 | 810 | ||||||||||||||||||||||||||
All-in costs per ounce ($/oz) - Subsidiaries(1) | All-in costs per ounce ($/oz) - Subsidiaries(1) | 1,240 | 1,218 | 1,075 | All-in costs per ounce ($/oz) - Subsidiaries(1) | 1,658 | 1,695 | 1,259 | ||||||||||||||||||||||||||
All-in costs per ounce ($/oz) - Joint Ventures(1) | All-in costs per ounce ($/oz) - Joint Ventures(1) | 824 | 785 | 846 | All-in costs per ounce ($/oz) - Joint Ventures(1) | 1,075 | 900 | 824 | ||||||||||||||||||||||||||
Total cash costs per ounce ($/oz) - Subsidiaries(1) | Total cash costs per ounce ($/oz) - Subsidiaries(1) | 815 | 763 | 743 | Total cash costs per ounce ($/oz) - Subsidiaries(1) | 1,066 | 1,017 | 836 | ||||||||||||||||||||||||||
Total cash costs per ounce ($/oz) - Joint Ventures(1) | Total cash costs per ounce ($/oz) - Joint Ventures(1) | 629 | 657 | 680 | Total cash costs per ounce ($/oz) - Joint Ventures(1) | 725 | 647 | 629 | ||||||||||||||||||||||||||
(1)“All-in sustaining costs per ounce”, “all-in costs per ounce” and “total cash costs per ounce” are non-GAAP measures. For a detailed reconciliation of “all-in sustaining costs per ounce”, “all-in costs per ounce” and “total cash costs per ounce” for the company’sCompany’s total operations for each of the three years in the period ended 31 December 2020,2022, refer to the relevant “AngloGold Ashanti operations - Total” tables below.
Comparison of operating performance on a segment basis in 20202022 with 20192021
Cost of sales
In Africa - Subsidiaries, cost of sales increased by $59$362 million, or five28 percent, to $1,232from $1,300 million in 2020 from $1,1732021 to $1,662 million in 2019.2022. The increase was mainlylargely due to an increase in labour and contractorcontractors’ costs, commodity prices, consumable stores, COVID-19 pandemic related spend, royalties, amortisation, and services, and other charges, partly offset by lower fuel and power costs, royalties paid and ore stockpile adjustments. In Guinea, at Siguiri,amortisation of tangible assets. Higher fuel and power costs were mainly due to the increase in the average price of Brent Crude oil, which increased from $71 per barrel in 2021 to $97 per barrel in 2022, a $26, or a 37 percent, per barrel increase. COVID-19 continued to present challenges within the overall logistics sector resulting in higher cost of transportation, warehousing and inventory prices, but to a lesser extent than in 2021.
At Iduapriem in Ghana, cost of sales increased by $62$76 million, or 2032 percent, to $377from $238 million in 2020 from $3152021 to $314 million in 2019. In2022. Cost of sales at Iduapriem increased year-on-year mainly due to higher amortisation of tangible assets as a result of higher production and higher capital expenditure in 2022. This increase in cost of sales was partly offset by lower environmental rehabilitation and other non-cash costs in 2022.
At Obuasi in Ghana, cost of sales increased by $102 million, or 62 percent, from $164 million in 2021 to $266 million in 2022. Cost of sales at Obuasi increased year-on-year mainly due to the resumption of stoping activities during 2022, following the temporary suspension of underground stoping activities in 2021 due to a sill pillar incident in May 2021. Amortisation of heavy mobile equipment increased mainly due to the reset of the useful life of the mining fleet and Mineral Reserve development amortisation increased as the assets were transferred from being under construction to Mineral Reserve development assets in 2022. Royalties paid were higher due to higher ounces of gold sold in 2022. Phase 3 of the Obuasi redevelopment project, was commissioned during 2020 incurringwhich relates principally to capital expenditure to refurbish existing infrastructure around the KMS Shaft, as well as to service the mine in deeper production areas, continued to progress. This increase in cost of sales was partly offset by lower environmental rehabilitation and other non-cash costs, and favourable gold inventory movements due to the lower cost of $34 millionunsold gold with the timing of gold shipments.
At Siguiri in 2020, from $nil in 2019. In Tanzania, at Geita,Guinea, cost of sales decreasedincreased by $29$78 million, or five19 percent, to $542from $410 million in 2019 from $5712021 to $488 million in 2019. In Ghana,2022. Cost of sales at Iduapriem,Siguiri increased year-on-year mainly due to higher fuel costs and an unfavourable movement in the exchange rate of the Guinean franc against the US dollar. This increase in cost of sales decreasedwas partly offset by $8lower environmental rehabilitation and other non-cash costs.
At Geita in Tanzania, cost of sales increased by $106 million, or three22 percent, to $280from $488 million in 2020 from $2882021 to $594 million in 2019.2022. Cost of sales at Geita increased year-on-year mainly due to higher fuel costs, increased engineering costs from the acceleration of HME fleet rebuilds as the open pit mine expanded, as well as higher underground mining contractors’ costs and higher royalties paid. Mineral Reserve development amortisation increased mainly due to a variation in the expenditure pattern which did not occur in 2021. Amortisation of leases increased mainly due to contract modifications in 2022. Amortisation of
164
tangible assets increased mainly due to a reset of the amortisation drivers early in 2022. This increase in cost of sales was partly offset by lower inventory costs.
In Africa - Joint Ventures, cost of sales decreased by $88$8 million, or 21two percent, to $340from $350 million in 2020 from $4282021 to $342 million in 2019.2022. The decrease was mainly due to the Sadiolalower amortisation of tangible assets, favourable movements in stockpiles and Morila operations reaching the end of their operating lives and the incurrence of $90 million cost of sales during 2019 which was not repeatedlower royalties paid due to a decrease in 2020. On 10 November 2020, AngloGold Ashanti together with its joint venture partner Barrick completed the sale of the Morila goldounces sold, partly offset by higher fuel costs. The Kibali mine in Mali to Firefinch Limited. On 30 December 2020, AngloGold Ashanti together with its joint venture partner IAMGOLD completed the sale of the Sadiola gold mine in Mali to Allied Gold. See “Item 4B: Business Overview—Regulatory Environment Enabling AngloGold Ashanti to Mine—Africa—Mali”. In the DRC at Kibali, cost of sales increased by $2 million, or 0.5 percent, to $340 millionwas the only operating asset in 2020 from $338 millionAfrica - Joint Ventures in 2019.2022.
In the Americas, cost of sales decreasedincreased by $58$91 million, or seven11 percent, to $764 million in 2020 from $822 million in 2019. The decrease was mainly due2021 to the weakening of the local currencies against the US dollar, decrease in rehabilitation and other non-cash costs and lower fuel costs, partly offset by increase in contractor costs and COVID-19 pandemic related spend. The Argentinian peso weakened by 46 percent and the Brazilian real weakened by 31 percent, against the US dollar. In Brazil, at AngloGold Ashanti Córrego do Sítio Mineração, cost of sales decreased by $26 million, or six percent, to $391$913 million in 2020 from $417 million in 2019. At Serra Grande, cost of sales decreased by $28 million, or 22 percent, to $102 million in 2020 from $130 million in 2019. In Argentina, at Cerro Vanguardia, cost of sales decreased by $5 million, or two percent, to $269 million in 2020 from $274 million in 2019. In the Americas other segment, cost of sales increased by $1 million, or 100 percent, to $2 million in 2020 from $1 million in 2019.
At AGA Mineração in Brazil, cost of sales increased by $42 million, or ten percent, from $435 million in 2021 to $477 million in 2022. Cost of sales at AGA Mineração increased year-on-year mainly due to higher commodity prices (oil, iron ore and construction materials) and higher costs of services, fuel, power and labour, write down of inventory, and a four percent strengthening of the Brazilian real against the US dollar.
At Serra Grande in Brazil, cost of sales increased by $39 million, or 32 percent, from $123 million in 2021 to $162 million in 2022. Cost of sales at Serra Grande increased year-on-year mainly due to higher commodity prices, higher cost of labour, consumables, fuel and power as well as activity changes primarily caused by various production challenges encountered during 2022. Cost of sales was further increased by a four percent strengthening of the Brazilian real against the US dollar.
At Cerro Vanguardia in Argentina, cost of sales increased by $12 million, or five percent, from $261 million in 2021 to $273 million in 2022. Cost of sales at Cerro Vanguardia increased year-on-year mainly due to higher salary increases, fuel costs, higher materials consumption (such as fuel, explosives, and spare parts) because of higher tonnes mined. This increase was partly offset by a 37 percent weakening of the Argentinean peso against the US dollar, and favourable inventory change movements.
In the Americas other segment, cost of sales decreased by $2 million, or 67 percent, from $3 million in 2021 to $1 million in 2022.
In Australia, cost of sales increased by $43 million, or six percent, from $740 million in 2021 to $783 million in 2022. The increase was mainly due to an increase in mining contractors’ costs, commodity prices, logistics costs, consumable stores, services and other charges, power and fuel costs, gold in process adjustments, deferred stripping amortisation and theamortisation of mining assets. This increase was partly offset by an eight percent weakening of the Australian dollar against the US dollar. The higher mining contractors’ costs were mainly due to cost increases resulting from challenges with shortages of critical skills. Higher commodity costs were mainly due to an increase in the prices of steel, support and construction materials, explosives, timber and reagents. COVID-19 continued to present challenges within the overall logistics sector resulting in higher cost of transportation, warehousing and inventory prices, but to a lesser extent than in 2021. The higher fuel costs were mainly due to the increase in the price of Brent Crude oil. The increase in deferred stripping amortisation was mainly due to the mining and depletion of different ore bodies. The increase in the amortisation of mining assets was mainly due to higher production in 2022 compared with 2021. These increases were partly offset by a decrease in environmental rehabilitation and other non-cash costs in 2022.
At Sunrise Dam in Australia, cost of sales increased by $24$7 million, or eighttwo percent, to $342from $364 million in 2020 from $3182021 to $371 million in 2019. 2022. Cost of sales at Sunrise Dam increased year-on-year primarily due to higher mining contractors’ costs (mainly higher cost of labour due to critical skill shortages), and higher fuel and mining costs. This increase was partly offset by a lower cost of gold inventory changes due to timing of gold pours and shipments.
At Tropicana in Australia, cost of sales increased by $41$36 million, or 14ten percent, to $338from $346 million in 2020 from $2972021 to $382 million in 2019.2022. Cost of sales at Tropicana increased year-on-year mainly due to higher mining contractors’ costs (mainly higher cost of labour due to critical skill shortages), consumable stores, service costs, fuel and power costs, gold inventory changes, royalties paid and higher Mineral Reserve development and deferred stripping amortisation. This increase was partly offset by lower environmental rehabilitation and other non-cash costs and ore stockpile movements.
Overall, the subsidiaries’ cost of sales increased by $505 million, or 18 percent, from $2,626$2,857 million in 20192021 to $2,699$3,362 million in 2020, which represents a $73 million, or three percent increase.2022. The increase was primarily due to an increase in cash operating costs by $50$394 million, or three18 percent, to $1,881from $2,160 million in 2020 from $1,8312021 to $2,554 million in 2019 and2022, an increase in royalties paid by $44$23 million, or 3214 percent, to $181from $162 million in 2020 from $1372021
165
to $185 million in 2019,2022, an increase in amortisation of tangible assets of $140 million, or 34 percent, from $411 million in 2021 to $551 million in 2022, an increase in amortisation of right of use assets of $18 million, or 29 percent, from $63 million in 2021 to $81 million in 2022. This increase was partly offset by an inventory change of $36 million, from a charge of $6 million in 2021 to a credit of $30 million in 2022, and a decrease in environmental rehabilitation and other non-cash costs by $21of $38 million, or 40100 percent, to $32from $38 million in 2020 from $53 million2021 to nil in 2019.2022. The increase in cash operating costs iswas primarily due to higher labour and contractorcontractors’ costs, commodity prices, logistics costs, consumable stores, COVID-19 pandemic related spend, services and other charges partly offset by loweras well as fuel and power costs.costs in 2022 compared to 2021. The increase in royalties paid was mainly due to higher ounces sold in 2022 compared to 2021. The increase in amortisation of tangible assets was mainly due to the Obuasi redevelopment project continuing to ramp up to full production, higher deferred stripping amortisation at Tropicana and Iduapriem, and higher Mineral Reserve development amortisation at Tropicana and Geita in 2022 compared to 2021. The increase in amortisation of right of use assets was mainly due to a change in business strategy whereby certain heavy mobile equipment is leased, mainly at the Brazil operations. The decrease in inventory change was mainly due to lower amortisation of inventories resulting from the suspension of tailings disposal and processing plant effluents treatment. The decrease in environmental rehabilitation and other non-cash costs arose from thewas mainly due to changes to restoration provision cash flows, inflation rateslower costs and discount rates in 2022 compared to 2019.2021.
All-in sustaining costs per ounce
In Africa - Subsidiaries, all-in sustaining costs increased by $28$27 per ounce, or threetwo percent, to $975from $1,264 per ounce in 2020 from $9472021 to $1,291 per ounce in 2019.2022. This increase was mainly due to an increase in cost of sales at Siguiri due to theand an increase in hard rock processing capability which resulted in a higher plant throughput during 2020. The higher plant throughput has been partly offset by lower than planned recovery rate from high levels of carbon in the ore affecting the capacity to recover gold. This led to higher processing costs year-on-year as a result of higher reagent consumption. The increase was partly offset by lower cost of sales at Geita driven by a build-up of ore stockpiles and lower mining costs, boosted by the move to owner mining. During 2020, the Obuasi redevelopment project was commissioned with higher level of sales as the project continued to ramp-up. Capitalsustaining capital expenditure, increased at Iduapriem due to higher pre-stripping activities and stay-in-business capital, at Siguiri to resolve the current recovery and throughput challenges of the newly commissioned plant, at Geita due to increased Ore Reserve development expenditure as a result of more underground activities and more exploration work done in 2020. The higher cost of sales and capital spend was partly offset by an increase in ounces of gold sold (excluding pre-production ounces)sold. For a discussion of 59,000 ounces, or five percent, from 1,096,000 ouncesthe increase in 2019cost of sales in Africa - Subsidiaries during 2022, see “Item 5A: Operating Results—Comparison of operating performance on a segment basis in 2022 with 2021—Cost of sales”. Sustaining capital expenditure in Africa - Subsidiaries increased as the region continued to 1,155,000 ouncesimplement its reinvestment programme. At Iduapriem in 2020,Ghana, sustaining capital expenditure decreased year-on-year mainly due to lower pre-stripping expenditure in Cut 2. At Obuasi in Ghana, sustaining capital expenditure increased year-on-year mainly due to the transition to predominantly underground operations which resulted in increased tonnes treated at Geita and the commissioningongoing progress of Phase 3 of the Obuasi redevelopment project, which relates principally to capital expenditure to refurbish existing infrastructure around the KMS Shaft, as well as to service the mine in deeper production areas. At Siguiri in Guinea, sustaining capital expenditure increased year-on-year mainly due to increased stay-in-business capital expenditure in 2022. At Geita, sustaining capital expenditure increased year-on-year mainly due to higher deferred stripping activities, stay-in-business capital expenditure and Mineral Reserve development capital expenditure. Gold sold in Africa - Subsidiaries increased by 221,000 ounces, or 21 percent, from 1.060 million ounces in 2021 to 1.281 million ounces in 2022. The increase was largely due to higher production across all operations in Africa other than Kibali. For a discussion of the increase in production at Obuasi.the Africa operations (other than Kibali) during 2022, see “Item 5A: Operating Results—Key factors affecting results—Production in 2022”.
In Africa - Joint Ventures, all-in sustaining costs increased by $43$123 per ounce, or six14 percent, to $810from $856 per ounce in 2020 from $7672021 to $979 per ounce in 2019.2022. This increase was mainly due to an increase in sustaining capital expenditure and lower ounces of gold sold, partly offset by lower cost of sales. For a discussion of the decrease in cost of sales in Africa - Joint Ventures during 2022, see “Item 5A: Operating Results—Comparison of operating performance on a segment basis in 2022 with 2021—Cost of sales”. Sustaining capital expenditure in Africa - Joint Ventures increased mainly due to higher stay-in-business capital expenditure. Gold sold in Africa - Joint Ventures decreased by 35,000 ounces, or ten percent, from 367,000 ounces in 2021 to 332,000 ounces in 2022. The decrease was mainly due to lower production from Kibali. For a discussion of the decrease in production at Kibali during 2022, see “Item 5A: Operating Results—Key factors affecting results—Production in 2022”.The Kibali mine in the DRC was the only operating asset in Africa - Joint Ventures in 2022.
In the Americas, all-in sustaining costs increased by $136 per ounce, or 9 percent, from $1,582 per ounce in 2021 to $1,718 per ounce in 2022. This increase was mainly due to an increase in cost of sales, lower amortisation and an increase in sustaining capital expenditure at Kibali and gold sold decreased by 77,000 ounces, or 17 percent, from 442,000 ounces in 2019 to 365,000 ounces in 2020. During 2020, the Sadiola and Morila operations reached the end of their operating lives and recorded no cost of sales and no gold sales. On 10 November 2020, AngloGold Ashanti together with its joint venture partner Barrick completed the sale of the Morila gold mine in Mali to Firefinch Limited. On 30 December 2020, AngloGold Ashanti together with its joint venture partner IAMGOLD completed the sale of the Sadiola gold mine in Mali to Allied Gold. See “Item 4B: Business Overview—Regulatory Environment Enabling AngloGold Ashanti to Mine—Africa—Mali”.
In Australia, all-in sustaining costs decreased by $155 per ounce, or ten percent, from $1,500 per ounce in 2021 to $1,345 per ounce in 2022. The decrease was mainly due to lower sustaining capital expenditure and an increase in ounces of gold sold, partly offset by an increase in cost of sales. For a discussion of the increase in cost of sales in Australia during 2022, see “Item 5A: Operating Results—Comparison of operating performance on a segment basis in 2022 with 2021—Cost of sales”. Sustaining capital expenditure decreased in Australia mainly due to lower stripping and pre-stripping expenditure. At Sunrise
166
Dam in Australia, sustaining capital expenditure increased year-on-year mainly due to the camp extension. At Tropicana in Australia, sustaining capital expenditure decreased year-on-year mainly due to lower deferred stripping and pre-stripping expenditure due to mining different ore bodies and at different phases to 2021. Gold sold in Australia increased by 44,000 ounces, or 9 percent, from 495,000 ounces in 2021 to 539,000 ounces in 2022. This increase was mainly due to higher production at Sunrise Dam and Tropicana. For a discussion of the increase in production at the Australia operations during 2022, see “Item 5A: Operating Results—Key factors affecting results—Production in 2022”.
All-in costs per ounce
In Africa - Subsidiaries, all-in costs decreased by $88$82 per ounce, or sevenfive percent, to $1,149from $1,516 per ounce in 2020 from $1,2372021 to $1,434 per ounce in 2019.2022. This decrease was mainly due to lower growth capital spend at Obuasi and revenue from pre-productionan increase in gold sold, capitalised against thelower non-sustaining project capital expenditure and the commissioninglower care and maintenance costs, partly offset by higher all-in sustaining costs. At Obuasi in Ghana, Phase 3 of the Obuasi redevelopment project, which relates principally to capital expenditure to refurbish existing infrastructure around the KMS Shaft, as well as to service the mine in deeper production areas, continues to progress. Care and maintenance activities of $45 million incurred in 2021 at the Obuasi mine during 2020, partly offset by an increasethe voluntary suspension of underground mining between May and October 2021 following a sill pillar incident were not repeated in all-in sustaining costs2022. Non-sustaining project capital expenditure at Siguiri. Gold sold increased by 59,000 ounces, in 2020, as compared to 2019,Obuasi was lower mainly due to the transitiondifferent project scopes and cash flows. This decrease was largely offset by higher non-sustaining project capital expenditure at Iduapriem in Ghana mainly due to predominantly underground operations which resultedincreased TSF investment in increased tonnes treated at Geita and commissioning2022. For a discussion of the redevelopment project at Obuasi.increase in ounces of gold sold in Africa - Subsidiaries during 2022, see “Item 5A: Operating Results—Comparison of operating performance on a segment basis in 2022 with 2021—All-in sustaining costs per ounce”.
In Africa - Joint Ventures, all-in costs increased by $39$175 per ounce, or five19 percent, to $824from $900 per ounce in 2020 from $7852021 to $1,075 per ounce in 2019.2022. This increase was mainly due to an increase in all-in sustaining costs and higher non-sustaining project capital expenditure, and lower gold sold. For a discussion of the decrease in ounces of gold sold in Africa - Joint Ventures during 2022, see “Item 5A: Operating Results—Comparison of 77,000 ounces, or 17 percent, from 442,000 ouncesoperating performance on a segment basis in 2019 to 365,000 ounces2022 with 2021—All-in sustaining costs per ounce”. The Kibali mine in 2020.the DRC was the only operating asset in Africa - Joint Ventures in 2022.
In the Americas, all-in costs decreased by $4$83 per ounce, to $1,179or 4 percent, from $1,858 per ounce in 2020 from $1,1832021 to $1,775 per ounce in 2019.2022. This decrease was mainly due to a decrease in all-in sustaining costshigher ounces of gold sold and a decrease in corporatelower non-sustaining exploration and social responsibility costs not related to current operations,study cost expenditure at the Colombian and Nevada growth projects, partly offset by anhigher all-in sustaining costs. For a discussion of the increase in growth capital spend atounces of gold sold in the Colombia projects. Gold soldAmericas during 2022, see “Item 5A: Operating Results—Comparison of operating performance on a segment basis in 2022 with 2021—All-in sustaining costs per ounce”.
In Australia, all-in costs decreased by 36,000 ounces$94 per ounce, or 5 percent, from $1,725 per ounce in 2020, as compared2021 to 2019,$1,631 per ounce in 2022. This decrease was mainly due to lower gold sold at Cerro Vanguardia and Serra Grande.
Total cash costs per ounce
The currencies of Argentina Australia and BrazilAustralia were, on average, weaker against the US dollar during 20202022 as compared to 2019,2021, which positively impacted total cash costs per ounce for 2020.2022. This positive impact was partly offset by the currency of Brazil being, on average, stronger against the US dollar during 2022 as compared to 2021. Total production in 2022 was higher as compared to 2021, which positively impacted total cash costs per ounce for 2022. For a discussion of production during 2022, see “Item 5A: Operating Results—Key factors affecting results—Production in 2022”.
In Africa - Subsidiaries, total cash costs per ounce decreasedincreased by $4,$32 per ounce, or 0.5three percent, to $797from $991 per ounce in 2020 from $8012021 to $1,023 per ounce in 2019.2022. The decreaseincrease was mainly due to a 52,000-ounce increase in production (excluding pre-production ounces). The decrease was partially offset by an increase in total cash costs.
At Iduapriem in Ghana, total cash costs per ounce decreased by $111 per ounce, or ten percent, from $1,081 per ounce in 2021 to $970 per ounce in 2022. Total cash costs per ounce decreased year-on-year mainly due to higher production and favourable movements in stockpiles, partly offset by an increase in fuel costs and higher royalties paid.
At Obuasi in Ghana, total cash costs per ounce decreased by $198 per ounce, or 18 percent, from $1,112 per ounce in 2021 to $914 per ounce in 2022. Total cash costs per ounce decreased year-on-year mainly due to higher production.
At Siguiri in Guinea, total cash costs per ounce increased by $119 per ounce, or ten percent, from $1,200 per ounce in 2021 to $1,319 per ounce in 2022. Total cash costs per ounce increased year-on-year mainly due to higher fuel costs and an unfavourable movement in the exchange rate of the Guinean franc against the US dollar, partly offset by an increase in production.
167
At Geita in Tanzania, total cash costs per ounce increased by $122 per ounce, or 15 percent, from $822 per ounce in 2021 to $944 per ounce in 2022. Total cash costs per ounce increased year-on-year mainly due to higher fuel costs, increased engineering costs from the heavy mining equipment maintenance as the open-pit mine expanded, as well as higher underground mining contractors’ costs and higher royalties paid. This increase was partly offset by higher gold production.
In Africa - Joint Ventures, total cash costs per ounce decreasedincreased by $28,$78 per ounce, or four12 percent, to $629from $647 per ounce in 2020 from $6572021 to $725 per ounce in 2019.2022. The decreaseincrease was mainly due to a decrease in total cash costs. The decrease was partiallylower production and higher fuel costs, partly offset by a 81,000-ounce decreasefavourable movements in production.
In the DRC, at Kibali,Americas, total cash costs per ounce increased by $57,$157 per ounce, or ten17 percent, to $629from $921 per ounce in 2020 from $5722021 to $1,078 per ounce in 2019.2022. The increase was mainly due to an increase in total cash costs, andpartly offset by a 2,000-ounce decrease10,000 ounce increase in production.
At Serra Grande in Brazil, total cash costs per ounce increased by $163 per ounce, or 14 percent, from $1,192 per ounce in 2021 to $1,355 per ounce in 2022. Total cash costs per ounce increased year-on-year mainly due to higher fuel costs, higher royalties paid and an unfavourable movement in the exchange rate of the Brazilian real against the US dollar, partly offset by anhigher production.
At Cerro Vanguardia in Argentina, total cash costs per ounce increased by $19 per ounce, or two percent, from $894 per ounce in 2021 to $913 per ounce in 2022. Total cash costs per ounce were higher year-on-year mainly due to higher fuel costs, higher materials consumption (such as fuel, explosives, and spare parts) as a result of higher tonnes mined and lower by-product revenue due to lower silver sales. This increase was partly offset by higher gold production and a favourable movement in by-product revenue.the exchange rate of the Argentinean peso against the US dollar.
In Australia, total cash costs per ounce increaseddecreased by $238,$39 per ounce, or 33three percent, to $968from $1,196 per ounce in 2020 from $7302021 to $1,157 per ounce in 2019,2022, primarily due to a 44,000 ounce increase in production, partly offset by an increase in total cash costs and a 60,000-ounce decrease in production.costs.
At Sunrise Dam in Australia, total cash costs per ounce increased by $55,$81 per ounce, or fivesix percent, to $1,069from $1,321 per ounce in 2020 compared2021 to $1,014$1,402 per ounce in 2019, mainly2022. Total cash costs per ounce were higher year-on-year primarily due to an increase in total cashhigher fuel and mining costs, partly offset by 2,000 ounce increasea favourable movement in production.the exchange rate of the Australian dollar against the US dollar.
At Tropicana in Australia, total cash costs per ounce increaseddecreased by $303,$106 per ounce, or 6011 percent, to $807from $987 per ounce in 2020 compared2021 to $504$881 per ounce in 2019,2022. Total cash costs per ounce decreased year-on-year mainly due to higher gold production, lower mining costs related to an increase in total cashore mining volumes in the Boston Shaker open pit and underground mine, a favourable movement in ore stockpiles and a favourable movement in the exchange rate of the Australian dollar against the US dollar, partly offset by higher fuel costs and a 62,000 ounce decrease in production.higher royalties paid.
Overall the subsidiaries’ total cash costs per ounce increased by $52,$49, or sevenfive percent, to $815from $1,017 per ounce in 2020 compared2021 to $763$1,066 per ounce in 2019.2022. The increase was mainly due to an increase in total cash costs andpartly offset by a 70,000-ounce decrease298,000 ounce increase in production.
Comparison of operating performance on a segment basis in 20192021 with 20182020
Cost of sales
In Africa - Subsidiaries, cost of sales increaseddecreased by $46$62 million, or fourfive percent, to $1,173from $1,362 million in 2019 from $1,1272020 to $1,300 million in 2018.2021. The increasedecrease was mainly due to increasesa significant amount of waste stripping capitalised, a decrease in total amortisation, inventory change,royalties paid due to lower ounces of gold sold in 2021 and improved efficiencies, partly offset by an increase in labour and contractors’ costs, commodity prices, logistics costs, consumable stores, environmental rehabilitation and other non-cash costs. In Tanzania, at Geita,costs, amortisation of right of use assets, services and other charges, power and fuel costs and higher ore stockpile adjustments. COVID-19 presented challenges within the overall logistics sector resulting in higher cost of transportation, warehousing and inventory prices. Higher fuel and power costs were mainly due to the increase in the average price of Brent Crude oil, which increased from $42 per barrel in 2020 to $71 per barrel in 2021, a $29, or a 69 percent, per barrel increase.
At Iduapriem in Ghana, cost of sales decreased by $41$42 million, or seven15 percent, to $571from $280 million in 2019 from $6122020 to $238 million in 2018. In2021. Cost of sales at Iduapriem decreased year-on-year mainly due to a significant amount of waste stripping capitalised at
168
Teberebie Cut 2 in 2021 compared to 2020, together with a decrease in royalties paid due to lower ounces of gold sold and an inventory change due to ore stockpile movements.
At Obuasi in Ghana, cost of sales in 2021 remained unchanged from 2020 at Iduapriem,$164 million. Phase 1 of the Obuasi redevelopment project commenced commercial production from 1 October 2020. Underground mining activities were voluntarily suspended between 18 May 2021 and 15 October 2021 at the Obuasi mine, following a sill pillar incident. From 15 October 2021, underground mining resumed to replenish the run-of-mine stockpile without corresponding gold production and related cost of sales. Since the voluntary suspension of underground mining activities, care and maintenance costs of $45 million were incurred at Obuasi during 2021.
At Siguiri in Guinea, cost of sales increased by $55$33 million, or 24nine percent, to $288from $377 million in 2019 from $2332020 to $410 million in 2018. In Guinea,2021. Cost of sales at Siguiri increased year-on-year mainly as a result of additional volumes of ore mined resulting in higher operating costs, increases on fuel and reagent costs, and higher royalties paid from additional volumes sold in 2021.
At Geita in Tanzania, cost of sales increaseddecreased by $29$54 million, or ten percent, to $315from $542 million in 2019 from $2862020 to $488 million in 2018.2021. Cost of sales at Geita decreased year-on-year mainly due to lower royalties paid and improved efficiencies in that more open pit tonnes were mined in 2021 at a lower rate per tonne than in 2020. This decrease was partly offset by lower grades as well as the depletion of ore stockpiles in 2021 compared to an increase in ore stockpiles during 2020.
In Africa - Joint Ventures, cost of sales decreasedincreased by $52$10 million, or 11three percent, to $428from $340 million in 2019 from $4802020 to $350 million in 2018.2021. The decreaseincrease was mainly due to favourable inventorylower open-pit recovered grades, unfavourable movements lower amortisationin stockpiles, higher royalties paid due to an increase in the average gold price received, and lower fuel expense. In Mali, at Morila, cost of sales decreased by $6 million, or 14 percent,additional reagent consumption costs, as compared to $36 million2020. The Kibali mine in 2019 from $42 million in 2018. At Sadiola, cost of sales decreased by $11 million, or 17 percent, to $54 million in 2019 from $65 million in 2018. In the DRC at Kibali, cost of sales decreased by $35 million, or nine percent, to $338 millionwas the only operating asset in 2019 from $373 millionAfrica - Joint Ventures in 2018.2021.
In the Americas, cost of sales decreasedincreased by $16$58 million, or twoeight percent, from $764 million in 2020 to $822 million in 2019 from $838 million in 2018.2021. The decreaseincrease was mainly due to an increase in labour and contractors’ costs, commodity prices, logistics costs, consumable stores, amortisation of right of use assets, services and other charges, power and fuel cost, write down of inventory and environmental rehabilitation and other non-cash costs. The higher labour and contractors’ costs were mainly due to COVID-19 related cost increases resulting from challenges with travel restrictions and shortages of critical skills. Higher commodity costs were mainly due to an increase in the prices of steel, support and construction materials, lime and other reagents. COVID-19 presented challenges within the overall logistics sector resulting in higher cost of transportation, warehousing and inventory prices. The higher fuel costs were mainly due to the increase in the price of Brent Crude oil. The increase in cost of sales was partly offset by lower royalties paid due to lower ounces of gold sold in 2021 as compared to 2020, lower amortisation of tangible assets due to lower ounces of gold produced in 2021 as compared to 2020 as well as the weakening of the local currencies the Argentinian peso by 72 percent and the Brazilian real by eight percent, against the US dollar. In Brazil, at AngloGold Ashanti Córrego do Sítio
At AGA Mineração in Brazil, cost of sales increased by $35$43 million, or nine11 percent, from $392 million in 2020 to $435 million in 2021. Cost of sales at AGA Mineração increased year-on-year mainly due to higher commodity prices (oil, iron ore and construction materials) and higher costs of services and labour. This increase was partly offset by lower royalties paid due to lower ounces of gold sold and a five percent weakening of the Brazilian real against the US dollar.
At Serra Grande in Brazil, cost of sales increased by $22 million, or 22 percent, to $417$123 million in 20192021 from $382$101 million in 2018. At2020. Cost of sales at Serra Grande increased year-on-year mainly due to higher commodity prices and higher cost of services and labour as well as inefficiencies primarily caused by higher absenteeism due to COVID-19 and various production challenges encountered during 2021. This increase was partly offset by a five percent weakening of the Brazilian real against the US dollar.
At Cerro Vanguardia in Argentina, cost of sales decreased by $8 million, or three percent, from $269 million in 2020 to $261 million in 2021. Cost of sales at Cerro Vanguardia decreased year-on-year mainly due to a 35 percent weakening of the Argentinean peso against the US dollar, and favourable inventory change movements. This decrease was partly offset by higher salary increases, additional costs relating to COVID-19 tests and other related medical costs in line with COVID-19 protocols and higher materials consumption (such as fuel, explosives and spare parts) as a result of higher tonnes mined.
In the Americas other segment, cost of sales increased by $1 million, or one50 percent, to $130from $2 million in 2019 from $1292020 to $3 million in 2018. In Argentina, at Cerro Vanguardia, cost of sales decreased by $51 million, or 16 percent, to $274 million in 2019 from $325 million in 2018.2021.
In Australia, cost of sales increased by $10$35 million, or twofive percent, to $632from $705 million in 2019 from $6222020 to $740 million in 2018.2021. The increase was mainly due to an increase in labour and contractors’ costs, commodity prices, logistics costs, consumable stores, amortisation of right of use assets, services and inventory change. The increase was partially offset by a decrease in service-relatedother charges, power and fuel costs, ore stockpile adjustments and the weakeningstrengthening of the Australian dollar against the US dollar. dollar by eight percent. The higher labour and contractors’ costs were mainly due to COVID-19 related cost increases resulting from challenges with travel restrictions and shortages of critical skills. Higher commodity costs were mainly due to an increase in the prices of steel, support and construction materials, lime and other reagents. COVID-19 presented challenges within the overall logistics sector resulting in higher cost of transportation, warehousing and inventory prices. The higher fuel costs were mainly due to the increase in the price of Brent Crude oil. This
169
increase in cost of sales was partly offset by a decrease in environmental rehabilitation and other non-cash costs, amortisation of waste stripping and royalties paid.
At Sunrise Dam in Australia, cost of sales increased by $22 million, or six percent, from $342 million in 2020 to $364 million in 2021. Cost of sales at Sunrise Dam increased year-on-year primarily due to higher mining costs (mainly higher cost of labour due to critical skill shortages), partly offset by lower royalties paid.
At Tropicana in Australia, cost of sales increased by $8 million, or threetwo percent, to $318from $338 million in 2019 from $3102020 to $346 million in 2018. At2021. Cost of sales at Tropicana increased year-on-year mainly due to higher mining costs (mainly higher cost of sales increased by $4 million, or one percent,labour due to $297 million in 2019 from $293 million in 2018.critical skill shortages), inventory movements and the impact of higher underground and open pit mining costs.
Overall the subsidiaries’ cost of sales increased by $28 million, or one percent, from $2,584$2,829 million in 20182020 to $2,626$2,857 million in 2019, which represents a $42 million, or two percent increase.2021. The increase was primarily due to a $36an increase in cash operating costs by $148 million, or seven percent, from $2,012 million in 2020 to $2,160 million in 2021, an increase in environmental rehabilitation and other non-cash costs by $6 million, or 19 percent, from $32 million in 2020 to $38 million in 2021, an increase in amortisation of right of use assets by $16 million, or 34 percent, from $47 million in 2020 to $63 million in 2021. This increase was partly offset by a decrease in royalties paid by $19 million, or ten percent, from $181 million in 2020 to $162 million in 2021, a decrease in amortisation of tangible assets of $115 million, or 22 percent, from $526 million in 2020 to $411 million in 2021 and an inventory change of $8 million, or 57 percent, from a charge of $14 million in 2020 to a charge of $6 million in 2021. The increase in cash operating costs was mainly due to higher labour and contractors’ costs, commodity prices, logistics costs, consumable stores, COVID-19 pandemic related expenditure, services and other charges as a result ofwell as fuel and power costs. The increase in environmental rehabilitation and other non-cash costs was mainly due to the changes to restoration provision cash flows, inflation ratescost increases and discount rates.rates in 2021 compared to 2020. The increase in amortisation of right of use assets was mainly due to an increase in number of right of use assets in 2021 as compared to 2020. The decrease in royalties paid was mainly due to a decrease in ounces of gold sold in 2021 as compared to 2020. The decrease in amortisation of tangible assets was mainly due to lower amortisation of waste stripping and lower gold production in 2021 as compared to 2020.
All-in sustaining costs per ounce
In Africa - Subsidiaries, all-in sustaining costs increased by $6$262 per ounce, or one26 percent, to $947from $1,002 per ounce in 2019 from $9412020 to $1,264 per ounce in 2018.2021. This increase was mainly due to an increase in cost of sales, at Geita. Thean increase was partially offset by the decreased spending in sustaining capital expenditure and a decrease in ounces of gold sold. For a discussion of the increase in cost of sales in Africa - Subsidiaries during 2021, see “Item 5A: Operating Results—Comparison of operating performance on a segment basis in 2021 with 2020—Cost of sales”. Sustaining capital expenditure in Africa - Subsidiaries increased as the region continued to implement its re-investment programme. At Iduapriem in Ghana, sustaining capital expenditure increased year-on-year mainly due to higher pre-stripping activities and stay-in-business capital expenditure. At Obuasi in Ghana, the Obuasi redevelopment project led to an increase in sustaining capital expenditure as Phase 2 of the project was completed at the end of December 2021. At Siguiri in Guinea, sustaining capital expenditure increased year-on-year mainly due to increased stay-in-business capital expenditure. At Geita in Tanzania, sustaining capital expenditure increased year-on-year mainly due to an increase in deferred stripping and Mineral Reserve development expenditure as the underground portal development at Geita Hill East progressed according to plan. Gold sold in Africa - Subsidiaries decreased by 189,000 ounces, or 15 percent, from 1.249 million ounces in 2020 to 1.060 million ounces in 2021. The decrease was mainly due to lower production from Iduapriem and an increaseGeita, partly offset by higher production from Siguiri. For a discussion of 30,000 ouncesthe decrease in gold sold (excluding pre-production ounces)production at the Africa operations (other than Kibali) during 2021, see “Item 5A: Operating Results—Key factors affecting results—Production in 2021”.
In Africa - Joint Ventures, all-in sustaining costs decreasedincreased by $53$46 per ounce, or six percent, to $767from $810 per ounce in 2019 from $8202020 to $856 per ounce in 2018.2021. This decreaseincrease was mainly due to an increase in cost of sales and an increase in sustaining capital expenditure, partly offset by higher ounces of gold sold. For a discussion of the increase in cost of sales in Africa - Joint Ventures during 2021, see “Item 5A: Operating Results—Comparison of operating performance on a segment basis in 2021 with 2020—Cost of sales”. Sustaining capital expenditure in Africa - Joint Ventures increased mainly due to higher deferred stripping. The increase was partly offset by an increase in gold sold in Africa - Joint Ventures by 2,000 ounces, or one percent, from 365,000 ounces in 2020 to 367,000 ounces in 2021. The marginal increase was mainly due to a decreasemarginally higher production from Kibali. For a discussion of the marginal increase in cost of sales and a decreaseproduction at Kibali during 2021, see “Item 5A: Operating Results—Key factors affecting results—Production in sustaining capital expenditure at Kibali. This decrease2021”. The Kibali mine in the DRC was partially offset by a decreasethe only operating asset in total amortisation and a decrease of 17,000 ouncesAfrica - Joint Ventures in gold sold.2021.
In the Americas, all-in sustaining costs increased by $177$584 per ounce, or 2158 percent, to $1,032from $1,003 per ounce in 2019 from $8552020 to $1,587 per ounce in 2018.2021. This increase was mainly due to a decrease of 83,000 ounces in gold sold (excluding pre-production ounces) and a decrease of total amortisation at Cerro Vanguardia and Serra Grande. The increase was partially offset by a decrease in cost of sales and an overall decrease of spending in sustaining capital expenditure.
170
percent, from 664,000 ounces in 2020 to 561,000 ounces in 2021. This decrease was partially offsetmainly due to lower production from all of the Americas operations. For a discussion of the decrease in production at the Americas operations during 2021, see “Item 5A: Operating Results—Key factors affecting results—Production in 2021”.
In Australia, all-in sustaining costs increased by $275 per ounce, or 22 percent, from $1,225 per ounce in 2020 to $1,500 per ounce in 2021. This increase was mainly due to an increase in cost of sales.sales, an increase in sustaining capital expenditure and lower ounces of gold sold. For a discussion of the increase in cost of sales in Australia during 2021, see “Item 5A: Operating Results—Comparison of operating performance on a segment basis in 2021 with 2020—Cost of sales”. Sustaining capital expenditure increased in Australia as Mineral Reserve development, deferred stripping and other stay-in-business capital expenditure increased. At Sunrise Dam in Australia, sustaining capital expenditure increased year-on-year mainly due to an increase in Mineral Reserve development. At Tropicana in Australia, sustaining capital expenditure increased year-on-year mainly due to higher deferred stripping, Mineral Reserve development and other stay-in-business capital expenditure. Gold sold in Australia decreased by 62,000 ounces, or 11 percent, from 557,000 ounces in 2020 to 495,000 ounces in 2021. This decrease was mainly due to lower production from Sunrise Dam and Tropicana. For a discussion of the decrease in production at the Australia operations during 2021, see “Item 5A: Operating Results—Key factors affecting results—Production in 2021”.
All-in costs per ounce
In Africa - Subsidiaries, all-in costs increased by $138$323 per ounce, or 1327 percent, to $1,237from $1,193 per ounce in 2019 from $1,0992020 to $1,516 per ounce in 2018.2021. This increase was mainly due to an increase in all-in sustaining costs, higher care and maintenance expenditure and higher non-sustaining project capital expenditure. At Obuasi in Ghana, underground mining activities were voluntarily suspended between 18 May 2021 and 15 October 2021, following a sill pillar incident. From 15 October 2021, underground mining resumed to replenish the run-of-mine stockpile without corresponding gold production. Since the voluntary suspension of underground mining activities, care and maintenance costs of $45 million were incurred at Obuasi during 2021. Non-sustaining capital expenditure at Geita in Tanzania increased mainly due to an increase in project capital with the start of the Nyamulilima project. For a discussion of the decrease in ounces of gold sold in Africa - Subsidiaries during 2021, see “Item 5A: Operating Results—Comparison of operating performance on a segment basis in 2021 with 2020—All-in sustaining costs per ounce”.
In Africa - Joint Ventures, all-in costs increased by $76 per ounce, or nine percent, from $824 per ounce in 2020 to $900 per ounce in 2021. This increase was mainly due to an increase in all-in sustaining costs and an increase inhigher non-sustaining project capital expenditure at Obuasi partially offset by. For a discussion of the 30,000-ounce increase in ounces of gold sold (excluding pre-production ounces).
In the Americas, all-in costs increased by $251$603 per ounce, or 58 percent, from $1,032 per ounce in 2020 to $1,635 per ounce in 2021. This increase was mainly due to an increase in closure and social responsibility costs not related to current operations. For a discussion of the decrease in ounces of gold sold in the Americas during 2021, see “Item 5A: Operating Results—Comparison of operating performance on a segment basis in 2021 with 2020—All-in sustaining costs per ounce”.
In Australia, all-in costs increased by $369 per ounce, or 27 percent, to $1,183from $1,356 per ounce in 2019 from $9322020 to $1,725 per ounce in 2018.2021. This increase was mainly due to an increase in all-in sustaining costs, an increase inhigher non-sustaining project capital expenditure at Sunrise Dam on the Golden Delicious open pit growth project and at Tropicana on the Havana cutback project, and higher non-sustaining exploration and study costs and the 83,000-ounce decrease in gold sold (excluding pre-production ounces).
Total cash costs per ounce
The currencies of Argentina Australia and Brazil were, on average, weaker against the US dollar during 20192021 as compared to 20182020, which positively impacted total cash costs per ounce for 2019.2021. This positive impact was partly offset by the currency of Australia being, on average, stronger against the US dollar during 2021 as compared to 2020. Total production in 2021 was lower as compared to 2020, which negatively impacted total cash costs per ounce for 2021. For a discussion of production during 2021, see “Item 5A: Operating Results—Key factors affecting results—Production in 2021”.
In Africa - Subsidiaries, total cash costs per ounce decreasedincreased by $12,$150 per ounce, or one18 percent, to $801from $841 per ounce in 2019 from $8132020 to $991 per ounce in 2018.2021. The decreaseincrease was mainly due to a 31,000-ounce increase185,000 ounce decrease in production (excluding pre-production ounces). The decrease was partially offset byand an increase in total cash costs.
171
At Obuasi in Ghana, total cash costs per ounce decreased by $109,$195 per ounce, or 1415 percent, to $695from $1,307 per ounce in 2019 from $8042020 to $1,112 per ounce in 2018. The decrease was2021. Total cash costs per ounce decreased year-on-year mainly due to the decreaseramp-up of Phase 2 production, despite the temporary suspension of underground stoping activities in 2021 due to a sill pillar incident in May 2021. During the temporary suspension period, care and maintenance costs of $45 million were incurred until underground stoping activities resumed in mid-October 2021.
At Siguiri in Guinea, total cash costs per ounce decreased by $93 per ounce, or seven percent, from $1,293 per ounce in 2020 to $1,200 per ounce in 2021. Total cash costs per ounce decreased year-on-year mainly as a result of higher production, partly offset by higher operating costs, increases on fuel and a 40,000-ounce increasereagent costs, and higher royalties paid from additional volumes sold in production (excluding pre-production ounces).2021.
In Africa - Joint Ventures, total cash costs per ounce increased by $18 per ounce, or three percent, from $629 per ounce in 2020 to $647 per ounce in 2021. The increase was mainly due to an increase in total cash costs. The increase was partiallycosts, partly offset by a 21,000-ounce1,000 ounce increase in production.Total cash costs per ounce increased year-on-year mainly as a result of lower open-pit recovered grades, unfavourable movements in stockpiles, higher royalties paid due to an increase in the average gold price received, and additional reagent consumption, as compared to 2020. The Kibali mine in the DRC was the only operating asset in Africa - Joint Ventures in 2021.
In Guinea, at Siguiri,the Americas, total cash costs per ounce increased by $247,$200 per ounce, or 2928 percent, to $1,091from $721 per ounce in 2019 from $8442020 to $921 per ounce in 20182021. The increase was mainly due to a 29,000-ounce90,000 ounce decrease in production and an increase in total cash costs.
In Africa - Joint Ventures, total cash costs per ounce decreased by $23, or three percent, to $657 per ounce in 2019 from $680 per ounce in 2018. The decrease was mainly due to a decrease in total cash costs. The decrease was partially offset by a 7,000-ounce decrease in production.
At Serra Grande, total cash costs per ounce increased by $47,$527 per ounce, or seven79 percent, to $707from $665 per ounce in 2019 from $6602020 to $1,192 per ounce in 2018 primarily2021. Total cash costs per ounce increased year-on-year mainly due to an increase in total cash costslower production, higher commodity prices (oil, iron ore and 7,000-ounce decrease inconstruction materials) and higher cost of services and labour as well as inefficiencies primarily caused by higher absenteeism due to COVID-19 and various production (excluding pre-production ounces).challenges encountered during 2021.
In Argentina, at Cerro Vanguardia, total cash costs per ounce increased by $197,$195 per ounce, or 4128 percent, to $673from $699 per ounce in 2019 from $4762020 to $894 per ounce in 2018 primarily2021. Total cash costs per ounce increased year-on-year mainly due to salary increases, additional costs relating to COVID-19 tests and other related medical costs in line with COVID-19 protocols, higher commodity prices and higher materials consumption (such as fuel, explosives and spare parts) as a 57,000-ounce decrease in production and a decrease in by-product revenue.result of higher tonnes mined. The increase was partiallypartly offset by a decrease in total cash costs.the weakening of the Argentinean peso against the US dollar and higher by-product revenue derived from higher ounces of silver sold.
In Australia, total cash costs per ounce decreasedincreased by $32,$228 per ounce, or four24 percent, to $730from $968 per ounce in 2019 from $7622020 to $1,196 per ounce in 20182021, primarily due to a 11,000-ounce decrease in production and an increase in total cash costs.
At Sunrise Dam, total cash costs per ounce increased by $252 per ounce, or 24 percent, from $1,069 per ounce in 2020 to $1,321 per ounce in 2021. Total cash costs per ounce increased year-on-year primarily due to lower production and higher mining costs (mainly higher cost of labour due to critical skill shortages), partly offset by lower royalties paid.
At Tropicana, total cash costs per ounce decreasedincreased by $90,$180 per ounce, or 1522 percent, to $504from $807 per ounce in 2019 compared2020 to $594$987 per ounce in 20182021. Total cash costs per ounce increased year-on-year mainly due to a 24,000-ounce increase in production. The decrease was partially offset by an increase in total cashlower grades, inventory movements and the impact of higher underground and open pit mining costs.
Overall the subsidiaries’ total cash costs per ounce increased by $20,$181, or three22 percent, to $763from $836 per ounce in 2019 compared2020 to $743$1,017 per ounce in 2018.2021. The increase was mainly due to an increase in total cash costs and a 45,000-ounce335,000-ounce decrease in production.
Reconciliations
The following tables present a reconciliation of cost of sales as included in the Company’s audited financial statements to “all-in sustaining costs”, “all-in sustaining costs per ounce”, “all-in costs”, “all-in costs per ounce”, “total cash costs net of by-product revenue” and “total cash costs per ounce” for each of the three years in the period ended 31 December 2022 on a total
and segment basis. In addition, the Company has provided detail of Contentsthe attributable ounces of gold produced and sold by mine for each of those periods below.
For the year ended 31 December 2022
Corporate and other
(in $ millions, except as otherwise noted)
Corporate (4) | |||||||||||||||||||||||||||||||||||||||||||||||||||||||||||
| All-in sustaining costs | |||||||||||||||||||||||||||||||||||||||||||||||||||||||||||
Cost of sales per segmental information(5) | 4 | ||||||||||||||||||||||||||||||||||||||||||||||||||||||||||
| By-product revenue | — | ||||||||||||||||||||||||||||||||||||||||||||||||||||||||||
| Cost of sales | 4 | ||||||||||||||||||||||||||||||||||||||||||||||||||||||||||
| Realised other commodity contracts | |||||||||||||||||||||||||||||||||||||||||||||||||||||||||||
| Amortisation of tangible, intangible and right of use assets | (4) | ||||||||||||||||||||||||||||||||||||||||||||||||||||||||||
| Adjusted for decommissioning and inventory amortisation | — | ||||||||||||||||||||||||||||||||||||||||||||||||||||||||||
| Corporate administration and marketing expenditure | 79 | ||||||||||||||||||||||||||||||||||||||||||||||||||||||||||
| Lease payment sustaining | 2 | ||||||||||||||||||||||||||||||||||||||||||||||||||||||||||
| Sustaining exploration and study costs | — | ||||||||||||||||||||||||||||||||||||||||||||||||||||||||||
| Total sustaining capital expenditure | 1 | ||||||||||||||||||||||||||||||||||||||||||||||||||||||||||
| All-in sustaining costs | 82 | ||||||||||||||||||||||||||||||||||||||||||||||||||||||||||
Adjusted for non-controlling interests and non-gold producing companies(1) | — | ||||||||||||||||||||||||||||||||||||||||||||||||||||||||||
| All-in sustaining costs adjusted for non-controlling interests and non-gold producing companies | 82 | ||||||||||||||||||||||||||||||||||||||||||||||||||||||||||
| All-in sustaining costs | 82 | ||||||||||||||||||||||||||||||||||||||||||||||||||||||||||
| Non-sustaining project capital expenditure | — | ||||||||||||||||||||||||||||||||||||||||||||||||||||||||||
| Non-sustaining lease payments | — | ||||||||||||||||||||||||||||||||||||||||||||||||||||||||||
| Non-sustaining exploration and study costs | — | ||||||||||||||||||||||||||||||||||||||||||||||||||||||||||
| Care and maintenance | — | ||||||||||||||||||||||||||||||||||||||||||||||||||||||||||
| Closure and social responsibility costs not related to current operations | 7 | ||||||||||||||||||||||||||||||||||||||||||||||||||||||||||
| Other provisions | 14 | ||||||||||||||||||||||||||||||||||||||||||||||||||||||||||
| All-in costs | 103 | ||||||||||||||||||||||||||||||||||||||||||||||||||||||||||
Adjusted for non-controlling interests and non-gold producing companies(1) | — | ||||||||||||||||||||||||||||||||||||||||||||||||||||||||||
| All-in costs adjusted for non-controlling interests and non-gold producing companies | 103 | ||||||||||||||||||||||||||||||||||||||||||||||||||||||||||
Gold sold - oz (000)(2) | — | ||||||||||||||||||||||||||||||||||||||||||||||||||||||||||
All-in sustaining cost per unit - $/oz(3) | — | ||||||||||||||||||||||||||||||||||||||||||||||||||||||||||
All-in cost per unit - $/oz(3) | — | ||||||||||||||||||||||||||||||||||||||||||||||||||||||||||
(1)Adjusting for non-controlling interest of items included in calculation, to disclose the attributable portions only.
(2)Attributable portion.
(3)In addition to the operational performances of the mines, “all-in sustaining cost per ounce”, “all-in cost per ounce” and “total cash costs per ounce” are affected by fluctuations in the currency exchange rate. AngloGold Ashanti reports “all-in sustaining cost per ounce” and “all-in cost per ounce” calculated to the nearest US dollar amount and gold sold in ounces. AngloGold Ashanti reports “total cash costs per ounce” calculated to the nearest US dollar amount and gold produced in ounces.
(4)Corporate includes non-gold producing subsidiaries.
(5)Refer to “Item 18: Financial Statements—Note 2—Segmental Information”.
(6)A new segment for Projects (previously reported under the Americas segment) has been introduced due to the implementation of the new Operating Model which comprises all the major non-sustaining capital projects with the potential to be developed into operating entities. Comparative information has been restated.
Rounding of figures may result in computational discrepancies.
173
For the year ended 31 December 2022
Corporate and other
(in $ millions, except as otherwise noted)
Corporate(4) | |||||||||||||||||||||||||||||||||||||||||||||||||||||||||||
| Total cash costs | |||||||||||||||||||||||||||||||||||||||||||||||||||||||||||
Cost of sales per segmental information(5) | 4 | ||||||||||||||||||||||||||||||||||||||||||||||||||||||||||
| By-product revenue | — | ||||||||||||||||||||||||||||||||||||||||||||||||||||||||||
| Inventory change | — | ||||||||||||||||||||||||||||||||||||||||||||||||||||||||||
| Amortisation of tangible assets | (3) | ||||||||||||||||||||||||||||||||||||||||||||||||||||||||||
| Amortisation of right of use assets | (1) | ||||||||||||||||||||||||||||||||||||||||||||||||||||||||||
| Amortisation of intangible assets | — | ||||||||||||||||||||||||||||||||||||||||||||||||||||||||||
| Rehabilitation and other non-cash costs | — | ||||||||||||||||||||||||||||||||||||||||||||||||||||||||||
| Retrenchment costs | — | ||||||||||||||||||||||||||||||||||||||||||||||||||||||||||
| Total cash costs net of by-product revenue | — | ||||||||||||||||||||||||||||||||||||||||||||||||||||||||||
Adjusted for non-controlling interests and non-gold producing companies (1) | — | ||||||||||||||||||||||||||||||||||||||||||||||||||||||||||
| Total cash costs adjusted for non-controlling interests and non-gold producing companies | — | ||||||||||||||||||||||||||||||||||||||||||||||||||||||||||
Gold produced – oz (000)(2) | — | ||||||||||||||||||||||||||||||||||||||||||||||||||||||||||
Total cash costs per unit – $/oz(3) | — | ||||||||||||||||||||||||||||||||||||||||||||||||||||||||||
(1)Adjusting for non-controlling interest of items included in calculation, to disclose the attributable portions only.
(2)Attributable portion.
(3)In addition to the operational performances of the mines, “all-in sustaining cost per ounce”, “all-in cost per ounce” and “total cash costs per ounce” are affected by fluctuations in the currency exchange rate. AngloGold Ashanti reports “all-in sustaining cost per ounce” and “all-in cost per ounce” calculated to the nearest US dollar amount and gold sold in ounces. AngloGold Ashanti reports “total cash costs per ounce” calculated to the nearest US dollar amount and gold produced in ounces.
(4)Corporate includes non-gold producing subsidiaries.
(5)Refer to “Item 18: Financial Statements—Note 2—Segmental Information”.
(6)A new segment for Projects (previously reported under the Americas segment) has been introduced due to the implementation of the new Operating Model which comprises all the major non-sustaining capital projects with the potential to be developed into operating entities. Comparative information has been restated.
Rounding of figures may result in computational discrepancies.
174
For the year ended 31 December 2022
Operations Africa
(in $ millions, except as otherwise noted)
| AFRICA | AFRICA | ||||||||||||||||||||||||||||
| Kibali | Other | Joint Ventures | Iduapriem | Obuasi | Siguiri | Geita | Africa Other | Subsidiaries | |||||||||||||||||||||
| All-in sustaining costs | |||||||||||||||||||||||||||||
Cost of sales per segmental information(5) | 342 | — | 342 | 314 | 266 | 488 | 594 | — | 1,662 | ||||||||||||||||||||
| By-product revenue | (1) | — | (1) | (1) | (1) | — | (1) | — | (3) | ||||||||||||||||||||
| Cost of sales | 341 | — | 341 | 313 | 265 | 488 | 593 | — | 1,659 | ||||||||||||||||||||
| Realised other commodity contracts | |||||||||||||||||||||||||||||
| Amortisation of tangible, intangible and right of use assets | (95) | — | (95) | (80) | (40) | (50) | (102) | — | (272) | ||||||||||||||||||||
| Adjusted for decommissioning and inventory amortisation | — | — | — | — | — | — | — | — | — | ||||||||||||||||||||
| Corporate administration and marketing expenditure | — | — | — | — | — | — | — | — | — | ||||||||||||||||||||
| Lease payment sustaining | 8 | — | 8 | 4 | — | 1 | 22 | — | 27 | ||||||||||||||||||||
| Sustaining exploration and study costs | — | — | — | 2 | — | 5 | 8 | — | 15 | ||||||||||||||||||||
| Total sustaining capital expenditure | 71 | — | 71 | 81 | 79 | 23 | 111 | — | 294 | ||||||||||||||||||||
| All-in sustaining costs | 325 | — | 325 | 320 | 304 | 467 | 632 | — | 1,723 | ||||||||||||||||||||
Adjusted for non-controlling interests and non -gold producing companies(1) | — | — | — | — | — | (70) | — | — | (70) | ||||||||||||||||||||
| All-in sustaining costs adjusted for non-controlling interests and non-gold producing companies | 325 | — | 325 | 320 | 304 | 397 | 632 | — | 1,653 | ||||||||||||||||||||
| All-in sustaining costs | 325 | — | 325 | 320 | 304 | 467 | 632 | — | 1,723 | ||||||||||||||||||||
| Non-sustaining project capital expenditure | 19 | — | 19 | 65 | 80 | 4 | 43 | — | 192 | ||||||||||||||||||||
| Non-sustaining lease payments | — | — | — | — | — | — | 3 | — | 3 | ||||||||||||||||||||
| Non-sustaining exploration and study costs | 2 | — | 2 | 1 | — | 7 | 5 | — | 13 | ||||||||||||||||||||
| Care and maintenance | — | — | — | — | — | — | — | — | — | ||||||||||||||||||||
| Closure and social responsibility costs not related to current operations | 10 | 1 | 11 | 1 | (23) | — | — | — | (22) | ||||||||||||||||||||
| Other provisions | — | — | — | — | — | — | — | — | — | ||||||||||||||||||||
| All-in costs | 356 | 1 | 357 | 387 | 361 | 478 | 683 | — | 1,909 | ||||||||||||||||||||
Adjusted for non-controlling interests and non-gold producing companies(1) | — | — | — | — | — | (72) | — | — | (72) | ||||||||||||||||||||
| All-in costs adjusted for non-controlling interests and non-gold producing companies | 356 | 1 | 357 | 387 | 361 | 406 | 683 | — | 1,837 | ||||||||||||||||||||
Gold sold – oz (000)(2) | 332 | — | 332 | 247 | 241 | 278 | 515 | — | 1,281 | ||||||||||||||||||||
All-in sustaining cost per unit – $/oz(3) | 979 | — | 979 | 1,299 | 1,264 | 1,428 | 1,227 | — | 1,291 | ||||||||||||||||||||
All-in cost per unit – $/oz(3) | 1,072 | — | 1,075 | 1,570 | 1,499 | 1,461 | 1,325 | — | 1,434 | ||||||||||||||||||||
175
For the year ended 31 December 2022
Operations Africa
(in $ millions, except as otherwise noted)
| AFRICA | AFRICA | ||||||||||||||||||||||||||||
| Kibali | Other | Joint Ventures | Iduapriem | Obuasi | Siguiri | Geita | Africa other | Subsidiaries | |||||||||||||||||||||
| Total cash costs | |||||||||||||||||||||||||||||
Cost of sales per segmental information(5) | 342 | — | 342 | 314 | 266 | 488 | 594 | — | 1,662 | ||||||||||||||||||||
| By-product revenue | (1) | — | (1) | (1) | (1) | — | (1) | — | (3) | ||||||||||||||||||||
| Inventory change | 3 | — | 3 | 3 | 6 | 4 | 7 | (1) | 19 | ||||||||||||||||||||
| Amortisation of tangible assets | (93) | — | (93) | (77) | (39) | (49) | (77) | — | (242) | ||||||||||||||||||||
| Amortisation of right of use assets | (2) | — | (2) | (3) | — | (1) | (25) | — | (29) | ||||||||||||||||||||
| Amortisation of intangible assets | — | — | — | — | (1) | — | — | — | (1) | ||||||||||||||||||||
| Rehabilitation and other non-cash costs | (4) | — | (4) | 4 | (2) | (8) | (7) | — | (13) | ||||||||||||||||||||
| Retrenchment costs | — | — | — | — | — | — | — | — | — | ||||||||||||||||||||
| Total cash costs net of by-product revenue | 245 | — | 245 | 240 | 229 | 434 | 491 | (1) | 1,393 | ||||||||||||||||||||
Adjusted for non-controlling interests non-gold producing companies and other(1) | — | — | — | — | — | (65) | — | — | (65) | ||||||||||||||||||||
| Total cash costs adjusted for non-controlling interests and non-gold producing companies and other | 245 | — | 245 | 240 | 229 | 369 | 491 | (1) | 1,328 | ||||||||||||||||||||
Gold produced - oz (000)(2) | 337 | — | 337 | 248 | 250 | 279 | 521 | — | 1,298 | ||||||||||||||||||||
Total cash costs per unit - $/oz(3) | 725 | — | 725 | 970 | 914 | 1,319 | 944 | — | 1,023 | ||||||||||||||||||||
176
For the year ended 31 December 2022
Operations in Australia, America and Projects
(in $ millions, except as otherwise noted)
| AUSTRALIA | AMERICAS | PROJECTS (6) | ||||||||||||||||||||||||||||||
| Sunrise Dam | Tropicana | Australia other | Total Australia | Cerro Vanguardia | AngloGold Ashanti Mineração | Serra Grande | Americas other | Total Americas | ||||||||||||||||||||||||
| All-in sustaining costs | ||||||||||||||||||||||||||||||||
Cost of sales per segmental information(5) | 371 | 382 | 30 | 783 | 273 | 477 | 162 | 1 | 913 | — | ||||||||||||||||||||||
| By-product revenue | (1) | (3) | — | (4) | (75) | (31) | — | — | (106) | — | ||||||||||||||||||||||
| Cost of sales | 370 | 379 | 30 | 779 | 198 | 446 | 162 | 1 | 807 | — | ||||||||||||||||||||||
| Realised other commodity contracts | ||||||||||||||||||||||||||||||||
| Amortisation of tangible, intangible and right of use assets | (54) | (117) | (1) | (172) | (39) | (106) | (40) | — | (185) | — | ||||||||||||||||||||||
| Adjusted for decommissioning and inventory amortisation | — | 1 | — | 1 | 6 | — | (1) | — | 5 | — | ||||||||||||||||||||||
| Corporate administration and marketing expenditure | — | — | — | — | — | — | — | — | — | — | ||||||||||||||||||||||
| Lease payment sustaining | 12 | 11 | 1 | 24 | — | 32 | 4 | — | 36 | 1 | ||||||||||||||||||||||
| Sustaining exploration and study costs | 1 | 1 | — | 2 | 3 | 1 | — | — | 4 | — | ||||||||||||||||||||||
| Total sustaining capital expenditure | 50 | 41 | — | 91 | 66 | 199 | 57 | — | 322 | — | ||||||||||||||||||||||
| All-in sustaining costs | 379 | 316 | 30 | 725 | 234 | 572 | 182 | 1 | 989 | 1 | ||||||||||||||||||||||
Adjusted for non-controlling interests and non -gold producing companies(1) | — | — | — | — | (18) | — | — | — | (18) | — | ||||||||||||||||||||||
| All-in sustaining costs adjusted for non-controlling interests and non-gold producing companies | 379 | 316 | 30 | 725 | 216 | 572 | 182 | 1 | 971 | 1 | ||||||||||||||||||||||
| All-in sustaining costs | 379 | 316 | 30 | 725 | 234 | 572 | 182 | 1 | 989 | 1 | ||||||||||||||||||||||
| Non-sustaining project capital expenditure | — | 111 | — | 111 | — | — | — | — | — | 17 | ||||||||||||||||||||||
| Non-sustaining lease payments | — | — | — | — | — | — | — | — | — | — | ||||||||||||||||||||||
| Non-sustaining exploration and study costs | 18 | 6 | 19 | 43 | 1 | 9 | 3 | 1 | 14 | 113 | ||||||||||||||||||||||
| Care and maintenance | — | — | — | — | — | — | — | — | — | — | ||||||||||||||||||||||
| Closure and social responsibility costs not related to current operations | — | — | — | — | — | 16 | 2 | — | 18 | — | ||||||||||||||||||||||
| Other provisions | — | — | — | — | — | — | — | — | — | — | ||||||||||||||||||||||
| All-in costs | 397 | 433 | 49 | 879 | 235 | 597 | 187 | 2 | 1,021 | 131 | ||||||||||||||||||||||
Adjusted for non-controlling interests and non -gold producing companies(1) | — | — | — | — | (18) | — | — | — | (18) | — | ||||||||||||||||||||||
| All-in costs adjusted for non-controlling interests and non-gold producing companies | 397 | 433 | 49 | 879 | 217 | 597 | 187 | 2 | 1,003 | 131 | ||||||||||||||||||||||
Gold sold – oz (000)(2) | 228 | 311 | — | 539 | 166 | 310 | 89 | — | 565 | — | ||||||||||||||||||||||
All-in sustaining cost per unit – $/oz(3) | 1,666 | 1,014 | — | 1,345 | 1,301 | 1,841 | 2,053 | — | 1,718 | — | ||||||||||||||||||||||
All-in cost per unit – $/oz(3) | 1,746 | 1,391 | — | 1,631 | 1,309 | 1,923 | 2,102 | — | 1,775 | — | ||||||||||||||||||||||
177
For the year ended 31 December 2022
Operations in Australia, America and Projects
(in $ millions, except as otherwise noted)
| AUSTRALIA | AMERICAS | |||||||||||||||||||||||||||||||
| Sunrise Dam | Tropicana | Australia other | Total Australia | Cerro Vanguardia | AngloGold Ashanti Mineração | Serra Grande | Americas other | Total Americas | ||||||||||||||||||||||||
| Total cash costs | ||||||||||||||||||||||||||||||||
Cost of sales per segmental information(5) | 371 | 382 | 30 | 783 | 273 | 477 | 162 | 1 | 913 | |||||||||||||||||||||||
| By-product revenue | (1) | (3) | — | (4) | (75) | (31) | — | — | (106) | |||||||||||||||||||||||
| Inventory change | 8 | (5) | — | 3 | 9 | 1 | (1) | (1) | 8 | |||||||||||||||||||||||
| Amortisation of tangible assets | (43) | (109) | — | (152) | (39) | (79) | (36) | — | (154) | |||||||||||||||||||||||
| Amortisation of right of use assets | (11) | (8) | (1) | (20) | — | (27) | (4) | — | (31) | |||||||||||||||||||||||
| Amortisation of intangible assets | — | — | — | — | — | — | — | — | — | |||||||||||||||||||||||
| Rehabilitation and other non-cash costs | 2 | 12 | (1) | 13 | 2 | (1) | (1) | — | — | |||||||||||||||||||||||
| Retrenchment costs | — | — | (1) | (1) | (2) | (2) | (1) | — | (5) | |||||||||||||||||||||||
| Total cash costs net of by-product revenue | 326 | 269 | 27 | 622 | 168 | 338 | 119 | — | 625 | |||||||||||||||||||||||
Adjusted for non-controlling interests, non-gold producing companies and other(1) | — | — | — | — | (13) | — | — | — | (13) | |||||||||||||||||||||||
| Total cash costs net of by-product revenue adjusted for non-controlling interests and non-gold producing companies | 326 | 269 | 27 | 622 | 155 | 338 | 119 | — | 612 | |||||||||||||||||||||||
Gold produced – oz (000)(2) | 232 | 306 | — | 538 | 170 | 311 | 88 | — | 569 | |||||||||||||||||||||||
Total cash costs per unit – $/oz(3) | 1,402 | 881 | — | 1,157 | 913 | 1,088 | 1,355 | — | 1,078 | |||||||||||||||||||||||
178
For the year ended 31 December 2022
AngloGold Ashanti operations – Total
(in $ millions, except as otherwise noted)
| JOINT VENTURES | SUBSIDIARIES | |||||||
| All-in sustaining costs | ||||||||
Cost of sales per segmental information(5) | 342 | 3,362 | ||||||
| By-product revenue | (1) | (113) | ||||||
| Cost of sales | 341 | 3,249 | ||||||
| Realised other commodity contracts | ||||||||
| Amortisation of tangible, intangible and right of use assets | (95) | (633) | ||||||
| Adjusted for decommissioning and inventory amortisation | — | 6 | ||||||
| Corporate administration and marketing expenditure | — | 79 | ||||||
| Lease payment sustaining | 8 | 90 | ||||||
| Sustaining exploration and study costs | — | 21 | ||||||
| Total sustaining capital expenditure | 71 | 708 | ||||||
| All-in sustaining costs | 325 | 3,520 | ||||||
Adjusted for non-controlling interests and non-gold producing companies(1) | — | (88) | ||||||
| All-in sustaining costs adjusted for non-controlling interests and non-gold producing companies | 325 | 3,432 | ||||||
| All-in sustaining costs | 325 | 3,520 | ||||||
| Non-sustaining project capital expenditure | 19 | 320 | ||||||
| Non-sustaining lease payments | — | 3 | ||||||
| Non-sustaining exploration and study costs | 2 | 183 | ||||||
| Care and maintenance | — | — | ||||||
| Closure and social responsibility costs not related to current operations | 11 | 3 | ||||||
| Other provisions | — | 14 | ||||||
| All-in costs | 357 | 4,043 | ||||||
Adjusted for non-controlling interests and non-gold producing companies(1) | — | (90) | ||||||
| All-in costs adjusted for non-controlling interests and non-gold producing companies | 357 | 3,953 | ||||||
Gold sold – oz (000)(2) | 332 | 2,385 | ||||||
All-in sustaining cost per unit – $/oz(3) | 979 | 1,439 | ||||||
All-in cost per unit – $/oz(3) | 1,075 | 1,658 | ||||||
179
For the year ended 31 December 2022
AngloGold Ashanti operations – Total
(in $ millions, except as otherwise noted)
| JOINT VENTURES | SUBSIDIARIES | |||||||
| Total cash costs | ||||||||
Cost of sales per segmental information(5) | 342 | 3,362 | ||||||
| By-product revenue | (1) | (113) | ||||||
| Inventory change | 3 | 30 | ||||||
| Amortisation of tangible assets | (93) | (551) | ||||||
| Amortisation of right of use assets | (2) | (81) | ||||||
| Amortisation of intangible assets | — | (1) | ||||||
| Rehabilitation and other non-cash costs | (4) | — | ||||||
| Retrenchment costs | — | (6) | ||||||
| Total cash costs net of by-product revenue | 245 | 2,640 | ||||||
Adjusted for non-controlling interests and non-gold producing companies(1) | — | (78) | ||||||
| Total cash costs net of by-product revenue adjusted for non-controlling interests and non-gold producing companies | 245 | 2,562 | ||||||
Gold produced – oz (000)(2) | 337 | 2,405 | ||||||
Total cash costs (adjusted) per unit – $/oz(3) | 725 | 1,066 | ||||||
180
For the year ended 31 December 2021
Corporate and other
(in $ millions, except as otherwise noted)
Corporate (4) | |||||||||||||||||||||||||||||||||||||||||||||||||||||||||||
| All-in sustaining costs | |||||||||||||||||||||||||||||||||||||||||||||||||||||||||||
Cost of sales per segmental information(5) | (5) | ||||||||||||||||||||||||||||||||||||||||||||||||||||||||||
| By-product revenue | — | ||||||||||||||||||||||||||||||||||||||||||||||||||||||||||
| Cost of sales | (5) | ||||||||||||||||||||||||||||||||||||||||||||||||||||||||||
| Realised other commodity contracts | |||||||||||||||||||||||||||||||||||||||||||||||||||||||||||
| Amortisation of tangible, intangible and right of use assets | (3) | ||||||||||||||||||||||||||||||||||||||||||||||||||||||||||
| Adjusted for decommissioning and inventory amortisation | — | ||||||||||||||||||||||||||||||||||||||||||||||||||||||||||
| Corporate administration and marketing expenditure | 73 | ||||||||||||||||||||||||||||||||||||||||||||||||||||||||||
| Lease payment sustaining | 3 | ||||||||||||||||||||||||||||||||||||||||||||||||||||||||||
| Sustaining exploration and study costs | — | ||||||||||||||||||||||||||||||||||||||||||||||||||||||||||
| Total sustaining capital expenditure | 11 | ||||||||||||||||||||||||||||||||||||||||||||||||||||||||||
| All-in sustaining costs | 79 | ||||||||||||||||||||||||||||||||||||||||||||||||||||||||||
Adjusted for non-controlling interests and non-gold producing companies(1) | — | ||||||||||||||||||||||||||||||||||||||||||||||||||||||||||
| All-in sustaining costs adjusted for non-controlling interests and non-gold producing companies | 79 | ||||||||||||||||||||||||||||||||||||||||||||||||||||||||||
| All-in sustaining costs | 79 | ||||||||||||||||||||||||||||||||||||||||||||||||||||||||||
| Non-sustaining project capital expenditure | — | ||||||||||||||||||||||||||||||||||||||||||||||||||||||||||
| Non-sustaining lease payments | — | ||||||||||||||||||||||||||||||||||||||||||||||||||||||||||
| Non-sustaining exploration and study costs | — | ||||||||||||||||||||||||||||||||||||||||||||||||||||||||||
| Care and maintenance | — | ||||||||||||||||||||||||||||||||||||||||||||||||||||||||||
| Closure and social responsibility costs not related to current operations | 4 | ||||||||||||||||||||||||||||||||||||||||||||||||||||||||||
| Other provisions | 1 | ||||||||||||||||||||||||||||||||||||||||||||||||||||||||||
| All-in costs | 84 | ||||||||||||||||||||||||||||||||||||||||||||||||||||||||||
Adjusted for non-controlling interests and non-gold producing companies(1) | — | ||||||||||||||||||||||||||||||||||||||||||||||||||||||||||
| All-in costs adjusted for non-controlling interests and non-gold producing companies | 84 | ||||||||||||||||||||||||||||||||||||||||||||||||||||||||||
Gold sold - oz (000)(2) | — | ||||||||||||||||||||||||||||||||||||||||||||||||||||||||||
All-in sustaining cost per unit - $/oz(3) | — | ||||||||||||||||||||||||||||||||||||||||||||||||||||||||||
All-in cost per unit - $/oz(3) | — | ||||||||||||||||||||||||||||||||||||||||||||||||||||||||||
(1)Adjusting for non-controlling interest of items included in calculation, to disclose the attributable portions only.
(2)Attributable portion.
(3)In addition to the operational performances of the mines, “all-in sustaining cost per ounce”, “all-in cost per ounce” and “total cash costs per ounce” are affected by fluctuations in the currency exchange rate. AngloGold Ashanti reports “all-in sustaining cost per ounce” and “all-in cost per ounce” calculated to the nearest US dollar amount and gold sold in ounces. AngloGold Ashanti reports “total cash costs per ounce” calculated to the nearest US dollar amount and gold produced in ounces.
(4)Corporate includes non-gold producing subsidiaries.
(5)Refer to “Item 18: Financial Statements—Note 2—Segmental Information”.
(6)A new segment for Projects (previously reported under the Americas segment) has been introduced due to the implementation of the new Operating Model which comprises all the major non-sustaining capital projects with the potential to be developed into operating entities. Comparative information has been restated.
Rounding of figures may result in computational discrepancies.
181
For the year ended 31 December 2021
Corporate and other
(in $ millions, except as otherwise noted)
Corporate (4) | |||||||||||||||||||||||||||||||||||||||||||||||||||||||||||
| Total cash costs | |||||||||||||||||||||||||||||||||||||||||||||||||||||||||||
Cost of sales per segmental information(5) | (5) | ||||||||||||||||||||||||||||||||||||||||||||||||||||||||||
| By-product revenue | — | ||||||||||||||||||||||||||||||||||||||||||||||||||||||||||
| Inventory change | — | ||||||||||||||||||||||||||||||||||||||||||||||||||||||||||
| Amortisation of tangible assets | (1) | ||||||||||||||||||||||||||||||||||||||||||||||||||||||||||
| Amortisation of right of use assets | (1) | ||||||||||||||||||||||||||||||||||||||||||||||||||||||||||
| Amortisation of intangible assets | (1) | ||||||||||||||||||||||||||||||||||||||||||||||||||||||||||
| Rehabilitation and other non-cash costs | — | ||||||||||||||||||||||||||||||||||||||||||||||||||||||||||
| Retrenchment costs | — | ||||||||||||||||||||||||||||||||||||||||||||||||||||||||||
| Total cash costs net of by-product revenue | (8) | ||||||||||||||||||||||||||||||||||||||||||||||||||||||||||
Adjusted for non-controlling interests,(1) | — | ||||||||||||||||||||||||||||||||||||||||||||||||||||||||||
| Total cash costs for non-controlling interests | (8) | ||||||||||||||||||||||||||||||||||||||||||||||||||||||||||
Gold produced – oz (000)(2) | — | ||||||||||||||||||||||||||||||||||||||||||||||||||||||||||
Total cash costs per unit – $/oz(3) | — | ||||||||||||||||||||||||||||||||||||||||||||||||||||||||||
(1)Adjusting for non-controlling interest of items included in calculation, to disclose the attributable portions only.
(2)Attributable portion.
(3)In addition to the operational performances of the mines, “all-in sustaining cost per ounce”, “all-in cost per ounce” and “total cash costs per ounce” are affected by fluctuations in the currency exchange rate. AngloGold Ashanti reports “all-in sustaining cost per ounce” and “all-in cost per ounce” calculated to the nearest US dollar amount and gold sold in ounces. AngloGold Ashanti reports “total cash costs per ounce” calculated to the nearest US dollar amount and gold produced in ounces.
(4)Corporate includes non-gold producing subsidiaries.
(5)Refer to “Item 18: Financial Statements—Note 2—Segmental Information”.
(6)A new segment for Projects (previously reported under the Americas segment) has been introduced due to the implementation of the new Operating Model which comprises all the major non-sustaining capital projects with the potential to be developed into operating entities. Comparative information has been restated.
Rounding of figures may result in computational discrepancies.
182
For the year ended 31 December 2021
Operations Africa
(in $ millions, except as otherwise noted)
| AFRICA | AFRICA | ||||||||||||||||||||||||||||
| Kibali | Other | Joint Ventures | Iduapriem | Obuasi | Siguiri | Geita | Africa Other | Subsidiaries | |||||||||||||||||||||
| All-in sustaining costs | |||||||||||||||||||||||||||||
Cost of sales per segmental information(5) | 350 | — | 350 | 238 | 164 | 410 | 488 | — | 1,300 | ||||||||||||||||||||
| By-product revenue | (2) | — | (2) | (1) | — | (1) | (1) | — | (3) | ||||||||||||||||||||
| Cost of sales | 348 | — | 348 | 237 | 164 | 409 | 487 | — | 1,297 | ||||||||||||||||||||
| Realised other commodity contracts | |||||||||||||||||||||||||||||
| Amortisation of tangible, intangible and right of use assets | (105) | — | (105) | (19) | (22) | (47) | (75) | — | (163) | ||||||||||||||||||||
| Adjusted for decommissioning and inventory amortisation | 1 | — | 1 | 1 | — | — | 1 | — | 2 | ||||||||||||||||||||
| Corporate administration and marketing expenditure | — | — | — | — | — | — | — | — | — | ||||||||||||||||||||
| Lease payment sustaining | 9 | — | 9 | 2 | — | 1 | 19 | — | 22 | ||||||||||||||||||||
| Sustaining exploration and study costs | — | — | — | 1 | — | 3 | 4 | — | 8 | ||||||||||||||||||||
| Total sustaining capital expenditure | 61 | — | 61 | 103 | 46 | 18 | 65 | — | 232 | ||||||||||||||||||||
| All-in sustaining costs | 314 | — | 314 | 325 | 188 | 384 | 501 | — | 1,398 | ||||||||||||||||||||
Adjusted for non-controlling interests and non -gold producing companies(1) | — | — | — | — | — | (58) | — | — | (58) | ||||||||||||||||||||
| All-in sustaining costs adjusted for non-controlling interests and non-gold producing companies | 314 | — | 314 | 325 | 188 | 326 | 501 | — | 1,340 | ||||||||||||||||||||
| All-in sustaining costs | 314 | — | 314 | 325 | 188 | 384 | 501 | — | 1,398 | ||||||||||||||||||||
| Non-sustaining project capital expenditure | 11 | — | 11 | 2 | 122 | 20 | 58 | — | 202 | ||||||||||||||||||||
| Non-sustaining lease payments | — | — | — | — | — | — | 2 | — | 2 | ||||||||||||||||||||
| Non-sustaining exploration and study costs | 2 | — | 2 | 3 | 2 | 2 | 1 | — | 8 | ||||||||||||||||||||
| Care and maintenance | — | — | — | — | 45 | — | — | — | 45 | ||||||||||||||||||||
| Closure and social responsibility costs not related to current operations | 3 | — | 3 | — | 10 | — | — | — | 10 | ||||||||||||||||||||
| Other provisions | — | — | — | — | — | — | 3 | — | 3 | ||||||||||||||||||||
| All-in costs | 330 | — | 330 | 330 | 367 | 406 | 565 | — | 1,668 | ||||||||||||||||||||
Adjusted for non-controlling interests and non-gold producing companies(1) | — | — | — | — | — | (61) | — | — | (61) | ||||||||||||||||||||
| All-in costs adjusted for non-controlling interests and non-gold producing companies | 330 | — | 330 | 330 | 367 | 345 | 565 | — | 1,607 | ||||||||||||||||||||
Gold sold – oz (000)(2) | 367 | — | 367 | 201 | 114 | 258 | 487 | — | 1,060 | ||||||||||||||||||||
All-in sustaining cost per unit – $/oz(3) | 856 | — | 856 | 1,619 | 1,653 | 1,267 | 1,029 | — | 1,264 | ||||||||||||||||||||
All-in cost per unit – $/oz(3) | 898 | — | 900 | 1,642 | 3,229 | 1,340 | 1,161 | — | 1,516 | ||||||||||||||||||||
183
For the year ended 31 December 2021
Operations Africa
(in $ millions, except as otherwise noted)
| AFRICA | AFRICA | ||||||||||||||||||||||||||||
| Kibali | Other | Joint Ventures | Iduapriem | Obuasi | Siguiri | Geita | Africa other | Subsidiaries | |||||||||||||||||||||
| Total cash costs | |||||||||||||||||||||||||||||
Cost of sales per segmental information(5) | 350 | — | 350 | 238 | 164 | 410 | 488 | — | 1,300 | ||||||||||||||||||||
| By-product revenue | (2) | — | (2) | (1) | — | (1) | (1) | — | (3) | ||||||||||||||||||||
| Inventory change | (1) | — | (1) | 1 | (10) | (1) | (1) | — | (11) | ||||||||||||||||||||
| Amortisation of tangible assets | (100) | — | (100) | (17) | (21) | (46) | (55) | — | (139) | ||||||||||||||||||||
| Amortisation of right of use assets | (5) | — | (5) | (2) | — | (1) | (20) | — | (23) | ||||||||||||||||||||
| Amortisation of intangible assets | — | — | — | — | (1) | — | — | — | (1) | ||||||||||||||||||||
| Rehabilitation and other non-cash costs | (5) | — | (5) | (1) | (12) | 2 | (12) | — | (23) | ||||||||||||||||||||
| Retrenchment costs | — | — | — | — | — | — | — | — | — | ||||||||||||||||||||
| Total cash costs net of by-product revenue | 237 | — | 237 | 218 | 120 | 363 | 399 | — | 1,100 | ||||||||||||||||||||
Adjusted for non-controlling interests non-gold producing companies and other(1) | — | — | — | — | — | (55) | — | — | (55) | ||||||||||||||||||||
| Total cash costs adjusted for non-controlling interests and non-gold producing companies and other | 237 | — | 237 | 218 | 120 | 308 | 399 | — | 1,045 | ||||||||||||||||||||
Gold produced - oz (000)(2) | 365 | — | 365 | 202 | 108 | 258 | 486 | — | 1,054 | ||||||||||||||||||||
Total cash costs per unit - $/oz(3) | 647 | — | 647 | 1,081 | 1,112 | 1,200 | 822 | — | 991 | ||||||||||||||||||||
184
For the year ended 31 December 2021
Operations in Australia, America and Projects
(in $ millions, except as otherwise noted)
| AUSTRALIA | AMERICAS | PROJECTS (6) Restated | ||||||||||||||||||||||||||||||
| Sunrise Dam | Tropicana | Australia other | Total Australia | Cerro Vanguardia | AngloGold Ashanti Mineração | Serra Grande | Americas other | Total Americas | ||||||||||||||||||||||||
| All-in sustaining costs | ||||||||||||||||||||||||||||||||
Cost of sales per segmental information(5) | 364 | 346 | 30 | 740 | 261 | 435 | 123 | 3 | 822 | — | ||||||||||||||||||||||
| By-product revenue | (1) | (3) | — | (4) | (93) | (26) | — | — | (119) | — | ||||||||||||||||||||||
| Cost of sales | 363 | 343 | 30 | 736 | 168 | 409 | 123 | 3 | 703 | — | ||||||||||||||||||||||
| Realised other commodity contracts | ||||||||||||||||||||||||||||||||
| Amortisation of tangible, intangible and right of use assets | (60) | (88) | (2) | (150) | (27) | (108) | (25) | (1) | (161) | — | ||||||||||||||||||||||
| Adjusted for decommissioning and inventory amortisation | 1 | 1 | — | 2 | — | (4) | — | — | (4) | — | ||||||||||||||||||||||
| Corporate administration and marketing expenditure | — | — | — | — | — | — | — | — | — | — | ||||||||||||||||||||||
| Lease payment sustaining | 13 | 12 | — | 25 | — | 15 | 4 | 1 | 20 | — | ||||||||||||||||||||||
| Sustaining exploration and study costs | — | — | — | — | 1 | 1 | — | — | 2 | — | ||||||||||||||||||||||
| Total sustaining capital expenditure | 47 | 82 | 1 | 130 | 69 | 193 | 82 | — | 344 | — | ||||||||||||||||||||||
| All-in sustaining costs | 364 | 350 | 29 | 743 | 211 | 506 | 184 | 3 | 904 | — | ||||||||||||||||||||||
Adjusted for non-controlling interests and non -gold producing companies(1) | — | — | — | — | (16) | — | — | — | (16) | — | ||||||||||||||||||||||
| All-in sustaining costs adjusted for non-controlling interests and non-gold producing companies | 364 | 350 | 29 | 743 | 195 | 506 | 184 | 3 | 888 | — | ||||||||||||||||||||||
| All-in sustaining costs | 364 | 350 | 29 | 743 | 211 | 506 | 184 | 3 | 904 | — | ||||||||||||||||||||||
| Non-sustaining project capital expenditure | 15 | 40 | — | 55 | — | 2 | — | — | 2 | 52 | ||||||||||||||||||||||
| Non-sustaining lease payments | — | — | — | — | — | — | — | — | — | — | ||||||||||||||||||||||
| Non-sustaining exploration and study costs | 27 | 8 | 21 | 56 | 1 | 11 | 4 | 1 | 17 | 72 | ||||||||||||||||||||||
| Care and maintenance | — | — | — | — | — | — | — | — | — | — | ||||||||||||||||||||||
| Closure and social responsibility costs not related to current operations | — | — | — | — | — | 7 | 2 | 1 | 10 | — | ||||||||||||||||||||||
| Other provisions | — | — | — | — | — | — | — | — | — | — | ||||||||||||||||||||||
| All-in costs | 406 | 398 | 50 | 854 | 212 | 526 | 190 | 5 | 933 | 124 | ||||||||||||||||||||||
Adjusted for non-controlling interests and non -gold producing companies(1) | — | — | — | — | (16) | — | — | — | (16) | — | ||||||||||||||||||||||
| All-in costs adjusted for non-controlling interests and non-gold producing companies | 406 | 398 | 50 | 854 | 196 | 526 | 190 | 5 | 917 | 124 | ||||||||||||||||||||||
Gold sold – oz (000)(2) | 231 | 264 | — | 495 | 144 | 334 | 83 | — | 561 | — | ||||||||||||||||||||||
All-in sustaining cost per unit – $/oz(3) | 1,573 | 1,326 | — | 1,500 | 1,353 | 1,519 | 2,220 | — | 1,587 | — | ||||||||||||||||||||||
All-in cost per unit – $/oz(3) | 1,757 | 1,506 | — | 1,725 | 1,362 | 1,582 | 2,283 | — | 1,635 | — | ||||||||||||||||||||||
185
For the year ended 31 December 2021
Operations in Australia, America and Projects
(in $ millions, except as otherwise noted)
| AUSTRALIA | AMERICAS | |||||||||||||||||||||||||||||||
| Sunrise Dam | Tropicana | Australia other | Total Australia | Cerro Vanguardia | AngloGold Ashanti Mineração | Serra Grande | Americas other | Total Americas | ||||||||||||||||||||||||
| Total cash costs | ||||||||||||||||||||||||||||||||
Cost of sales per segmental information(5) | 364 | 346 | 30 | 740 | 261 | 435 | 123 | 3 | 822 | |||||||||||||||||||||||
| By-product revenue | (1) | (3) | — | (4) | (93) | (26) | — | — | (119) | |||||||||||||||||||||||
| Inventory change | (3) | 3 | — | — | 7 | (3) | 1 | — | 5 | |||||||||||||||||||||||
| Amortisation of tangible assets | (49) | (80) | — | (129) | (27) | (94) | (21) | — | (142) | |||||||||||||||||||||||
| Amortisation of right of use assets | (11) | (8) | (1) | (20) | — | (14) | (4) | (1) | (19) | |||||||||||||||||||||||
| Amortisation of intangible assets | — | — | (1) | (1) | — | — | — | — | — | |||||||||||||||||||||||
| Rehabilitation and other non-cash costs | 3 | 3 | (1) | 5 | (8) | (12) | — | — | (20) | |||||||||||||||||||||||
| Retrenchment costs | — | — | — | — | (1) | (1) | — | — | (2) | |||||||||||||||||||||||
| Total cash costs net of by-product revenue | 303 | 261 | 27 | 591 | 139 | 285 | 99 | 2 | 525 | |||||||||||||||||||||||
Adjusted for non-controlling interests, non-gold producing companies and other(1) | — | — | — | — | (10) | — | — | — | (10) | |||||||||||||||||||||||
| Total cash costs net of by-product revenue adjusted for non-controlling interests and non-gold producing companies | 303 | 261 | 27 | 591 | 129 | 285 | 99 | 2 | 515 | |||||||||||||||||||||||
Gold produced – oz (000)(2) | 229 | 265 | — | 494 | 145 | 331 | 83 | — | 559 | |||||||||||||||||||||||
Total cash costs per unit – $/oz(3) | 1,321 | 987 | — | 1,196 | 894 | 858 | 1,192 | — | 921 | |||||||||||||||||||||||
186
For the year ended 31 December 2021
AngloGold Ashanti operations – Total
(in $ millions, except as otherwise noted)
| JOINT VENTURES | SUBSIDIARIES | |||||||
| All-in sustaining costs | ||||||||
Cost of sales per segmental information(5) | 350 | 2,857 | ||||||
| By-product revenue | (2) | (126) | ||||||
| Cost of sales | 348 | 2,731 | ||||||
| Realised other commodity contracts | ||||||||
| Amortisation of tangible, intangible and right of use assets | (105) | (477) | ||||||
| Adjusted for decommissioning and inventory amortisation | 1 | — | ||||||
| Corporate administration and marketing expenditure | — | 73 | ||||||
| Lease payment sustaining | 9 | 70 | ||||||
| Sustaining exploration and study costs | — | 10 | ||||||
| Total sustaining capital expenditure | 61 | 717 | ||||||
| All-in sustaining costs | 314 | 3,124 | ||||||
Adjusted for non-controlling interests and non-gold producing companies(1) | — | (74) | ||||||
| All-in sustaining costs adjusted for non-controlling interests and non-gold producing companies | 314 | 3,050 | ||||||
| All-in sustaining costs | 314 | 3,124 | ||||||
| Non-sustaining project capital expenditure | 11 | 311 | ||||||
| Non-sustaining lease payments | — | 2 | ||||||
| Non-sustaining exploration and study costs | 2 | 153 | ||||||
| Care and maintenance | — | 45 | ||||||
| Closure and social responsibility costs not related to current operations | 3 | 24 | ||||||
| Other provisions | — | 4 | ||||||
| All-in costs | 330 | 3,663 | ||||||
Adjusted for non-controlling interests and non-gold producing companies(1) | — | (77) | ||||||
| All-in costs adjusted for non-controlling interests and non-gold producing companies | 330 | 3,586 | ||||||
Gold sold – oz (000)(2) | 367 | 2,116 | ||||||
All-in sustaining cost per unit – $/oz(3) | 856 | 1,441 | ||||||
All-in cost per unit – $/oz(3) | 900 | 1,695 | ||||||
187
For the year ended 31 December 2021
AngloGold Ashanti operations – Total
(in $ millions, except as otherwise noted)
| JOINT VENTURES | SUBSIDIARIES | |||||||
| Total cash costs | ||||||||
Cost of sales per segmental information(5) | 350 | 2,857 | ||||||
| By-product revenue | (2) | (126) | ||||||
| Inventory change | (1) | (6) | ||||||
| Amortisation of tangible assets | (100) | (411) | ||||||
| Amortisation of right of use assets | (5) | (63) | ||||||
| Amortisation of intangible assets | — | (3) | ||||||
| Rehabilitation and other non-cash costs | (5) | (38) | ||||||
| Retrenchment costs | — | (2) | ||||||
| Total cash costs net of by-product revenue | 237 | 2,208 | ||||||
Adjusted for non-controlling interests, non-gold producing companies and other(1) | — | (65) | ||||||
| Total cash costs net of by-product revenue adjusted for non-controlling interests and non-gold producing companies | 237 | 2,143 | ||||||
Gold produced – oz (000)(2) | 365 | 2,107 | ||||||
Total cash costs per unit – $/oz(3) | 647 | 1,017 | ||||||
188
For the year ended 31 December 2020
Corporate and other
(in $ millions, except as otherwise noted)
Corporate (4) | |||||||||||||||||||||||||||||||||||||||||||||||||||||||||||
| All-in sustaining costs | |||||||||||||||||||||||||||||||||||||||||||||||||||||||||||
Cost of sales per segmental information(5) | (2) | ||||||||||||||||||||||||||||||||||||||||||||||||||||||||||
| By-product revenue | — | ||||||||||||||||||||||||||||||||||||||||||||||||||||||||||
| Cost of sales | (2) | ||||||||||||||||||||||||||||||||||||||||||||||||||||||||||
| Realised other commodity contracts | 5 | ||||||||||||||||||||||||||||||||||||||||||||||||||||||||||
| Amortisation of tangible, intangible and | (2) | ||||||||||||||||||||||||||||||||||||||||||||||||||||||||||
| Adjusted for decommissioning and inventory amortisation | (1) | ||||||||||||||||||||||||||||||||||||||||||||||||||||||||||
| Corporate administration and marketing | 67 | ||||||||||||||||||||||||||||||||||||||||||||||||||||||||||
| Sustaining exploration and study costs | 1 | ||||||||||||||||||||||||||||||||||||||||||||||||||||||||||
| Total sustaining capital expenditure | 2 | ||||||||||||||||||||||||||||||||||||||||||||||||||||||||||
| All-in sustaining costs | 73 | ||||||||||||||||||||||||||||||||||||||||||||||||||||||||||
Adjusted for non-controlling interests and non-gold producing companies(1) | — | ||||||||||||||||||||||||||||||||||||||||||||||||||||||||||
| All-in sustaining costs adjusted for non-controlling interests and non-gold producing companies | 73 | ||||||||||||||||||||||||||||||||||||||||||||||||||||||||||
| All-in sustaining costs | 73 | ||||||||||||||||||||||||||||||||||||||||||||||||||||||||||
| Non-sustaining project capital expenditure | — | ||||||||||||||||||||||||||||||||||||||||||||||||||||||||||
| — | |||||||||||||||||||||||||||||||||||||||||||||||||||||||||||
| Non-sustaining exploration and study costs | — | ||||||||||||||||||||||||||||||||||||||||||||||||||||||||||
| Care and maintenance | — | ||||||||||||||||||||||||||||||||||||||||||||||||||||||||||
| 9 | |||||||||||||||||||||||||||||||||||||||||||||||||||||||||||
| Other provisions | — | ||||||||||||||||||||||||||||||||||||||||||||||||||||||||||
| All-in costs | 82 | ||||||||||||||||||||||||||||||||||||||||||||||||||||||||||
Adjusted for non-controlling interests and non-gold producing companies(1) | — | ||||||||||||||||||||||||||||||||||||||||||||||||||||||||||
| All-in costs adjusted for non-controlling interests and non-gold producing companies | 82 | ||||||||||||||||||||||||||||||||||||||||||||||||||||||||||
Gold sold - oz (000)(2) | — | ||||||||||||||||||||||||||||||||||||||||||||||||||||||||||
All-in sustaining cost per unit - $/oz(3) | — | ||||||||||||||||||||||||||||||||||||||||||||||||||||||||||
All-in cost per unit - $/oz(3) | — | ||||||||||||||||||||||||||||||||||||||||||||||||||||||||||
(1)Adjusting for non-controlling interest of items included in calculation, to disclose the attributable portions only. Other consists of heap leach inventory.
(2)Attributable portion (excluding pre-production ounces).portion.
(3)In addition to the operational performances of the mines, all-in“all-in sustaining cost per ounce, all-inounce”, “all-in cost per ounceounce” and total“total cash costs per ounceounce” are affected by fluctuations in the currency exchange rate. AngloGold Ashanti reports all-in“all-in sustaining cost per ounceounce” and all-in“all-in cost per ounceounce” calculated to the nearest US dollar amount and gold sold in ounces. AngloGold Ashanti reports total“total cash costs per ounceounce” calculated to the nearest US dollar amount and gold produced in ounces.
(4)Corporate includes non-gold producing subsidiaries.
(5)Refer to “Item 18: Financial Statements—Note 2—Segmental Information”.
(6)A new segment for Projects (previously reported under the Americas segment) has been introduced due to the implementation of the new Operating Model which comprises all the major non-sustaining capital projects with the potential to be developed into operating entities. Comparative information has been restated.
Rounding of figures may result in computational differences.discrepancies.
189
For the year ended 31 December 2020
Corporate and other
(in $ millions, except as otherwise noted)
Corporate(4) | |||||||||||||||||||||||||||||||||||||||||||||||||||||||||||
| Total cash costs | |||||||||||||||||||||||||||||||||||||||||||||||||||||||||||
Cost of sales per segmental information(5) | (2) | ||||||||||||||||||||||||||||||||||||||||||||||||||||||||||
| By-product revenue | — | ||||||||||||||||||||||||||||||||||||||||||||||||||||||||||
| Inventory change | — | ||||||||||||||||||||||||||||||||||||||||||||||||||||||||||
| Amortisation of | — | ||||||||||||||||||||||||||||||||||||||||||||||||||||||||||
| Amortisation of | — | ||||||||||||||||||||||||||||||||||||||||||||||||||||||||||
| Amortisation of intangible assets | (2) | ||||||||||||||||||||||||||||||||||||||||||||||||||||||||||
| Rehabilitation and other non-cash costs | — | ||||||||||||||||||||||||||||||||||||||||||||||||||||||||||
| Retrenchment costs | — | ||||||||||||||||||||||||||||||||||||||||||||||||||||||||||
| Total cash costs net of by-product revenue | (4) | ||||||||||||||||||||||||||||||||||||||||||||||||||||||||||
Adjusted for non-controlling interests, non-gold producing companies and other(1) | — | ||||||||||||||||||||||||||||||||||||||||||||||||||||||||||
| Total cash costs net of by-product revenue adjusted for non-controlling interests and non-gold producing companies | (4) | ||||||||||||||||||||||||||||||||||||||||||||||||||||||||||
Gold produced – oz (000)(2) | — | ||||||||||||||||||||||||||||||||||||||||||||||||||||||||||
Total cash costs per unit – $/oz(3) | — | ||||||||||||||||||||||||||||||||||||||||||||||||||||||||||
| DRC | Mali | Joint | Ghana | Guinea | Tanzania | Africa other | Subsidiaries | ||||||||||||||||||||||||||||||||||||||||||||||||||||
| Kibali | Morila | Sadiola | Ventures | Iduapriem | Obuasi | Siguiri | Geita | ||||||||||||||||||||||||||||||||||||||||||||||||||||
| All-in sustaining costs | |||||||||||||||||||||||||||||||||||||||||||||||||||||||||||
Cost of sales per segmental information(5) | 340 | — | — | 340 | 280 | 34 | 377 | 542 | (1) | 1,232 | |||||||||||||||||||||||||||||||||||||||||||||||||
| By-product revenue | (1) | — | — | (1) | (1) | — | — | (2) | — | (3) | |||||||||||||||||||||||||||||||||||||||||||||||||
| Amortisation of tangible and intangible assets | (104) | — | — | (104) | (74) | (6) | (41) | (124) | — | (245) | |||||||||||||||||||||||||||||||||||||||||||||||||
| Adjusted for decommissioning and inventory amortisation | 1 | — | — | 1 | 1 | — | — | 4 | — | 5 | |||||||||||||||||||||||||||||||||||||||||||||||||
| Lease payment sustaining | 9 | — | — | 9 | — | — | — | 17 | — | 17 | |||||||||||||||||||||||||||||||||||||||||||||||||
| Corporate administration and marketing related to current operations | — | — | — | — | — | — | — | — | — | — | |||||||||||||||||||||||||||||||||||||||||||||||||
| Inventory writedown to net realisable value and other stockpile adjustments | — | — | — | — | — | — | — | — | — | — | |||||||||||||||||||||||||||||||||||||||||||||||||
| Sustaining exploration and study costs | — | — | — | — | 3 | — | 2 | 5 | — | 10 | |||||||||||||||||||||||||||||||||||||||||||||||||
| Total sustaining capital expenditure | 52 | — | — | 52 | 60 | 7 | 15 | 80 | 1 | 163 | |||||||||||||||||||||||||||||||||||||||||||||||||
| Realised other commodity contracts | — | — | — | — | — | — | — | — | — | — | |||||||||||||||||||||||||||||||||||||||||||||||||
| All-in sustaining costs | 296 | — | — | 297 | 269 | 35 | 353 | 522 | — | 1,179 | |||||||||||||||||||||||||||||||||||||||||||||||||
Adjusted for non-controlling interests and non -gold producing companies(1) | — | — | — | — | — | — | (53) | — | — | (53) | |||||||||||||||||||||||||||||||||||||||||||||||||
| All-in sustaining costs adjusted for non-controlling interests and non-gold producing companies | 296 | — | — | 297 | 269 | 35 | 300 | 522 | — | 1,126 | |||||||||||||||||||||||||||||||||||||||||||||||||
| All-in sustaining costs | 296 | — | — | 297 | 269 | 35 | 353 | 522 | — | 1,179 | |||||||||||||||||||||||||||||||||||||||||||||||||
| Non-sustaining project capital expenditure | — | — | — | — | — | 161 | 15 | 7 | — | 183 | |||||||||||||||||||||||||||||||||||||||||||||||||
| Lease payment non sustaining | — | — | — | — | — | — | — | 2 | — | 2 | |||||||||||||||||||||||||||||||||||||||||||||||||
| Technology improvements | — | — | — | — | — | — | — | — | — | — | |||||||||||||||||||||||||||||||||||||||||||||||||
| Non-sustaining exploration and study costs | — | — | — | — | 2 | 2 | 5 | 2 | — | 11 | |||||||||||||||||||||||||||||||||||||||||||||||||
| Care and maintenance costs | — | — | — | — | — | — | — | — | — | — | |||||||||||||||||||||||||||||||||||||||||||||||||
| Corporate and social responsibility costs not related to current operations | 2 | 6 | (3) | 4 | — | 10 | — | — | — | 10 | |||||||||||||||||||||||||||||||||||||||||||||||||
| Other provisions | — | — | — | — | — | — | — | — | — | — | |||||||||||||||||||||||||||||||||||||||||||||||||
| All-in costs | 298 | 6 | (3) | 301 | 271 | 208 | 373 | 533 | — | 1,385 | |||||||||||||||||||||||||||||||||||||||||||||||||
Adjusted for non-controlling interests and non-gold producing companies(1) | — | — | — | — | — | — | (56) | — | — | (56) | |||||||||||||||||||||||||||||||||||||||||||||||||
| All-in costs adjusted for non-controlling interests and non-gold producing companies | 298 | 6 | (3) | 301 | 271 | 208 | 317 | 533 | — | 1,329 | |||||||||||||||||||||||||||||||||||||||||||||||||
Gold sold – oz (000)(2) | 365 | — | — | 365 | 274 | 27 | 215 | 639 | — | 1,155 | |||||||||||||||||||||||||||||||||||||||||||||||||
All-in sustaining cost per unit – $/oz(3) | 809 | — | — | 810 | 985 | 1,316 | 1,397 | 814 | — | 975 | |||||||||||||||||||||||||||||||||||||||||||||||||
All-in cost per unit – $/oz(3) | 817 | — | — | 824 | 992 | 7,731 | 1,476 | 831 | — | 1,149 | |||||||||||||||||||||||||||||||||||||||||||||||||
| DRC | Mali | Joint | Ghana | Guinea | Tanzania | Africa other | Subsidiaries | ||||||||||||||||||||||||||||||||||||||||||||||||||||
| Kibali | Morila | Sadiola | Ventures | Iduapriem | Obuasi | Siguiri | Geita | ||||||||||||||||||||||||||||||||||||||||||||||||||||
| Total cash costs | |||||||||||||||||||||||||||||||||||||||||||||||||||||||||||
Cost of sales per segmental information(5) | 340 | — | — | 340 | 280 | 34 | 377 | 542 | (1) | 1,232 | |||||||||||||||||||||||||||||||||||||||||||||||||
| By-product revenue | (1) | — | — | (1) | (1) | — | — | (2) | — | (3) | |||||||||||||||||||||||||||||||||||||||||||||||||
| Inventory change | (1) | — | — | (1) | 1 | 9 | (1) | (12) | — | (3) | |||||||||||||||||||||||||||||||||||||||||||||||||
| Amortisation of intangible assets | — | — | — | — | — | — | — | — | — | — | |||||||||||||||||||||||||||||||||||||||||||||||||
| Amortisation of tangible and intangible assets | (104) | — | — | (104) | (74) | (6) | (41) | (124) | — | (245) | |||||||||||||||||||||||||||||||||||||||||||||||||
| Rehabilitation and other non-cash costs | (4) | — | — | (4) | (6) | (2) | (9) | (5) | — | (22) | |||||||||||||||||||||||||||||||||||||||||||||||||
| Retrenchment costs | — | — | — | — | — | — | — | — | — | — | |||||||||||||||||||||||||||||||||||||||||||||||||
| Total cash costs net of by-product revenue | 230 | — | — | 230 | 200 | 35 | 326 | 399 | (1) | 959 | |||||||||||||||||||||||||||||||||||||||||||||||||
Adjusted for non-controlling interests, non-gold producing companies and other(1) | — | — | — | — | — | — | (49) | — | — | (49) | |||||||||||||||||||||||||||||||||||||||||||||||||
| Total cash costs net of by-product revenue adjusted for non-controlling interests and non-gold producing companies | 230 | — | — | 230 | 200 | 35 | 277 | 399 | (1) | 910 | |||||||||||||||||||||||||||||||||||||||||||||||||
Gold produced - oz (000) (2) | 364 | — | — | 364 | 275 | 30 | — | 215 | — | 623 | — | — | 1,143 | ||||||||||||||||||||||||||||||||||||||||||||||
Total cash costs per unit - $/oz(3) | 629 | — | — | 629 | 731 | 1,145 | 1,293 | 641 | — | 797 | |||||||||||||||||||||||||||||||||||||||||||||||||
| Australia | Total Australia | Argentina | Brazil | Americas other | Total Americas | ||||||||||||||||||||||||||||||||||||||||||||||||
| Sunrise Dam | Tropicana | Australia other | Cerro Vanguardia | AngloGold Ashanti Mineração | Serra Grande | ||||||||||||||||||||||||||||||||||||||||||||||||
| All-in sustaining costs | |||||||||||||||||||||||||||||||||||||||||||||||||||||
Cost of sales per segmental information(5) | 342 | 338 | 25 | 705 | 269 | 391 | 102 | 2 | 764 | ||||||||||||||||||||||||||||||||||||||||||||
| By-product revenue | (1) | (2) | — | (3) | (82) | (17) | — | — | (99) | ||||||||||||||||||||||||||||||||||||||||||||
| Amortisation of tangible and intangible assets | (64) | (94) | (2) | (160) | (26) | (109) | (27) | (1) | (163) | ||||||||||||||||||||||||||||||||||||||||||||
| Adjusted for decommissioning and inventory amortisation | 2 | 1 | — | 3 | (7) | 3 | — | — | (4) | ||||||||||||||||||||||||||||||||||||||||||||
| Lease payment sustaining | 11 | 10 | 1 | 22 | — | 8 | 2 | — | 10 | ||||||||||||||||||||||||||||||||||||||||||||
| Corporate administration and marketing related to current operations | — | — | — | — | — | — | — | — | — | ||||||||||||||||||||||||||||||||||||||||||||
| Inventory writedown to net realisable value and other stockpile adjustments | — | — | — | — | — | — | — | — | — | ||||||||||||||||||||||||||||||||||||||||||||
| Sustaining exploration and study costs | — | 1 | — | 1 | 2 | 2 | — | — | 4 | ||||||||||||||||||||||||||||||||||||||||||||
| Total sustaining capital expenditure | 50 | 64 | — | 114 | 31 | 103 | 33 | — | 167 | ||||||||||||||||||||||||||||||||||||||||||||
| Realised other commodity contracts | — | — | — | — | — | — | — | — | — | ||||||||||||||||||||||||||||||||||||||||||||
| All-in sustaining costs | 340 | 318 | 24 | 682 | 187 | 381 | 110 | 1 | 679 | ||||||||||||||||||||||||||||||||||||||||||||
Adjusted for non-controlling interests and non -gold producing companies(1) | — | — | — | — | (14) | — | — | — | (14) | ||||||||||||||||||||||||||||||||||||||||||||
| All-in sustaining costs adjusted for non-controlling interests and non-gold producing companies | 340 | 318 | 24 | 682 | 173 | 381 | 110 | 1 | 665 | ||||||||||||||||||||||||||||||||||||||||||||
| All-in sustaining costs | 340 | 318 | 24 | 682 | 187 | 381 | 110 | 1 | 679 | ||||||||||||||||||||||||||||||||||||||||||||
| Non-sustaining project capital expenditure | 3 | 25 | — | 28 | — | — | — | 49 | 49 | ||||||||||||||||||||||||||||||||||||||||||||
| Lease payment non sustaining | — | — | — | — | — | — | — | — | — | ||||||||||||||||||||||||||||||||||||||||||||
| Technology improvements | — | — | — | — | — | — | — | — | — | ||||||||||||||||||||||||||||||||||||||||||||
| Non-sustaining exploration and study costs | 22 | 5 | 17 | 44 | 1 | 6 | 3 | 47 | 57 | ||||||||||||||||||||||||||||||||||||||||||||
| Care and maintenance | — | — | — | — | — | — | — | — | — | ||||||||||||||||||||||||||||||||||||||||||||
| Corporate and social responsibility costs not related to current operations | — | — | — | — | — | 8 | 2 | — | 10 | ||||||||||||||||||||||||||||||||||||||||||||
| Other provisions | — | — | — | — | — | — | — | — | — | ||||||||||||||||||||||||||||||||||||||||||||
| All-in costs | 365 | 348 | 41 | 754 | 188 | 395 | 115 | 97 | 795 | ||||||||||||||||||||||||||||||||||||||||||||
Adjusted for non-controlling interests and non -gold producing companies(1) | — | — | — | — | (14) | — | — | — | (14) | ||||||||||||||||||||||||||||||||||||||||||||
| All-in costs adjusted for non-controlling interests and non-gold producing companies | 365 | 348 | 41 | 754 | 174 | 395 | 115 | 97 | 781 | ||||||||||||||||||||||||||||||||||||||||||||
Gold sold – oz (000)(2) | 258 | 299 | — | 557 | 186 | 364 | 114 | — | 664 | ||||||||||||||||||||||||||||||||||||||||||||
All-in sustaining cost per unit – $/oz(3) | 1,320 | 1,061 | — | 1,225 | 931 | 1,050 | 953 | — | 1,003 | ||||||||||||||||||||||||||||||||||||||||||||
All-in cost per unit – $/oz(3) | 1,417 | 1,164 | — | 1,356 | 934 | 1,091 | 997 | — | 1,179 | ||||||||||||||||||||||||||||||||||||||||||||
| Australia | Total Australia | Argentina | Brazil | Americas other | Total Americas | ||||||||||||||||||||||||||||||||||||||||||||||||
| Sunrise Dam | Tropicana | Australia other | Cerro Vanguardia | AngloGold Ashanti Mineração | Serra Grande | ||||||||||||||||||||||||||||||||||||||||||||||||
| Total cash costs | |||||||||||||||||||||||||||||||||||||||||||||||||||||
Cost of sales per segmental information(5) | 342 | 338 | 25 | 705 | 269 | 391 | 102 | 2 | 764 | ||||||||||||||||||||||||||||||||||||||||||||
| By-product revenue | (1) | (2) | — | (3) | (82) | (17) | — | — | (99) | ||||||||||||||||||||||||||||||||||||||||||||
| Inventory change | (1) | (1) | — | (2) | (16) | 1 | — | — | (16) | ||||||||||||||||||||||||||||||||||||||||||||
| Amortisation of intangible assets | — | — | (1) | (1) | — | — | — | — | — | ||||||||||||||||||||||||||||||||||||||||||||
| Amortisation of tangible and intangible assets | (64) | (94) | (1) | (159) | (26) | (109) | (27) | (1) | (163) | ||||||||||||||||||||||||||||||||||||||||||||
| Rehabilitation and other non-cash costs | (2) | (1) | (1) | (4) | (13) | 4 | 3 | (1) | (6) | ||||||||||||||||||||||||||||||||||||||||||||
| Retrenchment costs | — | — | — | — | — | (1) | — | — | (2) | ||||||||||||||||||||||||||||||||||||||||||||
| Total cash costs net of by-product revenue | 274 | 240 | 22 | 536 | 132 | 269 | 77 | — | 478 | ||||||||||||||||||||||||||||||||||||||||||||
Adjusted for non-controlling interests, non-gold producing companies and other(1) | — | — | — | — | (10) | — | — | — | (10) | ||||||||||||||||||||||||||||||||||||||||||||
| Total cash costs net of by-product revenue adjusted for non-controlling interests and non-gold producing companies | 274 | 240 | 22 | 536 | 122 | 269 | 77 | — | 468 | ||||||||||||||||||||||||||||||||||||||||||||
Gold produced – oz (000) (2) | 256 | 298 | — | 554 | 173 | 362 | 114 | — | 649 | ||||||||||||||||||||||||||||||||||||||||||||
Total cash costs per unit – $/oz(3) | 1,069 | 807 | — | 968 | 699 | 747 | 665 | — | 721 | ||||||||||||||||||||||||||||||||||||||||||||
| JOINT VENTURES | SUBSIDIARIES | |||||||
| All-in sustaining costs | ||||||||
Cost of sales per segmental information(5) | 340 | 2,699 | ||||||
| By-product revenue | (1) | (105) | ||||||
| Amortisation of tangible and intangible assets | (104) | (570) | ||||||
| Adjusted for decommissioning and inventory amortisation | 1 | 4 | ||||||
| Lease payment sustaining | 9 | 52 | ||||||
| Corporate administration and marketing related to current operations | — | 67 | ||||||
| Inventory write-down to net realisable value and other stockpile adjustments | — | — | ||||||
| Sustaining exploration and study costs | — | 15 | ||||||
| Total sustaining capital expenditure | 52 | 445 | ||||||
| Realised other commodity contracts | — | 5 | ||||||
| All-in sustaining costs | 297 | 2,612 | ||||||
Adjusted for non-controlling interests and non-gold producing companies(1) | — | (67) | ||||||
| All-in sustaining costs adjusted for non-controlling interests and non-gold producing companies | 297 | 2,545 | ||||||
| All-in sustaining costs | 297 | 2,612 | ||||||
| Non-sustaining project capital expenditure | — | 260 | ||||||
| Lease payment non sustaining | — | 2 | ||||||
| Technology improvements | — | — | ||||||
| Non-sustaining exploration and study costs | — | 112 | ||||||
| Care and maintenance costs | — | — | ||||||
| Corporate and social responsibility costs not related to current operations | 4 | 29 | ||||||
| Other provisions | — | — | ||||||
| All-in costs | 301 | 3,015 | ||||||
Adjusted for non-controlling interests and non-gold producing companies(1) | — | (70) | ||||||
| All-in costs adjusted for non-controlling interests and non-gold producing companies | 301 | 2,945 | ||||||
Gold sold – oz (000)(2) | 365 | 2,376 | ||||||
All-in sustaining cost per unit – $/oz(3) | 810 | 1,072 | ||||||
All-in cost per unit – $/oz(3) | 824 | 1,240 | ||||||
| JOINT VENTURES | SUBSIDIARIES | |||||||
| Total cash costs | ||||||||
Cost of sales per segmental information(5) | 340 | 2,699 | ||||||
| By-product revenue | (1) | (105) | ||||||
| Inventory change | (1) | (21) | ||||||
| Amortisation of intangible assets | — | (2) | ||||||
| Amortisation of tangible and intangible assets | (104) | (568) | ||||||
| Rehabilitation and other non-cash costs | (4) | (32) | ||||||
| Retrenchment costs | — | (2) | ||||||
| Total cash costs net of by-product revenue | 230 | 1,969 | ||||||
Adjusted for non-controlling interests, non-gold producing companies and other(1) | — | (59) | ||||||
| Total cash costs net of by-product revenue adjusted for non-controlling interests and non-gold producing companies | 230 | 1,910 | ||||||
Gold produced – oz (000)(2) | 364 | 2,345 | ||||||
Total cash costs (adjusted) per unit – $/oz(3) | 629 | 815 | ||||||
(1)Adjusting for non-controlling interest of items included in calculation, to disclose the attributable portions only. Other consists of heap leach inventory.
(2)Attributable portion.
(3)In addition to the operational performances of the mines, all-in“all-in sustaining cost per ounce, all-inounce”, “all-in cost per ounceounce” and total“total cash costs per ounceounce” are affected by fluctuations in the currency exchange rate. AngloGold Ashanti reports all-in“all-in sustaining cost per ounceounce” and all-in“all-in cost per ounceounce” calculated to the nearest US dollar amount and gold sold in ounces. AngloGold Ashanti reports total“total cash costs per ounceounce” calculated to the nearest US dollar amount and gold produced in ounces.
(4)Corporate includes non-gold producing subsidiaries.
(5)Refer to “Item 18: Financial Statements—Note 2—Segmental Information”.
| DRC | Mali | Joint | Ghana | Guinea | Tanzania | Africa other | Subsidiaries | ||||||||||||||||||||||||||||||||||||||||||||||
| Kibali | Morila | Sadiola | Ventures | Iduapriem | Obuasi | Siguiri | Geita | ||||||||||||||||||||||||||||||||||||||||||||||
| All-in sustaining costs | |||||||||||||||||||||||||||||||||||||||||||||||||||||
Cost of sales per segmental information(5) | 338 | 36 | 54 | 428 | 288 | — | 315 | 571 | (1) | 1,173 | |||||||||||||||||||||||||||||||||||||||||||
| By-product revenue | (1) | — | — | (1) | (1) | — | — | (1) | — | (2) | |||||||||||||||||||||||||||||||||||||||||||
| Amortisation of tangible and intangible assets | (130) | (3) | (4) | (137) | (58) | — | (38) | (133) | (1) | (230) | |||||||||||||||||||||||||||||||||||||||||||
| Adjusted for decommissioning and inventory amortisation | 1 | 1 | — | 2 | 1 | — | — | 3 | 1 | 4 | |||||||||||||||||||||||||||||||||||||||||||
| Lease payment sustaining | — | — | — | — | — | — | — | 19 | — | 19 | |||||||||||||||||||||||||||||||||||||||||||
| Corporate administration and marketing related to current operations | — | — | — | — | — | — | — | — | — | — | |||||||||||||||||||||||||||||||||||||||||||
| Inventory writedown to net realisable value and other stockpile adjustments | — | — | — | — | — | — | — | — | — | — | |||||||||||||||||||||||||||||||||||||||||||
| Sustaining exploration and study costs | — | — | — | — | 3 | — | 3 | 6 | (1) | 12 | |||||||||||||||||||||||||||||||||||||||||||
| Total sustaining capital expenditure | 46 | — | — | 46 | 16 | — | 15 | 75 | — | 107 | |||||||||||||||||||||||||||||||||||||||||||
| Amortisation relating to inventory | — | — | — | — | — | — | — | — | — | — | |||||||||||||||||||||||||||||||||||||||||||
| Realised other commodity contracts | — | — | — | — | — | — | — | — | — | — | |||||||||||||||||||||||||||||||||||||||||||
| All-in sustaining costs | 254 | 34 | 50 | 338 | 249 | — | 295 | 540 | (1) | 1,083 | |||||||||||||||||||||||||||||||||||||||||||
Adjusted for non-controlling interests and non -gold producing companies(1) | — | — | — | — | — | — | (44) | — | — | (44) | |||||||||||||||||||||||||||||||||||||||||||
| All-in sustaining costs adjusted for non-controlling interests and non-gold producing companies | 254 | 34 | 50 | 338 | 249 | — | 251 | 540 | (1) | 1,039 | |||||||||||||||||||||||||||||||||||||||||||
| All-in sustaining costs | 254 | 34 | 50 | 338 | 249 | — | 295 | 540 | (1) | 1,083 | |||||||||||||||||||||||||||||||||||||||||||
| Non-sustaining project capital expenditure | 5 | — | — | 5 | — | 246 | 6 | — | — | 252 | |||||||||||||||||||||||||||||||||||||||||||
| Lease payment non sustaining | — | — | — | — | — | — | — | 1 | — | 1 | |||||||||||||||||||||||||||||||||||||||||||
| Technology improvements | — | — | — | — | — | — | — | — | — | — | |||||||||||||||||||||||||||||||||||||||||||
| Non-sustaining exploration and study costs | 5 | — | — | 4 | 1 | — | 4 | 4 | 1 | 10 | |||||||||||||||||||||||||||||||||||||||||||
| Care and maintenance costs | — | — | — | — | — | 48 | — | — | (1) | 47 | |||||||||||||||||||||||||||||||||||||||||||
| Corporate and social responsibility costs not related to current operations | 1 | — | — | — | 2 | — | 9 | — | — | 11 | |||||||||||||||||||||||||||||||||||||||||||
| Other provisions | — | — | — | — | — | — | — | — | — | — | |||||||||||||||||||||||||||||||||||||||||||
| All-in costs | 265 | 34 | 49 | 347 | 252 | 294 | 314 | 545 | (1) | 1,404 | |||||||||||||||||||||||||||||||||||||||||||
Adjusted for non-controlling interests and non -gold producing companies(1) | — | — | — | — | — | — | (47) | — | — | (47) | |||||||||||||||||||||||||||||||||||||||||||
| All-in costs adjusted for non-controlling interests and non-gold producing companies | 265 | 34 | 49 | 347 | 252 | 294 | 267 | 545 | (1) | 1,357 | |||||||||||||||||||||||||||||||||||||||||||
Gold sold – oz (000)(2) | 362 | 28 | 52 | 442 | 280 | — | 213 | 604 | — | 1,096 | |||||||||||||||||||||||||||||||||||||||||||
All-in sustaining cost per unit – $/oz(3) | 704 | 1,237 | 956 | 767 | 890 | — | 1,176 | 894 | — | 947 | |||||||||||||||||||||||||||||||||||||||||||
All-in cost per unit – $/oz(3) | 734 | 1,237 | 930 | 785 | 900 | — | 1,252 | 903 | — | 1,237 | |||||||||||||||||||||||||||||||||||||||||||
| DRC | Mali | Joint | Ghana | Guinea | Tanzania | Africa other | Subsidiaries | ||||||||||||||||||||||||||||||||||||||||||||||||||||
| Kibali | Morila | Sadiola | Ventures | Iduapriem | Obuasi | Siguiri | Geita | ||||||||||||||||||||||||||||||||||||||||||||||||||||
| Total cash costs | |||||||||||||||||||||||||||||||||||||||||||||||||||||||||||
Cost of sales per segmental information(5) | 338 | 36 | 54 | 428 | 288 | — | 315 | 571 | (1) | 1,173 | |||||||||||||||||||||||||||||||||||||||||||||||||
| By-product revenue | (1) | — | — | (1) | (1) | — | — | (1) | — | (2) | |||||||||||||||||||||||||||||||||||||||||||||||||
| Inventory change | 4 | (1) | — | 3 | (5) | — | 1 | (9) | 1 | (12) | |||||||||||||||||||||||||||||||||||||||||||||||||
| Amortisation of intangible assets | — | — | — | — | — | — | — | — | — | — | |||||||||||||||||||||||||||||||||||||||||||||||||
| Amortisation of tangible assets | (130) | (3) | (4) | (137) | (58) | — | (38) | (133) | (1) | (230) | |||||||||||||||||||||||||||||||||||||||||||||||||
| Rehabilitation and other non-cash costs | (1) | 1 | — | (1) | — | — | (5) | (8) | (2) | (14) | |||||||||||||||||||||||||||||||||||||||||||||||||
| Retrenchment costs | — | — | — | — | — | — | — | — | — | — | |||||||||||||||||||||||||||||||||||||||||||||||||
| Total cash costs net of by-product revenue | 210 | 33 | 50 | 292 | 224 | — | 273 | 420 | (2) | 915 | |||||||||||||||||||||||||||||||||||||||||||||||||
Adjusted for non-controlling interests, non-gold producing companies and other(1) | — | — | — | — | — | — | (41) | — | — | (41) | |||||||||||||||||||||||||||||||||||||||||||||||||
| Total cash costs net of by-product revenue adjusted for non-controlling interests and non-gold producing companies | 210 | 33 | 50 | 292 | 224 | — | 232 | 420 | (2) | 874 | |||||||||||||||||||||||||||||||||||||||||||||||||
Gold produced - oz (000) (2) | 366 | 27 | 51 | 445 | 275 | — | 213 | 604 | — | 1,091 | |||||||||||||||||||||||||||||||||||||||||||||||||
Total cash costs per unit - $/oz(3) | 572 | 1,205 | 966 | 657 | 815 | — | 1,091 | 695 | — | 801 | |||||||||||||||||||||||||||||||||||||||||||||||||
| Australia | Total Australia | Argentina | Brazil | Americas other | Total Americas | ||||||||||||||||||||||||||||||||||||||||||||||||
| Sunrise Dam | Tropicana | Australia other | Cerro Vanguardia | AngloGold Ashanti Mineração | Serra Grande | ||||||||||||||||||||||||||||||||||||||||||||||||
| All-in sustaining costs | |||||||||||||||||||||||||||||||||||||||||||||||||||||
Cost of sales per segmental information(5) | 318 | 297 | 17 | 632 | 274 | 417 | 130 | 1 | 822 | ||||||||||||||||||||||||||||||||||||||||||||
| By-product revenue | — | (2) | — | (3) | (61) | (20) | — | (1) | (81) | ||||||||||||||||||||||||||||||||||||||||||||
| Amortisation of tangible and intangible assets | (56) | (111) | (7) | (173) | (40) | (103) | (34) | — | (177) | ||||||||||||||||||||||||||||||||||||||||||||
| Adjusted for decommissioning and inventory amortisation | 2 | — | — | 2 | (3) | (3) | — | 2 | (5) | ||||||||||||||||||||||||||||||||||||||||||||
| Lease payment sustaining | 8 | 4 | 8 | 20 | — | 7 | — | — | 7 | ||||||||||||||||||||||||||||||||||||||||||||
| Corporate administration and marketing related to current operations | — | — | — | — | — | — | — | — | — | ||||||||||||||||||||||||||||||||||||||||||||
| Inventory writedown to net realisable value and other stockpile adjustments | — | — | — | — | — | — | — | — | — | ||||||||||||||||||||||||||||||||||||||||||||
| Sustaining exploration and study costs | 4 | — | — | 4 | 1 | 8 | 5 | — | 14 | ||||||||||||||||||||||||||||||||||||||||||||
| Total sustaining capital expenditure | 43 | 83 | — | 126 | 33 | 91 | 34 | — | 157 | ||||||||||||||||||||||||||||||||||||||||||||
| Amortisation relating to inventory | — | — | — | — | — | — | — | — | — | ||||||||||||||||||||||||||||||||||||||||||||
| Realised other commodity contracts | — | — | — | — | — | — | — | — | — | ||||||||||||||||||||||||||||||||||||||||||||
| All-in sustaining costs | 319 | 271 | 18 | 609 | 204 | 397 | 136 | 2 | 737 | ||||||||||||||||||||||||||||||||||||||||||||
Adjusted for non-controlling interests and non -gold producing companies(1) | — | — | — | — | (15) | — | — | — | (15) | ||||||||||||||||||||||||||||||||||||||||||||
| All-in sustaining costs adjusted for non-controlling interests and non-gold producing companies | 319 | 271 | 18 | 609 | 189 | 397 | 136 | 2 | 722 | ||||||||||||||||||||||||||||||||||||||||||||
| All-in sustaining costs | 319 | 271 | 18 | 609 | 204 | 397 | 136 | 2 | 737 | ||||||||||||||||||||||||||||||||||||||||||||
| Non-sustaining project capital expenditure | — | 23 | — | 23 | — | — | — | 38 | 38 | ||||||||||||||||||||||||||||||||||||||||||||
| Lease payment non sustaining | — | — | — | — | — | — | — | — | — | ||||||||||||||||||||||||||||||||||||||||||||
| Technology improvements | — | — | — | — | — | — | — | — | — | ||||||||||||||||||||||||||||||||||||||||||||
| Non-sustaining exploration and study costs | 5 | 4 | 18 | 27 | 1 | 3 | 1 | 44 | 49 | ||||||||||||||||||||||||||||||||||||||||||||
| Care and maintenance | — | — | — | — | — | — | — | — | — | ||||||||||||||||||||||||||||||||||||||||||||
| Corporate and social responsibility costs not related to current operations | — | — | — | — | — | 17 | 3 | — | 20 | ||||||||||||||||||||||||||||||||||||||||||||
| Other provisions | — | — | — | — | — | — | — | — | — | ||||||||||||||||||||||||||||||||||||||||||||
| All-in costs | 324 | 298 | 36 | 659 | 205 | 418 | 140 | 83 | 844 | ||||||||||||||||||||||||||||||||||||||||||||
Adjusted for non-controlling interests and non -gold producing companies(1) | — | — | — | — | (15) | — | — | — | (15) | ||||||||||||||||||||||||||||||||||||||||||||
| All-in costs adjusted for non-controlling interests and non-gold producing companies | 324 | 298 | 36 | 659 | 190 | 418 | 140 | 83 | 829 | ||||||||||||||||||||||||||||||||||||||||||||
Gold sold – oz (000)(2) | 256 | 358 | — | 614 | 219 | 358 | 122 | — | 700 | ||||||||||||||||||||||||||||||||||||||||||||
All-in sustaining cost per unit – $/oz(3) | 1,246 | 757 | — | 990 | 859 | 1,107 | 1,105 | — | 1,032 | ||||||||||||||||||||||||||||||||||||||||||||
All-in cost per unit – $/oz(3) | 1,266 | 830 | — | 1,072 | 863 | 1,164 | 1,141 | — | 1,183 | ||||||||||||||||||||||||||||||||||||||||||||
| Australia | Total Australia | Argentina | Brazil | Americas other | Total Americas | ||||||||||||||||||||||||||||||||||||||||||||||||
| Sunrise Dam | Tropicana | Australia other | Cerro Vanguardia | AngloGold Ashanti Mineração | Serra Grande | ||||||||||||||||||||||||||||||||||||||||||||||||
| Total cash costs | |||||||||||||||||||||||||||||||||||||||||||||||||||||
Cost of sales per segmental information(5) | 318 | 297 | 17 | 632 | 274 | 417 | 131 | 1 | 822 | ||||||||||||||||||||||||||||||||||||||||||||
| By-product revenue | — | (3) | — | (3) | (61) | (20) | — | (1) | (81) | ||||||||||||||||||||||||||||||||||||||||||||
| Inventory change | (1) | (1) | — | (2) | 3 | (1) | — | — | 2 | ||||||||||||||||||||||||||||||||||||||||||||
| Amortisation of intangible assets | — | — | — | — | — | — | — | — | — | ||||||||||||||||||||||||||||||||||||||||||||
| Amortisation of tangible assets | (56) | (111) | (7) | (173) | (40) | (103) | (34) | — | (177) | ||||||||||||||||||||||||||||||||||||||||||||
| Rehabilitation and other non-cash costs | (3) | (1) | (1) | (5) | (11) | (12) | (10) | — | (33) | ||||||||||||||||||||||||||||||||||||||||||||
| Retrenchment costs | — | — | — | (1) | (1) | (2) | — | (1) | (3) | ||||||||||||||||||||||||||||||||||||||||||||
| Total cash costs net of by-product revenue | 258 | 181 | 9 | 448 | 164 | 279 | 87 | (2) | 530 | ||||||||||||||||||||||||||||||||||||||||||||
Adjusted for non-controlling interests, non-gold producing companies and other(1) | — | — | — | — | (12) | — | — | — | (12) | ||||||||||||||||||||||||||||||||||||||||||||
| Total cash costs net of by-product revenue adjusted for non-controlling interests and non-gold producing companies | 258 | 181 | 9 | 448 | 152 | 279 | 87 | (2) | 518 | ||||||||||||||||||||||||||||||||||||||||||||
Gold produced – oz (000) (2) | 254 | 360 | — | 614 | 225 | 362 | 123 | — | 710 | ||||||||||||||||||||||||||||||||||||||||||||
Total cash costs per unit – $/oz(3) | 1,014 | 504 | — | 730 | 673 | 782 | 707 | — | 736 | ||||||||||||||||||||||||||||||||||||||||||||
| JOINT VENTURES | SUBSIDIARIES | |||||||
| All-in sustaining costs | ||||||||
Cost of sales per segmental information(5) | 428 | 2,626 | ||||||
| By-product revenue | (1) | (86) | ||||||
| Amortisation of tangible and intangible assets | (137) | (583) | ||||||
| Adjusted for decommissioning and inventory amortisation | 2 | 1 | ||||||
| Lease payment sustaining | — | 51 | ||||||
| Corporate administration and marketing related to current operations | — | 82 | ||||||
| Inventory writedown to net realisable value and other stockpile adjustments | — | — | ||||||
| Sustaining exploration and study costs | — | 31 | ||||||
| Total sustaining capital expenditure | 46 | 390 | ||||||
| Amortisation relating to inventory | — | — | ||||||
| Realised other commodity contracts | — | — | ||||||
| All-in sustaining costs | 338 | 2,512 | ||||||
Adjusted for non-controlling interests and non-gold producing companies(1) | — | (60) | ||||||
| All-in sustaining costs adjusted for non-controlling interests and non-gold producing companies | 338 | 2,452 | ||||||
| All-in sustaining costs | 338 | 2,512 | ||||||
| Non-sustaining project capital expenditure | 5 | 313 | ||||||
| Lease payment non sustaining | — | 1 | ||||||
| Technology improvements | — | — | ||||||
| Non-sustaining exploration and study costs | 4 | 85 | ||||||
| Care and maintenance costs | — | 47 | ||||||
| Corporate and social responsibility costs not related to current operations | — | 38 | ||||||
| Other provisions | — | 2 | ||||||
| All-in costs | 347 | 2,998 | ||||||
Adjusted for non-controlling interests and non-gold producing companies(1) | — | (62) | ||||||
| All-in costs adjusted for non-controlling interests and non-gold producing companies | 347 | 2,936 | ||||||
Gold sold – oz (000)(2) | 442 | 2,410 | ||||||
All-in sustaining cost per unit – $/oz(3) | 767 | 1,017 | ||||||
All-in cost per unit – $/oz(3) | 785 | 1,218 | ||||||
| JOINT VENTURES | SUBSIDIARIES | |||||||
| Total cash costs | ||||||||
Cost of sales per segmental information(5) | 428 | 2,626 | ||||||
| By-product revenue | (1) | (86) | ||||||
| Inventory change | 3 | (5) | ||||||
| Amortisation of intangible assets | — | — | ||||||
| Amortisation of tangible assets | (137) | (583) | ||||||
| Rehabilitation and other non-cash costs | (1) | (53) | ||||||
| Retrenchment costs | — | (4) | ||||||
| Total cash costs net of by-product revenue | 292 | 1,895 | ||||||
Adjusted for non-controlling interests, non-gold producing companies and other(1) | — | (53) | ||||||
| Total cash costs net of by product revenue adjusted for non-controlling interests and non-gold producing companies | 292 | 1,841 | ||||||
Gold produced – oz (000)(2) | 445 | 2,415 | ||||||
Total cash costs (adjusted) per unit – $/oz(3) | 657 | 763 | ||||||
Rounding of figures may result in computational discrepancies.
| DRC | Mali | Joint | Ghana | Guinea | Tanzania | Africa other | Subsidiaries | |||||||||||||||||||||||||||||||||||||||||||||||||
| Kibali | Morila | Sadiola | Ventures | Iduapriem | Obuasi | Siguiri | Geita | |||||||||||||||||||||||||||||||||||||||||||||||||
| All-in sustaining costs | ||||||||||||||||||||||||||||||||||||||||||||||||||||||||
Cost of sales per segmental information(5) | 373 | 42 | 65 | 480 | 233 | (6) | 286 | 612 | 2 | 1,127 | ||||||||||||||||||||||||||||||||||||||||||||||
| By-product revenue | (1) | — | — | (1) | — | — | — | (2) | — | (2) | ||||||||||||||||||||||||||||||||||||||||||||||
| Amortisation of tangible and intangible assets | (149) | (7) | (9) | (165) | (29) | — | (38) | (144) | (3) | (214) | ||||||||||||||||||||||||||||||||||||||||||||||
| Adjusted for decommissioning and inventory amortisation | 1 | 3 | — | 4 | — | — | 2 | 2 | — | 4 | ||||||||||||||||||||||||||||||||||||||||||||||
| Lease payment sustaining | — | — | — | — | — | — | — | — | — | — | ||||||||||||||||||||||||||||||||||||||||||||||
| Corporate administration and marketing related to current operations | — | — | — | — | — | — | — | — | — | — | ||||||||||||||||||||||||||||||||||||||||||||||
| Inventory writedown to net realisable value and other stockpile adjustments | — | — | — | — | — | — | — | — | — | — | ||||||||||||||||||||||||||||||||||||||||||||||
| Sustaining exploration and study costs | — | — | — | — | 1 | — | 7 | 8 | — | 16 | ||||||||||||||||||||||||||||||||||||||||||||||
| Total sustaining capital expenditure | 54 | 2 | — | 56 | 43 | — | 11 | 59 | — | 113 | ||||||||||||||||||||||||||||||||||||||||||||||
| Amortisation relating to inventory | — | — | — | — | — | — | — | — | — | — | ||||||||||||||||||||||||||||||||||||||||||||||
| Realised other commodity contracts | — | — | — | — | — | — | — | — | — | — | ||||||||||||||||||||||||||||||||||||||||||||||
| All-in sustaining costs | 278 | 40 | 56 | 374 | 248 | (6) | 267 | 535 | — | 1,044 | ||||||||||||||||||||||||||||||||||||||||||||||
Adjusted for non-controlling interests and non -gold producing companies(1) | — | — | — | — | — | — | (40) | — | — | (40) | ||||||||||||||||||||||||||||||||||||||||||||||
| All-in sustaining costs adjusted for non-controlling interests and non-gold producing companies | 278 | 40 | 56 | 374 | 248 | (6) | 227 | 535 | — | 1,004 | ||||||||||||||||||||||||||||||||||||||||||||||
| All-in sustaining costs | 278 | 40 | 56 | 374 | 248 | (6) | 267 | 535 | — | 1,044 | ||||||||||||||||||||||||||||||||||||||||||||||
| Non-sustaining project capital expenditure | 10 | — | 1 | 11 | — | 48 | 85 | — | — | 133 | ||||||||||||||||||||||||||||||||||||||||||||||
| Lease payment non sustaining | — | — | — | — | — | — | — | — | — | — | ||||||||||||||||||||||||||||||||||||||||||||||
| Technology improvements | — | — | — | — | — | — | — | — | — | — | ||||||||||||||||||||||||||||||||||||||||||||||
| Non-sustaining exploration and study costs | 1 | — | — | 1 | — | 1 | 10 | — | — | 11 | ||||||||||||||||||||||||||||||||||||||||||||||
| Care and maintenance costs | — | — | — | — | — | 39 | — | — | — | 39 | ||||||||||||||||||||||||||||||||||||||||||||||
| Corporate and social responsibility costs not related to current operations | — | — | — | — | — | — | — | — | — | — | ||||||||||||||||||||||||||||||||||||||||||||||
| Other provisions | — | — | — | — | — | — | — | — | — | — | ||||||||||||||||||||||||||||||||||||||||||||||
| All-in costs | 289 | 40 | 57 | 386 | 248 | 82 | 362 | 535 | — | 1,227 | ||||||||||||||||||||||||||||||||||||||||||||||
Adjusted for non-controlling interests and non -gold producing companies(1) | — | — | — | — | — | — | (54) | — | — | (54) | ||||||||||||||||||||||||||||||||||||||||||||||
| All-in costs adjusted for non-controlling interests and non-gold producing companies | 289 | 40 | 57 | 386 | 248 | 82 | 308 | 535 | — | 1,173 | ||||||||||||||||||||||||||||||||||||||||||||||
Gold sold - oz (000)(2) | 370 | 30 | 58 | 459 | 254 | — | 244 | 568 | — | 1,066 | ||||||||||||||||||||||||||||||||||||||||||||||
All-in sustaining cost per unit – $/oz(3) | 752 | 1,321 | 990 | 820 | 977 | — | 930 | 940 | — | 941 | ||||||||||||||||||||||||||||||||||||||||||||||
All-in cost per unit – $/oz(3) | 782 | 1,321 | 1,005 | 846 | 977 | — | 1,261 | 940 | — | 1,099 | ||||||||||||||||||||||||||||||||||||||||||||||
| DRC | Mali | Joint | Ghana | Guinea | Tanzania | Africa other | Subsidiaries | ||||||||||||||||||||||||||||||||||||||||||||||||||||
| Kibali | Morila | Sadiola | Ventures | Iduapriem | Obuasi | Siguiri | Geita | ||||||||||||||||||||||||||||||||||||||||||||||||||||
| Total cash costs | |||||||||||||||||||||||||||||||||||||||||||||||||||||||||||
Cost of sales per segmental information(5) | 373 | 42 | 65 | 480 | 233 | (6) | 286 | 612 | 2 | 1,127 | |||||||||||||||||||||||||||||||||||||||||||||||||
| By-product revenue | (1) | — | — | (1) | — | — | — | (2) | — | (2) | |||||||||||||||||||||||||||||||||||||||||||||||||
| Inventory change | (3) | — | 1 | (2) | — | — | (3) | (2) | — | (5) | |||||||||||||||||||||||||||||||||||||||||||||||||
| Amortisation of intangible assets | — | — | — | — | — | — | — | — | — | — | |||||||||||||||||||||||||||||||||||||||||||||||||
| Amortisation of tangible assets | (149) | (7) | (9) | (165) | (29) | — | (38) | (144) | (3) | (214) | |||||||||||||||||||||||||||||||||||||||||||||||||
| Rehabilitation and other non-cash costs | (1) | (1) | — | (2) | — | 6 | (5) | (10) | — | (8) | |||||||||||||||||||||||||||||||||||||||||||||||||
| Retrenchment costs | — | — | (2) | (2) | — | — | — | — | — | — | |||||||||||||||||||||||||||||||||||||||||||||||||
| Total cash costs net of by-product revenue | 219 | 34 | 55 | 308 | 204 | — | 240 | 454 | — | 898 | |||||||||||||||||||||||||||||||||||||||||||||||||
Adjusted for non-controlling interests, non-gold producing companies and other(1) | — | — | — | — | — | — | (36) | — | — | (36) | |||||||||||||||||||||||||||||||||||||||||||||||||
| Total cash costs net of by-product revenue adjusted for non-controlling interests and non-gold producing companies | 219 | 34 | 55 | 308 | 204 | — | 204 | 454 | — | 862 | |||||||||||||||||||||||||||||||||||||||||||||||||
Gold produced - oz (000) (2) | 363 | 30 | 59 | 452 | 254 | — | 242 | 564 | — | 1,060 | |||||||||||||||||||||||||||||||||||||||||||||||||
Total cash costs per unit - $/oz(3) | 600 | 1,145 | 938 | 680 | 804 | — | 844 | 804 | — | 813 | |||||||||||||||||||||||||||||||||||||||||||||||||
| Australia | TOTAL AUSTRALIA | Argentina | Brazil | Americas other | Total Americas | ||||||||||||||||||||||||||||||||||||||||||||||||
| Sunrise Dam | Tropicana | Australia other | Cerro Vanguardia | AngloGold Ashanti Mineração | Serra Grande | ||||||||||||||||||||||||||||||||||||||||||||||||
| All-in sustaining costs | |||||||||||||||||||||||||||||||||||||||||||||||||||||
Cost of sales per segmental information(5) | 310 | 293 | 18 | 622 | 325 | 382 | 129 | 2 | 838 | ||||||||||||||||||||||||||||||||||||||||||||
| By-product revenue | — | (2) | — | (2) | (111) | (17) | — | — | (128) | ||||||||||||||||||||||||||||||||||||||||||||
| Amortisation of tangible and intangible assets | (51) | (92) | (6) | (149) | (50) | (99) | (42) | — | (192) | ||||||||||||||||||||||||||||||||||||||||||||
| Adjusted for decommissioning and inventory amortisation | 1 | 1 | — | 2 | (3) | (6) | (2) | (1) | (11) | ||||||||||||||||||||||||||||||||||||||||||||
| Lease payment sustaining | — | — | — | — | — | — | — | — | — | ||||||||||||||||||||||||||||||||||||||||||||
| Corporate administration and marketing related to current operations | — | — | — | — | — | — | — | — | — | ||||||||||||||||||||||||||||||||||||||||||||
| Inventory writedown to net realisable value and other stockpile adjustments | — | — | — | — | — | — | — | — | — | ||||||||||||||||||||||||||||||||||||||||||||
| Sustaining exploration and study costs | 7 | 5 | — | 12 | 2 | 4 | 4 | — | 10 | ||||||||||||||||||||||||||||||||||||||||||||
| Total sustaining capital expenditure | 79 | 74 | 2 | 154 | 36 | 96 | 35 | 9 | 176 | ||||||||||||||||||||||||||||||||||||||||||||
| Amortisation relating to inventory | — | — | — | — | — | — | — | — | — | ||||||||||||||||||||||||||||||||||||||||||||
| Realised other commodity contracts | — | — | — | — | — | — | — | (5) | (5) | ||||||||||||||||||||||||||||||||||||||||||||
| All-in sustaining costs | 346 | 279 | 15 | 639 | 199 | 360 | 124 | 5 | 688 | ||||||||||||||||||||||||||||||||||||||||||||
Adjusted for non-controlling interests and non -gold producing companies(1) | — | — | — | — | (15) | — | — | (9) | (24) | ||||||||||||||||||||||||||||||||||||||||||||
| All-in sustaining costs adjusted for non-controlling interests and non-gold producing companies | 346 | 279 | 15 | 639 | 184 | 360 | 124 | (4) | 664 | ||||||||||||||||||||||||||||||||||||||||||||
| All-in sustaining costs | 346 | 279 | 15 | 639 | 199 | 360 | 124 | 5 | 688 | ||||||||||||||||||||||||||||||||||||||||||||
| Non-sustaining project capital expenditure | — | 2 | — | 2 | — | — | — | — | — | ||||||||||||||||||||||||||||||||||||||||||||
| Lease payment non sustaining | — | — | — | — | — | — | — | — | — | ||||||||||||||||||||||||||||||||||||||||||||
| Technology improvements | — | — | — | — | — | — | — | — | — | ||||||||||||||||||||||||||||||||||||||||||||
| Non-sustaining exploration and study costs | — | — | 18 | 18 | — | 2 | — | 34 | 36 | ||||||||||||||||||||||||||||||||||||||||||||
| Care and maintenance | — | — | — | — | — | — | — | — | — | ||||||||||||||||||||||||||||||||||||||||||||
| Corporate and social responsibility costs not related to current operations | — | — | — | — | 2 | 12 | 3 | (1) | 16 | ||||||||||||||||||||||||||||||||||||||||||||
| Other provisions | — | — | — | — | — | — | — | — | — | ||||||||||||||||||||||||||||||||||||||||||||
| All-in costs | 346 | 281 | 32 | 659 | 201 | 374 | 127 | 38 | 740 | ||||||||||||||||||||||||||||||||||||||||||||
Adjusted for non-controlling interests and non -gold producing companies(1) | — | — | — | — | (15) | — | — | — | (15) | ||||||||||||||||||||||||||||||||||||||||||||
| All-in costs adjusted for non-controlling interests and non-gold producing companies | 346 | 281 | 33 | 659 | 186 | 374 | 127 | 38 | 725 | ||||||||||||||||||||||||||||||||||||||||||||
Gold sold - oz (000)(2) | 283 | 332 | — | 615 | 282 | 370 | 131 | — | 783 | ||||||||||||||||||||||||||||||||||||||||||||
All-in sustaining cost per unit - $/oz(3) | 1,223 | 843 | — | 1,038 | 652 | 973 | 945 | — | 855 | ||||||||||||||||||||||||||||||||||||||||||||
All-in cost per unit - $/oz(3) | 1,223 | 848 | — | 1,070 | 656 | 1,015 | 965 | — | 932 | ||||||||||||||||||||||||||||||||||||||||||||
| Australia | TOTAL AUSTRALIA | Argentina | Brazil | Americas other | Total America | ||||||||||||||||||||||||||||||||||||||||||||||||
| Sunrise Dam | Tropicana | Australia other | Cerro Vanguardia | AngloGold Ashanti Mineração | Serra Grande | ||||||||||||||||||||||||||||||||||||||||||||||||
| Total cash costs | |||||||||||||||||||||||||||||||||||||||||||||||||||||
Cost of sales per segmental information(5) | 310 | 293 | 19 | 622 | 325 | 382 | 129 | 2 | 838 | ||||||||||||||||||||||||||||||||||||||||||||
| By-product revenue | — | (2) | — | (2) | (111) | (17) | — | — | (128) | ||||||||||||||||||||||||||||||||||||||||||||
| Inventory change | 7 | 5 | — | 12 | (7) | (6) | (3) | — | (16) | ||||||||||||||||||||||||||||||||||||||||||||
| Amortisation of intangible assets | — | — | — | — | — | — | — | — | — | ||||||||||||||||||||||||||||||||||||||||||||
| Amortisation of tangible assets | (51) | (92) | (6) | (149) | (50) | (99) | (42) | (1) | (192) | ||||||||||||||||||||||||||||||||||||||||||||
| Rehabilitation and other non-cash costs | — | (5) | (1) | (6) | (10) | 4 | 2 | — | (4) | ||||||||||||||||||||||||||||||||||||||||||||
| Retrenchment costs | — | — | — | — | (2) | (1) | — | — | (3) | ||||||||||||||||||||||||||||||||||||||||||||
| Total cash costs net of by-product revenue | 266 | 199 | 12 | 477 | 145 | 263 | 86 | 1 | 495 | ||||||||||||||||||||||||||||||||||||||||||||
Adjusted for non-controlling interests, non-gold producing companies and other(1) | — | — | — | — | (11) | — | — | — | (11) | ||||||||||||||||||||||||||||||||||||||||||||
| Total cash costs net of by-product revenue adjusted for non-controlling interests and non-gold producing companies | 266 | 199 | 12 | 477 | 134 | 263 | 86 | 1 | 484 | ||||||||||||||||||||||||||||||||||||||||||||
Gold produced - oz (000) (2) | 289 | 336 | — | 625 | 282 | 364 | 130 | — | 776 | ||||||||||||||||||||||||||||||||||||||||||||
Total cash costs per unit - $/oz(3) | 920 | 594 | — | 762 | 476 | 723 | 660 | — | 624 | ||||||||||||||||||||||||||||||||||||||||||||
| JOINT VENTURES | SUBSIDIARIES | |||||||
| All-in sustaining costs | ||||||||
Cost of sales per segmental information(5) | 480 | 2,584 | ||||||
| By-product revenue | (1) | (133) | ||||||
| Amortisation of tangible and intangible assets | (165) | (558) | ||||||
| Adjusted for decommissioning and inventory amortisation | 4 | (5) | ||||||
| Lease payment sustaining | — | — | ||||||
| Corporate administration and marketing related to current operations | — | 76 | ||||||
| Inventory writedown to net realisable value and other stockpile adjustments | — | — | ||||||
| Sustaining exploration and study costs | — | 38 | ||||||
| Total sustaining capital expenditure | 56 | 445 | ||||||
| Amortisation relating to inventory | — | — | ||||||
| Realised other commodity contracts | — | (5) | ||||||
| All-in sustaining costs | 374 | 2,443 | ||||||
Adjusted for non-controlling interests and non-gold producing companies(1) | — | (64) | ||||||
| All-in sustaining costs adjusted for non-controlling interests and non-gold producing companies | 374 | 2,379 | ||||||
| All-in sustaining costs | 374 | 2,443 | ||||||
| Non-sustaining project capital expenditure | 11 | 133 | ||||||
| Lease payment non sustaining | — | — | ||||||
| Technology improvements | — | — | ||||||
| Non-sustaining exploration and study costs | 1 | 65 | ||||||
| Care and maintenance costs | — | 39 | ||||||
| Care and maintenance costs, Corporate and social responsibility costs not related to current operations | — | 22 | ||||||
| Other provisions | — | (1) | ||||||
| All-in costs | 386 | 2,702 | ||||||
Adjusted for non-controlling interests and non-gold producing companies(1) | — | (69) | ||||||
| All-in costs adjusted for non-controlling interests and non-gold producing companies | 386 | 2,634 | ||||||
Gold sold - oz (000)(2) | 459 | 2,463 | ||||||
All-in sustaining cost per unit - $/oz(3) | 820 | 970 | ||||||
All-in cost per unit - $/oz(3) | 846 | 1,075 | ||||||
| JOINT VENTURES | SUBSIDIARIES | |||||||
| Total cash costs | ||||||||
Cost of sales per segmental information(5) | 480 | 2,584 | ||||||
| By-product revenue | (1) | (133) | ||||||
| Inventory change | (2) | (9) | ||||||
| Amortisation of intangible assets | — | (5) | ||||||
| Amortisation of tangible assets | (165) | (553) | ||||||
| Rehabilitation and other non-cash costs | (2) | (17) | ||||||
| Retrenchment costs | (2) | (4) | ||||||
| Total cash costs net of by-product revenue | 308 | 1,863 | ||||||
Adjusted for non-controlling interests, non-gold producing companies and other(1) | — | (47) | ||||||
| Total cash costs net of by-product revenue adjusted for non-controlling interests and non-gold producing companies | 308 | 1,816 | ||||||
Gold produced - oz (000)(2) | 452 | 2,460 | ||||||
Total cash costs (adjusted) per unit - $/oz(3) | 680 | 743 | ||||||
| Mponeng | West Wits Operations | Surface Operations | South Africa other | Total South Africa (Operations) | |||||||||||||||||||||||||||||||||||||||||||||||||
| All-in sustaining costs | |||||||||||||||||||||||||||||||||||||||||||||||||||||
Cost of sales per segmental information(3) | 158 | 158 | 124 | 4 | 287 | ||||||||||||||||||||||||||||||||||||||||||||||||
| By-product revenue | (1) | — | — | — | (1) | ||||||||||||||||||||||||||||||||||||||||||||||||
| Amortisation of tangible and intangible assets | — | — | — | — | — | ||||||||||||||||||||||||||||||||||||||||||||||||
| Adjusted for decommissioning and inventory amortisation | — | — | — | — | — | ||||||||||||||||||||||||||||||||||||||||||||||||
| Corporate administration and marketing related to current operations | — | — | — | — | — | ||||||||||||||||||||||||||||||||||||||||||||||||
| Inventory writedown to net realisable value and other stockpile adjustments | — | — | — | — | — | ||||||||||||||||||||||||||||||||||||||||||||||||
| Sustaining exploration and study costs | — | — | — | — | — | ||||||||||||||||||||||||||||||||||||||||||||||||
| Total sustaining capital expenditure | 27 | 27 | 7 | 1 | 35 | ||||||||||||||||||||||||||||||||||||||||||||||||
| Realised other commodity contracts | — | — | — | — | — | ||||||||||||||||||||||||||||||||||||||||||||||||
| All-in sustaining costs | 184 | 185 | 131 | 5 | 321 | ||||||||||||||||||||||||||||||||||||||||||||||||
| All-in sustaining costs | 184 | 185 | 131 | 5 | 321 | ||||||||||||||||||||||||||||||||||||||||||||||||
| Non-sustaining project capital expenditure | — | — | — | — | — | ||||||||||||||||||||||||||||||||||||||||||||||||
| Lease Payment non-sustaining | — | — | — | ||||||||||||||||||||||||||||||||||||||||||||||||||
| Technology improvements | — | — | — | — | — | ||||||||||||||||||||||||||||||||||||||||||||||||
| Non-sustaining exploration and study costs | — | — | — | — | — | ||||||||||||||||||||||||||||||||||||||||||||||||
| Care and maintenance | — | — | — | 17 | 17 | ||||||||||||||||||||||||||||||||||||||||||||||||
| Corporate and social responsibility costs not related to current operations | — | — | — | — | — | ||||||||||||||||||||||||||||||||||||||||||||||||
| Other provisions | — | — | — | — | — | ||||||||||||||||||||||||||||||||||||||||||||||||
| All-in costs | 184 | 185 | 131 | 22 | 338 | ||||||||||||||||||||||||||||||||||||||||||||||||
Gold sold - oz (000)(1) | 135 | 135 | 109 | — | 247 | ||||||||||||||||||||||||||||||||||||||||||||||||
All-in sustaining cost (excluding stockpile write-offs) per unit - $/oz(2) | 1,365 | 1,365 | 1,201 | — | 1,296 | ||||||||||||||||||||||||||||||||||||||||||||||||
All-in cost per unit (excluding stockpile write-offs) - $/oz(2) | 1,366 | 1,366 | 1,201 | — | 1,367 | ||||||||||||||||||||||||||||||||||||||||||||||||
For the year ended 31 December 2020
Operations in South Africa (Discontinued operations)
(in $ millions, except as otherwise noted)
| Mponeng | West Wits Operations | Surface Operations | South Africa other | Total South Africa (Operations) | |||||||||||||||||||||||||||||||||||||||||||
| Total cash costs | |||||||||||||||||||||||||||||||||||||||||||||||
Cost of sales per segmental information(3) | 158 | 158 | 124 | 4 | 287 | ||||||||||||||||||||||||||||||||||||||||||
| By-product revenue | (1) | (1) | — | — | (1) | ||||||||||||||||||||||||||||||||||||||||||
| Inventory change | (1) | (1) | (2) | (4) | (7) | ||||||||||||||||||||||||||||||||||||||||||
| Amortisation of intangible assets | — | — | — | — | — | ||||||||||||||||||||||||||||||||||||||||||
| Amortisation of tangible and intangible assets | — | — | — | — | — | ||||||||||||||||||||||||||||||||||||||||||
| Rehabilitation and other non-cash costs | — | — | — | — | — | ||||||||||||||||||||||||||||||||||||||||||
| Retrenchment costs | (1) | (1) | — | — | (2) | ||||||||||||||||||||||||||||||||||||||||||
| Total cash costs net of by-product revenue | 155 | 155 | 122 | — | 277 | ||||||||||||||||||||||||||||||||||||||||||
Gold produced - oz (000)(1) | 134 | 134 | 107 | — | 241 | ||||||||||||||||||||||||||||||||||||||||||
Total cash costs per unit - $/oz(2) | 1,164 | 1,164 | 1,131 | — | 1,149 | ||||||||||||||||||||||||||||||||||||||||||
| Mponeng | West Wits Operations | Surface Operations | South Africa other | Total South Africa (Operations) | |||||||||||||||||||||||||||||||
| All-in sustaining costs | |||||||||||||||||||||||||||||||||||
| Cost of sales per segmental information(5) | 158 | 158 | 124 | 4 | 287 | ||||||||||||||||||||||||||||||
| By-product revenue | (1) | — | — | — | (1) | ||||||||||||||||||||||||||||||
| Cost of sales | 157 | 158 | 124 | 4 | 286 | ||||||||||||||||||||||||||||||
| Realised other commodity contracts | — | — | — | — | — | ||||||||||||||||||||||||||||||
| Amortisation of tangible, intangible and right of use assets | — | — | — | — | — | ||||||||||||||||||||||||||||||
| Adjusted for decommissioning and inventory amortisation | — | — | — | — | — | ||||||||||||||||||||||||||||||
| Corporate administration and marketing expenditure | — | — | — | — | — | ||||||||||||||||||||||||||||||
| Lease payment sustaining | — | — | — | — | — | ||||||||||||||||||||||||||||||
| Sustaining exploration and study costs | — | — | — | — | — | ||||||||||||||||||||||||||||||
| Total sustaining capital expenditure | 27 | 27 | 7 | 1 | 35 | ||||||||||||||||||||||||||||||
| All-in Sustaining costs | 184 | 185 | 131 | 5 | 321 | ||||||||||||||||||||||||||||||
| Adjusted for non-controlling interests and non gold producing companies (1) | — | — | — | — | — | ||||||||||||||||||||||||||||||
| All-in Sustaining costs adjusted for non-controlling interests and non-gold producing companies | 184 | 185 | 131 | 5 | 321 | ||||||||||||||||||||||||||||||
| All-in Sustaining costs | 184 | 185 | 131 | 5 | 321 | ||||||||||||||||||||||||||||||
| Non-Sustaining project capital expenditure | — | — | — | — | — | ||||||||||||||||||||||||||||||
| Non-sustaining lease payments | — | — | — | — | — | ||||||||||||||||||||||||||||||
| Non-sustaining exploration and study costs | — | — | — | — | — | ||||||||||||||||||||||||||||||
| Care and maintenance | — | — | — | 17 | 17 | ||||||||||||||||||||||||||||||
| Closure and social responsibility costs not related to current operations | — | — | — | — | — | ||||||||||||||||||||||||||||||
| Other provisions | — | — | — | — | — | ||||||||||||||||||||||||||||||
| All-in costs | 184 | 185 | 131 | 22 | 338 | ||||||||||||||||||||||||||||||
| Adjusted for non-controlling interests and non gold producing companies (1) | — | — | — | — | — | ||||||||||||||||||||||||||||||
| All-in costs adjusted for non-controlling interests and non-gold producing companies | 184 | 185 | 131 | 22 | 338 | ||||||||||||||||||||||||||||||
| Gold sold - oz (000) | 135 | 135 | 109 | — | 247 | ||||||||||||||||||||||||||||||
| All-in sustaining cost per unit $/oz | 1,365 | 1,365 | 1,201 | — | 1,296 | ||||||||||||||||||||||||||||||
| All-in cost per unit $/oz | 1,366 | 1,366 | 1,201 | — | 1,367 | ||||||||||||||||||||||||||||||
For the year ended 31 December 20192020
Operations in South Africa (Discontinued operations)
(in $ millions, except as otherwise noted)
| Mponeng | West Wits Operations | Surface Operations | South Africa other | Total South Africa (Operations) | |||||||||||||||||||||||||||||||
| Total cash costs | |||||||||||||||||||||||||||||||||||
Cost of sales per segmental information(5) | 158 | 158 | 124 | 4 | 287 | ||||||||||||||||||||||||||||||
| By-product revenue | (1) | (1) | — | — | (1) | ||||||||||||||||||||||||||||||
| Inventory change | (1) | (1) | (2) | (4) | (7) | ||||||||||||||||||||||||||||||
| Amortisation of tangible assets | — | — | — | — | — | ||||||||||||||||||||||||||||||
| Amortisation of right of use assets | — | — | — | — | — | ||||||||||||||||||||||||||||||
| Amortisation of intangible assets | — | — | — | — | — | ||||||||||||||||||||||||||||||
| Rehabilitation and other non-cash costs | — | — | — | — | — | ||||||||||||||||||||||||||||||
| Retrenchment costs | (1) | (1) | — | — | (2) | ||||||||||||||||||||||||||||||
| Total cash costs net of by-product revenue | 155 | 155 | 122 | — | 277 | ||||||||||||||||||||||||||||||
| Adjusted for non-controlling interests, non-gold producing companies | — | — | — | — | — | ||||||||||||||||||||||||||||||
| Total cash costs net of by-product revenue adjusted for non-controlling interests and non-gold producing companies | 155 | 155 | 122 | — | 277 | ||||||||||||||||||||||||||||||
Gold produced – oz (000)(2) | 134 | 134 | 107 | — | 241 | ||||||||||||||||||||||||||||||
Total cash costs per unit – $/oz(3) | 1,164 | 1,164 | 1,131 | — | 1,149 | ||||||||||||||||||||||||||||||
192
For the year ended 31 December 2020
Operations Africa
(in $ millions, except as otherwise noted)
| AFRICA | AFRICA | ||||||||||||||||||||||||||||
| Kibali | Other | Joint Ventures | Iduapriem | Obuasi Restated | Siguiri | Geita | Africa Other | Subsidiaries Restated | |||||||||||||||||||||
| All-in sustaining costs | |||||||||||||||||||||||||||||
Cost of sales per segmental information(5) | 340 | — | 340 | 280 | 164 | 377 | 542 | (1) | 1,362 | ||||||||||||||||||||
| By-product revenue | (1) | — | (1) | (1) | — | — | (2) | — | (3) | ||||||||||||||||||||
| Cost of sales | 339 | — | 339 | 279 | 164 | 377 | 540 | (1) | 1,359 | ||||||||||||||||||||
| Realised other commodity contracts | — | — | — | — | — | — | — | — | — | ||||||||||||||||||||
| Amortisation of tangible, intangible and right of use assets | (104) | — | (104) | (74) | (11) | (41) | (124) | — | (250) | ||||||||||||||||||||
| Adjusted for decommissioning and inventory amortisation | 1 | — | 1 | 1 | — | — | 4 | — | 5 | ||||||||||||||||||||
| Corporate administration and marketing expenditure | — | — | — | — | — | — | — | — | — | ||||||||||||||||||||
| Lease payment sustaining | 9 | — | 9 | — | — | — | 17 | — | 17 | ||||||||||||||||||||
| Sustaining exploration and study costs | — | — | — | 3 | — | 2 | 5 | — | 10 | ||||||||||||||||||||
| Total sustaining capital expenditure | 52 | — | 52 | 60 | 7 | 15 | 80 | 1 | 163 | ||||||||||||||||||||
| All-in sustaining costs | 296 | — | 297 | 269 | 161 | 353 | 522 | — | 1,304 | ||||||||||||||||||||
Adjusted for non-controlling interests and non -gold producing companies(1) | — | — | — | — | — | (53) | — | — | (53) | ||||||||||||||||||||
| All-in sustaining costs adjusted for non-controlling interests and non-gold producing companies | 296 | — | 297 | 269 | 161 | 300 | 522 | — | 1,251 | ||||||||||||||||||||
| All-in sustaining costs | 296 | — | 297 | 269 | 161 | 353 | 522 | — | 1,304 | ||||||||||||||||||||
| Non-sustaining project capital expenditure | — | — | — | — | 199 | 15 | 7 | — | 220 | ||||||||||||||||||||
| Non-sustaining lease payments | — | — | — | — | — | — | 2 | — | 2 | ||||||||||||||||||||
| Non-sustaining exploration and study costs | — | — | — | 2 | 2 | 5 | 2 | — | 11 | ||||||||||||||||||||
| Care and maintenance | — | — | — | — | — | — | — | — | — | ||||||||||||||||||||
| Closure and social responsibility costs not related to current operations | 2 | 3 | 4 | — | 10 | — | — | — | 10 | ||||||||||||||||||||
| Other provisions | — | — | — | — | — | — | — | — | — | ||||||||||||||||||||
| All-in costs | 298 | 3 | 301 | 271 | 371 | 373 | 533 | — | 1,546 | ||||||||||||||||||||
Adjusted for non-controlling interests and non-gold producing companies(1) | — | — | — | — | — | (56) | — | — | (56) | ||||||||||||||||||||
| All-in costs adjusted for non-controlling interests and non-gold producing companies | 298 | 3 | 301 | 271 | 371 | 317 | 533 | — | 1,490 | ||||||||||||||||||||
Gold sold – oz (000)(2) | 365 | — | 365 | 274 | 120 | 215 | 639 | — | 1,249 | ||||||||||||||||||||
All-in sustaining cost per unit – $/oz(3) | 809 | — | 810 | 985 | 1,332 | 1,397 | 814 | — | 1,002 | ||||||||||||||||||||
All-in cost per unit – $/oz(3) | 817 | — | 824 | 992 | 3,078 | 1,476 | 831 | — | 1,193 | ||||||||||||||||||||
193
For the year ended 31 December 2020
Operations Africa
(in $ millions, except as otherwise noted)
| Mponeng | West Wits Operations | Surface Operations | South Africa other | Total South Africa (Operations) | ||||||||||||||||||||||||||||||||||||||||
| All-in sustaining costs | ||||||||||||||||||||||||||||||||||||||||||||
Cost of sales per segmental information(3) | 287 | 287 | 189 | 3 | 479 | |||||||||||||||||||||||||||||||||||||||
| By-product revenue | — | — | — | — | (1) | |||||||||||||||||||||||||||||||||||||||
| Amortisation of tangible and intangible assets | (47) | (47) | (13) | (1) | (61) | |||||||||||||||||||||||||||||||||||||||
| Adjusted for decommissioning and inventory amortisation | — | — | — | — | 1 | |||||||||||||||||||||||||||||||||||||||
| Inventory writedown to net realisable value and other stockpile adjustments | — | — | (3) | (3) | (6) | |||||||||||||||||||||||||||||||||||||||
| Total sustaining capital expenditure | 47 | 47 | 7 | 3 | 57 | |||||||||||||||||||||||||||||||||||||||
| Realised other commodity contracts | — | — | — | — | — | |||||||||||||||||||||||||||||||||||||||
| All-in sustaining costs | 287 | 287 | 180 | 2 | 469 | |||||||||||||||||||||||||||||||||||||||
| All-in sustaining costs | 287 | 289 | 180 | 2 | 469 | |||||||||||||||||||||||||||||||||||||||
| Non-sustaining project capital expenditure | 2 | — | — | — | 2 | |||||||||||||||||||||||||||||||||||||||
| Technology improvements | — | — | — | — | — | |||||||||||||||||||||||||||||||||||||||
| Care and maintenance | — | — | — | 42 | 42 | |||||||||||||||||||||||||||||||||||||||
| All-in costs | 289 | 289 | 180 | 44 | 513 | |||||||||||||||||||||||||||||||||||||||
Gold sold - oz (000)(1) | 242 | 242 | 172 | — | 414 | |||||||||||||||||||||||||||||||||||||||
All-in sustaining cost (excluding stockpile write-offs) per unit - $/oz(2) | 1,186 | 1,187 | 1,043 | — | 1,132 | |||||||||||||||||||||||||||||||||||||||
All-in cost per unit (excluding stockpile write-offs) - $/oz(2) | 1,197 | 1,198 | 1,043 | — | 1,240 | |||||||||||||||||||||||||||||||||||||||
| AFRICA | AFRICA | ||||||||||||||||||||||||||||
| Kibali | Other | Joint Ventures | Iduapriem | Obuasi Restated | Siguiri | Geita | Africa other | Subsidiaries Restated | |||||||||||||||||||||
| Total cash costs | |||||||||||||||||||||||||||||
Cost of sales per segmental information(5) | 340 | — | 340 | 280 | 164 | 377 | 542 | (1) | 1,362 | ||||||||||||||||||||
| By-product revenue | (1) | — | (1) | (1) | — | — | (2) | — | (3) | ||||||||||||||||||||
| Inventory change | (1) | — | (1) | 1 | 16 | (1) | (12) | — | 3 | ||||||||||||||||||||
| Amortisation of tangible assets | (101) | — | (101) | (74) | (11) | (40) | (108) | — | (232) | ||||||||||||||||||||
| Amortisation of right of use assets | (3) | — | (3) | — | — | (1) | (16) | — | (17) | ||||||||||||||||||||
| Amortisation of intangible assets | — | — | — | — | — | — | — | — | — | ||||||||||||||||||||
| Rehabilitation and other non-cash costs | (4) | — | (4) | (6) | (2) | (9) | (5) | — | (22) | ||||||||||||||||||||
| Retrenchment costs | — | — | — | — | — | — | — | — | — | ||||||||||||||||||||
| Total cash costs net of by-product revenue | 230 | — | 230 | 200 | 166 | 326 | 399 | (1) | 1,092 | ||||||||||||||||||||
Adjusted for non-controlling interests non-gold producing companies and other(1) | — | — | — | — | — | (49) | — | — | (49) | ||||||||||||||||||||
| Total cash costs adjusted for non-controlling interests and non-gold producing companies and other | 230 | — | 230 | 200 | 166 | 277 | 399 | (1) | 1,043 | ||||||||||||||||||||
Gold produced - oz (000)(2) | 364 | — | 364 | 275 | 127 | 215 | 623 | — | 1,239 | ||||||||||||||||||||
Total cash costs per unit - $/oz(3) | 629 | 0 | 629 | 731 | 1307 | 1293 | 641 | 0 | 841 | ||||||||||||||||||||
194
For the year ended 31 December 20192020
Operations in South AfricaAustralia, America and Projects
(in $ millions, except as otherwise noted)
| AUSTRALIA | AMERICAS | PROJECTS (6) Restated | ||||||||||||||||||||||||||||||
| Sunrise Dam | Tropicana | Australia other | Total Australia | Cerro Vanguardia | AngloGold Ashanti Mineração | Serra Grande | Americas other Restated | Total Americas | ||||||||||||||||||||||||
| All-in sustaining costs | ||||||||||||||||||||||||||||||||
Cost of sales per segmental information(5) | 342 | 338 | 25 | 705 | 269 | 391 | 102 | 2 | 764 | — | ||||||||||||||||||||||
| By-product revenue | (1) | (2) | — | (3) | (82) | (17) | — | — | (99) | — | ||||||||||||||||||||||
| Cost of sales | 341 | 336 | 25 | 702 | 187 | 374 | 102 | 2 | 665 | — | ||||||||||||||||||||||
| Realised other commodity contracts | — | — | — | — | — | — | — | — | — | — | ||||||||||||||||||||||
| Amortisation of tangible, intangible and right of use assets | (64) | (94) | (2) | (160) | (26) | (109) | (27) | (1) | (163) | — | ||||||||||||||||||||||
| Adjusted for decommissioning and inventory amortisation | 2 | 1 | — | 3 | (7) | 3 | — | — | (4) | — | ||||||||||||||||||||||
| Corporate administration and marketing expenditure | — | — | — | — | — | — | — | — | — | — | ||||||||||||||||||||||
| Lease payment sustaining | 11 | 10 | 1 | 22 | — | 8 | 2 | — | 10 | — | ||||||||||||||||||||||
| Sustaining exploration and study costs | — | 1 | — | 1 | 2 | 2 | — | — | 4 | — | ||||||||||||||||||||||
| Total sustaining capital expenditure | 50 | 64 | — | 114 | 31 | 103 | 33 | — | 167 | — | ||||||||||||||||||||||
| All-in sustaining costs | 340 | 318 | 24 | 682 | 187 | 381 | 110 | 1 | 679 | — | ||||||||||||||||||||||
Adjusted for non-controlling interests and non -gold producing companies(1) | — | — | — | — | (14) | — | — | — | (14) | — | ||||||||||||||||||||||
| All-in sustaining costs adjusted for non-controlling interests and non-gold producing companies | 340 | 318 | 24 | 682 | 173 | 381 | 110 | 1 | 665 | — | ||||||||||||||||||||||
| All-in sustaining costs | 340 | 318 | 24 | 682 | 187 | 381 | 110 | 1 | 679 | — | ||||||||||||||||||||||
| Non-sustaining project capital expenditure | 3 | 25 | — | 28 | — | — | — | — | — | 49 | ||||||||||||||||||||||
| Non-sustaining lease payments | — | — | — | — | — | — | — | — | — | — | ||||||||||||||||||||||
| Non-sustaining exploration and study costs | 22 | 5 | 17 | 44 | 1 | 6 | 3 | — | 10 | 47 | ||||||||||||||||||||||
| Care and maintenance | — | — | — | — | — | — | — | — | — | — | ||||||||||||||||||||||
| Closure and social responsibility costs not related to current operations | — | — | — | — | — | 8 | 2 | — | 10 | — | ||||||||||||||||||||||
| Other provisions | — | — | — | — | — | — | — | — | — | — | ||||||||||||||||||||||
| All-in costs | 365 | 348 | 41 | 754 | 188 | 395 | 115 | 1 | 699 | 96 | ||||||||||||||||||||||
Adjusted for non-controlling interests and non -gold producing companies(1) | — | — | — | — | (14) | — | — | — | (14) | — | ||||||||||||||||||||||
| All-in costs adjusted for non-controlling interests and non-gold producing companies | 365 | 348 | 41 | 754 | 174 | 395 | 115 | 1 | 685 | 96 | ||||||||||||||||||||||
Gold sold – oz (000)(2) | 258 | 299 | — | 557 | 186 | 364 | 114 | — | 664 | — | ||||||||||||||||||||||
All-in sustaining cost per unit – $/oz(3) | 1,320 | 1,061 | — | 1,225 | 931 | 1,050 | 953 | — | 1,003 | — | ||||||||||||||||||||||
All-in cost per unit – $/oz(3) | 1,417 | 1,164 | — | 1,356 | 934 | 1,091 | 997 | — | 1,032 | — | ||||||||||||||||||||||
195
For the year ended 31 December 2020
Operations in Australia, America and Projects
(in $ millions, except as otherwise noted)
| AUSTRALIA | AMERICAS | ||||||||||||||||||||||||||||||||||
| Sunrise Dam | Tropicana | Australia other | Total Australia | Cerro Vanguardia | AngloGold Ashanti Mineração | Serra Grande | Americas other | Total Americas | |||||||||||||||||||||||||||
| Total cash costs | |||||||||||||||||||||||||||||||||||
Cost of sales per segmental information(5) | 342 | 338 | 25 | 705 | 269 | 391 | 102 | 2 | 764 | ||||||||||||||||||||||||||
| By-product revenue | (1) | (2) | — | (3) | (82) | (17) | — | — | (99) | ||||||||||||||||||||||||||
| Inventory change | (1) | (1) | — | (2) | (16) | 1 | — | — | (16) | ||||||||||||||||||||||||||
| Amortisation of tangible assets | (54) | (86) | — | (141) | (26) | (100) | (25) | — | (151) | ||||||||||||||||||||||||||
| Amortisation of right of use assets | (10) | (8) | (1) | (18) | — | (8) | (2) | (1) | (11) | ||||||||||||||||||||||||||
| Amortisation of intangible assets | — | — | (1) | (1) | — | (1) | — | — | (1) | ||||||||||||||||||||||||||
| Rehabilitation and other non-cash costs | (2) | (1) | (1) | (4) | (13) | 4 | 3 | (1) | (6) | ||||||||||||||||||||||||||
| Retrenchment costs | — | — | — | — | — | (1) | — | — | (2) | ||||||||||||||||||||||||||
| Total cash costs net of by-product revenue | 274 | 240 | 22 | 536 | 132 | 269 | 77 | — | 478 | ||||||||||||||||||||||||||
Adjusted for non-controlling interests, non-gold producing companies and other(1) | — | — | — | — | (10) | — | — | — | (10) | ||||||||||||||||||||||||||
| Total cash costs net of by-product revenue adjusted for non-controlling interests and non-gold producing companies | 274 | 240 | 22 | 536 | 122 | 269 | 77 | — | 468 | ||||||||||||||||||||||||||
Gold produced – oz (000)(2) | 256 | 298 | — | 554 | 173 | 362 | 114 | — | 649 | ||||||||||||||||||||||||||
Total cash costs per unit – $/oz(3) | 1,069 | 807 | — | 968 | 699 | 747 | 665 | — | 721 | ||||||||||||||||||||||||||
196
For the year ended 31 December 2020
AngloGold Ashanti operations – Total
(in $ millions, except as otherwise noted)
| JOINT VENTURES | SUBSIDIARIES EXCLUDING DISCONTINUED OPERATIONS RESTATED | |||||||
| All-in sustaining costs | ||||||||
Cost of sales per segmental information(5) | 340 | 2,829 | ||||||
| By-product revenue | (1) | (105) | ||||||
| Cost of sales | 339 | 2,724 | ||||||
| Realised other commodity contracts | — | 5 | ||||||
| Amortisation of tangible, intangible and right of use assets | (104) | (575) | ||||||
| Adjusted for decommissioning and inventory amortisation | 1 | 4 | ||||||
| Corporate administration and marketing expenditure | — | 67 | ||||||
| Lease payment sustaining | 9 | 52 | ||||||
| Sustaining exploration and study costs | — | 15 | ||||||
| Total sustaining capital expenditure | 52 | 445 | ||||||
| All-in sustaining costs | 297 | 2,740 | ||||||
Adjusted for non-controlling interests and non-gold producing companies(1) | — | (67) | ||||||
| All-in sustaining costs adjusted for non-controlling interests and non-gold producing companies | 297 | 2,672 | ||||||
| All-in sustaining costs | 297 | 2,740 | ||||||
| Non-sustaining project capital expenditure | — | 298 | ||||||
| Non-sustaining lease payments | — | 2 | ||||||
| Non-sustaining exploration and study costs | — | 112 | ||||||
| Care and maintenance | — | — | ||||||
| Closure and social responsibility costs not related to current operations | 4 | 29 | ||||||
| Other provisions | — | — | ||||||
| All-in costs | 301 | 3,179 | ||||||
Adjusted for non-controlling interests and non-gold producing companies(1) | — | (70) | ||||||
| All-in costs adjusted for non-controlling interests and non-gold producing companies | 301 | 3,109 | ||||||
Gold sold – oz (000)(2) | 365 | 2,470 | ||||||
All-in sustaining cost per unit – $/oz(3) | 810 | 1,082 | ||||||
All-in cost per unit – $/oz(3) | 824 | 1,259 | ||||||
197
For the year ended 31 December 2020
AngloGold Ashanti operations – Total
(in $ millions, except as otherwise noted)
| Mponeng | West Wits Operations | Surface Operations | South Africa other | Total South Africa (Operations) | JOINT VENTURES | SUBSIDIARIES EXCLUDING DISCONTINUED OPERATIONS RESTATED | |||||||||||||||||||||||||||||||||||||||||||||||||
| Total cash costs | Total cash costs | Total cash costs | |||||||||||||||||||||||||||||||||||||||||||||||||||||
Cost of sales per segmental information | Cost of sales per segmental information | 287 | 287 | 189 | 3 | 479 | Cost of sales per segmental information | 340 | 2,829 | ||||||||||||||||||||||||||||||||||||||||||||||
| By-product revenue | By-product revenue | — | — | — | — | (1) | By-product revenue | (1) | (105) | ||||||||||||||||||||||||||||||||||||||||||||||
| Inventory change | Inventory change | 3 | 3 | (1) | — | 2 | Inventory change | (1) | (16) | ||||||||||||||||||||||||||||||||||||||||||||||
| Amortisation of tangible assets | Amortisation of tangible assets | (101) | (526) | ||||||||||||||||||||||||||||||||||||||||||||||||||||
| Amortisation of right of use assets | Amortisation of right of use assets | (3) | (47) | ||||||||||||||||||||||||||||||||||||||||||||||||||||
| Amortisation of intangible assets | Amortisation of intangible assets | — | — | — | — | — | Amortisation of intangible assets | — | (3) | ||||||||||||||||||||||||||||||||||||||||||||||
| Amortisation of tangible and intangible assets | (47) | (47) | (13) | (1) | (61) | ||||||||||||||||||||||||||||||||||||||||||||||||||
| Rehabilitation and other non-cash costs | Rehabilitation and other non-cash costs | (2) | (2) | (2) | (2) | (6) | Rehabilitation and other non-cash costs | (4) | (32) | ||||||||||||||||||||||||||||||||||||||||||||||
| Retrenchment costs | Retrenchment costs | (2) | (2) | — | — | (2) | Retrenchment costs | — | (2) | ||||||||||||||||||||||||||||||||||||||||||||||
| Total cash costs net of by-product revenue | Total cash costs net of by-product revenue | 239 | 239 | 173 | — | 411 | Total cash costs net of by-product revenue | 230 | 2,101 | ||||||||||||||||||||||||||||||||||||||||||||||
Gold produced - oz (000)(1) | 244 | 244 | 175 | — | 419 | ||||||||||||||||||||||||||||||||||||||||||||||||||
Total cash costs per unit - $/oz(2) | 976 | 976 | 987 | — | 981 | ||||||||||||||||||||||||||||||||||||||||||||||||||
Adjusted for non-controlling interests and non-gold producing companies(1) | Adjusted for non-controlling interests and non-gold producing companies(1) | — | (59) | ||||||||||||||||||||||||||||||||||||||||||||||||||||
| Total cash costs net of by-product revenue adjusted for non-controlling interests and non-gold producing companies | Total cash costs net of by-product revenue adjusted for non-controlling interests and non-gold producing companies | 230 | 2,042 | ||||||||||||||||||||||||||||||||||||||||||||||||||||
Gold produced – oz (000)(2) | Gold produced – oz (000)(2) | 364 | 2,442 | ||||||||||||||||||||||||||||||||||||||||||||||||||||
Total cash costs (adjusted) per unit – $/oz(3) | Total cash costs (adjusted) per unit – $/oz(3) | 629 | 836 | ||||||||||||||||||||||||||||||||||||||||||||||||||||
| Kopanang | Moab Khotsong | Vaal River Operations | Mponeng | West Wits Operations | Surface Operations | South Africa other | Total South Africa (Operations) | ||||||||||||||||||||||||||||||||||||||||||||||
| All-in sustaining costs | |||||||||||||||||||||||||||||||||||||||||||||||||||||
Cost of sales per segmental information(3) | 29 | 48 | 77 | 320 | 320 | 193 | — | 590 | |||||||||||||||||||||||||||||||||||||||||||||
| By-product revenue | (2) | (4) | (6) | — | — | — | — | (6) | |||||||||||||||||||||||||||||||||||||||||||||
| Amortisation of tangible and intangible assets | — | — | — | (57) | (57) | (15) | — | (72) | |||||||||||||||||||||||||||||||||||||||||||||
| Adjusted for decommissioning and inventory amortisation | — | — | — | — | — | (3) | — | (3) | |||||||||||||||||||||||||||||||||||||||||||||
| Corporate administration and marketing related to current operations | — | — | — | — | — | — | — | — | |||||||||||||||||||||||||||||||||||||||||||||
| Inventory writedown to net realisable value and other stockpile adjustments | — | — | — | — | — | — | 1 | 1 | |||||||||||||||||||||||||||||||||||||||||||||
| Sustaining exploration and study costs | — | — | — | — | — | — | — | — | |||||||||||||||||||||||||||||||||||||||||||||
| Total sustaining capital expenditure | — | 7 | 7 | 49 | 49 | 12 | — | 68 | |||||||||||||||||||||||||||||||||||||||||||||
| All-in sustaining costs | 27 | 51 | 78 | 312 | 312 | 187 | 1 | 578 | |||||||||||||||||||||||||||||||||||||||||||||
| All-in sustaining costs | 27 | 51 | 78 | 312 | 312 | 187 | 1 | 578 | |||||||||||||||||||||||||||||||||||||||||||||
| Non-sustaining project capital expenditure | — | — | — | 5 | 5 | — | — | 5 | |||||||||||||||||||||||||||||||||||||||||||||
| Technology improvements | — | — | — | — | — | — | 4 | 4 | |||||||||||||||||||||||||||||||||||||||||||||
| Non-sustaining exploration and study costs | — | — | — | — | — | — | — | — | |||||||||||||||||||||||||||||||||||||||||||||
| Care and maintenance | — | — | — | — | — | — | 35 | 35 | |||||||||||||||||||||||||||||||||||||||||||||
| Corporate and social responsibility costs not related to current operations | — | — | — | — | — | — | — | — | |||||||||||||||||||||||||||||||||||||||||||||
| All-in costs | 27 | 51 | 78 | 317 | 317 | 187 | 40 | 622 | |||||||||||||||||||||||||||||||||||||||||||||
Gold sold - oz (000)(1) | 13 | 41 | 53 | 265 | 265 | 171 | — | 490 | |||||||||||||||||||||||||||||||||||||||||||||
All-in sustaining cost (excluding stockpile write-offs) per unit - $/oz(2) | 2,115 | 1,247 | 1,452 | 1,177 | 1,177 | 1,094 | — | 1,178 | |||||||||||||||||||||||||||||||||||||||||||||
All-in cost per unit (excluding stockpile write-offs) - $/oz(2) | 2,115 | 1,247 | 1,452 | 1,196 | 1,196 | 1,094 | — | 1,268 | |||||||||||||||||||||||||||||||||||||||||||||
| Kopanang | Moab Khotsong | Vaal River Operations | Mponeng | West Wits Operations | Surface Operations | South Africa other | Total South Africa (Operations) | ||||||||||||||||||||||||||||||||||||||||||||||
| Total cash costs | |||||||||||||||||||||||||||||||||||||||||||||||||||||
Cost of sales per segmental information(3) | 29 | 48 | 77 | 320 | 320 | 193 | — | 590 | |||||||||||||||||||||||||||||||||||||||||||||
| By-product revenue | (2) | (4) | (6) | — | — | — | — | (6) | |||||||||||||||||||||||||||||||||||||||||||||
| Inventory change | — | (1) | (1) | — | — | (4) | — | (5) | |||||||||||||||||||||||||||||||||||||||||||||
| Amortisation of intangible assets | — | — | — | — | — | — | — | — | |||||||||||||||||||||||||||||||||||||||||||||
| Amortisation of tangible assets | — | — | — | (57) | (57) | (15) | — | (72) | |||||||||||||||||||||||||||||||||||||||||||||
| Rehabilitation and other non-cash costs | (2) | (1) | (3) | (4) | (4) | 2 | 2 | (3) | |||||||||||||||||||||||||||||||||||||||||||||
| Retrenchment costs | — | — | — | — | — | — | — | — | |||||||||||||||||||||||||||||||||||||||||||||
| Total cash costs net of by-product revenue | 25 | 42 | 67 | 259 | 259 | 176 | 2 | 504 | |||||||||||||||||||||||||||||||||||||||||||||
Gold produced - oz (000) (1) | 12 | 39 | 51 | 265 | 265 | 171 | — | 487 | |||||||||||||||||||||||||||||||||||||||||||||
Total cash costs per unit - $/oz(2) | 2,002 | 1,083 | 1,304 | 977 | 983 | 1,030 | — | 1,033 | |||||||||||||||||||||||||||||||||||||||||||||
5B. LIQUIDITY AND CAPITAL RESOURCES
In the board’s opinion, AngloGold Ashanti’s working capital is sufficient to meet the company’sCompany’s present requirements.
Comparison of cash flows in 2022 with 2021
Cash flows from operating activities
Cash flows from operating activities were $1,545increased by $536 million, or 42 percent, from $1,268 million in 2020, $5872021 to $1,804 million or 61 percent, higher than the 2019 amount of $958 million.in 2022. The increase in cash flows generated by operationsfrom operating activities was mainly due to an increase in revenue from gold sales due to an increase in the gold price and an increase in dividends received from joint ventures, partiallyan increase in receipts from customers as a result of an increase in gold production, as well as lower taxation paid due to lower profit before taxation in Australia, Brazil, Argentina and Tanzania. This increase was partly offset by an increase in payments to suppliers and employees as a result of higher production costs, which was impacted byand unfavourable working capital movements.
Net cash outflow from operating working capital items amounted to $238$137 million in 2020,2022, compared with an outflowinflow of $165$53 million in 2019.2021. The outflow from operating working capital in 2022 mainly relatesrelated to an increase in inventories and an increase in trade, other receivables and other assets, partly offset by an increase in trade, other payables and provisions.
Cash flows from operating activities were also impacted by movements in the VAT lock-up of value added tax (“VAT”) at Geita in Tanzania as well as foreign exchange controls and increased export-duty receivablesexport duties at Cerro Vanguardia.Vanguardia in Argentina. In Tanzania, on 1 July 2020, the Finance Act, 2020 (No. 8) became effective, amending the Value Added Tax Act, 2014 (No. 5), without retrospective effect, specifically by deleting the disqualification of refunds due to exporters of ‘raw minerals’. This allows for the recovery of VAT refunds at Geita for mineral exporters from July 2020 onwards. Discussions with the Tanzanian tax authorities are ongoing to resolve our historical claims fornet overdue recoverable VAT input credit refunds for(after discounting provisions) increased by $11 million, or eight percent, from $142 million in 2021 to $153 million in 2022, as a result of new claims submitted to the period from July 2017 to June 2020, whileTanzania Revenue Authority (“TRA”) during 2022 and despite offsetting verified VAT claims from July 2020 onwards are subjectof $45 million against corporate tax payments in 2022. AngloGold Ashanti expects to verification procedures by such authorities before any refunds will be received.continue offsetting verified VAT claims against corporate taxes. See “Item“Item 4B: Business Overview—The Regulatory Environment Enabling AngloGold Ashanti to Mine—Africa—Tanzania”. In Argentina, CVSA had a cash balance of $137the net export duty receivables (after discounting provisions) decreased by $10 million, equivalent asor 53 percent, from $19 million at 31 December 2020,2021 to $9 million at 31 December 2022. In addition, Cerro Vanguardia’s cash balance decreased by $23 million (equivalent), or 17 percent, from $139 million (equivalent) at 31 December 2021 to $116 million (equivalent) at 31 December 2022. While the approvals of which $50 million is currently eligible to be declared as dividends. Application has been made to the Argentinean Central Bank to approve $11 million of this eligible amountpurchase US dollars to be paiddistribute offshore dividends to AngloGold Ashanti are pending, the company, however, approvalcash remains pending. The cash is fully available for CVSA’sCerro Vanguardia’s operational and exploration requirements. See “Item“Item 4B: Business Overview—The Regulatory Environment Enabling AngloGold Ashanti to Mine—Americas—Argentina”.
Dividends received from associates and joint ventures increased by $71$463 million, or 200 percent, from $77$231 million in 20192021 to $148$694 million in 2020, hampered2022. In this connection, cash flows from operating activities were impacted by the slowlevel of cash repatriation from, and movements in the VAT lock-up at, the Kibali joint venture in the DRC. During 2022, AngloGold Ashanti’s cumulative cash receipts from the Kibali joint venture, located in the DRC. Cumulative cash receipts from the DRC in 2020 totalled $140 million, which includedform of dividends of $49 million received from Kibali (Jersey) Limited, amounted to $694 million. Kibali (Jersey) Limited received such cash from Kibali Goldmines S.A. in the fourth quarterform of 2020. At 31 December 2020,loan repayments (net of bank fees) (AngloGold Ashanti’s attributable share: $658 million) and dividends (net of withholding taxes) (AngloGold Ashanti’s attributable share: $36 million). AngloGold Ashanti’s attributable share of the outstanding cash balances awaiting repatriation from the DRC amounteddecreased by $459 million, or 92 percent, from $499 million at 31 December 2021 to $424 million. Barrick,$40 million at 31 December 2022. The cash is fully available for the operatoroperational requirements of the Kibali joint venture, continuesGoldmines S.A. In addition, Kibali Goldmines S.A. is due certain refunds of VAT which, to engage with the DRC Government regarding the 2018 Mining Code and the cash repatriation. Since the third quarter of 2020,date, remain outstanding. During 2022, AngloGold Ashanti did not recover any VAT offsets and refunds have also been impacted by the COVID-19 pandemicfrom its operations in the DRC. AngloGold Ashanti’s attributable share of the net recoverable VAT balance (including recoverable fuel duty and after discounting provisions) owed to AngloGold Ashanti by the DRC government increased by $13 million, or 18 percent, from $73 million at 31 December 2021 to $86 million at 31 December 2022. See “Item“Item 4B: Business Overview—The Regulatory Environment Enabling AngloGold Ashanti to Mine—Africa—Democratic Republic of the Congo (DRC)”.
Cash flows from investing activities
Cash flows from investing activities amounted to a net outflow of $448$1,461 million in 2020, $2352022, $521 million, or 3455 percent, lowerhigher than 2019an outflow of $683 million.$940 million in 2021. The decreaseincrease in cash outflow from investing activities was largely due to $200the acquisition of assets of $517 million proceeds on disposal of discontinued assetsduring 2022 and subsidiaries (South Africa asset disposal group) and $26 million proceeds from disposal of joint ventures (Sadiola and Morila).
199
Cash flows from financing activities
Cash flows from financing activities in the year ended 31 December 20202022 amounted to a net outflow of $329$323 million, which is a change of $152$133 million from an outflow of $177$456 million in the year ended 31 December 2019. Proceeds2021. The decrease in outflow was mainly due to lower net repayment of borrowings, finance costs and dividends paid, partly offset by an increase in repayment of lease liabilities.
Cash inflows from proceeds from borrowings in 2020 increaseddecreased by $2,058$556 million from $168$822 million in 20192021 to $2,226$266 million in 2020.2022. In order to safeguard the balance sheet during the COVID-19 pandemic, AngloGold Ashanti took proactive steps by fully drawing on the $1.4 billion multi-currency revolving credit facility in March 2020 to bolster liquidity. All amounts were repaid by 31 December 2020 and the $1.4 billion multi-currency revolving credit facility is undrawn as at 15 March 2021. In addition, in April 2020 AngloGold Ashanti secured a new standby credit facility of $1.0 billion in order to provide additional liquidity at the onset of the COVID-19 pandemic. The $1.0 billion standby facility, which remained undrawn, was cancelled on 1 October 2020. At the start of October 2020,2021, AngloGold Ashanti Holdings plc issued, a 10-year bond, fully and unconditionally guaranteed byat the end of October 2021, the $750 million 2028 notes (as defined below). In 2022, AngloGold Ashanti Limited, with a semi-annual coupon of 3.750% per annum maturingdrew the remaining undrawn commitments under the $150 million 2021 Geita RCF (as defined below), fully drew on 1 October 2030 (subject to early redemption)the $65 million 2022 Siguiri RCF (as defined below) and partially drew on the $1.4 billion 2022 multi-currency RCF (as defined below).
Cash outflows from repayment of borrowings increaseddecreased by $2,187$636 million from $123$820 million duringin 2021 to $184 million in 2022. In 2021, AngloGold Ashanti Holdings plc repurchased the year ended 31 December 2019 to $2,310$750 million during the year ended 31 December 2020. This increase was mainly due to the repayment2022 notes (as defined below) by way of a 10-year ($700 million) bond issued during April 2010tender offer in October 2021 followed by a redemption in November 2021. In 2022, AngloGold Ashanti repaid $95 million under, and repaid at maturity April 2020 and the repayment ofcancelled, the $1.4 billion 2018 multi-currency revolving credit facility, which had been fully drawn.RCF (as defined below) and repaid $35 million under, and cancelled, the $65 million 2016 Siguiri RCF (as defined below).
Finance costs paid decreased by $19$11 million from $137$120 million in 20192021 to $118$109 million in 2020.2022. The decrease was mainly due to a combination of reduced borrowings, reducedlower interest rates, interest capitalised againstpaid on the Obuasi redevelopment project2028 notes issued in 2021, compared to the 2022 notes which were repurchased and lower lease liabilities. The 10-year $700 million bond offering priced at 3.750% per annum assistedredeemed in reducing finance costs by replacing relatively more expensive debt.2021.
Other borrowing costs increaseddecreased by $24 million from nil in 2019 to $33$35 million in 2020 and mainly relate2021 to $11 million in 2022. The other borrowing costs associated withpaid in 2021 were for the $1.0 standby credit facility and underwriting fees for the issuance of the 2028 notes as well as the tender offer premium and redemption premium costs of the 2022 notes. The other feesborrowing costs paid in 2022 mainly related to the 10-year $700 million bond offering priced at 3.750% per annum.transaction costs of the new $1.4 billion 2022 multi-currency RCF.
Dividends paid decreased by $37 million from $240 million in 2021 to $203 million in 2022. Dividends paid to non-controlling interests decreasedincreased by $7$6 million from $16 million in 20192021 to $9$22 million in 2020.2022. These dividends were paid by our non-wholly owned subsidiaries CVSA and Siguiri to their respective non-AGA related shareholders.
During 2020,2022, the companyCompany declared and paid a dividend of $38$181 million to its shareholders, compared to $27$224 million in 2019.2021.
Comparison of cash flows in 2021 with 2020
Cash flows from operating activities
Cash flows from operating activities from continuing operations decreased by $315 million, or 20 percent, from $1,583 million in 2020 to $1,268 million in 2021. The decrease in cash flows from continuing operations was mainly due to a decrease in receipts from customers as a result of a decrease in gold production and an increase in payments to suppliers and employees as a result of higher production costs. This decrease was partly offset by lower taxation paid due to lower profit before tax, an increase in dividends received from joint ventures and favourable working capital movements.
Net cash inflow from operating working capital items amounted to $53 million in 2021, compared with an outflow of $238 million in 2020. The inflow from operating working capital in 2021 mainly related to a decrease in inventories and an increase in trade, other payables and provisions, partly offset by a decrease in trade, other receivables and other assets.
Cash flows from operating activities were also impacted by movements in the lock-up of value added tax (“VAT”) at Geita in Tanzania as well as foreign exchange controls and export duties at Cerro Vanguardia in Argentina. In Tanzania, net overdue recoverable VAT input credit refunds (after discounting provisions) increased by $3 million, or two percent, from $139 million in 2020 to $142 million in 2021, as a result of new claims submitted to the Tanzania Revenue Authority (“TRA”) during 2021 and despite offsetting verified VAT claims of $54 million against corporate tax payments in 2021. See “Item 4B: Business Overview—The Regulatory Environment Enabling AngloGold Ashanti to Mine—Africa—Tanzania”. In Argentina, the net export duty receivables (after discounting provisions) decreased by $4 million, or 17 percent, from $23 million at 31 December 2020 to $19 million at 31 December 2021. In addition, Cerro Vanguardia’s cash balance increased by $2 million (equivalent), or one percent, from $137 million (equivalent) at 31 December 2020 to $139 million (equivalent) at 31 December 2021. While the approval of the Argentinean Central Bank to purchase US dollars to distribute an offshore dividend to AngloGold Ashanti is pending, the cash remains fully available for Cerro Vanguardia’s operational requirements. See “Item 4B: Business Overview—The Regulatory Environment Enabling AngloGold Ashanti to Mine—Americas—Argentina”.
Dividends received from joint ventures increased by $83 million, or 56 percent, from $148 million in 2020 to $231 million in 2021. In this connection, cash flows from operating activities were impacted by the level of cash repatriation from, and movements in the VAT lock-up at, the Kibali joint venture in the DRC. During 2021, AngloGold Ashanti’s cumulative cash receipts from the Kibali joint venture, in the form of dividends from Kibali (Jersey) Limited, amounted to $231 million. Kibali (Jersey) Limited received such cash from Kibali Goldmines S.A. in the form of loan repayments (net of bank fees) (AngloGold Ashanti’s attributable share: $150 million) and dividends (net of withholding taxes) (AngloGold Ashanti’s attributable share: $81 million). AngloGold Ashanti’s
200
attributable share of the outstanding cash balances awaiting repatriation from the DRC increased by $75 million, or 18 percent, from $424 million at 31 December 2020 to $499 million at 31 December 2021. The cash is fully available for the operational requirements of Kibali Goldmines S.A. In addition, Kibali Goldmines S.A. is due certain refunds of VAT which, to date, remain outstanding. During 2021, AngloGold Ashanti did not recover any VAT offsets and refunds from its operations in the DRC. AngloGold Ashanti’s attributable share of the net recoverable VAT balance (including recoverable fuel duty and after discounting provisions) owed to AngloGold Ashanti by the DRC government increased by $4 million, or six percent, from $69 million at 31 December 2020 to $73 million at 31 December 2021. See “Item 4B: Business Overview—The Regulatory Environment Enabling AngloGold Ashanti to Mine—Africa—Democratic Republic of the Congo (DRC)”.
Net taxation paid decreased by $115 million, or 27 percent, from $431 million in 2020 to $316 million in 2021. The decrease in net taxation paid was mainly due to lower profit before taxation in Ghana, Australia, Brazil, Argentina and Tanzania.
Cash flows from operating activities from discontinued operations were nil in 2021, compared to a net cash inflow of $109 million in 2020.
Cash flows from investing activities
Cash flows from investing activities from continuing operations amounted to a net outflow of $940 million in 2021, $454 million, or 93 percent, higher than 2020 outflow of $486 million. The increase in outflow from continuing operations was largely due to higher capital expenditure of $288 million, or 39 percent, from $739 million in 2020 to $1,027 million in 2021, mainly due to increased conversion of Mineral Reserve, waste stripping at open pit mines and improved rates of underground development, and the transition of our TSFs in Brazil to dry-stacked structures to comply with new legal requirements, as well as proceeds from the disposals in 2020 of the South African assets of $200 million and certain joint ventures (Sadiola and Morila) of $26 million not being repeated in 2021. The increase in outflows was partly offset by the disposal of certain assets in Brazil and higher interest receipts in Argentina due to higher cash and cash equivalent balances in 2021.
Cash flows from investing activities from discontinued operations were nil in 2021, compared to a net cash outflow of $31 million in 2020.
Cash flows from financing activities in 2019 with 2018
Cash flows from financing activities from continuing operations in the year ended 31 December 20192021 amounted to a net outflow of $177$456 million, which is a change of $216$127 million from an outflow of $393$329 million in the year ended 31 December 2018. Proceeds2020. The increase in outflow was mainly due to an increase in dividends paid, partly offset by lower net repayment of borrowings.
Cash inflows from proceeds from borrowings in 2019 decreased by $585$1,404 million from $753$2,226 million in 20182020 to $168$822 million in 2019. This decrease included a $21 million drawdown2021. In 2020, AngloGold Ashanti fully drew on the $1.4 billion syndicated revolving credit facility, $1302018 multi-currency RCF in March 2020 and AngloGold Ashanti Holdings plc issued, at the start of October 2020, the $700 million in proceeds from2030 notes (as defined below). In 2021, AngloGold Ashanti Holdings plc issued, at the local borrowings facilities in South Africa and proceeds from other small loans amounting to $17 million.end of October 2021, the $750 million 2028 notes.
Cash outflows from repayment of borrowings decreased by $844$1,490 million from $967 during$2,310 million in 2020 to $820 million in 2021. In 2020, AngloGold Ashanti Holdings plc repaid, at maturity in April 2020, the year ended 31 December$700 million 2020 notes (as defined below) and AngloGold Ashanti repaid the fully drawn $1.4 billion 2018 to $123multi-currency RCF in October 2020. In 2021, AngloGold Ashanti Holdings plc repurchased the $750 million during the year ended 31 December 2019. This decrease included the repayment2022 notes by way of $122 million of the local borrowing facilitiesa tender offer in South Africa and $1 million relating to other loans.October 2021 followed by a redemption in November 2021.
Finance costs paid increased by $7$2 million from $130$118 million in 20182020 to $137$120 million in 2019.2021. The increase was mainly due to a combination of increased borrowingslower interest capitalised against the Obuasi redevelopment project and higher lease liabilities and fluctuating interest rates for Geita of $10 million, Siguiri of $6 million and Argentina of $2 million partially offset by decreased borrowings and fluctuating interest rates for Australia of $9 million, AngloGold Ashanti Holdings plc of $5 million, Corporate (non-gold producing subsidiaries) of $2 million and finance costs paid on leases for Australia of $6 million, Geita of $1 million, Brazil of $1 million and Corporate of $1 million.liabilities.
Other borrowing costs decreasedincreased by $10$2 million to nil in 2019 from $10$33 million in 2018.2020 to $35 million in 2021. The decrease was due toother borrowing costs paid in 2020 included the absencecosts of new transactionAngloGold Ashanti’s $1.0 billion standby credit facility and the underwriting fees for the issuance of the 2030 notes. The other borrowing costs paid in 2019.2021 were for the underwriting fees for the issuance of the 2028 notes as well as the tender offer premium and redemption premium costs of the 2022 notes.
Dividends paid increased by $193 million from $47 million in 2020 to $240 million in 2021. Dividends paid to non-controlling interests increased by $1$7 million from $15$9 million in 20182020 to $16 million in 2019.2021. These dividends were paid by our non-wholly owned subsidiaries.subsidiaries CVSA and Siguiri to their respective non-AGA related shareholders.
During 2019,2021, the companyCompany declared and paid a dividend of $27$224 million to its shareholders, compared to $24$38 million in 2018.2020.
Cash flows from financing activities from discontinued operations were nil in 2020 and 2021.
201
Liquidity
Sources of liquidity
To service the capital commitments and other operational requirements, the companyAngloGold Ashanti is dependent on existing cash resources, cash generated from operations and borrowing facilities. borrowings (in the form of bonds and credit facilities).
AngloGold Ashanti intends to finance its capital expenditure, capital lease obligations, other purchase obligations, environmental rehabilitation expenditures and debt repayment requirements in 2023 from cash on hand, cash flow from operations, existing credit facilities and, potentially, if deemed appropriate, long-term debt financing and the issuance of equity and equity-linked instruments. As part of the management of liquidity, funding and interest rate risk the Group regularly evaluates market conditions and may enter into transactions, from time to time, to repurchase outstanding debt, pursuant to open market purchases, privately negotiated transactions, tender offers or other means.
Cash and cash equivalents
AngloGold Ashanti’s cash and cash equivalents decreased by $48 million, or four percent, from $1.154 billion at 31 December 2021 to $1.106 billion at 31 December 2022. At 31 December 2022, 78 percent of the Company’s cash and cash equivalents were held in US dollars, three percent in Australian dollars, eight percent in South African rands, ten percent in Argentinean pesos and one percent in other currencies. Amounts are converted to US dollars at exchange rates as of 31 December 2022.
Cash generated from operations
Cash generated from operations is subject to operational, market and other risks. Distributions from operations may be subject to foreign investment, exchange control laws and regulations and the quantity of foreign exchange available in offshore countries. For example, in accordance with the rules and regulations of the Central Bank of Argentina, cash generated by our Argentinean operations is held in Argentinean peso and is subject to monetary and exchange policy controls. In addition, distributions from joint ventures are subject to relevant board approvals.
AngloGold Ashanti’s revenues are derived primarily from the sale of gold produced at its mines. Cash flows from operating activities are therefore the function of gold produced that is sold at a specific price. The market price of gold can fluctuate widely, which impacts the profitability of the company’sCompany’s operations and the cash flows generated by these operations. AngloGold Ashanti’s cash and cash equivalents increased to $1.33 billion at 31 December 2020 compared with $456 million at 31 December 2019. In accordance with South African Reserve Bank regulations, cash generated by South African operations is held in South African rands and is therefore subject to exchange controls. At 31 December 2020, 67 percent of the company’s cash and cash equivalents were held in US dollars, five percent in Australian dollars, 14 percent in South African rands, 11 percent in Argentinian pesos and 3 percent in other currencies.
Borrowings
The credit facilities and other finance arrangements contain financial covenants and other similar undertakings. To the extent that external borrowings are required, the company’sCompany’s covenant performance indicates that existing financing facilities will be available to meet the above commitments. To the extent that any of the financing facilities mature in the near future, the companyCompany believes that sufficient measures are in place to ensure that these facilities can be refinanced.
A full analysis of the borrowings as presented on the statement of financial position is included in “Item 18: Financial Statements—Note 24—Borrowings”.
Bonds
During April 2010, AngloGold Ashanti Holdings plc issued two rated bonds, fully and unconditionally guaranteed by AngloGold Ashanti Limited. The 10-year ($700 million) bond with a semi-annual coupon of 5.375% per annum (the “2020 notes”) was repaid at maturity on 15in April 2020.2020 and is no longer outstanding. The 30-year ($300 million) bond with a semi-annual coupon of 6.50% per annum (the “2040 notes”) will mature on 15 April 2040, unless the companyCompany redeems the bond earlier. See also “Item 10C: Material Contracts—Notes—20102020 Notes and 2040 Notes”.
During July 2012, AngloGold Ashanti Holdings plc issued a rated bond, fully and unconditionally guaranteed by AngloGold Ashanti Limited. The 10-year ($750 million) bond with a semi-annual coupon of 5.125% per annum will mature on 1 August 2022, unless(the “2022 notes”) was repurchased in part in October 2021 with the company redeems the bond earlier.remainder redeemed in November 2021 and is no longer outstanding. See also “Item“Item 10C: Material Contracts—Notes—20122022 Notes”.
During October 2020, AngloGold Ashanti Holdings plc issued a rated bond, fully and unconditionally guaranteed by AngloGold Ashanti Limited. The 10-year ($700 million) bond with a semi-annual coupon of 3.750% per annum (the “2030 notes”) will mature on 1 October 2030, unless the companyCompany redeems the bond earlier. See also “Item“Item 10C: Material Contracts—Notes—20202030 Notes”.
202
Credit facilities
During August 2016, Geita Gold Mining Limited and Société AngloGold Ashanti de Guinée S.A., each as a borrower, entered into two separate three-year unsecured revolving facilities agreements with Nedbank Limited, as lender, of $35 million (which was combined with the Geita RCF in January 2019) and $65 million (Siguiri RCF). In February 2019, Société AngloGold Ashanti de Guinée S.A. renewed the $65 million Siguiri RCF with Nedbank Limited for a further 3 years. The current interest rate charged is LIBOR +8.50%. The Siguiri RCF matures in 3 May 2022 and was fully drawn as of 31 December 2020.
During October 2018, AngloGold Ashanti Holdings plc and AngloGold Ashanti Australia Limited, as borrowers, entered into a five-year unsecured multi-currency syndicated revolving credit facility of $1.4 billion ($1.4 billion(the “2018 multi-currency RCF)RCF”) with the Bank of Nova Scotia, as facility agent, and certain financial institutions party thereto, as lenders. The loan consistsconsisted of (i) a US dollar based facility with interest charged at a margin of 1.45% above LIBOR and (ii) an Australian dollar based facility capped at A$500 million with interest charged at a margin of 1.45% above BBSY. The applicable margin was subject to a ratings grid. In this regard, the interest margin reduced if the Group’s credit rating improved from its current BB+/Baa3 status and increased if its credit rating worsened. The A$500 million portion of the 2018 multi-currency RCF was used to fund the working capital and development costs associated with the Group’s mining operations within Australia without eroding the Group’s headroom under its other facilities and exposing the Group to foreign exchange gains/losses each quarter. On 9 June 2022, the 2018 multi-currency RCF was repaid and cancelled.
During December 2021, Geita Gold Mining Limited, as borrower, entered into a three-year unsecured multi-currency revolving credit facility of $150 million with Nedbank Limited, as underwriter and agent, and certain financial institutions party thereto, as original banks (the “2021 Geita RCF”). The 2021 Geita RCF consisted of a Tanzanian shilling component capped at the equivalent of $87 million bearing interest at 12.5% and a US dollar component bearing interest at LIBOR plus 6.7%. On 27 February 2023, the 2021 Geita RCF was amended to, among other matters, increase its size to $277 million and change the reference rate to Term SOFR. The amended 2021 Geita RCF consists of a Tanzanian shilling component capped at the equivalent of $148 million bearing interest at 12.5% and a US dollar component of $129 million bearing interest at Term SOFR plus 6.7%. The 2021 Geita RCF will mature during August 2024 or December 2024 depending on the fulfilment of certain conditions in the facility agreement. As of 31 December 2022, the 2021 Geita RCF was fully drawn at $150 million.
AngloGold Ashanti Limited, as borrower, seeks to renew its corporate overnight facility of ZAR 150 million (the “RMB corporate overnight facility”) with FirstRand Bank Limited on an annual basis. During October 2021, the RMB corporate overnight facility was reduced from ZAR 500 million to ZAR 150 million. As of 31 December 2022, the ZAR 150 million RMB corporate overnight facility was undrawn.
On 9 June 2022, AngloGold Ashanti Holdings plc and AngloGold Ashanti Australia Limited, as borrowers, entered into a new five-year unsecured multi-currency syndicated revolving credit facility of $1.4 billion (the “2022 multi-currency RCF”) with the Bank of Nova Scotia, as facility agent, and certain financial institutions party thereto, as lenders. The 2022 multi-currency RCF refinanced the 2018 multi-currency RCF. The loan consists of (i) a US dollar based facility with interest charged at a margin of 1.45% above Compounded SOFR adjusted for CAS and (ii) an Australian dollar based facility capped at A$500 million with interest charged at a margin of 1.45% above BBSY. The applicable margin is subject to a ratings grid. In this regard, the interest margin will reduce shouldif the group’sGroup’s credit rating improveimproves from its current BB+/Baa3 status and shouldwill increase if its credit rating worsens. The A$500 million portion of this facilitythe 2022 multi-currency RCF will be used to fund the working capital and development costs associated with the group’sGroup’s mining operations within Australia without eroding the group’sGroup’s headroom under its other facilities and exposing the groupGroup to foreign exchange gains/losses each quarter. This facility matures in October 2023.The 2022 multi-currency RCF will mature on 9 June 2027, with the option, upon application, to be extended by two years. As of 31 December
Pursuant to environmental regulations in the countries with in which the companyAngloGold Ashanti operates, in connection with planningplans for the eventual end-of-life of our mines, AngloGold Ashanti is obligated to rehabilitate the lands where such mines are located. In most cases, AngloGold Ashanti is required to provide financial guarantees for such work, including reclamation bonds or letters of credit issued by third party entities, independent trust funds or cash reserves maintained by the operation, to the respective environmental protection agency, or such other government department with responsibility for environmental oversight in the respective country, to cover all or a portion of the estimated environmental rehabilitation obligations.
In most cases, the environmental obligations will expire on completion of the rehabilitation although, in some cases, AngloGold Ashanti may be required to post bonds for potential events or conditions that could arise after the rehabilitation has been completed. In Australia, since 2014, AngloGold Ashanti has paid into a Mine Rehabilitation Fund an amount of A$11 million for a
203
current carrying value of the liability of A$107 million. At Iduapriem, AngloGold Ashanti intendshas provided a bond comprising a cash component of $12 million with a further bond guarantee amounting to finance its capital expenditure, capital lease obligations, other purchase obligations, environmental rehabilitation expenditures$14 million issued by ABSA Bank Ghana Limited and debt repayment requirements in 2021 from cash on hand, cash flow from operations, existing credit facilities and, potentially, if deemed appropriate, long-term debt financing, the issuance of equity and equity-linked instruments. As partStandard Chartered Bank Ghana Ltd for a current carrying value of the managementliability of liquidity, funding$46 million. At Obuasi, AngloGold Ashanti has provided a bond comprising a cash component of $22 million with a further bank guarantee amounting to $30 million issued by Stanbic Bank Ghana Limited and interest rate riskStandard Chartered Bank Ghana PLC for a current carrying value of the group regularly evaluates market conditions andliability of $171 million. In some circumstances, the Company may enter into transactions, from timebe required to time, to repurchase outstanding debt, pursuant to open market purchases, tender offers or other means.post further bonds in due course which will have a consequential income statement charge for the fees charged by the providers of the reclamation bonds.
Current borrowings
AngloGold Ashanti’s current borrowings decreased by $592$33 million to $142from $51 million at 31 December 2020 from $7342021 to $18 million at 31 December 2019. The decrease in current borrowings is largely due to the settlement of the 5.375% notes which matured on 15 April 2020.2022. See “Item“Item 18: Financial Statements—Note 26—24—Borrowings”.
Non-current borrowings
AngloGold Ashanti’s non-current borrowings increased by $490$107 million to $1,789from $1,858 million at 31 December 2020 compared2021 to $1,299$1,965 million at 31 December 2019.2022. See “Item“Item 18: Financial Statements—Note 26—24—Borrowings”.
As at 31 December 2020,2022, AngloGold Ashanti’s total non-current borrowings, including the short-term portion maturing within 2020,2022, was made up as follows:
| $ (million) | |||||
| Unsecured borrowings | |||||
| Total borrowings | |||||
| Less: Short-term maturities (current borrowings) | |||||
| Total non-current borrowings | |||||
Amounts falling due are scheduled as follows:
| $ (million) | |||||
| Within one year | |||||
| Between one and two years | |||||
| Between two and five years | |||||
| After five years | |||||
| Total | |||||
At 31 December 2020,2022, the currencies in which the borrowings were denominated were as follows:
| $ (million) | |||||
| United States | |||||
| Australian | |||||
| South African rand | — | ||||
| Tanzanian | |||||
| Brazilian real | — | ||||
| Total | |||||
At 31 December 2020,2022, AngloGold Ashanti had the following undrawn amounts available under its borrowing facilities:
| $ (million) | |||||
| FirstRand Bank Limited corporate overnight facility | |||||
| Multi-currency syndicated revolving credit facility ($1.4 billion) – US dollar / Australian dollar | |||||
Geita revolving credit facility ($150 million) – US dollar / Tanzanian shilling (1) | |||||
| Siguiri revolving credit facility ($65 million) – US dollar | — | ||||
| Total undrawn facilities | |||||
(1) On 27 February 2023, the size of the 2021 Geita RCF was increased from $150 million to $277 million.
AngloGold Ashanti had no other committed lines of credit as of 31 December 2020.
As of 31 December 2020,2022, the companyCompany was in compliance with all debt covenants and provisions related to potential defaults.
See “Item“Item 18: Financial Statements—Note 36—34—Capital Management” and “Item“Item 10C: Material Contracts”.
204
At 31 December 2020,2022, lease liabilities were as follows:
| $ (million) | |||||
| Non-current | |||||
| Current | |||||
| Total | |||||
AngloGold Ashanti, through its executive committee, reviews its short-, medium- and long-term funding, treasury and liquidity requirements and positions monthly.
Supplemental parent guarantor and subsidiary issuer financial information
AngloGold Ashanti Holdings plc (the “Issuer”), a direct wholly-owned subsidiary of AngloGold Ashanti Limited (the “Guarantor”), has issued three series of outstanding debt securities which are each fully and unconditionally guaranteed by the Guarantor (the “guaranteed debt securities”). The AuditIssuer is a company incorporated under the laws of the Isle of Man that holds certain of AngloGold Ashanti’s operations and Risk Committee also reviews theseassets located outside of South Africa. The guaranteed debt securities outstanding as of 31 December 2022 consisted of:
•a $300 million 30-year bond, with a maturity date of 15 April 2040 and a fixed coupon of 6.500% payable semi-annually (the “2040 notes”);
•a $750 million 7-year bond, with a maturity date of 1 November 2028 and a fixed coupon of 3.375% payable semi-annually (the “2028 notes”); and
•a $700 million 10-year bond, with a maturity date of 1 October 2030 and a fixed coupon of 3.750% payable semi-annually (the “2030 notes”).
The Guarantor fully and unconditionally guarantees the payment of the principal of, premium, if any, and interest on each of the guaranteed debt securities, including any additional amounts, when and as any such payments become due, whether at maturity, upon redemption or declaration of acceleration, or otherwise. The Guarantor has obtained the approval of the South African Reserve Bank (SARB) to provide each of the guarantees. Each guarantee constitutes unsecured and unsubordinated debt of the Guarantor and ranks equally with all of its other unsecured and unsubordinated debt from time to time outstanding. Each guarantee is or will be effectively subordinated to any of the Guarantor’s existing and future secured debt, to the extent of the value of the assets securing such debt, and structurally subordinated to all of the existing and future liabilities (including trade payables) of each of the Guarantor’s subsidiaries (other than the Issuer). As at 31 December 2022, all of the debt of the Guarantor was unsecured. Under the terms of each full and unconditional guarantee, holders of the guaranteed debt securities will not be required to exercise their remedies against the Issuer before they proceed directly against the Guarantor.
The following summarised financial information reflects, on a quarterlycombined basis, the assets, liabilities, and results of operations of the Issuer and the Guarantor (collectively, the “Obligor Group”). Intercompany balances and transactions within the Obligor Group have been eliminated. Amounts attributable to the Obligor Group’s investment in consolidated subsidiaries that have not issued or guaranteed the guaranteed debt securities (the “Non-Obligor Subsidiaries”) have been excluded. The Obligor Group’s amounts due from, amounts due to and transactions with Non-Obligor Subsidiaries have been separately disclosed, if considered to be material. The summarised financial information below should be read in conjunction with AngloGold Ashanti’s consolidated financial statements for the year ended and as at 31 December 2022, see “Item 18: Financial Statements”.
205
Income statement information
Obligor Group(1) | ||||||||
| $ (million) | Year ended 31 December 2022 | |||||||
| Revenues from Non-Obligor Subsidiaries | 1 | |||||||
| Revenues from Investments | 18 | |||||||
| Net intergroup dividends, interest, royalties and fees with Non-Obligor Subsidiaries | 1 | |||||||
| Loss for the period from continuing operations | (141) | |||||||
| Loss for the period | (141) | |||||||
(1) Gross profit is not disclosed for the Obligor Group. The Guarantor changed the nature of its meetings.main operating activities from mining operations to investment holding in 2021 and has no costs and expenses applicable to revenue. As a result cost of sales and gross profit are no longer presented. The principal activity of the Issuer is to act as a holding company for certain of AngloGold Ashanti’s operations and assets located outside of South Africa.
Statement of financial position information
| Obligor Group | ||||||||
| $ (million) | Year ended 31 December 2022 | |||||||
| ASSETS | ||||||||
| Receivables due from Non-Obligor Subsidiaries | 1,640 | |||||||
| Other current assets | 604 | |||||||
| Total current assets | 2,244 | |||||||
| Non-current assets | 36 | |||||||
| LIABILITIES | ||||||||
| Payables due to Non-Obligor Subsidiaries | 276 | |||||||
| Other current liabilities | 198 | |||||||
| Total current liabilities | 474 | |||||||
| Non-current liabilities | 1,806 | |||||||
Contractual commitments and contingencies
For a detailed discussion of commitments and contingencies, see “Item 18: Financial Statements—Note 34—32—Contractual Commitments and Contingencies”.
As at 31 December 2020,2022, capital commitments can be summarised over the periods shown below as follows:
| Expiration per period | Expiration per period | |||||||||||||||||||||||||||||||||||||||||||||||||||||||||
| Commitment | Commitment | Total amount | Less than 1 year | 1 – 3 years | 4 – 5 years | Over 5 years | Commitment | Total amount | Less than 1 year | 1 – 3 years | 4 – 5 years | Over 5 years | ||||||||||||||||||||||||||||||||||||||||||||||
| (in millions) | (in millions) | $ | $ | $ | $ | $ | (in millions) | $ | $ | $ | $ | $ | ||||||||||||||||||||||||||||||||||||||||||||||
Capital expenditure (contracted and not yet contracted)(1) | Capital expenditure (contracted and not yet contracted)(1) | 487 | 416 | 71 | — | — | Capital expenditure (contracted and not yet contracted)(1) | 437 | 398 | 39 | — | — | ||||||||||||||||||||||||||||||||||||||||||||||
Other commercial commitments(2) | Other commercial commitments(2) | 1,273 | 391 | 588 | 242 | 52 | Other commercial commitments(2) | 1,011 | 436 | 447 | 128 | — | ||||||||||||||||||||||||||||||||||||||||||||||
| Total | Total | 1,760 | 807 | 659 | 242 | 52 | Total | 1,448 | 834 | 486 | 128 | — | ||||||||||||||||||||||||||||||||||||||||||||||
(1) IncludingThere were no commitments through contractual arrangements with equity accountedequity-accounted joint ventures of $12 million.ventures.
(2) Excludes commitments through contractual arrangements with equity accountedequity-accounted joint ventures.
To service the above capital commitments and other operational requirements, the groupGroup is dependent on existing cash resources, cash generated from operations and borrowing facilities.borrowings (in the form of bonds and credit facilities).
As at 31 December 20202022, AngloGold Ashanti had the following known contractual obligations:
| Total | Less than 1 year | 1 – 3 years | 4 – 5 years | More than 5 years | |||||||||||||||||||||||||
| (in millions) | $ | $ | $ | $ | $ | ||||||||||||||||||||||||
Long-term debt obligations including interest(1) | 2,658 | 205 | 947 | 92 | 1,414 | ||||||||||||||||||||||||
| Capital lease obligations | 160 | 42 | 60 | 39 | 19 | ||||||||||||||||||||||||
| Purchase obligations | |||||||||||||||||||||||||||||
- Contracted capital expenditure(2) | 120 | 120 | |||||||||||||||||||||||||||
- Other purchase obligations(3) | 1,273 | 391 | 588 | 242 | 52 | ||||||||||||||||||||||||
Environmental rehabilitation costs(4) | 643 | 51 | 82 | 73 | 437 | ||||||||||||||||||||||||
Pensions and other post-retirement medical obligations(5) | 83 | 9 | 19 | 18 | 37 | ||||||||||||||||||||||||
| Total | 4,937 | 818 | 1,696 | 464 | 1,959 | ||||||||||||||||||||||||
| Total | Less than 1 year | 1 – 3 years | 4 – 5 years | More than 5 years | |||||||||||||||||||||||||
| (in millions) | $ | $ | $ | $ | $ | ||||||||||||||||||||||||
Long-term debt obligations including interest(1) | 2,775 | 102 | 392 | 183 | 2,098 | ||||||||||||||||||||||||
| Capital lease obligations | 203 | 79 | 100 | 22 | 2 | ||||||||||||||||||||||||
| Purchase obligations | |||||||||||||||||||||||||||||
- Contracted capital expenditure(2) | 178 | 178 | |||||||||||||||||||||||||||
- Other purchase obligations(3) | 1,011 | 436 | 447 | 128 | — | ||||||||||||||||||||||||
Environmental rehabilitation costs(4) | 734 | 61 | 109 | 83 | 481 | ||||||||||||||||||||||||
Provision for silicosis(5) | 43 | 12 | 13 | 15 | 3 | ||||||||||||||||||||||||
Pensions and other post-retirement medical obligations(6) | 71 | 8 | 18 | 16 | 29 | ||||||||||||||||||||||||
| Total | 5,015 | 876 | 1,079 | 447 | 2,613 | ||||||||||||||||||||||||
(1) Interest calculations are at the rate existing at the year end. Actual rates are set at floating rates for some of the borrowings (Refer to “Item 18: Financial Statements—Note 26—24—Borrowings”).
(2) Represents contracted capital expenditure for which contractual obligations exist. Amounts stated include commitments of equity accounted joint ventures.
(3) Other purchase obligations represent contractual obligations for mining contract services, purchase of power, supplies, consumables, inventories, explosives and activated carbon.
(4) Pursuant to environmental requirements, AngloGold Ashanti is obligated to close its operations and reclaim and rehabilitate the lands upon which it conducted its mining and gold recovery operations. The present value of estimated closure costs at existing operating mines as well as mines in various stages of closure are reflected in this table. Costs are calculated using undiscounted real cash flows, not nominal cash flows. The amount will change from year to year depending on rehabilitation work undertaken, changes in design and methodology, and new occurrences. For more information on AngloGold Ashanti’s environmental rehabilitation obligations, see "Item“Item 4B: Business Overview-MineOverview—Mine Site Rehabilitation and Closure"Closure” and "Item“Item 4B: Business Overview-Environmental, HealthOverview—Sustainability and SafetyEnvironmental, Social and Governance (“ESG”) Matters”. Amounts stated include a total estimated liability of $24$17 million in respect of equity accountedequity-accounted joint ventures.
(5) In South Africa, AngloGold Ashanti has been subject to numerous claims, including class action litigation with respect to alleged occupational lung diseases. The settlement agreement in relation to the silicosis and tuberculosis class action came into effect in December 2019, following the approval of the settlement by the High Court in Johannesburg in July 2019. As a result, a trust (Tshiamiso Trust) was established for a minimum of 13 years responsible for making payments to eligible beneficiaries. The amount of monetary compensation will vary depending on the nature and seriousness of the disease. See “Item 3D: Risk Factors—The prevalence of occupational health diseases and other diseases and the potential costs and liabilities related thereto may have an adverse effect on the business and results of operations of AngloGold Ashanti”, “Item 4B: Business Overview—Sustainability and Environmental, Social and Governance (“ESG”) Matters” and “Item 18: Financial Statements—Note 1.2—Statement of Compliance—Significant Accounting Judgements and Estimates—Provision for silicosis”.
(6) Represents payments for unfunded plans or plans with insufficient funding. A $12 million reimbursive asset relating to annuities purchase to fund the asset has been separately recognised.
Off-balance sheet arrangements
AngloGold Ashanti does not engage in off-balance sheet financing activities, and does not have any off-balance sheet debt obligations, special purpose entities or unconsolidated associates. The most significant off-balance sheet item are the unaccrued future rehabilitation obligations.
Recent developments
Recent developments disclosed in “Item 18: Financial Statements—Note 35—Subsequent Events” include the following details:
Dividend declaration - On 22 February 2023, the directors of AngloGold Ashanti declared a gross cash dividend per ordinary share of 322 South African cents (assuming an exchange rate of ZAR 17.53/$, the gross dividend payable per ADS is equivalent to 18 US cents) which was approximately $75 million.
AngloGold Ashanti and Gold Fields Propose Joint Arrangement in Ghana - Gold Fields and AngloGold Ashanti (the “Parties”) have agreed the key terms of a proposed joint venture in Ghana between Gold Fields’ Tarkwa and AngloGold Ashanti’s neighbouring Iduapriem Mines (the “Proposed Joint Venture”). The Tarkwa Mine is held by Gold Fields Ghana, in which Gold Fields currently owns a 90% share and the Government of Ghana (the “GoG”) holds 10%. The Iduapriem Mine is currently 100% owned by AngloGold Ashanti. Both mines are located near the town of Tarkwa in the country’s Western Region. The Parties have agreed in principle on the key terms of the Proposed Joint Venture and will engage with the GoG and other key stakeholders, including relevant regulators, with a view to implementing the Proposed Joint Venture as soon as practically possible. The Parties have agreed to mutual exclusivity during this engagement. It is intended that the Proposed Joint Venture will be an incorporated joint venture, constituted within Gold Fields Ghana and operated by Gold Fields.
AngloGold Ashanti will contribute its 100% interest in the Iduapriem Mine to Gold Fields Ghana in return for a shareholding in that company. Excluding the interest to be held by the GoG, Gold Fields will have an interest of 66.7%, or two-thirds, and
207
AngloGold Ashanti will have an interest of 33.3%, or one-third, in the Proposed Joint Venture. There can be no certainty that the Parties will enter into a definitive agreement with respect to the Proposed Joint Venture or about the timing, terms and conditions of any such definitive agreement. Implementation of the Proposed Joint Venture is subject to, among other matters, reaching agreement with the GoG regarding the Proposed Joint Venture, conclusion of confirmatory due diligence and securing all requisite regulatory approvals.
Related party transactions
For a detailed discussion of related party transactions, see “Item 7B: Related Party Transactions”.
Recently adopted accounting policies and pending adoption of new accounting standards
AngloGold Ashanti adopted the amendment to IAS 16 “Property, Plant and Equipment—Proceeds before Intended Use” on 1 January 2022. The amendment prohibits deducting from the cost of an item of property, plant and equipment any proceeds from selling items produced while bringing that asset to the location and condition necessary for it to be capable of operating in the manner intended by management. Instead, an entity recognises the proceeds from selling such items, and the cost of producing those items, in profit or loss. The cost allocation requires significant judgement in terms of this amendment. In accordance with the transitional provisions of IAS 16 an entity applies the amendments retrospectively to items of property, plant and equipment made available for use on or after the beginning of the earliest period presented when the entity first applies the amendment.
The adoption of the amendment on 1 January 2022 resulted in a retrospective increase in property, plant and equipment and a decrease in accumulated losses of $33 million as of 31 December 2020. There was no impact on the 2021 results as no revenue was capitalised in 2021. The effects of the 2020 restatement are included in the accumulated losses opening balance of the 2021 financial reporting period. The impact arises from the reclassification of revenue, cost of sales, and tangible assets and the resulting amortisation recalculation, resulting exclusively from the redevelopment of the Obuasi mine. No other operation was impacted by the adoption of the amendment.
AngloGold Ashanti’s accounting policies are described in “Item 18: Financial Statements—Note 1—Statement of Compliance—Accounting Standards, Interpretations and Amendments to Published Accounting Standards”.
Critical accounting policies
AngloGold Ashanti’s accounting policies are described in “Item 18: Financial Statements—Note 1.2—Statement of Compliance—Significant Accounting Judgements and Estimates”.
Use of estimates and making of assumptions
The preparation of the Company’s financial statements requires management to make estimates and assumptions that affect the reported amounts of assets and liabilities and disclosures of contingent assets and liabilities at the date of the financial statements and the reported amounts of revenues and expenses during the year.
The more significant areas requiring the use of management estimates and assumptions relate to Mineral Reserve that are the basis of future cash flow estimates and unit-of-production depreciation, depletion and amortisation calculations; environmental, reclamation, rehabilitation and closure obligations; asset impairments/reversals (including impairments of goodwill); production start dates; and write downs of inventory to net realisable value. Other estimates include employee benefit liabilities and unrecognised tax positions.
The complex or subjective judgements that have the most significant effect on amounts recognised and the sources of estimation uncertainty where there is a significant risk of material adjustment to the carrying amounts of assets or liabilities in the next reporting period are continually evaluated and are based on historical experience and other factors, including expectations of future events that are believed to be reasonable under the circumstances. On an ongoing basis, management evaluates its estimates and assumptions; however, actual amounts could differ significantly due to the ultimate conclusion of uncertainties.
AngloGold Ashanti’s significant accounting judgements and estimates are described in “Item 18: Financial Statements—Note 1.2—Statement of Compliance—Significant Accounting Judgements and Estimates”.
5C. RESEARCH AND DEVELOPMENT, PATENTS AND LICENSES, ETC.
Research and development expenditure included in the income statement amounted to $1 million during each of 2022, 2021 and 2020.
5D. TREND INFORMATION
208
For a discussion of trends affecting AngloGold Ashanti’s business and operations, see “Item 5A: Operating Results—Key factors affecting results”.
5E. CRITICAL ACCOUNTING ESTIMATES
Not applicable.
209
ITEM 6: DIRECTORS, SENIOR MANAGEMENT AND EMPLOYEES
6A. DIRECTORS AND SENIOR MANAGEMENT
Directors
As at 1910 March 2021,2023, AngloGold Ashanti has a unitary board comprising 9ten directors - 8eight independent non-executive directors and onetwo executive director.directors. Certain information with respect to AngloGold Ashanti’s directors is set forth below:
| Name | Age | Position | Year first appointed(1) | |||||||||||||||||
| Christine Ramon | 53 | Executive director and interim chief executive officer | 2014 | |||||||||||||||||
Maria Ramos (2) | 62 | Independent non-executive director and chairman | 2019 | |||||||||||||||||
| Kojo Busia | 58 | Independent non-executive director | 2020 | |||||||||||||||||
| Alan Ferguson | 63 | Independent non-executive director | 2018 | |||||||||||||||||
| Albert Garner | 65 | Independent non-executive director | 2015 | |||||||||||||||||
| Rhidwaan Gasant | 61 | Lead independent non-executive director | 2010 | |||||||||||||||||
| Nelisiwe Magubane | 55 | Independent non-executive director | 2020 | |||||||||||||||||
| Maria Richter | 66 | Independent non-executive director | 2015 | |||||||||||||||||
| Jochen Tilk | 57 | Independent non-executive director | 2019 | |||||||||||||||||
| Name | Age | Position | Year first appointed(1) | |||||||||||||||||
| Alberto Calderon | 63 | Executive director and Chief Executive Officer | 2021 | |||||||||||||||||
| Gillian Doran | 46 | Executive director and Chief Financial Officer | 2023 | |||||||||||||||||
| Maria Ramos | 64 | Independent non-executive director and chairperson | 2019 | |||||||||||||||||
| Rhidwaan Gasant | 63 | Lead independent non-executive director | 2010 | |||||||||||||||||
| Kojo Busia | 60 | Independent non-executive director | 2020 | |||||||||||||||||
| Alan Ferguson | 65 | Independent non-executive director | 2018 | |||||||||||||||||
| Albert Garner | 67 | Independent non-executive director | 2015 | |||||||||||||||||
| Scott Lawson | 61 | Independent non-executive director | 2021 | |||||||||||||||||
| Maria Richter | 68 | Independent non-executive director | 2015 | |||||||||||||||||
| Jochen Tilk | 59 | Independent non-executive director | 2019 | |||||||||||||||||
(1)Directors serve for a period of three years unless re-elected. At each annual general meeting, directors appointed since the previous annual general meeting are required to retire but are eligible for re-election. In addition, one-third One-third of the directors (if their number is not a multiple of three, then the number nearest to but not less than one third)one-third), must retire at each annual general meeting, according to senioritythose who have been longest in office or by lot but may be re-elected.
| Maria Ramos | ||||||||||||||
| MSc, | ||||||||||||||
| Independent Non-Executive Director and | ||||||||||||||
Appointed: 1 June 2019 and | ||||||||||||||
| Board committee memberships: | Nominations and Governance Committee | |||||||||||||
She recently served as independent non-executive director on the boards of the Public Investment Corporation (PIC) and Saudi British Bank (SABB).Bank. She also co-chaired the United Nations Secretary General’sGeneral's Task Force on Digital Financing of the Sustainable Development Goals.
Ms. Ramos has in the past served as a non-executive and independent director on the boards of Sanlam Ltd, Remgro Ltd and SABMiller PLC.Plc. She was a member of the World Economic Forum’sForum's International Business Council and member of its executive Committee for 12 yearscommittee and its chairman between 2017 and 2019.chairperson for two years.
She is a member of the Group of Thirty and serves on the International Advisory Board of the Blavatnik School of Government, Oxford University. She is a member of the Bretton Woods Committee Advisory Council.
| Rhidwaan Gasant | ||||||||
210
| BCompt (Hons), CA (SA), ACIMA, CGMA, Executive Development Programme | ||||||||
| Lead Independent Non-Executive Director | ||||||||
Appointed: 12 August 2010 | ||||||||
| Board committee memberships: | Audit and Risk Committee Remuneration and Human Resources Committee | |||||||
Nominations Committee | ||||||||
Remuneration and Human Resources Committee | ||||||||
| Social, Ethics and Sustainability Committee | ||||||||
Audit and Risk Committee Nominations Committee | ||||||||
Social, Ethics and Sustainability Committee Nominations Committee Audit and Risk Committee | ||||||||
| Kojo Busia | ||||||||
| Independent Non-Executive Director | ||||||||
Appointed: 1 August 2020 | ||||||||
| Board committee memberships: | Social, Ethics and Sustainability Committee Investment Committee Nominations and Governance Committee | |||||||
He previously served as coordinator of the African Mineral Development Centre (AMDC) at the UNECA, where he was charged with the implementation of the African Mining Vision, an African Union policy framework for sustainable mineral resources development.UNECA. Prior to heading the AMDC, Dr. Busia spent nearly a decade leading the African Peer Review Mechanism Support Section, Governance and Public Administration Division, also at the UNECA. In addition, Dr.Dr Busia has served on several advisory boards including the Responsible Mining Foundation Advisory Council, Advisory Director of Global Mining Sustainability, and Mining Indaba’s Sustainability Advisory Committee. He is a founding director of the Africa Resource Management, Environment and Climate Change (ARMECC) Institute, a think-do-tank recently established in Accra, Ghana.
Appointed: 1 October 2018 | ||||||||
| Board committee memberships: | Audit and Risk Committee (Chairperson) Remuneration and Human Resources Committee Nominations and Governance Committee | |||||||
Alan Ferguson was a former chief financial officer of a number of FTSE-listed entities, including Lonmin Plc. Since 2011 he has held non-executive directorships on a number of boards including Johnson Matthey, Croda International and Marshall Motors Holdings where he chaired their audit committees and was the Senior Independent Director. He currently serves on the board of Harbour Energy, where he chairs the audit committee. In addition, Mr. Ferguson serves as a member of the Business Policy Panel of the Institute of Chartered Accountants of Scotland and is a member of the leadership team of the UK Audit Committee Chair's Independent Forum.
| Albert Garner (67) | ||||||||
| BSE | ||||||||
| Independent Non-Executive Director | ||||||||
Appointed: 1 January 2015 | ||||||||
| Board committee memberships: | Investment Committee Remuneration and Human Resources Committee | |||||||
Albert Garner has extensive experience in capital markets, corporate finance and mergers and acquisitions having worked with Lazard Frères & Co. LLC for over 40 years in various leadership positions. He is one of the most senior bankers at Lazard,
211
currently leading their special committee practice and chairing their fairness opinion committee. He formerly led Lazard’s corporate finance practice. Mr. Garner became a general partner in 1989 and is now Vice Chair of Investment Banking.
| Maria Richter (68) | ||||||||
| BA, Juris Doctor | ||||||||
| Independent Non-Executive Director | ||||||||
Appointed: 1 January 2015 | ||||||||
| Board committee memberships: | Remuneration and Human Resources Committee (Chairperson) Nominations and Governance Committee Social, Ethics and Sustainability Committee | |||||||
Maria Richter is an experienced non-executive director who has served on a diverse range of US and international company boards. She previously served on the board of Barclays International, Barclays Bank plc and National Grid plc where she was the chairperson of the finance committee and member of the audit and nominations committees. She currently sits on the boards of Rexel Group, France, a global leader in the professional distribution of energy products and services, and Bessemer Trust, a US wealth management company, and is a member of the audit and nominations committees of Rexel and the remuneration committee of Bessemer Trust.
During Ms. Richter’s professional career she served in various positions at the former Dewey Ballantine, Prudential, Salomon Brothers Inc. and Morgan Stanley & Co.
| Scott Lawson (61) | ||||||||
| BSc, Civil Engineering, MBA | ||||||||
| BSc, MBA | ||||||||
| Independent Non-Executive Director | ||||||||
Appointed: 1 December 2021 | ||||||||
| Board committee memberships: | Investment Committee Social, Ethics and Sustainability Committee | |||||||
Scott Lawson has over 35 years in the mining industry and is an experienced global mining executive who has served in a broad range of roles. He is the former executive vice president and chief integration officer of Newmont Corporation. Prior to this Mr. Lawson served as executive vice president and chief technology officer and other executive technical roles for Newmont Corporation.
Mr. Lawson spent 22 years with Rio Tinto in executive roles with Rio Tinto Alcan, Rio Tinto Technology and Innovation and Rio Tinto Kennecott. He is the former senior vice president, engineering services at Peabody Energy responsible for global engineering and technical services support.
| Jochen Tilk (59) | ||||||||
| Bachelors in Mining Engineering, Masters in Mining Engineering | ||||||||
| Independent Non-Executive Director | ||||||||
Appointed: 1 January 2019 | ||||||||
| Board committee memberships: | Investment Committee (Chairperson) Social, Ethics and Sustainability Committee Nominations and Governance Committee Audit and Risk Committee | |||||||
Jochen Tilk is the former executive chair of Nutrien Inc., a Canadian global supplier of agricultural products and services. He is the former president and CEO of Potash Corporation. Mr. Tilk, previously spent 25 years with Inmet Mining Corporation, a Canadian-based, international metals company, with five of those years as the company’s president and chief executive officer. He is also a director of Emera Inc., a publicly listed energy utility company and the Princess Margaret Cancer Foundation, a not-for-profit organization.
212
| Alberto Calderon (63) | ||||||||
| PhD, MPhil, MA, Juris Doctor, BA | ||||||||
| Chief Executive Officer and Executive Director | ||||||||
Appointed: 1 | ||||||||
| Board committee memberships: | None | |||||||
Alberto Calderon’s executive experience includes leadership roles across the mining, petroleum, and energy sectors. He served as the chief executive officer of Orica and was also an executive at BHP Group Plc. During his time with BHP Group Plc, Mr. Calderon held a number of key leadership positions, including group executive and chief executive aluminum, nickel and corporate development, group executive and chief commercial officer.
Mr. Calderon was also CEO of Cerrejón Coal Company, an integrated thermal coal mine in Colombia, and CEO of the Colombian oil company, Ecopetrol. Prior to this, Mr. Calderon held senior leadership positions in the International Monetary Fund and the Colombian government and has been a board member of a range of private, public and non-government organisations.
| Gillian Doran (46) | ||||||||
| Fellow Member of Association of Chartered Certified Accountants (FCCA) | ||||||||
| Chief Financial Officer and Executive Director | ||||||||
Appointed: 1 January 2023 | ||||||||
| Board committee memberships: | Investment Committee | |||||||
Gillian Doran brings more than 25 years of experience in finance and commercial roles across a number of industries, predominantly natural resources and also construction and manufacturing. Prior to joining the Company, Ms. Ramon was appointed Interim Chief Executive OfficerDoran served as chief financial officer for Rio Tinto’s Global Aluminium division. Ms. Doran’s career at Rio Tinto spanned over 15 years in a number of senior finance roles within operations, regional business unit and Group headquarters. A seasoned international executive leader having previously worked and lived in Europe, North America and Australia, Ms. Doran brings to AngloGold Ashanti with effect from 1 September 2020. Prior that she served as AngloGold Ashanti’s Chief Financial Officerdeep experience in financial accounting, planning, performance management, investment, transformation and has been an executive director of the company since 1 October 2014. Ms. Ramon has held senior financial management and executive positions in various companies. She previously served as Chief Financial Officer and Executive Director of Sasol from 2006 to 2013. Prior to this, she was CEO of Johnnic Holdings, having previously served as Financial Director. She serves as a director of the World Gold Council and the International Council on Mining and Metals. She previously served on the boards of MTN Group, International Federation of Accountants, Rand Refinery, Lafarge SA (France), Transnet and Johnnic Communications.
Board movements during 20202022 and subsequent to year-end
The following changes to the board of directors took place during the period from 1 January 20202022 to 31 December 20202022 and subsequent to year-end:
•On 6 May 2020,30 June 2022, Ms. Maria Ramos became chair of the Social, Ethics and Sustainability Committee, following the retirement of Ms. Nozipho January-BardillChristine Ramon retired from the board. Effective 6 May 2020, Ms. Ramos also stepped downCompany’s Board of Directors as a member of the Investment Committee and was appointed as a member of the Remuneration and Human Resources Committee. On 6 Mayan Executive Director.
•On 10 June 2020, Mr. Jochen Tilk30 October 2022, Ms. Nelisiwe Magubane passed away. Ms. Magubane was appointed asa Non-Executive Director of the Company and a member of the Audit and Risk Committee.
•OnEffective 1 September 2020, Mr. Kelvin Dushnisky stepped downJanuary 2023, Ms. Gillian Doran joined the Company’s Board of Directors as chief executive officer (CEO). Mr. Dushnisky remained available until 28 February 2021 to assist the group with a smooth handover. Ms. Christine Ramon, previously chief financial officer (CFO), has been appointed Interim CEO, effective 1 September 2020, while the board embarks on a comprehensive recruitment process to find a new permanent CEO to deliver on the Group’s strategy for enhanced value creation. Mr. Ian Kramer, previously Senior Vice President: Group Finance, was appointed Interim CFO for the duration of the transition period, effective 1 September 2020.an Executive Director.
•On 13 October 2020, the Nominations Committee was reconstituted to include Mr. Sipho Pityana (chairman of the committee), Mr. Rhidwaan Gasant, Ms. Maria Ramos, Dr. Kojo Busia, Mr. Jochen Tilk and Mr. Alan Ferguson. Ms. Maria Richter and Mr. Albert Garner stepped down as members of the Nominations Committee, effective 13 October 2020.
•On 18 February 2021, Ms. Ramos stepped down as a member of the Remuneration and Human Resources Committee and Mr. Rhidwaan GasantScott Lawson was appointed as a member of the RemunerationAudit and Human ResourceRisk Committee, subject to shareholder approval at the 2023 AGM (scheduled for 15 May 2023).
•Mr. Rhidwaan Gasant stepped down from the Investment Committee and was appointed as a member of the Social, Ethics and Sustainability Committee.
•Ms. Gillian Doran was appointed as a member of the Investment Committee.
•Ms. Maria Ramos stepped down from the Social, Ethics and Sustainability Committee.
In terms of the company’sCompany’s Memorandum of Incorporation (MoI), one thirdone-third of the directors are required to retire at each AGM and if they are eligible and available for re-election, will be put forward for re-election by the shareholders. The board has determined that the directors to retire at the next AGM are Mr. Alan Ferguson, Ms. Christine Ramon and Mr. Jochen Tilk. Ms. Ramon and Messrs. Ferguson, Garner and TilkGasant, who are eligible and have offered themselves for re-election.
EXECUTIVE COMMITTEE
AngloGold Ashanti’s executive management team (Executive Committee or Executive Management)(the “Executive Committee”) currently comprises eight members of whom one is antwo are executive director.directors. The Executive Committee oversees the day-to-day management of the group’sGroup’s activities and is supported by country and regional management teams as well as by groupGroup corporate functions.
In addition to Christine Ramon,Mr. Alberto Calderon and Ms. Gillian Doran, the following people are members of the Executive Committee:
213
Lisa Ali (55)
BSc (Hons) in Chemistry, Analytical Chemistry, Biochemistry; Executive MBA
Chief People Officer
Lisa Ali was appointed as Chief People Officer of the Company and a member of the Executive Committee with effect from 1 April 2022. In this role, Ms. Ali is responsible for Group human resources.
Ms. Ali has over 30 years of experience, most of which has been in extractive industries. Since 2020, Ms. Ali has served as Chief People and Sustainability Officer at Newcrest Mining Limited. Prior to joining Newcrest, Ms. Ali was Head of Transformation at Trinidad Petroleum Holdings Ltd. and its subsidiary companies, and has held several senior positions at BP International PLC.
Stewart Bailey (47)(49)
Stewart Bailey’s portfolio includes stakeholder relations and the broader ambit of sustainability policy and oversight. He leads a strong team of specialists covering investor relations and communications, alongside the core sustainability disciplines, namely safety, health, environment, community and government relations, communications and securityinvestors relations, reporting and human rights. Over 11environment. Throughout 13 years with AngloGold Ashanti, based both in the US and South Africa, he has built an in-depth knowledge of the Company, its operations and its stakeholders. Mr. Bailey, was formerly Senior Vice President of Investor Relations &and Group Communications, was appointed to his current role in 2019. In his previous role, Mr. Bailey covered debt and equity investors in the US, South Africa, the UK, Europe and Asia, was a key member of the company’s team which successfully completed debt issues of more than $3 billion between 2010 and 2019, and was a member of the team that has executed acquisitions and asset sales over that period.Asia. He also held line responsibility for AngloGold Ashanti’sAshanti's corporate communications programme, which included engagement with financial news media in South Africa, the US and the UK. He is a former financial journalist with Bloomberg LP in New York and Johannesburg.
Terry Briggs (50)
Chief Development Officer
the Company and a member of the Executive Vice President - GroupCommittee with effect from 1 April 2022. His portfolio at AngloGold Ashanti includes Corporate Strategy and Business Planning, Business Development and Technicalgreenfields exploration.
Mr. Briggs has represented on various geology and the strategic technical group. He is also accountable for non-managed joint ventures, such as Kibali. He is currently leading the Obuasi Redevelopment Projectmining industry bodies and chairing Colombia’s projects leadership team. Mr. Ehm, who has multi-commodity experience, is an experienced operationsauthored several publications on engineering, geology and project manager, having held senior leadership positions with AngloGold Ashanti as EVP Australia and EVP Tanzania.exploration.
Ludwig Eybers (54)(56)
BSc, (Mining Engineering), Post graduate qualifications with Darden Business School, USA
Chief Operating Officer - International
Ludwig Eybers has over 3033 years international mining experience. He joined AngloGold Ashanti in 2011 as Senior Vice President, Namibia and Mining Task Force, based in Perth Australia. In 2013, he relocated to AngloGold Ashanti in South Africa to take-up the position of Senior Vice President, Africa Region. He was subsequently promoted to Chief Operations Officer-InternationalOfficer- International in 2017. HeMr. Eybers is currently responsible for overall strategic and operational responsibilities for production at the company’sCompany's mining operations for the International Region.operations.
Chief Technology Officer
Marcelo Godoy has over 2025 years workof experience in the mining industry and has held various senior roles in Operations, Engineering, Business Strategy and Investor Relations. In 2011, he was appointed Managing Director of Iduapriem Mine and played a key role in the turnaround of the mine’s operating performance and reduction of costs. Mr. Ntuli was promoted topreviously Senior Vice President, Africa Region in 2016Exploration at Newmont Corporation where he led the transitiondevelopment of Geita from open pit to underground operations, amongst other achievements. He was subsequently promoted to rolenumerous innovation programs, including a world-class orebody risk management system that delivered a step change in the reliability of Chief Operating Officer Africa, including South African operations in 2019.production forecasts. Mr. NtuliGodoy is also a Harvard Business School alumnus.
214
Lizelle Marwick (45)
B.Proc, LLB, LLM
Chief Legal Officer
Lizelle Marwick was appointed as Executive Vice President: General Counsel and Compliance on 1 July 2020, after previously serving as Senior Vice President: Deputy General Counsel. She joined the companyCompany in 2011 establishing and heading up the legal function for the Africa operations. She is familiar with all aspects of the organisation and well versed on multi-jurisdictional legal work covering a wide range of subjects, with extensive experience in governance, corporate transactions and government negotiations. Prior to joining AngloGold Ashanti, Ms. Marwick practiced law at Bowman Gilfillan in South Africa and Herbert Smith
in the United Kingdom. She is admitted as an attorney in South Africa and a solicitor in England and Wales and holds a B.Proc, LLB and a Master of Laws in corporate law.Wales.
Executive Committee movements during 20202022 and subsequent to year-end
The following changesmovements to the Executive Committee took place during the period from 1 January 20202022 to 31 December 20202022 and subsequent to year-end:
•Mr. Terry Briggs was appointed as Chief Development Officer of the Company and a member of the Executive Committee with effect from 1 April 2022. Mr. Briggs replaced Mr. Vaughan Chamberlain, who was appointed as Interim Chief Development Officer of the Company and an interim member of the Executive Committee with effect from 1 October 2021 until 31 March 2022.
•Ms. Maria Sanz Perez, EVP: General CounselChristine Ramon took early retirement from her role as Chief Financial Officer and Compliance and company secretary resigned,a member of the Executive Committee of the Company effective 30 June
•Mr. Ian Kramer formerly SVP:was appointed Interim Chief Financial Officer of the Company and an interim member of the Executive Committee with effect from 1 July 2022. He resumed his role as Senior Vice President: Group Finance appointed as Interim CFO, effectivewith effect from 1 September 2020.January 2023, stepping down from the Executive Committee.
•Ms. Tirelo Sibisi has given noticeGillian Doran was appointed as Chief Financial Officer and a member of her resignation, effectivethe Company's Executive Committee with effect from 1 April 2021, and her contract of employment willJanuary 2023.
MEng (Mining), BSc (Hons) (Geology), RM SME, Pr.Sci.Nat (SACNASP), FGSSA
6B. COMPENSATION
REMUNERATION AND HUMAN RESOURCES COMMITTEE
Remuneration and Human Resources Committee (Remco)(the “Remco”)
The Remco is composed of four non-executive directors. Its purpose is to discharge the responsibilities of the board relating to all compensation, including all salary and equity compensation of the company’sCompany’s executives. The Remco establishes and administers the company’sCompany’s executive remuneration and its broad objectives include;include: aligning executive remuneration with companyCompany performance and shareholder interests; setting remuneration standards aimed at attracting, motivating and retaining a competent executive team; linking individual executive pay with operational and companyCompany performance aligned to strategic objectives; and evaluating the compensation of executives including approval of salary, equity and incentive based awards.
With respect to its mandate on human resources, the committeeRemco has oversight to all strategic aspects of people development and human resource issues. The committeeRemco also considers and makes recommendations to shareholders on non-executive director’s fees.
The performance of the executive team, including the executive directors, is considered relative to the prevailing business climate and market conditions, as well as to annual evaluations of the achievement of key performance objectives. Bonuses paid to the executives are a reflection of performance of each of the executives and the companyCompany as a whole.
In 2020,2022, the committeeRemco was composed of the following members:
Members
Maria Richter
Alan Ferguson
Albert Garner (appointed effective 15 December 2020)
Rhidwaan Gasant
The meetings of the committeeRemco are attended by the Chief Executive Officer and Chief FinancialPeople Officer, and Executive Vice President: Group Human Resources, except when they are conflicted or have a personal financial interest, such as when their own remuneration or benefits are being discussed.
Remuneration policy
Our remuneration policy is designed to allow AngloGold Ashanti to compete in a global market where we strive to retain and remunerate our employees using fair, robust and appropriate remuneration and to reward our employees for their contributions. Cost management and shareholder value remain fundamental drivers of our policy.
Linking pay and performance for our executives is important and by having a large portion of executive pay defined as at-risk pay, the policy ensures that executive compensation is aligned with the overall performance of the company,Company, the regions in which it operates and its business units. The executives have an overriding focus on social sustainability including safety, and a large percentage of variable pay is directly linked to keeping our employees safe.
Total reward
When determining remuneration AngloGold Ashanti considers all elements of short-term and long-term;long-term fixed and variable pay and ensures that it is consistent with the overall strategic direction of the companyCompany and each employee’s individual performance.
For a description of share-based compensation and awards (including cash awards) see “Item“Item 6E: Share Ownership”.
Our executive directors do not receive payment of directors’ fees or committee fees.
Benchmarking
Our executive employees and non-executive director’s remuneration is evaluated against a global group of comparator companies. AngloGold Ashanti’s size and complexity as well as each individual executive’s role is reviewed against our peer group and benchmarked based on guaranteed and variable pay. Performance (Company and individual) is a key factor influencing the remuneration of the executive employees.
Our salary benchmarks are targeted at the market median of a global market in our industry. Where there is a shortage of specialist and/or key technically skilled employees, we may offer a salary that may beis higher than the benchmark salary.
Each executive’s role is individually sized to ensure the best match possible. The comparison is done for the same or similar roles irrespective of location of work (including a review of purchasing power parity between countries).work. Each component of remuneration (base salary, short-term incentives, long-term incentives
216
and employee benefits and allowances) is analysed and compared with our global peer group’s market range and the overall package is reviewed accordingly., Our new incentive scheme, the Deferred Share Plan (DSP)(the “DSP”), was implemented in January 2018. For a description of the DSP, see “Item“Item 6E: Share Ownership—AngloGold Ashanti share incentive scheme—Deferred Share Plan (DSP)”.
Retirement benefits/pension
Retirement benefits are granted to all executives. All new executives and employees receive retirement benefits under defined contribution plans. Contributions vary based on the employee’s retirement plan. See “Item 18: Financial Statements—Note 8—Employee Benefits” and“Item 18: Financial Statements—Note 10—Employee Benefits” and “Item 18: Financial Statements—Note 28—26—Provision for Pension and Post-Retirement Benefits”.
EXECUTIVE DIRECTORS'DIRECTORS’ AND EXECUTIVE MANAGEMENT REMUNERATION
For details of the share-based awards and rights to subscribe for ordinary shares in the Company granted to, and exercised by executive directors and executive management team members, see “Item 6E: Share Ownership—AngloGold Deferred Share Plan (“DSP”) and “Item 6E: Share Ownership—Participation by Executive Directors, Executive Management Team Members and Other Managers in the AngloGold Share Incentive Scheme”.
NON-EXECUTIVE DIRECTORS'DIRECTORS’ FEES AND ALLOWANCES
The fees of non-executive directors isare fixed by shareholders at the annual general meeting. In addition to their compensation, the non-executive directors receive fees for their participation on board committees and allowances for travelling internationally to attend board meetings. Non-executive directors do not receive further payments from the companyCompany and are precluded from participation in the company’sCompany’s share incentive scheme.
For amounts paid to non-executive directors in 2022, see
6C. BOARD PRACTICES
The Board of Directors
The companyCompany is governed by a unitary board of directors, the composition of which promotes the balance of authority and precludes any one director from dominating decision-making. Our board membership at year-end comprised nine directors, eight independent non-executive directors and one executive director. Subsequent to year-end, an additional executive director joined the Company’s board.
The board is supported by its committees and has delegated certain functions to these committees without abdicating any of its own responsibilities. This process of formal delegation involves approved and documented terms of reference, which are reviewed annually.
See "Item“Item 6A: Directors and Senior Management” for information about the composition of the board and directors’ term of office and year of appointment.
Appointment and rotation of directors
Several factors, including the requirements of relevant legislation, best practice recommendations, qualifications and skills of a prospective board member and the requirements of the Director’s Fit and Proper Standards of the company,Company, as well as regional demographics, are considered in appointing board members. New directors are appointed pursuant to the recommendations of the Nominations and Governance Committee, which conducts a rigorous assessment of the credentials of each candidate. Newly appointed directors are elected at the next annual general meeting following their appointment and to stand for approval by shareholders.
At the next AGM, Dr. Kojo BusiaMs. Gillian Doran will be named for election by shareholders as a director of AngloGold Ashanti.
In terms of the company’s Memorandum of Incorporation (MoI), one thirdCompany’s MoI, one-third of the directors are required to retire at each Annual General Meeting (AGM)AGM and if they are eligible and available for re-election, will be put forward for re-election by the shareholders. The board has determined that the directors to retire at the next AGM are AlanMessrs. Ferguson, Christine RamonGarner and Jochen Tilk. Ms RamonGasant, and Messrs Ferguson and Tilk arebeing eligible, andsuch directors have offered themselves for re-election.
The company’sCompany’s MoI does not set a mandatory retirement age for non-executive directors. However, in accordance with recommendations of King IV, - any independent non-executive director serving more than nine years should be subjected to a rigorous review of his or her independence and performance by the board.
217
Service contracts
Non-Executive Directors
Non-executive directors receive fees for their services as directors which are approved by shareholders at annual general meetings.AGMs. Non-executive directors do not participate in the company’sCompany’s share incentive scheme.
Non-executive directors do not hold service contracts with the company.Company.
Executive Committee
All members of the Executive Management team have permanent employment contracts which entitle them to standard group benefits as defined by their specific region and participation in the company’s Deferred Share Plan (DSP).Company’s DSP. Interim appointments (including interim CEO(interim Chief Financial Officer and interim CFO)Chief Development Officer) include an allowance aligned to the Company’s acting allowance policy to recognise the additional responsibilities associated with these roles.
South African-based executives are paid a portion of their remuneration offshore, which is detailed under a separate contract. This reflects global roles and responsibilities and takes account of offshore business requirements.
The executive contracts are reviewed annually and include a change of control provision. The change of control is subject to the following triggers:
•The acquisition of all or part of AngloGold Ashanti; or
•A number of shareholders holding less than thirty-five percent of the company’sCompany’s issued share capital consorting to gain a majority of the board and make management decisions; and
•The contracts of Executive Committeeexecutive committee members are either terminated or their role and employment conditions are curtailed.
In the event of a change of control becoming effective, thean executive will in certain circumstances be subject to both the notice period andreceive the change of control contract terms.terms at the end of the relevant notice period in line with their contractual agreement. The notice and change of control periods applied per category of executive (excluding interim appointments) as at 31 December 20202022 were as follows:
| Executive | Notice period | Change of control | ||||||
| Chief Executive Officer | 12 months | 12 months | ||||||
| Chief Financial Officer | 6 months | 6 months | ||||||
| Other Executive Management team members | 6 months | 6 months | ||||||
Key activities of the board and committees during 20202022
The activities of the board and committees during 20202022 were aimed at promoting the economic stability of the business. This entailed ensuring that its operations were conducted with due regard to the expectations and needs of stakeholders, the safety and health of employees and communities, and the development of systems to ensure proper access to and dissemination of credible information.
Board and committee meeting attendance
Directors’ attendance at board and committee meetings during 20202022 was as follows:
Board (12) | Audit and Risk | Investment | Remuneration and Human Resources | Social, Ethics and Sustainability | Nominations | NED Search (13) | Special Committee A (13) | Special Committee B (13) | |||||||||||||||||||||
| Number of meetings in 2020 | 11 | 5 | 4 | 5 | 5 | 4 | 1 | 4 | 3 | ||||||||||||||||||||
SM Pityana (1) | 11 | n/a | n/a | 5 | 5 | 3 | 1 | 4 | 2 | ||||||||||||||||||||
KOF Busia (2) | 5 | n/a | 2 | n/a | 2 | 3 | n/a | n/a | n/a | ||||||||||||||||||||
KPM Dushnisky (3) | 7 | n/a | n/a | n/a | n/a | n/a | n/a | 4 | n/a | ||||||||||||||||||||
AM Ferguson (4) | 11 | 5 | n/a | 5 | n/a | 3 | n/a | 4 | n/a | ||||||||||||||||||||
AH Garner (5) | 11 | n/a | 4 | n/a | n/a | 1 | n/a | 4 | n/a | ||||||||||||||||||||
| R Gasant | 11 | 5 | 4 | n/a | n/a | 3 | 1 | n/a | 3 | ||||||||||||||||||||
NP January-Bardill (6) | 4 | n/a | n/a | 1 | 2 | n/a | 1 | n/a | n/a | ||||||||||||||||||||
NVB Magubane (7) | 11 | n/a | 4 | n/a | 5 | n/a | n/a | n/a | n/a | ||||||||||||||||||||
| KC Ramon | 11 | n/a | 4 | n/a | n/a | n/a | n/a | n/a | n/a | ||||||||||||||||||||
MDC Ramos (8) | 11 | n/a | 1 | 4 | 5 | 3 | 1 | 4 | 3 | ||||||||||||||||||||
MC Richter (9) | 11 | 5 | n/a | 5 | n/a | 1 | n/a | n/a | n/a | ||||||||||||||||||||
RJ Ruston (10) | 4 | 2 | 1 | n/a | n/a | n/a | n/a | n/a | n/a | ||||||||||||||||||||
JE Tilk (11) | 11 | 2 | 4 | n/a | 5 | 3 | n/a | n/a | 3 | ||||||||||||||||||||
Board (3) | Audit and Risk | Investment | Remuneration and Human Resources | Social, Ethics and Sustainability | Nominations and Governance (4) | |||||||||||||||
| Number of meetings in 2022 | 9 | 7 | 7 | 9 | 5 | 7 | ||||||||||||||
| MDC Ramos | 9 | n/a | n/a | n/a | 5 | 6 | ||||||||||||||
| KOF Busia | 9 | n/a | 7 | n/a | 5 | 6 | ||||||||||||||
| A Calderon | 9 | n/a | n/a | n/a | n/a | n/a | ||||||||||||||
| AM Ferguson | 9 | 7 | n/a | 9 | n/a | 7 | ||||||||||||||
| AH Garner | 9 | n/a | 6 | 9 | n/a | n/a | ||||||||||||||
| R Gasant | 9 | 7 | 7 | 9 | n/a | 7 | ||||||||||||||
| SP Lawson | 9 | n/a | 7 | n/a | 5 | n/a | ||||||||||||||
NVB Magubane (1) | 6 | 4 | n/a | n/a | 4 | n/a | ||||||||||||||
KC Ramon (2) | 4 | n/a | 5 | n/a | n/a | n/a | ||||||||||||||
| MC Richter | 9 | 7 | n/a | 9 | n/a | 6 | ||||||||||||||
| JE Tilk | 9 | 7 | 7 | n/a | 5 | 6 | ||||||||||||||
(1) SM Pityana resigned from the board with effect from 7 December 2020.NVB Magubane passed away on 30 October 2022.
(2) KOF Busia was appointed to the board, Social, Ethics and Sustainability Committee and the Investment Committee with effect from 1 August
Audit and Risk Committee
The Audit and Risk Committee comprises fourthree (pending shareholder approval at the 2023 AGM of the appointment of two additional non-executive directors to the Audit and Risk Committee) independent non-executive directors who collectively possess the skills and knowledge to oversee and assess the strategies and processes developed and implemented by management to manage the business within a continually evolving mining environment.
The Audit and Risk Committee’s duties as required by section 94(2)94(7) of the South AfricanSA Companies Act, King IV and JSE Listing Requirements are set out in its board-approved terms of reference which is reviewed and updated annually. These duties were discharged as follows:
•reviewed the quarterly market updates and the half year results;
•confirmed the integrity of the group’sGroup’s Integrated Report, Annual Financial Statements and the Form 20-F;
•reviewed the expertise, experience and performance of the finance function and (Interim) Chief Financial Officer;
•assessed the scope and effectiveness of the systems to identify, manage and monitor financial and non-financial risks;
•reviewed the procedures for detecting, monitoring and managing the risk of fraud;
•reviewed the scope, resources, results and effectiveness of the internal audit department;
•approved the internal audit plan and subsequent changes to the approved plan;
•ensured that a combined assurance model is applied to provide a coordinated approach to all assurance activities;
•nominated the appointment of independent external auditors by the shareholders;
•reviewed and approved the terms of engagement as contained in the engagement letter of the external auditors;
•approved the remuneration of the external auditors;
•pre-approved all non-audit services in line with a revised formal policy on non-audit services;
•assessed the external auditors’ independence;
•annually considerconsidered the suitability, after assessing the information provided by the audit firm in terms of section 22.15(h) of the JSE Listings Requirements, for appointment of the audit firm and the designated individual partner;
•assessed the effectiveness of the group’sGroup’s external audit function;
•reviewed developments in reporting standards, corporate governance and best practice;
•monitored the governance of information technology (IT) and the effectiveness of the group’sGroup’s information systems; and
•reviewed the adequacy and effectiveness of the group’sGroup’s compliance function; and
Proceedings and Performance Review
The Audit and Risk Committee formally met fiveseven times in 2020.2022.
The current members of the Audit and Risk Committee are:
Audit and Risk Committee Members (1) | AM Ferguson (Chairman and independent NED) | ||||
| R Gasant | |||||
| JE Tilk (Independent NED) | |||||
| Number of meetings held from January to December | |||||
NED - Non-Executive Director
(1) The appointments of Mr Albert Garner and Mr Scott Lawson as members of the Audit and Risk Committee on 22 February 2023 is subject to shareholder approval at the annual general meeting on 15 May 2023.
The Chief Financial Officer,Officer; Senior Vice President: Finance, Executive Vice President: General Counsel and Compliance,Finance; Chief Legal Officer; Senior Vice President: Group Internal Audit; Vice President: Group Tax; Group Risk Manager; Chief Information Officer;Senior Vice President: Digital Technology; Vice President: Group Compliance Officer,Compliance; the external auditors, as well as other assurance providers regularly attend committee meetings in an ex officio capacity and provide responses to questions raised by committee members during meetings. The full Audit and Risk Committee meets separately during closed sessions with management (including the Chief Executive Officer), internal audit and external audit at every scheduled quarterly meeting.
The effectiveness of the board and its committees, including the Audit and Risk Committee, will assessis assessed at least every two years, and every alternate year there is an opportunity for consideration, reflection and discussion by the board of its effectiveness through the completionperformance and that of an independent external evaluation process, during which results were discussed, actions taken and processes put in place to address areas identified for refinement.its committees.
Remuneration and Human Resources Committee (“Remco”)
The Remuneration and Human Resources CommitteeRemco activities are governed by the Terms of Reference (these were reviewed and approved by the board in November 2020)May 2022). The purpose of the CommitteeRemco is to assist the Board in discharging its oversight responsibilities relating to all compensation, including annual base salary, annual incentive compensation, employment,
severance pay and ongoing perquisites or special benefit items and equity compensation of the Company’s executives, including the Chief Executive Officer, as well as retention strategies, design and application of material compensation programmes and share ownership guidelines.
With respect to its mandate on human resources, the CommitteeRemco has strategic oversight of matters relating to the development of the Company’s human resources with the main objective of creating a competitive human resource for the Group.
219
The CommitteeRemco operates in an independent role, operating as an overseer with accountability to the Board. This is accomplished by:
•Determining specific remuneration packages for the Executive Committee (the “ExCom”) members, and reviewing these annually. The broad framework and cost of executive remuneration shall be a matter for the Board on the recommendation and advice of the Remco;
•Reviewing and approving corporate goals and objectives relevant to the compensation of the Chief Executive Officer;ExCom members;
•Evaluating the performance of the Executive Management teamExCom (excluding executive directors) in light of these goals and objectives annually and setting compensation based on such evaluation;evaluations;
•Ensuring that the mix of fixed and variable pay, in base pay, shares and other elements of compensation for each ExCom member meets the company’sCompany’s requirements and strategic objectives;
•Linking individual pay with operationalDetermining any long-term incentive component of each ExCom member’s compensation based on awards given to such member in past years and companythe Company’s performance against set targets;
•Considering other matters relating to the remuneration of or terms of employment applicable to ExCom members that may be referred to the Remco by the Board;
•On an annual basis, or at intervals that the Remco may deem necessary, considering the results of independent research into executive remuneration trends, to assist the Remco in relation to strategic objectives;its decision-making regarding executive remuneration;
•Ensuring that all benefits, including retirement benefits and other financial arrangements are justified and correctly valued and reviewed annually;
•Considering the sentimentspayment of performance linked non-pensionable bonuses to ExCom members, and viewssetting the criteria for, and relative value of such payments;
•Satisfying itself as to the accuracy of recorded performance measures that govern the vesting of share awards and incentives;
•On an annual basis, approving the granting of share options or performance shares to qualifying employees of the company’s investors;Company;
•Regularly reviewing incentive schemes to ensure continued contribution to shareholder value and ensureensuring that these are administered in terms of the rules;rules of the relevant incentive scheme;
•OverseeAs and when required, considering proposed amendments to the establishmentrules of a remuneration policy that will promote the achievement of strategic objectivesincentive schemes and encourage individual performance.making recommendations for their approval by shareholders;
•Regularly reviewing human resources strategy aimed atReviewing the executive director’s termination payments and ensuring the supply and retention of sufficient skilled resources to achieve the company’s objectives;
•ReviewAppointing an independent remuneration advisor to provide consultation to the outcomeexecutive directors, who make recommendations to the Board and shareholders on the remuneration of non-executive directors, taking into consideration market trends on non-executive directors’ remuneration, the views and sentiments of shareholders and the financial position of the implementation of the remuneration policy to ensure that the set objectives are being achieved and fairness is addressed.Company.
The current members of the CommitteeRemco are:
| Remuneration and Human Resource Committee Members | MC Richter (Chairperson and independent NED) | ||||
| R Gasant (Independent NED) | |||||
| AM Ferguson (Independent NED) | |||||
| A Garner (Independent NED) | |||||
| Number of meetings held from January to December | |||||
| Other individuals who regularly attended meetings (attended by invitation or if needed to contribute pertinent insights and information) | A Calderon (CEO) | ||||
KC Ramon | |||||
| A Sidat representing | |||||
| CM van Dyk (Remuneration and Benefits | |||||
Remuneration Consultants
When appropriate, the Remuneration and Human Resources CommitteeRemco obtains advice from independent remuneration consultants. These consultants are employed directly by the Remuneration and Human Resources CommitteeRemco and engage directly with them to ensure independence.
Mercer performs an independent bespoke executive survey and its advice is primarily around salary benchmarking for both executive and non-executive pay.
6D. EMPLOYEES
The average number of attributable employees (including contractors) in the AngloGold Ashanti groupGroup over the last three financial years was:
| 2020 | 2019 | 2018 | |||||||||||||||
| Africa | 16,829 | 15,786 | 14,833 | ||||||||||||||
| Australia | 1,230 | 1,140 | 1,051 | ||||||||||||||
| Americas | 8,789 | 8,114 | 7,973 | ||||||||||||||
| Other, including corporate and non-gold producing subsidiaries | 1,807 | 1,353 | 1,589 | ||||||||||||||
South Africa - discontinued operations (1) | 8,297 | 7,870 | 18,803 | ||||||||||||||
| Total* | 36,952 | 34,263 | 44,249 | ||||||||||||||
| 2022 | 2021 | 2020 | |||||||||||||||
| Africa | 19,807 | 17,260 | 16,829 | ||||||||||||||
| Australia | 1,532 | 1,332 | 1,230 | ||||||||||||||
| Americas | 9,498 | 9,972 | 8,789 | ||||||||||||||
| Other, including corporate and non-gold producing subsidiaries | 1,757 | 1,997 | 1,807 | ||||||||||||||
South Africa - discontinued operations (1) | — | — | 8,297 | ||||||||||||||
| Total* | 32,594 | 30,561 | 36,952 | ||||||||||||||
* The number of contractors employed on average during 20202022 was 16,222.18,599.
(1) In 2020, represents the monthly average number of employees for the nine months as a discontinued operationoperations before completion of sale on 30 September 2020.
Labour relations and collective bargaining
The AngloGold Ashanti approach to employee relations is predicated on a relationship-based model. We workstrive to establish constructive relations with our employees and their union representatives.representatives based on our Company values and our determination to embed interest-based collective bargaining. Working closely with our site,sites we are also at the forefront of ensuring that we comply with local legislation as well as with ourand regulatory obligations. Our
A global Employee Relations Standard governs employee and labour relations. The standard enables an approach to employee relations that is based on effective mechanisms for communication and participation, through direct and thoughtful engagement with employees, and where applicable, their representatives, such as trade unions.
Employees at most of our operations are unionised except those in Australia, Colombia and the United States. Although these employees are highlynot unionised, the Company ensures sound employee relations through compliance with labour legislation in these countries, fair company policies and the needprocedures and promoting healthy relationships through effective line management practices. The right to freedom of association and collective bargaining is not at risk at any of our operations.
Where our employees are unionised, we seek to build and maintain positive relations iswith representative unions as part of our overall stakeholder management philosophy. The table below shows the percentage of unionised employees covered by collective bargaining agreements by country:
| Employees covered by collective bargaining agreements | |||||
| Argentina | 90 percent | ||||
| Brazil | 100 percent | ||||
| Ghana | 86 percent | ||||
| Guinea | 94 percent | ||||
| Tanzania | 86 percent | ||||
No wage agreements in Africa were due or made during the reporting period. Biannual collective bargaining and negotiations are expected to commence towards the second quarter of 2023.
In Africa, -there were no labour relations remained stable acrossincidents which resulted in stopping of operations in 2022, with the region.
In Brazil, all three collective agreements (Nova Lima/Sabará, Santa Bárbara and Crixás) were signed with the unions and implemented effective 1 August 2020. A new routine2022. The country has experienced a higher inflation rate of 10.12 percent (Aug/21 – Jul/22) mostly generated by the political uncertainty and expectations around the Presidential campaign and the October electoral process. Despite this context, there was no operational impact or attempt to continuously strengthen the relationship with the employees and their representatives was key to that achievement.strike, unlike in 2021.
In Argentina, CVSA in Argentina, completed the 2020 salariesannual salary negotiation, in January 2021aligned with country inflation, with a final increase of 45.2%100.2 percent for 2020 effective until12 months (May 22 to April 2021. Prior to this in July 2020 an adjustment23). The percentage of 20% (included infulfilment of the final percentage)2022 objectives was also agreed and it was with retroactive effect from April 2020.the unions.
Full time employees receive a number of Contentsbenefits not afforded to contractor employees. These include retirement, accommodation for selective employees, production and safety related bonus schemes, and reasonable and fair conditions of services in addition to resultant benefits emanating from collective bargaining.
The minimum notice period regarding operational changes varies from country to country. The Company does, however, comply with all relevant legislation.
6E. SHARE OWNERSHIP
DIRECTORS’ AND PRESCRIBED OFFICERS’ INTERESTS IN ORDINARY SHARES
The interests of directors and prescribed officers in the ordinary shares of the companyCompany at 31 December 2020,2022, which individually did not exceed one percent of the company’sCompany’s issued ordinary share capital are included in the annual financial statements,statements; see "Item“Item 18: Financial Statements—Note 33-Related Parties-Directors’31—Related Parties—Directors’ and Prescribed Officers’ interests in AngloGold Ashanti shares"shares”.
A register detailing Directors and Prescribed Officers’ interests in contracts is available for inspection at the company’sCompany’s registered and corporate office. See "Item “Item 10H: Documents on Display"Display”.
CHANGE IN DIRECTOR’SDIRECTORS’ AND PRESCRIBED OFFICER’SOFFICERS’ INTERESTS IN ANGLOGOLD ASHANTI SHARES SINCE 31 DECEMBER 20202022
Refer "Itemto “Item 18: Note 33 - 31—Related Parties - Parties—Directors’ and Prescribed Officers’ interests in AngloGold Ashanti shares"
SHARE OWNERSHIP OF EXECUTIVE OFFICERS/EXECUTIVE MANAGEMENT
To the best of its knowledge, AngloGold Ashanti believes that its ordinary shares held by executive officers, in aggregate, do not exceed one percent of the company'sCompany’s issued ordinary share capital.
MINIMUM SHAREHOLDING REQUIREMENT FOR EXECUTIVESEXECUTIVE MANAGEMENT
With effect from March 2013, a minimum shareholding requirement (MSR) was introduced for the executive management team (including executive directors). All executive management team members (including executive directors) are required to have a minimum shareholding in the Company as per the table below.
The MSR was increased for executive directors and the executive management team as follows,extended to include a 12-month post-termination holding, effective 1 January 2020:
| Role | Within three years of appointment/from introduction of MSR (1 January 2020) | Within six years of appointment/from introduction of MSR (1 January 2020) | Holding requirement | 12-month Post-Termination Holding (1 January 2022) | |||||||||||||||||||
| CEO | 150% of net annual base salary | 300% of net annual base salary | |||||||||||||||||||||
| CFO | 125% of net annual base salary | 250% of net annual base salary | |||||||||||||||||||||
| Executive Management Team | 100% of net annual base salary | 200% of net base salary | |||||||||||||||||||||
The following count towards an individual MSR: •Shares purchased on the market, either directly or indirectly •Vested shares from AngloGold Accumulation of the post-termination holding commences on 1 January 2022, Executives have five years from introduction or appointment to accumulate holding. | |||||||||||||||||||||||
222
The table below summarises each executive director and executive committee member'smember’s accomplishment of the MSR:
| Executive | Executive | Six-year target achievement date | MSR holding as at 31 December 2020 as a percentage of net base pay | Three-year MSR target achievement percentage | Six-year MSR target achievement percentage | Executive | Six-year target achievement date | MSR holding as at 31 December 2022 as a percentage of net base pay | Three-year MSR target achievement percentage | Six-year MSR target achievement percentage | ||||||||||||||||||
| Executive directors | Executive directors | Executive directors | ||||||||||||||||||||||||||
KPM Dushnisky (1) | – | 141 | 150 | 300 | ||||||||||||||||||||||||
| KC Ramon | March 2021 | 553 | 125 | 250 | ||||||||||||||||||||||||
| A Calderon | A Calderon | September 2027 | 38% | 150% | 300% | |||||||||||||||||||||||
| Prescribed officers | Prescribed officers | Prescribed officers | ||||||||||||||||||||||||||
L Ali (1) | L Ali (1) | April 2028 | 56% | 100% | 200% | |||||||||||||||||||||||
| SD Bailey | SD Bailey | January 2025 | 115 | 100 | 200 | SD Bailey | January 2025 | 298% | 100% | 200% | ||||||||||||||||||
PD Chenard (2) | – | 119 | 100 | 200 | ||||||||||||||||||||||||
| GJ Ehm | March 2019 | 279 | 100 | 200 | ||||||||||||||||||||||||
TJ Briggs (1) | TJ Briggs (1) | April 2028 | 0% | 100% | 200% | |||||||||||||||||||||||
| L Eybers | L Eybers | March 2023 | 291 | 100 | 200 | L Eybers | March 2023 | 491% | 100% | 200% | ||||||||||||||||||
| MC Godoy | MC Godoy | October 2027 | 206% | 100% | 200% | |||||||||||||||||||||||
I Kramer | I Kramer | September 2026 | 27 | 100 | 200 | I Kramer | July 2028 | 4% | 100% | 200% | ||||||||||||||||||
L Marwick | L Marwick | July 2026 | 78 | 100 | 200 | L Marwick | July 2026 | 144% | 100% | 200% | ||||||||||||||||||
| S Ntuli | March 2025 | 95 | 100 | 200 | ||||||||||||||||||||||||
| TR Sibisi | March 2022 | 282 | 100 | 200 | ||||||||||||||||||||||||
(1) Appointed prescribed officer with effect from 1 April 2022 and the 3-year MSR achievement is due in April 2025 | ||||||||||||||
(2) Appointed prescribed officer with effect from 1 July 2022 to 31 December 2022. The MSR holding is not required subsequent to the appointment period. | ||||||||||||||
MINIMUM SHAREHOLDING REQUIREMENT FOR NON-EXECUTIVE DIRECTORS (“NEDs”)
During February 2022, the board approved an MSR for NEDs. In terms of the policy, NEDs are required to acquire and hold an MSR in AngloGold Ashanti shares, equivalent to 150 percent of their annual base fee within four years of the effective date of the policy for existing NEDs and from the effective date of appointment for new NEDs.
| Four-year target achievement date | MSR holding as at 31 December 2022 as a percentage of annual base fee | Two-year MSR target achievement percentage | Four-year MSR target achievement percentage | |||||||||||
| Non-Executive Directors | ||||||||||||||
| MDC Ramos (Chairperson) | February 2026 | 0% | 75% | 150% | ||||||||||
| R Gasant (Lead independent director) | February 2026 | 0% | 75% | 150% | ||||||||||
| KOF Busia | February 2026 | 36% | 75% | 150% | ||||||||||
| AM Ferguson | February 2026 | 90% | 75% | 150% | ||||||||||
| AH Garner | February 2026 | 404% | 75% | 150% | ||||||||||
| SP Lawson | February 2026 | 51% | 75% | 150% | ||||||||||
| MC Richter | February 2026 | 203% | 75% | 150% | ||||||||||
| JE Tilk | February 2026 | 50% | 75% | 150% | ||||||||||
ANGLOGOLD DEFERRED SHARE PLAN (DSP)
On 16 May 2017, the shareholders approved the introduction of the Deferred Share Plan (DSP), to commenceDSP. The DSP became effective 1 January 2018. The DSP replaced all previous AGA incentive schemes, i.e. Bonus Share Plan (BSP), Long Term Incentive Scheme (LTIP)2018 and the Co-Investment Plan (CIP) schemes. The last allocations granted in the BSP, LTIP and CIP schemes have vested during 2020; there are no further allocations and vesting as the schemes have been closed. The DSP,was designed with feedback from shareholders in mind, aims to better align the interests of companyCompany management with those of shareholders by among others rewarding decision-making that promotes the long termlong-term health of the business by increasing the maximum vesting period of shares from two to five years, and introducing a claw-back provision;provision, reducing the impact of uncontrollable factors, like gold price and currency fluctuations, in determining remuneration;remuneration, providing better incentive for prudent, value-adding capital allocation;allocation, capping the number of shares that can be issued under the DSP in any given year to 1%one percent of total shares in issue;issue, and providing greater incentives for excellence in the broad area of sustainability, which covers the safety, environmental, health, governance, community relations and human capital disciplines.
The scope of participation forin the DSP includeincludes Executive Directors, members of the Executive Committee and senior management employees of the companyCompany and its subsidiaries. These participants are allocated units with the opportunity to acquire shares in the company. The intention of the incentive scheme is to ensure that the mediummedium- to long termlong-term interests of the executives and senior management employees are aligned with the shareholders’ interests, providing rewards to the executives and senior management employees and wealth creation opportunities to the shareholders when the strategic performance drivers are achieved. All share awards which remain unexercised by the tenth-year anniversary from the date of grant, automatically lapse for no value.
Non-Executive Directors are not eligible to participate in the DSP.
223
DSP awards are payable in cash and where applicable (depending on stratum level), the balance will be delivered in one of two compensation components, either deferred cash or deferred shares, vesting equally over a period of two to five years. For each member of the Executive Management Team, the deferred portion is paid entirely in deferred shares vesting over a five-year period. Deferred shares have a right to receive dividend equivalents during the deferral period.
The total incentive is determined based on a combination of Company and individual performance measures, which are defined annually with weightings applied to each measure. Each metric is weighted and has a threshold, target and stretch definitionachievement level related to the companyCompany budget and the desired stretch targets for the year. Below thresholdBelow-threshold achievement results in no payment. At the end of each financial year, the CompanyCompany’s and the CEO CFO and EVP/COO’sCFO's performance is assessed by the Remco and the Boardboard and the performance of the other members of the executive management team is assessed by the Remco against the defined metrics to determine the quantum of the cash portion and the quantum of the deferred portion as a percentage of base salary as follows based on on-target achievement:
| Cash | Shares | Total Incentive | Cash | Shares | Total Incentive | |||||||||||||||||
| Level | Level | On Target Achievement | Level | On-Target Achievement | ||||||||||||||||||
| CEO | CEO | 100.00% | 200.00% | 300.00% % % | CEO | 100.00% | 200.00% | 300.00% % % | ||||||||||||||
| CFO | CFO | 85.00% % | 185.00% % | 270.00% % % | CFO | 85.00% % | 185.00% % | 270.00% % % | ||||||||||||||
| EVP/COO | 75.00% % | 174.00% % | 249.00% % % | |||||||||||||||||||
| Executive Management Team | Executive Management Team | 75.00% % | 174.00% % | 249.00% % % | ||||||||||||||||||
CEO means Chief Executive Officer.
CFO means Chief Financial Officer.
The graphs below illustrate the threshold, on-target and stretch for the DSP scheme and performance measure weightings (Company and individual) as a percentage of base salary:
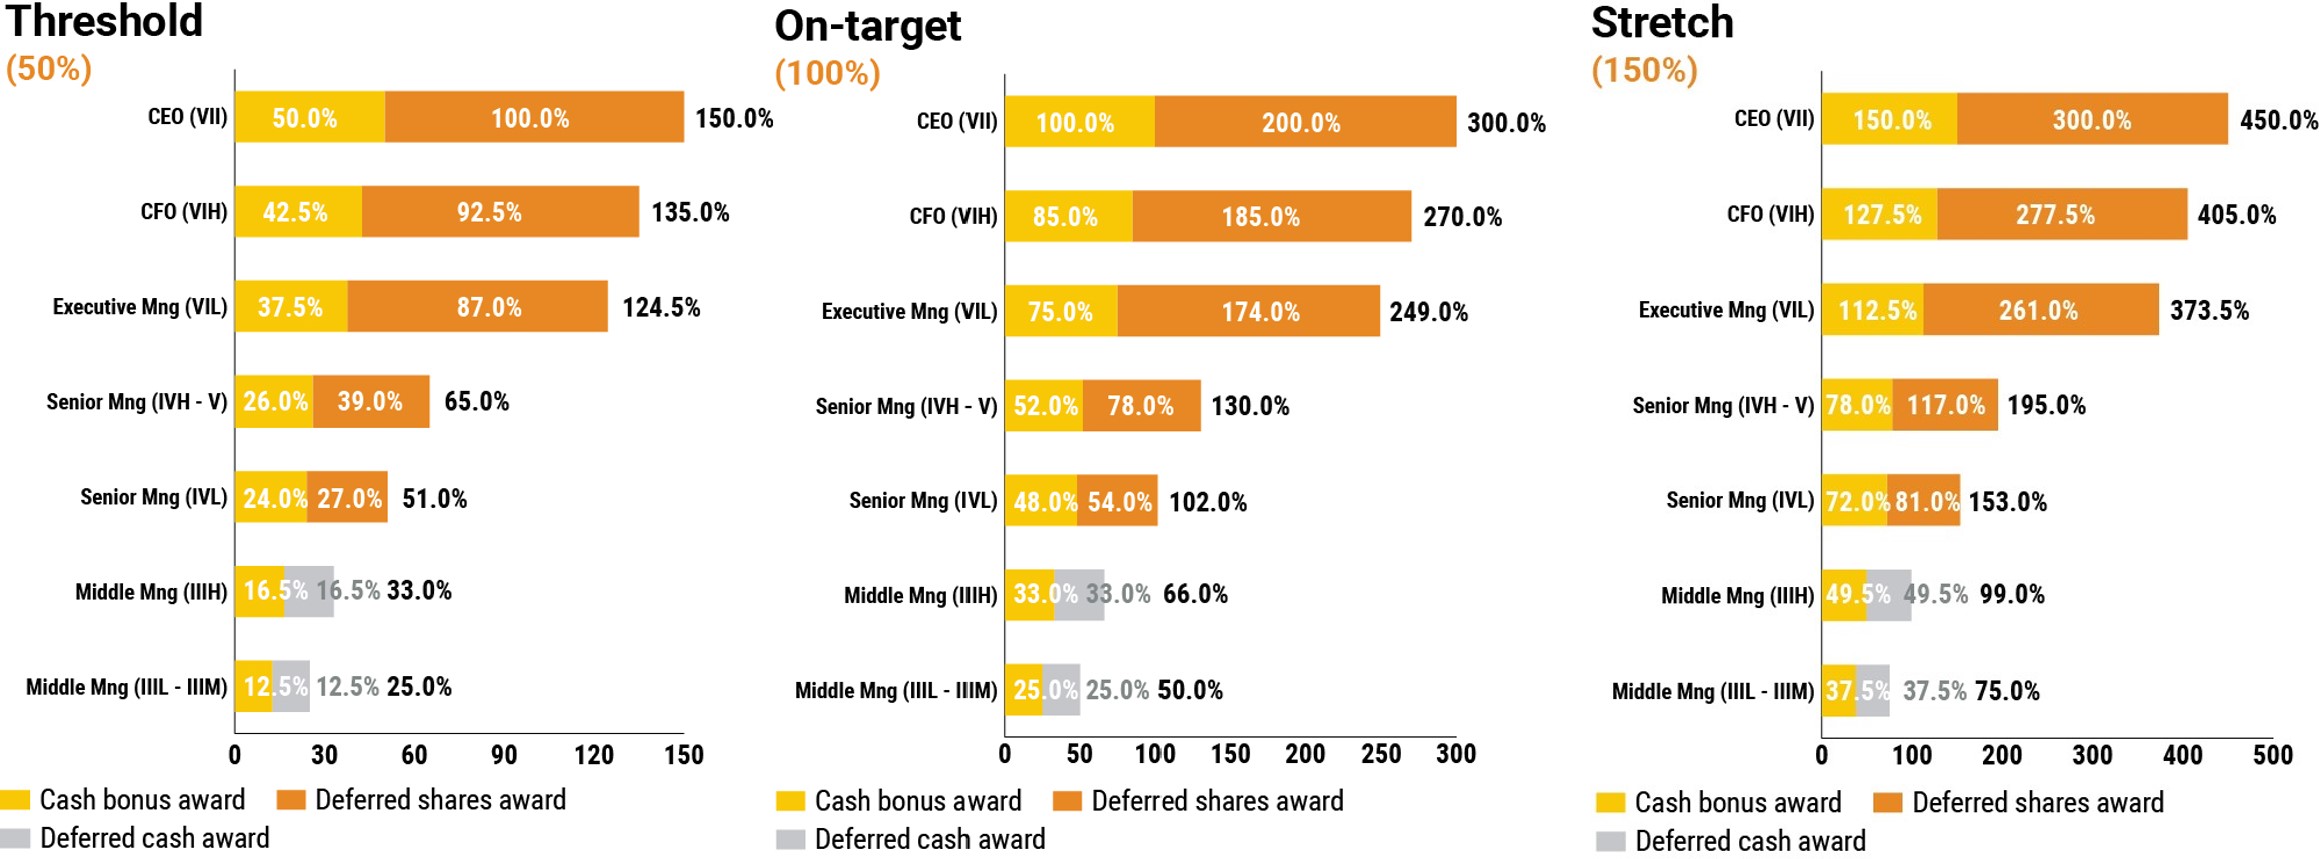
One set of performance metrics is used to determine the cash portion and deferred portion. Future vesting of the deferred portion is subject to continued employment. Effective 1 January 2020, all Executive Committeeemployment with the exception of the ExCom members including the CEO and CFOwho have streamlined strategic objectives (KPIs), between 3 to 4 at a maximum, as compared to the previous 10 KPI’s as held by the CEO.post-termination vesting for good-leavers. Individual KPI’s nowKPIs account for 20%20 percent of the performance scorecard in the DSP incentive scheme and 80% towards the company scorecard. This was previously 30%/70%Company performance accounts for the CEOremaining 80 percent. Company metrics are relative total shareholder return, absolute total shareholder return, normalized cash return on equity, production, all-in sustaining costs, total cash costs, mineral reserve additions pre-depletion, mineral resource additions pre-depletion, safety, health, environment and 40%/60% for CFOcommunity metrics and Exco members.people metrics.
Company and individual performance measures are assessed over each financial year, with the exception of certain companyCompany measures that are measured over a trailing three-year basis. The first allocation under the DSP was made in February 2019 in respect of the 2018 performance year. For further information about the DSP, see “Exhibit 19.4.1.3.19.4.1.3”.
The DSP was amended and restated by the board of directors on 20 February 2023 to reflect our current practice by adding flexibility to grant sign-on awards to new employees of AngloGold Ashanti and to compensate them for incentive awards that they have forfeited from their previous employer.
224
The Committee approved the 2022 DSP metrics Company performance achievement of 94.86 percent. This was an important year for the Company and the following results, among others, demonstrate re-alignment of the strategic priorities and focused delivery.
Key highlights include:
•Incorporating a diverse new executive team and making significant changes at the senior vice president and critical skills level in the areas of Supply, Projects, Digital Technology and Operations
•Achieving an unprecedented safety performance which positions the Company well below the industry average in key metrics and demonstrates significant progress in resetting the safety culture
•Surpassing the production budget for the first time since 2017 and delivering Obuasi targets
•Reducing real cash costs which were less than one percent above the top end of guidance, rising by six percent year on year, which was roughly half the inflation rate experienced for the Company’s basket of goods and services
•Consolidating Nevada as a multi-decade, cost-competitive new growth project
The table below summarises AngloGold Ashanti’s remuneration metrics, their weightings, and performance against these metrics applicable to the DSP during 2022:
| DSP performance measure | Weighting | Threshold measures | Target measures | Stretch measures | 2022 achievement % | |||||||||||||||
| Financial measures | Relative total shareholder return (measured in US$) | 12.50% | Median TSR of comparators | Halfway between median and upper quartile | Upper quartile TSR of comparators | 0.00% | ||||||||||||||
| Absolute total shareholder return (measured in US$) | 7.50% | USD COE (6%) | USD COE + 2% (8%) | USD COE + 6% (12%) | 11.25% | |||||||||||||||
| Normalised cash return on equity (nCROE) | 15.00% | USD COE (6%) | USD COE + 9% (15%) | USD COE + 18% (24%) | 22.50% | |||||||||||||||
| Production | 15.00% | 2,550 oz (000) | 2,734 oz (000) | 2,837 oz (000) | 15.60% | |||||||||||||||
| Total cash cost | 10.00% | $1,015 / oz | $963 / oz | $915 / oz | 0.00% | |||||||||||||||
| All-in sustaining costs | 5.00% | $1,425 / oz | $1,355 / oz | $1,285 / oz | 4.00% | |||||||||||||||
| Future optionality | Mineral Reserve additions (pre-depletion, asset sales, mergers and acquisitions) | 5.50% | Plus 1.6 Moz | Plus 3.2 Moz | Plus 4.8 Moz | 5.98% | ||||||||||||||
| Mineral Resources (pre-depletion, asset sales, mergers and acquisitions) | 5.50% | Plus 4.2 Moz | Plus 8.3 Moz | Plus 12.5 Moz | 4.10% | |||||||||||||||
| Safety | All injury frequency rate (AIFR) – one year | 8.00% | ≥2.5% performance improvement (2.07) | ≥5% performance improvement (2.01) | ≥7.5% performance improvement (1.96) | 11.24% | ||||||||||||||
| Major hazard control compliance | 95% critical control compliance | 99% critical control compliance | 99.5% critical control compliance | |||||||||||||||||
| Health, Environmental and Community | Health (2.5%): Reduction in workforce exposed to high respirable crystalline silica dust | 12.00% | 4% reduction | 7% reduction | 13% reduction | 17.33% | ||||||||||||||
Environment (7.5%): Greenhouse gas emissions management | 110% of budgeted carbon emission intensity (37.91) | 100% of budgeted carbon emission intensity (34.46) | 95% of budgeted carbon emission intensity (32.74) | |||||||||||||||||
Community (2%): Business disruptions as a result of community unrest | 2 | 1 | 0 | |||||||||||||||||
| People | Gender diversity | 4.00% | 21% female representation | 23% female representation | 25% female representation | 2.86% | ||||||||||||||
| Key staff retention | 85% pa | 90% pa | 95% pa | |||||||||||||||||
| Total | 100% | 94.86% | ||||||||||||||||||
Relative TSR measures the Company’s share price performance compared to the peer group on a relative basis. It is measured on a three-year trailing average. A total of seven peers (Agnico Eagle Ltd, Barrick Gold Corp, Gold ETF, Gold Fields Ltd, Kinross Gold Corp, Newcrest Mining Ltd and Newmont Mining Corp) are measured and numerically ranked; the positioning of AngloGold Ashanti in the ranking determines the bonus achievement.
Based on the criteria below for 2022, AngloGold Ashanti was ranked seventh and was therefore positioned below the median at a growth percentage of 13.00 percent; therefore, the achievement was calculated at below threshold (0 percent).
225
Criteria table for relative TSR
| Threshold achievement (50%) | 33.93% | Median | ||||||
| Target achievement (100%) | 49.05% | Halfway between median and upper quartile | ||||||
| Stretch achievements (150%) | 64.17% | Upper quartile | ||||||
Absolute TSR measures the Company’s share price performance on a three-year trailing average and compares it to a percentage increase relating to US cost of equity (US COE). The stretch target is achieved if US COE plus 6 percent is exceeded based on this calculation. Currently the US COE is 6 percent, resulting in the stretch target being 12 percent.
Criteria table for absolute TSR
| Threshold achievement (50%) | US cost of equity (COE) | 6.00% | ||||||
| Target achievement (100%) | COE + 2% | 8.00% | ||||||
| Stretch achievements (150%) | COE + 6% | 12.00% | ||||||
The Company’s growth percentage of 13.00 percent places them above the US COE plus 6 percent (12 percent); therefore, the achievement is on stretch (11.25 percent). Refer to the TSR ranking table above.
Additional details regarding the award outcomes for the CEO and CFO under the DSP for 2022 are provided below.
226
CEO: Key Objectives and Achievements for 2022:
| Scorecard | Weighting | Comments | ||||||
Health, safety, environment and community •Safety – 12.5% •Health, environment and community – 12.5% •Results aligned to Company DSP outcome | 25% | AngloGold Ashanti’s safety performance improved year-on-year •Total recordable injury frequency rate improved 41% to a record 1.26 in 2022 – less than half the 2021 ICMM member average of 2.90 •Lost-time injury frequency rate fell 40% to 0.65 year-on-year •Visible leadership on Major Hazard Critical Controls programme •Set new Scope 1 and 2 greenhouse gas reduction targets for 2030, including detailed programme of projects and capital estimates | ||||||
Financial and production •Achievement of budget production oz’s and cash cost / oz •Significantly advance Project Full Potential: Identify the full potential of 5-6 operations and the measures to close the gap during following 24 months •Build major projects for the company’s long- term future inclusive of significant progress made on: ▪Obuasi – 5% ▪Colombia project – 5% ▪Nevada project – 5% •Support the move of major capital projects through development phases | 55% | Exceeded budgeted production for first time since 2017. Achieved real cash cost reduction of 6% in volatile, inflationary environment, closing the gap vs. peer group, where costs increased above inflation: •Improvement projects helped offset significant exogenous factors, including flooding in Brazil and Covid impact on labour in Australia •Siguiri management intervention helped exceed planned production amid challenging operating conditions •Obuasi production met market expectations Initiated Full Asset Potential Programme: •Six sites underwent FP programme; potential cost reductions identified •Workbooks in place to realise efficiencies over c.24 months Growth Projects: •Quebradona Optimised Feasibility Study progressed; Environmental Impact assessment is in progress •North Bullfrog feasibility study expected now in first half of 2023; Feasibility study for Silicon rescheduled to include Merlin and other orebodies | ||||||
Individual KPIs •Embed Operating Model changes •Effective stakeholder management through: | 20% | •Implemented new Operating Model; achieved planned personnel efficiencies in corporate functions and business units, with commensurate cost benefits | ||||||
▪Good corporate governance and risk management | Corporate governance - simplified Delegation of Authority framework and implemented review of Group policies and standards | |||||||
▪Effective relationships with shareholders and investors | •Worked to develop relationship with shareholders and analysts through industry conferences, roadshows and roundtable meetings. Improved market understanding of overall strategy and Full Asset Potential process, aided by engagement during results reporting and set-piece engagements | |||||||
▪Good relations with governments in operating countries | •Government relations strengthened - increased personal interactions with key officials, including high-level meetings with governments of Ghana and Tanzania to strengthen relationships and discuss issues of mutual interest | |||||||
▪Effective regular communication with board, executive committee, operations, projects and employees | •Employee townhalls, site visits and visible leadership on mental wellbeing and sexual harassment prevention campaigns. Culture survey results and subsequent workshops and feedback sessions have effectively boosted employee morale and engagement | |||||||
•Implemented an integrated new ExCom and significant changes at senior management level to ensure robust capability to deliver the business plan | ||||||||
•Global implementation of the anti-discrimination and sexual harassment standards | ||||||||
| Total | 100% | |||||||
| CEO: Performance incentive outcome 2022 | ||||||||
| 2022 DSP performance outcome | Weighting | DSP award outcome | ||||||
| Financial performance targets | ||||||||
| Relative total shareholder return | 12.50% | 0.00% | ||||||
| Absolute total shareholder return | 7.50% | 11.25% | ||||||
| Normalised cash return on equity (nCROE) | 15.00% | 22.50% | ||||||
| Production | 15.00% | 15.60% | ||||||
| Total Cash Costs | 10.00% | 0.00% | ||||||
| All-in sustaining costs | 5.00% | 4.00% | ||||||
| Mineral Reserve pre-depletion | 5.50% | 5.98% | ||||||
| Mineral Resource additions pre-depletion | 5.50% | 4.10% | ||||||
| Safety | 8.00% | 11.24% | ||||||
| Health, Environment and Community | 12.00% | 17.33% | ||||||
| Core value: People | 4.00% | 2.86% | ||||||
| Total % for Company performance: | 100.0% | 94.86% | ||||||
| . | ||||||||
227
| Organisational performance weighting: | 80.00% | |||||||
| = | ||||||||
| A - Organisational performance weighted outcome: | 75.89% | |||||||
| Individual performance results | ||||||||
| Actual individual targets and strategic objectives are not disclosed in order to maintain commercial confidentiality in competitive markets | ||||||||
| Individual performance weighting: | 20.00% | |||||||
| X | ||||||||
| Performance rating award correlation: | 150.00% | |||||||
| = | ||||||||
| B - DSP opportunity based on individual performance: | 30.00% | |||||||
| Total % of DSP pay opportunity (A+B) | 105.89% | |||||||
| x | ||||||||
| On-target total cash bonus opportunity (as % of base pay) | 100.00% | |||||||
| On-target total deferred share award opportunity (as % of base pay) | 200.00% | |||||||
| = | ||||||||
| Final cash bonus result (as % of base pay) | 105.89% | |||||||
| Final deferred share result (as % of base pay) | 211.78% | |||||||
| Base pay as at 31 December 2022 (all offshore payments converted to ZAR at exchange rate of ZAR16.3655: USD1) | x | |||||||
| 26,184,800 | ||||||||
| = | ||||||||
| Annual cash portion of DSP: | 27,726,561 | |||||||
| Annual deferred share portion of DSP (to vest over five years): | 55,453,122 | |||||||
| Total 2022 deferred share plan award: | 83,179,683 | |||||||
CFO: Key Objectives and Achievements for 2022:
| Scorecard | Weighting | Comments | ||||||
| Leadership and stakeholder engagement | 5% | •Maintained effective relationships with equity and debt investors, banks, ratings agencies, auditors and joint venture partners •Continued to provide input at relevant stakeholders’ forums on financial, tax and regulatory matters | ||||||
| Liquidity, credit ratings and balance sheet management | 15% | •Refinanced $1.4bn multi-currency RCF by mid-June 2022 at favourable terms, for a five-year tenure with two one-year extensions •Proactively engaged the ratings agencies on the Company’s strategy, operational performance, and cost initiatives. AngloGold Ashanti’s credit ratings were maintained by all three credit ratings agencies | ||||||
| Cost discipline and cash preservation measures | 50% | •Production and cost guidance remained on track for the year in the first half of 2022 •Maintained focus on optimising corporate costs, as well as non-essential expenditure •Proactively managed supply chain risks across the business amidst challenging market conditions resulting from COVID-19-related impacts and the Russia/Ukraine war | ||||||
•Adequate levels of consumables and spares (3-6 months) have been maintained across the operations to maintain business continuity. Targeted supply chain savings remained on track despite inflationary pressures due to stocking and pricing strategies and ensured that the full asset potential programme was adequately supported | ||||||||
| Governance and risk management | 15% | •Ensured that a strong culture of compliance and consistency of accounting practices prevailed through regular interaction with business units •Ensured a strong focus on the Tanzanian tax matters and that there is appropriate disclosure of all tax exposures •Assessed oil hedging at various intervals earlier in the year | ||||||
| Implementation of the Operating Model | 15% | •The approved Operating Model structures for the Finance and Supply functions were embedded well before the end of June 2022; appropriate transition plans developed identified risks •Ensured that the business process optimisation initiatives had been progressed and that projects have been put in place to address the recommendations | ||||||
| Total | 100% | |||||||
228
| CEO: Performance incentive outcome 2022 | ||||||||
| 2022 DSP performance outcome | Weighting | DSP award outcome | ||||||
| Financial performance targets | ||||||||
| Relative total shareholder return | 12.50% | 0.00% | ||||||
| Absolute total shareholder return | 7.50% | 11.25% | ||||||
| Normalised cash return on equity (nCROE) | 15.00% | 22.50% | ||||||
| Production | 15.00% | 15.60% | ||||||
| Total Cash Costs | 10.00% | 0.00% | ||||||
| All-in sustaining costs | 5.00% | 4.00% | ||||||
| Mineral Reserve pre-depletion | 5.50% | 5.98% | ||||||
| Mineral Resource additions pre-depletion | 5.50% | 4.10% | ||||||
| Safety | 8.00% | 11.24% | ||||||
| Health, Environment and Community | 12.00% | 17.33% | ||||||
| Core value: People | 4.00% | 2.86% | ||||||
| Total % for Company performance: | 100.0% | 94.86% | ||||||
| Organisational performance weighting: | 80.00% | |||||||
| = | ||||||||
| A - Organisational performance weighted outcome: | 75.89% | |||||||
| Individual performance results | ||||||||
| Actual individual targets and strategic objectives are not disclosed in order to maintain commercial confidentiality in competitive markets | ||||||||
| Individual performance weighting: | 20.00% | |||||||
| X | ||||||||
| Performance rating award correlation: | 112.50% | |||||||
| = | ||||||||
| B - DSP opportunity based on individual performance: | 22.50% | |||||||
| Total % of DSP pay opportunity (A+B) | 98.39% | |||||||
| x | ||||||||
| On-target total cash bonus opportunity (as % of base pay) | 85.00% | |||||||
| On-target total deferred share award opportunity (as % of base pay) | 185.00% | |||||||
| = | ||||||||
| Final cash bonus result (as % of base pay) | 83.63% | |||||||
| Final deferred share result (as % of base pay) | 0.00%(1) | |||||||
| Base pay for six months as at 30 June 2022 (all offshore payments converted to ZAR at exchange rate of ZAR16.3655: USD1) | x | |||||||
| 5,441,578 | ||||||||
| = | ||||||||
| Annual cash portion of DSP: | 4,550,781 | |||||||
| Annual deferred share portion of DSP (to vest over five years): | — | |||||||
| Total 2022 deferred share plan award: | 4,550,781 | |||||||
(1) Deferred share award was not payable because of the CFO’s termination of service.
PARTICIPATION BY EXECUTIVE DIRECTORS, EXECUTIVE MANAGEMENT TEAM MEMBERS AND OTHER MANAGERS IN THE ANGLOGOLD SHARE INCENTIVE SCHEME
For details of the share-based awards and rights to subscribe for ordinary shares in each companythe Company granted to, and exercised by, executive directors, executive management team members and other managers on an aggregate basis during the year to 31 December 20202022 and subsequent to year end up to 1910 March 2021,2023, see "Item“Item 18: Financial Statements-Note 33-Related Parties-DirectorsStatements—Note 31—Related Parties—Directors and other key management personnel"personnel”.
PARTICIPATION BY EMPLOYEES IN THE ANGLOGOLD SHARE INCENTIVE SCHEME
For details of the share-based awards and rights to subscribe for ordinary shares in the companyCompany granted to, and exercised by, employees on an aggregate basis during the year to 31 December 2020,2022, see "Item “Item 18: Financial Statements—Note 11—Share—based payments"9—Share- Based Payments”.
ITEM 7: MAJOR SHAREHOLDERS AND RELATED PARTY TRANSACTIONS
Overview
Description of AngloGold Ashanti’s share capital
AngloGold Ashanti’s share capital consists of four classesone class of stock:
•Ordinary shares, par value 25 South African cents each (the “ordinary shares”);
The authorised and issued share capital of AngloGold at 31 December 20202022 is set out below:
| Title of class | Authorised | Issued | ||||||||||||
| Ordinary shares | 600,000,000 | 416,890,087 | ||||||||||||
| A preference shares | 2,000,000 | 2,000,000 | ||||||||||||
| B preference shares | 5,000,000 | 778,896 | ||||||||||||
| C preference shares | 30,000,000 | 0 | ||||||||||||
Title of class (1) | Authorised | Issued | ||||||||||||
| Ordinary shares | 600,000,000 | 418,600,473 | ||||||||||||
(1) During December 2021, the A and B redeemable preference shares were redeemed and the preference share certificates cancelled. All redeemable preference shares were removed from the authorised share capital at the AGM held on 16 May 2022.
All the issued ordinary shares, A redeemable preference shares and B redeemable preference shares are fully paid and are not subject to further calls or assessment by AngloGold Ashanti. For a discussion of rights attaching to the ordinary shares, the A redeemable preference shares, the B redeemable preference shares and the C redeemable preference shares, see “Item 10B: Memorandum of Incorporation”.
The following are the movements in the ordinary issued share capital at 31 December:
Ordinary shares
| Number of Shares | Rand | Number of Shares | Rand | Number of Shares | Rand | |||||||||||||||||||||||||||||||||
| 2020 | 2019 | 2018 | ||||||||||||||||||||||||||||||||||||
| At 1 January | 415,301,215 | 103,825,307 | 412,769,980 | 103,192,498 | 410,054,615 | 102,513,654 | ||||||||||||||||||||||||||||||||
| Issued during the year: | ||||||||||||||||||||||||||||||||||||||
| Exercise of options by participants in the AngloGold Share Incentive Scheme | 1,588,872 | 397,218 | 2,531,235 | 632,809 | 2,715,365 | 678,844 | ||||||||||||||||||||||||||||||||
| 31 December 2020 | 416,890,087 | 104,222,525 | 415,301,215 | 103,825,307 | 412,769,980 | 103,192,498 | ||||||||||||||||||||||||||||||||
| Number of Shares | Rand | Number of Shares | Rand | Number of Shares | Rand | ||||||||||||||||||||||||||||||||||||
| 2022 | 2021 | 2020 | |||||||||||||||||||||||||||||||||||||||
| At 1 January | 417,501,452 | 104,375,363 | 416,890,087 | 104,222,522 | 415,301,215 | 103,825,304 | |||||||||||||||||||||||||||||||||||
| Issued during the year: | |||||||||||||||||||||||||||||||||||||||||
| Exercise of options by participants in the AngloGold Share Incentive Scheme | 1,099,021 | 274,755 | 611,365 | 152,841 | 1,588,872 | 397,218 | |||||||||||||||||||||||||||||||||||
| 31 December | 418,600,473 | 104,650,118 | 417,501,452 | 104,375,363 | 416,890,087 | 104,222,522 | |||||||||||||||||||||||||||||||||||
During the period from 1 January 20212023 to and including 1910 March 2021, 351,6742023, 246,930 ordinary shares were issued at an average issue price of R231.06R270.27 per share, resulting in 417,241,761418,847,403 ordinary shares being in issue at 1910 March 2021.2023.
230
7A. MAJOR SHAREHOLDERS
According to information available to the directors, the following are the only shareholders or their associates holding, directly or indirectly, in excess of five percent of the ordinary issued share capital of the company:
| Ordinary shares held at | 31 December 2020 | 31 December 2019 | 31 December 2018 | |||||||||||||||||||||||||||||||||||
| Shareholder* | Number of Shares | Percent Voting Rights | Number of Shares | Percent Voting Rights | Number of Shares | Percent Voting Rights | ||||||||||||||||||||||||||||||||
| Public Investment Corp. of South Africa | 39,846,637 | 9.56 | 30,439,075 | 7.33 | 25,395,823 | 6.15 | ||||||||||||||||||||||||||||||||
| BlackRock Inc. | 27,956,084 | 6.71 | 41,236,154 | 9.93 | 32,926,713 | 7.98 | ||||||||||||||||||||||||||||||||
| Van Eck Global | 26,488,311 | 6.35 | 27,375,511 | 6.59 | 52,402,004 | 12.70 | ||||||||||||||||||||||||||||||||
| Ordinary shares held at | 31 December 2022 | 31 December 2021 | 31 December 2020 | |||||||||||||||||||||||||||||||||||
| Shareholder* | Number of Shares | Percent Voting Rights | Number of Shares | Percent Voting Rights | Number of Shares | Percent Voting Rights | ||||||||||||||||||||||||||||||||
| Public Investment Corporation of South Africa | 51,477,205 | 12.30 | 44,332,506 | 10.62 | 39,846,637 | 9.56 | ||||||||||||||||||||||||||||||||
| BlackRock Inc. | 29,536,274 | 7.06 | 27,155,066 | 6.50 | 27,956,084 | 6.71 | ||||||||||||||||||||||||||||||||
| Van Eck Associates Corporation | 23,602,172 | 5.64 | n/a | n/a | 26,488,311 | 6.35 | ||||||||||||||||||||||||||||||||
| Coronation Holdings | n/a | n/a | 37,322,250 | 8.94 | n/a | n/a | ||||||||||||||||||||||||||||||||
* Shares may not necessarily reflect the beneficial shareholder.
At 31 December 2020,2022, a total of 145,927,871125,736,908 shares (or 3530 percent of issued ordinary share capital) were held by The Bank of New York Mellon, as Depositary for the company’sCompany’s American Depositary Receipt programme. Each American Depositary Share (ADS) is equivalent to one ordinary share. At 31 December 2020,2022, the number of persons who were registered holders of ADSs was reported at 2,095.1,928. AngloGold Ashanti is aware that many ADSs are held of record by brokers and other nominees, and accordingly the above numbers are not necessarily representative of the actual number of persons who are beneficial holders of ADSs or the number of ADSs beneficially held by these persons.
All ordinary shareholders have the same voting rights.
As at 31 December 2020,2022, there were 23,043 25,543holders on record of AngloGold Ashanti ordinary shares. Of these holders 498478 had registered addresses in the United States and held a total of 67,474,889179,898,324 ordinary shares, 16.18or 42.98 percent of the total outstanding ordinary shares. In addition, certain accounts on record with registered addresses outside the United States, including The Bank of New York Mellon, hold AngloGold Ashanti ordinary shares, in whole or in part, beneficially for United States persons.
At 1910 March 2021,2023, a total of 148,623,301124,073,857 ADSs or 3629.62 percent of total issued ordinary share capital were issued and outstanding and held on record by 2,0721,914 registered holders.
Insofar as is known to AngloGold Ashanti, there was no person who, directly or indirectly, jointly or severally, exercised or could exercise control over AngloGold Ashanti, nor is AngloGold Ashanti aware of any arrangements which might result in a change in control of AngloGold Ashanti.
231
7B. RELATED PARTY TRANSACTIONS
The Company had the following transactions with related parties during the year ended 31 December:
| Purchases from related party | |||||
| (in million) | $ | ||||
| Purchases of goods and services from related parties | |||||
| Rand Refinery (Pty) Limited | |||||
services rendered to related parties | ||||||
Amounts due byto joint ventures and associates arising from purchases of goods and services are unsecured and non-interest bearing.
As at 31 December 2020 the outstanding balances arising from the sale of goods and services due by associates and joint ventures is $11 million.
232
7C. INTERESTS OF EXPERTS AND COUNSEL
Not applicable.
233
ITEM 8: FINANCIAL INFORMATION
234
8A. CONSOLIDATED FINANCIAL STATEMENTS AND OTHER FINANCIAL INFORMATION
See “Item“Item 18: Financial Statements”.
235
LEGAL PROCEEDINGS
There is no material proceeding in which a director, officer or affiliate of AngloGold Ashanti is either a party adverse or has a material interest adverse to the company.Company.
In addition to the proceedings described below, the companyCompany becomes involved, from time to time, in various claims, legal proceedings and complaints incidental to the ordinary course of its business.
TAX MATTERS
•The State of Minas Gerais v. Mineração Serra Grande S.A. (MSG): In Brazil, MSG received a tax assessment in October 2003 from the State of Minas Gerais related to VAT on gold bullion transfers. The tax administrators rejected MSG’s appeal against the assessment.assessment, which amounted to approximately $9.6 million. MSG is now appealingappealed the dismissal of the case to the State Court of Minas Gerais. The assessment is approximately $9 million. Any possible payment by MSG would be set off by an indemnity from Kinross Gold Corporation (Kinross) of $6$5 million provided for as part of the company’s acquisition of Kinross’ interest in MSG in 2012. The matter is currently pending in the State Court of Minas Gerais.
•Brazilian tax authorities v. AngloGold Ashanti Córrego do Sítio Mineração SA:SA and Mineração Serra Grande S.A. (MSG): AngloGold Ashanti’s subsidiaries in Brazil, including AGA Mineração (formerly AngloGold Ashanti Brasil Minera��Mineração Ltda) and MSG, are involved in various disputes with the Brazilian tax authorities. These disputes date back toas far as 2007 and involve federal tax assessments including income tax, royalties, social contributions, VAT and annual property tax. Various new claims, relating to VAT on diesel and consumables, for $12 million were assessed by management during the second half of 2020 and classified as possible claims, based on external legal opinions. Collectively, the total possible amount involved across all tax disputes in Brazil is approximately $42$46.5 million, which include VAT claims and social security payments of $36 million.
•Colombian Tax Office (DIAN) v. AngloGold Ashanti Colombia S.A.S.A.S. (AGAC) and Gramalote Colombia Limited (Gramalote): In JanuarySince 2013, AGAC received noticevarious notices from the DIAN that it disagreed with the company’s tax treatment of certain itemsexploration expenditure in theits 2010, 2011, 2013 and 20112014 income tax returns and its 2011 equity tax returns. On 23 October 2013,return. However, AGAC received the official assessments from the DIAN which established that an estimated additional tax of $19 million will be payable if the tax returns are amended. Penalties and interest for the additional taxes may amount to $115 million. The company believes that the DIAN has applied the tax legislation incorrectly. AGACincorrectly and subsequently challenged the DIAN’s ruling by filingfiled lawsuits in March and April 2015, before the Administrative Court of Cundinamarca (the trial court for tax litigation). Closing arguments on challenging each of the DIAN’s rulings in respect of those tax disputes were presented in February and June 2017. On 23 Aprilreturns. In 2018, the Administrative Court of Cundinamarca denied AGAC’s arguments with respect to the 2010 and 2011 income tax litigation. AGAC subsequently appealed this judgementthese judgments to the Supreme CourtCouncil of Colombia. A final judgement could take several years. A determination byState of Colombia (the highest court for tax matters). In November and December 2022, the Administrative Court withCouncil of State ruled against AGAC upon appeal. The Council of State ordered AGAC to pay $34 million of additional taxes (which includes interest) in respect toof the 2010 incomeand 2011 tax litigation is still pending.
returns, but it fully waived any related penalties (which were originally assessed in the amount of $47 million). In January 2018,December 2022, a tax reform was adopted in Colombia, enacting changes which may lead to a reduction of interest charged on outstanding tax obligations in certain circumstances. In February 2023, AGAC received notice frompaid $25 million of additional taxes (which includes interest) in respect of the DIAN that it also disagreed with AGAC’s 20132011 income and equity tax returns, onafter taking into account a reduction of $6 million in interest under the same basis astax reform. Following this payment, the 2011 tax litigation was fully settled. AGAC is still awaiting the final decision under the new tax reform in respect of the 2010 tax litigation. AGAC’s other lawsuits with respect to its 2013 and 20112014 tax returns calculating additional tax, along with penalties and interest, of $9 million. On 13 March 2020, AGAC filed a lawsuitare still pending before the Administrative Court of Cundinamarca challengingand the DIAN’s 2013 assessment. The matter is currently pending. In May 2019, AGAC received notice from the DIAN that it also disagreed with AGAC’s 2014 income and equity tax returns on the same basis as the 2010, 2011 and 2013 returns, calculating additional tax, along with penalties and interest,company has disclosed a contingent liability of $7 million.$5.0 million in respect thereof (mainly covering related penalties).
The total amount claimed by the DIAN, related to the above tax matters amountsthat remain outstanding amounted to $162$8.1 million of which $143$8.0 million relatesrelated to penalties and interest.as of 31 December 2022. Following a judgment of the Council of State in July 2019 holding that duplicate penalties may not be charged, the company expects that certain penalties will likely be waived, reducing the overall exposure to $0.1 million in respect of those tax matters. In addition, from 2017 onwards, the deduction of exploration costs is prohibited following a change in Colombian tax legislation. As a result, exploration costs have been treated in accordance with the amended tax legislation subsequent to that date.
•Argentina Tax Authority (AFIP) v. Cerro Vanguardia S.A. (CVSA): On 12In July 2013, CVSA received a notification from the AFIP requesting corrections to the 2007, 2008 and 2009 income tax returns of about $1.3$0.9 million relating to the non-deduction of tax losses previously claimed on hedge contracts. The AFIP is of the view that the financial derivatives could not be considered as hedge contracts, as hedge contract losses could only be offset against gains derived from the same kind of hedging contracts. Penalties and interest on the disputed amounts are estimated at a further $6.6$4.2 million. CVSA and AFIP have corresponded on this issue over the past several years, and the Argentinian tax authorities continue to assert
their position regarding the use of the financial derivatives. CVSA filed an appeal with the Tax Court on 19in June 2015, and the parties submitted their final reports in July 2017. The matter is pending with the Tax Court.
236
•Ghanaian tax authorities v. AngloGold Ashanti (Ghana) Limited (AGAG): withholding tax audits: In Ghana, AGAG received a final tax assessmentsaudit report from the Ghana Revenue Authority (GRA) in which the GRA demanded payment of $11.1$9.0 million as of 31 December 2020 in respect of the 2004-2014 tax years, following an audit by the Ghanaian tax authorities related to withholding taxes on payments to non-resident persons. AGAG raised objectionsobjected to the GRA’s assessment of withholding taxes on the basis that AGAG was duly exempted by the government of Ghana from withholding taxes on payments made to non-residents during the relevant periods in terms of the Deed of Warranty signed with the Ghanaian tax authorities and believes that the withholding taxes were not properly assessed. On several occasions, most recently ingovernment of Ghana. In 2017, AGAG met with the Commissioner-General of the Ghana Revenue AuthorityGRA and provided its position in writing together with the relevant supporting documentation.documents. AGAG has not yet to receivereceived a response from the Commissioner-General. Due to the statute of limitations applicable to tax assessments in Ghana, the amount of the tax uncertainty is estimated at $6.0 million as at 31 December 2022.
COLOMBIA
•Santa María-Montecristo and La Colosa class action lawsuits: Class action lawsuits have been filed in relation to each of AngloGold Ashanti Colombia S.A.S.A.S.’s (AGAC) Santa María-Montecristo and La Colosa projects. Each of the two lawsuits aims to stop exploration and mining in certain restricted areas affected by the projects due to environmental concerns.
The consolidated La Colosa class action lawsuit originally consisted of four separate class actions. In relation to this project, on 10in October 2016, Tolima’s Administrative Court ordered that a technical study be prepared by a panel of seven experts (selected by the plaintiff, AGAC, universities, the Colombian government and an NGO) to determine whether the La Colosa project presents a “threat” to the environment during its exploration phase. On 4In December 2017, Ibagué’s Third Administrative Court ordered that another technical study, similar to the one described in the October 2016 order, be prepared for the La Colosa project. AGAC appealed both orders. On 6In September 2018, Tolima’s Administrative Court consolidated all class actions in relation to the La Colosa project into one single class action lawsuit which is currently pending before the Council of State. The orders to prepare the technical studies have been temporarily suspended pending resolution by the Council of State. If AGAC’s appeal before the Council of State is not successful, the companyCompany may have to perform one or more technical studies in relation to the La Colosa project. If the studies were to conclude that a “threat” exists, certain development activities at the La Colosa project may be suspended.
Further, while the plaintiffs in the La Colosa class action have petitioned the courts to cancel the mining concession contract,contracts, the companyCompany believes that the judiciary system in Colombia does not have the authority to order such cancellation. Such power, by law, vests solely in the Colombian government which, through the relevant Colombian mining authorities, has the discretion to declare concessions void if a concession holder breaches applicable environmental laws or regulations. The Colombian government, as the authority granting the mining concession contracts, is also a defendant in this class action lawsuit together with AGAC. AGAC continues to oppose, through a variety of integrated legal and political strategies, the class action lawsuit that was filed against it. However, if the plaintiffs prevail and AGAC is unable to perform its core concession contracts as a result of the judicial decision, the companyCompany would be required to abandon the project.
•Cortolima’s injunction against AngloGold Ashanti Colombia S.A.S.A.S. (AGAC): In March 2013, Cortolima, a regional environmental authority in the Tolima department, issued a regulatory injunction against AGAC alleging, among other things, that in relation to certain of AGAC’s La Colosa mine design-related activities in the municipality of Piedras, AGAC engaged in drilling and other activities that could have negative effects on the environment. The injunction did not include any allegation that AGAC’s actions actually caused any environmental damages in Piedras. AGAC’s challenge of the injunction was unsuccessful before Cortolima. In August 2013, AGAC initiated legal proceedings before the Council of State of Colombia (the highest court for administrative matters) seeking annulment of the injunction as well as restoration of its rights to continue its activities in the area. In November 2019, the Council of State ruled that the competent judicial authority to decide on this matter is the Administrative Court of Tolima and referred the case to that court. On 30In July 2020, the Twelfth Administrative Court of Tolima ruled that since the injunction is a preliminary and temporary measure imposed as part of the administrative approval process within Cortolima and not a final decision, it is not yet amenable to administrative judicial review. AGAC subsequently appealedIn July 2021, this decision. Thedecision was reversed on appeal is currently pending beforeby the Administrative Superior
Court of Tolima.Tolima in a ruling that such injunctions are amenable to administrative judicial review. The companyappellate court ordered the Twelfth Administrative Court of Tolima to review the matter and issue a decision thereon. Consequently, the Twelfth Administrative Court of Tolima admitted the case and a first hearing was held on 21 April 2022. Trial evidence was accepted. On 25 October 2022, another hearing was held to gather testimonies. The case remains pending. The Company expects that a final resolution of this
237
matter will include payment of a penalty by AGAC in an amount that is not expected to be material. While the injunction remains in place, AGAC is not able to engage in certain of its activities related to the La Colosa project.
•Piedras and Cajamarca popular consultations: In 2013, the local council of the city of Piedras, near the La Colosa project, organised a popular consultation to ban all mining activities in Piedras (Piedras popular consultation), the result of which was validated by the Administrative Court of Tolima as part of an administrative procedure. Although the Piedras popular consultation did not have an immediate impact on the La Colosa project (due to its distant location from the project), AGAC believes the Piedras popular consultation was in violation of national law in Colombia. In 2013, AGAC filed a ‘tutela’ action (a legal action alleging a violation of AGAC’s constitutional rights) with the Council of State of Colombia (the highest court for administrative issues). In 2014, AGAC’s ‘tutela’ action was dismissed by the Council of State for lack of standing on the grounds that AGAC did not have mining tenements in Piedras. In addition, in 2015, AGAC filed a request for annulment of the administrative acts adopted by the local authorities in furtherance of the results of the Piedras popular consultation, which was rejected by the Second Administrative Court of Ibagué. AGAC’s appeal ofAGAC subsequently appealed this ruling is currently pending beforeruling. In July 2021, AGAC was notified that the Administrative Superior Court of Tolima which will have to decideruled on this matterappeal that, in light of the recent ruling2018 decision of the Constitutional Court onof Colombia (the highest court for constitutional issues) holding that local municipalities or regions are not entitled to veto mining activities through popular consultations (as further described below.below), the results of the Piedras popular consultation, and the administrative acts adopted in furtherance thereof, were not enforceable. An extraordinary appeal against this ruling was submitted on 22 March 2022, which is pending. In addition, in September 2021, a third party filed a ‘tutela’ action with the Council of State arguing that the Administrative Superior Court of Tolima did not have the authority to determine that the results of the Piedras popular consultation, and the administrative acts adopted in furtherance thereof, were not enforceable. In December 2021, the Council of State dismissed this ‘tutela’ action for lack of standing.
In March 2017, the residents of the municipality of Cajamarca also voted in a popular consultation to disapprove mining projects in the municipality, including the La Colosa project (Cajamarca popular consultation). However, the Mining Minister of Colombia subsequently publicly confirmed that Cajamarca’s vote does not apply retroactively implying the Cajamarca popular consultation did not have an immediate impact on AGAC’s rights with respect to the La Colosa project. In April 2017, AGAC nevertheless suspended all exploration activities at the La Colosa project until there is more certainty about mining activity in Colombia. On 11In October 2018, the Colombian Constitutional Court issued ruling SU-095-2018 stating that local municipalities or regions were not entitled to veto mining activities through popular consultations. The Constitutional Court also ordered the national legislative body, the Congress of Colombia, to enact a law within two years to ensure that local communities and groups are adequately consulted in the approval of mining activities in accordance with specific criteria set out in its ruling. Subsequently, a group of citizens submitted an annulment claim before the Administrative Court of Cundinamarca to cancel AGA’sAGAC’s mining contract in Cajamarca on the grounds of the results of the Cajamarca popular consultation. TheAfter having admitted the annulment claim was admitted on 11in December 2019, the Administrative Court of Cundinamarca dismissed the plaintiffs’ claim in May 2021 on procedural grounds. The plaintiffs subsequently appealed this decision and the appeal is currently pending before Cundinamarca’s Administrative Court which will have to decide on this matter in lightthe Council of the abovementioned ruling of the Constitutional Court.State.
•La Colosa Human Rights Litigation: In November 2014, the Personero (Ombudsman) of Ibagué, the capital of the Tolima department, filed a petition against the Colombian government before the Inter-American Commission on Human Rights (Commission), based in Washington, D.C., for alleged human rights violations protected by the American Convention on Human Rights (Convention) which has been ratified by Colombia along with many other Central and South American countries. The Commission has the power to refer a case to the Inter-American Court of Human Rights (Court) which is an autonomous judicial institution based in San José, Costa Rica whose purpose is the application and interpretation of the Convention. The petition alleges that the Colombian government denied justice to the Personero as a result of the failure of the Colombian judiciary to resolve the issues raised in two class actions filed by him before the local Colombian administrative courts within a reasonable period of time. Although AGAC is not a party to the suit, its outcome is nevertheless important to the development of the La Colosa project. The Commission currently has not accepted nor referred the case to the Court. If the case would be accepted or referred in the future, the Colombian government will have to defend itself against the lawsuit and will be bound by the findings of the Court. AGAC continues to regularly follow up with the Colombian government for updates.
•Paramo Delimitation: In November 2016, the Colombian government issued Resolution 19871987/2016 delineating certain wetlands or moorlands as environmentally important protected areas, which designation includes certain areas in and around the La Colosa project. In these areas there are limitations, or in some instances outright bans, on mining and mining-related activities. These limitations and bans could potentially adversely impact the design, operations and production of the mining project at the La Colosa project. On 12In June 2017, AGAC filed suit against the Colombian Ministry of the Environment in the Administrative Court of Cundinamarca to annul Resolution 19871987/2016 on technical and other grounds. The lawsuit was admitted on 30in April 2019. The Ministry of the Environment, as defendant in this action, is expected to file its response to the annulment claim.
•Zonte Metals: A Canadian junior mining company, Zonte Metals, filed applications for title to certain corridors, or small slivers of land, overlaying sections of the Gramalote project. The Secretary of Mines of Antioquia, the department in which the Gramalote project is located, denied the applications filed by Zonte Metals. However, Zonte Metals then filed a claim against the Colombian National Mining Agency (ANM) and the Antioquia Secretary of Mines before the Council of State of Colombia, by which it seeks to (i) revoke the resolution that denied its application and (ii) obtain the rights over the corridors requested in its application. The Council of State subsequently enjoined the Antioquia Secretary of Mines and Gramalote Colombia Limited (Gramalote) from progressing a pending application to integrate the disputed corridors with Gramalote’s tenement. The Antioquia Secretary of Mines has filed its response to the Zonte Metals claim, which includes arguments
238
aligned with the interests and position of Gramalote. On 4In September 2017, the Council of State approved Gramalote’s request to be made an interested party to the lawsuit, but it rejected Gramalote’s request to join the Antioquia Secretary of Mines as a co-defendant on 28in August 2019. On 24In January 2019, the Council of State also re-affirmed that the Council of State is the competent judicial authority to hear the matter. The date for the first hearing is currently pending.
GHANA
•Pompora Treatment Plant Litigation: On 2In April 2013, AngloGold Ashanti (Ghana) Limited (AGAG) received a summons from Abdul Waliyu and 152 others in which the plaintiffs allege that they were or are residents of the Obuasi municipality or its suburbs and that their health has been adversely affected by emissions and/or other environmental impacts arising in connection with the current and/or historical operations of the Pompora Treatment Plant (PTP), which was decommissioned in 2000. The plaintiffs’ alleged injuries include respiratory infections, skin diseases and certain cancers. The plaintiffs subsequently did not timely file their application for directions but AGAG intends to allow some time to pass prior to applying to have the matter dismissed for want of prosecution. On 24in time. In February 2014, executive members of the PTP (AGAG) Smoke Effect Association (PASEA), sued AGAG by themselves and on behalf of their members (undisclosed number) on grounds similar to those discussed above, as well as economic hardships resulting from the failure of their crops. This matter has been adjourned indefinitely. As plaintiffs in these matters have not actively pursued these legal proceedings, AGAG intends to allow some time to pass prior to applyingis taking steps to have the matter struck outthese matters dismissed for want of prosecution.
•Ghana Mining Licenses Litigation: In January 2019, AGAG and AngloGold Ashanti (Iduapriem) Limited (AAIL), along with other Ghanaian mining companies, were served with writs by two members of the Ghanaian Parliament seeking to invoke the jurisdiction of the Ghanaian Supreme Court (highest court in Ghana) for a declaration that the mining companies were not entitled to carry out any exploitation of minerals otherwise allowed under their relevant mining leases unless the leases had been timely ratified by the Parliament of Ghana. On 19In January 2019, the Ghanaian Attorney General filed its statement of case, agreeing with the position of the plaintiffs (that the mining leases required parliamentary ratification) and requesting that the Supreme Court order the mining companies to pay the Ghanaian government all revenue related to mining activities accrued during the time such mining leases were unratified. On 18In April 2019, AGAG and AAIL, in coordination with the other mining companies, filed their statement of case. The Supreme Court has not yet set a date for the first hearing to commence the case.
GUINEA
•Government of Guinea (National Claim Commission) v. Société AngloGold Ashanti Goldfields de Guinée SA (SAG): A national claim recovery commission established by the government of Guinea has demanded that SAG pay $43 million in dividends and penalties that would allegedly have been owed to the government of Guinea for the accounting years 2004 - 2007. SAG opposes the claim. Even though both parties had originally decided to submit their dispute to an independent audit firm to be appointed by a common accord, the independent audit firm was never appointed. In December 2010, the national claim recovery commission was disbanded and the matter was turned over to the Inspector General of the Ministry of Finance of Guinea. This matter has been dormant since it was handed over to the Inspector General.
TANZANIA
•Geita Gold Mining Limited (GGM): In January 2007, Jackson Manyelo and other plaintiffs filed a suit against GGM in the Mwanza High Court alleging that they were affected by blasting activities in the Katoma area carried out by GGM and had suffered damages in the amount of TZS9.6 billion (approximately $6 million). On 30In April 2015, the High Court issued a judgementjudgment in favour of GGM. In 2016, plaintiffs appealed to the Court of Appeal, where the matter is pending.
•Geita Gold Mining Limited (GGM) and Samax Resources Limited (Samax) v. Government of Tanzania: On 13In July 2017, GGM and Samax filed a notice of arbitration against the government of Tanzania arising from the enactment by the government of certain legislation that purports to make a number of changes to the operating environment of Tanzania’s extractive industries, including mining. The notice of arbitration was submitted in accordance with Article 12 of the Agreement for the Development of a Gold Mine at Geita, Mwanza between the government of Tanzania and each of GGM and Samax (the MDA), and under the 1976 Arbitration Rules of the United Nations Commission on International Trade Law
(UNCITRAL). The Arbitral Tribunal has been duly constituted. Since January 2019, at the request of the parties, the arbitral proceedings have been stayed several times in order to afford the parties the opportunity to achieve an amicable resolution of the dispute and as a result of the impact of the COVID-19 pandemic. Recently, on 5In October 2020,2022, the Tribunal granted another extensionparties agreed to stay the arbitration proceedings until 12 March 2021 on the basis that the parties were making progress with negotiations after COVID-19 restrictions were eased. The extension should be considered final unless new circumstances justifyfor a further extension. On 15 March 2021, and due to continuing COVID-19 issues in sub-Saharan Africa, GGM and Samax requested a further extension to stay the proceedings. This request is pending with the Tribunal.period of 12 months until 6 November 2023.
•Arbitration under the United Kingdom-Tanzania Bilateral Investment Treaty (UK-Tanzania BIT): Unrelated to the arbitration proceedings under the MDA described above, on 4in September 2017, GGM and Samax, together with Cluff Oil Limited and Cluff Mineral Exploration Limited, notified the government of Tanzania in writing that the Tanzanian government’s conduct amounted to a breach of its commitments under the UK-Tanzania BIT. This notice triggered a ‘cooling-off’ period under the UK-Tanzania BIT, pursuant to which the parties had six months to achieve an amicable resolution to their dispute. Following the expiry of the ‘cooling off’ period on 4in March 2018, GGM, Samax, Cluff Oil Limited and Cluff Mineral Exploration Limited are now entitled to submit their dispute with the government of Tanzania to ICSID arbitration in accordance with the terms of the UK-Tanzania BIT to the extent that they may deem this necessary.
239
BRAZIL
•Public Civil Action between Mineração Serra Grande S.A. (MSG) and the Goiás State Public Prosecutor's Office (Prosecutor): On 28In August 2019, the Prosecutor filed a public civil action against MSG in the local court of Crixás (Court) arguing that the Serra Grande tailings dam should be deactivated and decommissioned due to its size and upstream construction method. The Prosecutor requested the Court to grant an injunction ordering MSG to, inter alia, completely deactivate the tailings dam by 15 September 2021 and decommission the tailings dam, including complete removal of tailings material, by 15 September 2022. Further, the Prosecutor requested that a daily penalty of approximately $245,000 be imposed for MSG’s failure to comply with such injunction. MSG submitted its defence on 27in September 2019 and contends that it has not violated any Brazilian laws or regulations applicable to operations of the Serra Grande tailings dam. On 10In February 2020, the Court granted an injunction in respect of a number of the requests made by the Prosecutor. In line with the legal requirements of ANM Resolution No. 13/19, the injunction ordered the deactivation of the Serra Grande tailings dam by 15 September 2021, but did not include requirements to decommission the tailings dam, or to conduct complete removal of tailings material, by 15 September 2022. On 20 February 2020, MSG filed a motion for clarification in relation to certain items of the Court’s decision. On 25In May 2020, the Court clarified that its injunction should be interpreted in line with the legal requirements of ANM Resolution No. 13/19. On 4In June 2020, the Prosecutor presented further technical arguments in court, reiterating its request for an injunction ordering MSG to, inter alia, deactivate the tailings dam by September 2021 and to decommission the tailings dam, including complete removal of tailings material. On 22 June 2020,Afterwards, MSG filed an interlocutory appeal against the preliminary injunction granted on 10in February 2020 and a motion for further clarification. In August 2020, both MSG and the Prosecutor filed petitions informing the Court that the parties did not wish to produce oral evidence at a hearing. This matter is ongoing.In May 2021, the Court upheld the preliminary injunction ordering the deactivation of the Serra Grande tailings dam by 15 September 2021 and its decommissioning by 15 September 2025, both of which are consistent with the deadlines established by existing legal and regulatory requirements. In June 2021, the Prosecutor appealed this decision. The Court of Appeals of Goiás tried the case on 4 August 2022 and has affirmed the first instance decision. On 3 November 2022, the Prosecutor appealed this decision to the Superior Court of Justice.
•Public Civil Action between AngloGold Ashanti Córrego do Sítio Mineração SA (AGA Mineração) and the Minas Gerais State Public Prosecutor's Office (Prosecutor): In March 2020, the Prosecutor filed a public civil action against AGA Mineração in the local court of Sabará (Court) alleging a violation of Minas Gerais Law No. 23.291/19, which was adopted in February 2019. Article 12 of this law prohibits the grant of an environmental license for construction, installation, expansion or raising of a tailings dam if the “dam break” studies identify communities that are located in the self-rescue zone. In February 2020, the state of Minas Gerais approved AGA Mineração’s permit to operate the Cuiabá tailings dam following the determination by the Minas Gerais’ Attorney’s Office that Law No. 23.291/19 does not apply to tailings dams already in operation. In its lawsuit, the Prosecutor requested the Court to grant an injunction ordering the suspension of AGA Mineração’s operational permit for the Cuiabá tailings dam on the grounds that it was issued in violation of this law. During the months of March through May 2020, all parties presented their arguments in court. In June 2020, the Court rejected the Prosecutor’s request to grant an injunction. In July 2020, the Court’s decision not to grant an injunction was upheld on appeal by the Court of Appeals of Minas Gerais. Subsequently, the Court issued an order proposing a conciliation hearing between the parties. Noneparties, to which none of the parties objected to suchobjected. On 28 January 2022, the parties filed a joint petition requesting the cancellation of the conciliation hearing and the suspension of the legal proceedings in view of negotiations between the parties to explore a date remainspossible settlement. On 2 June 2022, AGA Mineração and the Prosecutor entered into a settlement. Pursuant to be scheduled by the Court. This matter is ongoing.settlement, AGA Mineração will, among other measures, update the emergency action plan and decommission the Cuiabá tailings dam according to the schedule filed with the relevant mining and environmental agencies. AGA Mineração will also prepare a technical study to assess the potential evacuation of communities from the self-rescue zone during the decommission stages. The Court approved the settlement on 29 July 2022 and the public civil action was terminated.
240
DIVIDENDS
General
Dividends are proposed by and approved by the board of directors of AngloGold Ashanti (Board)(the “board”), based on the company’sCompany’s financial performance and compliance with applicable laws, including in respect of the solvency and liquidity test contemplated in the SA Companies Act. Dividends are recognised when declared by the Board. AngloGold Ashanti’s dividend policy allows the Board to declare a semi-annual dividend to be based on 20 percent of the free cash flow generated by the business for that financial year, before taking into account growth capital expenditure, subject to applicable laws required to be complied with before a dividend may be declared by the Board. The Board may exercise its discretion on an annual basis, taking into consideration the prevailing market conditions, balance sheet flexibility and future capital commitments of the group.Group.
As a company incorporated in accordance with and bound by the company laws of the Republic of South Africa with its primary listing on the Johannesburg Stock Exchange, AngloGold Ashanti is required to declare dividends in South African rands. Therefore, dividends are declared in South African rands and paid in Australian dollars, South African rands, British pounds and Ghanaian cedis. Dividends paid to registered holders of AngloGold Ashanti ADSs are paid in US dollars converted from South African rands by The Bank of New York Mellon, as depositary,Depositary, in accordance with the deposit agreement. Exchange rate fluctuations may therefore affect the value of the dividends received by registered shareholders and distributions paid by the relevant depositaryDepositary to investors holding AngloGold Ashanti securities. Moreover, fluctuations in the exchange rates of the US dollar may affect the US dollar price of the ADSs on the NYSE. For details on taxation and exchange controls applicable to holders of ordinary shares or ADSs, see “Item“Item 10D: Exchange Controls”, “Item“Item 10E: Taxation-SouthTaxation—South African Taxation-TaxationTaxation—Taxation of dividends” and “Item 10E: Taxation-UnitedTaxation—United States Taxation-TaxationTaxation—Taxation of dividends”.
Dividends declared (in the ordinary course from trading and non-trading profits) to foreign shareholders are not subject to the approval by the South African Reserve Bank (SARB) in terms of South African foreign exchange control regulations. Dividends are freely transferable to foreign shareholders from both trading and non-trading profits earned in South Africa by publicly listed companies. Dividends in specie or special dividends may require SARB approval prior to declaration and payment to foreign shareholders.
Under South African law, the companyCompany may declare and pay dividends from any reserves included in total shareholder’s equity (including share capital and share premium) calculated in accordance with International Financial Reporting Standards (IFRS), subject to the solvency and liquidity test.
Withholding tax
South Africa currently imposes a Dividend Withholding Tax on Companies (dividends tax) at a rate of 20 percent on the net amount of the dividend declared and paid by a resident company, other than a Headquarter Company.
The dividends tax is generally imposed on the beneficial owner of the dividends. The dividends paid to South African shareholders may be exempt from dividend withholding tax in terms of certain domestic exemptions, or may be reduced to a lower rate under an applicable double tax treaty, if the required declarations and undertakings are provided by the beneficial owner of the dividend. In the case of dividends paid to a US holder with respect to shares, the Convention Between the Government of the United States of America and the Republic of South Africa for the Avoidance of Double Taxation and the Prevention of Fiscal Evasion with Respect to Taxes on Income and Capital Gains, signed 17 February 1997 (Treaty)(the “US/SA Double Taxation Treaty”) would generally limit the dividends tax rate to five percent of the gross amount of the dividends if a corporate US holder holds directly at least 10ten percent of the voting stock of AngloGold Ashanti. In all other cases, the maximum tax rate under the US/SA Double Taxation Treaty is 15 percent of the gross amount of the dividend. Different rules may apply if the beneficial owner of the dividends is a US resident who carries on business in South Africa through a permanent establishment situated in South Africa, or performs in South Africa independent personal services from a permanent establishment situated in South Africa, and the dividends are attributable to such permanent establishment.
241
8B. SIGNIFICANT CHANGES
Refer to “Item“Item 18: Financial Statements—Note 37—35—Subsequent Events”.
242
ITEM 9: THE OFFER AND LISTING
9A. OFFER AND LISTING DETAILS
The principal trading markets for AngloGold Ashanti’s ordinary shares are the New York Stock Exchange (NYSE), in the form of ADSs, under the symbol “AU” and the JSE Limited, in the form of ordinary shares, under the symbol “ANG”. Each ADS represents one ordinary share.
9B. PLAN OF DISTRIBUTION
Not applicable.
9C. MARKETS
NATURE OF TRADING MARKET
The principal trading markets for AngloGold Ashanti’s ordinary shares are the New York Stock Exchange,NYSE, in the form of ADSs, under the symbol “AU” (each representing one ordinary share) and the JSE Limited, in the form of ordinary shares, under the symbol “ANG”.
AngloGold Ashanti’s ordinary shares are also listed on the Ghana Stock Exchange, as ordinary shares under the symbol “AGA” and in the form of Ghanaian Depositary Shares or GhDSs (each representing one one-hundredth of an ordinary share) under the symbol “AADs”“AAD”, and the Australian Securities Exchange, in the form of ChessCHESS Depositary Interests (each representing one-fifth of an ordinary share) under the symbol “AGG”. AngloGold Ashanti was approved for a secondary listing on A2X Markets (A2X) in South Africa and its shares were admitted to trading on A2X on 6 June 2022 under the symbol “ANG”.
9D. SELLING SHAREHOLDERS
Not applicable.
9E. DILUTION
Not applicable.
9F. EXPENSES OF THE ISSUE
Not applicable.
243
ITEM 10: ADDITIONAL INFORMATION
10A. SHARE CAPITAL
Not applicable.
10B. MEMORANDUM OF INCORPORATION
At the last annual general meeting held on 10 June 2020,16 May 2022, AngloGold Ashanti received approval from shareholders (by way of a special resolution) to substitute clauses 9.1.1.3.2amend the MoI as follows:
1.by the deletion of the phrase “Subject to 9.4.3, this” at the beginning of clause 1.3 and 9.2.1.3.2the replacement thereof with the word “This”;
2.by the deletion of clause 9 (Rights Attaching to Preference Shares) in its entirety; and
3.by the amendment of Schedule 1 (Authorised Shares) as follows:
3.1 by the deletion of paragraphs 2, 3 and 4 of Schedule 1 in their entirety; and
3.2 by the deletion of the table at the end of Schedule 1 in its entirety and the replacement thereof with the following new clauses to enable the Companytable:
| Share capital | South African Rands | ||||
| 600,000,000 ordinary shares of R0.25 each | 150,000,000 | ||||
The reason for these amendments is to comply with the provisions of the SA Companies Act No. 71 of 2008 (as amended) (the Companies Act) and the JSE Listings Requirements in order to amendand, following the recent redemption of all of the A redeemable preference share termsshares and B redeemable preference shares of the Company, to remove all references in the MoI to the A redeemable preference shares, the B redeemable preference shares and the BC redeemable preference shares, as well as all of the provisions relating to all such redeemable preference shares, and thereby to remove all such redeemable preference shares from the authorised share terms. The approved (current) MoI is attached as an exhibit to this annual report.capital of the Company.
Registration
AngloGold Ashanti is incorporated under the company laws of the Republic of South Africa and is registered with the Companies and Intellectual Property Commission under registration number 1944/017354/06. The SA Companies Act has abolished the requirement for specific “object and purpose” provisions to be included in a memorandum of incorporation and although the MoI is silent on the matter, the company continues to carry on as its main business, gold exploration, the mining and production of gold, the manufacturing, marketing and selling of gold products and the development of markets for gold.
AngloGold Ashanti’s MoI is available for inspection as set out in “Item“Item 10H: Documents on Display” and a summary of the pertinent provisions, including the rights of the holders of shares in AngloGold Ashanti, are set out below.
This summary does not contain all the information pertaining to the rights of holders of AngloGold Ashanti’s ordinary shares and is qualified in its entirety by reference to the laws of South Africa and AngloGold Ashanti’s governing corporate documents. As well as being governed by the provisions of the MoI, the rights of holders of AngloGold Ashanti’s ordinary shares are governed by the JSE Listings Requirements, the SA Companies Act and the Companies Regulations, 2011, promulgated under the SA Companies Act (Regulations)(the “Regulations”), which include the Takeover Regulations. Further, the rights of holders of AngloGold Ashanti ADSs are governed by the Deposit Agreement between AngloGold Ashanti and The Bank of New York Mellon. See “Item“Item 10C: Material Contracts-TheContracts—The Deposit Agreement”.
The SA Companies Act provides that shares will no longer have a par or nominal value and hence no new shares having a nominal or par value may be authorised. However, any shares which have a nominal or par value authorised prior to 1 May 2011 (the effective date of the SA Companies Act) continue to have that nominal or par value and can be issued as such for so long as there are par value shares in the company’s authorised share capital. Should the company wish, it may also elect to convert its authorised par value shares to shares of no par value, subject to the relevant process and approvals contemplated in the SA Companies Act.
Directors
244
The management and control of any business of AngloGold Ashanti is vested in theits board of directors (board). The authority of the board to manage and direct the business and affairs of the company is not limited, restricted or qualified by the MoI.
Appointment and Retirement of Directors
The shareholders of the companyCompany have the power to elect the directors, and shareholders are also entitled to elect one or more alternate directors, in accordance with the provisions of the MoI.MoI and the SA Companies Act.
The board may appoint any person who satisfies the requirements for election as a director to fill any vacancy and serve as a director on a temporary basis until the vacancy is filled by election by shareholders entitled to exercise voting rights in such an election.
The MoI authorises the chairmanchairperson of the board, subject to the written approval of the majority of the directors, to appoint any person as a director provided that such appointment is approved by shareholders at the next shareholders’ meeting or annual general meeting.
At every annual general meeting one-third of the directors will retire by rotation, or if their number is not a multiple of three, then the number nearest to but not less than one third. The directors to retire at every annual general meeting will be those who have been the longest in office since their last election. Directors retiring by rotation are eligible for re-election. Directors who
voluntarily decide not to make themselves available for re-election may be counted towards the one-third of directors required to retire at the relevant annual general meeting.
The MoI contains no provision for directors to hold qualification shares. The MoI does not impose an age limit for the retirement of directors.
Remuneration
In accordance with the SA Companies Act, the MoI provides that the directors are entitled to such remuneration for their services as directors as AngloGold Ashanti’s shareholders may approve by special resolution in a general meeting or annual general meeting within the previous two years of the date of payment of such remuneration. If a director is employed in any other capacity, or holds an executive office or performs services that, in the opinion of the board, are outside the scope of the ordinary duties of a director, he or she may be paid such additional remuneration as a disinterested quorum of directors may reasonably determine.
Interests of Directors and Restriction on Voting
Although the interests of directors are not dealt with in the MoI, the provisions of the SA Companies Act in this regard are unalterable and will automatically apply, together with the applicable common law rules. Under the SA Companies Act, the procedures to deal with the personal financial interests of directors also apply to prescribed officers (i.e., persons who exercise general executive control over and management of the whole, or a significant portion, of the business and activities of the company or regularly participate to a material degree in the exercise of general executive control over and management of the whole, or a significant portion, of the business and activities of the company, irrespective of the office held or function performed by such persons) and any person who is a member of a committee of the board of the company, whether or not that person is also a member of the company’s board. The SA Companies Act provides that a director or such other person with a personal financial interest must disclose this to the board and cannot vote on or, after having made the disclosures to the meeting as prescribed by the SA Companies Act, remain present during the meeting when the matter in which hehe/she has interest is being discussed but will be counted as present for the purposes of a quorum.quorum (but is not to be regarded as being present at the meeting for the purposes of determining whether a resolution has sufficient support to be adopted).
Share Rights, Preferences and Restrictions
Allotment and Issue of Ordinary Shares
Subject to the JSE Listings Requirements, the SA Companies Act and/or with approval of shareholders in a general meeting, unissued ordinary shares must be offered to existing ordinary shareholders, pro rata to their ordinary shareholdings, unless they are issued for the acquisition of assets. The shareholders in a general meeting may authorise the AngloGold Ashanti board to issue any unissued ordinary shares.
245
Dividends, Rights and Distributions
The ordinary shares participate fully in all dividends, other distributions and entitlements as and when declared by AngloGold Ashanti in respect of fully paid ordinary shares. Under South African law, AngloGold Ashanti may declare and pay dividends,distributions (as defined in the SA Companies Act, which includes dividends), subject to the companyCompany satisfying the solvency and liquidity test as provided byset out in section 4 of the SA Companies Act and the board passing a resolution acknowledging that such test has been applied and has reasonably concluded that the companyCompany would satisfy such test immediately after completing the distribution. Dividends are payable to shareholders registered at a record date after the date of declaration of the dividend.
As a companyCompany incorporated and registered in the Republic of South Africa with its primary listing on the Johannesburg Stock Exchange, AngloGold Ashanti is required to declare dividends in South African rands. Dividends are paid in South African rands, Australian dollars, Ghanaian cedis and British pounds. Registered holders of AngloGold Ashanti ADSs are paid dividends in US dollars by The Bank of New York Mellon as depositary,Depositary, in accordance with the Deposit Agreement. See “Item“Item 10C: Material Contracts-TheContracts—The Deposit Agreement”.
Although not stated in the MoI, but subject to the JSE Listings Requirements and the SA Companies Act, any dividend may be paid and satisfied, either wholly or in part, by the distribution of specific assets, or in paid-up securities of AngloGold Ashanti or of any other company,Company, or in cash, or in any one or more of such ways as the directors may at the time of declaring the dividend determine and direct.
All dividends remaining unclaimed for a period of not less than three years from the date on which they became payable, may, by a resolution of the directors, become forfeited for the benefit of the company.Company.
Voting Rights
Each ordinary share confers the right to vote at all general meetings. Each holder present in person or by proxy or, in the case of a corporate entity, represented, has one vote on a show of hands. If a poll is held, holders present or any duly appointed proxy will have one vote for each ordinary share held. A holder of ordinary shares is entitled to appoint a proxy to attend, speak and vote at any meeting on his or her behalf and the proxy need not be a shareholder. Holders of ADSs are not entitled to vote in person at meetings, but may vote by way of proxy through The Bank of New York Mellon as the ADS issuer. Holders of Australian Chess Depositary Interests (CDIs) and Ghanaian Depositary Shares (GhDSs) are not entitled to vote in person or by proxy at meetings, but may vote by instructing Chess Depository Nominees and NTHC Limited as depositary,Depositary, respectively, how to vote their shares.
There are no limitations on the right of non-South African registered shareholders to hold or exercise voting rights attaching to any of the ordinary shares.
The MoI specifies that the rights relating to any class of shares may be modified or abrogated with the sanction of a resolution passed as if it were a special resolution of the holders of shares in that class at a separate general meeting. The MoI also specifies that the holders of the A, B and C preference shares may provide written consents to the modification of their rights.
Increase and Reduction of Capital
The companyCompany is authorised to issue the shares specified in the MoI and all such shares are required to be issued as fully paid up in accordance with the applicable approval and/or other requirements of the SA Companies Act and the JSE Listings Requirements.
The directors are authorised, subject to any requirements of the JSE Listings Requirements, the SA Companies Act, the Regulations and the MoI, to increase or decrease the number of authorised shares of any class of shares, reclassify any shares that have been authorised but not issued, classify any unclassified shares that have been authorised but not issued, and determine the preferences, rights, limitations or other terms of any class of authorised shares or amend any preferences, rights, limitations or other terms as determined. However, such capital amendments require an amendment to be made to the MoI, theMoI. The SA Companies Act and the JSE Listings Requirements currently doesdo not allow the MoI to be amended to give effect to such capital amendments without the approval of ordinary shareholders by special resolution.
Rights Upon Liquidation
In the event of the winding up of AngloGold Ashanti:
246
Shareholders’ meetingsMeetings
The directors may convene meetings of AngloGold Ashanti shareholders. Subject to the provisions of the SA Companies Act, the shareholders may requisition for the convening of a meeting.
Notice of each AngloGold Ashanti annual general meeting and general meeting of AngloGold Ashanti shareholders must be delivered at least 15 business days before that shareholders’ meeting is to begin. In accordance with the SA Companies Act, business days are calculated by excluding the first day, including the last day and excluding Saturdays, Sundays and any public holiday in the Republic of South Africa. In terms of the MoI, all shareholders are entitled to attend shareholders’ meetings at which they are entitled to vote.
For an ordinary resolution to be approved by shareholders, it must be supported by more than 50 percent of the voting rights exercised on the resolution. For a special resolution to be approved by shareholders, it must be supported by at least 75 percent of the voting rights exercised on the resolution.
Disclosure of Interest in Shares
Under South African law, a person must notify AngloGold Ashanti within three business days after that person (i) acquires a beneficial interest in sufficient securities of a class of securities issued by AngloGold Ashanti such that, as a result of the acquisition, the person holds a beneficial interest in securities amounting to five percent, ten percent, 15fifteen percent or any further whole multiple of five percent of the issued securities of that class or (ii) disposes of any beneficial interest in sufficient securities of a class of securities issued by AngloGold Ashanti such that, theas a result of the disposition, the person no longer holds a beneficial interest in securities amounting to a particular multiple of five percent of issued securities of that class. When AngloGold Ashanti has received the notice referred to above it must file a copy with the Takeover Regulation Panel and report the information to holders of the relevant class of securities unless the notice concerned is a disposition of less than one percent of the class of securities.
If the securities of AngloGold Ashanti are registered in the name of a person who is not the holder of the beneficial interest in all of the securities in AngloGold Ashanti held by that person, that registered holder of the securities must disclose the identity of the
person on whose behalf that security is held and the identity of each person with a beneficial interest in securities so held, the number and the class of securities held for each such person with a beneficial interest and the extent of each such beneficial interest. This information must be disclosed in writing to the companyCompany within five business days after the end of every month during which a change has occurred in the information or more promptly or frequently to the extent so provided by the requirements of a Central Securities Depository. A companyCompany that knows or has reasonable cause to believe that any of its securities are held by one person for the beneficial interest of another may by notice in writing require either of those persons to confirm or deny that fact, provide particulars of the extent of the beneficial interest held during the three years preceding the date of the notice and disclose the identity of each person with a beneficial interest in the securities held by that person, which information must be provided within 10ten business days of the receipt of the notice.
AngloGold Ashanti is obligated to establish and maintain a register of the disclosures described above and to publish in its annual financial statements a list of the persons who hold beneficial interests equal to or in excess of five percent of the total number of ordinary shares issued by AngloGold Ashanti together with the extent of those beneficial interests.
Rights of Minority Shareholders
Majority shareholders of South African companies have no fiduciary obligations under South African common law to minority shareholders. However, under the SA Companies Act, a shareholder or director may, under certain circumstances, seek relief from thea court if he has been unfairly prejudiced by any act or omission of the companyCompany or a related person, by the conduct of the business of the companyCompany or a related person in a particular manner, or the exercise of the powers of the directors of the companyCompany or a related person in a particular manner. There may also be personal and derivative actions available to a shareholder of a company.Company.
Pursuant to the SA Companies Act, a shareholder may petition a South African court for relief from the actions or omissions or business conduct of the companyCompany or the actions of the company’sCompany’s directors or officers that is oppressive or unfairly prejudicial to, or unfairly disregards the interest of the shareholder. In addition, a shareholder who voted against a resolution to amend the company’sCompany’s MoI, or to approve a fundamental transaction (and complied with other requirements set out in the SA Companies
247
Act) may exercise its appraisal right to demand that the companyCompany pay to it the fair value for all the shares of the companyCompany held by that shareholder.
Description of ADSs
The Bank of New York Mellon issuesregisters and delivers AngloGold Ashanti’s American Depositary Shares, or ADSs. Please see “Item“Item 10C: Material Contracts—Description of AngloGold Ashanti ADSs”.
10C. MATERIAL CONTRACTS
Multi-currency Revolving Credit Facility
General
On 23 October 2018, AngloGold Ashanti Holdings plc (AGAH)(“AGAH”) and AngloGold Ashanti Australia Limited, as borrowers, entered into a five-year unsecured multi-currency syndicated revolving credit facility of $1.4 billion (the “2018 multi-currency RCF”) with the Bank of Nova Scotia, as facility agent, and certain financial institutions party thereto, as lenders. The loan consisted of (i) a US dollar based facility with interest charged at a margin of 1.45% above LIBOR and (ii) an Australian dollar based facility capped at A$500 million with interest charged at a margin of 1.45% above BBSY. The A$500 million portion of the 2018 multi-currency RCF was used to fund the working capital and development costs associated with the Group’s mining operations within Australia without eroding the group’s headroom under its other facilities and exposing the Group to foreign exchange gains/losses each quarter. On 9 June 2022, the 2018 multi-currency RCF was repaid and cancelled, and replaced with the 2022 multi-currency RCF (as defined below).
On 9 June 2022, AGAH and AngloGold Ashanti Australia Limited, as borrowers, entered into a new five-year unsecured multi-currency syndicated revolving credit facility of $1.4 billion (the “2022 multi-currency RCF)RCF”) maturing in June 2027, with the option of two one-year extensions on application. The 2022 multi-currency RCF was entered into with The Bank of Nova Scotia, as facility agent, and certain financial institutions party thereto, as lenders. The loan2022 multi-currency RCF consists of (i) a US dollar based facility (base currency) and (ii) an Australian dollar based facility capped at A$500 million which will be used to fund the working capital and development costs associated with the group’sgroup's mining operations within Australia (without eroding the group’sgroup's headroom under its other facilities and exposing the group to foreign exchange gains/losses each quarter). As of 19 March 2021, the $1.4 billionThe 2022 multi-currency RCF was undrawn.entered into on substantially similar terms to the 2018 multi-currency RCF, save in respect of the basis for the US dollar interest rate which transitioned from LIBOR to Compounded SOFR. As of 10 March 2023, the equivalent of $37 million was drawn under the AUD portion of the 2022 multi-currency RCF.
Guarantees
The $1.4 billion2022 multi-currency RCF is guaranteed by AGAH and AngloGold Ashanti Australia Limited. The guarantees constitute unconditional obligations of the guarantors and rank at least pari passu with all other future unsecured obligations of the guarantors, except for obligations mandatorily preferred by law.
Security
Save as set out under the heading “—“—Guarantees” above, the obligations under $1.4 billionthe 2022 multi-currency RCF are unsecured.
Amount and repayment of borrowings
Loans under the $1.4 billion2022 multi-currency RCF must be for a minimum of $10 million, if the currency selected is the base currency (US dollar), or a minimum of A$10 million (or for the balance of the undrawn total commitments at the time of the drawing), if the currency selected is Australian dollars. No more than 14 loans may be outstanding at any time. Each loan must be repaid on the maturity date in the same currency as the maturing loan. All loans must be repaid in full on the final maturity date. The $1.4 billion2022 multi-currency RCF matures in October 2023.June 2027, with the option of two one-year extensions on application.
Interest rates and fees
The annual interest rate on loans drawn under the $1.4 billion2022 multi-currency RCF is calculated based on LIBOR,Compounded SOFR in the case of loans drawn in US dollars and BBSY in the case of loans drawn in Australian dollars, in each case plus ana margin. The initial margin ofis 1.45 percent per annum, that variesbut may vary between 0.950.90 percent and 2.15 percent per annum depending on the long-term debt rating of AGAH, and in relation to any Loan in Australian Dollars, BBSY, and certain mandatory costs.AGAH. The applicable margin is subject to a ratings grid. In this regard, the interest margin will reduce shouldif the group’sgroup's credit rating improveimproves from its current BB+/Baa3 status and shouldwill increase if its credit rating worsens. Interest on loanseach loan is payable on the last day of the relevant loan’s interest period and, if the interest period exceeds six months, on the dates falling at six-monthly intervals after the first day of the loan was made.interest period.
The borrowers under the $1.4 billion2022 multi-currency RCF are required to pay a commitment fee in the base currency equal to 35 percent of the then applicable margin per annum on the undrawn and uncancelled amount of each lender’s commitment during the commitment period. The borrowers are also required to pay a utilisation fee of 0.10 percent per annum (if the aggregate outstanding loans are less than one third of the total commitments then in effect), 0.20 percent per annum (if the aggregate outstanding loans are equal to or greater than one third but less than two thirdstwo-thirds of the total commitments then in effect) or 0.40 percent per annum (if the aggregate outstanding loans are equal to or greater than two thirdstwo-thirds of the total commitments then in effect).
Financial covenant
249
The $1.4 billion2022 multi-currency RCF includes a financial maintenance covenant which requires that the ratio of Total Net Financial Indebtedness to EBITDA (as such terms are defined in the revolving credit agreement) does not at any time exceed 3.50 to 1.00, with the proviso that this ratio may exceed 3.50 to 1.00 once during the life of the revolving credit agreement, for one six-month period subject to certain criteria. Refer to “Item“Item 18: Financial Statements-Note 36-CapitalStatements—Note 34—Capital Management” for the formulae used in the revolving credit agreement to test compliance with the covenants.
Change of control
If a lender so requires, the commitment of such lender under the $1.4 billion2022 multi-currency RCF will be cancelled and the participation of such lender in all outstanding loans, together with accrued interest and all other amounts accrued, will become immediately due and payable in case any person or group of persons acting in concert becomes (directly or indirectly) the beneficial owner of more than 50 percent of the issued share capital of AngloGold Ashanti Limited.Limited or (as applicable) an eligible successor holding company of AGAH.
Undertakings
The $1.4 billion2022 multi-currency RCF contains a negative pledge covenant, including restrictions on the granting of security, a change of business of AngloGold Ashanti Limited and its subsidiaries, acquisitions or participations in joint ventures and mergers and disposals.
The $1.4 billion2022 multi-currency RCF also contains, among other things, the following affirmative covenants: mandatory periodic reporting of financial and other information, notice upon the occurrence of events of default and certain other events, compliance with environmental laws and other obligations requiring each of AGAH and its subsidiaries to maintain its corporate existence and qualifications to conduct its business as currently conducted in all applicable jurisdictions and to maintain insurance coverage. The covenants are subject to exceptions and materiality thresholds.
Events of default
The $1.4 billion2022 multi-currency RCF contains events of default including failure to make payment of amounts due, breach of obligations under the loan documents, defaults under other agreements evidencing indebtedness, certain bankruptcy events and a cessation of business failure of any of the borrowers to be a wholly-owned subsidiary of AGAH and the occurrence of a material adverse change in the business and financial condition of the borrowers and guarantors under the revolving credit agreement, or AngloGold Ashanti and its subsidiaries as a whole, or in the ability of the borrowers and guarantors to perform their payment obligations under the loan documents. The occurrence of an event of default could result in the immediate and automatic cancellation of all commitments and the acceleration of all payment obligations under the revolving credit agreement2022 multi-currency RCF and the other loan documents.
The above description is only a summary of certain provisions of the revolving credit agreement2022 multi-currency RCF and is qualified in its entirety by reference to the provisions of the revolving credit agreement,2022 multi-currency RCF, a copy of which is attached hereto as Exhibit 19.4.4.1 and is incorporated herein by reference.
Notes
Each of the series of notes described below were issued under the indenture, dated as of 28 April 2010, among AngloGold Ashanti Holdings plc (AGAH)(“AGAH”), as issuer, AngloGold Ashanti Limited, as guarantor, and The Bank of New York Mellon, as trustee (the Indenture)“Indenture”). The below descriptions are only a summary of certain provisions of those series of notes and are qualified in their entirety by reference to the provisions of the Indenture and such relevant series of notes, a copy of each – in respect of the outstanding series of notes – is attached hereto as Exhibits 19.2.1, 19.2.2, 19.2.3, 19.2.4 and 19.2.419.2.5 and is incorporated herein by reference.
On 22 October 2021, AGAH issued $750 million 3.375 percent Notes due 2028 (the “2028 notes”). The interest on the 2028 notes is payable semi-annually on 1 May and 1 November of each year, commencing on 1 May 2022. AGAH may on any one or more occasions redeem all or part of the 2028 notes, at a redemption price equal to the greater of (1) 100 percent of the principal amount of the 2028 notes to be redeemed and (2) the sum of the present values of the remaining scheduled payments of principal and interest on the 2028 notes (excluding any portion of such payments of interest accrued or unpaid as of the date of redemption) discounted to the redemption date on a semiannual basis (assuming a 360-day year consisting of twelve 30-day months) at the treasury rate, plus 30 basis points, plus accrued and unpaid interest, if any, to the date of redemption. AGAH has agreed to pay certain additional amounts in respect of any withholdings or deductions for certain types of taxes in certain jurisdictions on payments to holders of the 2028 notes. The 2028 notes are unsecured and unsubordinated and are fully and unconditionally guaranteed by AngloGold Ashanti Limited.
AGAH has agreed to observe certain covenants with respect to the 2028 notes restricting, subject to certain limitations, the ability of AngloGold Ashanti Limited and AGAH to amalgamate, reconstruct, consolidate or merge with another company or other legal entity, and the ability of AngloGold Ashanti Limited and its restricted subsidiaries to pledge their assets to secure certain borrowings, create or incur liens on certain of their property or to engage in sale and leaseback transactions. In case of a change
250
of control of the guarantor and a downgrade, within a specified period, of the 2028 notes by three rating agencies, holders of the 2028 notes have the right to require the issuer to repurchase all or any part of their 2028 notes in cash for a value equal to 101 percent of the aggregate principal amount of 2028 notes repurchased, plus accrued and unpaid interest, if any, on the 2028 notes repurchased to the date of repurchase.
The offering of the 2028 notes was registered under the Securities Act. The 2028 notes were listed on the New York Stock Exchange.
2030 Notes
On 1 October 2020, AGAH issued $700 million 3.750 percent Notes due 2030 (the 2020 Notes)“2030 notes”). The interest on the 2020 Notes2030 notes is payable semi-annually on 1 April and 1 October of each year, commencing on 1 April 2021. AGAH may on any one or more occasions redeem all or part of the 2020 Notes,2030 notes, at a redemption price equal to the greater of (1) 100 percent of the principal amount of the 2020 Notes2030 notes to be redeemed and (2) the sum of the present values of the remaining scheduled payments of principal and interest on the 2020 Notes2030 notes (excluding any portion of such payments of interest accrued or unpaid as of the date of redemption) discounted to the redemption date on a semiannual basis (assuming a 360-day year consisting of twelve 30-day months) at the treasury rate, plus 50 basis points, plus accrued and unpaid interest, if any, to the date of redemption. AGAH has agreed to pay certain additional amounts in respect of any withholdings or deductions for certain types of taxes in certain jurisdictions on payments to holders of the 2020 Notes.2030 notes. The 2020 Notes2030 notes are unsecured and unsubordinated and are fully and unconditionally guaranteed by AngloGold Ashanti Limited.
AGAH has agreed to observe certain covenants with respect to the 2020 Notes restricting, subject to certain limitations, the ability of AngloGold Ashanti Limited and AGAH to amalgamate, reconstruct, consolidate or merge with another company or other
The offering of the 2030 notes was registered under the Securities Act. The 2030 notes were listed on the New York Stock Exchange.
2022 Notes
On 30 July 2012, AGAH issued $750 million 5.125 percent Notes due 2022 (the “2022 notes”). The interest on the 2022 notes was payable semi-annually on 1 February and 1 August of each year, commencing on 1 February, 2013. AGAH was permitted on any one or more occasions to redeem all or part of the 2022 notes, at a redemption price equal to the greater of (1) 100 percent of the principal amount of the 2022 notes to be redeemed and (2) the sum of the present values of the remaining scheduled payments of principal and interest on the 2022 notes (excluding any portion of such payments of interest accrued or unpaid as of the date of redemption) discounted to the redemption date on a semiannual basis (assuming a 360-day year consisting of twelve 30-day months) at the treasury rate, plus 50 basis points, plus accrued and unpaid interest, if any, to the date of redemption. AGAH had agreed to pay certain additional amounts in respect of any withholdings or deductions for certain types of taxes in certain jurisdictions on payments to holders of the 2022 notes. The 2022 notes were unsecured and unsubordinated and were fully and unconditionally guaranteed by AngloGold Ashanti Limited.
AGAH had agreed to observe certain covenants with respect to the 2022 notes restricting, subject to certain limitations, the ability of AngloGold Ashanti Limited and AGAH to amalgamate, reconstruct, consolidate or merge with another company or other legal entity, and the ability of AngloGold Ashanti Limited and its restricted subsidiaries to pledge their assets to secure certain borrowings, create or incur liens on certain of their property or to engage in sale and leaseback transactions. In case of a change of control of the guarantor and a downgrade, within a specified period, of the 2022 notes below an investment grade rating by two rating agencies, holders of the 2022 notes had the right to require the issuer to repurchase all or any part of their 2022 notes in cash for a value equal to 101 percent of the aggregate principal amount of 2022 notes repurchased, plus accrued and unpaid interest, if any, on the 2022 notes repurchased to the date of purchase.
The offering of the 2012 Notes2022 notes was registered under the Securities Act. The 2012 Notes2022 notes were listed on the New York Stock Exchange.
2020 Notes and 2040 Notes
On 28 April 2010, AGAH issued $700 million 5.375 percent Notes due 2020 (the “2020 notes”) and $300 million 6.500 percent Notes due 2040 (together,(the “2040 notes” and together with the 2010 Notes)2020 notes, the “2010 notes”). The interest on the 2010 Notesnotes is payable
251
semi-annually on 15 April and 15 October of each year, commencing on 15 October 2010. AGAH may on any one or more occasions redeem all or part of the 2010 Notes,notes, at a redemption price equal to the greater of (1) 100 percent of the principal amount of the 2010 Notesnotes to be redeemed and (2) the sum of the present values of the remaining scheduled payments of principal and interest on the 2010 Notesnotes (excluding any portion of such payments of interest accrued or unpaid as of the date of redemption) discounted to the redemption date on a semiannual basis (assuming a 360-day year consisting of twelve 30-day months) at the treasury rate, plus 25 basis points with respect to the 2010 Notes maturing in 2020 notes and 30 basis points with respect to the 2010 Notes maturing in 2040 notes, plus accrued and unpaid interest, if any, to the date of redemption. AGAH has agreed to pay certain additional amounts in respect of any withholdings or deductions for certain types of taxes in certain jurisdictions on payments to holders of the 2010 Notes.notes. The 2010 Notesnotes are unsecured and unsubordinated and are fully and unconditionally guaranteed by AngloGold Ashanti Limited.
AGAH has agreed to observe certain covenants with respect to the 2010 Notesnotes restricting, subject to certain limitations, the ability of AngloGold Ashanti Limited and AGAH to amalgamate, reconstruct, consolidate or merge with another company or other legal entity, and the ability of AngloGold Ashanti Limited and its restricted subsidiaries to pledge their assets to secure certain borrowings, create or incur liens on certain of their property or to engage in sale and leaseback transactions. In case of a change of control of the guarantor and a downgrade, within a specified period, of a series of 2010 Notesnotes below an investment grade rating by two rating agencies, holders of the 2010 Notesnotes have the right to require the issuer to repurchase all or any part of their 2010 Notesnotes in cash for a value equal to 101 percent of the aggregate principal amount of 2010 Notesnotes repurchased, plus accrued and unpaid interest, if any, on the 2010 Notesnotes repurchased to the date of purchase.
The offering of the 2010 Notesnotes was registered under the Securities Act. The 2010 Notesnotes were listed on the New York Stock Exchange.
The $700 million 5.375 percent Notes due 2020 notes were repaid at maturity on 15 April 2020 and are no longer outstanding.
For further information, see “Note 26: Borrowings” to our Annual“Item 18: Financial Statements included in Statements—Note 24—Borrowings”,“Item 18 of this Annual Report, “Item 5B: Liquidity and Capital Resources” and “Item“Item 19: Exhibits to Form 20-F”.
Description of AngloGold Ashanti ADSs
The Bank of New York Mellon issuesregisters and delivers AngloGold Ashanti’s American Depositary Shares, or ADSs. Each ADS represents the ownership interest of one ordinary share of AngloGold Ashanti.
The Deposit Agreement
This section provides a summary description of AngloGold Ashanti’s ADSs.
AngloGold Ashanti has entered into an Amended and Restated Deposit Agreement dated 3 June 2008 with The Bank of New York Mellon as depositaryDepositary and the owners and beneficial owners of American Depositary Receipts (Deposit Agreement)(the “Deposit Agreement”).
The following is a summary of the material provisions of the Deposit Agreement. For more complete information, read the entire Deposit Agreement and the Form of American Depositary Receipt, which AngloGold Ashanti has filed with the SEC as an exhibit to AngloGold Ashanti’s registration statements on Form F-6 (Registration No.Nos. 333-133049 and No. 333-159248) on 27 May 2008 and 14 May 2009, respectively. A copy thereof is also attached hereto as Exhibit 19.2.6 and is incorporated herein by reference. See “Item“Item 10H: Documents on Display”. Copies of the Deposit Agreement are also available for inspection at the Corporate Trust Office of The Bank of New York Mellon currently located at 240 Greenwich Street, New York, New York 10286.
Description of the ADSs
The Bank of New York Mellon, as depositary,Depositary, registers and delivers ADSs. Each ADS represents one ordinary share (or a right to receive one share) deposited with Standard Bank of South Africa Limited FirstRand Bank Limited or HSBC Bank Australia Limited, each as a custodian for The Bank of New York Mellon, and allboth of which are referred to collectively as “the Custodian”the “Custodian”. Each ADS also represents any other securities, cash or other property which may be held by The Bank of New York Mellon. The Bank of New York Mellon’s Corporate Trust Office at which the ADSs are administered is located at 240 Greenwich Street, New York, New York 10286. The Bank of New York Mellon’s principal executive office is also located at 240 Greenwich Street, New York, New York 10286.
ADSs may be held either (A) directly (i) by having an American Depositary Receipt, also referred to as an ADR, which is a certificate evidencing a specific number of ADSs, registered in the holder’s name, or (ii) by having ADSs registered in a holder’s name in the Direct Registration System, or (B) indirectly by holding a security entitlement in ADSs through a broker or other financial institution. If ADSs are held directly, such holders are ADS holders. This description applies to AngloGold Ashanti’s ADS holders. If ADSs are held indirectly, such holders must rely on the procedures of their broker or other financial institution to assert the rights of ADS registered holders described in this section. Such holders should consult with their broker or financial institution to find out what those procedures are.
The Direct Registration System, or DRS, is a system administered by DTC pursuant to which the depositaryDepositary may register the ownership of uncertificated ADSs, which ownership will be evidenced by periodic statements sent by the depositaryDepositary to the registered holders of uncertificated ADSs.
252
AngloGold Ashanti does not treat ADS holders as its shareholders and ADS holders do not have shareholder rights. South African law governs shareholder rights. The Bank of New York Mellon is the holder of the shares underlying the ADSs. Registered holders of ADSs have ADS holder rights. The Deposit Agreement sets out ADS holder rights as well as the rights and obligations of The Bank of New York Mellon. New York law governs the Deposit Agreement and the ADSs.
Dividends and Other Distributions
The Bank of New York Mellon has agreed to pay to holders of ADSs the cash dividends or other distributions it or a Custodian receives on AngloGold Ashanti ordinary shares or other deposited securities after deducting any fees and expenses and any applicable withholding taxes. Holders of ADSs will receive these distributions in proportion to the number of AngloGold Ashanti’s ordinary shares that their ADSs represent.
Cash
The Bank of New York Mellon will convert any cash dividend or other cash distribution (in South African rands) that AngloGold Ashanti pays on ordinary shares into US dollars (unless AngloGold Ashanti pays such dividend or cash distribution in US dollars) and distribute to registered holders of ADSs. If that is no longer possible or if any approval from any government is needed and cannot be obtained, The Bank of New York Mellon may distribute non-US currency only to those ADS holders to whom it is possible to make this type of distribution.
The Bank of New York Mellon may hold the non-US currency it cannot convert for the account of holders of ADSs who for one reason or the other have not been paid. It will not invest the non-US currency, and it will not be liable for interest on such amounts. Before making a distribution, any withholding taxes that must be paid will be deducted. See “Payment“—Payment of Taxes” below. The Bank of New York Mellon will distribute only whole US dollars and cents and will round fractional cents to the nearest whole
cent. If the exchange rates fluctuate during a time when The Bank of New York Mellon cannot convert the non-US currency, holders of ADSs may lose some or all of the value of the distribution.
Ordinary Shares
The Bank of New York Mellon may distribute to holders of ADSs additional ADSs representing ordinary shares that AngloGold Ashanti distributes as a dividend or free distribution, if AngloGold Ashanti provides it promptly with satisfactory evidence that it is legal to do so. If The Bank of New York Mellon does not distribute additional ADSs, the outstanding ADSs will also represent the newly distributed AngloGold Ashanti ordinary shares. The Bank of New York Mellon will only distribute whole ADSs. It will sell AngloGold Ashanti ordinary shares that would require it to deliver a fraction of an ADS and distribute the net proceeds in the same way as it distributes cash. The Bank of New York Mellon may sell a portion of the distributed shares sufficient to pay its fees and expenses in connection with that distribution.
Rights to Subscribe for Additional Ordinary Shares
If AngloGold Ashanti offers holders of its ordinary shares any rights to subscribe for additional AngloGold Ashanti ordinary shares or any other rights, The Bank of New York Mellon, after consultation with AngloGold Ashanti, may make these rights available to holders of ADSs or sell the rights and distribute the proceeds in the same way as it distributes cash. If The Bank of New York Mellon cannot do either of these things for any reason, it may allow these rights to lapse. In that case, holders of ADSs will receive no value for them.
If The Bank of New York Mellon makes these types of subscription rights available to holders of ADS, upon instruction from holders of ADSs, it will exercise the rights and purchase AngloGold Ashanti’s ordinary shares on their behalf. The Bank of New York Mellon will then deposit the AngloGold Ashanti ordinary shares and deliver ADSs to the holders of ADSs. It will only exercise these rights if holders of ADSs pay it the exercise price and any other charges the rights require them to pay.
US securities laws may restrict the sale, deposit, cancellation and transfer of the ADSs issued after exercise of rights. For example, holders of ADSs may not be able to trade the ADSs freely in the United States. In this case, The Bank of New York Mellon may deliver ADSs which are "restricted securities"“restricted securities” within the meaning of Rule 144 which will have the same provisions as the ADSs described here, except for the changes needed to put the restrictions in place.
Other Distributions
The Bank of New York Mellon will send to holders of ADSs any other distributions that AngloGold Ashanti makes on deposited securities by any means it thinks is legal, fair and practical. If it cannot make the distribution in that way, The Bank of New York Mellon may decide to sell what AngloGold Ashanti distributes, and then distribute the net proceeds in the same way as it distributes cash, or it may decide to hold what AngloGold Ashanti distributes, in which case the outstanding ADSs will also represent the newly distributed property. However, The Bank of New York Mellon is not required to distribute any securities (other than ADSs) to ADS holders unless it receives satisfactory evidence from AngloGold Ashanti that it is legal to make that distribution. The Bank of New York Mellon may sell a portion of the distributed securities or property sufficient to pay its fees and expenses in connection with that distribution.
253
The Bank of New York Mellon is not responsible if, based on available information, it decides that it is unlawful or impractical to make a distribution available to any ADS holders. AngloGold Ashanti has no obligation to register ADSs, AngloGold Ashanti ordinary shares, rights or other securities under the US Securities Act of 1933.Act. AngloGold Ashanti also has no obligation to take any other action to permit the distribution of ADSs, AngloGold Ashanti ordinary shares, or any other rights to ADS holders. This means that the holders of ADSs may not receive the distribution AngloGold Ashanti makes on its ordinary shares or any value for them if it is illegal or impracticable for AngloGold Ashanti to make them available to the holders of ADSs.
Deposit, Withdrawal and Cancellation
The Bank of New York Mellon will deliver ADSs if a holder of AngloGold Ashanti’s ordinary shares or its broker deposits AngloGold Ashanti’s ordinary shares or evidence of rights to receive ordinary shares with the Custodian. Upon payment of its fees and expenses and of any taxes or charges, such as stamp taxes or stock transfer taxes or fees, The Bank of New York Mellon will register the appropriate number of ADSs in the names such holder of AngloGold Ashanti ordinary shares requests and will deliver the ADSs at its Corporate Trust Office to the persons such holders request.
Holders of ADSs may turn in their ADSs at The Bank of New York Mellon’s Corporate Trust Office. Upon payment of its fees and expenses and of any taxes or charges, such as stamp taxes or stock transfer taxes or fees, The Bank of New York Mellon will deliver (1) the underlying ordinary shares to an account designated by the relevant holder of ADSs and (2) any other deposited securities underlying the ADSs at the office of the Custodian, or, at the request, risk and expense of ADS holders, The Bank of New York Mellon will deliver the deposited securities at its Corporate Trust Office.
Interchange Between Certificated ADSs and Uncertificated ADSs
ADS registered holders may surrender their ADS to The Bank of New York Mellon for the purpose of exchanging such ADS for uncertificated ADSs. The Bank of New York Mellon will cancel that ADS and will send to the ADS registered holder a statement confirming that the ADS registered holder is the registered holder of uncertificated ADSs. Alternatively, upon receipt by The Bank of New York Mellon of a proper instruction from a registered holder of uncertificated ADSs requesting the exchange of uncertificated ADSs for certificated ADSs, The Bank of New York Mellon will execute and deliver to the ADS registered holder an ADS evidencing those ADSs.
Voting Rights
ADS registered holders may instruct The Bank of New York Mellon to vote the number of deposited shares their ADSs represent. The Bank of New York Mellon will notify ADS registered holders of shareholders’ meetings and arrange to deliver AngloGold Ashanti’s voting materials to them if AngloGold Ashanti asks it to. Those materials will describe the matters to be voted on and explain how ADS registered holders may instruct The Bank of New York Mellon how to vote. For instructions to be valid, they must reach The Bank of New York Mellon by a date set by The Bank of New York Mellon.
Otherwise, ADS registered holders will not be able to exercise their right to vote unless they withdraw the shares. However, ADS registered holders may not know about the meeting sufficiently in advance to withdraw the shares.
The Bank of New York Mellon will try, as far as practicable, to vote or to have its agents vote the ordinary shares or other deposited securities as holders of ADSs instruct, but this is subject to South African law, the provisions of AngloGold Ashanti’s MoI and of the deposited securities and any applicable rule of the JSE. The Bank of New York Mellon will only vote or attempt to vote as such holders of ADSs instruct.
AngloGold Ashanti cannot assure the holders of ADSs that they will receive the voting materials in time for them to instruct The Bank of New York Mellon to vote their ordinary shares. In addition, The Bank of New York Mellon and its agents are not responsible for failing to carry out voting instructions or for the manner of carrying out voting instructions. This means that holders of ADSs may not be able to exercise their right to vote and there may be nothing they can do if their ordinary shares are not voted as they requested.
254
Fees and Expenses
| ADS holders must pay: | For: | ||||
| $5.00 (or less) per 100 ADSs | Each issuance of an ADS, including as a result of a distribution of AngloGold Ashanti ordinary shares or rights or other property Each cancellation of an ADS, including if the Deposit Agreement terminates | ||||
| $0.02 (or less) per ADS | Any cash payment | ||||
| Registration or transfer fees | Transfer and registration of AngloGold Ashanti ordinary shares on the AngloGold Ashanti share register to or from the name of The Bank of New York Mellon or its agent when AngloGold Ashanti ordinary shares are deposited or withdrawn | ||||
| $0.02 (or less) per ADS per year | Depositary services | ||||
| Expenses of The Bank of New York Mellon | Conversion of non-US currency to US dollars Cable, telex and facsimile transmission expenses Servicing the deposited securities | ||||
| Taxes and other governmental charges that The Bank of New York Mellon or any Custodian has to pay on any ADS or AngloGold Ashanti ordinary share underlying an | As necessary | ||||
| A fee equivalent to the fee that would have been payable if the securities distributed had been ordinary shares deposited for issuance of ADSs | Distribution of securities distributed to holders of deposited securities that are distributed by The Bank of New York Mellon to ADS holders | ||||
255
Payment of Taxes
Holders of ADSs will be responsible for any taxes or other governmental charges payable on their ADSs or on the deposited securities underlying their ADSs. The Bank of New York Mellon may refuse to transfer their ADSs or allow them to withdraw the deposited securities underlying their ADSs until such taxes or other charges are paid. It may apply payments owed to holders of ADSs or sell deposited securities underlying their ADSs to pay any taxes they owe, and they will remain liable for any deficiency. If The Bank of New York Mellon sells deposited securities, it will, if appropriate, reduce the number of ADSs to reflect the sale and pay to holders of ADSs any proceeds, or send to them any property remaining after it has paid the taxes.
Reclassifications
| If AngloGold Ashanti: | Then: | ||||||||||
Reclassifies, splits up or consolidates any of the deposited securities; | The cash, ordinary shares or other securities received by The Bank of New York Mellon will become deposited securities. Each ADS will automatically represent its equal share of the new deposited securities. | ||||||||||
| Distributes securities on the ordinary shares that are not distributed to holders of ADSs; or Recapitalises, reorganises, merges, liquidates, sells all or substantially all of AngloGold Ashanti’s assets, or takes any similar action. | The Bank of New York Mellon may, and will if AngloGold Ashanti asks it to, distribute some or all of the cash, AngloGold Ashanti ordinary shares or other securities it receives. It may also issue new ADSs or ask holders of ADSs to surrender their outstanding ADSs in exchange for new ADSs identifying the new deposited securities. | ||||||||||
Amendment and Termination
AngloGold Ashanti may, for any reason, agree with The Bank of New York Mellon to amend the Deposit Agreement and the ADSs without the consent of holders. If the amendment increases fees or charges (except for taxes and other governmental charges or registration fees, cable, telex or facsimile transmission costs, delivery costs or other such expenses) or if the amendment prejudices an important right of ADS holders, it will only become effective 30 days after The Bank of New York Mellon notifies holders of ADSs of the amendment. At the time an amendment becomes effective, holders of ADSs are considered, by continuing to hold their ADSs, to agree to the amendment and to be bound by the ADSs and the agreement as amended.
The Bank of New York Mellon may terminate the Deposit Agreement by mailing notice of termination to ADS holders at least 30 days prior to the date fixed in the notice if AngloGold Ashanti asks it to do so. The Bank of New York Mellon may also terminate the Deposit Agreement if The Bank of New York Mellon has told AngloGold Ashanti that it would like to resign and AngloGold Ashanti has not appointed a new depositaryDepositary bank within 90 days. In both cases, The Bank of New York Mellon must notify holders of AngloGold Ashanti ADSs at least 30 days before termination.
After termination, The Bank of New York Mellon and its agents will be required to do only the following under the Deposit Agreement: collect distributions on the deposited securities, sell rights, and, upon surrender of ADSs, deliver AngloGold Ashanti ordinary shares and other deposited securities. Four months after the date of termination or later, The Bank of New York Mellon may sell any remaining deposited securities by public or private sale and will hold the proceeds of the sale, as well as any other cash it is holding under the Deposit Agreement, for the pro rata benefit of the ADS holders who have not surrendered their ADSs. It will not invest the money and will have no liability for interest. The Bank of New York Mellon’s only obligations will be to account for the proceeds of the sale and other cash. After termination, AngloGold Ashanti’s only obligations will be with respect to indemnification of, and payment of certain amounts to, The Bank of New York Mellon.
Limitations on Obligations and Liability to ADS Holders
The Deposit Agreement expressly limits AngloGold Ashanti’s obligations and the obligations of The Bank of New York Mellon, and limits AngloGold Ashanti’s liability and the liability of The Bank of New York Mellon. AngloGold Ashanti and The Bank of New York Mellon:
•are only obligated to take the actions specifically set forth in the Deposit Agreement without negligence or bad faith;
•are not liable if either of AngloGold Ashanti or The Bank of New York Mellon is prevented or delayed by law or circumstances beyond their control from performing their obligations under the Deposit Agreement;
•are not liable if either of AngloGold Ashanti or The Bank of New York Mellon exercises discretion permitted under the Deposit Agreement;
•are not liable for the inability of any holder of ADSs to benefit from any distribution on deposited securities that is not made available to holders of ADSs under the terms of the Deposit Agreement, or for any special, consequential or punitive damages for any breach of the terms of the Deposit Agreement;
•have no obligation to become involved in a lawsuit or other proceeding related to the ADSs or the Deposit Agreement on behalf of the holders of ADSs or on behalf of any other party;
256
•may rely on advice of or information from legal counsel, accountants, and any persons presenting AngloGold Ashanti’s ordinary shares for deposit, any registered holder or any other person believed by AngloGold Ashanti in good faith to be competent to give such advice or information; and
•pursuant to the Deposit Agreement, agree to indemnify each other under certain circumstances.
Requirements for Depositary Action
Before The Bank of New York Mellon will issue, transfer or register the transfer of an ADS, make a distribution on an ADS, or allow withdrawal of AngloGold Ashanti ordinary shares, The Bank of New York Mellon may require:
•payment of stock transfer or other taxes or other governmental charges and transfer or registration fees charged by third parties for the transfer of any ordinary shares or other deposited securities;
•production of satisfactory proof of the identity and genuineness of any signature or other information it deems necessary; and
•compliance with regulations it may establish, from time to time, consistent with the Deposit Agreement, including presentation of transfer documents.
The Bank of New York Mellon may refuse to deliver, transfer or register transfers of ADSs generally when the books of The Bank of New York Mellon or AngloGold Ashanti are closed, or at any time if either AngloGold Ashanti or The Bank of New York Mellon thinks it advisable to do so.
Holders of ADSs have the right to cancel their ADSs and withdraw the underlying ordinary shares at any time except:
•when temporary delays arise because: (1) either AngloGold Ashanti or The Bank of New York Mellon have closed AngloGold Ashanti’s transfer books; (2) the transfer of the ordinary shares is blocked in connection with voting at a general meeting of shareholders; or (3) AngloGold Ashanti is paying a dividend on the ordinary shares;
•when ADS holders seeking to withdraw the ordinary shares are liable for unpaid fees, taxes and similar charges; or
•when it is necessary to prohibit withdrawals in order to comply with any laws or governmental regulations that apply to ADSs or to the withdrawal of the ordinary shares or other deposited securities.
This right of withdrawal may not be limited by any other provision of the Deposit Agreement.
Pre-release of ADSs
In certain circumstances, subject to the provisions of the Deposit Agreement, The Bank of New York Mellon may deliver ADSs before deposit of the underlying ordinary shares. This is called a pre-release of the ADS.ADSs.
The Bank of New York Mellon may also deliver AngloGold Ashanti ordinary shares upon cancellation of pre-released ADSs (even if the ADSs are cancelled before the pre-release transaction has been closed out). A pre-release is closed out as soon as the underlying AngloGold Ashanti ordinary shares are delivered to The Bank of New York Mellon. The Bank of New York Mellon may receive ADSs instead of ordinary shares to close out a pre-release.
The Bank of New York Mellon may pre-release ADSs only under the following conditions:
•before or at the time of the pre-release, the person to whom the pre-release is being made must represent to The Bank of New York Mellon in writing that it or its customer: (a) owns the ordinary shares or ADSs to be remitted, (b) assigns all beneficial rights, title and interest in such ADSs or ordinary shares, as the case may be, to The Bank of New York Mellon in its capacity as the depositaryDepositary and for the benefit of the ADS holders, and (c) will not take any action with respect to such ADSs or ordinary shares, as the case may be, that is consistent with the transfer of beneficial ownership (including, without the consent of The Bank of New York Mellon, disposing of such ADSs or ordinary shares, as the case may be) other than satisfaction of such pre-release;
•the pre-release must be fully collateralizedcollateralised with cash, US government securities, or other collateral that The Bank of New York Mellon considers appropriate; and
•The Bank of New York Mellon must be able to close out the pre-release on not more than five business days’ notice. Each pre-release will be subject to any further indemnities and credit regulations that The Bank of New York Mellon deems appropriate. The Bank of New York Mellon will normally limit the number of AngloGold Ashanti ordinary shares not deposited but represented by ADSs outstanding at any time as a result of pre-release so that they do not exceed 30 percent of the ordinary shares deposited, although The Bank of New York Mellon may disregard this limit from time to time, if it thinks it is appropriate to do so.
Direct Registration System
In the Deposit Agreement, all parties to the Deposit Agreement acknowledge that the DRS and Profile Modification System, or Profile, will apply to uncertificated ADSs upon acceptance thereof to DRS by The Depository Trust Company, also referred to as DTC. DRS is the system administered by DTC pursuant to which the depositaryDepositary may register the ownership of uncertificated ADSs, which ownership will be evidenced by periodic statements sent by the depositaryDepositary to the registered holders of uncertificated ADSs. Profile is a required feature of DRS which allows a DTC participant, claiming to act on behalf of a registered holder of ADSs, to direct the depositaryDepositary to register a transfer of those ADSs to DTC or its nominee and to deliver those ADSs to
257
the DTC account of that DTC participant without receipt by the depositaryDepositary of prior authorizationauthorisation from the ADS registered holder to register that transfer.
In connection with and in accordance with the arrangements and procedures relating to DRS/Profile, the parties to the Deposit Agreement understand that The Bank of New York Mellon will not verify, determine or otherwise ascertain that the DTC participant which is claiming to be acting on behalf of an ADS holder in requesting registration of transfer and delivery described in the paragraph above has the actual authority to act on behalf of the ADS holder (notwithstanding any requirements under the Uniform Commercial Code). In the Deposit Agreement, the parties agree that The Bank of New York Mellon’s reliance on and compliance with instructions received by The Bank of New York Mellon through the DRS/Profile System and in accordance with the Deposit Agreement will not constitute negligence or bad faith on the part of The Bank of New York Mellon.
Shareholder Communications: Inspection of Register of Holders of ADSs
The Bank of New York Mellon will make available for inspection at its office all communications that it receives from AngloGold Ashanti as a holder of deposited securities that AngloGold Ashanti makes generally available to holders of deposited securities. The Bank of New York Mellon sendswill send copies of those communications if requested by AngloGold Ashanti. ADS holders have a right to inspect the register of holders of ADSs, but not for the purpose of contacting those holders about a matter unrelated to AngloGold Ashanti’s business or the ADSs.
258
10D. Exchange controls
Exchange controls and other limitations affecting security holders
The following is a general outline of South African exchange controls and such outline may not apply to former residents of South Africa. Investors should consult a professional advisor as to the exchange control implications of their particular investments.
South African law provides for exchange control regulations, which restrict the export of capital from South Africa. Exchange controls are administered by the Financial Surveillance Department of the South African Reserve Bank (SARB), in terms of the Exchange Control Regulations, and regulate transactions involving South African residents and non-residents, with the exception of transactions between South African residents and residents of the Common Monetary Area, which comprises the Kingdoms of Lesotho and Eswatini (formerly Swaziland) and the Republic of Namibia. The purpose of exchange controls is to mitigate the decline of foreign capital reserves in South Africa.
The Government of South Africa has, however, committed itself to relaxing exchange controls gradually and significant relaxation has occurred in recent years.
The comments below relate, in general, to exchange controls in place at the date of this annual report.
Investments in South African companies
Acquisitions of shares or assets of South African companies by non-South African purchasers are generally subject to review and approval by the SARB, particularly where the consideration is payable in a form other than cash. In this regard, the SARB will give approval where it is persuaded, inter alia, that the consideration payable for the acquisition of the shares or assets is an arm’s length consideration.arm’s-length consideration and that such acquisition offers benefits to South Africa. In addition, where shares in a South African company are acquired by a non-resident, the share certificates issued to the non-resident shareholder must be endorsed “non-resident” by the SARB (or an Authorised Dealer).
Dividends
Dividends declared to foreign stockholders in public companies listed on the Johannesburg Stock Exchange (JSE) are not subject to the approval of the SARB, provided that the shares in respect of which the dividends are declared have been endorsed “non-resident” by the SARB or an Authorised Dealer at the time of acquisition. Dividends are freely transferable to foreign stockholders from both trading and non-trading profits earned in South Africa by public listed companies.
Voting rights
There are no limitations imposed by South African law, including South African exchange controls, or by the Memorandum of Incorporation of AngloGold Ashanti on the rights of non-South African shareholders to vote their ordinary shares.
Overseas financing, interest and investments
Interest on foreign loans, if paid from cash generated from operations in South Africa, may be remittable abroad, provided that the loans and the payment of the relevant interest in respect of such loans have received prior SARB approval.
AngloGold Ashanti and its South African subsidiaries require SARB approval to raise debt from and repay debt to non-residents of the Common Monetary Area, mainly in respect of the terms of repayment applicable to such loans, as well as any guarantees that may be provided in respect of such loans, by AngloGold Ashanti or its South African subsidiaries.
Debt raised outside the Common Monetary Area by AngloGold Ashanti’s non-South African subsidiaries is not restricted under South African exchange control regulations and can be used for investment outside the Common Monetary Area, subject to the relevant conditions imposed by the SARB in connection with such investment, the establishing of such a non-South African subsidiary or in raising the debt by such subsidiary. For example, AngloGold Ashanti and its South African subsidiaries would require SARB approval in order for AngloGold Ashanti and/or its South African subsidiaries to provide guarantees for the obligations of any of its non-South African subsidiaries. In addition, funds obtained from non-residents of the Common Monetary Area and debt raised outside the Common Monetary Area by AngloGold Ashanti’s non-South African subsidiaries must be repaid or serviced by AngloGold Ashanti’s foreign subsidiaries unless otherwise approved by the SARB.
A listing by a South African company on any stock exchange other than the JSE in connection with raising capital requires permission from the SARB.
Under current exchange control regulations, offshore investments by AngloGold Ashanti and its subsidiaries require the approval of the SARB. Subject to such prior approval of the SARB, there is no limit on the amount of capital that may be invested offshore.
259
10E. Taxation
South African taxation
General
The following section provides a summary summarisesof the South African tax consequences ofconsequent upon the ownership and disposition of shares by South African residents or ADSs by a US holder (as defined below) and is not intended to constitute tax advice. This summary is based upon current South African tax law and practice of the South African Revenue Service (SARS) practice,, the Convention Between the Government of the United States of America and the Republic of South Africa for the Avoidance ofUS/SA Double Taxation and the Prevention of Fiscal Evasion with Respect to Taxes on Income and Capital Gains, signed 17 February 1997 (Treaty),Treaty, and in part upon representations ofmade by the depositary, andDepositary, on the basis that it assumes that each obligation provided for in, or otherwise contemplated by, a Deposit Agreement and any related agreement will be performed in accordance with its respective terms.
The following summary of the South African tax considerations does not address the tax consequences to a US holder that is resident in South Africa for South African tax purposes, whose holding of shares or ADSs is effectively connected with a permanent establishment in South Africa through which such US holder carries on business activities or, in the case of an individual, with a fixed base situated therein, or who is otherwise not entitled to the full benefits under the US/SA Double Taxation Treaty. It should be appreciated that South Africa ratified the Multilateral Convention to Implement Tax Treaty-related measures to prevent Base Erosion and Profit Shifting (BEPS MLI) on 30 September 2022 and that one should thus read the applicable treaty, including the US/SA Double Taxation Treaty, in this context.
The statements of law set forth below are subject to any changes (which may be applied retroactively) in South African law or in the interpretation thereof by SARS, or in the US/SA Double Taxation Treaty, occurring after the date hereof. It should be expressly noted that South African tax law does not specifically address the treatment of ADSs. However, it is reasonable to assume (although no assurance can be made) that the tax treatment of US holders of shares is also applicable to US holders of ADSs.
Holders are strongly urged to consult their own tax advisors as to the consequences under South African, US federal, state and local, and other applicable laws, of the ownership and disposition of shares or ADSs.
Taxation of dividends
South Africa currently imposes a Dividend Withholding Tax on Companies (dividends tax) at a rate of 20 percent on the net amount of the dividend declared and paid by a resident company, other than a Headquarter Company.
The dividends withholding tax is generally imposed on the beneficial owner of the dividends. The dividend withholdingdividends tax is subject to domestic exemptions or relief in terms of an applicable double taxation treaty. The application of such domestic exemptions or relief in terms of an applicable double taxation treaty is subject to the making of certain declarations and undertakings by the beneficial owner of the dividends to the regulated intermediary making payment of the dividend. In terms of the latest amendments to the tax provisions, the declaration and undertaking entitling the beneficial owner to a reduced dividend withholding tax rate must be renewed every five years, subject to certain exemptions.
The dividends tax could be reduced to a lower rate under an applicable double tax treaty, if all requirements are met. In the case of dividends paid to a US holder with respect to shares, the US/SA Double Taxation Treaty would generally limit the dividends tax rate to five percent of the gross amount of the dividends if a corporate US holder holds directly at least 10ten percent of the voting stock of AngloGold Ashanti,the Company, provided that the applicable declaration and undertaking are given by the beneficial owner that the reduced rate applies.
In all other cases, the maximum tax rate under the US/SA Double Taxation Treaty is 15 percent of the gross amount of the dividend. Even though the domestic rate is 20 percent on the net amount of the dividends, the maximum rate that is payable under the Treaty is 15 percent of the gross amount of the dividends.
Different rules may apply if the beneficial owner of the dividends is a US resident who carries on business in South Africa through a permanent establishment situated in South Africa, or performs in South Africa services from a permanent establishment situated in South Africa, and the dividends are attributable to such permanent establishment or fixed base.
Moreover, if the dividends tax rate is reduced under the auspices of an applicable double tax treaty, certain South African compliance requirements must be met in order to obtain the double tax treaty relief, including amongst others the completion of a declaration and undertaking by the beneficial owners in favour of the Company and/or the relevant participant. regulated intermediary.
In terms of the latest tax provisions the declaration and undertaking need to be renewed at least every five years unless the regulated intermediary is subject to the provisions of inter alia the US Foreign Account Tax Compliance legislation.
A dividend is currently defined as any amount transferred or applied by a company that is a resident (including AngloGold Ashanti)the Company) for the benefit or on behalf of any person in respect of any share in that company, whether that amount is transferred or applied by way of a distribution made by the company, or as consideration for the acquisition of any share in that company. The definition of
260
a dividend specifically excludes any amount transferred or applied by the companyCompany that results in a reduction of so-called contributed tax capital (CTC) of the relevant class of shares, or constitutes shares in the companyCompany or constitutes an acquisition by the companyCompany of its own securities by way of a general repurchase of securities in terms of the JSE Listings Requirements. A distinction is thus made between a general repurchase of securities and a specific repurchase of securities. If the companyCompany embarks upon a general repurchase of securities, the proceeds areof such repurchase would not deemed to beconstitute a dividend, whereas, in the case of a specific repurchase of securities where the purchase price is not funded out of CTC of that class of shares, the proceeds arewould likely to constitute a dividend.
The concept of CTC effectively means the sum of the stated capital or share capital and share premium of a company that existed on 1 January 2011, excluding any transfers from reserves to the share premium account or stated capital account, plus proceeds from the issue of any new shares by a company, less the amount of CTC that has been returned to shareholders. Any application of CTC is limited to the holders of a class of shares. In addition, a distribution of CTC attributable to a specific class must be made proportionately to the number of shares held by a shareholder in a specific class. The definition of CTC is subject to various provisos. Recently the definition of CTC was amended to make it clear that CTC can only be transferred to shareholders proportionally.
For dividends tax purposes a dividend is defined as any dividend as indicated above that is paid by a company that is a resident or paid by a foreign company if the share in respect of which that foreign dividend is paid is a listed share and to the extent that the foreign dividend does not constitute a distribution of an asset in kind.
Dividends are generally exempt from the payment of income tax.
Taxation of capital gains on sale or other disposition
South African residents are taxed on their worldwide income, while non-residents are only taxed on South African sourced income (subject to the provisions of any relevant double taxation agreement).The general corporate income tax rate has recently been reduced to 27 percent.
Capital gains tax is not a separate tax to income tax; instead, a percentile of the taxpayer’s net capital gain (that is the taxable capital gain) is included in its taxable income on which it is taxed at the income tax rate.
Non-residents are only subject to the South African capital gains tax provisions in respect of the disposal of any immovable property (such as land and buildings or mining rights) or any interest or right of whatever nature to or in immovable property situated in South Africa, or any asset of a permanent establishment through which that non-resident is carrying on a trade in South Africa.In the instance of a shareholder holding shares in a South African company, the ‘interest in immovable property’ requirements are met if 80 percent or more of the market value of the shares is directly or indirectly attributable to South African immovable property held on capital account, and that shareholder (whether alone or together with any connected person in relation to that person), directly or indirectly, holds at least 20 percent of the equity shares of that South African company.
Gains realised on the sale of ordinary shares are deemed to be of a capital nature and subject to capital gains tax provided the ordinary shares have been held for a continuous period of at least three years. This deeming provision is limitedapplicable to ordinary shares“equity shares” as defined in section 1 of the South African Income Tax Act, No. 58 of 1962 (the “SA Income Tax Act”), and doesmay not extend to preference shares or ADSs. ADSs where the preference shares or ADSs do not constitute “equity shares” as so defined.
The meaning of the word “resident” is different for individuals and corporations and is governed by the South African Income Tax Act No. 58 of 1962 (the Act) and by the Treaty. In the event of conflict, the Treaty, which contains a tie breaker clause or mechanism to determine residency if a holder is resident in both countries, will prevail. In terms of the Act and Treaty, a US resident holder of shares or ADSs will not be subject to capital gains tax on the disposal of securities held as capital assets unless the securities are linked to a permanent establishment conducted in South Africa or constitute an interest in immovable property as indicated above. In contrast, gains on the disposal of securities which are not capital in nature are usually subject to income tax. Any asset held as a long-term investment will be considered a capital asset and subject to capital gains tax on the disposal of such an asset. Any asset acquired for purposes of resale as part of a profit-making scheme will not be considered a capital asset and will be subject to income tax on the disposal of such an asset. However, even in the latter case, a US resident holder will not be subject to income tax, unless the US resident holder carries on business in South Africa through a permanent establishment situated therein.
Securities transfer tax (STT)
No securities transfer tax, or STT, is payable in South Africa with respect to the issue of a security, but STT is payable upon transfer, redemption or cancellation thereof.
261
STT on transfers of securities is charged at a rate of 0.25 percent on the 'taxable amount'‘taxable amount’ in respect of the 'transfer'‘transfer’ of every security issued by a company incorporated in South Africa, or a company incorporated outside South Africa, but listed on an exchange in South Africa, subject to certain exemptions.
The word 'transfer'‘transfer’ is broadly defined and includes the transfer, sale, assignment or cession or disposal in any other manner of a security which results in a change in beneficial ownership.The cancellation or redemption of a security is also regarded as a 'transfer'‘transfer’ unless the companyCompany is being liquidated. However, the transfer of a security that does not result in a change in beneficial ownership is not regarded as a 'transfer'‘transfer’ for STT purposes. A security is also defined as a depositary receipt in a company. Accordingly,Apart from STT isthus being payable upon the conversion of ADSs to shares and vice versa, , STT could also be payable on the transfer of a depositary receipt issued by a company, including specifically the ADSs issued by AngloGold Ashanti.the Company. Generally, the central securities depositaryDepositary that has been accepted as a participant in terms of the Financial Markets Act, is liable for the payment of the STT, on the basis that it is recoverable from the person to whom it is transferred.
STT is levied on the 'taxable amount'‘taxable amount’ of a security.The taxable amount of a listed security is the greater of the consideration for the security declared by the transferee or the closing price of that security as traded on the stock exchange concerned. InThe person to whom the case of a transfer of a listed security eitheris transferred is liable for payment of the STT, and such tax must be paid through the member or the participant holding the security in custody, or where the listed security is not held in custody, the company that issued the listed security. The tax so payable may be recovered from the person to whom the security is liable for the tax.transferred. The tax must be paid by the fourteenth day of the month following the month during which the transfer occurred.
Withholding tax on interest
Generally, a 15 percent withholding tax may apply to the payments of interest.Under the US/SA Double Taxation Treaty, withholding is reduced to zero percent provided the interest is derived and beneficially owned by a resident of the United States.States will be taxable only in the United States (and therefore not subject to interest withholding tax in South Africa), subject to certain exclusions.
Value-Added Tax
The issue or transfer of shares is not a taxable supply for value-added tax (“VAT”) purposes.However, fees charged by independent service providers would beare subject to VAT at the standard rate of 15%.
United States Taxation
General
The following is a general summary of certain material US federal income tax consequences of the ownership and disposition of shares or ADSs to a US holder (as defined below) that holds its shares or ADSs as a capital asset.With respect to the following, references to shares includes references to ADSs unless the context indicates otherwise.This summary does not address any aspect of US federal gift or estate tax, or the state, local or non-US tax consequences to a US holder of shares. This summary is based on US tax laws including the Internal Revenue Code of 1986, as amended (the Code)“Code”), Treasury regulations promulgated thereunder, rulings, judicial decisions, administrative pronouncements, and the US/SA Double Taxation Treaty, all as currently in effect as of the date of this annual report, and all of which are subject to change or changes in interpretation, possibly with retroactive effect. In addition, this summary is based in part upon the representations of the depositaryDepositary and the assumption that each obligation in the Deposit Agreement relating to the ADSs and any related agreement will be performed in accordance with its terms.
This summary does not address all aspects of US federal income taxation that may apply to holders that are subject to special tax rules, including US expatriates, non-resident aliens present in the United States for at least 183 days during the calendar year, insurance companies, tax-exempt entities, banks, certain financial institutions, persons subject to the alternative minimum tax, regulated investment companies, securities broker-dealers, traders in securities who elect to apply a mark-to-market method of accounting, investors that own (directly, indirectly or by attribution) 10ten percent or more of the outstanding share capital or voting stock of AngloGold Ashanti, partnerships or other entities treated as partnerships for US federal income tax purposes or persons holding shares through such entities, persons holding their shares as part of a straddle, hedging or conversion transaction, persons who acquired their shares pursuant to the exercise of employee stock options or otherwise as compensation, or persons whose functional currency is not the US dollar. Such holders may be subject to US federal income tax consequences different from those set forth below.
As used herein, the term “US holder” means a beneficial owner of shares that is: (a) a citizen or individual resident of the United States for US federal income tax purposes; (b) a corporation (or other entity taxable as a corporation for US federal income tax purposes) created or organised in or under the laws of the United States, any state thereof or the District of Columbia; (c) an estate the income of which is subject to US federal income taxation regardless of its source; or (d) a trust if (i) a court within the
262
United States can exercise primary supervision over the administration of the trust and one or more US persons are authorised to control all substantial decisions of the trust or (ii) it has a valid election in effect under applicable Treasury regulations to be treated as a United States person.
If a partnership (including for this purpose any entity treated as a partnership for US federal income tax purposes) holds shares, the tax treatment of a partner generally will depend upon the status of the partner and the activities of the partnership. If a US holder is a partner in a partnership that holds shares, the holder is urged to consult its own tax advisor regarding the specific tax consequences of the ownership and disposition of the shares.
US holders should consult their own tax advisors regarding the specific South African and US federal, state and local tax consequences of owning and disposing of shares in light of their particular circumstances as well as any consequences arising under the laws of any other taxing jurisdiction. In particular, US holders are urged to consult their own tax advisors regarding whether they are eligible for benefits under the US/SA Double Taxation Treaty.
For US federal income tax purposes, a US holder of ADSs should generally be treated as owning the underlying shares represented by those ADSs. Therefore, deposits or withdrawals by a US holder of shares for ADSs or of ADSs for shares will not be subject to US federal income tax. The following discussion (except where otherwise expressly noted) applies equally to US holders of shares and US holders of ADSs.
▪Taxation of dividends
The gross amount of any distribution (including the amount of any South African withholding tax thereon) paid to a US holder by AngloGold Ashanti generally will be taxable as dividend income to the US holder for US federal income tax purposes on the date the distribution is actually or constructively received by the US holder, in the case of shares, or by the depositary,Depositary, in the case of ADSs.Corporate US holders will not be eligible for the dividends received deduction in respect of dividends paid by AngloGold
Ashanti. For foreign tax credit limitation purposes, dividends paid by AngloGold Ashanti will be income from sources outside the United States.
As noted above in “-Taxation-South“Taxation—South African Taxation-Taxationtaxation—Taxation of dividends”, the South African government has enacted a dividend withholding tax.As a result, US holders who are eligible for benefits under the current US/SA Double Taxation Treaty will be subject to a maximum withholding tax of 15 percent on the gross amount of dividend distributions paid by AngloGold Ashanti.
The amount of any distribution paid in foreign currency (including the amount of any South African withholding tax thereon) generally will be includible in the gross income of a US holder of shares in an amount equal to the US dollar value of the foreign currency calculated by reference to the spot rate in effect on the date of receipt by the US holder, in the case of shares, or by the depositary,Depositary, in the case of ADSs, regardless of whether the foreign currency is converted into US dollars on such date. If the foreign currency is converted into US dollars on the date of receipt, a US holder of shares generally should not be required to recognise foreign currency gain or loss in respect of the dividend. If the foreign currency received in the distribution is not converted into US dollars on the date of receipt, a US holder of shares generally will have a tax basis in the foreign currency equal to its US dollar value on the date of receipt. Any gain or loss recognised upon a subsequent conversion or other disposition of the foreign currency generally will be treated as US source ordinary income or loss. In the case of a US holder of ADSs, the amount of any distribution paid in a foreign currency generally will be converted into US dollars by the depositaryDepositary upon its receipt. Accordingly, a US holder of ADSs generally will not be required to recognise foreign currency gain or loss in respect of the distribution. Special rules govern and specific elections are available to accrual method taxpayers to determine the US dollar amount includible in income in the case of taxes withheld in a foreign currency. Accrual basis taxpayers are therefore urged to consult their own tax advisors regarding the requirements and elections applicable in this regard.
Subject to certain limitations, South African withholding taxes will be treated as foreign taxes eligible for credit against a US holder’s US federal income tax liability. The limitation on foreign taxes eligible for credit is calculated separately with respect to specific classes of income. Dividend income generally will constitute ‘passive category’“passive category” income, or in the case of certain US holders, ‘general category’“general category” income. The use of foreign tax credits is subject to complex conditions and limitations. In lieu of a credit, a US holder who itemises deductions may elect to deduct all of such holder’s foreign taxes in the taxable year. A deduction does not reduce US tax on a dollar-for-dollar basis like a tax credit, but the deduction for foreign taxes is not subject to all the same limitations applicable to foreign tax credits. US holders are urged to consult their own tax advisors regarding the availability of foreign tax credits.
Certain US holders (including individuals) are eligible for reduced rates of US federal income tax in respect of “qualified dividend income” received. AngloGold Ashanti currently believes that dividends paid with respect to its shares should constitute qualified dividend income for US federal income tax purposes. Each individual US holder of AngloGold Ashanti shares is urged to consult his own tax advisor regarding the availability of the reduced dividend tax rate in light of his own particular situation.
263
The US Treasury has expressed concern that parties to whom ADSs are pre-released may be taking actions that are inconsistent with the claiming of foreign tax credits for US holders of ADSs. Such actions would also be inconsistent with the claiming of the reduced rate of tax described above, applicable to dividends received by certain non-corporate holders. Accordingly, the analysis of the creditability of South African withholding taxes or the availability of qualified dividend treatment could be affected by future actions that may be taken by the US Treasury with respect to ADSs.
If a US holder is a resident of the United States for purposes of the US/SA Double Taxation Treaty, such holder will not be subject to South African tax on any capital gain if it sells or disposes of its shares. Special rules apply to individuals who are residents of more than one country.
Subject to the passive foreign investment company considerations discussed below, upon the sale, exchange or other disposition of shares, a US holder generally will recognise capital gain or loss for US federal income tax purposes in an amount equal to the difference between the US dollar value of the amount realised on the disposition and the holder’s tax basis, determined in US dollars, in the shares. Such gain or loss generally will be US source gain or loss, and will be treated as a long-term capital gain or loss if the holder’s holding period in the shares exceeds one year at the time of disposition. If the US holder is an individual, any capital gain generally will be subject to US federal income tax at preferential rates if specified minimum holding periods are met. The deductibility of capital losses is subject to limitations under the Code.
A US holder’s tax basis in a share will generally be its US dollar cost. The US dollar cost of a share purchased with foreign currency will generally be the US dollar value of the purchase price on the date of purchase, or the settlement date for the purchase in(in the case of shares traded on an established securities market that are purchased by a cash basis US holder or an electing accrual basis US holder.holder), or the date of purchase in all other cases. The amount realised on a sale or other disposition of shares for an amount in foreign currency will be the US dollar value of this amount on the settlement date for the sale or disposition (in the case of shares traded on an established securities market that are sold by a cash basis US holder or an electing accrual basis US holder), or the date of sale or disposition. On the settlement date,disposition in all other cases. In addition, in such other cases, the US holder will recognise US source foreign currency gain or loss (taxable as ordinary income or loss) equal to the difference (if any) between the US dollar value of the amount received based on the exchange rates in effect on the date of sale or other disposition and the settlement date. However, in the case of shares traded on an established securities market that are sold by a cash basis US holder (or an accrual basis US holder that so elects), the amount realised will be based on the exchange rate in effect on the settlement date for the sale, and no exchange gain or loss will be recognised at that time. If an accrual basis US holder makes
either of the elections described above, it must be applied consistently from year to year and cannot be revoked without the consent of the Internal Revenue Services (IRS).
Foreign currency received on the sale or other disposition of a share will have a tax basis equal to its US dollar value on the settlement date. Any gain or loss recognised on a sale or other disposition of foreign currency (including its use to purchase shares or upon exchange for US dollars) will be US source ordinary income or loss.
▪Passive foreign investment company considerations
A foreign corporation will be classified a passive foreign investment company (PFIC) for any taxable year if at least 75 percent of its gross income consists of passive income (such as dividends, interest, rents or royalties (other than rents or royalties derived in the active conduct of a trade or business and received from an unrelated person), or gains on the disposition of certain minority interests), or at least 50 percent of the average value of its assets consists of assets that produce, or are held for the production of, passive income. AngloGold Ashanti believes that it was not treated as a PFIC for the taxable year ended 31 December 20202022 or any prior taxable years and does not expect to become a PFIC in the foreseeable future. If AngloGold Ashanti were characterised as a PFIC for any taxable year, a US holder would suffer adverse tax consequences with respect to that taxable year and all future years during which it holds AngloGold Ashanti ordinary shares.
These consequences may include having gain realised on the disposition of shares treated as ordinary income rather than capital gain and being subject to punitive interest charges on the receipt of certain dividends and on the proceeds of the sale or other disposition of the shares. Furthermore, dividends paid by AngloGold Ashanti would not be “qualified dividend income” and would be taxed at the higher rates applicable to other items of ordinary income. US holders should consult their own tax advisors regarding the potential application of the PFIC rules to their ownership of the shares.
▪US information reporting and backup withholding
In general, dividend payments made to a US holder and proceeds paid from the sale, exchange, or other disposition of shares may be subject to information reporting to the IRS and possible backup withholding. US federal backup withholding generally is imposed at a current rate of 24 percent on specified payments including dividends and gross sale proceeds to persons who fail to furnish required information. Backup withholding will not apply to a US holder who furnishes a correct taxpayer identification number and makes any other required certification or who is otherwise exempt from backup withholding. US persons who are required to establish their exempt status generally must provide IRS Form W-9 (Request for Taxpayer Identification Number and Certification). Backup withholding is not an additional tax. Amounts withheld as backup withholding may be credited against a holder’s US federal income tax liability. A holder may obtain a refund of any excess amounts withheld under the backup withholding rules by filing the appropriate claim for refund with the IRS and furnishing any required information.
264
▪Information with respect to foreign financial assets
Individuals that own “specified foreign financial assets” with an aggregate value in excess of $50,000 are generally required to file information reports with respect to such assets with their U.S. federal income tax returns. Depending on the individual’s circumstances, higher threshold amounts may apply. “Specified foreign financial assets” include any financial accounts maintained by foreign financial institutions, as well as any of the following, but only if they are not held in accounts maintained by financial institutions: (i) stocks and securities issued by foreign persons, (ii) financial instruments and contracts held for investment that have foreign issuers or counterparties and (iii) interests in foreign entities. Therefore, the shares may be treated as specified foreign financial assets. In such cases, certain US holders may be subject to this information reporting regime and be required to file IRS formForm 8938 listing these assets with their U.S. federal income tax returns. Failure to file information reports may subject a US holder to penalties. US holders are urged to consult their own tax advisors regarding their obligations to file information reports with respect to the shares.
265
10F. DIVIDENDS AND PAYING AGENTS
Not applicable.
10G. STATEMENT BY EXPERTS
Not applicable.
10H. Documents on Display
AngloGold Ashanti files annual reports on Form 20-F and reports on Form 6-K with the SEC. You may access this information at the SEC’s home page (http://www.sec.gov). Copies of the documents referred to herein may be inspected at AngloGold Ashanti’s offices by contacting AngloGold Ashanti at 76 Rahima Moosa Street, Newtown,112 Oxford Road, Houghton Estate, Johannesburg, 2001 (P.O. Box 62117, Marshalltown, 2107)2198 (Private Bag X 20, Rosebank, 2196) South Africa, Attention: Company Secretary, telephone number: +27 11 637 6000.
No material on the AngloGold Ashanti website forms any part of, or is incorporated by reference into, this annual report on Form 20-F. References herein to the company’sCompany’s website shall not be deemed to cause such incorporation.
10I. SUBSIDIARY INFORMATION
Not applicable.
10J. Annual Report to Security Holders
AngloGold Ashanti intends to submit its annual report provided to security holders in electronic format as an exhibit to a current report on Form 6-K.
266
ITEM 11: QUANTITATIVE AND QUALITATIVE DISCLOSURES ABOUT MARKET RISK
TREASURY POLICY
Risk management activities within the groupGroup are the ultimate responsibility of the board of directors.board. The Chief Financial Officer is responsible to the board of directors for the design, implementation and monitoring of the risk management plan. The Audit and Risk Committee is responsible for overseeing risk management plans and systems, as well as financial risks which include a review of treasury activities and exposure to the group’sGroup’s counterparties.
Under the treasuryfinancial and risk management policy, hedges may be put in place once approved by the Board, using approved instruments over the group’sGroup’s planned gold production and resultant gold sales and currency exposures. The tenor of the hedges may extend out to 10 years. The treasuryfinancial and risk management policy sets trading limits on the extent to which the hedge position may change for the various levels of treasury management from dealer, through treasurer, Executive Managementexecutive management team and board members.
The financial risk management activities objectives of the groupGroup are as follows:
•Safeguarding the group’sGroup’s core earnings stream from its major assets through the effective control and management of gold and other commodity price risk, foreign exchange risk and interest rate risk;
•Effective and efficient usage of credit facilities in both the short- and long-term through the adoption of reliable liquidity management planning and procedures;
•Ensuring that investment and hedging transactions are undertaken with creditworthy counterparts; and
•Ensuring that all contracts and agreements related to financial risk management activities are co-ordinated and consistent throughout the groupGroup and comply where necessary with all relevant regulatory and statutory requirements.
Under the treasuryfinancial and risk management policy, treasury reports are produced at the following minimum intervals for review by management and the board of directors.
| • | Daily | Treasury Manager | |||||||||
| • | Weekly | Treasurer | |||||||||
| • | Monthly | ||||||||||
| • | Quarterly | Audit and Risk Committee and Board of Directors | |||||||||
The Treasury Risk Analyst is responsible for monitoring all reports for completeness and accuracy which are reviewed by the Treasurer.
At AngloGold Ashanti, all front office (dealing), middle office (risk reporting), back office (deal confirmations) and payment (treasury settlements) activities are segregated. All treasury transactions are captured on a third party developed treasury and risk management system that is widely used in corporate treasuries. The groupGroup internal audit function conducts regular and ad-hocad hoc reviews of the activities of treasury and the group’sGroup’s treasury system.
Gold price and other commodities risk management activities
In the normal course of its operations, the groupGroup is exposed to gold and other commodity price, currency, interest rate, equity price, liquidity and non-performance risk, which includes credit risk. The groupGroup is also exposed to certain by-product commodity price risk. In order to manage these risks, the groupGroup may enter into transactions which make use of derivatives. The groupGroup has developed a risk management process to facilitate, control and monitor these risks.
Gold price risk arises from the risk of an adverse effect of current or future earnings resulting from fluctuations in the price of gold. The group eliminated its hedge book during 2010 and has since had full exposure to the spot price of gold.
As at 31 December 2020,2022, the groupGroup had no commitments against future production potentially settled in cash.
In July 2022, AngloGold Ashanti entered into forward contracts for a total of 999,000 barrels of Brent Crude oil for the period January 2023 to December 2023 that will be cash settled on a monthly basis against the contract price. The average price achieved on the forward contracts is $89.20 per barrel of Brent Crude oil. At 31 December 2022, the mark-to-market value of these oil derivatives was an unrealised loss of $6 million.
Foreign exchange price risk protection agreements
The group,Group, from time to time, may enter into currency forward exchange and currency option contracts to hedge certain anticipated transactions denominated in foreign currencies. The objective of the group’sGroup’s foreign currency hedging activities is to protect the groupGroup from the risk that the eventual cash flows resulting from transactions denominated in US dollars will be adversely affected by changes in exchange rates.
267
As at 31 December 20202022 and 2019,2021, the groupGroup had no open forward exchange or currency option contracts in its currency hedge position.
Cash flows related to these instruments designated as qualifying hedges are reflected in the consolidated statement of cash flows in the same category as the cash flow from the items being hedged. Accordingly, cash flows relating to the settlement of forward sale commodity derivatives contracts hedging the forecasted sale of production into the spot market will be reflected upon settlement as a component of operating cash flows.
Interest rate and liquidity risk
Fluctuations in interest rates impact interest paid and received on the short-term cash investments and financing activities, giving rise to interest rate risk.
In the ordinary course of business, the groupGroup receives cash from the proceeds of its gold sales and is required to fund its working capital requirements. This cash is managed to ensure that surplus funds are invested in a manner to achieve market related returns while minimising risks.
The groupGroup is able to actively source financing at competitive rates. The counterparts are financial and banking institutions and their credit ratings are regularly monitored by the group.Group.
Cash and loans advanced maturity profile
| 2020 | 2019 | 2022 | 2021 | |||||||||||||||||||||||||||||||||||||||||||||||||||||||||||||||||||||||||||||||||||||||||||
| Maturity date | Maturity date | Currency | Fixed rate investment amount (million) | Effective rate % | Floating rate investment amount (million) | Effective rate % | Fixed rate investment amount (million) | Effective rate % | Floating rate investment amount (million) | Effective rate % | Maturity date | Currency | Fixed rate investment amount (million) | Effective rate % | Floating rate investment amount (million) | Effective rate % | Fixed rate investment amount (million) | Effective rate % | Floating rate investment amount (million) | Effective rate % | ||||||||||||||||||||||||||||||||||||||||||||||||||||||||||||||||||||||||||
| All less than one year | All less than one year | $ | — | 572 | 0.15 | 21 | 0.58 | 103 | 1.09 | All less than one year | $ | 8 | — | 507 | 3.48 | 1 | — | 301 | 0.10 | |||||||||||||||||||||||||||||||||||||||||||||||||||||||||||||||||||||||||||
| ZAR | 2,611 | 3.30 | 29 | 2.00 | 166 | 6.56 | 25 | 5.00 | ZAR | 1,471 | 6.87 | — | 1,337 | 3.54 | — | |||||||||||||||||||||||||||||||||||||||||||||||||||||||||||||||||||||||||||||||
| AUD | — | 50 | — | — | 41 | 0.23 | AUD | — | — | 49 | 1.07 | — | — | 72 | — | |||||||||||||||||||||||||||||||||||||||||||||||||||||||||||||||||||||||||||||||
| BRL | — | 32 | 1.90 | — | 33 | 5.94 | BRL | — | — | 52 | 11.57 | — | — | 106 | 4.27 | |||||||||||||||||||||||||||||||||||||||||||||||||||||||||||||||||||||||||||||||
| ARS | 6,679 | 34.00 | 4,820 | 30.00 | 1,831 | 35.00 | 81 | 28.00 | ARS | 18,178 | 66.50 | 2,362 | 65.50 | 13,256 | 34.00 | — | ||||||||||||||||||||||||||||||||||||||||||||||||||||||||||||||||||||||||||||||
| CAD | — | — | — | — | — | — | 353 | 0.19 | ||||||||||||||||||||||||||||||||||||||||||||||||||||||||||||||||||||||||||||||||||||||
| GBP | — | — | 2 | 1.54 | — | — | — | — | ||||||||||||||||||||||||||||||||||||||||||||||||||||||||||||||||||||||||||||||||||||||
Borrowings maturity profile
| Within one year | Between One and two years | Between Two and five years | After five years | Total | Within one year | Between One and two years | Between Two and five years | After five years | Total | |||||||||||||||||||||||||||||||||||||||||||||||||||||||||||||||||||||||||||||||
| Currency | Currency | Borrowings amount (million) | Effective rate % | Borrowings amount (million) | Effective rate % | Borrowings amount (million) | Effective rate % | Borrowings amount (million) | Effective rate % | Borrowings amount (million) | Currency | Borrowings amount (million) | Effective rate % | Borrowings amount (million) | Effective rate % | Borrowings amount (million) | Effective rate % | Borrowings amount (million) | Effective rate % | Borrowings amount (million) | ||||||||||||||||||||||||||||||||||||||||||||||||||||||||||||||||||||
| $ | $ | 95 | 6.4 | 812 | 5.4 | — | — | 977 | 4.6 | 1,884 | $ | 16 | 5.5 | 63 | 11.9 | 58 | 12.4 | 1,721 | 4.1 | 1,858 | ||||||||||||||||||||||||||||||||||||||||||||||||||||||||||||||||||||
| BRL | 1 | 5.7 | — | — | — | — | — | — | 1 | |||||||||||||||||||||||||||||||||||||||||||||||||||||||||||||||||||||||||||||||
| AUD | AUD | — | — | — | — | 54 | 4.5 | — | — | 54 | ||||||||||||||||||||||||||||||||||||||||||||||||||||||||||||||||||||||||||||||
| TZS | TZS | 108,170 | 12.5 | — | — | — | — | — | — | 108,170 | TZS | 3,586 | 12.5 | 201,542 | 12.5 | — | — | — | — | 205,128 | ||||||||||||||||||||||||||||||||||||||||||||||||||||||||||||||||||||
The table above is based on the borrowings as at 31 December 20202022 including borrowing cost and accrued interest but excludes any fair value adjustments.
268
Interest rate risk
| Fixed for less than one year | Fixed for between one and three years | Fixed for greater than three years | Fixed for less than one year | Fixed for between one and three years | Fixed for greater than three years | |||||||||||||||||||||||||||||||||||||||||||||||||||||||||||||||||||||||||||||||||||
| Currency | Currency | Borrowings amount (million) | Effective rate % | Borrowings amount (million) | Effective rate % | Borrowings amount (million) | Effective rate % | Total Borrowings amount (million) | Currency | Borrowings amount (million) | Effective rate % | Borrowings amount (million) | Effective rate % | Borrowings amount (million) | Effective rate % | Total Borrowings amount (million) | ||||||||||||||||||||||||||||||||||||||||||||||||||||||||||||||||||||||||
| $ | $ | 95 | 6.4 | 812 | 5.4 | 977 | 4.6 | 1,884 | $ | 16 | 5.5 | 128 | 12.1 | 1,714 | 4.1 | 1,858 | ||||||||||||||||||||||||||||||||||||||||||||||||||||||||||||||||||||||||
| BRL | 1 | 5.7 | — | — | — | — | 1 | |||||||||||||||||||||||||||||||||||||||||||||||||||||||||||||||||||||||||||||||||
| AUD | AUD | — | — | — | — | 54 | 4.5 | 54 | ||||||||||||||||||||||||||||||||||||||||||||||||||||||||||||||||||||||||||||||||
| TZS | TZS | 108,170 | 12.5 | — | 0 | — | — | 108,170 | TZS | 3,586 | 12.5 | 201,542 | 12.5 | — | — | 205,128 | ||||||||||||||||||||||||||||||||||||||||||||||||||||||||||||||||||||||||
The table above is based on the borrowings as at 31 December 20202022 including borrowing cost and accrued interest but excludes any fair value adjustments.
Non-performance risk
Realisation of contracts is dependent upon counterparts’ performance. The group has not obtained collateral or other security to support the financial instruments subject to non-performance risk, but the credit standing of counterparts was monitored on a regular basis throughout the year. The group spreads its business over a number of financial and banking institutions to minimise the risk of potential non-performance. Furthermore, the approval process of counterparts and the limits applied to each counterpart were monitored by the board of directors. Where possible, ISDA netting agreements were put in place.
The combined maximum credit risk exposure at balance sheet date amounts to $1,501$1,210 million in 20202022 for financial assets (2019: $644(2021: $1,300 million) and nil million for financial guarantees (2019:(2021: nil). Credit risk exposure netted by open derivative positions with counterparts was nil (2019:(2021: nil). No set-off is applied to balance sheet amounts due to the different maturity profiles of assets and liabilities.
Fair value of financial instruments
The estimated fair values of financial instruments are determined at discrete points in time based on relevant market information. The estimated fair values of the group’sGroup’s financial instruments, as measured at 31 December, are as follows (assets (liabilities)):
| 2020 | 2019 | 2022 | 2021 | |||||||||||||||||||||||||||||||||||||||||||||||||
| Carrying Amount | Fair value | Carrying Amount | Fair value | Carrying Amount | Fair value | Carrying Amount | Fair value | |||||||||||||||||||||||||||||||||||||||||||||
| (millions) | (millions) | $ | $ | $ | $ | (millions) | $ | $ | $ | $ | ||||||||||||||||||||||||||||||||||||||||||
| Cash and cash equivalents | Cash and cash equivalents | 1,330 | 1,330 | 456 | 456 | Cash and cash equivalents | 1,108 | 1,108 | 1,154 | 1,154 | ||||||||||||||||||||||||||||||||||||||||||
| Restricted cash | Restricted cash | 73 | 73 | 64 | 64 | Restricted cash | 60 | 60 | 58 | 58 | ||||||||||||||||||||||||||||||||||||||||||
| Deferred compensation asset | Deferred compensation asset | 28 | 28 | — | — | Deferred compensation asset | 12 | 12 | 25 | 25 | ||||||||||||||||||||||||||||||||||||||||||
| Short-term borrowings | Short-term borrowings | (142) | (142) | (734) | (741) | Short-term borrowings | (18) | (18) | (51) | (51) | ||||||||||||||||||||||||||||||||||||||||||
| Long-term borrowings | Long-term borrowings | (1,789) | (1,989) | (1,299) | (1,394) | Long-term borrowings | (1,965) | (1,808) | (1,858) | (1,960) | ||||||||||||||||||||||||||||||||||||||||||
| Listed investments - FVTPL | — | — | 21 | 21 | ||||||||||||||||||||||||||||||||||||||||||||||||
| Listed investments - FVTOCI | Listed investments - FVTOCI | 186 | 186 | 82 | 82 | Listed investments - FVTOCI | 2 | 2 | 116 | 116 | ||||||||||||||||||||||||||||||||||||||||||
| Listed and unlisted investments | Listed and unlisted investments | 2 | 2 | 67 | 67 | Listed and unlisted investments | 1 | 1 | 1 | 1 | ||||||||||||||||||||||||||||||||||||||||||
The following methods and assumptions were used to estimate the fair value of each class of financial instrument:
Cash restricted for use, cash and cash equivalents
The carrying amounts approximate fair value.
Trade and other receivables and trade and other payables
The carrying amounts approximate fair value because of the short-term duration of these instruments, except for the deferred compensation asset which is carried at fair value in level 3 of the fair value hierarchy.
Listed equity investments classified as FVTOCI and FVTPL are carried at fair value while fixed income investments and other non-current assets are carried at amortised cost. Thein level 1 of the fair value of fixed income investments and other non-current assets has been calculated using market interest rates. The unlisted equity investments are carried at cost.hierarchy.
Borrowings
269
The interest rate on borrowings is reset on a short-term floating rate basis, and accordingly the carrying amount is considered to approximate fair value.
Derivatives
The fair values of volatility-based instruments (i.e., options) are estimated based on market prices, volatilities, credit risk and interest rates for the periods under review.
Gain (loss) on non-hedge derivatives and other commodity contracts recognised
| Year ended 31 December | |||||||||||
| 2020 | 2019 | ||||||||||
| (millions) | $ | $ | |||||||||
Other commodity contracts(1) | (19) | 5 | |||||||||
| Year ended 31 December | |||||||||||
| 2022 | 2021 | ||||||||||
| (millions) | $ | $ | |||||||||
| Other commodity contracts | (6) | — | |||||||||
Foreign exchange risk
Foreign exchange risk arises on financial instruments that are denominated in a foreign currency.
The following table discloses the approximate foreign exchange risk sensitivities of borrowings at 31 December 20202022 (actual changes in the timing and amount of the following variables may differ from the assumed changes below).
| Change in exchange rate | Change in borrowings Total | |||||||||||||
| $M | ||||||||||||||
| Debt | ||||||||||||||
| TZS denominated (TZS/$) | Spot (+TZS250) | |||||||||||||
| AUD denominated (AUD/$) | Spot (+AUD0.1) | (2) | ||||||||||||
| Change in exchange rate | Change in borrowings Total | |||||||||||||
| $M | ||||||||||||||
| Debt | ||||||||||||||
| TZS denominated (TZS/$) | Spot (-TZS250) | |||||||||||||
| AUD denominated (AUD/$) | Spot (-AUD0.1) | 2 | ||||||||||||
270
ITEM 12: DESCRIPTION OF SECURITIES OTHER THAN EQUITY SECURITIES
12A. DEBT SECURITIES
Not applicable
12B. WARRANTS AND RIGHTS
Not applicable
12C. OTHER SECURITIES
Not applicable
12D. AMERICAN DEPOSITARY SHARES
12D.3. DEPOSITARY FEES AND CHARGES
AngloGold Ashanti’s American Depositary Shares, or ADSs, each representing one of AngloGold Ashanti’s ordinary shares, are traded on the New York Stock Exchange under the symbol “AU.”“AU”. The ADSs are evidenced by American Depositary Receipts, or ADRs, issued by The Bank of New York Mellon, as Depositary under the Amended and Restated Deposit Agreement dated as of 3 June 2008, among AngloGold Ashanti Limited, The Bank of New York Mellon and owners and beneficial owners of from time to time of ADRs. ADS holders may have to pay the following service fees to the Depositary:
| Service | Fees (USD) | |||||||
| Issuance of ADSs | Up to 5 cents per ADS | (1) | ||||||
| Cancellation of ADSs | Up to 5 cents per ADS | (1) | ||||||
| Distribution of cash dividends or other cash distributions | Up to 2 cents per ADS | (2) | ||||||
| Distribution of securities pursuant to | ||||||||
| (i) stock dividends, free stock distributions or | ||||||||
| (ii) exercises of rights to purchase additional ADSs | Up to 5 cents per ADS | (2) | ||||||
| ADR Depositary Services fee | Up to 2 cents per year | (2) | ||||||
(1) These fees are typically paid to the Depositary by the brokers on behalf of their clients receiving the newly-issued ADSs from the Depositary and by the brokers on behalf of their clients delivering the ADSs to the Depositary for cancellation. The brokers in turn charge these transaction fees to their clients.
(2) In practice, the Depositary has not collected these fees. If collected, such fees are offset against the related distribution made to the ADR holder.
In addition, ADS holders are responsible for certain fees and expenses incurred by the Depositary on their behalf including (1) taxes and other governmental charges, (2) such registration fees as may from time to time be in effect for the registration of transfers of ordinary shares generally on the share register and applicable to transfers of ordinary shares to the name of the Depositary or its nominee or the Custodian or its nominee on the making of deposits or withdrawals, and (3) such cable, telex and facsimile transmission expenses as are expressly incurred by the Depositary in the conversion of foreign currency.
Fees and other charges payable by the Depositary, any of the Depositary’s agents, including the Custodian, or the agents of the Depositary’s agents in connection with the servicing of Shares or other Deposited Securities, shall be collected at the sole discretion of the Depositary by billing such owners for such charge or by deducting such charge from one or more cash dividends or other cash distributions.
For further information, refer to “Item“Item 10C: Material Contracts - Contracts—The Deposit Agreement”.
12D.4. DEPOSITARY PAYMENTS FOR 20202022
For the year ended 31 December 2020,2022, The Bank of New York Mellon, as Depositary, reimbursed AngloGold Ashanti an amount of $1,057,722 (2019: $1,097,316)$934,248 (2021: $1,083,405) mainly for investor relations relatedrelations-related expenses.
271
PART II
ITEM 13: DEFAULTS, DIVIDEND ARREARAGES AND DELINQUENCIES
None.
272
ITEM 14: MATERIAL MODIFICATIONS TO THE RIGHTS OF SECURITY HOLDERS AND USE OF PROCEEDS
None.
273
ITEM 15: CONTROLS AND PROCEDURES
(a) Disclosure Controls and Procedures: As of 31 December 2020,2022, (the “Evaluation Date”), the company,Company, under the supervision and with the participation of its management, including the chief executive officer and chief financial officer has evaluated the effectiveness of the company’sCompany’s disclosure controls and procedures (as defined in Rules 13a - 15(e) and 15d - 15(e) under the Securities Exchange Act of 1934, as amended (the "Exchange Act"“Exchange Act”)). Based on such evaluation, the chief executive officer and chief financial officer have concluded that, as of the Evaluation Date, the company’sCompany’s disclosure controls and procedures are effective, and are reasonably designed to ensure that information required to be disclosed by the companyCompany in reports that it files or submits under the Exchange Act is recorded, processed, summarized and reported within the time periods specified in the rules and forms of the Securities and Exchange Commission. These disclosure controls and procedures include without limitation, controls and procedures designed to ensure that information required to be disclosed by the companyCompany in reports that it files or submits under the Exchange Act is accumulated and communicated to the company’sCompany’s management, including its chief executive officer and chief financial officer, as appropriate to allow timely decisions regarding disclosure.
(b)Management’s Annual Report on Internal Control over Financial Reporting: Management is responsible for establishing and maintaining adequate internal control over financial reporting for the company,Company, as defined in the Exchange Act Rule 13a - 15(f) and 15d -15(f). The company’sCompany’s internal control over financial reporting is a process designed to provide reasonable assurance regarding the reliability of financial reporting and the preparation of the company’sCompany’s financial statements for external purposes in accordance with International Financial Reporting Standards as issued by the International Accounting Standards Board.
The company’sCompany’s internal control over financial reporting includes those policies and procedures that:
•Pertain to the maintenance of records that, in reasonable detail, accurately and fairly reflect transactions and dispositions of the assets of the company;Company;
•Provide reasonable assurance that the transactions are recorded as necessary to permit preparation of financial statements in accordance with generally accepted accounting principles, and that receipts and expenditures of the companyCompany are being made only in accordance with authorisations of management and the Directors of the company;Company; and
•Provide reasonable assurance regarding prevention or timely detection of unauthorised acquisition, use, or disposition of the company’sCompany’s assets that could have a material effect on the financial statements.
Because of inherent limitations, internal control over financial reporting may not prevent or detect misstatements.Projections of any evaluation of effectiveness to future periods is subject to the risk that controls may become inadequate because of changes in conditions, or that the degree of compliance with policies and procedures may deteriorate.
The company’sCompany’s management assessed the effectiveness of the company’sCompany’s internal control over financial reporting as of the Evaluation Date. In making this assessment, management used the criteria set forth by the Committee of Sponsoring Organisations of the Treadway Commission (COSO) in Internal Control - Integrated Framework and related illustrative documents released on 14 May 2013. Based on this assessment, and using those criteria, management concluded that the company’sCompany’s internal control over financial reporting was effective as of the Evaluation Date.
(c) Changes in Internal Control over Financial Reporting: The Company maintains a system of internal control over financial reporting that is designed to provide reasonable assurance that its books and records accurately reflect transactions and that established policies and procedures are followed.
There have been no further changes in the company’sCompany’s internal control over financial reporting identified in connection with the evaluation required by paragraph (d) of Exchange Act Rule 13(a) - 15 during the year ended 31 December 20202022 that have materially affected, or are reasonably likely to materially affect, the company’s internal control over financial reporting.
See also “Item 3D,3D: Risk Factors of this annual report on Form 20F for risk factors related—AngloGold Ashanti’s inability to maintainingmaintain an effective system of internal control over financial reporting.reporting may have an adverse effect on investors’ confidence in the reliability of its financial statements.”
(d)Attestation Report of the Registered Public Accounting Firm: The Company’s independent registered accounting firm, Ernst & Young Inc., has issued an attestation report on the effectiveness of the company’sCompany’s internal control over financial reporting.This report appears below.
/s/ I KramerG A Doran
/s/ KC RamonA Calderon
REPORT OF INDEPENDENT REGISTERED PUBLIC ACCOUNTING FIRM
Opinion on Internal Control over Financial Reporting
We have audited AngloGold Ashanti Limited’s (the Company) internal control over financial reporting as of 31 December 2020,2022, based on criteria established in Internal Control—Integrated Framework issued by the Committee of Sponsoring Organizations of the Treadway Commission (2013 framework) (the COSO criteria). In our opinion, AngloGold Ashanti Limited (the Company)the Company maintained, in all material respects, effective internal control over financial reporting as of 31 December 2020,2022, based on the COSO criteria.
We also have audited, in accordance with the standards of the Public Company Accounting Oversight Board (United States) (PCAOB), the consolidated statement of financial position of AngloGold Ashanti Limitedthe Company as of 31 December 2020, 20192022, 2021 and 2018,2020, the related consolidated statements of income, comprehensive income, cash flows and changes in equity for each of the three years in the period ended 31 December 2020,2022, and the related notes and our report dated 2617 March 20212023 expressed an unqualified opinion thereon.
Basis for Opinion
The Company’s management is responsible for maintaining effective internal control over financial reporting and for its assessment of the effectiveness of internal control over financial reporting included in the accompanying Management’s Annual Report on Internal Control over Financial Reporting. Our responsibility is to express an opinion on the Company’s internal control over financial reporting based on our audit. We are a public accounting firm registered with the PCAOB and are required to be independent with respect to the Company in accordance with the U.S. federal securities laws and the applicable rules and regulations of the Securities and Exchange Commission and the PCAOB.
We conducted our audit in accordance with the standards of the PCAOB. Those standards require that we plan and perform the audit to obtain reasonable assurance about whether effective internal control over financial reporting was maintained in all material respects.
Our audit included obtaining an understanding of internal control over financial reporting, assessing the risk that a material weakness exists, testing and evaluating the design and operating effectiveness of internal control based on the assessed risk, and performing such other procedures as we considered necessary in the circumstances. We believe that our audit provides a reasonable basis for our opinion.
Definition and LimitationLimitations of Internal Control overOver Financial Reporting
A company’s internal control over financial reporting is a process designed to provide reasonable assurance regarding the reliability of financial reporting and the preparation of financial statements for external purposes in accordance with generally accepted accounting principles. A company’s internal control over financial reporting includes those policies and procedures that (1) pertain to the maintenance of records that, in reasonable detail, accurately and fairly reflect the transactions and dispositions of the assets of the company; (2) provide reasonable assurance that transactions are recorded as necessary to permit preparation of financial statements in accordance with generally accepted accounting principles, and that receipts and expenditures of the company are being made only in accordance with authorizations of management and directors of the company; and (3) provide reasonable assurance regarding prevention or timely detection of unauthorized acquisition, use, or disposition of the company’s assets that could have a material effect on the financial statements.
Because of its inherent limitations, internal control over financial reporting may not prevent or detect misstatements. Also, projections of any evaluation of effectiveness to future periods are subject to the risk that controls may become inadequate because of changes in conditions, or that the degree of compliance with the policies or procedures may deteriorate.
/s/ Ernst & Young Inc.
Johannesburg, Republic of South Africa
275
ITEM 16A: AUDIT COMMITTEE FINANCIAL EXPERT
Membership of the Audit and Risk Committee, including its chairman, comprises only independent non-executive directors, in compliance with the Sarbanes-Oxley Act. This also fulfils the guidelines of King IV, which became effective 1 November 2016, and the requirements of the SA Companies Act, No. 71 of 2008, which became effective on 1 May 2011. The Sarbanes-Oxley Act requires the board to identify a financial expert from within its ranks. The board has resolved that Mr. Rhidwaan GasantAlan Ferguson is the Audit and Risk Committee'sCommittee’s financial expert. Individually, the remaining members of the committeeAudit and Risk Committee have considerable knowledge and experience in associated areas such as audit, risk and corporate governance to help oversee and guide the board and the company.Company.
276
ITEM 16B: CODE OF ETHICS AND WHISTLE-BLOWING POLICIES
In order to comply with the company'sCompany’s obligation in terms of the Sarbanes-Oxley Act and King IV, and in the interests of good governance, the companyCompany has systems and procedures to introduce, monitor and enforce its ethical codes and has adopted a code of business principles and ethics for employees and directors, a code of ethics for the Chief Executive Officer, Chief Financial Officer and Senior Financial Officers, and a whistle-blowing policy that encourages employees to report anonymously if they wish and without fear of retaliation acts of an unethical or illegal nature that affect the company'sCompany’s interests. The code of business principles and ethics expresses the company’sCompany’s commitment to the conduct of its business in line with ethical standards and is designed to enable employees and directors to perform their roles and duties with integrity and responsibility.
The whistle-blowing policy provides channels for employees to report acts and practices that are in conflict with the company’sCompany’s code of business principles and ethics or are unlawful, including financial malpractice or dangers to the public or the environment. Reports may be made to management or through several mediums including the intranet, internet, telephone, short messaging system (sms), fax and post. All reports not made to management are administered by a third party, Tip-Offs Anonymous, to ensure independence of the process. Reported cases are relayed to management through group compliance and group internal audit.compliance. A report is provided by group compliance and group internal audit to the Serious Concerns Committee, a management committee, on a quarterly basis as well as the Social, Ethics and Sustainability Committee and the Audit and Risk Committee on a quarterly basis. Reporters have the option to request feedback on reported cases. The whistle-blowing policy encourages reports to be made in good faith in a responsible and ethical manner. Employees are encouraged to first seek resolution of alleged malpractices through discussion with their direct managers, if appropriate, or other management including legal, compliance, human resources or internal audit.
The code of business principles and ethics for employees and directors and the code of ethics for the Chief Executive Officer, Chief Financial Officer and Senior Financial Officers are available on the company’sCompany’s website at https://www.anglogoldashanti.com/company/sustainability/governance/policies-standards/ .
277
ITEM 16C: PRINCIPAL ACCOUNTANT FEES AND SERVICES
Ernst & Young Inc. has served as AngloGold Ashanti’s independent public accountants for each of the financial years in the three-year period ended 31 December 2020,2022, for which audited financial statements appear in this annual report on Form 20-F.
The following table presents the aggregate fees for professional services and other services rendered by Ernst & Young Inc. to AngloGold Ashanti in 20202022 and 2019.2021.
| 2020 | 2019 | ||||||||||
| (in millions) | $ | $ | |||||||||
Audit fees(1) | 6.02 | 5.77 | |||||||||
Audit-related fees(2) | 1.80 | 1.14 | |||||||||
Tax fees(3) | 0.32 | 0.07 | |||||||||
All other fees(4) | 0.01 | 0.09 | |||||||||
| Total | 8.15 | 7.07 | |||||||||
| 2022 | 2021 | ||||||||||
| (in millions) | $ | $ | |||||||||
Audit fees(1) | 6.45 | 5.87 | |||||||||
Audit-related fees(2) | 1.91 | 2.10 | |||||||||
Tax fees(3) | 0.22 | 0.03 | |||||||||
All other fees(4) | 0.02 | 0.01 | |||||||||
| Total | 8.60 | 8.01 | |||||||||
Rounding may result in computational differences.
(1) The Audit fees consist of fees billed for the annual audit services engagement and other audit services, which are those services that only the external auditor reasonably can provide, and include the Company audit; statutory audits; attest services; and assistance with and review of documents filed with the SEC.
(2) Audit-related fees consist of fees billed for assurance and related services.
(3) Tax fees include fees billed for tax advice and tax compliance services.
(4) All other fees include non-audit services.
Audit and Risk Committee Pre-approval Policies and Procedures
It is the policy of AngloGold Ashanti to maintain compliance with the requirements of the various applicable legislation and good governance practices when appointing or assigning work to the Company’s external auditor. Non-audit services may not be undertaken without an employee of AngloGold Ashanti obtaining the pre-approval of the Audit and Risk Committee as is laid out in the procedures relating to the pre-approval process.
The Audit and Risk Committee has delegated the approval authority to the chairman of the committee, Mr. Rhidwaan Gasant (1 January 2020 to 30 November 2020) and Mr. Alan Ferguson (from 1 December 2020 to date) or his designated official. The approval may take the form of a written or oral instruction, and in the case of an oral instruction this would be ratified at the next Audit and Risk Committee meeting. On a half yearly basis a summary of all approvals and work to date is tabled at the Audit and Risk Committee meeting.
All non-audit services provided to AngloGold Ashanti by the principal independent registered public accounting firm during 20202022 were reviewed and approved according to the procedures above. None of the services provided during 20202022 were approved under the de minimis exception allowed under the Exchange Act.
ITEM 16D: EXEMPTIONS FROM THE LISTING STANDARDS FOR AUDIT COMMITTEES
Not applicable.
ITEM 16E: PURCHASES OF EQUITY SECURITIES BY THE ISSUER AND AFFILIATED PURCHASERS
Neither the issuer nor any affiliate of the issuer purchased any of the company’sCompany’s shares during 2020.
2022.
ITEM 16F: CHANGE IN REGISTRANT’S CERTIFYING ACCOUNTANT
On 19 November 2021, PwC was appointed by the AngloGold Ashanti Limited’s Board of Directors as the Company’s independent principal accountants for the financial year ending 31 December 2023 after a formal tender process to appoint a new independent registered public accounting firm. The appointment of PwC was approved by AngloGold Ashanti’s shareholders at the AGM on 16 May 2022. Ernst & Young Inc. (EY) will resign as independent principal accountants of the Group on conclusion of its responsibilities relating to the 31 December 2022 financial year audit, which is expected to conclude during April 2023.
The reports of EY on the Company’s consolidated financial statements for the past two fiscal years did not contain an adverse opinion or a disclaimer of opinion, and were not qualified or modified as to uncertainty, audit scope, or accounting principles. In connection with the audits of the Company’s financial statements for each of the two fiscal years ended 31 December 2022, there were (i) no disagreements with EY, as that term is used in Item 16F(a)(1)(iv) of Form 20-F over any matters of accounting principles or practices, financial statement disclosure, or auditing scope or procedures, which, if not resolved to the satisfaction of EY, would have caused EY to make reference to the matter in their report and (ii) there were no “reportable events” as defined in Item 16F(a)(1)(v) of Form 20-F.
278
AngloGold Ashanti has provided EY with a copy of Contentsthe foregoing disclosure and has requested EY to provide it with a letter addressed to the SEC stating whether or not EY agrees with the above statements. A copy of such letter, dated 17 March 2023, in which EY state they agree with such disclosure, is filed as an exhibit to this annual report on Form 20-F, see “Item 19: Exhibits to the Form 20-F—Exhibit 19.15.9. “Letter from Ernst & Young Inc. to the Securities and Exchange Commission regarding a change in registrant's certifying accountant”.
ITEM 16G: CORPORATE GOVERNANCE
AngloGold Ashanti’s corporate governance practices are regulated by the JSE Listings Requirements. The following is a summary of the significant ways in which South Africa’s corporate governance standards which are followed by AngloGold Ashanti differ from those followed by U.S.US domestic companies under the NYSE Listing Standards. At this time, as described further below, AngloGold Ashanti complies with all of the NYSE Listing Standards as well as the JSE Listings Requirements.
The NYSE Listing Standards require that non-management directors of US-listed companies meet at regularly scheduled executive sessions without management. The JSE Listings Requirements do not require such meetings of listed company non-executive directors. AngloGold Ashanti’s non-management directors meet regularly without management.However, management is invited to attend the executive section of board meetings.
The NYSE Listing Standards require US-listed companies to have a nominating/corporate governance committee composed entirely of independent directors. The JSE Listings Requirements do not require such a committee but AngloGold Ashanti currently has a Nominations and Governance Committee composed of six non-executive directors, all of whom are independent under the JSE Listings Requirements and NYSE Listing Standards. The Nominations and Governance Committee is chaired by the ChairmanChairperson of the AngloGold Ashanti Board.
The NYSE Listing Standards also require US-listed companies to have a compensation committee composed entirely of independent directors. The JSE Listings Requirements merely require that boards have such a committee but not that its members be independent. AngloGold Ashanti has appointed a Remuneration and Human Resources Committee, currently comprised of four non-executive directors, all of whom are independent under the JSE Listings Requirements and NYSE Listing Standards. The Remuneration and Human Resources Committee is chaired by the Chairman of the AngloGold Ashanti Board.
The NYSE Listings Standards require US-listed companies to have an audit committee composed entirely of independent directors. The SA Companies Act requires that the members of the Audit Committee be approved by shareholders on an annual basis at a company’s annual general meeting. Both the SA Companies Act and the JSE Listings Requirements require that the audit committee be composed entirely of independent directors. AngloGold Ashanti has appointed an Audit and Risk Committee, currently comprising fourthree (pending shareholder approval at the 2023 AGM of the appointment of two additional non-executive directors to the Audit and Risk Committee) non-executive directors, all of whom are independent, as defined under the SA Companies Act, the JSE Listings Requirements and the NYSE Listing Standards.
The SA Companies Act and the JSE Listings Requirements require the appointment of a Social and Ethics Committee, and AngloGold Ashanti has appointed a Social, Ethics and EthicsSustainability Committee, comprising independent non-executive directors.
ITEM 16H: MINE SAFETY DISCLOSURE
The information concerning certain mine safety violations or other regulatory matters required pursuant to Section 1503(a) of the Dodd-Frank Wall Street Reform and Consumer Protection Act and this Item 16H of Form 20-F is included in Exhibit 19.16 to this annual report on Form 20-F.
ITEM 16I: DISCLOSURE REGARDING FOREIGN JURISDICTIONS THAT PREVENT
INSPECTIONS
Not applicable.
279
PART III
ITEM 17: FINANCIAL STATEMENTS
Not applicable.
280
ITEM 18: FINANCIAL STATEMENTS
The consolidated financial statements for the year ended 31 December 20202022 were authorised for issue by the Board of Directors on 2615 March 20212023 and were signed on its behalf by Kandimathie Christine Ramon, InterimGillan A Doran, Chief ExecutiveFinancial Officer, Maria DC Ramos, ChairmanChairperson of the Board of Directors, and Alan Ferguson, ChairmanChairperson of the Audit and Risk Committee.
The report of independent registered public accounting firm Ernst & Young Inc. Johannesburg, Republic of South Africa (PCAOB ID # 1698) is included in Item 18.
F - 1
Report of independent registered public accounting firm
To the shareholdersShareholders and the boardBoard of directorsDirectors of AngloGold Ashanti Limited
Opinion on the Financial Statements
We have audited the accompanying consolidated statement of financial position of AngloGold Ashanti Limited (“the Company”)(the Company) as of 31 December 2020, 20192022, 2021 and 2018,2020, the related consolidated statements of income, comprehensive income, cash flows and changes in equity for each of the three years in the period ended 31 December 2020,2022, and the related notes (collectively referred to as the “consolidated financial statements”). In our opinion, based on our audits and the report of other auditors, the consolidated financial statements present fairly, in all material respects, the financial position of the Company at 31 December 2020, 20192022, 2021 and 2018,2020, and the results of its operations and its cash flows for each of the three years in the periodthen ended, 31 December 2020, in conformity with International Financial Reporting Standards (“IFRS’IFRS”) as issued by the International Accounting Standards Board.
We did not audit the financial statements of Kibali (Jersey) Limited (“Kibali”)(Kibali), a corporation in which the Company has a 50% interest. In the consolidated financial statements, the Company’s investment in Kibali was stated at $1,063 million, $1,604 million $1,506 million and $1,439$1,604 million as of 31 December 2022, 2021 and 2020, 2019respectively, and 2018, respectively, the Company’s equity in the net income of Kibali was stated at $153 million in 2022, $231 million in 2021 and, $238 million in 2020, $143 million in 2019 and, $104 million in 2018.2020. Those statements were audited by other auditors whose report has been furnished to us, and our opinion, insofar as it relates to the amounts included for Kibali, is based solely on the report of the other auditors.
We also have audited, in accordance with the standards of the Public Company Accounting Oversight Board (United States) (PCAOB), the Company’s internal control over financial reporting as of 31 December 2020,2022, based on criteria established in Internal Control-Integrated Framework issued by the Committee of Sponsoring Organizations of the Treadway Commission (2013 framework) and our report dated 2617 March 20212023 expressed an unqualified opinion thereon.
Basis for Opinion
These financial statements are the responsibility of the Company's management. Our responsibility is to express an opinion on the Company’s financial statements based on our audits. We are a public accounting firm registered with the PCAOB and are required to be independent with respect to the Company in accordance with the U.S. federal securities laws and the applicable rules and regulations of the U.S. Securities and Exchange Commission and the PCAOB.
We conducted our audits in accordance with the standards of the PCAOB. Those standards require that we plan and perform the audit to obtain reasonable assurance about whether the financial statements are free of material misstatement, whether due to error or fraud. Our audits included performing procedures to assess the risks of material misstatement of the financial statements, whether due to error or fraud, and performing procedures that respond to those risks. Such procedures included examining, on a test basis, evidence regarding the amounts and disclosures in the financial statements. Our audits also included evaluating the accounting principles used and significant estimates made by management, as well as evaluating the overall presentation of the financial statements. We believe that our audits and the report of other auditors provide a reasonable basis for our opinion.
Critical Audit Matters
The critical audit matters communicated below are matters arising from the current period audit of the financial statements that were communicated or required to be communicated to the audit committee and that: (1) relate to accounts or disclosures that are material to the financial statements and (2) involved our especially challenging, subjective or complex judgments.judgements. The communication of critical audit matters does not alter in any way our opinion on the consolidated financial statements, taken as a whole, and we are not, by communicating the critical audit matters below, providing separate opinions on the critical audit matters or on the accounts or disclosures to which they relate.
F - 2
The Company used a probability weighted discounted cash flow model to measure the deferred compensation. The significant inputs and assumptions used in each scenario of the discounted cash flow model, included the production plan over the agreed upon period and the weighted average cost of capital (WACC). The determination of the fair value of the deferred compensation involved complex auditor judgment, due to the subjectivity of these significant assumptions and inputs, as well as the weighted probabilities and required the inclusion of specialists on our team. | |||||
We read the executed sale agreement to obtain an understanding of the structure of the sale and the deferred compensation, including an assessment of whether all conditions precedent to the sale were met at the effective date of the transaction. We recalculated the loss on disposal, which included the deferred compensation component made up of various judgements around the production plan per year, applicable discount rates for the agreed upon period and the relative weightings attached to each scenario. For the discount rate, with the support of our valuation specialists, we assessed management’s WACC by comparing it to our independently calculated WACC. For the production plan, we compared the plan to the previous production profiles developed by the Company and analysed the actual production versus that contained in the production plan underlying each scenario. We evaluated the weighted probabilities assigned to each scenario by considering the Company’s historical and year to date production and any available published information from the buyer, regarding its estimated production plan. We evaluated the related disclosures in the consolidated financial statements. | |||||
| Description of the | |||||
| Geita VAT recoverability | |||||
As disclosed in Note The In the current year, new correspondence and information was received from the TRA The Government of Tanzania and Geita Gold Mine (GGM). Auditing | |||||
| How We Addressed the Matter in Our Audit | Our procedures to address this matter included, among others, obtaining an understanding, evaluating the design and testing the operating effectiveness of controls over the Company’s assessment of tax law and the process to estimate the recoverability of the VAT receivable. We read correspondence between management As part of our audit procedures, we met with management to understand their strategy to resolve the matter and obtain an update on progress made and discussions that took place with the relevant parties during the year. We also assessed whether the draft agreements exchanged with the Government of Tanzania were consistent with management’s stated strategy to fully recover the carrying value of the receivables. We read the external legal counsel opinions obtained by management to support their interpretation of the tax legislation manner undertaken or proposed by the Company. We involved our tax professionals We We evaluated management’s assessment of the various scenarios in the model, by performing a sensitivity analysis, taking into account alternative weighting probability scenarios. We | ||||
F - 43
| Description of the Matter | |||||
At 31 December The Company incurs obligations to close, restore and rehabilitate its mine sites. Auditing the The consolidated disclosures are included in Note 1.2 and Note | |||||
| How We Addressed the Matter in Our Audit | Our procedures to address this matter included, among others, obtaining an understanding, evaluating the design and testing the operating effectiveness of controls over the With the support of our valuation specialists, we assessed management’s macro-economic assumptions in their rehabilitation models by comparing them to available market information. The most significant of these macro-economic assumptions were the risk-free interest rates, expected inflation and exchange rates. To assess the rehabilitation models prepared by management, among other procedures, we tested the mathematical accuracy With the support of our environmental specialists, we inquired of operational management whether additional environmental | ||||
| Description of the Matter | Impairment assessment of AGA Mineração | ||||
As described in Notes 1.2 and 13 to the consolidated financial statements, the Group conducts an impairment test whenever events or changes in circumstances indicate that the carrying amount for a cash generating unit (“CGU”) may not be recoverable. An impairment loss is recognised in the income statement for the amount by which the asset’s carrying amount exceeds its recoverable amount. During the year, the AGA Mineração CGU was disaggregated into two separate CGUs, namely Córrego do Sítio (CdS) and Cuiabá, following management’s reinvestment strategy to assess strategic options for CdS, as a result of the continued underperformance of the CdS complex. Further and in December 2022, processing of gold concentrate at the Queiroz plant which services the Cuiabá mine complex was suspended. These events were impairment indicators, which required the Group to conduct an impairment test on these CGUs. A gross impairment of $189 million for CdS and $70 million for Cuiabá was recorded for the year ended 31 December 2022. Auditing the assessment of the recoverable amount of these CGUs involved significant auditor judgment, since there are a number of forward looking and other assumptions that require significant estimation, including the extent of economic mineral resource and reserve and associated life of mine plans, discount rate, future gold prices, foreign exchange rates and specifically for Cuiaba, the probability weighted discounted cash flows including the period of suspension of operations at the Queiroz plant due to the completion of structural improvements, as well as the application of judgment around the disaggregation of the AGA Mineração CGU into two CGUs. | |||||
F - 4
| How We | Our procedures to address this matter included, among others, obtaining an understanding, evaluating the design and testing the operating effectiveness of controls over the Company’s impairment trigger assessment and the preparation, review and approval of the impairment calculation. For example, we evaluated management’s methods, processes and controls determining the carrying values, and the associated recoverable amounts of each CGU. We assessed management’s disaggregation of the CGUs by, among other procedures, reference to whether an active market exists for the output produced by each CGU. With the support of our We also involved our valuation specialists to evaluate the discount rate, by independently calculating a discount rate range using available market information and comparing to management’s discount rate. In addition, we performed sensitivity analyses to evaluate the impact of reasonably possible changes in the key assumptions including discount rate, future gold prices and for Cuiabá, the impact of delay in the net cash flows due to possible delays in the projected timelines of completion of structural improvements. To assess the cash flow models prepared by management, among other procedures, we tested the mathematical accuracy and compared relevant data therein to To test management’s assessment of the We compared our results to We assessed the adequacy of | ||||
/s/ Ernst & Young Inc.
We have served as the Company’s auditor since 1944
Johannesburg, Republic of South Africa
F - 5
PAGE LEFT BLANK INTENTIONALLY
F - 6
ANGLOGOLD ASHANTI LIMITED
Group – income statement
FOR THE YEARS ENDED December 31, 2020, 20192022, 2021 and 20182020
| 2020 | 2019 | 2018 | ||||||||||||||||||||||||||||||||||||||
| Figures in millions | Figures in millions | Notes | Figures in millions | Notes | 2022 | 2021 | 2020 | |||||||||||||||||||||||||||||||||
Restated (1) | ||||||||||||||||||||||||||||||||||||||||
| US Dollars | US Dollars | |||||||||||||||||||||||||||||||||||||||
| Continuing operations | Continuing operations | Continuing operations | ||||||||||||||||||||||||||||||||||||||
| Revenue from product sales | Revenue from product sales | 3 | 4,427 | 3,525 | 3,336 | Revenue from product sales | 3 | 4,501 | 4,029 | 4,595 | ||||||||||||||||||||||||||||||
| Cost of sales | Cost of sales | 4 | (2,699) | (2,626) | (2,584) | Cost of sales | 4 | (3,362) | (2,857) | (2,829) | ||||||||||||||||||||||||||||||
| (Loss) gain on non-hedge derivatives and other commodity contracts | (Loss) gain on non-hedge derivatives and other commodity contracts | (19) | 5 | (2) | (Loss) gain on non-hedge derivatives and other commodity contracts | (6) | — | (19) | ||||||||||||||||||||||||||||||||
| Gross profit | Gross profit | 2 | 1,709 | 904 | 750 | Gross profit | 2 | 1,133 | 1,172 | 1,747 | ||||||||||||||||||||||||||||||
| Corporate administration, marketing and other expenses | 5 | (68) | (82) | (76) | ||||||||||||||||||||||||||||||||||||
| Corporate administration, marketing and related expenses | Corporate administration, marketing and related expenses | (79) | (73) | (68) | ||||||||||||||||||||||||||||||||||||
| Exploration and evaluation costs | Exploration and evaluation costs | (124) | (112) | (98) | Exploration and evaluation costs | (205) | (164) | (124) | ||||||||||||||||||||||||||||||||
| Impairment, derecognition of assets and profit (loss) on disposal | Impairment, derecognition of assets and profit (loss) on disposal | (1) | (6) | (7) | Impairment, derecognition of assets and profit (loss) on disposal | (304) | 11 | (1) | ||||||||||||||||||||||||||||||||
| Other (expenses) income | Other (expenses) income | 6 | (57) | (83) | (79) | Other (expenses) income | 5 | (26) | (136) | (57) | ||||||||||||||||||||||||||||||
| Operating profit | Operating profit | 1,459 | 621 | 490 | Operating profit | 519 | 810 | 1,497 | ||||||||||||||||||||||||||||||||
| Interest income | Interest income | 27 | 14 | 8 | Interest income | 81 | 58 | 27 | ||||||||||||||||||||||||||||||||
| Dividend received | Dividend received | 2 | 0 | 2 | Dividend received | — | — | 2 | ||||||||||||||||||||||||||||||||
| Foreign exchange and other gains (losses) | 0 | (12) | (9) | |||||||||||||||||||||||||||||||||||||
| Foreign exchange and fair value adjustments | Foreign exchange and fair value adjustments | (128) | (43) | — | ||||||||||||||||||||||||||||||||||||
| Finance costs and unwinding of obligations | Finance costs and unwinding of obligations | 7 | (177) | (172) | (168) | Finance costs and unwinding of obligations | 6 | (149) | (116) | (177) | ||||||||||||||||||||||||||||||
| Share of associates and joint ventures’ profit (loss) | 8 | 278 | 168 | 122 | ||||||||||||||||||||||||||||||||||||
| Profit (loss) before taxation | 1,589 | 619 | 445 | |||||||||||||||||||||||||||||||||||||
| Share of associates and joint ventures’ profit | Share of associates and joint ventures’ profit | 7 | 166 | 249 | 278 | |||||||||||||||||||||||||||||||||||
| Profit before taxation | Profit before taxation | 489 | 958 | 1,627 | ||||||||||||||||||||||||||||||||||||
| Taxation | Taxation | 12 | (625) | (250) | (212) | Taxation | 10 | (173) | (312) | (625) | ||||||||||||||||||||||||||||||
| Profit (loss) after taxation from continuing operations | 964 | 369 | 233 | |||||||||||||||||||||||||||||||||||||
| Profit after taxation from continuing operations | Profit after taxation from continuing operations | 316 | 646 | 1,002 | ||||||||||||||||||||||||||||||||||||
| Discontinued operations | Discontinued operations | Discontinued operations | ||||||||||||||||||||||||||||||||||||||
| Profit (loss) from discontinued operations | Profit (loss) from discontinued operations | 9 | 7 | (376) | (83) | Profit (loss) from discontinued operations | — | — | 7 | |||||||||||||||||||||||||||||||
| Profit (loss) for the year | Profit (loss) for the year | 971 | (7) | 150 | Profit (loss) for the year | 316 | 646 | 1,009 | ||||||||||||||||||||||||||||||||
| Allocated as follows: | Allocated as follows: | Allocated as follows: | ||||||||||||||||||||||||||||||||||||||
| Equity shareholders | Equity shareholders | Equity shareholders | ||||||||||||||||||||||||||||||||||||||
| - Continuing operations | - Continuing operations | 946 | 364 | 216 | - Continuing operations | 297 | 622 | 984 | ||||||||||||||||||||||||||||||||
| - Discontinued operations | - Discontinued operations | 7 | (376) | (83) | - Discontinued operations | — | — | 7 | ||||||||||||||||||||||||||||||||
| Non-controlling interests | Non-controlling interests | Non-controlling interests | ||||||||||||||||||||||||||||||||||||||
| - Continuing operations | - Continuing operations | 18 | 5 | 17 | - Continuing operations | 19 | 24 | 18 | ||||||||||||||||||||||||||||||||
| 971 | (7) | 150 | 316 | 646 | 1,009 | |||||||||||||||||||||||||||||||||||
| Basic earnings (loss) per ordinary share (cents) | Basic earnings (loss) per ordinary share (cents) | 13 | 227 | (3) | 32 | Basic earnings (loss) per ordinary share (cents) | 11 | 71 | 148 | 236 | ||||||||||||||||||||||||||||||
| Earnings (loss) per ordinary share from continuing operations | 225 | 87 | 52 | |||||||||||||||||||||||||||||||||||||
| Earnings per ordinary share from continuing operations | Earnings per ordinary share from continuing operations | 71 | 148 | 234 | ||||||||||||||||||||||||||||||||||||
| Earnings (loss) per ordinary share from discontinued operations | Earnings (loss) per ordinary share from discontinued operations | 2 | (90) | (20) | Earnings (loss) per ordinary share from discontinued operations | — | — | 2 | ||||||||||||||||||||||||||||||||
| Diluted earnings (loss) per ordinary share (cents) | Diluted earnings (loss) per ordinary share (cents) | 13 | 227 | (3) | 32 | Diluted earnings (loss) per ordinary share (cents) | 11 | 71 | 148 | 236 | ||||||||||||||||||||||||||||||
| Earnings (loss) per ordinary share from continuing operations | 225 | 87 | 52 | |||||||||||||||||||||||||||||||||||||
| Earnings per ordinary share from continuing operations | Earnings per ordinary share from continuing operations | 71 | 148 | 234 | ||||||||||||||||||||||||||||||||||||
| Earnings (loss) per ordinary share from discontinued operations | Earnings (loss) per ordinary share from discontinued operations | 2 | (90) | (20) | Earnings (loss) per ordinary share from discontinued operations | — | — | 2 | ||||||||||||||||||||||||||||||||
F - 7
ANGLOGOLD ASHANTI LIMITED
Group – statement of comprehensive income
FOR THE YEARS ENDED December 31, 2020, 20192022, 2021 and 2018
| Figures in millions | 2020 | 2019 | 2018 | ||||||||||||||||||||
| Restated | Restated | ||||||||||||||||||||||
| US Dollars | |||||||||||||||||||||||
| Profit (loss) for the year | 971 | (7) | 150 | ||||||||||||||||||||
| Items that will be reclassified subsequently to profit or loss: | 38 | 0 | (50) | ||||||||||||||||||||
Exchange differences on translation of foreign operations (1) | 38 | 0 | (50) | ||||||||||||||||||||
| Items that will not be reclassified subsequently to profit or loss: | 86 | 14 | (91) | ||||||||||||||||||||
Exchange differences on translation of non-foreign operations (1) | (16) | 4 | (100) | ||||||||||||||||||||
| Net gain (loss) on equity investments | 98 | 6 | 9 | ||||||||||||||||||||
| Actuarial gain (loss) recognised | 10 | 2 | 5 | ||||||||||||||||||||
| Deferred taxation thereon | (6) | 2 | (5) | ||||||||||||||||||||
| Other comprehensive income (loss) for the year, net of tax | 124 | 14 | (141) | ||||||||||||||||||||
| Total comprehensive income (loss) for the year, net of tax | 1,095 | 7 | 9 | ||||||||||||||||||||
| Allocated as follows: | |||||||||||||||||||||||
| Equity shareholders | |||||||||||||||||||||||
| - Continuing operations | 1,121 | 378 | 75 | ||||||||||||||||||||
| - Discontinued operations | (44) | (376) | (83) | ||||||||||||||||||||
| Non-controlling interests | |||||||||||||||||||||||
| - Continuing operations | 18 | 5 | 17 | ||||||||||||||||||||
| 1,095 | 7 | 9 | |||||||||||||||||||||
| Figures in millions | 2022 | 2021 | 2020 | |||||||||||||||||
Restated (1) | ||||||||||||||||||||
| US Dollars | ||||||||||||||||||||
| Profit (loss) for the year | 316 | 646 | 1,009 | |||||||||||||||||
| Items that will be reclassified subsequently to profit or loss: | (27) | (22) | 38 | |||||||||||||||||
| Exchange differences on translation of foreign operations | (27) | (22) | 38 | |||||||||||||||||
| Items that will not be reclassified subsequently to profit or loss: | (47) | (83) | 86 | |||||||||||||||||
| Exchange differences on translation of non-foreign operations | (1) | (3) | (16) | |||||||||||||||||
| Net (loss) gain on equity investments | (50) | (73) | 98 | |||||||||||||||||
| Actuarial (loss) gain recognised | (10) | (1) | 10 | |||||||||||||||||
| Deferred taxation thereon | 14 | (6) | (6) | |||||||||||||||||
| Other comprehensive (loss) income for the year, net of tax | (74) | (105) | 124 | |||||||||||||||||
| Total comprehensive income for the year, net of tax | 242 | 541 | 1,133 | |||||||||||||||||
| Allocated as follows: | ||||||||||||||||||||
| Equity shareholders | ||||||||||||||||||||
| - Continuing operations | 223 | 517 | 1,159 | |||||||||||||||||
| - Discontinued operations | — | — | (44) | |||||||||||||||||
| Non-controlling interests | ||||||||||||||||||||
| - Continuing operations | 19 | 24 | 18 | |||||||||||||||||
| 242 | 541 | 1,133 | ||||||||||||||||||
(1) Exchange differences arising on translation of foreign and non-foreign operationsComparative periods have been retrospectively restated, where indicated, due to reflect those that will be reclassified subsequentlythe initial application of the amendment to profit or lossIAS 16 "Property, Plant and those that will not be reclassified subsequently to profit or loss.Equipment - Proceeds before Intended Use" on 1 January 2022. Refer to note 1.
F - 8
ANGLOGOLD ASHANTI LIMITED
Group – statement of financial position
AS AT December 31, 2020, 20192022, 2021 and 2018
| Figures in millions | Notes | 2020 | 2019 | 2018 | ||||||||||||||||
| US Dollars | ||||||||||||||||||||
| ASSETS | ||||||||||||||||||||
| Non-current assets | ||||||||||||||||||||
| Tangible assets | 15 | 2,884 | 2,592 | 3,381 | ||||||||||||||||
| Right of use assets | 16 | 142 | 158 | |||||||||||||||||
| Intangible assets | 17 | 131 | 123 | 123 | ||||||||||||||||
| Investments in associates and joint ventures | 19 | 1,651 | 1,581 | 1,528 | ||||||||||||||||
| Other investments | 20 | 188 | 76 | 141 | ||||||||||||||||
| Inventories | 21 | 69 | 93 | 106 | ||||||||||||||||
| Trade, other receivables and other assets | 22 | 235 | 122 | 102 | ||||||||||||||||
| Deferred taxation | 29 | 7 | 105 | 0 | ||||||||||||||||
| Cash restricted for use | 23 | 31 | 31 | 35 | ||||||||||||||||
| 5,338 | 4,881 | 5,416 | ||||||||||||||||||
| Current assets | ||||||||||||||||||||
| Other investments | 20 | 0 | 10 | 6 | ||||||||||||||||
| Inventories | 21 | 733 | 632 | 652 | ||||||||||||||||
| Trade, other receivables and other assets | 22 | 229 | 250 | 209 | ||||||||||||||||
| Cash restricted for use | 23 | 42 | 33 | 31 | ||||||||||||||||
| Cash and cash equivalents | 24 | 1,330 | 456 | 329 | ||||||||||||||||
| 2,334 | 1,381 | 1,227 | ||||||||||||||||||
| Assets held for sale | 9 | 0 | 601 | 0 | ||||||||||||||||
| 2,334 | 1,982 | 1,227 | ||||||||||||||||||
| Total assets | 7,672 | 6,863 | 6,643 | |||||||||||||||||
| EQUITY AND LIABILITIES | ||||||||||||||||||||
| Share capital and premium | 25 | 7,214 | 7,199 | 7,171 | ||||||||||||||||
| Accumulated losses and other reserves | (3,519) | (4,559) | (4,519) | |||||||||||||||||
| Shareholders’ equity | 3,695 | 2,640 | 2,652 | |||||||||||||||||
| Non-controlling interests | 45 | 36 | 42 | |||||||||||||||||
| Total equity | 3,740 | 2,676 | 2,694 | |||||||||||||||||
| Non-current liabilities | ||||||||||||||||||||
| Borrowings | 26 | 1,789 | 1,299 | 1,911 | ||||||||||||||||
| Lease liabilities | 16 | 116 | 126 | |||||||||||||||||
| Environmental rehabilitation and other provisions | 27 | 731 | 697 | 827 | ||||||||||||||||
| Provision for pension and post-retirement benefits | 28 | 83 | 100 | 100 | ||||||||||||||||
| Trade, other payables and provisions | 30 | 8 | 15 | 3 | ||||||||||||||||
| Deferred taxation | 29 | 246 | 241 | 315 | ||||||||||||||||
| 2,973 | 2,478 | 3,156 | ||||||||||||||||||
| Current liabilities | ||||||||||||||||||||
| Borrowings | 26 | 142 | 734 | 139 | ||||||||||||||||
| Lease liabilities | 16 | 37 | 45 | |||||||||||||||||
| Trade, other payables and provisions | 30 | 627 | 586 | 594 | ||||||||||||||||
| Taxation | 31 | 153 | 72 | 60 | ||||||||||||||||
| 959 | 1,437 | 793 | ||||||||||||||||||
| Liabilities held for sale | 9 | 0 | 272 | 0 | ||||||||||||||||
| 959 | 1,709 | 793 | ||||||||||||||||||
| Total liabilities | 3,932 | 4,187 | 3,949 | |||||||||||||||||
| Total equity and liabilities | 7,672 | 6,863 | 6,643 | |||||||||||||||||
| Figures in millions | Notes | 2022 | 2021 | 2020 | ||||||||||||||||
Restated (1) | Restated (1) | |||||||||||||||||||
| US Dollars | ||||||||||||||||||||
| ASSETS | ||||||||||||||||||||
| Non-current assets | ||||||||||||||||||||
| Tangible assets | 13 | 4,209 | 3,493 | 2,917 | ||||||||||||||||
| Right of use assets | 14 | 156 | 175 | 142 | ||||||||||||||||
| Intangible assets | 15 | 106 | 122 | 131 | ||||||||||||||||
| Investments in associates and joint ventures | 17 | 1,100 | 1,647 | 1,651 | ||||||||||||||||
| Other investments | 18 | 3 | 117 | 188 | ||||||||||||||||
| Inventories | 19 | 5 | 27 | 69 | ||||||||||||||||
| Trade, other receivables and other assets | 20 | 231 | 237 | 235 | ||||||||||||||||
| Reimbursive right for post-retirement benefits | 26 | 12 | — | — | ||||||||||||||||
| Deferred taxation | 27 | 72 | 7 | 7 | ||||||||||||||||
| Cash restricted for use | 21 | 33 | 32 | 31 | ||||||||||||||||
| 5,927 | 5,857 | 5,371 | ||||||||||||||||||
| Current assets | ||||||||||||||||||||
| Inventories | 19 | 773 | 703 | 733 | ||||||||||||||||
| Trade, other receivables and other assets | 20 | 237 | 260 | 229 | ||||||||||||||||
| Cash restricted for use | 21 | 27 | 26 | 42 | ||||||||||||||||
| Cash and cash equivalents | 22 | 1,108 | 1,154 | 1,330 | ||||||||||||||||
| 2,145 | 2,143 | 2,334 | ||||||||||||||||||
| Total assets | 8,072 | 8,000 | 7,705 | |||||||||||||||||
| EQUITY AND LIABILITIES | ||||||||||||||||||||
| Share capital and premium | 23 | 7,239 | 7,223 | 7,214 | ||||||||||||||||
| Accumulated losses and other reserves | (3,139) | (3,181) | (3,486) | |||||||||||||||||
| Shareholders’ equity | 4,100 | 4,042 | 3,728 | |||||||||||||||||
| Non-controlling interests | 34 | 52 | 45 | |||||||||||||||||
| Total equity | 4,134 | 4,094 | 3,773 | |||||||||||||||||
| Non-current liabilities | ||||||||||||||||||||
| Borrowings | 24 | 1,965 | 1,858 | 1,789 | ||||||||||||||||
| Lease liabilities | 14 | 102 | 124 | 116 | ||||||||||||||||
| Environmental rehabilitation and other provisions | 25 | 634 | 729 | 731 | ||||||||||||||||
| Provision for pension and post-retirement benefits | 26 | 71 | 77 | 83 | ||||||||||||||||
| Trade, other payables and provisions | 28 | 7 | 7 | 8 | ||||||||||||||||
| Deferred taxation | 27 | 300 | 313 | 246 | ||||||||||||||||
| 3,079 | 3,108 | 2,973 | ||||||||||||||||||
| Current liabilities | ||||||||||||||||||||
| Borrowings | 24 | 18 | 51 | 142 | ||||||||||||||||
| Lease liabilities | 14 | 84 | 61 | 37 | ||||||||||||||||
| Trade, other payables and provisions | 28 | 710 | 647 | 627 | ||||||||||||||||
| Bank overdraft | 2 | — | — | |||||||||||||||||
| Taxation | 29 | 45 | 39 | 153 | ||||||||||||||||
| 859 | 798 | 959 | ||||||||||||||||||
| Total liabilities | 3,938 | 3,906 | 3,932 | |||||||||||||||||
| Total equity and liabilities | 8,072 | 8,000 | 7,705 | |||||||||||||||||
F - 9
ANGLOGOLD ASHANTI LIMITED
Group – statement of cash flows
FOR THE YEARS ENDED December 31, 2020, 20192022, 2021 and 20182020
| Figures in millions | Notes | 2022 | 2021 | 2020 | ||||||||||||||||
Restated (1) | ||||||||||||||||||||
| US Dollars | ||||||||||||||||||||
| Cash flows from operating activities | ||||||||||||||||||||
| Receipts from customers | 4,517 | 4,054 | 4,580 | |||||||||||||||||
| Payments to suppliers and employees | (3,273) | (2,701) | (2,714) | |||||||||||||||||
| Cash generated from operations | 30 | 1,244 | 1,353 | 1,866 | ||||||||||||||||
| Dividends received from joint ventures | 694 | 231�� | 148 | |||||||||||||||||
| Taxation refund | 29 | 32 | 20 | — | ||||||||||||||||
| Taxation paid | 29 | (166) | (336) | (431) | ||||||||||||||||
| Net cash inflow (outflow) from operating activities from continuing operations | 1,804 | 1,268 | 1,583 | |||||||||||||||||
| Net cash inflow (outflow) from operating activities from discontinued operations | — | — | 109 | |||||||||||||||||
| Net cash inflow (outflow) from operating activities | 1,804 | 1,268 | 1,692 | |||||||||||||||||
| Cash flows from investing activities | ||||||||||||||||||||
| Capital expenditure | ||||||||||||||||||||
| - project capital | 13 | (378) | (392) | (369) | ||||||||||||||||
| - stay-in-business capital | 13 | (650) | (635) | (370) | ||||||||||||||||
| Interest capitalised and paid | (2) | (14) | (17) | |||||||||||||||||
| Acquisition of assets | 13 | (517) | — | — | ||||||||||||||||
| Acquisition of intangible assets | — | (1) | (1) | |||||||||||||||||
| Dividends from associates and other investments | 18 | 22 | 9 | |||||||||||||||||
| Proceeds from disposal of tangible assets | 8 | 25 | 3 | |||||||||||||||||
| Other investments and assets acquired | (16) | (4) | (8) | |||||||||||||||||
| Proceeds from disposal of other investments | — | — | 9 | |||||||||||||||||
| Proceeds from disposal of joint ventures | — | 2 | 26 | |||||||||||||||||
| Loans advanced | (1) | (15) | — | |||||||||||||||||
| Loans repaid by associates and joint ventures | — | — | 12 | |||||||||||||||||
| Recognition of joint operation - cash | — | — | 2 | |||||||||||||||||
| Proceeds from disposal of discontinued assets and subsidiaries | — | — | 200 | |||||||||||||||||
| Decrease (increase) in cash restricted for use | (4) | 14 | (9) | |||||||||||||||||
| Interest received | 81 | 58 | 27 | |||||||||||||||||
| Net cash inflow (outflow) from investing activities from continuing operations | (1,461) | (940) | (486) | |||||||||||||||||
| Net cash outflow from investing activities from discontinued operations | — | — | (31) | |||||||||||||||||
| Cash in subsidiaries sold and transferred to held for sale | — | — | 3 | |||||||||||||||||
| Net cash inflow (outflow) from investing activities | (1,461) | (940) | (514) | |||||||||||||||||
| Cash flows from financing activities | ||||||||||||||||||||
| Proceeds from borrowings | 24 | 266 | 822 | 2,226 | ||||||||||||||||
| Repayment of borrowings | 24 | (184) | (820) | (2,310) | ||||||||||||||||
| Repayment of lease liabilities | 14 | (82) | (63) | (47) | ||||||||||||||||
| Finance costs - borrowings | 24 | (99) | (111) | (110) | ||||||||||||||||
| Finance costs - leases | 14 | (10) | (9) | (8) | ||||||||||||||||
| Other borrowing costs | (11) | (35) | (33) | |||||||||||||||||
| Dividends paid | (203) | (240) | (47) | |||||||||||||||||
| Net cash outflow from financing activities from continuing operations | (323) | (456) | (329) | |||||||||||||||||
| Net increase (decrease) in cash and cash equivalents | 20 | (128) | 849 | |||||||||||||||||
| Translation | (68) | (48) | 25 | |||||||||||||||||
| Cash and cash equivalents at beginning of year | 1,154 | 1,330 | 456 | |||||||||||||||||
Cash and cash equivalents at end of year (2) | 22 | 1,106 | 1,154 | 1,330 | ||||||||||||||||
| Figures in millions | Notes | 2020 | 2019 | 2018 | ||||||||||||||||
| US Dollars | ||||||||||||||||||||
| Cash flows from operating activities | ||||||||||||||||||||
| Receipts from customers | 4,411 | 3,535 | 3,339 | |||||||||||||||||
| Payments to suppliers and employees | (2,583) | (2,433) | (2,408) | |||||||||||||||||
| Cash generated from operations | 32 | 1,828 | 1,102 | 931 | ||||||||||||||||
| Dividends received from joint ventures | 148 | 77 | 91 | |||||||||||||||||
| Taxation refund | 31 | 0 | 7 | 5 | ||||||||||||||||
| Taxation paid | 31 | (431) | (228) | (171) | ||||||||||||||||
| Net cash inflow (outflow) from operating activities from continuing operations | 1,545 | 958 | 856 | |||||||||||||||||
| Net cash inflow (outflow) from operating activities from discontinued operations | 109 | 89 | 1 | |||||||||||||||||
| Net cash inflow (outflow) from operating activities | 1,654 | 1,047 | 857 | |||||||||||||||||
| Cash flows from investing activities | ||||||||||||||||||||
| Capital expenditure | ||||||||||||||||||||
| - project capital | (331) | (336) | (170) | |||||||||||||||||
| - stay-in-business capital | (370) | (367) | (405) | |||||||||||||||||
| Interest capitalised and paid | (17) | (6) | 0 | |||||||||||||||||
| Acquisition of intangible assets | (1) | 0 | 0 | |||||||||||||||||
| Dividends from other investments | 9 | 0 | 2 | |||||||||||||||||
| Proceeds from disposal of tangible assets | 3 | 3 | 10 | |||||||||||||||||
| Other investments acquired | (8) | (9) | (13) | |||||||||||||||||
| Proceeds from disposal of other investments | 9 | 3 | 7 | |||||||||||||||||
| Investments in associates and joint ventures | 0 | (5) | (8) | |||||||||||||||||
| Proceeds from disposal of joint ventures | 26 | 0 | 0 | |||||||||||||||||
| Loans advanced to associates and joint ventures | 0 | (3) | (5) | |||||||||||||||||
| Loans repaid by associates and joint ventures | 12 | 23 | 22 | |||||||||||||||||
| Recognition of joint operation - cash | 2 | 0 | 0 | |||||||||||||||||
| Proceeds from disposal of discontinued assets and subsidiaries | 200 | 0 | 0 | |||||||||||||||||
| Decrease (increase) in cash restricted for use | (9) | 0 | (6) | |||||||||||||||||
| Interest received | 27 | 14 | 5 | |||||||||||||||||
| Net cash inflow (outflow) from investing activities from continuing operations | (448) | (683) | (561) | |||||||||||||||||
| Net cash inflow (outflow) from investing activities from discontinued operations | (31) | (54) | 226 | |||||||||||||||||
| Cash in subsidiaries sold and transferred to held for sale | 3 | (6) | 0 | |||||||||||||||||
| Net cash inflow (outflow) from investing activities | (476) | (743) | (335) | |||||||||||||||||
| Cash flows from financing activities | ||||||||||||||||||||
| Proceeds from borrowings | 2,226 | 168 | 753 | |||||||||||||||||
| Repayment of borrowings | (2,310) | (123) | (967) | |||||||||||||||||
| Repayment of lease liabilities | (47) | (42) | ||||||||||||||||||
| Finance costs - borrowings | 26 | (110) | (128) | (130) | ||||||||||||||||
| Finance costs - leases | (8) | (9) | ||||||||||||||||||
| Other borrowing costs | (33) | 0 | (10) | |||||||||||||||||
| Dividends paid | (47) | (43) | (39) | |||||||||||||||||
| Net cash inflow (outflow) from financing activities from continuing operations | (329) | (177) | (393) | |||||||||||||||||
| Net cash inflow (outflow) from financing activities from discontinued operations | 0 | 0 | 0 | |||||||||||||||||
| Net cash inflow (outflow) from financing activities | (329) | (177) | (393) | |||||||||||||||||
| Net increase (decrease) in cash and cash equivalents | 849 | 127 | 129 | |||||||||||||||||
| Translation | 25 | 0 | (5) | |||||||||||||||||
| Cash and cash equivalents at beginning of year | 456 | 329 | 205 | |||||||||||||||||
| Cash and cash equivalents at end of year | 24 | 1,330 | 456 | 329 | ||||||||||||||||
(2) Cash and cash equivalents at the end of December 2022 is net of a bank overdraft of $2m.
F - 10
ANGLOGOLD ASHANTI LIMITED
Group – statement of changes in equity
FOR THE YEARS ENDED December 31, 2020, 20192022, 2021 and 20182020
| Equity holders of the parent | Equity holders of the parent | |||||||||||||||||||||||||||||||||||||||||||||||||||||||||||||||
| Figures in millions | Figures in millions | Share capital and premium | Other capital reserves(1) | Retained earnings (Accumulated losses)(2) | Fair value through OCI | Actuarial gains (losses) | Foreign currency translation reserve (3) | Total | Non- controlling interests | Total equity | Figures in millions | Share capital and premium | Other capital reserves(2) | Retained earnings (Accumulated losses)(1) | Fair value through OCI | Actuarial gains (losses) | Foreign currency translation reserve (3) | Total | Non- controlling interests | Total equity | ||||||||||||||||||||||||||||||||||||||||||||
| US Dollars | US Dollars | US Dollars | ||||||||||||||||||||||||||||||||||||||||||||||||||||||||||||||
| Balance at 31 December 2017 | 7,134 | 124 | (3,349) | 33 | (16) | (1,263) | 2,663 | 41 | 2,704 | |||||||||||||||||||||||||||||||||||||||||||||||||||||||
| Balance at 31 December 2019 Restated | Balance at 31 December 2019 Restated | 7,199 | 83 | (3,273) | 45 | (10) | (1,409) | 2,635 | 36 | 2,671 | ||||||||||||||||||||||||||||||||||||||||||||||||||||||
| Profit (loss) for the year | Profit (loss) for the year | — | — | 133 | — | — | — | 133 | 17 | 150 | Profit (loss) for the year | — | — | 991 | — | — | — | 991 | 18 | 1,009 | ||||||||||||||||||||||||||||||||||||||||||||
| Other comprehensive income (loss) | Other comprehensive income (loss) | — | — | — | 5 | 4 | (150) | (141) | — | (141) | Other comprehensive income (loss) | — | — | — | 92 | 10 | 22 | 124 | — | 124 | ||||||||||||||||||||||||||||||||||||||||||||
| Total comprehensive income (loss) | Total comprehensive income (loss) | — | — | 133 | 5 | 4 | (150) | (8) | 17 | 9 | Total comprehensive income (loss) | — | — | 991 | 92 | 10 | 22 | 1,115 | 18 | 1,133 | ||||||||||||||||||||||||||||||||||||||||||||
| Shares issued | Shares issued | 37 | — | — | — | — | — | 37 | — | 37 | Shares issued | 15 | — | — | — | — | — | 15 | — | 15 | ||||||||||||||||||||||||||||||||||||||||||||
| Share-based payment for share awards net of exercised | Share-based payment for share awards net of exercised | — | (17) | — | — | — | — | (17) | — | (17) | Share-based payment for share awards net of exercised | — | (3) | — | — | — | — | (3) | — | (3) | ||||||||||||||||||||||||||||||||||||||||||||
| Dividends paid (note 14) | — | — | (24) | — | — | — | (24) | — | (24) | |||||||||||||||||||||||||||||||||||||||||||||||||||||||
| Dividends paid (note 12) | Dividends paid (note 12) | — | — | (38) | — | — | — | (38) | — | (38) | ||||||||||||||||||||||||||||||||||||||||||||||||||||||
| Dividends of subsidiaries | Dividends of subsidiaries | — | — | — | — | — | — | — | (15) | (15) | Dividends of subsidiaries | — | — | — | — | — | — | — | (9) | (9) | ||||||||||||||||||||||||||||||||||||||||||||
| Transfer of gain on disposal of equity investments | — | — | 1 | (1) | — | 0 | — | 0 | ||||||||||||||||||||||||||||||||||||||||||||||||||||||||
| Recognition of joint operation | Recognition of joint operation | 4 | 4 | 4 | ||||||||||||||||||||||||||||||||||||||||||||||||||||||||||||
| Transfer on disposal and derecognition of equity investments | Transfer on disposal and derecognition of equity investments | — | — | 6 | (6) | — | — | — | — | — | ||||||||||||||||||||||||||||||||||||||||||||||||||||||
| Translation | Translation | — | (11) | 12 | — | — | — | 1 | (1) | 0 | Translation | — | (3) | 2 | — | 1 | — | — | — | — | ||||||||||||||||||||||||||||||||||||||||||||
| Balance at 31 December 2018 | 7,171 | 96 | (3,227) | 37 | (12) | (1,413) | 2,652 | 42 | 2,694 | |||||||||||||||||||||||||||||||||||||||||||||||||||||||
| Balance at 31 December 2020 Restated | Balance at 31 December 2020 Restated | 7,214 | 77 | (2,308) | 131 | 1 | (1,387) | 3,728 | 45 | 3,773 | ||||||||||||||||||||||||||||||||||||||||||||||||||||||
| Profit (loss) for the year | Profit (loss) for the year | — | — | (12) | — | — | — | (12) | 5 | (7) | Profit (loss) for the year | — | — | 622 | — | — | — | 622 | 24 | 646 | ||||||||||||||||||||||||||||||||||||||||||||
| Other comprehensive income (loss) | Other comprehensive income (loss) | — | — | — | 8 | 2 | 4 | 14 | — | 14 | Other comprehensive income (loss) | — | — | — | (78) | (2) | (25) | (105) | — | (105) | ||||||||||||||||||||||||||||||||||||||||||||
| Total comprehensive income (loss) | Total comprehensive income (loss) | — | — | (12) | 8 | 2 | 4 | 2 | 5 | 7 | Total comprehensive income (loss) | — | — | 622 | (78) | (2) | (25) | 517 | 24 | 541 | ||||||||||||||||||||||||||||||||||||||||||||
| Shares issued | Shares issued | 28 | — | — | — | — | — | 28 | — | 28 | Shares issued | 9 | — | — | — | — | — | 9 | — | 9 | ||||||||||||||||||||||||||||||||||||||||||||
| Share-based payment for share awards net of exercised | Share-based payment for share awards net of exercised | — | (10) | — | — | — | — | (10) | — | (10) | Share-based payment for share awards net of exercised | — | 11 | — | — | — | — | 11 | — | 11 | ||||||||||||||||||||||||||||||||||||||||||||
| Dividends paid (note 14) | — | — | (27) | — | — | — | (27) | — | (27) | |||||||||||||||||||||||||||||||||||||||||||||||||||||||
| Dividends paid (note 12) | Dividends paid (note 12) | — | — | (224) | — | — | — | (224) | — | (224) | ||||||||||||||||||||||||||||||||||||||||||||||||||||||
| Dividends of subsidiaries | Dividends of subsidiaries | — | — | — | — | — | — | — | (16) | (16) | Dividends of subsidiaries | — | — | — | — | — | — | — | (16) | (16) | ||||||||||||||||||||||||||||||||||||||||||||
| Transactions with non-controlling interests | — | (4) | — | — | — | — | (4) | 4 | 0 | |||||||||||||||||||||||||||||||||||||||||||||||||||||||
| Translation | Translation | — | 1 | (2) | — | — | — | (1) | 1 | 0 | Translation | — | (4) | 6 | — | (1) | — | 1 | (1) | — | ||||||||||||||||||||||||||||||||||||||||||||
| Balance at 31 December 2019 | 7,199 | 83 | (3,268) | 45 | (10) | (1,409) | 2,640 | 36 | 2,676 | |||||||||||||||||||||||||||||||||||||||||||||||||||||||
| Balance at 31 December 2021 Restated | Balance at 31 December 2021 Restated | 7,223 | 84 | (1,904) | 53 | (2) | (1,412) | 4,042 | 52 | 4,094 | ||||||||||||||||||||||||||||||||||||||||||||||||||||||
| Profit (loss) for the year | Profit (loss) for the year | — | — | 953 | — | — | — | 953 | 18 | 971 | Profit (loss) for the year | 297 | 297 | 19 | 316 | |||||||||||||||||||||||||||||||||||||||||||||||||
| Other comprehensive income (loss) | Other comprehensive income (loss) | — | — | — | 92 | 10 | 22 | 124 | — | 124 | Other comprehensive income (loss) | (36) | (10) | (28) | (74) | (74) | ||||||||||||||||||||||||||||||||||||||||||||||||
| Total comprehensive income (loss) | Total comprehensive income (loss) | — | — | 953 | 92 | 10 | 22 | 1,077 | 18 | 1,095 | Total comprehensive income (loss) | — | — | 297 | (36) | (10) | (28) | 223 | 19 | 242 | ||||||||||||||||||||||||||||||||||||||||||||
| Shares issued | Shares issued | 15 | — | — | — | — | — | 15 | — | 15 | Shares issued | 16 | 16 | 16 | ||||||||||||||||||||||||||||||||||||||||||||||||||
| Share-based payment for share awards net of exercised | — | (3) | — | — | — | — | (3) | — | (3) | |||||||||||||||||||||||||||||||||||||||||||||||||||||||
| Dividends paid (note 14) | — | — | (38) | — | — | — | (38) | — | (38) | |||||||||||||||||||||||||||||||||||||||||||||||||||||||
| Dividends paid (note 12) | Dividends paid (note 12) | — | — | (181) | — | — | — | (181) | — | (181) | ||||||||||||||||||||||||||||||||||||||||||||||||||||||
| Dividends of subsidiaries | Dividends of subsidiaries | — | — | — | — | — | — | — | (9) | (9) | Dividends of subsidiaries | — | — | — | — | — | — | (37) | (37) | |||||||||||||||||||||||||||||||||||||||||||||
| Recognition of joint operation | 4 | 4 | 4 | |||||||||||||||||||||||||||||||||||||||||||||||||||||||||||||
| Transfer on disposal and derecognition of equity investments | — | — | 6 | (6) | — | — | 0 | — | 0 | |||||||||||||||||||||||||||||||||||||||||||||||||||||||
| Transfer on derecognition of equity investment | Transfer on derecognition of equity investment | — | — | 69 | (69) | — | — | — | — | — | ||||||||||||||||||||||||||||||||||||||||||||||||||||||
| Translation | Translation | — | (3) | 2 | — | 1 | — | 0 | — | 0 | Translation | — | (3) | 4 | — | (1) | — | — | — | — | ||||||||||||||||||||||||||||||||||||||||||||
| Balance at 31 December 2020 | 7,214 | 77 | (2,341) | 131 | 1 | (1,387) | 3,695 | 45 | 3,740 | |||||||||||||||||||||||||||||||||||||||||||||||||||||||
| Balance at 31 December 2022 | Balance at 31 December 2022 | 7,239 | 81 | (1,715) | (52) | (13) | (1,440) | 4,100 | 34 | 4,134 | ||||||||||||||||||||||||||||||||||||||||||||||||||||||
(1)The (Accumulated losses) Retained earnings balances have been restated, where indicated, due to the initial application of the amendment to IAS 16 “Property, Plant and Equipment - Proceeds before Intended Use” on 1 January 2022. Refer to note 1.
(2)Other capital reserves include a surplus on disposal of Company shares held by companies prior to the formation of AngloGold Ashanti Limited of $10m (2019: $10m; 2018:$8m (2021: $9m; 2020: $10m), surplus on equity transaction of joint venture of $36m (2019:(2021: $36m; 2018:2020: $36m), equity items for share-based payments of $33m (2019: $39m; 2018:$48m)$39m (2021: $41m; 2020: $33m) and other reserves.
(3) Foreign currency translation reserve includes a loss of $101m relating to the sale of the South African operations that will not re-cycle through the Income statement. Of the remaining balance, a loss of $1,295m relates to further balances$1,400m (2021: $1,399m; 2020: $1,396m) that will not re-cycle through the Income statement on disposal of the non-foreign operations, and a gainloss of $40m (2021: $13m: 2020: $9m gain) relating to the foreign operations that will re-cycle through the Income statement on disposal, (refer to note 1).disposal.
F - 11
ANGLOGOLD ASHANTI LIMITED
Notes to the consolidated financial statements
FOR THE YEARS ENDED 31 December, 2020, 20192022, 2021 and 20182020
1 ACCOUNTING POLICIES
The consolidated and Company financial statements are prepared in compliance with International Financial Reporting Standards (IFRS) and Interpretations of those standards, as issued by the International Accounting Standards Board (IASB), SAICA Financial Reporting Guides as issued by the Accounting Practices Committee, Financial Reporting Pronouncements as issued by the Financial Reporting Standards Council, JSE Listings Requirements and in the manner required by the South African Companies Act, 2008.
•Amendments to IAS 16 amendment "Property, Plant‘Property, plant and Equipment—Proceedsequipment’ relating to proceeds before Intended Use"intended use;
The Group adopted the amendment to IAS 16 “Property, Plant and Equipment - Proceeds before Intended Use” on 1 January 2022. The amendment prohibits deducting from the cost of an item of property, plant and equipment any proceeds from selling items produced while bringing that asset to the location and condition necessary for it to be capable of operating in the manner intended by management. Instead, an entity recognises the proceeds from selling such items, and the cost of producing those items, in profit or loss. AnThe cost allocation requires significant judgement in terms of this amendment. In accordance with the transitional provisions of IAS 16 an entity applies the amendments retrospectively to items of property, plant and equipment made available for use on or after the beginning of the earliest period presented when the entity first applies the amendment. Management is assessing the impact the amendment will have on the group.
The Amendments are effective for annual periods beginningadoption of the amendment on or after 1 January 2021, with early application permitted. The Amendments focus2022 resulted in a retrospective increase in property, plant and equipment and gross profit of $38m for 31 December 2020 (2019: decrease of $5m). There was no impact on the effects on financial statements when an entity replaces the old interest rate benchmark with an alternative benchmark rate2021 results as a consequenceno revenue was capitalised in 2021. The effects of the global regulatory reform of key interbank offered rates (IBORs). The group2019 and 2020 restatement has IBOR linked borrowings and isbeen included in the process of identifying and negotiating with bank syndicates, new reference rates on the IBOR linked borrowings, including the considerationaccumulated losses opening balance of the Secured Overnight Financing Rate which is2020 and 2021 financial reporting period respectively. The impact arises from the recommended USD LIBOR alternative. Refer to note 26 for detailsreclassification of IBOR linked borrowings.
F - 12
| 2021 | 2020 | |||||||||||||||||||
| US Dollar million | As previously reported | Adjustments | Restated | As previously reported | Adjustments | Restated | ||||||||||||||
| Statement of financial position | ||||||||||||||||||||
| Tangible assets (note 13) | 3,460 | 33 | 3,493 | 2,884 | 33 | 2,917 | ||||||||||||||
| (Accumulated losses) and other reserves | (3,214) | 33 | (3,181) | (3,519) | 33 | (3,486) | ||||||||||||||
| Income statement | ||||||||||||||||||||
| Revenue from product sales (note 3) | 4,029 | — | 4,029 | 4,427 | 168 | 4,595 | ||||||||||||||
| Cost of sales (note 4) | (2,857) | — | (2,857) | (2,699) | (130) | (2,829) | ||||||||||||||
| Gross profit | 1,172 | — | 1,172 | 1,709 | 38 | 1,747 | ||||||||||||||
| Operating profit | 810 | — | 810 | 1,459 | 38 | 1,497 | ||||||||||||||
| Profit before taxation | 958 | — | 958 | 1,589 | 38 | 1,627 | ||||||||||||||
| Profit after taxation from continuing operations | 646 | — | 646 | 964 | 38 | 1,002 | ||||||||||||||
| Profit for the year | 646 | — | 646 | 971 | 38 | 1,009 | ||||||||||||||
Basic earnings per ordinary share (US cents) (1) (note 11) | 148 | — | 148 | 227 | 9 | 236 | ||||||||||||||
| Basic earnings per ordinary share (US cents) from continuing operations (note 11) | 148 | — | 148 | 225 | 9 | 234 | ||||||||||||||
Diluted earnings per ordinary share (US cents) (1) (note 11) | 148 | — | 148 | 227 | 9 | 236 | ||||||||||||||
Diluted earnings per ordinary share (US cents) from continuing operations (note 11) | 148 | — | 148 | 225 | 9 | 234 | ||||||||||||||
| Statement of Comprehensive Income | ||||||||||||||||||||
| Profit for the year | 646 | — | 646 | 971 | 38 | 1,009 | ||||||||||||||
| Total comprehensive income for the year | 541 | — | 541 | 1,095 | 38 | 1,133 | ||||||||||||||
| Equity shareholders - Continuing operations | 517 | — | 517 | 1,121 | 38 | 1,159 | ||||||||||||||
| Statement of changes in equity | ||||||||||||||||||||
| Retained earnings (Accumulated losses) | (1,937) | 33 | (1,904) | (2,341) | 33 | (2,308) | ||||||||||||||
| Statement of cash flows | ||||||||||||||||||||
| Receipts from customers | 4,054 | — | 4,054 | 4,411 | 169 | 4,580 | ||||||||||||||
| Payments to suppliers and employees | (2,701) | — | (2,701) | (2,583) | (131) | (2,714) | ||||||||||||||
| Cash generated from operations (note 30) | 1,353 | — | 1,353 | 1,828 | 38 | 1,866 | ||||||||||||||
| Net cash inflow from operating activities from continuing operations | 1,268 | — | 1,268 | 1,545 | 38 | 1,583 | ||||||||||||||
| Net cash inflow from operating activities | 1,268 | — | 1,268 | 1,654 | 38 | 1,692 | ||||||||||||||
| Capital expenditure - project capital (note 13) | (392) | — | (392) | (331) | (38) | (369) | ||||||||||||||
| Net cash inflow from investing activities from continuing operations | (940) | — | (940) | (448) | (38) | (486) | ||||||||||||||
| Net cash inflow from investing activities | (940) | — | (940) | (476) | (38) | (514) | ||||||||||||||
| Other Disclosures | ||||||||||||||||||||
| Basic headline earnings per share (note 11) | 146 | — | 146 | 238 | 10 | 248 | ||||||||||||||
| Diluted headline earnings per share (note 11) | 146 | — | 146 | 238 | 9 | 247 | ||||||||||||||
(1) There was no impact on basic and diluted earnings per ordinary share from discontinued operations
| Figures in millions | 2019 | 2018 | ||||||||||||||||||
| US Dollars | As previously reported | Adjustments | Restated | As previously reported | Adjustments | Restated | ||||||||||||||
| Profit (loss) for the period | (7) | 0 | (7) | 150 | 0 | 150 | ||||||||||||||
| Items that will be reclassified subsequently to profit or loss: | ||||||||||||||||||||
| Exchange differences on translation of foreign operations | 4 | (4) | 0 | (150) | 100 | (50) | ||||||||||||||
| Items that will not be reclassified subsequently to profit or loss: | 10 | 4 | 14 | 9 | (100) | (91) | ||||||||||||||
| Exchange differences on translation of non-foreign operations | 0 | 4 | 4 | 0 | (100) | (100) | ||||||||||||||
| Net gain on equity investments | 6 | 0 | 6 | 9 | 0 | 9 | ||||||||||||||
| Actuarial gain recognised | 2 | 0 | 2 | 5 | 0 | 5 | ||||||||||||||
| Deferred taxation thereon | 2 | 0 | 2 | (5) | 0 | (5) | ||||||||||||||
| Other comprehensive (loss) income for the period, net of tax | 14 | 0 | 14 | (141) | 0 | (141) | ||||||||||||||
| Total comprehensive income (loss) for the period, net of tax | 7 | 0 | 7 | 9 | 0 | 9 | ||||||||||||||
F - 13
1 STATEMENT OF COMPLIANCE continued
•Amendments to IAS 37 ‘Provisions, Contingent Liabilities and Contingent Assets’ relating to onerous contracts - costs of fulfilling a contract;
•Amendments to IFRS 3 ‘Business Combinations’ with regards to updating a reference to the conceptual framework; and
•Annual improvements to IFRS Standards 2018 – 2020 for IFRS 16 ‘Leases’ relating to lease incentives and IFRS 9 ‘Financial Instruments’ relating to fees in the ’10 per cent’ test for derecognition of financial liabilities.
Other than the amendment to IAS 16, these amendments had no material impact on the Group.
The significant accounting principles applied infollowing amendments to IFRS were early adopted by the presentation of the group annual financial statements are set out below.Group effective from 1 January 2022:
•Amendments to IAS 1 ‘Presentation of Financial Statements’ with regards to the disclosure of accounting policies;
•Amendments to IAS 8 ‘Accounting Policies, Changes in Accounting Estimates and Errors’ relating to the definition of accounting estimates;
•Amendments to IAS 1 ‘Classification of Liabilities as Current or Non-Current’; and
•Amendments to IAS 1 ‘Non-Current Liabilities with Covenants’.
The adoption of these amendments had no material impact on the Group.
Accounting standards, amendments and interpretations issued which are relevant to the Group, but not yet effective
The new accounting standards and amendments to accounting standards issued which are relevant to the Group, but not yet effective on 31 December 2022, include:
IFRS 17 'Insurance Contracts' and Amendments to IFRS 17 'Insurance Contracts'
IFRS 17 replaces IFRS 4 ‘Insurance Contracts’ and sets out principles for the recognition, measurement, presentation and disclosure of insurance contracts. IFRS 17 requires insurance liabilities to be measured at a current fulfilment value and provides a more uniform approach for all insurance contracts. The standard and the amendments to the standard is effective for the Group’s reporting period starting on 1 January 2023 and will be applied retrospectively. The effect of the implementation of the new standard is not expected to have a material impact on the Group’s results.
Amendments to IAS 12 ‘Deferred Tax related to Assets and Liabilities arising from a Single Transaction’
This amendment narrowed the scope of the recognition exemption in paragraphs 15 and 24 of IAS 12 (recognition exemption) so that it no longer applies to transactions that, on initial recognition, give rise to equal taxable and deductible temporary differences. This should mainly impact right of use assets and lease liabilities and decommissioning, restoration and similar liabilities and the corresponding amounts recognised as part of the cost of the related asset. The amendments are effective for the Group from 1 January 2023, will be applied retrospectively and are not expected to materially impact the Group.
F - 14
1 STATEMENT OF COMPLIANCE continued
1.1 BASIS OF PREPARATION
The financial statements are prepared according to the historical cost convention, except for the revaluation of certain financial instrumentsassets and liabilities to fair value. The group’sGroup’s accounting policies as set out below are consistent in all material respects with those applied in the previous year.
The groupGroup financial statements are presented in US dollars.
All notes are from continuing operations unless otherwise stated.
The groupGroup financial statements incorporate the financial statements of the Company, its subsidiaries and its interests in joint ventures and associates. The financial statements of all material subsidiaries, joint ventures and associates, are prepared for the same reporting period as the holding company,Company, using the same accounting policies.
Subsidiaries are all entities over which the groupGroup has control. The groupGroup controls an entity when it is exposed to, or has rights to, variable returns from its involvement with the entity and has the ability to affect those returns through its power over the entity. Control would generally exist where the groupGroup owns more than 50% of the voting rights, unless the groupGroup and other investors collectively control the entity where they must act together to direct the relevant activities. In such cases, as no investor individually controls the entity the investment is accounted for as an associate, joint venture or a joint operation. Subsidiaries are fully consolidated from the date on which control is transferred to the group.Group. They are deconsolidated from the date on which control ceases. The groupGroup re-assesses whether or not it controls an investee if facts and circumstances indicate that there are changes to one or more of the three elements of control.
Intra-group transactions, balances and unrealised gains and losses on transactions between group companies, including any resulting tax effects are eliminated.
The significant accounting judgements and estimates applied in the presentation of the Group and Company annual financial statements are set out below. The accounting policies adopted are detailed in Annexure A: “Summary of material accounting policies”.
1.2 SIGNIFICANT ACCOUNTING JUDGEMENTS AND ESTIMATES
Use of estimates
The preparation of the financial statements requires the group’sGroup’s management to make estimates and assumptions that affect the reported amounts of assets and liabilities and disclosure of contingent assets and liabilities at the date of the financial statements, and the reported amounts of revenues and expenses during the reporting period. The determination of estimates requires the exercise of judgement based on various assumptions and other factors such as historical experience, current and expected economic conditions, and in some cases actuarial techniques. Actual results could differ from those estimates.
The more significant areas requiring the use of management estimates and assumptions relate to OreMineral Reserve that are the basis of future cash flow estimates and unit-of-production depreciation, depletion and amortisation calculations; environmental, reclamation and closure obligations; asset impairments/reversals (including impairments of goodwill); production start date; recoverability of indirect taxes; recoverability of deferred tax assets; and write-downswrite downs of inventory to net realisable value. Other estimates include employee benefit liabilities, unrecognised tax positions and deferred compensation assets.
The uncertainty of the impact of the COVID-19 pandemic on the global economy and on the group has been considered in judgements made and in the key assumptions used in management's estimates. Key assumptions include items such as commodity prices, exchange rates and changes in interest rates.
F - 15
Use of estimates continued
Carrying value of tangible assets
Amortisation
The majority of mining assets are amortised using the units-of-production method where the mine operating plan calls for production from a well-defined provedProven and probable OreProbable Mineral Reserve.
For other tangible assets, the straight-line method is applied over the estimated useful life of the asset which does not exceed the estimated mine life based on provedProven and probable OreProbable Mineral Reserve as the useful lives of these assets are considered to be limited to the life of the relevant mine.Assets are amortised to residual values. Residual values and useful lives are reviewed, and adjusted if appropriate, at the beginning of each financial year.
The calculation of the units-of-production rate of amortisation could be impacted to the extent that actual production in the future is different from current forecast production based on provedProven and probable OreProbable Mineral Reserve. This would generally arise from the following factors:
•changes in provedProven and probable OreProbable Mineral Reserve;
•the grade of OreMineral Reserve may vary significantly from time to time;
•differences between actual commodity prices and commodity price assumptions;
•unforeseen operational issues at mine sites; and
•changes in capital, operating, mining, processing and reclamation costs, discount rates and foreign exchange rates.
Changes in provedProven and probable OreProbable Mineral Reserve could similarly impact the useful lives of assets amortised on the straight-line method, where those lives are limited to the life of the mine.
Stripping costs
The groupGroup has a number of surface mining operations that are in the production phase for which production stripping costs are incurred. The benefits that accrue to the groupGroup as a result of incurring production stripping costs include (a) ore that can be used to produce inventory and (b) improved access to further quantities of material that will be mined in future periods.
The production stripping costs relating to improved access to further quantities of material in future periods are capitalised as a stripping activity asset, if and only if, all of the following are met:
•It is probable that the future economic benefit (improved access to the orebody) associated with the stripping activity will flow to the group;Group;
•The groupGroup can identify the component of the orebody for which access has been improved; and
•The costs relating to the stripping activity associated with that component or components can be measured reliably.
Components of the various orebodies at the operations of the groupGroup are determined based on the geological areas identified for each of the orebodies and are reflected in the OreMineral Reserve reporting of the group.Group. In determining whether any production stripping costs should be capitalised as a stripping activity asset, the groupGroup uses three operational guidance measures; two of which relate to production measures, while the third relates to an average stripping ratio measure.
Once determined that any portion of the production stripping costs should be capitalised, the groupGroup determines the amount of the production stripping costs that should be capitalised with reference to the average mine costs per tonne of the component and the actual waste tonnes that should be deferred. Stripping activity assets are amortised on the units-of-production method based on the OreMineral Reserve of the component or components of the orebody to which these assets relate.
This accounting treatment is consistent with that for stripping costs incurred during the development phase of a pit, before production commences, except that stripping costs incurred during the development phase of a pit, before production commences, are amortised on the units-of-production method based on the OreMineral Reserve of the pit.
Deferred stripping costs are included in ‘Mine development costs’, within tangible assets. These costs form part of the total investment in the relevant cash-generating unit, which is reviewed for impairment if events or a change in circumstances indicate that the carrying value may not be recoverable. Amortisation of stripping activity assets is included in cost of sales.
Impairment
The groupGroup reviews and tests the carrying value of tangible assets when events or changes in circumstances indicate that the carrying amount may not be recoverable. Assets are grouped at the lowest level for which identifiable cash flows are largely independent of cash flows of other assets, which is generally at the individual mine level. If there are indications that impairment may have occurred, estimates are prepared of expected future cash flows for each group of assets. Expected future cash flows used to determine the value in use of goodwill and tangible assets are inherently uncertain and could materially change over time and impact the recoverable amounts. The cash flows and value in use are significantly affected by a number of factors including published OreMineral Reserve, Mineral Resource, exploration potential and production estimates, together with economic factors such as spot and future metal prices, discount rates, foreign currency exchange rates, estimates of costs to produce Ore Mineral
F - 16
Use of estimates continued
Reserve and future capital expenditure. AtThe estimated future cash flows and discount rates are post-tax. Discounting post-tax cash flows at a post-tax discount rate yields the same result as discounting pre-tax cash flows at a pre-tax discount rate.At the reporting date the groupGroup assesses whether any of the indicators which gave rise to previously recognised impairments have changed such that the impairment loss no longer exists or may have decreased. The impairment loss is then assessed on the original factors for reversal and if indicated, such reversal is recognised.
An impairment loss is recognised for the amount by which the asset’s carrying amount exceeds its recoverable amount. The recoverable amount is the higher of an asset’s fair value less costs to sell and value in use.
The carrying value of tangible assets at 31 December 20202022 was $2,884m (2019: $2,592m; 2018: $3,381m)$4,209m (2021: $3,493m; 2020: $2,917m). The impairment and derecognition of tangible assets recognised in the consolidated financial statements for the year ended 31 December 2020 (including impairment of tangible assets transferred to held for sale)2022 was NaN (2019: $505m; 2018: $104m)$282m (2021: $6m; 2020: nil).
Production start date
The groupGroup assesses the stage of each mine construction project to determine when a project moves into the production stage. The criteria used to assess the start date are determined by the unique nature of each mine construction project and include factors such as the complexity of a plant and its location. The groupGroup considers various relevant criteria to assess when the construction project is substantially complete and ready for its intended use and moves into the production stage. The criteria used in the assessment would include, but are not limited to the following:
•the level of capital expenditure compared to the construction cost estimates;
•completion of a reasonable period of testing of the constructed asset;
•adequacy of stope face;
•ability to produce metals in saleable form (within specifications); and
•ability to sustain ongoing production of metal.
When a mine construction project moves into the production stage, the capitalisation of certain mine construction costs ceases and costs are either regarded as inventory or expensed, except for capitalisable costs related to mining asset additions or improvements, underground mine development, deferred stripping activities, or Ore Reserve development.
Phase 12 of the Obuasi mine re-development project, after initially being delayed due to voluntary suspension of all underground activities following a sill pillar incident during May 2021, moved into the production stage on 1 October 20202022 when it was determined that the Phase 12 assets were capable of operating in the manner intended by management.
Carrying value of goodwill
Where an investment in a subsidiary, joint venture or an associate is made, any excess of the consideration transferred over the fair value of the attributable Mineral Resource including value beyond provedProven and probable OreProbable Mineral Reserve, exploration properties and net assets is recognised as goodwill.
Goodwill is not subject to amortisation and is tested annually for impairment and whenever events or changes in circumstance indicate that the carrying amount may not be recoverable.
An impairment loss is recognised for the amount by which the asset’s carrying amount exceeds its recoverable amount. The recoverable amount is the higher of an asset’s fair value less costs to sell and value in use. For the purposes of assessing impairment, assets are grouped at the lowest levels for which there are separately identifiable independent cash flows (cash-generating units).
An individual operating mine is not a typical going-concern business because of the finite life of its OreMineral Reserve. The allocation of goodwill to an individual mine will result in an eventual goodwill impairment due to the wasting nature of the mine reporting unit. In accordance with the provisions of IAS 36, the groupGroup performs its annual impairment review of assigned goodwill during the fourth quarter of each year, refer to note 15 for impairment assumptions.
The carrying value of goodwill in the consolidated financial statements at 31 December 20202022 was $126m (2019: $116m; 2018: $116m)$105m (2021: $119m; 2020: $126m). NaN impairmentImpairment of goodwill was recognised in the consolidated financial statements for the yearsyear ended 31 December 2020, 2019 and 2018.2022 was $8m (2021: nil; 2020: nil).
F - 17
Use of estimates continued
Income taxes
The groupGroup is subject to income taxes in numerous jurisdictions. Significant judgement is required in determining the worldwide provision for income taxes due to the complexity of legislation. There are many transactions and calculations for which the
ultimate tax determination is uncertain during the ordinary course of business. The groupGroup recognises liabilities for anticipated tax audit issues based on estimates of whether additional taxes will be due. Where the final tax outcome of these matters is different
from the amounts that were initially recorded, such differences will impact the income tax and deferred tax provisions in the period in which such determination is made.
The groupGroup tax reconciliation between tax expense and the product of accounting profit multiplied by the applicable tax rate, prepared in accordance with IAS 12 Income Taxes, applies the South African domestic corporate tax rate of 28 percent. This rate will be reduced to 27 percent with effect for years of assessment ending on or after 31 March 2023.
The groupGroup recognises the net future tax benefit related to deferred income tax assets to the extent that it is probable that the deductible temporary differences will reverse in the foreseeable future. Assessing the recoverability of deferred income tax assets requires the groupGroup to make significant estimates related to expectations of future taxable income. Estimates of future taxable income are based on forecast cash flows from operations and the application of existing tax laws in each jurisdiction. To the extent that future cash flows and taxable income differ significantly from estimates, the ability of the groupGroup to realise the net deferred tax assets recorded at the reporting date could be impacted.
Additionally, future changes in tax laws in the jurisdictions in which the groupGroup operates could limit the ability of the groupGroup to obtain tax deductions in future periods.
Carrying values at 31 December 2020:2022:
•deferred tax asset: $72m (2021: $7m; 2020: $7m (2019: $105m; 2018:NaN );
•deferred tax liability: $246m (2019: $241m; 2018: $315m)$300m (2021: $313m; 2020: $246m);
•taxation liability: $153m (2019: $72m; 2018: $60m)$45m (2021: $39m; 2020: $153m);
•taxation asset: $14m (2019: $10m; 2018: $6m)$41m (2021: $49m; 2020: $14m), included in trade, other receivables and other assets; andassets.
The unrecognised value of deferred tax assets: $487m (2019: $389m; 2018: $501m)assets is $857m (2021: $834m; 2020: $487m).
Provision for environmental rehabilitation obligations
The group’sGroup incurs obligations to close, restore and rehabilitate its mine sites affected by mining and exploration activities which are subject to various laws and regulations governing the protection of the environment. The groupGroup recognises management’s best estimate for decommissioning and restoration obligations in the period in which they are incurred.incurred and the costs can be reasonably estimated. The determination of the provision is based on, among other considerations, judgements and estimates of current damage caused, timing and amount of future costs to be incurred to rehabilitate the mine sites, estimates of future inflation, exchange rates and discount rates. Future changes to environmental laws and regulations, technology, life of mine estimates, inflation rates, foreign currency exchange rates and discount rates could affect the carrying amount of this provision.provision, cannot be predicted with certainty and could have a material impact on our business, financial condition, results of operations and cash flows. A sensitivity assessment is included in note 25.
The carrying amount of the rehabilitation obligations (including held for sale rehabilitation obligations) for the groupGroup at 31 December 20202022 was $674m (2019: $730m; 2018: $637m).$578m (2021: $673m; 2020: $659m ). Note 25 provides information about related environmental guarantees and bonds.
Stockpiles and metals in process
Costs that are incurred in or benefit the production process are accumulated in stockpiles and metals in process values. Net realisable value tests are performed at least annually and represent the estimated future sales price of the product, based on prevailing and long-term metals prices, less estimated costs to complete production and bring the product to sale.
Surface and underground stockpiles and metals in process are measured by estimating the number of tonnes added and removed from the stockpile, the number of contained ounces based on assay data, and the estimated recovery percentage based on the expected processing method. Stockpile ore tonnages are verified by periodic surveys.
Although the quantities of recoverable metal are reconciled by comparing the grades of ore to the quantities of metals actually recovered (metallurgical balancing), the nature of the process inherently limits the ability to precisely monitor recoverability levels. As a result, the metallurgical balancing process is constantly monitored and engineering estimates are refined based on actual results over time.
F - 18
Use of estimates continued
Variations between actual and estimated quantities resulting from changes in assumptions and estimates that do not result in write-downswrite downs to net realisable value are accounted for on a prospective basis.
The carrying value of inventories (excluding finished goods and mine operating supplies) for the groupGroup at 31 December 20202022 was $382m (2019: $377m; 2018: $404m)$306m (2021: $299m; 2020: $382m).
Recoverable tax, rebates, levies and duties
In a number of countries, particularly in AfricaTanzania and Argentina, AngloGold Ashanti is due refunds of indirect tax which remain outstanding for periods longer than those provided for in the respective statutes refer note 22.statutes. The Group uses probability weighted discounting models together with the expected timing of recovery of these refunds to estimate their fair values and related discounting effects which are updated at each reporting period. Timing of the recoverability and the resultant probabilities is updated based on several factors including ongoing correspondence and meetings with the relevant authorities and available income taxes for off-sets, if applicable. Where the recovery of the indirect tax refunds is tied to off-set arrangements against income taxes, the modeled scenarios incorporate judgements around the applicable mine’s business plan and availability of future income tax off-sets. The Group consults tax and legal specialists to determine the current basis of applicable laws and regulations in the associated jurisdictions which are highly complex and subject to interpretation. Future changes to such laws and regulations or the interpretation thereof could have a material impact on the carrying value of these assets, results of operations and cash flows.
In addition, AngloGold Ashanti has unresolved non-income tax disputes in a number of countries, particularly in Africa and inTanzania, Brazil and Argentina. If the outstanding input taxes are not received and these disputes are not resolved in a manner favourable to AngloGold Ashanti, it could have a material adverse effect upon the carrying value of these assets and our results of operations.
The net carrying value of recoverable tax, rebates, levies and duties (excluding normal taxation assets) for the groupGroup at 31 December 20202022 was $281m (2019: $227m; 2018: $194m).$307m (2021: $304m; 2020: $281m) and is included in trade, other receivables and other assets, refer note 20.
Post-retirement obligations
The determination of the group’sGroup’s obligation and expense for post-retirement liabilities, including the Group's reimbursive asset relating to annuities purchased to fund the obligation, depends on the selection of certain assumptions used by actuaries to calculate amounts. These assumptions include, among others, the discount rate, the expected long-term rate of return of plan assets, health care inflation costs, rates of increase in compensation costs and the number of employees who reach retirement age before the mine reaches the end of its life. While AngloGold Ashanti believes that these assumptions are appropriate, significant changes in the assumptions may materially affect post-retirement obligations as well as future expenses, which may result in an impact on earnings in the periods that the changes in these assumptions occur.
The carrying value of the post-retirement obligations at 31 December 20202022 was $83m (2019: $100m; 2018: $100m)$71m (2021: $77m; 2020: $83m).
A Mineral Reserve estimate is an estimate of the amounttonnage and grade or quality of productIndicated and Measured Mineral Resource that can be the basis of an economically viable project. More specifically, it is the economically mineable part of a Measured or Indicated Mineral Resource, which includes diluting materials and legally extracted fromallowances for losses that may occur when the group’s properties.material is mined or extracted. In order to calculateestimate the OreMineral Reserve, estimates and assumptions are required about a range of geological, technical and economic factors, including quantities, grades, production techniques, recovery rates, production costs, transport costs, commodity demand, commodity prices and exchange rates.
Estimating the quantity and/or grade of the OreMineral Reserve requires the size, shape and depth of orebodies to be determined by analysing geological data such as the logging and assaying of drill samples. This process may require complex and difficult geological judgements and calculations to interpret the data.
F - 19
Use of estimates continued
period to period. Changes in the reported OreMineral Reserve may affect the group’sGroup’s financial results and financial position in a number of ways, including the following:
•asset carrying values may be affected due to changes in estimated future cash flows;
•depreciation, depletion and amortisation charged in the income statement may change where such charges are determined by the units-of-production method, or where the useful economic lives of assets change;
•overburden removal costs, including production stripping activities, recorded on the statement of financial position or charged in the income statement may change due to changes in stripping ratios or the units-of-production method of depreciation;
•decommissioning site restoration and environmental provisions may change where changes in the estimated OreMineral Reserve affect expectations about the timing or cost of these activities; and
•the carrying value of deferred tax assets may change due to changes in estimates of the likely recovery of the tax benefits.
Provision for silicosis
The Settlement Agreement in the silicosis and tuberculosis class action litigation became operational on 10 December 2019. A settlement trust, known as the Tshiamiso Trust, was established to carry out the terms of the Settlement Agreement. Significant judgement is applied in estimating the costs that will be incurred to settle the silicosis class action claims and related expenditure. The final costs may differ from current cost estimates. The provision is based on actuarial assumptions including:
•silicosis prevalence rates;
•estimated settlement per claimant;
•benefit take-up rates;
•disease progression rates;
•timing of cashflows; and
•discount rate.
Management believes the assumptions are appropriate, however changes in the assumptions may materially affect the provision and final costs of settlement. A sensitivity assessment is included in note 25.
The carrying value of the silicosis provision at 31 December 20202022 was $61m (2019: $65m; 2018: $63m)$35m (2021: $50m; 2020: $61m).
As a consequence of the sale of the South African operations in 2020, a deferred compensation asset was recognised. The deferred compensation asset is included at fair value in level 3 of the fair value hierarchy. Management used a probability weighted discounted cash flow model to measure the deferred compensation asset. The significant inputs and assumptions used in the discounted cash flow calculation, includedinclude the production plan over the deferred compensation period and the weighted average cost of capital. Details of the valuation, including a sensitivity assessment, are included in note 35.33.
The carrying value of the deferred compensation asset at 31 December 20202022 was $28m.$12m (2021: $25m; 2020: $28m).
Contingencies
By their nature, contingencies will only be resolved when one or more future events occur or fail to occur. The assessment of such contingencies inherently involves the exercise of significant judgement and estimates of the outcome of future events. Such contingencies include, but are not limited to environmental obligations, litigation, regulatory proceedings, tax matters and losses resulting from other events and developments. Refer note 1210 for tax uncertainties and contingencies and note 3432 for litigationlegal claims and other contingencies.
When a loss is considered probable and reasonably estimable, a liability is recorded in the amount of the best estimate for the ultimate loss. The likelihood of a loss with respect to a contingency can be difficult to predict and determining a meaningful estimate of the loss or a range of loss may not always be practicable based on the information available at the time and the potential effect of future events and decisions by third parties that will determine the ultimate resolution of the contingency. It is not uncommon for such matters to be resolved over many years, during which time relevant developments and new information is continuously evaluated to determine both the likelihood of any potential loss and whether it is possible to reasonably estimate a range of possible losses. When a loss is probable but a reasonable estimate cannot be made, disclosure is provided.
In determining the threshold for disclosure on a qualitative and quantitative basis, management considers the potential for a disruptive effect on the normal functioning of the groupGroup and/or whether the contingency could impact investment decisions. Such qualitative matters considered are reputational risks, regulatory compliance issues and reasonable investor considerations. For quantitative purposes, an amount of $18m$33m has been considered.
As a global company, the groupGroup is exposed to numerous legal risks. The outcome of currently pending and future proceedings cannot be predicted with certainty. Litigation and other judicial proceedings as a rule raise difficult and complex legal issues and are subject to uncertainties and complexities including, but not
F - 20
limited to, the facts and circumstances of each particular case, issues regarding the jurisdiction in which each suit is brought and differences in applicable law. Upon resolution of any pending legal matter, the groupGroup may be forced to incur charges in excess of the presently established provisions and related insurance coverage. It is possible that the financial position, results of operations or cash flows of the groupGroup could be materially affected by the unfavourable outcome of litigation.
Climate change considerations
The group has worked alongside authoritiesCompany’s 2021 TCFD-aligned Climate Change Report outlines the Board-approved Climate Change Strategy and key stakeholders inseeks to embed the management of physical and transition climate risks and opportunities into the Company’s strategic and operational planning processes, a process that is enabled through a refreshed company-wide climate change governance framework. The report also summarises at a high level specific outcomes from the physical climate risk assessment conducted at each operating country to assist public health efforts and to help slow the spread of the virus. Measures have been taken to help protectoperating assets, considering the well-beingbusiness as usual scenario. The potential effect of our employeesdecarbonisation scenarios and communities.other transition risks on the Company’s business strategy and planning assumptions including the cost of energy and other key mining inputs, is an area that will be addressed through the continued implementation of the Company’s Climate Change Strategy.
Unlike other major mineral resources companies, AngloGold Ashanti continuesdoes not mine or extract fossil fuels such as coal, natural gas or oil. AngloGold Ashanti does, however, emit greenhouse gases directly through the combustion of fuels and other energy products at its gold mining operations and indirectly through the consumption of electricity purchased from national grids that include fossil-based energy in its production. AngloGold Ashanti has committed to respond toa target of net zero Scope 1 and 2 greenhouse gas (GHG) emissions by 2050 in line with the evolving COVID-19 pandemic while contributing to the global effort to stop the spreadambitions of the virusParis Agreement, as a member of the International Council on Mining and provide public health and economic relief to local communities. TheMetals (ICMM). As a member of the ICMM, the Company has taken a number of proactive stepsalso committed to protect employees, host communities and the business itself. These initiatives have complemented government responsesaccelerating action on Scope 3 emissions, including setting credible targets in each of its operating jurisdictions. Our thoughts and prayers arepartnership with the families, colleagues and loved ones of those who have been impactedsuppliers, if not by the virus.
1.3 SUMMARY OF SIGNIFICANTMATERIAL ACCOUNTING POLICIES
Equity-accounted investments
Joint ventures and Associates
A joint venture is an entity in which the groupGroup holds a long-term interest and which the groupGroup and one or more other ventures jointly control under a contractual arrangement, that provides for strategic, financial and operating policy decisions relating to the activities requiring unanimous consent of the parties sharing control. The group’s interests inIn a joint arrangements classified as joint ventures are accountedventure the Group has rights to the net assets of the arrangement, rather than rights to its assets and obligations for using the equity method.
Joint ventures and Associates are equity-accounted from the effective date of acquisition to the effective date of disposal.
Any losses of equity-accounted investments are accounted for in the consolidated financial statements until the investment in such investments is written down to zero. Thereafter, losses are accounted for only insofar as the groupGroup is committed to providing financial support to such investees.
The carrying value of equity-accounted investments represents the cost of each investment, including goodwill, balance outstanding on loans advanced if the loan forms part of the net investment in the investee, any impairment / impairment reversals recognised, the share of post-acquisition retained earnings and losses, and any other movements in reserves. The carrying value of equity-accounted investments is reviewed when indicators arise and if any impairment / impairment reversal has occurred; it is recognised in the period in which the impairment arose. If necessary, impairment and impairment reversals on loans and equity are reported under share of joint ventures and associates profit and loss
In the cash flow statement, dividends received from joint ventures are included in operating activities and dividends received from associates are included in investing activities.
In determining materiality for the disclosure requirements of IFRS 12 “DisclosureDisclosure of Interest in Other Entities”,Entities, management has assessed that amounts representing the carrying value of at least 90% of the investments in associates and joint ventures balances, reported in the statement of financial position, constitute quantitative materiality.
Joint operations
F - 21
A joint operation is a joint arrangement whereby the parties that have joint control of the arrangement have rights to the use of assets and obligations for the liabilities of the arrangement. The groupGroup accounts for activities under joint operations by recognising, in relation to the joint operation, the assets it controls and the liabilities it incurs, the expenses it incurs and the revenue from the sale or use of its share of the joint operations output.
Foreign currency translation
Functional currency
Items included in the financial statements of each of the group’sGroup’s entities are measured using the currency of the primary economic environment in which the entity operates (the ‘functional currency’). The functional currency of the parent companyCompany is South African Rands.
Foreign currency transactions are translated into the functional currency using the approximate exchange rates prevailing at the dates of the transactions. Foreign exchange gains and losses resulting from the settlement of foreign currencysuch transactions, and from the translation at the reporting period exchange rate of monetary assets and liabilities denominated in foreign currencies, are recognised in the income statement.profit or loss.
Group companies
The results and financial position of all groupGroup entities (none of which has the currency of a hyperinflationary economy) that have a functional currency different from the presentation currency are translated into the presentation currency as follows:
Exchange differences arising from the translation of the net investment in foreign operations and of borrowings and other currency instruments designated as hedges of such investments, are accounted for as other comprehensive income on consolidation. On repayment or realisation of net investments in foreign operations, the resulting FCTR is recycled to the income statement. On disposal of non-foreign operations, where the parent’s functional currency, is the same as the subsidiary’s, associate’s, joint venture’s or branch’s functional currency, no reclassification of FCTR is required.
Tangible assets
Tangible assets are recorded at cost less accumulated amortisation and impairments/reversals. Cost includes pre-production expenditure incurred during the development of a mine and the present value of related future decommissioning costs.
Interest on borrowings relating to the financing of major capital projects under construction is capitalised during the construction phase as part of the cost of the project. Such borrowing costs are capitalised over the period during which the asset is being acquired or constructed and borrowings have been incurred. Capitalisation ceases when construction is interrupted for an extended period or when the asset is substantially complete. Other borrowing costs are expensed as incurred.
To the extent a legal or constructive obligation to a third party exists, the acquisition cost includes estimated costs of dismantling and removing the asset and restoring the site. A change in estimated expenditures for dismantling, removal and restoration is added to or deducted from the carrying value of the related asset. To the extent that the change would result in a negative carrying amount of the related asset, this effect is recognised as income. The change in depreciation charge is recognised prospectively.
For assets amortised on the units-of-production method, amortisation is calculated to allocate the cost of each asset to its residual value over its estimated useful life. For assets not amortised on the units-of-production method, amortisation is calculated over their estimated useful life as follows:
•buildings up to life of mine;
•plant and machinery up to life of mine;
•equipment and motor vehicles up to five years; and
•computer equipment up to three years; andyears.
Mine development costs
Capitalised mine development costs include expenditure incurred to develop new orebodies, to define further mineralisation in existing orebodies and to expand the capacity of a mine. Mine development costs include acquired provedProven and probable OreProbable Mineral Reserve at cost at the acquisition date. These costs are amortised from the date on which the assets are ready for use as intended by management.
Depreciation, depletion and amortisation of mine development costs are computed by the units-of-production method based on estimated provedProven and probable OreProbable Mineral Reserve. The provedProven and probable OreProbable Mineral Reserve reflects estimated quantities of OreMineral Reserve which can be recovered economically in the future from known mineral deposits.
F - 22
Capitalised mine development costs also include stripping activity assets relating to production stripping activities incurred in the production phase of open-pit operations of the group.Group. Once determined that any portion of the production stripping costs should be capitalised, the groupGroup determines the average mine costs per tonne of the component and the waste tonnes to which the production stripping costs relate to determine the amount of the production stripping costs that should be capitalised. Stripping activity assets are amortised on a units-of-production method based on the OreMineral Reserve of the component of the orebody to which these assets relate.
The average mine cost per tonne of the component is calculated as the total expected costs to be incurred to mine the relevant component of the orebody, divided by the number of tonnes expected to be mined from the component. The average mine cost per tonne of the component to which the stripping activity asset relates are recalculated annually in the light of additional knowledge and changes in estimates.
Mine infrastructure
Mine plant facilities, including decommissioning assets, are amortised using the lesser of their useful life or units-of-production method based on estimated provedProven and probable OreProbable Mineral Reserve.
Equipment, furniture and fittings in the Company financial statements are included in Mine infrastructure in the Group financial statements.
Land and assets under construction
Land and assets under construction are not depreciated and are measured at historical cost less impairments.
Mineral rights and dumps
Mineral rights are amortised using the units-of-production method based on the estimated provedProven and probable OreProbable Mineral Reserve. Dumps are amortised over the period of treatment.
Exploration and evaluation assets
All pre-license and exploration costs, including geological and geographical costs, labour, Mineral Resource and exploratory drilling cost, are expensed as incurred, until it is concluded that a future economic benefit will more likely than not be realised. In evaluating if expenditures meet this criterion to be capitalised, several different sources of information are used depending on the level of exploration. While the criterion for concluding that expenditure should be capitalised is always probable, the information used to make that determination depends on the level of exploration:
•Costs on greenfields sites, being those where the groupGroup does not have any mineral deposits which are already being mined or developed under the planned method of extraction, are expensed as incurred until the groupGroup is able to demonstrate that future economic benefits are probable, which generally will be the establishment of provedProven and probable OreProbable Mineral Reserve at this location;
•Costs on brownfields sites, being those adjacent to mineral deposits which are already being mined or developed under the planned method of extraction, are expensed as incurred until the groupGroup is able to demonstrate that future economic benefits are probable, which generally will be the establishment of increased inclusive provedProven and probable Ore Reserve,Probable Mineral Resource, after which the expenditure is capitalised as a mine development cost; and
•Costs relating to extensions of mineral deposits, which are already being mined or developed, including expenditure on the definition of mineralisation of such mineral deposits, are capitalised as a mine development cost.
Costs relating to property acquisitions are capitalised within mine development costs.
Impairment of non-financial assets
The Group’s non-financial assets, other than inventories and deferred tax assets, are reviewed at each reporting date or whenever events or changes in circumstances indicate that the carrying amount may not be recoverable, to determine whether there is any indication of impairment. An impairment test is performed annually on all goodwill, intangible assets not yet in use and intangible assets with indefinite useful lives irrespective of whether any impairment indicators have been identified.
For non-financial assets or cash generating units, in circumstances in which indicators of impairment are identified, a formal impairment test is required to be carried out. The impairment test compares the assets or cash generating units (CGUs) carrying amount with its recoverable amount. The recoverable amount is the higher of the amounts calculated under the fair value less cost of disposal and value in use approaches.
Value-in-use is estimated using a discounted cash flow model. The future cash flows are adjusted for risks specific to the asset and is adjusted where applicable to consider any specific risks relating to the country where the asset or cash-generating unit is
F - 23
located. Future cash flows are discounted to their present value using a discount rate that reflects current market assessments of the time value of money.
A cash-generating unit is the smallest identifiable group of assets that generates cash inflows that are largely independent of the cash inflows from other assets or groups of assets. The composition and nature of the Group’s CGUs vary and is determined largely by identifying the smallest identifiable group of assets that generates independent cash inflows and factors specific to the Group’s mining operations. The Group’s CGUs are generally at the individual mine level with some operating mines consisting of a combination of shafts and/or pits.
The Group allocates regional support assets to the CGUs. If there is an indication that a regional support asset may be impaired, then the recoverable amount is determined for the CGU to which the corporate asset belongs.
Exploration assets are tested for impairment whenever facts and circumstances indicate that the carrying amount is not recoverable. Assets will be allocated to CGUs or groups of CGUs based on how the entity manages its operations i.e., by mineral within a specific geographic area. An impairment loss is recognised for the amount by which the assets or CGUs carrying amount exceeds their recoverable amount.
Development expenditure
Development activities commence after project sanctioning by the appropriate level of management. Judgement is applied by management in determining when a project has reached a stage at which economically recoverable reserves exist such that development may be sanctioned. In exercising this judgement, management is required to make certain estimates and assumptions that may change as new information becomes available. If, after having started the development activity, a judgement is made that a development asset is impaired, the appropriate amount will be written off to the income statement. Capitalised development costs are included as assets under construction and mine development costs in tangible assets.
Goodwill
Where an investment in a subsidiary, joint venture or an associate is made, any excess of the consideration transferred over the fair value of the attributable Mineral Resource including value beyond Proven and Probable Ore Reserves,Mineral Reserve, exploration properties and net assets is recognised as goodwill. Goodwill in respect of subsidiaries is disclosed as goodwill.
Goodwill relating to subsidiaries is tested annually for impairment and carried at cost less accumulated impairment losses. Gains and losses on the disposal of an entity include the carrying amount of goodwill relating to the entity sold. Goodwill is allocated to cash-generating units for the purpose of impairment testing.
Leases
The groupGroup assesses whether a contract is or contains a lease at inception of a contract. The groupGroup recognises a right-of-use asset and a corresponding lease liability with respect to all lease agreements in which it is the lessee, except for short-term leases (defined as leases with a lease term of 12 months or less with no purchase option) and leases of low value assets.assets, where the recognition exemption is applied. For these leases, the groupGroup recognises the lease payments as an operating expense on a straight-line basis over the term of the lease unless another systematic basis is more representative of the time pattern in which economic benefits from the leased asset are consumed. The lease liability is initially measured at the present value of the lease payments that are not paid at the commencement date, discounted by using the rate implicit in the lease. If this rate cannot be readily determined, the groupGroup uses its incremental borrowing rate. The groupincremental borrowing rate is the rate that the Group would have to pay to borrow the funds necessary to obtain an asset of similar value to the right of use asset in a similar economic environment with similar terms, security and conditions. The Group applies the IFRS 16 portfolio approach in determining the discount rate for leases. As such a single discount rate has been used for contracts that share similar characteristics. The groupGroup has determined that contracts that are denominated in the same currency will use a single discount rate. This rate has been determined using various factors including in-country borrowings as well as other sources of finance. Contracts may contain both lease and non-lease components. The groupGroup allocates the consideration in the contract to the lease and non-lease components based on their relative stand-alone prices.
Lease payments included in the measurement of the lease liability comprise:
•fixed lease payments (including in-substance fixed payments), less any lease incentives;
•variable lease payments that depend on an index or rate, initially measured using the index or rate at the commencement date;
•the amount expected to be payable by the lessee under residual value guarantees;
•the exercise price of purchase options, if the lessee is reasonably certain to exercise the options; and
•payments of penalties for terminating the lease, if the lease term reflects the exercise of an option to terminate the lease.
The lease liability is presented separately in the consolidated statement of financial position, allocated to non-current and current liabilities.
F - 24
The groupGroup remeasures the lease liability (and makes a corresponding adjustment to the related right-of-use asset) whenever:
•the lease term has changed or there is a change in the assessment of exercise of a purchase option, in which case the lease liability is remeasured by discounting the revised lease payments using a revised discount rate;
•the lease payments change due to changes in an index or rate or a change in expected payment under a guaranteed residual value, in which cases the lease liability is remeasured by discounting the revised lease payments using the initial discount rate (unless the lease payments change is due to a change in a floating interest rate, in which case a revised discount rate is used);
•a lease contract is modified and the lease modification is not accounted for as a separate lease, in which case the lease liability is remeasured by discounting the revised lease payments using a revised discount rate.
The right-of-use assets comprise the initial measurement of the corresponding lease liability, lease payments made at or before the commencement day, any initial direct costs and restoration costs as described below. They are subsequently measured at cost less accumulated depreciation and impairment losses.
The lease term is determined as the non-cancellable period of a lease, together with:
•periods covered by an option to extend the lease if the groupGroup is reasonably certain to make use of that option; and / or
•periods covered by an option to terminate the lease, if the groupGroup is reasonably certain not to make use of that option.
Whenever the groupGroup incurs an obligation for costs to dismantle and remove a leased asset, restore the site on which it is located or restore the underlying asset to the condition required by the terms and conditions of the lease, a provision is recognised and measured under IAS 37 Provisions, Contingent Liabilities and Contingent Assets. The costs are included in the related right-of-use asset, unless those costs are incurred to produce inventories.
Right-of-use assets are depreciated over the shorter period of lease term and useful life of the underlying asset. If a lease transfers ownership of the underlying asset or the cost of the right-of-use asset reflects that the groupGroup expects to exercise a purchase option, the related right-of-use asset is depreciated over the useful life of the underlying asset. The depreciation starts at the commencement date of the lease.
The groupGroup applies IAS 36 Impairment of Assets to determine whether a right-of-use asset is impaired and accounts for any identified impairment loss accordingly.
Inventories
Inventories are valued at the lower of cost and net realisable value after appropriate allowances for redundant and obsolete items. Cost is determined on the following bases:
•metals in process are valued at the average total production cost at the relevant stage of production;
•gold doré/bullion is valued on an average total production cost method;
•ore stockpiles are valued at the average moving cost of mining and stockpiling the ore. Stockpiles are classified as a non-current asset where the stockpile exceeds current processing capacity;
•by-products, which include silver and sulphuric acid, are valued using an average total production cost method;
•mine operating supplies are valued at average cost; and
•heap leach pad materials are measured on an average total production cost basis.
A portion of the related depreciation, depletion and amortisation charge is included in the cost of inventory. Impairments resulting from a decrease in prices are disclosed in other expenses, all other impairmentsInventory write downs are included in cost of sales.
Provisions
The group’s management awards certain employee bonuses in the form of equity-settled share-based payments on a discretionary basis.
regulatory requirements. Provisions for non-recurring remediation costs are made when there is a present obligation, it is probable that expenditure on remediation work will be required and the cost can be estimated within a reasonable range of possible outcomes. The costs are based on currently available facts, technology expected to be available at the time of the clean-up, laws and regulations presently or virtually certain to be enacted and prior experience in remediation of contaminated sites.
Decommissioning costs
The provision for decommissioning represents the cost that will arise from rectifying damage caused before production commences. Accordingly, a provision and a decommissioning asset is recognised and included within mine infrastructure.
F - 25
Decommissioning costs are provided at the present value of the expenditures expected to settle the obligation, using estimated cash flows based on current prices. The unwinding of the decommissioning obligation is included in the income statement. Estimated future costs of decommissioning obligations are reviewed regularly and adjusted as appropriate for new circumstances or changes in law or technology. Changes in estimates are capitalised or reversed against the relevant asset. Estimates are discounted at a pre-tax rate that reflects current market assessments of the time value of money.
Gains or losses from the expected disposal of assets are not taken into account when determining the provision.
Restoration costs
The provision for restoration represents the cost of restoring site damage after the start of production. Changes in the provision are recorded in the income statement as a cost of production.
Restoration costs are estimated at the present value of the expenditures expected to settle the obligation, using estimated cash flows based on current prices and adjusted for risks specific to the liability. The estimates are discounted at a pre-tax rate that reflects current market assessments of the time value of money.
Other
Litigation and administrative proceedings are evaluated on a case-by-case basis considering the information available, including that of legal counsel, to assess potential outcomes. Where it is considered probable that an obligation will result in an outflow of resources, a provision is recorded for the present value of the expected cash outflows if these are reasonably measurable. These provisions cover the estimated payments to plaintiffs, court fees and the cost of potential settlements.
Where some or all of the expenditure required to settle a provision is expected to be reimbursed by another party, the reimbursement is recognised only when the reimbursement is virtually certain. The amount to be reimbursed is recognised as a separate asset. Where the Group has a joint and several liability with one or more other parties, no provision is recognised to the extent that those other parties are expected to settle part or all of the obligation.
Employee benefits
Post-employment benefit obligations
Some Group companies provide post-retirement health care benefits to their retirees. The entitlement to these benefits is usually conditional on the employee remaining in service up to retirement age and completion of a minimum service period. The expected costs of these benefits are accrued over the period of employment using an accounting methodology on the same basis as that used for defined benefit pension plans. Actuarial gains and losses arising from experience adjustments and changes in actuarial assumptions are recorded in other comprehensive income immediately. These obligations are valued annually by independent qualified actuaries.
Some of these obligations are funded with a purchased insurance policy to which the Group contributes premiums to. As this insurance policy does not meet the definition of a qualifying insurance policy the entity recognises its right to reimbursement under the insurance policy as a separate asset measured at fair value similar to a defined benefit plan asset. Actuarial gains and losses arising from experience adjustments and changes in actuarial assumptions are recorded in other comprehensive income immediately. These obligations are valued annually by independent qualified actuaries.
Termination benefits
Termination benefits are payable when employment is terminated before the normal retirement date, or when an employee accepts voluntary redundancy in exchange for these benefits. The Group recognises a liability and expense for termination benefits when it is demonstrably committed to either terminating the employment of current employees according to a detailed formal plan without possibility of withdrawal; or providing termination benefits as a result of an offer made to encourage voluntary redundancy based on the number of employees expected to accept the offer. Benefits falling due more than 12 months after reporting date are discounted to present value.
Share-based payments
The Group’s management awards certain employee bonuses in the form of equity-settled share-based payments on a discretionary basis.
The fair value of the equity instruments granted is calculated at grant date. For transactions with employees, fair value is based on market prices of the equity instruments granted, if available, taking into account the terms and conditions upon which those equity instruments were granted. If market prices of the equity instruments granted are not available, the fair value of the equity instruments granted is estimated using an appropriate valuation model. Vesting conditions, other than market conditions, are not taken into account when estimating the fair value of shares or share options at measurement date.
F - 26
Over the vesting period, the fair value at measurement date is recognised as an employee benefit expense with a corresponding increase in other capital reserves based on the Group’s estimate of the number of instruments that will eventually vest. The income statement charge or credit for a period represents the movement in cumulative expense recognised as at the beginning and end of that period. Vesting assumptions for non-market conditions are reviewed at each reporting date to ensure they reflect current expectations.
When options are exercised or share awards vest, the proceeds received, net of any directly attributable transaction costs, are credited to share capital (nominal value) and share premium.
Where the terms of an equity settled award are modified, as a minimum, an expense is recognised as if the terms had not been modified. In addition, an expense is recognised for any modification which increases the total fair value of the share-based payment arrangement, or is otherwise beneficial to the employee, as measured at the date of the modification.
In addition, the Group’s management awards certain employee bonuses in the form of a cash settled scheme, whereby awards granted are linked to the performance of the Company’s share price. A liability is recognised based upon the grant date fair value and is subsequently remeasured to the closing share price at each reporting date up to the date of vesting. Remeasurements to fair value are recognised in the income statement.
Revenue recognition
Revenue is recognised when control of the goods passes to the customer and the performance obligations of transferring control have been met. The amount of revenue recognised reflects the consideration to which the entity is entitled in exchange for the goods transferred.
Revenue from product sales comprises sales of:
•refined gold;
•by-products including silver and sulphuric acid; and
•doré bars.
Revenue from product sales is recognised at a point in time.
Taxation
Deferred taxation is recognised on all qualifying temporary differences at the reporting date between the tax bases of assets and liabilities and their carrying amounts for financial reporting purposes.
Deferred tax assets are only recognised to the extent that it is probable that the deductible temporary differences will reverse in the foreseeable future and future taxable profit will be available against which the temporary difference can be utilised.
The carrying amount of deferred tax assets is reviewed at each reporting date.
Deferred tax assets and liabilities are measured at future anticipated tax rates, which have been enacted or substantively enacted at the reporting date.
Current and deferred tax is recognised as income or expense and included in profit or loss for the period, except to the extent that the tax arises from a transaction or event which is recognised, in the same or a different period in other comprehensive income or directly in equity, or an acquisition that is a business combination that is an acquisition.combination.
Current tax is measured on taxable income at the applicable statutory rate enacted or substantively enacted at the reporting date. Interest and penalties, if any, are recognised in the income statement as part of taxation expense if based on the specific facts and circumstances, the entity has determined that the interest (receivable or payable) and penalties payable to the tax authorities are an income tax.
Financial instruments
Financial instruments are initially recognised at fair value when the groupGroup becomes a party to their contractual arrangements. Transaction costs directly attributable to the instrument’s acquisition or issue are included in the initial measurement of financial
F - 27
assets and financial liabilities, except financial instruments classified as at fair value through profit or loss (FVTPL)., which are expensed. The subsequent measurement of financial instruments is dealt with below.
Financial liabilities
Financial liabilities are classified as measured at amortised cost using the effective interest rate method. Financial liabilities subsequently measured at amortizedamortised cost compromise of interest bearing borrowings, bank overdrafts and trade and other payables.
A financial liability is derecognised when the obligation under the liability is discharged, cancelled or expires. The groupGroup also derecognises a financial liability when its terms are modified and the cash flows of the modified liability are substantially different. In this case a new financial liability based on the modified terms is recognised at fair value.
Financial assets
•amortisedAmortised cost;
•Fair value through other comprehensive income (FVTOCI) - equity instruments; or
•FVTPL.
On derecognition of a financial asset, the difference between the proceeds received or loss arising on derecognitionreceivable and the carrying amount of the asset is recognised directlyincluded in profit or loss and presented in other gains or losses, together with foreign exchange gains or losses.loss. Impairment losses are presented in the statement of profit or loss. A gain or loss on a debt investment that is subsequently measured at FVTPL is recognised in profit or loss and presented net within other gains or lossesforeign exchange and fair value adjustments in the period in which it arises. On derecognition
Cash and cash equivalents
Cash and cash equivalents comprise cash on hand, deposits on call and other short-term highly liquid investments with a maturity period of a financial asset, the difference between the proceeds receivedthree months or receivableless at date of purchase. Cash and thecash equivalents are stated at carrying amount which fairly approximates its fair value. For the purposes of the assetstatement of cash flows cash and cash equivalents is includednet of bank overdrafts as it forms an integral part of the Group’s cash management.
Cash restricted for use
Cash restricted for use comprises cash and cash equivalents including amounts held in profit or loss.escrow, trust, separate bank accounts and cash held by joint operations which are not available for general use by the Group. Cash restricted for use for more than 12 months is classified as a non-current financial asset.
Equity instruments
Listed and unlisted equity investments are included in Other investments in the Statement of financial position. Listed equity investments which are held to meet rehabilitation liabilities are classified as FVTPL. Listed equity investments held for other purposes are classified as FVTOCI.
The groupGroup subsequently measures all equity investments at fair value. Where the group’sGroup’s management has elected to present fair value gains and losses on equity investments in OCI, there is no subsequent reclassification of fair value gains and losses to profit or loss following the derecognition of the investment. Dividends from such investments continue to be recognised in profit or loss as other income when the group’sGroup’s right to receive payments is established. Residual values in OCI are reclassified to retained earnings (accumulated losses) on derecognition of the related FVTOCI instruments. Changes in the fair value of financial assets at FVTPL are recognised in other gains or losses in the statement of profit or loss as applicable.
Impairment of financial assets
Financial assets at amortised cost consist of trade receivables, loans, cash and cash equivalents, cash restricted for use and debt instruments.securities. Impairment losses are assessed using the forward-looking expected credit loss (ECL) approach. An allowance is recorded for all loans and other debt financial assets not held at FVTPL. The impairment methodology applied depends on whether there has been a significant increase in credit risk. Trade receivable loss allowances are measured at an amount equal to lifetime ECL’s. Loss allowances are deducted from the gross carrying amount of the assets.assets and the movement on the loss allowance is recognised in profit and loss. Debt securities that are determined to have a low credit risk at the reporting date and bank balances, for which credit risk has not increased significantly since initial recognition, are measured at an amount equal to 12-month ECL.
F - 28
Financial guarantee contracts are recognised as a financial liability at the time the guarantee is issued. The group measures financial instrumentsliability is initially measured at fair value at each reporting date where relevant. Fair value is the price that would be received to sell an asset or paid to transfer a liability in an orderly transaction between market participants at the measurement date.value. The fair value of an asset or a financial guarantee contract is the present value of the difference between the net contractual cash flows required under a debt instrument, and the net contractual cash flows that would have been required without the guarantee. The liability is measured usingamortised in a straight line over the assumptions that market participants would use when pricingperiod the asset or liability, assuming that market participants actguarantee remains in their economic best interest.place.
F - 2829
2 SEGMENTAL INFORMATION
AngloGold Ashanti Limited’sAshanti’s operating segments are being reported based on the financial information regularly provided to the Chief Executive Officer and the Executive Committee, collectively identified as the Chief Operating Decision Maker (CODM). The group produces gold as its primary product and does not have distinct divisional segments in terms of principal business activity, but manages its business on the basis of different geographic segments (including equity accounted joint venture investments). Individual members of the Executive Committee are responsible for geographic regions of the business.
| Figures in millions | Gold income | ||||||||||||||||
| US Dollars | 2020 | 2019 | 2018 | ||||||||||||||
| Geographical analysis of gold income by origin is as follows: | |||||||||||||||||
Africa(1) | 2,769 | 2,203 | 1,983 | ||||||||||||||
| Australia | 989 | 851 | 780 | ||||||||||||||
| Americas | 1,211 | 1,000 | 1,021 | ||||||||||||||
| 4,969 | 4,054 | 3,784 | |||||||||||||||
| Equity-accounted joint ventures included above | (647) | (615) | (581) | ||||||||||||||
| Continuing operations | 4,322 | 3,439 | 3,203 | ||||||||||||||
| Discontinued operations - South Africa | 408 | 554 | 602 | ||||||||||||||
| 4,730 | 3,993 | 3,805 | |||||||||||||||
| Foreign countries included in the above and considered material are: | |||||||||||||||||
| Australia | 989 | 851 | 780 | ||||||||||||||
| Argentina | 0 | 0 | 387 | ||||||||||||||
| Brazil | 853 | 679 | 0 | ||||||||||||||
| Ghana | 536 | 0 | 0 | ||||||||||||||
| Tanzania | 1,133 | 849 | 715 | ||||||||||||||
| DRC | 647 | 504 | 468 | ||||||||||||||
| Geographical analysis of gold income by destination is as follows: | |||||||||||||||||
| South Africa | 943 | 981 | 946 | ||||||||||||||
| North America | 580 | 486 | 450 | ||||||||||||||
| South America | 1 | 0 | 0 | ||||||||||||||
| Australia | 989 | 851 | 780 | ||||||||||||||
| Europe | 358 | 329 | 387 | ||||||||||||||
| United Kingdom | 2,098 | 1,407 | 1,221 | ||||||||||||||
| 4,969 | 4,054 | 3,784 | |||||||||||||||
| Equity-accounted joint ventures included above | (647) | (615) | (581) | ||||||||||||||
| Continuing operations | 4,322 | 3,439 | 3,203 | ||||||||||||||
| Discontinued operations - South Africa | 408 | 554 | 602 | ||||||||||||||
| Continuing and discontinued operations | 4,730 | 3,993 | 3,805 | ||||||||||||||
| Figures in millions | By product revenue | ||||||||||||||||
| US Dollars | 2020 | 2019 | 2018 | ||||||||||||||
Africa(1) | 4 | 3 | 4 | ||||||||||||||
| Australia | 3 | 3 | 2 | ||||||||||||||
| Americas | 99 | 81 | 128 | ||||||||||||||
| 106 | 87 | 134 | |||||||||||||||
| Equity-accounted joint ventures included above | (1) | (1) | (1) | ||||||||||||||
| Continuing operations | 105 | 86 | 133 | ||||||||||||||
| Discontinued operations - South Africa | 1 | 1 | 6 | ||||||||||||||
| 106 | 87 | 139 | |||||||||||||||
In addition to the geographical reportable segments structure, the Group has voluntarily disaggregated and disclosed the financial information on a line-by-line basis for each mining operation to facilitate comparability of mine performance.
F - 2930
| Figures in millions | Gold income | ||||||||||||||||
| US Dollars | 2022 | 2021 | 2020 | ||||||||||||||
Restated (8) | |||||||||||||||||
| Geographical analysis of gold income by origin is as follows: | |||||||||||||||||
Africa * (1) | 2,981 | 2,644 | 2,937 | ||||||||||||||
| Kibali - Attributable 45% | 596 | 659 | 647 | ||||||||||||||
| Iduapriem | 443 | 361 | 485 | ||||||||||||||
| Obuasi | 431 | 204 | 219 | ||||||||||||||
| Siguiri | 591 | 545 | 453 | ||||||||||||||
| Geita | 920 | 875 | 1,133 | ||||||||||||||
| Australia * | 967 | 890 | 989 | ||||||||||||||
| Sunrise Dam | 410 | 416 | 459 | ||||||||||||||
| Tropicana - Attributable 70% | 557 | 474 | 530 | ||||||||||||||
| Americas * | 1,036 | 1,028 | 1,211 | ||||||||||||||
| Cerro Vanguardia | 319 | 279 | 358 | ||||||||||||||
| AngloGold Ashanti Mineração | 557 | 600 | 649 | ||||||||||||||
| Serra Grande | 160 | 149 | 204 | ||||||||||||||
| 4,984 | 4,562 | 5,137 | |||||||||||||||
| Equity-accounted joint ventures included above | (596) | (659) | (647) | ||||||||||||||
| Continuing operations | 4,388 | 3,903 | 4,490 | ||||||||||||||
| Discontinued operations - South Africa | — | — | 408 | ||||||||||||||
| 4,388 | 3,903 | 4,898 | |||||||||||||||
| Foreign countries included in the above and considered material are: | |||||||||||||||||
| Australia | 967 | 890 | 989 | ||||||||||||||
| Argentina | 319 | 279 | 358 | ||||||||||||||
| Brazil | 717 | 749 | 853 | ||||||||||||||
| Ghana | 874 | 565 | 704 | ||||||||||||||
| Guinea | 591 | 545 | 453 | ||||||||||||||
| Tanzania | 920 | 875 | 1,133 | ||||||||||||||
| DRC | 596 | 659 | 647 | ||||||||||||||
| Geographical analysis of gold income by destination is as follows: | |||||||||||||||||
South Africa # | 599 | 669 | 661 | ||||||||||||||
| North America | 409 | 699 | 580 | ||||||||||||||
| South America | 33 | 34 | 1 | ||||||||||||||
| Australia | 967 | 890 | 989 | ||||||||||||||
| Europe | 319 | 279 | 358 | ||||||||||||||
| United Kingdom | 2,066 | 1,446 | 2,095 | ||||||||||||||
Other # | 591 | 545 | 453 | ||||||||||||||
| 4,984 | 4,562 | 5,137 | |||||||||||||||
| Equity-accounted joint ventures included above | (596) | (659) | (647) | ||||||||||||||
| Continuing operations | 4,388 | 3,903 | 4,490 | ||||||||||||||
| Discontinued operations - South Africa | — | — | 408 | ||||||||||||||
| Continuing and discontinued operations | 4,388 | 3,903 | 4,898 | ||||||||||||||
# (continued)The Siguiri gold production is sold through an agent to multiple customers, the destination which is not determinable and as a result allocated to the Other category in the geographical analysis. The comparatives previously included under South Africa have been reclassified accordingly.
The group'sGroup's revenue is mainly derived from gold income. Approximately 38%55% of the group'sGroup's total gold produced is sold to twothree customers of the group:Group: ANZ Investment Bank Ltd 18% andin Australia (20%), Standard Chartered Bank 20%in the United Kingdom (22%), and JP Morgan Chase N.A. London in the United Kingdom (13%). Due to the diversity and depth of the total gold market, the bullion banks do not possess significant pricing power.
| Figures in millions | Gross profit (loss) (2) | ||||||||||||||||
| US Dollars | 2020 | 2019 | 2018 | ||||||||||||||
Africa(1) | 1,201 | 605 | 380 | ||||||||||||||
| Australia | 286 | 221 | 160 | ||||||||||||||
Americas(1) | 532 | 265 | 310 | ||||||||||||||
| Corporate and other | (2) | 1 | 2 | ||||||||||||||
| 2,017 | 1,092 | 852 | |||||||||||||||
| Equity-accounted joint ventures included above | (308) | (188) | (102) | ||||||||||||||
| Continuing operations | 1,709 | 904 | 750 | ||||||||||||||
| Discontinued operations - South Africa | 83 | 79 | 22 | ||||||||||||||
| 1,792 | 983 | 772 | |||||||||||||||
| Figures in millions | Cost of sales | ||||||||||||||||
| US Dollars | 2020 | 2019 | 2018 | ||||||||||||||
Africa(1) | 1,572 | 1,601 | 1,607 | ||||||||||||||
| Australia | 705 | 632 | 622 | ||||||||||||||
Americas (1) | 764 | 822 | 838 | ||||||||||||||
| Corporate and other | (2) | (1) | (3) | ||||||||||||||
| 3,039 | 3,054 | 3,064 | |||||||||||||||
| Equity-accounted joint ventures included above | (340) | (428) | (480) | ||||||||||||||
| Continuing operations | 2,699 | 2,626 | 2,584 | ||||||||||||||
| Discontinued operations - South Africa | 287 | 479 | 589 | ||||||||||||||
| 2,986 | 3,105 | 3,173 | |||||||||||||||
| Figures in millions | Amortisation | ||||||||||||||||
| US Dollars | 2020 | 2019 | 2018 | ||||||||||||||
Africa(1) | 349 | 367 | 379 | ||||||||||||||
| Australia | 160 | 173 | 149 | ||||||||||||||
Americas(1) | 163 | 177 | 192 | ||||||||||||||
| Corporate and other | 2 | 3 | 3 | ||||||||||||||
| 674 | 720 | 723 | |||||||||||||||
| Equity-accounted joint ventures included above | (104) | (137) | (165) | ||||||||||||||
| Continuing operations | 570 | 583 | 558 | ||||||||||||||
| Discontinued operations - South Africa | 0 | 61 | 72 | ||||||||||||||
| 570 | 644 | 630 | |||||||||||||||
| Figures in millions | Total assets (1)(3)(4) | ||||||||||||||||
| US Dollars | 2020 | 2019 | 2018 | ||||||||||||||
| South Africa | 0 | 697 | 1,106 | ||||||||||||||
| Africa | 3,956 | 3,514 | 3,135 | ||||||||||||||
| Australia | 1,044 | 972 | 888 | ||||||||||||||
| Americas | 1,626 | 1,427 | 1,286 | ||||||||||||||
| Corporate and other | 1,046 | 253 | 228 | ||||||||||||||
| 7,672 | 6,863 | 6,643 | |||||||||||||||
| Figures in millions | Non-current assets (5) | ||||||||||||||||
| US Dollars | 2020 | 2019 | 2018 | ||||||||||||||
| Non-current assets considered material, by country are: | |||||||||||||||||
| South Africa | 59 | 25 | 1,005 | ||||||||||||||
| Foreign entities | 5,053 | 4,644 | 4,234 | ||||||||||||||
| DRC | 1,604 | 1,506 | 1,439 | ||||||||||||||
| Ghana | 915 | 758 | 550 | ||||||||||||||
| Tanzania | 425 | 379 | 369 | ||||||||||||||
| Australia | 849 | 817 | 718 | ||||||||||||||
| Brazil | 627 | 625 | 615 | ||||||||||||||
F - 31
| Figures in millions | By product revenue | ||||||||||||||||
| US Dollars | 2022 | 2021 | 2020 | ||||||||||||||
Africa * (1) | 4 | 5 | 4 | ||||||||||||||
| Kibali - Attributable 45% | 1 | 2 | 1 | ||||||||||||||
| Iduapriem | 1 | 1 | 1 | ||||||||||||||
| Obuasi | 1 | — | — | ||||||||||||||
| Siguiri | — | 1 | — | ||||||||||||||
| Geita | 1 | 1 | 2 | ||||||||||||||
| Australia * | 4 | 4 | 3 | ||||||||||||||
| Sunrise Dam | 1 | 1 | 1 | ||||||||||||||
| Tropicana - Attributable 70% | 3 | 3 | 2 | ||||||||||||||
| Americas * | 106 | 119 | 99 | ||||||||||||||
| Cerro Vanguardia | 75 | 93 | 82 | ||||||||||||||
| AngloGold Ashanti Mineração | 31 | 26 | 17 | ||||||||||||||
| 114 | 128 | 106 | |||||||||||||||
| Equity-accounted joint ventures included above | (1) | (2) | (1) | ||||||||||||||
| Continuing operations | 113 | 126 | 105 | ||||||||||||||
| Discontinued operations - South Africa | — | — | 1 | ||||||||||||||
| 113 | 126 | 106 | |||||||||||||||
| Figures in millions | Cost of sales | ||||||||||||||||
| US Dollars | 2022 | 2021 | 2020 | ||||||||||||||
Restated (8) | |||||||||||||||||
Africa * (1) | 2,004 | 1,650 | 1,702 | ||||||||||||||
| Kibali - Attributable 45% | 342 | 350 | 340 | ||||||||||||||
| Iduapriem | 314 | 238 | 280 | ||||||||||||||
| Obuasi | 266 | 164 | 164 | ||||||||||||||
| Siguiri | 488 | 410 | 377 | ||||||||||||||
| Geita | 594 | 488 | 542 | ||||||||||||||
| Administration and other | — | — | (1) | ||||||||||||||
| Australia * | 783 | 740 | 705 | ||||||||||||||
| Sunrise Dam | 371 | 364 | 342 | ||||||||||||||
| Tropicana - Attributable 70% | 382 | 346 | 338 | ||||||||||||||
| Administration and other | 30 | 30 | 25 | ||||||||||||||
| Americas * | 913 | 822 | 764 | ||||||||||||||
| Cerro Vanguardia | 273 | 261 | 269 | ||||||||||||||
| AngloGold Ashanti Mineração | 477 | 435 | 392 | ||||||||||||||
| Serra Grande | 162 | 123 | 101 | ||||||||||||||
| Administration and other | 1 | 3 | 2 | ||||||||||||||
| Corporate and other | 4 | (5) | (2) | ||||||||||||||
| 3,704 | 3,207 | 3,169 | |||||||||||||||
| Equity-accounted joint ventures included above | (342) | (350) | (340) | ||||||||||||||
| Continuing operations | 3,362 | 2,857 | 2,829 | ||||||||||||||
| Discontinued operations - South Africa | — | — | 287 | ||||||||||||||
| 3,362 | 2,857 | 3,116 | |||||||||||||||
F - 32
| Figures in millions | Capital expenditure | ||||||||||||||||
| US Dollars | 2020 | 2019 | 2018 | ||||||||||||||
Africa(1) | 397 | 410 | 313 | ||||||||||||||
| Australia | 143 | 149 | 156 | ||||||||||||||
Americas (1) | 217 | 195 | 176 | ||||||||||||||
| Continuing operations | 757 | 754 | 645 | ||||||||||||||
| Discontinued operations - South Africa | 35 | 60 | 76 | ||||||||||||||
| 792 | 814 | 721 | |||||||||||||||
| Equity-accounted joint ventures included above | (56) | (51) | (69) | ||||||||||||||
| 736 | 763 | 652 | |||||||||||||||
| Figures in millions | Gross profit (loss) (2) | ||||||||||||||||
| US Dollars | 2022 | 2021 | 2020 | ||||||||||||||
Restated (8) | |||||||||||||||||
Africa * (1) | 981 | 999 | 1,239 | ||||||||||||||
| Kibali - Attributable 45% | 256 | 311 | 308 | ||||||||||||||
| Iduapriem | 130 | 124 | 206 | ||||||||||||||
| Obuasi | 165 | 41 | 55 | ||||||||||||||
| Siguiri | 103 | 135 | 76 | ||||||||||||||
| Geita | 327 | 388 | 593 | ||||||||||||||
| Administration and other | — | — | 1 | ||||||||||||||
| Australia * | 188 | 153 | 286 | ||||||||||||||
| Sunrise Dam | 40 | 53 | 117 | ||||||||||||||
| Tropicana - Attributable 70% | 177 | 130 | 194 | ||||||||||||||
| Administration and other | (29) | (30) | (25) | ||||||||||||||
| Americas * | 229 | 325 | 532 | ||||||||||||||
| Cerro Vanguardia | 122 | 111 | 157 | ||||||||||||||
| AngloGold Ashanti Mineração | 111 | 191 | 273 | ||||||||||||||
| Serra Grande | (2) | 26 | 104 | ||||||||||||||
| Administration and other | (2) | (3) | (2) | ||||||||||||||
| Corporate and other | (9) | 6 | (2) | ||||||||||||||
| 1,389 | 1,483 | 2,055 | |||||||||||||||
| Equity-accounted joint ventures included above | (256) | (311) | (308) | ||||||||||||||
| Continuing operations | 1,133 | 1,172 | 1,747 | ||||||||||||||
| Discontinued operations - South Africa | — | — | 83 | ||||||||||||||
| 1,133 | 1,172 | 1,830 | |||||||||||||||
F - 33
| Figures in millions | Amortisation | ||||||||||||||||
| US Dollars | 2022 | 2021 | 2020 | ||||||||||||||
Restated (8) | |||||||||||||||||
Africa * (1) | 367 | 268 | 354 | ||||||||||||||
| Kibali - Attributable 45% | 95 | 105 | 104 | ||||||||||||||
| Iduapriem | 80 | 19 | 74 | ||||||||||||||
| Obuasi | 40 | 22 | 11 | ||||||||||||||
| Siguiri | 50 | 47 | 41 | ||||||||||||||
| Geita | 102 | 75 | 124 | ||||||||||||||
Australia * (6) | 172 | 150 | 160 | ||||||||||||||
| Sunrise Dam | 54 | 60 | 64 | ||||||||||||||
| Tropicana - Attributable 70% | 117 | 88 | 94 | ||||||||||||||
| Administration and other | 1 | 2 | 2 | ||||||||||||||
| Americas * | 185 | 161 | 163 | ||||||||||||||
| Cerro Vanguardia | 39 | 27 | 26 | ||||||||||||||
| AngloGold Ashanti Mineração | 106 | 108 | 109 | ||||||||||||||
| Serra Grande | 40 | 25 | 27 | ||||||||||||||
| Administration and other | — | 1 | 1 | ||||||||||||||
| Corporate and other | 4 | 3 | 2 | ||||||||||||||
| 728 | 582 | 679 | |||||||||||||||
| Equity-accounted joint ventures included above | (95) | (105) | (104) | ||||||||||||||
| Continuing operations | 633 | 477 | 575 | ||||||||||||||
| Figures in millions | Total assets (3)(4) | ||||||||||||||||
| US Dollars | 2022 | 2021 | 2020 | ||||||||||||||
Restated (7)(9) | Restated (7)(9) | ||||||||||||||||
Africa * (1) | 4,083 | 4,226 | 3,989 | ||||||||||||||
| Kibali - Attributable 45% | 1,063 | 1,604 | 1,604 | ||||||||||||||
| Iduapriem | 436 | 386 | 328 | ||||||||||||||
| Obuasi | 1,268 | 1,036 | 923 | ||||||||||||||
| Siguiri | 447 | 463 | 458 | ||||||||||||||
| Geita | 864 | 732 | 670 | ||||||||||||||
| Administration and other | 5 | 5 | 6 | ||||||||||||||
Australia * (6) | 960 | 1,034 | 1,044 | ||||||||||||||
| Americas * | 1,406 | 1,573 | 1,370 | ||||||||||||||
| Cerro Vanguardia | 514 | 491 | 456 | ||||||||||||||
| AngloGold Ashanti Mineração | 625 | 781 | 650 | ||||||||||||||
| Serra Grande | 228 | 252 | 189 | ||||||||||||||
| Administration and other | 39 | 49 | 75 | ||||||||||||||
Projects * (7) | 872 | 313 | 256 | ||||||||||||||
| Colombian projects | 244 | 211 | 176 | ||||||||||||||
| North American projects | 628 | 102 | 80 | ||||||||||||||
| Corporate and other | 751 | 854 | 1,046 | ||||||||||||||
| 8,072 | 8,000 | 7,705 | |||||||||||||||
F - 34
| Figures in millions | Non-current assets (5) | ||||||||||||||||
| US Dollars | 2022 | 2021 | 2020 | ||||||||||||||
Restated (7)(9) | Restated (7)(9) | ||||||||||||||||
| Non-current assets considered material, by country are: | |||||||||||||||||
| South Africa | 40 | 61 | 59 | ||||||||||||||
| Foreign entities | 5,767 | 5,640 | 5,086 | ||||||||||||||
| DRC | 1,063 | 1,604 | 1,604 | ||||||||||||||
| Ghana | 1,349 | 1,191 | 948 | ||||||||||||||
| Tanzania | 594 | 510 | 425 | ||||||||||||||
| Australia | 758 | 806 | 849 | ||||||||||||||
| Brazil | 659 | 797 | 627 | ||||||||||||||
| North America | 617 | — | — | ||||||||||||||
| Figures in millions | Capital expenditure | ||||||||||||||||
| US Dollars | 2022 | 2021 | 2020 | ||||||||||||||
Restated (7) | Restated (7)(8) | ||||||||||||||||
Africa * (1) | 576 | 506 | 435 | ||||||||||||||
| Kibali - Attributable 45% | 90 | 72 | 52 | ||||||||||||||
| Iduapriem | 146 | 105 | 60 | ||||||||||||||
| Obuasi | 159 | 168 | 206 | ||||||||||||||
| Siguiri | 27 | 38 | 30 | ||||||||||||||
| Geita | 154 | 123 | 87 | ||||||||||||||
Australia * (6) | 202 | 185 | 143 | ||||||||||||||
| Sunrise Dam | 50 | 62 | 53 | ||||||||||||||
| Tropicana - Attributable 70% | 152 | 122 | 90 | ||||||||||||||
| Administration and other | — | 1 | — | ||||||||||||||
| Americas * | 322 | 346 | 168 | ||||||||||||||
| Cerro Vanguardia | 66 | 69 | 31 | ||||||||||||||
| AngloGold Ashanti Mineração | 199 | 195 | 104 | ||||||||||||||
| Serra Grande | 57 | 82 | 33 | ||||||||||||||
Projects * (7) | 17 | 52 | 49 | ||||||||||||||
| Colombian projects | 16 | 52 | 49 | ||||||||||||||
| North American projects | 1 | — | — | ||||||||||||||
| Corporate and other | 1 | 11 | — | ||||||||||||||
| Continuing operations | 1,118 | 1,100 | 795 | ||||||||||||||
| Discontinued operations - South Africa | — | — | 35 | ||||||||||||||
| 1,118 | 1,100 | 830 | |||||||||||||||
| Equity-accounted joint ventures included above | (90) | (72) | (56) | ||||||||||||||
| 1,028 | 1,028 | 774 | |||||||||||||||
•The operating segments continue to be presented per geographical region. The additional information disaggregated and disclosed for each mining operation has been provided by the Group to facilitate comparability of mine performance.
(1)Includes equity-accounted joint ventures.investments.
(2)The group'sGroup's segmental profit measure is gross profit (loss), which excludes the results of associates and joint ventures. For the reconciliation of gross profit (loss) to profit before taxation and discontinued operations, refer to the groupGroup income statement.
(3)Total assets include allocated goodwill of $118m (2019: $108m; 2018: $108m)$105m (2021: $111m; 2020: $118m) for Australia and $8m (2019:nil (2021: $8m; 2018:2020: $8m) for Americas (note 17)15). In 2019, the South African segment included assets held for sale of $581m and the Africa Region segment included assets held for sale of $20m.
(4)In 2020,2022, the Group's pre-tax impairment reversalsimpairments and derecognition of assets of $17m$308m were accounted for in South Africa (2019: $556m; 2018: $98m)Corporate and other of nil (2021: $1m; 2020: nil), Africa Region of NaN (2019: $2m; 2018: $5m)$4m (2021: $4m; 2020: nil) and the Americas of NaN (2019:$304m (2021: $1m; 2018: $1m)2020: nil). In 2020, there was an impairment reversal of $17m in South Africa.
(5)Non-current assets exclude financial instruments, and deferred tax assets.assets and reimbursive right for post-retirement benefits.
(6)The Australia total assets include property, plant and equipment, cash, leased assets, inventory and others assets which the Group is unable to allocate and disaggregate on a reasonable basis between the different mining operations, as some of these assets represent shared assets between the mining operations within the Australia geographical region. The amortisation disaggregated segment disclosures only relate to property, plant and equipment which do not represent shared assets and for which the Group can disaggregate and allocate on a reasonable basis to the different mining operations within the geographical region.
F - 35
(7) A new segment for Projects (previously reported under the Americas segment) has been introduced due to the implementation of the new operating model which comprises all the major non-sustaining capital projects with the potential to be developed into operating entities. Comparative information has been restated.
(8) The adoption of the amendment to IAS 16 “Property, Plant and Equipment - Proceeds before Intended Use” on 1 January 2022 resulted in a retrospective increase in gold income of $168m, cost of sales of $130m, amortisation of $5m, gross profit of $38m and capital expenditure of $38m for 31 December 2020 . Refer to note 1.
(9) The total asset balances for 31 December 2021 and 31 December 2020 have been retrospectively restated and increased with $33m due to the initial application of the amendment to IAS 16 “Property, Plant and Equipment - Proceeds before Intended Use” on 1 January 2022..Refer to note 1.
3 REVENUE FROM PRODUCT SALES
| US Dollars | |||||||||||||||||
| Figures in millions | 2022 | 2021 | 2020 | ||||||||||||||
| Restated | |||||||||||||||||
| Revenue consists of the following principal categories: | |||||||||||||||||
| Gold income (note 2) | 4,388 | 3,903 | 4,490 | ||||||||||||||
| By-products (note 2) | 113 | 126 | 105 | ||||||||||||||
| 4,501 | 4,029 | 4,595 | |||||||||||||||
4 COST OF SALES
| US Dollars | |||||||||||||||||
| Figures in millions | 2022 | 2021 | 2020 | ||||||||||||||
| Restated | |||||||||||||||||
| Cash operating costs | 2,554 | 2,160 | 2,012 | ||||||||||||||
| Royalties | 185 | 162 | 181 | ||||||||||||||
| Other cash costs | 14 | 12 | 13 | ||||||||||||||
| Total cash costs | 2,753 | 2,334 | 2,206 | ||||||||||||||
| Retrenchment costs | 6 | 2 | 2 | ||||||||||||||
| Rehabilitation and other non-cash costs | — | 38 | 32 | ||||||||||||||
| Amortisation of tangible assets (notes 30 and 34) | 551 | 411 | 526 | ||||||||||||||
| Amortisation of right of use assets (notes 14, 30 and 34) | 81 | 63 | 47 | ||||||||||||||
| Amortisation of intangible assets (notes 15, 30 and 34) | 1 | 3 | 2 | ||||||||||||||
| Inventory change | (30) | 6 | 14 | ||||||||||||||
| 3,362 | 2,857 | 2,829 | |||||||||||||||
5 OTHER EXPENSE (INCOME)
| US Dollars | |||||||||||||||||
| Figures in millions | 2022 | 2021 | 2020 | ||||||||||||||
| Care and maintenance | — | 45 | — | ||||||||||||||
| Governmental fiscal claims | 11 | 7 | 6 | ||||||||||||||
| Legacy TSF obligations | (16) | 9 | 14 | ||||||||||||||
| Pension and medical defined benefit | 7 | 7 | 8 | ||||||||||||||
| Royalty receivable impaired | — | — | 4 | ||||||||||||||
| Royalties received | (2) | (2) | (2) | ||||||||||||||
| Retrenchment and related costs | — | 18 | — | ||||||||||||||
| Legal fees and project costs | 15 | 10 | 9 | ||||||||||||||
| Refund from insurance claim | — | — | (5) | ||||||||||||||
| Other indirect taxes | 11 | 18 | 23 | ||||||||||||||
| Premium on settlement of bonds | — | 24 | — | ||||||||||||||
| 26 | 136 | 57 | |||||||||||||||
F - 3236
| US Dollars | |||||||||||||||||
| Figures in millions | 2020 | 2019 | 2018 | ||||||||||||||
| Revenue consists of the following principal categories: | |||||||||||||||||
| Gold income (note 2) | 4,322 | 3,439 | 3,203 | ||||||||||||||
| By-products (note 2) | 105 | 86 | 133 | ||||||||||||||
| Revenue from product sales | 4,427 | 3,525 | 3,336 | ||||||||||||||
| US Dollars | |||||||||||||||||
| Figures in millions | 2020 | 2019 | 2018 | ||||||||||||||
| Cash operating costs | 1,881 | 1,831 | 1,850 | ||||||||||||||
| Royalties | 181 | 137 | 133 | ||||||||||||||
| Other cash costs | 12 | 13 | 13 | ||||||||||||||
| Total cash costs | 2,074 | 1,981 | 1,996 | ||||||||||||||
| Retrenchment costs | 2 | 4 | 4 | ||||||||||||||
| Rehabilitation and other non-cash costs | 32 | 53 | 17 | ||||||||||||||
| Amortisation of tangible assets (notes 32 and 36) | 521 | 538 | 553 | ||||||||||||||
| Amortisation of right of use assets (notes 16, 32 and 36) | 47 | 42 | 0 | ||||||||||||||
| Amortisation of intangible assets (notes 32 and 36) | 2 | 3 | 5 | ||||||||||||||
| Inventory change | 21 | 5 | 9 | ||||||||||||||
| 2,699 | 2,626 | 2,584 | |||||||||||||||
| US Dollars | |||||||||||||||||
| Figures in millions | 2020 | 2019 | 2018 | ||||||||||||||
| Corporate administration expenses | 59 | 63 | 60 | ||||||||||||||
| Share scheme and related costs | 9 | 19 | 16 | ||||||||||||||
| 68 | 82 | 76 | |||||||||||||||
6 OTHER EXPENSE (INCOME)
| US Dollars | |||||||||||||||||
| Figures in millions | 2020 | 2019 | 2018 | ||||||||||||||
| Care and maintenance note 36 | 0 | 47 | 39 | ||||||||||||||
| Governmental fiscal claims, cost of old tailings operations and other expenses | 20 | 21 | 14 | ||||||||||||||
| Guinea public infrastructure contribution | 0 | 8 | 0 | ||||||||||||||
| Pension and medical defined benefit provisions | 8 | 9 | 10 | ||||||||||||||
| Royalty receivable impaired | 4 | 0 | 0 | ||||||||||||||
| Royalties received | (2) | (3) | (10) | ||||||||||||||
| Brazilian power utility legal settlement | 0 | (16) | 0 | ||||||||||||||
| Retrenchment and related costs | 0 | 3 | 6 | ||||||||||||||
| Legal fees and project costs | 9 | 11 | 16 | ||||||||||||||
| Refund from insurance claim | (5) | 0 | 0 | ||||||||||||||
| Other indirect taxes | 23 | 3 | 4 | ||||||||||||||
| 57 | 83 | 79 | |||||||||||||||
| US Dollars | |||||||||||||||||
| Figures in millions | 2020 | 2019 | 2018 | ||||||||||||||
| Finance costs | |||||||||||||||||
| Finance costs on bonds, corporate notes, bank loans and other | 124 | 135 | 128 | ||||||||||||||
| Amortisation of fees | 23 | 4 | 7 | ||||||||||||||
| Lease finance charges | 8 | 10 | 5 | ||||||||||||||
| Less: interest captalised | (17) | (6) | 0 | ||||||||||||||
| 138 | 143 | 140 | |||||||||||||||
| Unwinding of obligations | 39 | 29 | 28 | ||||||||||||||
| Total finance costs and unwinding of obligations (notes 32 and 36) | 177 | 172 | 168 | ||||||||||||||
| US Dollars | |||||||||||||||||
| Figures in millions | 2022 | 2021 | 2020 | ||||||||||||||
| Finance costs | |||||||||||||||||
| Finance costs on bonds, bank loans and other | 102 | 109 | 124 | ||||||||||||||
| Amortisation of fees | 8 | 6 | 23 | ||||||||||||||
| Lease finance charges | 11 | 9 | 8 | ||||||||||||||
| Less: interest captalised | (2) | (14) | (17) | ||||||||||||||
| 119 | 110 | 138 | |||||||||||||||
| Unwinding of obligations | 30 | 6 | 39 | ||||||||||||||
| Total finance costs and unwinding of obligations (notes 30 and 34) | 149 | 116 | 177 | ||||||||||||||
The interest included within finance costs is calculated at effective interest rates.
| US Dollars | |||||||||||||||||
| Figures in millions | 2020 | 2019 | 2018 | ||||||||||||||
| Revenue | 677 | 616 | 582 | ||||||||||||||
| Operating costs and other expenses | (353) | (452) | (472) | ||||||||||||||
Profit on sale of joint ventures (1) | 19 | 0 | 0 | ||||||||||||||
| Net interest received (paid) | 5 | 10 | (8) | ||||||||||||||
| Profit (loss) before taxation | 348 | 174 | 102 | ||||||||||||||
| Taxation | (70) | (35) | (9) | ||||||||||||||
| Profit (loss) after taxation | 278 | 139 | 93 | ||||||||||||||
| Impairment reversal of investments in associates | 0 | 23 | 15 | ||||||||||||||
| Impairment reversal of investments in joint ventures (note 19) | 0 | 6 | 14 | ||||||||||||||
| Share of associates and joint ventures’ profit (loss) (note 32) | 278 | 168 | 122 | ||||||||||||||
| US Dollars | |||||||||||||||||
| Figures in millions | 2020 | 2019 | 2018 | ||||||||||||||
| Revenue from product sales | 409 | 555 | 608 | ||||||||||||||
| Cost of sales | (287) | (479) | (589) | ||||||||||||||
| (Loss) gain on non-hedge derivatives and other commodity contracts | (39) | 3 | 3 | ||||||||||||||
| Gross profit | 83 | 79 | 22 | ||||||||||||||
| Other expenses | (23) | (44) | (72) | ||||||||||||||
| Derecognition of assets, and (loss) profit on disposal of assets | (80) | (3) | (118) | ||||||||||||||
| Impairment reversal (loss) recognised on remeasurement to fair value less costs to sell | 17 | (549) | 0 | ||||||||||||||
| Loss before taxation | (3) | (517) | (168) | ||||||||||||||
| Normal and deferred taxation on operations | 0 | (23) | 38 | ||||||||||||||
| Deferred tax on impairment reversal (loss), derecognition and profit (loss) on disposal of assets | (1) | 164 | 47 | ||||||||||||||
| Deferred taxation on unrealised movement on derivatives and other commodity contracts | 11 | 0 | 0 | ||||||||||||||
| Total profit (loss) from discontinued operations | 7 | (376) | (83) | ||||||||||||||
| US Dollars | ||||||||
| Figures in millions | 30 September 2020 | 31 December 2019 | ||||||
| Tangible assets and right of use assets | 359 | 429 | ||||||
| Other investments | 76 | 84 | ||||||
| Inventories | 75 | 37 | ||||||
| Trade, other receivables and other assets | 5 | 4 | ||||||
| Deferred taxation | 40 | 15 | ||||||
| Cash and cash restricted for use | 0 | 12 | ||||||
| Assets held for sale | 555 | 581 | ||||||
| Lease liabilities | 2 | 3 | ||||||
| Environmental rehabilitation and other provisions | 198 | 211 | ||||||
| Trade and other payables | 55 | 58 | ||||||
| Liabilities held for sale | 255 | 272 | ||||||
| Net assets held for sale | 300 | 309 | ||||||
| US Dollars | |||||||||||||||||
| Figures in millions | 2022 | 2021 | 2020 | ||||||||||||||
| Revenue | 629 | 697 | 677 | ||||||||||||||
| Operating costs and other expenses | (393) | (370) | (353) | ||||||||||||||
| Profit on sale of joint ventures | — | — | 19 | ||||||||||||||
| Net interest received | 4 | 7 | 5 | ||||||||||||||
| Profit (loss) before taxation | 240 | 334 | 348 | ||||||||||||||
| Taxation | (73) | (85) | (70) | ||||||||||||||
| Profit (loss) after taxation | 167 | 249 | 278 | ||||||||||||||
| Impairment investment in joint ventures (note 17) | (1) | — | — | ||||||||||||||
| Share of associates and joint ventures’ profit (loss) (note 30) | 166 | 249 | 278 | ||||||||||||||
| US Dollars | |||||||||||||||||
| Figures in millions | 2020 | 2019 | 2018 | ||||||||||||||
| Restated | |||||||||||||||||
Employee benefits including Executive Directors’ and Prescribed Officers’ salaries and other benefits (1) | 644 | 697 | 797 | ||||||||||||||
| - current medical expenses | 23 | 29 | 39 | ||||||||||||||
| - defined benefit post-retirement medical expenses | 7 | 8 | 9 | ||||||||||||||
| - defined contribution | 25 | 29 | 37 | ||||||||||||||
| Retrenchment costs | 2 | 7 | 30 | ||||||||||||||
| Share-based payment expense (note 11) | 16 | 42 | 35 | ||||||||||||||
| Included in cost of sales, other expenses (income) and corporate administration, marketing and other expenses of continuing and discontinued operations | 717 | 812 | 947 | ||||||||||||||
| US Dollars | |||||||||||||||||
| Figures in millions | 2022 | 2021 | 2020 | ||||||||||||||
| Employee benefits including Executive Directors’ and Prescribed Officers’ salaries and other benefits | 650 | 593 | 644 | ||||||||||||||
| - current medical expenses | 17 | 25 | 23 | ||||||||||||||
| - defined benefit post-retirement medical expenses | 5 | 6 | 7 | ||||||||||||||
| - defined contribution | 20 | 20 | 25 | ||||||||||||||
| Retrenchment costs | 6 | 16 | 2 | ||||||||||||||
| Share-based payment expense (note 9) | 18 | 22 | 16 | ||||||||||||||
| Included in cost of sales, other expenses and corporate administration, marketing and related expenses of continuing and discontinued operations | 716 | 682 | 717 | ||||||||||||||
| US dollar millions | As previously reported | Adjustment | As restated | ||||||||
| Employee benefits including Executive Directors' and Prescribed Officers' salaries and other benefits | 680 | 17 | 697 | ||||||||
| Included in cost of sales, other expenses (income) and corporate administration, marketing and other expenses of continuing and discontinued operations | 795 | 17 | 812 | ||||||||
F - 37
| US Dollars | |||||||||||||||||
| Figures in millions | 2020 | 2019 | 2018 | ||||||||||||||
| Equity-settled share incentive schemes | |||||||||||||||||
| Bonus Share Plan (BSP) | 1 | 6 | 20 | ||||||||||||||
| Deferred Share Plan (DSP) | 14 | 13 | 0 | ||||||||||||||
| Other | 1 | 2 | 2 | ||||||||||||||
| 16 | 21 | 22 | |||||||||||||||
| Cash-settled share incentive scheme | |||||||||||||||||
| Cash-settled Long Term Incentive Plan (CSLTIP) | 0 | 21 | 13 | ||||||||||||||
| Total share-based payment expense (note 10) | 16 | 42 | 35 | ||||||||||||||
| US Dollars | |||||||||||||||||
| Figures in millions | 2022 | 2021 | 2020 | ||||||||||||||
| Equity-settled share incentive schemes | |||||||||||||||||
| Deferred Share Plan (DSP) | 18 | 22 | 14 | ||||||||||||||
| Other | — | — | 2 | ||||||||||||||
| Total share-based payment expense (note 8) | 18 | 22 | 16 | ||||||||||||||
Equity-settled incentive schemes
Bonus Share Plan (BSP)
| Award date (unexercised awards) | 2018 | ||||||||||||||||
| Calculated fair value | R | 119.14 | |||||||||||||||
| Vesting date 50% | 22 Feb 2019 | ||||||||||||||||
| Vesting date 50% | 22 Feb 2020 | ||||||||||||||||
| Expiry date | 22 Feb 2028 | ||||||||||||||||
| Award date (unvested awards and awards vested during the year) | 2020 | 2019 | 2018 | ||||||||||||||
| Calculated fair value | R | 119.14 | |||||||||||||||
| Vesting date 50% | 22 Feb 2019 | ||||||||||||||||
| Vesting date 50% | 22 Feb 2020 | ||||||||||||||||
| Expiry date | 22 Feb 2028 | ||||||||||||||||
| Number of shares | |||||||||||||||||
| 2022 | 2021 | 2020 | |||||||||||||||
| Awards outstanding at beginning of year | 849,683 | 1,005,977 | 2,141,415 | ||||||||||||||
| Awards lapsed during the year | (3,581) | — | — | ||||||||||||||
| Awards exercised during the year | (219,580) | (156,294) | (1,135,438) | ||||||||||||||
| Awards outstanding and exercisable at end of year | 626,522 | 849,683 | 1,005,977 | ||||||||||||||
| Number of shares | |||||||||||||||||
| 2020 | 2019 | 2018 | |||||||||||||||
| Awards outstanding at beginning of year | 2,141,415 | 4,557,919 | 4,479,679 | ||||||||||||||
| Awards granted during the year | 0 | 0 | 2,492,584 | ||||||||||||||
| Awards lapsed during the year | 0 | (109,065) | (359,343) | ||||||||||||||
| Awards exercised during the year | (1,135,438) | (2,307,439) | (2,055,001) | ||||||||||||||
| Awards outstanding at end of year | 1,005,977 | 2,141,415 | 4,557,919 | ||||||||||||||
| Awards exercisable at end of year | 1,005,977 | 1,207,936 | 1,588,512 | ||||||||||||||
Deferred Share Plan (DSP)
The Deferred Share Plan (DSP)DSP was implemented with effect from 1 January 2018, with the first awards for the scheme allocated in March 2019. This represents a single scheme under which share awards will be allocated to certain employees from 2019 onwards, vesting equally over a period of 2, 3 and 5 years depending on the level of seniority of the participant.
| Award date (unvested awards and awards vested during the year) | 2022 | 2021 | 2020 | ||||||||||||||
| Calculated fair value | R | 335.04 | R | 308.97 | R | 325.97 | |||||||||||
| DSP 2 year | |||||||||||||||||
| Vesting date 50% | 24 Feb 2023 | 24 Feb 2022 | 25 Feb 2021 | ||||||||||||||
| Vesting date 50% | 24 Feb 2024 | 24 Feb 2023 | 25 Feb 2022 | ||||||||||||||
| DSP 3 year | |||||||||||||||||
| Vesting date 33% | 24 Feb 2023 | 24 Feb 2022 | 25 Feb 2021 | ||||||||||||||
| Vesting date 33% | 24 Feb 2024 | 24 Feb 2023 | 25 Feb 2022 | ||||||||||||||
| Vesting date 34% | 24 Feb 2025 | 24 Feb 2024 | 25 Feb 2023 | ||||||||||||||
| DSP 5 year | |||||||||||||||||
| Vesting date 20% | 24 Feb 2023 | 24 Feb 2022 | 25 Feb 2021 | ||||||||||||||
| Vesting date 20% | 24 Feb 2024 | 24 Feb 2023 | 25 Feb 2022 | ||||||||||||||
| Vesting date 20% | 24 Feb 2025 | 24 Feb 2024 | 25 Feb 2023 | ||||||||||||||
| Vesting date 20% | 24 Feb 2026 | 24 Feb 2025 | 25 Feb 2024 | ||||||||||||||
| Vesting date 20% | 24 Feb 2027 | 24 Feb 2026 | 25 Feb 2025 | ||||||||||||||
| Expiry date | 24 Feb 2032 | 24 Feb 2031 | 25 Feb 2030 | ||||||||||||||
F - 38
Equity-settled incentive schemes continued
| Number of shares | |||||||||||||||||
| 2022 | 2021 | 2020 | |||||||||||||||
| Awards outstanding at beginning of year | 2,692,383 | 2,289,762 | 1,599,360 | ||||||||||||||
| Awards granted during the year | 793,955 | 1,185,348 | 1,176,532 | ||||||||||||||
| Awards lapsed during the year | (163,697) | (322,814) | (155,575) | ||||||||||||||
| Awards exercised during the year | (839,033) | (459,913) | (330,555) | ||||||||||||||
| Awards outstanding at end of year | 2,483,608 | 2,692,383 | 2,289,762 | ||||||||||||||
| Awards exercisable at end of year | 693,211 | 588,694 | 183,439 | ||||||||||||||
| Award date (unvested awards and awards vested during the year) | 2020 | 2019 | 2018 | ||||||||||||||
| Calculated fair value | R | 325.97 | R | 204.42 | |||||||||||||
| DSP 2 year | |||||||||||||||||
| Vesting date 50% | 25 Feb 2021 | 21 Feb 2020 | |||||||||||||||
| Vesting date 50% | 25 Feb 2022 | 21 Feb 2021 | |||||||||||||||
| DSP 3 year | |||||||||||||||||
| Vesting date 33% | 25 Feb 2021 | 21 Feb 2020 | |||||||||||||||
| Vesting date 33% | 25 Feb 2022 | 21 Feb 2021 | |||||||||||||||
| Vesting date 34% | 25 Feb 2023 | 21 Feb 2022 | |||||||||||||||
| DSP 5 year | |||||||||||||||||
| Vesting date 20% | 25 Feb 2021 | 21 Feb 2020 | |||||||||||||||
| Vesting date 20% | 25 Feb 2022 | 21 Feb 2021 | |||||||||||||||
| Vesting date 20% | 25 Feb 2023 | 21 Feb 2022 | |||||||||||||||
| Vesting date 20% | 25 Feb 2024 | 21 Feb 2023 | |||||||||||||||
| Vesting date 20% | 25 Feb 2025 | 21 Feb 2024 | |||||||||||||||
| Expiry date | 25 Feb 2030 | 21 Feb 2029 | |||||||||||||||
| Number of shares | |||||||||||||||||
| 2020 | 2019 | 2018 | |||||||||||||||
| Awards outstanding at beginning of year | 1,599,360 | ||||||||||||||||
| Awards granted during the year | 1,176,532 | 1,669,191 | |||||||||||||||
| Awards lapsed during the year | (155,575) | (55,208) | |||||||||||||||
| Awards exercised during the year | (330,555) | (14,623) | |||||||||||||||
| Awards outstanding at end of year | 2,289,762 | 1,599,360 | |||||||||||||||
| Awards exercisable at end of year | 183,439 | 0 | |||||||||||||||
Long Term Incentive Plan (LTIP)
| Award date | 2015 | ||||||||||||||||
| Calculated fair value | R | 129.94 | |||||||||||||||
| Vesting date | 3 Mar 2018 | ||||||||||||||||
| Expiry date | 3 Mar 2025 | ||||||||||||||||
| Number of shares | |||||||||||||||||
| 2020 | 2019 | 2018 | |||||||||||||||
| Awards outstanding at beginning of year | 229,639 | 447,842 | 2,466,357 | ||||||||||||||
| Awards lapsed during the year | 0 | 0 | (1,186,330) | ||||||||||||||
| Awards exercised during the year | (118,077) | (218,203) | (832,185) | ||||||||||||||
| Awards outstanding at end of year | 111,562 | 229,639 | 447,842 | ||||||||||||||
| Awards exercisable at end of year | 111,562 | 229,639 | 447,842 | ||||||||||||||
| Number of shares | |||||||||||||||||
| 2022 | 2021 | 2020 | |||||||||||||||
| Awards outstanding at beginning of year | 109,229 | 111,562 | 229,639 | ||||||||||||||
| Awards exercised during the year | (46,521) | (2,333) | (118,077) | ||||||||||||||
| Awards outstanding and exercisable at end of year | 62,708 | 109,229 | 111,562 | ||||||||||||||
F - 39
| Number of shares | |||||||||||||||||
| 2020 | 2019 | 2018 | |||||||||||||||
| Awards outstanding at beginning of year | 23,927 | 112,578 | 95,378 | ||||||||||||||
| Awards granted during the year | 0 | 0 | 80,809 | ||||||||||||||
| Awards lapsed during the year | 0 | (16,500) | (11,633) | ||||||||||||||
| Awards matched during the year | (23,927) | (72,151) | (51,976) | ||||||||||||||
| Awards outstanding at end of year | 0 | 23,927 | 112,578 | ||||||||||||||
| Award date (unvested awards and awards vested during the year) | ||||||||||||||
| 2017 | 2016 | |||||||||||||
| Vesting date | 1 March 2020 | 1 March 2019 | ||||||||||||
| Number of units | |||||||||||
| 2020 | 2019 | 2018 | |||||||||
| Share units outstanding at beginning of year | 1,480,562 | 3,815,761 | 4,469,618 | ||||||||
| Share units granted during the year | 0 | 0 | 0 | ||||||||
| Share units lapsed during the year | (82,063) | (1,305,761) | (611,265) | ||||||||
| Share units exercised during the year | (1,398,499) | (1,029,438) | (42,592) | ||||||||
| Share units outstanding at end of year | 0 | 1,480,562 | 3,815,761 | ||||||||
| Figures in millions | US Dollars | ||||||||||||||||
| 2020 | 2019 | 2018 | |||||||||||||||
| South African taxation | |||||||||||||||||
| Normal taxation | 1 | 0 | 0 | ||||||||||||||
| Prior year over provision | 0 | 0 | (2) | ||||||||||||||
| Deferred taxation | |||||||||||||||||
Other temporary differences (1) | 74 | (18) | (27) | ||||||||||||||
| Change in estimated deferred tax rate | 0 | (14) | 7 | ||||||||||||||
| 75 | (32) | (22) | |||||||||||||||
| Foreign taxation | |||||||||||||||||
| Normal taxation | 553 | 299 | 243 | ||||||||||||||
| Prior year under (over) provision | 8 | (1) | 1 | ||||||||||||||
| Deferred taxation | |||||||||||||||||
| Temporary differences | 9 | (28) | (6) | ||||||||||||||
| Prior year (over) under provision | (6) | 1 | 4 | ||||||||||||||
| Change in estimate | (14) | 9 | (7) | ||||||||||||||
| Change in statutory tax rate | 0 | 2 | (1) | ||||||||||||||
| 550 | 282 | 234 | |||||||||||||||
| 625 | 250 | 212 | |||||||||||||||
| Figures in millions | US Dollars | ||||||||||||||||
| 2022 | 2021 | 2020 | |||||||||||||||
| South African taxation | |||||||||||||||||
| Normal taxation | 1 | — | 1 | ||||||||||||||
| Prior year under (over) provision | 1 | (1) | — | ||||||||||||||
| Deferred taxation | |||||||||||||||||
| Other temporary differences | — | — | 74 | ||||||||||||||
| 2 | (1) | 75 | |||||||||||||||
| Foreign taxation | |||||||||||||||||
| Normal taxation | 198 | 252 | 553 | ||||||||||||||
| Prior year under (over) provision | 31 | (3) | 8 | ||||||||||||||
| Deferred taxation | |||||||||||||||||
| Temporary differences | (7) | 52 | 9 | ||||||||||||||
| Prior year under (over) provision | 4 | 4 | (6) | ||||||||||||||
| Impairment and disposal of tangible assets | (58) | — | — | ||||||||||||||
| Change in estimate | 3 | 6 | (14) | ||||||||||||||
| Change in statutory tax rate | — | 2 | — | ||||||||||||||
| 171 | 313 | 550 | |||||||||||||||
| 173 | 312 | 625 | |||||||||||||||
| Figures in millions | Figures in millions | US Dollars | Figures in millions | US Dollars | ||||||||||||||||||||||||||||||
| Reconciliation to South African statutory rate | Reconciliation to South African statutory rate | 2020 | 2019 | 2018 | Reconciliation to South African statutory rate | 2022 | 2021 | 2020 | ||||||||||||||||||||||||||
| Implied tax charge at 28% | Implied tax charge at 28% | 445 | 173 | 125 | Implied tax charge at 28% | 137 | 268 | 445 | ||||||||||||||||||||||||||
| Increase (decrease) due to: | Increase (decrease) due to: | Increase (decrease) due to: | ||||||||||||||||||||||||||||||||
Expenses not tax deductible(1) | Expenses not tax deductible(1) | 29 | 28 | 28 | Expenses not tax deductible(1) | 84 | 22 | 29 | ||||||||||||||||||||||||||
| Share of associates and joint ventures' profit | Share of associates and joint ventures' profit | (78) | (47) | (34) | Share of associates and joint ventures' profit | (46) | (70) | (78) | ||||||||||||||||||||||||||
Tax rate differentials(2) and withholding taxes | Tax rate differentials(2) and withholding taxes | 96 | 39 | 25 | Tax rate differentials(2) and withholding taxes | 25 | 54 | 96 | ||||||||||||||||||||||||||
| Exchange variations, translation and accounting adjustments | 28 | 11 | 24 | |||||||||||||||||||||||||||||||
| Current year tax losses not recognised (recognised) in deferred tax assets: | ||||||||||||||||||||||||||||||||||
| Obuasi mine | (6) | 14 | 13 | |||||||||||||||||||||||||||||||
AngloGold Ashanti Holdings plc(3) | 31 | 29 | 36 | |||||||||||||||||||||||||||||||
| Exchange variations and translation adjustments | Exchange variations and translation adjustments | — | 6 | 28 | ||||||||||||||||||||||||||||||
| Deferred tax assets recognised at Obuasi | Deferred tax assets recognised at Obuasi | (56) | — | (6) | ||||||||||||||||||||||||||||||
| Current year tax losses (expense) not recognised: | Current year tax losses (expense) not recognised: | |||||||||||||||||||||||||||||||||
| Obuasi | Obuasi | (50) | 6 | — | ||||||||||||||||||||||||||||||
| AngloGold Ashanti Holdings plc | AngloGold Ashanti Holdings plc | 24 | 25 | 31 | ||||||||||||||||||||||||||||||
| North America | North America | 4 | 6 | 6 | North America | 22 | 13 | 4 | ||||||||||||||||||||||||||
| Siguiri | (8) | 0 | 0 | |||||||||||||||||||||||||||||||
| Other | 3 | (2) | (1) | |||||||||||||||||||||||||||||||
Siguiri (4) | Siguiri (4) | (27) | (37) | (8) | ||||||||||||||||||||||||||||||
| SA Corporate | SA Corporate | 20 | 18 | — | ||||||||||||||||||||||||||||||
| Change in planned utilisation of deferred tax assets and impact of estimated deferred tax rate change | Change in planned utilisation of deferred tax assets and impact of estimated deferred tax rate change | (14) | (5) | 0 | Change in planned utilisation of deferred tax assets and impact of estimated deferred tax rate change | 3 | 6 | (14) | ||||||||||||||||||||||||||
| Tax effect of retained SA items | Tax effect of retained SA items | 16 | 3 | (10) | Tax effect of retained SA items | — | — | 16 | ||||||||||||||||||||||||||
| Tax allowances | Tax allowances | (1) | (1) | (2) | Tax allowances | — | — | (1) | ||||||||||||||||||||||||||
| Derecognition of deferred tax assets | Derecognition of deferred tax assets | 78 | 0 | 0 | Derecognition of deferred tax assets | — | — | 78 | ||||||||||||||||||||||||||
| Impact of statutory tax rate change | Impact of statutory tax rate change | 0 | 2 | (1) | Impact of statutory tax rate change | — | 2 | — | ||||||||||||||||||||||||||
| Adjustment in respect of prior years | 2 | 0 | 3 | |||||||||||||||||||||||||||||||
Adjustment in respect of prior years(5) | Adjustment in respect of prior years(5) | 36 | — | 2 | ||||||||||||||||||||||||||||||
| Other | Other | 1 | (1) | 3 | ||||||||||||||||||||||||||||||
| Income tax expense | Income tax expense | 625 | 250 | 212 | Income tax expense | 173 | 312 | 625 | ||||||||||||||||||||||||||
(1) Includes non-deductible corporate, legal, project, exploration and non-tax deductible rehabilitation costs, impairments in Brazil and British Virgin Isle group losses.
(2) Due to different tax rates in various jurisdictions, primarily Tanzania, Ghana, Guinea, Australia, Brazil and Guinea.Argentina.
(4) Siguiri current tax expense not recognised due to tax holiday.
(5) Includes $34m provided in Colombia in 2022.
.
F - 4140
NOTES TO THE CONSOLIDATED FINANCIAL STATEMENTS (continued)
| Figures in millions | Figures in millions | US Dollars | Figures in millions | US Dollars | ||||||||||||||||||||||||||||||
| 2020 | 2019 | 2018 | 2022 | 2021 | 2020 | |||||||||||||||||||||||||||||
| Analysis of unrecognised deferred tax assets | Analysis of unrecognised deferred tax assets | Analysis of unrecognised deferred tax assets | ||||||||||||||||||||||||||||||||
| Tax losses available to be utilised against future profits | ||||||||||||||||||||||||||||||||||
| Available to be utilised against future profits | Available to be utilised against future profits | |||||||||||||||||||||||||||||||||
| - utilisation required within one year | - utilisation required within one year | 62 | 0 | 48 | - utilisation required within one year | 107 | 54 | 62 | ||||||||||||||||||||||||||
| - utilisation required between one and two years | - utilisation required between one and two years | 54 | 85 | 187 | - utilisation required between one and two years | 100 | 177 | 54 | ||||||||||||||||||||||||||
| - utilisation required between two and five years | - utilisation required between two and five years | 352 | 356 | 300 | - utilisation required between two and five years | 1,350 | 1,339 | 352 | ||||||||||||||||||||||||||
| - utilisation required between five and twenty years | - utilisation required between five and twenty years | 1,002 | 973 | 1,229 | - utilisation required between five and twenty years | 956 | 989 | 1,002 | ||||||||||||||||||||||||||
| - utilisation in excess of twenty years | - utilisation in excess of twenty years | 421 | 73 | 26 | - utilisation in excess of twenty years | 588 | 449 | 421 | ||||||||||||||||||||||||||
| 1,891 | 1,487 | 1,790 | 3,101 | 3,008 | 1,891 | |||||||||||||||||||||||||||||
At the statutory tax rates the unrecognised value of deferred tax assets are: $487m (2019: $389m; 2018: $501m)is: $857m (2021: $834m; 2020: $487m), mainly relating to tax losses incurred in the United Kingdom, North America, Ghana, Colombia and SA Corporate.South Africa. Unutilised capital allowances in Ghana of $132m (2021:$1bn) were converted into tax losses. The losses are forfeited if not utilised within five years.
On 23 February 2022, the South African finance minister announced a change in corporate tax rate from 28% to 27% for companies with years of assessment ending on or after 31 March 2023. Unrecognised deferred tax assets in South Africa was calculated at 27%. The tax rate change resulted in a $4m decrease within the South African unrecognised deferred tax assets.
Income tax uncertainties
AngloGold Ashanti operates in numerous countries around the world and accordingly is subject to, and pays annual income taxes under, the various income tax regimes in the countries in which it operates. Some of these tax regimes are defined by contractual agreements with local government, and others are defined by the general corporate income tax laws of the country. The groupGroup has historically filed, and continues to file, all required income tax returns and to pay the taxes reasonably determined to be due. In some jurisdictions, tax authorities are yet to complete their assessments for previous years. The tax rules and regulations in many countries are highly complex and subject to interpretation. From time to time, the groupGroup is subject to a review of its historic income tax filings and in connection with such reviews, disputes can arise with the tax authorities over the interpretation or application of certain rules in respect of the group’sGroup’s business conducted within the country involved. Significant judgement is required in determining the worldwide provisions for income taxes due to the complexity of legislation. There are many transactions and calculations for which the ultimate tax determination is uncertain during the ordinary course of business.
Irrespective of whether potential economic outflows of matters have been assessed as probable or possible, individually significant matters are included below, to the extent that disclosure does not prejudice the group.Group.
Argentina - Cerro Vanguardia SA
The Argentina Tax Authority has challenged the deduction of certain hedge losses, with tax and penalties amounting to $8m (2019: $10m; 2018: $14m)$4m (2021: $7m; 2020: $8m). Management has appealed this matter which has been heard by the Tax Court, with final evidence submitted in 2017. The matter is pending and judgement is expected in the next 24 months.months as at 31 December 2022. Management is of the opinion that the hedge losses were claimed correctly and no provision has therefore been made.
Brazil - AGA Mineração and Serra Grande
The Brazil Tax Authority has challenged various aspects of the Companies’companies’ tax returns for periods from 20032005 to 2016 which individually and in aggregate are not considered to be material. Based on the engagement with the Brazil Tax Authority, certain amounts have been allowed and assessments reduced, whilst objections have been lodged against the remainder of the findings. In December 2019, Serra Grande received a tax assessment of $20m (2019: $25m)$23m (2021: $19m; 2020: $20m) relating to the amortisation of goodwill on the acquisition of mining interests, which is permitted as a tax deduction when the acquirer is a domiciled entity. Management is of the opinion that the Brazil Tax Authority is unlikely to succeed in this matter. This is supported by external legal advice and therefore no provision has been made.
Colombia - La Colosa and Gramalote
The tax treatment of exploration expenditure has been investigatedchallenged by the Colombian Tax Authority which resulted in claims for taxes and penalties of $86m$42m(1) (2019: $88m; 2018: $144m)(2021: $74m; 2020: $86m) pertaining to the 2010 to 2014 tax years.
These assessments were appealed in 2016 (in the case of La Colosa) and resulted in an adverse judgement on 22 October 2018,judgements in the Administrative Court of Cundinamarca. An appeal was lodged and all arguments submitted to the Council of State on 21 AugustCundinamarca in 2018, with an expected judgement in the next 12 to 18 months as at 31 December 2020.which were subsequently appealed by AngloGold Ashanti. The deduction of exploration costs is prohibited from 2017 onwards following a change in legislation. Subsequent to this date, exploration costs have been treated in accordance with the amended legislation. In July 2019, the Supreme Administrative Court issued a ruling that duplicate penalties may not be charged. The impact of the ruling is that certain penalties willwere waived.
During November 2022, the Supreme Administrative Court issued final rulings on the tax treatment of exploration expenditure pertaining to the 2010 and 2011 tax years, partially allowing the AngloGold Ashanti tax claims as submitted. The rulings, which included tax and interest, cannot be appealed and resulted in tax liabilities of $34 million being provided for in 2022. The Court fully waived penalties for the 2010 and 2011 tax years which reduceswere originally assessed, to the overall exposure by $76m (2019:value of $70m (2021: $48m; 2020: $76m). The matterPenalties of $8m pertaining to the 2013 and 2014 tax years was not recognised as a provision in 2022 and is pending and may take two to four yearsconsidered to be resolved. Management iscontingent, awaiting judgement from the Courts. A revised tax reform was adopted on 16 December 2022 in Colombia, which may lead to a reduction in interest charged on the 2010 and 2011 tax years. In February 2023, the Company paid $25m, which included a reduction of $6m in interest under the tax reform, in full settlement of the opinion that2011 tax and equity tax claims. The final court ruling in respect of the Colombian Tax Authority2010 tax year is unlikely to succeed in this matter and therefore no provision is made.awaited.
F - 41
(1) Includes After reduction of overall exposure by $70m (2021: $48m; 2020: $76m (2019:$76m)) as described above.
Ghana - Iduapriem
The Ghana Revenue Authority completed a tax audit during the third quarter of 2020 for the 2018 year of assessment claiming a tax liability of $15m.$14m at the time (2021:$14m; 2020: $15m). The claim relatesrelated to corporate income taxes, where certain business expenses have been disallowed as a deduction for tax purposes. Management filed an objection to the assessment in September 2020 and a tax appeal with the High Court during the fourth quarter of 2021. An out of court settlement was reached with the Ghana Revenue Authority during the fourth quarter of 2022, whereby the corporate income tax claims were withdrawn, at no cost to Iduapriem.
Guinea - Siguiri
The Guinea Tax Authority has challenged certain aspects of Société AngloGold Ashanti de Guinée S.A.'s tax return for the 2010 year of assessment totalling $8m (attributable) (2021: $8m (attributable); 2020: $8m (attributable)). Management has objected to the assessment. However, provision has been made for a portion of the total claims amounting to $2m (attributable) (2021: $2m (attributable); 2020: $2m (attributable)). A meeting was held in February 2022 under the Minister of Budget Tax advisor’s chairmanship, calling for the formation of a tripartite committee to review the claim and resolve the issue. Members from government were appointed to the committee, but no meetings were held in 2022.
Mali – Yatela and AGA Mali Services
The Mali Tax Authority has challenged various aspects of Société des Mines de Yatela S.A. and Société AngloGold Ashanti Mali S.A.'s tax returns for periods of 2012 to 2019 totalling $4m (attributable) (2021: $4m (attributable); 2020: $1m (attributable)). Management is of the opinion that the Ghana RevenueMali Tax Authority is unlikely to succeed in this matterthe tax matters and therefore no provision has been made.
Tanzania - Geita Gold Mine
The Tanzania Revenue Authority has raised audit findings on various tax matters for years from 2009 to 20192021 amounting to $254m (2019: $164m; 2018: $163m)$318m (2021: $291m; 2020: $254m) including additionaladjusted tax assessments of $94mrelating to the 2020 and 2021 tax years, which were received in 2020.June 2022 and September 2022 totalling $28 million. In addition, the Tanzania Revenue Authority has issued Agency Notices on various local bank accounts of the Company in Tanzania, enforcing payments from those bank accounts, despite the matters being on appeal. In order to continue operating its bank accounts and to not impact operations, Geita paid various amountsmade payments under protest.protest for which a receivable of $24m (2021: $25m) was raised. Management has objected and appealed through various levels of the legislativeadministrative processes. Management has obtained external legal advice and is of the opinion that the claims of the Tanzania Revenue Authority are unlikely to succeed.
In addition, it should be noted that amendments passed to Tanzanian legislation in 2017 amended the 2010 Mining Act and new Finance Act. Effective from 1 July 2017, the gold mining royalty rate increased to 6% (from 4%) and further a 1% clearing fee on the value of all minerals exported was imposed. The groupGroup has been paying the higher royalty and clearing fees since this date, under protest, and is of the view that this is in contravention of its Mining Development Agreement.
F - 4342
| 2020 | 2019 | 2018 | |||||||||||||||
| US cents per share | |||||||||||||||||
| Basic earnings (loss) per ordinary share | 227 | (3) | 32 | ||||||||||||||
| - Continuing operations | 225 | 87 | 52 | ||||||||||||||
| The calculation of basic earnings (loss) per ordinary share is based on profits (losses) attributable to equity shareholders of $946m (2019: $364m; 2018: $216m) and 419,033,516 (2019: 418,349,777; 2018: 417,122,155) shares being the weighted average number of ordinary shares in issue during the financial year. | |||||||||||||||||
| - Discontinued operations | 2 | (90) | (20) | ||||||||||||||
| The calculation of basic earnings (loss) per ordinary share is based on profits (losses) attributable to equity shareholders of $7m (2019: $(376)m; 2018: $(83)m) and 419,033,516 (2019: 418,349,777; 2018: 417,122,155) shares being the weighted average number of ordinary shares in issue during the financial year. | |||||||||||||||||
| Diluted earnings (loss) per ordinary share | 227 | (3) | 32 | ||||||||||||||
| - Continuing operations | 225 | 87 | 52 | ||||||||||||||
| The calculation of diluted earnings (loss) per ordinary share is based on profits (losses) attributable to equity shareholders of $946m (2019: $364m; 2018: $216m) and 419,481,450 (2019: 418,349,777; 2018: 417,379,405) shares being the diluted number of ordinary shares. | |||||||||||||||||
| - Discontinued operations | 2 | (90) | (20) | ||||||||||||||
| The calculation of diluted earnings (loss) per ordinary share is based on profits (losses) attributable to equity shareholders of $7m (2019: $(376)m; 2018: $(83)m) and 419,481,450 (2019: 418,349,777; 2018: 417,379,405) shares being the weighted average number of ordinary shares in issue during the financial year. | |||||||||||||||||
| 2022 | 2021 | 2020 | |||||||||||||||
| Restated | |||||||||||||||||
| US cents per share | |||||||||||||||||
| Basic earnings (loss) per ordinary share | 71 | 148 | 236 | ||||||||||||||
| - Continuing operations | 71 | 148 | 234 | ||||||||||||||
| The calculation of basic earnings per ordinary share is based on profits attributable to equity shareholders of $297m (2021: $622m; 2020: restated $984m) and 420,197,062 (2021: 419,755,627; 2020: 419,033,516) shares being the weighted average number of ordinary shares in issue during the financial year. | |||||||||||||||||
| - Discontinued operations | — | — | 2 | ||||||||||||||
| The calculation of basic earnings per ordinary share is based on profits attributable to equity shareholders of nil (2021: nil; 2020: $7m) and 420,197,062 (2021: 419,755,627; 2020: 419,033,516) shares being the weighted average number of ordinary shares in issue during the financial year. | |||||||||||||||||
| Diluted earnings (loss) per ordinary share | 71 | 148 | 236 | ||||||||||||||
| - Continuing operations | 71 | 148 | 234 | ||||||||||||||
| The calculation of diluted earnings per ordinary share is based on profits attributable to equity shareholders of $297m (2021: $622m; 2020: restated $984m) and 420,869,866 (2021: 420,056,703; 2020: 419,481,450) shares being the diluted number of ordinary shares. | |||||||||||||||||
| - Discontinued operations | — | — | 2 | ||||||||||||||
| The calculation of diluted earnings per ordinary share is based on profits attributable to equity shareholders of nil (2021: nil; 2020: $7m) and 420,869,866 (2021: 420,056,703; 2020: 419,481,450) shares being the weighted average number of ordinary shares in issue during the financial year. | |||||||||||||||||
In calculating the basic and diluted number of ordinary shares outstanding for the year, the following were taken into consideration:
| Number of shares | |||||||||||||||||
| 2020 | 2019 | 2018 | |||||||||||||||
| Ordinary shares | 416,399,307 | 414,407,622 | 411,412,947 | ||||||||||||||
Fully vested options and currently exercisable(1) | 2,634,209 | 3,942,155 | 5,709,208 | ||||||||||||||
| Weighted average number of shares | 419,033,516 | 418,349,777 | 417,122,155 | ||||||||||||||
Dilutive potential of share options(2) | 447,934 | 0 | 257,250 | ||||||||||||||
| Fully diluted number of ordinary shares | 419,481,450 | 418,349,777 | 417,379,405 | ||||||||||||||
| Number of shares | |||||||||||||||||
| 2022 | 2021 | 2020 | |||||||||||||||
| Ordinary shares | 418,260,476 | 417,272,178 | 416,399,307 | ||||||||||||||
Fully vested options and currently exercisable(1) | 1,936,586 | 2,483,449 | 2,634,209 | ||||||||||||||
| Weighted average number of shares | 420,197,062 | 419,755,627 | 419,033,516 | ||||||||||||||
| Dilutive potential of share options | 672,804 | 301,076 | 447,934 | ||||||||||||||
| Diluted weighted average number of ordinary shares | 420,869,866 | 420,056,703 | 419,481,450 | ||||||||||||||
(1)Employee compensation awards are included in basic earnings per share from the date that all necessary conditions have been satisfied and it is virtually certain that shares will be issued as a result of employees exercising their options.
F - 4443
| US Dollars | US Dollars | |||||||||||||||||||||||||||||||||
| Figures in millions | Figures in millions | 2020 | 2019 | 2018 | Figures in millions | 2022 | 2021 | 2020 | ||||||||||||||||||||||||||
| Headline earnings (loss) | ||||||||||||||||||||||||||||||||||
| Restated | ||||||||||||||||||||||||||||||||||
Headline earnings (loss) (4) | Headline earnings (loss) (4) | |||||||||||||||||||||||||||||||||
| The profit (loss) attributable to equity shareholders was adjusted by the following to arrive at headline earnings (loss): | The profit (loss) attributable to equity shareholders was adjusted by the following to arrive at headline earnings (loss): | The profit (loss) attributable to equity shareholders was adjusted by the following to arrive at headline earnings (loss): | ||||||||||||||||||||||||||||||||
| Profit (loss) attributable to equity shareholders from continuing and discontinued operations | Profit (loss) attributable to equity shareholders from continuing and discontinued operations | 953 | (12) | 133 | Profit (loss) attributable to equity shareholders from continuing and discontinued operations | 297 | 622 | 991 | ||||||||||||||||||||||||||
| Net impairment (impairment reversal) on held for sale assets | (17) | 549 | (2) | |||||||||||||||||||||||||||||||
| Taxation on net impairment (impairment reversal) on held for sale assets | 0 | (165) | 0 | |||||||||||||||||||||||||||||||
| Derecognition of assets | 0 | 10 | 104 | |||||||||||||||||||||||||||||||
| Taxation on derecognition of assets | 0 | 0 | (26) | |||||||||||||||||||||||||||||||
Impairment loss on investment in joint venture (1) | Impairment loss on investment in joint venture (1) | 1 | — | — | ||||||||||||||||||||||||||||||
Net (impairment reversal) impairment on held for sale assets (1) | Net (impairment reversal) impairment on held for sale assets (1) | — | — | (17) | ||||||||||||||||||||||||||||||
Impairment on property, plant and equipment and right of use asset (1) | Impairment on property, plant and equipment and right of use asset (1) | 304 | 2 | — | ||||||||||||||||||||||||||||||
| Taxation on impairment on property, plant and equipment and right of use asset | Taxation on impairment on property, plant and equipment and right of use asset | (58) | — | — | ||||||||||||||||||||||||||||||
Derecognition of assets (1) | Derecognition of assets (1) | 4 | 4 | — | ||||||||||||||||||||||||||||||
| Loss on disposal of discontinued operations | Loss on disposal of discontinued operations | 80 | 0 | 24 | Loss on disposal of discontinued operations | — | — | 80 | ||||||||||||||||||||||||||
| Taxation on loss on disposal of discontinued operations | Taxation on loss on disposal of discontinued operations | 1 | 0 | (20) | Taxation on loss on disposal of discontinued operations | — | — | 1 | ||||||||||||||||||||||||||
Profit on sale of joint ventures (1) | Profit on sale of joint ventures (1) | (19) | 0 | 0 | Profit on sale of joint ventures (1) | — | — | (19) | ||||||||||||||||||||||||||
| Net loss (profit) on disposal of assets | 2 | (3) | 8 | |||||||||||||||||||||||||||||||
| Net (profit) loss on disposal of tangible assets | Net (profit) loss on disposal of tangible assets | (4) | (17) | 2 | ||||||||||||||||||||||||||||||
| Taxation on net (profit) loss on disposal of assets | Taxation on net (profit) loss on disposal of assets | 0 | 0 | (1) | Taxation on net (profit) loss on disposal of assets | — | 1 | — | ||||||||||||||||||||||||||
| 1,000 | 379 | 220 | 544 | 612 | 1,038 | |||||||||||||||||||||||||||||
| US Cents | ||||||||||||||||||||||||||||||||||
| Headline earnings | Headline earnings | |||||||||||||||||||||||||||||||||
Headline earnings per ordinary share (2) | Headline earnings per ordinary share (2) | 129 | 146 | 248 | ||||||||||||||||||||||||||||||
Diluted headline earnings per ordinary share (3) | Diluted headline earnings per ordinary share (3) | 129 | 146 | 247 | ||||||||||||||||||||||||||||||
| US Cents | |||||||||||||||||
| Basic headline earnings (loss) per share | |||||||||||||||||
| The calculation of basic headline earnings (loss) per ordinary share is based on basic headline earnings (losses) of $1,000m (2019: $379m; 2018: $220m) and 419,033,516 (2019: 418,349,777; 2018: 417,122,155) shares being the weighted average number of ordinary shares in issue during the year. | 238 | 91 | 53 | ||||||||||||||
| Diluted headline earnings (loss) per share | |||||||||||||||||
| The calculation of diluted headline earnings (loss) per ordinary share is based on diluted headline earnings (losses) of $1,000m (2019: $379m; 2018: $220m) and 419,481,450 (2019: 418,349,777; 2018: 417,379,405) shares being the weighted average number of ordinary shares in issue during the year. | 238 | 91 | 53 | ||||||||||||||
(4) Headline earnings and headline earnings per share disclosure has been included due to Johannesburg Stock Exchange requirements.
| US Dollars | ||||||||||||||||||||
| Figures in million | 2020 | 2019 | 2018 | |||||||||||||||||
| Ordinary shares | ||||||||||||||||||||
| Dividend number 119 of 70 SA cents per share was declared on 20 February 2018 and paid on 6 April 2018 (6 US cents per share). | 24 | |||||||||||||||||||
| Dividend number 120 of 95 SA cents per share was declared on 19 February 2019 and paid on 8 April 2019 (7 US cents per share). | 27 | |||||||||||||||||||
| Dividend number 121 of 165 SA cents per share was declared on 21 February 2020 and paid on 27 March 2019 (9 US cents per share) | 38 | |||||||||||||||||||
| 38 | 27 | 24 | ||||||||||||||||||
| US Dollars | ||||||||||||||||||||
| Figures in millions | 2022 | 2021 | 2020 | |||||||||||||||||
| Ordinary shares | ||||||||||||||||||||
| Dividend number 121 of 165 SA cents per share was declared on 21 February 2020 and paid on 27 March 2020 (9 US cents per share). | 38 | |||||||||||||||||||
| Dividend number 122 of 705 SA cents per share was declared on 22 February 2021 and paid on 26 March 2021 (48 US cents per share). | 199 | |||||||||||||||||||
| Dividend number 123 of 87 SA cents per share was declared on 6 August 2021 and paid on 10 September 2021 (6 US cents per share) | 25 | |||||||||||||||||||
| Dividend number 124 of 217 SA cents per share was declared on 22 February 2022 and paid on 25 March 2022 (15 US cents per share) | 62 | |||||||||||||||||||
| Dividend number 125 of 493 SA cents per share was declared on 5 August 2022 and paid on 9 September 2022 (28 US cents per share) | 119 | |||||||||||||||||||
| 181 | 224 | 38 | ||||||||||||||||||
F - 4544
| Figures in millions | Figures in millions | Mine development costs | Mine infra- structure(2) | Mineral rights and dumps | Exploration and evaluation assets | Assets under construction | Land and buildings(3)(4) | Total | Figures in millions | Mine development costs | Mine infrastructure | Mineral rights and dumps | Exploration and evaluation assets | Assets under construction | Land and buildings(3) | Total | ||||||||||||||||||||||||||||||||||||||||||||||||||||||||||||||||||
| US Dollars | US Dollars | US Dollars | ||||||||||||||||||||||||||||||||||||||||||||||||||||||||||||||||||||||||||||||||
| Cost | Cost | Cost | ||||||||||||||||||||||||||||||||||||||||||||||||||||||||||||||||||||||||||||||||
| Balance at 1 January 2018 | 5,562 | 4,382 | 892 | 5 | 490 | 83 | 11,414 | |||||||||||||||||||||||||||||||||||||||||||||||||||||||||||||||||||||||||||
Balance at 1 January 2020 Restated (1) | Balance at 1 January 2020 Restated (1) | 5,001 | 3,776 | 881 | 7 | 400 | 66 | 10,131 | ||||||||||||||||||||||||||||||||||||||||||||||||||||||||||||||||||||||||||
| Additions | Additions | Additions | ||||||||||||||||||||||||||||||||||||||||||||||||||||||||||||||||||||||||||||||||
| - project capital | - project capital | 2 | 0 | 0 | 0 | 175 | 0 | 177 | - project capital | 64 | — | — | 1 | 284 | 20 | 369 | ||||||||||||||||||||||||||||||||||||||||||||||||||||||||||||||||||
| - stay-in-business capital | - stay-in-business capital | 294 | 20 | 3 | 0 | 149 | 1 | 467 | - stay-in-business capital | 180 | 8 | 1 | — | 179 | 2 | 370 | ||||||||||||||||||||||||||||||||||||||||||||||||||||||||||||||||||
Finance costs capitalised (4) | Finance costs capitalised (4) | — | — | — | — | 17 | — | 17 | ||||||||||||||||||||||||||||||||||||||||||||||||||||||||||||||||||||||||||
| Disposals | Disposals | (5) | (30) | 0 | (1) | 0 | (3) | (39) | Disposals | (1) | (26) | — | — | — | — | (27) | ||||||||||||||||||||||||||||||||||||||||||||||||||||||||||||||||||
Transfers and other movements(1) | 60 | (41) | 0 | 0 | (270) | 1 | (250) | |||||||||||||||||||||||||||||||||||||||||||||||||||||||||||||||||||||||||||
Transfers and other movements (2) | Transfers and other movements (2) | (1,076) | 186 | (699) | 2 | (320) | 24 | (1,883) | ||||||||||||||||||||||||||||||||||||||||||||||||||||||||||||||||||||||||||
| Translation | Translation | (239) | (119) | (7) | 0 | (32) | (5) | (402) | Translation | 157 | 9 | 5 | (1) | 6 | — | 176 | ||||||||||||||||||||||||||||||||||||||||||||||||||||||||||||||||||
| Balance at 31 December 2018 | 5,674 | 4,212 | 888 | 4 | 512 | 77 | 11,367 | |||||||||||||||||||||||||||||||||||||||||||||||||||||||||||||||||||||||||||
Balance at 31 December 2020 Restated (1) | Balance at 31 December 2020 Restated (1) | 4,325 | 3,953 | 188 | 9 | 566 | 112 | 9,153 | ||||||||||||||||||||||||||||||||||||||||||||||||||||||||||||||||||||||||||
| Accumulated amortisation and impairments | Accumulated amortisation and impairments | Accumulated amortisation and impairments | ||||||||||||||||||||||||||||||||||||||||||||||||||||||||||||||||||||||||||||||||
| Balance at 1 January 2018 | 3,979 | 2,796 | 853 | 3 | 26 | 15 | 7,672 | |||||||||||||||||||||||||||||||||||||||||||||||||||||||||||||||||||||||||||
| Balance at 1 January 2020 | Balance at 1 January 2020 | 3,866 | 2,803 | 846 | 4 | 25 | — | 7,544 | ||||||||||||||||||||||||||||||||||||||||||||||||||||||||||||||||||||||||||
| Amortisation for the year | Amortisation for the year | 345 | 179 | 5 | 1 | — | — | 530 | ||||||||||||||||||||||||||||||||||||||||||||||||||||||||||||||||||||||||||
| Disposals | Disposals | (1) | (25) | — | — | — | — | (26) | ||||||||||||||||||||||||||||||||||||||||||||||||||||||||||||||||||||||||||
Transfers and other movements (2) | Transfers and other movements (2) | (1,208) | (33) | (699) | — | — | — | (1,940) | ||||||||||||||||||||||||||||||||||||||||||||||||||||||||||||||||||||||||||
| Translation | Translation | 117 | 6 | 4 | — | 1 | — | 128 | ||||||||||||||||||||||||||||||||||||||||||||||||||||||||||||||||||||||||||
Balance at 31 December 2020 Restated (1) | Balance at 31 December 2020 Restated (1) | 3,119 | 2,930 | 156 | 5 | 26 | — | 6,236 | ||||||||||||||||||||||||||||||||||||||||||||||||||||||||||||||||||||||||||
| Net book value at 31 December 2020 | Net book value at 31 December 2020 | 1,206 | 1,023 | 32 | 4 | 540 | 112 | 2,917 | ||||||||||||||||||||||||||||||||||||||||||||||||||||||||||||||||||||||||||
| Cost | Cost | |||||||||||||||||||||||||||||||||||||||||||||||||||||||||||||||||||||||||||||||||
Balance at 1 January 2021 Restated (1) | Balance at 1 January 2021 Restated (1) | 4,325 | 3,953 | 188 | 9 | 566 | 112 | 9,153 | ||||||||||||||||||||||||||||||||||||||||||||||||||||||||||||||||||||||||||
| Additions | Additions | |||||||||||||||||||||||||||||||||||||||||||||||||||||||||||||||||||||||||||||||||
| - project capital | - project capital | 68 | — | — | 5 | 300 | 19 | 392 | ||||||||||||||||||||||||||||||||||||||||||||||||||||||||||||||||||||||||||
| - stay-in-business capital | - stay-in-business capital | 274 | 17 | — | — | 344 | — | 635 | ||||||||||||||||||||||||||||||||||||||||||||||||||||||||||||||||||||||||||
Finance costs capitalised (4) | Finance costs capitalised (4) | — | — | — | — | 14 | — | 14 | ||||||||||||||||||||||||||||||||||||||||||||||||||||||||||||||||||||||||||
| Disposals | Disposals | (2) | (23) | — | — | — | (5) | (30) | ||||||||||||||||||||||||||||||||||||||||||||||||||||||||||||||||||||||||||
Transfers and other movements (2) | Transfers and other movements (2) | 140 | (207) | — | (2) | (320) | — | (389) | ||||||||||||||||||||||||||||||||||||||||||||||||||||||||||||||||||||||||||
| Translation | Translation | (107) | (6) | (3) | — | (5) | — | (121) | ||||||||||||||||||||||||||||||||||||||||||||||||||||||||||||||||||||||||||
Balance at 31 December 2021 Restated (1) | Balance at 31 December 2021 Restated (1) | 4,698 | 3,734 | 185 | 12 | 899 | 126 | 9,654 | ||||||||||||||||||||||||||||||||||||||||||||||||||||||||||||||||||||||||||
| Accumulated amortisation and impairments | Accumulated amortisation and impairments | |||||||||||||||||||||||||||||||||||||||||||||||||||||||||||||||||||||||||||||||||
| Balance at 1 January 2021 | Balance at 1 January 2021 | 3,119 | 2,930 | 156 | 5 | 26 | — | 6,236 | ||||||||||||||||||||||||||||||||||||||||||||||||||||||||||||||||||||||||||
| Amortisation for the year | Amortisation for the year | 397 | 233 | 2 | 1 | 0 | 1 | 634 | Amortisation for the year | 243 | 166 | 6 | 2 | — | — | 417 | ||||||||||||||||||||||||||||||||||||||||||||||||||||||||||||||||||
Impairment and derecognition of assets (5) | Impairment and derecognition of assets (5) | 0 | 104 | 0 | 0 | 0 | 0 | 104 | Impairment and derecognition of assets(5) | — | 6 | — | — | — | — | 6 | ||||||||||||||||||||||||||||||||||||||||||||||||||||||||||||||||||
| Disposals | Disposals | (5) | (27) | 0 | (1) | 0 | (2) | (35) | Disposals | (1) | (22) | — | — | — | — | (23) | ||||||||||||||||||||||||||||||||||||||||||||||||||||||||||||||||||
Transfers and other movements(1) | (52) | (153) | 0 | 0 | 0 | 0 | (205) | |||||||||||||||||||||||||||||||||||||||||||||||||||||||||||||||||||||||||||
Transfers and other movements(2) | Transfers and other movements(2) | (79) | (311) | — | — | — | — | (390) | ||||||||||||||||||||||||||||||||||||||||||||||||||||||||||||||||||||||||||
| Translation | Translation | (135) | (42) | (6) | 0 | 1 | (2) | (184) | Translation | (78) | (4) | (3) | — | — | — | (85) | ||||||||||||||||||||||||||||||||||||||||||||||||||||||||||||||||||
| Balance at 31 December 2018 | 4,184 | 2,911 | 849 | 3 | 27 | 12 | 7,986 | |||||||||||||||||||||||||||||||||||||||||||||||||||||||||||||||||||||||||||
| Net book value at 31 December 2018 | 1,490 | 1,301 | 39 | 1 | 485 | 65 | 3,381 | |||||||||||||||||||||||||||||||||||||||||||||||||||||||||||||||||||||||||||
| Cost | ||||||||||||||||||||||||||||||||||||||||||||||||||||||||||||||||||||||||||||||||||
| Balance at 1 January 2019 | 5,674 | 4,212 | 888 | 4 | 512 | 77 | 11,367 | |||||||||||||||||||||||||||||||||||||||||||||||||||||||||||||||||||||||||||
| Additions | ||||||||||||||||||||||||||||||||||||||||||||||||||||||||||||||||||||||||||||||||||
| - project capital | 43 | 0 | 0 | 1 | 281 | 14 | 339 | |||||||||||||||||||||||||||||||||||||||||||||||||||||||||||||||||||||||||||
| - stay-in-business capital | 208 | 25 | 1 | 2 | 188 | 0 | 424 | |||||||||||||||||||||||||||||||||||||||||||||||||||||||||||||||||||||||||||
| Disposals | (1) | (16) | 0 | 0 | 0 | 0 | (17) | |||||||||||||||||||||||||||||||||||||||||||||||||||||||||||||||||||||||||||
Transfers and other movements(1) | (259) | 219 | 1 | 0 | (489) | (16) | (544) | |||||||||||||||||||||||||||||||||||||||||||||||||||||||||||||||||||||||||||
| Transfer to non-current assets and liabilities held for sale | (660) | (663) | (9) | 0 | (90) | (9) | (1,431) | |||||||||||||||||||||||||||||||||||||||||||||||||||||||||||||||||||||||||||
| Finance costs capitalised | 0 | 0 | 0 | 0 | 6 | 0 | 6 | |||||||||||||||||||||||||||||||||||||||||||||||||||||||||||||||||||||||||||
| Translation | (4) | (1) | 0 | 0 | (3) | 0 | (8) | |||||||||||||||||||||||||||||||||||||||||||||||||||||||||||||||||||||||||||
| Balance at 31 December 2019 | 5,001 | 3,776 | 881 | 7 | 405 | 66 | 10,136 | |||||||||||||||||||||||||||||||||||||||||||||||||||||||||||||||||||||||||||
| Accumulated amortisation and impairments | ||||||||||||||||||||||||||||||||||||||||||||||||||||||||||||||||||||||||||||||||||
| Balance at 1 January 2019 | 4,184 | 2,911 | 849 | 3 | 27 | 12 | 7,986 | |||||||||||||||||||||||||||||||||||||||||||||||||||||||||||||||||||||||||||
| Amortisation for the year | 392 | 215 | 1 | 1 | 0 | 0 | 609 | |||||||||||||||||||||||||||||||||||||||||||||||||||||||||||||||||||||||||||
Impairment and derecognition of assets(5) | 243 | 172 | 0 | 0 | 90 | 0 | 505 | |||||||||||||||||||||||||||||||||||||||||||||||||||||||||||||||||||||||||||
| Disposals | (1) | (15) | 0 | 0 | 0 | 0 | (16) | |||||||||||||||||||||||||||||||||||||||||||||||||||||||||||||||||||||||||||
Transfers and other movements(1) | (455) | (53) | 1 | 0 | (3) | (12) | (522) | |||||||||||||||||||||||||||||||||||||||||||||||||||||||||||||||||||||||||||
| Transfer to non-current assets and liabilities held for sale | (488) | (422) | (5) | 0 | (88) | 0 | (1,003) | |||||||||||||||||||||||||||||||||||||||||||||||||||||||||||||||||||||||||||
| Translation | (9) | (5) | 0 | 0 | (1) | 0 | (15) | |||||||||||||||||||||||||||||||||||||||||||||||||||||||||||||||||||||||||||
| Balance at 31 December 2019 | 3,866 | 2,803 | 846 | 4 | 25 | 0 | 7,544 | |||||||||||||||||||||||||||||||||||||||||||||||||||||||||||||||||||||||||||
| Net book value at 31 December 2019 | 1,135 | 973 | 35 | 3 | 380 | 66 | 2,592 | |||||||||||||||||||||||||||||||||||||||||||||||||||||||||||||||||||||||||||
| Balance at 31 December 2021 | Balance at 31 December 2021 | 3,204 | 2,765 | 159 | 7 | 26 | — | 6,161 | ||||||||||||||||||||||||||||||||||||||||||||||||||||||||||||||||||||||||||
| Net book value at 31 December 2021 | Net book value at 31 December 2021 | 1,494 | 969 | 26 | 5 | 873 | 126 | 3,493 | ||||||||||||||||||||||||||||||||||||||||||||||||||||||||||||||||||||||||||
F - 45
NOTES TO THE CONSOLIDATED FINANCIAL STATEMENTS (continued)
13 TANGIBLE ASSETS (continued)
| Figures in millions | Mine development costs | Mine infrastructure | Mineral rights and dumps | Exploration and evaluation assets | Assets under construction | Land and buildings(3) | Total | ||||||||||||||||||||||||||||||||||
| US Dollars | |||||||||||||||||||||||||||||||||||||||||
| Cost | |||||||||||||||||||||||||||||||||||||||||
| Balance at 1 January 2022 | 4,698 | 3,734 | 185 | 12 | 899 | 126 | 9,654 | ||||||||||||||||||||||||||||||||||
| Additions | |||||||||||||||||||||||||||||||||||||||||
| - project capital | 121 | — | — | 1 | 255 | 1 | 378 | ||||||||||||||||||||||||||||||||||
| - stay-in-business capital | 286 | 8 | — | — | 355 | 1 | 650 | ||||||||||||||||||||||||||||||||||
Finance costs capitalised (4) | — | — | — | — | 2 | — | 2 | ||||||||||||||||||||||||||||||||||
Acquisition of assets (5) | — | — | 614 | — | — | — | 614 | ||||||||||||||||||||||||||||||||||
| Disposals | (2) | (14) | — | — | — | — | (16) | ||||||||||||||||||||||||||||||||||
Transfers and other movements(2) | 290 | 379 | — | (1) | (753) | 1 | (84) | ||||||||||||||||||||||||||||||||||
| Translation | (120) | (8) | (4) | — | (1) | — | (133) | ||||||||||||||||||||||||||||||||||
| Balance at 31 December 2022 | 5,273 | 4,099 | 795 | 12 | 757 | 129 | 11,065 | ||||||||||||||||||||||||||||||||||
| Accumulated amortisation and impairments | |||||||||||||||||||||||||||||||||||||||||
| Balance at 1 January 2022 | 3,204 | 2,765 | 159 | 7 | 26 | — | 6,161 | ||||||||||||||||||||||||||||||||||
| Amortisation for the year | 374 | 174 | 8 | 1 | — | — | 557 | ||||||||||||||||||||||||||||||||||
Impairment and derecognition of assets(6) | 109 | 149 | 16 | — | — | 8 | 282 | ||||||||||||||||||||||||||||||||||
| Disposals | (1) | (14) | — | — | — | — | (15) | ||||||||||||||||||||||||||||||||||
Transfers and other movements(2) | (11) | (23) | — | — | — | — | (34) | ||||||||||||||||||||||||||||||||||
| Translation | (86) | (5) | (3) | (1) | — | — | (95) | ||||||||||||||||||||||||||||||||||
| Balance at 31 December 2022 | 3,589 | 3,046 | 180 | 7 | 26 | 8 | 6,856 | ||||||||||||||||||||||||||||||||||
| Net book value at 31 December 2022 | 1,684 | 1,053 | 615 | 5 | 731 | 121 | 4,209 | ||||||||||||||||||||||||||||||||||
(1)The tangible asset cost for 31 December 2020 and 31 December 2021 has been retrospectively restated and increased by $33m due to the initial application of the amendment of IAS 16 "Property, Plant and Equipment - Proceeds before intended use" on 1 January 2022. Refer to note 1.
(2)Transfers and other movements include amounts from deferred stripping, changes in estimates of decommissioning assets, asset reclassifications and initial recognition of joint operation share of property, plant and equipment.
(3)Assets of $7m (2021: $6m; 2020: $7m) have been pledged as security.
(4)The weighted average capitalisation rate used to determine the amount of borrowing costs eligible for capitalisation was 4.53% (2021: 4.96%; 2020: 4.52%)
(5)Corvus Gold
On 18 January 2022, AngloGold Ashanti announced the successful completion of the previously announced plan of arrangement with Corvus Gold Inc. (“Corvus Gold”), pursuant to which AngloGold Ashanti agreed to acquire the remaining 80.5% of common shares of Corvus Gold, not already owned by AngloGold Ashanti. On acquisition, AngloGold Ashanti obtained control over Corvus Gold.
Under the terms of the arrangement, the shareholders of Corvus Gold (other than the AngloGold Ashanti Group) received C$4.10 in cash per Corvus Gold share. The acquisition was concluded to represent an asset acquisition under IFRS.
The total consideration was $460m, including a non-cash consideration of $95m. The non-cash consideration primarily represents the fair value of $80m of the 19.5% Corvus Gold investment held by the Group prior to the acquisition of the 80.5%, and previously accounted for as an equity investment at fair value through OCI. The cash consideration paid, including transaction costs, at an exchange rate of C$1.26/$, amounted to $365m.
The Company has completed its analysis to assign fair values to all identifiable assets acquired and liabilities assumed. In accordance with asset acquisition accounting, the Company has allocated the total purchase consideration to these identifiable assets based on their relative fair values at the date of the acquisition to mineral rights and dumps of $460m.
Coeur Sterling
On 4 November 2022, AngloGold Ashanti announced the successful completion of its previously announced plan to acquire all of the shares of Coeur Sterling, Inc. (“Coeur Sterling”), a wholly owned subsidiary of Coeur Mining, Inc. ("Coeur").
Under the terms of the arrangement, AngloGold Ashanti paid the closing consideration of $150m to Coeur in cash.
Coeur estimated that the properties acquired by AngloGold Ashanti have a Mineral Resource of 914,000oz. The payment of $50m additional consideration is contingent on whether after additional exploration activities, AngloGold Ashanti declares a Mineral Resource from these properties that is greater than 3.5Moz. The additional exploration activities have not yet been performed by the Group.
The acquisition was concluded to represent an asset acquisition under IFRS. The Company has completed its analysis to assign fair values to all identifiable assets acquired and liabilities assumed. In accordance with asset acquisition accounting, the Company has allocated the total purchase consideration to these identifiable assets based on their relative fair values at the date of the acquisition to mineral rights and dumps of $154m and rehabilitation provisions of $2m.
(6)Impairment of assets is assessed as follows:
F - 46
NOTES TO THE CONSOLIDATED FINANCIAL STATEMENTS (continued)
| Figures in millions | Mine development costs | Mine infra- structure(2) | Mineral rights and dumps | Exploration and evaluation assets | Assets under construction | Land and buildings(3)(4) | Total | ||||||||||||||||||||||||||||||||||
| Cost | |||||||||||||||||||||||||||||||||||||||||
| Balance at 1 January 2020 | 5,001 | 3,776 | 881 | 7 | 405 | 66 | 10,136 | ||||||||||||||||||||||||||||||||||
| Additions | |||||||||||||||||||||||||||||||||||||||||
| - project capital | 64 | 0 | 0 | 1 | 246 | 20 | 331 | ||||||||||||||||||||||||||||||||||
| - stay-in-business capital | 180 | 8 | 1 | 0 | 179 | 2 | 370 | ||||||||||||||||||||||||||||||||||
Finance costs capitalised (5) | 0 | 0 | 0 | 0 | 17 | 0 | 17 | ||||||||||||||||||||||||||||||||||
| Disposals | (1) | (26) | 0 | 0 | 0 | 0 | (27) | ||||||||||||||||||||||||||||||||||
Transfers and other movements(1) | (1,076) | 186 | (699) | 2 | (320) | 24 | (1,883) | ||||||||||||||||||||||||||||||||||
| Translation | 157 | 9 | 5 | (1) | 6 | 0 | 176 | ||||||||||||||||||||||||||||||||||
| Balance at 31 December 2020 | 4,325 | 3,953 | 188 | 9 | 533 | 112 | 9,120 | ||||||||||||||||||||||||||||||||||
| Accumulated amortisation and impairments | |||||||||||||||||||||||||||||||||||||||||
| Balance at 1 January 2020 | 3,866 | 2,803 | 846 | 4 | 25 | 0 | 7,544 | ||||||||||||||||||||||||||||||||||
| Amortisation for the year | 345 | 179 | 5 | 1 | 0 | 0 | 530 | ||||||||||||||||||||||||||||||||||
| Disposals | (1) | (25) | 0 | 0 | 0 | 0 | (26) | ||||||||||||||||||||||||||||||||||
Transfers and other movements(1) | (1,208) | (33) | (699) | 0 | 0 | 0 | (1,940) | ||||||||||||||||||||||||||||||||||
| Translation | 117 | 6 | 4 | 0 | 1 | 0 | 128 | ||||||||||||||||||||||||||||||||||
| Balance at 31 December 2020 | 3,119 | 2,930 | 156 | 5 | 26 | 0 | 6,236 | ||||||||||||||||||||||||||||||||||
| Net book value at 31 December 2020 | 1,206 | 1,023 | 32 | 4 | 507 | 112 | 2,884 | ||||||||||||||||||||||||||||||||||
Impairment calculation assumptions as at 31 December 20202022 - goodwill, tangible and intangible assets
Management assumptions for the value in use of tangible assets and goodwill include:
•the gold price assumption represents management’s best estimate of the future price of gold. A long-term real gold price of $1,450/$1,731/oz (2019: $1,300/(2021: $1,599/oz; 2018: $1,239/2020:$1,450/oz) is based on a range of economic and market conditions that will exist over the remaining useful life of the assets.
Annual life of mine plans take into account the following:
•provedProven and probable OreProbable Mineral Reserve;
•value beyond provedProven and probable OreProbable Mineral Reserve (including exploration potential) determined using the gold price assumption referred to above;
•In determining the impairment for each cash generating unit, the real pre-taxpost-tax rate was derived from the weighted average cost of capital (WACC) using the Capital Asset Pricing Model (CAPM) to determine the required return on equity with risk factors consistent with the basis used in 2019. At 31 December 2020, the derived group WACC was 9.1% (real post-tax) which is 100 basis points higher than in 2019 of 8.1%, and is based on the industry average capital structure of the major gold companies considered to be appropriate peers.2021. In determining the WACC for each cash generating unit, sovereign and mining risk factors are considered to determine country specific risks. In certain instances, a specific risk premium was added to large projects being undertaken or the turnaround nature of a specific mine to address uncertainties in the forecast of the cash flows;
•foreign currency cash flows translated at estimated forward exchange rates and then discounted using appropriate discount rates for that currency;
•cash flows used in impairment calculations are based on life of mine plans which range from 65 years to 2629 years; and
•variable operating cash flows are increased at local Consumer Price Index rates.
Córrego do Sítio (CdS)
CdS is owned and operated by AngloGold Ashanti Mineração (AGA Mineração) in Brazil. The CdS mining complex has been in operation since 1989 and consists of open pit and underground mines. The property is currently in a production stage. In line with AngloGold Ashanti's reinvestment strategy, management has taken a decision during the third quarter of 2022 to carve out the underperforming complex of CdS from the AGA Mineração CGU and to investigate alternative strategic options including either to sell the complex, place the complex under care and maintenance, close the complex or to consider additional capital expenditure to regain profitability of the complex. After the strategic review of CdS, the Company has elected to retain CdS. This decision resulted in the disaggregation of the AGA Mineração CGU into two separate CGUs, being the CdS mining complex CGU and the Cuiabá mining complex CGU.
As a result of these impairment indicators, the recoverable amount for the CdS mining complex CGU was determined not to support its carrying values as at 30 September 2022 and an impairment loss of $151m ($189m gross of taxes) was recognised and included in the Americas segment. The disaggregation of CGUs did not have an impact on reportable segments in terms of IFRS 8 Operating Segments as disclosed in the segmental reporting. The recoverable amount of $5m was determined with reference to the CGU’s value in use derived from a discounted cash flow model, using a discount rate of 8.5% compared to the CGU’s carrying amount of $156m.
Cuiabá
Cuiabá is owned and operated by AGA Mineração in Brazil. It has been in operation since 1834 and is an underground mine. The property is currently in the production stage. The Cuiabá mining complex CGU, which was disaggregated from the AGA Mineração CGU, recognised an impairment loss of $57m ($70m gross of taxes). This was largely due to the suspension of filtered tailings deposition on the Calcinados Tailings Storage Facility (TSF) and processing of gold concentrate at the Queiroz plant in December 2022 (with both servicing the Cuiabá mining complex), pending completion of additional buttressing to align the TSF’s post liquefaction factor of safety with international standards currently considered best practice.
The recoverable amount of $304m (compared to the CGU's carrying amount of $361m) was determined with reference to the CGU’s value in use which requires the use of estimates. The impairment result was derived from a discounted cash flow model and a discount rate of 8.5%.
Management modelled various scenarios, which included a combination of reasonably possible changes in key assumptions, to determine the impact on the recoverable amount. The impairment assessment required significant judgement and estimation uncertainty. The impairment loss was recognised and included in the Americas segment.
Serra Grande
Mineração Serra Grande (“Serra Grande”) is wholly owned by AngloGold Ashanti and is located in the northwest of Goiás State, central Brazil. It has been in operation since 1986 and consists of three underground and two open pit mines. The property is currently in the production stage. The Serra Grande CGU recognised an impairment loss of $38m ($45m gross of taxes) during December 2022 largely due to a projection of lower grades and ounces and an increase in the interest rates driven by global inflation and country risk which resulted in an increased discount rate. The recoverable amount of $128m was determined with reference to the CGU’s value in use derived from a discounted cash flow model, using a discount rate of 8.5% (Dec 2021: 5.6%) compared to the CGU’s carrying amount of $166m. The impairment loss was recognised and included in the Americas segment.
F - 47
NOTES TO THE CONSOLIDATED FINANCIAL STATEMENTS (continued)
| Figures in millions - US Dollars | 2019 (1) | 2018 | |||||||||
| First Uranium - Mine Waste Solutions | 89 | 93 | |||||||||
| Surface Operations | 18 | 1 | |||||||||
| Mponeng | 384 | 4 | |||||||||
| Covalent | 11 | 0 | |||||||||
| Obuasi | 0 | 5 | |||||||||
| Siguiri | 2 | 0 | |||||||||
| AGA Mineração | 1 | 0 | |||||||||
| Other | 0 | 1 | |||||||||
| 505 | 104 | ||||||||||
Impairment of cash generating unitsAllocation:
| Cash Generating Unit | Mine Development Cost | Mine Infrastructure | Mineral Rights and Dumps | Land and buildings | Total Tangible Asset Impairment | Goodwill | Right of use assets | Total Impairment | ||||||||||||||||||||||||||||||||||||||||||
| Figures in millions - US Dollars | 2022 | |||||||||||||||||||||||||||||||||||||||||||||||||
| Córrego do Sítio | 58 | 98 | 16 | 6 | 178 | — | 11 | 189 | ||||||||||||||||||||||||||||||||||||||||||
| Cuiabá | 34 | 30 | — | 1 | 65 | — | 5 | 70 | ||||||||||||||||||||||||||||||||||||||||||
| Serra Grande | 17 | 18 | — | 1 | 36 | 8 | 1 | 45 | ||||||||||||||||||||||||||||||||||||||||||
| 109 | 146 | 16 | 8 | 279 | 8 | 17 | 304 | |||||||||||||||||||||||||||||||||||||||||||
Sensitivity analysis - Impairment
| Sensitivity analysis -Impairment | Sensitivity analysis -Impairment | Cuiabá | Córrego do Sítio | Serra Grande | ||||||||||||||||||||||||
| Figures in millions - US Dollars | Figures in millions - US Dollars | Carrying value | Value in use | Figures in millions - US Dollars | 2022 | |||||||||||||||||||||||
Kibali (1)(2) | 1,482 | 1,614 | ||||||||||||||||||||||||||
| Assumed gold price and discount rate have a significant impact on the recoverable amount. A 1% change in the gold price and 1% absolute movement (discount rate) would have the following impact: | Assumed gold price and discount rate have a significant impact on the recoverable amount. A 1% change in the gold price and 1% absolute movement (discount rate) would have the following impact: | |||||||||||||||||||||||||||
| Effect of increase in assumption: | Effect of increase in assumption: | |||||||||||||||||||||||||||
| 1% change in gold price | 1% change in gold price | 17 | 6 | 7 | ||||||||||||||||||||||||
| 1% absolute movement in discount rate | 1% absolute movement in discount rate | (21) | (2) | (6) | ||||||||||||||||||||||||
| Effect of decrease in assumption: | Effect of decrease in assumption: | |||||||||||||||||||||||||||
| 1% change in gold price | 1% change in gold price | (17) | (6) | (7) | ||||||||||||||||||||||||
| 1% absolute movement in discount rate | 1% absolute movement in discount rate | 23 | 2 | 7 | ||||||||||||||||||||||||
Assumed cash flows have a significant impact on the recoverable amount of Cuiabá. (1) A one- and three-month delay in the net cash flows would have the following impact: | Assumed cash flows have a significant impact on the recoverable amount of Cuiabá. (1) A one- and three-month delay in the net cash flows would have the following impact: | |||||||||||||||||||||||||||
| Effect of change in cash flow assumption: | Effect of change in cash flow assumption: | |||||||||||||||||||||||||||
| One month movement in cash flows | One month movement in cash flows | (4) | ||||||||||||||||||||||||||
| Three month movement in cash flows | Three month movement in cash flows | (13) | ||||||||||||||||||||||||||
(1) ItA risk assessment conducted in December 2022, with oversight from external consultants, as required by Brazilian regulations, concluded that additional buttressing should be completed at the Calcinados TSF (receiving material from the Cuiabá CGU) to align the TSF’s post liquefaction factor of safety with international standards currently considered best practice. Construction at the Calcinados TSF is estimated that a decreaseexpected to begin later in 2023, and the timeline for completion will be determined once the engineering and geotechnical work has been completed by external consultants. Tailings deposition at the Calcinados TSF, as well as processing of gold concentrate at the Queiroz plant, which services the Cuiabá mine complex, is suspended until additional buttressing of the long-term realCalcinados TSF impoundment is complete. The extent and timing of the work requires significant estimation and judgement and management’s assumptions may ultimately differ from the actual outcome.
Management modelled various scenarios, which included a combination of reasonably possible changes in key assumptions, to determine the impact on the recoverable amount. Key areas of estimation uncertainty include gold price sensitivities (as disclosed above) and projected timelines of $1,450/oz by 4.4%, would causecompletion of the recoverable amountstructural improvements, where such delays could lead to loss of Kibali to equal its carrying amount using a real post-tax weighted average costproduction. Additionally, management’s assumptions for future cash flows include an estimate of capital (WACC) discount rate of 12.5% (2019: 9.7%). The sensitivity analysis has been provided on the basiscosts that the key assumption changes without a change in the other assumptions. However, forCompany expect to incur including capital expenditure as well as incremental revenue and costs related to potential gold concentrate sales. For a change in each of the assumptions used, it is impracticable to disclose the consequential effect of changes on the other variables used to measure the recoverable amount because these assumptions and others used in impairment testing are inextricably linked.
F - 48
14 RIGHT OF USE ASSETS AND LEASE LIABILITIES
The groupGroup leases various assets including buildings, plant and equipment and vehicles. The group’sGroup’s lease obligations are secured by the lessors’ title to the leased assets for such leases.
RIGHT OF USE ASSETS
| Figures in millions - US Dollars | Mine Infra- structure | Land and buildings | Total | ||||||||||||||||||||||||||||||||||||||
| Cost | |||||||||||||||||||||||||||||||||||||||||
| Balance at 1 January 2020 | 209 | 24 | 233 | ||||||||||||||||||||||||||||||||||||||
| Additions | 23 | — | 23 | ||||||||||||||||||||||||||||||||||||||
Derecognition and other movements (1) | (13) | 1 | (12) | ||||||||||||||||||||||||||||||||||||||
| Translation | 14 | (1) | 13 | ||||||||||||||||||||||||||||||||||||||
| Balance at 31 December 2020 | 233 | 24 | 257 | ||||||||||||||||||||||||||||||||||||||
| Accumulated amortisation and impairments | |||||||||||||||||||||||||||||||||||||||||
| Balance at 1 January 2020 | 61 | 14 | 75 | ||||||||||||||||||||||||||||||||||||||
| Amortisation for the year | 45 | 2 | 47 | ||||||||||||||||||||||||||||||||||||||
Derecognition and other movements (1) | (11) | — | (11) | ||||||||||||||||||||||||||||||||||||||
| Translation | 5 | (1) | 4 | ||||||||||||||||||||||||||||||||||||||
| Balance at 31 December 2020 | 100 | 15 | 115 | ||||||||||||||||||||||||||||||||||||||
| Net book value at 31 December 2020 | 133 | 9 | 142 | ||||||||||||||||||||||||||||||||||||||
| Cost | |||||||||||||||||||||||||||||||||||||||||
| Balance at 1 January 2021 | 233 | 24 | 257 | ||||||||||||||||||||||||||||||||||||||
| Additions | 95 | 7 | 102 | ||||||||||||||||||||||||||||||||||||||
Derecognition and other movements(1) | (22) | (15) | (37) | ||||||||||||||||||||||||||||||||||||||
| Translation | (9) | — | (9) | ||||||||||||||||||||||||||||||||||||||
| Balance at 31 December 2021 | 297 | 16 | 313 | ||||||||||||||||||||||||||||||||||||||
| Accumulated amortisation and impairments | |||||||||||||||||||||||||||||||||||||||||
| Balance at 1 January 2021 | 100 | 15 | 115 | ||||||||||||||||||||||||||||||||||||||
| Amortisation for the year | 61 | 2 | 63 | ||||||||||||||||||||||||||||||||||||||
Derecognition and other movements(1) | (22) | (15) | (37) | ||||||||||||||||||||||||||||||||||||||
| Impairment | — | 1 | 1 | ||||||||||||||||||||||||||||||||||||||
| Translation | (4) | — | (4) | ||||||||||||||||||||||||||||||||||||||
| Balance at 31 December 2021 | 135 | 3 | 138 | ||||||||||||||||||||||||||||||||||||||
| Net book value at 31 December 2021 | 162 | 13 | 175 | ||||||||||||||||||||||||||||||||||||||
| Cost | |||||||||||||||||||||||||||||||||||||||||
| Balance at 1 January 2022 | 297 | 16 | 313 | ||||||||||||||||||||||||||||||||||||||
| Additions | 90 | 1 | 91 | ||||||||||||||||||||||||||||||||||||||
Derecognition and other movements(1) | (34) | — | (34) | ||||||||||||||||||||||||||||||||||||||
| Translation | (8) | (2) | (10) | ||||||||||||||||||||||||||||||||||||||
| Balance at 31 December 2022 | 345 | 15 | 360 | ||||||||||||||||||||||||||||||||||||||
| Accumulated amortisation and impairments | |||||||||||||||||||||||||||||||||||||||||
| Balance at 1 January 2022 | 135 | 3 | 138 | ||||||||||||||||||||||||||||||||||||||
| Amortisation for the year | 78 | 3 | 81 | ||||||||||||||||||||||||||||||||||||||
Derecognition and other movements(1) | (29) | — | (29) | ||||||||||||||||||||||||||||||||||||||
Impairment (2) | 17 | — | 17 | ||||||||||||||||||||||||||||||||||||||
| Translation | (4) | 1 | (3) | ||||||||||||||||||||||||||||||||||||||
| Balance at 31 December 2022 | 197 | 7 | 204 | ||||||||||||||||||||||||||||||||||||||
| Net book value at 31 December 2022 | 148 | 8 | 156 | ||||||||||||||||||||||||||||||||||||||
| US dollar millions | Mine Infra- structure | Land and buildings | Total | ||||||||||||||||||||||||||||||||||||||
| Cost | |||||||||||||||||||||||||||||||||||||||||
| Impact of adopting IFRS 16 - 1 January 2019 | 119 | 9 | 128 | ||||||||||||||||||||||||||||||||||||||
| Additions | |||||||||||||||||||||||||||||||||||||||||
| - stay-in-business capital | 32 | 0 | 32 | ||||||||||||||||||||||||||||||||||||||
Transfers and other movements(1) | 58 | 15 | 73 | ||||||||||||||||||||||||||||||||||||||
| Transfer to assets and liabilities held for sale | 0 | (1) | (1) | ||||||||||||||||||||||||||||||||||||||
| Translation | 0 | 1 | 1 | ||||||||||||||||||||||||||||||||||||||
| Balance at 31 December 2019 | 209 | 24 | 233 | ||||||||||||||||||||||||||||||||||||||
| Accumulated amortisation and impairments | |||||||||||||||||||||||||||||||||||||||||
| Balance at 1 January 2019 | 0 | 0 | 0 | ||||||||||||||||||||||||||||||||||||||
| Amortisation for the year | 40 | 2 | 42 | ||||||||||||||||||||||||||||||||||||||
Transfers and other movements(1) | 21 | 12 | 33 | ||||||||||||||||||||||||||||||||||||||
| Balance at 31 December 2019 | 61 | 14 | 75 | ||||||||||||||||||||||||||||||||||||||
| Net book value at 31 December 2019 | 148 | 10 | 158 | ||||||||||||||||||||||||||||||||||||||
| Cost | |||||||||||||||||||||||||||||||||||||||||
| Balance at 1 January 2020 | 209 | 24 | 233 | ||||||||||||||||||||||||||||||||||||||
| Additions | |||||||||||||||||||||||||||||||||||||||||
| - stay-in-business capital | 23 | 0 | 23 | ||||||||||||||||||||||||||||||||||||||
| Derecognition and other movements | (13) | 1 | (12) | ||||||||||||||||||||||||||||||||||||||
| Translation | 14 | (1) | 13 | ||||||||||||||||||||||||||||||||||||||
| Balance at 31 December 2020 | 233 | 24 | 257 | ||||||||||||||||||||||||||||||||||||||
| Accumulated amortisation and impairments | |||||||||||||||||||||||||||||||||||||||||
| Balance at 1 January 2020 | 61 | 14 | 75 | ||||||||||||||||||||||||||||||||||||||
| Amortisation for the year | 45 | 2 | 47 | ||||||||||||||||||||||||||||||||||||||
| Derecognition of assets | (11) | 0 | (11) | ||||||||||||||||||||||||||||||||||||||
| Translation | 5 | (1) | 4 | ||||||||||||||||||||||||||||||||||||||
| Balance at 31 December 2020 | 100 | 15 | 115 | ||||||||||||||||||||||||||||||||||||||
Net book value at 31 December 2020 | 133 | 9 | 142 | ||||||||||||||||||||||||||||||||||||||
(2) The Group recognised an impairment loss of $304m (gross of taxation) during December 2022, of which $17m related to right of use assets. Refer to note 13
F - 49
LEASE EXPENSES
| US dollar millions | 2020 | 2019 | ||||||
| Amounts recognised in the income statement | ||||||||
| Amortisation expense on right of use assets (note 4) | 47 | 42 | ||||||
| Interest expense on lease liabilities (note 7) | 8 | 10 | ||||||
| Expenses on short term leases | 107 | 83 | ||||||
Expenses on variable lease payments not included in the lease liabilities(1) | 234 | 220 | ||||||
Expenses on leases of low value assets(1) | 24 | 2 | ||||||
| Figures in millions - US Dollars | 2022 | 2021 | 2020 | ||||||||
Amounts recognised in the income statement (1) | |||||||||||
| Expenses on short term leases | 19 | 48 | 107 | ||||||||
Expenses on variable lease payments not included in the lease liabilities(2) | 749 | 302 | 234 | ||||||||
| Expenses on leases of low value assets | 15 | 33 | 24 | ||||||||
(1) Includes expenses at Obuasi that have been capitalised as part of the re-development project.
| US Dollar million | 2020 | 2019 | ||||||
| Reconciliation of lease liabilities | ||||||||
| A reconciliation of the lease liabilities included in the statement of financial position is set out in the following table: | ||||||||
| Opening balance | 171 | 0 | ||||||
| Lease liabilities recognised | 23 | 160 | ||||||
| Repayment of lease liabilities | (47) | (42) | ||||||
| Finance costs paid on lease liabilities | (8) | (9) | ||||||
| Interest charged to the income statement | 8 | 10 | ||||||
| Reclassification of finance leases from borrowings | 0 | 60 | ||||||
| Change in estimate | (1) | (5) | ||||||
| Translation | 7 | (3) | ||||||
| Closing balance | 153 | 171 | ||||||
| Lease finance costs paid included in the statement of cash flows | 8 | 9 | ||||||
| US Dollar million | 2020 | 2019 | ||||||
| Maturity analysis of lease liabilities | ||||||||
| Undiscounted cash flows | ||||||||
| Less than and including 1 year | 43 | 52 | ||||||
| Between 1 and 5 years | 83 | 89 | ||||||
| Five years and more | 36 | 57 | ||||||
| Total | 162 | 198 | ||||||
| US Dollar million | 2020 | 2019 | ||||||
| Lease liabilities | ||||||||
| Non-current | 116 | 126 | ||||||
| Current | 37 | 45 | ||||||
| Total | 153 | 171 | ||||||
(2)The weighted average incremental borrowing ratevariable lease payments consist mainly of mining and drilling contracts and constitutes 87% of total lease payments made during the period. The variable nature of these contracts is to allow equal sharing of pain and gain between the Group and its contractors. These payments are predominantly driven by performance measures on a per tonne or a per metre basis. The increase in variable lease payments is mainly due to the full year impact of the AMAX lease at Iduapriem (half year impact in 2021), higher leasing activity at Brazil due to their leasing strategy deployed and an increased footprint of our North American operations. The future cash flows to which the endGroup is potentially exposed to are not disclosed as their variability does not permit reliable forecasts.
LEASE LIABILITIES
| Figures in millions - US Dollars | 2022 | 2021 | 2020 | ||||||||
Reconciliation of lease liabilities (1) | |||||||||||
| A reconciliation of the lease liabilities included in the statement of financial position is set out in the following table: | |||||||||||
| Opening balance | 185 | 153 | 171 | ||||||||
| Lease liabilities recognised | 90 | 103 | 23 | ||||||||
| Repayment of lease liabilities | (82) | (63) | (47) | ||||||||
| Finance costs paid on lease liabilities | (10) | (9) | (8) | ||||||||
| Interest charged to the income statement | 11 | 9 | 8 | ||||||||
| Modifications and terminations | (7) | — | (1) | ||||||||
| Translation | (1) | (8) | 7 | ||||||||
| Closing balance | 186 | 185 | 153 | ||||||||
| Lease liabilities | |||||||||||
| Non-current (note 34) | 102 | 124 | 116 | ||||||||
| Current (note 34) | 84 | 61 | 37 | ||||||||
| Total | 186 | 185 | 153 | ||||||||
(1) The Group leases a number of 31 December 2020assets as part of its activities. These primarily include gas pipelines, ore haulage and site services, mining equipment and property. All lease contracts contain market review clauses in the event that the Group exercises its option to renew. A maturity analysis of lease liabilities is 5.38% (2019: 4.72%).provided in note 33.
F - 5150
| Figures in millions | Goodwill | Other | Total | ||||||||||||||||||||
| US Dollars | |||||||||||||||||||||||
| Cost | |||||||||||||||||||||||
| Balance at 1 January 2018 | 127 | 172 | 299 | ||||||||||||||||||||
| Additions | 0 | 1 | 1 | ||||||||||||||||||||
| Disposals | 0 | (3) | (3) | ||||||||||||||||||||
Transfers and other movements(1) | 0 | 4 | 4 | ||||||||||||||||||||
| Translation | (11) | (7) | (18) | ||||||||||||||||||||
| Balance at 31 December 2018 | 116 | 167 | 283 | ||||||||||||||||||||
| Accumulated amortisation and impairments | |||||||||||||||||||||||
| Balance at 1 January 2018 | 0 | 161 | 161 | ||||||||||||||||||||
| Amortisation for the year | 0 | 5 | 5 | ||||||||||||||||||||
| Disposals | 0 | (3) | (3) | ||||||||||||||||||||
Transfers and other movements(1) | 0 | 4 | 4 | ||||||||||||||||||||
| Translation | 0 | (7) | (7) | ||||||||||||||||||||
| Balance at 31 December 2018 | 0 | 160 | 160 | ||||||||||||||||||||
| Net book value at 31 December 2018 | 116 | 7 | 123 | ||||||||||||||||||||
| Cost | |||||||||||||||||||||||
| Balance at 1 January 2019 | 116 | 167 | 283 | ||||||||||||||||||||
| Transfer to assets and liabilities held for sale | 0 | (26) | (26) | ||||||||||||||||||||
Transfers and other movements(1) | 0 | 3 | 3 | ||||||||||||||||||||
| Balance at 31 December 2019 | 116 | 144 | 260 | ||||||||||||||||||||
| Accumulated amortisation and impairments | |||||||||||||||||||||||
| Balance at 1 January 2019 | 0 | 160 | 160 | ||||||||||||||||||||
| Amortisation for the year | 0 | 3 | 3 | ||||||||||||||||||||
| Transfer to assets and liabilities held for sale | 0 | (26) | (26) | ||||||||||||||||||||
| Balance at 31 December 2019 | 0 | 137 | 137 | ||||||||||||||||||||
| Net book value at 31 December 2019 | 116 | 7 | 123 | ||||||||||||||||||||
| Cost | |||||||||||||||||||||||
| Balance at 1 January 2020 | 116 | 144 | 260 | ||||||||||||||||||||
| Additions | 0 | 1 | 1 | ||||||||||||||||||||
Transfers and other movements(1) | 0 | (49) | (49) | ||||||||||||||||||||
| Translation | 10 | 0 | 10 | ||||||||||||||||||||
| Balance at 31 December 2020 | 126 | 96 | 222 | ||||||||||||||||||||
| Accumulated amortisation and impairments | |||||||||||||||||||||||
| Balance at 1 January 2020 | 0 | 137 | 137 | ||||||||||||||||||||
| Amortisation for the year | 0 | 2 | 2 | ||||||||||||||||||||
Transfers and other movements (1) | 0 | (49) | (49) | ||||||||||||||||||||
| Translation | 0 | 1 | 1 | ||||||||||||||||||||
| Balance at 31 December 2020 | 0 | 91 | 91 | ||||||||||||||||||||
| Net book value at 31 December 2020 | 126 | 5 | 131 | ||||||||||||||||||||
| Figures in millions | Goodwill | Other | Total | ||||||||||||||||||||
| US Dollars | |||||||||||||||||||||||
| Cost | |||||||||||||||||||||||
| Balance at 1 January 2020 | 116 | 144 | 260 | ||||||||||||||||||||
| Additions | — | 1 | 1 | ||||||||||||||||||||
Transfers and other movements(1) | — | (49) | (49) | ||||||||||||||||||||
| Translation | 10 | — | 10 | ||||||||||||||||||||
| Balance at 31 December 2020 | 126 | 96 | 222 | ||||||||||||||||||||
| Accumulated amortisation and impairments | |||||||||||||||||||||||
| Balance at 1 January 2020 | — | 137 | 137 | ||||||||||||||||||||
| Amortisation for the year | — | 2 | 2 | ||||||||||||||||||||
Transfers and other movements(1) | — | (49) | (49) | ||||||||||||||||||||
| Translation | — | 1 | 1 | ||||||||||||||||||||
| Balance at 31 December 2020 | — | 91 | 91 | ||||||||||||||||||||
| Net book value at 31 December 2020 | 126 | 5 | 131 | ||||||||||||||||||||
| Cost | |||||||||||||||||||||||
| Balance at 1 January 2021 | 126 | 96 | 222 | ||||||||||||||||||||
| Additions | — | 1 | 1 | ||||||||||||||||||||
Transfers and other movements(1) | — | (1) | (1) | ||||||||||||||||||||
| Translation | (7) | (1) | (8) | ||||||||||||||||||||
| Balance at 31 December 2021 | 119 | 95 | 214 | ||||||||||||||||||||
| Accumulated amortisation and impairments | |||||||||||||||||||||||
| Balance at 1 January 2021 | — | 91 | 91 | ||||||||||||||||||||
| Amortisation for the year | — | 3 | 3 | ||||||||||||||||||||
Transfers and other movements(1) | — | (1) | (1) | ||||||||||||||||||||
| Translation | — | (1) | (1) | ||||||||||||||||||||
| Balance at 31 December 2021 | — | 92 | 92 | ||||||||||||||||||||
| Net book value at 31 December 2021 | 119 | 3 | 122 | ||||||||||||||||||||
| Cost | |||||||||||||||||||||||
| Balance at 1 January 2022 | 119 | 95 | 214 | ||||||||||||||||||||
| Additions | — | 1 | 1 | ||||||||||||||||||||
| Translation | (6) | (1) | (7) | ||||||||||||||||||||
| Balance at 31 December 2022 | 113 | 95 | 208 | ||||||||||||||||||||
| Accumulated amortisation and impairments | |||||||||||||||||||||||
| Balance at 1 January 2022 | — | 92 | 92 | ||||||||||||||||||||
| Amortisation for the year | — | 1 | 1 | ||||||||||||||||||||
Impairment of Goodwill (2) | 8 | — | 8 | ||||||||||||||||||||
| Translation | — | 1 | 1 | ||||||||||||||||||||
| Balance at 31 December 2022 | 8 | 94 | 102 | ||||||||||||||||||||
| Net book value at 31 December 2022 | 105 | 1 | 106 | ||||||||||||||||||||
(1)Transfers and other movements include amounts from asset reclassifications and amounts written off.
(2)The Serra Grande CGU recognised an impairment loss of $45m (gross of taxation) during December 2022, of which $8m related to goodwill. Refer to note 13.
F - 5251
NOTES TO THE CONSOLIDATED FINANCIAL STATEMENTS (continued)
Impairment calculation assumptions for goodwill
Based on an analysis carried out by the groupGroup in 2020,2022, the carrying value and value in use of the most sensitive CGU with goodwill is:
| 2020 | |||||||||||
| US Dollars | |||||||||||
| Figures in millions | Carrying Value | Value in use | |||||||||
| Sunrise Dam | 229 | 538 | |||||||||
| 2022 | |||||||||||
| US Dollars | |||||||||||
| Figures in millions | Carrying Value | Value in use | |||||||||
| Sunrise Dam | 230 | 293 | |||||||||
As at 31 December 2020,2022, the recoverable amount of Sunrise Dam exceeded its carrying amount by $309m.$63m. Sunrise Dam had $118m$105m goodwill at that date.31 December 2022. The life of mine of Sunrise Dam is planned until 2028.
It is estimated that a decrease of the long-term real gold price of $1,450/$1,731/oz by 8%4.5%, or an increase in the discount rate of 4.6% to 13.9% would cause the recoverable amount of this CGU to equal its carrying amount. The sensitivity analysis has been provided on the basis that the key assumption changes without a change in the other assumptions. However, for a change in each of the assumptions used, it is impracticable to disclose the consequential effect of changes on the other variables used to measure the recoverable amount because these assumptions and others used in impairment testing of goodwill are inextricably linked.
Therefore, it is possible that outcomes within the next financial year that are different from the assumptions used in the impairment testing process for goodwill could require a materialan adjustment to the carrying amounts in future periods.
Net book value of goodwill allocated to each of the CGUs:
| US Dollars | |||||||||||||||||
| Figures in millions | 2020 | 2019 | 2018 | ||||||||||||||
| - Sunrise Dam | 118 | 108 | 108 | ||||||||||||||
| - Serra Grande | 8 | 8 | 8 | ||||||||||||||
| 126 | 116 | 116 | |||||||||||||||
| Real pre-tax discount rates applied in impairment calculations on the CGU for which the carrying amount of goodwill is significant is as follows: | |||||||||||||||||
- Sunrise Dam (1) | 8.7 | % | 10.8 | % | 8.3 | % | |||||||||||
| US Dollars | |||||||||||||||||
| Figures in millions | 2022 | 2021 | 2020 | ||||||||||||||
| - Sunrise Dam | 105 | 111 | 118 | ||||||||||||||
| - Serra Grande | — | 8 | 8 | ||||||||||||||
| 105 | 119 | 126 | |||||||||||||||
| Real post-tax discount rates applied in impairment calculations on the CGU for which the carrying amount of goodwill is significant is as follows: | |||||||||||||||||
- Sunrise Dam (1) | 4.6 | % | 2.4 | % | 5.4 | % | |||||||||||
Goodwill has been allocated to its respective CGUs where it is tested for impairment as part of the CGU . The groupGroup reviews and tests the carrying value of goodwill on an annual basis for impairment. The discount rates for 20202022 were determined on a basis consistent with the 20192021 discount rates.
(1)The value in use of the CGU is $538m in 2020 (2019: $363m; 2018: $750m)$293m (2021: $389m; 2020: $538m).
F - 5352
NOTES TO THE CONSOLIDATED FINANCIAL STATEMENTS (continued)
| Name | Name | Non-controlling interest holding | Country of incorporation and operation | Name | Non-controlling interest holding | Country of incorporation and operation | ||||||||||||||||||||||||||||||||||||||||
| 2020 | 2019 | 2018 | 2022 | 2021 | 2020 | |||||||||||||||||||||||||||||||||||||||||
| Cerro Vanguardia S.A. (CVSA) | Cerro Vanguardia S.A. (CVSA) | 7.5 | % | 7.5 | % | 7.5 | % | Argentina | Cerro Vanguardia S.A. (CVSA) | 7.5 | % | 7.5 | % | 7.5 | % | Argentina | ||||||||||||||||||||||||||||||
| Société AngloGold Ashanti de Guinée S.A. (Siguiri) | Société AngloGold Ashanti de Guinée S.A. (Siguiri) | 15 | % | 15 | % | 15 | % | Republic of Guinea | Société AngloGold Ashanti de Guinée S.A. (Siguiri) | 15 | % | 15 | % | 15 | % | Republic of Guinea | ||||||||||||||||||||||||||||||
Financial information of subsidiaries that have material non-controlling interests are provided below:
| US Dollars | |||||||||||||||||
| Figures in millions | 2020 | 2019 | 2018 | ||||||||||||||
| Profit (loss) allocated to material non-controlling interests | |||||||||||||||||
| CVSA | 8 | 5 | 9 | ||||||||||||||
| Siguiri | 10 | 0 | 8 | ||||||||||||||
| Accumulated balances of material non-controlling interests | |||||||||||||||||
| CVSA | 14 | 13 | 14 | ||||||||||||||
| Siguiri | 31 | 23 | 32 | ||||||||||||||
| US Dollars | |||||||||||||||||
| Figures in millions | 2022 | 2021 | 2020 | ||||||||||||||
| Profit (loss) allocated to material non-controlling interests | |||||||||||||||||
| CVSA | 7 | 5 | 8 | ||||||||||||||
| Siguiri | 12 | 19 | 10 | ||||||||||||||
| Accumulated balances of material non-controlling interests | |||||||||||||||||
| CVSA | 11 | 11 | 14 | ||||||||||||||
| Siguiri | 23 | 41 | 31 | ||||||||||||||
Summarised financial information of subsidiaries is as follows. The information is based on amounts including inter-company balances.
| US Dollars | |||||||||||
| Figures in millions | CVSA | Siguiri | |||||||||
| Statement of profit or loss for 2020 | |||||||||||
| Revenue | 440 | 453 | |||||||||
| Profit (loss) for the year | 84 | 68 | |||||||||
| Total comprehensive income (loss) for the year, net of tax | 84 | 68 | |||||||||
| Attributable to non-controlling interests | 8 | 10 | |||||||||
| Dividends paid to non-controlling interests | (6) | (3) | |||||||||
| Statement of profit or loss for 2019 | |||||||||||
| Revenue | 390 | 349 | |||||||||
| Profit (loss) for the year | 68 | 1 | |||||||||
| Total comprehensive income (loss) for the year, net of tax | 68 | 1 | |||||||||
| Attributable to non-controlling interests | 5 | 0 | |||||||||
| Dividends paid to non-controlling interests | (7) | (9) | |||||||||
| Statement of profit or loss for 2018 | |||||||||||
| Revenue | 498 | 365 | |||||||||
| Profit (loss) for the year | 119 | 56 | |||||||||
| Total comprehensive income (loss) for the year, net of tax | 119 | 56 | |||||||||
| Attributable to non-controlling interests | 9 | 8 | |||||||||
| Dividends paid to non-controlling interests | (7) | (8) | |||||||||
| US Dollars | |||||||||||
| Figures in millions | CVSA | Siguiri | |||||||||
| Statement of profit or loss for 2022 | |||||||||||
| Revenue | 395 | 591 | |||||||||
| Profit (loss) for the year | 101 | 78 | |||||||||
| Total comprehensive income (loss) for the year, net of tax | 101 | 78 | |||||||||
| Attributable to non-controlling interests | 7 | 12 | |||||||||
| Dividends paid to non-controlling interests | (7) | (15) | |||||||||
| Statement of profit or loss for 2021 | |||||||||||
| Revenue | 371 | 546 | |||||||||
| Profit (loss) for the year | 75 | 124 | |||||||||
| Total comprehensive income (loss) for the year, net of tax | 75 | 124 | |||||||||
| Attributable to non-controlling interests | 5 | 19 | |||||||||
| Dividends paid to non-controlling interests | (8) | (8) | |||||||||
| Statement of profit or loss for 2020 | |||||||||||
| Revenue | 440 | 453 | |||||||||
| Profit (loss) for the year | 84 | 68 | |||||||||
| Total comprehensive income (loss) for the year, net of tax | 84 | 68 | |||||||||
| Attributable to non-controlling interests | 8 | 10 | |||||||||
| Dividends paid to non-controlling interests | (6) | (3) | |||||||||
F - 5453
NOTES TO THE CONSOLIDATED FINANCIAL STATEMENTS (continued)
| US Dollars | |||||||||||
| Figures in millions | CVSA | Siguiri | |||||||||
| Statement of financial position as at 31 December 2022 | |||||||||||
| Non-current assets | 256 | 199 | |||||||||
Current assets (1) | 260 | 248 | |||||||||
| Non-current liabilities | (144) | (131) | |||||||||
| Current liabilities | (225) | (165) | |||||||||
| Total equity | 147 | 151 | |||||||||
| Statement of financial position as at 31 December 2021 | |||||||||||
| Non-current assets | 240 | 229 | |||||||||
Current assets(1) | 252 | 234 | |||||||||
| Non-current liabilities | (132) | (68) | |||||||||
| Current liabilities | (218) | (122) | |||||||||
| Total equity | 142 | 273 | |||||||||
| Statement of financial position as at 31 December 2020 | |||||||||||
| Non-current assets | 202 | 233 | |||||||||
Current assets(1) | 254 | 224 | |||||||||
| Non-current liabilities | (123) | (138) | |||||||||
| Current liabilities | (150) | (117) | |||||||||
| Total equity | 183 | 202 | |||||||||
| Statement of cash flows for the year ended 31 December 2022 | |||||||||||
| Cash inflow (outflow) from operating activities | 142 | 140 | |||||||||
| Cash inflow (outflow) from investing activities | (5) | (27) | |||||||||
| Cash inflow (outflow) from financing activities | (94) | (98) | |||||||||
| Net increase (decrease) in cash and cash equivalents | 43 | 15 | |||||||||
| Statement of cash flows for the year ended 31 December 2021 | |||||||||||
| Cash inflow (outflow) from operating activities | 165 | 197 | |||||||||
| Cash inflow (outflow) from investing activities | (23) | (38) | |||||||||
| Cash inflow (outflow) from financing activities | (112) | (143) | |||||||||
| Net increase (decrease) in cash and cash equivalents | 30 | 16 | |||||||||
| Statement of cash flows for the year ended 31 December 2020 | |||||||||||
| Cash inflow (outflow) from operating activities | 169 | 63 | |||||||||
| Cash inflow (outflow) from investing activities | (16) | (30) | |||||||||
| Cash inflow (outflow) from financing activities | (59) | (11) | |||||||||
| Net increase (decrease) in cash and cash equivalents | 94 | 22 | |||||||||
| US Dollars | |||||||||||
| Figures in millions | CVSA | Siguiri | |||||||||
| Statement of financial position as at 31 December 2020 | |||||||||||
| Non-current assets | 202 | 233 | |||||||||
Current assets (1) | 254 | 224 | |||||||||
| Non-current liabilities | (123) | (138) | |||||||||
| Current liabilities | (150) | (117) | |||||||||
| Total equity | 183 | 202 | |||||||||
| Statement of financial position as at 31 December 2019 | |||||||||||
| Non-current assets | 177 | 245 | |||||||||
| Current assets | 202 | 170 | |||||||||
| Non-current liabilities | (120) | (141) | |||||||||
| Current liabilities | (82) | (121) | |||||||||
| Total equity | 177 | 153 | |||||||||
| Statement of financial position as at 31 December 2018 | |||||||||||
| Non-current assets | 176 | 257 | |||||||||
| Current assets | 215 | 157 | |||||||||
| Non-current liabilities | (112) | (64) | |||||||||
| Current liabilities | (78) | (137) | |||||||||
| Total equity | 201 | 213 | |||||||||
| Statement of cash flows for the year ended 31 December 2020 | |||||||||||
| Cash inflow (outflow) from operating activities | 169 | 63 | |||||||||
| Cash inflow (outflow) from investing activities | (16) | (30) | |||||||||
| Cash inflow (outflow) from financing activities | (59) | (11) | |||||||||
| Net increase (decrease) in cash and cash equivalents | 94 | 22 | |||||||||
| Statement of cash flows for the year ended 31 December 2019 | |||||||||||
| Cash inflow (outflow) from operating activities | 107 | 46 | |||||||||
| Cash inflow (outflow) from investing activities | (30) | (22) | |||||||||
| Cash inflow (outflow) from financing activities | (47) | (30) | |||||||||
| Net increase (decrease) in cash and cash equivalents | 30 | (6) | |||||||||
| Statement of cash flows for the year ended 31 December 2018 | |||||||||||
| Cash inflow (outflow) from operating activities | 179 | 84 | |||||||||
| Cash inflow (outflow) from investing activities | (36) | (96) | |||||||||
| Cash inflow (outflow) from financing activities | (140) | (6) | |||||||||
| Net increase (decrease) in cash and cash equivalents | 3 | (18) | |||||||||
(1) CVSA had a cash balance equivalent to $116m (2021: $139m; 2020: $137m), following the payment to AngloGold Ashanti of $137m equivalent as at 31 December 2020,$17m (2021: $19m; 2020: nil) offshore dividends (net of which $50mwithholding taxes). The remaining declared attributable dividend of $120m (2021: $131m; 2020: $50m) is currently eligibleavailable for payment to be declared as dividends. Application hasAngloGold Ashanti's offshore and onshore investment holding companies. Applications have been made to the Argentinean Central Argentine Bank to approve $11mthe payment of this eligible amount$105m (2021: $114m; 2020: $11m) of the offshore declared dividends related to be paid offshore to AngloGold Ashanti. Approvalthe 2019, 2020 and 2021 financial years. While the approval is pending. Thepending, the cash isremains fully available for CVSA’s operational requirements.
F - 5554
| US Dollars | |||||||||||||||||
| Figures in millions | 2020 | 2019 | 2018 | ||||||||||||||
| Carrying value | |||||||||||||||||
| Investments in associates | 47 | 40 | 36 | ||||||||||||||
| Investments in joint ventures | 1,604 | 1,541 | 1,492 | ||||||||||||||
| 1,651 | 1,581 | 1,528 | |||||||||||||||
| US Dollars | |||||||||||||||||
| Figures in millions | 2022 | 2021 | 2020 | ||||||||||||||
| Carrying value | |||||||||||||||||
| Investments in associates | 37 | 43 | 47 | ||||||||||||||
| Investments in joint ventures | 1,063 | 1,604 | 1,604 | ||||||||||||||
| 1,100 | 1,647 | 1,651 | |||||||||||||||
Detailed disclosures are provided for the years in which investments in associates and joint ventures are considered to be material.
Summarised financial information of immaterial associates is as follows:
| US Dollars | |||||||||||||||||
| Figures in millions | 2020 | 2019 | 2018 | ||||||||||||||
| Aggregate statement of profit or loss for associates (attributable) | |||||||||||||||||
| Revenue | 29 | 20 | 19 | ||||||||||||||
Operating (expenses) income (1) | (6) | 3 | (4) | ||||||||||||||
| Taxation | 0 | 0 | (1) | ||||||||||||||
| Profit (loss) for the year | 23 | 23 | 14 | ||||||||||||||
| Total comprehensive profit (loss) for the year, net of tax | 23 | 23 | 14 | ||||||||||||||
| US Dollars | |||||||||||||||||
| Figures in millions | 2022 | 2021 | 2020 | ||||||||||||||
| Aggregate statement of profit or loss for associates (attributable) | |||||||||||||||||
| Revenue | 31 | 36 | 29 | ||||||||||||||
Operating (expenses) income (1) | (14) | (16) | (6) | ||||||||||||||
| Taxation | (3) | (2) | — | ||||||||||||||
| Profit (loss) for the year | 14 | 18 | 23 | ||||||||||||||
| Total comprehensive profit (loss) for the year, net of tax | 14 | 18 | 23 | ||||||||||||||
(1) Includes share of associate profit.
Investments in material joint ventures comprise:
| Name | Effective % | Description | Country of incorporation and operation | ||||||||||||||||||||||||||
| 2020 | 2019 | 2018 | |||||||||||||||||||||||||||
Kibali Goldmines S.A.(1) | 45.0 | 45.0 | 45.0 | Exploration and mine development | The Democratic Republic of the Congo | ||||||||||||||||||||||||
| Name | Effective % | Description | Country of incorporation and operation | ||||||||||||||||||||||||||
| 2022 | 2021 | 2020 | |||||||||||||||||||||||||||
Kibali Goldmines S.A.(1) | 45.0 | 45.0 | 45.0 | Exploration and mine development | The Democratic Republic of the Congo | ||||||||||||||||||||||||
(1)AngloGold Ashanti Limited has a 50% interest in Kibali (Jersey) Limited (Kibali) which holds our effective 45% interest in Kibali Goldmines S.A.
| US Dollars | US Dollars | |||||||||||||||||||||||||||||||||
| Figures in millions | Figures in millions | 2020 | 2019 | 2018 | Figures in millions | 2022 | 2021 | 2020 | ||||||||||||||||||||||||||
| Carrying value of joint ventures | Carrying value of joint ventures | Carrying value of joint ventures | ||||||||||||||||||||||||||||||||
| Kibali | Kibali | 1,604 | 1,506 | 1,439 | Kibali | 1,063 | 1,604 | 1,604 | ||||||||||||||||||||||||||
| Immaterial joint ventures | 0 | 35 | 53 | |||||||||||||||||||||||||||||||
| 1,604 | 1,541 | 1,492 | ||||||||||||||||||||||||||||||||
| Reversal (impairment) of investments in joint ventures | ||||||||||||||||||||||||||||||||||
Sadiola (note 8) (2) | 0 | 6 | 14 | |||||||||||||||||||||||||||||||
| (Impairment) reversal of investments in joint ventures | (Impairment) reversal of investments in joint ventures | |||||||||||||||||||||||||||||||||
| Yatela (note 7) | Yatela (note 7) | (1) | — | — | ||||||||||||||||||||||||||||||
| The cumulative unrecognised share of losses of the joint ventures: | The cumulative unrecognised share of losses of the joint ventures: | |||||||||||||||||||||||||||||||||
| Yatela | Yatela | 2 | 2 | 1 | ||||||||||||||||||||||||||||||
| US Dollars | |||||||||||||||||
| Figures in millions | 2020 | 2019 | 2018 | ||||||||||||||
| The cumulative unrecognised share of losses of the joint ventures: | |||||||||||||||||
Morila (3) | 0 | 8 | 8 | ||||||||||||||
| Yatela | 1 | 2 | 3 | ||||||||||||||
F - 5655
NOTES TO THE CONSOLIDATED FINANCIAL STATEMENTS (continued)
Summarised financial information of the Kibali joint venturesventure is as follows (not attributable)(1):
| US Dollars | |||||||||||||||||
| Figures in millions | 2022 | 2021 | 2020 | ||||||||||||||
| Statement of profit or loss | |||||||||||||||||
| Revenue and other income | 1,329 | 1,470 | 1,443 | ||||||||||||||
| Other operating costs and expenses | (588) | (551) | (541) | ||||||||||||||
| Amortisation of tangible and intangible assets | (208) | (244) | (241) | ||||||||||||||
| Finance costs, unwinding of obligations and cash repatriation fee | (50) | (6) | (6) | ||||||||||||||
| Interest received | 5 | 6 | 7 | ||||||||||||||
| Taxation | (156) | (181) | (157) | ||||||||||||||
| Profit for the year | 332 | 494 | 505 | ||||||||||||||
| Total comprehensive income for the year, net of tax | 332 | 494 | 505 | ||||||||||||||
| Dividends received from joint venture (attributable) | 694 | 231 | 140 | ||||||||||||||
| US Dollars | |||||||||||||||||
| Kibali | |||||||||||||||||
| Figures in millions | 2020 | 2019 | 2018 | ||||||||||||||
| Statement of profit or loss | |||||||||||||||||
| Revenue | 1,443 | 1,123 | 1,098 | ||||||||||||||
| Other operating costs and expenses | (541) | (479) | (539) | ||||||||||||||
| Amortisation of tangible and intangible assets | (241) | (282) | (330) | ||||||||||||||
| Finance costs and unwinding of obligations | (6) | (4) | (4) | ||||||||||||||
| Interest received | 7 | 4 | 3 | ||||||||||||||
| Taxation | (157) | (62) | (16) | ||||||||||||||
| Profit for the year | 505 | 300 | 212 | ||||||||||||||
| Total comprehensive income for the year, net of tax | 505 | 300 | 212 | ||||||||||||||
| Dividends received from joint venture (attributable) | 140 | 75 | 89 | ||||||||||||||
| US Dollars | |||||||||||||||||
| Kibali | |||||||||||||||||
| Figures in millions | 2020 | 2019 | 2018 | ||||||||||||||
| Statement of financial position | |||||||||||||||||
| Non-current assets | 2,459 | 2,522 | 2,659 | ||||||||||||||
| Current assets | 120 | 183 | 205 | ||||||||||||||
Cash and cash equivalents (1) | 944 | 453 | 124 | ||||||||||||||
| Total assets | 3,523 | 3,158 | 2,988 | ||||||||||||||
| Non-current financial liabilities | 50 | 45 | 29 | ||||||||||||||
| Other non-current liabilities | 118 | 26 | 24 | ||||||||||||||
| Current financial liabilities | 15 | 11 | 11 | ||||||||||||||
| Other current liabilities | 106 | 66 | 64 | ||||||||||||||
| Total liabilities | 289 | 148 | 128 | ||||||||||||||
| Net assets | 3,234 | 3,010 | 2,860 | ||||||||||||||
| Group’s share of net assets | 1,617 | 1,505 | 1,430 | ||||||||||||||
| Other | (13) | 1 | 9 | ||||||||||||||
| Carrying amount of interest in joint venture | 1,604 | 1,506 | 1,439 | ||||||||||||||
| US Dollars | |||||||||||||||||
| Figures in millions | 2022 | 2021 | 2020 | ||||||||||||||
| Statement of financial position | |||||||||||||||||
| Non-current assets | 2,420 | 2,361 | 2,459 | ||||||||||||||
| Current assets | 201 | 162 | 120 | ||||||||||||||
Cash and cash equivalents (2) | 92 | 1,115 | 944 | ||||||||||||||
| Total assets | 2,713 | 3,638 | 3,523 | ||||||||||||||
| Non-current financial liabilities | 51 | 44 | 50 | ||||||||||||||
| Other non-current liabilities | 320 | 226 | 118 | ||||||||||||||
| Current financial liabilities | 56 | 14 | 15 | ||||||||||||||
| Other current liabilities | 105 | 107 | 106 | ||||||||||||||
| Total liabilities | 532 | 391 | 289 | ||||||||||||||
| Net assets | 2,181 | 3,247 | 3,234 | ||||||||||||||
| Group’s share of net assets | 1,091 | 1,624 | 1,617 | ||||||||||||||
Other (3) | (28) | (20) | (13) | ||||||||||||||
| Carrying amount of interest in joint venture | 1,063 | 1,604 | 1,604 | ||||||||||||||
(1) At 31 December 2020, the Company’s attributable shareend of January and in early February 2022, Kibali Goldmines S.A., which owns and operates the Kibali gold mine in the Democratic Republic of the outstanding cash balances awaiting repatriationCongo, received fifteen claims from the DRC amountedDirection Générale des Douanes et Accises (“Customs Authority”) concerning customs duties. The Customs Authority claims that incorrect import duty tariffs have been applied to $424m. Barrick Gold Corporation (Barrick), the operatorimportation of certain consumables and equipment for the Kibali joint venture, continuesgold mine. In addition, they claim that the exemption available to engageKibali Goldmines S.A., which was granted in relation to the original mining lease, no longer applies. Finally, the Customs Authority claims that a service fee paid on the exportation of gold was paid to the wrong government body. The claims, including substantial penalties and interest, total $339m* (AngloGold Ashanti attributable share: $153m). Five of these claims, totalling $256m*, have been closed and we await closure minutes, before settling $4.5m*. However, discussions are ongoing on the remaining $83m*, dealing with a 1% service fee on gold sales, which is being claimed by two different departments. Based on discussions with the DRC Government regarding the 2018 Mining Codeminister of finance we anticipate to settle for no more than $8m* and the cash repatriation.therefore a total provision of $12.5m* was raised for these customs matters.
(2)Kibali cash and cash equivalents are subject to various steps before they can be distributed to joint venture shareholders. Cash balances were reduced in 2022 due to repatriations in the form of dividends and repayment of shareholder loans.
(3) Includes amounts relating to additional costs and contributions at acquisition as well as minority interests.
| US Dollars | |||||||||||||||||
| Figures in millions | 2020 | 2019 | 2018 | ||||||||||||||
| Aggregate statement of profit (loss) for immaterial joint ventures (attributable) | |||||||||||||||||
| Revenue | 0 | 111 | 112 | ||||||||||||||
| Other operating costs and expenses | (2) | (94) | (92) | ||||||||||||||
| Amortisation of tangible and intangible assets | 0 | (7) | (15) | ||||||||||||||
| Profit on sale of joint ventures | 19 | 0 | 0 | ||||||||||||||
| Taxation | 0 | (7) | (2) | ||||||||||||||
| Profit (loss) for the year | 17 | 3 | 3 | ||||||||||||||
| Total comprehensive income (loss) for the year, net of tax | 17 | 3 | 3 | ||||||||||||||
F - 56
18 OTHER INVESTMENTS
| US Dollars | |||||||||||||||||
| Figures in millions | 2022 | 2021 | 2020 | ||||||||||||||
Listed investments (1) | |||||||||||||||||
| Non-current investments | |||||||||||||||||
| Equity investments at fair value through OCI (FVTOCI) | |||||||||||||||||
| Balance at beginning of year | 116 | 186 | 72 | ||||||||||||||
| Additions | 16 | 3 | 9 | ||||||||||||||
Capitalised to tangible assets (2) | (80) | — | — | ||||||||||||||
Fair value adjustments (3) | (50) | (73) | 98 | ||||||||||||||
| Transfer from unlisted non-current investments | — | — | 7 | ||||||||||||||
| Balance at end of year | 2 | 116 | 186 | ||||||||||||||
| The non-current equity investments consist of ordinary shares and collective investment schemes and primarily comprise: | |||||||||||||||||
| Corvus Gold Inc. | — | 80 | 59 | ||||||||||||||
| Pure Gold Mining | 1 | 35 | 126 | ||||||||||||||
| Other | 1 | 1 | 1 | ||||||||||||||
| 2 | 116 | 186 | |||||||||||||||
| Book value of listed investments | 2 | 116 | 186 | ||||||||||||||
| Unlisted investments | |||||||||||||||||
| Non-current investments | |||||||||||||||||
| Balance at beginning of year | 1 | 2 | 4 | ||||||||||||||
| Transfer to listed non-current investments | — | — | (7) | ||||||||||||||
| Fair value adjustments - FVTPL | — | (1) | 5 | ||||||||||||||
| Balance at end of year | 1 | 1 | 2 | ||||||||||||||
| The unlisted investments include: | |||||||||||||||||
| Book value of unlisted investments | 1 | 1 | 2 | ||||||||||||||
| Total book value of other investments | 3 | 117 | 188 | ||||||||||||||
(1) The Group’s listed equity investments are susceptible to market price risk arising from uncertainties about the future values of the investments. At the reporting date, the FVTOCI equity investments were listed on the Toronto Stock Exchange.
(2) The19.5% investment held in Corvus Gold Inc.was capitalised to tangible assets on completion of Corvus Gold asset acquisition on 18 January 2022.
(3) Includes net fair value gain of nil (2021: $21m; 2020: $18m) for Corvus Gold Inc. and a fair value loss of $50m (2021: $94m; 2020: $81m net gain) for Pure Gold Mining.
F - 57
19 INVENTORIES
| US Dollars | |||||||||||||||||
| Figures in millions | 2022 | 2021 | 2020 | ||||||||||||||
| Non-current | |||||||||||||||||
| Raw materials - ore stockpiles | 5 | 27 | 69 | ||||||||||||||
| Current | |||||||||||||||||
| Raw materials | |||||||||||||||||
| - ore stockpiles | 225 | 217 | 262 | ||||||||||||||
| - heap-leach inventory | 10 | 6 | 5 | ||||||||||||||
| Work in progress | |||||||||||||||||
| - metals in process | 66 | 49 | 46 | ||||||||||||||
| Finished goods | |||||||||||||||||
| - gold doré/bullion | 51 | 29 | 42 | ||||||||||||||
| - by-products | 2 | 1 | — | ||||||||||||||
| Total metal inventories | 354 | 302 | 355 | ||||||||||||||
| Mine operating supplies | 419 | 401 | 378 | ||||||||||||||
| 773 | 703 | 733 | |||||||||||||||
Total inventories(1) | 778 | 730 | 802 | ||||||||||||||
(1)The amount of the write down of ore stockpiles, heap-leach inventory, metals in process, finished goods and mine operating supplies to net realisable value, and recognised as an expense in cost of sales is $12m (2021: $13m; 2020: $7m)
.
20 TRADE, OTHER RECEIVABLES AND OTHER ASSETS
| US Dollars | |||||||||||||||||
| Figures in millions | 2022 | 2021 | 2020 | ||||||||||||||
| Non-current | |||||||||||||||||
| Deferred compensation asset | 12 | 25 | 28 | ||||||||||||||
| Prepayments | 19 | 14 | 12 | ||||||||||||||
Recoverable tax, rebates, levies and duties (1) | 200 | 198 | 195 | ||||||||||||||
| 231 | 237 | 235 | |||||||||||||||
| Current | |||||||||||||||||
| Trade and loan receivables | 20 | 50 | 56 | ||||||||||||||
| Prepayments | 58 | 41 | 56 | ||||||||||||||
Recoverable tax, rebates, levies and duties (1) | 148 | 155 | 100 | ||||||||||||||
| Other receivables | 11 | 14 | 17 | ||||||||||||||
| 237 | 260 | 229 | |||||||||||||||
| Total trade, other receivables and other assets | 468 | 497 | 464 | ||||||||||||||
| There is a concentration of risk in respect of amounts due from Revenue Authorities for recoverable tax, rebates, levies and duties from subsidiaries in the Africa Region segment. These values are summarised as follows: | |||||||||||||||||
| Recoverable value added tax | 231 | 212 | 215 | ||||||||||||||
| Appeal deposits | 43 | 43 | 34 | ||||||||||||||
(1) Includes taxation asset, refer note 29.
| US Dollars | |||||||||||||||||
| Figures in millions | 2020 | 2019 | 2018 | ||||||||||||||
Listed investments (1) | |||||||||||||||||
| Non-current investments | |||||||||||||||||
| Equity investments at fair value through profit and loss (FVTPL) | |||||||||||||||||
| Balance at end of year | 0 | 0 | 19 | ||||||||||||||
| Equity investments at fair value though OCI (FVTOCI) | |||||||||||||||||
| Balance at beginning of year | 72 | 63 | 47 | ||||||||||||||
| Additions | 9 | 9 | 13 | ||||||||||||||
| Disposals | 0 | 0 | (7) | ||||||||||||||
| Fair value adjustments | 98 | 0 | 10 | ||||||||||||||
| Transfer from unlisted non-current investments | 7 | 0 | 0 | ||||||||||||||
| Balance at end of year | 186 | 72 | 63 | ||||||||||||||
| The non-current equity investments consist of ordinary shares and collective investment schemes and primarily comprise: | |||||||||||||||||
| Corvus Gold Corporation | 59 | 41 | 43 | ||||||||||||||
| Various listed investments held by Environmental Rehabilitation Trust Fund | 0 | 0 | 16 | ||||||||||||||
| Pure Gold Mining | 126 | 31 | 18 | ||||||||||||||
| Other | 1 | 0 | 5 | ||||||||||||||
| 186 | 72 | 82 | |||||||||||||||
F - 58
20 OTHER INVESTMENTS (continued)
| US Dollars | |||||||||||||||||
| Figures in millions | 2020 | 2019 | 2018 | ||||||||||||||
| Listed investments (continued) | |||||||||||||||||
| Non-current investments (continued) | |||||||||||||||||
| Investments at amortised cost - Non-current | |||||||||||||||||
| Balance at end of year | 0 | 0 | 12 | ||||||||||||||
| Current investments | |||||||||||||||||
Listed investments - FVTOCI (1) (2) | 0 | 10 | 6 | ||||||||||||||
| Book value of listed investments | 186 | 82 | 100 | ||||||||||||||
| Unlisted investments | |||||||||||||||||
| Non-current investments | |||||||||||||||||
| Balance at beginning of year | 4 | 47 | 54 | ||||||||||||||
| Additions | 0 | 45 | 48 | ||||||||||||||
| Maturities | 0 | (44) | (45) | ||||||||||||||
| Transfer to non-current assets and liabilities held for sale | 0 | (48) | 0 | ||||||||||||||
| Transfer to listed non-current investments | (7) | 0 | 0 | ||||||||||||||
| Fair value adjustment - FVTOCI | 0 | 2 | 0 | ||||||||||||||
| Fair value adjustments - FVTPL | 5 | 0 | 0 | ||||||||||||||
| Other | 0 | 0 | (2) | ||||||||||||||
| Translation | 0 | 2 | (8) | ||||||||||||||
| Balance at end of year | 2 | 4 | 47 | ||||||||||||||
| The unlisted investments include: | |||||||||||||||||
| Book value of unlisted investments | 2 | 4 | 47 | ||||||||||||||
| Non-current other investments | 188 | 76 | 141 | ||||||||||||||
| Total book value of other investments | 188 | 86 | 147 | ||||||||||||||
| US Dollars | |||||||||||||||||
| Figures in millions | 2020 | 2019 | 2018 | ||||||||||||||
| Non-current | |||||||||||||||||
| Raw materials - ore stockpiles | 69 | 93 | 106 | ||||||||||||||
| Current | |||||||||||||||||
| Raw materials | |||||||||||||||||
| - ore stockpiles | 262 | 229 | 251 | ||||||||||||||
| - heap-leach inventory | 5 | 4 | 3 | ||||||||||||||
| Work in progress | |||||||||||||||||
| - metals in process | 46 | 51 | 44 | ||||||||||||||
| Finished goods | |||||||||||||||||
| - gold doré/bullion | 42 | 42 | 57 | ||||||||||||||
| - by-products | 0 | 1 | 0 | ||||||||||||||
| Total metal inventories | 355 | 327 | 355 | ||||||||||||||
| Mine operating supplies | 378 | 305 | 297 | ||||||||||||||
| 733 | 632 | 652 | |||||||||||||||
Total inventories(1) | 802 | 725 | 758 | ||||||||||||||
| US Dollars | |||||||||||||||||
| Figures in millions | 2020 | 2019 | 2018 | ||||||||||||||
| Non-current | |||||||||||||||||
| Deferred compensation asset | 28 | 0 | 0 | ||||||||||||||
| Prepayments | 12 | 15 | 18 | ||||||||||||||
| Recoverable tax, rebates, levies and duties | 195 | 107 | 84 | ||||||||||||||
| 235 | 122 | 102 | |||||||||||||||
| Current | |||||||||||||||||
| Trade and loan receivables | 56 | 47 | 33 | ||||||||||||||
| Prepayments | 56 | 61 | 42 | ||||||||||||||
Recoverable tax, rebates, levies and duties (1) | 100 | 130 | 116 | ||||||||||||||
| Other receivables | 17 | 12 | 18 | ||||||||||||||
| 229 | 250 | 209 | |||||||||||||||
| Total trade, other receivables and other assets | 464 | 372 | 311 | ||||||||||||||
| There is a concentration of risk in respect of amounts due from Revenue Authorities for recoverable tax, rebates, levies and duties from subsidiaries in the Africa Region segment. These values are summarised as follows: | |||||||||||||||||
| Recoverable value added tax | 215 | 167 | 126 | ||||||||||||||
Recoverable fuel duties(2) | 0 | 43 | 41 | ||||||||||||||
| Appeal deposits | 34 | 10 | 10 | ||||||||||||||
Geita Gold Mine
Geita Gold Mine (GGM) in Tanzania net indirect tax receivables balance increased by $20m$11m to $139m (2019: $119m; 2018: $84m)$153m (2021: $142m; 2020: $139m).
Claims relating to periods from August 2021 totalling $45m were offset against provisional tax payments in 2022. Offset against provisional corporate tax payments amounted to $54m in 2021. No refunds were received in cash or offset against provisional corporate tax payments were made in the current year. Claims relating to periods pre-July 2017 totalling $9m were2020. Amounts offset against provisional corporate tax payments in 2019. Amounts set off against VAT claims have been certified by an external advisor and verified by the Tanzania Revenue Authority (“TRA”)(TRA). The TRA acknowledged the majority of the offsets during December 2019. The remaining disputed balance relating to the period July 2017 to June 2020 was objected to as GGM believe that the claims have been correctly lodged pursuant to Tanzanian law.
An amendment, effective 20 July 2017, to Tanzania's mining legislation included an amendment to the Value Added Tax Act, 2014 (No. 5) (2015 VAT Act) to the effect that no input tax credit can be claimed for the exportation of “raw minerals”. The Written Laws (Miscellaneous Amendments) (No. 2) Act, 2019,, issued during 2019, provides a definition for "raw minerals". However, GGM has received notices from the TRA that they are not eligible for VAT relief from July 2017 onwards on the basis that all production constitutes “raw minerals” for this purpose.
The basis for dispute of the disqualifications is on the interpretation of the legislation. Management's view is the definition of "raw minerals" provided in the Written Laws (Miscellaneous Amendments) (No. 2) Act.Act, 2019 excludes gold doré. Gold bearing ore is mined from the open pit and underground mining operations, where it is further crushed and milled to maximise the gold recovery process, producing gold doré exceeding 80% purity as well as beneficiated products (concentrate). On this basis the mined doré and concentrate do not constitute “raw minerals” and accordingly the VAT claims are valid. Management have obtained a legal opinionopinions that supportssupport management's view that doré does not constitute a “raw mineral”.
The Finance Act 2020 became effective on 1 July 2020. The Finance Act amended the VAT Act by deleting the disqualification of VAT refunds due to the exportation of “raw minerals”. The deletion is intended to ensure the recovery of VAT refunds from July 2020, although the amendment cannot be applied retrospectively, itthe change in the VAT Act, together with the Written Laws (Miscellaneous Amendments) (No.2) Act 2019, confirms that doré bars are not “raw minerals” and that VAT refunds from July 2017 onwards are due to GGM. On 30 January 2021, management received a proposal from the TRA to settle VAT objections filed between 2017 and 2020, confirming the TRA's position to disqualify all VAT refunds requested by GGM for the period from July 2017 to June 2020. Management is not in agreement with the proposal and will pursueare pursuing legal remedies provided to taxpayers by Tanzanian law.law, as well as working with the TRA towards an agreement to resolve these matters.
The total VAT claims submitted from July 2017 to June 2020 amount to $164m (of the total, $25m$155m (net of claims were submitted in 2020)foreign exchange revaluations). All disqualifications received from the TRA have been objected to by GGM in accordance with the provisions and time frames set out in the Tax Administration Act, 2015 (No.10). Claims of $27m$64m (2021: $50m; 2020 $52m) were submitted between July 2020to the TRA and December 2020, taking the total claims amount to $191m.$203m (net of offsets and foreign exchange revaluations). The net indirect tax receivable at 31 December 20202022 of $139m,$153m, reflects a probability weighted scenario model of the discounting effects applied to the timing of when GGM expects to offset its indirect tax claims against future income taxes of GGM.
On 4 September 2018, a decree was published by the Argentinian Government, which reintroduced export duties for products exported from Argentina. The export duty rate was 12% on the freight on board (FOB) value of goods exported, including gold, paid in country. The duty was limited so as not to exceed ARS $4 for each US dollar exported. On 14 December 2019, the Government of Argentina announced that the cap of ARS $4 for each US dollar exported, would be replaced by a flat rate of 12% for 2020. On 2 October 2020, the Government of Argentina extended the export duties until 31 December 2021, at a rate of 8% for gold bullion. On 31 December 2021, the Government of Argentina extended the export duties until 31 December 2023, at a rate of 8% for gold bullion. In terms of the Stability Agreement between CVSA and the Government of Argentina, CVSA has a right of refund or offset of these amounts paid as established by its Stability Agreement, which provides for a 30% taxation cap on annual taxes and duties paid by CVSA. Export duty refunds for the years 2018 to 2022 are outstanding as at 31 December 2022 and their fair value has been estimated using a probability weighted scenario model considering various recovery time frames, estimated Argentina Peso to USD exchange rates and discounting using a country risk adjusted rate. As a result of the taxation cap, net export duty receivables amount to $23m (2019: $25m).$9m (2021: $19m; 2020 $23m), and reflects the discounting effects applied to when CVSA expects refund of these receivables.
F - 59
21 CASH RESTRICTED FOR USE
| US Dollars | |||||||||||||||||
| Figures in millions | 2022 | 2021 | 2020 | ||||||||||||||
| Non-current | |||||||||||||||||
Cash restricted for environmental and rehabilitation obligations (1) | 33 | 32 | 31 | ||||||||||||||
| Current | |||||||||||||||||
Cash restricted by prudential solvency requirements (2) | 18 | 18 | 24 | ||||||||||||||
Cash balances held by - joint operations (3) | 9 | 8 | 18 | ||||||||||||||
| 27 | 26 | 42 | |||||||||||||||
| Total cash restricted for use (note 33 and 34) | 60 | 58 | 73 | ||||||||||||||
(1) Reclamation bonds provided to the Environmental Protection Agency in Ghana for environmental and rehabilitation obligations.
(2) Cash held by the Group's captive insurance company to maintain the solvency capital requirement.
(3) Cash held by joint operations for use within those entities only.
F - 60
22 CASH AND CASH EQUIVALENTS
| US Dollars | |||||||||||||||||
| Figures in millions | 2022 | 2021 | 2020 | ||||||||||||||
| Cash and deposits on call | 870 | 712 | 1,081 | ||||||||||||||
| Money market instruments | 238 | 442 | 249 | ||||||||||||||
| Total cash and cash equivalents (note 33 and note 34) | 1,108 | 1,154 | 1,330 | ||||||||||||||
23 CASH RESTRICTED FOR USESHARE CAPITAL AND PREMIUM
| US Dollars | |||||||||||||||||
| Figures in millions | 2022 | 2021 | 2020 | ||||||||||||||
| Share capital | |||||||||||||||||
Authorised (1) | |||||||||||||||||
| 600,000,000 ordinary shares of 25 SA cents each | 23 | 23 | 23 | ||||||||||||||
| Issued and fully paid | |||||||||||||||||
| 418,600,473 (2021: 417,501,452; 2020: 416,890,087) ordinary shares of 25 SA cents each | 17 | 17 | 17 | ||||||||||||||
| Share premium | |||||||||||||||||
| Balance at beginning of year | 7,206 | 7,250 | 7,235 | ||||||||||||||
| Ordinary shares issued - share premium | 16 | 9 | 15 | ||||||||||||||
Preference shares redeemed(1) | — | (53) | — | ||||||||||||||
| 7,222 | 7,206 | 7,250 | |||||||||||||||
| Less: held within the Group | |||||||||||||||||
Redeemable preference shares(1) | (53) | ||||||||||||||||
| Balance at end of year | 7,222 | 7,206 | 7,197 | ||||||||||||||
| Share capital and premium | 7,239 | 7,223 | 7,214 | ||||||||||||||
| US Dollars | |||||||||||||||||
| Figures in millions | 2020 | 2019 | 2018 | ||||||||||||||
| Non-current | 31 | 31 | 35 | ||||||||||||||
| Current | |||||||||||||||||
| Cash restricted by prudential solvency requirements and other | 24 | 27 | 24 | ||||||||||||||
| Cash balances held by the Tropicana - joint operation | 18 | 6 | 7 | ||||||||||||||
| 42 | 33 | 31 | |||||||||||||||
| Total cash restricted for use (note 35 and 36) | 73 | 64 | 66 | ||||||||||||||
(1) During December 2021 the A and B redeemable preference shares were redeemed and the preference share certificates cancelled.
All redeemable preference shares were removed from authorised share capital at the Annual General Meeting held on 16 May 2022.
F - 61
24 CASH AND CASH EQUIVALENTSBORROWINGS
| US Dollars | |||||||||||||||||
| Figures in millions | 2022 | 2021 | 2020 | ||||||||||||||
| Non-current | |||||||||||||||||
| Unsecured | |||||||||||||||||
| Debt carried at amortised cost | |||||||||||||||||
| Rated bonds - issued October 2021 | 745 | 744 | — | ||||||||||||||
| Semi-annual coupons are paid at 3.375% per annum on the $750m 7-year bonds. The bonds were issued on 22 October 2021, are repayable on 1 November 2028. | |||||||||||||||||
| Rated bonds - issued October 2020 | 694 | 693 | 692 | ||||||||||||||
| Semi-annual coupons are paid at 3.75% per annum on $700m 10-year bonds. The bonds were issued on 1 October 2020, are repayable on 1 October 2030. | |||||||||||||||||
| Rated bonds - issued April 2010 | 296 | 296 | 295 | ||||||||||||||
| Semi-annual coupons are paid at 6.5% per annum on $300m 30-year bonds. The $300m bonds are repayable in April 2040. | |||||||||||||||||
| Rated bonds - issued July 2012 | — | — | 764 | ||||||||||||||
| Semi-annual coupons were paid at 5.125% per annum on the $750m 10-year bonds. The bonds were issued on 30 July 2012 and were repaid during October 2021 and November 2021. | |||||||||||||||||
| Multi-currency syndicated revolving credit facility ($1.4bn multi-currency RCF) | 31 | — | |||||||||||||||
| The Facility consisted of a US dollar-based facility with interest charged at a margin of 1.45% above LIBOR and an Australian dollar-based facility capped at $500m with a margin of 1.45% above BBSY. The applicable margin was subject to a ratings grid. The facility was issued on 23 October 2018 and was repaid and cancelled on 9 June 2022. | |||||||||||||||||
| Multi-currency syndicated revolving credit facility ($1.4bn multi-currency RCF) - 2022 | 30 | ||||||||||||||||
| This facility was entered into on 9 June 2022 and consists of a US dollar- based facility with interest charged at a margin of 1.45% above SOFR plus a credit adjustment spread and an Australian dollar-based facility capped at $500m with a margin of 1.45% above BBSY. The applicable margin is subject to a ratings grid. The facility is available until 9 June 2027, with the option on application to extend by two years. | |||||||||||||||||
| Siguiri revolving credit facility ($65m) | — | 35 | 67 | ||||||||||||||
| Interest paid at 8.5% above LIBOR. The facility was issued on 23 August 2016, extended to 3 August 2022 and repaid and cancelled. | |||||||||||||||||
| Siguiri revolving credit facility ($65m) - 2022 | 67 | ||||||||||||||||
| Interest paid at 8% above term SOFR. The facility was issued on 13 October 2022 and is available until 13 October 2025. | |||||||||||||||||
| Geita revolving credit facility ($150m) | 113 | ||||||||||||||||
| Multi-currency RCF consisting of a Tanzanian shilling component which was capped at the equivalent of US$45m. Interest on this component was paid at 12.5%. Interest on the remaining USD component was paid at LIBOR plus 6.7%. The facility was cancelled during December 2021. | |||||||||||||||||
| Geita revolving credit facility ($150m) - 2021 | 151 | 110 | |||||||||||||||
| A multi-currency RCF was entered into during December 2021, consisting of a Tanzanian shilling component which is capped at the equivalent of US$87m. This component bears interest at 12.5%. The remaining USD component of the facility bears interest at LIBOR plus 6.7%. The facility matures either in August 2024 or December 2024 depending on the fulfilment of certain conditions in the facility agreement. | |||||||||||||||||
| Total borrowings (note 33) | 1,983 | 1,909 | 1,931 | ||||||||||||||
| Current portion of borrowings (note 34) | (18) | (51) | (142) | ||||||||||||||
| Total non-current borrowings (note 34) | 1,965 | 1,858 | 1,789 | ||||||||||||||
| US Dollars | |||||||||||||||||
| Figures in millions | 2020 | 2019 | 2018 | ||||||||||||||
| Cash and deposits on call | 1,081 | 417 | 312 | ||||||||||||||
| Money market instruments | 249 | 39 | 17 | ||||||||||||||
| Total cash and cash equivalents (notes 35 and note 36) | 1,330 | 456 | 329 | ||||||||||||||
| US Dollars | |||||||||||||||||
| Figures in millions | 2020 | 2019 | 2018 | ||||||||||||||
| Share capital | |||||||||||||||||
| Authorised | |||||||||||||||||
| 600,000,000 ordinary shares of 25 SA cents each | 23 | 23 | 23 | ||||||||||||||
| 2,000,000 A redeemable preference shares of 50 SA cents each | 0 | 0 | 0 | ||||||||||||||
| 5,000,000 B redeemable preference shares of 1 SA cent each | 0 | 0 | 0 | ||||||||||||||
| 30,000,000 C redeemable preference shares of 0 par value | 0 | 0 | 0 | ||||||||||||||
| 23 | 23 | 23 | |||||||||||||||
| Issued and fully paid | |||||||||||||||||
| 416,890,087 (2019: 415,301,215; 2018: 412,769,980) ordinary shares of 25 SA cents each | 17 | 17 | 16 | ||||||||||||||
| 2,000,000 A redeemable preference shares of 50 SA cents each | 0 | 0 | 0 | ||||||||||||||
| 778,896 B redeemable preference shares of 1 SA cent each | 0 | 0 | 0 | ||||||||||||||
| 17 | 17 | 16 | |||||||||||||||
| Treasury shares held within the group: | |||||||||||||||||
| 2,778,896 A and B redeemable preference shares | 0 | 0 | 0 | ||||||||||||||
| 17 | 17 | 16 | |||||||||||||||
| Share premium | |||||||||||||||||
| Balance at beginning of year | 7,235 | 7,208 | 7,171 | ||||||||||||||
| Ordinary shares issued - share premium | 15 | 27 | 37 | ||||||||||||||
| 7,250 | 7,235 | 7,208 | |||||||||||||||
| Less: held within the group | |||||||||||||||||
| Redeemable preference shares | (53) | (53) | (53) | ||||||||||||||
| Balance at end of year | 7,197 | 7,182 | 7,155 | ||||||||||||||
| Share capital and premium | 7,214 | 7,199 | 7,171 | ||||||||||||||
F - 62
| US Dollars | |||||||||||||||||
| Figures in millions | 2022 | 2021 | 2020 | ||||||||||||||
| Amounts falling due | |||||||||||||||||
| Within one year | 18 | 51 | 142 | ||||||||||||||
| Between one and two years | 149 | 31 | 812 | ||||||||||||||
| Between two and five years | 102 | 110 | — | ||||||||||||||
| After five years | 1,714 | 1,717 | 977 | ||||||||||||||
| (note 33) | 1,983 | 1,909 | 1,931 | ||||||||||||||
IBOR linked borrowings
| US Dollars | |||||||||||||||||
| Figures in millions | 2020 | 2019 | 2018 | ||||||||||||||
| Non-current | |||||||||||||||||
| Unsecured | |||||||||||||||||
| Debt carried at amortised cost | |||||||||||||||||
| Rated bonds - issued July 2012 | 764 | 762 | 761 | ||||||||||||||
| Semi-annual coupons are paid at 5.125% per annum. The bonds were issued on 30 July 2012, are repayable on 1 August 2022 and are US dollar-based. | |||||||||||||||||
| Rated bonds - issued April 2010 | 295 | 1,003 | 1,002 | ||||||||||||||
| Semi-annual coupons are paid at 5.375% per annum on $700m 10-year bonds and at 6.5% per annum on $300m 30-year bonds. The $700m were repaid on 15 April 2020 and the $300m bonds are repayable in April 2040. The bonds are US dollar-based. | |||||||||||||||||
| Rated bonds - issued October 2020 | 692 | 0 | 0 | ||||||||||||||
| Semi-annual coupons are paid at 3.75% per annum. The bonds were issued on 1 October 2020, are repayable on 1 October 2030 and are US dollar-based. | |||||||||||||||||
| Multi-currency syndicated revolving credit facility ($1.4bn multi-currency RCF) | 0 | 15 | 0 | ||||||||||||||
| The Facility consists of a US dollar based facility with interest charged at a margin of 1.45% above LIBOR and an Australian dollar based facility capped at $500m with a margin of 1.45% above BBSY. The applicable margin is subject to a ratings grid. The facility was issued on 23 October 2018 and is available until 23 October 2023. | |||||||||||||||||
| Syndicated loan facility (R1.4bn) | 0 | 0 | 28 | ||||||||||||||
| Quarterly interest paid at JIBAR plus 1.65% per annum. The facility was issued on 7 July 2015 and was cancelled on 19 February 2020.The loan is SA rand-based. | |||||||||||||||||
| Syndicated loan facility (R1bn) | 0 | 72 | 35 | ||||||||||||||
| Quarterly interest paid at JIBAR plus 1.3% per annum. The facility was issued on 3 November 2017. During 2020 the facility was fully repaid and voluntarily cancelled on 11 November 2020. The loan was SA rand-based. | |||||||||||||||||
| Siguiri revolving credit facilities ($65m) | 67 | 67 | 0 | ||||||||||||||
| Interest paid at 8.5% above LIBOR. The facility was issued on 23 August 2016, and is available until 3 May 2022 and is US dollar-based. | |||||||||||||||||
| Geita revolving credit facility ($150m) | 113 | 114 | 60 | ||||||||||||||
| Multi-currency RCF consisting of Tanzanian shilling component which is capped at the equivalent of US$45m. This component bears interest at 12.5%. The remaining USD component of the facility bears interest at LIBOR plus 6.7% The facility matures on 22 June 2021. | |||||||||||||||||
| Revolving credit facilities ($100m) | 0 | 0 | 103 | ||||||||||||||
| During 2019 the loans were refinanced and included in the Geita and Siguiri revolving credit facilities. | |||||||||||||||||
| Secured | |||||||||||||||||
Finance leases (1) | 0 | 0 | 57 | ||||||||||||||
The table below provides further detail on revolving credit facilities (RCFs) which reference LIBOR. At 31 December 2022, this facility had yet to transfer to an alternative benchmark rate:
| Figures in millions - US Dollar | Carrying value at 31 December 2022 | Repayable within one year | Repayable between one and two years | ||||||||
Geita revolving credit facility ($150m) (1) | 63 | — | 63 | ||||||||
(1) The Geita RCF consists of a Tanzanian shilling component which is capped at the equivalent of US$87m and this component bears interest at 12.5%. The remaining component bears interest at LIBOR plus 6.7%. The Facility was fully drawn at 31 December 2022. The Geita RCF facility matures either in August 2024 or December 2024 depending on the fulfilment of certain conditions in the facility agreement.
F - 63
NOTES TO THE CONSOLIDATED FINANCIAL STATEMENTS (continued)
| US Dollars | |||||||||||||||||
| Figures in millions | 2020 | 2019 | 2018 | ||||||||||||||
| Other | 0 | 0 | 4 | ||||||||||||||
| Total borrowings (note 35) | 1,931 | 2,033 | 2,050 | ||||||||||||||
| Current portion of borrowings (note 36) | (142) | (734) | (139) | ||||||||||||||
| Total non-current borrowings (note 36) | 1,789 | 1,299 | 1,911 | ||||||||||||||
| Amounts falling due | |||||||||||||||||
| Within one year | 142 | 734 | 139 | ||||||||||||||
| Between one and two years | 812 | 110 | 734 | ||||||||||||||
| Between two and five years | 0 | 898 | 860 | ||||||||||||||
| After five years | 977 | 291 | 317 | ||||||||||||||
| (note 35) | 1,931 | 2,033 | 2,050 | ||||||||||||||
| BORROWINGS continued | |||||||||||||||||
| US Dollars | |||||||||||||||||
| Figures in millions | 2022 | 2021 | 2020 | ||||||||||||||
| Currency | |||||||||||||||||
| The currencies in which the borrowings are denominated are as follows: | |||||||||||||||||
| US dollar | 1,858 | 1,829 | 1,884 | ||||||||||||||
| Australian dollar | 37 | 33 | — | ||||||||||||||
| SA rand | — | — | — | ||||||||||||||
| Tanzanian shillings | 88 | 47 | 47 | ||||||||||||||
| (notes 33) | 1,983 | 1,909 | 1,931 | ||||||||||||||
| Undrawn facilities | |||||||||||||||||
| Undrawn borrowing facilities as at 31 December are as follows: | |||||||||||||||||
| FirstRand Bank Limited (R150m; 2021: R150m; 2020: R500m) - SA rand | 9 | 10 | 34 | ||||||||||||||
| Multi currency syndicated revolving credit facility ($1.4bn) - US Dollar | 1,362 | 1,367 | 1,400 | ||||||||||||||
| Geita Revolving credit facility - $150m - US dollar / Tanzanian shilling | — | 40 | 41 | ||||||||||||||
| Siguiri Revolving credit facility - $65m - US dollar | — | 30 | — | ||||||||||||||
| 1,371 | 1,447 | 1,475 | |||||||||||||||
| Change in liabilities arising from financing activities: | |||||||||||||||||
Reconciliation of borrowings (excluding lease liabilities) (1) | |||||||||||||||||
| A reconciliation of the total borrowings included in the statement of financial position is set out in the following table: | |||||||||||||||||
| Opening balance | 1,909 | 1,931 | 2,033 | ||||||||||||||
| Proceeds from borrowings | 266 | 822 | 2,226 | ||||||||||||||
| Repayment of borrowings | (184) | (820) | (2,310) | ||||||||||||||
| Finance costs paid on borrowings | (89) | (115) | (114) | ||||||||||||||
| Deferred loan fees | (8) | (4) | 4 | ||||||||||||||
| Other borrowing fees | — | (11) | (15) | ||||||||||||||
| Interest charged to the income statement | 97 | 106 | 115 | ||||||||||||||
| Translation | (8) | — | (8) | ||||||||||||||
| Closing balance | 1,983 | 1,909 | 1,931 | ||||||||||||||
| Reconciliation of finance costs paid: | |||||||||||||||||
| A reconciliation of the finance cost paid included in the statement of cash flows is set out in the following table: | |||||||||||||||||
| Finance costs paid on borrowings | 89 | 115 | 114 | ||||||||||||||
| Capitalised finance cost | (2) | (14) | (17) | ||||||||||||||
| Commitment fees, utilisation fees and other borrowing costs | 12 | 10 | 13 | ||||||||||||||
| Total finance costs paid | 99 | 111 | 110 | ||||||||||||||
(1) The Finance leases have been included in the lease liabilities from 1 January 2019 (refer to note 16).
| Figures in millions | Carrying value at 31 December 2020 | Repayable within one year | Repayable within one to two years | ||||||||
| Siguiri revolving credit facility ($65m) | 67 | 2 | 65 | ||||||||
Geita revolving credit facility ($105m) (1) | 67 | 67 | 0 | ||||||||
Multi-currency syndicated revolving credit facility ($1.4bn multi-currency RCF) (2) | 0 | 0 | 0 | ||||||||
| US Dollars | |||||||||||||||||
| Figures in millions | 2020 | 2019 | 2018 | ||||||||||||||
| Currency | |||||||||||||||||
| The currencies in which the borrowings are denominated are as follows: | |||||||||||||||||
| US dollar | 1,884 | 1,893 | 1,896 | ||||||||||||||
| Australian dollar | 0 | 21 | 48 | ||||||||||||||
| SA rand | 0 | 72 | 75 | ||||||||||||||
| Tanzanian shillings | 47 | 47 | 29 | ||||||||||||||
| Brazilian real | 0 | 0 | 2 | ||||||||||||||
| (notes 35) | 1,931 | 2,033 | 2,050 | ||||||||||||||
| Undrawn facilities | |||||||||||||||||
| Undrawn borrowing facilities as at 31 December are as follows: | |||||||||||||||||
Syndicated revolving credit facility (R2.5bn) - SA rand (1) | 179 | 174 | |||||||||||||||
Syndicated revolving credit facility (R1.4bn) - SA rand (2) | 100 | 70 | |||||||||||||||
| FirstRand Bank Limited (R500m; 2019 & 2018: R750m) - SA rand | 34 | 54 | 52 | ||||||||||||||
Revolving credit facility (R1bn) - SA rand(3) | 0 | 35 | |||||||||||||||
| Multi currency syndicated revolving credit facility ($1.4bn) - US Dollar | 1,400 | 1,379 | 1,400 | ||||||||||||||
| Revolving credit facility - $150m | 41 | 40 | 57 | ||||||||||||||
| 1,475 | 1,752 | 1,788 | |||||||||||||||
| Change in liabilities arising from financing activities: | |||||||||||||||||
Reconciliation of borrowings (excluding lease liabilities) (4): | |||||||||||||||||
| A reconciliation of the total borrowings included in the statement of financial position is set out in the following table: | |||||||||||||||||
| Opening balance | 2,033 | 2,050 | 2,268 | ||||||||||||||
| Proceeds from borrowings | 2,226 | 168 | 753 | ||||||||||||||
| Repayment of borrowings | (2,310) | (123) | (967) | ||||||||||||||
| Finance costs paid on borrowings | (114) | (122) | (117) | ||||||||||||||
| Deferred loan fees | 4 | (7) | 0 | ||||||||||||||
| Other borrowing fees | (15) | ||||||||||||||||
| Interest charged to the income statement | 115 | 127 | 127 | ||||||||||||||
| Reclassification of finance leases to lease liabilities | 0 | (60) | 0 | ||||||||||||||
| Translation | (8) | 0 | (14) | ||||||||||||||
| Closing balance | 1,931 | 2,033 | 2,050 | ||||||||||||||
| Reconciliation of finance costs paid: | |||||||||||||||||
| A reconciliation of the finance cost paid included in the statement of cash flows is set out in the following table: | |||||||||||||||||
| Finance costs paid on borrowings | 114 | 122 | 117 | ||||||||||||||
| Capitalised finance cost | (17) | (6) | 0 | ||||||||||||||
| Commitment fees, utilisation fees and other borrowing costs | 13 | 12 | 13 | ||||||||||||||
| Total finance costs paid | 110 | 128 | 130 | ||||||||||||||
F - 6564
| US Dollars | |||||||||||||||||
| Figures in millions | 2022 | 2021 | 2020 | ||||||||||||||
| Environmental rehabilitation obligations | |||||||||||||||||
| Provision for decommissioning | |||||||||||||||||
| Balance at beginning of year | 215 | 219 | 196 | ||||||||||||||
| Charge to income statement | — | 3 | — | ||||||||||||||
Change in estimates(1) | (55) | (8) | 17 | ||||||||||||||
| Unwinding of decommissioning obligation | 5 | 3 | 2 | ||||||||||||||
| Translation | (3) | (2) | 4 | ||||||||||||||
| Balance at end of year | 162 | 215 | 219 | ||||||||||||||
| Provision for restoration | |||||||||||||||||
| Balance at beginning of year | 458 | 440 | 423 | ||||||||||||||
| Charge to income statement | (8) | (3) | 2 | ||||||||||||||
Change in estimates(1) | (36) | 29 | 15 | ||||||||||||||
| Additions | 2 | — | — | ||||||||||||||
| Unwinding of restoration obligation | 12 | 6 | 4 | ||||||||||||||
| Utilised during the year | (8) | (10) | (11) | ||||||||||||||
| Translation | (4) | (4) | 7 | ||||||||||||||
| Balance at end of year | 416 | 458 | 440 | ||||||||||||||
| Provision for silicosis | |||||||||||||||||
| Balance at beginning of year | 34 | 49 | 54 | ||||||||||||||
| Change in estimates | (1) | 1 | 4 | ||||||||||||||
| Transfer (to) from short term provisions included in trade, other payables and provisions | 2 | (5) | (1) | ||||||||||||||
| Unwinding of silicosis provision | 3 | 3 | 4 | ||||||||||||||
| Utilised during the year | (15) | (10) | (9) | ||||||||||||||
| Translation | — | (4) | (3) | ||||||||||||||
| Balance at end of year | 23 | 34 | 49 | ||||||||||||||
Other provisions(2) | |||||||||||||||||
| Balance at beginning of year | 22 | 23 | 24 | ||||||||||||||
| Charge to income statement | 20 | 14 | 12 | ||||||||||||||
| Change in estimates | 2 | — | 1 | ||||||||||||||
| Transfer (to) from short term provisions included in trade, other payables and provisions | (5) | (7) | 3 | ||||||||||||||
| Utilised during the year | (6) | (6) | (13) | ||||||||||||||
| Translation | — | (2) | (4) | ||||||||||||||
| Balance at end of year | 33 | 22 | 23 | ||||||||||||||
| Total environmental rehabilitation and other provisions | 634 | 729 | 731 | ||||||||||||||
Sensitivity analysis - Provision for decommissioning (3) | |||||||||||||||||
| A change in discount rates and cash flows have a significant impact on the amounts recognised in the statement of financial position. A 10% change in the discount rate and cash flows would have the following impact: | |||||||||||||||||
| Effect of increase in assumptions: | |||||||||||||||||
| 10% change in discount rate | (7) | (5) | (3) | ||||||||||||||
| 10% change in cash flows | 16 | 21 | 22 | ||||||||||||||
| Effect of decrease in assumptions: | |||||||||||||||||
| 10% change in discount rate | 8 | 5 | 3 | ||||||||||||||
| 10% change in cash flows | (16) | (21) | (22) | ||||||||||||||
Sensitivity analysis - Provision for restoration (3) | |||||||||||||||||
| A change in discount rates and cash flows have a significant impact on the amounts recognised in the income statement. A 10% change in the discount rate and cash flows would have the following impact: | |||||||||||||||||
| Effect of increase in assumptions: | |||||||||||||||||
| 10% change in discount rate | (10) | (5) | (3) | ||||||||||||||
| US Dollars | |||||||||||||||||
| Figures in millions | 2020 | 2019 | 2018 | ||||||||||||||
| Environmental rehabilitation obligations | |||||||||||||||||
| Provision for decommissioning | |||||||||||||||||
| Balance at beginning of year | 196 | 237 | 286 | ||||||||||||||
| Charge to income statement | 0 | 0 | 1 | ||||||||||||||
Change in estimates(1) | 17 | 29 | (47) | ||||||||||||||
| Unwinding of decommissioning obligation | 2 | 10 | 12 | ||||||||||||||
| Transfer to assets and liabilities held for sale | 0 | (81) | 0 | ||||||||||||||
| Utilised during the year | 0 | (1) | (1) | ||||||||||||||
| Translation | 4 | 2 | (14) | ||||||||||||||
| Balance at end of year | 219 | 196 | 237 | ||||||||||||||
| Provision for restoration | |||||||||||||||||
| Balance at beginning of year | 423 | 385 | 409 | ||||||||||||||
| Charge to income statement | 2 | (1) | 2 | ||||||||||||||
Change in estimates(1) | 15 | 50 | (28) | ||||||||||||||
| Unwinding of restoration obligation | 4 | 9 | 12 | ||||||||||||||
| Transfer to assets and liabilities held for sale | 0 | (15) | 0 | ||||||||||||||
| Utilised during the year | (11) | (5) | (3) | ||||||||||||||
| Translation | 7 | 0 | (7) | ||||||||||||||
| Balance at end of year | 440 | 423 | 385 | ||||||||||||||
Other provisions(2) | |||||||||||||||||
| Balance at beginning of year | 78 | 205 | 247 | ||||||||||||||
| Charge to income statement | 12 | 39 | 24 | ||||||||||||||
| Change in estimates | 5 | 27 | 18 | ||||||||||||||
| Transfer to assets and liabilities held for sale | 0 | (115) | 0 | ||||||||||||||
| Transfer from (to) short term provisions included in trade and other payables | 2 | (73) | (26) | ||||||||||||||
| Unwinding of other provisions | 4 | 6 | 7 | ||||||||||||||
| Utilised during the year | (22) | (16) | (35) | ||||||||||||||
| Translation | (7) | 5 | (30) | ||||||||||||||
| Balance at end of year | 72 | 78 | 205 | ||||||||||||||
| Total environmental rehabilitation and other provisions | 731 | 697 | 827 | ||||||||||||||
F - 65
| 10% change in cash flows | 42 | 46 | 44 | ||||||||||||||
| Effect of decrease in assumptions: | |||||||||||||||||
| 10% change in discount rate | 10 | 5 | 3 | ||||||||||||||
| 10% change in cash flows | (42) | (46) | (44) | ||||||||||||||
Sensitivity analysis - Provision for silicosis (3) | |||||||||||||||||
| Significant judgements are applied in estimating the costs required to settle any qualifying silicosis claims and is based on certain assumptions which includes the number of claimants, take-up rates and disease progression rates. A 10% change in these assumptions would have the following impact: | |||||||||||||||||
| Effect of increase in assumptions: | |||||||||||||||||
| 10% change in take-up rates | 6 | 6 | 6 | ||||||||||||||
| 10% change in number of cases | 6 | 6 | 6 | ||||||||||||||
| 10% change in disease progression rate | 4 | 3 | 3 | ||||||||||||||
| Effect of decrease in assumptions: | |||||||||||||||||
| 10% change in take-up rates | (6) | (6) | (6) | ||||||||||||||
| 10% change in number of cases | (6) | (6) | (6) | ||||||||||||||
| 10% change in disease progression rate | (4) | (3) | (3) | ||||||||||||||
(1)The change in estimates is attributable to changes in discount rates due to changes in global economic assumptions and changes in mine plans resulting in a change in cash flows and changes in design of tailings storage facilities and in methodology following requests from the environmental regulatory authorities. These provisions are expected to unwind beyond the end of the life of mine.
(2)Other provisions include the long-term provision for the silicosis class action litigation of $49m (2019: $54m; 2018: $47m), the short-term portion of $12m (2019; $11m; 2018: $16m) has been included in trade and other payables. The balance of otherOther provisions comprises claims filed by former employees in respect of loss of employment, work-related accident injuries and diseases, governmental fiscal claims relating to levies, surcharges and environmental legal disputes and a shareholder claim related to stamp duties. These liabilities are expected to be settled over the next two-totwo-to five-year period.
(3)The sensitivity analysis is based on the change of a single assumption, keeping all other assumptions constant. This may not be the case in practice where changes in assumptions may result in correlated changes in other assumptions, and a change in the provision amount.
Environmental obligations
Pursuant to environmental regulations in the countries in which we operate, in connection with plans for the eventual end-of-life of our mines, we are obligated to rehabilitate the lands where such mines are located. In most cases, AngloGold Ashanti is required to provide financial guarantees for such work, including reclamation bonds or letters of credit issued by third party entities, independent trust funds or cash reserves maintained by the operation, to the respective environmental protection agency, or such other government department with responsibility for environmental oversight in the respective country, to cover the estimated environmental rehabilitation obligations.
In most cases, the environmental obligations will expire on completion of the rehabilitation although, in some cases, we may be required to post bonds for potential events or conditions that could arise after the rehabilitation has been completed.
In Australia, since 2014, we have paid into a Mine Rehabilitation Fund an amount of AUD $11.2m for a current carrying value of the liability of AUD $107.4m. At Iduapriem, we have provided a bond comprising of a cash component of $11.8m with a further bond guarantee amounting to $14m issued by ABSA Bank Ghana Limited and Standard Chartered Bank Ghana Ltd for a current carrying value of the liability of $45.9m. At Obuasi, we have provided a bond comprising of a cash component of $21.54m with a further bank guarantee amounting to $30m issued by Stanbic Bank Ghana Limited and Standard Chartered Bank Ghana PLC for a current carrying value of the liability of $171.03m. In some circumstances we may be required to post further bonds in due course which will have a consequential income statement charge for the fees charged by the providers of the reclamation bonds.
| US Dollars | US Dollars | |||||||||||||||||||||||||||||||||
| Figures in millions | Figures in millions | 2020 | 2019 | 2018 | Figures in millions | 2022 | 2021 | 2020 | ||||||||||||||||||||||||||
| Defined benefit plans | Defined benefit plans | Defined benefit plans | ||||||||||||||||||||||||||||||||
| The retirement schemes consist of the following: | The retirement schemes consist of the following: | The retirement schemes consist of the following: | ||||||||||||||||||||||||||||||||
| Post-retirement medical scheme for AngloGold Ashanti's South African employees | Post-retirement medical scheme for AngloGold Ashanti's South African employees | 77 | 93 | 93 | Post-retirement medical scheme for AngloGold Ashanti's South African employees | 66 | 71 | 77 | ||||||||||||||||||||||||||
| Other defined benefit plans | Other defined benefit plans | 6 | 7 | 7 | Other defined benefit plans | 5 | 6 | 6 | ||||||||||||||||||||||||||
| 83 | 100 | 100 | 71 | 77 | 83 | |||||||||||||||||||||||||||||
F - 66
NOTES TO THE CONSOLIDATED FINANCIAL STATEMENTS (continued)
| Figures in millions | 2020 | 2019 | 2018 | ||||||||||||||
| US Dollars | |||||||||||||||||
| Post-retirement medical scheme for AngloGold Ashanti's South African employees | |||||||||||||||||
| The provision for post-retirement medical funding represents the provision for health care benefits for employees and retired employees and their registered dependants. | |||||||||||||||||
| The post-retirement benefit costs are assessed in accordance with the advice of independent professionally qualified actuaries. The actuarial method used is the projected unit credit funding method. This scheme is unfunded. The last valuation was performed as at 31 December 2020. | |||||||||||||||||
| Information with respect to the defined benefit liability is as follows: | |||||||||||||||||
| Benefit obligation | |||||||||||||||||
| Balance at beginning of year | 93 | 93 | 115 | ||||||||||||||
| Interest cost | 7 | 8 | 9 | ||||||||||||||
| Benefits paid | (7) | (8) | (10) | ||||||||||||||
| Actuarial (gain) loss | (9) | (2) | (5) | ||||||||||||||
| Translation | (5) | 2 | (16) | ||||||||||||||
| Balance at end of year | 79 | 93 | 93 | ||||||||||||||
| Settlement gain | (2) | 0 | 0 | ||||||||||||||
| Net amount recognised | 77 | 93 | 93 | ||||||||||||||
| Components of net periodic benefit cost | |||||||||||||||||
| Interest cost | 7 | 8 | 9 | ||||||||||||||
| Net periodic benefit cost | 7 | 8 | 9 | ||||||||||||||
| Assumptions | |||||||||||||||||
| Assumptions used to determine benefit obligations at the end of the year are as follows: | |||||||||||||||||
| Discount rate | 9.14 | % | 9.15 | % | 9.57 | % | |||||||||||
| Expected increase in health care costs | 6.06 | % | 7.25 | % | 7.35 | % | |||||||||||
| Assumed health care cost trend rates at 31 December: | |||||||||||||||||
| Health care cost trend assumed for next year | 6.06 | % | 7.25 | % | 7.35 | % | |||||||||||
| Rate to which the cost trend is assumed to decline (the ultimate trend rate) | 6.06 | % | 7.25 | % | 7.35 | % | |||||||||||
| Assumed health care cost trend rates have a significant effect on the amounts reported for health care plans. A 1% point change in assumed health care cost trend rates would have the following effect: | |||||||||||||||||
| Effect on total service and interest cost – 1% point increase | 0 | 1 | 1 | ||||||||||||||
| Effect on post-retirement benefit obligation – 1% point increase | 4 | 7 | 7 | ||||||||||||||
| Effect on total service and interest cost – 1% point decrease | 0 | (1) | (1) | ||||||||||||||
| Effect on post-retirement benefit obligation – 1% point decrease | (4) | (6) | (7) | ||||||||||||||
| Cash flows | |||||||||||||||||
| Contributions | |||||||||||||||||
| AngloGold Ashanti Limited expects to contribute $8m to the post-retirement medical plan in 2021. | |||||||||||||||||
| Estimated future benefit payments | |||||||||||||||||
| The following medical benefit payments, which reflect the expected future service, as appropriate, are expected to be paid: | |||||||||||||||||
| 2021 | 8 | ||||||||||||||||
| 2022 | 9 | ||||||||||||||||
| 2023 | 9 | ||||||||||||||||
| 2024 | 9 | ||||||||||||||||
| 2025 | 9 | ||||||||||||||||
| Thereafter | 33 | ||||||||||||||||
| Figures in millions | 2022 | 2021 | 2020 | ||||||||||||||
| US Dollars | |||||||||||||||||
| Post-retirement medical scheme for AngloGold Ashanti's South African employees | |||||||||||||||||
| The provision for post-retirement medical funding represents the provision for health care benefits for employees and retired employees and their registered dependants. | |||||||||||||||||
| The post-retirement benefit costs are assessed in accordance with the advice of independent professionally qualified actuaries. The actuarial method used is the projected unit credit funding method. The last valuation was performed as at 31 December 2022. | |||||||||||||||||
| Information with respect to the defined benefit liability is as follows: | |||||||||||||||||
| Benefit obligation | |||||||||||||||||
| Balance at beginning of year | 71 | 77 | 93 | ||||||||||||||
| Interest cost | 6 | 6 | 7 | ||||||||||||||
| Benefits paid | (7) | (8) | (7) | ||||||||||||||
| Actuarial loss (gain) | (1) | 1 | (9) | ||||||||||||||
| Translation | (3) | (5) | (5) | ||||||||||||||
| Balance at end of year | 66 | 71 | 79 | ||||||||||||||
| Settlement gain | — | — | (2) | ||||||||||||||
| Net amount recognised | 66 | 71 | 77 | ||||||||||||||
| Assumptions | |||||||||||||||||
| Assumptions used to determine benefit obligations at the end of the year are as follows: | |||||||||||||||||
| Discount rate | 10.88 | % | 9.79 | % | 9.14 | % | |||||||||||
| Expected increase in health care costs | 7.49 | % | 7.23 | % | 6.06 | % | |||||||||||
| Assumed health care cost trend rates at 31 December: | |||||||||||||||||
| Health care cost trend assumed for next year | 7.49 | % | 7.23 | % | 6.06 | % | |||||||||||
| Rate to which the cost trend is assumed to decline (the ultimate trend rate) | 7.49 | % | 7.23 | % | 6.06 | % | |||||||||||
| Assumed health care cost trend rates have a significant effect on the amounts reported for health care plans. A 1% point change in assumed health care cost trend rates would have the following effect: | |||||||||||||||||
| Effect on total service and interest cost – 1% point increase | — | 1 | — | ||||||||||||||
| Effect on post-retirement benefit obligation – 1% point increase | 4 | 5 | 4 | ||||||||||||||
| Effect on total service and interest cost – 1% point decrease | — | — | — | ||||||||||||||
| Effect on post-retirement benefit obligation – 1% point decrease | (4) | (4) | (4) | ||||||||||||||
| During 2022 the company purchased annuities to partly meet its obligations to pay medical aid contributions. Two remaining premiums of $22m are payable on 1 August 2023 and 2024. The annuities are payable monthly and cover 100% of the medical aid contributions payable to retired members. The annuities increase by South African CPI each year. | |||||||||||||||||
| Reimbursive right for post-retirement benefits | |||||||||||||||||
| Premiums paid | 26 | ||||||||||||||||
| Benefits paid | (3) | ||||||||||||||||
| Interest income | 1 | ||||||||||||||||
| Actuarial loss (gain) | (12) | ||||||||||||||||
| Translation | — | ||||||||||||||||
| Balance at end of year | 12 | ||||||||||||||||
| The fair value of the right of reimbursement has been determined as the present value of expected future annuity payments payable by the insurer in respect of continuation members, less the present value of outstanding medical aid premium payments payable on 1 August 2023 and 2024. The future annuity payments make appropriate allowance for future increases in line with CPI. The main input used in the valuation model are healthcare cost inflation of 6.2%, demographic assumptions and medical aid contribution increases of 7.49%. This is considered a level 3 fair value input. | |||||||||||||||||
| Cash flows | |||||||||||||||||
| Estimated future benefit payments | |||||||||||||||||
| The following medical benefit payments, which reflect the expected future service, as appropriate, are expected to be paid through purchased annuities: | |||||||||||||||||
| 2023 | 8 | ||||||||||||||||
| 2024 | 9 | ||||||||||||||||
| 2025 | 9 | ||||||||||||||||
| 2026 | 8 | ||||||||||||||||
| 2027 | 8 | ||||||||||||||||
| Thereafter | 29 | ||||||||||||||||
F - 67
| US Dollars | |||||||||||||||||
| Figures in millions | 2022 | 2021 | 2020 | ||||||||||||||
| Deferred taxation relating to temporary differences is made up as follows: | |||||||||||||||||
| Liabilities | |||||||||||||||||
| Tangible assets (owned) | 430 | 442 | 373 | ||||||||||||||
| Right-of-use assets | 52 | 53 | 40 | ||||||||||||||
| Inventories | 19 | 13 | 20 | ||||||||||||||
| Other | 13 | 22 | 13 | ||||||||||||||
| 514 | 530 | 446 | |||||||||||||||
| Assets | |||||||||||||||||
| Provisions | 131 | 141 | 122 | ||||||||||||||
| Lease liabilities | 57 | 56 | 42 | ||||||||||||||
| Tax losses | 89 | 23 | 22 | ||||||||||||||
| Other | 9 | 4 | 21 | ||||||||||||||
| 286 | 224 | 207 | |||||||||||||||
| Net deferred taxation liability | 228 | 306 | 239 | ||||||||||||||
| Included in the statement of financial position as follows: | |||||||||||||||||
Deferred tax assets (1) | 72 | 7 | 7 | ||||||||||||||
| Deferred tax liabilities | 300 | 313 | 246 | ||||||||||||||
| Net deferred taxation liability | 228 | 306 | 239 | ||||||||||||||
| The movement on the net deferred tax balance is as follows: | |||||||||||||||||
| Balance at beginning of year | 306 | 239 | 136 | ||||||||||||||
| Taxation of items included in income statement from continuing and discontinued operations | (58) | 64 | 53 | ||||||||||||||
| Taxation of non-current assets and liabilities included in income statement from discontinued operations | — | — | 28 | ||||||||||||||
| Taxation on items included in other comprehensive income | (14) | 6 | 6 | ||||||||||||||
| Translation | (6) | (3) | 16 | ||||||||||||||
| Balance at end of year | 228 | 306 | 239 | ||||||||||||||
(1) Deferred tax assets of $72m (2021: $7m; 2020: $7m) were recognised for Obuasi, resulting from generated tax losses to be utilised against future taxable income.
| US Dollars | |||||||||||||||||
| Figures in millions | 2020 | 2019 | 2018 | ||||||||||||||
| Deferred taxation relating to temporary differences is made up as follows: | |||||||||||||||||
| Liabilities | |||||||||||||||||
| Tangible assets (owned) | 373 | 370 | 521 | ||||||||||||||
| Right-of-use assets | 40 | 48 | 0 | ||||||||||||||
| Inventories | 20 | 24 | 37 | ||||||||||||||
| Other | 13 | 9 | 5 | ||||||||||||||
| 446 | 451 | 563 | |||||||||||||||
| Assets | |||||||||||||||||
| Provisions | 122 | 209 | 218 | ||||||||||||||
| Lease liabilities | 42 | 52 | 0 | ||||||||||||||
| Tax losses | 15 | 45 | 24 | ||||||||||||||
| Other | 28 | 9 | 6 | ||||||||||||||
| 207 | 315 | 248 | |||||||||||||||
| Net deferred taxation liability | 239 | 136 | 315 | ||||||||||||||
| Included in the statement of financial position as follows: | |||||||||||||||||
| Deferred tax assets | 7 | 105 | 0 | ||||||||||||||
| Deferred tax liabilities | 246 | 241 | 315 | ||||||||||||||
| Net deferred taxation liability | 239 | 136 | 315 | ||||||||||||||
| The movement on the net deferred tax balance is as follows: | |||||||||||||||||
| Balance at beginning of year | 136 | 315 | 359 | ||||||||||||||
| Taxation of items included in income statement from continuing and discontinued operations | 53 | (189) | (30) | ||||||||||||||
| Taxation of non-current assets and liabilities included in discontinued operations | 28 | 0 | 0 | ||||||||||||||
| Taxation on items included in other comprehensive income | 6 | (2) | 5 | ||||||||||||||
| Transfer to non-current assets and liabilities held for sale | 0 | 15 | 0 | ||||||||||||||
| Translation | 16 | (3) | (19) | ||||||||||||||
| Balance at end of year | 239 | 136 | 315 | ||||||||||||||
Provision has been made for South African income tax or foreign taxes that may result from future remittances of undistributed earnings of foreign subsidiaries or foreign corporate joint ventures, where the groupGroup is able to assert that the undistributed earnings are not permanently reinvested. In all other cases, the foreign subsidiaries reinvest the undistributed earnings into future capital expansion projects, maintenance capital and ongoing working capital funding requirements. Unrecognised taxable temporary differences pertaining to undistributed earnings totalled $1,806m (2019: $1,787m(1); 2018: $1,663m(1))$1,393m (2021: $1,800m; 2020: $1,806m). If remitted, the undistributed earnings may be subject to withholding taxes between 0% - 10%.
F - 68
| US Dollars | |||||||||||||||||
| Figures in millions | 2020 | 2019 | 2018 | ||||||||||||||
| Non-current | |||||||||||||||||
| Other Payables | 8 | 15 | 3 | ||||||||||||||
| Current | |||||||||||||||||
| Trade payables | 403 | 365 | 350 | ||||||||||||||
Accruals(1) | 191 | 167 | 186 | ||||||||||||||
| Short-term provisions | 30 | 53 | 20 | ||||||||||||||
| Derivatives | 0 | 0 | 9 | ||||||||||||||
| Other payables | 3 | 1 | 29 | ||||||||||||||
| 627 | 586 | 594 | |||||||||||||||
| Total trade, other payables and provisions | 635 | 601 | 597 | ||||||||||||||
| Current trade and other payables are non-interest bearing and are normally settled within 60 days. | |||||||||||||||||
| US Dollars | |||||||||||||||||
| Figures in millions | 2022 | 2021 | 2020 | ||||||||||||||
| Non-current | |||||||||||||||||
| Other payables | 7 | 7 | 8 | ||||||||||||||
| Current | |||||||||||||||||
| Trade payables | 391 | 406 | 403 | ||||||||||||||
Accruals(1) | 279 | 205 | 191 | ||||||||||||||
| Short-term provisions | 30 | 31 | 30 | ||||||||||||||
| Short-term financial liabilities | 6 | — | — | ||||||||||||||
| Other payables | 4 | 5 | 3 | ||||||||||||||
| 710 | 647 | 627 | |||||||||||||||
| Total trade, other payables and provisions | 717 | 654 | 635 | ||||||||||||||
| Current trade and other payables are non-interest bearing and are normally settled within 60 days. | |||||||||||||||||
(1)Includes accrual for silicosis of $12m (2019: $11m; 2018: $16m)(2021: $16m; 2020: $12m) and retrenchments of nil (2021: $7m; 2020: nil).
F - 69
| US Dollars | US Dollars | |||||||||||||||||||||||||||||||||
| Figures in millions | Figures in millions | 2020 | 2019 | 2018 | Figures in millions | 2022 | 2021 | 2020 | ||||||||||||||||||||||||||
| Balance at beginning of year | Balance at beginning of year | 62 | 54 | 50 | Balance at beginning of year | (10) | 139 | 62 | ||||||||||||||||||||||||||
| Refunds during the year | Refunds during the year | 0 | 7 | 5 | Refunds during the year | 32 | 20 | — | ||||||||||||||||||||||||||
| Payments during the year | Payments during the year | (431) | (228) | (171) | Payments during the year | (166) | (336) | (431) | ||||||||||||||||||||||||||
| Taxation of items included in the income statement | Taxation of items included in the income statement | 562 | 298 | 242 | Taxation of items included in the income statement | 231 | 248 | 562 | ||||||||||||||||||||||||||
| Offset of VAT and other taxes | Offset of VAT and other taxes | (41) | (50) | (63) | Offset of VAT and other taxes | (84) | (87) | (41) | ||||||||||||||||||||||||||
| Transfer of Siguiri tax asset to non-current trade and other receivables | Transfer of Siguiri tax asset to non-current trade and other receivables | 4 | — | — | ||||||||||||||||||||||||||||||
| Withholding tax transferred from (to) trade, other payables and provisions | Withholding tax transferred from (to) trade, other payables and provisions | — | 7 | (7) | ||||||||||||||||||||||||||||||
| Discounting of tax receivable | Discounting of tax receivable | — | 1 | — | ||||||||||||||||||||||||||||||
| Transfer from tax receivable relating to North America | Transfer from tax receivable relating to North America | (4) | (10) | 0 | Transfer from tax receivable relating to North America | — | — | (4) | ||||||||||||||||||||||||||
| Withholding tax transferred to trade, other payables and provisions | (7) | 0 | 0 | |||||||||||||||||||||||||||||||
| Translation | Translation | (2) | (9) | (9) | Translation | 1 | (2) | (2) | ||||||||||||||||||||||||||
| Balance at end of year | Balance at end of year | 139 | 62 | 54 | Balance at end of year | 8 | (10) | 139 | ||||||||||||||||||||||||||
| Included in the statement of financial position as follows: | Included in the statement of financial position as follows: | Included in the statement of financial position as follows: | ||||||||||||||||||||||||||||||||
| Taxation asset included in trade, other receivables and other assets | Taxation asset included in trade, other receivables and other assets | (14) | (10) | (6) | Taxation asset included in trade, other receivables and other assets | (37) | (49) | (14) | ||||||||||||||||||||||||||
| Taxation liability | Taxation liability | 153 | 72 | 60 | Taxation liability | 45 | 39 | 153 | ||||||||||||||||||||||||||
| 139 | 62 | 54 | 8 | (10) | 139 | |||||||||||||||||||||||||||||
| US Dollars | |||||||||||||||||
| Figures in millions | 2020 | 2019 | 2018 | ||||||||||||||
| Profit (loss) before taxation | 1,589 | 619 | 445 | ||||||||||||||
| Adjusted for: | |||||||||||||||||
| Movement on non-hedge derivatives and other commodity contracts | 0 | (6) | 6 | ||||||||||||||
| Amortisation of tangible assets and right of use assets (note 4) | 568 | 580 | 553 | ||||||||||||||
| Finance costs and unwinding of obligations (note 7) | 177 | 172 | 168 | ||||||||||||||
| Environmental, rehabilitation and other expenditure | (50) | (6) | (23) | ||||||||||||||
| Impairment, derecognition of assets and profit (loss) on disposal | (1) | 3 | 5 | ||||||||||||||
| Other expenses (income) | 51 | 41 | 28 | ||||||||||||||
| Amortisation of intangible assets (note 4) | 2 | 3 | 5 | ||||||||||||||
| Interest income | (27) | (14) | (8) | ||||||||||||||
| Share of associates and joint ventures’ (profit) loss (note 8) | (278) | (168) | (122) | ||||||||||||||
| Other non-cash movements | 35 | 43 | (4) | ||||||||||||||
| Movements in working capital | (238) | (165) | (122) | ||||||||||||||
| 1,828 | 1,102 | 931 | |||||||||||||||
| Movements in working capital: | |||||||||||||||||
| (Increase) decrease in inventories | (83) | (67) | (2) | ||||||||||||||
| (Increase) decrease in trade, other receivables and other assets | (163) | (138) | (74) | ||||||||||||||
| Increase (decrease) in trade, other payables and provisions | 8 | 40 | (46) | ||||||||||||||
| (238) | (165) | (122) | |||||||||||||||
| US Dollars | |||||||||||||||||
| Figures in millions | 2022 | 2021 | 2020 | ||||||||||||||
| Profit (loss) before taxation | 489 | 958 | 1,627 | ||||||||||||||
| Adjusted for: | |||||||||||||||||
| Movement on non-hedge derivatives and other commodity contracts | 6 | — | — | ||||||||||||||
| Amortisation of tangible and right of use assets (note 4) | 632 | 474 | 573 | ||||||||||||||
| Amortisation of intangible assets (note 4) | 1 | 3 | 2 | ||||||||||||||
| Finance costs and unwinding of obligations (note 6) | 149 | 116 | 177 | ||||||||||||||
| Environmental, rehabilitation, silicosis and other provisions | (85) | (20) | (50) | ||||||||||||||
| Impairment and derecognition of assets | 308 | 7 | 1 | ||||||||||||||
| Profit on sale of assets | (8) | (22) | (2) | ||||||||||||||
| Other expenses (income) | 9 | 61 | 51 | ||||||||||||||
| Interest income | (81) | (58) | (27) | ||||||||||||||
| Share of associates and joint ventures’ (profit) loss (note 7) | (166) | (249) | (278) | ||||||||||||||
| Other non-cash movements | 127 | 30 | 30 | ||||||||||||||
| Movements in working capital | (137) | 53 | (238) | ||||||||||||||
| 1,244 | 1,353 | 1,866 | |||||||||||||||
| Movements in working capital: | |||||||||||||||||
| (Increase) decrease in inventories | (54) | 58 | (83) | ||||||||||||||
| Increase in trade, other receivables and other assets | (149) | (49) | (163) | ||||||||||||||
| Increase in trade, other payables and provisions | 66 | 44 | 8 | ||||||||||||||
| (137) | 53 | (238) | |||||||||||||||
F - 70
| US Dollars | |||||||||||||||||
| Figures in millions | 2020 | 2019 | 2018 | ||||||||||||||
| Material related party transactions were as follows (not attributable): | |||||||||||||||||
| Sales and services rendered to related parties | |||||||||||||||||
| Associates | 11 | 19 | 0 | ||||||||||||||
| Joint ventures | 8 | 7 | 10 | ||||||||||||||
| Purchases and services acquired from related parties | |||||||||||||||||
| Associates | 20 | 12 | 19 | ||||||||||||||
| Joint ventures | 1 | 1 | 0 | ||||||||||||||
| Outstanding balances arising from sale of goods and services due by related parties | |||||||||||||||||
| Associates | 11 | 19 | 19 | ||||||||||||||
| Joint ventures | 0 | 1 | 0 | ||||||||||||||
| Amounts owed to/due by related parties above are unsecured and non-interest bearing. | |||||||||||||||||
| Loans advanced to joint ventures and associates | |||||||||||||||||
| Loans advanced to associates and joint ventures are included in the carrying value of investments in associates and joint ventures (note 19) | |||||||||||||||||
| US Dollars | |||||||||||||||||
| Figures in millions | 2022 | 2021 | 2020 | ||||||||||||||
| Material related party transactions were as follows (not attributable): | |||||||||||||||||
| Sales and services rendered to related parties | |||||||||||||||||
| Associates | — | 7 | 11 | ||||||||||||||
| Joint ventures | — | — | 8 | ||||||||||||||
| Purchases and services acquired from related parties | |||||||||||||||||
| Associates | 14 | 14 | 20 | ||||||||||||||
| Joint ventures | — | — | 1 | ||||||||||||||
| Outstanding balances arising from sale of goods and services due by related parties | |||||||||||||||||
| Associates | — | 7 | 11 | ||||||||||||||
| Joint ventures | — | — | — | ||||||||||||||
| Amounts owed to/due by related parties above are unsecured and non-interest bearing. | |||||||||||||||||
| Loans advanced to joint ventures and associates | |||||||||||||||||
| Loans advanced to associates and joint ventures are included in the carrying value of investments in associates and joint ventures (note 17) | |||||||||||||||||
Executive contracts
All members of the Executive Management team have permanent employment contracts which entitle them to standard group benefits as defined by their specific region and participation in the Company’s Deferred Share Plan (DSP).
South African-based executives are paid a portion of their remuneration offshore, which is detailed under a separate contract. This reflects global roles and responsibilities and takes account of offshore business requirements.
The executive contracts are reviewed annually and currently continue to include a change in control provision. The change in control is subject to the following triggers:
•The acquisition of all or part of AngloGold Ashanti; or
•A number of shareholders holding less than thirty-five percent of the Company’s issued share capital consorting to gain a majority of the board and make management decisions; and
•The contracts of Executive Committee members are either terminated or their role and employment conditions are curtailed.
In the event of a change in control becoming effective, the executive management team will in certain circumstances be subject to both the notice period and the change in control contract terms. The notice period applied per category of executive and the change in control periods as at 31 December 20202022 were as follows:
| Executive Committee member | Notice Period | Change of control | |||||||||
| 12 months | 12 months | ||||||||||
| 6 months | 6 months | ||||||||||
| Other Executive Management team members | 6 months | 6 months | |||||||||
F - 71
Directors and other key management personnel
Executive directors’ and prescribed officers’ remuneration
The tables below illustrate the single total figure of remuneration and the total cash equivalent received reconciliation of Executive Directors and Prescribed Officers as prescribed by King IV. It comprises an overview of all the pay elements available to the executive management team for the year ended 31 December 2020.2022.
The following are definitions of terminology used in the adoption of the reporting requirements under King IV.
Reflected
In respect of the DSP awards, remuneration is reflected when performance conditions have been met during the reporting period.
Settled
This refers to remuneration that has been included in prior reporting periods and has now become payable (but may not yet have been paid) to the executive in the current period.
Single total figure of remuneration | Base Salary | Pension scheme benefits | Cash in lieu of dividends | Other benefits(2) | Awards earned during the period reflected but not yet settled | Other Payment | Single total figure of remuneration | ||||||||||||||||||||||||||||
| ZAR denominated portion | USD/AUD denominated portion(1) | DSP awards(3) | 2020 | 2019 | 2018 | ||||||||||||||||||||||||||||||
| ZAR '000 | ZAR '000 | ZAR '000 | ZAR '000 | ZAR '000 | ZAR '000 | ZAR '000 | ZAR '000 | USD '000 (9) | USD '000(9) | USD '000(9) | |||||||||||||||||||||||||
| Executive directors | |||||||||||||||||||||||||||||||||||
KPM Dushnisky(4) | 0 | 21,657 | 5,266 | 13 | 1,759 | 25,796 | 0 | 54,491 | 3,312 | 6,268 | 7,570 | ||||||||||||||||||||||||
KC Ramon(5) | 5,864 | 4,594 | 834 | 385 | 924 | 22,507 | 16,513 | 51,621 | 3,138 | 5,097 | 3,547 | ||||||||||||||||||||||||
| Total executive directors | 5,864 | 26,251 | 6,100 | 398 | 2,683 | 48,303 | 16,513 | 106,112 | 6,450 | 11,365 | 11,117 | ||||||||||||||||||||||||
| Prescribed officers | |||||||||||||||||||||||||||||||||||
| SD Bailey | 4,465 | 3,305 | 0 | 75 | 1,259 | 24,103 | 0 | 33,207 | 2,019 | 2,190 | 0 | ||||||||||||||||||||||||
| PD Chenard | 5,282 | 4,255 | 0 | 0 | 2,468 | 8,554 | 0 | 20,559 | 1,250 | 3,292 | 0 | ||||||||||||||||||||||||
| GJ Ehm | 0 | 10,462 | 284 | 409 | 710 | 32,108 | 0 | 43,973 | 2,673 | 4,742 | 3,286 | ||||||||||||||||||||||||
| L Eybers | 0 | 10,832 | 284 | 377 | 798 | 31,896 | 0 | 44,187 | 2,686 | 4,659 | 2,511 | ||||||||||||||||||||||||
I Kramer(6) | 1,156 | 0 | 144 | 0 | 24 | 6,085 | 289 | 7,698 | 468 | 0 | 0 | ||||||||||||||||||||||||
LMarwick(7) | 1,896 | 939 | 256 | 0 | 136 | 16,615 | 571 | 20,413 | 1,241 | 0 | 0 | ||||||||||||||||||||||||
| S Ntuli | 5,202 | 3,851 | 728 | 95 | 1,387 | 26,942 | 0 | 38,205 | 2,322 | 2,565 | 0 | ||||||||||||||||||||||||
ME Sanz Perez(8) | 2,353 | 1,763 | 514 | 300 | 1,809 | 0 | 0 | 6,739 | 410 | 3,868 | 2,833 | ||||||||||||||||||||||||
| TR Sibisi | 4,484 | 3,518 | 1,000 | 258 | 58 | 20,802 | 0 | 30,120 | 1,831 | 3,514 | 2,699 | ||||||||||||||||||||||||
| Total prescribed officers | 24,838 | 38,925 | 3,210 | 1,514 | 8,649 | 167,105 | 860 | 245,101 | 14,900 | 24,830 | 11,329 | ||||||||||||||||||||||||
Single total figure of remuneration | Base Salary | Pension scheme benefits | Cash in lieu of dividends | Other benefits(2) | Awards earned during the period reflected but not yet settled | Other Payments | Single total figure of remuneration | |||||||||||||||||||||||||||||||
| ZAR denominated portion | USD/AUD denominated portion(1) | DSP awards(3) | Sign-on awards granted | 2022 | 2021 | 2020 | ||||||||||||||||||||||||||||||||
| ZAR '000 | ZAR '000 | ZAR '000 | ZAR '000 | ZAR '000 | ZAR '000 | ZAR '000 | ZAR '000 | USD '000(12) | USD '000(12) | USD '000(12) | ||||||||||||||||||||||||||||
| Executive directors | ||||||||||||||||||||||||||||||||||||||
| A Calderon | — | 26,185 | 6,481 | — | 162 | 83,180 | — | — | 116,008 | 7,089 | 2,761 | — | ||||||||||||||||||||||||||
KC Ramon(4) | 3,052 | 2,336 | 430 | 435 | 3,524 | 4,551 | — | 13,082 | 27,410 | 1,675 | 2,875 | 3,138 | ||||||||||||||||||||||||||
| Total executive directors | 3,052 | 28,521 | 6,911 | 435 | 3,686 | 87,731 | — | 13,082 | 143,418 | 8,764 | 5,636 | 3,138 | ||||||||||||||||||||||||||
| Prescribed officers | ||||||||||||||||||||||||||||||||||||||
L Ali(6) | — | 7,620 | — | — | 787 | 20,092 | 19,111 | 0 | 47,610 | 2,909 | — | — | ||||||||||||||||||||||||||
| SD Bailey | 5,037 | 2,977 | — | 225 | 1,177 | 20,882 | — | — | 30,298 | 1,851 | 1,673 | 2,019 | ||||||||||||||||||||||||||
I Boninelli(7) | 1,507 | — | — | — | 3 | — | — | — | 1,510 | 92 | 605 | — | ||||||||||||||||||||||||||
TJ Briggs(8) | — | 5,073 | 374 | — | 677 | 13,060 | 14,437 | — | 33,621 | 2,054 | — | — | ||||||||||||||||||||||||||
VA Chamberlain (9) | 1,058 | 225 | 137 | 124 | 18 | 2,664 | — | 321 | 4,547 | 278 | 606 | — | ||||||||||||||||||||||||||
| L Eybers | — | 10,986 | 312 | 401 | 814 | 28,281 | — | — | 40,794 | 2,493 | 2,291 | 2,686 | ||||||||||||||||||||||||||
| MC Godoy | — | 9,821 | 1,645 | — | 1,224 | 25,282 | — | — | 37,972 | 2,320 | 2,857 | — | ||||||||||||||||||||||||||
I Kramer(10) | 2,167 | — | 271 | — | 40 | 6,899 | — | 542 | 9,919 | 606 | 598 | 468 | ||||||||||||||||||||||||||
| L Marwick | 5,310 | 2,148 | 713 | 84 | 520 | 19,220 | — | — | 27,995 | 1,711 | 1,433 | 1,241 | ||||||||||||||||||||||||||
Exited prescribed officers (11) | — | — | — | — | — | — | — | — | — | — | 4,226 | 8,076 | ||||||||||||||||||||||||||
| Total prescribed officers | 15,079 | 38,850 | 3,452 | 834 | 5,260 | 136,380 | 33,548 | 863 | 234,266 | 14,314 | 14,289 | 14,490 | ||||||||||||||||||||||||||
(1) Salary denominated in USD/AUD for global roles and responsibilities converted to ZAR on payment date.ZAR.
(2) Other benefits include health care, group personal accident disability,cover, life cover, funeral cover, accommodation allowance, pension allowance, airfare and surplus leave encashed. Surplus leave days accrued are automatically encashed unless work requirements allow for carry over.
(3) The fair value of the DSP comprises of a cash bonus and share awards for the year ended 31 December 2020.2022. The cash bonus is payable in February 20212023 and the share awards are allocated in February 2021.2023. Shares vest over either a 5-yearthree- or five-year period in equal tranches.
(4) KPM Dushnisky received the cash portion only for 2020 due to his resignation,KC Ramon retired as Chief Financial Officer and executive director with effect from 30 June 2022. All payments including salary, pension and other benefits were pro-rated and aligned to the standard terms30 June 2022. Included in other payments is payment in lieu of unworked notice period from 1 July 2022 to 31 December 2022, as well as a waiver and conditionsrestraint of termination.trade payments.
(5) KC Ramon was appointed as Interim CEOKPM Dushniskjy resigned effective 1 September 2020. His single total figure of remuneration for 2022 was nil (2021: $2.8m; 2020: $3.3m)
(6) L Ali was appointed as Chief People Officer and prescribed officer with effect from 1 April 2022. All payments including salary, DSP awards and other benefits were pro-rated and aligned to the appointment period. The sign-on awards of ZAR19.111m was awarded on appointment date, 1 April 2022, in lieu of forfeited remuneration and shares from previous employer, of which ZAR5.525m will be settled in cash over a period of two years and ZAR13.586m will be settled in shares vesting over a two year period in accordance with the JSE Listing Requirements.
(7)I Boninelli stepped down as Executive Group Human Resources Consultant and prescribed officer effective 31 March 2022. All payments including salary, DSP awards (cash bonus only) and other benefits were pro-rated and aligned to the appointment period.
(8) TJ Briggs was appointed as Chief Development Officer and prescribed officer with effect from 1 April 2022. All payments, including pension and other benefits, were pro-rated to the appointment period for 2022. Included in the DSP awardawards is the DSP cash bonus and share award, for 2020 calculatedpro-rated to align to the period. The sign-on awards of ZAR14.437m was awarded on appointment date, 1 April 2022, in lieu of shares forfeited from previous employer and will be settled in shares vesting over a three year period in accordance with the CFO role for 8 months only. Other payments reflect the acting allowance paid and the DSP cash bonus and share award for the acting period of 4 months calculated on the CEO target bonus opportunity.JSE Listing Requirements.
(10) I Kramer was appointed as Interim Chief Financial Officer and prescribed officer from 1 July 2022 to 31 December 2022. All salary payments, including pension and other benefits, were pro-rated aligned to the acting period for 2022. Included in the DSP awardawards is the DSP cash bonus and share award for the full year of 20202022 (DSP award wasawards were not pro-rated. It waspro-rated but were calculated based on his normal Senior Vice President salary plus 46 months acting allowance on the Senior Vice President target bonus opportunity). Other payments reflect the acting allowance for the acting period from 1 SeptemberJuly to 31 December 2020.2022.
F - 72
Directors and other key management personnel CONTINUED
| Total cash equivalent received reconciliation | Single total figure of remuneration | Awards earned during the period reflected but not yet settled | DSP 2020 cash portion settled | BSP, CIP, DSP and LTIP share awards settled | Sign-on shares settled | Total cash equivalent received reconciliation | |||||||||||||||||||||||||||||||||||||||||||||||
DSP awards(1) | Sign-on awards granted | Grant fair value(2) | Market movement since grant date(2) | Vesting fair value(2) | Grant fair value(2) | Market movement since grant date(2) | Vesting fair value(2) | 2022 | 2021 | 2020 | |||||||||||||||||||||||||||||||||||||||||||
| ZAR '000 | ZAR '000 | ZAR '000 | ZAR '000 | ZAR '000 | ZAR '000 | ZAR '000 | ZAR '000 | ZAR '000 | ZAR '000 | ZAR '000 | USD '000(3) | USD '000(3) | USD '000(3) | ||||||||||||||||||||||||||||||||||||||||
| Executive directors | |||||||||||||||||||||||||||||||||||||||||||||||||||||
| A Calderon | 116,008 | (83,180) | — | 7,557 | — | — | — | — | — | — | 40,385 | 2,468 | 1,375 | — | |||||||||||||||||||||||||||||||||||||||
| KC Ramon | 27,410 | (4,551) | — | 9,951 | 12,666 | 3,174 | 15,840 | — | — | — | 48,650 | 2,973 | 2,329 | 4,278 | |||||||||||||||||||||||||||||||||||||||
| Total executive directors | 143,418 | (87,731) | — | 17,508 | 12,666 | 3,174 | 15,840 | — | — | — | 89,035 | 5,441 | 3,704 | 4,278 | |||||||||||||||||||||||||||||||||||||||
| Prescribed officers | |||||||||||||||||||||||||||||||||||||||||||||||||||||
| L Ali | 47,610 | (20,092) | (19,111) | — | — | — | — | 6,246 | (1,377) | 4,869 | 13,276 | 811 | — | — | |||||||||||||||||||||||||||||||||||||||
| SD Bailey | 30,298 | (20,882) | — | 4,965 | 7,101 | 1,376 | 8,477 | — | — | — | 22,858 | 1,397 | 1,365 | 1,508 | |||||||||||||||||||||||||||||||||||||||
| I Boninelli | 1,510 | — | — | 4,091 | — | — | — | — | — | — | 5,601 | 342 | 328 | — | |||||||||||||||||||||||||||||||||||||||
| TJ Briggs | 33,621 | (13,060) | (14,437) | — | — | — | — | — | — | — | 6,124 | 374 | — | — | |||||||||||||||||||||||||||||||||||||||
| VA Chamberlain | 4,547 | — | — | 2,944 | 7,908 | (147) | 7,761 | — | — | — | 15,252 | 932 | 288 | — | |||||||||||||||||||||||||||||||||||||||
| L Eybers | 40,794 | (28,281) | — | 6,516 | 11,177 | 2,776 | 13,953 | — | — | — | 32,982 | 2,015 | 2,039 | 3,756 | |||||||||||||||||||||||||||||||||||||||
| MC Godoy | 37,972 | (25,282) | — | 1,594 | — | — | — | 13,720 | 4,400 | 18,120 | 32,404 | 1,980 | 471 | — | |||||||||||||||||||||||||||||||||||||||
| I Kramer | 9,919 | (6,899) | — | 2,184 | 2,196 | 205 | 2,401 | — | — | — | 7,605 | 465 | 536 | 98 | |||||||||||||||||||||||||||||||||||||||
| L Marwick | 27,995 | (19,220) | — | 4,273 | 3,151 | 364 | 3,515 | — | — | — | 16,563 | 1,012 | 948 | 231 | |||||||||||||||||||||||||||||||||||||||
| Exited prescribed officers | — | — | — | — | — | — | — | — | — | — | — | — | 7,922 | 10,744 | |||||||||||||||||||||||||||||||||||||||
| Total prescribed officers | 234,266 | (133,716) | (33,548) | 26,567 | 31,533 | 4,574 | 36,107 | 19,966 | 3,023 | 22,989 | 152,665 | 9,328 | 13,897 | 16,337 | |||||||||||||||||||||||||||||||||||||||
| Total cash equivalent received reconciliation | Single total figure of remuneration | Awards earned during the period reflected but not yet settled | DSP 2019 cash portion settled | BSP, CIP, DSP and LTIP share awards settled | Sign-on cash settled | Sign-on shares settled | Total cash equivalent received reconciliation | |||||||||||||||||||||||||||||||||||||||||||
DSP awards(1) | Grant fair value(2) | Market movement since grant date(2) | Vesting fair value(2) | Grant fair value(2) | Currency movement since grant date(2) | Settlement fair value(2) | Grant fair value(2) | Market movement since grant date(2) | Vesting fair value(2) | 2020 | 2019 | 2018 | ||||||||||||||||||||||||||||||||||||||
| ZAR '000 | ZAR '000 | ZAR '000 | ZAR '000 | ZAR '000 | ZAR '000 | ZAR '000 | ZAR '000 | ZAR '000 | ZAR '000 | ZAR '000 | ZAR '000 | ZAR '000 | USD '000(4) | USD '000(4) | USD '000(4) | |||||||||||||||||||||||||||||||||||
| Executive directors | ||||||||||||||||||||||||||||||||||||||||||||||||||
KPM Dushnisky(3) | 54,491 | (25,796) | 9,177 | 2,770 | 1,810 | 4,579 | 14,680 | (245) | 14,435 | 10,094 | 18,379 | 28,473 | 85,359 | 5,189 | 6,298 | 550 | ||||||||||||||||||||||||||||||||||
| KC Ramon | 51,621 | (38,137) | 9,214 | 22,804 | 24,878 | 47,682 | 0 | 0 | 0 | 0 | 0 | 0 | 70,380 | 4,278 | 3,057 | 1,936 | ||||||||||||||||||||||||||||||||||
| Total executive directors | 106,112 | (63,933) | 18,391 | 25,574 | 26,688 | 52,261 | 14,680 | (245) | 14,435 | 10,094 | 18,379 | 28,473 | 155,739 | 9,467 | 9,355 | 2,486 | ||||||||||||||||||||||||||||||||||
| — | — | |||||||||||||||||||||||||||||||||||||||||||||||||
| Prescribed officers | ||||||||||||||||||||||||||||||||||||||||||||||||||
| SD Bailey | 33,207 | (24,103) | 5,473 | 4,960 | 5,278 | 10,237 | 0 | 0 | 0 | 0 | 0 | 0 | 24,814 | 1,508 | 1,041 | 0 | ||||||||||||||||||||||||||||||||||
| PD Chenard | 20,559 | (8,554) | 5,557 | 0 | 0 | 0 | 3,165 | 0 | 3,165 | 6,513 | 9,012 | 15,525 | 36,252 | 2,204 | 900 | 0 | ||||||||||||||||||||||||||||||||||
| GJ Ehm | 43,973 | (32,108) | 8,612 | 20,969 | 21,781 | 42,750 | 0 | 0 | 0 | 0 | 0 | 0 | 63,227 | 3,843 | 2,536 | 1,751 | ||||||||||||||||||||||||||||||||||
| L Eybers | 44,187 | (31,896) | 8,518 | 19,688 | 21,295 | 40,983 | 0 | 0 | 0 | 0 | 0 | 0 | 61,792 | 3,756 | 2,082 | 1,233 | ||||||||||||||||||||||||||||||||||
| I Kramer | 7,698 | (6,085) | 0 | 0 | 0 | 0 | 0 | 0 | 0 | 0 | 0 | 0 | 1,613 | 98 | 0 | 0 | ||||||||||||||||||||||||||||||||||
| L Marwick | 20,413 | (16,615) | 0 | 0 | 0 | 0 | 0 | 0 | 0 | 0 | 0 | 0 | 3,798 | 231 | 0 | 0 | ||||||||||||||||||||||||||||||||||
| S Ntuli | 38,205 | (26,942) | 6,367 | 6,289 | 6,710 | 12,999 | 0 | 0 | 0 | 0 | 0 | 0 | 30,629 | 1,862 | 1,160 | 0 | ||||||||||||||||||||||||||||||||||
| ME Sanz Perez | 6,739 | 0 | 6,224 | 17,588 | 18,861 | 36,448 | 0 | 0 | 0 | 0 | 0 | 0 | 49,411 | 3,004 | 2,425 | 1,399 | ||||||||||||||||||||||||||||||||||
| TR Sibisi | 30,120 | (20,802) | 5,943 | 15,258 | 16,122 | 31,380 | 0 | 0 | 0 | 0 | 0 | 0 | 46,641 | 2,835 | 2,249 | 886 | ||||||||||||||||||||||||||||||||||
| Total prescribed officers | 245,101 | (167,105) | 46,694 | 84,752 | 90,047 | 174,797 | 3,165 | 0 | 3,165 | 6,513 | 9,012 | 15,525 | 318,177 | 19,341 | 12,393 | 5,269 | ||||||||||||||||||||||||||||||||||
(1) The fair value of the DSP comprises of a cash bonus and share awards for the year ended 31 December 2020.2022. The cash bonus is payable in February 20212023 and the share awards are allocated in February 2021.2023. Shares vest over a 53- to 5- year period in equal tranches.
(2) Reflects the sum of all the grant fair value, the sum of all the share price movements since grant to vesting date and the sum of all the vesting fair value for the vested DSP 2019, vested CSLTIP 2017, vested BSP 2018, vested CIP 2018DSP 2020, DSP 2021 and vested sign-on share awards and difference in the currency movements for the vested sign-on cash settled award.
(3)KPM Dushnisky's cash portion of the DSP 2019 award was reduced by USD800,000. This is in lieu of the sign-on bonus which Mr Dushnisky voluntarily repaid after his former employer paid him a discretionary cash incentive for the same period.
Details of the share incentive scheme awards are included below.
| Balance at 1 January 2020 | Granted | Vested, deemed settled | Forfeited/ Lapsed | Balance at 31 December 2020 | Fair value of granted awards | Fair value of vested awards(1) | Fair value of unvested awards at 31 December 2020 | |||||||||||||||||||
| ZAR'000 | ZAR'000 | ZAR'000 | ||||||||||||||||||||||||
| Executive Directors | ||||||||||||||||||||||||||
| KPM Dushnisky | 0 | 0 | 0 | 0 | 0 | 0 | 0 | 0 | ||||||||||||||||||
| KC Ramon | 27,817 | 0 | 27,817 | 0 | 0 | 0 | 9,402 | 0 | ||||||||||||||||||
| Total executive directors | 27,817 | 0 | 27,817 | 0 | 0 | 0 | 9,402 | 0 | ||||||||||||||||||
| Prescribed officers | ||||||||||||||||||||||||||
| SD Bailey | 8,306 | 0 | 8,306 | 0 | 0 | 0 | 2,807 | 0 | ||||||||||||||||||
| PD Chenard | 0 | 0 | 0 | 0 | 0 | 0 | 0 | 0 | ||||||||||||||||||
| GJ Ehm | 22,997 | 0 | 22,997 | 0 | 0 | 0 | 7,773 | 0 | ||||||||||||||||||
| L Eybers | 22,288 | 0 | 22,288 | 0 | 0 | 0 | 7,533 | 0 | ||||||||||||||||||
I Kramer (2) | 3,716 | 0 | 3,716 | 0 | 0 | 0 | 1,256 | 0 | ||||||||||||||||||
L Marwick (2) | 3,577 | 0 | 3,577 | 0 | 0 | 0 | 1,209 | 0 | ||||||||||||||||||
| S Ntuli | 10,637 | 0 | 10,637 | 0 | 0 | 0 | 3,595 | 0 | ||||||||||||||||||
| ME Sanz Perez | 19,072 | 0 | 19,072 | 0 | 0 | 0 | 6,446 | 0 | ||||||||||||||||||
| TR Sibisi | 17,705 | 0 | 17,705 | 0 | 0 | 0 | 5,984 | 0 | ||||||||||||||||||
| Total prescribed officers | 108,298 | 0 | 108,298 | 0 | 0 | 0 | 36,603 | 0 | ||||||||||||||||||
| Other management | 809,659 | 0 | 809,659 | 0 | 0 | 0 | 273,665 | 0 | ||||||||||||||||||
| Total BSP awards | 945,774 | 0 | 945,774 | 0 | 0 | 0 | 319,670 | 0 | ||||||||||||||||||
| Balance at 1 January 2020 | Granted | Vested, deemed settled | Forfeited/ Lapsed | Balance at 31 December 2020 | Fair value of granted awards | Fair value of vested awards(1) | Fair value of unvested awards at 31 December 2020 | |||||||||||||||||||
| ZAR '000 | ZAR '000 | ZAR '000 | ||||||||||||||||||||||||
| Executive directors | ||||||||||||||||||||||||||
| KPM Dushnisky | 0 | 0 | 0 | 0 | 0 | 0 | 0 | 0 | ||||||||||||||||||
| KC Ramon | 110,595 | 0 | 104,468 | 6,127 | 0 | 0 | 29,431 | 0 | ||||||||||||||||||
| Total executive directors | 110,595 | 0 | 104,468 | 6,127 | 0 | 0 | 29,431 | 0 | ||||||||||||||||||
| Prescribed officers | ||||||||||||||||||||||||||
| SD Bailey | 19,793 | 0 | 18,696 | 1,097 | 0 | 0 | 5,267 | 0 | ||||||||||||||||||
| PD Chenard | 0 | — | 0 | 0 | 0 | 0 | 0 | 0 | ||||||||||||||||||
| GJ Ehm | 110,595 | 0 | 104,468 | 6,127 | 0 | 0 | 29,431 | 0 | ||||||||||||||||||
| L Eybers | 97,535 | 0 | 92,131 | 5,404 | 0 | 0 | 25,955 | 0 | ||||||||||||||||||
I Kramer (2) | 10,143 | 0 | 9,581 | 562 | 0 | 0 | 2,661 | 0 | ||||||||||||||||||
L Marwick (2) | 7,749 | 0 | 7,319 | 430 | 0 | 0 | 2,033 | 0 | ||||||||||||||||||
| S Ntuli | 25,173 | 0 | 23,778 | 1,395 | 0 | 0 | 6,699 | 0 | ||||||||||||||||||
| ME Sanz Perez | 88,463 | 0 | 83,562 | 4,901 | 0 | 0 | 23,541 | 0 | ||||||||||||||||||
| TR Sibisi | 75,971 | 0 | 71,762 | 4,209 | 0 | 0 | 20,217 | 0 | ||||||||||||||||||
| Total prescribed officers | 435,422 | 0 | 411,297 | 24,125 | 0 | 0 | 115,804 | 0 | ||||||||||||||||||
| Other management | 934,545 | 0 | 882,734 | 51,811 | 0 | 0 | 245,197 | 0 | ||||||||||||||||||
| Total LTIP awards | 1,480,562 | 0 | 1,398,499 | 82,063 | 0 | 0 | 390,432 | 0 | ||||||||||||||||||
| Balance at 1 January 2020 | Granted | Matched | Forfeited/ Lapsed | Balance at 31 December 2020 | Fair value of granted awards | Fair value of matched awards(1) | Fair value of unvested matched at 31 December 2020 | |||||||||||||||||||
| ZAR '000 | ZAR '000 | ZAR '000 | ||||||||||||||||||||||||
| Executive directors | ||||||||||||||||||||||||||
| KPM Dushnisky | 0 | 0 | 0 | 0 | 0 | 0 | 0 | 0 | ||||||||||||||||||
| KC Ramon | 8,475 | 0 | 8,475 | 0 | 0 | 0 | 2,780 | 0 | ||||||||||||||||||
| Total executive directors | 8,475 | 0 | 8,475 | 0 | 0 | 0 | 2,780 | 0 | ||||||||||||||||||
| Prescribed officers | ||||||||||||||||||||||||||
| SD Bailey | 0 | 0 | 0 | 0 | 0 | 0 | 0 | 0 | ||||||||||||||||||
| PD Chenard | 0 | 0 | 0 | 0 | 0 | 0 | 0 | 0 | ||||||||||||||||||
| GJ Ehm | 0 | 0 | 0 | 0 | 0 | 0 | 0 | 0 | ||||||||||||||||||
| L Eybers | 6,590 | 0 | 6,590 | 0 | 0 | 0 | 2,264 | 0 | ||||||||||||||||||
| I Kramer | 0 | 0 | 0 | 0 | 0 | 0 | 0 | 0 | ||||||||||||||||||
| L Marwick | 0 | 0 | 0 | 0 | 0 | 0 | 0 | 0 | ||||||||||||||||||
| S Ntuli | 0 | 0 | 0 | 0 | 0 | 0 | 0 | 0 | ||||||||||||||||||
| ME Sanz Perez | 5,742 | 0 | 5,742 | 0 | 0 | 0 | 1,883 | 0 | ||||||||||||||||||
| TR Sibisi | 3,120 | 0 | 3,120 | 0 | 0 | 0 | 891 | 0 | ||||||||||||||||||
| Total prescribed officers | 15,452 | 0 | 15,452 | 0 | 0 | 0 | 5,038 | 0 | ||||||||||||||||||
| Other management | 0 | 0 | 0 | 0 | 0 | 0 | 0 | 0 | ||||||||||||||||||
| Total CIP awards | 23,927 | 0 | 23,927 | 0 | 0 | 0 | 7,818 | 0 | ||||||||||||||||||
Sign-on share awards
| Balance at 1 January 2020 | Granted | Vested deemed settled | Forfeited/ Lapsed | Balance at 31 December 2020 | Fair value of granted awards(1) | Fair value of vested awards(2) | Fair value of unvested awards at 31 December 2020(3) | |||||||||||||||||||
| ZAR '000 | ZAR '000 | ZAR '000 | ||||||||||||||||||||||||
| Executive directors | ||||||||||||||||||||||||||
| KPM Dushnisky | 175,878 | 0 | 87,939 | 0 | 87,939 | 0 | 28,473 | 30,121 | ||||||||||||||||||
| Total executive directors | 175,878 | 0 | 87,939 | 0 | 87,939 | 0 | 28,473 | 30,121 | ||||||||||||||||||
| Prescribed officers | ||||||||||||||||||||||||||
| PD Chenard | 64,951 | 0 | 32,475 | 0 | 32,476 | 0 | 15,525 | 11,124 | ||||||||||||||||||
| Total prescribed officers | 64,951 | 0 | 32,475 | 0 | 32,476 | 0 | 15,525 | 11,124 | ||||||||||||||||||
| Total sign-on share awards | 240,829 | 0 | 120,414 | 0 | 120,415 | 0 | 43,998 | 41,245 | ||||||||||||||||||
| Balance at 1 January 2022 | Granted | Vested deemed settled | Balance at 31 December 2022 | Fair value of granted awards(1) | Fair value of vested awards(2) | Fair value of unvested awards at 31 December 2022(3) | ||||||||||||||||||||
| ZAR '000 | ZAR '000 | ZAR '000 | ||||||||||||||||||||||||
| Prescribed officers | ||||||||||||||||||||||||||
| L Ali | — | 44,233 | 20,337 | 23,896 | 13,586 | 4,869 | 7,867 | |||||||||||||||||||
| TJ Briggs | — | 47,004 | — | 47,004 | 14,437 | — | 15,475 | |||||||||||||||||||
| M Godoy | 107,353 | — | 48,309 | 59,044 | — | 18,120 | 19,439 | |||||||||||||||||||
| Total prescribed officers | 107,353 | 91,237 | 68,646 | 129,944 | 28,023 | 22,989 | 42,781 | |||||||||||||||||||
Other management (4) | 4,553 | — | 2,500 | 2,053 | — | 631 | 676 | |||||||||||||||||||
| Total sign-on share awards | 111,906 | 91,237 | 71,146 | 131,997 | 28,023 | 23,620 | 43,457 | |||||||||||||||||||
(1) The fair value of granted awards represents the value of awards, calculated using a five business day volume weighted average share price prior to grant date. The share awards were granted on start date and will vest over a 2-year2- to 3-year period in equal tranches in accordance with the JSE Listing requirements.Listings Requirements.
(2) The fair value of KDM Dushnisky's vested awards representsrepresent the value received on settlement date, 26 February 2020. The fair value of PD Chenard's vested awards represents the value received on settlement date, 12 May 2020.date.
(3) The fair value of unvested awards is calculated using the closing share price as at 31 December.
F - 7673
DSP awards
| Balance at 1 January 2020 | Granted | Vested, deemed settled | Forfeited/ Lapsed | Balance at 31 December 2020 | Fair value of granted awards(1) | Fair value of vested awards(2) | Fair value of unvested awards at 31 December 2019(3) | |||||||||||||||||||
| ZAR '000 | ZAR '000 | ZAR '000 | ||||||||||||||||||||||||
| Executive directors | ||||||||||||||||||||||||||
| KPM Dushnisky | 67,742 | 128,719 | 13,548 | 0 | 182,913 | 41,959 | 4,579 | 62,651 | ||||||||||||||||||
| KC Ramon | 89,782 | 62,595 | 17,956 | 0 | 134,421 | 20,404 | 6,069 | 46,042 | ||||||||||||||||||
| Total executive directors | 157,524 | 191,314 | 31,504 | 0 | 317,334 | 62,363 | 10,648 | 108,693 | ||||||||||||||||||
| Prescribed officers | ||||||||||||||||||||||||||
| SD Bailey | 19,196 | 39,635 | 6,398 | 0 | 52,433 | 12,920 | 2,163 | 17,959 | ||||||||||||||||||
| PD Chenard | 0 | 40,251 | 0 | 0 | 40,251 | 13,121 | 0 | 13,787 | ||||||||||||||||||
| GJ Ehm | 82,037 | 54,574 | 16,407 | 0 | 120,204 | 17,789 | 5,546 | 41,172 | ||||||||||||||||||
| L Eybers | 77,380 | 53,982 | 15,476 | 0 | 115,886 | 17,597 | 5,231 | 39,693 | ||||||||||||||||||
I Kramer(5) | 7,759 | 9,012 | 3,879 | 0 | 12,892 | 2,938 | 1,311 | 4,416 | ||||||||||||||||||
L Marwick(5) | 6,170 | 8,397 | 3,085 | 0 | 11,482 | 2,737 | 1,043 | 3,933 | ||||||||||||||||||
| S Ntuli | 24,006 | 46,110 | 8,002 | 0 | 62,114 | 15,030 | 2,705 | 21,275 | ||||||||||||||||||
ME Sanz Perez(4) | 67,712 | 45,068 | 13,542 | 99,238 | 0 | 14,691 | 4,577 | 0 | ||||||||||||||||||
| TR Sibisi | 63,424 | 43,035 | 12,684 | 0 | 93,775 | 14,028 | 4,287 | 32,120 | ||||||||||||||||||
| Total prescribed officers | 347,684 | 340,064 | 79,473 | 99,238 | 509,037 | 110,851 | 26,863 | 174,355 | ||||||||||||||||||
| Other management | 1,094,152 | 645,154 | 403,017 | 56,337 | 1,279,952 | 210,300 | 136,220 | 438,408 | ||||||||||||||||||
| Total DSP awards | 1,599,360 | 1,176,532 | 513,994 | 155,575 | 2,106,323 | 383,514 | 173,731 | 721,456 | ||||||||||||||||||
| Balance at 1 January 2022 | Granted | Vested, deemed settled | Forfeited/ Lapsed | Balance at 31 December 2022 | Fair value of granted awards(1) | Fair value of vested awards(2) | Fair value of unvested awards at 31 December 2022(3) | |||||||||||||||||||
| ZAR '000 | ZAR '000 | ZAR '000 | ||||||||||||||||||||||||
| Executive directors | ||||||||||||||||||||||||||
| A Calderon | — | 41,601 | — | — | 41,601 | 13,938 | — | 13,696 | ||||||||||||||||||
| KC Ramon | 183,487 | 58,442 | 46,383 | — | 195,546 | 19,580 | 15,840 | 64,380 | ||||||||||||||||||
| Total executive directors | 183,487 | 100,043 | 46,383 | — | 237,147 | 33,518 | 15,840 | 78,076 | ||||||||||||||||||
| Prescribed officers | ||||||||||||||||||||||||||
| SD Bailey | 90,037 | 33,127 | 24,712 | — | 98,452 | 11,099 | 8,477 | 32,413 | ||||||||||||||||||
VA Chamberlain(4) | 27,159 | 12,986 | 26,547 | 13,598 | — | 4,351 | 7,761 | — | ||||||||||||||||||
| L Eybers | 162,348 | 43,252 | 40,818 | — | 164,782 | 14,491 | 13,953 | 54,251 | ||||||||||||||||||
| MC Godoy | — | 10,180 | — | — | 10,180 | 3,411 | — | 3,352 | ||||||||||||||||||
| I Kramer | 17,824 | 9,776 | 6,942 | — | 20,658 | 3,275 | 2,401 | 6,801 | ||||||||||||||||||
| L Marwick | 41,821 | 28,814 | 10,043 | — | 60,592 | 9,654 | 3,515 | 19,949 | ||||||||||||||||||
| Total prescribed officers | 339,189 | 138,135 | 109,062 | 13,598 | 354,664 | 46,281 | 36,107 | 116,766 | ||||||||||||||||||
Other management(5) | 1,581,013 | 555,777 | 788,105 | 150,099 | 1,198,586 | 186,208 | 234,197 | 394,610 | ||||||||||||||||||
| Total DSP awards | 2,103,689 | 793,955 | 943,550 | 163,697 | 1,790,397 | 266,007 | 286,144 | 589,452 | ||||||||||||||||||
(1) The fair value of granted awards represents the value of awards, calculated using a five-business day volume weighted average share price prior to grant date, 2524 February 2020.2022.
(2) The fair value of vested awards represents the value deemed received on settlement date.
(3) The fair value of unvested awards is calculated using the closing share price as at 31 December.
(4) Share awards lapsed due to resignation.retirement.
(5)The awards for other management for the 2021 comparative period include awards for Mr PD Chenard, who retired 31 January 2021, Mr GH Ehm, who retired 31 December 2021, Mr S Ntuli, who separated from the Company due to the reconfigured Operating Model effective 31 December 2021, and Ms TR Sibisi, who resigned effective 30 September 2021.Opening balances were included as part of Other management.
Non-Executive Directors’ fees and allowances
The table below details the fees payable to non-executive directors in accordance withduring the Company’s shareholderyear as approved policy together with allowancesby shareholders:
| Figures in thousands | Figures in thousands | |||||||||||||||||||
Director fees(1) | Committee fees | Travel allowance | Total | Total | Total | |||||||||||||||
| US Dollars | 2022 | 2021 | 2020 | |||||||||||||||||
| MDC Ramos (Chairperson) | 308,800 | 56,000 | 8,750 | 373,550 | 451 | 202 | ||||||||||||||
| R Gasant (Lead independent director) | 166,700 | 104,500 | 10,000 | 281,200 | 296 | 223 | ||||||||||||||
| KOF Busia | 125,900 | 86,500 | 26,250 | 238,650 | 240 | 103 | ||||||||||||||
| AM Ferguson | 125,900 | 89,000 | 33,750 | 248,650 | 255 | 197 | ||||||||||||||
| AH Garner | 125,900 | 50,500 | 13,750 | 190,150 | 202 | 174 | ||||||||||||||
| SP Lawson | 125,900 | 50,500 | 18,750 | 195,150 | — | — | ||||||||||||||
NVB Magubane (2) | 95,300 | 30,000 | 8,750 | 134,050 | 178 | 171 | ||||||||||||||
| MDC Richter | 125,900 | 85,500 | 18,750 | 230,150 | 250 | 209 | ||||||||||||||
| JE Tilk | 125,900 | 110,000 | 23,750 | 259,650 | 279 | 206 | ||||||||||||||
| Total fees for 2022 | 1,326,200 | 662,500 | 162,500 | 2,151,200 | 2,151 | 1,485 | ||||||||||||||
(1) Includes the annual base fee paid in the year. It is to be noted that certain non-executive directors either waived an element of theirNEDs as well as fees or donated part of theirpaid for special board meetings.
(2) NVB Magubane passed away on 30 October 2022. The amounts include fees paid up to the South African Solidarity Fund or associated funds, and as such the table does not reflect the fees that were actually paid or received by these non-executive directors:
| Figures in thousands | Figures in thousands | |||||||||||||||||||
| Director fees | Committee fees | Travel allowance | Total | Total | Total | |||||||||||||||
| US Dollars | 2019 | 2020 | 2019 | 2018 | ||||||||||||||||
| M Ramos (Chairperson) | 130,500 | 71,875 | 0 | 202,375 | 107 | 0 | ||||||||||||||
| R Gasant (Lead independent director) | 150,500 | 72,000 | 0 | 222,500 | 193 | 229 | ||||||||||||||
KOF Busia (1) | 63,500 | 28,500 | 11,250 | 103,250 | 0 | 0 | ||||||||||||||
| AM Ferguson | 130,500 | 59,000 | 7,500 | 197,000 | 217 | 52 | ||||||||||||||
| AH Garner | 130,500 | 35,500 | 7,500 | 173,500 | 196 | 200 | ||||||||||||||
NP January-Bardill(2) | 33,500 | 16,625 | 0 | 50,125 | 186 | 198 | ||||||||||||||
NVB Magubane (3) | 130,500 | 40,000 | 0 | 170,500 | 0 | 0 | ||||||||||||||
| MDC Richter | 130,500 | 67,000 | 11,250 | 208,750 | 230 | 235 | ||||||||||||||
RJ Ruston(2) | 33,500 | 13,125 | 10,000 | 56,625 | 218 | 261 | ||||||||||||||
| JE Tilk | 130,500 | 67,875 | 7,500 | 205,875 | 231 | 0 | ||||||||||||||
SM Pityana (Chairman)(4) | 329,000 | 77,250 | 0 | 406,250 | 387 | 441 | ||||||||||||||
| Total fees for 2020 | 1,393,000 | 548,750 | 55,000 | 1,996,750 | 1,965 | 1,616 | ||||||||||||||
Non-Executive Directors do not hold service contracts with the Company. Executive Directors do not receive payment of directors’ fees or committee fees.
F - 7874
Directors’ and Prescribed Officers’ interests in AngloGold Ashanti shares (continued)
The interests of directors, prescribed officers and their associates in the ordinary shares of the Company at 31 December, which individually did not exceed 1% of the Company’s issued ordinary share capital, were:
31 December 2020 Beneficial holding | 31 December 2019 Beneficial holding | 31 December 2018 Beneficial holding | ||||||||||||||||||
| Direct | Indirect | Direct | Indirect | Direct | Indirect | |||||||||||||||
| Non-Executive directors | ||||||||||||||||||||
MDC Richter(1) | 9,300 | 0 | 9,300 | 0 | 9,300 | 0 | ||||||||||||||
AH Garner(1) | 17,500 | 0 | 17,500 | 0 | 17,500 | 0 | ||||||||||||||
RJ Ruston(2) | 0 | 1,000 | 0 | 1,000 | 0 | 1,000 | ||||||||||||||
| Total | 26,800 | 1,000 | 26,800 | 1,000 | 26,800 | 1,000 | ||||||||||||||
| Executive directors | ||||||||||||||||||||
KPM Dushnisky (1) | 38,168 | 0 | 131,730 | 0 | 50,000 | 0 | ||||||||||||||
| KC Ramon | 91,949 | 0 | 59,124 | 0 | 51,062 | 0 | ||||||||||||||
| Total | 130,117 | 0 | 190,854 | 0 | 101,062 | 0 | ||||||||||||||
| Company Secretary | ||||||||||||||||||||
| L Marwick | 0 | 0 | 0 | 0 | 0 | 0 | ||||||||||||||
| Total | 0 | 0 | 0 | 0 | 0 | 0 | ||||||||||||||
| Prescribed officers | ||||||||||||||||||||
SD Bailey(1) | 8,609 | 0 | 1,190 | 0 | 0 | 0 | ||||||||||||||
| PD Chenard | 13,194 | 0 | 0 | 0 | 0 | 0 | ||||||||||||||
GJ Ehm(2) | 50,443 | 12,213 | 35,058 | 16,213 | 35,058 | 16,213 | ||||||||||||||
| L Eybers | 28,466 | 0 | 18,164 | 0 | 17,207 | 0 | ||||||||||||||
| I Kramer | 0 | 0 | 0 | 0 | 0 | 0 | ||||||||||||||
| S Ntuli | 6,421 | 0 | 0 | 0 | 0 | 0 | ||||||||||||||
| TR Sibisi | 34,359 | 0 | 13,283 | 0 | 9,914 | 0 | ||||||||||||||
| Total | 141,492 | 12,213 | 67,695 | 16,213 | 62,179 | 16,213 | ||||||||||||||
| Grand total | 298,409 | 13,213 | 285,349 | 17,213 | 190,041 | 17,213 | ||||||||||||||
31 December 2022 Beneficial holding | 31 December 2021 Beneficial holding | 31 December 2020 Beneficial holding | ||||||||||||||||||
| US Dollars | Direct | Indirect | Direct | Indirect | Direct | Indirect | ||||||||||||||
| Non-Executive directors | ||||||||||||||||||||
KOF Busia(1) | 2,000 | — | 2,000 | — | — | — | ||||||||||||||
AM Ferguson(1) | 5,000 | — | 5,000 | — | — | — | ||||||||||||||
MDC Richter(1) | 10,300 | 1,000 | 10,300 | — | 9,300 | — | ||||||||||||||
AH Garner(1) | 22,500 | — | 17,500 | — | 17,500 | — | ||||||||||||||
J Tilk(1) | 2,800 | — | — | — | — | — | ||||||||||||||
S Lawson(1) | 2,830 | — | — | — | — | — | ||||||||||||||
| Total | 45,430 | 1,000 | 34,800 | — | 26,800 | — | ||||||||||||||
| Executive directors | ||||||||||||||||||||
A Calderon (1)(2) | 26,370 | — | 4,690 | — | — | — | ||||||||||||||
| KC Ramon | — | — | — | — | — | — | ||||||||||||||
| Total | 26,370 | — | 4,690 | — | — | — | ||||||||||||||
| Prescribed officers | ||||||||||||||||||||
SD Bailey (1) | 13,039 | — | 12,867 | — | 8,609 | — | ||||||||||||||
L Eybers (2) | 28,466 | — | 28,466 | — | 28,466 | — | ||||||||||||||
MC Godoy (1) | 32,643 | — | — | — | — | — | ||||||||||||||
| I Kramer | 376 | — | — | — | — | — | ||||||||||||||
| Total | 74,524 | — | 41,333 | — | 37,075 | — | ||||||||||||||
| Grand total | 146,324 | 1,000 | 80,823 | — | 63,875 | — | ||||||||||||||
(1)Held on the New York stock exchange as American Depositary Shares (ADSs) (1 ADS is equivalent to 1 ordinary share)
(2)Held on the Australian stocksecurities exchange as CHESS Depositary Receipts (5 CDIs are equivalent to 1 ordinary share)
A register detailing Directors and Prescribed Officers’ interests in contracts is available for inspection at the Company’s registered and corporate office.
There arewere no changes in Director'sDirectors' and Prescribed Officers' interests in AngloGold Ashanti shares, afterexcluding options and awards granted in terms of the Group's DSP scheme, subsequent to 31 December 2020 up to the date of this report.2022.
F - 7975
| US Dollars | ||||||||||||||||||||
| Figures in millions | 2020 | 2019 | 2018 | |||||||||||||||||
| Capital commitments | ||||||||||||||||||||
| Acquisition of tangible assets | ||||||||||||||||||||
| Contracted for | 120 | 161 | 99 | |||||||||||||||||
| Not contracted for | 367 | 426 | 792 | |||||||||||||||||
Authorised by the directors (1) | 487 | 587 | 891 | |||||||||||||||||
| Allocated to: | ||||||||||||||||||||
| Project capital | ||||||||||||||||||||
| - within one year | 216 | 288 | 446 | |||||||||||||||||
| - thereafter | 71 | 162 | 308 | |||||||||||||||||
| 287 | 450 | 754 | ||||||||||||||||||
| Stay-in-business capital | ||||||||||||||||||||
| - within one year | 200 | 117 | 125 | |||||||||||||||||
| - thereafter | 0 | 20 | 12 | |||||||||||||||||
| 200 | 137 | 137 | ||||||||||||||||||
| Share of underlying capital commitments of joint ventures included above | 12 | 2 | 91 | |||||||||||||||||
Purchase obligations (2) | ||||||||||||||||||||
| Contracted for | ||||||||||||||||||||
| - within one year | 391 | 506 | 305 | |||||||||||||||||
| - thereafter | 882 | 579 | 658 | |||||||||||||||||
| 1,273 | 1,085 | 963 | ||||||||||||||||||
| US Dollars | ||||||||||||||||||||
| Figures in millions | 2022 | 2021 | 2020 | |||||||||||||||||
| Capital commitments | ||||||||||||||||||||
| Acquisition of tangible assets | ||||||||||||||||||||
| Contracted for | 178 | 146 | 120 | |||||||||||||||||
| Not contracted for | 259 | 547 | 367 | |||||||||||||||||
| Authorised by the directors | 437 | 693 | 487 | |||||||||||||||||
| Allocated to: | ||||||||||||||||||||
| Project capital | ||||||||||||||||||||
| - within one year | 155 | 337 | 216 | |||||||||||||||||
| - thereafter | 39 | 64 | 71 | |||||||||||||||||
| 194 | 401 | 287 | ||||||||||||||||||
| Stay-in-business capital | ||||||||||||||||||||
| - within one year | 243 | 292 | 200 | |||||||||||||||||
| 243 | 292 | 200 | ||||||||||||||||||
| Share of underlying capital commitments of joint ventures included above | — | 4 | 12 | |||||||||||||||||
| Purchase obligations | ||||||||||||||||||||
| Contracted for | ||||||||||||||||||||
| - within one year | 436 | 423 | 391 | |||||||||||||||||
| - thereafter | 575 | 624 | 882 | |||||||||||||||||
| 1,011 | 1,047 | 1,273 | ||||||||||||||||||
Purchase obligations
Purchase obligations represent contractual obligations for the purchase of mining contract services, power, supplies, consumables, inventories, explosives and activated carbon.
To service these capital commitments, purchase obligations and other operational requirements, the groupGroup is dependent on existing cash resources, cash generated from operations and borrowing facilities.
Cash generated from operations is subject to operational, market and other risks. Distributions from operations may be subject to foreign investment, exchange control laws and regulations, and the quantity of foreign exchange available in offshore countries. In addition, distributions from joint ventures are subject to the relevant board approval.
The credit facilities and other finance arrangements contain financial covenants and other similar undertakings. To the extent that external borrowings are required, the group’sGroup's covenant performance indicates that existing financing facilities will be available to meet the commitments detailed above. To the extent that any of the financing facilities mature in the near future, the groupGroup believes that sufficient measures are in place to ensure that these facilities can be refinanced.
| US Dollars | |||||||||||||||||
| Figures in millions | 2020 | 2019 | 2018 | ||||||||||||||
| Contingent liabilities | |||||||||||||||||
Litigation - Ghana(1)(2) | 97 | 97 | 97 | ||||||||||||||
| 97 | 97 | 97 | |||||||||||||||
Litigation claims
F - 76
NOTES TO THE CONSOLIDATED FINANCIAL STATEMENTS (continued)
32 Contractual commitments and contingencies (continued)
Tax claims
For a discussion on tax claims and tax uncertainties refer to note 12.
F - 8177
In the normal course of its operations, the groupGroup is exposed to gold price, other commodity price, foreign exchange, interest rate, liquidity, equity price (deemed to be immaterial) and credit risks. In order to manage these risks, the groupGroup may enter into transactions which make use of both on- and off-balance sheet derivatives. The groupGroup does not acquire, hold or issue derivatives for speculative purposes. The groupGroup has developed a comprehensive risk management process to facilitate, control and monitor these risks. The board has approved and monitors this risk management process, inclusive of documented treasury policies, counterparty limits and controlling and reporting structures.
Managing risk in the groupGroup
Risk management activities within the groupGroup are the ultimate responsibility of the board of directors. The Chief Financial Officer is responsible to the board of directors for the design, implementation and monitoring of the risk management plan. The Audit and Risk Committee is responsible for overseeing risk management plans and systems, as well as financial risks which include a review of treasury activities and the group’sGroup’s counterparties.
The financial risk management objectives of the groupGroup are defined as follows:
•safeguarding the group’sGroup’s core earnings stream from its major assets through the effective control and management of gold price risk, other commodity risk, foreign exchange risk and interest rate risk;
•effective and efficient usage of credit facilities in both the short and long-term through the adoption of reliable liquidity management planning and procedures;
•ensuring that investment and hedging transactions are undertaken with creditworthy counterparties; and
•ensuring that all contracts and agreements related to risk management activities are co-ordinated, consistent throughout the groupGroup and that they comply where necessary with all relevant regulatory and statutory requirements.
Gold price and foreign exchange risk
Gold price risk arises from the risk of an adverse effect on current or future earnings resulting from fluctuations in the price of gold. The groupGroup has transactional foreign exchange exposures, which arise from sales or purchases by an operating unit in currencies other than the unit's functional currency. The gold market is predominately priced in US dollars which exposes the groupGroup to the risk of fluctuations in the SA rand/US dollar, Brazilian real/US dollar, Argentinean peso/US dollar and Australian dollar/US dollar exchange rates.
The group had no commitmentsGroup makes use of derivative financial instruments to mitigate price movements on crude oil purchases. In July 2022, AngloGold Ashanti entered into forward agreements for a total of 999,000 barrels of Brent crude oil for the period January 2023 to December 2023 that will be cash settled on a monthly basis against future production potentially settled in cash.the contract price. The average price achieved on the forward contracts is $89.20 per barrel.
Interest rate and liquidity risk
The groupGroup manages liquidity risk by ensuring that there isit has sufficient committed borrowing and banking facilities after taking into consideration the actual and forecast cash flows, in order to meet the group'sGroup's short, medium and long term funding and liquidity management requirements.
In the ordinary course of business, the groupGroup receives cash from the proceeds of its gold sales and is required to fund its working capital and capital expenditure requirements. This cash is managed to ensure surplus funds are invested in a manner to achieve market-related returns whilst minimising risks. The groupGroup is able to actively source financing at competitive rates. The counter parties are financial and banking institutions and their credit ratings are regularly monitored.
The groupGroup has sufficient undrawn borrowing facilities available to fund its working capital and capital requirements (notes 2624 and 36)34).
F - 8278
NOTES TO THE CONSOLIDATED FINANCIAL STATEMENTS (continued)
The following are the contractual maturities of financial liabilities, including interest payments:payments, are as follows:
Financial liabilities
| Within one year | Between one and two years | Between two and five years | After five years | Total | ||||||||||||||||||||||||||||||||||||||||||||||||||||
| 2022 | $ millions | Effective rate % | $ millions | Effective rate % | $ millions | Effective rate % | $ millions | Effective rate % | $ millions | |||||||||||||||||||||||||||||||||||||||||||||||
Trade and other payables (1) | 680 | — | 7 | — | 687 | |||||||||||||||||||||||||||||||||||||||||||||||||||
| Bank overdraft | 2 | 2 | ||||||||||||||||||||||||||||||||||||||||||||||||||||||
| Borrowings | 102 | 249 | 326 | 2,098 | 2,775 | |||||||||||||||||||||||||||||||||||||||||||||||||||
| - In USD | 88 | 4.6 | 150 | 4.6 | 284 | 4.2 | 2,098 | 4.1 | 2,620 | |||||||||||||||||||||||||||||||||||||||||||||||
| - AUD in USD equivalent | 2 | 4.5 | 2 | 4.5 | 42 | 4.5 | 46 | |||||||||||||||||||||||||||||||||||||||||||||||||
| - TZS in USD equivalent | 12 | 12.5 | 97 | 12.5 | — | 109 | ||||||||||||||||||||||||||||||||||||||||||||||||||
| 2021 | ||||||||||||||||||||||||||||||||||||||||||||||||||||||||
| Trade and other payables | 616 | 7 | — | — | 623 | |||||||||||||||||||||||||||||||||||||||||||||||||||
| Borrowings | 119 | 115 | 332 | 2,169 | 2,735 | |||||||||||||||||||||||||||||||||||||||||||||||||||
| - In USD | 113 | 4.3 | 76 | 4.2 | 280 | 4.1 | 2,169 | 4.1 | 2,638 | |||||||||||||||||||||||||||||||||||||||||||||||
| - AUD in USD equivalent | — | 1.5 | 33 | 1.5 | — | — | — | — | 33 | |||||||||||||||||||||||||||||||||||||||||||||||
| - TZS in USD equivalent | 6 | 12.5 | 6 | 12.5 | 52 | 12.5 | — | — | 64 | |||||||||||||||||||||||||||||||||||||||||||||||
| 2020 | ||||||||||||||||||||||||||||||||||||||||||||||||||||||||
| Trade and other payables | 597 | 8 | — | — | 605 | |||||||||||||||||||||||||||||||||||||||||||||||||||
| Borrowings | 205 | 901 | 137 | 1,414 | 2,657 | |||||||||||||||||||||||||||||||||||||||||||||||||||
| - In USD | 158 | 5.0 | 901 | 5.0 | 137 | 4.6 | 1,414 | 4.6 | 2,610 | |||||||||||||||||||||||||||||||||||||||||||||||
| - TZS in USD equivalent | 47 | 12.5 | — | — | — | — | — | — | 47 | |||||||||||||||||||||||||||||||||||||||||||||||
| Within one year | Between one and two years | Between two and five years | After five years | Total | ||||||||||||||||||||||||||||||||||||||||||||||||||||
| 2020 | $ millions | Effective rate % | $ millions | Effective rate % | $ millions | Effective rate % | $ millions | Effective rate % | $ millions | |||||||||||||||||||||||||||||||||||||||||||||||
| Trade and other payables | 627 | 8 | 0 | 0 | 635 | |||||||||||||||||||||||||||||||||||||||||||||||||||
| Borrowings | 205 | 901 | 137 | 1,414 | 2,657 | |||||||||||||||||||||||||||||||||||||||||||||||||||
| - In USD | 158 | 5.0 | 901 | 5.0 | 137 | 4.6 | 1,414 | 4.6 | 2,610 | |||||||||||||||||||||||||||||||||||||||||||||||
| - TZS in USD equivalent | 47 | 12.5 | 0 | 0 | 0 | 0 | 0 | 0 | 47 | |||||||||||||||||||||||||||||||||||||||||||||||
| 2019 | ||||||||||||||||||||||||||||||||||||||||||||||||||||||||
| Trade and other payables | 586 | 15 | 0 | 0 | 601 | |||||||||||||||||||||||||||||||||||||||||||||||||||
| Borrowings | 802 | 185 | 1,012 | 602 | 2,601 | |||||||||||||||||||||||||||||||||||||||||||||||||||
| - In USD | 790 | 5.8 | 132 | 6.0 | 913 | 6.1 | 602 | 6.5 | 2,437 | |||||||||||||||||||||||||||||||||||||||||||||||
| - AUD in USD equivalent | 0 | 2.3 | 0 | 2.3 | 22 | 2.3 | 0 | 0 | 22 | |||||||||||||||||||||||||||||||||||||||||||||||
| - TZS in USD equivalent | 6 | 12.5 | 47 | 12.5 | 0 | 0 | 0 | 0 | 53 | |||||||||||||||||||||||||||||||||||||||||||||||
| - ZAR in USD equivalent | 6 | 8.1 | 6 | 8.1 | 77 | 8.1 | 0 | 0 | 89 | |||||||||||||||||||||||||||||||||||||||||||||||
| 2018 | ||||||||||||||||||||||||||||||||||||||||||||||||||||||||
| Trade and other payables | 562 | 0 | 0 | 0 | 562 | |||||||||||||||||||||||||||||||||||||||||||||||||||
| Gold and oil derivative contracts | 9 | 0 | 0 | 0 | 9 | |||||||||||||||||||||||||||||||||||||||||||||||||||
| Borrowings | 133 | 836 | 1,120 | 663 | 2,752 | |||||||||||||||||||||||||||||||||||||||||||||||||||
| - In USD | 112 | 5.8 | 790 | 5.8 | 1,025 | 6.0 | 622 | 6.5 | 2,549 | |||||||||||||||||||||||||||||||||||||||||||||||
| - AUD in USD equivalent | 7 | 6.8 | 7 | 6.8 | 23 | 6.8 | 26 | 6.8 | 63 | |||||||||||||||||||||||||||||||||||||||||||||||
| - TZS in USD equivalent | 5 | 12.5 | 3 | 12.5 | 29 | 12.5 | 0 | 0 | 37 | |||||||||||||||||||||||||||||||||||||||||||||||
| - ZAR in USD equivalent | 9 | 9.0 | 36 | 9.0 | 43 | 9.7 | 15 | 14.7 | 103 | |||||||||||||||||||||||||||||||||||||||||||||||
The table below provides a breakdown of the contractual maturities including interest payments of the lease liabilities.
| Within one year | Between one and two years | Between two and five years | After five years | Total | ||||||||||||||||||||||||||||||||||||||||
| 2022 | $ millions | $ millions | $ millions | $ millions | $ millions | |||||||||||||||||||||||||||||||||||||||
| Lease liabilities | 79 | 63 | 59 | 2 | 203 | |||||||||||||||||||||||||||||||||||||||
| - In USD | 39 | 28 | 12 | — | 79 | |||||||||||||||||||||||||||||||||||||||
| - AUD in USD equivalent | 24 | 21 | 36 | 2 | 83 | |||||||||||||||||||||||||||||||||||||||
| - BRL in USD equivalent | 15 | 13 | 9 | — | 37 | |||||||||||||||||||||||||||||||||||||||
| - ZAR in USD equivalent | 1 | 1 | 2 | — | 4 | |||||||||||||||||||||||||||||||||||||||
| 2021 | ||||||||||||||||||||||||||||||||||||||||||||
| Lease liabilities | 68 | 50 | 74 | 10 | 202 | |||||||||||||||||||||||||||||||||||||||
| - In USD | 32 | 19 | 13 | — | 64 | |||||||||||||||||||||||||||||||||||||||
| - AUD in USD equivalent | 24 | 23 | 51 | 10 | 108 | |||||||||||||||||||||||||||||||||||||||
| - BRL in USD equivalent | 10 | 7 | 6 | — | 23 | |||||||||||||||||||||||||||||||||||||||
| - ZAR in USD equivalent | 2 | 1 | 4 | — | 7 | |||||||||||||||||||||||||||||||||||||||
| 2020 | ||||||||||||||||||||||||||||||||||||||||||||
| Lease liabilities | 42 | 31 | 68 | 19 | 160 | |||||||||||||||||||||||||||||||||||||||
| - In USD | 10 | 4 | 6 | — | 20 | |||||||||||||||||||||||||||||||||||||||
| - AUD in USD equivalent | 22 | 21 | 58 | 19 | 120 | |||||||||||||||||||||||||||||||||||||||
| - BRL in USD equivalent | 7 | 5 | 4 | — | 16 | |||||||||||||||||||||||||||||||||||||||
| - ZAR in USD equivalent | 3 | 1 | — | — | 4 | |||||||||||||||||||||||||||||||||||||||
| Within one year | Between one and two years | Between two and five years | After five years | Total | ||||||||||||||||||||||||||||||||||||||||||||||||||||
| 2020 | $ millions | Effective rate % | $ millions | Effective rate % | $ millions | Effective rate % | $ millions | Effective rate % | $ millions | |||||||||||||||||||||||||||||||||||||||||||||||
| Lease liabilities | 42 | 31 | 68 | 19 | 160 | |||||||||||||||||||||||||||||||||||||||||||||||||||
| - In USD | 10 | 6.1 | 4 | 6.1 | 6 | 6.1 | 0 | 0 | 20 | |||||||||||||||||||||||||||||||||||||||||||||||
| - AUD in USD equivalent | 22 | 4.7 | 21 | 4.7 | 58 | 4.7 | 19 | 4.7 | 120 | |||||||||||||||||||||||||||||||||||||||||||||||
| - BRL in USD equivalent | 7 | 8.4 | 5 | 8.4 | 4 | 8.4 | 0 | 0 | 16 | |||||||||||||||||||||||||||||||||||||||||||||||
| - ZAR in USD equivalent | 3 | 9.8 | 1 | 9.8 | 0 | 0 | 0 | 0 | 4 | |||||||||||||||||||||||||||||||||||||||||||||||
| 2019 | ||||||||||||||||||||||||||||||||||||||||||||||||||||||||
| Lease liabilities | 51 | 33 | 54 | 56 | 194 | |||||||||||||||||||||||||||||||||||||||||||||||||||
| - In USD | 22 | 7.0 | 4 | 7.0 | 8 | 7.0 | 1 | 7.0 | 35 | |||||||||||||||||||||||||||||||||||||||||||||||
| - AUD in USD equivalent | 22 | 3.5 | 22 | 3.5 | 42 | 3.5 | 55 | 3.5 | 141 | |||||||||||||||||||||||||||||||||||||||||||||||
| - BRL in USD equivalent | 3 | 6.8 | 3 | 6.8 | 3 | 6.8 | 0 | 0 | 9 | |||||||||||||||||||||||||||||||||||||||||||||||
| - ZAR in USD equivalent | 4 | 9.8 | 4 | 9.8 | 1 | 9.8 | 0 | 0 | 9 | |||||||||||||||||||||||||||||||||||||||||||||||
F - 79
NOTES TO THE CONSOLIDATED FINANCIAL STATEMENTS (continued)
33FINANCIAL RISK MANAGEMENT ACTIVITIES (continued)
The table below provides a breakdown of the effective borrowing rate per currency for lease liabilities:
| 2022 | 2021 | 2020 | |||||||||
| USD | 3.1% | 2.3% | 6.1% | ||||||||
| AUD | 4.3% | 4.6% | 4.7% | ||||||||
| BRL | 14.7% | 11.0% | 8.4% | ||||||||
| ZAR | 5.2% | 5.9% | 9.8% | ||||||||
The Group weighted average incremental borrowing rate at the end of 31 December 2022 is 5.7% ( 2021: 4.6%, 2020: 5.4%).
Credit risk
Credit risk arises from the risk that a counterparty may default or not meet its obligations timeously. The groupGroup minimises credit risk by ensuring that credit risk is spread over a number of counterparties. These counterparties are financial and banking institutions. Counterparty credit limits and exposures are reviewed by the Audit and Risk Committee. Where possible, management ensures that netting agreements are in place. No set-off is applied to the statement of financial position due to the different maturity profiles of assets and liabilities.
The combined maximum credit risk exposure of the groupGroup is as follows:
| US Dollars | ||||||||||||||||||||
| Figures in millions | 2020 | 2019 | 2018 | |||||||||||||||||
Other investments (1) | 2 | 67 | 59 | |||||||||||||||||
| Trade and other receivables | 95 | 57 | 41 | |||||||||||||||||
| Cash restricted for use (note 23) | 73 | 64 | 66 | |||||||||||||||||
| Cash and cash equivalents (note 24) | 1,330 | 456 | 329 | |||||||||||||||||
| Total financial assets | 1,500 | 644 | 495 | |||||||||||||||||
| US Dollars | ||||||||||||||||||||
| Figures in millions | 2022 | 2021 | 2020 | |||||||||||||||||
| Other unlisted investments | 1 | 1 | 2 | |||||||||||||||||
| Trade and other receivables | 41 | 87 | 95 | |||||||||||||||||
| Cash restricted for use (note 21) | 60 | 58 | 73 | |||||||||||||||||
| Cash and cash equivalents (note 22) | 1,108 | 1,154 | 1,330 | |||||||||||||||||
| Total financial assets | 1,210 | 1,300 | 1,500 | |||||||||||||||||
Trade and other receivables, that are past due but not impaired totalled $12m (2019: $15m; 2018: $6m). Other investments that are impaired totalled NaN (2019: $1m; 2018: NaN)(2021: $18m; 2020: $12m).
Trade receivables which are recognised on settlement mainly comprise banking institutions purchasing gold bullion and normal market settlement terms are two working days, therefore expected credit losses are not expected to be material.
The groupGroup does not generally obtain collateral or other security to support financial instruments subject to credit risk, but monitors the credit standing of counterparties.
The maximum exposure to credit risk for all other financial instruments are approximated by their carrying values.
Fair value of financial instruments
The estimated fair values of financial instruments are determined at discrete points in time based on relevant market information.
The estimated fair value of the group’sGroup’s other investments and borrowings as at 31 December are as follows:
Type of instrument
| Carrying amount | Fair value | Carrying amount | Fair value | Carrying amount | Fair value | |||||||||||||||||||||||||||||||||
| US Dollar millions | 2020 | 2019 | 2018 | |||||||||||||||||||||||||||||||||||
| Financial assets | ||||||||||||||||||||||||||||||||||||||
Other investments (1) | 188 | 188 | 170 | 170 | 147 | 147 | ||||||||||||||||||||||||||||||||
| Financial liabilities | ||||||||||||||||||||||||||||||||||||||
| Borrowings (note 26) | 1,931 | 2,131 | 2,033 | 2,135 | 2,050 | 2,084 | ||||||||||||||||||||||||||||||||
| Carrying amount | Fair value | Carrying amount | Fair value | Carrying amount | Fair value | |||||||||||||||||||||||||||||||||
| Figures in millions - US Dollars | 2022 | 2021 | 2020 | |||||||||||||||||||||||||||||||||||
| Financial assets | ||||||||||||||||||||||||||||||||||||||
Other investments | 3 | 3 | 117 | 117 | 188 | 188 | ||||||||||||||||||||||||||||||||
| Financial liabilities | ||||||||||||||||||||||||||||||||||||||
| Borrowings (note 24) | 1,983 | 1,826 | 1,909 | 2,011 | 1,931 | 2,131 | ||||||||||||||||||||||||||||||||
The following methods and assumptions were used to estimate the fair value of each class of financial instrument:
Cash restricted for use, cash and cash equivalents, bank overdrafts, trade, other receivables and other assets and trade and other payables
The carrying amounts approximate fair value due to their short term nature,nature.
F - 80
NOTES TO THE CONSOLIDATED FINANCIAL STATEMENTS except for the deferred compensation asset which is carried at fair value in level 3 of the fair value hierarchy.(continued)
33FINANCIAL RISK MANAGEMENT ACTIVITIES (continued)
Other Investments and other non-current assets
Listed equity investments classified as FVTOCI are carried at fair value in level 1 of the fair value hierarchy and unlisted investments classified as FVTPL are carried at fair value in level 13 of the fair value hierarchy.
Borrowings
The rated bonds are carried at amortised cost and their fair values are their closing market values at the reporting date (fair value hierarchy - level 1). The interest rate on the remaining borrowings is set on a short-term floating rate basis, and accordingly the carrying amount is considered to approximate fair value.value and carried at level 2 in the fair value hierarchy.
Fair value hierarchy
The groupGroup uses the following hierarchy for determining and disclosing the fair value of financial instruments:
Level 1: quoted prices (unadjusted) in active markets for identical assets or liabilities;
Level 2: inputs other than quoted prices included in level 1 that are observable for the asset or liability, either directly (as prices) or indirectly (derived from prices); and
Level 3: inputs for the asset or liability that are not based on observable market data (unobservable inputs).
The following table sets out the group’sGroup’s financial assetsinstruments measured at fair value by level within the fair value hierarchy as at 31 December:
Type of instrument
| US Dollar millions | Level 1 | Level 2 | Level 3 | Total | ||||||||||||||||||||||
| 2020 | ||||||||||||||||||||||||||
| Equity securities - FVTOCI | 186 | 0 | 0 | 186 | ||||||||||||||||||||||
| Deferred compensation asset | 0 | 0 | 28 | 28 | ||||||||||||||||||||||
| 2019 | ||||||||||||||||||||||||||
| Equity securities - FVTPL | 21 | 0 | 0 | 21 | ||||||||||||||||||||||
| Equity securities - FVTOCI | 82 | 0 | 0 | 82 | ||||||||||||||||||||||
| 2018 | ||||||||||||||||||||||||||
| Equity securities - FVTPL | 19 | 0 | 0 | 19 | ||||||||||||||||||||||
| Equity securities - FVTOCI | 69 | 0 | 0 | 69 | ||||||||||||||||||||||
| Figures in millions - US Dollars | Level 1 | Level 2 | Level 3 | Total | ||||||||||||||||||||||
| Assets measured at fair value on a recurring basis | 2022 | |||||||||||||||||||||||||
| Equity securities - FVTOCI | 2 | — | — | 2 | ||||||||||||||||||||||
| Deferred compensation asset | — | — | 12 | 12 | ||||||||||||||||||||||
| 2021 | ||||||||||||||||||||||||||
| Deferred compensation asset | — | — | 25 | 25 | ||||||||||||||||||||||
| Equity securities - FVTOCI | 116 | — | — | 116 | ||||||||||||||||||||||
| 2020 | ||||||||||||||||||||||||||
| Equity securities - FVTOCI | 186 | — | — | 186 | ||||||||||||||||||||||
| Deferred compensation asset | — | — | 28 | 28 | ||||||||||||||||||||||
| Liabilities measured at fair value on a recurring basis | 2022 | |||||||||||||||||||||||||
| Oil derivative contract | — | 6 | — | 6 | ||||||||||||||||||||||
Level 3 financial assets
The two components of the deferred compensation assets relating to the sale of the South African producing assets and related liabilities to Harmony are calculated as follows:
a.$260 per ounce payable on all underground production sourced within the West Wits mineral rights (comprising the Mponeng, Savuka and TauTona mines) in excess of 250,000 ounces per annum for 6 years commencing 1 January 2021. Using a probability weighted calculation of unobservable market data and estimated with reference to expected underlying discounted cash flows a deferred compensation asset of $28m$12m is recognised in the statement of financial position as at 31 December 2020. If the weighted number of ounces used in the weighted probability calculation increases with 10% over the period calculated, the asset value would increase by approximately $3m and if the weighted number of ounces used in the weighted probability calculation decreases by 10% over the period calculated the value of the asset would decrease by approximately $3m. The sensitivity on the weighted number of ounces included within the weighted probability calculation has been based on the range of possible outcomes expected from Harmony’s mining plans, which could differ from the actual mining plans followed by Harmony.2022.
b. $20 per ounce payable on underground production sourced within the West Wits mineral rights (comprising the Mponeng, Savuka and TauTona mines) below the datum of current infrastructure. At transaction date this constituted 8.53 million ounces of reserves.Mineral Reserve. The consideration is dependent on Harmony developing below infrastructure. The performance of this obligation is outside the influence of AngloGold Ashanti as it depends on Harmony’s future investment decisions. Under the conditions prevailing as at 31 December 2020,2022, no portion of deferred compensation below infrastructure has been included in the loss on disposal of assets of discontinued operations.
F - 8581
NOTES TO THE CONSOLIDATED FINANCIAL STATEMENTS (continued)
| Figures in millions - US Dollars | 2022 | 2021 | ||||||
| Opening balance | 25 | 28 | ||||||
| Unwinding of the deferred compensation asset | 1 | 2 | ||||||
Changes in estimates - fair value adjustments (1) | (13) | (3) | ||||||
| Translation | (1) | (2) | ||||||
Closing balance (2) | 12 | 25 | ||||||
(1) Included in the Income statement in foreign exchange and fair value adjustments | ||||||||
(2) Included in the Statement of financial position in non-current trade, other receivables and other assets | ||||||||
Sensitivity analysis
The average strike prices are$44.50 per barreltable below illustrates the impact on the floor andfair value of the deferred compensation asset resulting from an average price of $65 per barrel onincrease / decrease in production estimates over the cap. At 31 December 2020remaining period used in the group had no commitments potentially settled in cash.weighted probability calculation.
| Percentage change in number of ounces | Change in deferred compensation asset $m | Percentage change in number of ounces | Change in deferred compensation asset $m | |||||||||||
| 2022 | 2021 | |||||||||||||
| Effect of changes in assumptions | ||||||||||||||
| Increase in number of ounces | +10% | 1 | +10% | 3 | ||||||||||
| Decrease in number of ounces | -10% | (1) | -10% | (3) | ||||||||||
| The sensitivity on the weighted number of ounces included within the weighted probability calculation has been based on the range of possible outcomes expected from Harmony’s mining plans, which could differ from the actual mining plans followed by Harmony. | ||||||||||||||
Sensitivity analysis
Interest rate risk on other financial assets and liabilities (excluding derivatives)
The groupGroup also monitors interest rate risk on other financial assets and liabilities.
The following table shows the approximate interest rate sensitivities of other financial assets and liabilities at 31 December (actual changes in the timing and amount of the following variables may differ from the assumed changes below). As the sensitivity is the same (linear) for both increases and decreases in interest rates only absolute numbers are presented.
| Change in interest rate basis points | Change in interest amount in currency millions | Change in interest amount US dollar millions | ||||||||||||||||||
| 2020 | ||||||||||||||||||||
| Financial assets | ||||||||||||||||||||
| USD denominated | 100 | 6 | 6 | |||||||||||||||||
| AUD denominated | 150 | 1 | 1 | |||||||||||||||||
| ARS denominated | 250 | 121 | 1 | |||||||||||||||||
| Financial liabilities | ||||||||||||||||||||
| TZS denominated | 250 | 2,730 | 1 | |||||||||||||||||
| USD denominated | 100 | 1 | 1 | |||||||||||||||||
| Change in interest rate basis points | Change in interest amount in currency millions | Change in interest amount US dollar millions | ||||||||||||||||||
| 2019 | ||||||||||||||||||||
| Financial assets | ||||||||||||||||||||
| USD denominated | 100 | 1 | 1 | |||||||||||||||||
| AUD denominated | 150 | 1 | 1 | |||||||||||||||||
| BRL denominated | 0 | 0 | 0 | |||||||||||||||||
| Financial liabilities | ||||||||||||||||||||
| TZS denominated | 250 | 2,704 | 1 | |||||||||||||||||
ZAR denominated(2) | 150 | 15 | 1 | |||||||||||||||||
| USD denominated | 100 | 1 | 1 | |||||||||||||||||
| Change in interest rate basis points | Change in interest amount in currency millions | Change in interest amount US dollar millions | ||||||||||||||||||
| 2018 | ||||||||||||||||||||
| Financial assets | ||||||||||||||||||||
| USD denominated | 100 | 1 | 1 | |||||||||||||||||
ZAR denominated(1)(2) | 150 | 1 | 1 | |||||||||||||||||
| BRL denominated | 250 | 2 | 1 | |||||||||||||||||
| Financial liabilities | ||||||||||||||||||||
| TZS denominated | 250 | 1,680 | 1 | |||||||||||||||||
ZAR denominated(2) | 150 | 14 | 1 | |||||||||||||||||
| AUD denominated | 100 | 1 | 1 | |||||||||||||||||
F - 8782
NOTES TO THE CONSOLIDATED FINANCIAL STATEMENTS (continued)
| Change in interest rate basis points | Change in interest amount in currency millions | Change in interest amount US dollar millions | ||||||||||||||||||
| 2022 | ||||||||||||||||||||
| Financial assets | ||||||||||||||||||||
| USD denominated | 100 | 5 | 5 | |||||||||||||||||
| AUD denominated | 150 | 1 | 1 | |||||||||||||||||
| Financial liabilities | ||||||||||||||||||||
| TZS denominated | 250 | 5,128 | 2 | |||||||||||||||||
| AUD denominated | 150 | 1 | 1 | |||||||||||||||||
| USD denominated | 100 | 1 | 1 | |||||||||||||||||
| Change in interest rate basis points | Change in interest amount in currency millions | Change in interest amount US dollar millions | ||||||||||||||||||
| 2021 | ||||||||||||||||||||
| Financial assets | ||||||||||||||||||||
| USD denominated | 100 | 3 | 3 | |||||||||||||||||
| AUD denominated | 150 | 1 | 1 | |||||||||||||||||
| CAD denominated | 100 | 4 | 5 | |||||||||||||||||
| Financial liabilities | ||||||||||||||||||||
| TZS denominated | 250 | 2,692 | 1 | |||||||||||||||||
| AUD denominated | 150 | 1 | 1 | |||||||||||||||||
| USD denominated | 100 | 1 | 1 | |||||||||||||||||
| Change in interest rate basis points | Change in interest amount in currency millions | Change in interest amount US dollar millions | ||||||||||||||||||
| 2020 | ||||||||||||||||||||
| Financial assets | ||||||||||||||||||||
| USD denominated | 100 | 6 | 6 | |||||||||||||||||
| AUD denominated | 150 | 1 | 1 | |||||||||||||||||
| ARS denominated | 250 | 121 | 1 | |||||||||||||||||
| Financial liabilities | ||||||||||||||||||||
| TZS denominated | 250 | 2,730 | 1 | |||||||||||||||||
| USD denominated | 100 | 1 | 1 | |||||||||||||||||
F - 83
NOTES TO THE CONSOLIDATED FINANCIAL STATEMENTS (continued)
33FINANCIAL RISK MANAGEMENT ACTIVITIES (continued)
Foreign exchange risk
Foreign exchange risk arises on financial instruments that are denominated in a foreign currency.
The following table discloses the approximate foreign exchange risk sensitivities of borrowings at 31 December (actual changes in the timing and amount of the following variables may differ from the assumed changes below).
| Change in exchange rate | Change in borrowings total | Change in exchange rate | Change in borrowings total | Change in exchange rate | Change in borrowings total | |||||||||||||||||||||||||||||||||
| US$ Million | US$ Million | US$ Million | ||||||||||||||||||||||||||||||||||||
| 2020 | 2019 | 2018 | ||||||||||||||||||||||||||||||||||||
| Borrowings | ||||||||||||||||||||||||||||||||||||||
| ZAR denominated (R/$) | Spot (+R1.50) | 0 | Spot (+R1.50) | (7) | Spot (+R1.50) | (7) | ||||||||||||||||||||||||||||||||
| TZS denominated (TZS/$) | Spot (+TZS250) | (5) | Spot (+TZS250) | (5) | Spot (+TZS250) | (3) | ||||||||||||||||||||||||||||||||
| AUD denominated (AUD/$) | Spot (+AUD0.1) | 0 | Spot (+AUD0.1) | (1) | Spot (+AUD0.1) | (3) | ||||||||||||||||||||||||||||||||
| ZAR denominated (R/$) | Spot (R(1.5)) | 0 | Spot (R(1.5)) | 9 | Spot (R(1.50)) | 9 | ||||||||||||||||||||||||||||||||
| TZS denominated (TZS/$) | Spot (TZS(250)) | 6 | Spot (TZS(250)) | 6 | Spot (-TZS(250)) | 4 | ||||||||||||||||||||||||||||||||
| AUD denominated (AUD/$) | Spot (AUD(0.1)) | 0 | Spot (AUD(0.1)) | 1 | Spot (AUD(0.1)) | 4 | ||||||||||||||||||||||||||||||||
| Change in exchange rate | Change in borrowings total | Change in exchange rate | Change in borrowings total | Change in exchange rate | Change in borrowings total | |||||||||||||||||||||||||||||||||
| US$ Million | US$ Million | US$ Million | ||||||||||||||||||||||||||||||||||||
| 2022 | 2021 | 2020 | ||||||||||||||||||||||||||||||||||||
| Borrowings | ||||||||||||||||||||||||||||||||||||||
| TZS denominated (TZS/$) | Spot (+TZS250) | (9) | Spot (+TZS250) | (5) | Spot (+TZS250) | (5) | ||||||||||||||||||||||||||||||||
| AUD denominated (AUD/$) | Spot (+AUD0.1) | (2) | Spot (+AUD0.1) | (2) | Spot (+AUD0.1) | — | ||||||||||||||||||||||||||||||||
| TZS denominated (TZS/$) | Spot (-TZS(250)) | 11 | Spot (-TZS(250)) | 6 | Spot (-TZS(250)) | 6 | ||||||||||||||||||||||||||||||||
| AUD denominated (AUD/$) | Spot (-AUD(0.1)) | 2 | Spot (-AUD(0.1)) | 2 | Spot (-AUD(0.1)) | — | ||||||||||||||||||||||||||||||||
The borrowings totalfollowing table discloses the approximate foreign exchange risk sensitivities of cash and cash equivalents at 31 December (actual changes in the denominated currency will not be influenced by a movement in its exchange rate.timing and amount of the following variables may differ from the assumed changes below).
| Change in exchange rate | Change in cash and cash equivalents total $ millions | Change in exchange rate | Change in cash and cash equivalents total $ millions | Change in exchange rate | Change in cash and cash equivalents total $ millions | |||||||||||||||||||||||||||||||||
| 2022 | 2021 | 2020 | ||||||||||||||||||||||||||||||||||||
| Cash and cash equivalents | ||||||||||||||||||||||||||||||||||||||
| ZAR denominated (R/$) | Spot (+ZAR1.50) | 9 | Spot (+ZAR1.50) | 9 | Spot (+ZAR1.50) | 20 | ||||||||||||||||||||||||||||||||
| AUD denominated (AUD/$) | Spot (+AUD0.1) | 2 | Spot (+AUD0.1) | 4 | Spot (+AUD0.1) | 3 | ||||||||||||||||||||||||||||||||
| ARS denominated (ARS/$) | Spot(+ARS10) | 7 | Spot(+ARS10) | 14 | Spot(+ARS10) | 20 | ||||||||||||||||||||||||||||||||
| CAD denominated (CAD/$) | Spot(+CAD0.1) | — | Spot(+CAD0.1) | 24 | Spot(+CAD0.1) | 0 | ||||||||||||||||||||||||||||||||
| ZAR denominated (R/$) | Spot (-ZAR1.50) | (7) | Spot (-ZAR1.50) | (7) | Spot (-ZAR1.50) | (17) | ||||||||||||||||||||||||||||||||
| AUD denominated (AUD/$) | Spot (-AUD0.1) | (2) | Spot (-AUD0.1) | (4) | Spot (-AUD0.1) | (3) | ||||||||||||||||||||||||||||||||
| ARS denominated (ARS/$) | Spot(-ARS(10)) | (6) | Spot(-ARS(10)) | (11) | Spot(-ARS(10)) | (16) | ||||||||||||||||||||||||||||||||
| CAD denominated (CAD/$) | Spot(-CAD0.1) | — | Spot(-CAD0.1) | (21) | Spot(-CAD0.1) | — | ||||||||||||||||||||||||||||||||
F - 8884
The primary objective of managing the group'sGroup's capital is to ensure that there is sufficient capital available to support the funding requirements of the group,Group, including capital expenditure, in a way that optimises the cost of capital, maximises shareholders' returns and ensures that the groupGroup remains in a sound financial position.
The capital structure of the groupGroup consists of net debt (borrowings as detailed in note 26,24, offset by cash and bank balances detailed in note 24)22) and equity of the groupGroup (comprising share capital and premium and accumulated reserves and non-controlling interests).
The groupGroup manages and makes adjustments to the capital structure as opportunities arise in the market place, as and when borrowings mature, or as and when funding is required. This may take the form of raising equity, market or bank debt or hybrids thereof.
The groupGroup manages capital using various financial metrics including the ratio of Adjusted net debt to Adjusted EBITDA (gearing). Both the calculation of Adjusted net debt and Adjusted EBITDA are based on the formula included in the Revolving Credit Agreements. The loan covenant ratio of Adjusted net debt to Adjusted EBITDA should not exceed 3.5 times. The facilityfacilities also makesmake provision for the ability of the groupGroup to have a leverage ratio of greater than 3.5 times but less than 4.5 times, subject to certain conditions, for one measurement period not exceeding six months, during the tenor of the facility.facilities.
The groupGroup had no major issuance of equity during the year.
A full analysis of the borrowings as presented on the statement of financial position inis included in note 26. In addition, during April 2020 the $700m rated bonds entered into during April 2010 were fully repaid and cancelled. During the second half of 2020 the Company concluded a 10-year $700m bond offering, priced at 3.75% per annum. The bonds were issued on 1 October 2020 with semi-annual coupons payable in April and October each year and the bonds are repayable on 1 October 2030.24.
The $750m, $300m, $700m and the new $700m$750m rated bonds are fully and unconditionally guaranteed by the group.AngloGold Ashanti Limited.
During June 2022, the Group entered into a new five-year unsecured multi-currency syndicated revolving credit facility of $1.4bn with a group of banks. The loan consists of a US dollar-based facility with interest charged at a margin of 1.45% above SOFR plus a credit adjustment spread and an Australian dollar-based facility capped at A$500m with interest charged at a margin of 1.45% above BBSY. The applicable margin is subject to a ratings grid. This facility replaces the $1.4bn multi-currency RCF which was cancelled during June 2022. This facility will mature on 9 June 2027, with the option, upon application, to be extended by two years.
During October 2022 the Group entered into a new three-year unsecured $65m Siguiri revolving credit facility. The facility bears interest at 8% above term SOFR, subject to a ratings grid and is US dollar based. This facility replaces the 2016 $65m Siguiri revolving credit facility that was cancelled and repaid during August 2022.
The interest margin on the five-yearfive-year unsecured multi-currency syndicated revolving credit facility of $1.4bn with a group of banks will reduce should the group’sGroup’s credit rating improve from its current BB+/Baa3 status and should increase if its credit rating worsens. The A$500m portion of this facility will be used to fund the working capital and development costs associated with the group'sGroup's mining operations within Australia without eroding the group'sGroup's headroom under its other facilities and exposing the groupGroup to foreign exchange gains/losses each quarter.losses.
Amounts are converted to US dollarsdollar at year end exchange rates.
F - 8985
NOTES TO THE CONSOLIDATED FINANCIAL STATEMENTS (continued)
Gearing ratio (Adjusted Net debt to Adjusted EBITDA)
| US Dollars | |||||||||||||||||
| Figures in millions | 2020 | 2019 | 2018 | ||||||||||||||
| Adjusted net debt from continuing operations | |||||||||||||||||
| Borrowings - non-current portion (note 26) | 1,789 | 1,299 | 1,911 | ||||||||||||||
| Lease liabilities - non-current portion (note 16) | 116 | 126 | |||||||||||||||
| Borrowings - current portion (note 26) | 142 | 734 | 139 | ||||||||||||||
| Lease liabilities - current portion (note 16) | 37 | 45 | 0 | ||||||||||||||
| Total borrowings | 2,084 | 2,204 | 2,050 | ||||||||||||||
| Less: cash and cash equivalents (note 24) | (1,330) | (456) | (329) | ||||||||||||||
| Net debt | 754 | 1,748 | 1,721 | ||||||||||||||
| Adjustments: | |||||||||||||||||
| IFRS16 lease adjustments | (106) | (119) | 0 | ||||||||||||||
| Corporate office lease | 0 | 0 | (9) | ||||||||||||||
| Unamortised portion of borrowing costs | 23 | 16 | 13 | ||||||||||||||
| Cash restricted for use (note 23) | (73) | (64) | (66) | ||||||||||||||
| Adjusted net debt | 597 | 1,581 | 1,659 | ||||||||||||||
| The Adjusted EBITDA calculation included in this note is based on the formula included in the Revolving Credit Agreements for compliance with the debt covenant formula. | |||||||||||||||||
| Adjusted EBITDA from continuing operations | |||||||||||||||||
| Profit (loss) before taxation | 1,589 | 619 | 445 | ||||||||||||||
| Add back: | |||||||||||||||||
| Finance costs and unwinding of obligations (note 7) | 177 | 172 | 168 | ||||||||||||||
| Interest income | (27) | (14) | (8) | ||||||||||||||
| Amortisation of tangible, intangible and right of use assets (note 4) | 570 | 583 | 558 | ||||||||||||||
| Other amortisation | 6 | 6 | 11 | ||||||||||||||
| Associates and joint ventures’ adjustments for amortisation, interest, taxation and other | 168 | 149 | 158 | ||||||||||||||
| EBITDA | 2,483 | 1,515 | 1,332 | ||||||||||||||
| Adjustments: | |||||||||||||||||
| Foreign exchange and other (gains) losses | 0 | 12 | 9 | ||||||||||||||
| Dividend income | (2) | 0 | (2) | ||||||||||||||
| Retrenchment and related costs | 2 | 7 | 4 | ||||||||||||||
| Care and maintenance costs (note 6) | 0 | 47 | 39 | ||||||||||||||
| Impairment, derecognition of assets and (profit) loss on disposal | 1 | 6 | 7 | ||||||||||||||
| Profit on disposal of joint ventures | (19) | 0 | 0 | ||||||||||||||
| Loss (gain) on non-hedge derivatives and other commodity contracts | 5 | (5) | 2 | ||||||||||||||
| Associates and joint ventures’ share of costs | 0 | (2) | (3) | ||||||||||||||
| Adjusted EBITDA (as defined in the Revolving Credit Agreements) | 2,470 | 1,580 | 1,388 | ||||||||||||||
| Gearing ratio (Adjusted net debt to Adjusted EBITDA) | 0.24:1 | 1.00:1 | 1.20:1 | ||||||||||||||
| Maximum debt covenant ratio allowed per agreement | 3.5:1 | 3.5:1 | 3.5:1 | ||||||||||||||
| US Dollars | |||||||||||||||||
| Figures in millions | 2022 | 2021 | 2020 | ||||||||||||||
| Restated | |||||||||||||||||
| Adjusted net debt from continuing operations | |||||||||||||||||
| Borrowings - non-current portion (note 24) | 1,965 | 1,858 | 1,789 | ||||||||||||||
| Lease liabilities - non-current portion (note 14) | 102 | 124 | 116 | ||||||||||||||
| Borrowings - current portion (note 24) | 18 | 51 | 142 | ||||||||||||||
| Lease liabilities - current portion (note 14) | 84 | 61 | 37 | ||||||||||||||
| Total borrowings | 2,169 | 2,094 | 2,084 | ||||||||||||||
Less: cash and cash equivalents (1) (note 22) | (1,106) | (1,154) | (1,330) | ||||||||||||||
| Net debt | 1,063 | 940 | 754 | ||||||||||||||
| Adjustments: | |||||||||||||||||
| IFRS16 lease adjustments | (158) | (149) | (106) | ||||||||||||||
| Unamortised portion of borrowing costs | 33 | 32 | 22 | ||||||||||||||
| Cash restricted for use (note 21) | (60) | (58) | (73) | ||||||||||||||
| Adjusted net debt | 878 | 765 | 597 | ||||||||||||||
(1) Net of bank overdraft in 2022. | |||||||||||||||||
| The Adjusted EBITDA calculation included in this note is based on the formula included in the agreements for compliance with the debt covenant formulas. | |||||||||||||||||
| Adjusted EBITDA from continuing operations | |||||||||||||||||
| Profit (loss) before taxation | 489 | 958 | 1,627 | ||||||||||||||
| Add back: | |||||||||||||||||
| Finance costs and unwinding of obligations (note 6) | 149 | 116 | 177 | ||||||||||||||
| Interest income | (81) | (58) | (27) | ||||||||||||||
| Amortisation of tangible, intangible and right of use assets (note 4) | 633 | 477 | 575 | ||||||||||||||
| Other amortisation | (3) | 4 | 6 | ||||||||||||||
| Associates and joint ventures’ adjustments for amortisation, interest and taxation | 165 | 183 | 168 | ||||||||||||||
| EBITDA | 1,352 | 1,680 | 2,526 | ||||||||||||||
| Adjustments: | |||||||||||||||||
| Foreign exchange and fair value adjustments | 128 | 43 | — | ||||||||||||||
| Dividend income | — | — | (2) | ||||||||||||||
| Retrenchment and related costs | 6 | 20 | 2 | ||||||||||||||
| Care and maintenance costs (note 5) | — | 45 | — | ||||||||||||||
| Impairment, derecognition of assets and (profit) loss on disposal | 304 | (11) | 1 | ||||||||||||||
| Profit on disposal of joint ventures | — | — | (19) | ||||||||||||||
| Premium on settlement of bonds | — | 24 | — | ||||||||||||||
| Loss (gain) on non-hedge derivatives and other commodity contracts | 6 | — | 5 | ||||||||||||||
| Associates and joint ventures’ share of costs | 1 | — | — | ||||||||||||||
| Adjusted EBITDA (as defined in the agreements) | 1,797 | 1,801 | 2,513 | ||||||||||||||
| Gearing ratio (Adjusted net debt to Adjusted EBITDA) | 0.49:1 | 0.42:1 | 0.24:1 | ||||||||||||||
| Maximum debt covenant ratio allowed per agreement | 3.5:1 | 3.5:1 | 3.5:1 | ||||||||||||||
F - 9086
35 SUBSEQUENT EVENTS
Dividend declarationDividend declaration: - On 22 February 2021,2023, the directors of AngloGold Ashanti declared a gross cash dividend per ordinary share of 705322 South African cents (assuming an exchange rate of ZAR 14.7/17.53/$, the gross dividend payable per ADS is equivalent to 4818 US cents).
AngloGold Ashanti Holdings plc (“IOMco”)will contribute its 100% interest in the Iduapriem Mine to Gold Fields Ghana in return for a shareholding in that company. Excluding the interest to be held by the GoG, Gold Fields will have an interest of 66.7%, a 100 percent wholly-owned subsidiary ofor two-thirds, and AngloGold Ashanti Limited, has issued debt securities which are fully and unconditionally guaranteed by AngloGold Ashanti Limited (being the “Guarantor”). IOMco iswill have an Isleinterest of Man registered company that holds certain of AngloGold Ashanti’s operations and assets located outside South Africa (excluding certain operations and assets33.3%, or one-third, in the United States of America). The following is condensed consolidating financial information for the Company as of 31 December 2020, 2019 and 2018 and for the years ended 31 December 2020, 2019 and 2018, with a separate column for each of AngloGold Ashanti Limited as Guarantor, IOMco as Issuer and the other subsidiaries of the Company combined (the “Non-Guarantor Subsidiaries”). For the purposes of the condensed consolidating financial information, the Company carries its investments under the equity method. The following supplemental condensed consolidating financial information should be read in conjunction with the Company’s condensed consolidated financial statements.
| Figures in millions (US dollars) | 2020 | 2020 | 2020 | 2020 | 2020 | ||||||||||||||||||||||||
| Condensed consolidating income statement | AngloGold Ashanti (the “Guarantor”) | IOMco (the “Issuer”) | Other subsidiaries (the “Non-Guarantor Subsidiaries”) | Consolidation adjustments | Total | ||||||||||||||||||||||||
| Revenue from product sales | 0 | 0 | 4,427 | 0 | 4,427 | ||||||||||||||||||||||||
| Cost of sales | 0 | 0 | (2,699) | 0 | (2,699) | ||||||||||||||||||||||||
| Gain (loss) on non-hedge derivatives and other commodity contracts | 0 | 0 | (14) | (5) | (19) | ||||||||||||||||||||||||
| Gross profit (loss) | 0 | 0 | 1,714 | (5) | 1,709 | ||||||||||||||||||||||||
| Corporate administration, marketing and other income (expenses) | (38) | (15) | (8) | (7) | (68) | ||||||||||||||||||||||||
| Exploration and evaluation costs | 0 | 0 | (124) | 0 | (124) | ||||||||||||||||||||||||
| Impairment, derecognition of assets and profit (loss) on disposal | 0 | 0 | (1) | 0 | (1) | ||||||||||||||||||||||||
| Other income (expenses) | (16) | (4) | (40) | 3 | (57) | ||||||||||||||||||||||||
| Operating profit (loss) | (54) | (19) | 1,541 | (9) | 1,459 | ||||||||||||||||||||||||
| Interest income | 3 | 7 | 17 | 0 | 27 | ||||||||||||||||||||||||
| Dividend received | 9 | 0 | (7) | 0 | 2 | ||||||||||||||||||||||||
| Foreign exchange and other gains (losses) | (3) | 1 | 2 | 0 | 0 | ||||||||||||||||||||||||
| Finance costs and unwinding of obligations | (11) | (119) | (63) | 16 | (177) | ||||||||||||||||||||||||
| Share of associates and joint ventures’ profit (loss) | 0 | 0 | 444 | (166) | 278 | ||||||||||||||||||||||||
| Equity gain (loss) in subsidiaries | 1,126 | 1,263 | 0 | (2,389) | 0 | ||||||||||||||||||||||||
| Profit (loss) before taxation | 1,070 | 1,133 | 1,934 | (2,548) | 1,589 | ||||||||||||||||||||||||
| Taxation | (74) | 0 | (551) | 0 | (625) | ||||||||||||||||||||||||
| Profit (loss) after taxation from continuing operations | 996 | 1,133 | 1,383 | (2,548) | 964 | ||||||||||||||||||||||||
| Discontinued operations | |||||||||||||||||||||||||||||
| Profit (loss) from discontinued operations | (43) | 0 | 5 | 45 | 7 | ||||||||||||||||||||||||
| Profit (loss) for the period | 953 | 1,133 | 1,388 | (2,503) | 971 | ||||||||||||||||||||||||
| Allocated as follows: | |||||||||||||||||||||||||||||
| Equity shareholders | |||||||||||||||||||||||||||||
| - Continuing operations | 996 | 1,133 | 1,365 | (2,548) | 946 | ||||||||||||||||||||||||
| - Discontinued operations | (43) | 0 | 5 | 45 | 7 | ||||||||||||||||||||||||
| Non-controlling interests | |||||||||||||||||||||||||||||
| - Continuing operations | 0 | 0 | 18 | 0 | 18 | ||||||||||||||||||||||||
| 953 | 1,133 | 1,388 | (2,503) | 971 | |||||||||||||||||||||||||
| Comprehensive income (loss) | 1,077 | 1,251 | 1,427 | (2,660) | 1,095 | ||||||||||||||||||||||||
| Comprehensive (income) loss attributable to non-controlling interests | 0 | 0 | (18) | 0 | (18) | ||||||||||||||||||||||||
| Comprehensive income (loss) attributable to AngloGold Ashanti | 1,077 | 1,251 | 1,409 | (2,660) | 1,077 | ||||||||||||||||||||||||
| Figures in millions (US dollars) | 2019 | 2019 | 2019 | 2019 | 2019 | ||||||||||||||||||||||||
| Condensed consolidating income statement | AngloGold Ashanti (the “Guarantor”) | IOMco (the “Issuer”) | Other subsidiaries (the “Non-Guarantor Subsidiaries”) | Consolidation adjustments | Total | ||||||||||||||||||||||||
| Revenue from product sales | 0 | 0 | 3,525 | 0 | 3,525 | ||||||||||||||||||||||||
| Cost of sales | (1) | 0 | (2,625) | 0 | (2,626) | ||||||||||||||||||||||||
| Gain (loss) on non-hedge derivatives and other commodity contracts | 0 | 0 | 5 | 0 | 5 | ||||||||||||||||||||||||
| Gross profit (loss) | (1) | 0 | 905 | 0 | 904 | ||||||||||||||||||||||||
| Corporate administration, marketing and other income (expenses) | (41) | (6) | (17) | (18) | (82) | ||||||||||||||||||||||||
| Exploration and evaluation costs | 0 | 0 | (112) | 0 | (112) | ||||||||||||||||||||||||
| Impairment, derecognition of assets and profit (loss) on disposal | 0 | (3) | (6) | 3 | (6) | ||||||||||||||||||||||||
| Other income (expenses) | (10) | 3 | 135 | (211) | (83) | ||||||||||||||||||||||||
| Operating profit (loss) | (52) | (6) | 905 | (226) | 621 | ||||||||||||||||||||||||
| Interest income | 3 | 6 | 5 | 0 | 14 | ||||||||||||||||||||||||
| Foreign exchange and other gains (losses) | 0 | (4) | (8) | 0 | (12) | ||||||||||||||||||||||||
| Finance costs and unwinding of obligations | (16) | (106) | (56) | 6 | (172) | ||||||||||||||||||||||||
| Share of associates and joint ventures’ profit (loss) | 0 | 0 | 154 | 14 | 168 | ||||||||||||||||||||||||
| Equity gain (loss) in subsidiaries | 302 | 815 | 0 | (1,117) | 0 | ||||||||||||||||||||||||
| Profit (loss) before taxation | 237 | 705 | 1,000 | (1,323) | 619 | ||||||||||||||||||||||||
| Taxation | 32 | 0 | (282) | 0 | (250) | ||||||||||||||||||||||||
| Profit (loss) after taxation from continuing operations | 269 | 705 | 718 | (1,323) | 369 | ||||||||||||||||||||||||
| Discontinued operations | |||||||||||||||||||||||||||||
| Profit (loss) from discontinued operations | (281) | 0 | (95) | 0 | (376) | ||||||||||||||||||||||||
| Profit (loss) for the period | (12) | 705 | 623 | (1,323) | (7) | ||||||||||||||||||||||||
| Allocated as follows: | |||||||||||||||||||||||||||||
| Equity shareholders | |||||||||||||||||||||||||||||
| - Continuing operations | 269 | 705 | 713 | (1,323) | 364 | ||||||||||||||||||||||||
| - Discontinued operations | (281) | 0 | (95) | 0 | (376) | ||||||||||||||||||||||||
| Non-controlling interests | |||||||||||||||||||||||||||||
| Continuing operations | 0 | 0 | 5 | 0 | 5 | ||||||||||||||||||||||||
| (12) | 705 | 623 | (1,323) | (7) | |||||||||||||||||||||||||
| Comprehensive income (loss) | 2 | 717 | 618 | (1,330) | 7 | ||||||||||||||||||||||||
| Comprehensive (income) loss attributable to non-controlling interests | 0 | 0 | (5) | 0 | (5) | ||||||||||||||||||||||||
| Comprehensive income (loss) attributable to AngloGold Ashanti | 2 | 717 | 613 | (1,330) | 2 | ||||||||||||||||||||||||
| Figures in millions (US dollars) | 2018 | 2018 | 2018 | 2018 | 2018 | ||||||||||||||||||||||||
| Condensed consolidating income statement | AngloGold Ashanti (the “Guarantor”) | IOMco (the “Issuer”) | Other subsidiaries (the “Non-Guarantor Subsidiaries”) | Consolidation adjustments | Total | ||||||||||||||||||||||||
| Revenue from product sales | 0 | 0 | 3,336 | 0 | 3,336 | ||||||||||||||||||||||||
| Cost of sales | (2) | 0 | (2,582) | 0 | (2,584) | ||||||||||||||||||||||||
| Gain (loss) on non-hedge derivatives and other commodity contracts | 0 | 0 | (2) | 0 | (2) | ||||||||||||||||||||||||
| Gross profit (loss) | (2) | 0 | 752 | 0 | 750 | ||||||||||||||||||||||||
| Corporate administration, marketing and other income (expenses) | (12) | (20) | (13) | (31) | (76) | ||||||||||||||||||||||||
| Exploration and evaluation costs | 0 | 0 | (98) | 0 | (98) | ||||||||||||||||||||||||
| Impairment, derecognition of assets and profit (loss) on disposal | 0 | 1 | (9) | 1 | (7) | ||||||||||||||||||||||||
| Other income (expenses) | (10) | 10 | (70) | (9) | (79) | ||||||||||||||||||||||||
| Operating profit (loss) | (24) | (9) | 562 | (39) | 490 | ||||||||||||||||||||||||
| Interest income | 0 | 4 | 4 | 0 | 8 | ||||||||||||||||||||||||
| Dividend received | 2 | 0 | 0 | 0 | 2 | ||||||||||||||||||||||||
| Foreign exchange and other gains (losses) | 0 | (6) | (3) | 0 | (9) | ||||||||||||||||||||||||
| Finance costs and unwinding of obligations | (16) | (107) | (45) | 0 | (168) | ||||||||||||||||||||||||
| Share of associates and joint ventures’ profit (loss) | 5 | 0 | 108 | 9 | 122 | ||||||||||||||||||||||||
| Equity gain (loss) in subsidiaries | 142 | 490 | 0 | (632) | 0 | ||||||||||||||||||||||||
| Profit (loss) before taxation | 109 | 372 | 626 | (662) | 445 | ||||||||||||||||||||||||
| Taxation | 23 | 0 | (235) | 0 | (212) | ||||||||||||||||||||||||
| Profit (loss) after taxation from continuing operations | 132 | 372 | 391 | (662) | 233 | ||||||||||||||||||||||||
| Discontinued operations | |||||||||||||||||||||||||||||
| Profit (loss) from discontinued operations | 1 | 0 | (84) | 0 | (83) | ||||||||||||||||||||||||
| Profit (loss) for the period | 133 | 372 | 307 | (662) | 150 | ||||||||||||||||||||||||
| Allocated as follows: | |||||||||||||||||||||||||||||
| Equity shareholders | |||||||||||||||||||||||||||||
| - Continuing operations | 132 | 372 | 374 | (662) | 216 | ||||||||||||||||||||||||
| - Discontinued operations | 1 | 0 | (84) | 0 | (83) | ||||||||||||||||||||||||
| Non-controlling interests | |||||||||||||||||||||||||||||
| - Continuing operations | 0 | 0 | 17 | 0 | 17 | ||||||||||||||||||||||||
| 133 | 372 | 307 | (662) | 150 | |||||||||||||||||||||||||
| Comprehensive income (loss) | (8) | 320 | 301 | (604) | 9 | ||||||||||||||||||||||||
| Comprehensive (income) loss attributable to non-controlling interests | 0 | 0 | (17) | 0 | (17) | ||||||||||||||||||||||||
| Comprehensive income (loss) attributable to AngloGold Ashanti | (8) | 320 | 284 | (604) | (8) | ||||||||||||||||||||||||
| Figures in millions (US dollars) | 2020 | 2020 | 2020 | 2020 | 2020 | ||||||||||||||||||||||||
| Condensed consolidating statement of financial position | AngloGold Ashanti (the “Guarantor”) | IOMco (the “Issuer”) | Other subsidiaries (the “Non-Guarantor Subsidiaries”) | Consolidation adjustments | Total | ||||||||||||||||||||||||
| ASSETS | |||||||||||||||||||||||||||||
| Non-current assets | |||||||||||||||||||||||||||||
| Tangible and right of use assets | 2 | 0 | 3,001 | 22 | 3,026 | ||||||||||||||||||||||||
| Intangible assets | 1 | 0 | 132 | (1) | 131 | ||||||||||||||||||||||||
| Investments in subsidiaries, associates and joint ventures | 3,859 | 5,019 | 1,609 | (8,835) | 1,651 | ||||||||||||||||||||||||
| Other investments | 1 | 3 | 185 | (2) | 188 | ||||||||||||||||||||||||
| Inventories | 0 | 0 | 69 | 0 | 69 | ||||||||||||||||||||||||
| Trade and other receivables | 28 | 33 | 203 | (29) | 235 | ||||||||||||||||||||||||
| Deferred taxation | 0 | 0 | 7 | 0 | 7 | ||||||||||||||||||||||||
| Cash restricted for use | 0 | 0 | 31 | 0 | 31 | ||||||||||||||||||||||||
| 3,891 | 5,055 | 5,237 | (8,845) | 5,338 | |||||||||||||||||||||||||
| Current assets | |||||||||||||||||||||||||||||
| Inventories, trade and other receivables, intergroup balances and other current assets | 84 | 812 | 1,574 | (1,508) | 962 | ||||||||||||||||||||||||
| Cash restricted for use | 0 | 0 | 42 | 0 | 42 | ||||||||||||||||||||||||
| Cash and cash equivalents | 176 | 572 | 582 | 0 | 1,330 | ||||||||||||||||||||||||
| 260 | 1,384 | 2,198 | (1,508) | 2,334 | |||||||||||||||||||||||||
| Assets held for sale | 0 | 0 | 0 | 0 | 0 | ||||||||||||||||||||||||
| 260 | 1,384 | 2,198 | (1,508) | 2,334 | |||||||||||||||||||||||||
| Total assets | 4,151 | 6,439 | 7,435 | (10,353) | 7,672 | ||||||||||||||||||||||||
| EQUITY AND LIABILITIES | |||||||||||||||||||||||||||||
| Share capital and premium | 7,214 | 6,096 | 807 | (6,903) | 7,214 | ||||||||||||||||||||||||
| Retained earnings (accumulated losses) and other reserves | (3,519) | (1,694) | 2,369 | (675) | (3,519) | ||||||||||||||||||||||||
| Shareholders’ equity | 3,695 | 4,402 | 3,176 | (7,578) | 3,695 | ||||||||||||||||||||||||
| Non-controlling interests | 0 | 0 | 45 | 0 | 45 | ||||||||||||||||||||||||
| Total equity | 3,695 | 4,402 | 3,221 | (7,578) | 3,740 | ||||||||||||||||||||||||
| Non-current liabilities | 128 | 1,724 | 1,121 | 0 | 2,973 | ||||||||||||||||||||||||
| Current liabilities including intergroup balances | 328 | 313 | 3,093 | (2,775) | 959 | ||||||||||||||||||||||||
| Liabilities held for sale | 0 | 0 | 0 | 0 | 0 | ||||||||||||||||||||||||
| Total liabilities | 456 | 2,037 | 4,214 | (2,775) | 3,932 | ||||||||||||||||||||||||
| Total equity and liabilities | 4,151 | 6,439 | 7,435 | (10,353) | 7,672 | ||||||||||||||||||||||||
| Figures in millions (US dollars) | 2019 | 2019 | 2019 | 2019 | 2019 | ||||||||||||||||||||||||
| Condensed consolidating statement of financial position | AngloGold Ashanti (the “Guarantor”) | IOMco (the “Issuer”) | Other subsidiaries (the “Non-Guarantor Subsidiaries”) | Consolidation adjustments | Total | ||||||||||||||||||||||||
| ASSETS | |||||||||||||||||||||||||||||
| Non-current assets | |||||||||||||||||||||||||||||
| Tangible assets and right of use assets | 4 | 0 | 2,740 | 6 | 2,750 | ||||||||||||||||||||||||
| Intangible assets | 1 | 0 | 123 | (1) | 123 | ||||||||||||||||||||||||
| Investments in subsidiaries, associates and joint ventures | 2,646 | 4,612 | 1,459 | (7,136) | 1,581 | ||||||||||||||||||||||||
| Other investments | 2 | 2 | 74 | (2) | 76 | ||||||||||||||||||||||||
| Inventories | 0 | 0 | 93 | 0 | 93 | ||||||||||||||||||||||||
| Trade and other receivables | 0 | 29 | 122 | (29) | 122 | ||||||||||||||||||||||||
| Deferred taxation | 105 | 0 | 0 | 0 | 105 | ||||||||||||||||||||||||
| Cash restricted for use | 0 | 0 | 31 | 0 | 31 | ||||||||||||||||||||||||
| 2,758 | 4,643 | 4,642 | (7,162) | 4,881 | |||||||||||||||||||||||||
| Current assets | |||||||||||||||||||||||||||||
| Other investments | 0 | 10 | 0 | 0 | 10 | ||||||||||||||||||||||||
| Inventories, trade and other receivables, intergroup balances and other current assets | 333 | 619 | 1,247 | (1,317) | 882 | ||||||||||||||||||||||||
| Cash restricted for use | 0 | 0 | 33 | 0 | 33 | ||||||||||||||||||||||||
| Cash and cash equivalents | 12 | 102 | 342 | 0 | 456 | ||||||||||||||||||||||||
| 345 | 731 | 1,622 | (1,317) | 1,381 | |||||||||||||||||||||||||
| Assets held for sale | 253 | 0 | 348 | 0 | 601 | ||||||||||||||||||||||||
| 598 | 731 | 1,970 | (1,317) | 1,982 | |||||||||||||||||||||||||
| Total assets | 3,356 | 5,374 | 6,612 | (8,479) | 6,863 | ||||||||||||||||||||||||
| EQUITY AND LIABILITIES | |||||||||||||||||||||||||||||
| Share capital and premium | 7,199 | 6,096 | 837 | (6,933) | 7,199 | ||||||||||||||||||||||||
| Retained earnings (accumulated losses) and other reserves | (4,559) | (2,715) | 1,668 | 1,047 | (4,559) | ||||||||||||||||||||||||
| Shareholders’ equity | 2,640 | 3,381 | 2,505 | (5,886) | 2,640 | ||||||||||||||||||||||||
| Non-controlling interests | 0 | 0 | 36 | 0 | 36 | ||||||||||||||||||||||||
| Total equity | 2,640 | 3,381 | 2,541 | (5,886) | 2,676 | ||||||||||||||||||||||||
| Non-current liabilities | 225 | 1,031 | 1,222 | 0 | 2,478 | ||||||||||||||||||||||||
| Current liabilities including intergroup balances | 401 | 962 | 2,667 | (2,593) | 1,437 | ||||||||||||||||||||||||
| Liabilities held for sale | 90 | 0 | 182 | 0 | 272 | ||||||||||||||||||||||||
| Total liabilities | 716 | 1,993 | 4,071 | (2,593) | 4,187 | ||||||||||||||||||||||||
| Total equity and liabilities | 3,356 | 5,374 | 6,612 | (8,479) | 6,863 | ||||||||||||||||||||||||
| Figures in millions (US dollars) | 2018 | 2018 | 2018 | 2018 | 2018 | ||||||||||||||||||||||||
| Condensed consolidating statement of financial position | AngloGold Ashanti (the “Guarantor”) | IOMco (the “Issuer”) | Other subsidiaries (the “Non-Guarantor Subsidiaries”) | Consolidation adjustments | Total | ||||||||||||||||||||||||
| ASSETS | |||||||||||||||||||||||||||||
| Non-current assets | |||||||||||||||||||||||||||||
| Tangible assets | 625 | 0 | 2,756 | 0 | 3,381 | ||||||||||||||||||||||||
| Intangible assets | 1 | 0 | 123 | (1) | 123 | ||||||||||||||||||||||||
| Investments in subsidiaries, associates and joint ventures | 2,383 | 4,255 | 1,398 | (6,508) | 1,528 | ||||||||||||||||||||||||
| Other investments | 2 | 3 | 138 | (2) | 141 | ||||||||||||||||||||||||
| Inventories | 1 | 0 | 105 | 0 | 106 | ||||||||||||||||||||||||
| Trade and other receivables | 0 | 29 | 102 | (29) | 102 | ||||||||||||||||||||||||
| Cash restricted for use | 0 | 0 | 35 | 0 | 35 | ||||||||||||||||||||||||
| 3,012 | 4,287 | 4,657 | (6,540) | 5,416 | |||||||||||||||||||||||||
| Current assets | |||||||||||||||||||||||||||||
| Other investments | 0 | 6 | 0 | 0 | 6 | ||||||||||||||||||||||||
| Inventories, trade and other receivables, intergroup balances and other current assets | 390 | 416 | 1,166 | (1,111) | 861 | ||||||||||||||||||||||||
| Cash restricted for use | 0 | 0 | 31 | 0 | 31 | ||||||||||||||||||||||||
| Cash and cash equivalents | 7 | 97 | 225 | 0 | 329 | ||||||||||||||||||||||||
| 397 | 519 | 1,422 | (1,111) | 1,227 | |||||||||||||||||||||||||
| Total assets | 3,409 | 4,806 | 6,079 | (7,651) | 6,643 | ||||||||||||||||||||||||
| EQUITY AND LIABILITIES | |||||||||||||||||||||||||||||
| Share capital and premium | 7,171 | 6,096 | 821 | (6,917) | 7,171 | ||||||||||||||||||||||||
| Retained earnings (accumulated losses) and other reserves | (4,519) | (3,310) | 1,406 | 1,904 | (4,519) | ||||||||||||||||||||||||
| Shareholders’ equity | 2,652 | 2,786 | 2,227 | (5,013) | 2,652 | ||||||||||||||||||||||||
| Non-controlling interests | 0 | 0 | 42 | 0 | 42 | ||||||||||||||||||||||||
| Total equity | 2,652 | 2,786 | 2,269 | (5,013) | 2,694 | ||||||||||||||||||||||||
| Non-current liabilities | 319 | 1,734 | 1,103 | 0 | 3,156 | ||||||||||||||||||||||||
| Current liabilities including intergroup balances | 438 | 286 | 2,707 | (2,638) | 793 | ||||||||||||||||||||||||
| Total liabilities | 757 | 2,020 | 3,810 | (2,638) | 3,949 | ||||||||||||||||||||||||
| Total equity and liabilities | 3,409 | 4,806 | 6,079 | (7,651) | 6,643 | ||||||||||||||||||||||||
| Figures in millions (US dollars) | 2020 | 2020 | 2020 | 2020 | 2020 | ||||||||||||||||||||||||
| Condensed consolidating statement of cash flow | AngloGold Ashanti (the “Guarantor”) | IOMco (the “Issuer”) | Other subsidiaries (the “Non-Guarantor Subsidiaries”) | Consolidation adjustments | Total | ||||||||||||||||||||||||
| Cash flows from operating activities | |||||||||||||||||||||||||||||
| Cash generated from (used by) operations | (100) | (18) | 1,948 | (2) | 1,828 | ||||||||||||||||||||||||
| Net movement in intergroup receivables and payables | 29 | (218) | 191 | (2) | 0 | ||||||||||||||||||||||||
| Dividends received from joint ventures | 0 | 148 | 0 | 0 | 148 | ||||||||||||||||||||||||
| Taxation paid | 0 | 0 | (431) | 0 | (431) | ||||||||||||||||||||||||
| Net cash inflow (outflow) from operating activities from continuing operations | (71) | (88) | 1,708 | (4) | 1,545 | ||||||||||||||||||||||||
| Net cash inflow (outflow) from operating activities from discontinued operations | 74 | 0 | 35 | 0 | 109 | ||||||||||||||||||||||||
| Net cash inflow (outflow) from operating activities | 3 | (88) | 1,743 | (4) | 1,654 | ||||||||||||||||||||||||
| Cash flows from investing activities | |||||||||||||||||||||||||||||
| Capital expenditure | 0 | 0 | (701) | 0 | (701) | ||||||||||||||||||||||||
| Interest capitalised and paid | 0 | 0 | 0 | (17) | (17) | ||||||||||||||||||||||||
| Acquisition of intangible assets | (1) | 0 | 0 | 0 | (1) | ||||||||||||||||||||||||
| Proceeds from disposal of tangible assets | 1 | 0 | 2 | 0 | 3 | ||||||||||||||||||||||||
| Dividends from other investments | 9 | 0 | 0 | 0 | 9 | ||||||||||||||||||||||||
| Other investments acquired | 0 | 0 | (8) | 0 | (8) | ||||||||||||||||||||||||
| Proceeds from disposal of other investments | 0 | 9 | 0 | 0 | 9 | ||||||||||||||||||||||||
| Proceeds from disposal of joint ventures | 0 | 26 | 0 | 0 | 26 | ||||||||||||||||||||||||
| Net loans repaid by (advanced to) associates and joint ventures | 10 | 2 | 0 | 0 | 12 | ||||||||||||||||||||||||
| Disposal (acquisition) of subsidiaries and recognition of joint operation | (10) | (8) | 10 | 10 | 2 | ||||||||||||||||||||||||
| Proceeds from disposal of discontinued assets and subsidiaries | 205 | 0 | 0 | (5) | 200 | ||||||||||||||||||||||||
| Decrease (increase) in cash restricted for use | 1 | 0 | (10) | 0 | (9) | ||||||||||||||||||||||||
| Interest received | 3 | 8 | 16 | 0 | 27 | ||||||||||||||||||||||||
| Net cash inflow (outflow) from investing activities from continuing operations | 218 | 37 | (691) | (12) | (448) | ||||||||||||||||||||||||
| Net cash inflow (outflow) from investing activities from discontinued operations | (24) | 0 | (7) | 0 | (31) | ||||||||||||||||||||||||
| Cash in subsidiaries sold and transferred to held for sale | 0 | 0 | 3 | 0 | 3 | ||||||||||||||||||||||||
| Net cash inflow (outflow) from investing activities | 194 | 37 | (695) | (12) | (476) | ||||||||||||||||||||||||
| Cash flows from financing activities | |||||||||||||||||||||||||||||
| Increase in share capital | 0 | 0 | 10 | (10) | 0 | ||||||||||||||||||||||||
| Proceeds from borrowings | 133 | 2,050 | 43 | 0 | 2,226 | ||||||||||||||||||||||||
| Repayment of borrowings | (193) | (2,050) | (114) | 0 | (2,357) | ||||||||||||||||||||||||
| Finance costs paid | (7) | (98) | (30) | 17 | (118) | ||||||||||||||||||||||||
| Other borrowing costs | 0 | (33) | 0 | 0 | (33) | ||||||||||||||||||||||||
| Dividends paid | (38) | 0 | (9) | 0 | (47) | ||||||||||||||||||||||||
| Intergroup dividends received (paid) | 52 | 652 | (704) | 0 | 0 | ||||||||||||||||||||||||
| Net cash inflow (outflow) from financing activities from continuing operations | (53) | 521 | (804) | 7 | (329) | ||||||||||||||||||||||||
| Net cash inflow (outflow) from financing activities from discontinued operations | 0 | 0 | 0 | 0 | 0 | ||||||||||||||||||||||||
| Net cash inflow (outflow) from financing activities | (53) | 521 | (804) | 7 | (329) | ||||||||||||||||||||||||
| Net increase (decrease) in cash and cash equivalents | 144 | 470 | 244 | (9) | 849 | ||||||||||||||||||||||||
| Translation | 20 | 0 | (4) | 9 | 25 | ||||||||||||||||||||||||
| Cash and cash equivalents at beginning of year | 12 | 102 | 342 | 0 | 456 | ||||||||||||||||||||||||
| Cash and cash equivalents at end of year | 176 | 572 | 582 | 0 | 1,330 | ||||||||||||||||||||||||
| Figures in millions (US dollars) | 2019 | 2019 | 2019 | 2019 | 2019 | ||||||||||||||||||||||||
| Condensed consolidating statement of cash flow | AngloGold Ashanti (the “Guarantor”) | IOMco (the “Issuer”) | Other subsidiaries (the “Non-Guarantor Subsidiaries”) | Consolidation adjustments | Total | ||||||||||||||||||||||||
| Cash flows from operating activities | |||||||||||||||||||||||||||||
| Cash generated from (used by) operations | (59) | (8) | 1,165 | 4 | 1,102 | ||||||||||||||||||||||||
| Net movement in intergroup receivables and payables | 35 | (205) | 177 | (7) | 0 | ||||||||||||||||||||||||
| Dividends received from joint ventures | 0 | 77 | 0 | 0 | 77 | ||||||||||||||||||||||||
| Taxation refund | 0 | 0 | 7 | 0 | 7 | ||||||||||||||||||||||||
| Taxation paid | 0 | 0 | (228) | 0 | (228) | ||||||||||||||||||||||||
| Net cash inflow (outflow) from operating activities from continuing operations | (24) | (136) | 1,121 | (3) | 958 | ||||||||||||||||||||||||
| Net cash inflow (outflow) from operating activities from discontinued operations | 58 | 0 | 31 | 0 | 89 | ||||||||||||||||||||||||
| Net cash inflow (outflow) from operating activities | 34 | (136) | 1,152 | (3) | 1,047 | ||||||||||||||||||||||||
| Cash flows from investing activities | |||||||||||||||||||||||||||||
| Capital expenditure | 0 | 0 | (703) | 0 | (703) | ||||||||||||||||||||||||
| Interest capitalised and paid | 0 | 0 | 0 | (6) | (6) | ||||||||||||||||||||||||
| Proceeds from disposal of tangible assets | 0 | 0 | 3 | 0 | 3 | ||||||||||||||||||||||||
| Other investments acquired | 0 | 0 | (9) | 0 | (9) | ||||||||||||||||||||||||
| Proceeds from disposal of other investments | 0 | 0 | 3 | 0 | 3 | ||||||||||||||||||||||||
| Investments in associates and joint ventures | 0 | 0 | (5) | 0 | (5) | ||||||||||||||||||||||||
| Net loans repaid by (advanced to) associates and joint ventures | 17 | 4 | (1) | 0 | 20 | ||||||||||||||||||||||||
| Increase in investment in subsidiary | (16) | — | — | 16 | — | ||||||||||||||||||||||||
| Disposal (acquisition) of subsidiaries | 0 | (8) | 8 | 0 | 0 | ||||||||||||||||||||||||
| Interest received | 3 | 5 | 6 | 0 | 14 | ||||||||||||||||||||||||
| Net cash inflow (outflow) from investing activities from continuing operations | 4 | 1 | (698) | 10 | (683) | ||||||||||||||||||||||||
| Net cash inflow (outflow) from investing activities from discontinued operations | (46) | 0 | (8) | 0 | (54) | ||||||||||||||||||||||||
| Cash in subsidiaries sold and transferred to held for sale | 0 | 0 | (6) | 0 | (6) | ||||||||||||||||||||||||
| Net cash inflow (outflow) from investing activities | (42) | 1 | (712) | 10 | (743) | ||||||||||||||||||||||||
| Cash flows from financing activities | |||||||||||||||||||||||||||||
| Increase in share capital | 0 | 0 | 16 | (16) | 0 | ||||||||||||||||||||||||
| Proceeds from borrowings | 130 | 0 | 38 | 0 | 168 | ||||||||||||||||||||||||
| Repayment of borrowings | (124) | 0 | (41) | 0 | (165) | ||||||||||||||||||||||||
| Finance costs paid | (10) | (102) | (31) | 6 | (137) | ||||||||||||||||||||||||
| Dividends paid | (28) | 0 | (15) | 0 | (43) | ||||||||||||||||||||||||
| Intergroup dividends received (paid) | 44 | 242 | (286) | 0 | 0 | ||||||||||||||||||||||||
| Net cash inflow (outflow) from financing activities from continuing operations | 12 | 140 | (319) | (10) | (177) | ||||||||||||||||||||||||
| Net cash inflow (outflow) from financing activities from discontinued operations | 0 | 0 | 0 | 0 | 0 | ||||||||||||||||||||||||
| Net cash inflow (outflow) from financing activities | 12 | 140 | (319) | (10) | (177) | ||||||||||||||||||||||||
| Net increase (decrease) in cash and cash equivalents | 4 | 5 | 121 | (3) | 127 | ||||||||||||||||||||||||
| Translation | 1 | 0 | (4) | 3 | 0 | ||||||||||||||||||||||||
| Cash and cash equivalents at beginning of year | 7 | 97 | 225 | 0 | 329 | ||||||||||||||||||||||||
| Cash and cash equivalents at end of year | 12 | 102 | 342 | 0 | 456 | ||||||||||||||||||||||||
| Figures in millions (US dollars) | 2018 | 2018 | 2018 | 2018 | 2018 | ||||||||||||||||||||||||
| Condensed consolidating statement of cash flow | AngloGold Ashanti (the “Guarantor”) | IOMco (the “Issuer”) | Other subsidiaries (the “Non-Guarantor Subsidiaries”) | Consolidation adjustments | Total | ||||||||||||||||||||||||
| Cash flows from operating activities | |||||||||||||||||||||||||||||
| Cash generated from (used by) operations | (93) | (18) | 1,034 | 8 | 931 | ||||||||||||||||||||||||
| Net movement in intergroup receivables and payables | 73 | (215) | 130 | 12 | 0 | ||||||||||||||||||||||||
| Dividends received from joint ventures | 0 | 91 | 0 | 0 | 91 | ||||||||||||||||||||||||
| Taxation refund | 0 | 0 | 5 | 0 | 5 | ||||||||||||||||||||||||
| Taxation paid | 0 | 0 | (171) | 0 | (171) | ||||||||||||||||||||||||
| Net cash inflow (outflow) from operating activities from continuing operations | (20) | (142) | 998 | 20 | 856 | ||||||||||||||||||||||||
| Net cash inflow (outflow) from operating activities from discontinued operations | (27) | 0 | 28 | 0 | 1 | ||||||||||||||||||||||||
| Net cash inflow (outflow) from operating activities | (47) | (142) | 1,026 | 20 | 857 | ||||||||||||||||||||||||
| Cash flows from investing activities | |||||||||||||||||||||||||||||
| Capital expenditure | 0 | 0 | (575) | 0 | (575) | ||||||||||||||||||||||||
| Proceeds from disposal of tangible assets | 0 | 0 | 4 | 6 | 10 | ||||||||||||||||||||||||
| Dividends from other investments | 2 | 0 | 0 | 0 | 2 | ||||||||||||||||||||||||
| Other investments acquired | 0 | 0 | (13) | 0 | (13) | ||||||||||||||||||||||||
| Proceeds from disposal of other investments | 0 | 0 | 7 | 0 | 7 | ||||||||||||||||||||||||
| Investments in associates and joint ventures | 0 | 0 | (8) | 0 | (8) | ||||||||||||||||||||||||
| Net loans repaid by (advanced to) associates and joint ventures | 9 | 10 | (2) | 0 | 17 | ||||||||||||||||||||||||
| Disposal (acquisition) of subsidiaries | 0 | (7) | 7 | 0 | 0 | ||||||||||||||||||||||||
| Decrease (increase) in cash restricted for use | 0 | 1 | (6) | (1) | (6) | ||||||||||||||||||||||||
| Interest received | 0 | 1 | 4 | 0 | 5 | ||||||||||||||||||||||||
| Net cash inflow (outflow) from investing activities from continuing operations | 11 | 5 | (582) | 5 | (561) | ||||||||||||||||||||||||
| Net cash inflow (outflow) from investing activities from discontinued operations | 207 | 0 | 19 | 0 | 226 | ||||||||||||||||||||||||
| Net cash inflow (outflow) from investing activities | 218 | 5 | (563) | 5 | (335) | ||||||||||||||||||||||||
| Cash flows from financing activities | |||||||||||||||||||||||||||||
| Proceeds from borrowings | 407 | 45 | 301 | 0 | 753 | ||||||||||||||||||||||||
| Repayment of borrowings | (570) | (80) | (317) | 0 | (967) | ||||||||||||||||||||||||
| Finance costs paid | (12) | (102) | (16) | 0 | (130) | ||||||||||||||||||||||||
| Other borrowing costs | 0 | (10) | 0 | 0 | (10) | ||||||||||||||||||||||||
| Dividends paid | (24) | 0 | (15) | 0 | (39) | ||||||||||||||||||||||||
| Intergroup dividends received (paid) | 25 | 360 | (386) | 1 | 0 | ||||||||||||||||||||||||
| Net cash inflow (outflow) from financing activities from continuing operations | (174) | 213 | (433) | 1 | (393) | ||||||||||||||||||||||||
| Net cash inflow (outflow) from financing activities from discontinued operations | 0 | 0 | 0 | 0 | 0 | ||||||||||||||||||||||||
| Net cash inflow (outflow) from financing activities | (174) | 213 | (433) | 1 | (393) | ||||||||||||||||||||||||
| Net increase (decrease) in cash and cash equivalents | (3) | 76 | 30 | 26 | 129 | ||||||||||||||||||||||||
| Translation | (1) | 0 | 22 | (26) | (5) | ||||||||||||||||||||||||
| Cash and cash equivalents at beginning of year | 11 | 21 | 173 | 0 | 205 | ||||||||||||||||||||||||
| Cash and cash equivalents at end of year | 7 | 97 | 225 | 0 | 329 | ||||||||||||||||||||||||
PAGE LEFT BLANK INTENTIONALLY
F - 10187
KIBALI (JERSEY) LIMITED
Consolidated Financial Statements for the Three Years Ended
31 December 2020, 20192022, 2021 and 20182020
F - 10288
CONTENTS
| PAGE | |||||
| Report of independent registered public accounting firm | F - | ||||
| (BDO LLP: London, United Kingdom: PCAOB ID # 1295) | |||||
| Consolidated statements of profit or loss and other comprehensive income for the years ended 31 December | F - | ||||
| Consolidated statements of financial position as at 31 December | F - | ||||
| Consolidated statements of changes in equity for the years ended 31 December | F - | ||||
| Consolidated statements of cash flows for the years ended 31 December | F - | ||||
| Notes to the consolidated financial statements | F - | ||||
F - 10389
REPORT OF INDEPENDENT REGISTERED PUBLIC ACCOUNTING FIRM
Shareholders and Board of Directors
Kibali (Jersey) Limited
Jersey, Channel Islands
Opinion on the Consolidated Financial Statements
We have audited the accompanying consolidated statements of financial position of Kibali (Jersey) Limited (the Company) and subsidiaries“Company”) as of December 31, December2022, 2021 and 2020, 2019 and 2018, the related consolidated statements of profit or loss and other comprehensive income, changes in equity, and cash flows for each of the three years in the period ended December 31, December 2020,2022, and the related notes (collectively referred to as the “consolidated financial statements”). In our opinion, the consolidated financial statements present fairly, in all material respects, the financial position of the Company at December 31, 2022, 2021 and subsidiaries at 31 December 2020, 2019 and 2018, and the results of theirits operations and theirits cash flows for each of the three years in the period ended December 31, December 2020,2022, in conformity with International Financial Reporting Standards as issued by the International Accounting Standards Board.
Basis for Opinion
These consolidated financial statements are the responsibility of the Company’s management. Our responsibility is to express an opinion on the Company’s consolidated financial statements based on our audits. We are a public accounting firm registered with the Public Company Accounting Oversight Board (United States) (PCAOB)(“PCAOB”) and are required to be independent with respect to the Company in accordance with the U.S. federal securities laws and the applicable rules and regulations of the Securities and Exchange Commission and the PCAOB.
We conducted our audits in accordance with the standards of the PCAOB. Those standards require that we plan and perform the audit to obtain reasonable assurance about whether the consolidated financial statements are free of material misstatement, whether due to error or fraud. The Company is not required to have, nor were we engaged to perform, an audit of its internal control over financial reporting. As part of our audits we are required to obtain an understanding of internal control over financial reporting but not for the purpose of expressing an opinion on the effectiveness of the Company’s internal control over financial reporting. Accordingly, we express no such opinion.
Our audits included performing procedures to assess the risks of material misstatement of the consolidated financial statements, whether due to error or fraud, and performing procedures that respond to those risks. Such procedures included examining, on a test basis, evidence regarding the amounts and disclosures in the consolidated financial statements. Our audits also included evaluating the accounting principles used and significant estimates made by management, as well as evaluating the overall presentation of the consolidated financial statements. We believe that our audits provide a reasonable basis for our opinion.
/s/ BDO LLP
BDO LLP
We have served as the Company's auditor since 2013.
London, United Kingdom
F - 10490
CONSOLIDATED STATEMENTS OF PROFIT OR LOSS AND OTHER COMPREHENSIVE INCOME
FOR THE YEARS ENDED 31 DECEMBER 2020, 20192022, 2021 and 20182020
| 31 Dec | 31 Dec | 31 Dec | 31 Dec | 31 Dec | 31 Dec | |||||||||||||||||||||||||||||||||||||||||||||||
| Note | 2020 | 2019 | 2018 | Note | 2022 | 2021 | 2020 | |||||||||||||||||||||||||||||||||||||||||||||
| US$’000 | US$’000 | US$’000 | US$’000 | US$’000 | US$’000 | |||||||||||||||||||||||||||||||||||||||||||||||
| REVENUE | REVENUE | REVENUE | ||||||||||||||||||||||||||||||||||||||||||||||||||
| Gold sales | Gold sales | 4 | 1,440,328 | 1,122,940 | 1,041,035 | Gold sales | 3/25 | 1,328,306 | 1,469,221 | 1,440,328 | ||||||||||||||||||||||||||||||||||||||||||
| Other income | Other income | 5 | 2,204 | 170 | 56,838 | Other income | 4 | 539 | 1,208 | 2,204 | ||||||||||||||||||||||||||||||||||||||||||
| TOTAL INCOME | TOTAL INCOME | 1,442,532 | 1,123,110 | 1,097,873 | TOTAL INCOME | 1,328,845 | 1,470,429 | 1,442,532 | ||||||||||||||||||||||||||||||||||||||||||||
| COSTS AND EXPENSES | COSTS AND EXPENSES | COSTS AND EXPENSES | ||||||||||||||||||||||||||||||||||||||||||||||||||
| Mining and processing costs | Mining and processing costs | 6 | 670,138 | 688,796 | 772,259 | Mining and processing costs | 5 | 674,019 | 688,086 | 670,138 | ||||||||||||||||||||||||||||||||||||||||||
| Royalties | Royalties | 67,547 | 52,792 | 45,249 | Royalties | 62,472 | 68,704 | 67,547 | ||||||||||||||||||||||||||||||||||||||||||||
| Exploration and corporate expenditure | Exploration and corporate expenditure | 7 | 6,274 | 13,686 | 6,154 | Exploration and corporate expenditure | 6 | 6,795 | 5,848 | 6,274 | ||||||||||||||||||||||||||||||||||||||||||
| Other expenses | Other expenses | 5 | 37,477 | 6,021 | 45,288 | Other expenses | 4 | 52,778 | 33,246 | 37,477 | ||||||||||||||||||||||||||||||||||||||||||
| TOTAL COSTS | TOTAL COSTS | 781,436 | 761,295 | 868,950 | TOTAL COSTS | 796,064 | 795,884 | 781,436 | ||||||||||||||||||||||||||||||||||||||||||||
| Finance income | Finance income | 8 | 6,912 | 4,370 | 3,380 | Finance income | 7 | 5,187 | 5,618 | 6,912 | ||||||||||||||||||||||||||||||||||||||||||
| Finance costs | Finance costs | 8 | (6,460) | (3,973) | (4,465) | Finance costs | 7 | (49,917) | (5,913) | (6,460) | ||||||||||||||||||||||||||||||||||||||||||
| Finance income/costs – net | 452 | 397 | (1,085) | |||||||||||||||||||||||||||||||||||||||||||||||||
| Share of profits of equity accounted joint venture | Share of profits of equity accounted joint venture | 25 | 239 | 34 | 132 | Share of profits of equity accounted joint venture | 24 | 157 | 103 | 239 | ||||||||||||||||||||||||||||||||||||||||||
| PROFIT BEFORE INCOME TAX | PROFIT BEFORE INCOME TAX | 661,788 | 362,246 | 227,970 | PROFIT BEFORE INCOME TAX | 488,208 | 674,353 | 661,787 | ||||||||||||||||||||||||||||||||||||||||||||
| Income tax expense | Income tax expense | 9 | (157,090) | (61,934) | (15,972) | Income tax expense | 8 | (155,946) | (180,715) | (157,090) | ||||||||||||||||||||||||||||||||||||||||||
| PROFIT FOR THE YEAR | PROFIT FOR THE YEAR | 504,698 | 300,312 | 211,998 | PROFIT FOR THE YEAR | 332,262 | 493,638 | 504,697 | ||||||||||||||||||||||||||||||||||||||||||||
| OTHER COMPREHENSIVE EXPENSE | ||||||||||||||||||||||||||||||||||||||||||||||||||||
| Gain/(Loss) on investment in marketable securities | 6 | (5) | (17) | |||||||||||||||||||||||||||||||||||||||||||||||||
| OTHER COMPREHENSIVE INCOME/(EXPENSE) | OTHER COMPREHENSIVE INCOME/(EXPENSE) | |||||||||||||||||||||||||||||||||||||||||||||||||||
| (Loss)/Gain on investment in marketable securities | (Loss)/Gain on investment in marketable securities | (2) | (2) | 6 | ||||||||||||||||||||||||||||||||||||||||||||||||
| TOTAL COMPREHENSIVE INCOME | TOTAL COMPREHENSIVE INCOME | 504,704 | 300,307 | 211,981 | TOTAL COMPREHENSIVE INCOME | 332,260 | 493,636 | 504,703 | ||||||||||||||||||||||||||||||||||||||||||||
| PROFIT FOR THE YEAR | PROFIT FOR THE YEAR | PROFIT FOR THE YEAR | ||||||||||||||||||||||||||||||||||||||||||||||||||
| Attributable to: | Attributable to: | Attributable to: | ||||||||||||||||||||||||||||||||||||||||||||||||||
| Owners of the parent | Owners of the parent | 472,533 | 288,401 | 207,750 | Owners of the parent | 306,330 | 461,271 | 472,533 | ||||||||||||||||||||||||||||||||||||||||||||
| Non-controlling interest | Non-controlling interest | 32,164 | 11,911 | 4,248 | Non-controlling interest | 25,930 | 32,367 | 32,164 | ||||||||||||||||||||||||||||||||||||||||||||
| 504,697 | 300,312 | 211,998 | 332,260 | 493,638 | 504,697 | |||||||||||||||||||||||||||||||||||||||||||||||
| TOTAL COMPREHENSIVE INCOME | TOTAL COMPREHENSIVE INCOME | TOTAL COMPREHENSIVE INCOME | ||||||||||||||||||||||||||||||||||||||||||||||||||
| Attributable to: | Attributable to: | Attributable to: | ||||||||||||||||||||||||||||||||||||||||||||||||||
| Owners of the parent | Owners of the parent | 472,539 | 288,396 | 207,733 | Owners of the parent | 306,330 | 461,269 | 472,539 | ||||||||||||||||||||||||||||||||||||||||||||
| Non-controlling interest | Non-controlling interest | 32,164 | 11,911 | 4,248 | Non-controlling interest | 25,930 | 32,367 | 32,164 | ||||||||||||||||||||||||||||||||||||||||||||
| 504,703 | 300,307 | 211,981 | 332,260 | 493,636 | 504,703 | |||||||||||||||||||||||||||||||||||||||||||||||
The accompanying notes form part of these consolidated financial statements
F - 10591
CONSOLIDATED STATEMENTS OF FINANCIAL POSITION
AS AT 31 DECEMBER 2020, 20192022, 2021 and 20182020
| 31 Dec | 31 Dec | 31 Dec | 31 Dec | 31 Dec | 31 Dec | |||||||||||||||||||||||||||||||||||||||||||||||
| Note | 2020 | 2019 | 2018 | Note | 2022 | 2021 | 2020 | |||||||||||||||||||||||||||||||||||||||||||||
| US$’000 | US$’000 | US$’000 | US$’000 | US$’000 | US$’000 | |||||||||||||||||||||||||||||||||||||||||||||||
| NON-CURRENT ASSETS | NON-CURRENT ASSETS | NON-CURRENT ASSETS | ||||||||||||||||||||||||||||||||||||||||||||||||||
| Property, plant and equipment | Property, plant and equipment | 10 | 1,846,746 | 1,892,847 | 1,988,533 | Property, plant and equipment | 9 | 1,844,984 | 1,811,291 | 1,846,746 | ||||||||||||||||||||||||||||||||||||||||||
| Mineral properties | Mineral properties | 11 | 366,053 | 404,432 | 454,479 | Mineral properties | 10 | 308,141 | 334,881 | 366,053 | ||||||||||||||||||||||||||||||||||||||||||
| Long term ore stockpiles | Long term ore stockpiles | 14 | 36,875 | 52,685 | 28,510 | Long term ore stockpiles | 13 | 20,160 | — | 36,875 | ||||||||||||||||||||||||||||||||||||||||||
| Investment in equity accounted joint venture | 25 | 550 | 343 | 387 | ||||||||||||||||||||||||||||||||||||||||||||||||
| Other investments in joint venture | 25 | 22,790 | 20,795 | 21,479 | ||||||||||||||||||||||||||||||||||||||||||||||||
| Total investment in joint venture | 25 | 23,340 | 21,138 | 21,866 | ||||||||||||||||||||||||||||||||||||||||||||||||
| Investment in Associate | Investment in Associate | 4 | 4 | |||||||||||||||||||||||||||||||||||||||||||||||||
| Investment in joint venture | Investment in joint venture | 24 | 26,254 | 21,776 | 23,340 | |||||||||||||||||||||||||||||||||||||||||||||||
| Trade and other receivables | Trade and other receivables | 13 | 185,768 | 140,987 | 137,852 | Trade and other receivables | 12 | 220,845 | 192,507 | 185,768 | ||||||||||||||||||||||||||||||||||||||||||
| Deferred tax asset | 12 | — | 9,647 | 27,265 | ||||||||||||||||||||||||||||||||||||||||||||||||
| TOTAL NON-CURRENT ASSETS | TOTAL NON-CURRENT ASSETS | 2,458,782 | 2,521,736 | 2,658,505 | TOTAL NON-CURRENT ASSETS | 2,420,388 | 2,360,459 | 2,458,782 | ||||||||||||||||||||||||||||||||||||||||||||
| CURRENT ASSETS | CURRENT ASSETS | CURRENT ASSETS | ||||||||||||||||||||||||||||||||||||||||||||||||||
| Inventories and ore stockpiles | Inventories and ore stockpiles | 14 | 90,487 | 95,003 | 93,036 | Inventories and ore stockpiles | 13 | 75,921 | 107,951 | 90,487 | ||||||||||||||||||||||||||||||||||||||||||
| Trade and other receivables | Trade and other receivables | 13 | 29,699 | 89,047 | 112,982 | Trade and other receivables | 12 | 124,940 | 53,915 | 29,699 | ||||||||||||||||||||||||||||||||||||||||||
| Investment in marketable securities | Investment in marketable securities | 9 | 3 | 9 | Investment in marketable securities | 8 | 7 | 9 | ||||||||||||||||||||||||||||||||||||||||||||
| Current tax receivable | Current tax receivable | 302 | — | — | ||||||||||||||||||||||||||||||||||||||||||||||||
| Cash and cash equivalents | Cash and cash equivalents | 22 | 944,233 | 452,692 | 123,931 | Cash and cash equivalents | 21 | 91,865 | 1,115,359 | 944,233 | ||||||||||||||||||||||||||||||||||||||||||
| TOTAL CURRENT ASSETS | TOTAL CURRENT ASSETS | 1,064,428 | 636,745 | 329,958 | TOTAL CURRENT ASSETS | 293,036 | 1,277,232 | 1,064,428 | ||||||||||||||||||||||||||||||||||||||||||||
| TOTAL ASSETS | TOTAL ASSETS | 3,523,210 | 3,158,481 | 2,988,463 | TOTAL ASSETS | 2,713,424 | 3,637,691 | 3,523,210 | ||||||||||||||||||||||||||||||||||||||||||||
| EQUITY AND LIABILITIES | EQUITY AND LIABILITIES | EQUITY AND LIABILITIES | ||||||||||||||||||||||||||||||||||||||||||||||||||
| Equity | Equity | Equity | ||||||||||||||||||||||||||||||||||||||||||||||||||
| Share capital | Share capital | 15 | 5 | 5 | 5 | Share capital | 14 | 5 | 5 | 5 | ||||||||||||||||||||||||||||||||||||||||||
| Share premium | Share premium | 15 | 2,523,612 | 2,523,612 | 2,523,612 | Share premium | 14 | 2,123,612 | 2,523,612 | 2,523,612 | ||||||||||||||||||||||||||||||||||||||||||
| Retained earnings | 655,005 | 462,972 | 324,571 | |||||||||||||||||||||||||||||||||||||||||||||||||
| Other reserve | (36) | (42) | (37) | |||||||||||||||||||||||||||||||||||||||||||||||||
| (Accumulated deficit)/Retained earnings | (Accumulated deficit)/Retained earnings | (27,194) | 655,276 | 655,005 | ||||||||||||||||||||||||||||||||||||||||||||||||
| Other deficit | Other deficit | (40) | (38) | (36) | ||||||||||||||||||||||||||||||||||||||||||||||||
| Equity attributable to owners of the parent | Equity attributable to owners of the parent | 3,178,586 | 2,986,547 | 2,848,151 | Equity attributable to owners of the parent | 2,096,383 | 3,178,855 | 3,178,586 | ||||||||||||||||||||||||||||||||||||||||||||
| Non-controlling interest | Non-controlling interest | 16 | 55,743 | 23,579 | 11,668 | Non-controlling interest | 15 | 85,040 | 68,110 | 55,743 | ||||||||||||||||||||||||||||||||||||||||||
| TOTAL EQUITY | TOTAL EQUITY | 3,234,329 | 3,010,126 | 2,859,819 | TOTAL EQUITY | 2,181,423 | 3,246,965 | 3,234,329 | ||||||||||||||||||||||||||||||||||||||||||||
| NON-CURRENT LIABILITIES | NON-CURRENT LIABILITIES | NON-CURRENT LIABILITIES | ||||||||||||||||||||||||||||||||||||||||||||||||||
Loans and borrowings 1 | 17 | — | 1,507 | 1,526 | ||||||||||||||||||||||||||||||||||||||||||||||||
| Loans and borrowings | Loans and borrowings | 16 | — | 1,839 | — | |||||||||||||||||||||||||||||||||||||||||||||||
| Lease liabilities | Lease liabilities | 17 | 50,457 | 43,821 | 27,465 | Lease liabilities | 16 | 51,045 | 41,839 | 50,457 | ||||||||||||||||||||||||||||||||||||||||||
| Deferred tax liability | Deferred tax liability | 12 | 89,609 | — | — | Deferred tax liability | 11 | 296,507 | 196,654 | 89,609 | ||||||||||||||||||||||||||||||||||||||||||
| Provision for rehabilitation | Provision for rehabilitation | 18 | 28,364 | 25,516 | 23,640 | Provision for rehabilitation | 17 | 23,233 | 29,026 | 28,364 | ||||||||||||||||||||||||||||||||||||||||||
| TOTAL NON-CURRENT LIABILITIES | TOTAL NON-CURRENT LIABILITIES | 168,430 | 70,844 | 52,631 | TOTAL NON-CURRENT LIABILITIES | 370,785 | 269,358 | 168,430 | ||||||||||||||||||||||||||||||||||||||||||||
| CURRENT LIABILITIES | CURRENT LIABILITIES | CURRENT LIABILITIES | ||||||||||||||||||||||||||||||||||||||||||||||||||
| Loans and borrowings | Loans and borrowings | 16 | 43,298 | — | — | |||||||||||||||||||||||||||||||||||||||||||||||
| Lease liabilities | Lease liabilities | 17 | 14,674 | 11,105 | 11,425 | Lease liabilities | 16 | 12,507 | 13,909 | 14,674 | ||||||||||||||||||||||||||||||||||||||||||
| Trade and other payables | Trade and other payables | 19 | 66,881 | 45,460 | 59,770 | Trade and other payables | 18 | 104,815 | 97,109 | 66,881 | ||||||||||||||||||||||||||||||||||||||||||
| Provision for rehabilitation | Provision for rehabilitation | 18 | 803 | 1,024 | — | Provision for rehabilitation | 17 | 596 | 600 | 803 | ||||||||||||||||||||||||||||||||||||||||||
| Current tax payable | Current tax payable | 38,093 | 19,922 | 4,818 | Current tax payable | — | 9,750 | 38,093 | ||||||||||||||||||||||||||||||||||||||||||||
| TOTAL CURRENT LIABILITIES | TOTAL CURRENT LIABILITIES | 120,451 | 77,511 | 76,013 | TOTAL CURRENT LIABILITIES | 161,216 | 121,368 | 120,451 | ||||||||||||||||||||||||||||||||||||||||||||
| TOTAL EQUITY AND LIABILITIES | TOTAL EQUITY AND LIABILITIES | 3,523,210 | 3,158,481 | 2,988,463 | TOTAL EQUITY AND LIABILITIES | 2,713,424 | 3,637,691 | 3,523,210 | ||||||||||||||||||||||||||||||||||||||||||||
The consolidated financial statements were approved by the Board of Directors on 2617 March 20212023 and signed on its behalf by:
| Graham Shuttleworth | ||||||||
| Director | ||||||||
The accompanying notes form part of these consolidated financial statements
F - 10692
CONSOLIDATED STATEMENTS OF CHANGES IN EQUITY
FOR THE YEARS ENDED 31 DECEMBER 2020, 20192022, 2021 and 20182020
| Total equity | (Accumulated | Total equity | |||||||||||||||||||||||||||||||||||||||||||||||
| attributable | Non- | Deficit)/ | attributable | Non- | |||||||||||||||||||||||||||||||||||||||||||||
| US$’000 | US$’000 | Share | Retained | Other | to owners of | controlling | Total | US$’000 | Note | Share | Retained | Other | to owners of | controlling | Total | ||||||||||||||||||||||||||||||||||
| capital | premium | earnings | reserves | the parent | interest | equity | capital | premium | earnings | reserves | the parent | interest | equity | ||||||||||||||||||||||||||||||||||||
| Balance at 1 January 2018 | 5 | 2,523,612 | 293,821 | (20) | 2,817,418 | 7,420 | 2,824,838 | ||||||||||||||||||||||||||||||||||||||||||
| Balance at 1 January 2020 | Balance at 1 January 2020 | 5 | 2,523,612 | 462,972 | (42) | 2,986,547 | 23,579 | 3,010,126 | |||||||||||||||||||||||||||||||||||||||||
| Fair value movement on investment in marketable securities | Fair value movement on investment in marketable securities | — | (17) | — | (17) | Fair value movement on investment in marketable securities | — | 6 | — | 6 | |||||||||||||||||||||||||||||||||||||||
| Total other comprehensive expense | Total other comprehensive expense | — | — | — | (17) | — | (17) | Total other comprehensive expense | — | — | — | 6 | — | 6 | |||||||||||||||||||||||||||||||||||
| Net profit for the year | Net profit for the year | — | 207,750 | — | 207,750 | 4,248 | 211,998 | Net profit for the year | — | 472,533 | — | 472,533 | 32,164 | 504,697 | |||||||||||||||||||||||||||||||||||
| Total comprehensive income/(expense) | — | 207,750 | (17) | 207,733 | 4,248 | 211,981 | |||||||||||||||||||||||||||||||||||||||||||
| Total comprehensive income | Total comprehensive income | — | 472,533 | 6 | 472,539 | 32,164 | 504,703 | ||||||||||||||||||||||||||||||||||||||||||
Dividend paid (1) | Dividend paid (1) | — | (177,000) | — | (177,000) | — | (177,000) | Dividend paid (1) | — | (280,500) | — | (280,500) | — | (280,500) | |||||||||||||||||||||||||||||||||||
| Balance at 31 December 2018 | 5 | 2,523,612 | 324,571 | (37) | 2,848,151 | 11,668 | 2,859,819 | ||||||||||||||||||||||||||||||||||||||||||
| Balance at 31 December 2020 | Balance at 31 December 2020 | 5 | 2,523,612 | 655,005 | (36) | 3,178,586 | 55,743 | 3,234,329 | |||||||||||||||||||||||||||||||||||||||||
| Balance at 1 January 2019 | 5 | 2,523,612 | 324,571 | (37) | 2,848,151 | 11,668 | 2,859,819 | ||||||||||||||||||||||||||||||||||||||||||
| Fair value movement on investment in marketable securities | — | (5) | — | (5) | |||||||||||||||||||||||||||||||||||||||||||||
| Total other comprehensive expense | — | — | — | (5) | — | (5) | |||||||||||||||||||||||||||||||||||||||||||
| Net profit for the year | — | 288,401 | — | 288,401 | 11,911 | 300,312 | |||||||||||||||||||||||||||||||||||||||||||
| Total comprehensive income/(expense) | — | 288,401 | (5) | 288,396 | 11,911 | 300,307 | |||||||||||||||||||||||||||||||||||||||||||
Dividend paid (1) | — | (150,000) | — | (150,000) | — | (150,000) | |||||||||||||||||||||||||||||||||||||||||||
| Balance at 31 December 2019 | 5 | 2,523,612 | 462,972 | (42) | 2,986,547 | 23,579 | 3,010,126 | ||||||||||||||||||||||||||||||||||||||||||
| Balance at 1 January 2020 | 5 | 2,523,612 | 462,972 | (42) | 2,986,547 | 23,579 | 3,010,126 | ||||||||||||||||||||||||||||||||||||||||||
| Fair value movement on investment in marketable securities | Fair value movement on investment in marketable securities | — | 6 | — | 6 | Fair value movement on investment in marketable securities | — | (2) | — | (2) | |||||||||||||||||||||||||||||||||||||||
| Total other comprehensive income | Total other comprehensive income | — | — | — | 6 | 6 | — | 6 | Total other comprehensive income | — | — | — | (2) | — | (2) | ||||||||||||||||||||||||||||||||||
| Net profit for the year | Net profit for the year | — | 472,533 | — | 472,533 | 32,164 | 504,697 | Net profit for the year | — | 461,271 | — | 461,271 | 32,367 | 493,638 | |||||||||||||||||||||||||||||||||||
| Total comprehensive income | Total comprehensive income | — | 472,533 | 6 | 472,539 | 32,164 | 504,703 | Total comprehensive income | — | 461,271 | (2) | 461,269 | 32,367 | 493,636 | |||||||||||||||||||||||||||||||||||
Dividend paid (1) | Dividend paid (1) | — | (280,500) | — | (280,500) | — | (280,500) | Dividend paid (1) | — | (461,000) | — | (461,000) | (20,000) | (481,000) | |||||||||||||||||||||||||||||||||||
| Balance at 31 December 2020 | 5 | 2,523,612 | 655,005 | (36) | 3,178,586 | 55,743 | 3,234,329 | ||||||||||||||||||||||||||||||||||||||||||
| Balance at 31 December 2021 | Balance at 31 December 2021 | 5 | 2,523,612 | 655,276 | (38) | 3,178,855 | 68,110 | 3,246,965 | |||||||||||||||||||||||||||||||||||||||||
| Fair value movement on investment in marketable securities | Fair value movement on investment in marketable securities | — | (2) | — | (2) | ||||||||||||||||||||||||||||||||||||||||||||
| Total other comprehensive expense | Total other comprehensive expense | — | — | — | (2) | — | (2) | ||||||||||||||||||||||||||||||||||||||||||
| Reclassification of share premium | Reclassification of share premium | 14 | (400,000) | 400,000 | — | — | |||||||||||||||||||||||||||||||||||||||||||
| Net profit for the year | Net profit for the year | — | 306,330 | — | 306,330 | 25,930 | 332,260 | ||||||||||||||||||||||||||||||||||||||||||
| Total comprehensive income | Total comprehensive income | — | (400,000) | 706,330 | (2) | 306,328 | 25,930 | 332,258 | |||||||||||||||||||||||||||||||||||||||||
Dividend paid (1) | Dividend paid (1) | — | (1,388,800) | — | (1,388,800) | (9,000) | (1,397,800) | ||||||||||||||||||||||||||||||||||||||||||
| Balance at 31 December 2022 | Balance at 31 December 2022 | 5 | 2,123,612 | (27,194) | (40) | 2,096,383 | 85,040 | 2,181,423 | |||||||||||||||||||||||||||||||||||||||||
SHARE CAPITAL
The share capital comprises the issued ordinary shares of the Company at par.
SHARE PREMIUM
The share premium comprises the excess value recognised from the issue of ordinary shares at par.
(ACCUMULATED DEFICIT)/RETAINED EARNINGS
(Accumulated deficit)/Retained earnings comprises the Group’s cumulative accounting profits and losses since inception less
dividends.
OTHER RESERVES
Other reserves comprises the Group’s cumulative fair value movement on the investment in marketable securities since inception in Kilo Goldmines Limited less amounts reclassified to profit and loss.
NON-CONTROLLING INTEREST
The non-controlling interest represents the total carrying value of the 10% interest Société Minière de Kilo- Moto SA UNISARL (SOKIMO) has in Kibali Goldmines SA ("Kibali"), which is a subsidiary of Kibali (Jersey) Limited.
(1) This balance relates to dividends declared and fully paid up to Shareholders in the period.
The accompanying notes form part of these consolidated financial statements
F - 10793
CONSOLIDATED STATEMENTS OF CASH FLOWS
FOR THE YEARS ENDED 31 DECEMBER 2020, 20192022, 2021 and 20182020
| 31 Dec | 31 Dec | 31 Dec | 31 Dec | 31 Dec | 31 Dec | ||||||||||||||||||||||||||||||||||||||||||||||||||||||||
| 2020 | 2019 | 2018 | 2022 | 2021 | 2020 | ||||||||||||||||||||||||||||||||||||||||||||||||||||||||
| US$’000 | US$’000 | US$’000 | US$’000 | US$’000 | US$’000 | ||||||||||||||||||||||||||||||||||||||||||||||||||||||||
| Cash Flows From Operating Activities | Cash Flows From Operating Activities | Cash Flows From Operating Activities | |||||||||||||||||||||||||||||||||||||||||||||||||||||||||||
| Cash generated by operations | Cash generated by operations | 23 | 956,870 | 615,431 | 473,208 | Cash generated by operations | 22 | 675,900 | 944,244 | 956,870 | |||||||||||||||||||||||||||||||||||||||||||||||||||
| Interest received | Interest received | 4,158 | 2,683 | 1,814 | Interest received | 3,783 | 3,327 | 4,158 | |||||||||||||||||||||||||||||||||||||||||||||||||||||
| Finance cost paid | Finance cost paid | (299) | (715) | (515) | Finance cost paid | (1) | (1) | (299) | |||||||||||||||||||||||||||||||||||||||||||||||||||||
| Dividends received from equity | |||||||||||||||||||||||||||||||||||||||||||||||||||||||||||||
| accounted joint venture | 25 | 65 | 156 | — | |||||||||||||||||||||||||||||||||||||||||||||||||||||||||
| Dividends received from equity accounted joint venture | Dividends received from equity accounted joint venture | — | 495 | 65 | |||||||||||||||||||||||||||||||||||||||||||||||||||||||||
| Income tax paid | Income tax paid | (32,121) | (6,193) | — | Income tax paid | 8 | (55,815) | (84,575) | (32,121) | ||||||||||||||||||||||||||||||||||||||||||||||||||||
| Withholding tax paid | Withholding tax paid | (8,100) | (18,000) | — | |||||||||||||||||||||||||||||||||||||||||||||||||||||||||
| Net cash flows generated by operating activities | Net cash flows generated by operating activities | 928,673 | 611,362 | 474,507 | Net cash flows generated by operating activities | 615,767 | 845,490 | 928,673 | |||||||||||||||||||||||||||||||||||||||||||||||||||||
| Cash Flows Related to Investing Activities | Cash Flows Related to Investing Activities | Cash Flows Related to Investing Activities | |||||||||||||||||||||||||||||||||||||||||||||||||||||||||||
| Additions of property, plant and equipment | Additions of property, plant and equipment | (132,229) | (120,202) | (155,298) | Additions of property, plant and equipment | (199,534) | (168,762) | (132,229) | |||||||||||||||||||||||||||||||||||||||||||||||||||||
| Drawdowns, interest and capital repayments from equity accounted joint venture | (468) | 1,900 | 4,098 | ||||||||||||||||||||||||||||||||||||||||||||||||||||||||||
| Drawdowns, interest and capital payments from equity accounted joint venture | Drawdowns, interest and capital payments from equity accounted joint venture | (157) | (37) | (468) | |||||||||||||||||||||||||||||||||||||||||||||||||||||||||
| Net cash flows used in investing activities | Net cash flows used in investing activities | (132,697) | (118,302) | (151,200) | Net cash flows used in investing activities | (199,691) | (168,799) | (132,697) | |||||||||||||||||||||||||||||||||||||||||||||||||||||
| Cash Flows Relating to Financing Activities | Cash Flows Relating to Financing Activities | Cash Flows Relating to Financing Activities | |||||||||||||||||||||||||||||||||||||||||||||||||||||||||||
| Payment of dividends | Payment of dividends | (280,500) | (150,000) | (177,000) | Payment of dividends | (1,396,900) | (481,000) | (280,500) | |||||||||||||||||||||||||||||||||||||||||||||||||||||
| Principal paid on lease liabilities | (20,753) | (11,110) | (9,579) | ||||||||||||||||||||||||||||||||||||||||||||||||||||||||||
| Cash repatriation fees paid | Cash repatriation fees paid | 7 | (44,351) | ||||||||||||||||||||||||||||||||||||||||||||||||||||||||||
| Increase in overdraft | Increase in overdraft | 20,341 | — | — | |||||||||||||||||||||||||||||||||||||||||||||||||||||||||
| Lease repayments | Lease repayments | (14,350) | (20,530) | (20,753) | |||||||||||||||||||||||||||||||||||||||||||||||||||||||||
| Interest paid on lease liabilities | Interest paid on lease liabilities | (3,182) | (3,153) | (3,359) | Interest paid on lease liabilities | (4,310) | (4,035) | (3,182) | |||||||||||||||||||||||||||||||||||||||||||||||||||||
| Net cash outflows through financing activities | (304,435) | (164,263) | (189,938) | ||||||||||||||||||||||||||||||||||||||||||||||||||||||||||
| Net cash outflows used in financing activities | Net cash outflows used in financing activities | (1,439,570) | (505,565) | (304,435) | |||||||||||||||||||||||||||||||||||||||||||||||||||||||||
| Net increase in cash and cash equivalents | Net increase in cash and cash equivalents | 491,541 | 328,797 | 133,369 | Net increase in cash and cash equivalents | (1,023,494) | 171,126 | 491,541 | |||||||||||||||||||||||||||||||||||||||||||||||||||||
| Cash and cash equivalents at the beginning of the year | Cash and cash equivalents at the beginning of the year | 452,692 | 123,895 | (9,474) | Cash and cash equivalents at the beginning of the year | 1,115,359 | 944,233 | 452,692 | |||||||||||||||||||||||||||||||||||||||||||||||||||||
| Cash and cash equivalents at the end of the year | Cash and cash equivalents at the end of the year | 944,233 | 452,692 | 123,895 | Cash and cash equivalents at the end of the year | 91,865 | 1,115,359 | 944,233 | |||||||||||||||||||||||||||||||||||||||||||||||||||||
| Cash and cash equivalents | 944,233 | 452,692 | 123,931 | |||||||||||||||||||||||
| Bank overdrafts | 19 | — | — | (36) | ||||||||||||||||||||||
| Cash and cash equivalents | 944,233 | 452,692 | 123,895 | |||||||||||||||||||||||
The accompanying notes form part of these consolidated financial statements
F - 108
NOTES TO THE CONSOLIDATED FINANCIAL STATEMENTS
The principal accounting policies applied in the preparation of these consolidated financial statements are set out below.These policies have been consistently applied to all the years presented, unless otherwise stated.
BASIS OF PREPARATION
The consolidated financial statements of Kibali (Jersey) Limited (the Company) and its subsidiaries and joint venture (the Group) have been prepared in accordance with International Financial Reporting Standards and Interpretations (collectively (IFRS)) issued by the International Accounting Standards Board (IASB).
The consolidated financial statements have been prepared under the historical cost convention, as modified by the revaluation of investment in marketable securities classified as fair value through other comprehensive income. The preparation of financial statements in conformity with IFRS requires the use of certain critical accounting estimates.estimates and judgements. It also requires management to exercise its judgement in the process of applying the Group’s accounting policies. The areas involving a high degree of judgement or complexity, or areas where assumptions and estimates are significant to the consolidated financial statements are disclosed in note 3.2.
NEW STANDARDS AND INTERPRETATIONS APPLIED
The IASB has issued the following new standards, amendments to published standards and interpretations to existing standards with effective dates on or prior to 1 January 20202022 which have been adopted by the Group for the first time this year.year, and had an immaterial or no impact.
F - 95
1. SIGNIFICANT ACCOUNTING POLICIES (CONTINUED)
NEW STANDARDS AND INTERPRETATIONS APPLIED (CONTINUED)
Effective period commencing on or after | ||||||||
| Amendments to Existing Standards | ||||||||
| IFRS 3, IAS 16 and IAS37 | Amendments to IFRS | |||||||
| IFRS 1, IFRS 9, IFRS 16 and IAS | ||||||||
Certain new standards, amendments and interpretations to existing standards have been published and are relevant to the Group’s activities and are mandatory for the Group’s accounting periods beginning 1 January 2020,2023, or later periods and which the Group has decided not to early adopt. These include the following, and are not expected to have any material impact:
Effective period commencing on or after | ||||||||
| IFRS 17 | Insurance contracts including amendments to IFRS 17 | 01-Jan-23 | ||||||
| IAS 1 | Amendments to IAS 1: Classification of Liabilities as Current or Non-current | 01-Jan-23 | ||||||
| Amendments to | 01-Jan-23 | |||||||
| IAS | Amendments to IAS 1 and IFRS Practice Statement 2 - Disclosure of Accounting policies | 01-Jan-23 | ||||||
| Amendments to IAS 12 - Deferred Tax related to Assets and Liabilities arising from a Single Transaction | 01-Jan-23 | |||||||
| IFRS | ||||||||
| Amendment to IFRS | ||||||||
F - 96
1. SIGNIFICANT ACCOUNTING POLICIES (CONTINUED)
CONSOLIDATION
The consolidated financial informationstatements includes the financial statements of the Company, its subsidiaries and the Company’s equity accounted joint ventures using uniform accounting policies for similar transactions and other events in similar circumstances.
SUBSIDIARIES
Subsidiaries are entities over which the Group has power, exposure, or rights, to variable returns from its involvement and the ability to use its power over the investee to affect the amount of the Group's returns; generally accompanying an interest of more than one-half of the voting rights.
Subsidiaries are fully consolidated from the date on which control is transferred to the Group. They are deconsolidated from the date that control ceases. The purchase method of accounting is used to account for the acquisition of subsidiaries by the Group. The cost of an acquisition is measured at the fair value of the assets given, equity instruments issued and liabilities incurred or assumed at the date of exchange. Acquisition costs are expensed. Identifiable assets acquired (including mineral property interests or other identifiable intangible assets) and liabilities and contingent liabilities assumed in a business combination are measured initially at their fair values at the acquisition date, irrespective of the extent of any non-controlling interest. The excess of the cost of acquisition over the fair value of the Group’s share of the identifiable net assets acquired is recorded as goodwill. If the cost of acquisition is less than the fair value of the net assets of the subsidiary acquired, the difference is recognised directly in the statement of comprehensive income.
Intercompany transactions, balances and unrealised gains on transactions between group companies are eliminated. Unrealised losses are also eliminated unless the transaction provides evidence of an impairment of the asset transferred. Accounting policies of subsidiaries have been changed where necessary to ensure consistency with the policies adopted by the Group.
NON-CONTROLLING INTERESTS
The Group initially recognisedrecognises any non-controlling interest in the acquiree at the non-controlling interest's proportionate share of the acquiree's net assets. The group has not elected to take the option to use fair value in acquisitions completed to date.
The total comprehensive income of non-wholly owned subsidiaries is attributed to owners of the parent and to the non-controlling interests in proportion to their relative ownership interests.
JOINT VENTURES
The Group holds interests in one joint venture. In a joint venture the parties that have joint control of the arrangement (the joint venturer) have a right to the net assets of the arrangement. This right is accounted for in the consolidated financial statements using the equity method. Joint control is considered to exist when there is contractual joint control; control being the power to govern the financial and operating policies of an entity so as to obtain benefits from the activities and the ability to use its power over the investee to affect the amounts of the Group’s returns by the joint venturers.
Acquisitions
Except for initial recognition under IFRS 11 transition rules, further investments in additional joint ventures are initially recognised at cost. The cost of an acquisition is measured at the fair value of the assets given, equity instruments issued or liabilities incurred or assumed at the date of exchange, plus costs directly attributable to the acquisition. Goodwill on associated companies and joint ventures represents the excess of the cost of acquisition of the associate or joint venture over the Group’s share of the fair value of the identifiable net assets of the associate or joint venture and is included in the carrying amount of the investment.
F - 97
1. SIGNIFICANT ACCOUNTING POLICIES (CONTINUED)
JOINT VENTURES (CONTINUED)
Joint ventures are accounted for using the equity method of accounting. In applying the equity method of accounting, the Group’s share of its joint ventures’ post-acquisition profits or losses are recognised in profit or loss and its share of post-acquisition other comprehensive income is recognised in other comprehensive income. These post-acquisition movements and distributions received from the joint venture companies are adjusted against the carrying amount of the investments. When the Group’s share of losses in a joint venture Company equals or exceeds its interest in the joint venture Company, including any other unsecured non-current receivables, the Group does not recognise further losses, unless it has obligations to make or has made payments on behalf of the joint venture Company.
Unrealised gains on transactions between the Group and its joint venture companies are eliminated to the extent of the Group’s interest in the joint venture companies. Unrealised losses are also eliminated unless the transaction provides evidence of an impairment of the asset transferred. Trading receivables and payables with joint ventures are classified within trade and other receivables and payables. The accounting policies of joint venture companies have been changed where necessary to ensure consistency with the accounting policies adopted by the Group.
Dividends received are classified as operating cash flows in the consolidated cash flow statement.
The carrying value of the investment in joint venture is compared to the recoverable amounts whenever circumstances indicate that the net book value may not be recoverable. An impairment is recognised in the profit or loss to the extent that the carrying value exceeds the recoverable amount.
Impairment provisions for loans to joint ventures classified as ‘other investments’ in joint venture are recognised based on a forward looking expected credit loss model. The methodology used to determine the amount of the provision is based on whether there has been a significant increase in credit risk since initial recognition of the financial asset. For those where the credit risk has not increased significantly since initial recognition of the financial asset, twelve month expected credit losses along with gross interest income are recognised. For those for which credit risk has increased significantly, lifetime expected credit losses along with the gross interest income are recognised. For those that are determined to be credit impaired, lifetime expected credit losses along with interest income on a net basis are recognised.
SEGMENTAL REPORTING
An operating segment is a group of assets and operations engaged in performing mining or advanced exploration that are subject to risks and returns that are different from those of other segments. Other parts of the business are aggregated and treated as part of a ‘corporate and exploration’ segment. The Group provides segmental information using the same categories of information which the Group’s chief operating decision-maker utilises. The Group’s chief operating decision maker is considered by management to be the board of directors.
The Group has only one operating segment, being that of gold mining. Segment analysis is based on the mining operations and exploration projects that have a significant amount of capitalised expenditure or other fixed assets.
FOREIGN CURRENCY TRANSLATION
Functional and presentation currency
Items included in the financial statements of each of the Group’s entities are measured using the currency of the primary economic environment in which the entity operates (the functional currency). The consolidated financial statements are presented in US dollars, which is also the functional currency of the Company and its significant subsidiaries and joint ventures.
F - 98
1. SIGNIFICANT ACCOUNTING POLICIES (CONTINUED)
FOREIGN CURRENCY TRANSLATION
Transactions and balances
Foreign currency transactions are translated into the relevant functional currency using the exchange rates prevailing at the date of the transactions. Foreign exchange gains and losses resulting from the settlement of such transactions and from the translation at year end exchange rates of monetary assets and liabilities denominated in foreign currencies are recognised in the statement of comprehensive income in other income and other expenses.
INTANGIBLE ASSETS
Mineral properties
PROPERTY, PLANT AND EQUIPMENT
Long-lived assets and mine development costs
Long-lived assets including development costs and mine plant facilities (such as metallurgical plant, tailings and raw water dams, power plant and mine infrastructure) are initially recorded at cost. Development of ore bodies includes the development cost of shaft systems and waste rock removal that allows access to reserves that are economically recoverable in the future. Cost associated with underground development are capitalised when the works provide access to the ore body, whereas costs associated with ore extraction from operating ore body sections are treated as operating costs. Where relevant the estimated cost of dismantling the asset and remediating the site is included in the cost of property, plant and equipment, subsequently they are measured at cost less accumulated amortisation and impairment.
Development costs consist primarily of direct expenditure incurred to establish or expand productive capacity.
Costs are capitalised during the construction of a new mine until commercial levels of production are achieved (refer to ‛commercial production’ below), after which the relevant costs are amortised. Costs are capitalised provided that the project is considered to be commercially, technically and economically viable. Such viability is deemed to be achieved when the Group is confident that the project will provide a satisfactory return relative to its perceived risks and is sufficiently certain of economic production. Costs which are necessarily incurred while commissioning new assets, in the period before they are capable of operating in the manner intended by management, are capitalised under ‘Long-lived assets and mine development costs’.
Development costs incurred after the commencement of production are capitalised to the extent they are expected to give rise to a future economic benefit.
Commercial production
When a mine construction project is substantially complete and ready for its intended use the asset moves into the production stage, the capitalisation of certain mine construction costs ceases and subsequent costs are either regarded as inventory or expensed, except for capitalisable costs related to subsequent mining asset additions or improvements, underground mine development or ore reserve development.
F - 99
1. SIGNIFICANT ACCOUNTING POLICIES (CONTINUED)
PROPERTY, PLANT AND EQUIPMENT (CONTINUED)
The commissioning of an underground mine typically occurs in phases, with sections brought into production whilst deeper levels remain under construction. The shared infrastructures, such as declines of shafts, are assessed to determine whether they contribute to the production areas. Where they contribute to production, the attributable costs are transferred to production assets and start to be
depreciated. The costs transferred comprise costs directly attributable to producing zones or, where applicable, estimates of the portion of shared infrastructure that are attributed to the producing zones.
Development expenditure approval
Development activities commence after project sanctioning by the appropriate level of management. Judgement is applied by management in determining when a project has reached a stage at which economically recoverable reserves exists such that development may be sanctioned. In exercising this judgement, management is required to make certain estimates and assumptions similar to those described below for capitalised exploration and evaluation expenditure. Any such estimates and assumptions may change as new information becomes available.
Stripping costs
In surface mining operations, the Group may find it necessary to remove waste materials to gain access to mineral ore deposits prior to and after production commences. This waste removal activity is known as ‘stripping’. Prior to production commencing from a pit, stripping costs are measured internally and capitalised until the point where the overburden has been removed and access to the ore commences. Subsequent to production, waste stripping continues, either as part of ore extraction as a run of mine activity or due to strategic decisions such as pit push-back campaigns. There are two benefits accruing to the Group from stripping activity during the production phase: usable ore that can be used to produce inventory and improved access to further quantities of material that will be mined in future periods. Economic ore extracted during this period and subsequently is accounted for as inventory. The production stripping costs relating to improved access to further quantities in future periods are capitalised as a stripping activity asset, if and only if, all of the following are met:
•It is probable that the future economic benefit (improved access to the ore body) associated with the stripping activity will flow to the Group;
•The Group can identify the component of the ore body for which access has been improved; and
•The costs relating to the stripping activity associated with that component or components can be measured reliably.
In determining the relevant component of the ore body for which access is improved, the Group componentises its mine into geographically distinct ore body sections or phases to which the stripping activities being undertaken within that component are allocated. Such phases are determined based on assessment of factors such as geology and mine planning.
Once determined that any portion of the production stripping costs should be capitalised, the Group typically uses the average stripping ratio of the component or phase of the mine to which the production stripping cost related to determine the amount of the production stripping costs that should be capitalised, unless the direct costs of stripping activity can be separately identified in which case such costs are capitalised. The Group depreciates the deferred costs capitalised as stripping assets on a unit of production method, with reference to the ex-pit ore production from the relevant ore body component or phase.
Short-lived assets
Short-lived assets including non-mining assets are shown at cost less accumulated depreciation and impairment.
F - 100
1. SIGNIFICANT ACCOUNTING POLICIES (CONTINUED)
PROPERTY, PLANT AND EQUIPMENT (CONTINUED)
Depreciation and amortisation
Long-lived assets include mining properties, such as metallurgical plant, tailings and raw water dams, power plant and mine infrastructure, as well as mine development costs and are depreciated on a unit of production basis. In FY2020 and FY2019, anbasis by using ounces produced method was used to calculate depreciation. In FY2018, the tonnes milled unit of production approach was used to calculate depreciation. The change in method used from tonnes milled to ounces produced, represented a change in estimate during FY2019. The directors believe the ounces produced method gives the best indication of plant and infrastructure usage.
Depreciation and amortisation are charged over the life of the mine (or over the remaining useful life of the asset, if shorter) based on estimated contained ounces in proven and probable reserves and the portion of resources considered probable of economic extraction based on the current LOM (Life of Mine) plan that benefit from the development and are considered probable of economic extraction. No future capital expenditure is included in the depreciable value. Proven and probable ore reserves and the portion of resources reflect estimated quantities of economically recoverable reserves and resources, which can be recovered in the future from known mineral deposits. Life of mine contained reserves and resources are used in the contained ounces units of production depreciation calculation. Any changes to the expected life of the mine (or asset) are applied prospectively in calculating depreciation and amortisation charges. Depreciation of construction and development costs commences when commercial production is achieved, as detailed above. Underground development costs that are attributable to the commissioned sections of an underground mine are depreciated from the date the development provides access to operational areas and ore extraction begins from those areas. Other assets under construction, such as plant improvement projects, are depreciated from the date they are commissioned, based on assessment by the Group’s engineers.
Short-lived assets which include motor vehicles, office equipment and computer equipment are depreciated over estimated useful lives of between two to five years but limited to the remaining mine life. Residual values and useful lives are reviewed, and adjusted if appropriate, at each statement of financial position date.
Changes to the estimated residual values or useful lives are accounted for prospectively. Depreciation starts when the assets are ready and available for use.
Impairment
The carrying amount of the property, plant and equipment and investments in joint ventures of the group is compared to the recoverable amount of the assets whenever events or changes in circumstances indicate that the net book value may not be recoverable. The recoverable amount is the higher of value in use and the fair value less cost to sell. In assessing the value in use, the expected future cash flows from the assets is determined by applying a discount rate to the anticipated risk adjusted future cash flows. The discount rate used is the group’s weighted average cost of capital adjusted for asset specific factors when applicable. An impairment is recognised in the income statement to the extent that the carrying amount exceeds the assets’ recoverable amount. Generally proven and probable reserves are used in the calculations, although limited ore resources may be included when they are considered economically viable and sufficiently likely to be extracted and form part of the approved mine plan. The models use the approved mine plans and exclude capital expenditure which enhance the assets or extractable ore tonnes outside of such approved mine plans. The revised asset carrying amounts are depreciated in line with group accounting policies.
A previously recognised impairment loss is reversed if the recoverable amount increases as a result of a reversal of the conditions that originally resulted in the impairment. This reversal is recognised in the income statement and is limited to the carrying amount that would have been determined, net of depreciation, had no impairment loss been recognised in prior years.
Assets are grouped at the lowest levels for which there are separately identifiable cash flows (cash-generating units) for purposes of assessing impairment. The estimates of future discounted cash flows are subject to risks and uncertainties including the future gold price. It is therefore reasonably possible that changes could occur which may affect the recoverability of property, plant and equipment.
F - 101
1. SIGNIFICANT ACCOUNTING POLICIES (CONTINUED)
INVENTORIES
Inventories include ore stockpiles, gold in process and doré, and supplies and spares and are stated at the lower of cost or net realisable value. The cost of ore stockpiles and gold produced is determined principally by the weighted average cost method using related production costs.
Costs of stockpiles include costs incurred up to the point of stockpiling, such as mining and grade control costs, but exclude future costs of production. Ore extracted is allocated to separate stockpiles based on estimated grade, with grades below defined cut-off levels treated as waste and expensed. While held in physically separate stockpiles, the Group blends the ore from each stockpile when feeding the processing plant to achieve the resultant gold content. In such circumstances, lower and higher grade ore stockpiles each represent a raw material, used in conjunction with each other, to deliver overall gold production, as supported by the relevant feed plan. Kibali’s high and medium grade ore stockpile is above 2.75g/3g/t with a marginal ore cut-off grade of 1.11g/0.5g/t.
The processing of ore in stockpiles occurs in accordance with the Life of Mine (LOM) processing plan that has been optimised based on the known mineral reserves, current plant capacity and mine design. Ore tonnes contained in the stockpile which are to be milled as per the mine plan over the period beyond the next twelve months, are classified as non-current in the statement of financial position.
Net realisable value of ore stockpiles is determined with reference to estimated contained gold and market gold prices applicable. Ore stockpiles which are blended together or with future ore mined when fed to the plant are assessed as an input to the gold production process to ensure the combined stockpiles are carried at the lower of cost and net realisable value. Ore stockpiles which are not planned to be blended in production are assessed separately to ensure they are carried at the lower of cost and net realisable value, although no such stockpiles are currently held.
Stores and materials consist of consumable stores and are valued at weighted average cost after appropriate impairment of redundant and slow moving items.
Interest is recognised on a time proportion basis, taking into account the principal outstanding and the effective rate over the period to maturity. Borrowing cost is expensed as incurred except to the extent that it relates directly to the construction of property, plant and equipment during the time that is required to complete and prepare the asset for its intended use, when it is capitalised as part of property, plant and equipment. Borrowing costs are capitalised as part of the cost of the asset where it is probable that the asset will result in economic benefit and where the borrowing cost can be measured reliably. No interest or borrowing costs have been capitalised during any of the past three years.disclosure periods .
ROYALTIES
Royalty arrangements based on mineral production are in place at each operating mine. The primary type of royalty is a net smelter return royalty. Under this type of royalty, the Group pays the holder an amount calculated as the royalty percentage multiplied by the value of gold production at market gold prices less selling costs. A royalty expense is recorded when revenue from the sale of gold is recognised.
F - 102
1. SIGNIFICANT ACCOUNTING POLICIES (CONTINUED)
FINANCIAL INSTRUMENTS
Financial instruments are measured as set out below. Financial instruments carried on the statement of financial position include cash and cash equivalents, trade and other receivables, trade and other payables, investments in marketable securities, loans to joint ventures, loans to minorities and lease liabilities. Financial assets and financial liabilities are recognised in the Group’s statement of financial position when the Group becomes a party to the contractual provisions of the instrument.
Financial instruments are initially recognised at fair value when the group becomes a party to their contractual arrangements. Transaction costs directly attributable to the instrument’s acquisition or issue are included in the initial measurement of financial assets and financial liabilities, except financial instruments classified as at fair value through profit or loss (FVTPL). The subsequent measurement of financial instruments is dealt with below.
Financial assets
On initial recognition, a financial asset is classified as measured at:
•Amortised cost;
•Fair value through other comprehensive income (FVTOCI) - equity instruments; or
At initial recognition, the group measures a financial asset at its fair value plus, in the case of a financial asset not at FVTPL, transaction costs that are directly attributable to the acquisition of the financial asset. Transaction costs of financial assets carried at FVTPL, are expensed.
A financial asset is measured at amortised cost if it is held within the business model whose objective is to hold assets to collect contractual cash flows and its contractual terms give rise, on specified dates, to cash flows that are solely payments of principal and interest on the principal amount outstanding. Interest income from these financial assets is included in finance income using the effective interest rate method. Any gain or loss arising on derecognition is recognised directly in profit or loss and presented in other gains or losses, together with foreign exchange gains or losses. Impairment losses are presented as separate line item in the statement of profit or loss. A gain or loss on a debt investment that is subsequently measured at FVTPL is recognised in profit or loss and presented net within other gains or losses in the period in which it arises. On derecognition of a financial asset, the difference between the proceeds received or receivable and the carrying amount of the asset is included in profit or loss.
Financial assets at amortised cost consist of trade receivables and other receivables (excluding taxes), cash and cash equivalents. Impairment losses are assessed using the forward-looking expected credit loss (ECL) approach. An allowance is recorded for all loans and other debt financial assets not held at FVTPL. The impairment methodology applied depends on whether there has been a significant increase in credit risk. Trade receivable loss allowances are measured at an amount equal to lifetime ECL’s. Loss allowances are deducted from the gross carrying amount of the assets.
Cash and cash equivalents
Cash and cash equivalents are carried in the statement of financial position at cost. For the purpose of the cash flow statement, cash and cash equivalents comprise cash on hand, deposits held at call with banks, other short term highly liquid investments with a maturity of three months or less at the date of purchase and bank overdrafts. In the statement of financial position, bank overdrafts are included in borrowings in current liabilities.
F - 103
1. SIGNIFICANT ACCOUNTING POLICIES (CONTINUED)
FINANCIAL LIABILITIES
Loans and borrowing
Borrowings are recognised initially at fair value, net of transaction costs incurred. Borrowings are subsequently stated at amortised cost; any difference between the proceeds (net of transaction costs) and the redemption value is recognised in the statement of comprehensive income over the period of the borrowings using the effective interest method. Borrowings are classified as current liabilities unless the Company has an unconditional right to defer settlement of the liability for at least 12 months after the statement of financial position date.
Trade and other payables
Accounts payable and other short term monetary liabilities, are initially recognised at fair value, which equates to the transaction price, and subsequently carried at amortised cost using the effective interest method.
REHABILITATION COSTS
The net present value of estimated future rehabilitation costs is provided for in the financial statements and capitalized within property, plant and equipment on initial recognition. Rehabilitation will generally occur on closure or after closure of a mine. Initial recognition is at the time of the construction or disturbance occurring and thereafter as and when additional construction or disturbances take place. The estimates are reviewed annually to take into account the effects of inflation and changes in estimated risk adjusted rehabilitation works cost and are discounted using rates that reflect the time value of money.
Annual increases in the provision due to the unwinding of the discount are recognized in the statement of comprehensive income as a finance cost. The present value of additional disturbances and changes in the estimate of the rehabilitation liability are recorded to mining assets against an increase/decrease in the rehabilitation provision. The rehabilitation asset is amortised as noted previously. Rehabilitation projects undertaken, included in the estimates, are charged to the provision as incurred.
Environmental liabilities, other than rehabilitation costs, which relate to liabilities arising from specific events, are expensed when they are known, probable and may be reasonably estimated.
PROVISIONS
Provisions are recognised when the Company has a present legal or constructive obligation as a result of past events where it is probable that an outflow of resources embodying economic benefits will be required to settle the obligation, and a reliable estimate of the amount of the obligation can be made.
CURRENT TAX
Current tax is the tax expected to be payable on the taxable income for the year calculated using rates (and laws) that have been enacted or substantively enacted by the reporting date (and when such laws are applicable to the group allowing for the impact of tax stability protections afforded to the group). It includes adjustments for tax expected to be payable or recoverable in respect of previous periods.
The Group is subject to income tax in several jurisdictions and significant judgement is required in determining the provision for income taxes. During the ordinary course of business, there are transactions and calculations for which the ultimate tax determination is uncertain. As a result, the Group recognises tax liabilities based on estimates of whether additional taxes and interest will be due.
These tax liabilities are recognised when, despite the company's belief that its tax return positions are supportable, the company believes it is more likely than not that a taxation authority would not accept its filing position. In these cases, the Group records its tax balances based on either the most likely amount or the expected value, which weights multiple potential scenarios. The company believes that its accruals for tax liabilities are adequate for all open audit years based on its assessment of many factors including past experience and interpretations of tax law.
F - 119104
DEFERRED TAXATION
Deferred tax is provided in full, using the liability method, on temporary differences arising between the tax bases of assets and liabilities and their carrying amounts in the consolidated financial statements. However, if the temporary difference arises from initial recognition of an asset or liability in a transaction other than a business combination that at the time of the transaction affects neither accounting nor taxable profit or loss, it is not recognised. Deferred tax is determined using tax rates (and laws) that have been enacted or substantively enacted by the statement of financial position date (and when such laws are applicable to the group allowing for the impact of tax stability protections afforded to the group) and are expected to apply when the temporary differences reverses. Deferred tax assets are recognised to the extent that it is probable that future taxable profit will be available against which the temporary differences can be utilised. Deferred tax is provided on temporary differences arising on investments in subsidiaries and joint ventures, except where the timing of the reversal of the temporary difference is controlled by the Group and it is probable that the temporary difference will not reverse in the foreseeable future.
VALUE ADDED TAX (TVA)
TVA receivables are recognised initially at cost. Subsequently, TVA receivables are measured at amortised cost using the effective interest method, less provision for impairment.
The Group assesses at each reporting period whether there is an indication that these receivables may be impaired taking into account the risk of non-collectability and timing of receipt.
SHARE CAPITAL
Ordinary shares are classified as equity. Incremental costs directly attributable to the issue of new shares or options are shown in equity as a deduction from the proceeds.
LEASES
The Group adopted IFRS 16 using the modified retrospective approach, with recognition of transitional adjustments on the date of initial application (1 January 2019), without restatement of comparative figures.
The lease liabilities were measured at the present value of the remaining lease payments, discounted with the rate determined by reference to the estimated incremental borrowing average rate of 6.81% p.a. Variable lease payments are only included in the measurement of the lease liability if they depend on an index or rate. In such cases, the initial measurement of the lease liability assumes the variable element will remain unchanged throughout the lease term. Other variable lease payments are expensed in the period to which they relate.
Subsequent to initial measurement lease liabilities increase as a result of interest charged at a constant rate on the balance outstanding and are reduced for lease payments made. Right-of-use assets are amortised on a straight-line basis over the remaining term of the lease or over the remaining economic life of the asset if, rarely, this is judged to be shorter than the lease term.
The following table presentsGroup discloses contingent liabilities when possible obligations exist as a result of past events, unless the impactpossible outflows of adopting IFRS 16 oneconomic benefits are considered remote. By their nature, contingencies will often only be resolved when one or more future events occur or fail to occur. The assessment of such contingencies inherently involves the statementexercise of financial position as at 1 January 2019:
| 31 December 2018 As originally Presented $’000 | IFRS 16 adjustment $’000 | 1 January 2019 $’000 | ||||||||||||
| Assets | ||||||||||||||
| Right-of-use assets (PP&E at 31.12.18) | 4,817 | 15,949 | 20,766 | |||||||||||
| Liabilities | ||||||||||||||
| Lease liabilities (finance lease liability at 31.12.18) | 38,890 | 15,949 | 54,839 | |||||||||||
F - 105
1. SIGNIFICANT ACCOUNTING POLICIES (CONTINUED)
REVENUE RECOGNITION
The company’sCompany’s primary product is gold, other metals produced as part of the extraction process are considered to be by-products arising from the production of gold. The companyCompany enters into a contract for the sale of gold at each of its mining operations. The performance obligation under its contract is to supply such gold to the customer, subject to minimum quality specifications with the consideration for such gold sales determined by the market spot price for each ounce of gold at the point of sale and gold content. As the sales from the gold contract is subject to customer survey adjustment, sales are initially recorded based on the results of tests on the material prior to shipment to determine the gold content and specification with such estimates subsequently adjusted to reflect the final gold content determined by the customer shortly after period end. Revenue is recorded to the extent that it is highly probable that there will be no subsequent reversal of such revenue due to gold content or quality specifications. Historical adjustments of this nature have been insignificant.
The performance obligations are considered to be satisfied and control of the gold transferred as the gold leaves the gold room upon collection by the customer, with title, possession and significant risks and rewards transferred at this point with revenue recorded accordingly. Subsequent adjustments are recorded in revenue to take into account final assay and weight certificates from the refinery, if different from the initial certificates. The differences between the estimated and actual contained gold have historically not been significant. Payment terms from the customer are based on 95% as initial payment for sales as agreed on the day of shipment based on the results of tests on the material prior to shipment with the final payment of 5% based on final customer assay and includes an adjustment to the initial 95% provisional payment. The period between provisional invoicing and final pricing, or settlement period, is typically around 5 days.
EXPLORATION AND EVALUATION COSTS
The Group capitalizes all exploration and evaluation expenditures where management concludes that the realization of future economic benefit is more likely than not. While the criteria for concluding that expenditure should be capitalised is always probable, the information that management use to make that determination depends on the level of exploration.
Exploration and evaluation expenditure on brownfield sites, being those adjacent to mineral deposits which are already being mined or developed, is expensed as incurred until the directors are able to demonstrate that future economic benefits are probable through the completion of a prefeasibility study, after which the expenditure is capitalised as a mine development cost. A ‘prefeasibility study’ consists of a comprehensive study of the viability of a mineral project that has advanced to a stage where the mining method, in the case of underground mining, or the pit configuration, in the case of an open pit, has been established, and which, if an effective method of mineral processing has been determined, includes a financial analysis based on reasonable assumptions of technical, engineering, operating economic factors and the evaluation of other relevant factors. The prefeasibility study, when combined with existing knowledge of the mineral property that is adjacent to mineral deposits that are already being mined or developed, allow the directors to conclude that it is more likely than not that the Group will obtain future economic benefit from the expenditures.
F - 106
1. SIGNIFICANT ACCOUNTING POLICIES (CONTINUED)
EXPLORATION AND EVALUATION COSTS (CONTINUED)
Exploration and evaluation expenditure on greenfield sites, being those where the Group does not have any mineral deposits which are already being mined or developed, is expensed until such time as the directors have sufficient information to determine that future economic benefits are probable, after which the expenditure is capitalised as a mine development cost. The information required by directors is typically a final feasibility study however a prefeasibility study may be deemed to be sufficient where the additional work required to prepare a final feasibility study is not significant or the work done at prefeasibility level clearly demonstrates an economic asset. Exploration and evaluation expenditure relating to extensions of mineral deposits which are already being mined or developed, including expenditure on the definition of mineralisation of such mineral deposits, is capitalised as a mine development cost following the completion of an economic evaluation equivalent to a prefeasibility study. This economic evaluation is distinguished from a prefeasibility study in that some of the information that would normally be determined in a prefeasibility study is instead obtained from the existing mine or development. This information when combined with existing knowledge of the mineral property already being mined or developed allow the directors to conclude that more likely than not the Company will obtain future economic benefit from the expenditures. Costs relating to property acquisitions are capitalised within development costs.
DIVIDEND DISTRIBUTION
Dividend distribution to the Company’s shareholders is recognised as a liability in the Group’s financial statements in the period in which the dividends are approved by the board of directors and declared to shareholders.
During the year, Kibali Goldmines S.A., a subsidiary of Kibali (Jersey) Limited established a mechanism for the repatriation of cash from the DRC. This resulted in bank arrangement fees of $44.3 million which have been presented as Cash repatriation fees within Finance Costs. Please refer to note 7 for more details.
F - 122107
Some of the accounting policies require the application of significant judgement by management in selecting the appropriate assumptions for calculating financial estimates or determining the appropriate accounting treatment for a transaction.
By their nature, these judgements are subject to an inherent degree of uncertainty and are based on historical experience, terms of existing contracts, management’s view on trends in the gold mining industry and information from outside sources.
The estimatesjudgements and assumptionsestimates that have a significant risk of causing a material adjustment to the carrying amounts of assets and liabilities are discussed below:
Judgements:
•Democratic Republic of Congo (DRC) 2018 Mining Code
•Value Added Tax (TVA)
•Exploration and evaluation expenditure
•Customs claim
Estimates:
•Carrying values of property, plant and equipment
•Open cast mine stripping
•Determination of Ore reserves
•Capitalisation and depreciation
•Gold price assumptions
•Future rehabilitation obligations
•Stockpiles, gold in process and product inventories
JUDGEMENTS:
DEMOCRATIC REPUBLIC OF CONGO (DRC) 2018 MINING CODE
In the DRC, the 2018 Mining Code and related amended Mining Regulations came into effect during the first half of 2018 and removed fiscal stability protections under the 2002 Mining Code and introduced a series of potentially significant adverse changes to tax legislation. Kibali has taken legal advice and has been exploring all options to protect its vested rights under the 2002 Mining Code, as well as the specific state guarantees it previously received regarding fiscal stability. Without prejudice to its rights under the stability protections Kibali is currently paying the additional taxes, of $13.6 million (2021: $11.4 million) (2020: $8.6 million),as per the 2018 mining code, while it engages with government. Continued engagement with government has resulted in the submission of an application for a number of exemption and waivers in terms of Article 220 of the 2018 law as part of the group’s efforts to reach a mutually acceptable way forward. Article 220 affords benefits to mining companies in landlocked infrastructural challenged provinces, such as where Kibali is located.
VALUE ADDED TAX (TVA)
Included in trade and other receivables (refer to note 13)12) is a recoverable TVA balance (including recoverable TVA on fuel duty and after discounting provisions) of US$153.7191.2 million (2019 :US$147.8(2021: US$163.2 million) (2018(2020: US$180.5153.7 million) owing by the fiscal authorities in the DRC. The Group continues to seek recovery of TVA in the DRC, in line with the Mining Code. The carrying value of the receivable has been assessed considering factors such as the level of receipts and tax offsets in the period and to date, the impact of the settlement agreement reached in Q4 2018 (see below),prior years, relationships and communications with government officials and the tax authority and the limited quantum of disputed submissions.Judgement exists in assessing recovery of these receivables as whilst the TVA balance is considered collectible, uncertainty exists regarding the timing of receipts and offsets.
F - 123108
JUDGEMENTS (CONTINUED):
VALUE ADDED TAX (TVA) (CONTINUED)
Given the continued delays in recovery, the outstanding receivable was discounted by US$50.162.2 million (2019:(2021: US$37.357.3 million) (2018:(2020: US$37.350.1 million) which required estimates as to the timing of future receipts and the level and timing of future offsets with reference to relevant taxes forecast under the mine plan, historical levels and other factors. The increase in the year was based on a probability weighted scenario analysis that takes into account numerous recoverability profiles, following the DRC Government’s decision in July 2020 to suspend offsets and cash repayments. A discount rate of 7.3%10.34% (2021: 7.88%) (2020:7.33%) was applied to both the expected cash receipts and the amounts forecasted to be recovered through offsetting across all scenarios in the assessment. Within the scenarios, Management have assumed varying periods of delay in offsets, up to a period of 3-years, and have included staggered recovery profiles which reflects management’s best reflects actual recoveries achieved over recent years.estimates. A 1% increase/decrease in the discount rate will increase/decrease the provision by US$5.3 million/US$5.4 million (2021: US$6.1 million/US$6.3 million) (2020: US$4.1 million/US$7.1 million.million). Applying additional weighting based on management assessment of likelihood to the staggered recovery profiles would increase the provision by US$6.4 million (2021: US$7.8 million) (2020: US$1.4 million.million).
EXPLORATION AND EVALUATION EXPENDITURE
The Group has to apply judgement in determining whether exploration and evaluation expenditure should be capitalised or expensed. Management exercises this judgement based on the results of economic evaluations, prefeasibility or feasibility studies. Costs are capitalised where those studies conclude that more likely than not the Group will obtain future economic benefit from the expenditures.
ESTIMATES:
CARRYING VALUES OF PROPERTY, PLANT, EQUIPMENTAND EQUIPMENTMINERAL PROPERTIES
The Group assesses at each reporting period whether there is any indication that these assets may be impaired (refer to note 109 and 11)10). If such indication exists, the Group estimates the recoverable amount of the asset. The recoverable amount is assessed by reference to the higher of ‘value in use’ (being the net present value of expected future cash flows of the relevant cash generating unit) and ‘fair value less cost to sell’. The estimates used for impairment reviews are based on detailed mine and operating plans.
The Future cash flows are based on estimates of:
•The quantities of the proven and probable reserves and certain limited ore resources being those for which there is a high degree of confidence in economic extraction;
•Future production levels;
•Future commodity prices; including oil forecast at US$65bbl (2019:70bbl (2021: US$70bbl) (2018:(2020: US$70bbl)65bbl);
•Future cash cost of production and capital expenditure associated with extraction of the reserves and certain limited ore resources in the approved mine plan;
•Future gold prices – a gold price curve was used for the impairment calculations starting at a US$1 700/oz gold price (2019:(2021: US$1 350oz) (2018:700/oz) (2020: US$1 250/700/oz). A gold price of US$1 700/oz was used for the 20212023 year with the price assumption remaining level for years thereafter(2024: $1 650) (2025: $1 600) (thereafter at US$1 400/oz550/oz)
•A real discount rate equivalent to 10.3% pre-tax (2019:6.6% (2021: real 8.7%8.6%) (2018: nominal 8.6%, with an inflation rate of 2.5% applied(2020: real 10.3%).
F - 109
2. KEY ACCOUNTING ESTIMATES AND JUDGEMENTS (CONTINUED)
ESTIMATES (CONTINUED):
The Group capitalises costs,has to apply judgement in determining whether exploration and evaluation expenditure should be capitalised or expensed. Management exercises this judgement based on the results of economic evaluations, prefeasibility or feasibility studies. Costs are capitalised where those studies conclude that more likely than not the Group will obtain future economic benefit from the expenditures.
ESTIMATES:
CARRYING VALUES OF PROPERTY, PLANT, EQUIPMENTAND MINERAL PROPERTIES
The Group assesses at each reporting period whether there is any indication that these assets may be impaired (refer to note 9 and 10). If such indication exists, the Group estimates the recoverable amount of the asset. The recoverable amount is assessed by reference to the higher of ‘value in use’ (being the net present value of expected future cash flows of the relevant cash generating unit) and ‘fair value less cost to sell’. The estimates used for impairment reviews are based on detailed mine and operating plans. The Future cash flows are based on estimates of:
•The quantities of the proven and probable reserves and certain limited ore resources being those for which there is a high degree of confidence in economic extraction;
•Future production levels;
•Future commodity prices; including oil forecast at US$70bbl (2021: US$70bbl) (2020: US$65bbl);
•Future cash cost of production and capital expenditure associated with stripping activity, to expose the orebody, within mining assets. Judgement is required in determining the relevant section or phaseextraction of the orebodyreserves and certain limited ore resources in the approved mine plan;
•Future gold prices – a gold price curve was used for the impairment calculations starting at a US$1 700/oz gold price (2021: US$1 700/oz) (2020: US$1 700/oz). A gold price of US$1 700/oz was used for the 2023 year (2024: $1 650) (2025: $1 600) (thereafter at US$1 550/oz)
•A real discount rate equivalent to which stripping activity relates, based on assessment of factors such as mine planning, geology of the open cast pits and strategic board decisions such as the pushback campaigns which requires judgement over the eligible costs. The Group capitalised US$12.2 million (2019 US$9.1 million) (2018: US$9.2 million)6.6% (2021: real 8.6%) (2020: real 10.3%).
No reasonably possible changes to stripping assets with a net book value of US$19.1 million (2019: US$8.6 million) (2018: US$5.5 million). The capitalised stripping costs relatethese assumptions will lead to three open cast satellite pits KCD, Sessenge and Gorumbwa. The Group subsequently depreciates relevant stripping assets as that section of the orebody is mined which requires judgement as to the relevant section of the orebody for depreciation.an impairment
F - 124109
EXPLORATION AND EVALUATION EXPENDITURE
The Group has to apply judgement in determining whether exploration and evaluation expenditure should be capitalised or expensed. Management exercises this judgement based on the results of economic evaluations, prefeasibility or feasibility studies. Costs are capitalised where those studies conclude that more likely than not the Group will obtain future economic benefit from the expenditures.
ESTIMATES:
CARRYING VALUES OF PROPERTY, PLANT, EQUIPMENTAND MINERAL PROPERTIES
The Group assesses at each reporting period whether there is any indication that these assets may be impaired (refer to note 9 and 10). If such indication exists, the Group estimates the recoverable amount of the asset. The recoverable amount is assessed by reference to the higher of ‘value in use’ (being the net present value of expected future cash flows of the relevant cash generating unit) and ‘fair value less cost to sell’. The estimates used for impairment reviews are based on detailed mine and operating plans. The Future cash flows are based on estimates of:
•The quantities of the proven and probable reserves and certain limited ore resources being those for which there is a high degree of confidence in economic extraction;
•Future production levels;
•Future commodity prices; including oil forecast at US$70bbl (2021: US$70bbl) (2020: US$65bbl);
•Future cash cost of production and capital expenditure associated with extraction of the reserves and certain limited ore resources in the approved mine plan;
•Future gold prices – a gold price curve was used for the impairment calculations starting at a US$1 700/oz gold price (2021: US$1 700/oz) (2020: US$1 700/oz). A gold price of US$1 700/oz was used for the 2023 year (2024: $1 650) (2025: $1 600) (thereafter at US$1 550/oz)
•A real discount rate equivalent to 6.6% (2021: real 8.6%) (2020: real 10.3%).
No reasonably possible changes to these assumptions will lead to an impairment
F - 126109
The Group hadcapitalises costs, associated with stripping activity, to apply judgementexpose the orebody, within mining assets. Judgement is required in determining the recoverable amount of deferred tax assets recognized in prior year. Deferred tax assets are recognised to the extent that their utilisation is probable, being based upon whether it is more likely than not that sufficient and suitable taxable profits will be available in the future, against which the reversal of temporary differences can be deducted. The recoverabilityrelevant section or phase of the asset has been assessed consideringorebody to which stripping activity relates, based on assessment of factors such as mine planning, geology of the open cast pits and strategic board decisions such as the pushback campaigns which requires judgement over the eligible costs. The Group capitalised US$33.6 million (2021 US$36.5 million) (2020: US$12.2 million) to stripping assets with a net book value of US$53 million (2021: US$11.4 million) (2020: US$19.1 million). The capitalised stripping costs relate to four open cast satellite pits Aerodrome, KCD, Sessenge and Gorumbwa. The Group subsequently depreciates relevant stripping assets as that section of the orebody is mined which requires judgement as to the relevant section of the orebody for depreciation.
DETERMINATION OF ORE RESERVES
The Group estimated its Mineral Reserves and Mineral Resources based on information compiled by qualified persons according to the Canadian Institute of Mining, Metallurgy and Petroleum (CIM) 2014 Definition Standards for Mineral Resources and Mineral Reserves dated May 10, 2014 (CIM (2014) Standards) as incorporated with NI 43-101 since the 2019 financial year. Previously the Group based its estimates of ore reserves and mineral resources in accordance with the Australasian Code for Reporting of Exploration Results, Mineral Resources and Ore Reserves of December 2012 (the 2012 JORC code).
Reserves determined in this way are used in the calculation of depreciation, amortisation and impairment charges, as well as the assessment of the carrying value of mining assets and timing of mine closure obligations. There are numerous uncertainties inherent in estimating ore reserves and assumptions that are valid at the time of estimation may change significantly when new information becomes available. Changes in the forecast prices of commodities, exchange rates, production costs or recovery rates may change the economic status of reserves and may, ultimately, result in the reserves being restated.
CAPITALISATION AND DEPRECIATION
There are several methods that could be adopted for calculating depreciation, i.e. the straight line method, the production method using ounces produced or tonnes milled. The directors believe the ounces produced method is the best indication of plant and infrastructure usage. Estimates are required regarding the allocation of assets to relevant proven and probable reserves and certain limited resources in the units of production calculations, with assessments involving the Group’s mining, capital and geology departments. Proven and probable reserves and certain limited resources are used in each depreciation calculation, which is considered to be a suitably conservative measure of the future ore extractable using existing assets. Expenditure incurred to date in underground infrastructure development considered to have been commissioned, is depreciated over the remaining proven and probable reserves and certain limited resources of the underground mine, as the infrastructure provides access to the future mining areas.
The Group applies judgement in allocating costs between operating and capital items in respect of underground mining and in determining the date depreciation commences. Costs are capitalised when the activity provides access to future ore bodies and are expensed as operating costs when the works involve extraction of ore from operational sections of the ore body. The nature of activity is assessed based on information provided by contractors, together with inspections by the Group’s mining teams. Direct labour, materials and other costs are specifically allocated based on the activity performed. Indirect costs that are attributable to underground works are allocated between capital and operating expenses based on factors such as development versus operating metres.
F - 110
2. KEY ACCOUNTING ESTIMATES AND JUDGEMENTS (CONTINUED)
ESTIMATES (CONTINUED):
CAPITALISATION AND DEPRECIATION (CONTINUED)
Judgement is required in determining the point at which assets under construction at Kibali begin commercial production and should be depreciated. Depreciation start dates are determined considering the factors detailed in Note 1 and during 2015 Kibali underground mine assets attributable to production started to be depreciated. The commissioning of the underground happens in phases and as the sections are brought into production the attributable costs are transferred and depreciated. Judgement is applied in identifying the costs considered attributable to this production. Additionally, given ongoing mine construction and development, judgement was required in allocating costs between operating costs, ore stockpiles and ongoing capital works. Costs have been allocated based on the underlying assumptionsactivity and economic benefits.
GOLD PRICE ASSUMPTIONS
The following gold prices were used in the lifemineral reserves optimisation calculation:
202220212020
US$/oz1 30021 20031 2004
FUTURE REHABILITATION OBLIGATIONS
The net present value of mine plan,current rehabilitation estimates have been discounted to their present value using a real risk free rate of 1.73% (2021: 0%) (2020: 0%) per annum, with cash flows adjusted for a market risk rate of 10% (2021: 10% ) (2020: 10% ) being the operating performanceprevailing risk free interest rates at the time. The majority of expenditure is expected to be incurred at the end of the mine life. The Group undertakes regular assessments by external experts of its mine closure plans, together with assessments by internal staff in the intervening periods, to determine the required rehabilitation works, cost of works and any restrictions undertiming of such works. Judgment is required in determining the applicable DRC tax code having due considerationappropriate costs, timing of costs, discount rates and inflation (when nominal discount rate used).
For further information, including the carrying amounts of the liabilities, refer to Note 17.A 0.25% change in the discount rate on the Group’s rehabilitation estimates would result in an impact of US$0.8 million (2021: US$1.0 million at 0.25% real) (2020: US$1.0 million at 0.25% real) on the provision for environmental rehabilitation, and an impact of US$0.1 million (2021: US$0.2 million) (2020: US$0.2 million) on the statement of comprehensive income.
STOCKPILES, GOLD IN PROCESS AND PRODUCT INVENTORIES
Costs that are incurred in or benefit the productive process are accumulated as stockpiles, gold in process and product inventories. Net realisable value tests are performed at least annually and represent the estimated future sales price of the product based on contained gold and metals prices, less estimated costs to complete production and bring the product to sale. Judgment is required in assessing whether stockpiles of different grades should be tested individually, or tested as inputs to the tax stability protections,gold production process, as detailed in the "DRC 2018 Mining Code"Group’s accounting policy. In the current year, the stockpiles were tested reflecting the planned blended feed of such stockpiles to the mill on the basis that they are blended together and with future ore mined.
Stockpile quantities are measured by estimating the number of tonnes added and removed from the stockpile, the number of contained gold ounces based on assay data, and the estimated recovery percentage based on the expected processing method. Stockpile tonnages are verified by periodic surveys. The forecast gold prices and cost escalators were those used in the impairment test detailed above. Although Kibali has a deferred tax liability in financial year 2020 accumulated losses carried forward, can still be utilised.
2 A gold price range of US$1 300 to US$1 600/oz was used, pit dependant, with the majority (75%) at $1 300/oz
3 A gold price range of US$1 200 to US$1 500/oz was used, pit dependant, with the majority (75%) at $1 200/oz
4 A gold price range of US$1 000 to US$1 300/oz was used, pit dependant, with the majority (85%) at $1 200/oz
F - 127111
The companyCompany has disaggregated revenue into various categories in the following table, which is intended to depict how the nature, amount, timing and uncertainty of revenue and cash flows are affected by economic date.
31 Dec 2020 US$’000 | 31 Dec 2019 US$’000 | 31 Dec 2018 US$’000 | ||||||||||||
| Primary geographic market | ||||||||||||||
| Democratic Republic of Congo | 1,440,328 | 1,122,940 | 1,041,035 | |||||||||||
| 1,440,328 | 1,122,940 | 1,041,035 | ||||||||||||
| Product type | ||||||||||||||
| Gold doré | 1,437,297 | 1,120,743 | 1,041,035 | |||||||||||
Silver 3 | 3,031 | 2,197 | — | |||||||||||
| 1,440,328 | 1,122,940 | 1,041,035 | ||||||||||||
| Timing of transfer of goods | ||||||||||||||
| Point in time | 1,440,328 | 1,122,940 | 1,041,035 | |||||||||||
| 1,440,328 | 1,122,940 | 1,041,035 | ||||||||||||
31 Dec 2022 US$’000 | 31 Dec 2021 US$’000 | 31 Dec 2020 US$’000 | ||||||||||||
| Primary geographic market | ||||||||||||||
| Democratic Republic of Congo | 1,328,306 | 1,469,221 | 1,440,328 | |||||||||||
| 1,328,306 | 1,469,221 | 1,440,328 | ||||||||||||
| Product type | ||||||||||||||
| Gold doré | 1,325,380 | 1,465,793 | 1,437,297 | |||||||||||
| Silver | 2,926 | 3,428 | 3,031 | |||||||||||
| 1,328,306 | 1,469,221 | 1,440,328 | ||||||||||||
| Timing of transfer of goods | ||||||||||||||
| Point in time | 1,328,306 | 1,469,221 | 1,440,328 | |||||||||||
| 1,328,306 | 1,469,221 | 1,440,328 | ||||||||||||
31 Dec 2020 | 31 Dec 2019 | 31 Dec 2018 | |||||||||||||||||||||
| US$’000 | US$’000 | US$’000 | |||||||||||||||||||||
| Other Income: | |||||||||||||||||||||||
| Other income | 169 | 170 | 174 | ||||||||||||||||||||
| Net foreign exchange gains | 2,035 | — | 56,664 | ||||||||||||||||||||
| 2,204 | 170 | 56,838 | |||||||||||||||||||||
31 Dec 2022 | 31 Dec 2021 | 31 Dec 2020 | |||||||||||||||||||||
| US$’000 | US$’000 | US$’000 | |||||||||||||||||||||
| Other Income: | |||||||||||||||||||||||
| Other income | — | 147 | 169 | ||||||||||||||||||||
| Net foreign exchange gains | 82 | 741 | 2,035 | ||||||||||||||||||||
| Dividend Received | 457 | 320 | — | ||||||||||||||||||||
| 539 | 1,208 | 2,204 | |||||||||||||||||||||
The total other income is not considered to be part of the main revenue generating activities and as such the Group presents this income separately from revenue.
F - 128112
31 Dec 2020 | 31 Dec 2019 | 31 Dec 2018 | Note | 31 Dec 2022 | 31 Dec 2021 | 31 Dec 2020 | ||||||||||||||||||||||||||||||||||||||||
| US$’000 | US$’000 | US$’000 | US$’000 | US$’000 | US$’000 | |||||||||||||||||||||||||||||||||||||||||
| Other Expenses: | Other Expenses: | Other Expenses: | ||||||||||||||||||||||||||||||||||||||||||||
| Management Fee | Management Fee | 4,667 | 4,563 | 4,478 | Management Fee | 25 | 7,036 | 6,216 | 4,667 | |||||||||||||||||||||||||||||||||||||
| COVID-19 specific costs | COVID-19 specific costs | 18,608 | — | — | COVID-19 specific costs | 1,030 | 35 | 18,608 | ||||||||||||||||||||||||||||||||||||||
| Net foreign exchange loss | — | 1,458 | 2,917 | |||||||||||||||||||||||||||||||||||||||||||
| Other expenses | Other expenses | 38,762 | 18,644 | — | ||||||||||||||||||||||||||||||||||||||||||
| Provision for impairment against TVA receivable and related expenses | Provision for impairment against TVA receivable and related expenses | 14,202 | — | 37,893 | Provision for impairment against TVA receivable and related expenses | 5,950 | 8,351 | 14,202 | ||||||||||||||||||||||||||||||||||||||
| 37,477 | 6,021 | 45,288 | 52,778 | 33,246 | 37,477 | |||||||||||||||||||||||||||||||||||||||||
5.MINING AND PROCESSING COSTS
| 31 Dec | 31 Dec | 31 Dec | |||||||||||||||||||||
| 2022 | 2021 | 2020 | |||||||||||||||||||||
| US$’000 | US$’000 | US$’000 | |||||||||||||||||||||
| Mining and processing costs comprise: | |||||||||||||||||||||||
| Mine production costs | 316,880 | 264,556 | 249,395 | ||||||||||||||||||||
| Movement in production inventory and ore stockpiles | (11,871) | (15,340) | 2,924 | ||||||||||||||||||||
| Depreciation and amortisation | 207,813 | 243,958 | 241,311 | ||||||||||||||||||||
| Other mining and processing costs | 161,197 | 194,912 | 176,508 | ||||||||||||||||||||
| 674,019 | 688,086 | 670,138 | |||||||||||||||||||||
6.MINING AND PROCESSING COSTS
31 Dec 2020 | 31 Dec 2019 | 31 Dec 2018 | |||||||||||||||||||||
| 2020 | 2019 | 2018 | |||||||||||||||||||||
| US$’000 | US$’000 | US$’000 | |||||||||||||||||||||
| Mining and processing costs comprise: | |||||||||||||||||||||||
| Mine production costs | 249,395 | 263,608 | 264,122 | ||||||||||||||||||||
| Movement in production inventory and ore stockpiles | 2,924 | (32,953) | (12,154) | ||||||||||||||||||||
| Depreciation and amortisation | 241,311 | 282,180 | 329,519 | ||||||||||||||||||||
| Other mining and processing costs | 176,508 | 175,961 | 190,772 | ||||||||||||||||||||
| 670,138 | 688,796 | 772,259 | |||||||||||||||||||||
31 Dec 2013 | 31 Dec 2012 | 31 Dec 2011 | |||||||||||||||||||||
| 2020 | 2019 | 2018 | |||||||||||||||||||||
| US$’000 | US$’000 | US$’000 | |||||||||||||||||||||
Exploration and corporate expenditure comprises: | |||||||||||||||||||||||
| Exploration expenditure | 4,295 | 7,123 | 3,213 | ||||||||||||||||||||
| Corporate expenditure | 1,979 | 6,563 | 2,941 | ||||||||||||||||||||
| 6,274 | 13,686 | 6,154 | |||||||||||||||||||||
31 Dec 2013 | 31 Dec 2012 | 31 Dec 2011 | |||||||||||||||||||||
| 2022 | 2021 | 2020 | |||||||||||||||||||||
| US$’000 | US$’000 | US$’000 | |||||||||||||||||||||
| Exploration and corporate expenditure comprise: | |||||||||||||||||||||||
| Exploration expenditure | 3,452 | 4,214 | 4,295 | ||||||||||||||||||||
| Corporate expenditure | 3,343 | 1,634 | 1,979 | ||||||||||||||||||||
| 6,795 | 5,848 | 6,274 | |||||||||||||||||||||
F - 129113
31 Dec 2012 | 31 Dec 2012 | 31 Dec 2011 | 31 Dec 2012 | 31 Dec 2012 | 31 Dec 2011 | |||||||||||||||||||||||||||||||||||||||||
| 2020 | 2019 | 2018 | 2022 | 2021 | 2020 | |||||||||||||||||||||||||||||||||||||||||
| US$’000 | US$’000 | US$’000 | US$’000 | US$’000 | US$’000 | |||||||||||||||||||||||||||||||||||||||||
Finance income comprise: | Finance income comprise: | Finance income comprise: | ||||||||||||||||||||||||||||||||||||||||||||
| Interest received – loans and receivables | Interest received – loans and receivables | 3,513 | 3,277 | 2,664 | ||||||||||||||||||||||||||||||||||||||||||
| Bank interest | Bank interest | 2,664 | 1,389 | 20 | Bank interest | 1,674 | 2,341 | 4,248 | ||||||||||||||||||||||||||||||||||||||
| Interest received – loans and receivables | 4,248 | 2,981 | 3,360 | |||||||||||||||||||||||||||||||||||||||||||
| Total finance income | Total finance income | 6,912 | 4,370 | 3,380 | Total finance income | 5,187 | 5,618 | 6,912 | ||||||||||||||||||||||||||||||||||||||
| Finance costs comprise: | Finance costs comprise: | Finance costs comprise: | ||||||||||||||||||||||||||||||||||||||||||||
| Interest expense on finance lease | Interest expense on finance lease | (4,869) | (3,153) | (3,359) | Interest expense on finance lease | (4,830) | (5,428) | (4,869) | ||||||||||||||||||||||||||||||||||||||
| Interest paid on overdrafts | Interest paid on overdrafts | (1,215) | (289) | (515) | Interest paid on overdrafts | — | — | (1,215) | ||||||||||||||||||||||||||||||||||||||
| Unwinding of discount on provisions for Rehabilitation | Unwinding of discount on provisions for Rehabilitation | (376) | (531) | (591) | Unwinding of discount on provisions for Rehabilitation | (735) | (485) | (376) | ||||||||||||||||||||||||||||||||||||||
| Cash repatriation fee | Cash repatriation fee | (44,352) | — | — | ||||||||||||||||||||||||||||||||||||||||||
| Total finance costs | Total finance costs | (6,460) | (3,973) | (4,465) | Total finance costs | (49,917) | (5,913) | (6,460) | ||||||||||||||||||||||||||||||||||||||
| Net finance income/(costs) | 452 | 397 | (1,085) | |||||||||||||||||||||||||||||||||||||||||||
| Net finance (costs)/income | Net finance (costs)/income | (44,730) | (295) | 452 | ||||||||||||||||||||||||||||||||||||||||||
| 31 Dec | 31 Dec | 31 Dec | |||||||||||||||||||||
| 2020 | 2019 | 2018 | |||||||||||||||||||||
| US$’000 | US$’000 | US$’000 | |||||||||||||||||||||
| Current taxation | 57,834 | 44,316 | — | ||||||||||||||||||||
| Deferred taxation | 12 | 99,256 | 17,618 | 15,972 | |||||||||||||||||||
| 157,090 | 61,934 | 15,972 | |||||||||||||||||||||
| 31 Dec | 31 Dec | 31 Dec | |||||||||||||||||||||
| 2022 | 2021 | 2020 | |||||||||||||||||||||
| US$’000 | US$’000 | US$’000 | |||||||||||||||||||||
| Current taxation | 47,993 | 55,671 | 57,834 | ||||||||||||||||||||
| Deferred taxation | 11 | 99,853 | 107,044 | 99,256 | |||||||||||||||||||
| Withholding tax | 8,100 | 18,000 | — | ||||||||||||||||||||
| 155,946 | 180,715 | 157,090 | |||||||||||||||||||||
The tax on the Group’s profit before tax differs from the theoretical amount that would arise using the statutory tax rate applicable to the Group’s main operations. Withholding tax arose from the dividend payment made from Kibali Goldmines SA to Moto (Jersey) 2 Limited and Kibali (Jersey) Limited.
| 31 Dec | 31 Dec | 31 Dec | 31 Dec | 31 Dec | 31 Dec | |||||||||||||||||||||||||||||||||||||||||
| 2020 | 2019 | 2018 | 2022 | 2021 | 2020 | |||||||||||||||||||||||||||||||||||||||||
| US$’000 | US$’000 | US$’000 | US$’000 | US$’000 | US$’000 | |||||||||||||||||||||||||||||||||||||||||
| Profit before tax | Profit before tax | 661,787 | 362,246 | 227,970 | Profit before tax | 488,208 | 674,353 | 661,787 | ||||||||||||||||||||||||||||||||||||||
| Tax calculated at the DRC effective tax rate of 30% | 198,537 | 108,674 | 68,391 | |||||||||||||||||||||||||||||||||||||||||||
| Tax calculated at the DRC standard tax rate of 30% | Tax calculated at the DRC standard tax rate of 30% | 146,462 | 202,306 | 198,537 | ||||||||||||||||||||||||||||||||||||||||||
| Withholding tax | Withholding tax | 8,100 | 18,000 | |||||||||||||||||||||||||||||||||||||||||||
| Reconciling items: | Reconciling items: | Reconciling items: | ||||||||||||||||||||||||||||||||||||||||||||
| Exempt income | Exempt income | (54,694) | (54,359) | (50,569) | Exempt income | (24,070) | (56,141) | (54,694) | ||||||||||||||||||||||||||||||||||||||
| Other differences | 13,247 | 7,619 | (1,850) | |||||||||||||||||||||||||||||||||||||||||||
| Non-deductible costs | Non-deductible costs | 25,454 | 16,550 | 13,247 | ||||||||||||||||||||||||||||||||||||||||||
| Taxation charges | Taxation charges | 157,090 | 61,934 | 15,972 | Taxation charges | 155,946 | 180,715 | 157,090 | ||||||||||||||||||||||||||||||||||||||