0001499505agro:OthersMemberagro:SugarEthanolandEnergyMember2020-01-012020-12-31SownLandCropsSunflowerMemberifrs-full:TopOfRangeMember2023-01-012023-12-31
UNITED STATES SECURITIES AND EXCHANGE COMMISSION
Washington, D.C. 20549
FormFORM 20-F
| | | | | | | | |
| ¨ | REGISTRATION STATEMENT PURSUANT TO SECTION 12(b) OR (g) OF THE SECURITIES EXCHANGE ACT OF 1934 |
| | OR | |
| þ | ANNUAL REPORT PURSUANT TO SECTION 13 OR 15(d) OF THE SECURITIES EXCHANGE ACT OF 1934 FOR THE FISCAL YEAR ENDED ON DECEMBER 31, 20202023 |
| | OR | |
| ¨ | TRANSITION REPORT PURSUANT TO SECTION 13 OR 15(d) OF THE SECURITIES EXCHANGE ACT OF 1934 |
| | FOR THE TRANSITION PERIOD FROM TO ________________ | |
| | OR | |
| ¨ | SHELL COMPANY REPORT PURSUANT TO SECTION 13 OR 15(d) OF THE SECURITIES EXCHANGE ACT OF 1934 |
| | Date of event requiring this shell company report | |
COMMISSION FILE NUMBER: 001-35052
Adecoagro S.A.
(Exact name of Registrantregistrant as specified in its charter)
N/A
(Translation of Registrant’sregistrant’s name into English)
Grand Duchy of Luxembourg
(Jurisdiction of incorporation or organization)
Vertigo Naos Building, 6, Rue Eugène Ruppert,
L - 2453 Luxembourg
Tel: +352.2644.9372
(Address of principal executive offices)
Aurelien CorrionManuela Lamellari
Vertigo Naos Building, 6, Rue Eugène Ruppert,
L - 2453 Luxembourg
Email:aurelien.corrion@intertrustgroup.com manuela.lamellari@intertrustgroup.com
Tel: +352.26449.167+352.26449.494
(Name, Telephone, E-Mail and/or Facsimile number and Address of Company Contact Person)
Securities registered or to be registered pursuant to Section 12(b) of the Act:
| | | | | | | | |
| Title of Each Class | Trading Symbol | Name of Each Exchange on Which Registered |
| Common Shares | AGRO | New York Stock Exchange |
Securities registered or to be registered pursuant to Section 12(g) of the Act:
None
Securities for which there is a reporting obligation pursuant to Section 15(d) of the Act:
None
The number of outstanding shares of each of the issuer’s classes of capital stock
as of December 31, 2020:2023:
117,296,951106,005,500 Common Shares, par value $1.50 per share
Indicate by check mark if the registrant is a well-known seasoned issuer, as defined in Rule 405 of the Securities Act
Yes ¨ No þ
If this report is an annual or transition report, indicate by check mark if the registrant is not required to file reports pursuant to Section 13 or 15(d) of the Securities Exchange Act of 1934.
Yes ¨ No þ
Indicate by check mark whether the Registrantregistrant (1) has filed all reports required to be filed by Section 13 or 15(d) of the Securities Exchange Act of 1934 during the preceding 12 months (or for such shorter period that the Registrantregistrant was required to file such reports) and (2) has been subject to such filing requirements for the past 90 days.
Yes þ No ¨
Indicate by check mark whether the registrant has submitted electronically every Interactive Data File required to be submitted pursuant to Rule 405 of Regulation S-T (§232.405 of this chapter) during the preceding 12 months (or for such shorter period that the registrant was required to submit and post such files).
Yes þ No ¨
Indicate by check mark whether the registrant is a large accelerated filer, an accelerated filer, a non-accelerated filer, or an emerging growth company. See definition of “large accelerated filer," accelerated” “accelerated filer,” and "emerging“emerging growth company"company” in Rule 12b-2 of the Exchange Act. (Check one):
| | | | | | | | |
Large accelerated filer ¨ ☐ | Accelerated filer þ | Non-accelerated filer ¨ |
| | | Emerging growth company ¨ |
If an emerging growth company that prepares its financial statements in accordance with U.S. GAAP, indicate by check mark if the registrant has elected not to use the extended transition period for complying with any new or revised financial accounting standards provided pursuant to Section 13(a) of the Exchange Act. ¨
Indicate by check mark whether the registrant has filed a report on and attestation to its management’s assessment of the effectiveness of its internal control over financial reporting under Section 404(b) of the Sarbanes-Oxley Act (15 U.S.C. 7262(b)) by the registered public accounting firm that prepared or issued its audit report.
☑ Yes ☐ No
If securities are registered pursuant to Section 12(b) of the Act, indicate by check mark whether the financial statements of the
registrant included in the filing reflect the correction of an error to previously issued financial statements. ☐
Indicate by check mark whether any of those error corrections are restatements that required a recovery analysis of incentive-based compensation received by any of the registrant’s executive officers during the relevant recovery period pursuant to §240.10D-1(b). ☐
Indicate by check mark which basis of accounting the registrant has used to prepare the financial statements included in this filing:
U.S. GAAP ¨ International Financial Reporting Standards as issued by the International Accounting Standards Board þ Other ¨
If “Other” has been checked in response to the previous question, indicate by check mark which financial statement item the Registrantregistrant has elected to follow:
Item 17 ¨ Item 18 ¨
If this is an annual report, indicate by check mark whether the registrant is a shell company (as defined in Rule 12b-2 of the Exchange Act). Yes ¨ No þ
TABLE OF CONTENTS
| | | | | | | | | | | |
| |
| | |
| |
| | |
| | |
| | | |
| | |
| | | |
| | |
| | | |
| | |
| | | | |
| | | | |
| | | | |
| | | | |
| | | | |
| | |
| | | | |
| | | | |
| | | | |
| | | | |
| | | | |
| | |
| | | | |
| | |
| | | | |
| | | | |
| | | | |
| | | | |
| E. | E. | | |
| CRITICAL ACCOUNTING ESTIMATES | | F. | |
| | | |
| | | | |
| | |
| | | | |
| | | | |
| | | | |
| | | | |
| | | | |
| | ERRONEOUSLY AWARDED COMPENSATION | |
| | | | |
| | |
| | | | |
| | | | |
| | | | |
| | | | | | | | | | | |
| | | | |
| | | | |
| | | |
| Item 16 J. | Insider Trading Policies. | |
| Item 16 K. | Cybersecurity. | |
| | | | |
| | | |
| | | | |
| | |
| | | |
| | |
| | | |
| | |
FORWARD-LOOKING STATEMENTS
This annual report contains forward-looking statements that are based on our current expectations, assumptions, estimates and projections about us and our industry. These forward-looking statements can be identified by words or phrases such as “anticipate,” “believe,” “continue,” “estimate,” “expect,” “intend,” “is/are likely to,” “may,” “plan,” “should,” “would,” or other similar expressions. The forward-looking statements included in this annual report relate to, among others:
•our business prospects and future results of operations;
•weather and other natural phenomena;
•the length and severity of the coronavirus (COVID-19) pandemic;
•developments in, or changes to, the laws, regulations and governmental policies governing our business, including limitations on ownership of farmland by foreign entities in certain jurisdictionjurisdictions in which we operate, environmental laws and regulations;
•the implementation of our business strategy;
•the correlation between petroleum, ethanol and sugar prices;
•our plans relating to acquisitions, joint ventures, strategic alliances or divestitures;divestitures, and to consolidate our position in different businesses;
•the efficiencies, cost savings and competitive advantages resulting from acquisitions;
•the implementation of our financing strategy and capital expenditure plan;
•the maintenance of our relationships with customers;
•the competitive nature of the industries in which we operate;
•the cost and availability of financing;
•future demand for the commodities we produce;
•international prices for commodities;
•the condition of our land holdings;
•the development of the logistics and infrastructure for transportation of our products in the countries where we operate;
•the length and severity of the coronavirus (COVID-19) pandemic or any other pandemic outbreak;
•the performance of the South American and world economies;
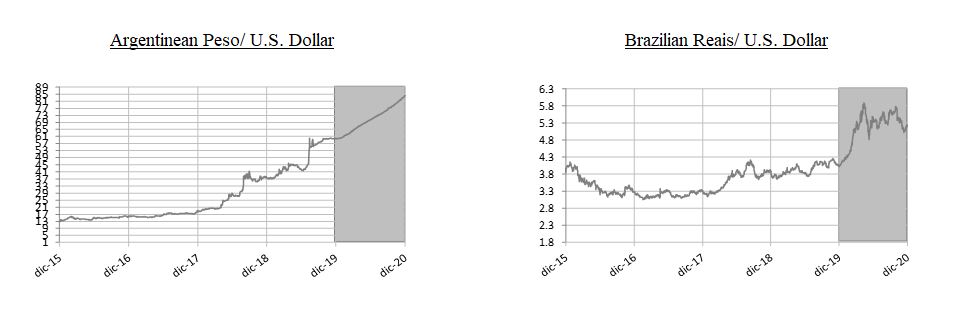
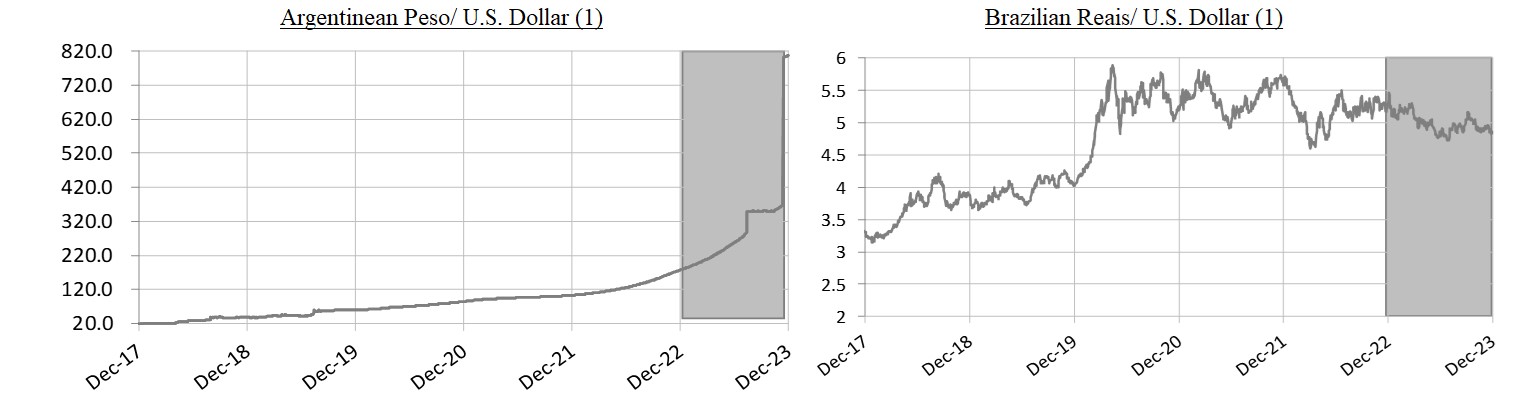
•the relative value of the Brazilian Real, the Argentine Peso and the Uruguayan Peso compared to other currencies; and
•the factors discussed under the section entitled “Risk Factors” in this annual report.
These forward-looking statements involve various risks and uncertainties. Although we believe that our expectations expressed in these forward-looking statements are reasonable, our expectations may turn out to be incorrect. Our actual results could be materially different from our expectations. In light of the risks and uncertainties described above, the estimates and forward-looking statements discussed in this annual report might not occur, and our future results and our performance may differ materially from those expressed in these forward-looking statements due to, including, but not limited to, the factors mentioned above. Because of these uncertainties, you should not make any investment decision based on these estimates and forward-looking statements.
The forward-looking statements made in this annual report relate only to events or information as of the date on which the statements are made. We undertake no obligation to update any forward-looking statements to reflect events or circumstances after the date on which the statements are made or to reflect the occurrence of unanticipated events.
PRESENTATION OF FINANCIAL AND OTHER INFORMATION
Certain Defined Terms
In this annual report, unless otherwise specified or if the context so requires:
•References to the terms “Adecoagro S.A.S.A,”, “Adecoagro”, “we”, “us”, “our”, “Adecoagro,” “we,” “us,” “our,” “Company”; and “our company” refer to, Adecoagro S.A., a corporation organized under the form of a société anonyme under the laws of the Grand Duchy of Luxembourg, and its subsidiaries.
•References to “IFH” and “IFH LP” mean the former International Farmland Holdings, LP, a limited partnership, (previously IFH LP and International Farmland Holdings, LLC, or IFH LLC) which was merged into Adecoagro LP.
•References to “Adecoagro LP” mean Adecoagro, LP SCS, a limited partnership organized under the form of a société comandite simple under the laws of the Grand Duchy of Luxembourg (previously Adecoagro LP and Adecoagro, LLC).
•References to “$,” “US$,” “U.S. dollars” and “dollars” are to U.S. dollars.
•References to “Argentine Pesos,” “Pesos” or “Ps.” are to Argentine Pesos, the official currency of Argentina.
•References to “Brazilian Real,” “Real,” “Reais” or “R$” are to the Brazilian Real, the official currency of Brazil.
•References to “Uruguayan Pesos,” are to Uruguayan Pesos, the official currency of Uruguay.
•Unless stated otherwise, references to “sales” are to the consolidated sales of manufactured productsgoods and services rendered plus sales of agricultural produce and biological assets.service rendered.
•References to “IFRS” are International Financial Reportingto IFRS Accounting Standards as issued by the International Accounting Standards Board (“IASB”) and the interpretations of the International Financial Reporting Interpretations Committee (“IFRIC”), together “IFRS.”Committee.
Background
As part of a corporate reorganization (the “Reorganization”), Adecoagro, a Luxembourg corporation under the form of a société anonyme, was formed as a holding company for IFH for the purpose, among others, of facilitating the initial public offering (the “IPO”) of our common shares, completed on January 28, 2011. Before the IPO, Adecoagro had not engaged in any business or other activities except in connection with its formation and the Reorganization. For an additional discussion of the Reorganization, see “Item 4. Information on the Company—A. History and Development of the Company—History.”
During 2011, we contributed the net proceeds of the IPO to increase our interest in IFH from 98%98.0% to 98.64%. During 2012, we issued, in a series of transactions, 1,654,752 shares to certain limited partners of IFH in exchange for their residual interest in IFH, totaling 1.3595%1.36%, thereby increasing our interest in IFH to approximately 100%. During 2015 IFH was merged into Adecoagro LP, our wholly-owned subsidiary. For further information please see "Item 4 - “Item 4. Information on the Company—A. History and developmentDevelopment of the Company - General Information"Company—History”.
The Consolidated Financial Statements as of December 31, 20202023 and 20192022 and for the years ended December 31, 2020, 20192023, 2022 and 20182021 (hereinafter, the “Consolidated Financial Statements”) included in this annual report have been prepared in accordance with IFRS. All IFRS effective at the time of preparing the Consolidated Financial Statements have been applied.
Description of accounting policies that changed during 2020 and 2019
ReclassificationFinancial reporting in a hyperinflationary economy
DuringIn order to conclude whether an economy is categorized as hyperinflationary under the period ended September 30, 2020, the Company changed its accounting policy related to the applicationterms of IAS 29, Inflation Accounting,the Standard details a series of factors to be considered, including the existence of a cumulative inflation rate for a three year period that was implemented in 2018. Theapproximates or exceeds 100 %.
Since 2018, when the cumulative initial effect of inflation accounting until December 31, 2017 divided by the exchange rate at that date was recognized directly in equity, in the line “Adjustment of opening balance for the application of IAS 29”, as part of retained earnings. The ongoing effect of hyperinflation adjustment and retranslation of comparative amountsrelevant three year period exceeded the 100% threshold, our operations in Argentina have been deemed to closing exchange rates after initial recognition was recognizedbe conducted in Other Comprehensive Income, as part ofa hyperinflationary economy for accounting purposes under the cumulative translation adjustment (“CTA”).
The Company has changed its accounting policy for the presentation of the effect of the initial application of IAS 29, and reclassified it to Other Comprehensive Income, as part of the cumulative translation adjustment (“CTA”); instead of presenting it within retained earnings. This change in the presentation policy was adopted in order to provide uniformity of disclosure for the same concept and only required a reclassification of the constituent elements of the equity and did not affect total shareholders equity.
In addition, and related to hyperinflation accounting,terms of IAS 29. Accordingly, IAS 29 has been applied in the Company has also changed its accounting policyfinancial reporting of our subsidiaries that use the Argentine peso as their functional currency since 2018.
The inflation adjustment for the presentationyears ended December 31, 2023, 2022 and 2021 was calculated by means of finance income /expense. Until June 2020,conversion factor derived from the Company did not segregateArgentine price index published by the impactNational Institute of inflation on financial results. The company has decided toStatistics and the year-over-year change its presentation policy and segregate the impact of inflation over financial results, considering the segregation of such effects provides reliable and more relevant information. Financial results will be presented reflecting interest and exchange difference, net of its inflation effects. This change represents only a reclassification within Financial results and does not have any impact on total financial results, net or net income.
Both changes have been reflected in the comparative periods, thus, comparative figures have been restated. See Note 34 to our Consolidated Financial Statements.
Description of accounting policies that changed during 2019
Leases
IFRS 16 - Leases -index was adopted following the simplified approach, without restating comparative figures. The reclassifications3.114; 1.9479 and the adjustments arising from the new lease accounting rules were directly recognized in the opening balance sheet on January 1, 2019.
On adoption of IFRS 16, the Company recognized lease liabilities in relation to leases, which had previously been classified as ‘operating leases’ under the principles of IAS 17 Leases. For the initial recognition, these liabilities were measured at the present value of the remaining lease payments, and discounted using the lessee’s incremental borrowing rate as of January 1, 2019.
The adoption of IFRS 16 Leases from January 1, 2019, resulted in changes in accounting policies and adjustments to the amounts recognized in the Consolidated Financial Statements. For further details see Note 34 to our Consolidated Financial Statements.
Financial Statements1.509, respectively.
Non-IFRS Financial Measures
To supplement our Consolidated Financial Statements, which are prepared and presented in accordance with IFRS, we use the following non-IFRS financial measures in this annual report, which are based on the information that arose from segment information (Note 3 of ourthe Consolidated Financial Statements).Statements:
•Adjusted Consolidated EBITDAEBITDA;
•Adjusted Segment EBITDAEBITDA;
•Adjusted Consolidated EBITEBIT;
•Adjusted Segment EBITEBIT;
•Adjusted Net Income;
•Adjusted Free Cash FlowFlow;
•Adjusted Free Cash Flow from OperationsOperations;
•Net DebtDebt; and
•Net Debt to Adjusted Consolidated EBITDA Ratio
In particular, Adjusted Consolidated EBITDA, Adjusted Segment EBITDA, Adjusted Consolidated EBIT and Adjusted Segment EBIT arose from our segment information in the Consolidated Financial Statements. Please refer to Note 3 to our Consolidated Financial Statements - Segment Information.
In this section, we provide an explanation and a reconciliation of each of our non-IFRS financial measures to the most directly comparable IFRS measures. The presentation of these financial measures is not intended to be considered in isolation or as a substitute for, or superior to, financial information prepared and presented in accordance with IFRS.
We use non-IFRS measures to internally evaluate and analyze financial results. We believe these non-IFRS financial measures provide investors with useful supplemental information about the liquidity and financial performance of our business, enable comparison of financial results between periods where certain items may vary independent of business performance, and enable comparison of our financial results with other public companies, many of which present similar non-IFRS financial measures.
There are limitations associated with the use of non-IFRS financial measures as an analytical tool. In particular, many of the adjustments to our IFRS financial measures reflect the exclusion of items, such as depreciation of property, plant and equipment and amortization of intangible assets, changes in fair value and the related income tax effects of the aforementioned exclusions, that are recurring and will be reflected in our financial results for the foreseeable future. In addition, these measures
may be different from non-IFRS financial measures used by other companies, limiting their usefulness for comparison purposes.
Adjusted Consolidated EBITDA, Adjusted Segment EBITDA, Adjusted Consolidated EBIT and Adjusted Segment EBIT
We present Adjusted Consolidated EBITDA, Adjusted Segment EBITDA, Adjusted Consolidated EBIT and Adjusted Segment EBIT in this annual report as supplemental measures of performance of our company and of each operating segment, respectively, thatwhich are not required by, or presented in accordance with IFRS.
Adjusted Consolidated EBITDA equals the sum of our Adjusted Segment EBITDA for each of our operating segments. We define “Adjusted Consolidated EBITDA” as (i) consolidated net profit (loss) for the year, as applicable, before interest expense, income taxes, depreciation of property, plant and equipment, and amortization of intangible assets, net gain or loss from fair value adjustments of investment property land foreign exchange gains or losses, other net financial results;results and bargain purchase gain on acquisition (ii) adjusted by profit or loss from discontinued operations; (iii) adjusted by those items, that do not impact profit and loss, but are recorded directly in shareholders'shareholders’ equity, including (a) the gains or losses from disposals of non-controllingnoncontrolling interests in subsidiaries whose main underlying asset is farmland, reflected under the line item: "Reserve“Reserve from the sale of non-controllingnoncontrolling interests in subsidiaries” and (b) the net increase in value of sold farmland, which has beenis recognized in either revaluation surplus or retained earnings and reflected in shareholders’ equity under the line item “Reverse of retained earnings;revaluation surplus derived from disposals of assets”; and (iv)(iii) net of the combined effect of the application of IAS 29 and IAS 21 from the Argentine operations included in profit from operations. (See "Item 5. Operating and Financial Review and Prospects — A. Operating Results - Critical Accounting Policies and Estimates.")
We define “Adjusted Segment EBITDA” for each of our operating segments as (i) the segment’s share of consolidated profit (loss) from operations before financing and taxation per segment information for the year, as applicable, before depreciation of property, plant and equipment and amortization of intangible assets;assets and bargain purchase gain on acquisition, (ii) adjusted by profit or loss from discontinued operations; (iii) adjusted by those items, that do not impact profit and loss, but are recorded directly in shareholders'shareholders’ equity, including (a) the gains or losses from disposals of non-controllingnoncontrolling interests in subsidiaries whose main underlying asset is farmland, reflected under the line item: "Reserveitem “Reserve from the sale of non-controllingnoncontrolling interests in subsidiaries” and (b) the net increase in value of sold farmland, which has beenis recognized in either revaluation surplus or retained earnings, and reflected in shareholder’ equity under the line item “Reverse of retained earnings.revaluation surplus derived from disposals of assets;” and (iii) net of the combined effect of the application of IAS 29 and IAS 21 to our Argentine operations included in profit from operations.
We believe that Adjusted Consolidated EBITDA and Adjusted Segment EBITDA are important measures of operating performance for our company and each operating segment, respectively, because they allow investors to evaluate and compare our consolidated operating results and to evaluate and compare the operating performance of our segments, respectively, including our return on capital and operating efficiencies, from period to period by removing the impact of our capital structure (interest expense from our outstanding debt), asset base (depreciation and amortization), tax consequences (income taxes), bargain purchase gain, foreign exchange gains or losses and other financial results. In addition, by including the gains or losses from disposals of non-controllingnoncontrolling interests in subsidiaries whose main underlying asset is farmland, investors can also evaluate and compare the full value and returns generated by our land transformation activities. Other companies may calculate Adjusted Consolidated EBITDA and Adjusted Segment EBITDA differently, and therefore our Adjusted Consolidated EBITDA and Adjusted Segment EBITDA may not be comparable to similarly titledsimilar measures used by other companies. Adjusted Consolidated EBITDA and Adjusted Segment EBITDA are not measures of financial performance under IFRS, and should not be considered in isolation or as an alternative to consolidated net profit (loss), cash flows from operating activities, segment’ssegment profit from operations before financing and taxation and other measures determined in accordance with IFRS. Items excluded from Adjusted Consolidated EBITDA and Adjusted Segment EBITDA are significant and necessary components to the operations of our business, and, therefore, Adjusted Consolidated EBITDA and Adjusted Segment EBITDA should only be used as a supplemental measure of our company’s operating performance, and of each of our operating segments, respectively. We also believe Adjusted Consolidated EBITDA and Adjusted Segment EBITDA are useful for securities analysts, investors and others to evaluate and compare the financial performance of our company and other companies in the agricultural industry. These non-IFRS measures should be considered in addition to, but not as a substitute for or superior to, the information contained in either our statements of income or segment information.
Our Adjusted Consolidated EBIT equals the sum of our Adjusted Segment EBITs for each of our operating segments. We define “Adjusted Consolidated EBIT” as (i) consolidated net profit (loss) for the year, as applicable, before interest expense, income taxes, foreign exchange gains or losses and other net financial results; and (ii) adjusted by profit or loss from discontinued operations ; (iii) adjusted by gains or losses from disposals of non controllingnoncontrolling interests in subsidiaries whose main underlying asset farmland; (iii) the net increase in value of sold farmland, ;which has been recognized in either revaluation surplus or retained earnings; (iv) net gain/loss from fair value adjustments of investment property land; (v) bargain purchase gain on acquisition and (iv)(vi) net of the combined effect of the application of IAS 29 and IAS 21 fromto the Argentine operations included in profit from operations. We define “Adjusted Segment EBIT” for each of our operating segments as the segment’s share of (i) consolidated profit (loss) from operations before financing and taxation as per segment information for the year, as applicable; and (ii) adjusted by profit or net gain/loss from discontinued operations;fair value adjustments of investment property land; (iii) bargain purchase gain on acquisition; and (iii)(iv) adjusted by those items, that do not impact profit and loss, but are recorded directly in shareholders'shareholders’ equity, including (a) the gains or losses from disposals of
non-controlling noncontrolling interests in subsidiaries whose main underlying asset is farmland, reflected under the line item: "Reserve from the sale of non-controllingnoncontrolling interests in subsidiaries”; (b) the net increase in value of sold farmland, which has been recognized in either revaluation surplus of retained earnings.
We believe that Adjusted Consolidated EBIT and Adjusted Segment EBIT are important measures of operating performance, for our company and each operating segment, respectively, because they allow investors to evaluate and compare our consolidated operating results and to evaluate and compare the operating performance of our segments, from period to period by including the impact of depreciable fixed assets and removing the impact of our capital structure (interest expense from our outstanding debt), tax consequences (income taxes), foreign exchange gains or losses and other financial results. In addition, by including the gains or losses from disposals of non-controllingnoncontrolling interests in subsidiaries whose main underlying asset is farmland and also the sale of farmlands, investors can evaluate the full value and returns generated by our land transformation activities. Other companies may calculate Adjusted Consolidated EBIT and Adjusted Segment EBIT differently, and therefore our Adjusted Consolidated EBIT and Adjusted Segment EBIT may not be comparable to similarly titledsimilar measures used by other companies. Adjusted Consolidated EBIT and Adjusted Segment EBIT are not measures of financial performance under IFRS, and should not be considered in isolation or as an alternative to consolidated net profit (loss), cash flows from operating activities, segment’ssegment profit from operations before financing and taxation and other measures determined in accordance with IFRS. Items excluded from Adjusted Consolidated EBIT and Adjusted Segment EBIT are significant and necessary components to the operations of our business, and, therefore, Adjusted Consolidated EBIT and Adjusted Segment EBIT should only be used as a supplemental measure of the operating performance of our company, and of each of our operating segments, respectively.
Adjusted Net Income
We define Adjusted Net Income as (i) profit / (loss) of the period/year before net gain / (losses) from fair value adjustments of investment property land and bargain purchase gain on acquisition; plus (ii) any non-cash finance costs resulting from foreign exchange gain/losses for such period, which are composed by both exchange differences and cash flow hedge transfer from equity, included in Financial Results, net, in our statement of income; net of the related income tax effects, plus (iii) gains or losses from disposals of non-controlling interests in subsidiaries whose main underlying asset is farmland, which are reflected in our shareholders’ equity under the line item “Reserve from the sale of non-controlling interests in subsidiaries” if any, plus (iv) the reversal of the aforementioned income tax effect, plus (v) inflation accounting effect; plus (vi) the net increase in value of sold farmland, which has been recognized in either revaluation surplus or retained earnings, if any.
We believe that Adjusted Net Income is an important measure of performance for our company allowing investors to properly assess the impact of the results of our operations in our equity. In fact, results arising from the revaluation effect of our net monetary position held in foreign currency in the countries where our functional currency is the local currency do not affect the equity of the Company, when measured in foreign / reporting currency. Conversely, the tax effect resulting from the aforementioned revaluation effect does impact the equity of the Company, since it reduces/increases the income tax to be paid in each country. Accordingly we have added back the income tax effect to Adjusted Net Income.
In addition, by including the gains or losses from disposals of non-controlling interests in subsidiaries whose main underlying asset is farmland, investors can also include the full value and returns generated by our land transformation activities.
Other companies may calculate Adjusted Net Income differently, and therefore our Adjusted Net Income may not be comparable to similar measures used by other companies. Adjusted Net Income is not a measure of financial performance under IFRS, and should not be considered in isolation or as an alternative to consolidated net profit (loss). This non-IFRS measure should be considered in addition to, but not as a substitute for or superior to, the information contained in our consolidated financial statements.
Adjusted Free Cash Flow and Adjusted Free Cash Flow from Operations
We believe that the measures ofdefine Adjusted Free Cash Flow as the aggregate of (i) net cash generated from operating activities net of the combined effect of the application of IAS 29 and IAS 21 to the Argentine operations, (ii) net cash used in investing activities net of the combined effect of the application of IAS 29 and IAS 21 to the Argentine operations -excluding the combined effect in other financial income-, less (iii) interest paid net of the combined effect of the application of IAS 29 and IAS 21 to the Argentine operations, plus (iv) proceeds from the sale of non-controlling interest in farming subsidiaries; less (v) lease payments, less (vi) dividends paid to noncontrolling interest, plus (vii) the net of acquisition/disposal of restricted short-term investments, namely US-Treasury Bills used as collateral of short term borrowings, and less (viii) other financial income derived from gains on bond arbitrage transactions. We define Adjusted Free Cash Flow from Operations are important measures of liquidity that enable investors to draw important comparisons year to year of the amount of cash generated by the Company’s principal business and financing activities, which includes the cash generated from our land transformation activities, after paying for recurrent items, including interest, taxes and maintenance capital expenditures.
We define Adjusted Free Cash Flow as (i) net cash generated from operating activities net of the combined effect of the application of IAS 29 and IAS 21 to the Argentine operations, less (ii) net cash used in investing activities net of the combined effect of the application of IAS 29 and IAS 21 to the Argentine Operations -excluding the net of the combined effect in other financial income-, less (iii) interest paid net of the combined effect of the application of IAS 29 and IAS 21 to the Argentine operations, plus (iv) proceeds from the sale of non-controllingnoncontrolling interest in farming subsidiaries; less (v) lease payments. payments, less (vi) dividends paid to noncontrolling interest plus (vii) the
net of acquisition/disposal of restricted short-term investments, namely US-Treasury Bills used as collateral of short term borrowings, less (viii) other financial income derived from gains on bond arbitrage transactions, less (ix) expansion capital expenditures.
We definebelieve that the measures of Adjusted Free Cash Flow and Adjusted Free Cash Flow from Operations as (i) netare important measures of liquidity that enable investors to draw important comparisons year to year of the amount of cash generated from operatingby the Company’s principal business and financing activities, net of the combined effect of the application of IAS 29after paying for recurrent items, including interest, taxes and IAS 21 less (ii) net cash used in investing activities net of the combined effect of the application of IAS 29 and IAS 21, less (iii) interest paid net of the combined effect of the application of IAS 29 and IAS 21 to the Argentine operations, plus (iv) proceeds from the sale of non-controlling interest in subsidiaries; less (v) lease payments; plus (vi) expansionmaintenance capital expenditures. (See "Item 3. Key Information— A Selected Financial Data." and "Item 5. Operating and Financial Review and Prospects — A. Operating Results -- Critical Accounting Policies and Estimates"
Expansion capital expenditures is defined as the required investment to expand current production capacity including organic growth, joint ventures and acquisitions. We define maintenance capital expenditures as the necessary investments in order to maintain the current level of productivity both at an agricultural and industrial level. Proceeds from the sale of non-controllingnoncontrolling interest in farming subsidiaries is a measure of the cash generated from our land transformation business thatby the sale of farms, which is included under cash from financing activities pursuant to IFRS.
We believe Adjusted Free Cash Flow is an important liquidity measure for the Company because it allows investors and others to evaluate and compare the amount of cash generated by the Company business and financing activities to undertake growth investments, to fund acquisitions, to reduce outstanding financial debt, and to provide a return to shareholders in the form of dividends and/or share repurchases, among other things.others.
We believe Adjusted Free Cash Flow from Operations is an additional important liquidity metric for the Company because it allows investors and others to evaluate and compare the total amount of cash generated by the Company’s business and financing activities after paying for recurrent items including interests, taxes and maintenance capital expenses.expenditures. We believe this metric is relevant in evaluating the overall performance of our business.
Other companies may calculate Adjusted Free Cash Flow and Adjusted Free Cash Flow from Operations differently, and therefore, our formulation may not be comparable to similarly titled measures used by other companies. Adjusted Free Cash Flow and Adjusted Free Cash Flow from Operations are not measures of liquidity under IFRS, and should not be considered in
isolation or as an alternative to consolidated, cash flows from operating activities, net increase, (decrease) in cash and cash equivalents and other measures determined in accordance with IFRS.
Net Debt and Net Debt to Adjusted Consolidated EBITDA Ratio
Net debt is defined as the sum of non-currentcurrent and currentnon-current borrowings, less cash and cash equivalents.equivalents and restricted short-term investments (namely US-Treasury Bills used as collateral of short-term borrowings). This measure is widely used by management.
Management is consistently tracking our leverage position and our ability to repay and service our debt obligations over time. We have therefore set a leverage ratio target that is measured by net debt divided by Adjusted Consolidated EBITDA.
We believe that the ratio of net debt to Adjusted Consolidated EBITDA provides useful information to investors because management uses it to manage our debt-equity ratio in order to promote access to capital markets and our ability to meet scheduled debt service obligations.
Fiscal Year and Harvest Year
Our fiscal year begins on January 1 and ends on December 31 of each year. However, our production is based on the harvest yearharvest-year for each of our crops and rice. A harvest yearharvest-year varies according to the crop or rice and to the climate in which it is grown. Due to the geographic diversity of our farms, the planting period for a given crop or rice may start earlier on one farm than on another, causing differences in their respective harvesting periods. The presentation of production volume (tons) and product area (hectares) in this annual report, in respect of the harvest yearsharvest-years for each of our crops and rice, starts with the first day of the planting period at the first farm to start planting on that harvest yearharvest-year and continues to the last day of the harvesting period of the respective crop or rice on the last farm to finish harvesting that harvest year,harvest-year, as shown in the table below.
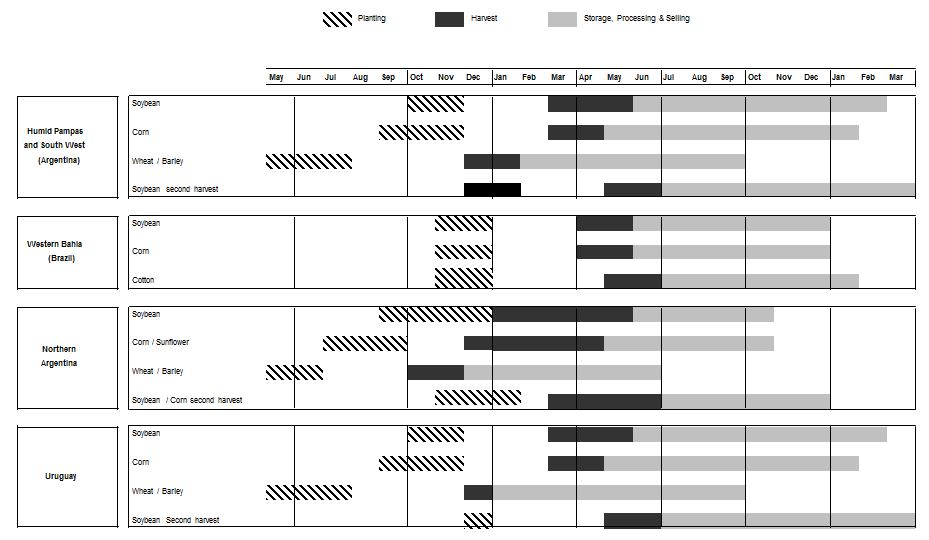
| | | | | | | | | | | | | | | | | | | | | | | | | | | | | | | | | | | | | | | | | | | | | | | | | | | | | | | | | | | | | | | | | | | | | | | | | | | | | |
| | | | Planting | | | Harvest | | | Storage, Processing & Selling | | | | | | | |
| | | | | | | | | | | | | | | | | | | | | | | | | |
| | | May | Jun | Jul | Aug | Sep | Oct | Nov | Dec | Jan | Feb | Mar | Apr | May | Jun | Jul | Aug | Sep | Oct | Nov | Dec | Jan | Feb | Mar |
| | | | | | | | | | | | | | | | | | | | | | | | | |
| Humid Pampas and South West (Argentina) | | Soybean | | | | | | | | | | | | | | | | | | | | | | | |
| | | | | | | | | | | | | | | | | | | | | | | | |
| Corn | | | | | | | | | | | | | | | | | | | | | | | |
| | | | | | | | | | | | | | | | | | | | | | | | | |
| | Wheat / Barley | | | | | | | | | | | | | | | | | | | | | | | |
| | | | | | | | | | | | | | | | | | | | | | | | | |
| | Soybean second harvest | | | | | | | | | | | | | | | | | | | | | | | |
| | | | | | | | | | | | | | | | | | | | | | | | | |
| | Corn second harvest | | | | | | | | | | | | | | | | | | | | | | | |
| | | | | | | | | | | | | | | | | | | | | | | | | |
| | Peanut | | | | | | | | | | | | | | | | | | | | | | | |
| | | | | | | | | | | | | | | | | | | | | | | | | |
| | Sunflower | | | | | | | | | | | | | | | | | | | | | | | |
| | | | | | | | | | | | | | | | | | | | | | | | | |
| Northern Argentina | | Soybean | | | | | | | | | | | | | | | | | | | | | | | |
| | | | | | | | | | | | | | | | | | | | | | | | |
| | Corn / Sunflower | | | | | | | | | | | | | | | | | | | | | | | |
| | | | | | | | | | | | | | | | | | | | | | | | | |
| | Wheat / Barley | | | | | | | | | | | | | | | | | | | | | | | |
| | | | | | | | | | | | | | | | | | | | | | | | | |
| | Soybean / Corn second harvest | | | | | | | | | | | | | | | | | | | | | | | |
| | | | | | | | | | | | | | | | | | | | | | | | | |
| | Cotton | | | | | | | | | | | | | | | | | | | | | | | |
| | | | | | | | | | | | | | | | | | | | | | | | | |
| | Rice | | | | | | | | | | | | | | | | | | | | | | | |
| | | | | | | | | | | | | | | | | | | | | | | | | |
| Uruguay | | Soybean | | | | | | | | | | | | | | | | | | | | | | | |
| | | | | | | | | | | | | | | | | | | | | | | | | |
| | Corn | | | | | | | | | | | | | | | | | | | | | | | |
| | | | | | | | | | | | | | | | | | | | | | | | | |
| | Wheat / Barley | | | | | | | | | | | | | | | | | | | | | | | |
| | | | | | | | | | | | | | | | | | | | | | | | | |
| | Soybean / Corn second harvest | | | | | | | | | | | | | | | | | | | | | | | |
| | | | | | | | | | | | | | | | | | | | | | | | | |
| | Rice | | | | | | | | | | | | | | | | | | | | | | | |
Product area for cattle is presented on a harvest yearharvest-year basis given that land utilized for cattle operations is linked to our farming operations and use of farmland during a harvest year. Production volumes for dairy and cattle operations are presented on a fiscal year basis. On the other hand, production volumes and product area in our sugar, ethanolSugar, Ethanol and energyEnergy business are presented on a fiscal yearfiscal-year basis.
The financial results for all of our products are presented on a fiscal yearfiscal-year basis.
Certain Weight Units and Measures in the Agricultural Business
Weight units and measures used in agriculture vary according to the crop and producing country. In order to permit comparability of our operating data with operating data from the international markets, the following table sets forth key weight units and measures used in the agricultureagricultural industry:
| | | | | | | | |
| Agricultural weight units and measures | | |
| 1 metric ton | 1,000 kg | 1.102 U.S. (short) tons |
| 1 cubic meter | 1,000 liters | |
| 1 kilogram (kg) | 2.20462 pounds | |
| 1 pound | 0.45359 kg | |
| 1 acre | 0.40469 hectares | |
| 1 hectare (ha) | 2.47105 acres | |
| Soybean and Wheat | | |
| 1 bushel of soybean | 60 pounds | 27.2155 kg |
| 1 bag of soybean | 60 kg | 2.20462 bushels |
| 1 bushel/acre | 67.25 kg/ha | |
| 1.00 U.S. dollar/bushel | 2.2046 U.S. dollar/bag | |
| Corn | | |
| 1 bushel of corn | 56 pounds | 25.4012 kg |
| 1 bag of corn | 60 kg | 2.36210 bushels |
| 1 bushel/acre | 62.77 kg/ha | |
| 1.00 U.S. dollar/bushel | 2.3621 U.S. dollar/bag | |
| Dairy | | |
| 1 liter | 0.264 gallons | 2.273 pounds |
| 1 gallon | 3.785 liters | 8.604 pounds |
| 1 lbs | 0.440 liters | 0.116 gallons |
| 1.00 U.S. dollar/liter | 43.995 U.S. dollar/cwt | 3.785 U.S. dollar/gallon |
| 1.00 U.S. dollar/cwt | 0.023 U.S. dollar/liter | 0.086 U.S. dollar/gallon |
| 1.00 U.S. dollar/gallon | 0.264 U.S. dollar/liter | 11.622 U.S. dollar/cwt |
Sugar &and Ethanol | | |
| 1 kg of TRS equivalent | 0.95 kg of VHP Sugar | 0.59 liters of Hydrated Ethanol |
| 1.00 US$ cents/pound | 22.04 U.S. dollar/ton | |
Presentation of Information — Market Data and Forecasts
This annual report includes information provided by us and by third-party sources that we believe are reliable, including data related to the economic conditions in the markets in which we operate. Unless otherwise indicated, information in this annual report concerning economic conditions is based on publicly available information from third-party sources which we believe to be reasonable. The economic conditions in the markets in which we operate may deteriorate, and those economies may not grow at the rates projected by market data, or at all. The deterioration of the economic conditions in the markets in which we operate may have a material adverse effect on our business, results of operations and financial condition and the market price of our common shares.
Rounding
We have made rounding adjustments to reach some of the figures included in this annual report. Accordingly, numerical figures shown as totals in some tables may not be an arithmetic aggregation of the figures that preceded them.
PART I
Item 1. Identity of Directors, Senior Management and Advisers
Not applicable.
Item 2. Offer Statistics and Expected Timetable
Not applicable.
Item 3. Key Information
A. SELECTED FINANCIAL DATA
The following selected statement of financial position data as of December 31, 2020 and 2019 and selected statement of income data and cash flow data for each of the three years in the period ended December 31, 2020, 2019 and 2018 have been derived from our Consolidated Financial Statements appearing elsewhere in this annual report on Form 20-F. The selected statement of financial position data as of December 31, 2018, 2017 and 2016 and for the years ended December 31, 2017 and 2016 has been derived from our annual consolidated financial statements which are not included in this annual report.
The Consolidated Financial Statements are prepared in accordance with IFRS. All IFRS effective at the time of preparing the Consolidated Financial Statements have been applied.
You should read the information contained in the following tables in conjunction with “Item 5. Operating and Financial Review and Prospects”, “Item 8. Financial Information”, “Item 18. Financial Statements” and the Consolidated Financial Statements and the accompanying notes included elsewhere in this annual report.
Financial reporting in a hyperinflation economy
IAS 29 “Financial Reporting in Hyperinflationary Economies” requires that the financial statements of entities whose functional currency is that of a hyperinflationary economy to be adjusted for the effects of changes in a suitable general price index and to be expressed in terms of the current unit of measurement at the closing date of the reporting period. Accordingly, the inflation produced from the date of acquisition or from the revaluation date, as applicable, must be computed in the non-monetary items.
In order to conclude on whether an economy is categorized as hyperinflationary under the terms of IAS 29, the Standard details a series of factors to be considered, including the existence of a cumulative inflation rate in three years that approximates or exceeds 100 %.
Since 2018, when cumulative inflation rate in three years exceeded the 100% threshold, Argentina´s operations are considered to be under hyperinflationary economy for accounting purposes under the terms of IAS 29 and since then, it has been applied IAS 29 in the financial reporting of its subsidiaries and associates with Argentine peso as functional currency.
| | | | | | | | | | | | | | | | | | | | | | | | | | | | | |
| | For the years ended December 31, |
| | 2020 | | 2019 (*) | | 2018 (*) | | 2017 | | 2016 |
| | (In thousands of $) |
| Statements of Income Data: | | | | | | | | | |
| Sale of goods and services rendered | 817,764 | | | 887,138 | | | 793,239 | | | 933,178 | | | 869,235 | |
| Cost of goods sold and services rendered | (611,946) | | | (671,173) | | | (609,965) | | | (766,727) | | | (678,581) | |
| Initial recognition and changes in fair value of biological assets and agricultural produce | 122,729 | | | 68,589 | | | 16,195 | | | 63,220 | | | 125,456 | |
| Changes in net realizable value of agricultural produce after harvest | 7,005 | | | 1,825 | | | (909) | | | 8,852 | | | (5,841) | |
| Margin on manufacturing and agricultural activities before operating expenses | 335,552 | | | 286,379 | | | 198,560 | | | 238,523 | | | 310,269 | |
| General and administrative expenses | (53,428) | | | (57,202) | | | (56,080) | | | (57,299) | | | (50,750) | |
| Selling expenses | (95,058) | | | (106,972) | | | (90,215) | | | (95,399) | | | (80,673) | |
| Other operating income, net | 1,987 | | | (822) | | | 104,232 | | | 43,763 | | | 5,752 | |
| | | | | | | | | |
| Profit from operations before financing and taxation | 189,053 | | | 121,383 | | | 156,497 | | | 129,588 | | | 184,598 | |
| Finance income | 26,054 | | | 8,979 | | | 8,394 | | | 11,744 | | | 7,957 | |
| Finance costs | (213,776) | | | (126,111) | | | (163,937) | | | (131,349) | | | (165,380) | |
| Other financial results - Net gain of inflation effects on the monetary items | 12,064 | | | 16,911 | | | (25,211) | | | — | | | — | |
| Financial results, net | (175,658) | | | (100,221) | | | (180,754) | | | (119,605) | | | (157,423) | |
| Profit / (Loss) before income tax | 13,395 | | | 21,162 | | | (24,257) | | | 9,983 | | | 27,175 | |
| Income tax (expense) / benefit | (12,325) | | | (20,820) | | | 1,024 | | | 4,992 | | | (12,899) | |
| Profit / (loss) for the year | 1,070 | | | 342 | | | (23,233) | | | 14,975 | | | 14,276 | |
| | | | | | | | | |
| Attributable to: | | | | | | | | | |
| Equity holders of the parent | 412 | | | (772) | | | (24,622) | | | 13,198 | | | 11,568 | |
| Non-controlling interest | 658 | | | 1,114 | | | 1,389 | | | 1,777 | | | 2,708 | |
| | | | | | | | | |
| Earnings / (loss) per share from operations attributable to the equity holders of the parent during the year: | | | | | | | | | |
| Basic earnings / (loss) per share | 0.003 | | | (0.007) | | | (0.211) | | | 0.109 | | | 0.095 | |
| Diluted earnings / (loss) per share | 0.003 | | | (0.007) | | | (0.211) | | | 0.108 | | | 0.094 | |
(*) Prior periods have been recast to reflect the Company's change in accounting policy for the reclassification within financial results as explained in "Description of accounting policies that changed during 2020 and 2019" Note 34.1 to our Consolidated Financial Statements.
| | | | | | | | | | | | | | | | | | | | | | | | | | | | | |
| | For the Year Ended December 31, |
| | 2020 | | 2019 (*) | | 2018 (*) | | 2017 | | 2016 |
| Cash Flow Data: | | | | | | | | | |
| Net cash generated from operating activities (a) | 257,125 | | | 322,110 | | | 218,513 | | | 237,105 | | | 255,401 | |
| Net cash used in investing activities (b) | (121,916) | | | (249,639) | | | (175,109) | | | (188,335) | | | (122,014) | |
| Net cash generated from financing activities (c) | (53,919) | | | (37,863) | | | (20,854) | | | 70,194 | | | (181,682) | |
| (a) Includes 23,550 and 7,598 of the combined effect of IAS 29 and IAS 21 of the Argentine subsidiaries for 2019 and 2018, respectively. |
| (b) Includes 3,851 and 4,122 of the combined effect of IAS 29 and IAS 21 of the Argentine subsidiaries for 2019 and 2018, respectively. |
| (c) Includes (14,340) and (8,231) of the combined effect of IAS 29 and IAS 21 of the Argentine subsidiaries for 2019 and 2018, respectively. |
| Other Financial Data: | | | | | | | | | |
Adjusted Segment EBITDA (unaudited) (1) | | | | | | | | | |
| Crops | 35,694 | | | 25,654 | | | 34,012 | | | 25,678 | | | 27,462 | |
| Rice | 34,108 | | | 20,328 | | | 18,827 | | | 12,179 | | | 11,698 | |
| Dairy | 18,153 | | | 14,965 | | | 7,189 | | | 12,243 | | | 5,717 | |
| All Other segments | 1,620 | | | 266 | | | (460) | | | 556 | | | 9,085 | |
| Farming subtotal | 89,575 | | | 61,213 | | | 59,568 | | | 50,656 | | | 53,962 | |
| Ethanol, sugar and energy | 253,052 | | | 253,069 | | | 238,284 | | | 247,301 | | | 265,044 | |
| Land transformation | 18,132 | | | 10,526 | | | 36,850 | | | — | | | — | |
| Corporate | (18,806) | | | (19,639) | | | (19,971) | | | (21,664) | | | (20,957) | |
Adjusted Consolidated EBITDA (unaudited) (1) | 341,953 | | | 305,169 | | | 314,731 | | | 276,293 | | | 298,049 | |
(1)See “Presentation of Financial and Other Information” for the definitions of Adjusted Segment EBITDA and Adjusted Consolidated EBITDA and the reconciliation in the table below.
| | | | | | | | | | | | | | | | | | | | | | | | | | | | | |
| | As of December 31, |
| | 2020 | | 2019 (*) | | 2018 | | 2017 | | 2016 |
| | (In thousands of $) |
| Statement of Financial Position Data: | | | | | | | | | |
| Biological assets | 165,693 | | | 130,436 | | | 105,387 | | | 167,994 | | | 145,404 | |
| Inventories | 133,461 | | | 112,790 | | | 128,102 | | | 108,919 | | | 111,754 | |
| Property, plant and equipment, net | 1,358,292 | | | 1,493,220 | | | 1,480,439 | | | 831,377 | | | 814,867 | |
| Right of use assets | 209,694 | | | 238,053 | | | — | | | — | | | — | |
| Total assets | 2,482,236 | | | 2,521,307 | | | 2,277,372 | | | 1,645,089 | | | 1,496,397 | |
| Non-current lease liabilities | 159,435 | | | 174,570 | | | — | | | — | | | — | |
| Total lease liabilities | 195,772 | | | 216,384 | | | — | | | — | | | — | |
| Non-current borrowings | 813,464 | | | 780,202 | | | 718,484 | | | 663,060 | | | 430,304 | |
| Total borrowings | 971,090 | | | 968,280 | | | 862,116 | | | 817,958 | | | 635,396 | |
| Share Capital | 183,573 | | | 183,573 | | | 183,573 | | | 183,573 | | | 183,573 | |
| Equity attributable to equity holders of the parent | 925,041 | | | 988,269 | | | 1,063,636 | | | 673,880 | | | 700,334 | |
| Non-controlling interest | 38,683 | | | 40,614 | | | 44,509 | | | 9,139 | | | 11,970 | |
| Number of shares (including treasury shares) | 122,382 | | | 122,382 | | | 122,382 | | | 122,382 | | | 122,382 | |
(*) Prior period has been recast to reflect the Company's change in accounting policy for the reclassification within financial results as explained in "Description of accounting policies that changed during 2020 and 2019" Note 34.1 to our Consolidated Financial Statements.
The following tables show a reconciliation of Adjusted Segment EBITDA to our segments’ profit / (loss) from operations before financing and taxation, the most directly comparable IFRS financial measure, and a reconciliation of Adjusted Consolidated EBITDA to our net profit (loss) for the year, the most directly comparable IFRS financial measure.
| | | | | | | | | | | | | | | | | | | | | | | | | | | | | | | | | | | | | | | | | | | | | | | | | | | | | |
| | For the year ended December 31, 2020 |
| | Crops | | Rice | | Dairy | | All other
segments | | Farming
Subtotal | | Sugar,
Ethanol
and
Energy | | Land
Trans-
formation | | Corporate | | Total |
| | (In thousands of $) |
Adjusted Segment EBITDA
(unaudited) | | | | | | | | | | | | | | | | | |
Profit/(Loss) from
Operations Before Financing and Taxation as per Segment Information | 30,297 | | | 27,456 | | | 11,444 | | | 2,562 | | | 71,759 | | | 130,536 | | | 7,934 | | | (19,682) | | | 190,547 | |
| Net (gain) from Fair value adjustment of investment property as per Segment Information | — | | | — | | | — | | | (1,080) | | | (1,080) | | | — | | | — | | | — | | | (1,080) | |
| Reverse of revaluation surplus derived from the disposals of assets before taxes | — | | | — | | | — | | | — | | | — | | | — | | | 10,198 | | | — | | | 10,198 | |
Adjusted Segment EBIT (unaudited)(1) | 30,297 | | | 27,456 | | | 11,444 | | | 1,482 | | | 70,679 | | | 130,536 | | | 18,132 | | | (19,682) | | | 199,665 | |
| Depreciation of Property, plant and equipment and amortization of Intangible Assets as per Segment Information | 5,397 | | | 6,652 | | | 6,709 | | | 138 | | | 18,896 | | | 122,516 | | | — | | | 876 | | | 142,288 | |
Adjusted Segment EBITDA (unaudited)(1) | 35,694 | | | 34,108 | | | 18,153 | | | 1,620 | | | 89,575 | | | 253,052 | | | 18,132 | | | (18,806) | | | 341,953 | |
| Reconciliation to Profit | | | | | | | | | | | | | | | | | |
| Profit for the year | | | | | | | | | | | | | | | | | 1,070 | |
| Income tax expense | | | | | | | | | | | | | | | | | 12,325 | |
| Interest expense, net | | | | | | | | | | | | | | | | | 54,198 | |
| Foreign exchange, net | | | | | | | | | | | | | | | | | 109,266 | |
| Other financial results - Net gain of inflation effects on the monetary items | | | | | | | | | | | | | | | | | (12,064) | |
| Other financial results, net | | | | | | | | | | | | | | | | | 24,258 | |
| Combined effects of IAS 29 and IAS 21 of the Argentine subsidiaries of Profit from operations | | | | | | | | | | | | | | | | | 1,494 | |
| Net (gain) from Fair value adjustment of investment property as per Segment Information | | | | | | | | | | | | | | | | | (1,080) | |
Adjusted Consolidated EBIT (unaudited) (1) | | | | | | | | | | | | | | | | | 189,467 | |
| Depreciation of Property, Plant and Equipment and amortization of Intangible Assets as per Segment Information | | | | | | | | | | | | | | | | | 142,288 | |
| Reverse of revaluation surplus derived from the disposals of assets before taxes | | | | | | | | | | | | | | | | | 10,198 | |
Adjusted Consolidated EBITDA (unaudited)(1) | | | | | | | | | | | | | | | | | 341,953 | |
(1)See “Presentation of Financial and Other Information” for the definitions of Adjusted Segment EBIT, Adjusted Consolidated EBIT, Adjusted Segment EBITDA and Adjusted Consolidated EBITDA.
| | | | | | | | | | | | | | | | | | | | | | | | | | | | | | | | | | | | | | | | | | | | | | | | | | | | | |
| | For the year ended December 31, 2019 |
| | Crops | | Rice | | Dairy | | All other
segments | | Farming
Subtotal | | Sugar,
Ethanol
and
Energy | | Land
Trans-
formation | | Corporate | | Total |
| | (In thousands of $) |
Adjusted Segment EBITDA
(unaudited) | | | | | | | | | | | | | | | | | |
Profit/(Loss) from
Operations Before Financing and Taxation | 20,992 | | | 13,334 | | | 9,901 | | | (842) | | | 43,385 | | | 95,412 | | | 2,504 | | | (19,659) | | | 121,642 | |
| Net loss from Fair value adjustment of investment property | — | | | — | | | — | | | 927 | | | 927 | | | — | | | — | | | — | | | 927 | |
| Reverse of revaluation surplus derived from the disposals of assets before taxes | — | | | — | | | — | | | — | | | — | | | — | | | 8,022 | | | — | | | 8,022 | |
Adjusted Segment EBIT (unaudited)(1) | 20,992 | | | 13,334 | | | 9,901 | | | 85 | | | 44,312 | | | 95,412 | | | 10,526 | | | (19,659) | | | 130,591 | |
| Depreciation and amortization | 4,662 | | | 6,994 | | | 5,064 | | | 181 | | | 16,901 | | | 157,657 | | | — | | | 20 | | | 174,578 | |
Adjusted Segment EBITDA (unaudited)(1) | 25,654 | | | 20,328 | | | 14,965 | | | 266 | | | 61,213 | | | 253,069 | | | 10,526 | | | (19,639) | | | 305,169 | |
| Reconciliation to Profit | | | | | | | | | | | | | | | | | |
| Profit for the year | | | | | | | | | | | | | | | | | 342 | |
| Income tax expense | | | | | | | | | | | | | | | | | 20,820 | |
Interest expense, net (2) | | | | | | | | | | | | | | | | | 50,078 | |
Foreign exchange, net (2) | | | | | | | | | | | | | | | | | 25,779 | |
Other financial results - Net gain of inflation effects on the monetary items (2) | | | | | | | | | | | | | | | | | (16,911) | |
Other financial results, net (2) | | | | | | | | | | | | | | | | | 41,275 | |
| Combined effects of IAS 29 and IAS 21 of the Argentine subsidiaries of Profit from operations | | | | | | | | | | | | | | | | | 259 | |
| Net gain from Fair value adjustment of investment property | | | | | | | | | | | | | | | | | 927 | |
Adjusted Consolidated EBIT (unaudited)(1) | | | | | | | | | | | | | | | | | 122,569 | |
| Depreciation and amortization | | | | | | | | | | | | | | | | | 174,578 | |
| Reverse of revaluation surplus derived from the disposals of assets before taxes | | | | | | | | | | | | | | | | | 8,022 | |
Adjusted Consolidated EBITDA (unaudited)(1) | | | | | | | | | | | | | | | | | 305,169 | |
(1)See “Presentation of Financial and Other Information” for the definitions of Adjusted Segment EBIT, Adjusted Consolidated EBIT, Adjusted Segment EBITDA and Adjusted Consolidated EBITDA.
(2)Prior periods have been recast to reflect the Company's change in accounting policy for the reclassification within financial results as explained in "Description of accounting policies that changed during 2020 and 2019" Note 34.1 to our Consolidated Financial Statements.
| | | | | | | | | | | | | | | | | | | | | | | | | | | | | | | | | | | | | | | | | | | | | | | | | | | | | |
| | For the year ended December 31, 2018 |
| | Crops | | Rice | | Dairy | | All other
segments | | Farming
Subtotal | | Sugar,
Ethanol
and
Energy | | Land
Trans-
formation | | Corporate | | Total |
| | (In thousands of $) |
Adjusted Segment EBITDA
(unaudited) | | | | | | | | | | | | | | | | | |
Profit/(Loss) from
Operations Before Financing and Taxation | 32,315 | | | 12,981 | | | 4,936 | | | 10,049 | | | 60,281 | | | 95,082 | | | 36,850 | | | (19,971) | | | 172,242 | |
| Net gain from fair value adjustment of investment property | — | | | — | | | — | | | (10,680) | | | (10,680) | | | — | | | — | | | — | | | (10,680) | |
Adjusted Segment EBIT (unaudited)(1) | 32,315 | | | 12,981 | | | 4,936 | | | (631) | | | 49,601 | | | 95,082 | | | 36,850 | | | (19,971) | | | 161,562 | |
| Depreciation and amortization | 1,697 | | | 5,846 | | | 2,253 | | | 171 | | | 9,967 | | | 143,202 | | | — | | | — | | | 153,169 | |
Adjusted Segment EBITDA (unaudited)(1) | 34,012 | | | 18,827 | | | 7,189 | | | (460) | | | 59,568 | | | 238,284 | | | 36,850 | | | (19,971) | | | 314,731 | |
| Reconciliation to Profit | | | | | | | | | | | | | | | | | |
| Loss for the year | | | | | | | | | | | | | | | | | (23,233) | |
| Income tax benefit | | | | | | | | | | | | | | | | | (1,024) | |
Interest expense, net (2) | | | | | | | | | | | | | | | | | 39,538 | |
Foreign exchange, net (2) | | | | | | | | | | | | | | | | | 68,787 | |
Other financial results - Net gain of inflation effects on the monetary items (2) | | | | | | | | | | | | | | | | | 25,211 | |
Other financial results, net (2) | | | | | | | | | | | | | | | | | 47,218 | |
| Combined effects of IAS 29 and IAS 21 of the Argentine subsidiaries of Profit from operations | | | | | | | | | | | | | | | | | 15,745 | |
| Net gain from fair value adjustment of investment property | | | | | | | | | | | | | | | | | (10,680) | |
Adjusted Consolidated EBIT (unaudited)(1) | | | | | | | | | | | | | | | | | 161,562 | |
| Depreciation and amortization | | | | | | | | | | | | | | | | | 153,169 | |
Adjusted Consolidated EBITDA (unaudited)(1) | | | | | | | | | | | | | | | | | 314,731 | |
(1)See “Presentation of Financial and Other Information” for the definitions of Adjusted Segment EBIT, Adjusted Consolidated EBIT, Adjusted Segment EBITDA and Adjusted Consolidated EBITDA.
(2)Prior periods have been recast to reflect the Company's change in accounting policy for the reclassification within financial results as explained in "Description of accounting policies that changed during 2020 and 2019" Note 34.1 to our Consolidated Financial Statements.
| | | | | | | | | | | | | | | | | | | | | | | | | | | | | | | | | | | | | | | | | | | | | | | | | | | | | |
| | For the year ended December 31, 2017 |
| | Crops | | Rice | | Dairy | | All other
segment | | Farming
Subtotal | | Sugar,
Ethanol
and
Energy | | Land
Trans-
formation | | Corporate | | Total |
| | (In thousands of $) |
Adjusted Segment EBITDA
(unaudited) | | | | | | | | | | | | | | | | | |
Profit/(Loss) from
Operations Before Financing and Taxation | 24,167 | | | 8,328 | | | 11,206 | | | 4,699 | | | 48,400 | | | 102,852 | | | — | | | (21,664) | | | 129,588 | |
| Net gain from fair value adjustment of investment property | — | | | — | | | — | | | (4,302) | | | (4,302) | | | — | | | — | | | — | | | (4,302) | |
Adjusted Segment EBIT (unaudited)(1) | 24,167 | | | 8,328 | | | 11,206 | | | 397 | | | 44,098 | | | 102,852 | | | — | | | (21,664) | | | 125,286 | |
| Depreciation and amortization | 1,511 | | | 3,851 | | | 1,037 | | | 159 | | | 6,558 | | | 144,449 | | | — | | | — | | | 151,007 | |
Adjusted Segment EBITDA (unaudited)(1) | 25,678 | | | 12,179 | | | 12,243 | | | 556 | | | 50,656 | | | 247,301 | | | — | | | (21,664) | | | 276,293 | |
| Reconciliation to Profit | | | | | | | | | | | | | | | | | |
| Profit for the year | | | | | | | | | | | | | | | | | 14,975 | |
| Income tax expense | | | | | | | | | | | | | | | | | (4,992) | |
| Interest expense, net | | | | | | | | | | | | | | | | | 41,078 | |
| Foreign exchange, net | | | | | | | | | | | | | | | | | 38,708 | |
| Other financial results, net | | | | | | | | | | | | | | | | | 39,819 | |
| Net gain from fair value adjustment of investment property | | | | | | | | | | | | | | | | | (4,302) | |
Adjusted Consolidated EBIT (unaudited)(1) | | | | | | | | | | | | | | | | | 125,286 | |
| Depreciation and amortization | | | | | | | | | | | | | | | | | 151,007 | |
Adjusted Consolidated EBITDA (unaudited)(1) | | | | | | | | | | | | | | | | | 276,293 | |
(1)See “Presentation of Financial and Other Information” for the definitions of Adjusted Segment EBIT, Adjusted Consolidated EBIT, Adjusted Segment EBITDA and Adjusted Consolidated EBITDA.
| | | | | | | | | | | | | | | | | | | | | | | | | | | | | | | | | | | | | | | | | | | | | | | | | | | | | |
| | For the year ended December 31, 2016 |
| | Crops | | Rice | | Dairy | | All other
segments | | Farming
Subtotal | | Sugar,
Ethanol
and
Energy | | Land
Trans-
formation | | Corporate | | Total |
| | (In thousands of $) |
Adjusted Segment EBITDA
(unaudited) | | | | | | | | | | | | | | | | | |
Profit/(Loss) from
Operations Before Financing and Taxation | 26,093 | | | 8,932 | | | 4,753 | | | 22,942 | | | 62,720 | | | 142,835 | | | — | | | (20,957) | | | 184,598 | |
| Net gain from fair value adjustment of investment property | — | | | — | | | — | | | (14,049) | | | (14,049) | | | — | | | — | | | — | | | (14,049) | |
Adjusted Segment EBIT (unaudited)(1) | 26,093 | | | 8,932 | | | 4,753 | | | 8,893 | | | 48,671 | | | 142,835 | | | — | | | (20,957) | | | 170,549 | |
| Depreciation and amortization | 1,369 | | | 2,766 | | | 964 | | | 192 | | | 5,291 | | | 122,209 | | | — | | | — | | | 127,500 | |
Adjusted Segment EBITDA (unaudited)(1) | 27,462 | | | 11,698 | | | 5,717 | | | 9,085 | | | 53,962 | | | 265,044 | | | — | | | (20,957) | | | 298,049 | |
| Reconciliation to Profit | | | | | | | | | | | | | | | | | |
| Profit for the year | | | | | | | | | | | | | | | | | 14,276 | |
| Income tax expense | | | | | | | | | | | | | | | | | 12,899 | |
| Interest expense, net | | | | | | | | | | | | | | | | | 40,527 | |
| Foreign exchange losses, net | | | | | | | | | | | | | | | | | 19,062 | |
| Other financial results, net | | | | | | | | | | | | | | | | | 97,834 | |
| Net gain from fair value adjustment of investment property | | | | | | | | | | | | | | | | | (14,049) | |
Adjusted Consolidated EBIT (unaudited)(1) | | | | | | | | | | | | | | | | | 170,549 | |
| Depreciation and amortization | | | | | | | | | | | | | | | | | 127,500 | |
Adjusted Consolidated EBITDA (unaudited)(1) | | | | | | | | | | | | | | | | | 298,049 | |
(1)See “Presentation of Financial and Other Information” for the definitions of Adjusted Segment EBIT, Adjusted Consolidated EBIT, Adjusted Segment EBITDA and Adjusted Consolidated EBITDA.
| | | | | | | | | | | | | | | | | | | | | | | | | | | | | |
| Adjusted Free Cash Flow | 2020 | | 2019 | | 2018 | | 2017 | | 2016 |
| Net cash generated from operating activities | 257,125 | | | 322,110 | | | 218,513 | | | 237,105 | | | 255,401 | |
| Net cash used in investing activities | (121,916) | | | (249,639) | | | (175,109) | | | (188,335) | | | (122,014) | |
| Interest paid | (60,026) | | | (53,996) | | | (50,021) | | | (41,612) | | | (48,400) | |
| Lease payments | (40,336) | | | (49,081) | | | — | | | — | | | — | |
| Reversal of Expansion Capital expenditures (unaudited) | 56,719 | | | 129,074 | | | 98,011 | | | 70,804 | | | 48,295 | |
| IAS 29 & IAS 21 effect for operating Activities | 14,956 | | | (23,550) | | | (7,598) | | | — | | | — | |
| IAS 29 & IAS 21 effect for investing Activities | 429 | | | (2,922) | | | (3,935) | | | — | | | — | |
| IAS 29 & IAS 21 effect for Interest Paid | 1,639 | | | (4,408) | | | — | | | — | | | — | |
| Adjusted Free Cash Flow from Operations (unaudited) | 108,590 | | | 67,588 | | | 79,861 | | | 77,962 | | | 133,282 | |
| Expansion Capital expenditures (unaudited) | (56,719) | | | (129,074) | | | (98,011) | | | (70,804) | | | (48,295) | |
| Adjusted Free Cash Flow (unaudited) | 51,871 | | | (61,486) | | | (18,150) | | | 7,158 | | | 84,987 | |
| | | | | | | | | | | | | | | | | | | | | | | | | | | | | |
| Indebtedness | 2020 | | 2019 | | 2018 | | 2017 | | 2016 |
| Net Debt (unaudited) | 634,808 | | | 678,004 | | | 588,481 | | | 548,763 | | | 476,828 | |
| Net Debt / Adjusted Consolidated EBITDA (unaudited) | 1.86 x | | 2.22 x | | 1.87 | x | | 1.98 | x | | 1.60 | x |
| | | | | | | | | | | | | | | | | | | | | | | | | | | | | |
| Reconciliation - Net Debt | 2020 | | 2019 | | 2018 | | 2017 | | 2016 |
| Total Borrowings | 971,090 | | | 968,280 | | | 862,116 | | | 817,958 | | | 635,396 | |
| Cash and cash equivalents | (336,282) | | | (290,276) | | | (273,635) | | | (269,195) | | | (158,568) | |
| Net Debt (unaudited) | 634,808 | | | 678,004 | | | 588,481 | | | 548,763 | | | 476,828 | |
Reconciliation of Adjusted Free Cash Flow to Net increase/(decrease) in Cash and Cash Equivalents
| | | | | | | | | | | | | | | | | | | | | | | | | | | | | |
| | 2020 | | 2019 | | 2018 | | 2017 | | 2016 |
| Net increase/(decrease) in cash and cash equivalents | 81,290 | | | 34,608 | | | 22,550 | | | 118,964 | | | (48,295) | |
| Interest Paid | (60,026) | | | (53,996) | | | (50,021) | | | (41,612) | | | (48,400) | |
| Lease Payments | (40,336) | | | (49,081) | | | — | | | — | | | — | |
| Net cash generated from financing activities | 53,919 | | | 37,863 | | | 20,854 | | | (70,194) | | | 181,682 | |
| IAS 29 & IAS 21 effect for operating activities | 14,956 | | | (23,550) | | | (7,598) | | | — | | | — | |
| IAS 29 & IAS 21 effect for investing activities | 429 | | | (2,922) | | | (3,935) | | | — | | | — | |
| IAS 29 & IAS 21 effect for interest paid | 1,639 | | | (4,408) | | | — | | | — | | | — | |
| Adjusted Free Cash Flow (unaudited) | 51,871 | | | (61,486) | | | (18,150) | | | 7,158 | | | 84,987 | |
Reconciliation of Adjusted Free Cash Flow from operations to Net increase/(decrease) in Cash and Cash Equivalents
| | | | | | | | | | | | | | | | | | | | | | | | | | | | | |
| | 2020 | | 2019 | | 2018 | | 2017 | | 2016 |
| Net increase/(decrease) in cash and cash equivalents | 81,290 | | | 34,608 | | | 22,550 | | | 118,964 | | | (48,295) | |
| Expansion Capital Expenditures (unaudited) | 56,719 | | | 129,074 | | | 98,011 | | | 71,891 | | | 48,295 | |
| Interest Paid | (60,026) | | | (53,996) | | | (50,021) | | | (41,612) | | | (48,400) | |
| Lease payments | (40,336) | | | (49,081) | | | — | | | — | | | — | |
| Net cash used / (generated) from financing activities | 53,919 | | | 37,863 | | | 20,854 | | | (70,194) | | | 181,682 | |
| IAS 29 & IAS 21 effect for operating activities | 14,956 | | | (23,550) | | | (7,598) | | | — | | | — | |
| IAS 29 & IAS 21 effect for investing activities | 429 | | | (2,922) | | | (3,935) | | | — | | | — | |
| IAS 29 & IAS 21 effect for interest paid | 1,639 | | | (4,408) | | | — | | | — | | | — | |
| Adjusted Free Cash Flow from operations (unaudited) | 108,590 | | | 67,588 | | | 79,861 | | | 79,049 | | | 133,282 | |
B. CAPITALIZATION AND INDEBTEDNESS
Not Applicable.
C. REASONS FOR THE OFFER AND USE OF PROCEEDS
Not Applicable.
D. RISK FACTORS
Investing in our common shares involves a high degree of risk. Before making an investment decision, you should carefully consider the information contained in this annual report, particularly the risks described below, as well as in our Consolidated Financial Statements and accompanying notes. Our business activities, cash flow, financial condition and results of operations could be materially and adversely affected by any of the risks and uncertainties mentioned below. The market price of our common shares may decrease due to any of these risks or other factors, and you may lose all or part of your investment. The risks and uncertainties not presently known to us or that we currently deem immaterial may also affect our business operations.
For purposes of this section, the indication that a risk, uncertainty or problem may or will have a “material adverse effect on us” or that we may experience a “material adverse effect” means that the risk, uncertainty or problem could have a material adverse effect on our business, financial condition or results of operations and/or the market price of our common shares, except as otherwise indicated or as the context may otherwise require. Investors should view similar expressions in this section as having a similar meaning.
Summary of Risk Factors
The risks facing us and our business are many and varied. Set forth below is a summary of the risk factors more fully described herein.
The risks related to our business and industries include risks related to:the following:
• health epidemics, and the COVID-19 in particular, that could adversely impact our ability to operate our business and results of operations;
• unpredictableUnpredictable weather conditions, including as a result of climate change, pest infestations and diseases that may have an adverse impact on agricultural production;production.
• fluctuationsFluctuations in market prices for our products that could adversely affect our financial condition and results of operations;operations.
• the relationship between the price of ethanol and sugarEthanol prices are correlated to the price of oil,sugar and are also closely correlated to the price of petroleum, so that a decline in the price of sugar or a decline in the price of oilpetroleum will adversely affect our sugar and ethanol businesses;businesses.
• theThe expansion of our business through acquisitions which poses risks that may reduce the benefits we anticipate from these transactions;transactions.
• increasesA significant increase in the price of raw materials we use in our operations, or the shortage of such raw materials, that could adversely affect our results of operations;operations.
• increasesWe cannot guarantee that our suppliers will not engage in improper practices, including inappropriate labor or manufacturing practices.
•Increased fuel and energy prices and frequent interruptions of energy supply that could adversely affect our business;business.
• our dependenceOur business may be materially and adversely affected by the emergence of epidemics or pandemics, such as COVID 19.
•We depend on stable international trade and economic and other conditions in key export markets for our products;products.
• aA worldwide economic downturn that could weaken demand for our products or lower prices;prices.
• the seasonality of ourOur business is seasonal and our results which may fluctuate significantly depending on the growing cycle of our crops;crops.
• potential diseases to our dairy cattle;
•We face significant competition from Brazilian and foreign producers,across our business segments, which could adversely affect our financial performance;performance.
• ourOur current insurance coverage which may not be sufficient to cover our potential losses;losses.
• a reduction in market demand for ethanol or a change in governmentalCybersecurity incidents, including attacks on the infrastructure necessary to maintain our IT systems, may adversely affect us.
•Governmental policies reducing the amount of ethanol required to be added to gasoline, whichor eliminating tax incentives for flex-fuel vehicles, may adversely affect our business;business.
• competition from alternative fuels, productsGrowth in the sale and production methods;distribution of ethanol depends in part on infrastructure improvements, which may not occur on a timely basis, if at all.
• the lack of liquidity of aA substantial portion of our assets constituted by farmland;is farmland that is highly illiquid.
• theWe have entered into agriculture partnership agreements in respect of a significant portion of our sugarcane plantationsplantations.
•Our performance depends on favorable working relationships with our employees and associated risks;
•compliance with labor disputes from time to time that maylaws. Any strain on these relationships or increased labor costs could adversely affect us;our business.
• a failure toWe may not possess all of the permits and licenses required to operate our business, or failurewe may fail to renew or maintain the licenses and permits we currently hold;
• extensive environmental regulation, and concerns regarding climate change that mayhold which could subject us to even stricter environmental regulations;fines and other penalties.
•Our business is subject to significant governmental regulation, which may adversely affect our results of operations and financial condition.
•Climate change may impose increased costs on our operations.
•Some of the agricultural commodities and food products that we produce that contain genetically modified organisms ("GMO");organisms.
• increased regulation of food safety that could increase our costsWe may face restrictions and adversely affectpenalties under consumer protection laws.
•IFRS requires us to measure our results of operations;
• IFRS accounting standards related to biological assets that require us to make numerous estimates in the preparation of our financial statementsat fair value and therefore limit the comparability of our financial statements to similar issuers using U.S. GAAP;applying US GAAP.
• our substantialOur indebtedness which could impair theirour financial condition and decrease the amountimpair our ability to receive or pay out dividends.
•The terms of dividends we receive;our indebtedness and that of certain of our subsidiaries impose significant restrictions on our operating and financial flexibility.
• fluctuationsFluctuations in interest rates that could have a significant impact on our results of operations, indebtedness and cash flow;flow.
• our failure toWe may need additional capital and we may not be able to renew our credit lines when they mature, depriving us of needed liquidity;obtain it.
• theThere is a risk that we could be treated as a U.S. domestic corporation for U.S. federal income tax purposes, which could materially increase our U.S. federal income tax liability and subject any dividends we pay to U.S. federal withholding tax;tax.
• the risk that eeWe may be classified by the IRS as a “passive foreign investment company” (a “PFIC”),company,” which may result in adverse tax consequences for U.S. investors; andinvestors in our common shares.
•We are subject to anti-corruption, anti-bribery, anti-money laundering and other international trade laws and regulations.
•Technological advances or alternative products may affect demand for our products and services or require substantial capital investments to remain competitive.
•Security breaches and other disruptions could compromise our technology infrastructure and information and expose us to processes disruption and liability, which would cause our business and reputation to suffer.
•We depend on our information technology systems and any failure of these systems could adversely affect our business.
•Noncompliance with data protection laws could adversely affect our business.
•Our operations are subject to disruptions by third parties who interfere with the possession of our real estate or our means of production.
We also confrontface risks associated with the countries in which we operate, primarily in Argentina and Brazil, which include risks related to:the following:
• operatingEconomic and political conditions in emergingthe countries in which we operate, and the perception of these conditions in international markets, which makesmay adversely impact our business, our access to capital and debt markets, and our results of operations and financial condition dependent upon economic conditions in those countries in which we operate with any decline in economic conditions potentially harming our results of operations or financial condition;condition.
• theThe economies of the countries in which we operate which may be adversely affected by the deterioration of other global markets;markets.
• the governmentsGovernments have a high degree of influence in the economies in which we operate, have a high degree of influence, which could adversely affect our results of operations or financial condition;condition.
• currencyCurrency exchange rate fluctuations relative to the U.S. dollar in the countries in which we operate;operate our businesses may adversely impact our results of operations and financial condition.
• inflationInflation in some of the countries in which we operate, along with governmental measures to curb inflation, which may have a significant negative effect on the economies of those countries and, as a result, on our financial condition and results of operations;operations.
•Any deterioration in Brazil’s or our credit rating may adversely affect the impact of inflation on our operating costs in Argentina, which are denominated in Argentine Pesos and mosttrading price of our operating costs in Brazil, which denominated in Brazilian Reais;common shares and us.
• disruptionDisruption of transportation and logistics services, insufficient investment in public infrastructure or disruption to any aspect of the supply chain which could adversely affect our operating results;results.
• security breaches and other disruptions that could compromise our technology infrastructure and information and expose us to processes disruption and liability, which would cause our business and reputation to suffer;
• failure to comply with data protection laws which could adversely affect our business;
• the measures taken or toThe Argentine economy may be implementedaffected by the Argentine government in response to the COVID-19 pandemic, which may have an adverse effect on our business and operations;
• Argentine economic and political conditions and perceptions of these conditions in the international market that may have a direct impact on our business and our access to international capital and debt markets, and could adversely affect our results of operations and financial condition;
• continuing inflation, increase of unemployment, decline in GDP, peso depreciation, and/or other future economic, social and political developments in Argentina, over which we have no control, that may adversely affect our financial condition or results of operations;
• the impact of the Argentine congressional and presidential elections on the future economic and political environment of Argentina;
• the economy of Argentina and theits government’s limited access to financing from international markets and the result of any failure to pay its debt obligationsobligations.
•Argentina’s current account and balance of payment imbalances could lead to a depreciation of the current debt restructuring process;Peso, and as a result, affect our results of operations, our capital expenditure program and our ability to service our foreign currency liabilities.
11•Failure to adequately address actual and perceived risks of institutional corruption may adversely affect the economy and financial condition of the emerging markets in which we operate.
• high and possibly increasing inflation in Argentina and uncertainty surrounding future inflation rates may have an adverse impact for Argentina in the long-term credit market;
• government intervention in Argentina which may have a direct impactLaws on our prices and sales;
• salary increases ordered by the Argentine government to be paid to employees in the private sector, or imposed additional charges, which would increase our operating costs;
• Argentine law concerning foreign ownership of rural properties which may adversely affect our results of operations and future investments in rural properties in Argentina;properties.
•An increase in export and import duties and controls which may have an adverse impact on our sales;sales.
• exchangeExchange controls that restrict the inflow and outflow of funds in Argentina and may substantially limit the our ability of companies to retain or obtain foreign currency or make payments abroad;abroad.
• scangesChanges in the Argentine tax laws, that may adversely affect the results of our operations, financial conditionincentives, benefits and cash flows;
• measures taken or to be implemented by the Brazilian government in response to the COVID-19 pandemic that may cause adverse effect on our business and operations;
• Brazilian economic and political conditions and perceptions of these conditions in international markets that may have a direct impact on our business and our access to international capital and debt markets, which could adversely affect our results of operations and financial condition;
• changes in Brazilian tax laws thatregulations may have a material adverse impact on the taxes applicable to our business and may increase our tax burden;
• widespread corruption and fraud relating to ownership of real estate that may adversely affect our business, especially our land transformation business;
• social movements and the possibility of expropriation and constitution of public easement that may affect the normal use of, damage, or deprive us of the use of or fair value of, our properties;
• Brazilian rules concerning foreign investment in rural properties that may adversely affect our investments;
• The Brazilian government’s significant influence over the Brazilian economy, which, combined with Brazilian political and economic conditions, may adversely affect us;
• allegations of political corruption against the Brazilian government and the Brazilian legislative branch that could create economic and political instability;
• restrictions on the movement of capital out of Brazil that may impair our ability to receive payments from our Brazilian Subsidiaries and restrict their ability to make payments in U.S. dollars; and
• the impact of governmental regulation in Brazil.burden.
As a Luxembourg corporation (“société anonyme”) we and our common shares are also exposed to risks that relate to:include the following:
•difficultyWe are a Luxembourg corporation (“société anonyme”) and it may be difficult for our shareholdersyou to obtain or enforce judgments against us or our executive officers and directors in the United States;States.
• difficulty for ourOur shareholders inmay have more difficulty protecting their interests than they would as shareholders of a U.S. corporation;corporation, which could adversely impact trading in our common shares and our ability to conduct equity financings.
•Luxembourg and European Union insolvency and bankruptcy laws and regulations which are substantially different from U.S. insolvency laws and may offer our shareholders less protection than they would have under U.S. insolvency and bankruptcy laws;laws.
•Our ability to pay dividends is restricted under Luxembourg law.
•We are a holding company and depend on the inabilityability of shareholdersour subsidiaries to participatedistribute funds to us in equity offerings,order to satisfy our financial obligations and failure to receive any value for rights that wemake dividend payments, which they may grant;not be able to do.
Risks Related to Our Business and Industries
We may be exposed to risks related to health epidemics, and the COVID-19 in particular, that could adversely impact our ability to operate our business and results of operations.
The global impact of the COVID-19 outbreak and measures taken to reduce the spread of the virus have had an adverse effect on the global macroeconomic environment and may continue to create continued economic uncertainty and reduced economic activity. The outbreak has resulted in authorities implementing numerous measures to try to contain the virus, such as travel bans and restrictions, quarantines, shelter-in-place or total lock-down orders and business limitations and shutdowns.
Governments around the globe have taken steps to mitigate some of the more severe economic effects of the virus, but there can be no assurance that such steps will be effective or achieve their desired results in a timely fashion or at all. The speed and extent of the spread of COVID-19, and the duration and intensity of resulting business disruption and related financial and social impact, are still uncertain, and such adverse effects on our business and financial position may still be material.
In the first six months of 2020, our Sugar, Ethanol and Energy business, experienced a decrease in prices of ethanol due to the decrease in international oil prices, and a decrease in demand as a consequence of the reduced circulation of people in response to the pandemic. In light of these factors, we slowed down our crushing pace, implemented a cost reduction plan and maintained the workforce sized to our operational needs. As signs of a partial recovery started to emerge, we revamped our operations and accelerated our crushing pace during the second semester, more than offsetting the lower initial crushing.
The Company could be negatively affected if a significant number of personnel including management and personnel at its farming and industrial operations are infected with the COVID-19 virus and/or its variants or are quarantined as the result of, or in order to avoid, exposure to the virus. During 2020, a select number of our personnel at one of our peanut production plants were infected with the COVID-19 virus but our operations were not affected. Similarly a limited number of other personnel throughout the organization were infected with the COVID-19 virus without materially impacting our operations. While governmental agencies and private sector participants are seeking to mitigate the adverse effects of this coronavirus, including measures such as heightened sanitary practices, telecommuting, quarantine, curtailment or cessation of travel, and other restrictions, and the medical community is developing and administering vaccines and other treatment options, the timing and efficacy of such measures is uncertain. These and other responses could impact the ability to harvest, produce and market our products, the availability of those who make the decision to purchase our products and the ultimate demand for our products.
Commodity markets have been and may also be disrupted with attendant effects on demand for some of our products. For example, the Chinese market is a significant source of global demand for the commodities we sell, including soy and corn, and a reduction in demand from China may have a significant effect on commodity prices and demand and potentially broader impacts on our supply chain or the global economy.
Further, the ongoing COVID-19 pandemic, including the spread of virus variants, and any possible future outbreaks of viruses may have a significant adverse effect on us. Firstly, a spread of such diseases amongst our employees, as well as any quarantines affecting them or our facilities could adversely impact the productivity of our personnel and thereby affect our operations, which can impact the quality and continuity of our activities and our reputation. Secondly, the current COVID-19 pandemic and any possible future outbreaks of viruses may have an adverse effect on our suppliers and/or transportation companies used to distribute our products. Thirdly, any quarantines or spread of viruses may adversely affect the demand of our products from end-consumers.
Additionally, our operations may be adversely affected by the wider macroeconomic effect of the ongoing COVID-19 pandemic. Currently, the prospects for diminished economic growth may continue resulting in a recession or diminishing growth in several countries, including Argentina and Brazil, due to the reduction of the economic activities. The final effects of the COVID-19 pandemic could have substantial negative impact on the countries where we operate. Any negative effect on the economy, particularly in the countries that we operate, may decrease incomes and the demand for our products. Lastly, in case of an economic downturn, the price of our common shares may be adversely affected.
We are not now able to determine fully the extent to which COVID-19 will impact our business activity or financial results, which will depend on future developments that are highly uncertain and cannot be predicted fully (see “—Risks Related to Argentina-The measures taken or to be implemented by the Argentine government in response to the COVID-19 pandemic may cause adverse effect on our business and operations” and "— Risks Related to Brazil — The measures taken or to be implemented by the Brazilian government in response to the COVID-19 pandemic may cause adverse effect on our business and operations-").
Unpredictable weather conditions, including as a result of climate change, pest infestations and diseases may have an adverse impact on agricultural production.
The occurrence of severe adverseSevere weather or environmental conditions, especiallyin particular, droughts, hail, floods, or frost or diseasespestilence, are unpredictable and may have a potentially devastatingsignificant adverse impact on agricultural production and may otherwise adversely affect the supply and price of the agricultural commodities that we sell and use in our business. AdverseMoreover, adverse weather conditions may be exacerbated by the effects of climate change which impactsimpact the entirety of our business and policies.
The effects of severe adverse weather conditions See “—Climate change may reduce yields ofimpose increased costs on our agricultural activities.operations.” Additionally, higher than average temperatures and rainfall can contribute to an increased presence of pest and insects thatpestilence, which may adversely impact our agricultural production. Furthermore, the potential physical impacts of climate change are uncertain and may vary by region, which includes changes in rainfall patterns, water shortages, changing sea levels and changing temperature levels that could adversely impact our business operations, the location, costs and competitiveness of global agricultural production and related storage and processing facilities. During April and November 2019 we suffered from a drought in Mato Grosso do Sul, which led to a significant decrease in sugarcane yields for the year and reduced profit from operations by about $49.5 million. In 2020,
from March to October, we suffered a drought in Minas Gerais (Usina Monte Alegre – “UMA”), which led to a significant decrease in sugarcane yields, that reduced UMA’s milling by approximately 120 thousand tons of sugar cane and decreased the operating profit by about $5.1 million. This drought will also have a negative impact on 2021 sugarcane yields in UMA. Yields may also be affected by plagues, diseases or weed infections and related operational problems. See “Item 5.Operating and Financial Review and Prospects — Trends and Factors Affecting Our Results of Operations — (i) Effects of Yield Fluctuations”.
The occurrence and effects of disease and plagues can be unpredictable and devastating to agricultural products, potentially rendering all or a substantial portion of the affected harvest unsuitable for sale. Our agricultural products are also susceptible to fungus and bacteria that are associated with excessively moist conditions. Our results of operations could be adversely affected in such cases where our production is materially affected and all or a substantial portion of the production costs have been incurred. We cannot assure you that such events in the future will not adversely affect our operating results and financial condition. Furthermore, if we fail to control a given plague or disease and our production is threatened, we may be unable to supply our main customers, which could affect our results of operations and financial condition.
Our sugar production depends on the volume and sucrose content of the sugarcane that we cultivate or that is supplied to us by growers located in the vicinity of our mills. Both sugarcane yields and sucrose content depend primarily on weather conditions such as rainfall and temperature, which can vary. Weather conditions have historically caused volatility in the ethanol and sugar industries. Future weather patterns may reduce the amount of sugarcane that we can harvest or purchase, or the sucrose content in such sugarcane, and, consequently, the amount of sugar and ethanol we can produce in any given harvest. Any reduction in production volumes could have a material adverse effect on our operating results of operations and financial condition.
AsIn 2022, South America suffered a result, we cannot assure youthird consecutive year of drier weather during spring and summer times, commonly known as a “La Niña” year. While South America experienced a strong year of heavier rains during the spring and summer times of 2023, commonly known as an “El Niño” year, there can be no assurance that future severe adverse weather conditions including aswill be normalized or that such year will not be followed by a result“La Niña” year. Although we are diversified in terms of climate change,crops and geographical regions, our 2022/2023 were negatively impacted reflected in lower yields.
Similarly, the occurrence and effects of disease and pestilence can be unpredictable and devastating to agricultural products, potentially rendering all or pest infestationsa substantial portion of the affected harvest unsuitable for sale. Our agricultural products are also susceptible to fungi and bacteria that are associated with excessively moist conditions. Our results of operations could be adversely affected in such cases where our production is materially affected and all or a substantial portion of the production costs have been incurred. There can be no assurance that such events in the future will not adversely affect our operating results and financial condition. Furthermore, if we fail to control pestilence or disease and our production is threatened, we may be unable to supply our main customers, which could affect our results of operations and financial condition.
In addition, disease among our dairy cattle herd, such as mastitis, tuberculosis, brucellosis and foot-and-mouth disease, could have an adverse effect on productivity. Outbreaks of cattle diseases may also result in the closure of certain important markets to our cattle-derived products. There can be no assurance that future outbreaks will not occur. A future outbreak of diseases among our cattle herds could adversely affect our milk sales and operating results and financial condition. Furthermore, outbreaks, or fears of outbreaks, of any of these or other animal diseases may lead to the cancellation of orders by our customers, in particular if the disease has the potential to affect human health or create adverse publicity that may have a material adverse effect on consumer demand for our products. Moreover, outbreaks of animal disease may lead foreign
governments to ban the importation of some or all of our products, which may result in the destruction of some or all of these animals.
Fluctuations in market prices for our products could adversely affect our financial condition and results of operations.
Prices for agricultural products and by-products, including, among other things,others, sugar, ethanol, grains and grains, like those of other commodities,powder milk, have historically been cyclical and sensitive to domestic and international changes in supply and demand and can be expected to fluctuate significantly. In addition, the agricultural products and by-products we produce are traded on commodities and futures exchanges and thus are subject to speculative trading, which may adversely affect us. The prices that we are able to obtain for our agricultural products and by-products depend on many factors beyond our control including:
•prevailing world commodity prices, which historically have been subject to significant fluctuations over relatively short periods of time, depending on worldwide demand and supply;
•changes in the agricultural subsidy levels of certain important producers (mainly the U.S. and the European Union, (“E.U.or the “E.U.,”) and the adoption of other government policies affecting industry market conditions and prices;
•changes to trade barriers of certain important consumer markets (including China, India, the U.S. and the E.U.) and the adoption of other governmental policies affecting industry market conditions and prices;
•changes in government policies for biofuels;
•disruptions in commodity markets caused by global events, including the impact of the COVID-19 pandemic;pandemic and the ongoing war between Russia and Ukraine;
•world inventory levels, i.e., the supply of commodities carried over from year to year;
•climatic conditions and natural disasters in areas where agricultural products are cultivated;
•the production capacity of our competitors; and
•demand for and supply of competing commodities and substitutes.
Further, because we may not hedge 100% of the price risk of our agricultural products, we may beare unable to have minimum price guarantees for all of our production and are, therefore, exposed to risks associated with the prices of agricultural products and their volatility. WeAs a result, we are subject to fluctuations in prices of agricultural products that could result in our receiving lower prices for our agricultural products than our production costs.
The rapid and widening spread of the COVID-19 is impacting the price of the products we sell (i.e., ethanol, corn, powder milk among others) due to the lower demand and economic activity worldwide. As anFor example, during the month of March 2021,in 2023 sugar prices in USD decreased by 8.8%U.S. dollars increased 27.9% according to ICE-NY,the International Exchange - New York, or “ICE NY”, anhydrous and hydrous ethanol prices ins BRLin Brazilian Reais decreased by 25%18.6% and 26%18.8%, respectively according to ESALQ and cornthe center for Advanced Studies on Applied Economics (Centro de Estudos Avançados em Economia Aplicada (CEPEA/ESALQ)). The increase in international sugar prices was influenced by steadily rising estimates of sugar production in USD decreased by 4.6% based on CBOT. GivenIndia. However, Sugar prices have remained volatile since the uncertainty around the extent and timingcommencement of the COVID-19 pandemic we cannot predict or assesconflict in Ukraine.
Also, domestic prices of electricity exported to the final impactgrid, in particular, electricity produced by hydroelectric generators, are impacted by weather conditions. For example, according to the Chamber of Electric Energy Commercialization of Brazil (Câmara de Comercialização de Energia Elétrica - CCEE ) is expected to average its regulatory minimum of 61.1 R$/MWh in 2024. In 2023, the pandemic. (See "— We may be exposedaverage energy spot price (PLD) was 69.0 R$/MWh, 17% lower compared to risks related to health epidemics,2022 (59.0 R$/MWh), and the COVID-19forecasted energy price for 2024 is 61.0 R$/MWh, 12% lower than in particular, that could adversely impact our ability to operate our business and operating results”).2023.
In addition,Moreover, there is a strong relationship between the value of our land holdings and market prices of the commodities we produce, which are affected by global economic conditions. A decline in the prices of grains, sugar, ethanol, or related by-products below their current levels for a sustained period of time could significantly reduce the value of our land holdings and materially and adversely affect our financial condition and results of operations.
Ethanol prices are correlated to the price of sugar and are also closely correlated to the price of oil,petroleum, so that a decline in the price of sugar or a decline in the price of oilpetroleum will adversely affect our sugar and ethanol businesses.
AThe vast majority of ethanol in Brazil is produced at sugarcane mills that produce both ethanol and sugar. Because sugarcane millers are able to alter their product mix in response to the relative prices of ethanol and sugar, the prices of both products are directly correlated, and the correlation between ethanol and sugar prices may increase over time. Sugar prices in Brazil are determined by prices in the world market, resulting in a correlation between Brazilian ethanol prices and world sugar prices. Accordingly, a decline in sugar prices would have an adverse effect on the financial performance of our ethanol and sugar businesses.
In addition, gasoline prices in Brazil are set by the Brazilian government through Petrobras. Because
Moreover, because flex-fuel vehicles which have become popular in Brazil, allow consumers to choose between gasoline and ethanol at the pump rather than inat the showroom, ethanol prices are correlated to gasoline prices as well and, consequently, international oil prices. The COVID-19 pandemic had an impact atIn Brazil, petroleum and petroleum derivatives have historically been subject to price controls. Currently there is no legislation or regulation in force that gives the inception . See "We may be exposedBrazilian government the power to risks relatedset prices for petroleum, petroleum products, ethanol or vehicular natural gas. However, given that Petróleo Brasileiro S.A. – Petrobras, the only supplier of oil-based fuels in Brazil, is a government-controlled company, prices of petroleum and petroleum products are subject to health epidemics,government influence, resulting in potential inconsistencies between international prices and the COVID-19 in particular,prevailing prices within Brazil that could adversely impact our ability to operateaffect our business and results of operations."our financial results.
While we are not now able to fully determine the impact of fluctuation. A decline in oil prices to our operations, weWe believe that the correlation between petroleum, ethanol and sugar prices will increase over time. Accordingly, a decline in oilsugar prices or a decision by Petrobras to lower fuel prices and its attendant effects on the price of ethanol and sugar will have an adverse effect on the financial performance of our ethanol and sugar business.businesses, and a decline in petroleum prices could make ethanol less competitive and reduce demand, despite increased sales of flex-fuel vehicles, affecting our results and financial condition, including cash flows. Finally, a decrease in gasoline prices could make ethanol less competitive and result in a reduction in demand even if demand for flex-fuel vehicles were to increase, which could adversely affect our financial condition and results of operations.
The expansion of our business through acquisitions poses risks that may reduce the benefits we anticipate from these transactions.
As part of our business strategy, we have grown through acquisitions. We plan to continue growing by acquiring other farms and production facilities throughout South America. We believe that the agricultural industry and agricultural activity in the region are highly fragmented and that our future consolidation opportunities will continue to be significant to our growth. However, our management is unable to predict whether or when any prospective acquisitions or strategic alliances will occur, or if such acquisitions or strategic alliances will be agreed upon on favorable terms and conditions. Our ability to continue to expand our business successfully through acquisitions and strategic alliances depends on many factors, including our ability to identify potential acquisitions, access financing sources, including through capital markets, at acceptable conditions, negotiate favorable transaction terms and successfully consummate and integrate any businesses we acquire.
To support the acquisitions we pursue, we may need to implement new or upgraded strategies, systems, procedures and controls for our operations and will face risks, including diversion of management time and focus and challenges associated with integrating new managers and employees. We may be unable to realize synergies and efficiency gains from acquisitions or to identify, negotiate or finance future acquisitions, particularly as part of our international growth strategy, successfully or at favorable valuations, or to effectively integrate these acquisitions or strategic alliances with our current businesses. Our failure to integrate new businesses or manage any new alliances successfully could adversely affect our business and financial performance.
Any future strategic alliances or acquisitions of businesses, technologies, services or products might require us to obtain additional equity or debt financing, which may not be available on favorable terms, or at all, and may result in unforeseen operating difficulties and expenditures, as well as strain on our organizational culture, especially if an acquisition is followed by a period of lower than projected prices for our products. Future acquisitions and joint ventures may be subject to antitrust and other regulatory approvals, which may not be obtained on a timely basis or at all.
Acquisitions also expose us to the risk of successor liability relating to actions involving an acquired company, its management or contingent liabilities incurred before the acquisition. The due diligence we conduct in connection with an acquisition, and any contractual guarantees or indemnities that we receive from the sellers of acquired companies, may not be sufficient to protect us from, or compensate us for, actual liabilities. Any material liability associated with an acquisition could adversely affect our reputation and results of operations and reduce the benefits of the acquisition.
In addition,
Finally, we are unable to predict the effect that changes in Argentine or Brazilian legislation regarding foreign ownership of rural properties could have in our business. (See “ — See “—Risks Related to Argentina-Argentine law concerning
the Countries in Which We Operate—Laws on the foreign ownership of rural properties may adversely affect our results of operations and future investments in rural properties in Argentina” and “—Risks Related to Brazil—Changes in Brazilian rules concerning foreign investment in rural properties may adversely affect our investments.properties.”)
A significant increase in the price of raw materials we use in our operations, or the shortage of such raw materials, could adversely affect our results of operations.
Our production process requires various raw materials, including primarily fertilizer, pesticidesin particular fertilizers, phytosanitary products and seeds, which we acquire from local and international suppliers. We do not have long-term supply contracts for most of these raw materials. A significant increase in the cost of these raw materials, especially fertilizer and agrochemicals, a shortage of raw
materials or the unavailability of these raw materials entirelyin their entirety could reduce our profit margin, reduce our production and/or interrupt the production of some of our products, in all cases adversely affecting theour results of our operations and our financial condition.
For example, we rely on fertilizers and agrochemicals, many of which are petrochemical based. In our Farming business, fertilizers and agrochemicals represented approximately 17%15.9% of our total cost of production (including manufacturing and administrative expenses) for the 2019/2020 harvest year.2022/2023 harvest-year. In our Sugar, Ethanol and Energy business, fertilizers and agrochemicals represented 16.7%20.9% of our cost of production (including manufacturing and administrative expenses) for 2019during 2021, 19.6% in 2022 and 17.1% for 2020.19.7% in 2023. Worldwide production of agricultural products has increased significantly in recent years increasing thein response to increased demand for agrochemicals and fertilizers. This has resulted, among other things,However, shortages in increased prices forthe supply of agrochemicals and fertilizers.fertilizers remain, which has been aggravated by the ongoing war between Russia and Ukraine. See “—We may be adversely affected by the ongoing armed conflict between Russia and Ukraine”.
We cannot guarantee that our suppliers will not engage in improper practices, including inappropriate labor or manufacturing practices.
We cannot guarantee that our suppliers’ business operations comply with all applicable laws and regulations relating to working conditions, sustainability, production chain assurance and appropriate safety conditions, or that they will not carry out improper practices relating to such matters to reduce the cost of the products they sell to us. In the event that our suppliers engage in such improper business practices, our customers’ perception of our business may be adversely affected, which may adversely affect our business, results of operations and our reputation.
Moreover, considering Brazilian law and judicial precedent, we may be involved in litigation concerning our suppliers’ inappropriate labor practices, as labor authorities may argue that we failed to adequately supervise our supply chain. This risk is particularly relevant if these suppliers are involved in sensitive labor issues, such as child labor and the direct or indirect use of forced labor or modern slavery. Any such litigation could impact our customers’ perception of our business, and adverse decisions may compel us to disburse material amounts in connection therewith, which may adversely affect our business, results of operations and our reputation
Increased fuel and energy prices and frequent interruptions of energy supply could adversely affect our business.
We require substantial amounts of fuel oil and other resources for our harvest activities and transport of our agricultural products. During both the 2019/20 harvest year,2022/2023 and 2021/2022 harvest-years, fuel represented 3.2%2.7% and 4.5% respectively, of the cost of production (including manufacturing and administrative expenses) of our Farming business. In our Sugar, Ethanol and Energy business, fuel represented 9.3%11.0% and 12.8% of our cost of production (including manufacturing and administrative expenses) for the 2020/21 harvest yearin 2023 and 10.2% for the 2019/2020 harvest year. 2022, respectively.
We rely upon third parties for our supply of energy resources used in our operations. The prices for and availability of energy resources may be subject to change or curtailment, respectively, due to, among other things,inter alia, new laws or regulations, the imposition of new taxes or tariffs, interruptions in production by suppliers, the imposition of restrictions on energy supply by government, and worldwide price levels and market conditions. OverIn addition, our contracts for the purchase and sale of energy in the free market may contain flexibilities according to which counterparties may also reduce the amounts of contracted energy, within certain limits. Any of these events could affect our revenues if we are unable to sell the reduced volumes at the same price or due to the excess energy that we fail to sell. In addition, in the event of an energy shortage, the government may impose rationing obligations that could affect the volumes established in our contracts, consequently affecting our revenues.
Moreover, over the last few years, the Argentine government has taken certain measures in order to reduce the use of energy during peak months of the year by frequently cutting energy supply to industrial facilities and large consumers to ensure adequate supply for residential buildings. For example, certain of our industrial facilities have been subject to a quota system whereby electricity cuts occur on a work shiftwork-shift basis, resulting in our facilities being shut down during certain work shifts. We cannot assure youBrazil has also been subject to electricity rationing measures as a result of droughts in recent years. There can be no assurance that we will be able to procure the required energy inputs at acceptable prices. If energy supply is cut for an extended period of time and we are unable to find replacement sources at comparable prices, or at all, our business and results of operations could be adversely affected.
Our business may be materially and adversely affected by the emergence of epidemics or pandemics, such as COVID 19.
Epidemics and pandemics caused by infectious agents, such as the COVID -19 pandemic, can impact the health of our workforce, partners and suppliers, as well as necessitate the redesign of routines, procedures and organization of work in
general, and may consequently affect the continuity of various activities and our productivity. In addition, such public health events may affect commodity prices and demand, which, consequently, may negatively impact our results and financial condition.
We depend on stable international trade and economic and other conditions in key export markets for our products.
Our operating results depend largely on economic conditions and regulatory policies for our products in major export markets. The ability of our products to compete effectively in these export markets may be adversely affected by a number of factors that are beyond our control, including the deterioration of macroeconomic conditions, volatility of exchange rates, the imposition of greater tariffs or protectionist policies or other trade barriers or other factors in those markets, such as regulations relating to chemical content of products and safety requirements. The European Union,EU, for example, limits the import of genetically modified organisms, or “GMOs.” See “—Some of the agricultural commodities and food products that we produce contain genetically modified organisms.”
Due to the growing participation in the worldwide agricultural commodities markets by commodities produced in South America, South American growers,producers, including us, are increasingly affected by the measures taken by importing countries in order to protect their local producers. Measures such as the limitation on imports adopted in a particular country or region may affect the sector’s export volume significantly and, consequently, our operating results. Additionally, due toin the ongoing COVID-19 pandemic,past, governments and other authorities have established certain restrictions on the freedom of movement and business operations, including travel bans, supply chain disruptions and border closures.closures, including as a response to the COVID-19 pandemic. Other measures such as the restriction on imports or business closures of ports, airports or any locations of entry, or border closings may have a material adverse impact on our operations and financial results. See "— We may be exposed to risks related to health epidemics,results, and the COVID-19 in particular, that could adversely impact our ability to operate our business and operating results”.
we cannot predict future pandemic outbreaks.If the sale of our products into a particular importing country is adversely affected by trade barriers or by any of the factors mentioned above, the relocation of our products to other consumers on terms equally favorable could be impaired, and our business, financial condition and operating results may be adversely affected.
A worldwide economic downturn could weaken demand for our products or lower prices.
The demand for the products we sell may be affected by international, national and local economic conditions that are beyond our control. Adverse changes in the perceived or actual economic climate, such as higher fuel prices, higher interest rates, stock and real estate market declines and/or volatility, more restrictive credit markets, higher taxes, and changes in governmental policies could reduce the level of demand or prices of the products we produce. We cannot predict the duration or magnitude of a downturn, or the timing or strength of economic recovery. If a downturn were to continue for an extended period of time or worsen, we could experience a prolonged period of decreased demand and prices. In addition, economic downturns have and may adversely impact our suppliers, which cancould result in disruptions in goods and services and financial losses. Finally, the deterioration of global economic conditions, particularly in relevant economies such as the United States and China, as a result of the continuing COVID-19 pandemic orwar in Ukraine, supply chain challenges and other events may ultimately decrease the customer demand for our products and have a material adverse effect on our financial condition and results of operations. (See "— We
In addition, we expect that a limited number of financial institutions will hold all or most of our cash, including some institutions located in the United States. Depending on our cash balance in any of our accounts at any given point in time, our balances may not be exposedcovered by government-backed deposit insurance programs in the event of default or failure of any bank with which we maintain a commercial relationship. While the U.S. Federal Deposit Insurance Corporation provides deposit insurance of $250,000 per depositor, per insured bank, the amounts that we have in deposits in U.S. banks far exceeds that insurance amount. Therefore, if the U.S. government does not impose measures to risks related to health epidemics, andprotect depositors in the COVID-19event a bank in particular, thatwhich our funds are held fails, we may lose all or a substantial portion of our deposits. The occurrence of any default or failure of any of the banks in which we have deposits could adversely impact our ability to operatehave a material adverse effect on our business, financial condition, results of operations and operating results.”cash flows.
Our business is seasonal and our results may fluctuate significantly depending on the growing cycle of our crops.
As with any agricultural business enterprise, our business operations are predominantly seasonal in nature. The harvest of corn, soybean and rice generally occurs from January to May. Wheat is harvested from December to January. Cotton is harvested from June to August, but requires processing which takes approximately two to three months. Our operations and sales are affected by the growing cycle of our crops processprocessing times and the timing of our harvest sales.
In addition, our sugarSugar, Ethanol and ethanolEnergy business is subject to seasonal trends based on the sugarcane growing cycle in the center-south region of Brazil. The annual sugarcane harvesting period in the center-south region of Brazil begins in March/April and ends in November/December. This creates price fluctuations which result in fluctuations in our sugar and ethanol inventories, usually peaking in December to take advantage of higher prices during the traditional off-season (i.e., January through April), and a degree of seasonality in our gross profit. Seasonality could have a material adverse effect on our business and financial performance. In addition, our quarterly results may vary as a result of the effects of fluctuations in commodities prices, production yields and costs. Therefore, our results of operations have varied significantly from period to period and are likely to continue to vary, due to seasonal factors.
Our dairy cattle are vulnerable to diseases.
Diseases among our dairy cattle herd, such as mastitis, tuberculosis, brucellosis and foot-and-mouth disease, can have an adverse effect on productivity. Outbreaks of cattle diseases may also result in the closure of certain important markets to our cattle-derived products. We cannot assure that future outbreaks will not occur. A future outbreak of diseases among our cattle herds could adversely affect our milk sales and operating results and financial condition.
Furthermore, outbreaks, or fears of outbreaks, of any of these or other animal diseases may lead to cancellation of orders by our customers and, particularly if the disease has the potential to affect humans, or create adverse publicity that may have a material adverse effect on consumer demand for our products. Moreover, outbreaks of animal disease may result in foreign governmental action to close export markets to some or all of our products, which may result in the destruction of some or all of these animals.
We face significant competition from Brazilian and foreign producers,across our business segments, which could adversely affect our financial performance.
WeIn our Farming business, we face strongsignificant competition from other producers in ourthe domestic marketmarkets and from foreign producers in our export markets. The commodities market for commodities is highly fragmented. Small producers can also be important competitors, some of which operate in the informal economy and are able to offer lower prices by meeting lower quality standards. Competition from other producers is a barrier to expanding our sales in the domestic/domestic and foreign market.markets. With respect to exports, we compete with other large, vertically integrated producers that have the ability to produce quality products at low cost, as well as with foreign producers.
The Brazilian markets, in particular, are highly price-competitive and sensitive to product substitution. Customers may seek to diversify their sources of supply by purchasing a portion of the products they need from producers in other countries, as some
of our customers in key export markets have begun to do. We expect that we will continue to face strong competition in all of our markets and anticipate that existing or new competitors may broaden their product lines and extend their geographic scope. Any failure by us to respond to product, pricing and other moves by competitors may negatively affect our financial performance.
Our current insurance coverage may not be sufficient to cover our potential losses.
Our production is, in general, subject to different risks and hazards, including adverse weather conditions, fires, diseases and pest infestations, other natural phenomena, industrial accidents, labor disputes, changes in the legal and regulatory framework applicable to us, environmental contingencies and other natural phenomena. Our insurance currently covers only part of the losses we may incur and does not cover losses on crops due to hail storms, fires or similar risks. Furthermore, certain types of risks may not be covered by the policies we have for our industrial facilities. Additionally, we cannot guarantee that the indemnification paid by the insurer due to the occurrence of a casualty covered by our policies will be sufficient to entirely compensate us for the loss or damages suffered. Moreover, we may not be able to maintain or obtain insurance of the type and amount desired at reasonable costs. If we were to incur significant liability for which we were not fully insured, it could have a materially adverse effect on our business, financial condition and results of operations.
We may incur additional expenses to mitigate the loss, such as shifting production to another facility. These costs may not be fully covered by our insurance.
A reduction in market demand for ethanol or a change in governmental policies reducing the amount of ethanol required to be added to gasoline may adversely affect our business.
Government authorities of several countries, including Brazil and certain states of the United States, currently require the use of ethanol as an additive to gasoline.
Approximately 31% of all fuel ethanol in Brazil is consumed in the form of anhydrous ethanol blended with gasoline; the remaining 69% of fuel ethanol is consumed in the form of hydrous ethanol, which is mostly used to power flex-fuel vehicles. Flex-fuel vehicles have the flexibility to run either on gasoline (blended with anhydrous ethanol) or hydrous ethanol. In The United States, which currently requires the addition of 10% of ethanol into gasoline, is considering increasing this requirement to 15% in 2021 The European Union aims for 10% of the energy used in the transport sector to derive from renewable energy sources by 2020, without specific targets for certain renewable energy sources and without intermediate targets, to be determined by each Member State. Other countries such as Colombia and Canada have a 10% and 5% biofuel blending mandate, respectively, while Argentina currently has a 12% ethanol blending. In March 2021, the British government announced that that next September it will require an increase from 5% to 10% in biofuel additives to petroleum products. Also, India has established a target of achieving 20% ethanol-blending with petroleum by 2025. In addition, flex-fuel and ethanol powered vehicles in Brazil are entitled to a tax benefit in the form of a lower tax rate on manufactured products (Imposto sobre Produtos Industrializados) and therefore are currently taxed at lower levels than gasoline-only vehicles, which has contributed to the increase in production and sale of flex-fuel vehicles. Many of these policies and incentives aim to mitigate the effects of climate change. If climate change policies were to change, the legal framework and incentive structure promoting the use of ethanol may also change, leading to a reduction in the demand for ethanol. In addition, any reduction in the percentage of ethanol required in fuel blended with gasoline or increase in the rates at which flex-fuel vehicles are taxed in Brazil, or any growth in the demand for natural gas and other fuels as an alternative to ethanol, lower gasoline prices or an increase in gasoline consumption (versus ethanol), may cause demand for ethanol to decline and affect our business.
Additionally, the COVID-19 outbreak and other market factors have resulted in a reduction in the demand for oil and related fuels, causing significant volatility in the price of, and a reduction in the demand for, ethanol. Due to the uncertainty surrounding the COVID-19 pandemic and its impact on global markets, we cannot fully determine the extent of the reduction in the demand for ethanol, which, if sustained, may have a material adverse impact on our operations and financial condition. See “— Ethanol prices are correlated to the price of sugar and are also closely correlated to the price of oil, so that a decline in the price of sugar or a decline in the price of oil will adversely affect our sugar and ethanol businesses and (See "— We may be exposed to risks related to health epidemics, and the COVID-19 in particular, that could adversely impact our ability to operate our business and operating results.”
Growth in the sale and distribution of ethanol depends in part on infrastructure improvements, which may not occur on a timely basis, if at all.
In contrast to the well-established logistical operations and infrastructure supporting sugar exports, ethanol exports inherently demand much more complex preparation and means of distribution, including outlets from our facilities to ports and
shipping to other countries. Substantial infrastructure development by personsIn our Sugar, Ethanol and entities outside our control is required for our operations, and theEnergy segment, ethanol industry generally, to grow. Areas requiring expansion include, but are not limited to, additional rail capacity, additional storage facilities for ethanol, increases in truck fleets capable of transporting ethanol within localized markets, expansion of refining and blending facilities to handle ethanol, growth in service stations equipped to handle ethanol fuels, and growth in the fleet of flex-fuel vehicles. Specifically, with respect to ethanol exports, improvements in consumer markets abroad are needed in the number and capacity of ethanol blending industrial plants, the distribution channels of gasoline-ethanol blends and the chains of distribution stations capable of handling fuel ethanol as an additive to gasoline. Substantial investments required for these infrastructure changes and expansions may not be made or they may not be made on a timely basis. Any delay or failure in making the changes in or expansion of infrastructure may hurt the demand for or prices of our products, prevent our products’ delivery, impose additional costs on us or otherwise have a serious adverse effect on our business, operating results or financial status. Our business relies on the continuing availability of infrastructure for ethanol production, storage and distribution, and any infrastructure disruptions may have a material adverse effect on our business, financial condition and operating results.
We may be harmed by competition from alternative fuels, products and production methods.
Ethanol competes in the biofuel market with other, established fuels such as biodiesel, as well as fuels that are still in the development phase, including methanol and butanol from biomass. Alternative fuels could become more successful than ethanol in the biofuels market over the medium or long term due to, for example, lower production costs, greater environmental benefits or other more favorable product characteristics.characteristics, among other factors. In addition, alternative fuels may also benefit from tax incentives or other more favorable governmental policies than those that apply to ethanol. Furthermore, our success depends on early identification of new developments relating to products and production methods and continuous improvement of existing expertise in order to ensure that our product range keeps pace with technological change. Competitors may gain an advantage over us by for example, developing or using new products and production methods, introducing new products to the market sooner than we do, or securing exclusive rights to new technologies, thereby significantly harming our competitive position.
Our current insurance coverage may not be sufficient to cover our potential losses.
Our production is, in general, subject to different risks and hazards, including adverse weather conditions, fires, diseases and pest infestations, other natural phenomena, industrial accidents, labor disputes, changes in the legal and regulatory framework applicable to us, environmental contingencies and other natural or artificial phenomena. Our insurance currently covers only part of the losses we may incur and does not cover losses on crops due to hailstorms, fires or similar risks. Furthermore, certain types of risks may not be covered by the policies we have for our industrial facilities. Additionally, we cannot guarantee that the indemnification paid by the insurer due to the occurrence of a casualty covered by our policies will be sufficient to entirely compensate us for our loss or damages suffered. Moreover, we may not be able to maintain or obtain insurance of the type and amount desired at reasonable costs.
If we were to incur significant liability for which we were not fully insured, such liability could have a material adverse effect on our business, financial condition and results of operations. We may further incur additional expenses to mitigate the loss, such as shifting production to another facility. These costs may not be fully covered by our insurance.
Cybersecurity incidents, including attacks on the infrastructure necessary to maintain our IT systems, may adversely affect us.
We are subject to a broad range of cyber threats, with varying levels of sophistication. These cyber threats are related to the confidentiality, availability and integrity of our systems and data, including our customers’ confidential, classified or personal data, among others.
As attempts to attack continue to evolve in scope and sophistication, we will likely be required to incur significant costs and dedicate additional resources to modify or improve our protection measures against such attacks, to investigate or remediate any vulnerability or consequent violations, or to communicate cyber-attacks.
We may be unable to protect our information systems and technology platforms from the aforementioned risks and any cyber-attacks may result in significant losses of intellectual property, trade secrets, customer data and other confidential information, in addition to significant net assets, including cash, which may materially adversely affect us as it could damage our reputation or result in lawsuits, regulatory fines, sanctions, regulatory intervention and others.
Governmental policies reducing the amount of ethanol required to be added to gasoline, or eliminating tax incentives for flex-fuel vehicles, may adversely affect our business.
Governmental authorities of several countries, including Brazil and the United States, currently require the use of a certain percentage of anhydrous ethanol in gasoline. Since 1997, the Brazilian Sugar and Alcohol Inter-ministerial Council (Conselho Interministerial do Açúcar e do Álcool), or “CIMA,” has fixed the percentage of anhydrous ethanol that must be used as an additive to gasoline. According to CIMA Resolution No. 1, dated March 4, 2015, the current percentage of anhydrous alcohol for regular gasoline is 27%, and for additive/premium gasoline, is 25%. According to data from the National Agency of Petroleum, Natural Gas and Biofuels (Agência Nacional do Petróleo, Gás Natural e Biocombustível), or the “ANP”, approximately one-half of all fuel ethanol in Brazil is used to fuel automobiles that run on a blend of anhydrous ethanol and gasoline; the remainder is used in either flex-fuel vehicles or vehicles powered by hydrous ethanol alone.
Other countries have similar governmental policies that require various blends of anhydrous ethanol and gasoline with minimum ethanol percentages such as the United States, Peru and Thailand (10%), Canada (5%), Paraguay (20%) and Argentina (12%). In March 2021, the British government announced that by September 2021 it would require an increase from 5% to 10% in biofuel additives to petroleum products, and E10 became the standard grade of petrol in the United Kingdom in September 2021 . Moreover, India has established a target of achieving 20% ethanol blending with petroleum by 2025. Any reductions in the percentage of ethanol to be added to gasoline or changes in Brazilian government policies related to the taxation and use of ethanol, as well as growth in the demand for other alternative fuels to ethanol, such as natural gas, may adversely affect our business, financial condition and results of operations.
In addition, flex-fuel and ethanol-powered vehicles in Brazil are entitled to a tax benefit in the form of a lower tax rate on manufactured products (imposto sobre produtos industrializados) and, therefore, are currently taxed at lower levels than gasoline-only vehicles. This incentive contributed to the increase in production and sale of flex-fuel vehicles, and there are many similar policies and incentives that aim to mitigate the effects of climate change which directly or indirectly promote the use of ethanol. If climate change policies were to change, the legal framework and incentive structure promoting the use of ethanol may also change, leading to a reduction in the demand for ethanol.
Growth in the sale and distribution of ethanol depends in part on infrastructure improvements, which may not occur on a timely basis, if at all.
In contrast to the well-established logistical operations and infrastructure supporting sugar exports, ethanol exports inherently demand much more complex preparation and means of distribution, including outlets from our facilities to ports and shipping to other countries. Substantial infrastructure development by persons and entities outside our control is required for our operations, and the ethanol industry generally, to grow. Areas requiring expansion include, but are not limited to, additional railroad capacity, additional storage facilities for ethanol, increases in truck fleets capable of transporting ethanol within localized markets, expansion of refining and blending facilities to handle ethanol, growth in service stations equipped to handle ethanol fuels, and growth in the fleet of flex-fuel vehicles. Improvements in our ethanol exports, to consumer markets abroad would require an increase in the number and capacity of ethanol-blending industrial plants, the distribution channels of gasoline-ethanol blends and the chains of distribution stations capable of handling fuel ethanol as an additive to gasoline.
Substantial investments required for these infrastructure changes and expansions may not be made or they may not be made on a timely basis. Any delay or failure in making the changes in or expansion of infrastructure may hurt the demand for or prices of our products, prevent our products’ delivery, impose additional costs on us or otherwise have a significant adverse effect on our business, operating results or financial status. Our business relies on the continuing availability of infrastructure for ethanol production, storage and distribution, and any infrastructure disruptions may have a material adverse effect on our business, financial condition and operating results.
A substantial portion of our assets is farmland that is highly illiquid.
Ownership of a significant portion of the land we operate is a key part of our business model. However, agricultural real estate is generally an illiquid asset. Moreover, the adoption of laws and regulations that impose limitations on ownership of rural land by foreigners in the jurisdictions in which we operate may also limit the liquidity of our farmland holdings. See “—Risks Related to Argentina—Argentine law concerningthe Countries in Which We Operate—Laws on the foreign ownership of rural properties may adversely affect our results of operations and future investments in rural properties in Argentina” and “—Risks Related to Brazil—Changes in Brazilian rules concerning foreign investment in rural properties may adversely affect our investments.properties.” As a result, it is unlikely that we will be able to promptly adjust our owned agricultural real estate portfolio promptly in response to changes in economic, business or regulatory conditions. IlliquidityA lack of liquidity in local market conditions may adversely affect our ability to complete dispositions, to receive proceeds generated from any such sales, or to repatriate any such proceeds.
We have entered into agriculture partnership agreements in respect of a significant portion of our sugarcane plantations.
As of December 31, 2020,2023, approximately 93.81%93.5% of our sugarcane plantations were leased through agriculture partnership agreements, for periods of an average of six to twelve12 years. We cannot guarantee that these agriculture partnerships will be renewed after their respective terms end. We cannot guarantee that we will be able to renew these agreements andend, or whether such renewals will be on terms and conditions satisfactory to us. Any failure to renew the agriculture partnerships or obtain land suitable for sugarcane planting in sufficient quantity and at reasonable prices to develop our activities could adversely affect our results of operations, increase our costs or force us to seek alternative properties, which may not be available or be available only at higher prices.
We may be subject toOur performance depends on favorable working relationships with our employees and compliance with labor disputes from time to time that maylaws. Any strain on these relationships or increased labor costs could adversely affect us.our business.
Approximately 18%91% of our employees are represented by unions or equivalent bodies and are covered by collective bargaining or similar agreements which are subject to periodic renegotiation. We may not successfully conclude our labor negotiations on satisfactory terms, which may result in a significant increase in the cost of labor or may result in work stoppages or labor disturbances that disrupt our operations. Cost increases, work stoppages or disturbances that result in substantial amounts of raw product not being processed could have a material and adverse effect on our business, results of operations and financial condition.
Furthermore, all benefits and obligations provided under collective bargaining or similar agreements negotiated are binding upon all parties, and have legal and practical effects on employment agreements.
If we do not observe legallegally and conventionalconventionally binding provisions, itwe may be susceptible to labor disputes filed by employees, Public Civil Actionclass actions filed by the Labor Public Prosecutionlabor prosecutors, and inspections by Labor Protection Agencies,labor protection agencies, resulting in the payment of legal and/or administrative sanctions.
Further, the Argentine Remote Employment Law (Ley de teletrabajo) (the “Remote Employment Law”), and its related regulation, entered into force in April 2021 and governs labor contracts in which employees work remotely on a regular basis, except for those who work in clients' offices. The law regulates several aspects applicable to working remotely, such as the right to digital disconnection, the right to a working schedule that is compatible with caretaking tasks, the right to return to work in person on the employer’s premises, the reimbursement of expenses, the provision of work tools, and transnational services, among others. The Remote Employment Law’s most significant impacts include the need to provide employees with working tools and to compensate them for expenses arising from remote work. While many companies have already defined and adopted measures to implement this law, many others are still in the planning stage, or have chosen to implement a mixed on-site and remote work schedule (in which case the Remote Employment Law applies proportionally).
We may not possess all of the permits and licenses required to operate our business, or we may fail to renew or maintain the licenses and permits we currently hold. Thishold which could subject us to fines and other penalties, which could materially adversely affect our results of operations.penalties.
We are required to hold a variety of permits and licenses to conduct our farming and industrial operations, including but not limited to permits and licenses concerning land development, agricultural and harvesting activities, seed production, industrial plants, labor standards, occupational health and safety, land use, water use and other matters. We may not possess all of the permits and licenses required for each of our business segments. In addition, the approvals, permits or licenses or renewals there ofthereof required by governmental agencies may change without substantial advance notice, and we could fail to obtain the approvals, permits or licenses required to expand our business. If we fail to obtain or to maintain such permits or licenses, or if renewals are granted with onerous conditions, we could be subject to fines and other penalties and be limited in the number or the quality of the products that we could offer. As a result, our business, results of operations and financial condition could be adversely affected.
We are
Our business is subject to extensive environmentalsignificant governmental regulation, which may adversely affect our results of operations and concerns regarding climate change may subject us to even stricter environmental regulations.financial condition.
Our activities are subject to a broad set of laws and regulations relating to the protection of the environment. Such laws include compulsory maintenance of certain preserved areas within our properties, management of pesticidesphytosanitary products and associated hazardous waste and the acquisition and renewals of permits for water use and effluents disposal. In addition, the storage and processing of our products may create hazardous conditions. We could be exposed to civil, criminal and administrative penalties in addition to the obligation to remedy the adverse effects of our operations on the environment and to indemnify third parties for damages.
In addition, pursuant to Brazilian environmental legislation, the corporate entity of a company willentities can be disregarded (such that the owners of the company will be liable for itstheir debts) if necessary to guarantee the payment of costs related to the recovery of environmental damages whenever the legal entity is deemed by a court to be an obstacle to reimbursement of damages caused to the quality of the environment. Moreover, the relevant public authority may prevent us from using the property as long as environmental damages persist, which can directly affect the rent revenue stream of the agriculture partnership agreements. Because of the possibility of unanticipated regulatory measures or other developments, particularly as environmental laws become more stringent, the amount and timing of future expenditures required to maintain compliance could increase from current levels and could adversely affect the availability of funds for capital expenditures and other purposes. Compliance with existing or new environmental laws and regulations, as well as obligations in agreements with public entities, could result in increased costs and expenses.
Environmental laws and their enforcement are becoming more stringent in Argentina and Brazil, increasing the risk of and penalties associated with violations, which could impair or suspend our operations or projects and our operations expose us to potentially adverse environmental legislation and regulation. Failure to comply with past, present or future laws could result in the imposition of fines, third partythird-party claims, and investigation by environmental and police authorities and the relevant public attorney office. For example, the perceived effects of climate change may result in additional legal and regulatory requirements to reduce or mitigate the effects of our industrial facilities’ emissions. Such requirements, if enacted, could increase our capital expenditures and expenses for environmental compliance in the future, which may have a material and adverse effect on our business, results of operations and financial condition. Moreover, the denial of any permit that we have requested, or the revocation of any of the permits that we have already obtained, may have an adverse effect on our results of operations.
Climate change may impose increased costs on our operations.
Climate change imposes challenges and opportunities for our business. More stringent environmental regulations could result in the imposition of costs associated with greenhouse gas emissions (as a result of measures such as carbon taxation or the creation of market limitations on greenhouse gas emissions), which have the potential to increase our operating costs and reduce our production.
The risks associated with climate change can also include difficulties in accessing capital due to reputational problems with investors, changes in consumer profiles, reduced consumption of fossil fuels and energy transitions in the global economy toward a more low-carbon matrix, with the inclusion of substitute products for fossil fuels and the increased use of electricity for urban mobility. These factors may have a negative impact on the demand for our products and services and may burden or even render the implementation and operation of our projects unfeasible, thereby adversely impacting our results and financial condition and limiting some of our opportunities for growth.
Furthermore, the potential physical impacts of climate change are uncertain and may vary by region, which includes changes in rainfall patterns, water shortages, changing sea levels and changing temperature levels that could adversely impact our business operations, the location, costs and competitiveness of global agricultural production and related storage and processing facilities. Yields may also be affected by plagues, diseases or weed infections and related operational problems. See “Item 5. Operating and Financial Review and Prospects—A. Operating Results—Trends and Factors Affecting Our Results of Operations—Effects of Yield Fluctuations.”
Some of the agricultural commodities and food products that we produce contain genetically modified organisms ("GMO").organisms.
Our soybean, corn and cotton products contain GMOs in varying proportions depending on the year and the country of production. The use of GMOs in food has been met with varying degrees of acceptance in the markets in which we operate. In certain countries, adverse publicity about genetically modified food has led to governmental regulation limitingthat limits sales of GMO products in some of the markets in which our customers sell our products, including the European Union. It is possible that new restrictions on GMO products will be imposed in major markets for some of our products or that our customers will decide to
purchase fewer GMO products or not buy GMO products at all, which could have a material adverse effect on our business, results of operations, financial condition or prospects.
We may face restrictions and penalties under consumer protection laws.
Increased regulation of food safety could increase our costsFundação de Proteção e Defesa do Consumidor), or “PROCONs” and adversely affect our results of operations.
Our manufacturing facilities and products are subject to regular local,prosecutors, which oversee consumer issues on a district-by-district basis. Companies that operate across Brazil may face penalties from multiple PROCONs, as well as foreign, governmental inspectionsthe National Secretariat for Consumers (Secretaria Nacional do Consumidor). Companies may settle claims made by consumers via PROCONs and extensive regulation in the food safety area, including governmental food processing controls. We incur significant costs in connectioncourts by directly indemnifying consumers and through a mechanism that allows them to adjust their conduct, called a conduct adjustment agreement (Termo de Ajustamento de Conduta), or “TAC.” The Brazilian Public Prosecution Office (Ministério Público) may also commence investigations related to consumer rights violations, and this TAC mechanism is also available for them. Companies that violate TACs face potential automatic fines. Brazilian prosecutors may also file class actions against companies that violate consumer rights, seeking strict compliance with consumer protection law provisions and indemnification for the compliance of food and safety requirements and changes in government regulations relating to food safety could require us to make additional investments or incur additional costs to meet the necessary specifications for our products. Our products are often inspected by foreign food safety officials, and any failure to pass those inspections can result in our being required to return all or part of a shipment, destroy all or part of a shipment or incur costs because of delays in delivering products to our customers. Any tightening of food safety regulations could result in increased costs and coulddamages consumers may have an adverse effect on our business and results of operations.suffered.
If our products become contaminated,For instance, we may be subject to product liability claims, product recalls and restrictions on exports that would adversely affect our business.
for contaminated products. The sale of food products for human consumption involves the risk of injury to consumers. These injuries may result from tampering by third parties, bioterrorism, product contamination or spoilage, including the presence of bacteria, pathogens, foreign objects, substances, chemicals, other agents, or residues introduced during the growing, storage, handling or transportation phases.
We cannot be sure that consumption of our products will not cause a health-related illness in the future or that we will not be subject to claims or lawsuits relating to such matters. The negative publicity surrounding any assertion that our products caused illness or injury could adversely affect our reputation with existing and potential customers and our corporate and brand image, and we could also incur significant indemnification liabilities legal expenses.expenses and be subject to criminal charges. Moreover, claims or liabilities of this nature might not be covered by any rights of indemnity or contribution that we may have against others, which could have a material adverse effect on our business, results of operations or financial condition.
IFRS accounting standards relatedrequires us to measure our biological assets require us to make numerous estimates in the preparation of our financial statementsat fair value and therefore limit the comparability of our financial statements to similar issuers using U.S.applying US GAAP.
IAS 41 “Biological Assets” requires that we measure our biological assets and agriculture produce at the point of harvest at fair value less costs to sell. Therefore, we are required to make assumptions and estimates relating to, among other things,others, future agricultural commodity yields, prices, and production costs extrapolated through a discounted cash flow method. For example, the value of our biological assets generated initial recognition and changes in fair value of biological assets amounting to a $122.7gains of $87.9 million, gain$215.9 million and $227.7 million in 2020; $68.6 million gain in 20192023, 2022 and a $16.2 million gain in 2018.2021, respectively. The assumptions and estimates used to determine the fair value of biological assets, and any changes to such prior estimates, directly affect our reported results of operations. If actual market conditions differ from our estimates and assumptions, there could be material adjustments to our results of operations. In addition, the use of such discounted cash flow method utilizing these future estimated metrics differs from generally accepted accounting principles in the United States (“U.S. GAAP”).Under US GAAP, biological assets are measured at historical cost. As a result, our financial statements and reported earnings are not directly comparable to those of similar companies in the United States.applying US GAAP.
We have substantial
Our indebtedness which could impair theirour financial condition and decrease the amount of dividends we receive.impair our ability to receive or pay out dividends.
As of December 31, 2020,2023, we had $634.8$503 million of net debt outstanding on a consolidated basis, including our $500 million ofSenior Notes 2027, incurred by Adecoagro S.A.due 2027. Certain of our subsidiaries in Argentina and Brazil have a substantial amount of debt, which requires significant principal and interest payments. Such indebtedness could affect our subsidiaries’ future operations, for example, by requiring a substantial portion of their cash flows from operations to be dedicated to the payment of principal and interest on indebtedness instead of funding working capital and capital improvements and other investments. The substantial amount of debt incurred by us and our subsidiaries also imposes significant debt obligations, increasing our cost of borrowing to satisfy business needs and limiting our ability to obtain additional financing.
The substantial level of indebtedness borne by certain of our subsidiaries also affects the amount of cash available to them to pay as dividends, increasing our vulnerability to economic downturns or other adverse developments relative to competitors with less leverage, and limiting our ability to obtain additional financing for working capital, capital expenditures, acquisitions or other corporate purposes in the future. Moreover, our indebtedness places limits on our ability to make acquisitions or needed capital expenditures or to pay dividends to our shareholders.
The terms of our indebtedness and that of certain of our subsidiaries impose significant restrictions on our operating and financial flexibility.
The terms of our Senior Notes due 2027 and the debt instruments of some of our subsidiaries contain customary covenants including limitations on our ability to, among other things,others, incur or guarantee additional indebtedness; make restricted payments, including dividends and prepaying indebtedness; create or permit liens; enter into business combinations and asset sale transactions; make investments, including capital expenditures; and enter into new businesses. Some of these debt instruments are also secured by various collateral including mortgages on farms, pledges of subsidiary stock and liens on certain facilities, equipment and accounts. Some of these debt instruments also contain cross-default provisions, where a default on one loan by one subsidiary could result in lenders of otherwise performing loans declaring a default. These restrictions could limit our ability to obtain future financing, withstand a future downturn in business or the economy in general, conduct operations or otherwise take advantage of business opportunities that may arise. Moreover, by reducing the level of dividends we may receive, the terms of our subsidiaries’ indebtedness placesplace limits on our ability to make acquisitions or needed capital expenditures or to pay dividends to our shareholders.
The financial ratio covenants we are currently required to meet, some of which are measured on a combined basis aggregating results of the borrowing subsidiaries and others which are measured on an individual debtor basis, include, among others, debt service coverage, minimum liquidity and leverage ratios.
The failure to maintain applicable financial ratios, in certain circumstances, would prevent us from borrowing additional amounts and could result in a default under such indebtedness. If we or our subsidiaries are unable to repay those amounts, the affected lenders could initiate bankruptcy-related proceedings or enforce their rights to the collateral securing such indebtedness, which would have a material and adverse effect on our business, results of operations and financial condition.
Fluctuations in interest rates could have a significant impact on our results of operations, indebtedness and cash flow.
As of December 31, 2020, approximately $717.62023, US$627.0 million of our total debt on a consolidated basis was subject to fixed interest rates, and $253.4US$278.0 million was subject to variable interest rates. As of December 31, 2020,2023, borrowings incurred by the Company’sour subsidiaries in Brazil wereare repayable at various dates between January 20212024 and November 2027September 2030 and bear either fixed interest rates ranging from 2.5%6.80% to 7.95%13.23% per annum or variable rates based on TaxaBrazilian Long-Term Interest Rate (Taxa de Juros de Longo Prazo (TJLP)Prazo), Íthe Brazilian Broad Consumer Prices Index (Índice de Preços ao Consumidor Amplo (IPCA)Amplo), and CDIthe Brazilian interbank rate (taxa do certificado de depósito bancário), or base-rates plus spreads ranging from 1.62%8.6% to 4.24%14.2% per annum. Borrowings incurred by the Company´sour subsidiaries in Argentina are repayable at various dates between January 20212024 and June 2028 and bear either no interest rate or variable rates based on specific base-rates plus spreads of 4.4% for those borrowings denominated in U.S. dollar, and fixed interest rates ranging from 2.8%74.5% to 7.0%117% per annum.annum for those borrowings denominated in Argentine pesos. Significant interest rate increases can have an adverse effect on our profitability, liquidity and financial position. Currently, our variable interest rate exposure is mainly linked to the London Interbank Offer Rate ("LIBOR") rate plus specified spreads. If interest rates increase, whether because of an increase in market interest rates or an increase in our own cost of borrowing, our debt service obligations for our variable rate indebtedness would increase, and our net income could be adversely affected. At December 31, 2020, LIBOR (six months) was 0.26%.
Volatility in LIBOR or other reference rates could increase our periodic interest payments and have an adverse effect on our total financing costs. We may be unable to adequately adjust our prices to offset any increased financing costs, which would have an adverse effect on our results of operations.
On July 27, 2017, the Financial Conduct Authority (the authority that regulates LIBOR) announced that it intends to stop compelling banks to submit rates for the calculation of LIBOR after 2021. Further, on November 30, 2020, ICE Benchmark Administration (“IBA”) announced that it planned to consult on its intention to cease the publication of one-week and two-month LIBOR on December 31, 2021, and the overnight, one-month, three-month, six-month and 12-month LIBOR tenors on June 30, 2023. That same day, the Board of Governors of the Federal Reserve System, the Federal Deposit Insurance Corporation, and the Office of the Comptroller of the Currency jointly responded to IBA’s announcement by encouraging banks to stop writing contracts referencing LIBOR as soon as possible (and in any event by the end of 2021, subject to certain limited exceptions), stating that entering into new contracts that use LIBOR as a reference rate after December 31, 2021, and failing to prepare for disruptions to LIBOR (including operating without robust fallback language that includes a clearly defined alternative reference rate), could cause significant issues if not addressed. These announcements indicate that the continuation of LIBOR on the current basis cannot and will likely not be guaranteed after June 2023 and may be subject to significant disruption after December 2021.It is not possible to predict the effect of these changes, other reforms or the establishment of alternative reference rates in the United Kingdom, the United States or elsewhere. See also the discussion of interest rate risk in “Item 11. Quantitative and Qualitative Disclosures About Market Risk-”Risk of Fluctuations in Interest Rates.”
The transition process may involve, among other things, increased volatility or illiquidity in markets for instruments that currently rely on LIBOR. The transition may also result in reductions in the value of certain instruments or the effectiveness of
related transactions such as hedges, increased borrowing costs, uncertainty under applicable documentation, or difficult and costly consent processes. Any such effects of the transition away from LIBOR, as well as other unforeseen effects, may result in losses or increases in financing costs with respect to our indebtedness, expenses, difficulties, complications, or delays in connection with future financing efforts, all of which could have a material adverse impact on our business, financial condition and results of operations.
Also,In addition, changes in the fair value of the derivative instruments can result in a non-cash charge or gain being recognized in our financial results for a period preceding the period or periods in which settlement occurs under the derivative instruments and interest payments are made. Changes or shifts in interest rates can significantly impact the valuation of our derivatives and therefore could expose us to substantial mark-to-market losses or gains if interest rates fluctuate materially from the time when the derivatives were entered into. Accordingly, fluctuations in interest rates may impact our financial position, results of operations, and cash flows. See "Noteflows.For detail information regarding derivatives, please see Note 2 to our Consolidated Financial Statements".Statements.
We may need additional capital and we may not be able to renewobtain it.
We believe that our credit lines when they mature, deprivingexisting cash and cash equivalents, cash flows from operations and ability to raise financing are and will be sufficient to meet our anticipated cash needs for the foreseeable future. We may, however, require additional cash
resources due to changed business conditions or other future developments, including any investments or acquisitions we may decide to pursue. If these resources are insufficient to satisfy our cash requirements, we may seek to sell additional equity or debt securities or obtain other sources of financing. The sale of additional equity securities could result in dilution to our shareholders. The incurrence of indebtedness could result in increased debt service obligations and could require us to agree to operating and financing covenants that would restrict our operations.
Our ability to obtain additional capital on acceptable terms is subject to a variety of needed liquidity.uncertainties, including:
Certain•conditions of the U.S. capital markets and other capital markets in which we may seek to raise funds;
•our future results of operations and financial condition;
•government regulation of foreign investment in the United States, Europe, and Latin America; and
•global economic, political, and other conditions in jurisdictions in which we do business.
Moreover, certain of our subsidiaries rely substantially on existing uncommitted credit lines to support their operations and business needs through the agricultural harvest cycle. If we are unable to renew these credit lines, or if we cannot replace such credit lines with other borrowing facilities, our financial condition and results of operations may be adversely affected.
There is a risk that we could be treated as a U.S. domestic corporation for U.S. federal income tax purposes, which could materially increase our U.S. federal income tax liability and subject any dividends we pay to U.S. federal withholding tax.
WeImmediately prior to our IPO, we acquired approximately 98% of IFH, a holding company, which was a partnership for U.S. federal income tax purposes organized under the laws of Delaware immediately prior to our IPO, in exchange for our common shares. Under section 7874(b) of the U.S. Internal Revenue Code section 7874(b)of 1986, as amended, or the “Code”, we would be treated as a U.S. domestic corporation if we were deemed to have acquired substantially all of the assets constituting the trade or business of a U.S. domestic partnership and former members of IFH were deemed to own at least 80% of our common shares by reason of the transfer of those trade or business assets (ignoring common shares issued in our IPO for purposes of the 80% threshold). The rules mentioned above are unclear in certain respects and there is limited guidance on the application of the rules to partnership acquisitions. Accordingly, we cannot assure youthere can be no assurance that the U.S. Internal Revenue Service (“IRS”) will not seek to assert that we are a U.S. domestic corporation, which assertion if successful could materially increase our U.S. federal income tax liability and require us to withhold tax from any dividends we pay to holders of our common shares who are not United States persons within the meaning of U.S. Internal Revenue Code section 7701(a) (30). of the Code. See “Item 10. Additional Information—E. Taxation”.Taxation—United States Federal Income Taxation of the Company.”
We may be classified by the IRS as a “passive foreign investment company” (a “PFIC”),company,” which may result in adverse tax consequences for U.S. investors.investors in our common shares.
Whether the Companywe will be a PFICpassive foreign investment company, or a “PFIC,” for U.S. federal income tax purposes for the current or future tax year will depend on the Company’sour assets and income over the course of each such tax year and, as a result, cannot be predicted with certainty as of the date of this Form 20-F.annual report. Under circumstances where theour cash is not deployed for active purposes, our risk of becoming a PFIC may increase. Although the determination of whether a corporation is a PFIC is made annually, and thus may be subject to change, we do not believe that we were a PFIC for U.S. federal income tax purposes for our most recently completed taxable year. However, there can be no assurance that we will not be a PFIC for any taxable year. If we were treated as a PFIC for any taxable year during which a U.S. investor heldowned common shares, certain adverse tax consequences could apply to such U.S. investor. A U.S. taxpayer who holdsowns stock in a foreign corporation during any year in which such corporation qualifies asis a PFIC may be able to mitigate such negative tax consequences by making certain U.S. federal income tax elections, which are subject to numerous restrictions and limitations. Holders of the Company’s common shares are urged to consult their own tax advisors regarding the acquisition, ownership, and disposition of the Company’s common shares. See “Material“Item 10. Additional Information—E. Taxation—Material U.S. Federal Income Tax Considerations for U.S. Holders—Passive Foreign Investment Company (“PFIC”) Rules”.
We are subject to anti-corruption, anti-bribery, anti-money laundering and other international trade laws and regulations.
We are subject to anti-corruption, anti-bribery, anti-money laundering and other international trade laws and regulations.
We are required to comply with the laws and regulations of Brazil and other jurisdictions where we conduct operations.operations regarding anti-corruption, anti-bribery, anti-money laundering and other international trade laws and regulations. In particular, we are subject to the Brazilian Anti-corruption Law No 12,846,No. 12,846/2013, to the U.S. Foreign Corrupt Practices Act of 1977, or the “FCPA,” to the United Kingdom Bribery Act of 2010, as well as economic sanctionsanctions programs, including those administered by the United Nations, the European Union and the United States, including the U.S. Treasury Department’s Office of Foreign Assets Control,Control.
Law No. 12,846/2013, or “OFAC.the “Brazilian Anti-corruption Law,” imposes strict liability on companies, in the civil and administrative spheres, for acts contrary to the Brazilian federal public administration practiced by their directors, administrators, collaborators or third parties acting on their behalf or benefit. Among the sanctions applied are fines, loss of assets, rights and values illicitly obtained, suspension or partial interdiction of activities, prohibition on contracting with the government or receiving benefits or tax or credit incentives and confiscation of assets, which sanctions, if applied, could adversely affect our results. In Brazil, other laws that provide for violations related to corruption and unlawful acts against the Brazilian federal public administration are also applicable to us, such as Law No. 8,492/1992 (as amended by Law No. 14,230, dated October 25, 2021), or the “Administrative Misconduct Law,” which also provides for penalties that include the prohibition to enter into contracts with the government for a period of up to 14 years. Our governance structure, internal control mechanisms, risk management and compliance may not be sufficient or capable of preventing or detecting (i) violations of the Brazilian Anti-corruption Law, the Administrative Misconduct Law or other rules related to combating corruption and fraud, (ii) occurrences of fraudulent or dishonest behavior on the part of our managers, employees, subsidiaries, controllers, affiliates or any contracted individuals and legal entities and other agents acting on our behalf or for our benefit or on behalf and for the benefit of such parties or (iii) other occurrences of behavior not in line with ethical principles, which may adversely affect our reputation, as well as our business, financial condition and results of operations, or the price of the securities issued by us.
Law No. 27,401/2017, or the “Argentinian Corporate Criminal Liability Law,” makes legal entities criminally liable for local or international bribery and influence peddling, negotiations that are incompatible with public office, illegal payments made to public officials under the appearance of taxes or fees owed to the relevant government agency, illegal enrichment of public officers and employees, and producing aggravated false balance sheets and reports to cover up local or international bribery or influence peddling. Legal entities shall be liable when these crimes are committed, directly or indirectly, with their intervention or on their behalf, and are only exempted from liability if the individual who committed the crime acted exclusively for his/her own benefit and without any benefit for the entity. Legal entities may be convicted even if it is not possible to identify or convict the individual involved in the crime, provided that the circumstances of the case lead to the conclusion that the crime could not have been committed without tolerance of the authorities of the legal entity. Although previous drafts of the bill included sections making controlling entities liable for economic penalties imposed on their subsidiaries under this law, such articles were removed from the law as approved by the Argentine congress. Among the sanctions applied are fines, loss of assets, rights and values illicitly obtained, suspension or partial interdiction of activities, prohibitions on contracting with the government or receiving benefits or tax or credit incentives and confiscation of assets, which sanctions, if applied, could adversely affect our results of operation.
The FCPA prohibits providing anything of value to foreign officials for the purposes of obtaining or retaining business or securing any improper business advantage. As part of our business, we may deal with entities and employees which are
considered foreign officials for purposes of the FCPA. In addition, economic sanctions programs restrict our dealings with certain sanctioned countries, individuals and entities. When issues arise, we attempt to act promptly to learn relevant facts, conduct appropriate due diligence, and take any appropriate remedial action to address the risk. There can be no assurance that our internal policies and procedures will be sufficient to prevent or detect all inappropriate practices, fraud or violations of law by our employees, directors, officers, partners, agents and service providers or that such persons will not take actions in violation of our policies and procedures (or otherwise in violation of the relevant anticorruptionanti-corruption laws and sanctions regulations) for which we or they may be ultimately held responsible.
Violations of anti-bribery and anticorruptionanti-corruption laws and sanctions regulations could have a material adverse effect on our business, reputation, results of operations and financial condition. In addition, we may be subject to one or more enforcement actions, investigations and proceedings by authorities for alleged infringements of these laws. These proceedings may result in penalties, fines, sanctions or other forms of liability and could have a material adverse effect on our reputation, business, financial condition and results of operations. We cannot predict whether future investigations, developments from current investigations or allegations involving us or involving any of our affiliates, officers, employees, shareholders or members of our Board of Directors or any third parties related to us in any way will arise. In the event of investigations, allegations or developments, our reputation, business, financial condition, results of operations, as well as the price of the securities issued by us, may be adversely affected.
We may be adversely affected by the ongoing armed conflict between Russia and Ukraine.
The ongoing war between Russia and Ukraine has disrupted supply chains and international trade generally. Following Russia’s invasion of Ukraine beginning on February 24, 2022, the United States, the United Kingdom, the E.U. and other countries announced broad economic sanctions against Russia, including financial measures such as freezing Russia’s central bank assets and limiting its ability to access its U.S. dollar reserves. The United States, the E.U. and the United Kingdom have
also banned people and businesses from dealings with the Russian central bank, its finance ministry and its wealth fund. Selected Russian banks will also be removed from Swift messaging system, which enables the smooth transfer of money across borders. Other sanctions by the United Kingdom include major Russian banks being excluded from the United Kingdom financial system, stopping them from accessing sterling and clearing payments, major Russian companies and the state being prevented from raising capital or borrowing money on the United Kingdom markets, and the establishment of limits on deposits Russians can make at United Kingdom banks. The United States, the E.U. and the United Kingdom adopted personal measures, such as sanctions on individuals with close ties to Mr. Putin, placed visa restrictions on several oligarchs, as well as their family members and close associates, and froze assets.
While the precise effect of the ongoing war and these sanctions on the Russian and global economies remains uncertain, they have already resulted in significant volatility in financial markets, depreciation of the Russian ruble and the Ukrainian hryvnia against the U.S. dollar and other major currencies, as well as an increase in energy and commodity prices globally. As a result, in particular, the availability and pricing of fertilizers for the 2023/2024 harvest is subject to significant uncertainty in Brazil and Argentina. From a supply point of view, Brazil and Argentina are highly dependent on fertilizer imports, and Russia and Belarus hold a significant market share in Brazilian and Argentine soil fertilizer imports (a share that is higher for potash-based products). In addition, fertilizer prices, which had already risen before the conflict, have continued to rise and have led producers to delay purchase negotiations. As a result of such supply risk and the slow pace of the market at present, we expect that there may be shortages of some types of fertilizers (mainly for potash-based products). We may also be unsuccessful in finding alternative direct imports from non-sanctioned regions or in increasing our prices to reflect increased supply costs in the future. Failure to obtain fertilizer on favorable terms, sufficient quantities or at all could have a material adverse effect on our production capacity.
Finally, geopolitical tension in petroleum-producing countries can affect the global supply and lead prices to rally. The war in Ukraine led to oil prices reaching as high as US$139.0 per barrel, the highest price since 2008. Although this positively impacted ethanol demand and prices, there can be no assurance that such geopolitical tension will not adversely affect our results of operations and financial condition.
Technological advances or alternative products may affect demand for our products and services or require substantial capital investments to remain competitive.
Technological advances may affect demand for products or require substantial capital investments to remain competitive. The development and implementation of new technologies can result in a significant reduction in the costs of the products and services we distribute. We cannot predict when new technologies may become available or the effects of these events on our business. Advances in the development of alternatives to the products and services we currently distribute can significantly reduce demand or eliminate the need for them. Any advances in technology that require significant capital investments to ensure competitiveness, or that otherwise reduce demand for our services, will have a material adverse effect on our business and financial performance. In addition, any other alternative products or technological advances that reduce demand for our services could have a material adverse effect on our results of operations and financial condition.
Security breaches and other disruptions could compromise our technology infrastructure and information and expose us to processes disruption and liability, which would cause our business and reputation to suffer.
In the ordinary course of our business, we depend on technology to carry out our business. We also collect and store sensitive data, including intellectual property, our proprietary business information and that of our customers and suppliers, and personally identifiable information of our employees, in our data centers and on our networks. The secure processing, maintenance and transmission of this information is critical to our operations. In addition, these systems may require modifications or upgrades as a result of technological changes or growth in our business. Although we take actions to secure our systems and electronic information and have disaster recovery plans in case of incidents that could cause major disruptions to our business, these measures may not be enough.
Despite our security measures, our information technology and infrastructure may be vulnerable to attacks by hackers or breached due to employee error, malfeasance or other disruptions. Any such breach could compromise our networks, our systems, and eventually suffer from systems disruption and/or having the information stored there accessed, publicly disclosed, lost or stolen. Any such access, disclosure or other loss of information could result in legal claims or proceedings, fines from governmental authorities, disrupt our operations, damage our reputation, and cause over costs to remedy the harm suffered, which could adversely affect our business/operating margins, revenues and competitive position.
We depend on our information technology systems and any failure of these systems could adversely affect our business.
We depend on information technology systems for significant elements of our operations, including data storage and retrieval of critical business information. Our information technology systems are vulnerable to damage from a variety of sources, including network failures, malicious human acts and natural disasters. In addition, some of our servers are potentially vulnerable to physical or electronic break-ins, computer viruses and similar disruptive issues. Failures or significant disruptions to our information technology systems or those used by our third-party service providers may prevent us from conducting our general business operations. Any disruption or loss of information technology systems on which critical aspects of our operations depend could have an adverse effect on our business, results of operations and financial condition.
In addition, we store highly confidential information on our information technology systems, including information related to our products. If our servers or third-party servers on which our data is stored are attacked by a physical or electronic break-in, computer virus or any other malicious human action, our confidential information may be stolen, unlawfully disclosed or destroyed. Any security breach involving misappropriation, loss or unauthorized disclosure or use of confidential information of our suppliers, customers or others, whether by us or by third parties, could subject us to civil and criminal penalties, have a material negative impact on our brands and reputation, create relevant legal and financial exposure, result in loss of customer confidence, or decrease the use of our products and services, any of which results may have an adverse impact on our business, results of operations and reputation.
Our security measures may also be breached by human error, wrongdoing, system errors or vulnerabilities, or other irregularities. Our measures to monitor and develop information technology infrastructure and networks may not be effective in protecting us against cyberattacks and other breaches related to our information technology systems. The techniques used to gain unauthorized, improper or illegal access to our systems, data or data from our customers, to disable or degrade services, or to sabotage systems are constantly evolving, can be difficult to detect quickly and often are not recognized until they are used against a target. Unauthorized parties may attempt to gain access to our systems or facilities by various means, including, but not limited to, hacking into our systems or those of our customers, partners or suppliers, or attempting to fraudulently induce our employees, customers, partners, suppliers or other users of our systems to disclose usernames, passwords, financial information or other confidential information, which in turn may be used to access our information technology systems. Certain third-party efforts to access information technology systems can be supported by significant financial and technological resources, making them even more sophisticated and difficult to detect.
Noncompliance with data protection laws could adversely affect our business.
Personal privacy, information security, and data protection are significant issues globally. The regulatory framework governing the collection, processing, storage, use and sharing of certain information, particularly financial and other personal data, is rapidly evolving and is likely to continue to be subject to uncertainty and varying interpretations. The occurrence of unanticipated events and the development of evolving technologies often rapidly drive the adoption of legislation or regulation affecting the use, collection or other processing of data and the manner in which we conduct our business. Any failure or perceived failure by us to comply with our privacy policies or any applicable privacy, security or data protection, information security or consumer-protection related laws, regulations, orders or industry standards in one or more jurisdictions could expose us to costly litigation, significant awards, fines or judgments, civil and criminal penalties or negative publicity, and could materially and adversely affect our business, financial condition and results of operations.
The Brazilian General Data Protection Law (Lei Geral de Proteção de Dados) or the “LGPD,” which came into force on September 18, 2020, is a comprehensive data protection law establishing general principles and obligations that apply across multiple economic sectors and contractual relationships. The LGPD applies to individuals or legal entities, private or government entities, who process personal data in Brazil or collect personal data in Brazil or, further, when the processing activities have the purpose of offering or supplying goods or services to data subjects located in Brazil. The LGPD establishes detailed rules for the collection, use, processing and storage of personal data (including personal data of clients, suppliers and employees), and affects all economic sectors, including the relationship between customers and suppliers of goods and services, employees and employers and other relationships in which personal data is collected, whether in a digital or physical environment. Specifically, the LGPD establishes, among others, personal data owners’ rights, the legal basis for personal data protection, requirements for obtaining consent from data owners, obligations and requirements related to security incidents, data leaks and data transfers, as well as the creation of the National Data Protection Authority (Autoridade Nacional de Proteção de Dados), or the “ANPD,” for the purposes of monitoring, implementing and supervising compliance with the LGPD in Brazil. In the event of noncompliance with the LGPD, we may be subject to penalties, including (1) warnings, with the impositions of a deadline for the adoption of corrective measures; (2) a one-time fine of up to 2% (subject to an upper limit of R$50,000,000) of our revenue; (3) a daily fine (subject to an upper limit of R$50,000,000); (4) public disclosure of the violation; (5) the restriction of access to the personal data to which the violation relates, until corrective measures are implemented; (6) deletion of the personal data to which the violation relates; (7) partial suspension of the databases to which the violation relates for up to 12 months, until corrective measures are implemented; (8) suspension of the personal data processing activities to which the
violation relates for up to 12 months; and (9) partial or full prohibition on personal data processing activities. While we have put in place systems and processes to comply with the LGPD, there can be no assurance that our LGPD compliance efforts will be deemed appropriate or sufficient by regulatory authorities or by courts, such as the Brazilian Public Prosecution Office (Ministério Público). Moreover, as the LGPD requires further regulation from the ANPD regarding several aspects of the law, which are still unknown, and we may have difficulty adapting our systems and processes to the new legislation due to the legislation’s complexity. The changes have impacted, and could further adversely impact, our business by increasing our operational and compliance costs.
In Argentina, Law No. 25,326 on the Protection of Personal Data, or the “LPPD,” regulates issues related to the protection of data stored in files, records, databases, and other technical means of data processing, whether they are public or private, to guarantee the right to honor and privacy of people, as well as access to the information that is recorded about them. The owner of personal data has the power to exercise the right of access to it free of charge at intervals of no less than six months, unless a legitimate interest to not permit such access is proven in accordance with the LPPD. The Agency for Access to Public Information, in its capacity as the enforcement authority of the LPPD, has the power to administer complaints and claims filed by individuals whose rights have been affected due to a breach of current regulations on personal data protection.
Any additional privacy laws, rules or regulations enacted or approved in Brazil, Argentina or in other jurisdictions in which we operate could cause us to incur costs to correct the noncompliance with such laws,, expose us to uninsured liability, increase our risk of regulatory scrutiny, subject us to lawsuits and result in the imposition of material penalties and fines under state and federal laws or regulations, which could seriously harm our business, financial condition or results of operations. Any failure, real or perceived, by us to comply with our privacy policies or with any regulatory requirements or orders or other local, state, federal or international privacy or consumer protection-related laws and regulations could cause customers to reduce their purchases of our agricultural products and services and could have a material and adverse effect on our business.
Our operations are subject to disruptions by third parties who interfere with the possession of our real estate or our means of production.
Our operations are subject to disruption by third parties, including through illegal burnings, the invasion or occupation of our real estate, and the blocking of roads and agricultural land by members of certain social movements, environmental protection movements, as well as indigenous peoples, all of which is common practice in, and affects, the industry. In certain regions, including those where we own property or lease land under agricultural partnership agreements, available remedies, such as police protection and litigation, may be inadequate or nonexistent. In these cases, our operations, image and reputation may be affected, and we may be subject to legal and administrative litigation that may result in criminal and administrative penalties, including, but not limited to, suspension, shutdowns, and a requirement to pay fines, which may also result in the need for additional investments. In addition, we may be subject to civil liabilities for environmental damage, which includes the obligation to redress any damages caused to the environment and/or public health. The demonstration of the cause-and-effect relationship between the damage caused and action or omission is sufficient to trigger the obligation to redress environmental damage.
Moreover, social movements are active in Brazil and advocate land reform and mandatory property redistribution by the Brazilian government. Land invasions and occupations of rural areas by a large number of individuals is common practice for these movements, and, in certain areas, including those in which we have invested or are likely to invest, police protection and effective eviction proceedings are not available to land owners. As a result, there can be no assurance that our properties will not be subject to invasion or occupation by these groups. A land invasion or occupation could materially impair the normal use of our lands or have a material adverse effect on our results of operations, financial condition or the value of our common shares. In addition, our land may be subject to expropriation by the Brazilian government. Under the Brazilian Federal Constitution, the Brazilian government may expropriate land that is not in compliance with mandated local “social functions.” A “social function” is defined as including: (i) the rational and adequate use of land; (ii) the adequate use of natural resources available and preservation of the environment; (iii) compliance with labor laws; and (iv) the use of land to promote welfare of owners and employees. If the Brazilian government decides to expropriate any of our properties, our results of operations may be adversely affected, to the extent that potential compensation to be paid by the Brazilian government may be less than the profit we could make from the sale or use of such land. Disputing the Brazilian government’s expropriation of land is usually time-consuming and the outcomes of such challenges are uncertain. In addition, we may be forced to accept public bonds, which have limited liquidity, as compensation for expropriated land instead of cash.
In addition, along with the expropriation rights, Brazilian law also confers to the government the power to create public easements over third-party property. Public easements are commonly used where infrastructure projects require the use of multiple plots of land, in particular in rural areas (e.g. transmission lines or oil and gas pipelines). Public easements require the payment of fair and prior indemnification, which authorizes the government to use such property for the public interest. The
creation of a public easement must observe the same procedures applicable for the expropriation of real property. However, unlike expropriation, the public easement does not remove the property from the owners’ estate, but only creates the right of using the property or part of it. The creation of a public easement on our land, including on our farmland, would mean we would be prevented from using the relevant piece of land, which could adversely affect our results of operations and financial condition.
Risks associated withRelated to the Countries in which we operateWhich We Operate
We operate our business in emerging markets.
Our results of operations and financial condition are dependent upon economic conditions in thosethe emerging countries in which we operate, and any decline in economic conditions could harm our results of operations or financial condition.operate.
All of our operations and/or development activities are in South America. As of December 31, 2020,2023, based on total asset value, 44.8%40.3% of our assets were located in Argentina, 47.3%52.1% in Brazil and 4.0%4.6% in Uruguay. During the year ended December 31, 2020, 50.1%2023., 27.9% of our consolidated sales of goods and services rendered were attributable to our BrazilianArgentine operations, 47.3%27.8% were attributable to our ArgentineBrazilian operations and 2.6%43.8% were attributable to our Uruguayan operations. In the future, we expect to have additional operations in the South American countries in which we now operate or in other countries with similar political, economic and social conditions. Many of these countries have a history of economic instability or crises (such as inflation or recession), government deadlock, political instability, civil strife, changes in laws and regulations, expropriation or nationalization of property, and exchange controls which could adversely affect our business, financial condition and results of operations.
In particular, fluctuations in the economies of Argentina, Brazil and BrazilUruguay, and actions adopted by the governments of those countries have had and may continue to have a significant impact on companies operating in those countries, including us. Specifically, we have been affected and may continue to be affected by high levels of inflation, increased interest rates, fluctuations in the value of the Argentine Peso and the Brazilian Real (“Real”) against foreign currencies, wage controls, price and foreign exchange controls, regulatory policies, business and tax regulations, political and social tension, and in general by the political, social and economic scenarios in Argentina, and Brazil and to a lesser extent, Uruguay.
The Argentine economy has experienced significant volatility in past decades, including numerous periods of low or negative growth and high and variable levels of inflation and currency devaluation. Inflation remains a challenge for Argentina given its persistent nature in recent years and also considering its high levels during 2022 and 2023. No assurances can be given that the rate of growth experienced over past years will be achieved in future years or that the national economy will not suffer a recession. If economic conditions in Argentina were to continue slowing down, or contract, if inflation were to accelerate further, or if the Argentine government's measures to attract or retain foreign investment and international financing in the future to incentivize domestic economy activity are unsuccessful, such developments could adversely affect Argentina's economic growth and in turn affect our financial health and results of operations.
Moreover, presidential and congressional primary and general elections in Argentina took place in August and October 2023, respectively. Due to the results obtained on August 13, the two candidates with the largest number of votes, that is, Javier Milei and Sergio Massa, had to go to a second round, held on November 19, where the candidate of “La Libertad Avanza” was elected president with 55.65% of the votes. Ever since the beginning of its mandate, Javier Milei Administration has implemented various policies aimed to deregulate the economy in order to address the economic and social crisis. In that intelligence, on December 20, 2023, through the Decree of Necessity and Urgency No. 70/2023 (“DNU 70/2023”, for its Spanish acronym), the Executive Branch declared the public emergency in economic, financial, fiscal, administrative, social security, tariff, sanitary and social matters until December 31, 2025 and included numerous amendments and repeals of several laws.
However, the Argentine Constitution provides for a control by the Legislative Branch of DNU 70/2023. The Chamber of Senators has recently rejected the DNU. Deputies have not issued an opinion of the DNU 70/23 yet. It will remain in force as long as it is not expressly rejected by both Chambers of Congress. In addition to the control by Congress, DNU 70/23 is also subject to judicial review as to its constitutionality in cases arising from its entry into force or application. As these measures must still be approved, modified or rejected by Congress, their validity and long-term impact on the economy and our business remain uncertain.
Additionally, in Brazil, the president has the power to enact policies and issue orders relating to the Brazilian economy, including the sector in which we operate, through specific regulations or through their control over Petrobras, our sole supplier of gasoline, diesel and certain other oil by-products, which could affect our operations and financial performance in Brazil. Political and economic uncertainty and any new policies or changes in current policies could have a material adverse effect on our business, operating results, financial condition and prospects. And any difficulty by the Brazilian government in
obtaining a majority in the national Congress could result in congressional stalemate, political unrest and massive demonstrations and/or strikes that could adversely affect our operations. Uncertainties in relation to the implementation, by the current government, of changes related to monetary, fiscal and social security policies, as well as to the pertinent legislation, can contribute to economic instability. These uncertainties and new measures may increase the volatility of the Brazilian securities market.
Economic and political conditions in the countries in which we operate, and the perception of these conditions in international markets, may adversely impact our business, our access to the capital and debt markets, and our results of operations and financial condition.
The Brazilian and Argentine economies have experienced extreme volatility in recent decades, with uneven periods of economic growth, periods of high inflation and devaluation of the Peso and the Real against the U.S. dollar. Our business and operations may be affected by the economic and political events that may affect the Brazilian and Argentine economies, such as price controls, foreign exchange controls, currency devaluations, high interest rates, increased public expenditures, tax increases or other regulatory initiatives.
The credibility of several Argentine economic indices during the Ms. Cristina Fernández de Kirchner administration (from 2004 through 2015) has been called into question. By previously understating inflation, INDEC overstated economic growth in real terms. The adjustments made by the Mr. Mauricio Macri administration to INDEC, beginning in 2016, led to a determination of real gross domestic product (“GDP") growth of 48.6% between 2004 and 2015 rather than the officially reported 65% growth. Because of these reforms, on November 9, 2016, the Executive Board of the International Monetary Fund (“IMF”) lifted its censure on Argentina, noting that Argentina had resumed the publication of data in a manner consistent with its obligations under the Articles of Agreement of the IMF. On June 29, 2017, INDEC also published revised GDP data for the years 2004 through 2015. According to INDEC, Argentina’s GDP increased 11.9% in 2021, grew cumulatively by 6.4% in 2022 and decreased 4.5% in 2023. According to the IMF, Argentina’s GDP is expected to decrease by 2.8% in 2024. Moreover, since 2015, international commodity prices for Argentina’s primary commodity exports have fluctuated, which has had an adverse effect on Argentina’s economic growth. Reliance on the export of certain commodities, such as soy, has made the Argentine economy more vulnerable to fluctuations in the prices of commodities. If international commodity prices decline, the Argentine economy could be adversely affected. In addition, adverse weather conditions can affect the production of commodities by the agricultural sector, which accounts for a significant portion of Argentina’s export revenues.
Throughout 2020, 2021, 2022 and 2023, social and political tension and high levels of poverty and unemployment persisted while industrial activity and consumption diminished considerably. The deterioration of the economy significantly increased the social and political turmoil, including civil unrest, riots, looting, nationwide protests, strikes and street demonstrations. Due to the high levels of inflation and devaluation, employers both in the public and private sectors are experiencing significant pressure from organized labor unions and their employees to further increase salaries.
On December 23, 2019, the “Ley de Solidaridad Social y Reactivación Productiva” or the Social Solidarity Law was enacted. The Social Solidarity Law decreed a public emergency in economic, financial, fiscal, administrative, social security, tariff, energy, health and social matters. As a result of this measure, the Argentine President and Congress gained considerable powers to alter governmental policies and measures related to the Argentine economy. However, the decline in the GDP of Argentina, the deepening recession and the increase in unemployment has led to an increase in poverty, which, according to INDEC, by the first semester of 2023 affected more than 40.1% of the population. We cannot now fully estimate the impact that the measures currently adopted by the government, or those that it may implement in the future, will have on the Argentine economy as a whole and on the business, equity and results of our operations. Persistent inflation, increased unemployment, decreased GDP, Peso depreciation, and/or other future economic, social and political developments in Argentina, over which we have no control, may adversely affect our financial condition or results of operations.
In 2019 rigid restrictions and foreign exchange controls were reintroduced, which, among other things, significantly curtailed access to the official foreign exchange market (the Mercado Libre de Cambios or “FX Market”) by individuals and entities. See “Item 10. Additional Information—D. Exchange Controls.”
Moreover, a significant portion of our operations, properties and customers are located in Brazil. Accordingly, our financial condition and results of operations are substantially dependent on economic conditions in Brazil. Historically, Brazil’s political situation has influenced the performance of the Brazilian economy, and political crises have affected the confidence of investors and the general public, which has resulted in economic deceleration and heightened volatility in the securities issued abroad by Brazilian companies. Future developments in policies of the Brazilian government and/or the uncertainty of whether and when such policies and regulations may be implemented may adversely affect our results of operations and financial condition. The Brazilian economy has experienced significant volatility in recent decades, characterized by periods of low or negative growth, high and variable levels of inflation and currency devaluation. The Brazilian GDP decreased 3.3% in 2016, increased 1.3% in 2017, 1.3% in 2018 and 1.1% in 2019, decreased 4.1% in 2020, increased 4.6% in 2021 , 2.9% in 2022 and
2.2% *in 2023. There can be no assurance that GDP will increase or remain stable in the future. Future developments in the Brazilian economy may affect Brazil’s growth rates and, consequently, the consumption of sugar, ethanol, and our other products. As a result, these developments could impair our business strategies, results of operations and financial condition.
Additionally, the effects of any new policies to be implemented by the government of Mr. Luiz Inácio Lula da Silva on the economy and the confidence of foreign investors in Brazil are still unclear. Accordingly, we cannot determine the scope of potential impacts resulting from such events on the economy and our business at this stage.
The economies of the countries in which we operate may be adversely affected by the deterioration of other global markets.
Financial and securities markets in the countries in which we operate are influenced, to different degrees, by the economic and market conditions in other countries, including other South American and emerging market countries and other global markets. Investors’ reactions to developments in these other countries, such as the recent developments in the global financial markets, may substantially affect the capital flows into, and the market value of securities of issuers with operations in, the countries in which we operate.
A significant deterioration in the economic growth of any of the main trading partners of Brazil, Argentina or ArgentinaUruguay could have a material impact on the trade balance of those countries and could adversely affect their economic growth and that of other countries in the region. Furthermore, adverse economic conditions in any of these countries could have a material adverse effect on our business, financial condition and results of operations.
A crisis in global financial markets including other emerging country markets could dampen investor enthusiasm for securities of issuers with South American operations, including our common shares. The COVID-19 pandemic has negatively impacted global financial markets ushering significant risk and volatility. These effects
Although economic conditions vary from country to country, investor reactions to events occurring in one country sometimes demonstrate a “contagion” effect in which an entire region or class of investment is disfavored by international investors. Furthermore, weak, flat or negative economic growth in any of Brazil’s or Argentina’s major trading partners, including each other, could adversely affect their balance of payments and, consequently, its economic growth.
The Argentine and Brazilian economies may also be affected by conditions in developed economies, such as the market priceUnited States, that are significant trading partners of Brazil or Argentina or have influence over global economic cycles and the short-term evolution of commodity prices. If interest rates increase significantly in developed economies, including the United States, Argentina and its developing economy trading partners, such as Brazil, could find it more difficult and expensive to borrow capital and refinance existing debt, which could adversely affect economic growth in those countries. Decreased growth from Argentina’s trading partners could have a material adverse effect on the markets for Argentina’s exports and, in turn, adversely affect economic growth. Any of these potential risks to the Argentine economy could have a material adverse effect on our common shares,business, financial condition and results of operations.
In addition, Brazil and Argentina are highly dependent on the export of certain commodities, such as well as make it difficultsoy, which has made the Brazilian and Argentine economies more vulnerable to fluctuations in commodity prices. If international commodity prices decline, the Brazilian or Argentine economies could be adversely affected. In addition, adverse weather conditions can affect the production of commodities by the agricultural sector, which account for usa significant portion of Brazil’s and Argentina’s export revenues. All these circumstances could have a negative impact on the levels of government revenues, available foreign exchange and the government’s ability to access capital marketsservice its sovereign debt, and obtain financing forcould either generate recessionary or inflationary pressures, depending on the government’s reaction. Either of these results would adversely impact Brazil’s or Argentina's economic growth and, therefore, our operations in the future, on acceptable terms or under any conditions.financial condition and results of operations.
Governments have a high degree of influence in the economies in which we operate, which could adversely affect our results of operations or financial condition.
Governments in many of the markets in which we currently operate, or thatin which we may operate in the future, frequently intervene in their respective economies and occasionally make significant changes in monetary, credit, industry and other policies and regulations. Governmental actions to control inflation and other policies and regulations have often involved, among other measures, price controls, currency devaluations, capital controls and limitations on imports. We have no control over, and cannot predict what measures or policies governments may take in the future. Our results of operations and financial condition may be adversely affected by changes in governmental policy or regulations in the jurisdictions in which we operate that impact different factors such as:
•labor laws and wage increases;
•changes in governmental economic or tax policies, and their effect on economic growth;
•abrupt currency fluctuations;
•high levels of inflation;inflation and the measures taken to combat it, such as price controls or price-fixing regulations;
•exchange and capital control policies;
•highsignificant variation in interest rates;
•the lack of liquidity of domestic capital and lending markets;
•inconsistent fiscal and monetary policy;policies;
•liquidity and solvency of thetheir respective financial system;systems;
•restrictions on land acquisition or use or agricultural commodity production, including limitations on ownership of rural land by foreigners;foreign persons or entities;
•developments in trade negotiations through the World Trade Organization or other international organizations;organizations, including as a result of import/export restrictions or other laws and policies affecting foreign trade and investment;
•environmental regulations;
•tax laws, including royalties and the effect of tax laws on distributions from our subsidiaries;
•changes in governmental economic or tax policies;
•restrictions on the repatriation of investments and on the transfer of funds abroad;
•expropriations or nationalizations;
•import/export restrictions or other laws and policies affecting foreign trade and investment;
•increase inincreased public expenses affecting the economy and fiscal deficits;
•price controls or price fixing regulations;
•restrictions on land acquisition or use or agricultural commodity production;deficits; and
•other political, social and economic developments, including political, social or economic instability, in or affecting the country where each business is based.
Uncertainty over whether governments will implement changes in policy or regulation affecting these or other factors in the future may contribute to economic uncertainty and heightened volatility in the securities markets, which may have a material and adverse effect on our business, results of operations and financial condition.
For instance, the Argentine government has in the past exercised substantial control over the Argentine economy by setting certain industry market conditions and prices. The Social Solidarity Law, enacted in December 2019, froze electricity and natural gas tariff rates until December 31, 2020, and instructed the relevant regulatory agencies to pursue a mandatory renegotiation of those rates
On January 7, 2020, the former government relaunched a voluntary price control to foster consumption and establish reference prices for household products. Initially, 310 products were included in this program and public officials stated that the prices of the products included within the program were to be reduced by 8% on the average (including two of the milk products we sell). On November 10, 2022, new voluntary price controls were launched, which established reference prices until June 30, 2023, and that violation of price control measures would result in sanctions, including fines, which amount would be considered on a case-by-case basis at the time of issuing the relevant sanction by the enforcement authority. On April 4, 2020, the former government issued Decree No. 351/2020, which authorized the intervention by local authorities to control maximum prices and resulted in the need to allocate additional economic and human resources for our Argentine subsidiaries to comply with governmental requirements and filings pursuant to these regulations. Additionally, the Fernández administration created an informative regime for the purpose of publishing standard maximum prices of a basic listing of consumer products for each province, and a public and free mechanism that allowed the filing of claims and complaints by consumers and those included in the production, distribution and commercialization chain of the products included in the obligation to sell at maximum prices. This regulation impacted our processed rice and fluid milk products. Our facilities have been inspected to control compliance with this regulation.
As of the date of this annual report, there can be no assurance whether the Argentine government will enact new price control regulations. Interventions by the Argentine government similar to those described above can have an adverse impact on the level of foreign investment in Argentina, the access of Argentine companies to the international capital markets and Argentina’s commercial and diplomatic relations with other countries and, consequently, could adversely affect our business, financial condition and results of operations. In the future, the degree of governmental intervention in the economy may continue to rise, which may adversely affect the Argentine economy and, in turn, our business, results of operations and financial condition.
However, the Milei administration appears to have among its main objectives a significant reduction in the government’s intervention in the economy. For instance, at the end of December 2023 and January 2024, the government revoked 69 laws and regulations related to price controls, and reached an agreement with supermarket chains that led to the implementation of a new program called “Differentiated Prices” to maintain, on a provisional basis, a 20% discount on a list of 20 mass consumption products.
Moreover, historically, the Brazilian government has frequently intervened in the Brazilian economy and has occasionally made significant changes in economic policies and regulations, including, among others, the imposition of a tax on foreign capital entering Brazil, changes in monetary, fiscal and tax policies, currency devaluations, capital controls and limits on imports. The administration is currently facing domestic pressure to retreat from the current macroeconomic policies in an attempt to achieve higher rates of economic growth. In addition, the Brazilian government has discussed the creation of a tax on financial transactions, including wire transfers, in order to improve the fiscal situation of the country or to increase taxation. We cannot predict which policies will be adopted by the Brazilian government and whether these policies will negatively affect the economy or our business or financial performance.
In 2023, the Brazilian Congress approved and enacted Constitutional Amendment 132/23, which aims to reform the consumption tax system. Specifically, Constitutional Amendment 132/23 provides for the extinction of three federal taxes: (i) the Tax over Industrial Products (Imposto sobre Produtos Industrializados, or “IPI”), (ii) the Social Contribution on Gross Revenues (Programa de Integração Social, or “PIS”) and (iii) the Contribution for the Financing of Social Security (Contribuição para o Financiamento da Seguridade Social, or “COFINS”), which will be replaced by the Social Contribution on Operations with Goods and Services (Contribuição Social sobre Operações com Bens e Serviços, or “CBS”). Additionally, the amendment also involves the consolidation of state and municipal taxes. The Interstate and Intermunicipal Transportation Tax Over Goods and Services (Imposto sobre Operações relativas à Circulação de Mercadorias e sobre Prestações de Serviços de Transporte Interestadual e Intermunicipal e de Comunicação, or “ICMS”) which is a state tax, and the Tax on Services (Imposto Sobre Serviços, or ISS) which is a municipal tax, will be replaced by the new Tax on Operations with Goods and Services (Imposto sobre Bens e Serviços, or “IBS”). Constitutional Amendment 132/23 provides for a 10-year transition period so that it will be fully implemented in 2033. The tax reform may even reduce or eliminate tax benefits to the Company, and the loss of these tax benefits may directly or indirectly affect the Company’s business and operating results. Tax reform or any future changes in applicable legislation and regulations, which alter applicable taxes or special regimes during or after their periods of validity, may directly or indirectly affect the Company’s business and results of operations. The effects of these tax reform bills and any other changes resulting from the enactment of additional tax reforms cannot be quantified, are unpredictable and may directly or indirectly affect the Company’s business and results.
Furthermore, in March 2022, Brazilian federal tax rates on cooking gas and diesel were reset to zero by the Brazilian government. Later, in June 2022, this exemption was also extended to gasoline and ethanol. These suspensive measures were scheduled to last until the end of 2022. However, in January 2023, President Luiz Inácio Lula da Silva extended the federal tax exemption for gasoline and ethanol until February 28, 2023. Until the end of February 2023, the Federal Government partially raised federal taxes on gasoline and ethanol to R$0.47 per liter of gasoline and R$0.02 per liter for ethanol, reaching R$ 0.1309 per liter in June 2023. The tax exemption on diesel partially returned from September to October 2023; however, with the loss of validity of provisional measure no. 1,175, the zero rate returned from October to December 2023. We cannot predict the potential impact of the policies that will be adopted by the Brazilian government and whether these policies will negatively affect the economy and our business or financial performance.
Currency exchange rate fluctuations relative to the U.S. dollar in the countries in which we operate our businesses may adversely impact our results of operations and financial condition.
We operate exclusively outside the United States, and ourOur businesses may be impacted by significant fluctuations in foreign currency exchange rates. Our exposure to currency exchange rate fluctuations results from the currency translation adjustments required in connection with the preparation of our Consolidated Financial Statements. The currency exchange exposure stems from the generation of revenues and the incurrence of expenses in different currencies and the devaluation of local currency revenues impairing the value of investments in U.S. Dollars.dollars. While the Consolidated Financial Statements presented herein are, and our future Consolidated Financial Statements will be, presented in U.S. dollars, the financial statements of our subsidiaries are prepared using the local currency as the functional currency and translated into U.S. dollars by applying: (i) a year-end exchange rate for assets and liabilities; and (ii) an average exchange rate for the year for income and expenses. Resulting exchange differences arising from the translation to our presentation currency are recognized as a separate component of equity. Currencies in Argentina and Brazil have fluctuated significantly against the U.S. dollar in the past. Accordingly, fluctuations in exchange rates relative to the U.S. dollar could impair the comparability of our results from period to period and have a material adverse effect on our results of operations and financial condition.
Argentina has a history of high volatility in its FX Market, including sharp and unanticipated devaluations, tight foreign exchange controls and severe restrictions on foreign trade. The devaluation of the Peso may have a negative impact on the ability of certain Argentine businesses to service their foreign currency denominated debt. It could also lead to higher inflation rates, significantly reduce real wages and jeopardize our business. The Peso depreciated 21.86% against the U.S. dollar 356.3%, 72.5% and 22.1% in 2016, 17.36% in 2017, 102.16% in 2018, 58.86% in 20192023, 2022 and 40.51% in 2020,2021, respectively, based on the official exchange rates published by the Argentine Central Bank (Banco Central de la República Argentina - BCRA).Argentina), or the “BCRA.” In the past, years, the Argentine government has imposed restrictions on the purchase of foreign currency, (see “—Risks Related to Argentina—Exchange controls could restrict the inflow and outflow of funds in Argentina and may substantially limit the ability of companies to retain or obtain foreign currency or make payments abroad.”) which measures gave rise to an unofficial market where the U.S. dollar traded at a different market value than reflected in the official Argentine Peso – U.S. DollarPeso-U.S. dollar exchange rate. Due to theIn September 2019, following a foreign exchange crisis generated in August 2019 and the continued reduction of the Argentine Central Bank’sBCRA’s foreign currency reserves, since September 1, 2019 the Argentine government reinstated rigid exchange controls and transfer restrictions, substantially limiting the ability to obtain foreign currency or make certain payments or distributions out of Argentina (see “— Risks Related to Argentina — Argentina. See “—Exchange controls restrict the inflow and outflow of funds in Argentina and may substantially limit the ability of companies to retain or obtain foreign currency or make payments abroad”).abroad.”
The Brazilian currency has also historically suffered frequent fluctuations. As a consequenceresult of inflationary pressures, in the past, the Brazilian government has implemented various economic plans and adopted a number of exchange rate policies, including sudden devaluations, periodic mini-devaluations during which the frequency of adjustments has ranged from daily to monthly, floating exchange rate systems, exchange controls and dual exchange rate markets. Formally, the value of the Realreal against foreign currencies is determined under a free-floating exchange rate regime, but, in factpractice, the Brazilian government is currently interveningintervenes in the market,markets through currency swaps and trading in the spot market, among other measures, every time the currency exchange rate is above or below the levels that the Brazilian government considers appropriate, taking into account inflation, growth, the performance of the Realreal against the U.SU.S. dollar in comparison with other currencies, and other economic factors. Periodically, there are significant fluctuations in the value of the Real against the U.S. dollar. The Real appreciated 7.2% in 2023 and 6.5% in 2022, and depreciated 46.2% against the U.S. dollar7.4%, 28.9% and 4.0% in 2015 and appreciated 16.8% in 2016. In 2017, 2018each of, 2021, 2020 and 2019, the Real depreciated against the U.S. dollar 1.5%, 17.1% and 4.02%, respectively. In 2020 the Real depreciated 28.9% against the U.S. dollar.
Future fluctuations in the value of the local currencies relative to the U.S. dollar in the countries in which we operate may adversely affect our results of operations or financial condition could be adversely affected.condition.
Inflation in some of the countries in which we operate, along with governmental measures to curb inflation, may have a significant negative effect on the economies of those countries and, as a result, on our financial condition and results of operations.
In the past, someSome of the countries in which we operate, particularly Argentina and Brazil, have experienced, or are currently experiencing, high rates of inflation, adversely affecting their economies and financial markets, and limiting the ability of their governments to create conditions that stimulate or maintain economic growth. Although inflation rates in some of these countries (other than Argentina, as further explained in “-Risks Related to Argentina-Our results of operations may be adversely affected by high and possibly increasing inflation in Argentina”) have been relatively lowcurtailed in the recent past, we cannot assure youthere can be no assurance that this trend will continue. The measuresMeasures taken by the governments of these countries to control inflation have often included maintaining a tight monetary policy with high interest rates, thereby restricting the availability of credit and retardingimpairing economic growth. Measures to combat inflation and public speculation about possible additional actions have also contributed significantly to economic uncertainty in many of these countries and to heightened volatility in their securities markets. Periods of higher inflation may also slow the growth rate of local economies. Inflation is also likely to increase some
of our costs and expenses, whichand we may not be able to fully pass such increases on to our clients, which could adversely affect our operating margins and operating income.
A For instance, a portion of our operating costs in Argentina are denominated in Argentine Pesos and most of our operating costs in Brazil are denominated in Brazilian Reais. Inflation in Argentina or Brazil, without a corresponding Peso or Real devaluation, could result in an increase in our operating costs without a commensurate increase in our revenues, which could adversely affect our financial condition and our ability to pay our foreign currency denominated obligations.
Historically, inflation has materially undermined the Argentine economy and the government’s ability to create conditions that would permit long-term and stable growth. In recent years, Argentina has experienced high inflation rates. High inflation may also undermine Argentina’s foreign competitiveness in international markets and adversely affect economic activity and employment, as well as our business and results of operations. In particular, the profit margin on our services is impacted by the increase in our costs in providing those services, which is influenced by wage inflation in Argentina, as well as other factors. Since 2008, the Argentine economy has been subject to strong inflationary pressures which, according to private sector analysts, reached an average annual rate of 28.2% between 2010 and 2015. In 2007, INDEC was subject to a process of institutional and methodological reforms that led to controversies regarding the credibility of the information published by it, including the Consumer Price Index, or the “CPI.” On January 7, 2016, the Argentine Statistics and Census Agency (Instituto Nacional de Estadísticas y Censos - “INDEC”)INDEC ceased publishing certain statistical data and, after implementing methodological reforms, resumed publications of the Consumer Price Index (“CPI”)CPI on June 16, 2016, which reached2016. The CPI tallied annual rates of 40.9% at211.4%, 94.8% and 50.9% in 2023, 2022, and 2021, respectively. If the endArgentine government continues to fail to address Argentina’s structural inflationary imbalance, the current levels of the fiscal year 2016, 24,8% at the end of the fiscal year 2017, 47.6% at the end of fiscal year 2018, 53.8% at the end of fiscal year 2019 and 36.1% at the end of fiscal year 2020 (see “— Risks Relatedinflation may continue to Argentina-The credibility of several Argentine economic indices have been called into question,rise, which may lead to a lackhave an adverse effect on Argentina’s economy.
—Risks Related to Argentina— Our results of operations may be adversely affected by high and possibly increasing inflation in Argentina”).
Brazil, in turn, has historically experienced high rates of inflation. Inflation, as well as government efforts to curb inflation, hashave had significant negative effects on the Brazilian economy, particularly prior to 1995. The inflation rateInflation was 7.2% in 2016, as measured by the General Market Price Index (Indice(Índice Geral de Preços -– Mercado), compiled by the Getulio Vargas Foundation (Fundação Getúlio Vargas). However, in cash costs and our operating expenses are denominated in Brazilian Reais and tend to increase with Brazilian 2017 Brazil registered a deflation of 0.53% due to a decrease in the price of food products. In 2018 Brazil then registered an inflation of 7.3% and 7.5%, 7.3% in 2019 and 2018, respectively, and, mainly due to the depreciation of the Brazilian Real against the U.S. dollar and the increase of thein prices of primary products, and 23.14%inflation was 23.1% in 2020 due to COVID-19, the depreciationand 17.8% in 2021. In 2022, Brazil registered an inflation of the Brazilian Real against the U.S. dollar5.4% and, the increasein 2023, a deflation of the prices of primary products.3.2%. A significant proportion of our cash costs and our operating expenses are denominated in Brazilian Reais and tend to increase with Brazilian inflation.
The Brazilian government’s measures to control inflation have in the past included and currently include maintaining a tight monetary policy with high interest rates, thereby restricting the availability of credit and reducing economic growth. This policy has changed in the last two years,was abated between 2016 and January 2021, when the Special System for Settlement and Custody rate (Sistema Especial de Liquidação e Custódia), or the “SELIC” rate (the base Brazilian governmentinterest rate), which is set by the Monetary Policy Council (Comitê de Política Monetária), or the “COPOM,” was decreased the interest rate by 775 basis points.from 14.25% to 2.00%. Subsequently, the highincreased inflation arising from the lower interest rate, and the intention to maintain this rate at low levels,abate inflation rates led the Brazilian government to adopt other measures to control inflation, such as tax relief for several sectors of the economy and tax cuts for the products included in the basic food basket. These measures were not sufficient to control the inflation, which led the Brazilian government to reinstate a tighter monetary policy. As a result, interest rates have fluctuated significantly. The Special System for Settlement and Custody (Sistema Especial de Liquidação e Custódia, or “SELIC”) interestyear-end SELIC rate in Brazil at year-end was 4.50%, 2.00%, 9.25% and 13.75% in 2016, 7% in 2017, 6.5% in 2018, 4.5% in 2019, 2020, 2021 and 2.00% in 2020 as determined by2022, respectively. At the Comitê de Política Monetária, or COPOM.end of 2023 SELIC rate was at 11.75%. As of the date of this annual report, the SELIC rate is set at 10.75%.
Argentina and/or Brazil may experience highhigher levels of inflation in the future, which may impact domestic demand for our products. Inflationary pressures may also weaken investor confidence in Argentina and/or Brazil, curtail our ability to access foreign financial markets and lead to further government intervention in the economy, including interest rate increases, restrictions on tariff adjustments to offset inflation, intervention in foreign exchange markets, and actions to adjust or fix currency values, which may trigger or exacerbate increases in inflation, and consequently have an adverse impact on us. In an inflationary environment, the value of uncollected accounts receivable, as well as of unpaid accounts payable, declines rapidly. If the countries in which we operate experience high levels of inflation in the future and price controls are imposed, we may not be able to adjust the rates we charge our customers to fully offset the impact of inflation on our cost structures, which could adversely affect our results of operations or financial condition.
Despite the positive effects the depreciation of the Peso may have on the competitiveness of certain sectors of the Argentine economy, including our business, it also had a negative impact on the financial condition of many Argentine businesses and individuals. The devaluation of the Peso affected or may affect the ability of certain Argentine businesses to honor their foreign currency-denominated debt, generates high levels of inflation, reduces real wages significantly, and has a negative impact on companies oriented to the domestic market, such as public services and the financial industry. Additional volatility, appreciation or depreciation of the Peso, or reduction in the BCRA’s international reserves due to currency interventions could adversely affect the Argentine economy, which, in turn, may have an adverse effect on our financial condition and results of operations. Inflation has also contributed to a material increase in our costs of operation, in particular labor costs; it also enables a reduction in the purchasing power of the population, thus increasing the risk of a lower level of consumption from our customers in Argentina, which could negatively impact our financial condition and results of operations. Inflation rates could continue to grow in the future, and there is uncertainty regarding the effects that any measures adopted by the government could have to control inflation.
Inflation can also lead to an increase in Argentina's debt and have an adverse effect on Argentina's ability to service its debt, mainly in the medium and long term when most inflation-indexed debt matures. In addition, weaker fiscal results could have a material adverse effect on the Argentine government's ability to access long-term financing, which, in turn, could adversely affect Argentina's economy and financial condition and access to international or domestic capital markets. If the measures adopted by the Argentine government are not able to resolve the structural inflationary disruptions of Argentina, the current inflationary levels could rise and have a negative impact on the economic and financial conditions of Argentina, and, as such, adversely affect our operations and financial condition.
Depreciation of the Peso or the Real relative to the U.S. Dollardollar or the Euroeuro may also create additional inflationary pressures in Argentina or Brazil that may negatively affect us. Depreciation generally curtails access to foreign financial markets and may prompt government intervention, including recessionary governmental policies. Depreciation also reduces the U.S. Dollardollar or Euroeuro value of dividends and other distributions on our common shares and the U.S. Dollardollar or Euroeuro equivalent of the market price of our common shares. Any of the foregoing might adversely affect our business, operating results and cash flow, as well as the market price of our common shares.
Conversely, in the short term, a significant increase in the value of the Peso or the Real against the U.S. Dollardollar would adversely affect the respective Argentine and/or Brazilian government’s income
from exports. This could have a negative effect on gross domestic product (“GDP”)GDP growth and employment, and could also reduce the public sector’s revenues in those countries by reducing tax collection in real terms, as a portion of public sector revenues are derived from the collection of export taxes.
Any deterioration in Brazil’s or our credit rating may adversely affect the trading price of our common shares and us.
Credit ratings affect investors’ perceptions of risk and, as a result, the yields required on issuances of indebtedness in the financial markets. Rating agencies regularly evaluate Brazil and its sovereign ratings, taking into account a number of factors, including macroeconomic trends, fiscal and budgetary conditions, indebtedness and the prospect of change in these factors.
27In 2021, Standard & Poor’s maintained Brazil’s credit rating at BB- with a stable outlook. In June 2023, Standard & Poor’s adjusted its outlook to positive. In December 2023, Standard & Poor’s upgraded Brazil’s credit rating from BB- to BB. In 2021, Moody’s confirmed Brazil’s credit rating at Ba2 with a stable outlook. In 2021, Fitch reaffirmed Brazil’s credit rating at BB-, with a negative outlook. In June 2023, Fitch upgraded Brazil’s credit rating to BB with a stable outlook.
The review in Brazil’s credit rating by Standard & Poor’s and Fitch to BB- in past years adversely affected the trading price of debt and equity securities of Brazilian issuers. Any further downgrade of Brazil’s credit rating could heighten investors’ perception of risk and, as a result, increase the cost of debt issuances and adversely affect the trading price of our securities.
Additionally, any downgrade of our credit rating may adversely affect our ability to obtain loans and/or financings in the future or our cost of funding, which may increase the cost of funding our operations or the refinancing of our financial obligations, adversely affecting us.Disruption of transportation and logistics services, insufficient investment in public infrastructure or disruption to any aspect of the supply chain could adversely affect our operating results.
One of the main disadvantages of the agricultural sector in the countries in which we operate is that key growing regions lie far from major ports. As a result, efficient access to transportation infrastructure and ports is critical to the growth of agriculture as a whole in the countries in which we operate and of our operations in particular. Improvements in transportation infrastructure are likely to be required to make more agricultural production accessible to export terminals at competitive prices. A substantial portion of agricultural production in the countries in which we operate is currently transported by truck, a means of transportation significantly more expensive than the railrailroad transportation available to U.S. and other international producers. Our dependence on truck transportation may affect our position as a low-cost producer so thatwhich may impair our ability to compete in the world markets may be impaired.markets.
Substantial investments are required for road and rail improvement projects, which may not be completed on a timely basis, if at all. Any delay or failure in developing infrastructure systems could reduce the demand for our products, impede our products’ delivery or impose additional costs on us. We currently outsource the transportation and logistics services necessary to operate our business. Any disruption in these services could result in supply problems at our farms and processing facilities and impair our ability to deliver our products to our customers in a timely manner.
In Brazil, a strike held by truckers in May 2018 resulted in a complete stop ofcompletely halted road transportation throughout the country. As a consequence,result, the Brazilian government issued Provisional Measure No. 832 andenacted of Law No. 13,703/2018, which established a Minimum Pricebase price for Road Freight Transport Policyroad freight transportation and created the "Freight Table",a freight table, in which minimum and mandatory transportation cost values are set each six months by the AgêBrazilian Land Transportation Agency (Agência Nacional de Transportes Terrestres - ANTT (National Land Transport Agency). WithTerrestres), or the creation of the Freight Table,“ANTT.” These measures adversely affected many companies in the agribusiness sector were adversely affected by the increase inthrough increased transportation costs.
WeIn addition, we are exposed to the risk of disruption to any aspect of theour supply chain, to suppliers’ operations or to distribution channels, and the deterioration in the financial condition of aour trading partner.partners. These may be caused by a cyber-event, global health crisis, major fire, violent weather conditions or other natural disasters that affect the manufacturing or other facilities of our operating subsidiaries or those of their suppliers and distributors. In certain geographic areas where we operate, insurance coverage may not be obtainable on commercially reasonable terms, if at all. Coverage may be subject to limitations or we may be unable to recover damages from its insurers.
Disruption may also be caused by spread of infectious disease (such as COVID-19) or by a deterioration in labor or union relations, disputes or work stoppages or other labor-related developments affecting Adecoagro or its suppliers and distributors (See "— We may be exposed to risks related to health epidemics, and the COVID-19 in particular, that could adversely impact our ability to operate our business and operating results”).
Security breaches and other disruptions could compromise our technology infrastructure and information and expose us to processes disruption and liability, which would cause our business and reputation to suffer.
In the ordinary course of our business, we depend on technology to carry out our business. We also collect and store sensitive data, including intellectual property, our proprietary business information and that of our customers and suppliers, and personally identifiable information of our employees, in our data centers and on our networks. The secure processing, maintenance and transmission of this information is critical to our operations. In addition, these systems may require modifications or upgrades as a result of technological changes or growth in our business. Although we take actions to secure our systems and electronic information and have disaster recovery plans in case of incidents that could cause major disruptions to our business, these measures may not be enough. In January 2020, we experienced an invasion by a computer virus that temporarily compromised our network, and a significant number of our servers and personal computers at our corporate offices. Although the cyberattack did not impact our production operations systems or financial and accounting systems, we were required to execute a contingency plan to restore the affected services, and return to a safe and normal network conditions.
Despite our security measures, our information technology and infrastructure may be vulnerable to attacks by hackers or breached due to employee error, malfeasance or other disruptions. Any such breach could compromise our networks, our systems, and eventually suffer from systems disruption and/or having the information stored there accessed, publicly disclosed, lost or stolen. Any such access, disclosure or other loss of information could result in legal claims or proceedings, fines from governmental authorities, disrupt our operations, damage our reputation, and cause over costs to remedy the harm suffered, which could adversely affect our business/operating margins, revenues and competitive position.
Non-compliance with data protection laws could adversely affect our business.
We operate in a complex regulatory and legal environment that exposes us to compliance and litigation risks that could materially affect our business, financial condition and results of operations. These laws may change, sometimes significantly, as a result of political, economic or social events.
In addition, on August 14, 2018, the Brazilian Federal Law No. 13,709/2018 was enacted, which sets out comprehensive data protection procedures and general principles and obligations that apply across multiple economic sectors and contractual relationships (Lei Geral de Proteção de Dados, or the “LGPD”). The LGPD establishes detailed rules for the collection, use, processing and storage of personal data and will affect all economic sectors, including the relationship between customers and suppliers of goods and services, employees and employers and other relationships in which personal data is collected, whether in a digital or physical environment. The obligations established by LGPD are already in effect, and all legal entities are required to adapt their data processing activities to these new rules. The data protection regime imposes more stringent data protection standards on Brazilian residents.
We are currently evaluating the impact that the LGPD will have on our business practices and associate compliance costs.
Until adaptation in completed, any breaches of the LGPD may subject us to penalties and/or fines and a requirement to notify Governmental Authorities and parties whose data has been affected.
The prolonged home office period may increase our exposure to security breaches which can adversely affect us.
Effective August, 2021, failure to comply with LGPD can give rise to an administrative fine, per infraction, of up to 2% of group or conglomerate revenues in Brazil, up to a total maximum of fifty million reais (R$ 50,000,000.00) per infraction.
Until August 2021, however, even if no administrative sanctions may be imposed, the obligations arising from the LGPD are already enforceable and we may be subject to claims, indemnification and/or fines from data subjects, and/or other governmental authorities in general.
Risks Related to Argentina
The measures taken or to be implemented by the Argentine government in response to the COVID-19 pandemic may have an adverse effect on our business and operations
In March 2020, the World Health Organization declared the COVID-19 outbreak a pandemic. This pandemic, as well as the reality or fear of any other adverse public health developments, could adversely and materially affect, among other things, our manufacturing and supply chain operations, including due to the reduction or closure of our production units and the interruption of the supply of raw materials. The local, national and international response to the pandemic continues to rapidly evolve. Responses have included voluntary and, in some cases, mandatory quarantines as well as shutdowns and other restrictions on travel and commercial, social and other activities.
The Argentine government has taken several measures regarding the COVID-19 pandemic outbreak to date. On March 18, 2020, through Decree No. 287/2020 and Administrative Decision No. 409/2020, the Argentine Executive Branch extended the public health emergency following the increasing spread in Argentina. On March 20, 2020, the Decree No. 297/2020 (“Decree 297”) was published in the Official Gazette by which the Argentine Executive Branch implemented a social, preventive and mandatory isolation regime (“Mandatory Isolation Regime”), beginning on March 20, 2020, which was extended until November 8, 2020. As of the date of this report, the activities pursued by our Argentine subsidiaries, related to agricultural production, distribution and commercialization, were exempted from the Mandatory Isolation Regime. The new regulations did require our Argentine subsidiaries to guarantee the hygiene and safety conditions established by the Ministry of Health to preserve the health of their employees.
On March 31, 2020, the Argentine Executive Branch prohibited: (i) employment terminations without cause; (ii) employment terminations and/or suspensions for lack of workload; (iii) employment terminations and/or suspensions due to reduced workload; and/or (iv) employment terminations and/or suspensions for force majeure events. Suspensions pursuant to Section 223 bis of the Employment Contract Law, regarding suspensions due to lack of work and/or force majeure, were exempted from this prohibition. In addition, Decree No. 39/2021 further extended the prohibition on terminations without cause, terminations based on the lack or reduction of work, and suspensions for force majeure events until May 31, 2021. It is likely that these restrictions are further extended if the scenario remains the same or substantially similar to the current one.
Since November 9, 2020, pursuant to Decree No. 875/2020 the Mandatory Isolation Regime was replaced with a mandatory distance regime (“Mandatory Distance Regime”) in many Argentine provinces and areas. During the Mandatory Distance Regime, individuals must maintain a minimum social distance of two meters, use face masks in shared spaces, sanitize their hands, and strictly comply with the protocols for activities, recommendations, and instructions implemented by the provincial and federal health authorities. In case of detecting situations of risk of spread of the COVID-19, the provincial governors are empowered to reinstate the Mandatory Isolation Regime for individuals entering the Province or the City of Buenos Aires from other jurisdictions, with prior intervention of the provincial health authority and for a maximum period of fourteen days. The Mandatory Distance Regime implemented in April 9, 2021 new restrictions to means of transport, circulation of individuals, remote work, and a curfew limiting circulation in high sanitary-epidemiological risk. This Mandatory Distance Regime has been extended until April 30, 2021. The extension of the Mandatory Isolation Regime in several Argentine provinces as well as other actions taken by the government have resulted in hurdles for the commercialization, distribution and administrative aspects of our Argentine subsidiaries’ businesses.
Under the new regulations, the economic, industrial, commercial, and service activities by business entities, including Adecoagro, may be carried out, provided businesses have an operating protocol approved by the provincial health authority that includes all the recommendations and instructions of the federal health authority and restrict the use of closed surfaces allowing a maximum of 50% of their capacity (subject to certain exceptions). For more information on how the Company complies with these protocols see “Information of the Company—Business Overview—COVID-19—Government measures in Argentina and Brazil".
The measures to control the COVID-19 pandemic have negatively impacted global economy, disrupted financial markets and international trade, resulted in increased unemployment levels and significantly impacted global supply chains, all of which has had and may continue to have an adverse impact in Argentina’s economy and may negatively impact our industry and our business.
Maximum Prices and Supply Obligations
In connection with the declaration of the COVID-19 sanitary emergency, in order to guarantee the regular supply of essential products, on March 20, 2020, the Argentine Government issued general regulations (applicable to most producers) particularly, Resolution No. 100/2020 of the Secretary of Domestic Commerce, imposing the obligation to those who participate in the production, distribution and commercialization chain of certain products, to (i) sell products to their maximum prices set as of March 6, 2020; and (ii) increase production up to their facilities’ full capacity and provide the proper measures to guarantee their transport and supply. Originally, these obligations were supposed to be effective for a 30-day term. However, the Argentine Government successively extended these obligations, in principle, until May 15, 2021. It is likely that these obligations would be extended again. Since this regime has been in place, only certain and limited price increases had been authorized. Considering the inflationary context in the Argentine economy, since many of the product prices were capped to their prices as of March 20, 2020, with some few limited authorized increments, these measures have negatively impacted our Argentine subsidiaries’ businesses.
Additionally, the Argentine Government created (i) an informative regime for the purpose of publishing standard maximum prices of a basic listing of consumer products for each province (which will be available on the website www.preciosmaximos.produccion.gob.ar); and (ii) a public and free mechanism that allows the filing of claims and complaints by consumers and those included in the production, distribution and commercialization chain of the products included in the obligation to sell at maximum prices. This regulation impacted our processed rice and fluid milk products. The facilities of the Company have been inspected to control compliance of the abovementioned regulation. As long as this regulation is in place, the Company would face restrictions to freely implement price increases on the processed rice and fluid milk products.
Those measures (jointly with other announcements that up to the present have not being turned into regulations) suggest that the Argentine Government would be planning to enforce the Supply Act broadly to avoid potential shortage on the supply or increase in the prices of products deemed essential. Since, the Secretary of Domestic Commerce has notified several companies within the Argentine subsidiaries’ industries, urging them to work at full capacity. Some of them have even been formally accused of not complying with the Supply Act. Recently, by means of Resolution No. 330/2021, the Secretary of Domestic Commerce has officially urged all industrial and commercial “big business” to manufacture, distribute and market their goods and services to the maximum of their installed capacity, while the health emergency persists in Argentina.
On April 4, 2020 the Argentine Government issued Decree No. 351/2020, which authorized the intervention of local authorities (both at Provincial and Municipal level) to control maximum prices under the recently adopted regulations and adopted rules to coordinate the enforcement of regulations. This has resulted in the need to allocate additional economic and
human resources for the Argentine subsidiaries to comply with governmental requirements and filings pursuant to the regulations in place.
In accordance with Resolution No. 552/2020 (as amended), published on November 12, 2020, the Secretary of Domestic Commerce suspended the effects of Resolution No. 100/2020 for a list of products included in Annex I (among others, brown rice, prepared rice, condensed milks, soy milks, vegetable milks; and brie, camembert, blue and provolone cheeses) that due to their characteristics and purpose are not relevant for the satisfaction of the basic needs of consumers and users, until May 15, 2021.
The Supermarkets’ Shelves Law published on March 17, 2020 (as implemented by Decree No. 991/2020 published in the Official Gazette on December 15, 2020), is applicable to the products marketed by the Company. The main objectives of this law are: (i) to ensure that the price of certain products remains clear and competitive for the benefit of consumers, (ii) to maintain harmony and balance between economic operators, (iii) to expand the supply of artisanal, regional and national products produced by micro, small and medium-sized enterprises, and (iv) to promote the offer of products manufactured by small producers. Although the law is focused on supermarkets, it might have an impact on the Company’s commercialization strategies. The Supermarkets’ Shelves Law resulted in the Argentine government imposing increasing regulations affecting the Argentine subsidiaries’ businesses, often generating further marketing and distribution costs for the purposes of complying with these regulations.
On March 17, 2021, the Secretary of Domestic Commerce published in the Official Gazette Resolution No. 237/2021 which created a new information regime (Sistema Informativo para la Implementación de Políticas de Reactivación Económica) (“SIPRE”; after its acronym in Spanish), according to which the Company might have to submit extensive monthly reports on prices, production and sales. This regime has also increased compliance costs and forced the Argentine subsidiaries to allocate resources to comply with these information regimes.
Pursuant to Resolution No. 283/2021, published in the Official Gazette on March 31, 2021, the Secretary of Domestic Commerce created the Product Labeling Inspection and Compliance Monitoring System to ensure that certain product labels do not contain inaccurate information that deceives consumers (Sistema de Fiscalización de Rótulos y Etiquetas) (“SiFiRE”; after its acronym in Spanish). As provided in this regulation, this information regime is aimed at the defense of fair trade and the protection of consumer rights. The SiFiRE established a new set of rules applicable to the following product labels: (i) foods; (ii) beverages; (iii) drinkable foods; (iv) toiletries; (v) personal hygiene products and; (vi) personal care and household cleaning products suitable for human use and handling. Any misleading labels must be amended. If infringing products have already been launched to the market, suppliers and importers must place a correction sticker on them at their own expense. The sanctions provided in Consumer Protection Law No. 24,240 and Executive Order No. 274/2019 on Fair Trade may apply to corporations, including us.
Through Resolution No. 330/2021, published in the Official Gazette on April 9, 2021, the Secretary of Domestic Commerce ordered all companies from the commerce and industry sectors, that during 2019 have recorded total sales in the domestic market in excess of the amounts established by Resolution No. 220/2019 (i.e., companies which are not considered small or medium, pursuant to the parameters included therein), to increase their production up to the maximum of their installed capacity and to arbitrate appropriate measures to guarantee the transportation, distribution and supply of inputs and final goods produced throughout the Argentine Republic, until the sanitary emergency declared by the Social Solidarity and Productive Reactivation Law No. 27,541 remains in force (in principle, until December 21, 2021). This Resolution included a similar provision to the one already provided under Resolution No. 100/2020 referred to above.
Since Resolution No. 330/2021 does not include any specific requirements, it is difficult to determine at this time both its scope and how compliance with this regulation is going to be monitored by the Argentine Government. However, the Argentine subsidiaries expect to incur further compliance costs due to these regulations.
Any application of these measures could potentially affect costs, expenses and/or margins.
Remote Work
COVID-19 pandemic pressured most companies which were not excluded from the Argentine Isolation Regime to implement measures to guarantee remote work for their employees. Consequently, several liabilities such as cybersecurity, privacy policies, adequate computing devices and professional use of personal computing devices have to be implemented by such companies.
Although as of the date of this report the activities carried out by our Argentines subsidiaries have been excluded from the Argentine Isolation Regime, because it provides as “essential” activities and services related to production, distribution and agricultural commercialization, we cannot assure that this exception will continue to apply to our operations.
The foregoing measures taken by the Argentine government in response to the COVID-19 virus and any future actions that may implemented are material intrusions and limits on the ability of the Company to operate its businesses and which will adversely impact the price of our products and our operating results.
On August 14th, 2020, the Legal Regime of Teleworking Contract under Law No. 27,555 (the “Teleworking Law”) was published in the Official Gazette. This Law regulates dependent work provided from the employee's own home or from a place other than the employer's establishment and introduces modifications to the Labor Contract Law establishing the concept of teleworking. In addition, the Teleworking Law provides the minimum legal requirements for regulating teleworking, it delegates specific aspects to collective bargaining, recognizes rights and duties for those who work under this modality (e.g., right of reversibility, right to digital disconnection, trade union rights, right to privacy) and also provides regulations referring to working hours, provision of work tools and reimbursement of expenses.
On January 20, Executive Decree No. 27/2021 approving the regulation of the Teleworking Law was published in the Official Gazette, including provisions regulating certain aspects of the Teleworking Law: the right to digital disconnection; conditions under which caretaking tasks may be performed by teleworking individuals; limits and conditions for reversal; how work tools are to be provided and expenses reimbursed; union representation of teleworking individuals; health and safety conditions; employer oversight systems; and the right to privacy of teleworking individuals.
On February 5, Resolution 54/2021 of the Ministry of Labor, Employment and Social Security was published ordering that Teleworking Law will enter into force on April 1, 2021. As long as the restrictions to circulate due to the COVID-19 pandemic, the application of this law is in suspense.
Argentine economic and political conditions and perceptions of these conditions in the international market may have a direct impact on our business and our access to international capital and debt markets, and could adversely affect our results of operations and financial condition.
A significant portion of our operations, property and customers are located in Argentina. Consequently, the value of our assets and properties and the results of our operations depend on the macroeconomics, regulatory, social and political conditions of Argentina and on the exchange rates between the Argentine peso and foreign currency. These conditions include growth rates, inflation rates, exchange rates, taxes, foreign exchange controls, changes in the interest rates, changes of the state policies, social instability and other domestic and international political and economic events affecting Argentina.
The Argentine economy has experienced extreme volatility in the recent decades, with uneven periods of economic growth, periods of high inflation and devaluation of the Argentine Peso against the U.S. dollar. Our business and operations may be affected by the economic and political events that may affect the Argentine economy, such as: price controls, foreign exchange controls, currency devaluations, high interest rates, increase in public expenses, tax increase or other regulatory initiatives.
The credibility of several Argentine economic indices during the Fernández de Kirchner administration (years 2004 through 2015) has been called into question. By previously understating inflation, the INDEC had overstated economic growth in real terms. The adjustments made by the Macri administration to INDEC lead to a determination of real GDP growth of 48.6% for the period of 2004 to 2015, as opposed to 65% growth in real terms for the same period resulting from the information used prior to June 2016. Because of these reforms, on November 9, 2016, the Executive Board of the International Monetary Fund (the “IMF”) lifted its censure on Argentina, noting that Argentina had resumed the publication of data in a manner consistent with its obligations under the Articles of Agreement of the IMF. On June 29, 2017, INDEC also published revised GDP data for the years 2004 through 2015. According to the INDEC, Argentina’s GDP grew by 2.9% in 2017, compared to the same period in 2016. Additionally, according to the INDEC, Argentina’s GDP decreased by 2.5% in 2018, and 2.2% in 2019. In addition, in 2020 the general macroeconomic conditions worsened as a result of the COVID-19 pandemic. According to INDEC, during the second quarter of 2020, GDP declined by 19.1% year over year (which represented the most significant decline of the GDP in Argentine history) with a peak of 16.2% in the second quarter compared to the first quarter of 2020, and during the third quarter of 2020, economic activity declined by 10.2% year over year.
Since the beginning of 2015, international commodity prices for Argentina’s primary commodity exports have declined, which has had an adverse effect on Argentina’s economic growth. A continued decline in the international prices for
Argentina’s main commodity exports could have a direct negative effect on our business, results of operation and financial condition, as well as on Argentina’s economy.
On August 11, 2019, presidential and legis+lative primary elections were held in Argentina, in which Alberto Fernandez and former president Cristina Fernández de Kirchner from the “Frente de Todos” (a coalition formed to participate in the general elections) received 47.65% of the votes while president Mauricio Macri's party obtained 32.08%. On October 27, 2019, Alberto Fernández and Cristina Kirchner, as vice-president, won the presidential elections and took office on December 10, 2019.
After the primary elections, the markets reacted negatively, and the economic conditions continued to deteriorate. Due to, among other things, the rise of inflation, the continued demand for salary increases, the growth of the fiscal deficit, the required payments to be made on public debt, the reduction of industrial growth, the recession and the increase of the capital outflows from Argentina, the Government of former President Macri re-introduced rigid restrictions and foreign exchange controls in September 1, 2019, which among other things, significantly curtailed access to the official foreign exchange market (the “FX Market”or Mercado Libre de Cambios) by individuals and entities (see “Additional Information-Exchange Controls”).
During the end of 2019 and early 2020, social and political tension and high levels of poverty and unemployment persisted industrial activity and consumption diminished considerably. The deterioration of the economy significantly increased the social and political turmoil, including civil unrest, riots, looting, nationwide protests, strikes and street demonstrations. Due to the high levels of inflation and devaluation, employers both in the public and private sectors are experiencing significant pressure from organized labor unions and their employees to further increase salaries (see “— The Argentine government may order salary increases to be paid to employees in the private sector, which would increase our operating costs”).
On December 23, 2019, the Social Solidarity and Productive Reactivation Law No. 27,541 was published in the Official Gazette, which declared the public emergency in economic, financial, fiscal, administrative, social security, tariff, energy, health and social matters. As a result of this measure, the Argentine president and the National Congress have gained considerable powers to alter governmental policies and measures related to the Argentine economy (See “— The impact of the Argentine congressional and presidential elections on the future economic and political environment of Argentina remains uncertain”).
Since December 2019, upon the outbreak of the COVID-19, the global economy has been negatively impacted, causing the disruption of the financial markets and international trade, resulting in increasing unemployment levels and significantly impacting global supply chains, all of which has had and continues to have an adverse impact in Argentina’s economy and may negatively materially impact our industry and our business (See “ – The measures taken or to be implemented by the Argentine government in response to the COVID-19 pandemic may have an adverse effect on our business and operations). The decline in the GDP in Argentina, the deepening recession and the increase of the unemployment also led to an increase in poverty, which, according to INDEC, as of June 30, 2020 affected more than 40.9% of the population.
Regarding the foreign exchange market and restrictions, in an effort to contain the escalation of the currency exchange rate, the Argentine Central Bank has been selling its reserves of U.S. dollars, which has resulted in a decrease in the Argentine Central Bank's international reserves from US$65.7 billion as of December 31, 2018 to US$39.4 billion as of December 31, 2020. However, the actual net liquid international reserves of the Argentine Central Bank would be substantially lower, as informed by private sources. Moreover, the Argentine government has been financing all economic assistance related to the COVID-19 pandemic with a significant issuance of currency, which has also contributed to increase inflation, the demand for U.S. dollars and the devaluation of the peso.
The Argentine government also adopted measures regarding sovereign debt, including a “re-profiling” or restructuring of certain public debt bonds subject to Argentine law and also conducted a debt restructuring process of sovereign bonds subject to foreign law which was closed during August 2020 (See " —The economy of Argentina may be affected by its government’s limited access to financing from international markets and the result of any failure to pay its debt obligations and the current debt restructuring process").obligations.
The failure of the Argentine Government to restructure its current debt with the IMF and to address the Argentine macroeconomic problems is worsening the economic conditions. In this regard, the country risk index published by J.P. Morgan as of March 4, 2021 reached a peak of 1547 basis points since the successful restructuring of the Argentine international sovereign bonds in August 2020. IfHistorically, the Argentine government does not restructure its outstandingand provinces have defaulted on debt withpayments, which has limited their access, as well as that of private companies, to the IMF and other international financial institutions and continues failing to urgently address the necessary measures to improve the macroeconomic condition of the country, the current economic conditions, including inflation, unemployment, decline in GDP, Peso depreciation, and/or other economic factors over which we do not have control may continue to worsen, eventually
provoking a general economic collapse, which could have an adverse effect on our financial condition, results and costs of operations.
We cannot now fully estimate the impact that the measures currently adopted by the government, or those that it may implement in the future, will have on the Argentine economy as a whole and on the business, equity and results of our operations.
Continuing inflation, increase of unemployment, decline in GDP, peso depreciation, and/or other future economic, social and political developments in Argentina, over which we have no control, may adversely affect our financial condition or results of operations.
The impact of the Argentine congressional and presidential elections on the future economic and political environment of Argentina remains uncertain.
Since taking office in December 10, 2019, the Alberto Fernández administration (the “Fernández Administration”) announced and implemented the following measures:
• Law of Social Solidarity and Productive Reactivation: On December 23, 2019, Law No. 27,541 Social Solidarity and Productive Reactivation was published in the Official Gazette (the “Solidarity Law”). The Solidarity Law declared a public emergency in economic, financial, fiscal, administrative, social security, tariff, energy, health and social matters and granted the Executive Branch with broad powers in many aspects related to the public emergency. The Solidarity Law and related regulations adopted on on December 27, 2019 by Decree No. 99/2019, introduced important foreign exchange restrictions and tax modifications, among other provisions related to sovereign debt, energy and social security. Decree No. 99/2019 provided measures regarding employer contributions, applicable rates for foreign goods and provided that, digital services will be taxed at a 8%, and the acquisition services abroad and passenger transport services destined outside the country at 30%. The Solidarity Law delegated in the Executive powers from Congress to determine the export duty rates of exports of all goods and determines different caps for different products. Most agricultural goods have a cap of 15% export duties rate or less (currently, most of them are set between 5%-12%) except for soybean products which are mostly set at a 33% export duty rate.
• Price Control Program: On January 7, 2020, the government relaunched the so-called Programa Precios Cuidados, a voluntary price control program, whose goal is to foster consumption and establish reference prices for households products with the highest consumption. Initially, 310 products were included within Programa Precios Cuidados and public officials stated that the prices of the products included within the program were to be reduced by 8% on the average. Two of the milk products commercialized by the Company are covered by the Programa Precios Cuidados.
• Maximum prices and supply obligations: See “— The measures taken or to be implemented by the Argentine government in response to the COVID-19 pandemic may have an adverse effect on our business and operations — Maximum Prices and Supply Obligations”.
• Law of Sustainability of Public Debt issued under Foreign Law: See " — The economy of Argentina may be affected by its government’s limited access to financing from international markets, and the result of failure to pay its debt obligations and the current debt restructuring process”.
• Tax Reform Law: See “— Changes in the Argentine tax laws may adversely affect the results of our operations, financial condition and cash flows”.
• Supermarket Shelves Law: See “— The measures taken or to be implemented by the Argentine government in response to the COVID-19 pandemic may have an adverse effect on our business and operations — Supermarket Shelves Law”.
• Coronavirus measures: See “— The measures taken or to be implemented by the Argentine government in response to the COVID-19 pandemic may have an adverse effect on our business and operations".
• Teleworking Law. See “— The measures taken or to be implemented by the Argentine government in response to the COVID-19 pandemic may have an adverse effect on our business and operations — Remote Work”.
We have no control over the implementation of the reforms to the regulatory framework that governs our operations and cannot guarantee that these reforms will be implemented or, if implemented, that such implementation will benefit our business. The failure of these measures to achievehas substantially increased their intended goals could adversely affect the Argentine economy, which, in turn, may have an adverse effect on our business, results of operations and financial condition.
On October 24, 2021 the congressional elections will be held, by means of which part of the members of the House of Representatives and the Senate will be elected. Primary elections that will define candidates of each political party are scheduled for August 8, 2021. The results of the elections and their impact on the Fernández Administration as mid-term elections are still uncertain.
This political uncertainty in respect of economic measures could lead to volatility in the market prices of securities of Argentine companies and our common shares, and could have a negative impact in our domestic consumer markets, which, in turn, could have a negative effect on our business, results of operations and financial condition.
The Argentine economy has been adversely affected by economic developments in other markets and by other general "contagion" effects.
Financial and securities markets in Argentina, and also the Argentine economy, are influenced by economic and market conditions in other markets worldwide, including those relating to the recent trade dispute between China and the United States. Although economic conditions vary from country to country, investor's reactions to events occurring in one country sometimes demonstrate a "contagion" effect in which an entire region or class of investment is disfavored by international investors.
Furthermore, weak, flat or negative economic growth in any of Argentina’s major trading partners, such as Brazil, could adversely affect Argentina’s balance of payments and, consequently, its economic growth.
The Argentine economy may also be affected by conditions in developed economies, such as the United States, that are significant trading partners of Argentina or have influence over global economic cycles and over short-term evolution of commodity prices. If interest rates increase significantly in developed economies, including the United States, Argentina and its developing economy trading partners, such as Brazil, could find it more difficult and expensive to borrow capital and refinance existing debt, which could adversely affect economic growth in those countries. Decreased growth from Argentina’s trading partners could have a material adverse effect on the markets for Argentina’s exports and, in turn, adversely affect economic growth. Any of these potential risks to the Argentine economy could have a material adverse effect on our business, financial condition and result of operations.
The COVID-19 pandemic outbreak has also destabilized global financial markets, which has had a negative impact on global trade and the global economy, including the Argentine economy, which in turn could have a negative impact on our business, results of operations and financial condition (See “ — Risks Related to Our Business and Industries —The COVID-19 pandemic may have an adverse effect on our business and operating results”).
In addition, Argentina is highly dependent on the export of certain commodities, such as soy, what has made the Argentine economy more vulnerable to fluctuations in the commodity prices. If international commodity prices decline, the Argentine economy could be adversely affected. In addition, adverse weather conditions can affect the production of commodities by the agricultural sector, which account for a significant portion of Argentina's export revenues.
All these circumstances could have a negative impact on the levels of government revenues, available foreign exchange and the government's ability to service its sovereign debt, and could either generate recessionary or inflationary pressures, depending on the government's reaction. Either of these results would adversely impact Argentina's economic growth and, therefore, our financial condition and results of operations.
Consequently, there can be no assurance that the Argentine financial system and securities markets will not continue to be adversely affected by events in developed countries' economies or events in other emerging markets, which could in turn, adversely affect the Argentine economy and, indirectly, our business, financial condition and results of operations, and the market value of our securities.
The economy of Argentina may be affected by its government’s limited access torespective financing from international markets and the result of failure to pay its debt obligations and the current debt restructuring process.
costs. The Argentine economy has been experiencing significant instability in the past decades, including devaluations, high inflation, and prolonged periods of reduced economic growth, which have led to payment defaults on Argentina’s foreign debt and multiple downgrades in Argentina’s foreign debt rating with attendant restrictions on Argentina’s ability to obtain financing in the international markets.
Argentina’s 2001 sovereign default and its failure to fully restructure its sovereign debt and negotiate with the holdout creditors has historically limited and may continue to limit Argentina’s ability to access international financing. In 2005, Argentina completed the restructuring of a substantial portion of its indebtedness and settled all of its debt with the IMF. Additionally, in June 2010, Argentina completed the restructuring of a significant portion of the defaulted bonds that were not exchanged in the 2005 restructuring. Holdout bondholders that declined to participate in the restructuring filed lawsuits against Argentina in several countries, including the United States. Since late 2012, rulings from courts in the United States favorable to holdout bondholders aggravated investors’ concerns regarding investment in the country.
In February 2016, the Macri administration entered into settlement agreements with certain holdout bondholders to settle these claims, which were subject to the approval of the Argentine Congress. The Argentine government reached settlement agreements with holders of a significant portion of the defaulted bonds and has repaid the majority of the holdout creditors with the proceeds of a US$16.5 billion international offering of 3-year, 5-year,three-year, five-year, 10-year and 30-year bonds on April 22, 2016 -which bonds, among other sovereign bonds, were then restructured by the Fernández administration in August, 2020 -as explained below.2016. Although the size of the outstanding claims has decreased significantly, litigation initiated by bondholders that havedid not acceptedaccept Argentina’s settlement offer ofin 2016 continues in several jurisdictions.
Additionally, foreign shareholders of several Argentine companies have filed claims with the International Center for Settlement of Investment Disputes, (ICSID)(“ICSID”), alleging that the emergency measures adopted by the Argentine government since the crisis in 2001 and 2002 differ from the just and equal treatment standards set forth in several bilateral investment treaties to which Argentina is a party. The ICSID has ruled against Argentina with respect to many of these claims.
Litigation involving holdout creditors, claims with ICSID and other claims against the Argentine national government, resulted and may result in material judgments against the government, lead to attachments of, or injunctions relating to, Argentina’s assets, or could cause Argentina to default under its other obligations, and such events may prevent Argentina from obtaining favorable terms or interest rates when accessing international capital markets or from accessing international financing at all. Our ability to obtain U.S. dollar-denominated financing has been adversely impacted by these factors.
In MayJune 2018, the Macri administration requestedIMF approved a financial support plan for Argentina in the IMF the grantingform of a Stand-By Arrangementstand-by arrangement for upUS$50 billion, which was increased to US$57.1 billion with the purpose of supporting the Argentine government’s economic plan.
As of the date of this report, the IMF disbursed an aggregate of US$44.70 billion. The Fernández administration is currently negotiating the restructuring of the terms of the Stand-By Arrangement, which payments become due as from 2021.
in September 2018. The Argentine government announced that it will also engage in negotiationsnegotiated an extension with the Paris ClubIMF for repayments under the restructuring ofstand-by arrangement that matured in 2022. On January 28, 2022, the debt incurred with such institution given that there are also payments becoming due on the following months.
As of the date of this annual report, we cannot guarantee thatIMF and the Argentine government reached an understanding, and the final agreement was approved by the IMF’s executive board on March 3, 2022. On March 17, 2022, the Argentine Congress approved the staff-level agreement to be entered into with the IMF. Further, on October 7, 2022, the IMF will reach an agreement on the restructuringcommunicated that its executive board conducted a second review of the Stand-By Arrangement, nor are we able to predictagreement with Argentina and approved a second immediate disbursement of approximately US$3.8 billion. Likewise, on December 22, 2022, the future consequences for the Argentine economy in general or our business in particular if such agreement fails.
Pursuant to a report issued by the Secretary of Financethird review of the Argentine government, asagreement was announced, approving a disbursement of December 2019, Argentina’s foreign debt amounted toapproximately US$311.25 billion, which represented 91.6% of Argentina’s GDP. During6.0 billion.
Moreover, during 2020 the Argentine government carried out the restructuring ofrestructured its public debt instrumented in bonds denominated in foreign currency governed by foreign law as well as bonds denominated in foreign currency governed by Argentine law, by means of debt restructuring procedures implemented internationally and locally, respectively, within each groupsgroup of creditors according to the type of sovereign debt.
On February 12, 2020, the Argentine Congress enacted Law No. 27,544 for the Restoration of the Sustainability of the Public Debt issued under Foreign Law, which provided forapproved the restructuring of the Argentine external public debt. Through Decree No. 250/2020, published in the Official Gazette on March 10, 2020, the Argentine Executive Branchadministration authorized negotiations for the restructuring of US$68.8568.9 billion of sovereign bonds issued in foreign currency and governed by foreign
law. On April 17, 2020, Argentina announced an invitation to exchange its sovereign bonds governed by foreign law that were eligible for the restructuring for new bonds. The universe of eligible bonds that were subject to the exchange offer was comprised by bonds governed by the laws of New York (United States) and by the laws of the United Kingdom, denominated in several currencies (US Dollars, Euros and Swiss Francs). Within the universe of the bonds they were the instruments issued within the framework of the prior restructuring, carried out by the exchanges of years 2005 and 2010.
After several extensions and improvements made within the initial offer, on August 31, 2020, Argentina announced the results of the invitation to exchange. Argentina obtained the majorities required under the collective action clauses to exchange 99.01% of the eligible bonds, as a result of obtaining a level of acceptance of 93.55% of the bondholders to its exchange proposal launched in April and improved in July and in August, after the agreement with three groups of bondholders.
Within the context of the agreement with the groups of bondholders for the restructuring of sovereign debt governed by foreign law, Argentina also conducted a local exchange. Argentina launched an offer to exchange sovereign bonds denominated in USU.S. dollars and ‘dollar-linked’“dollar-linked” issued under local law. The instruments subject to the local debt restructuring were affected by the deferral of payments of principal and interest until December 31, 2020, provided by Presidential Decree No. 346/20 published in the Official Gazette on April 6, 2020.
20. In August 2020, Argentina launched an offer to exchange this universe of sovereign bonds denominated in USU.S. dollars and ‘dollar-linked’ issued under Argentine law. As a result of this transaction, and as informed in Ministry of Economy press release on September 15, 2020, 99.41%99.4% of the bondholders of eligible instruments under this local exchange had accepted the offer.
The local debt exchange was then reopened and is ongoing as of the date of this report. On November 4, 2020, Resolution No. 540/2020 offurther provided the Ministry of Economy was published in the Official Gazette, which provided for the reopening of the local exchange and, for this purpose, set forth a procedure to allow eligible instruments which
did not enter into the debt restructuring under Argentine law carried out onin August and September 2020 to be tendered. The resolution provided that holders who were unable to enter the exchange within the prior invitation term may do so in successive acceptance terms which will be extended until July 28, 2021 in the conditions set forth therein.
In addition,Through Resolution No. 646/2021, the Ministry of Economy established a new procedure to be carried out in January 26, 2020 the Provincelocal market for eligible securities of Buenos Aires, the largest estate in Argentina, also had a maturity of provincial sovereign debt for US$277 million in principal amount and interests that, after the failure of the negotiations for an extension, cancelled within the curing period in February 5, 2020. The Province of Buenos Aires had additional payments under its sovereign debt for US$110 million maturing in May 2020 and US$750 million maturing in June 2020. In May 2020 the Province of Buenos Aires,holders who did not fulfilladhere to the paymentproposed exchange operation. In this regard, as of its international sub-sovereign bondsDecember 1, 2021, the securities subject to the local debt restructuring, which were not restructured (listed in Annex I of Resolution 381/2020), were deemed non-negotiable and since then is seeking to restructure them through an exchange offer. After several extensions without success,their listings on the Province of Buenos Aires has recently extended againElectronic Open Market (MAE) and in the offer expiration date untilArgentine stock exchanges and markets were canceled.
Furthermore, in March 26, 2021. There are other Argentine provinces which are also carrying out the restructuring of their bonds governed by foreign law and denominated in foreign currency.
As of the date of this annual report,2023, the Argentine government restructured its public debt by issuing bonds denominated in Pesos. The restructuring obtained 64.0% participation and extended the IMF did not reachmaturities of notes worth Ps.4.3 billion.
In addition, on August 4, 2023, through Decree No. 404/2023 a loan agreement between Argentina and Qatar for 580,000,000 Special Drawing Rights was approved in an agreementattempt to pay interest on the restructuring of the Stand-By Arrangement and there are no assurances that such agreement would be reached during 2021, nor are we able to predict the future consequences for the Argentine economy in general or our business in particular if such agreement is not reached.
Argentina is also aiming at obtaining a deferral of the payments which are due in the upcoming months of 2021debt contracted with the Paris Club and other international financial institutions, for which purposes the Government would have engaged in conversations but there is still uncertainty on the deferral of such payments.
If the negotiations with the IMF and the other international financial institutions fail or the Province of Buenos Aires or other provinces of Argentina fail to restructure their debt,IMF. In this regard, the Argentine government defaults again inannounced the paymentcancellation of its sovereign debt orUS$ 1,411 million within the measures adopted and to be adopted by the Argentine government to reduce the fiscal deficit, control inflation and stabilize the foreign exchange market are not effective, Argentina’s ability to obtain international or multilateral private financing or direct foreign investment may be limited, which may in turn impair its ability to implement reforms and public policies to foster economic growth, impair the ability of private sector entities to access the international capital markets or make the terms of such financing much less favorable that those accessible by companies in other countries in the region and may accelerate the depreciationframework of the Argentine peso, foster inflationagreement. Moreover, on August 23, 2023, former Economy Minister, Sergio Massa, announced agreements with the World Bank and deepen the economic crisis and recession.Inter-American Development Bank that determined that these entities would provide Argentina with total financing of US$ 1,310 million.
Lack
Moreover, on January 31, 2024, the IMF’s Executive Board announced the conclusion of the seventh review of the agreement with Argentina. The IMF’s Executive Board granted the country access to an immediate disbursement of approximately USD 4.7 billion, which would place the total disbursements under the agreement at around USD 40.7 billion to date.
In any case, lack of access to international or domestic financial markets in the future could affect the projected capital expenditures for our operations in Argentina, which, in turn, may have an adverse effect on our financial condition or the results of our operations.
Argentina’s current account and balance of payment imbalances could lead to a depreciation of the Argentine peso,Peso, and as a result, affect our results of operations, our capital expenditure program and our ability to service our foreign currency liabilities.
According to INDEC,In the past, Argentina has had a structural current accountsevere macroeconomic imbalances, including frequent and extreme fiscal deficits. Since 1961, the Argentine government has had yearly fiscal deficits approximately 90% of the time, resulting in highly vulnerable macroeconomic conditions. The Argentine government has financed its fiscal deficit that reached US$3.5 billionmainly in 2019, US$27.3 billion in 2018, US$31.2 billion in 2017, US$15.1 billion in 2016, and US$17.6 billion in 2015. The account deficit between 2015 and 2017 originates in the stagnation of exports of goods, which have only increasedtwo ways: (i) by 1.4%, taking into account the compounded average growth rate or CAGR, between 2015 and 2017; in contrast, imports of goods have been increasing at a much faster speed, reaching a CAGR of 5.8% in the same period. Nonetheless, by the end of 2020, that structural current account deficit was turned around, reaching a US$3.0 billion surplus.
During the Macri administration, the account deficit was financed mainly withrelying on external debt issuances, which has historically led to rapid increases in public debt levels; and (ii) by having the international debt markets. In addition, the settlementBCRA issue currency, which has led to high inflation and, in certain cases, hyperinflation. The fiscal deficit reached 4.5%, 2.4% and 2.9% of the disputesGDP in 2021, 2022 and 2023, respectively. Failure to reduce fiscal deficits could lead to growing levels of uncertainty regarding Argentina’s macroeconomic conditions. In particular, it could lead to growing inflation rates and unanticipated foreign exchange depreciation and balance of payments crises, higher local vulnerability to international credit crises or geopolitical shocks, higher interest rates and erratic monetary policies, a reduction in real salaries and as a consequence, in private consumption, and a reduction in growth rates. This level of uncertainty, over the 2001 defaulted debt crisis has allowed several provinceswhich we have no control, may adversely affect our financial condition and results of Argentina and certain Argentine private companies to issue new debt securities in foreign markets. However, both the Argentine Government and certain provincial governments have implemented debt restructuring procedures of their sovereign debt and sub-sovereign debt bonds, respectively, some of which procedures are still ongoing (see " — The economy of Argentina may be affected by its government’s limited access to financing from international markets and the result of failure to pay its debt obligations and the current debt restructuring process”).operations.
Because foreign direct investment remains stagnant in Argentina, it may become impossible for Argentina and its provinces to meet their debtsdebt obligations in the future, since Argentina’s foreign currency needs would severely overcome its foreign currency sources. If this level of uncertainty prevails on international investors, Argentina may suffer a “sudden stop” event, where investors stop lending money to ArgentineanArgentine institutions. This, in turn, may result in large capital outflows that could not only force the Argentine government to default on its debt, but also generate a rapid and unanticipated depreciation of the argentine peso,Peso, a hike in local interest rates and a probable banking system crisis if bank deposits are largely withdrawn following social unrest.
The events described above have already taken place in recent decades in Argentina, and although the current administration intends to address the situation, as of the date of this annual report, the impact that the measures taken by the present administration will have on the Argentine economy as a whole cannot be predicted. As of the date of this report, the results of the measures already implemented and the Argentine government’s measures related to the outbreak of COVID-19, impacted the primary fiscal and financial deficit in 2020, that reached 6.5% and 8.5% of GDP, respectively, as a result of the income and expenditures measures that the Argentine government implemented to face the pandemic. Alberto Fernández's government measures aim to stabilize state accounts, but in principle they intend to maintain expansive policies that would mean initially even more increases in public spending, financed through the expansion of currency issuance.
The failure to reduce fiscal deficits could increase the level of uncertainty regarding the macroeconomic conditions in Argentina. In particular, it could lead to an increase in the inflation index, devaluation of the Argentine peso with respect to foreign currencies and a subsequent crisis in the balance of payments, greater local vulnerability to the international credit crisis or geopolitical shocks, rising rates of interest, erratic monetary policies, reduction in real wages and, as a consequence, in private consumption and reduction in growth rates. This level of uncertainty, over which we have no control, can affect our financial condition or the results of operations.
If a balance of payments crisis were to occur, a large depreciation of the Argentine pesoPeso against the U.S. dollar could adversely affect our ability to meet our foreign currency obligations. Furthermore, the negative effect such a crisis could have on the growth rates of the Argentine economy and its consumption patterns could have a material adverse effect on our business, financial condition and result of operations.
If current levels of fiscal deficits are not reduced, the Argentine economy could be adversely affected, negatively impacting our business and results of operations.
Between 2007 and 2015, Fernández de Kirchner's administration significantly increased public spending. In the eleven-month period ended on November 30, 2015, the fiscal deficit increased by 363% annualized. During that period, the Fernández de Kirchner administration turned to the Argentine Central Bank and the National Social Security Administration (Administración Nacional de la Seguridad Social or “ANSES” after its Spanish acronym), to finance part of the public spending. Inflation continues to be a challenge for Argentina given its persistent nature in recent years. The Macri administration had announced its intention to reduce the primary fiscal deficit as a percentage of GDP over time and reduce the government's dependence on Argentine Central Bank financing. Given the difficulties of the Argentine public finances, the administration of former President Macri adopted several measures to finance public spending, for example, the revision of
subsidy policies (in particular those related to tariffs on energy, electricity and gas, water and public transport) and the implementation of an expansive monetary policy. These measures resulted in a further increase in prices and, therefore, adversely affected, consumer purchasing power and the overall economic activity. In addition, measures taken by the administration of President Alberto Fernández, the implementation of the Solidarity Law (See “— The impact of the Argentine congressional and presidential elections on the future economic and political environment of Argentina remains uncertain”) as well as the measures related to the outbreak of COVID-19 will have an impact on the Argentine economy (See “— The measures taken or to be implemented by the Argentine government in response to the COVID-19 pandemic may cause adverse effect on our business and operations”).
Accordingly, Argentina has had severe macroeconomic imbalances, including frequent and extreme fiscal deficits. Since 1961, the Argentine government has had yearly fiscal deficits in approximately 90% of the time (47 years out of 53), resulting in highly vulnerable macroeconomic conditions. The Argentine government has financed its fiscal deficit mainly in two ways: (i) by relying on external debt issuances, which has historically led to rapid increases in public debt levels; and (ii) by having the Argentine Central Bank issue new currency notes, which has led to high inflation periods and, in certain cases, hyperinflation. The fiscal deficit reached 5.2% of GDP in 2015, 5.8% of GDP in 2016, 6.0% of GDP in 2017, 5.2% of GDP in 2018, 4.9% of GDP in 2019 and 8.5% of GDP in 2020. (See “—Argentina’s current account and balance of payment imbalances could lead to a depreciation of the Argentine peso, and as a result, affect our results of operations, our capital expenditure program and our ability to service our foreign currency liabilities”).
The failure to reduce fiscal deficits could lead to growing levels of uncertainty regarding Argentina’s macroeconomic conditions. In particular, it could lead to growing inflation rates and unanticipated foreign exchange depreciation and balance of payments crisis, higher local vulnerability to international credit crisis or geopolitical shocks, higher interest rates and erratic monetary policies, a reduction in real salaries and as a consequence, in private consumption, and a reduction in growth rates. This level of uncertainty, over which we have no control, may adversely affect our financial condition or results of operations.
Our results of operations may be adversely affected by high and possibly increasing inflation in Argentina.
Historically, inflation has materially undermined the Argentine economy and the government’s ability to create conditions that would permit long term and stable growth. In recent years, Argentina has experienced high inflation rates. High inflation may also undermine Argentina’s foreign competitiveness in international markets and adversely affect economic activity and employment, as well as our business and results of operation. In particular, the profit margin on our services is impacted by the increase in our costs in providing those services, which is influenced by wage inflation in Argentina, as well as other factors.
Since 2008, the Argentine economy has been subject to strong inflationary pressures that, according to private sector analysts, reached an average annual rate of 28.2% between 2010 and 2015. In 2007 INDEC was subject to a process of institutional and methodological reforms that led to controversies regarding the credibility of the information published by it, including CPI. Reports published by the IMF between 2007 and 2015, using alternative measures to estimate price developments, showed considerably higher variations than those published by INDEC (see “ — The credibility of several Argentine economic indices have been called into question, which may lead to a lack of confidence in the Argentine economy and may in turn limit our ability to access the credit and capital markets” and “— Risks Related to Our Business and Industries-Inflation in some of the countries in which we operate, along with governmental measures to curb inflation, may have a significant negative effect on the economies of those countries and, as a result, on our financial condition and results of operations”). In December 2015, the Macri Administration suspended the publication of indexes and statistics and, after implementing certain methodological reforms and adjusting certain macroeconomic statistics, resumed its publication of the CPI in June 2016. Based on the new and revised information provided by INDEC, inflation reached an annual rate of 40.9% in 2016, 24.8% in 2017, 47.6% in 2018, 53.8% in 2019, and 36.1% in 2020.
Due to several internal and external factors, during the first half of 2018 the peso suffered a new sharp depreciation, which, as of December 31, 2018 accumulated 103.83% and that fostered the inflation levels again to 47.6% in 2018. In April 2019 the Argentine government adopted a series of economic measures attempting to control the foreign exchange rate and inflation, including retail prices monitoring and freezing programs (see “— The measures taken or to be implemented by the Argentine government in response to the COVID-19 pandemic may have an adverse effect on our business and operations — Maximum Prices and Supply Obligations”), the limitation of tariffs increases and the fixing of intervention zones by the Argentine Central Bank in the U.S. Dollar exchange market. However, these measures caused a deepening of the recession, while foreign exchange instability and high inflation continued.
In the past, the Argentine government implemented programs to control inflation and monitor prices for essential goods and services, including attempts to freeze the price of certain supermarket products by means of price support arrangements between the government and the private sector. These programs, however, did not address the structural causes for Argentina’s inflation and, consequently, failed to reduce inflation. Nevertheless, in January 2020, the Fernández Administration adopted these type of programs (see “ — Government intervention in Argentina may have a direct impact on our prices and sales” and “-Risks Related to Argentina- The impact of the Argentine congressional and presidential elections on the future economic and political environment of Argentina remains uncertain”).
Controlling inflation remains to be a challenge for Argentina. If the Argentine government continues failing to address Argentina’s structural inflationary imbalance, the current levels of inflation may continue to rise, which may have an adverse effect on Argentina’s economy.
Inflation in Argentina has contributed to a material increase in our costs of operation, in particular labor costs; it also enables a reduction in the purchasing power of the population, thus increasing the risk of a lower level of consumption from our customers in Argentina, which could negatively impact our financial condition and results of operations. Inflation rates could continue to grow in the future, and there is uncertainty regarding the effects that any measures adopted by the government could have to control inflation.
Uncertainty surrounding future inflation rates may have an adverse impact for Argentina in the long-term credit market.
The Argentine economy has experienced significant volatility in past decades, including numerous periods of low or negative growth and high and variable levels of inflation and currency devaluation. Inflation remains a challenge for Argentina given its persistent nature in recent years and also considering its high levels during 2019. No assurances can be given that the rate of growth experienced over past years will be achieved in future years or that the national economy will not suffer recession. If economic conditions in Argentina were to continue slowing down, or contract, if inflation were to accelerate further, or if the Argentine government's measures to attract or retain foreign investment and international financing in the future to incentivize domestic economy activity are unsuccessful, such developments could adversely affect Argentina's economic growth and in turn affect our financial health and results of operations.
Inflation can also lead to an increase in Argentina's debt and have an adverse effect on Argentina's ability to service its debt, mainly in the medium and long term when most inflation-indexed debt matures. In addition, weaker fiscal results could have a material adverse effect on the Government's ability to access long term financing, which, in turn, could adversely affect Argentina's economy and financial condition and access to international or domestic capital markets. If the measures adopted by the Argentine government are not able to resolve the structural inflationary disruptions of Argentina, the current inflationary levels could rise and have a negative impact on the economic and financial conditions of Argentina, and as such adversely affect our operations and financial condition (see “— Our results of operations may be adversely affected by high and possibly increasing inflation in Argentina").
High inflation rates affect Argentina’s foreign competitiveness, increase social and economic inequality, negatively impacts employment, consumption and the level of economic activity, and undermines confidence in Argentina’s banking system, which could further limit the availability of and access by local companies to domestic and international credit.
Devaluation of the peso may adversely affect our results of operations, our capital expenditure program and the ability to service our liabilities and transfers of funds abroad.
Argentina has a history of high volatility in its foreign exchange markets, including sharp and unanticipated devaluations, tight foreign exchange controls and severe restrictions on foreign trade. The devaluation of the peso may have a negative impact on the ability of certain Argentine businesses to service their foreign currency denominated debt. It could also lead to higher inflation rates, significantly reduce real wages and jeopardize our business.
The devaluation of the Argentine peso has been continuous during recent history. After several years of moderate variations in the nominal exchange rate, the Argentine peso depreciated 32.6% and 31.1% in 2013 and 2014, respectively, with respect to the U.S. dollar. In 2015, the Argentine peso lost 52.5% of its value with respect to the U.S. dollar, in 2016 depreciated 21.9% and in 2017, depreciated approximately 17.4% of its value with respect to the U.S. dollar. In 2018 the Argentine peso suffered a sharp depreciation which accumulated 102.2% (See “— Our results of operations may be adversely affected by high and possibly increasing inflation in Argentina” and “— The Argentine economy could be adversely affected by economic developments in other markets and by other general “contagion” effects”).
After the results of the primary elections were announced on August 11, 2019, the markets reacted negatively, and the U.S. dollar price jumped from $43.9 pesos to $60.4 at the exchange rate published by the Argentine Central Bank as of August 14, 2019. Consequently, the shares of Argentine companies in the New York stock exchanges and the value of national bonds dropped. Given the political and economic landscape, the Government of former President Macri re-instated rigid restrictions and foreign exchange controls in September 1, 2019, which among other things, significantly curtailed access to the official foreign exchange market by individuals and entities (See "Item 10 — Additional Information-Exchange Controls”). During 2019 the Argentine peso depreciated 58.9% against the U.S. dollar. Furthermore, an unofficial U.S. dollar trading market developed in which the Argentine peso/U.S. dollar exchange rate is significantly higher than the one in the official one. We cannot predict future fluctuations in the Argentine peso/U.S. dollar exchange rate or further foreign exchange restrictions.
Despite the positive effects the depreciation of the Argentine peso may have on the competitiveness of certain sectors of the Argentine economy, including our business, it also had a negative impact on the financial condition of many Argentine businesses and individuals. The devaluation of the Argentine peso affected or may affect the ability of certain Argentine businesses to honor their foreign currency-denominated debt, generates high levels of inflation, reduces real wages significantly, and has a negative impact on companies oriented to the domestic market, such as public services and the financial industry.
Given the political and economic landscape, the Government of former President Macri re-instated rigid restrictions and foreign exchange controls in September 1, 2019, which among other things, significantly curtailed access to the official foreign exchange market by individuals and entities (See "Item 10 — Additional Information-Exchange Controls”). Notwithstanding the strengthening of the foreign exchange controls, the Peso accumulated a depreciation of 59.02% and 40.49% against the U.S. dollar in 2019 and 2020, respectively. Furthermore, an unofficial U.S. dollar trading market developed again in which the Argentine peso/U.S. dollar exchange rate is significantly higher than the one in the official one. We cannot predict future fluctuations in the Argentine peso/U.S. dollar exchange rate or further foreign exchange restrictions.
Additional volatility, appreciation or depreciation of the peso, or reduction in the Argentine Central Bank’s international reserves due to currency interventions could adversely affect the Argentine economy, which in turn may have an adverse effect on our financial conditions and results of operations.
Failure to adequately address actual and perceived risks of institutional corruption may adversely affect Argentina'sthe economy and financial condition.condition of the emerging markets in which we operate.
A lack of a solid and transparent institutional framework for contracts with the Argentine government and its agencies and corruption allegations have affected and continue to affect Argentina. Argentina ranked 6698 of 180 in the Transparency International's 20192023 Corruption Perceptions Index and 126 of 190 in the World Bank's Doing Business 2020 report.
As of the date of this annual report, there are various ongoing investigations into allegations of money laundering and corruption being conducted by the Office of the Argentine Federal Prosecutor, including the largest such investigation, known as the “Notebooks Investigation” (“Los Cuadernos de las Coimas”) which have negatively impacted the Argentine economy and political environment. This investigation relates to notebooks kept by a driver who worked for public officials during the Kirchner Administration. The notebooks allegedly document a widespread corruption scheme involving illegal cash payments by businessmen to government officials in order to win government contracts. As a result of these investigations, several businessmen (including construction company executives) and former public officials have been detained and prosecuted, including the former president and current vice-president of Argentina, Mrs. Cristina Fernández de Kirchner, who was prosecuted for illicit association.
Depending on how long it takes to close these investigations and their results, companies involved in the investigations may be subject to, among other things, a decrease in their credit ratings, claims filed by their investors, and may further experience restrictions in their access to financing through the capital markets, together with a decrease in their income. Additionally, as the criminal cases against the companies involved in the investigations move forward, said companies may be restricted from rendering services or may face new restrictions, due to their customers' internal standards. These adverse effects could restrict these companies' ability to conduct their operating activities and to meet their financial obligations. Consequently, the number of suppliers available for our operations may be reduced and, as such, we may experience an adverse effect on our commercial activities and results of operations.
Index. The Argentine government's ability to implement initiatives aimed at strengthening Argentina's institutions and reducing corruption is uncertain as it would be subject to independent review by the judicial branch,Judicial Branch, as well as legislative support from opposition parties. We cannot give anyThere can be no assurance that the implementation of these measures by the Argentine government will be successful in stopping institutional deterioration and corruption. Furthermore, we cannot predict what
impact these investigations might have or what other measures may be adopted by the courts, the current administration or any future administration, each of which could adversely affect our business, financial condition and the results of our operations.
The credibility of several Argentine economic indices has been called into question, which may lead to a lack of confidenceMoreover, in the Argentine economy and may in turn limit our ability to access the credit and capital markets.
Between 2007 and 2014, the inflation index determined by INDEC has been the subject of widespread criticism and extensive discussions in connection with analysispast, members of the Argentine economy, including data on inflation, GDPBrazilian government and unemployment. The intervention of the former Argentine government in the INDEC in 2007 and the change in the way the inflation index was measuredBrazilian Legislative Branch have resulted in disagreements between the former Argentine government and private consultants as to the actual annual inflation rate. The former Argentine governmentfaced allegations of the Fernández de Kirchner administration imposed fines on private consultants reporting inflation rates higher than the INDEC data.political corruption. As a result, private consultants typically shared their data with Argentine lawmakers who opposed the previous government,a number of politicians, including senior federal officials and who released such data from time to time. The widespread disagreements had the negative effect of eroding public confidence in Argentina’s economy.
Since June 2016, after implementing certain methodological reforms, the CPI was corrected and on November 9, 2016, the Executive Boardcongressmen, resigned and/or have been arrested. For example, since 2014, several members of the IMF lifted its censure on Argentina, noting that Argentina had resumed the publicationBrazilian executive and legislative branches of data ingovernment have been investigated as a manner consistent with its obligations under the Articlesresult of Agreementallegations of the IMF, recovering credibility. As of the date of this annual report, the impact of any future measures takenunethical and illegal conduct identified by the Fernández administration with respect to the INDEC will have on the Argentine economy and investors’ perception of the country cannot be predicted. Concern regarding lack of accuracy in the INDEC´s indices could adversely affect investor confidence in the Argentine economy and our ability to access international credit markets to finance our operations and growth.
Government intervention in Argentina may have a direct impact on our prices and sales.
The Argentine government has in the past exercised substantial control over the Argentine economy by setting certain industry market conditions and prices. In March 2002, the Argentine government fixed the price for milk after a conflict among producers and the government. In 2005, the Argentine government adopted measures in order to increase the domestic availability of beef and reduce domestic prices. The export tax rate was increased and a minimum weight requirement for animals to be slaughtered was established. In March 2006, sales of beef products to foreign markets were temporarily suspended until prices decreased. Furthermore, in 2007 the Argentine government significantly increased export tax rates on exports of crops. Several restrictions were also imposed on the grain and oilseed markets that essentially limited the access of traders to exports, resulting in a disparity between domestic and world prices. In March 2012, the Undersecretary of Transport created an “indicative price” for the transportation of grains by road fixed on a quarterly basis. The actual price paid for the road transportation of grains was set to be no lower than 5% or higher than 15% of the “indicative price” fixed for the applicable period. In some cases, the imposition of this “indicative price” produced increases in our transportation costs. In addition, on April 9, 2013, the Secretary of Commerce issued a resolution that established a fixed price for selling liquid hydrocarbons for a six months period. The fixed price would be the highest selling price on the date of issuance of the resolution, in certain regions of the country. Notwithstanding the April 9 resolution, YPF (the Argentine government-controlled oil and gas company) implemented gas price increases that were matched by other oil companies. Due to the increase in the price of the wheat, on July 4, 2013, the Secretary of Commerce issued a resolution mandating wheat producers and distributors to sell their stocks to satisfy the domestic demand, seeking to reduce the wheat price. On January 2014, the Secretary of Commerce launched a new program of price controls called Precios Cuidados. Producers and suppliers committed to fixed prices for more than 300 basic products subject to review on a quarterly basis. As of the date hereof, two of our rice products sold under the trademark “Molinos Ala” and "Apostoles" are subject to this program. Violation of the program may result in sanctions, including fines, which amount will be considered on a case by case basis at the time of issuing the relevant sanction by the enforcement authority.
The two administrations of President Fernández de Kirchner, who governed from 2007 through December 9, 2015, increased state intervention in the Argentine economy, through expropriation and nationalization measures, price controls and foreign exchange controls. Below follows an outline of the main measures taken by such administration on these aspects.
In 2008 the Fernández de Kirchner administration absorbed and replaced the former private pension funds for a fully public pension system. In April 2012, the Fernandez de Kirchner administration decreed the removal of directors and senior officers of YPF S.A., the country’s largest oil and gas company which was controlled by the Spanish group Repsol, and with the approval of the Argentine Congress expropriated shares held by Repsol representing 51% of the shares of YPF, and in 2015, the Argentine Congress passed a law approving the government takeover of the passenger and cargo railways, which became owned by a State-owned company called Ferrocarriles Argentinos Sociedad del Estado. In 2014 the Argentine Tax Authority (“Administración Federal de Ingresos Públicos - AFIP”) established a “Systematic Registration of Movements and Grains
Stocks Regime”Car Wash Operation (Régimen de Registración Sistemática de Movimientos y Existencias de GranosOperação Lava-Jato) pursuant to which all persons involved in the commercialization and manufacturing of grains and dairy products registered with the Registry of Operators of the Agro-industrial Chain (Registro Único de Operadores de la Cadena Agroindustrial or “RUCA” after its acronym in Spanish) must report the stock and stock variations (including locations, transport between the producer´s facilities, etc.) of all grains and other agricultural products (other than those to be applied to sowing) held in inventory or through third parties. In 2014 the Argentine Congress enacted the “Supply Law”, that coversby Brazilian federal prosecutors. Any political crisis could worsen the economic process related to goods, facilities and services that directly or indirectly satisfy the basic or essential needs of the population, granting broad delegations of powers on its enforcement authority and provides thatconditions in a situation of shortage or scarcity of goods or servicesBrazil, which satisfy basic or essential needs destined to the general welfare of the population, the governmental authorities may order their sale, production, distribution and delivery throughout the Argentine territory.
Since taking office in December 2019, the Fernández Administration implemented several measures that increased the government intervention, for example: i) the Solidarity Law published on December 23, 2019; ii) the Price Control Program announced on January 7, 2020; iii) the Law of Sustainability of Public Debt under Foreign Law, published on February 13, 2020; iv) the Supermarkets’ Shelves Law published on March 17, 2020; and v) Decree No. 690/2020, published on August 22, 2020, which regulated information and telecommunications services and their tariffs. As of the date of this report it is not possible to predict whether the current administration will promote actions related to price controls of products elaborated by us. In case it does, we cannot predict how these measures willadversely affect our results of operations (see “— The impact of the Argentine congressional and presidential elections on the future economic and political environment of Argentina remains uncertain”).
Among other provisions, the Solidarity Law froze the electricity and natural gas tariff rates until December 31, 2020 and instructed the relevant regulatory agencies to pursue a mandatory renegotiation of those rates. Currently, a tariff renegotiation is in process. Any increase in tariff will result in an increase of costs.
As of the date of this report it is not possible to predict whether the current administration will promote additional actions related to price controls of products elaborated by us. In case it does, we cannot predict how these measures will affect our results of operations. Please bear in mind that due to the COVID-19 pandemic the Argentine Government intervention on economic, trade and regulatory matters has increased substantially.
Expropriations and other interventions by the Argentine government such as the one relating to YPF can have an adverse impact on the level of foreign investment in Argentina, the access of Argentine companies to the international capital markets and Argentina’s commercial and diplomatic relations with other countries. In the future, the level of governmental intervention in the economy may continue, which may have adverse effects on Argentina’s economy and, in turn, our business, results of operations and financial condition.condition
Although many of the above measures were adopted or announced by the former Argentine government’s administrations of Fernández de Kirchner, we cannot assure you that the Fernández Administration will not interfere or increase its intervention by setting prices or regulating other market conditions. Accordingly, we cannot assure you that we will be able to freely negotiate the prices of all our Argentine products in the future or that the prices or other market conditions that the Fernández Administration might impose will allow us to freely negotiate the prices of our products, which could have a material and adverse effect on our business, results of operations and financial condition.
The Argentine government may order salary increases to be paid to employees in the private sector, or imposed additional charges, which would increase our operating costs.
In the past, the Argentine government has passed laws, regulations and decrees requiring companies in the private sector to increase wages and provide specified benefits to employees and may do so again in the future. Argentine employers, both in the public and private sectors, have experienced significant pressure from their employees and labor organizations to increase wages and to provide additional employee benefits.
Due to the high levels of inflation, employees and labor organizations are demanding significant wage increases. Since June 2017, the minimum salary was raised from Ps.10,000 to Ps.21,600, as of the date of this report (in nominal terms without adjustment for inflation).
Since 2015, the INDEC has published the Salary Variation Index (Coeficiente de Variación Salarial), an index that shows the evolution of salaries. The Salary Variation Index showed an increase in registered private sector salaries of approximately 33.0% in 2016, 27.3% in 2017, 30.4% in 2018, 67.0% in 2019 and 34.4% in 2020. These increases were mainly in line with the inflation prevailing in Argentina.
Also,Finally, under Brazilian law, real property ownership is normally transferred by means of Decree No. 34/2019 issued on December 13, 2019, as amended,a transfer deed, and subsequently registered at the Argentine Executive Branch duplicated the amount of the statutory severance payments payable to employees hired before December 13, 2019 and fired between December 13, 2019 and January 25, 2021. After several extensions of this measure, on January 22, 2021, the Argentine government issued Decree No. 39/2021, which further extended the obligation to pay double severance amounts for employee terminations until April 25, 2021, but limited the amount of the additional severance payment to Ps. 500,000. It is likely that this provision would be further extended by the Government if the economic condition continues.
Furthermore,appropriate real estate registry office under the Solidarity Law (See “— The impactcorresponding real property record. There are uncertainties, corruption and fraud relating to title ownership of real estate in Brazil, mostly in rural areas. In certain cases, the Argentine congressionalreal estate registry may register deeds with errors, including duplicate and/or fraudulent entries, and, presidential elections on the future economictherefore, deed challenges frequently occur, leading to judicial actions and political environment of Argentina remains uncertain”) the Fernández Administration is empowered to,police investigations. Property disputes over title ownership are frequent in its sole discretion, provide mandatory salary increases for employees of the private sector, which occurred on January 2020, imposing the payment of an extraordinary non-remunerative bonus of AR$ 4,000 to all workers in the private sector, payable in two installments in January 2020Brazil, and, February 2020. This bonus and similar salary increases and additional payments could also have an effect on inflation.
On March 31, 2020, due to the COVID-19 pandemic, the Argentine government issued Decree No. 329/2020, which prohibits layoffs and dismissals due to force majeure or lack or decrease work during the next 60 days from the date of publication of the decree. In addition, Decree No. 39/2021 further extended the prohibition on terminations without cause, terminations based on the lack or reduction of work, and suspensions for force majeure events until April 25, 2021 (see “- The measures taken or to be implemented by the Argentine government in response to the COVID-19 pandemic may have an adverse effect on our business and operations”).
On August 14, 2020 the Argentine Executive Branch enacted the Law 27,555 that regulates dependent work provided from the employee's own home or from a place other than the employer's establishment and introduces the concept of teleworking. In addition, Law 27,555 establishes the minimum legal requirements for regulating teleworking, delegates specific aspects to collective bargaining, recognizes rights and duties for those who work under this modality (e.g., right of reversibility, right to digital disconnection, trade union rights, right to privacy) and contains regulations referring to working hours, provision of work tools and reimbursement of expenses. The Law 27,555 entered into force on April 1, 2021.
Due to the high levels of inflation, employers in both the public and private sectors have historically experienced, and currently are experiencing significant pressure from organized labor and their employees to provide further increases in salaries. If, as a result, of such measures, future salary increases in Argentine peso exceedthere is a risk that errors, fraud or challenges could adversely affect us.
Laws on the pace of the devaluation of the Argentine pesos, they could have a material and adverse effect on our expenses and business, results of operations and financial condition.
Argentine law concerning foreign ownership of rural properties may adversely affect our results of operations and future investments in rural properties in Argentina.properties.
In Argentina, Law No. 26,737, passed by the Argentine Congress in December 26,737/2011 and its implementing regulation Decree No. 274/2012, as amended and supplemented by Decree No. 820/2016, dated as of February 28, 2012 and of June 30, 2016, respectively, impose limits on the ownership or possession of rural landproperties by foreign legal entities or certain foreign individuals.
Law No. 26,737 and its implementing regulation require that, “foreign ownership” Under these rules, foreign ownership of rural land may not exceed 15% of the total amount of rural land in the Argentine territory calculated alsoand in relation to the territory of the Province, Departmentprovince, department or Municipalitymunicipality where the relevant lands are located. For purposes of the law, “foreign ownership” meansForeign ownership is defined as the ownership (whether by acquisition, transfer, assignment of rights or otherwise) overof rural land by: (i) certain foreign individuals, regardless of whether they are Argentine residents or not;residents; (ii) legal entities where foreign individuals or entities own, whether directly or indirectly, a number of votes sufficient to prevaildirect the entity’s decision-making process (which is presumed in the local entity’s decision-making process. It is presumed that foreign legal entities in which more thancase of an equity interest greater or equal to 51% of the stock is directly or indirectly owned by foreign individuals or entities are subject to Law No. 26,737;); (iii) companies that issue bonds (a) convertible in stock representing 51%25% or more of the company’s stock upon conversion and (b) whose holders are foreign individuals or entities; (iv) trusts whose beneficiaries are foreign individuals or entities as defined pursuant to (i) and (ii) above;holding an interest of at least 25%; (v) joint ventures in which foreign entities or individuals hold a participatingan interest highergreater than thoseas set forth byin the law; (vi) foreign, public law-governed legal entities; and (vii) simple associations or de facto corporations in which foreigners hold sharesan interest greater than as set forth in the percentage set forth by the new law in relation to corporations or which are controlled by foreigners.
Law No. 26,737 created a A National Registry of Rural Land (Registro Nacional de Tierras Rurales), or the “RNTR,” was made in charge of the enforcement of the provisions of the law and registry of rural land.this framework.
Any modification to the capital stock of companies that own or possess rural land, by public or private instrument, that implies a direct or indirect change of control, must be reported to the National Registry of Rural Land within 30 days from the date of such modification.
In addition, foreign entities or individuals of the samea single nationality may notcannot own more than 4.5% of rural land in Argentina, and a single foreign entity or individual may not own more than 1,000 hectares in thea certain “core area”, or the “equivalent surface”,surface,” as determinedset by the Interministerial Council of Rural Land (Consejo Interministerial de Tierras Rurales), in accordance with the provinces’ proposal, specifying districts, sub-regions or areas and taking into consideration the location of the land, the proportion of the land area in respect of the total territory of the relevant Province, Departmentprovince, department or Municipalitymunicipality and, the quality of the land for use and exploitation. The “equivalent surface” regime may be modified by the Interministerial Council of Rural Lands considering possible changes in the quality of the land or the growth of urban populations. Pursuant to Decree No. 274/2012, as amended and supplemented by Decree No. 820/2016, the departments that comprise the “core area” are: Marcos Juarez and Unión in the Province of Córdoba; Belgrano, San Martín, San Jerónimo, Iriondo, San Lorenzo, Rosario, Constitución, Caseros and General López in the Province of Santa Fe; and the districts of Leandro N. Alem, General Viamonte, Bragado, General Arenales, Junin, Alberti, Rojas, Chivilcoy, Chacabuco, Colón, Salto, San Nicolás, Ramallo, San Pedro, Baradero, San Antonio de Areco, Exaltación de La Cruz, Capitán Sarmiento, San Andrés de Giles, Pergamino, Arrecifes and Carmen de Areco in the Province of Buenos Aires.
ForeignMoreover, foreign legal entities or individuals may not own rural land that containcontains or areis located next to permanent and significant bodies of water to be determined by the Federal Hydrological Council (Consejo Hídrico Federal) and may also include hydrological works and projects considered strategic and involving the public interest.
Acquisition of rural land will not be deemed as an “investment” under bilateral investment treaties signed by the Argentine Republic, since rural land is deemed as “a non-renewable natural resource”.
The regulatory decrees of Law No. 26,737 provide that no previous authorization certificate is required for certain operations such as: (i) the transfer of the property or possession rights over real estate properties that were located in an “Industrial Area” or an “Industrial Park”, independently from the acquirer’s nationality, (ii) any modificationwater. Any change to the capital stock of companies that own or possess rural land by public or private instrument, when such modification impliesthat results in a direct or indirect change of control provided that such change of control is not made in favor of a new foreign legal entity or individual; and (iii) creation of certain real property rights overmust be reported to the rural land, such as easements.
Upon the issue ofRNTR within 30 days. As an exception, Decree No. 820/2016 the effects of Law No. 26,737 have been somewhat mitigated, by setting forthprovides that a term of 90 days during which the foreign legal entity or individual that has exceededmay exceed the allowed limit of ownership of rural land mustthresholds for up to 90 days, provided they reduce their current ownership to the legal limit by (i) transferring or causing any of its controlled legal entities to transfer the amount of rural land that exceeds the legal limit, or (ii) modifying or causing any of its controlled legal entities to modify the type of exploitation awarded to rural lands owned by such foreign legal entity, or (iii) transferring its participationinterest to permitted legal entities that are considered compliant pursuant to the terms ofunder Law No. 26,737.
Law No. 26,737 initially statedprovided that even though no vested rights couldwere not to be affected as a result of the application of such law, any act in violation ofby its provisions would be considered null and void.application. Decree No. 820/2016820 further clarified this situation and establishedset forth that the foreign entities or individuals who owned rural land in excess toof the allowed limit of ownership threshold when the Law No. 26,737 came into effect (i) are not obligedrequired to transfer such rural land in excess, and (ii) in the event of transfer of rural lands acquired before Law No. 26,737 came into force, they can acquire the equivalent to such transferred rural land, provided that the legal limits established tofor its use and location were complied with at the typetime of exploitation and location. Hence,such acquisition. As such, the application of these laws regarding foreign ownership of rural lands does not have an adverse effect on the current rural land owned by our Argentine subsidiaries.
However, our Argentine subsidiaries may be prevented from acquiring additional rural land in Argentina, which may adversely affect our financial condition and results of operations.
Recently, Section 154 of DNU 70/2023 has repealed Law No. 26,737. In addition to the control by Congress, DNU 70/23 is also subject to judicial review as to its constitutionality in cases arising from its entry into force or application. Recently, the Federal Court of Appeals in La Plata, in a class action promoted by an association of Former Combatants of Malvinas Islands, declared the unconstitutionality of Section 154 of DNU 70/23. Even though this ruling is not final, we consider that the repeal of Law 26,737 is currently suspended. It may be a matter of discussion whether this ruling has “erga omnes” (towards all) effects. However, as long as Law No. 26,737 has to be enforced by the Executive Power and it is the defendant of this process, we are of the opinion that Section 154 of DNU 70/23 is suspended. There is a meaningful risk to our business if Section 154 is suspended or declared unconstitutional given that, as set forth above, our Argentine subsidiaries may be prevented from acquiring additional rural land in Argentina, which may adversely affect our financial condition and results of operations.
In Brazil, Law No. 5,709/1971 sets forth certain restrictions on the acquisition of rural property by foreigners. Foreign investors may only acquire rural properties in which agricultural, cattle-raising, industrial or colonization projects are going to be developed as approved by the relevant authorities. The total rural area to be acquired by a foreign investor cannot exceed one quarter of the surface of the municipality where it is located, and foreigners of a single nationality cannot cumulatively own more than 10% of the surface of the respective municipality. The acquisition or possession (or any in rem right) by a foreign person of rural property located in an area of national security (i.e. at or near the Brazilian border) must be previously approved by the General Office of the National Security Council (Secretaria-Geral do Conselho de Segurança Nacional). Moreover, under Law No. 8,629/1993, these restrictions are also applicable to rural lease agreements; however, agriculture partnerships agreements (parcerias agrícolas) are not subject to these restrictions. The acquisition or lease by a foreign person of rural property exceeding 100 indefinite use units (módulos de exploração indefinida), a unit of measurement set by the National Institute of Colonization and Land Reform (Instituto Nacional de Colonização e Reforma Agrária), or “INCRA,” must be previously approved by the Brazilian Congress.
Between June 7, 1994 and August 22, 2010, the prevailing view was that Law No. 5,709 did not apply to Brazilian companies directly or indirectly controlled by foreign investors. However, an August 23, 2010 opinion by the Brazilian Solicitor-General’s Office (Advocacia-Geral da União), which was ratified by the President of Brazil, modified this view to confirm that Brazilian entities controlled by foreigners should be subject to these restrictions. We believe, and it is now generally held, that the recorded acquisition of rural land by Brazilian companies directly or indirectly controlled by foreigners prior to August 23, 2010 is not affected by this change in position.
Any new rural land acquisitions by us are nonetheless subject to these restrictions, the waiver of which may be burdensome and time consuming. In order to obtain the authorization for the acquisition or lease of rural properties, foreign investors must present a project proposal to INCRA describing: (i) the relationship between the property and the envisioned project; (ii) the physical and financial schedule of the investment and implementation of the project; (iii) whether governmental funds will finance the project; (iv) the logistical viability of the project and proof of compatibility between the envisioned site and the geographic location of the land; and (v) proof of compatibility with the environmental zoning rules relating to the location of the property. While we conduct our operations in Brazil through local subsidiaries, we would be considered a foreign controlled entity within the meaning of these restrictions. Therefore, if we are unable to comply with these restrictions and obtain the required approvals in connection with future acquisitions or lease transactions, our business plan, contemplated expansion in Brazil and results of operations would be adversely affected. In addition, there can be no assurance that future legislation will not further restrict the acquisition of rural land by Brazilian companies controlled by foreign holders.
An increase in export and import duties and controls may have an adverse impact on our sales.
The Argentine government has historically imposed duties on the exports of various primary and manufactured products, including some of our products. Since then, such export taxes have undergone significant increases, reaching a maximum of 35% inCurrently, the case of soybean. Currently, soybean are levied at a 33% export duty rate is 33% for soybean, 30-31% for soybean oil (depending on the applicable tariff code), 12% for soybean flour, and oil are levied at a 31% duty rate.29% for biodiesel. Most of other agricultural products, -suchsuch as fresh fruit and vegetables, usually grown in specific regions, were set at a 0% export duty rate on January 2021.
rate. Most industrial and manufactured goods have had their export duty rates reduced throughout 2021, 2022 and 2023. The Social Solidarity Law (passed in 2019) established new caps for the Fernandez Administration to determineset the export duty rate of all goods included in the tariff positions of the Common Mercosur Nomenclature until December 31, 2021.Nomenclature. Even
though most goods are capped tohave a maximum 15%12.0% ad valorem export duty rate, there are special lower caps for some agricultural products from specific regions and industrial goods.
On December 13, 2023 the Export Promotion Program was reestablished through the Decree No. 28/2023. The Fernandez Administration also implementedprogram provides that exporters of goods and certain services must enter and trade at the official exchange rate of 80% of their
sales through the FX Market. For the remaining 20% of their sales, exporters must execute purchase and sale transactions with marketable securities acquired with settlement in foreign currency and sold with settlement in local currency (spot transactions with entry settlement or “CCL de Entrada”).
Until recently, importers that intended to access the FX Market were requested to obtain an approved declaration submitted via the Argentine System of Imports (“SIRA” after its acronym in Spanish) from local authorities. The BCRA determined that as from December 13, 2023, it will not be necessary to obtain a SIRA in “exit” status to access the FX Market, nor to validate the operation in the Current Account for Foreign Trade. From December 26, 2023, through the Joint General Resolution No. 5466/2023, SIRA was replaced by SEDI (Statistical System for Imports). The SEDI system requires that importers register a sworn statement with the relevant data beforehand. This application is compared with the information in the tax authorities’ records and with the applicant’s financial economic capacity. Once these controls are passed, the application will be set to REGISTERED status. It is worth mentioning that the risk profile controls required under the SIRA system have been discontinued. To register a definitive import, it will be necessary to have a SEDI declaration in READY status. Once the status is READY, the SEDI declaration may be used within 360 calendar days. The SEDI regime does not require any prior sworn statements on November 2020 a compensation program for small-scale soybean producers. Additionally, duties on the exportationpayments of services were set to a 5% ad valorem export duty rate.abroad.
Argentina has also imposed
On the Import Monitoring System (Sistema Integral de Monitoreo de Importaciones or “SIMI”). Under this new system, importers areother hand, since December 26, 2023, there was an abrogation of Resolution No. 523/2017 of the National Secretariat of Commerce, which required to submit certain information electronically through the SIMI application which, once approved, will be valid for 90 calendar days.
In addition, the Macri Administration had enacted an import licensing regime that includesapproval of automatic and non-automatic licensingimport licenses prior to their definitive import for imports. Automaticgoods included in all the tariff positions of the Mercosur common nomenclature for definitive import licensing provides that the importer isfor consumption. In this scene, imports of goods will only required to submit information through the SIMI as well as provide other certification related to the imported goods. Non-automatic licensing provides that the authorities have a 10-day period to either approve or reasonably reject the import license requested based on its effect on local businesses, in addition to the other import requirements that the goods be subject to (SIMI, certifications, etc.).the “SEDI” information regime (which replaces the SIRA regime) established by means of Joint General Resolution No. 5466/2023, issued by the Federal Tax Authority and the Secretariat of Commerce.
The current Fernández Administration has determined many more tariff codes to undergo non-automatic import licensing procedures to control the flow of imports of final goods. Most raw materials, input for industries and machinery are mainly subject to automatic licensing. In late 2020, many importers have suffered either a delay or blockage on their non-automatic import license applications and started seeking judicial relief to lift the blockages of their prospective imports.
Notwithstanding the above, we cannot assure youThere can be no assurance that there will not be further increases in the export taxes or that other new export taxes or quotas will not be imposed. The imposition of new export taxes or quotas or a significant increase in existing export taxes or the application of export quotas or the imposition of regimes that aim to restrict or control imports and exports could adversely affect our financial condition or results of operations.
Exchange controls restrict the inflow and outflow of funds in Argentina and may substantially limit the ability of companies to retain or obtain foreign currency or make payments abroad.
BetweenIn the past, the Brazilian economy has experienced balance of payment deficits and shortages in foreign exchange reserves, and the Brazilian government has responded by restricting the ability of Brazilian or foreign persons or entities to convert Reais into foreign currencies. The Brazilian government may institute a restrictive exchange control policy in the future. Any restrictive exchange control policy could prevent or restrict our Brazilian subsidiaries’ access to U.S. dollars, and consequently their ability to meet their U.S. dollar obligations and may adversely affect our financial condition and results of operations.
Similarly, between 2011 and 2015, until President Macri took office, the Argentine government increased controls and restrictions on the sale of foreign currencies and the acquisition of foreign assets by Argentine residents, limitingand limited the possibilitytransfer of transferring funds abroad. Through a combination of foreign exchange and tax regulations, the Fernández de Kirchner administration significantly curtailed access to the FX Market byfor individuals and private-sector entities. In addition, duringentities, and the last few years under the Fernández de Kirchner administration, the Argentine Central BankBCRA exercised a de facto prior approval for certain foreign exchange transactions otherwise authorized to be carried out under the applicable regulations, such as dividend payments or repayment of principal of intercompany loans as well as the payments related to import of goods, by means of regulating the amount of foreign currency available to companies to conduct such transactions. The number ofThese exchange controls introduced in the past and in particular after between 2011 and 2015 during the Fernández de Kirchner administration gave rise to an unofficial U.S. dollar trading market, and the unofficial Argentine pesoPeso to U.S. dollar exchange rate in such market differed substantially from the official Argentine pesoPeso to U.S. dollar exchange rate. Due to the foreign exchange crisis generated in August 2019 and the continued reduction of the Argentine Central Bank’sBCRA’s foreign currency reserves, since September 1, 2019 the Argentine government has reinstated, in 2019, rigid exchange controls and transfer restrictions, substantially limiting the ability to obtain foreign currency or make certain payments or distributions out of Argentina, (see "Item 10 - Additional Information-Exchange Controls”).
which have been extended without time limitation by Decree No. 91/2019, and BCRA Communication “A” 6,862/2020. In response to the re-imposed foreignthese exchange restrictions, an unofficial U.S. dollar trading market developed again in which the Argentine peso-U.S. dollar exchange rate differed substantially from the official Argentine peso-U.S. dollar exchange rate in the FX Market.
once again. In addition, access to foreign currency and its transfer outside of Argentina can alsobegan to be obtained and carried out through capital markets transactions denominated Blue-Chip Swap,referred to as “Blue-chip swap”, subject to certain restrictions, which isare significantly more expensive than acquiring foreign currency in the FX Market.
Notwithstanding the measures adoptedannouncements, made by the ArgentineMilei administration, that foreign exchange controls will be lifted before the end of the 2024, the government recently, it may impose additional exchange controls, transfer restrictions, restrictions on the free movement of capital, and may implement other measures in response to capital flight or a significant depreciation of the Argentine peso,Peso, which would adversely affect our financial condition and the results of our operations. In addition, other exchange controls could in the future further impair or prevent the conversion of anticipated dividends, distributions, or the proceeds from any sale of equity holdings in Argentina from Argentine pesosPesos into U.S. dollars and the remittance of the U.S. dollars abroad. These restrictions
and controls could further interfere with the ability of our Argentine subsidiaries to make distributions in U.S. dollars to us and thus our ability to pay dividends in the future. Such
measures could lead to renewed political and social tensions, and could undermine the Argentine government’s public finances, which could adversely affect Argentina’s economy and prospects for economic growth and, consequently, adversely affect our business and results of operations, and could impair our ability to make dividend payments.
Changes in
In an effort to contain the Argentine tax laws may adversely affect the results of our operations, financial condition and cash flows.
On December 29, 2017, the Argentine Government enacted Law No. 27,430 (the "Tax Reform Law"), a comprehensive tax reform which became effective on January 1, 2018. Specifically, Law No. 27,430 introduced amendments to income tax (both at corporate and individual levels), value added tax, tax procedural law, criminal tax law, social security contributions, excise tax, tax on fuels and tax on the transfer of real estate. In addition, the Solidarity Law, introduced important tax modifications -among other provisions- which modified the Tax Reform Law, provided measures regarding employer contributions, applicable rates for foreign goods and created, in regards to the Tax for an Inclusive and Solidary Argentina, an 8% rate for the acquisition of digital services and a 30% rate for the acquisition services abroad and passenger transport services destined outside the country (see “—The impactescalation of the Argentine congressional and presidential elections oncurrency exchange rate, the future economic and political environmentBCRA has been selling its reserves of Argentina remains uncertain”).
The Tax Reform Law introduced several amendments in connection with federal income tax, such as the progressive reduction of the tax rate on corporate level from 35% to a 30% applicable to the fiscal periods starting on January 1, 2018 until December 31, 2019; and to 25% applicable to the fiscal periods starting on January 1, 2020, and established that dividends or other profits distributed to Argentine resident individuals and foreign beneficiaries would be subject to taxation. Therefore, as of January 1, 2018, income tax on Argentine resident companies and branches of non-Argentine entities applies in two stages: (i) a first stage is charged at the corporate level (at a tax rate of 30% or 25%, depending on the fiscal period involved, as explained above); and (ii) a second stage is charged at the shareholder or owner level - in respect of an Argentine resident individual or a foreign beneficiary- (at a tax rate of 7% or 13%, according to the fiscal period from which the distributed profit derived). Such tax treatment was amended by the Solidarity Law, which established: (i) the suspension up to fiscal years to be initiated as of January 1, 2021 inclusive, of the 25% corporate income tax rate and of the 13% tax rate applicable on dividends; and that (ii) on such periods of suspension, the applicable rate on corporate income tax will be of 30% and the applicable rate on dividends will be of 7%. The Argentine Congress is currently discussing a draft bill to modify the following aspects: (i) amend the corporate tax rate for Argentine entities, by applying a sliding scale from 25% to 35%, depending on the accumulated net income obtained during the given year; and (ii) regardless of the applicable corporate tax rate, in all cases, dividends or profits will be levied at a 7% tax rate. If the bill is approved by the Argentine Congress, such tax treatment would be applicable for fiscal years starting as of January 1, 2021.
The Tax Reform Law eliminated the equalization tax, which levied distributions made out of previously untaxed income, was eliminated. The sale, exchange or disposition of shares and other securities not trading in, or listed on, capital markets and securities exchanges by resident individuals and foreign beneficiaries in general is subject to tax at a rate of 15%. Non-residents can opt to be taxed at a rate of 15% on the net gain or 13.5% on the gross amount of the transaction, at the option of the seller.
These and other changes in the Argentine tax laws could adversely affect our operations, financial condition and cash flows.
Risks Related to Brazil
The measures taken or to be implemented by the Brazilian government in response to the COVID-19 pandemic may cause adverse effect on our business and operations.
In March 2020, the World Health Organization declared the COVID-19 outbreak a pandemic. This pandemic, as well as the reality or fear of any other adverse public health developments, could adversely and materially affect, among other things, our manufacturing and supply chain operations, including due to the reduction or closure of our production units and the interruption of the supply of raw materials (see “— Risks Related to Our Business and Industries-The COVID-19 pandemic may have an adverse effect on our business and operating results”).
In this regard, the Brazilian federal, state and municipal governments and other authorities have enacted a number of rules to address the potential impacts of the COVID-19 outbreak. Considering the possible outcomes thereof, we may be exposed to additional risks, which include:
(i) to contain or delay the spread of COVID-19, the Brazilian Ministry of Health, as well as several state and municipal authorities have adopted or recommended social distancing measures, which may ultimately result in severe fines/penalties;
(ii) in March 2020, the Brazilian government created a Crisis Committee to Monitor the Impacts of COVID-19 in Brazil. Since then, it has announced several measures (tax or otherwise) to address the effects of COVID-19 in Brazil. Likewise, the Brazilian Congress is currently discussing several measures to increase the Brazilian government’s revenues, such as imposing new taxes, revoking tax benefits and increasing the rates of current taxes; and
(iii) States and municipalities may also revoke tax benefits and/or increase the rates of current taxes to increase its revenues. See “— We receive certain tax benefits from Brazilian Tax Authorities which we cannot assure will be maintained or renewed;”.
These new rules, if approved, may have a material adverse impact on our results of operations.
Further, the ongoing COVID-19 pandemic and any possible future outbreaks of viruses may have a significant adverse effect on us. Firstly, a spread of such diseases amongst our employees, as well as any quarantines affecting them or our facilities could adversely impact the productivity of our personnel and thereby affect our operations, which can impact the quality and continuity of our activities and, ultimately, our reputation. Secondly, the current COVID-19 pandemic and any possible future outbreaks of viruses may have an adverse effect on our suppliers and/or transportation companies used to distribute our products. Thirdly, any quarantines or spread of viruses may adversely affect the demand of our products from end-consumers.
It is also possible that our commercial contracts, including power supply agreements, could be affected by adverse impacts derived from the COVID-19 pandemic, since the parties thereto may not comply with their contractual obligations. As the COVID-19 pandemic will most likely be considered as an act of God or force majeure event by Brazilian courts, parties may justify their nonperformance and request (i) termination without penalties; (ii) adjustment and/or release of contractual obligations; (iii) adjustment and/or release of the effects of arrears; and/or (iv) adjustment and/or release of penalties for breach of contract, which, in any case, may cause a negative impact on our results of operations.
Additionally, our operations may be adversely affected by the wider macroeconomic effect of the ongoing COVID-19 pandemic. Currently, it is expected there be a recession or diminishing growth in several countries, including Brazil, due to the freeze of the economic activities. Although the economic scenario is still uncertain, the updated forecast for the 2021 Brazilian GDP points out to a growth, following a 4.1% recession in 2020. The final effects of the COVID-19 pandemic could have substantial negative impact on the countries where we operate. Any negative effect on the economy, particularly in the countries that we operate, may decrease incomes and the demand for our products. Lastly, in case of an economic downturn, the price of our common shares may be adversely affected.
Moreover, Brazil is experiencing political disagreements among governments and other authorities in connection with the measures that have been adopted and the ones that might be implemented.
In March 2021, after a second wave of the pandemic, Brazil has become the country with the current highest daily death toll in the world. The Brazilian government cannot affirm confirm if the vaccination will be concluded in 2021 and when and the pandemic will be under control. Therefore, these institutional conflicts since the beginning of COVID-19 as well as the
potential adoption of measures against WHO’s recommendations may lead to political turmoil and, ultimately, civil riots and impeachment process, which all may potentially negatively impact our businesses and operations in Brazil .
Lastly, there is considerable uncertainty regarding the possible outcomes of the COVID-19 pandemic and we cannot assure that other measures will be implemented to mitigate the impacts of the COVID-19 and whether they will mean tougher restrictions or limitations that could affect our operations. In addition, the deterioration of global economic conditions as a result of the pandemic may ultimately decrease customer demand for our products and have a material adverse effect on our financial condition and results of operations.
Brazilian economic and political conditions and perceptions of these conditions in international markets have a direct impact on our business and our access to international capital and debt markets, which could adversely affect our results of operations and financial condition.
A significant portion of our operations, properties and customers are located in Brazil. Accordingly, our financial condition and results of operations are substantially dependent on economic conditions in Brazil. The Brazilian economy has experienced significant volatility in recent decades, characterized by periods of low or negative growth, high and variable levels of inflation and currency devaluation. Brazil’s GDP decreased 3.3% in 2016, increased 1.3% in 2017, increased 1.3% in 2018, increased 1.1% in 2019 and decreased 4.1% in 2020. We cannot assure you that GDP will increase or remain stable in the future. Future developments in the Brazilian economy may affect Brazil’s growth rates and, consequently, the consumption of sugar, ethanol, and our other products. As a result, these developments could impair our business strategies, results of operations and financial condition. Furthermore, due to the ongoing COVID-19 outbreak, it is expected that Brazil’s GDP for 2021 fiscal year will again be negatively impacted, but may show positive figures at year-end. See "— We may be exposed to risks related to health epidemics, and the COVID-19 in particular, that could adversely impact our ability to operate our business and operating results”.
Historically, Brazil’s political situation has influenced the performance of the Brazilian economy, and political crisis have affected the confidence of investors and the general public,U.S. dollars, which has resulted in economic deceleration and heightened volatilitya decrease in BCRA international reserves from US$ 65.7 billion as of December 2018 to US$ 28.2 billion as of March 2024. However, the securities issued abroad by Brazilian companies. Future developments in policiesactual net liquid international reserves of the Brazilian government and/or the uncertainty of whether and when such policies and regulations mayBCRA is reported by private sources to be implemented.substantially lower.
See “Item 10. Additional Information—D. Exchange Controls.”
Changes in Brazilian tax laws, incentives, benefits and regulations may have a material adverse impact on the taxes applicable to our business and may increase our tax burden.
Changes in tax laws, regulations, related interpretations and tax accounting standards in Brazil, Argentina, Uruguay, Luxembourg or the United States may result in a higher tax rate on our earnings, which may significantly reduce our profits and cash flows from operations.
The Brazilian government frequently implements changes to the Brazilian tax regime that may affect us and our clients. These changes include changes in prevailing tax rates and, occasionally, imposition of temporary taxes, the proceeds of which are earmarked for designated Brazilian government purposes. Some of these changes may result in increases in our tax payments, which could adversely affect industry profitability and increase the prices of our products, restrict our ability to do business in our existing and target markets and cause our financial results to suffer.
Over the past years Brazil has faced an economic recession and the Government is adopting fiscal adjustment measures. Any fiscal adjustment is complex and involves radical and unpopular measures. The Minister of Finance has also been raising the possibility of increasing or creating new taxes. For example,Recently, Brazilian government initiatives have proposed changes to the Brazilian tax regime that, if enacted, could impact our business. Bill No. 3,887/2020 would replace the PIS/COFINS tax (a social contribution on gross revenues) with a new Contribution on Goods and Services (CBS), and Bill No. 2,337/2021 would comprehensively reform income taxation rules primarily by revoking the income tax exemption on the distribution of dividends by Brazilian companies while also introducing new anti-avoidance provisions for a broad variety of transactions among related parties, ending the deductibility of interest on equity expenses, extending the minimum term for the amortization of intangibles, and changing the income tax rules related to Brazilian investment funds, among other changes. More specifically, ending the deductibility of interest on equity would impact the net amount to be received by our shareholders in the form of dividends. Although these laws have not yet been enacted and it is not possible to determine at this time the exact changes that will eventually pass into law, any such changes could have adverse effects on our results and operations. Further, Brazilian government authorities at the federal, state and local levels may reduceconsider changes in tax laws to cover budgetary shortfalls resulting from the recent economic downturn in Brazil, including the impact of COVID-19. If enacted, such changes may harm our profitability by increasing our tax burden, increasing our tax compliance costs or increase at any time through a presidential decree the ratesotherwise affecting our financial condition, results of operations and cash flows. The Brazilian government regularly enacts reforms to the tax levied on financial operations, such as credit transactions (“IOF/Credit”), foreign exchange transactions (“IOF/Exchange”), derivative securities transactions (“IOF/Securities”), amongand other taxable events. On March, 30, 2017, a presidential decree was published in orderassessment regimes to introduce a 0.38% rate of the IOF/Credit on some loan transactions, such as credits provided by cooperatives, which were previously subject to a zero percent rate.
It is also common for taxpayers to file suits for the declaration that a certain tax is illegal or unconstitutional.we and our customers are subject. Such cases where the final decision is favorable to taxpayers, a situation that occurs very frequently. Accordingly, the Brazilian Government may proposereforms include changes in tax rates and, occasionally, enactment of temporary levies, the proceeds of which are earmarked for designated governmental purposes. The effects of these changes and any other changes that result from the enactment of additional tax legislationreforms cannot be quantified and there can be no assurance that any such reforms would not have an adverse effect upon our business. Furthermore, such changes may produce uncertainty in orderthe financial system, increasing the cost of borrowing and contributing to an increase rates, tax basis and/or to create new taxes.
in our non-performing credit portfolio. The effects of these changes and any other change that could result from the enactment of additional legislation cannot be quantified. We cannot assure youThere can be no assurance that we will be able to maintain our projected cash flow and profitability following any increases in Brazilian taxes applicable to us and our operations.
We are also subject to review of the interpretation of certain laws by the Brazilian Judiciary, which may result in adverse tax consequences for us. For example, in February 2023, the Federal Supreme Court, by unanimous vote, concluded that favorable judicial decisions to taxpayers (res judicata) must be automatically voided if, after such decisions were issued, the Supreme Court reaches a different conclusion on the subject matter in question. That is, if a company obtained authorization from a court to stop withholding a specific tax in the past, such authorization will automatically expire upon confirmation by the Brazilian Supreme Court that the withholding of such tax is legitimate and due. Accordingly, if pro-taxpayer court decisions are reversed by the Brazilian Supreme Court, and we have benefited from any such decisions, our business, financial performance and operating results could be negatively affected.
Similarly, the Argentine Government frequently implements changes to the Argentine tax regime. Due to the recent change in the Argentine administration which took place in December 2023, we may be subject to new tax reforms that adversely affect our business.
On December 29, 2017, the Argentine government enacted Law No. 27,430, or the “Tax Reform Law,” a comprehensive tax reform which became effective on January 1, 2018. The Tax Reform Law introduced several amendments in connection with federal income tax, such as the progressive reduction of the tax rate at the corporate level from 35% to 25% and established that dividends or other profits distributed to Argentine resident individuals and foreign beneficiaries would be subject to taxation at tax rate of 7% or 13%, according to the fiscal period from which the distributed profit derived. The Tax Reform also eliminated the equalization tax. However, both tax treatments were amended by the Social Solidarity Law in 2019, which established the applicable rate on corporate income tax will be 30% and the applicable rate on dividends will be 7%. The sale, exchange or disposition of shares and other securities not trading in, or listed on, capital markets and securities exchanges by resident individuals and foreign beneficiaries in general is subject to tax at a rate of 15%. Non-residents can opt to be taxed at a rate of 15% on the net gain or 13.5% on the gross amount of the transaction, at the option of the seller.
In 2018, Laws No. 27,430 and No. 27,468 reinstated the application of an integral inflation adjustment tax mechanism for corporate taxpayers, as a corrective mechanism to assess the real gain subject to tax, but only to the extent that the CPI exceeds 100% in the 36 previous months to the closing of each relevant fiscal year. For fiscal periods starting on or after January 1, 2019, 2020 and 2021, special rates were established.
On June 16, 2021, the Argentine government enacted Law No. 27,630 which amended the Argentine income tax law and replaced the fixed rate paid by Argentine companies on their corporate income from 30% to a progressive rate ranging from 25% to 35% for tax periods starting on January 1, 2021. Subject to net income amounts, companies will have to pay a fixed amount and a progressive rate over the surplus of the minimum base rate in their category. These amounts will be adjusted on a yearly basis starting January 1, 2022 based on the CPI variation. The applicable rate over profits and dividends paid to shareholders, whether they are individuals, or undivided estates residing in Argentina or foreign residents, will continue to be 7% in all cases, regardless of the tax rate paid by the company at the corporate level.
In addition, the Social Solidarity Law amended the Tax Reform Law to govern employer contributions and the applicable rates for foreign goods and created an 8% tax rate for the acquisition of digital services and a 30% rate for the acquisition services abroad and passenger transport services destined outside the country. The Social Solidarity Law also introduced other amendments to the income tax, personal assets tax, excise tax on certain goods, tax on debits and credits in local bank accounts and social security rules. It also established a new tax on certain purchases of foreign currency, a new tax debt settlement plan for certain taxpayers, and established new rates on exports of goods and services. Argentine companies are required to pay personal assets tax corresponding to Argentine resident individuals, foreign individuals and foreign entities for holding equity interests in such companies as of December 31 of each year. Under the Social Solidarity Law, the tax rate applicable to shares or interests in the capital of companies governed by the Argentine corporate law was increased from 0.25% to 0.50% of the pro rata equity value. The tax is levied on the equity stated in the latest financial statements.
In addition, the Company is within the scope of the OECD (Organization for Economic Cooperation and Development) Pillar Two model rules (the Global Anti-base Erosion rules or GloBE). Pillar Two legislation was enacted in Luxembourg, the jurisdiction in which the company is incorporated, and came into effect from January 2024. Since the Pillar Two legislation was not effective at the reporting date, the Company has no related current tax exposure. Under Pillar Two, the Company is liable to pay a top-up tax for the difference between its GloBE effective tax rate per jurisdiction and the 15% minimum rate. All jurisdictions within the group have an effective tax rate that exceeds 15%, except for Uruguay. Although Uruguay may have a rate below 15%, we estimate that the impact would not be significant.
These and other changes in Brazilian and Argentine tax laws could adversely affect our operations, financial condition and cash flows.
We receive certain tax benefits from Brazilian Tax Authorities which we cannot assuretax authorities, and there can be no assurance that such benefits will be maintained or renewed.
We receive certain tax benefits by virtue of our production facilities and investment projects in underdeveloped regions in Brazil. Our mainThese tax benefitincentives reduce the amount of theBrazilian sales tax ICMS, (circulation tax for goods and services) fromdue in the state of Mato Grosso do Sul (Ivinhemaas a result of the Ivinhema and Angélica Mill) wasmills. These benefits were most recently renewed until 2032.
We cannot assure youThere can be no assurance that the tax incentives we currently benefit from will be maintained, renewed or that we will obtain new tax incentives on favorable terms. In the event we fail to comply with specific obligations to which we are subject in
connection with the tax benefits described above, such benefits may be suspended or cancelled,canceled, or we may be required to pay the taxes due in full, plus penalties, which may adversely affect us. Additionally, we cannot assure youthere can be no assurance that we will be able to renew these tax benefits when they expire, or to obtain additional tax benefits under favorable conditions. State and federal governments frequently implement changes to the tax regimes, such as changes in tax rates, thatwhich may adversely affect us or our customers. If our current tax benefits are cancelledcanceled or not renewed, we may be materially adversely affected.
Widespread corruption and fraud relatingRisks Related to ownership of real estate may adversely affect our business, especially our land transformation business.Our Common Shares
Under Brazilian Legislation, real property ownership is normally transferred by means of a transfer deed, and subsequently registered at the appropriate Real Estate Registry Office under the corresponding real property record. There are uncertainties, corruption and fraud relating to title ownership of real estate in Brazil, mostly in rural areas. In certain cases, the Real Estate Registry Office may register deeds with errors, including duplicate and/or fraudulent entries, and, therefore, deed challenges frequently occur, leading to judicial actions and police investigations. Property disputes over title ownership are frequent in Brazil, and, as a result, there is a risk that errors, fraud or challenges could adversely affect us.
Social movements and the possibility of expropriation and constitution of public easement may affect the normal use of, damage, or deprive us of the use of or fair value of, our properties.
Social movements, such as Movimento dos Trabalhadores Rurais Sem Terra and Comissão Pastoral da Terra, are active in Brazil and advocate land reform and mandatory property redistribution by the Brazilian government. Land invasions and occupations of rural areas by a large number of individuals is common practice for these movements, and, in certain areas, including those in which we have invested or are likely to invest, police protection and effective eviction proceedings are not available to land owners. As a result, we cannot assure you that our properties will not be subject to invasion or occupation by these groups. A land invasion or occupation could materially impair the normal use of our lands or have a material adverse effect on our results of operations, financial condition or the valueThe price of our common shares. In addition, our landshares may be subjecthighly volatile.
We cannot predict the extent to expropriation bywhich investor interest in our common shares will create or be able to maintain an active trading market, or how liquid that market will be in the Brazilian government. Under Article 184 of the Brazilian Constitution, the Brazilian government may expropriate land that is not in compliance with mandated local “social functions”. A “social function” is defined in Article 186 of the Brazilian Constitution as (i) rational and adequate exploitation of land; (ii) adequate use of natural resources available and preservation of the environment; (iii) compliance with labor laws; and (iv) exploitation of land to promote welfare of owners and employees. If the Brazilian government decides to expropriate anyfuture. The market price of our properties, our results of operationscommon shares may be adversely affected, to the extent that potential compensation to be paid by the Brazilian governmentvolatile and may be less than the profit we could make from the sale or useinfluenced by many factors, some of such land. Disputing the Brazilian government’s expropriation of land is usually time-consuming and the outcomes of such challengeswhich are uncertain. In addition, we may be forced to accept public debt bonds, which have limited liquidity, as compensation for expropriated land instead of cash.
Moreover, along with the expropriation rights, the Brazilian legislation also confers to the Government (or the Concessionary of public services) the power to constitute public easements over third-parties real estate properties. Public easements are commonly used in those situations which the infrastructure project requires the use of a portion of several real estate properties, mostly in rural areas, such as the installation of transmission lines or oil and gas pipelines.
Public easement also requires the payment of a fair and prior indemnification, which authorizes the government (or concessionary of public services) to use such property for public interest. The institution of public easement shall observe the same procedure for expropriation of real estate property. However, unlike expropriation, the public easement does not remove the property from the owner's estate, but only creates the right of using the property or part of it. The constitution of a public easement will prevent the use of the part of the property andbeyond our results of operations may be adversely affected if such easement is constituted in into the liquidity area of our farmland holdings.
Brazilian rules concerning foreign investment in rural properties may adversely affect our investments.
Brazilian Federal Law No. 5,709, effective October 7, 1971 (“Law 5709”) established certain restrictions on the acquisition of rural property by foreigners, including that (i) foreign investors may only acquire rural properties in which agricultural, cattle-raising, industrial or colonization projects are going to be developed as approved by the relevant authorities; (ii) the total rural area to be acquired by a foreign investor cannot exceed one quarter of the surface of the municipality where it is located, and foreigners with the same nationality may not own, cumulatively, more than 10% of the surface of the municipality in which it is located; and (iii) the acquisition or possession (or any in rem right) by a foreigner of rural property situated in an area considered important to national security (i.e. land located at or near the Brazilian border) must be previously approved by the General Office of the National Security Council (Secretaria-Geral do Conselho de Segurança Nacional). Pursuant to Article 23 of Law No. 8,629, of February 25, 1993 (“Law 8629”), the restrictions mentioned in items (i) and (ii) above established by Law 5709 are also applicable for rural lease agreements executed by foreigners. “Parcerias Agrícolas” (agriculture partnerships agreements) have not been subject to these restrictions. The Federal General Attorney’s Office (“AGU”) on October 8, 2012 issued a legal opinion 005/2012, pursuant to which the AGU confirmed the understanding that the “Parcerias Rurais” are not subject to the restrictions or limitations of Law 5709. In addition, pursuant to Law 8629, the acquisition or lease by a foreigner of a rural property exceeding 100 módulos de exploração indefinida – “MEI,” a measurement unit defined by the Regional Superintendence of the National Institute of Colonization and Land Reform (Superintendência Regional do Instituto Nacional de Colonização e Reforma Agrária – “INCRA”) must be previously approved by the Brazilian National Congress. Law 5709 also establishes that the same restrictions apply to Brazilian companies that are directly or indirectly controlled by foreign investors. Any acquisition or lease of rural property by foreigners in violation of the terms of Law 5709 would be considered null and void under Brazilian law.
Since the enactment of the Brazilian Constitution in 1988, the consensus view was that the restrictions imposed by Federal Law 5709 on the acquisition or lease of rural property above-mentioned did not apply to Brazilian companies controlled by foreigners, pursuant to legal opinion No. GQ-22, issued by the AGU in 1994, which was ratified by legal opinion No. GQ-181, also issued by the AGU in 1998. The Brazilian Constitution and its amendments, in particular Constitutional Amendment No. 6, of August 15, 1995, provides that (i) no restrictions on the acquisition of rural land in Brazil should apply to Brazilian companies; and (ii) any company incorporated and headquartered in Brazil and controlled by foreign investors must receive the same treatment as any other company incorporated and headquartered in Brazil and controlled by Brazilian investors. However, the Brazilian Justice National Council issued an Official Letter on July 13, 2010 addressed to all the Brazilian local State Internal Affairs Bureaus in order for them to adopt procedures within sixty (60) days and instruct the local State Notary and Real Estate Registry Offices to observe the restrictions of the Brazilian law on the acquisitions of rural land by Brazilian companies with foreign equity holders. Thereafter, on August 19, 2010, the AGU revised its prior opinion, and published a new legal opinion which: (i) revoked the AGU’s legal opinions No. GQ-22 and GQ-181; and (ii) confirmed that Brazilian entities controlled by foreigners should be subject to the restrictions described above, and transactions entered into by foreigners in connection with the acquisition of rural properties would be subject to approval from INCRA, the Ministry of Agrarian Development and the Brazilian National Congress, when applicable. This revised opinion was ratified by the President of Brazil and published in the Official Gazette of the Federal Executive on August 23, 2010, becoming effective as of such date. We believe that the acquisitions of rural properties by Brazilian companies directly or indirectly controlled by foreigners registered in the appropriate real estate registry prior to August 23, 2010 are not affected by the AGU’s legal opinion. As a confirmation of such understanding, pursuant to the Joint Normative Ruling N. 1 issued on September 27, 2012 by the Ministries of: (i) Agricultural Development; (ii) Agriculture, Cattle-raising and Supply; (iii) Industry Development and Foreign Commerce; and (iv) Tourism (the “Joint Normative Ruling N. 1”); and the Normative Ruling/IN INCRA No.76, issued on August 23, 2013, a Brazilian company controlled by foreign individuals or companies which acquired or leased rural properties, by means of an act or agreement entered into from June 7, 1994 and August 22, 2010, may register such property before the National System of Rural Registry (Sistema Nacional de Cadastro Rural-SNCR), without any administrative sanction. However, as of said date, the acquisition and leasing of rural land in Brazil, including through corporate transactions, will be subject to the above-mentioned restrictions, and will require several additional layers of review and approvals, which may be discretionary (including the approvals from INCRA, Ministry of Agrarian Development and the Brazilian National Congress, when applicable), burdensome and time consuming. Additionally, the Joint Normative Ruling N. 1 sets forth the administrative procedures applicable to requests for authorization for the acquisition or lease of rural properties by foreign investors pursuant to Law 5709. Under the Joint Normative Ruling, in order to obtain the authorization for the acquisition or lease of rural properties, foreign investors must present a project proposal to the INCRA, containing: (i) the rationale for the relationship between the property to be acquired or leased and the project size; (ii) physical and financial schedule of the investment and implementation of the project; (iii) use of official credit (governmental funds) for the total or partial finance of the project; (iv) logistic viability of the execution of the project and, in case of an industrial project, proof of compatibility between the local industrial sites and the geographic location of the lands; and (v) proof of compatibility with the criteria established by the Brazilian Ecological and Economical Zoning (Zoneamento Ecológico Econômico do Brasil – ZEE), relating to the location of the property.
While we conduct our operations in Brazil through local subsidiaries, we would be considered a foreign controlled entity within the meaning of the restrictions described above. Therefore, if we are not able to comply with these restrictions and obtain the required approvals in connection with future acquisitions or lease transactions, our business plan, contemplated expansion in Brazil and results of operations will be adversely affected.
Furthermore, there is currently proposed legislation under review in the Brazilian National Congress regarding the acquisition of rural land by Brazilian companies controlled by foreign holders, which if approved may further limit and restrict the investments of companies with foreign equity capital in rural land in Brazil. Such further restrictions, if adopted, may place more strain on our ability to expand our operations in Brazil.
The Brazilian government has exercised, and continues to exercise, significant influence over the Brazilian economy, which, combined with Brazilian political and economic conditions, may adversely affect us.
We may be adversely affected by the following factors, as well as the Brazilian government’s response to these factors:control, including:
•economic and social instability;the failure of financial analysts to cover our common shares or changes in financial estimates by analysts;
•increaseactual or anticipated variations in interest rates;our operating results;
•exchange controls and restrictions on remittances abroad;changes in financial estimates by financial analysts, or any failure by us to meet or exceed any of these estimates, or changes in the recommendations of any financial analysts that elect to follow our common shares or the shares of our competitors;
•restrictions and taxes on agricultural exports;announcements by us or our competitors of significant contracts or acquisitions;
•exchange rate fluctuations;
•inflation;
•volatility and liquidity in domestic capital and credit markets;
•expansion or contractionfuture sales of the Brazilian economy, as measured by GDP growth rates;
•allegations of corruption against political parties, elected officials or other public officials, including allegations made in relation to the “Car Wash Operation” (Operação Lava-Jato) investigation;
•government measures aimed at controlling the COVID-19 outbreak;
•government policies related to our sector;
•fiscal or monetary policy and amendments to tax legislation;common shares; and
•other political, diplomatic, social or economic developmentsinvestor perceptions of us and the industries in or affecting Brazil.which we operate.
Historically, the Brazilian government has frequently intervened in the Brazilian economy and has occasionally made significant changes in economic policies and regulations, including, among others, the imposition of a tax on foreign capital entering Brazil (IOF tax), changes in monetary, fiscal and tax policies, currency devaluations, capital controls and limits on imports. The administration is currently facing domestic pressure to retreat from the current macroeconomic policies in an attempt to achieve higher rates of economic growth. In addition, the Brazilian government has discussed the creation of a tax on financial transactions, including wire transfers, (the so-called “CPMF”)equity markets in order to improve the fiscal situation of the countrygeneral have experienced substantial price and volume fluctuations that have often been unrelated or to increase the IOF taxation. We cannot predict which policies will be adopted by the Brazilian government and whether these policies will negatively affect the economy or our business or financial performance.
The Brazilian economy has been experiencing a slowdown over the past years and the Brazil’s GDP growth has fluctuated over the past few years, with a growth of 3.0% in 2013, an increase of 0.5% in 2014, and a contraction of 3.5% in 2015 and 3.3% in 2016. In 2017, 2018 and 2019 Brazilian economy increased 1.3%, 1.3% and 1.1%, respectively. In 2020, there was a decrease of 4.1%. Inflation and unemployment have increased more recently and the Brazilian Real has weakened significantly in comparisondisproportionate to the U.S. dollar. Although the scenario still uncertain, particularly due to the COVID-19 outbreak,operating performance of particular companies affected. These broad market and industry factors may materially harm the market expectations for 2021 are that the Brazilian economy will experience a growth in GDP. Our resultsprice of operations and financial condition may be adversely affected by the economic conditions in Brazil.
Allegationsour common shares, regardless of political corruption against the Brazilian government and the Brazilian legislative branch could create economic and political instability.
our operating performance. In the past, membersfollowing periods of volatility in the Brazilian government andmarket price of the Brazilian legislative branch have faced allegations of political corruption. As a result, a number of politicians, including senior federal officials and congressmen, resigned and/or have been arrested. Several members of the Brazilian executive and legislative branches of government were investigated as a result of allegations of unethical and illegal conduct identified by the Car Wash Operation (Operação Lava-Jato) being conducted by the Office of the Brazilian Federal Prosecutor. Any political crisis could worsen the economic conditions in Brazil, which may adversely affect our results of operations and financial condition
Moreover, the economic and political crisis have resulted in a further downgrading of the country’s long-term credit rating from two of the three major rating companies, placing Brazil 3 notches below the limit of the speculative investment grade level (“junk”). Standard & Poor's downgraded Brazil to BB with a stable outlook in January 2018, Fitch Ratings downgraded to BB- with a stable outlook in February 2018, while Moody’s maintained its Ba2 rating, with a negative outlook since May 2017. Brazil’s sovereign rating is currently rated by the three major risk rating agencies as follows: BB- by S&P and Fitch Ratings and Ba2 by Moody’s. Various major Brazilian companies were also downgraded. Such downgrades have further worsened the conditions of the Brazilian economy and the condition of Brazilian companies, especially those relying on foreign investments.
More recently, in March, 2021, the Organization for Economic Cooperation and Development (OECD) set up a permanent monitoring group to check if the combat against corruptioncertain companies’ securities, securities class action litigation has been regressing in Brazil.
Restrictions on the movement of capital out of Brazil may impair our ability to receive payments from our Brazilian Subsidiaries and restrict their ability to make payments in U.S. dollars.
In the past, the Brazilian economy has experienced balance of payment deficits and shortages in foreign exchange reserves, and the Brazilian government has responded by restricting the ability of Brazilian or foreign persons or entities to convert reais into foreign currencies. The Brazilian government may institute a restrictive exchange control policy in the future. Any restrictive exchange control policyinstituted against these companies. This litigation, if instituted against us, could prevent or restrict our Brazilian Subsidiaries’ access to U.S. dollars, and consequently their ability to meet their U.S. dollar obligations and may adversely affect our financial condition andor results of operations.
Our business in Brazil is subject to governmental regulation.
Our Brazilian operationsexemption as a “foreign private issuer” from certain rules under the U.S. securities laws will result in less information about us being available to investors than for U.S. companies, which may result in our common shares being less attractive to investors.
As a “foreign private issuer” in the United States, we are subject to a variety of national, state, and localexempt from certain rules under the U.S. securities laws and regulations, including environmental, agricultural, healthare permitted to file less information with the SEC than U.S. companies. As a “foreign private issuer,” we are exempt from certain rules under the Securities Exchange Act of 1934 , as amended (the “Exchange Act”) that impose certain disclosure obligations and safetyprocedural requirements for proxy solicitations under Section 14 of the Exchange Act. In addition, our officers, directors, and labor laws. We investprincipal shareholders are exempt from the reporting and “short-swing” profit recovery provisions of Section 16 of the Exchange Act and the rules under the Exchange Act with respect to their purchases and sales of our common shares. Moreover, we are not required to file periodic reports and financial and managerial resourcesstatements with the SEC as frequently or as promptly as companies that are not “foreign private issuers” whose securities are registered under the Exchange Act. In addition, we are not required to comply with these laws and related permit requirements. Our failure to do so could subject us to fines or penalties, enforcement actions, claims for personal injury or property damages, or obligations to investigate and/or remediate damage or injury. Moreover, if applicable laws and regulations, or the interpretation or enforcement thereof, become more stringent in the future, our capital or operating costs could increase beyond what we currently anticipate, and the process of obtaining or renewing licenses for our activities could be hindered or even opposedRegulation FD promulgated by the competent authorities.
The Brazilian government has been constantly implementing new legal provisions through Provisional Presidential Decrees,SEC under the Exchange Act, which expire and loose effect if not converted into law byrestricts the Brazilian National Congress after 120 days. This legislative practice causes uncertainties and may adversely affect our business and operations.
We are also subject to laws and regulations imposed in Brazil and its agencies, including (i) the National Agencyselective disclosure of Petroleum, Natural Gas and Biofuels (Agência Nacional do Petróleo, Gás Natural e Biocombustível) and by the Brazilian Electricity Regulatory Agency (Agência Nacional de Energia Elétrica) on account of our production of sugarcane, ethanol and electricity (ii) the Ministry of Agriculture, Breeding Cattle and Supply (Ministério da Agricultura, Pecuária e Abastecimento), on account of our agricultural, sugarcane and ethanol production activities. If an adverse final decision is issued in an administrative process, we could be exposed to penalties and sanctions derived from the violation of any of these laws and regulations, including the payment of fines, and, depending on the level of severity applied to the infraction, the closure of facilities and/or stoppage of activities and the cancellation or suspension of the registrations, authorizations and licenses, which may also result in temporary interruption or discontinuity of activities in our plants, and adversely affect our business, financial condition and results of operations.
Government laws and regulations in Brazil governing the burning of sugarcane could have a material adverse impact on our business or financial performance.
In Brazil, a relevant percentage of sugarcane is currently harvested by burning the crop, which removes leaves in addition to eliminating insects and other pests. The states of São Paulo, Minas Gerais and Mato Grosso do Sul, among others, have established laws and regulations that limit and/or entirely prohibit the burning of sugarcane and there is a likelihood that increasingly stringent regulations will be imposed by those states and other governmental agencies in the near future.
Such limitations arise from a Brazilian Federal Decree that set forth the complete elimination of the harvest by burning the crop until 2018 in areas where it is possible to carry out mechanized harvest. In the state of Minas Gerais, the deadline imposed by the State Government for the elimination of the harvest by burning the crop is 2014, for areas with declivity lower than 12%, and for areas with declivity higher than 12%, they are subject to an additional term at the discretion of the State Environmental Agency, on a case by case basis. Nevertheless, in the state of Mato Grosso do Sul, the current deadline is 2018 for the elimination of harvest by burning the crop for areas where mechanized harvest can be carried out, as per the Brazilian Federal Decree.
The strengthening of the laws and regulations or the total prohibition of sugarcane burning would require us to increase our planned investment in harvesting equipment, which, in turn, would limit our ability to fund other investments. In addition, the state of São Paulo has imposed an obligation on growers to dedicate a certain percentage of land used for sugarcane cultivation for native or reclaimed forest area. The cost of setting aside this land is difficult to predict and may increase costs for us or our sugarcane suppliers.information. As a result, the costsour shareholders may not have access to comply with existing or new laws or regulations are likelyinformation they deem important, which may result in our common shares being less attractive to increase, and, in turn, our ability to operate our plants and harvest our sugarcane crops may be adversely affected.
Risks Related to a Luxembourg Companyinvestors.
We are a Luxembourg corporation (“société anonyme”) and it may be difficult for you to obtain or enforce judgments against us or our executive officers and directors in the United States.
We are organized under the laws of the Grand Duchy of Luxembourg. Most of our assets are located outside the United States. Furthermore, most of our directors and officers and experts reside outside the United States, and most of their assets are located outside the United States. As a result, you may find it difficult to effect service of process within the United States upon these persons or to enforce judgments outside the United States obtained against us or these persons in U.S. courts, including judgments in actions predicated upon the civil liability provisions of the U.S. federal securities laws. Likewise, it may also be difficult for you to enforce in U.S. courts judgments obtained against us or these persons in courts located in jurisdictions outside the United States, including actions predicated upon the civil liability provisions of the U.S. federal securities laws. It may also be difficult for an investor to bring an action in a Luxembourg court predicated upon the civil
liability provisions of the U.S. federal securities laws against us or these persons. Luxembourg law providesconfers to shareholders the right to bring a derivative action on our behalf of the Company only in limited circumstances and, subject to conditions only admit, shareholders’ right to bring a derivative action on behalf of the company.certain conditions.
Service of process within Luxembourg upon the Company may be possible, provided that The Hague Convention on the Service Abroad of Judicial and Extrajudicial Documents in Civil or Commercial Matters of November 15, 1965 is complied with. As there is no treaty in force on the reciprocal recognition and enforcement of judgments in civil and commercial matters between the United States and the Grand Duchy of Luxembourg, courts in Luxembourg will not automatically recognize and enforce a final judgment rendered by a U.S. court. The enforceability in Luxembourg courts of judgments entered by U.S. courts will be subject prior to any enforcement in Luxembourg to the procedure and the conditions set forth in particular in the Luxembourg civil procedure code and/or established by court interpretation, which conditions may include the following and which may evolve:
• the judgment of the U.S. court is final and duly enforceable (exécutoire) in the United States and has not been fully enforced in the United States and/or any other jurisdiction;
• the U.S. court had jurisdiction over the subject matter leading to the judgment (based on the verification of a characterized link of connection of the litigation to the judge of origin);
• the U.S. court has applied to the dispute the substantive law which would have been applied by Luxembourg courts;
• the judgment was granted following proceedings where the counterparty had the opportunity to appear, and if it appeared, to present a defense and other conditions for a fair trial have been complied with taking into account all facts and circumstances whether occurring before, during or after trial or issue and delivery of the judgment, and the judgment has not been obtained by reason of fraud;
• the U.S. court has acted in accordance with its own procedural laws;
• the judgment of the U.S. court does not contravene Luxembourg international public policy both substantive and procedural (as such term is interpreted under the laws of Luxembourg); and
• the absence of contradiction between such judgment and an already issued judgment of a Luxembourg court.
Under our articles of incorporation, we indemnify and hold our directors harmless against all claims and suits brought against them, subject to limited exceptions. Under our articles of incorporation, to the extent allowed or required by law, the rights and obligations among or between us, any of our current or former directors, officers and company employees and any current or former shareholder will be governed exclusively by the laws of Luxembourg and subject to the jurisdiction of the Luxembourg courts, unless such rights or obligations do not relate to or arise out of their capacities as such. Although there is doubt as to whether U.S. courts would enforce such provision in an action brought in the United States under U.S. securities laws, such provision could make the enforcement of judgments obtained outside Luxembourg more difficult as to the enforcement against our assets in Luxembourg or jurisdictions that would apply Luxembourg law.
YouOur shareholders may have more difficulty protecting yourtheir interests than youthey would as a shareholdershareholders of a U.S. corporation.corporation, which could adversely impact trading in our common shares and our ability to conduct equity financings.
Our corporate affairs are governed by our articles of incorporationassociation and bythe laws of Luxembourg, including the laws governing public joint stock companies organized under the laws of the Grand Duchy of Luxembourg as well as such other applicable local law, rules and regulations.(sociétés anonymes). The rights of our shareholders and the responsibilities of our directors and officers under Luxembourg law are different from those applicable to a corporation incorporated in the United States. As a foreign private issuer, we are exempt from certain rules under the Exchange Act, and consequently, there may be less publicly available information about us than is regularly published by or about U.S. issuers. Also,In addition, Luxembourg regulationslaw governing the securities of Luxembourg companies may not be as extensive as those in effect in the United States, and Luxembourg law and regulations in respect of corporate governance matters may not be as protective of minority shareholders as state corporation laws in the United States. Therefore, youour shareholders may have more difficulty in protecting yourtheir interests in connection with actions taken by our directors and officers or our principal shareholders than youthey would as a shareholdershareholders of a corporation incorporated in the United States.
Neither our articles of association nor Luxembourg law provide for appraisal rights for dissenting shareholders in certain extraordinary corporate transactions that may otherwise be available to shareholders under certain U.S. state laws. As a result of these differences, our shareholders may have more difficulty protecting their interests than they would as shareholders of a U.S. issuer.
Luxembourg and European Union insolvency and bankruptcy laws and regulations are substantially different from U.S. insolvency laws and may offer our shareholders less protection than they would have under U.S. insolvency and bankruptcy laws.
As a company organized under the laws of the Grand Duchy of Luxembourg and with its registered office in Luxembourg, we are subject to Luxembourg and European Union insolvency and bankruptcy laws and regulations in the event any insolvency proceedings are initiated against us including, among other things,others, Council and European Parliament Regulation (EU) 2015/848 of 20 May 2015 on insolvency proceedings (recast). Should courts in another European Union Member State determine that the insolvency and bankruptcy laws of that Member State apply to us (or to certain of our assets) in accordance with and subject to such European Union regulations, the courts in that Member State could have jurisdiction over the insolvency proceedings initiated against us. Insolvency and bankruptcy laws in Luxembourg or the relevant other European Union Member State, if any, may offer our shareholders less protection than they would have under U.S. insolvency and bankruptcy laws and make it more difficult for them to recover the amount they could expect to recover in a liquidation under U.S. insolvency and bankruptcy laws.
YouOur ability to pay dividends is restricted under Luxembourg law.
Our articles of association and the Luxembourg law of August 10, 1915, on commercial companies as amended from time to time (loi du 10 août 1915 sur les sociétés commerciales telle que modifiée), require a general shareholders’ meeting to approve any dividend distribution, except as set forth below.
Our ability to declare dividends under Luxembourg corporate law is subject to the availability of distributable earnings or available reserves, including share premium. Moreover, we may not be able to participatedeclare and pay dividends more frequently than annually. As permitted by Luxembourg corporate law, our articles of association authorize the declaration of dividends more frequently than annually by the Board of Directors in equity offerings,the form of interim dividends so long as the amount of such interim dividends does not exceed total net profits made since the end of the last financial year for which the annual accounts have been approved, plus any profits carried forward and yousums drawn from reserves available for this purpose, less the aggregate of the prior financial year’s accumulated losses, the amounts to be set aside for the reserves required by Luxembourg law or by our articles of association for the prior financial year.
We are a holding company and depend on the ability of our subsidiaries to distribute funds to us in order to satisfy our financial obligations and to make dividend payments, which they may not receive any value for rights thatbe able to do.
We are a holding company, and our subsidiaries conduct all of our operations. We own no material assets other than the equity interests in our subsidiaries. As a result, our ability to make dividend payments depends on our subsidiaries and their ability to distribute funds to us. If we may grant.
Item 4. Information on the Company
A. HISTORY AND DEVELOPMENT OF THE COMPANY
General Information
Adecoagro was organized in the Grand Duchy of Luxembourg on June 11, 2010 as a société anonyme (a joint stock company). The Company’s legal name is “Adecoagro S.A.” On January 28, 2011, Adecoagro completed the IPO of its shares listed on the New York Stock Exchange (“NYSE”). The shares are traded under the symbol “AGRO.” In a series of transactions during 2012, we transferred shares of Adecoagro to certain limited partners of IFH in exchange for their residual interest in IFH increasing our interest in IFH to approximately 100%.
On March 27, 2015, Adecoagro commenced a series of transactions for the purpose of transferring the domicile of its subsidiary, Adecoagro LP, to Luxembourg. In connection with the Adecoagro LP re-domiciliation, Adecoagro merged IFH into Adecoagro LP (Delaware) with Adecoagro LP (Delaware) as the surviving entity and on April 1, 2015 Adecoagro GP S.à r.l., a société à responsibilité limitée organized under the laws of Luxembourg, became the general partner of Adecoagro LP on April 1, 2015. Also on April 1, 2015, Adecoagro completed the re-domiciliation of Adecoagro LP (Delaware) out of Delaware to Luxembourg and Adecoagro LP without dissolution or liquidation, continued its corporate existence as Adecoagro LP S.C.S., a société comandite simple organized under Luxembourg law, effective April 2, 2015. For a detailed description of the Adecoagro LP redomiciliation please see “Corporate“—Corporate Development” below.
Adecoagro is registered with the Luxembourg Registry of Trade and Companies under number B153681. Adecoagro has its registered office at 6, Rue Eugène Ruppert, L-2453, Luxembourg, Grand Duchy of Luxembourg. As from April 30, 2024, the registered office will change from 6 rue Eugène Ruppert, L-2453 Luxembourg to 28 Boulevard F.W. Raiffeisen, L-2411 Luxembourg. Our telephone number is (+352) 264491.
maintains a website at http://www.sec.gov which contains reports and other information regarding registrants that file electronically with the SEC.
History
In September 2002, we commenced our operations with the acquisition of 100% of the equity interests of Pecom Agropecuaria S.A., an Argentine corporation (sociedad anónima), and we rapidly became one of the largest agricultural companies in Argentina. Totaling more than 74,000 hectares of farmland, this acquisition represented one of the largest stock purchase transactions in South America in 2002. In connection with the acquisition, Pecom Agropecuaria S.A. changed its name to Adeco Agropecuaria S.A. (“Adeco Agropecuaria”). Adeco Agropecuaria was the platform from which we executed our expansion plans, including the acquisition of additional land and the diversification of our business activities.
In 2004, we began our regional expansion and acquired a farm in Uruguay (approximately 5,086 hectares) and three farms in Western Bahia, Brazil (20,419 hectares). In 2005, we continued the expansion of our crop business in Argentina with the acquisitions of La Agraria S.A. (approximately 4,857 hectares) and Establecimientos El Orden S.A. and Cavok S.A. (approximately 15,157 hectares) and Las Horquetas farm (2,086 hectares).
In 2005, we acquired our first sugar and ethanol mill, Usina Monte Alegre S.A. (“UMA”), with a crushing capacitycapacity at that time of 0.9 million tons of sugarcane per year at thatthe time. UMA became our platform for expansion in the Brazilian sugarsugar and ethanol sector.
In 2006 and 2007, we continued our land portfolio expansion and vertical integration through the acquisitions of Pilagá S.A. (formerly Pilagá S.R.L. and before that, Pilagá S.A.G.), one of the largest and oldest agriculture companies in Argentina, with more than 88,000 hectares and two rice processing facilities, and one additional farm of approximately 2,400 hectares in Argentina and two farms of approximately 4,000 hectares in Brazil for the production of crops. Also, in December 2007, we acquired Bañado del Salado S.A., Agro Invest S.A. and Forsalta S.A., with more than 43,000 hectares for crop production in Argentina, and one farm in Uruguay of approximately 3,177 hectares.
During 2007, we also began the expansion of our dairy business in Argentina. After five years of research, we began the construction of athe first “free-stall” dairy facility with a capacity to milk 3,000 cows.
In Brazil, duringDuring 2007, we began the construction of a sugarcane cluster in Mato Grosso do Sul, Brazil, with a projected 10.0 million tons of sugarcane crushing capacity. Angelica was the first greenfield mill we built from inception, with a nominal crushing capacity of 4.9 million tons. We also bought approximately 13,000 hectares of farmland for the planting of sugarcane to supply the mill. Angelica began operating during August 2008, and reached full operational capacity during April 2010.
Additionally, inIn August 2010, we acquired Dinaluca S.A., an agricultural company consisting of a farm located in the province of Corrientes, Argentina, and with more than 14,000 hectares for crop production in Argentina. Further, between August and November 2011, we acquired: (i) Compañía Agroforestal de Servicios y Mandatos S.A., an agricultural Argentine company owning more than 4,900 hectares of land in the province of Santiago del Estero, (ii) Simoneta S.A., an agricultural Argentine company owner ofowning more than 4,600 hectares of land in the province of La Pampa, and (iii) 3,400 hectares of land for crop production in the province of San Luis, Argentina.
During 2012, we began the construction of our second free stall dairy facility in Argentina, with a capacity of 3,500 milking cows.
On February 26, 2013, Adecoagro formed a 50/50 joint venture, CHS Agro S.A., together with CHS de Argentina S.A., a leading farmer-owned energy, grains and foods company based in the United States. CHS Agro built a sunflower processing facility located in the city of Pehuajo, Province of Buenos Aires, Argentina. The facility processes black oil and confectionary sunflower into specialty products such as in-shell seeds and oil seeds, which are exported entirely. The joint venture grows confectionary sunflower on leased farms, while black oil sunflower is originatedoriginates from third parties. On January 14, 2019 and after a restructuring of the joint venture, we purchased the remaining 50% of the capital stock of CHS Agro from CHS de Argentina S.A. Adecoagro currently owns 100% of CHS Agro S.A., which has since been renamed as Girasoles del Plata S.A. The consideration for this acquisition was nominal.
DuringIn March 2013, we began the construction of the second greenfield project in our sugarcane cluster in Mato Grosso do Sul, the Ivinhema mill, with 5.7 million tons of sugarcane crushing capacity and located 45 km south of Angelica. This mill
allowed us to consolidate our cluster, generate important synergies and economies of scale, and improve operational margins and Adjusted Free Cash Flow. The Ivinhema mill was built in two phases: the first phase with 2.0 million tons of capacity was completed during April 2012, and the second phase with 3.0 million tons of crushing capacity was completed in mid-2015.
DuringIn October 2017, we completed the construction of our first bio-digester. The facility generates electricity by burning biogas extracted from the effluents produced in our Diarydairy operations. On November 3, 2017, we began generating and delivering 1.4 MW of electricity to the local power grid. In addition to increasing revenues and securing our energy requirements, this facility enhances the sustainability of our free stall dairy operation by reducing greenhouse gas emissions, improving the effluent management and concentrating valuable nutrients, which are applied back to the fields.
On February 5, 2019 we acquired a peanut processing facility for $10 million. The facility is located in Dalmacio Vélez, Province of Cordoba, Argentina.
On February 8, 2019, we acquired two milk processing plants and two trademarks from SanCor Cooperativas Unidas Limitadas. One of the acquired facilities is located in the city of Chivilcoy, Province of Buenos Aires, and is primarily focused on fluid milk production for the domestic market in Argentina. The other acquired facility is located in the city of Morteros, Province of Cordoba, and produces dry milk and cheese for the export market. In addition, we acquired the intellectual property covering the brands “Las Tres Niñas” and “Angelita” and associated trademarks. Both brand names are well recognized in Argentina and represent strong brands to market our retail consumer dairy products. The total consideration for this operation was US$47 million.
On May 2, 2022 we acquired the rice production operations owned by certain subsidiaries of Viterra Limited (“Viterra”) in Uruguay and Argentina. These operations comprise four rice processing and storage plants in Uruguay and one in Argentina, and the assets acquired included all biological assets and inventories of processed and rough rice. The acquisition price amounted to approximately $18 million, and contemplated a financial debt for an approximate amount of $20 million. Uruguayan rice is internationally recognized as being of the highest quality standards. This transaction was aligned with the Company’s strategy to expand its vertically integrated rice business under the highest quality and sustainability standard. This expansion not only increased the Company’s rice production and processing capacity, in addition to benefiting from synergies with existing operations, but it also improved the Company’s global footprint, including access to new markets and clients who purchase Uruguayan rice. The acquisition increased the Company’s competitiveness in logistics and transportation and consolidated its position in the rice business.
Corporate Development
On October 30, 2010, as part of a corporate reorganization, referred to herein as the Reorganization, AFI Ltd., a subsidiary of IFH LLC and the parent of Adecoagro LLC, distributed its interest in Adecoagro LLC to IFH LLC and commenced a process of dissolution, making IFH LLC the direct parent of Adecoagro LLC. Thereafter, our shareholders transferred pro rata 98% of their membership interests in IFH LLC to Adecoagro S.A. (a corporation organized under the laws of the Grand Duchy of Luxembourg with no prior holdings or operations, formed for the purpose, among others, of facilitating our IPO) in exchange for 100% of the common shares of Adecoagro.
In connection with the Reorganization, Adecoagro converted IFH LLC from a limited liability company tointo IFH LP, a Delaware limited partnership.partnership owned 2% by our shareholders and, approximately 98% by Adecoagro, in each case as limited partners, and the remainder by Ona Ltd., a newly formed Maltese corporation, as its general partner. Adecoagro LLC was also converted to Adecoagro LP, a Delaware limited partnership, owned approximately 100% by IFH LP as limited partner, and the remainder by Toba Ltd., a newly formed Maltese corporation, as its general partner.
On January 28, 2011, we successfully completed ourthe initial public offering of our shares listed on the NYSE, and on February 2, 2011, we issued 28,405,925 shares, at a price of US$1111.00 per share. The shares trade under the symbol “AGRO.”
On February 2, 2011, we also issued and sold to Al Gharrafa Investment Company (“Al Gharrafa”), a wholly owned subsidiary of Qatar Holding LLC and one of our shareholders, 7,377,598 common shares at a purchase price of $10.65 per share, which is equal to the price per common share paid by the underwriters of our initial public offering of the Company, pursuant to an agreement entered into on January 6, 2011. In addition, on February 11, 2011, we issued 4,285,714 shares when the over-allotment option was exercised by the underwriters in our IPO.
During 2012, the Company issued in a series of transactions 1,654,752 shares to certain limited partners of IFH in exchange for their residual interest in IFH increasing Adecoagro’s interest in IFH to approximately 100%.
On February 5, 2013, we completed an underwritten secondary offering of 13.9 million common shares of Adecoagro offered by our shareholder, HBK Master Fund LP at a price per share to the public of $8.00 pursuant to an effective shelf registration statement on Form F-3 filed with the SEC. On February 13, 2013, HBK Master Fund LP sold an additional 2.1 million common shares of Adecoagro pursuant to the overallotment option it granted to the underwriter in the secondary offering.
On March 27, 2015, Adecoagro commenced a series of transactions for the purpose of transferring the domicile of its subsidiary, Adecoagro LP to Luxembourg. In connection with the redomiciliation of Adecoagro LP, Adecoagro merged IFH LP into Adecoagro LP with Adecoagro LP (Delaware) as the surviving entity. In connection with this merger, all of the assets and liabilities of IFH L.P. vested in Adecoagro LP (Delaware), Ona Ltd became its general partner and Toba Ltd became a wholly ownedwholly-owned subsidiary of Adecoagro LP (Delaware). In connection with the transactions completed on March 27, 2015, Ona Ltd. assigned its general partnership interest in Adecoagro LP to Adecoagro GP S.a.r.l.S.à r.l., a société responsibilitie limiteeá responsibilité limitée organized under the laws of Luxembourg, on April 1, 2015. Also on April 1, 2015, Adecoagro completed the redomiciliation of Adecoagro LP (Delaware) out of Delaware to Luxembourg and Adecoagro LP, without dissolution or liquidation, continued its
corporate existence as Adecoagro LP S.C.S., a société en comandite simple organized under Luxembourg law, effective April 2, 2015. Since that date the affairs of Adecoagro LP S.C.S. have been governed by its by-laws and Luxembourg law.
On March 21, 2016, we completed an underwritten secondary offering of 12.0 million shares of Adecoagro offered by our shareholders, Quantum Partner LP and Geosor Corporation, at a price per share to the public of $11.7 pursuant to an effective shelf registration statement on Form F-3 filed with the SEC. In connection with this offering, the selling shareholders granted the underwriter the right to purchase up to 1,800,000 additional common shares exercisable once at any time within 30 days after March 21,2016. On April 20, 2016, the underwriter elected to purchase an additional 350,000 common shares at a price of 11.40 per common share. In 2022, we withdrew the registration statement relating to the unsold secondary registered shares remaining under such shelf registration statement.
On September 21, 2017, the Company issued US$500 million principal amount of its 6.000% Senior Notes due 2027 (the “2027 Notes”). The 2027 Notes were issued pursuant to an Indenture dated as of September 21, 2017 (the “Indenture”), among us, as issuer, Adeco AgropecuariaS.A.Agropecuaria S.A., Pilagá S.A., Adecoagro Brasil ParticipacoesParticipações S.A., Adecoagro Vale do Ivinhema S.A. and Usina Monte Alegre Ltda., as guarantors (the “Guarantors”) and The Bank of New York Mellon, as trustee, registrar, paying agent and transfer agent, and are guaranteed on a senior unsecured basis by each of the Guarantors.
On December 5, 2019, Adecoagro Vale do Ivinhema , a wholly owned subsidiary of the Company, placed R$400.0 million in Certificados de Recebíveis do Agronegócio (CRA), due in November 2027 and bearing an interest at a rate of IPCA (Brazilian official inflation rate) + 3.80% per annum.
The following chart summarizes our corporate structure as of April 2021.2023. The Restricted Subsidiaries and Unrestricted Subsidiaries shown on the chart refer to the terms Restricted Subsidiary"Restricted Subsidiary" and Unrestricted Subsidiary,"Unrestricted Subsidiary", respectively, as defined in our Senior Notes Indenture attached hereto as Exhibit 4.43.
Principal Capital Expenditures
Capital expenditures totaled $166.7$250.2 million, $256.9$229.1 million and $219.7$213.0 million for the years ended December 31, 2020, 20192023, 2022 and 2018,2021, respectively.
For a discussion of our Capital expenditures include both maintenance capital expenditures and future projections, see “Item 5. Operating and Financial Review and Prospects—B. Liquidity and Capital Resources—Capital Expenditure Commitments.”expansion capital expenditures.
B. BUSINESS OVERVIEW
COVID-19
The global impact of the COVID-19 outbreak and measures taken to reduce the spread of the virus have had an adverse effect on the global macroeconomic environment, and may continue to create continued economic uncertainty and reduced economic activity. The outbreak has resulted in authorities implementing numerous measures to try to contain the virus, such as travel bans and restrictions, quarantines, shelter-in-place or total lock-down orders and business limitations and shutdowns.
The speed and extent of the spread of COVID-19, and the duration and intensity of resulting business disruption and related financial and social impact, are still uncertain, and such adverse effects on our business and financial position may still be material.
Government measures in Argentina and Brazil
In light of the COVID-19 pandemic outbreak, on March 20, 2020 the Argentine government implemented a social, preventive and mandatory isolation regime, prohibiting the circulation of people on routes, roads and public spaces (the “Mandatory Isolation Regime”) which was extended until November 8, 2020 for the area of greater Buenos Aires, among many other jurisdictions, by means of Decree No. 875/2020. During the term of the Mandatory Isolation Regime, the activities pursued by our Argentine subsidiaries, related to agricultural production, distribution and commercialization, were exempted from the Mandatory Isolation Regime for being considered “essential” activities.
In order to guarantee the regular supply of essential products, the Argentine government established measures that, among others, obliged those who participate in the production, distribution and commercialization chain of certain products, for a 30-day period (r enewable if necessary), to (i) sell them at their maximum prices as of March 6, 2020; and (ii) increase production to their full capacity and adopt adequate measures to guarantee their supply and delivery, and created (i) a pricing regime establishing standard maximum prices of a basic listing of consumer products for each province (available on the website www.preciosmaximos.produccion.gob.ar); and (ii) a public and free mechanism that allowed the filing of claims and complaints by consumers and those included in the production, distribution and commercialization chain of the affected consumer products subject to maximum prices. Due to these measures, the prices of some of the products sold in the domestic market by the Company were capped during the year, and we were not able to reflect the actual increase in costs, reducing our profit margins.
After the Argentine Supreme Court determined on March 17, 2020 the suspension of judicial terms until April 12, 2020, the Argentine Tax Court and the Argentine Federal Tax Authority (as well as other public agencies) followed the same criteria. During this period, all proceedings started against Customs or the Tax Authority were be suspended, though all procedural acts that could take place in this period were considered valid. Although the extraordinary term suspension affected all proceedings carried out under the Tax Procedural Law and the Customs Code, it did not affect the regular obligations of taxpayers or importers/exporters.
On March 20, 2020, the BCRA established an exceptional framework for banking and other foreign exchange institutions during the term of the Mandatory Isolation Regime, including: i) closure of retail centers of financial and foreign exchange institutions; ii) services that must still be provided by financial institutions; iii) extension of maturities for bank financings; iv) suspension of electronic check clearing (which was later reinstated by means of Communique “A” 6944); v) remote operation of the foreign exchange market; vi) continuity of wholesale exchange market and tenders of certain Central Bank bills called Leliq (Letras de Liquidez del Banco Central or “LELIQ”); vii) continuity of payment methods operations; and viii) remote operation of stock markets.
In Brazil, the government created a crisis committee to monitor the impact of COVID-19 in March 2020. Since then, it has announced several measures (tax and others) to address the effects of COVID-19. In this regard, the Brazilian health authorities, as well as several state and municipal authorities have adopted or recommended social distancing measures. Likewise, the Brazilian Congress is currently discussing several measures to increase the Brazilian government’s revenues, such as imposing new taxes, revoking tax benefits and increasing the rates of current taxes.
In Brazil, states and municipalities may also revoke tax benefits and/or increase the rates of current taxes to increase its revenues (See “Item 3. Key Information-D. Risk Factors —Risks Related to Brazil- We receive certain tax benefits from Brazilian Tax Authorities which we cannot assure will be maintained or renewed.”)
In the first six months of 2020, our Sugar, Ethanol and Energy business, experienced a decrease in prices of ethanol due to the decrease in international oil prices, and a decrease in demand as a consequence of the reduced circulation of people in response to the pandemic. In light of these factors, we slowed down our crushing pace, implemented a cost reduction plan and maintained the workforce sized to our operational needs. As signs of a partial recovery started to emerge, we revamped our operations and accelerated our crushing pace during the second semester, more than offsetting the lower initial crushing. In addition, the Brazilian Congress is currently discussing a Bill which, if approved will impose mandatory and temporary postponement of the terms of rural leases and terms on certain situations, preventing lessors from terminating such agreements and filing for repossession of the leased land.
Company measures
Following the declaration of the COVID-19 pandemic by the World Health Organization, the Company committed to provide a safe environment for its employees and contractors, and immediately prepared measures and developed safety protocols to mitigate the eventual risk of being affected by the disease, and to prevent an uncontrolled spread of COVID-19 through the operations of its subsidiaries. Adecoagro has enacted prevention and action protocols tailored for each facility and activity, in addition to constituting crisis committees to monitor the Company’s response to the pandemic.
Measures taken include but are not limited to: (i) body temperature controls at entrances of each facility and other critical check points, (ii) mandatory distancing in the workplace, (iii) maximum limit of people in the conferences rooms, lunch room and vehicles (iv) sanitary barriers, (v) special protective attire and masks, (vi) mandatory quarantines for those who have been in contact with travelers or with symptomatic persons, (vii) training programs and information about how to prevent the risks of transmission of COVID-19, (viii) hired an infectious disease specialist to further assess on site. Additionally, remote work has been guaranteed for the duration of the Pandemic for employees based in central offices, and a rotation scheme has been implemented for administrative employees based in the farms or industrial facilities.
Despite the COVID-19, all our businesses have been operating without any major disruption both at the farm and industry levels. For more information on the possible impacts on the COVID-19 in our business, see“Item 3. Key Information-D. Risk Factors —Risks Related to Our Business and Industries — Ethanol prices are correlated to the price of sugar and are also closely correlated to the price of oil, so that a decline in the price of sugar or a decline in the price of oil will adversely affect our sugar and ethanol businesses" and "We may be exposed to risks related to health epidemics, and the COVID-19 in particular, that could adversely impact our ability to operate our business and results of operations".
Our Company
We are a leading agro-industrial company in South America, with operations in Argentina, Brazil and Uruguay. We are currently involved in a broad range of businesses, including farming crops and rice and other agricultural products, land transformation, dairy operations, sugar, ethanol and energy production and land transformation.production. Our sustainable business model is focused on (i) a low-cost production model that leverages growing or producing each of our agricultural products in regions where we believe we have competitive advantages, (ii) reducing the volatility of our returns through product and geographic diversification and use of advanced technology, (iii) benefiting from vertical integration in key segments of the agro-industrial chain, (iv) acquiring and transforming land to improve its productivity and realizing land appreciation through strategic dispositions, and (v) implementing sustainable production practices and technologies focused on long-term profitability.
As of December 31, 2020,2023, we owned a total of 220,186213,548 hectares comprised of 18land comprising 17 farms in Argentina, 8eight farms in Brazil and 1one farm in Uruguay. In terms of hectares, Argentina accounts for 93% of our portfolio, Brazil accounts for 6%
and Uruguay accounts for 1%. In addition, we own and operate several agro-industrial productionprocessing and manufacturing facilities including threefour rice processing facilitiesmills and one rice snack facility in Argentina, threetwo rice mills in Uruguay, four dairy free-stallsfree-stall facilities with 11,477 milkingan average of 14,509 dairy cows, and two milk processing facilities in Argentina, one peanut processing facility and one sunflower processing facility in Argentina, two grain handling and conditioning plants in Argentina, and three sugar and ethanol mills in Brazil with a sugarcane crushing capacity of 14.2 million tons.Brazil.
We believe that we are:
•one of the largest owners of productive farmland in South America, with more than 184,000175,000 owned and productive hectares as of December 31, 20202023 (excluding legal land reserves pursuant to local regulations and other land reserves) located in Argentina, Brazil and Uruguay, producing a wide range of agricultural products;
•a leading producer of grains and oilseeds in South America. During the 2019/2020 harvest year,2022/2023 harvest-year, we harvested 196,256209,646 hectares (including 94,985118,989 leased hectares and 34,55632,662 second crop hectares) and produced 720,059483,855 tons of grains, including soybeans, corn, wheat, peanut, sunflower and cotton, among others;
•one of the largest fully integrated producers of rough (unprocessed) rice in the world, planting 41,54455,648 hectares (including 2,38215,831 leased hectares) and producing 278,348354,128 tons during the 2019/20 harvest year, which accounted for 23% of the total Argentine production according to the Confederacion de Molinos Arroceros del Mercosur (“Conmasur”).2022/2023 harvest-year. We are also a large processor and exporter of white rice (processed) in Argentina accounting for 19%and Uruguay. Moreover, we are a leading retailer of total white rice production capacity in Argentina products, including four popular brands—Molinos Ala, Apóstoles, 53 and 45% of total Argentine white rice exports during 2020 (approximately 30% of total paddy basis), according to Camara de Industriales Arroceros de Entre Ríos (Federacion de Entidades Arroceras)Mucho Gusto;
•a leading dairy producer in South America in terms of our cutting-edge technology, productivity per cow and grain conversion efficiencies, producing 145.2199.9 million liters of raw milk during 2020,2023, and adding value in our processing facilities. We are a leading retailer of dairy products, including three popular brands, “Lasbrands—Las Tres Niñas”as, "Apóstoles"Apóstoles and “Angelita.”
•a growing producer of sugar and ethanol in Brazil, where we currently own three sugar and ethanol mills, with an aggregate installed capacity of 14.2 million tons per year and full cogeneration capacity (theof 246 MW as of December 31, 2023 (i.e. the generation of electricity from sugarcane bagasse, the fiber portion of sugarcane that remains after the extraction of sugarcane juice) of 241 MW as of December 31, 2020.. Our operation is highly integrated, meaning that 94% of the sugarcane crushed at our mills is supplied from our own plantations. As of December 31, 2020,2023, our sugarcane plantation consisted of 176,651198,747 hectares; and
•one of the leading companies in South America involved in the acquisition and transformation of undermanaged land to more productive uses, generating higher cash yields. DuringOver the last fourteen17 fiscal years, we have consistently sold a portion of our fully mature farmland every year. Inin aggregate, we have sold close to 102,913over 105,000 hectares, generating capital gains of approximately $250more than US$250 million. The results of these transactions are disclosed within the Crops or Rice segment, depending on the utilization of the farm.
We are engaged in threetwo main businesses:
1.Farming Business:
As of December 31, 20202023 we owned 206,896200,594 hectares (excluding sugarcane farms) of farmland in Argentina and Uruguay, of which 105,883 hectares are croppable, 13,707 hectares are being evaluated for transformation, 54,450 hectares are suitable for raising beef cattle some of which are leased to third party cattle farmers, constituting a total of 174,040 productive hectares, and 32,856 hectares are legal land reserves pursuant to local regulations or other land reserves.Uruguay. During the 2019/2020 harvest year2022/2023 harvest-year, we held leases or have entered into agriculture partnerships for an additional 97,367 croppable hectares.134,820 hectares of arable land. We own the facilities and have the resources to store and condition 100% of our crop and rice production. We do not depend on third parties to condition our production for sale. In addition, within our land portfolio there is a portion destined to cattle grazing activities in the Argentine provinces of Corrientes, Santa Fe, Formosa and Santiago del Estero. In 2023, we entered into new lease agreements with third-party cattle farmers for a total area of 16,171 hectares.
Our farmingFarming business is subdivided into fourthree main businesses:
•Crops: Crop business: We produce a wide range of agricultural commodities, including soybeans,soybean, corn, wheat, peanut, sunflower and cotton, among others. In Argentina, our farming activities are primarily conducted mainly in the Argentine humid pampas region, where agro-ecological conditions are optimal for low-cost production. Since 2004, we have expanded our operations throughout the center-west region of Uruguay, as well as in the northern region of Argentina. During the 2019/2020 harvest year,2022/2023 harvest-year, we planted approximately 196,262209,646 hectares of crops, including second harvests, producing 720,059and produced 483,855 tons of grains, including soybeans, wheat, corn, peanut, sunflower and cotton among others.grains. We also planted an additional 6,75813,650 hectares where we produced over 226,821280,000 tons of forage that we used for cowto feed cattle in our dairy operation. During the current 2020/21 harvest year,2023/2024 harvest-year, we planted approximately 217,797220,813 hectares of crops including(including second harvest,harvest) and also planted an additional 5,33712,202 hectares of forage.
•Rice business: We own a fully-integratedfully integrated rice operation in Argentina.operation. We produce irrigated rice in the northeastnortheastern provinces of Argentina and in Uruguay, where the availability of water, sunlight, and fertile soil results in onea coveted region for the low-cost production of the most ideal regions in the world for producing rice at low cost.rice. We believe that we are one of the largest producers of rough (unprocessed) rice in Argentina,South America, producing 278,348354,128 tons during the 2019/2020 harvest year, which accounted for 23% of the total Argentine production according to Conmasur.2022/2023 harvest-year. We own threefour rice mills and one rice snack facility in Argentina and two rice mills in Uruguay that process our own production, as well as rice purchased from third parties. We produce different types of white and brown rice that is sold both in the domestic Argentine retail market under our own brand;brands and exported.abroad. During the current 2020/21 harvest year,2023/2024 harvest-year, we planted 44,28258,452 hectares of rice.
•Dairy business: We believe that we are a leading dairy producer in South America in terms of our utilization of cutting-edge technology and in our productivity per cow and grain conversion efficiencies.efficiency. Through the production of raw milk, we are able to transform forage and grains into value-added animal protein. Our free-stall dairies in Argentina allow us to optimize our use of resources (land, dairy cow feedfeeding cattle and capital), increase our productivity and maximize the conversion of forage and grain into raw milk. We produced 145.2199.9 million liters of raw milk during 2020,in 2023, with a daily average of 10,876 milking14,509 dairy cows, delivering an average of 36.537.7 liters of milk per cow per day. OnIn October 2017, we completed the construction of our first bio-digestorbiodigester with 1.4MWH1.4 MWh of installed capacity. TheIn 2019, we further acquired two milk processing facilities that, together with some investments done throughout the years, today they produce ultra-high temperature (“UHT”) milk, powdered milk, semi-hard cheese, cream and chocolate milk, among other products, with the flexibility to sell to both the domestic and export market based on relative profitability. In 2023, our facilities processed 351.8 million liters of milk, thereby producing 136.8 million liters of fluid milk, over 5,400 tons of semi-hard cheese, over 15,000 tons of powdered milk and over 6.1 million liters of cream and cocoa flavored milk. In December 2023, our second biodigester with 2MW of installed capacity started generating and delivering electricity to the local power grid. This facility, as well as our first biodigester, generates electricity by burning biogas extracted from the effluents produced by our milking cows.dairy cattle. In addition to increasing revenues and securing our energy requirements, this facility enhances the sustainability of our free-stall dairy operation by reducing greenhouse gas emissions, improving the effluent management of effluents and concentrating valuable nutrients which are applied back to the fields. In 2019 we acquired two milk processing facilities which produce UHT and UP milk, milk powder and semi-hard cheese with the potential to produce other products, and with flexibility to sell into both the domestic and export market based on relative profitability. During 2020 our facilities produced 115 million liters of fluid milk, over 3,600 tons of semi-hard cheese and over 18,400 tons of milk powder.
•All Other Segments business: Our all other segments business consists of leasing pasture land to cattle farmers in Argentina. We lease over 12,735 hectares of pasture land which is not suitable for crop production to third party cattle farmers.
2. Sugar, Ethanol and Energy Business:
We cultivate and harvest sugarcane, thatwhich is then processed in our own mills to produce sugar, ethanol and energy. As of December 31, 2020, our total2023, we had 198,747 hectares of sugarcane plantation consisted of 176,651 hectaresplantations in the Brazilian states of Mato Grosso do Sul and Minas Gerais, Brazil, of which 13,29110,024 hectares of sugarcane were planted on ownedour own land and 163,360188,723 hectares were planted on land leased from third partiesby us under long termlong-term agreements. We currentlyuse different techniques to maximize sugarcane production. For example, we use meiosis to renew and expand harvestable areas by planting only a few rows of sugarcane, along with other products in the rest of the field. We harvest the sugarcane within six to nine months and use that production to plant sugarcane in the area where other products have been already harvested. By doing so, we maximize sugarcane plantation efficiency.
Further, we own and operate three sugar and ethanol mills, mills—UMA, Angélica and Ivinhema, Ivinhema—with a total crushing capacity of 14.2(1) million tons of sugarcane per year as of December 31, 2020. UMA is a small but efficient mill located in the state2023 (assuming an average of Minas Gerais, Brazil, with a sugarcane crushing capacity of 1.2(2) million tons per year, full cogeneration capacity and an associated sugar brand with strong presence in the regional retail market (Açúcar Monte Alegre)5,569 milling hours). We plant and harvest 99.7% of the sugarcane milled at UMA, with the remaining 0.3% acquired from third parties. UMA is also engaged in the production of organic sugar and during 2020 it exported the product for the first time, after having received the necessary certification to export organic sugar to the European Union. Angélica and Ivinhema are two new, modern mills, which we built in the state of Mato Grosso do Sul, Brazil, with current sugarcane crushing capacities of 5.6(3) and 7.4(4) million tons per year, respectively. Both mills are located 45 km apart, and form a cluster surrounded by one large sugarcane plantation. Angelica and Ivinhema are equipped with high pressure steam boilers and turbo-generators with the capacity to use all the sugarcane bagasse by-product to generate electricity. Approximately 28% of the electricity generated is used to power the mill and the excess electricity is sold to the local power grid, resulting in the mills having full cogeneration capacity.
For the year ended December 31, 2020,2023, we crushed 11.112.5 million tons of sugarcane. Our mills produce both sugar and ethanol, and accordingly, we have some flexibility to adjust our production (within certain capacity limits that generally vary between 40% and 80%) between sugar and ethanol, to take advantage of more favorable market demand and prices at given points in time. For the year ended December 31, 20202023, we produced 646,981805,608 tons of sugar and 502,170522,508 cubic meters of ethanol.
DuringSince 2020, we started commercializinghave been selling carbon credits (CBio)or “CBios” under the RenovaBio program. The RenovaBio is a program was designed by the Brazilian government to cut carbon emissions by establishing a mechanism that discouragesdiscouraging fossil fuel consumption while encouraging the production of renewable energy. Under this program, a carbon credit market is established in which sellers of fossil fuels have to acquire a mandatory quota of carbon credits which are definedset based on the amount of non-renewable fuels sold by them in the prior year. The issuersIssuers of CBios are biofuel producers whose mills have been certified by the National Agency of Petroleum, Natural Gas & Biofuels (ANP)ANP and awarded a score based on how “green” their mill operation is. SaidThis score acts as a multiplier effect tofor the amount of CBios the mill can issue for every cubic meter of ethanol it sells. CBios, in turn, are financial instruments traded on Brazil’s B3 platform.the B3. Prices are based on the supply-demandsupply of and demand for those credits. During 2020In 2023, we sold 492 thousand443,111 CBios at an average unit price of 40.9 BRL/CBio (approximately 7.5 USD/CBio)R$95.4 (average net price of US$19.0).
(1) Assuming an averageIn 2021, Adecoagro became the first company in Brazil to be authorized by the Totum Institute to issue Renewable Natural Gas Certificates, or “gas-recs”, as they are referred to in the market. These certificates attest to the production of 5,569 hours
(2) Assuming an averagerenewable natural gas. Industries in Brazil can voluntarily purchase these certificates as evidence of 4,800 hours
(3) Assuming an averagethe decarbonization of 5,333 hours
(4) Assuming an average of 5,920 hours
3. Land Transformation Business: We acquire farmlandsgas consumed in their operations. In 2022, we believe are undeveloped or underutilized and, by implementing cutting-edge production technology and agricultural best practices, transformbecame pioneers in the land to be suitable for more productive uses, enhance yields and increase the valuecommercialization of the land. During the eighteen-year period since our inception, we have effectively put into production over 171,000 hectares of land that were previously undeveloped or undermanaged. During 2020, we continued the transformation process of over 120,000 hectares we own. We realize and capture land transformation value through the strategic disposition of assets that have reached full development potential. We believe that the rotation of our land portfolio allows us to re-allocate capital efficiently, maximizing our return on invested capital. Our current owned land portfolio consists of 220,186 hectares, distributed throughout our operating regions as follows: 93% in Argentina, 6%gas-recs in Brazil and 1% in Uruguay. During the last fourteen years, we sold 25 of our fully mature farms, generating capital gains of approximately $250 million.
We promote sustainable land use through our land transformation activities, which seek to promote environmentally responsible agricultural production and a balance between production and ecosystem preservation. We do not operate in heavily wooded areas or wetland areas.
From time to time, the company seeks to recycle its capital by disposing of a portion of its fully developed farms. This allows the company to monetize the capital gains generated by its land transformation activities and allocate its capital to acquire land with higher transformation potential or to deploy it in other businesses, thereby enhancing the return on invested capital. Please see also “Item 3. Key Information-D. Risk Factors —Risks Related to Argentina — Changes in Argentine law concerning foreign ownership of rural properties may adversely affect our results of operations and future investments in rural properties in Argentina” and “-Risks Related to Brazil- Recent changes in Brazilian rules concerning foreign investment in rural properties may adversely affect our investments.”
The following table sets forth, for the periods indicated, certain data relating to our land transformation business:
| | | | | | | | | | | | | | | | | | | | |
| | | Year Ended December 31, |
| | 2020 | | 2019 | | 2018 |
| Undeveloped/Undermanaged land put into production (hectares) | | 1,903 | | — | | 508 |
| Ongoing transformation of croppable land (hectares) | | 123,313 | | 126,854 | | 132,936 |
Number of farm sold (2) | | 2 | | 1 | | 2 |
| Hectares sold | | 5,444 | | 6,082 | | 9,300 |
Capital gains from the sale of land ($ thousands) (1) | | 1,500 | | 9,376 | | 36,227 |
(1) Includes the sale of non-controlling interests in farmland companies.
(2) During 2020 we sold Huelen farm amounting to 4,633 hectares and25,000 certificates, as a 811 hectare plotresult of Abolengo farm.our biogas production during 2021, at a unit price of R$1.80 per certificate.
Our Competitive Strengths
We believe the following are our competitive strengths:
•Unique and strategic asset base. We own strategically located farmland and agro-industrial assets in Argentina, Brazil and Uruguay. We engage in continuous improvement ofcontinuously improve our operations and practices, resulting in the reduction of operating costs and an increase in productivity and ultimately enhancing the value of our properties and generating capital gains. Our operations also benefit from strategically located industrial facilities throughout Argentina, Brazil and Brazil,Uruguay, increasing operating efficiencies and reducing operating and logistical costs. We are vertically integrated where economics and returns are attractive, where the efficiency of our primary operation is significantly enhanced, or where lack of a competitive market results in the absence of a transparent price determination mechanism. Our diversified asset base creates valuable synergies and economies of scale, including (i) the ability to transfer the technologies and best practices that we have developed across our business lines, (ii) the ability to apply value-adding land transformation strategies to farmland in connection with our farming and sugarcane operations, and (iii) a greater ability to negotiate more favorable terms with our suppliers and customers.
Owning a significant portion of the land on whichwhere we operate is a key element of our business model.
•Low-cost production leveraging agro-ecological competitive advantages. Each of the commodity products we grow is produced in regions where agro-ecological conditions provide competitive advantages and which, through the implementation of our efficient and sustainable production model, allowhelp us to become one of the lowest cost producers.
•▪Our grain and oilseed production is based in the Argentine humid pampas region, where soil fertility, regular rainfalls, temperate climate, the availability of land and the relative proximity to ports contribute to the reduced use of fertilizers and agrochemicals, high productivity and stable yields and efficient logistics, ultimately resulting in one of the lowest costs per ton of grain produced and delivered.logistics.
•▪Our rice operation is located in the northeast provinces of Argentina and in Uruguay, which are one of the best rice farming regions in the world due to plentiful sunlight, the abundant availability of water for low costlow-cost irrigation, and a large potential for expansion.
•▪Our dairy operation is situated in the Argentine humid pampas region, where cow feed (grains, oilseeds and forage) is efficiently and abundantly produced at a low cost and climate and sanitary conditions are optimal for cow comfort, which enhances productivity, cow reproduction rates and milk quality.
•▪We produce sugarcane in the center-south regionstates of Mato Grosso do Sul and Minas Gerais in Brazil, where the combination of soil and climate resultderive in high sugarcane productivity and quality, resulting in one of the lowest production costs in the world significantly(significantly lower than other major sugar producing regions, including India, China, the United States, the United Kingdom, France and Germany.Germany).
•Standardized and scalable agribusiness model applying technological innovation. We have consistently used innovative production techniques to ensure that we are at the forefront of technological improvements and environmental sustainability standards in our industry. We are implementing an agribusiness model that consists of specializing our workforce and defining standard protocols to track crop development and control production variables, thereby enhancing management decision-making. We further optimize our agribusiness model through the effective
implementation and constant adaptation of a portfolio of advanced agricultural and information technologies and best practices tailored to each region in which we operate and commodity that we produce, allowing us to improve our crop yields, reduce operating costs and maximize margins in a sustainable manner.
•▪In our farmingFarming business, we use “no-till” technology as the cornerstone of production in our crop productionCrops segment and have been able to implement this technique in areas within our production regions where it hadwas not been used before.previously used. Furthermore, we also utilize crop rotation, second harvests, integrated pest management, balanced fertilization, water management and mechanization. Additionally, we use the silo bag storage method, utilizing large polyethylene bags with a capacity of 180-200180 to 200 tons which can be left on the field for 12 months, resulting in low-cost, scalable and flexible storage on the field during harvest, which we believe allows us to expand our crop storage capacity at a low cost, generate important logistic and freight savings by moving our production in the off-season when freight fares are lower, and time the entry of our production into the market at optimal price points. See “ —“—Operations and Principal Activities-Farming-StorageActivities—Farming Business—Storage and Conditioning.Conditioning for the Farming Business.”
•▪In our dairy business,Dairy segment, we believe that we were the first company in South America to implement the “free-stall” production system, resulting in more efficient conversion of feed to raw milk and higher production rates per cow compared to our peers in the region.
•▪In our sugar, ethanolSugar, Ethanol and energy business,Energy segment, our sugarcane cluster, constituted bycomposed of the Ivinhema and Angélica millsmills: (i) has a highly mechanized planting and harvesting operation, which has increased our sugarcane production, reduced our operating costs and contributed to environmental sustainability by eliminating the need to burn the sugarcane before harvest; (ii) has the capacity to use all the bagasse (a by-product(the fiber portion of sugarcane that remains after the sugar and ethanol production process) that is produced,extraction of sugarcane juice), with almost no incremental cost, to cogenerate 225230 MW of clean and renewable energy; (iii) has the capacity of processingcan process 54,480 tons of sugarcane per dayday; and (iv) has the ability tocan recycle by-products such as filter cake and vinasse, by using them as fertilizers in our sugarcane fields, as well as recycling water and other effluents, generating important savings in input costs and protecting the environment.
•Unique diversification model to mitigate cash flow volatility. We pursue a unique, multi-tier diversification strategy to reduce our exposure to production and market fluctuations that may impact our cash flow and operating results. We seek geographic diversification by spreading our portfolio of farmland and agro-industrial assets across different regions of Argentina, Brazil and Uruguay, thereby lowering our risk exposure to weather-related losses and contributing to stable cash flows. Additionally, we produce a variety of products including soybeans,soybean, corn, wheat, peanut, sunflower, cotton, barley, sorghum, rice, raw milk and dairy products, sugar, ethanol and energy, among others, which lowers our risk exposure to potentially depressed market conditions of any specific product. Moreover, through vertical integration in the rice, dairy, sugar, ethanolRice, Dairy and energySugar, Ethanol and Energy businesses, we process and transform a portion of our agricultural commodities into branded retail products, reducing our commodity price risk and our reliance on the standard market distribution channels for unprocessed products. Finally, our commercial committee defines our commercial policies based on market fundamentals and the consideration of logistical and production data to develop a customized sale/hedge risk management strategy for each product.
•Expertise in acquiring farmland with transformation and appreciation potential. Since our inception in 2002, we have executed transactions for the purchase and disposition of land for over $780US$780 million and sold over 100,000105,000 hectares of developed land, generating capital gains of approximately $250more than US$250 million. We believe we have a superior track record and have positioned ourselves as a key player in the land business in South America. Our business development team has gained extensive expertise in evaluating and acquiring farmland throughout South America and has a solid understanding of the productivity potential of each region and of the potential for land transformation and appreciation. To date, we have analyzed over 11 million hectares of farmland spread throughout the regions in which we operate and other productive regions in the world. We have developed a methodology to assess farmland and to appraise its potential value with a high degree of accuracy and efficiency by using information generated through sophisticated technology, including satellite images, rain and temperature records, soil analyses,analysis, and topography and drainage maps. Our management team has gained extensive experience in transforming and maximizing the appreciation potential of our land portfolio through the implementation of our agribusiness techniques described above. We also have an extensive track record of rotating our asset portfolio to generate capital gains and monetize the transformation and appreciation generated through our land transformation activities and agricultural operations.
•Experienced management team and knowledgeable employees. Our peoplepersonnel are our most important asset. We have an experienced senior management team with an average of more than 20 years of experience working in our sector and a solid track record of implementing and executing large scalelarge-scale growth projects, such as land transformations, greenfield
developments of industrial plants, and integrating acquisitions within our organization. Recruiting technically qualified employees at each of our farms and operating sites is a main focus of our senior management and a key to our success.
Our Business Strategy
We intend to maintain our position as a leading agricultural company in South America by expanding and consolidating each of our business lines, thus, creating value for our shareholders. The key elements of our business strategy are:are as follows:
•Expand our farmingFarming business through organic growth, leasing and strategic acquisitions. We will continue to seek opportunities for organic growth, target attractive acquisition and leasing opportunities and strive to maximize operating synergies and achieve economies of scale in each of our three main farmingFarming business areas (crops, rice and dairy). We believe that the execution risk associated with these projects iswill not expected to be significant as we are investing in existing operations that are highly efficient. AlsoMoreover, our expected results do not rely exclusively on rising commodity prices, which we expect to remain flat.
◦▪Crops: OnIn February 2019, we acquired a state-of-the-art peanut processing facility strategically located in Córdoba province, Argentina'sArgentina’s largest peanut production area. TheThis plant is equipped with high-performance equipment and is comprised ofcomprises a shelling plant, a blanching plant and a seed treatment plant. It has a shelling capacity of 70 thousand80,000 tons per year, a blanching capacity of 36 thousand36,000 tons per year, and a storage capacity of 50 thousand67,000 tons of inshell and 7.5 thousandin-shell peanuts. Moreover, our finished products storage has a capacity of 10,000 tons of finished product (4.2 thousand(4,200 of which are under cold storage), and. The plant also has a drying capacity of 1.2 thousand1,200 tons (at a 14% input moisture). The plant has been granted all the necessary certifications and permits, which allow us to satisfy demand in selective global markets that pay a premium for Argentine peanutpeanuts because of itstheir superior quality. Our increased focus in the segment along with the plant acquisition will allowhas allowed us to reduce costs by (i) saving in tolling and brokerage fees, (ii) consolidating and exporting our production from our on-site customs, (iii) reducing operational risks and (iv) having access to land at competitive prices by managing crop rotation ourselves, among others.other factors.
◦▪Rice business:Rice: We completed investments in the segment allowingthat have enabled us to increase productivity at the farm level, improve our rice processing and distribution capabilities, and increase the value of main by-products. Some of our investments in this segment include: (i) the implementation of zero levelzero-level technology in over 30,00039,000 hectares, which has considerably reduced water consumption at the farm, and increased yields by providing better germination, uniform irrigation and lower losses during harvest; (ii) the increasingincreased use of our own machinery for planting and harvesting activities, which has allowed us to seek the optimal harvest timing; and (iii) the installmentinstallation of an on-site dryer at our Oscuro farm, which has allowedadded efficiency to our grain storage and handling to be more efficient and reducereduced transportation costs, among others.and other costs. At the industrial level, we constructed a parboil plant whichthat has allowed us to increase our processing volume and produce a higher marginhigher-margin product.
Additionally, in May 2022, we acquired Viterra’s rice operations in Argentina and Uruguay, including two rice processing and storage plants in Uruguay and one in Argentina. This transaction contributed to our geographic diversification and thereby mitigates weather risk, in addition to providing further commercial and logistics advantages, such as the incorporation of Uruguayan branded rice, which is known for its high quality, and therefore granting us access to new markets.
◦
▪Dairy business:Dairy: As of December 2020,31, 2023, we had threefour fully operative free-stalls temporarily working at 103%free-stall facilities with an occupancy of their total nominal capacity, until February 2021 when we inaugurated14,451 cows. We continue with our fourth free-stall. The high occupancy rate did not affect productivity as we have taken special care in providing comfort and welfare to our herd. We are advancing well instrategy of growing and securing corn silage to feed additional cows. As for the bio-digester, energy production is stabilized and generating attractive results.
Additionally, since February 2019 we are owners of two milk processing facilities acquired from SanCor Cooperativas Unidas Limitadas.Limitadas. Both plants are well equipped and strategically located. The facility located in the city of Morteros, Province of Córdoba, is at the center of Argentina´sArgentina’s largest dairy basin and has a total installed processing capacity of 840870 thousand liters per day aimed at producing powderpowdered milk and cheese, mainly destined to the export market. The facility located in Chivilcoy, Provincein the province of Buenos Aires, is halfway between our dairy free-stallsfree-stall facilities and the Citycity of Buenos Aires, the largest fluid dairy market. The total installed processing capacity of this facility is 870 thousand555,000 liters per day aimed at producing mostly fluid milk. (See " – Our Company)." These acquisitions are part of our long term growth strategy, consistent with our strategy for our crops, rice, sugar, ethanol, and energy businesses. We believe that being vertically integrated allows us to control the supply chain, which in turn enhances efficiencies and increases margins, and provides us with the flexibility to sell into the export and domestic markets, based on relative profitability with a view to generate attractive returns.
•Consolidate our sugar and ethanol cluster in Mato Grosso do Sul. Our main strategy for our Sugar, Ethanol and Energy business is to consolidate our cluster in the state of Mato Grosso do Sul Brazil. Our main strategy for our sugar and ethanol business is to consolidate our cluster in Mato Grosso do Sul, Brazil by ramping up production inat our Ivinhema and Angelica mills, which have a nominal capacity of 14.213 million tons per year. See “ —Operations and Principal Activities—Sugar, Ethanol and Energy-OurEnergy Business—Our Sugar Mills.” The consolidation of the cluster has generated important synergies, operating efficiencies and economies of scale such as (i) a reduction in the average distance from the sugarcane fields to the mills, generating important savings in sugarcane transportation expenses; (ii) onea single centralized management team, reducing total administration cost per ton of sugarcane milled; and (iii) a large sugarcane plantation supplying two mills, allowing forwhich permits non-stop harvesting. Our sugarcane cluster in Mato Grosso do Sul has allowed us to become one of the most efficient and low cost producers of sugar, ethanol and energy in Brazil. Additionally, we plan to continue to closely monitor closely the Brazilian sugar and ethanol industries and may pursue selective acquisitions that provide opportunities to increase our economies of scale, operating synergies and profitability.
After reaching full capacity, our operating teams
We remain focused on finding ways to continue maximizing efficiency and generating additional synergies and cost dilution. In this process, theyour operating teams identified certain bottlenecks in our industrial operations whichthat were removed with minimal investments and allowed us to increase crushing volumes per hour and total capacity per year. These organic growth projects consisted of (i) expanding Angelica’s crushingIn 2021, we inaugurated a molecular sieve at our Ivinhema mill, which increased our ethanol dehydration capacity by 0.9 million tons by installing larger50%. Prior to this investment, the only mill rollerscapable of producing anhydrous ethanol was the Angelica mill. This increase in our dehydration capacity serves as a commercial tool at the same time as it enhances the efficiency and sustainability of our operations and increases our production flexibility. Also, our high ethanol storage capacity enables us to carry over stocks and places us in a solid position to benefit from higher expected prices both in the domestic and export markets.
Additionally, we continue developing and adopting technologies to become more efficient sugarcane producers and further reduce our carbon footprint. We developed a proprietary technology to produce biogas from vinasse, a subproduct of the ethanol production process, and we built a biogas unit in our Ivinhema mill. Biogas can be used in the production of renewable energy or converted into biomethane to replace diesel consumption. We use vinasse in a concentrated form as input in a biodigester where microorganisms act on organic matter and produce biogas. Biogas, in turn, once cleaned and compressed is converted into biomethane which can be used as biofuel in adapted vehicles, such as trucks, lorries and cars. We are optimistic about this project, which enhances the sustainability of our operations, has the potential to create an additional revenue stream and will enable us to replace our diesel consumption. In 2021, we certified our biogas facility as the first millrenewable gas plant in Brazil, which allows us to issue and expanding the sugar centrifugationsell gas-recs. Concurrently, and ethanol filtration processes, and (ii) expanding Ivinhema’s capacity by 2.1 million tons, by installing a new mill expanding theindependently from its use in biogas production, we also use concentrated vinasse as potassium biofertilizer in our sugarcane reception, juice treatment and sugar factory. Through these investments we increased the nominal crushing capacity by 30%.plantation.
• Further increase our operating efficiencies while maintaining a diversified portfolio. We intend to continue to focus on improving the efficiency of our operations and maintaining a low-cost structure to increase our profitability and protect our cash flows from commodity price cycle risk. We seek to maintain our low-cost platform by (i) making additional investments in advanced technologies, including those related to agricultural, industrial and logistical processes and information technology, (ii) improving our economies of scale through organic growth, strategic acquisitions, and more efficient production methods, and (iii) fully utilizing our resources to increase our production margins. In addition, we intend to mitigate commodity price cycle risk and minimize our exposure to weather related losses by (i)(a) maintaining a diversified product mix and vertically integrating production of certain commodities and (ii)(b) geographically diversifying the locations of our farms.
• Continue to implement our land transformation strategy. We plan to continue to enhance the value of our owned farmland and future land acquisitions by making them suitable for more profitable agricultural activities, thereby seeking to maximize the return on our invested capital in our land assets. In addition, we expect to continue rotating our land portfolio through strategic dispositions of certain properties in order to realize and monetize the transformation and appreciation value created by our land transformation activities. We also plan to leverage our knowledge and experience in land asset- management to identify superior buying and selling opportunities.
Operations and Principal Activities
Farming Business
Our Farming business line is divided into three main reportable operating businesses, namely crops, ricesegments: Crops, Rice and dairy.Dairy. We conduct our farming operations primarily onuse our own land and to a lesser extent, on land leased from third parties.parties to conduct our operations. During harvest year 2019/2020 our farming operations were conducted on a total of 237,806the 2022/2023 harvest-year, we used 265,294 hectares of land to conduct our Farming operations, out of which, we own 105,883owned 97,812 hectares (excluding sugarcane farms), 34,556used 32,662 hectares wereas second crop area,harvest areas and leased 134,820 hectares. During the 2021/2022 harvest-year, we conducted our Farming operations on 291,843 hectares of land; out of which, we owned 112,361 hectares (excluding sugarcane farms), used 36,750 as second harvest areas and leased 142,732 hectares. During the remaining 97,367 hectares from third parties. During harvest year 2018/2019 our farming operations were conducted on a total of 225,1152019/2020 harvest-year, we used 262,110 hectares of land to conduct our Farming operations, out of which, we own 107,681owned 111,009 hectares (excluding sugarcane farms), 31,127 wereused 41,924 as second crop areaharvest areas, and we leased 86,307109,178 hectares. During harvest year 2017/2018 we conducted our farming operations on a total of 232,796 hectares of land of which the respective figures were 124,733, 35,948 and 72,115 hectares.
The following table setstables set forth our production volumes for each of our farming business lines.
| | Harvest Year |
| 2019/2020 | | 2018/2019 | | 2017/2018 |
| | Harvest Year | | | | Harvest Year |
| | 2022/2023 | | | | 2022/2023 | | 2021/2022 | | 2020/2021 |
| Production | Production | | (in tons) | Production | | (in tons) |
| Crops (tons) (1) | Crops (tons) (1) | | 720,059 | | | 652,169 | | | 685,657 | |
| Rice (tons) (2) | Rice (tons) (2) | | 278,348 | | | 239,779 | | | 276,693 | |
| Total | Total | | 998,407 | | | 891,948 | | | 962,350 | |
| | | | | | | | | | | | | | | | | | | | |
| | | Year Ended December 31, |
| | | 2020 | | 2019 | | 2018 |
| Dairy (thousands of liters)(3) | | 145,192 | | | 120,069 | | | 101,300 | |
| | | | | | | | | | | | | | | | | | | | |
| | | Year Ended December 31, |
| | | 2023 | | 2022 | | 2021 |
| Dairy (thousands of liters)(3) | | 199,913 | | | 185,583 | | | 173,148 | |
(1) Crop production does not include 226,821288,137 tons, 212,650314,000 tons, and 120,221300,782 tons of forage produced in the 2019/2020, 2018/20192022/2023, 2021/2022 and
2017/2018 harvest years, 2020/2021 harvest-years, respectively. It also does not include the soybean planted in Brazil in 2022/2023, 2021/2022 and 2020/2021 as cover crop during the implementation of the agricultural technique known as meiosis. Revenues corresponding to the sale of this product are booked in the Sugar, Ethanol and Energy segment.
(2) Expressed in tons of rough rice.
(3) Raw milk produced.
Crops Business (Grains, Oilseeds and Cotton)
Our agricultural production is mainly based on planting, growing and harvesting crops over our owned croppablearable area. During the 2019/2020 harvest year,2022/2023 harvest-year, we planted and harvested crops over a total area ofand forage on approximately 203,020223,296 hectares, including our owned land, leased land leased from third parties and hectares planted in second harvests. During mid 2020harvest areas. In mid-2023, we began the planting of crops pertaining to the 2020/2021 harvest year,2023/2024 harvest-year, which werewas concluded duringin the first quarter of 2021,2024, with a total planted area of 217,833 hectares.232,852 hectares (including forage). Our main products include soybean, corn, wheat, peanut, sunflower and cotton. Other products, such as sorghum and barley, among others, are sown occasionally and represent only a small percentage of total sown land.
Our crop production process is directly linked to the geo-climatic conditions of our farms and our crop cycles, which define the periods for planting and harvesting our various products. Our crop diversification and the location of our farms in various regions of South America enable us to implement an efficient planting and harvesting system throughout the year, which includes second harvests in many cases. Our production process begins with the planting of each crop. After harvesting, crops may go through a processing phase where the grains or seeds are cleaned and dried to reach the required market standards. For additional discussion on our harvest-years and the presentation of production and product area information in this annual report, see “Presentation of Financial and Other Information—Fiscal Year and Harvest Year.”
The following table sets forth, for the harvest yearsharvest-years indicated, the planted hectaresareas for our main products:
| | | | | Harvest Year | | | Harvest Year |
| 2019/2020 | | 2018/2019 | | 2017/2018 |
Product Area(5) | | |
| | 2022/2023 | | | | 2022/2023 | | 2021/2022 | | 2020/2021 |
| Planted Area | | Planted Area | | (in hectares) |
| Soybean (1) | Soybean (1) | | 73,685 | | | 73,309 | | | 81,270 | |
| Corn (2) | Corn (2) | | 61,685 | | | 47,668 | | | 55,029 | |
| Wheat (3) | Wheat (3) | | 32,799 | | | 40,210 | | | 34,631 | |
| Sunflower | Sunflower | | 6,818 | | | 3,825 | | | 2,869 | |
| Cotton | Cotton | | 4,461 | | | 5,316 | | | 3,132 | |
| Peanut | Peanut | | 16,814 | | | 15,479 | | | 9,375 | |
| Forage (4) | Forage (4) | | 6,758 | | | 5,828 | | | 4,793 | |
| Others (5) | |
| Total | Total | | 203,020 | | | 191,635 | | | 191,099 | |
(1) Includes soybean first crop and second crop planted area.
(2) Includes sorghumcorn first crop and chia.second crop planted area as well as sorghum.
(3) Includes barley crop.
(4) Forage includes corn silage, wheat silage and sorghum used for cow feedfeeding cattle in our dairy operation.
(5) AsIncludes beans, chia and sesame.
The following table sets forth, for the harvest yearsharvest-years indicated, the production volumes for our main products:
| | | | | Harvest Year | | | Harvest Year |
| | | | 2020/2021 | | 2019/2020 | | 2018/2019 | | 2017/2018 | | | 2023/2024 | | 2022/2023 | | 2021/2022 | | 2020/2021 |
Crop Production(1) | | (In tons) |
| Soybeans (2) | | 1,530 | | | 181,259 | | | 187,226 | | | 171,392 | |
Production(1) | | Production(1) | | (in tons) |
| Soybeans (2) (3) | |
| Corn (2) | Corn (2) | | 32,550 | | | 364,792 | | | 295,990 | | | 258,054 | |
| Wheat | Wheat | | 122,297 | | | 104,236 | | | 114,809 | | | 78,640 | |
| Sunflower (2) | Sunflower (2) | | 10,876 | | | 12,652 | | | 5,937 | | | 5,181 | |
| Cotton lint (2) | Cotton lint (2) | | — | | | 1,490 | | | 422 | | | 523 | |
| Peanut (2) | Peanut (2) | | — | | | 55,630 | | | 47,785 | | | 19,901 | |
| Others (2) | |
| Total (2) | Total (2) | | 167,254 | | | 720,059 | | | 652,169 | | | 533,691 | |
(1) Crop production does not include 226,821288,137 tons, 212,650314,000 tons and 120,221300,782 tons of forage produced in the 2019/2020, 2018/20192022/2023, 2021/2022 and
2017/2018 harvest years, 2020/2021 harvest-years, respectively.
(2) As of the date of this annual report, the harvest of soybean, corn, peanut, sunflower and cotton pertaining to the 2020/2021 harvest year2023/2024 harvest-year is ongoing. The only crop whichthat has been fully harvested is wheat.
(3) Does not include the soybean planted in Brazil in 2022/2023, 2021/2022 and 2020/2021 as cover crop during the implementation of the agricultural technique known as meiosis. Revenues corresponding to the sale of this product are booked in the Sugar, Ethanol and Energy segment.
The following table below sets forth, for the periodsyears indicated, the sales forbreakdown of our main products:
| | | | | | | | | | | | | | | | | | | | |
| | | Year Ended December 31, |
| | | 2020 | | 2019 | | 2018 |
| Sales | | (In thousands of $) |
| Soybeans | | 44,732 | | | 46,386 | | | 84,217 | |
| Corn (1) | | 45,088 | | | 61,332 | | | 38,251 | |
Wheat (2) | | 15,109 | | | 20,318 | | | 32,706 | |
| Sunflower | | 10,925 | | | 8,430 | | | 1,598 | |
| Peanut | | 46,983 | | | 28,994 | | | 1,676 | |
| Other crops (3) | | 7,277 | | | 3,478 | | | 6,090 | |
| Adjustments (4) | | (1,653) | | | (2,492) | | | (9,120) | |
| Total | | 168,461 | | | 166,446 | | | 155,418 | |
| | | | | | | | | | | | | | | | | | | | |
| | | Year Ended December 31, |
| | | 2023 | | 2022 | | 2021 |
| Sales | | (In thousands of US$) |
| Soybeans (1) | | 51,096 | | | 72,323 | | | 56,997 | |
| Corn (2) | | 35,464 | | | 72,427 | | | 57,504 | |
Wheat (3) | | 15,968 | | | 23,603 | | | 27,267 | |
| Sunflower | | 19,812 | | | 25,076 | | | 16,618 | |
| Peanut | | 67,072 | | | 63,087 | | | 60,422 | |
| Other crops (4) | | 27,500 | | | 23,813 | | | 13,009 | |
| Adjustments (5) | | (50,659) | | | (2,578) | | | 11,975 | |
| Total | | 166,253 | | | 277,751 | | | 243,792 | |
(1) Includes sorghumDoes not include revenue corresponding to the sale of soybean planted in Brazil in 2022/2023, 2021/2022 and chia.2020/2021 as cover crop during the implementation of the agricultural technique known as meiosis. Revenues corresponding to the sale of this product are booked in the Sugar, Ethanol and Energy segment.
(2) Includes sorghum.
(3) Includes barley.
(3)(4) Includes cotton, other crops and farming services. Includes sale of certifications related to RTRS soybean (Round Table on Responsible Soy Association) and sales related to our cattle activities.
(4) Accumulated(5) Refers to the accumulated adjustment of Hyperinflationhyperinflation in the accounting translation for our Crops segment sales.
Soybeans
Soybeans are an annual legume widely grown due to their high content of protein (40%) and oil (20%). They have been grown for over 3,000 years in Asia and, more recently, have been successfully cultivated around the world. The world’s top producers of soybeans currently are the United States, Brazil, Argentina, China and India. Soybeans are one of the few plants that provide a complete protein supply as they contain all eight essential amino acids. About 85% of the world’s soybeans are processed, or “crushed,” annually into soybean meal and oil. Approximately, 98% of soybean meal is further processed into animal feed, with the balance used to make soy flour and proteins. Of the oil content, 85% is consumed as edible oil and the rest is used for industrial products such as fatty acids, soaps and biodiesel. We sell our soybeans mainly to crushing and processing industries, which produce soybean oil and soybean meal used in the food, animal feed and biofuel industries.
Soybeans comprised 10.6%3.9%, 5.2%,5.4% and 5.5%5.1% of our total consolidated sales in 2018, 2019,2023, 2022 and 20202021, respectively.
Corn
Corn is a cereal grown around the world and is one of the world’s most widely consumed foods. The main component of corn grain is starch (72% to 73% of grain weight), followed by proteins (8% to 11%). Corn grain is directly used for food and animal feed (beef, swine and poultry meat production and dairy). Corn is also processed to make food and feed ingredients (such as high fructose corn syrup, corn starchcornstarch and lysine), or industrial products such as ethanol and polylactic acid (PLA). Oil,
flour and sugar are also extracted from corn, with several uses in the food, medicine and cosmetic industries. Additionally, there are specific corn types used for direct human consumption such as popcorn and sweet corn.
Corn comprised 4.8%2.7%, 5.4% and 5.1% of our total consolidated sales in 2018, 6.9% of our consolidated sales in 2019,2023, 2022 and 5.5% of our consolidated sales in 2020.2021, respectively.
Wheat
Wheat is the world’s largest cereal-grass crop. Unlike other cereals, wheat grain contains a high amount of gluten, the protein that provides the elasticity necessary for excellent bread making. Although most wheat is grown for human consumption, other industries use small quantities to produce starch, paste, malt, dextrose, gluten, alcohol, and other products. Inferior and surplus wheat and various milling by productsby-products are used for livestock feed. We sell wheat to exporters and to local mills that produce flour for the food industry.
Wheat comprised 4.1%1.2%, 1.8% and 2.4% of our total consolidated sales in 2018, 2.3% of our total consolidated sales in 2019,2023, 2022 and 1.8% of our total consolidated sales in 2020.2021, respectively.
Sunflower
There are two types of sunflower, the most important of which in terms of volume beingis the oilseed sunflower, which is primarily grown for the oil extracted from the seed. Sunflower oil is considered one of the top three oils for human consumption, due to its high oil content (39-49%) and its oil composition (90% of oleic and linoleic oil). The other type of sunflower is the confectionary sunflower, which is used for direct human consumption. Sunflower seeds are an exceptional source of vitamin E, omega-6 fatty acids, dietary fiber and minerals. We grow both types of sunflower.
Sunflower comprised 0.2%1.5%, 1.9% and 1.5% of our total consolidated sales in 2018, 1.0% in 2019,2023, 2022 and 1.3% in 2020.2021, respectively.
Since early 2019, we operatehave been operating a sunflower processing facility located in Buenos Aires province, Argentina. This enables us to control processing activities and develop direct and long termlong-term relationships with different customers around the world.
Peanut
Peanut is a summer legume whichthat has its harvesting process divided in two stages: (1) digging, which implies loosening the plant, cutting the taproot and inverting the plant; and (2) combining, which means separating the pods from the vines. Planting activities begin in October and approximately 150 days after planting, digging activities take place. In Argentina, all the peanutpeanuts grown is highare highly oleic. Córdoba province is Argentina'sArgentina’s largest peanut production area due to its optimal agroclimaticagro-climatic conditions, which have led many processing industries to install there.
Argentina is positioned among the most important players in the production and export of this crop,peanuts, with high technological levels both in terms of production as well as processing. Argentina exports more than 90% of the peanuts it produces and its main market is the European Union,E.U., followed by RussiaLatin America, Northern Africa and Latin America.Asia. Its main competitors are USA,the United States, Brazil and China. We grow peanutpeanuts in the centercentral region of Argentina.
Peanut comprised 0.2%5.2%, 4.7% and 5.4% of our total consolidated sales in 2018, 3.3% of our total consolidated sales in 20192023, 2022 and 5.7% of our total consolidated sales in 2020.2021, respectively.
Since early 2019, we own and operate a peanut processing facility equipped with cutting-edge technology, which has been granted all the necessary certifications and export permits.technology. This vertical integration is in line with our strategy to grow our peanut business as it enables us to control processing activities and develop direct and long term relationslong-term relationships with different customers around the world.
Forages
We are engaged in the production of forage in Argentina, including corn silage, wheat silage and sorghum silage. We use forage as cow feed in our dairy operation. During the 2019/2020 harvest year,2022/2023 harvest-year, we planted 6,75813,650 hectares of forage and produced 226,821288,137 tons of forage.
Crop Production Process
Our crop production process is directly linked to the geo-climatic conditions of our farms and our crop cycles, which define the periods for planting and harvesting our various products. Our crop diversification and the location of our farms in various regions of South America enable us to implement an efficient planting and harvesting system throughout the year, which includes second harvests in many cases. Our production process begins with the planting of each crop. After harvesting, crops may go through a processing phase where the grain or seeds are cleaned and dried to reach the required market standards.
For additional discussion of our harvest years and the presentation of production and product area information in this annual report, see “Presentation of Financial and Other Information-Fiscal Year and Harvest Year.”
Rice Business
Rice is the main food staple for about half of the world’s population. Although it is cultivated in over 100 countries and on almost every continent, 90% of the world’s rice is grown and consumed in Asia. Globally, rice is the most important crop in terms of its contribution to human diets and production value. There are three main types of rice: short grain, medium grain and long grain rice.grain. Each one has a different taste and texture. We produce long grain rice and Carolina double rice, a variety of medium grain rice.
We conduct our rice operation in the northeast of Argentina, which is one of the most efficient locations in the world for producing rice at a low cost. This is a result of optimumoptimal natural agronomic conditions, including plentiful sunlight, abundant availability of water for low cost irrigation and large quantities of land. The use of public water for artificial irrigation is governed by provincial regulations and is subject to the granting of governmental permits. We currently have permits for the use of water in our production of rice in the provinces of Corrientes and Santa Fe. Maintenance of our permits is subject to our compliance with applicable laws and regulations, which is supervised by the corresponding governmental authority (e.g., the Ministry of Water, Public Services and Environment (Ministerio- Ministerio de Agua, Servicios Publicos y Medio Ambiente)Ambiente), in the province of Santa Fe, and the Water Institute of the Province of Corrientes (Instituto(Instituto Correntino del Agua)Agua).
In 2022, we expanded our rice footprint to Uruguay by acquiring the rice operations of certain subsidiaries of Viterra. Similar to Argentina, Uruguay also benefits from optimal natural agronomic conditions to produce rice. As a result, Uruguay is also considered one of the most efficient locations in the world for producing rice at a low cost. The production of rice in Uruguay is mostly concentrated in the southeastern region of the country given its close distance to the Montevideo seaport. Industry participants source rice from third-party producers, with whom they have long-term relationships and who many times finance their activities. The price paid for paddy rice is annually set forth by agreements between farmers and industry participants. Those agreements establish fixed margins for the industry and take into account average export prices. Given that sales price plays a key role in determining the cost of paddy rice, participants agree on offering similar prices and achieve synergies in sharing freight costs.
The following table sets forth, for the harvest yearsharvest-years indicated, the total number of planted ricerice-planted hectares we owned and leased, as well as the overall rough rice we produced:
| | | | | Harvest Year | | | Harvest Year |
| Rice Product Area & Production | | 2020/2021 | | 2019/2020 | | 2018/2019 | | 2017/2018 |
| Rice Product Area and Production | | Rice Product Area and Production | | 2023/2024 | | 2022/2023 | | 2021/2022 | | 2020/2021 |
| Owned planted area (hectares) | Owned planted area (hectares) | | 40,444 | | | 39,162 | | | 37,608 | | | 38,589 | |
| Leased planted area (hectares) | Leased planted area (hectares) | | 3,839 | | | 2,382 | | | 1,700 | | | 1,700 | |
| Total rice planted (hectares) | Total rice planted (hectares) | | 44,282 | | | 41,544 | | | 39,308 | | | 40,289 | |
Rough rice production (tons) (1) | Rough rice production (tons) (1) | | 159,448 | | | 278,348 | | | 239,779 | | | 276,693 | |
(1) As of the date of this annual report, the harvest of rice pertaining to the 2020/2021 harvest year2023/2024 harvest-year is ongoing.
We grow rice onin four farms we own and two farms we lease, allowned by us, which are located in Argentina.Argentina, whereas the rest is through leased farms located in Argentina and in Uruguay. In the 2017/2018 harvest year,ongoing 2023/2024 harvest-year, we have planted a total area of approximately 40,289 hectares of rice, producing a total of 276,693 tons, representing 17% of our total planted area that year, and 34% of our total farming production. In the 2018/2019 harvest year, we planted a total area of approximately 39,308 hectares of rice, producing a total of 239,779 tons, representing 17% of our total planted area that year, and 27% of our total farming production. In the 2019/2020 harvest year, we planted a total area of approximately 41,544 hectares of rice, producing a total of 278,348 tons, representing 17% of our total planted area that year, and 28% of our total farming production. In the current 2020/2021 harvest year, we planted a total of 44,28258,452 hectares of rice, which have not been fully harvested as of the date of this annual report. In the 2022/2023 harvest-year, we planted approximately 55,648 hectares and produced 354,128 tons of rice, which represented 20% of our total planted area and 42% of our total farming production. In the 2021/2022 harvest-year, we planted approximately 60,857 hectares and produced 416,735 tons of rice, which represented 20% of our total planted area and 35% of our total farming production. In the 2020/2021 harvest year, we planted approximately 44,282 hectares and produced 346,685 tons of rice, which represented 17% of our total planted area and 32% of our total farming production .
Rice Production Process
The riceRice production cycle lasts approximately five to six months, beginning in September of each year and ending in April of the following year. Rice planting continues until November, followed by treatment of the rice, which lasts approximately
three months, until January. InOur harvest begins in February we begin harvesting, whichand lasts until April. After harvesting, the rice is ready for processing.
We process rice in our threefour rice mills in Argentina and two rice mills in Uruguay, where we are able to process our entire rice crop and utilize our excess milling capacity to process rough rice we purchase from third party growers.
At the mill, we clean the rice to remove all impurities. We then put it through a dryer to remove excess moisture from the grains. Proper drying results in increased storage life, prevents deterioration in quality and leads to optimum milling. Once dried, the rice grain, now known as rough rice or paddy rice, is ready for storage. We store rice in elevators or in silo bags until milling. During the milling process, the rough rice goes through a de-huskingdehusking machine that removes the husk from the kernel. The rice that is obtained after this process is known as brown rice and is ready for human consumption. Brown rice becomes white rice after it is polished to remove the excess bran.
The main objective of the milling process is to remove the husk and the bran, preserving the quality of the whole grain. Although the process is highly automated and uses advanced technology, some rice grains are broken in the process. The percentage of broken rice depends on a number of factors such as the crop development cycle at the farm, the variety of the grain, the handling and the industrial process. Average processing of rough rice results in 58.5% white rice, 13.0% broken rice, and 20.0% rice husk and 8.5% bran rice, which is sold for use as cattle feed or floor bedding in the poultry business.
| | | | | Year Ended December 31, | | | Year Ended December 31, |
| | | | 2020 | | 2019 | | 2018 | | | 2023 | | 2022 | | 2021 |
| Processed Rice Production | Processed Rice Production | | (In tons) | Processed Rice Production | | (in tons) |
| Rough rice processed — own | Rough rice processed — own | | 263,637 | | | 250,427 | | | 266,078 | |
| Rough rice processed — third party | Rough rice processed — third party | | 26,393 | | | 24,920 | | | 10,615 | |
| Total rough rice processed | Total rough rice processed | | 290,030 | | | 275,347 | | | 276,693 | |
| | | | | Year Ended December 31, | | | Year Ended December 31, |
| | | | 2020 | | 2019 | | 2018 | | | 2023 | | 2022 | | 2021 |
| Processed Rice Sales | Processed Rice Sales | | (In thousands of $) | Processed Rice Sales | | (in thousands of $) |
| Total Sales | Total Sales | | 101,862 | | | 101,156 | | | 95,403 | |
Rice comprised 12.0%18%, 15% and 12% of our total consolidated sales in 2018, 11.4% in 20192023, 2022 and 12.5% in 2020.
Rice Seed Production
In our rice seed facility in Argentina, we are involved in the genetic development of new rice varieties adapted to local conditions to increase rice productivity and quality, to improve both farm production as well as the manufacturing process. In connection with these efforts, we have entered into agreements with selected research and development institutions such as the National Institute of AgricultureAgricultural Technology (Instituto(Instituto Nacional de Tecnología Agropecuaria, or “INTA”) in Argentina, the Instituto Riograndense do Arroz or "IRGA "“IRGA” in Brazil, the Híbridos de Arroz para América Latina or "HIAA"“HIAA” in Colombia, the Latin American Fund for Irrigated Rice (Fondo(Fondo Latinoamericano para Arroz de Riego, or “FLAR”) in Colombia, the Santa Catarina State Agricultural Research and Rural Extension Agency (Empresa(Empresa de pesquisa Agropecuária e Extensão Rural de Santa Catarina, or “EPAGRI”) in Brazil, and Badische Anilin- und Soda-Fabrik (“Basf”BASF”) in Germany.Germany, Louisiana State University or “LSU” in United States, Bioherius in Argentina, Transactiva in Italy and the Universidad Nacional del Nordeste or “UNNE” in Argentina. Our own technical team is continuously testing and developing new rice varieties. Our first rice seed variety, Ita Caabo 105, was released to the market in 2008. In 2011, we released our second variety Ita Caabo 110, and at the beginning of 2014 we released our third variety, Ita Caabo 107. Furthermore, we released two new varieties, Ita Caabo 111 FL and Ita Caabo 109 in 2021 and 2022, respectively. We are currently experimenting with a wide range of varieties to continue improving our productivity in addition to the development of a hybrid line. These seeds are both used at our farms and sold to rice farmers in Argentina, Brazil, Uruguay and Paraguay. We are also developing, alongside Basf,BASF, a herbicide-tolerant rice variety to assist in the control of harmful weeds.
Dairy Business
We conduct our dairy operationbusiness in our farms located in the Argentine humid pampas region. This region is one of the best places in the world for producing raw milk at a low cost, due to the availability of grains and forages produced efficiently and at low cost, and due to the favorable weather for cow comfort and productivity. Our dairy operation consists of three free-stallfour free-
stall dairy facilities, operating at full capacity, with an occupancy of 11,477 milking14,451 dairy cows as of December 2020,2023. In addition, we own two facilities where we process our raw milk, as well as third parties’ milk, and a total capacity of 11,104. The high occupancy rate did not affect productivity as we have taken special care in providing comfortsell our products to the domestic and welfare to our herd.export markets.
The following table sets forth, for the periods indicated below, the total number of our dairy cows, average daily milk production per cow and our total milk production:production at the farm level:
| | | | | | | | | | | | | | | | | | | | |
| | | Year Ended December 31, |
| Dairy Herd & Production | | 2020 | | 2019 | | 2018 |
Total dairy herd (head) (1) | | 11,477 | | | 9,781 | | | 8,035 | |
| Average milking cows | | 10,876 | | | 9,066 | | | 7,581 | |
| Average daily production (liters per cow) | | 36.5 | | | 36.3 | | | 36.6 | |
| Total production (thousands of liters) | | 145,192 | | | 120,069 | | | 101,300 | |
| | | | | | | | | | | | | | | | | | | | |
| | | Year Ended December 31, |
| Dairy Herd & Production | | 2023 | | 2022 | | 2021 |
Total dairy cows (head) (1) | | 14,451 | | | 14,461 | | | 13,742 | |
Average dairy cows (2) | | 14,509 | | | 14,415 | | | 12,942 | |
Average daily production (liters per cow) (2) | | 37.7 | | | 35.3 | | | 36.7 | |
| Total production (thousands of liters) | | 199,913 | | | 185,583 | | | 173,148 | |
(1) As of December.
| | | | | | | | | | | | | | | | | | | | |
| | | Year Ended December 31 |
| Dairy Sales | | 2020 | | 2019 | | 2018 |
| | | (In thousands of $) |
| Sales | | 133,474 | | | 83,822 | | | 29,710 | |
| | | | | | | | | | | | | | | | | | | | |
| | | Year Ended December 31 |
| Dairy Sales | | 2023 | | 2022 | | 2021 |
| | | (In thousands of $) |
| Sales | | 180,119 | | | 235,012 | | | 183,054 | |
Dairy comprised 3.7%14%, 17% and 16% of our total consolidated sales in 2018, 9.4% for 20192023, 2022 and 16.3% for 20202021, respectively.
Our threefour free-stall dairiesdairy facilities, with an average of over 14,500 dairy cows, are fully ramped-upramped up and are delivering high productivity levels. During 2020 we started the construction of our fourth free-stall, which was finalized in February 2021. Once our four free-stalls are fully operative, we will be able to double our production capacity, reaching over 185 million liters of fluid milk per year and over 14 thousand total milking cows. We believe this investment isour free-stall dairy facilities are a unique opportunity to leverage on Argentina’s competitive advantages in transforming vegetable protein into milk protein, on our operational expertise, and on the positive outlook for global and local milk prices.
We own two milk processing facilities which had been acquired from SanCor Cooperativas Unidas Limitadas on in February 2019, in addition to “Lasthe Las Tres Niñas” as and “Angelita”Angelita trademarks, both of which are well-known in Argentina and represent a solid commercializationsales vehicle for retail and consumer dairy products. Our milk facilities produce UHT milk and UP milk, powdercream, powdered milk, and semi-hard cheese, among others. Our facilities have a total installed reception capacity of 2.4 million liters per day and an installed processing capacity of 1.7over 1.4 million liters of raw milk per day. In order toTo account for the difference between total installed capacity and actual utilization, it is necessary towe must account for the machine's efficiency rate of our machines, maintenance works, number of working days and number of personnel shifts, among other variables. We completed 2020 with 297.6In 2023, we processed 351.8 million liters of raw milk processed.in aggregate.
Our Chivilcoy industrial facility is located in the city of Chivilcoy, Provincein the province of Buenos Aires, and is primarily focused on fluid milk production for the domestic market. It has an installed processing capacity of 870 thousand555,000 liters per day and an installed milk reception capacity of 1.2 million liters per day. The facility has an installed processing capacity of 600 thousand510,000 liters of UHT milk 155 thousandand 45,000 liters of UP milkcream and 115 thousand liters of yogurt. We completed 2020 with 115.1cocoa flavored milk. In 2023, we processed 147.5 million liters of raw milk processed inat the Chivilcoy facility.
Our Morteros industrial facility is located in the city of Morteros, Provincein the province of Córdoba, and produces powderpowdered milk and semi-hard cheese mainlyprimarily for the export market. Morteros plant has an installed processing capacity of 840 thousand870,000 liters per day 550 thousand correspond to(550,000 liters for powdered milk powder and 290 thousand to cheese,320,000 liters for cheese), and it has an installed milk reception capacity of 1.2 million liters per day. We concluded 2020 with 182.6In 2022, we renewed our cheese production line by increasing its installed processing capacity from 290,000 liters to 320,000 liters. Hence, this will enhance our cheese production and contribute to accessing new markets and clients through the production of other types of semi-hard and hard cheeses, while simultaneously decreasing the amount of waste generated throughout the entire production process significantly. In 2023, we processed 204.3 million liters of raw milk processed inat the Morteros facility.
Dairy Production Process
We wean calves during the 24 hours subsequent to birth and during the next 60 days raise them on pasteurized milk and high protein meal.high-protein meals. Male calves are fed concentrates and hay for an additional 3three months in the farm before they are sent to our feedlot or to third partythird-party feedlots to be fattened for sale. Young heifers remain in open corrals during the next 13 months where they are fed with concentrates and forage until they are ready for breeding. Calving occurs nine months later. Heifers are
subsequently milked for an average of 320 days. Dairy cows are once again inseminated during the 42-42 to 90-day period following calving. This process is repeated once a year for a period of three or four years. The pregnancy rate for our herd is between 85% and 90% per year.
Each cow in our dairy herd is mechanically milked three times a day. The milk obtained is cooled to less than four degrees centigrade in order to preserve its quality and is then stored in a tank, or directly loaded to trucks, which derivesresults in increased quality and lower costs. Milk is delivered mainly to our processing facilities and the balance is sold to large third partythird-party milk processing facilities on a daily basis by tank trucks. We feed our dairy cows mainly with corn and alfalfa silages, some grass and corn grain, supplemented as needed with soybean by-products, hay, vitamins and minerals.
We have invested in technology to improve the genetics of our cows, animal health and feeding in order to enhance our milk production. These investments include top quality imported semen from genetically improved North American Holstein bulls, agricultural machinery and devices, use of dietary supplements and modern equipment to control individual milk production and cooling. Our feeding program is focused on high conversion of feed into milk, while maintaining cows in good health and comfort. We have also invested in technology and know-how so as to increase our forage production and utilization.
Implementation of the free-stall system allows us to position ourselves as a key player in the dairy industry and boost our agricultural and industrial integration presence in the South American agricultural sector. By eliminating cow grazing, we reduced the amount of land utilized for milk production, which freed up more land for our agricultural and land development activities. Cow productivity (measured in liters of milk produced per day) using the free-stall system increases by up to 40% compared to traditional grazing systems. These productivity gains are achieved because the free-stall system significantly improves the conversion rate of animal feed to milk, resulting in an approximate 40% increase in the conversion ratio, or the production of 1.4 liters of milk for each 1 kgkilogram of animal feed, as compared to the average of 1one liter of milk for each 1 kgkilogram of feed associated with the usual grazing model.
This increased productivity and conversion rate are mainlyprimarily due to improved cow comfort and an enhanced diet quality. We assess cow comfort through the engagement of expert consultants, who recommended designing beds covered with sand. The sand plays a significant role in helping cows to rest comfortably. Additionally, we installed a cooling system to increase cow comfort as well. This system relies on water sprinklers and ventilation fans located all over the facility to create a controlled, cool atmosphere, which improves cow comfort as the Holstein herd is originally adapted to cold regions. Additionally, we manage diet quality by adapting our feeding regime based on the various feeding stages in the lifetime of each cow. The actual feeding is fully mechanized, and we carefully control the harvesting and storage of feed. The control of all productivity variables, such as reproduction, health and operations, supports efficiency gains through standardized processes. Finally, the physical concentration of the animals facilitates efficient overall management of the dairyDairy business as a whole. In terms of the environment, the free-stall model allows for a better effluent treatment, which includes a sand-manure separator stage, a decantation pool and an anaerobic lagoon. All these processes help to decrease the organic matter content of the effluent and deliver a cleaner output. The final treated effluent is used to fert-irrigatefertilize crops adjacent to the dairy operation. Accordingly, we transform dairy waste into a high value-added by-product, which reduces fertilizer usage.
During October, 2017 we completed the construction of our first bio-digester. This facility enhances the sustainability of our free-stall dairy operation by reducing greenhouse gas emissions, improving the effluent management and concentrating valuable nutrients which are applied back to the fields. It generates electricity by burning biogas extracted from the effluents produced by our milking cows. On November 3, 2017, we began generating and delivering 1.4 MW of electricity to the local power grid from our first biodigester. Furthermore, in October 2023 we completed the construction of our second biodigester with 2 MW of installed capacity, which later in December 2023 started generating and delivering electricity to the local power grid. These two facilities generate electricity by burning biogas extracted from effluents produced by our dairy cattle. In addition to enhancing inincreasing revenues and securing our energy requirements, this facility enhances the sustainability of our diaryfree-stall dairy operation it increases revenuesby reducing greenhouse gas emissions, improving the management of effluents and secures our energy requirements.concentrating valuable nutrients, which are applied back to the fields.
All Other Segments
All Other Segments primarily encompasses our cattle business. Our cattle segment consists of pasture land that is not suitable for crop production due to soil quality and is leased to third parties for cattle grazing activities.
We currently own 54,450 hectares of cattle grazing land located in the Argentine provinces of Corrientes, Santa Fe, Formosa and Santiago del Estero. In 2020, we entered into new lease agreements with third party cattle farmers for a total area of 12,735 hectares.
Storage and Conditioning for the Farming Business
Our storage and conditioning facilities in the farmingFarming business allow us to condition, store and deliver our products with no third-party involvement. All our crop storage facilities are located close to our farms, allowing us to (i) reduce storage and conditioning costs; (ii) reduce freight costs since we only commence moving the product once the final destination is determined, whether locally or to a port,port; (iii) capitalize on fluctuations in the prices of commodities; and (iv) improve commercial performance by mixing grains to avoid discounts due to sub-standardsubstandard quality.
We own two conditioning and storage facilities for grains and oilseeds, with a total built storage capacity of 38,74037,000 tons. One of our facilities has a capacity of 19,24012,500 tons and is located in the province of Santa Fe, Argentina, in the town of Christophersen. It has a railway loading terminal, providing logistical flexibility and savings. Our other facility has a capacity of 24,500 tons and is located in Buenos Aires province close to Bahía Blanca’s deep water port, in an area where we produce 120,000 tons of grains. In addition, our peanut processing facility has the capacity to store 7,50010,000 tons of finished product (and 50,000 of inshell), while
67,000 of in-shell product), while our sunflower processing facility has the capacity to store 4,00011,020 tons of sunflower.sunflower, out of which 7,100 tons are stored in leased silo bags. We also own four rice mills in Argentina threeand two rice mills in Uruguay, which account for over 112,500239,500 tons of total storage capacity, and onecapacity. Moreover, we have three additional conditioning facilityfacilities for rice handling, with a total storage capacity of 6,30060,000 tons.
SetThe table below sets forth below is our storage capacity as of December 31, 2020:2023:
| | | | | | | | |
| Storage Capacity | | Nominal |
| Crops (tons) (1) | | 50,240 58,020 | |
| Rice (tons) | | 118,800 299,500 | |
| Dairy (liters) (2) | | 25,800,000 27,800,000 | |
(1) Includes 38,74037,000 tons corresponding to our two conditioning and storage facilities, 7,50010,000 tons to our peanut facility and 4,00011,020 tons to our sunflower facility.
(2) Morteros facility accounts for 24.3 million liters of fluid milk (equivalent to 2,500 tons of powdered milk powder and 360 tons of cheese) while Chivilcoy accounts for 1.53.5 million liters of fluid milk.
In addition, we use silo bags to increase our storage capacity at a low cost. Silo bags are an efficient low-cost method for grain storage. As crops are harvested, they are placed inside large polyethylene bags that can be left in the fields for approximately 12 months without damaging the grain. Each silo bag can hold up to 180 to 200 tons of product, depending on the type of grain. During the 2019/2020 harvest year, we stored approximately 50% of our grain production through silo bags.
Silo bags offer important operational and logistic advantages, such as (i) low cost storage; (ii) flexible and scalable capacity that is adapted based on production and commercial strategy; (iii) harvest efficiencies since the bags are filled on the field allowing for a non-stop harvest operation regardless of any logistical setbacks; (iv) logistic efficiencies leading to lower freight since grains are transported during the off-season when truck fares are lower; (v) increased ability to monitor quality and identify different grain qualities, since grains are stored in relatively small amounts (200 tons) and easily monitored, maximizing our commercial performance; and (vi) better use of our drying capacity throughout the year. Silo bags are commercially accepted. Grains stored in silo bags can be sold in the market, and if such grains are to be delivered post-harvest, we charge storage costs. Additionally, we can store grains to be used as seed during the following season (soybeans, rice and wheat), achieving quality seed management. We have expanded the use of silo bags from Argentina to our operations in Brazil and Uruguay.
Grain conditioning facilities at our farms allow our trade desk to optimize commercialization costs and to achieve commercial quality standards and avoid price discounts. These facilities are operated to dry, clean, mix and separate different qualities of each grain in order to achieve commercial standards. By mixing different batches of a same grain type, differentiated by quality parameters such as moisture, percentage broken, and percentage damaged, among others, we can achieve commercial standards without having to discount a lower-quality stand-alone batch. Efficient management of these facilities results in a lower cost for grain conditioning and a better achievable price.
SetThe table below sets forth below is our drying capacity as of December 31, 2020:2023:
| | | | | | | | |
| Drying Capacity | | Nominal |
| Crops (tons/day) (1) | | 9,925 | |
| Rice (tons/day) | | 6,850 12,600 | |
(1) Includes the drying capacity corresponding to our two grain conditioning and storage facilities, our peanut processing facility and our sunflower processing facility.
Some grains such as soybeans, wheat and rice, can be used for seed during the next planting season. We produce almost 97%78.5% of the seed used for planting these crops in our fields. The seed is stored in silo bags and/or grain facilities, where it can be processed, classified, and prepared for planting during next crop season. A deep survey and monitoring process is carried out in order to evaluate, control and deliver high quality seed to our farms.
The rest of our seed requirements are purchased from seed suppliers in order to incorporate new enhanced varieties into our planting plan.
Marketing, Sales and Distribution for the Farming Business
Crops
In Argentina, grain prices are based on the market prices quoted on Argentine grain exchanges, such as the Buenos Aires Grain Exchange (Bolsa de Cereales de Buenos Aires) and the Rosario Grain Exchange (Bolsa de Cereales de Rosario), which use as a reference the prevailing prices in international grain exchanges (including CBOT and ICE-NY). In Uruguay, local prices are based on an export parity (during harvest) or import parity in the case of post-harvest sales, which, in each case, take into account the prices and costs associated with each market. In Brazil, the grain market includes the Brazilian Grain Exchange (Bolsa de Mercadorias e Futuros (Brazilian Grain Exchange)), which, as in Argentina, uses as a price reference the international grain exchanges (including CBOT and ICE-NY). Prices are quoted in relation to the month of delivery and the port in which the product is to be delivered. Different conditions in price, such as terms of storage and shipment, are negotiated between us and the end buyer. We negotiate sales with the top traders and industrial companies in our markets. We also engage in hedging positions by buying
and selling futures and options in commodities exchanges, including the Chicago Board of Trade, the New York Board of Trade, BMF&FBOVESPA Exchangethe B3, and the Mercado a Término de Buenos Aires(MATBA).
Soybeans
Our soybean crop is sold to local companies and is ultimately exported or diverted to the crushing industry. Approximately 29%27% of the soybean crop was hedged pre-harvest, by forward sales and sales in the futures markets. Harvest and post-harvest sales are a function of the export market versus local premiums paid by crushers (oil, meal and biodiesel) and logistics considerations. Our fivesix largest customers comprisedaccounted for approximately 79%80% of our soybean sales infor the year ended December 31, 2020.2023.
Corn
Our corn production is mainly destined to the export market. Our fiveten largest customers comprised approximately 70%80% of our corn sales infor the year ended December 31, 2020.2023.
Wheat
Our wheat production is mainly destined to the export industry.market. Quality segregation allows us to negotiate premiums with the millers and export market. Brazil is the main importer of Argentine wheat. Our fiveten largest customers comprised approximately 74%75% of our wheat sales infor the year ended December 31, 2020.2023.
Sunflower
Our sunflower production from Argentina is sold to local companies. Sales are made pursuant by production agreements of sunflower for confectionary, high oil content sunflower and seed. Our twofour largest customers (Bunge Argentina and Molinos Agro) comprised 100%81% of our sunflower sales infor the year ended December 31, 2020.2023.
Peanut
Approximately 90%95% of our peanut production is exported. Our ten10 largest customers comprised approximately 65% of our peanut sales infor the year ended December 31, 2020,2023, while the European Union was the destination for overapproximately 90% of ourthe sales.
Cotton
We typically make pre-harvest sales of cotton fiber produced in Argentina into the export market. Sales for the textile industry are based on domestic demand and premiums. Our two largest customers comprised approximately 100%90% of our cotton sales infor the year ended December 31, 2020.2023. Cotton seed is sold in the domestic market to meet feed demand.
Customers
We sell manufactured and agricultural products to a large base of customers. The type and class of customers may differ depending on our business segments, regions and some logistics issues that are very important in our decision making. For the year ended December 31, 20202023, more than 89%85% of our sales of crops were sold to 1015 well-known customers, both multinational orinternational and local. Of these customers, the first fourten cases represented almost 63%75% of our sales and the remaining sixfollowing five customers represented approximately 26%10% of our net sales in the course of that year.2023.
Rice
Rough rice is available for sale commencing after the harvest of each year. White rice availability is based on our milling capacity. 72%83% of our total rice production is sold into the export market, with the remainder sold in Argentina in the retail market. We exportWithin exports, we sold approximately 36% of our exported volume to Brazil, 30%38% to the European Union;Union, 29% to Brazil, 12% to Iraq, 7% to Mexico, 7% to Turkey; and the balance to the Middle East,Chile and other LatinCentral American countries, Central America and Africa.countries. We sell approximately 28%17% of our rice in the Argentine retail market through threefour brands, we own thatwhich collectively have a 18%17.2% market share. Local rice prices are driven by regional supply demand and other world export prices. Our fiveten largest customers for rice comprisedin the retail market accounted for approximately 50%61% of our domestic rice sales in Argentina for the year ended December 31, 2020.
Dairy
In 2023, 70% of our raw milk production was destined to our processing facilities, while the majority of the balance was sold to onetwo dairy producer.producers. We negotiate the price of raw milk on a monthly basis in accordance with domestic supply and demand. The price of the milk we sell is mainly based on the percentage of fat and protein that it contains and the temperature at which it is cooled. The price we obtain for ourof milk also rises or falls based on the content of bacteria and somatic cells. We are one of the top ten10 dairy processors in Argentina, considering our free-stall production of over 400 thousandalmost 550,000 liters per day and the raw milk we source from 130143 farmers (110(138 in Morteros and 205 in Chivilcoy).
Sugar, Ethanol and Energy Business
The following table sets forth a breakdown of our production volumes by product for the years indicated in our Sugar, Ethanol and Energy business:
| | | | | | | | | | | | | | | | | | | | |
| | | Year Ended December 31, |
| | | 2023 | | 2022 | | 2021 |
Sugar (tons) (1) | | 805,608 | | | 481,919 | | | 546,819 | |
| Ethanol (cubic meters) | | 522,508 | | | 540,231 | | | 534,603 | |
| Energy (MWh exported) | | 694,259 | | | 608,964 | | | 730,739 | |
(1) Includes 3,561 tons of organic sugar in 2023, 3,701 tons in 2022 and 4,145 tons in 2021.
The following table sets forth our sales for each of the sugarcane by-products we produce for the years indicated:
| | | | | | | | | | | | | | | | | | | | |
| | | Year Ended December 31, |
| | | 2023 | | 2022 | | 2021 |
| | | (In thousands of $) |
| Sugar | | 419,858 | | | 188,769 | | | 208,365 | |
| Ethanol | | 247,008 | | | 387,124 | | | 291,883 | |
| Energy | | 34,844 | | | 33,060 | | | 48,017 | |
| Other | | 20,597 | | | 21,807 | | | 13,745 | |
| Total | | 722,307 | | | 630,760 | | | 562,010 | |
Sugarcane
Sugarcane is a tropical grass that grows best in locations with stable, warm temperatures and high humidity, although cold and dry winters are an important factor for the sucrose concentration of sugarcane. The climate and topography of the center-south region of Brazil is ideal for the cultivation of sugarcane and accounts for approximately 90% of Brazil’s sugarcane production. Sugarcane is the most efficient agricultural raw material used in the production of sugar and ethanol. Ethanol produced from sugarcane is highly regarded as an environmentally friendly biofuel with the following characteristics.
Renewable: Sugarcane ethanol, unlike coal or oil, which can be depleted, is produced from sugarcane plants that grow back year after year, provided that they are replanted every five to seven years.
Sustainable: Sugarcane only needs to be replanted every five to seven years, as a semi-perennial crop. It can be harvested without uprooting the plant, and therefore its cultivation has less of an impact on the soil and the surrounding environment. The mechanization of the harvesting and planting process further improves sustainable agricultural management.
Energy Efficient: Sugarcane is highly efficient in converting sunlight, water and carbon dioxide into stored energy. The energy output of sugarcane is equal to nine times the energy input used in the production process, whereas the energy output of corn ethanol is only about 1.9 to 2.3 times the energy input used in its production process. Sugarcane produces seven times more energy compared to corn used for ethanol production.
Low Carbon Emissions: Compared to gasoline, sugarcane ethanol reduces greenhouse gases by more than 61%61.0%, which is the greatest reduction of any other liquid biofuel produced today in large quantities. Ethanol made from sugarcane is deemed an advanced biofuel by the United States EPA.
Synergies: The main raw material used in the production of electricity in sugar mills is bagasse, which is a by-product of the sugarcane milling process, allowing for a renewable source of co-generated electricity.
Sugarcane is a tropical grass that grows best in locations with stable, warm temperatures and high humidity, although cold and dry winters are an important factor for the sucrose concentration of sugarcane. The climate and topography of the center-south region of Brazil is ideal for the cultivation of sugarcane and accounts for approximately 85% of Brazil’s sugarcane production.
As of December 31, 2020,2023, our sugarcane plantations consisted of 176,651198,747 hectares of sugarcane planted in Minas Gerais and Mato Grosso do Sul in Brazil. Approximately 94%93% of our sugarcane is planted over land leased through agricultural partnerships. Under these agreements, our partners lease land to us for periods of between one and two sugarcane cycles, equivalent to periods of between 7seven to 14fourteen years, on which we cultivate the sugarcane. Lease payments are based on the market value of the sugarcane set forth by the regulations of the State of SaoSão Paulo Sugarcane, Sugar and Alcohol Growers CounselCouncil (Conselho dos Produtores deCana-de-Açúcar, Açúcar e Álcool do Estado de SaoSão Paulo,) or “Consecana”). We planted and harvested approximately 94% of the total sugarcane we milled during 2020,2023, with the remaining 6% purchased directly from third parties at prices also determined by the Consecana system, based on the sucrose content of the cane and the prices of sugar and ethanol. The following table sets forth a breakdown during the time periods indicated of the amount of sugarcane we milled that was grown on our owned and leased land or purchased from third parties:
| | | | | | | | | | | | | | | | | | | | |
| | | Year Ended December 31, |
| | | 2020 | | 2019 | | 2018 |
| | (In tons) |
| Grown on our owned and leased land | | 10,464,893 | | 10,411,801 | | 10,748,091 |
| Purchased from third parties | | 638,307 | | 433,335 | | 611,112 |
| Total | | 11,103,200 | | 10,845,136 | | 11,359,204 |
| | | | | | | | | | | | | | | | | | | | |
| | | Year Ended December 31, |
| | | 2023 | | 2022 | | 2021 |
| | (In tons) |
| Grown on our owned and leased land | | 11,685,815 | | 10,117,148 | | 10,479,720 |
| Purchased from third parties | | 811,608 | | 367,740 | | 460,587 |
| Total | | 12,497,423 | | 10,484,888 | | 10,940,307 |
Sugarcane Harvesting Cycle
The annual sugarcane harvesting period in the center-south region of Brazil begins in March/April and ends in November/December of each year. In Mato Grosso do Sul, where our cluster is located, the weather pattern is less seasonal than in Sao Paulo. Our wet season is dryer and our dry season is more humid than traditional sugarcane regions. As a consequence of this weather pattern, the sugar content, (TRS)measured by the total recoverable sugar, or “TRS”, gap between the beginning and the end of the year compared to the peak of the harvest is much smaller than in SaoSão Paulo. This allows us to grow and harvest sugarcane year roundyear-round with a minimal impact on sugar content (TRS).TRS.
Since the beginning of the 2016/172017 harvest year, we have implemented a “non-stop” or “continuous harvest”.“continuous” harvest model. This means that we will harvest and crush sugarcane year-round, without stopping during the traditional off-season. This new strategy allows us to increase annual sugarcane milling and sugar, ethanol and energy production by approximately 10%. Another benefit of the system is that we produce ethanol in the off-season, when market prices usually have a high premium to prices at harvest. In addition, cogeneration efficiency is related to harvested volumes and unrelated to TRS, enabling us to utilize our cogeneration potential during the whole year. Considering that approximately 87%86% of total costs are fixed, this model has resulted not only in higher revenues but also in the dilution of our fixed costs.
We plant several sugarcane varieties, depending on the quality of the soil, the local microclimate and the estimated date of harvest of such area. Once planted, sugarcane can be harvested, once a year, up to six to eight consecutive years. With each subsequent harvest, agricultural yields decrease. The plantations must be carefully managed and treated during the year in order to continue to attain sugar yields similar to a newly-planted crop.
We believe we own one of the most mechanized harvesting operations in Brazil. Our sugarcane harvesting process is currently 99%99.7% mechanized (100% at the Angélica and Ivinhema mills and 94%95.0% at the UMA mill) and the remaining 1%0.3% is harvested manually. Mechanized harvesting does not require burning prior to harvesting, significantly reducing environmental impact when compared to manual harvesting. In addition, the leaves that remain on the fields after the sugarcane has been harvested mechanically create a protective cover for the soil, reducing evaporation and protecting it from sunlight and erosion. This protective cover of leaves decomposes into organic material over time, which increases the fertility of the soil. Mechanized harvesting is more time efficient and has lower costs when compared to manual harvesting. Sugarcane is ready for harvesting when the crop’s sucrose content is at its highest level. Sucrose content and sugarcane yield (tons of cane per hectare) are important measures of productivity for our harvesting operations. Geographical factors, such as soil quality, topography and climate, as well as agricultural techniques that we implement, affect our productivity. Since most sugar mills produce both sugar and ethanol in variable mixes, the industry has adopted a conversion index for measuring sugar and ethanol production capacity, the Total Recoverable Sugar (“TRS”)TRS index, which measures the amount of kilograms of sugar per ton of sugarcane.
During the 20202023 harvest, our mills harvested sugarcane with an average TRS content of 132 kg/ton and an average yield of 7980 tons of sugarcane per hectare, compared to 133131 kg/ton and 7667 tons per hectare in 2019,2022, respectively.
Once the sugarcane is harvested, it is transported to our mills for inspection and weighing. We utilize our own trucks and trailers for transportation purposes. The average transportation distance from the sugarcane fields to the mills is approximately 2830 kilometers at the UMA mill and 33 kilometers at the Angélica and Ivinhema.Ivinhema mills.
Our Sugar Mills
We currently own three sugar mills in Brazil, Brazil—UMA, Angélica and Ivinhema. Our mills produce sugar, ethanol and energy, and have the flexibility to adjust the production mix between sugar and ethanol, to take advantage of more favorable market demand and prices at given points in time. As of December 31, 2020,2023, our sugar mills had a total installed crushing capacity of 14.2 million tons of sugarcane, of which 13.0 million tons correspond to our sugarcane cluster in Mato Grosso do Sul Brazil.(Angélica and Ivinhema). As of December 31, 2020,2023, we concluded the 20202023 harvest crushing an aggregate volume of 11.112.5 million tons of sugarcane.
The Usina Monte AlegreUMA mill (“UMA”) is located in the state of Minas Gerais, Brazil, and has a sugarcane crushing capacity of 1.2 million tons per year full cogeneration(assuming an average of 4,800 milling hours). UMA has capacity to produce up to 85,592 tons of sugar, 54,468 cubic meters of ethanol and 74,880 MWh of energy exports. It has an associated sugar brand, Açúcar Monte Alegre, with a strong presence in the regional retail market (Açúcar Monte Alegre).market. UMA is also engaged in the production of organic sugar and duringin 2020, it exported thethis product for the first time after having received the necessary certification to export organic sugar to the European Union.E.U. We plant and harvest 99.7%98.4% of the sugarcane milled at UMA, with the remaining 0.3%1.6% acquired from third parties. UMA concluded its harvest operations for the 2020 season crushing 1.1 million tons of sugarcane.
Angélica is an advanced mill, completed in 2010 and locatedIvinhema are two modern mills, which were built in the state of Mato Grosso do Sul, Brazil, located 45 kilometers apart, and form a cluster surrounded by one large sugarcane plantation. Angélica is an advanced mill, completed in 2010, with a totalcurrent sugarcane crushing capacity of 5.6 million tons per year. The millyear (assuming an average of 5,333 milling hours). It has capacity to produce up to 381,105 tons of sugar, 381,105 cubic meters of ethanol and 504,000 MWh of energy exports. It is equipped with two modern high pressure boilers and three turbo-generators with the capacity to generate approximately 105110 MW of electricity through the use of sugarcane bagasse. The energy produced through this process is used to power the mill with an excess of 70MW70 MW available for sale to the power grid. AngélicaIvinhema mill has the flexibility to vary production between ethanol and sugar from 60% to 40% for either product.
Our third mill, Ivinhema, is located in the statea current sugarcane crushing capacity of Mato Grosso do Sul, approximately 45 kilometers south7.4 million tons per year (assuming an average of our existing Angelica mill, completing our planned sugarcane cluster in that region. The mill5,920 milling hours). It is equipped with state-of-the-art technology including full cogeneration capacity, flexibility to produce sugar and ethanol and fully mechanized agricultural operations. Ivinhemaoperations.It has capacity to produce up to 362,520396,048 tons of sugar, 362,520396,048 cubic meters of ethanol and 612,000 MWh of energy exports.
Our Main Products
The following table sets forth a breakdown of our production volumes by product for the years indicated:
| | | | | | | | | | | | | | | | | | | | |
| | | Year Ended December 31, |
| | | 2020 | | 2019 | | 2018 |
Sugar (tons) (1) | | 646,981 | | | 213,256 | | | 344,137 | |
| Ethanol (cubic meters) | | 502,170 | | | 756,494 | | | 675,001 | |
| Energy (MWh exported) | | 717,915 | | | 853,139 | | | 705,539 | |
(1) Includes 8,659 tons of organic sugar in 2020, 1,783 tons in 2019 and 7,012 tons in 2018.
The following table sets forth our sales for each of the sugarcane by-products we produce for the years indicated:
| | | | | | | | | | | | | | | | | | | | |
| | | Year Ended December 31, |
| | | 2020 | | 2019 | | 2018 |
| | | (In thousands of $) |
| Sugar | | 171,102 | | | 97,710 | | | 128,377 | |
| Ethanol | | 199,062 | | | 373,847 | | | 324,661 | |
| Energy | | 41,169 | | | 59,701 | | | 57,797 | |
| Other | | 126 | | | 525 | | | 103 | |
| Total | | 411,459 | | | 531,783 | | | 510,938 | |
Sugar
As of December 31, 20202023, our sugar production capacity was approximately 3,550 tons per day which, in a normal year of 15,993after 16,169 hours of milling, resultsresulted in an annual sugara maximum production capacity of over 803,621862,745 tons of sugar. The increased capacity is the result of enhanced operational efficiencies and minimum CapEx investments.
We produce threefour types of sugar: organic sugar, very high polarization, (“VHP”)or “VHP” sugar, standard raw sugar and white crystal sugar. VHP sugar, a raw sugar with a minimum polarization of 99.00 degrees and a maximum polarization of 99.49 degrees of sucrose content, is similar to the type of sugar traded in major commodities exchanges, including the standard NY11 contract. The main difference between VHP sugar and NY11 raw sugar is the sugar content of VHP sugar, and it therefore commands a price premium over NY11 raw sugar. Crystal sugar is a non-refined white sugar (color 150 ICUMSA) produced directly from sugarcane juice.
Sugar sales comprised 16.2%32.3%, 11.0%14.0% and 20.9%18.5% of our total consolidated sales in 2018, 20192023, 2022 and 2020,2021, respectively.
Sugar Production Process
There are essentially five steps in the sugar manufacturing process. First, we crush the sugarcane to extract the sugarcane juice. We then treat the juice to remove impurities. The residue is used to make an organic compost used as fertilizer in our sugarcane fields. The juice is then boiled until the sugar crystallizes, and sugar is then separated from the molasses
(glucose (glucose which does not crystallize) by centrifugation. The resulting sugar is dried and sent to storage and/or packaging. We use the molasses in our production of ethanol.
On average, one metric ton of sugarcane contains 140 kilograms of TRS. While a mill can produce either sugar or ethanol, the TRS input requirements differ between these two products. On average, 1.045 kilograms of TRS equivalent are required to produce 1.0 kilogram of sugar, while the amount of TRS required to produce one liter of ethanol is 1.691 kilograms.
Ethanol
As of December 2020,2023, our ethanol production capacity was approximately 3,2003,350 cubic meters per day which, in a normal year of 15,993after 16,169 hours of milling, resultsresulted in a maximum annual production capacity of over 730,640831,620 cubic meters of ethanol. The increased capacity is the result of enhanced operational efficiencies and minimum CapEx investments.
We produce and sell two different types of ethanol: hydrous ethanol and anhydrous ethanol, (asas further described in “Production Process-Ethanol”). the section below.
Ethanol sales comprised 40.9%19.0%, 28.7% and 26.0% of our total consolidated sales in 2018, 42.1% of our total consolidated sales in 20192023, 2022 and 24.3% of our total consolidated sales in 2020.2021, respectively.
Since 2020, as part of the RenovaBio program, every time we sell ethanol we have the right to issue and sell carbon credits, which are traded on Brazil’s B3 platform. The number of carbon credits that are issued are determined by the score granted by the National Agency of Petroleum, Natural Gas & Biofuels (ANP) based on how “green” the mill operation is deemed to be. During 20202023, we sold 492 thousand443,111 CBios at an average price of 40.9 BRL/R$95 CBio (approximately 7.5 USD/(average net price of US$19.0 per CBio). Please see "“—Our Company- 2. Company—Sugar, Ethanol and Energy Business"Business” above.
Ethanol Production Process
Ethanol is produced through the fermentation of sugarcane juice or diluted molasses. Initially, we process the sugarcane used in ethanol production the same way that we process it for sugar production. The molasses resulting from this process is mixed with clear juice and then with yeast in fermentation vats, and the resulting wine has an ethanol content of approximately 8% to 10%. After the fermentation is complete, the yeast is separated for recycling in the ethanol production process. We distill the wine to obtain hydrous ethanol. In order to produce anhydrous ethanol, hydrous ethanol undergoes a dehydration process in a molecular sieve. The liquid remaining after these processes is called vinasse, which we further process to make liquid organic fertilizer that we use in our sugarcane plantations. Vinasse is also the input used in our biodigestor to produce biogas.
Cogeneration
We generate electricity from sugarcane bagasse (the fiber portion of sugarcane that remains after the extraction of sugarcane juice) in our three mills located in Brazil. As of December 31, 2020,2023, total installed cogeneration capacity reached 241MW, of which 167MW are available for resale to third parties after supplying our mills’ energy requirements.246 MW. The ability to generate electricity from the by-product of the sugarcane crushing process on a large enough scale to fully power a mill with excess electricity being available is referred to as having full cogeneration capacity. Our three mills are duly licensed by the Brazilian Electricity Agency (Agência Nacional de Energia Elétrica (“ANEEL”, or “ANEEL”) to generate and sell electricity.
Cogeneration Production Process
Sugarcane is composed of water, fibers, sucrose and other sugars and minerals. When the sugarcane goes through the milling process, we separate the water, sugar and minerals from the fibers or sugarcane bagasse. Bagasse is an important sub-productsubproduct of sugarcane, and it is used as fuel for the boilers in our mills. Sugarcane bagasse is burned in our state-of-the-art boilers to produce high pressurehigh-pressure steam (68 atm) which is used in our high-efficiency turbo-generators to generate electricity to power our mills. The excess electricity, about 72%68% of production, is sold to the national power grid.
The following flow chart demonstrates the sugar, ethanol and cogeneration production process:
The main advantages of energy generated by sugarcane bagasse are:
•Itit is a clean and renewable energy;
•Itit complements hydropower, the main source of Brazilian energy, as it is generated during the sugarcane harvest period (April to December) when water reservoirs are at their lowest level;
•Itit requires a short period of time to start operations; and
•Itit requires only a small investment in transmission lines when plants are located close to consumer centers.
As of December 2020,2023, our total installed cogeneration capacity at our cluster and UMA mill was 225MW230 MW and 16MW16 MW respectively, of which 155MW155 MW and 12MW12 MW are available to sell to the market.
We believe that there is a high potential for growth in the generation of electricity, and we are prepared to make investments to the extent economically viable.
Storage and Conditioning for the Sugar, Ethanol and Energy business
Our sugar and ethanol storage and conditioning facilities are located at our mill sites and allowenable us to deliver our products when they are ready to be commercialized with no third-party involvement. Having such facilities at mill sites allows us to (i) reduce storage and conditioning costs; (ii) reduce freight costs since we only commence moving the product once the final destination is determined, whether locally or to a port; and (iii) capitalize on fluctuations in the prices of sugar and ethanol.
| | Nominal Storage Capacity | Nominal Storage Capacity | | Cluster | | UMA | | Total | Nominal Storage Capacity | | Cluster | | UMA | | Total |
| Ethanol (cubic meters) | Ethanol (cubic meters) | | 240,000 | | | 27,000 | | | 267,000 | |
| Sugar (tons) (1) | | 110,000 | | | 19,100 | | | 129,100 | |
| Sugar (tons) | |
(1) Additionally, we lease an inflatable store which adds a capacity of 8,000 tons of sugar to our UMA mill.
Marketing, Sales and Distribution for the Sugar, Ethanol and Energy business
Sugar:Sugar. We sell sugar both in the domestic and the international markets. The domesticDomestic sales are processed by our own brand called “Monte Alegre”“Açúcar Monte Alegre,” which is establishedbased in the state of Minas Gerais, Brazil, under whichBrazil. Through this brand, we sell traditionalconventional and organic sugar, allowing us to have a competitive advantage amongst our peers. Prices for the sugar we export are set in accordance with international market prices, which are in turn determined in accordance with the ICE # 11 futures contracts. For the fiscal periodyear ended on December 31, 20202023, our largest fivethree customers in this segment comprisedaccounted for approximately 90%79% of our sales. Thetotal export sales, and the remaining 10%21% was dispersed among several customers.
Ethanol:Ethanol. Almost all of ourWe sell ethanol both to domestic and international markets. Our ethanol sales are into the domestic Brazilian market givenaccounted for approximately 89% and the increasing demand generated from the increase in flex-fuel vehicles in Brazil and better ethanol parity at the gas stations. Around 48%remaining 11% were export sales. Approximately 42% of our domestic ethanol sales are made through formal agreements. The remaining volumes areremainder is sold through daily salesales orders through specialized brokerage firms and/or directly with distribution companies and the prices for these transactions are set using the CEPEA/ESALQ hydrous ethanol index as a reference. Our largest five customers by volume comprisedaccounted for approximately 84%64% of our sales infor the periodyear ended December 31, 2020.2023.
Cogeneration:Cogeneration.We also sell electricity co-generatedcogenerated at our sugar and ethanol mills to the grid. Sales are made to commercialization companies, in the spot market, to distributors and through government auctions in long- termlong-term contracts. Our largest six customers comprised 65%accounted for approximately 73% of our sales revenues infor the periodyear ended December 31, 2020.2023.
The Brazilian energy agency, ANEEL has organized yearly auctions for alternative energy and for renewable sources at favored rates. As a hedging strategy, we sell the electricity production of our mills through long-term contracts adjusted for inflation by reference to the National Index of Consumer Prices (“IPCA”)“IPCA”.
In 2009, Angélica sold energy in a public auction carried out by Camarathe Brazilian Electricity Sales Chamber (Câmara de Comercialização de Energia Elétrica (“CCEE”), Angélicaor the “CCEE,”) and entered into a 15-year agreement with CCEE for the sale of 87,600 MWh per year at a rate of R$294.50363.94 per MWh (price for year 2020)(for 2023). In August 2010, Angélica participated in a public auction, whereupon Angélica entered into a second 15-year agreement with CCEE starting in 2011 for the sale of 131,400 MWh per year at a rate of R$265.03325.44 per MWh (price for year 2020)(for 2023). The delivery period is April to December for the first auction is Mayand March to December andNovember for the second the delivery period starts in April and ends in November of each year.auction. The rates under both agreements are adjusted annually for inflation by reference to the IPCA.
Our Approach to Land Transformation Business
Land transformationWe acquire farmland that we believe is an important elementundeveloped or underutilized. By implementing cutting-edge production technology and agricultural best practices, we render this land suitable for more productive uses, enhance yields and increase its overall value. We seek to promote environmentally responsible agricultural production and a balance between production and ecosystem preservation. We do not operate in heavily wooded areas or wetland areas. Moreover, from time to time, we seek to recycle our capital by selling a portion of our business model and a driver of value creation. Throughfully developed farms. This allows us to monetize capital gains generated by our land transformation we optimizeactivities and allocate our capital to acquire land use and increase the productivewith higher transformation potential and value of our farmland. Our land transformation model consists of changing the use of underutilized or undermanaged agricultural land to more profitable cash generating agricultural activities, such as turning low cash-yielding cattle pasture land into high cash-yielding croppable land, allowing profitable agricultural activities, such as crop, rice and sugarcane production.
deploy it in other businesses, thereby enhancing return on invested capital. Since our inception, we have successfully identified multiple opportunities for the acquisition of undeveloped or undermanaged farmland with high potential for transformation. During the eighteen-year period since our inception,last 21 years, we have effectively put into production over 171 thousand171,000 hectares of land that were previously undeveloped or inefficiently managed and are undergoing the transformation process.undermanaged.
The land transformation process begins by determining the productive potential of each plot of land. This will vary according to soil properties, climate, productive risks, and the available technology in each specific region. Before commencing the transformation process, we perform environmental impact studies to evaluate the potential impact on the local ecosystem, with the goal of promoting environmentally responsible agricultural production and ecosystem preservation, thereby supporting sustainable land use. We do not operate in heavily wooded areas or primarily wetland areas.
The transformation process for undeveloped and undermanaged land requires us to make initial investments during a period of one to up to three years, and the land reaches stable productive capability the third to seventh year following commencement of the land transformation activities.
We are engaged in three different categories of the land transformation process, which are defined by the previousThe metric we use of the land:
•Undeveloped land (savannahs and natural grasslands): This is the most drastic transformation phase since it demands both physical and chemical transformation of the soil. First, the land is mechanically cleared to remove native vegetation. The soil is then mechanically leveled for agricultural operations: in the case of land being transformed for rice production, this process involves heavy land movements and systematization required for irrigation and drainage channels, roads and bridges. In the case of land destined for sugarcane plantations, land movements will also be necessary for the construction of terraces to prevent the excess of water runoff. Certain soils must be chemically treated and corrected by incorporating nutrients such as limestone, gypsum and phosphorous, as is the case of the Brazilian ‘Cerrado’. Soil correction is not required in Argentina or Uruguay due to the natural fertility of the soil. Pesticides and fertilizers are then applied to the soil in preparation for planting. In the case of land destined for crop production (grains and oilseeds), soybean, which is sometimes referred to as a colonizing crop, is usually planted during the first years due to its resistance to pests, weeds and extreme weather and soil conditions. Thereafter, the land will enter into a crop rotation scheme to reduce the incidence of plague and disease and to balance soil nutrients. In the case of rice and sugar cane, which are produced in a monoculture system, there is no colonizing crop or rotation involved. Intensive plague and weed controls and additional soil correction will take place during these first three to five years. Land productivity or yields, measured in tons of soybean or other crops per hectare, will be initially low and will gradually increase year by year. During the first five to seven years, the yields will increase at high and sustained rates. After the seventh year we consider the land developed as yield volatility is reduced and growth is only achievable at marginal rates. Since our inception in 2002, we have put into production about 70 thousand hectares of undeveloped land into productive croppable land.
•Undermanaged or underutilized farmland (cultivated pastures and poorly managed agriculture): This transformation process is lighter than the one described above since it does not require the initial mechanical clearing of vegetation or land leveling. Only in the case of land being prepared for rice production will leveling be required for efficient flood-irrigation. The transformation of cattle pastures or poor agriculture in the Brazilian ‘Cerrado’ will begin with soil correction and soil tillage in preparation for planting of the first soybean or sugarcane crop. The process will then continue as described in the case above. Land productivity or crop yields will grow at high rates during the first three to five years of the transformation process and will then commence to stabilize and grow at marginal rates, at which point we consider the land developed. Since our inception in 2002 we have put into production over 100 thousand hectares of undermanaged or underutilized farmland into croppable land.
•Ongoing transformation of croppable land: The application of efficient and sustainable crop production technologies and best practices such as “no-till”, crop rotations, integrated pest and weed management and balanced fertilization, among others, incrementally increases soil quality and land productivity over time, maximizing return on invested capital and increasing the land value of our properties. Our entire farmland portfolio is constantly undergoing this phase of land transformation.
In each of these categories of transformation, the metric the company uses to track the level and analyze the progress of the transformation process is the level and tendency of crop yields and the number of years the land has been under crop production. Consequently, the process of land transformation is evidenced by the results of the activities within our other business segments, primarily our crops, rice and sugarcane segments. Accordingly, the costs associated with the transformation process described above are allocated within these other business segments. As a result, there may be variations in our results from one season to the next according to the amount of farmland undergoing transformation and the amount of land sold and our ability to identify and acquire new farmland.
Our land transformation segment seeksactivities seek not only to profit from crop and rice cultivation, but also from the opportunistic disposition of successfully transformed farmland. We strategically sell farms that have reached productive maturity with marginal potential for further productivity increases (years three to seven after commencing the land transformation process) to realize and monetize the capital gains arising from the land transformation process. Land transformation proceeds are in turn reinvested in the purchase of strategic farmland with potential for transformation and appreciation. The rotation of our land portfolio allows us to allocate capital efficiently. Since 2006 we have had a solid track record of selling farmland and achieving profitable returns. During the last fourteen years, we have sold25 farms, generating capital gains of approximately $250 million.
These capital gains are generated by three main factors:
(i) the acquisition of land at opportunistic prices below the market value or fair value of the land;
(ii) the land transformation and ongoing land transformation process described above enhances the productivity and profitability of land, ultimately increasing the value of the land; and
(iii) general market appreciation of land driven by increase in commodity prices and supply and demand dynamics in the land market. In this regard, during the last 43 years, since 1977, farmland prices in Argentina’s core production region have increased an average of 8.1% per year according to data published by Margenes Agropecuarios. The value of the farms we sold as well as our overall land portfolio, has mostly been positively impacted by this external factor.
We believe we are one of the most active players in the land business in South America. Since our inception in 2002, we have executed transactions for the purchase and sale of land for over $780 million. Our business development team is responsible for analyzing, selecting, acquiring and selling land. The team has gained extensive expertise in evaluating and acquiring farmland throughout South America, and has a solid understanding of the productivity potential of each region and of the potential for land transformation and appreciation. Since 2002, the team has analyzed over 11 million hectares of farmland with a total value of approximately $16 billion. We have developed a methodology to analyze investment opportunities, taking into account price, transformation potential, productive model, financial projections, and investment requirements, among others. Our analysis also employs advanced information technology, including the use of satellite images, rain and temperature records, soil analysis, and topography and drainage maps. From time to time, we may leverage our favorable position in and knowledge of the land market to engage in opportunistic buying and selling transactions.
The following table sets forth our acquisitions and divestitures since our inception:
| | | | | | | | | | | | | | | | | | | | |
| | | Acquisition | | Divestitures | | Total Land Holdings |
| Year Ended December 31, | | (in hectares) |
| 2002 | | 74,898 | | | — | | | 74,898 | |
| 2003 | | — | | | — | | | 74,898 | |
| 2004 | | 34,659 | | | — | | | 109,557 | |
| 2005 | | 22,262 | | | — | | | 131,819 | |
| 2006 | | 5,759 | | | 3,507 | | | 134,071 | |
| 2007 | | 113,197 | | | 8,714 | | | 239,274 | |
| 2008 | | 43,783 | | | 4,857 | | | 278,200 | |
| 2009 | | — | | | 5,005 | | | 273,195 | |
| 2010 | | 14,755 | | | 5,086 | | | 282,864 | |
| 2011 | | 12,992 | | | 2,439 | | | 293,417 | |
| 2012 | | — | | | 9,475 | | | 283,942 | |
| 2013 | | — | | | 14,176 | | | 269,766 | |
| 2014 | | — | | | 12,887 | | | 257,036 | |
| 2015 | | — | | | 10,905 | | | 246,139 | |
| 2016 | | — | | | — | | | 246,139 | |
| 2017 | | — | | | — | | | 246,139 | |
| 2018 | | — | | | 14,427 | | | 231,712 | |
| 2019 | | — | | | 6,082 | | | 225,630 | |
| 2020 | | — | | | 5,444 | | | 220,186 | |
| 2021 | | — | | | 336(*) | | 219,850 | |
| 2022 | | — | | | — | | | 219,850 | |
| 2023 | | — | | | 6,302 | | | 213,548 | |
| | | | | | | | | | | | | | | | | | | | |
| | | Acquisition | | Divestitures | | Total Land Holdings |
| Year Ended December 31, | | (In hectares) |
| 2002 | | 74,898 | | | — | | | 74,898 | |
| 2003 | | — | | | — | | | 74,898 | |
| 2004 | | 34,659 | | | — | | | 109,557 | |
| 2005 | | 22,262 | | | — | | | 131,819 | |
| 2006 | | 5,759 | | | 3,507 | | | 134,071 | |
| 2007 | | 113,197 | | | 8,714 | | | 239,274 | |
| 2008 | | 43,783 | | | 4,857 | | | 278,200 | |
| 2009 | | — | | | 5,005 | | | 273,195 | |
| 2010 | | 14,755 | | | 5,086 | | | 282,864 | |
| 2011 | | 12,992 | | | 2,439 | | | 293,417 | |
| 2012 | | — | | | 9,475 | | | 283,942 | |
| 2013 | | — | | | 14,176 | | | 269,766 | |
| 2014 | | — | | | 12,887 | | | 257,036 | |
| 2015 | | — | | | 10,905 | | | 246,139 | |
| 2016 | | — | | | — | | | 246,139 | |
| 2017 | | — | | | — | | | 246,139 | |
| 2018 | | — | | | 14,427 | | | 231,712 | |
| 2019 | | — | | | 6,082 | | | 225,630 | |
| 2020 | | — | | | 5,444 | | | 220,186 | |
The following table sets forth, for the periods indicated, certain data relating to our land transformation activity:
| | | | | | | | | | | | | | | | | | | | |
| | | Year Ended December 31, |
| | 2023 | | 2022 | | 2021 |
| Undeveloped/undermanaged land put into production (hectares) | | — | | — | | — |
| Ongoing transformation of arable land (hectares) | | 117,011 | | 123,313 | | 123,313 |
| Number of farms sold | | 1 | | — | | — |
| Hectares sold | | 6,302 | | — | | — |
| Capital gains from the sale of land (in thousands of US$) | | 6,334 | | — | | — |
Property, Plant and Equipment
Our Farms
The table below sets forth the name, location, size and current use of our owned farms:
| | | | | | | | | | | | | | | | | | | | |
| Farm | | State, Country | | Gross Size
(Hectares) | | Current Use |
| Las Horquetas | | Buenos Aires, Argentina | | 2,086 | | | Grains & Cattle |
| San Carlos | | Buenos Aires, Argentina | | 4,215 | | | Grains |
La Carolina(1) | | Santa Fe, Argentina | | 4,306 | | | Grains & Cattle |
El Orden(1) | | Santa Fe, Argentina | | 3,506 | | | Grains & Cattle |
| La Rosa | | Santa Fe, Argentina | | 4,087 | | | Grains & Cattle |
| San Joaquín | | Santa Fe, Argentina | | 37,273 | | | Rice, Grains & Cattle |
| Carmen | | Santa Fe, Argentina | | 10,021 | | | Grains |
| Abolengo | | Santa Fe, Argentina | | 6,662 | | | Grains |
| Santa Lucia | | Santiago del Estero, Argentina | | 17,495 | | | Grains & Cattle |
| El Colorado | | Santiago del Estero, Argentina | | 4,960 | | | Grains |
La Guarida (2) | | Santiago del Estero, Argentina | | 7,880 | | | Grains & Cattle |
La Garrucha (2) | | Salta, Argentina | | 1,839 | | | Grains |
Los Guayacanes (2) | | Salta, Argentina | | 3,693 | | | Grains |
| Ombú | | Formosa, Argentina | | 18,321 | | | Grains & Cattle |
| Oscuro | | Corrientes, Argentina | | 33,429 | | | Rice, Grains & Cattle |
| Itá Caabó | | Corrientes, Argentina | | 22,888 | | | Rice, Grains & Cattle |
| Bela Manhã | | Mato Grosso do Sul, Brazil | | 381 | | | Sugarcane |
| Ouro Verde | | Mato Grosso do Sul, Brazil | | 679 | | | Sugarcane |
| Don Fabrício | | Mato Grosso do Sul, Brazil | | 3,302 | | | Sugarcane |
| Takuarê | | Mato Grosso do Sul, Brazil | | 298 | | | Sugarcane |
| Agua Branca | | Mato Grosso do Sul, Brazil | | 1,614 | | | Sugarcane |
| Nossa Senhora Aparecida | | Mato Grosso do Sul, Brazil | | 540 | | | Sugarcane |
| Sapálio | | Mato Grosso do Sul, Brazil | | 6,140 | | | Sugarcane |
| La Pecuaria | | Duranzo, Uruguay | | 3,177 | | | Grains |
| Doña Marina | | Corrientes, Argentina | | 14,755 | | | Rice |
| Total | | | | 213,548 | | | |
(1) In December 2015, we completed the sale of a 49% interest in Global Acamante S.L.U, Global Calidon S.L.U, Global Carelio S.L.U, and Global Mirabilis S.L.U, whose main underlying assets are El Orden and La Carolina farms.
(2) In June 2014, we completed the sale of a 49.0% interest in Global Anceo S.L.U and Global Hisingen S.L.U, two Spanish subsidiaries that owned the La Guarida, La Garrucha and Los Guayacanes farms.
A substantial portion of our assets consists of rural real estate. The agricultural real estate market in Brazil, Argentina and Uruguay is particularly characterized by volatility and illiquidity. As a result, we may experience difficulties in immediately adjusting our portfolio of rural properties in response to any alterations in the economic or business environments. The volatility of the local market could affect our ability to sell and receive the proceeds from such sales, which could give rise to a material adverse effect on our business, results of operations and financial condition. See “Item 3. Key Information—D. Risk Factors—Risks Related to Our Business and Industries—A substantial portion of our assets is farmland that is highly illiquid.”
Appraisal of Farms. In September 2020, in order2023, to assess the market value of rural properties in Brazil, Argentina and Uruguay, we requested an appraisal by Cushman & Wakefield Argentina S.A., an independent real estate valuation firm knowledgeable aboutwith experience in the agricultureagricultural industry and the local real estate market. As part of these appraisals, the value of each of our properties was determined using the sales comparison approach taking into account current offerings and prices buyers had recently paid for comparable sites, adjusted for the differences between comparable properties and the subject property to arrive at an estimate of the value. The major elements of comparison used to value the properties included the property rights conveyed, the financial terms incorporated into the transaction, the conditions or motivations surrounding the sale, changes in market conditions since the sale, the location of the real estate and the physical characteristics of the property.
The above mentionedThese valuations assumed good and marketable title to subject properties, which were assumed to be free and clear of all liens and encumbrances. The valuation did not include site measurements and no surveys of the subject properties were undertaken. In addition, the valuations also assumed (a) responsible ownership and competent management of the subject properties; (b) there were no hidden or unapparent conditions of the subject properties, subsoil or structures that render the subject properties more or less valuable; (c) full compliance with all applicable federal, state and local zoning and environmental regulations and lawslaws; and (d) all required licenses, certificates of occupancy and other governmental consents were or can be obtained and renewed for any use on which the value opinion contained in the appraisals is based. Unless otherwise stated in the appraisals, the existence of potentially hazardous or toxic materials that may have been used in the construction or maintenance of the improvements or may be located at or about the subject properties was not considered in arriving at the appraisal of value. These materials (such as formaldehyde foam insulation, asbestos insulation and other potentially hazardous materials) may adversely affect the value of the subject properties.
Cushman & Wakefield has informed us their assessment of the market value of our farmland as of September 30, 2020.2023. According to Cushman & Wakefield, the market value of our farmland totaled $763.2US$745.3 million outas of which $699.4 million correspond to the market value of our farmland in Argentina and Uruguay, and the remaining $63.8 million correspond to the market value of our farmland in Brazil.that date. Net of minoritynon-controlling interests in certain Argentine farms, the market value of our farmland totaled $712.5US$695.3 million. These valuations are only intended to provide an indicative approximation of the market value of our farmland property as of September 30, 20202023 based on then current market conditions. This information is subject to change based on a host of variables and market conditions.
| | | | | | | | | | | | | | | | | | | | |
Farm | | State, Country | | Gross Size
(Hectares) | | Current Use |
El Meridiano | | Buenos Aires, Argentina | | 6,302 | | | Grains |
Las Horquetas | | Buenos Aires, Argentina | | 2,086 | | | Grains & Cattle |
San Carlos | | Buenos Aires, Argentina | | 4,215 | | | Grains |
La Carolina(2)
| | Santa Fe, Argentina | | 4,306 | | | Grains & Cattle |
El Orden(2)
| | Santa Fe, Argentina | | 3,506 | | | Grains & Cattle |
La Rosa | | Santa Fe, Argentina | | 4,087 | | | Grains & Cattle |
San Joaquín | | Santa Fe, Argentina | | 37,273 | | | Rice, Grains & Cattle |
Carmen | | Santa Fe, Argentina | | 10,021 | | | Grains |
Abolengo | | Santa Fe, Argentina | | 6,662 | | | Grains |
Santa Lucia | | Santiago del Estero, Argentina | | 17,495 | | | Grains & Cattle |
El Colorado | | Santiago del Estero, Argentina | | 4,960 | | | Grains |
La Guarida (1)
| | Santiago del Estero, Argentina | | 7,880 | | | Grains & Cattle |
La Garrucha (1)
| | Salta, Argentina | | 1,839 | | | Grains |
Los Guayacanes (1)
| | Salta, Argentina | | 3,693 | | | Grains |
Ombú | | Formosa, Argentina | | 18,321 | | | Grains & Cattle |
Oscuro | | Corrientes, Argentina | | 33,429 | | | Rice, Grains & Cattle |
Itá Caabó | | Corrientes, Argentina | | 22,888 | | | Rice, Grains & Cattle |
Bela Manhã | | Mato Grosso do Sul, Brazil | | 381 | | | Sugarcane |
Ouro Verde | | Mato Grosso do Sul, Brazil | | 679 | | | Sugarcane |
Don Fabrício | | Mato Grosso do Sul, Brazil | | 3,302 | | | Sugarcane |
Takuarê | | Mato Grosso do Sul, Brazil | | 489 | | | Sugarcane |
Agua Branca | | Mato Grosso do Sul, Brazil | | 1,614 | | | Sugarcane |
Nossa Senhora Aparecida | | Mato Grosso do Sul, Brazil | | 540 | | | Sugarcane |
Sapálio | | Mato Grosso do Sul, Brazil | | 6,140 | | | Sugarcane |
Carmen (Agua Santa) | | Mato Grosso do Sul, Brazil | | 146 | | | Sugarcane |
La Pecuaria | | Duranzo, Uruguay | | 3,177 | | | Grains |
Doña Marina | | Corrientes, Argentina | | 14,755 | | | Rice |
Total | | | | 220,186 | | | |
(1) On June 2014, we completed the sale of a 49.0% interest in Global Anceo S.L.U and Global Hisingen S.L.U, two Spanish subsidiaries that owned La Guarida, La Garrucha and Los Guayacanes farms.
(2) On December 2015, we completed the sale of a 49% interest in Global Acamante S.L.U, Global Calidon S.L.U, Global Carelio S.L.U, and Global Mirabilis S.L.U, whose main underlying assets are El Orden and La Carolina.
A substantial portion of our assets consists of rural real estate. The agricultural real estate market in Brazil, Argentina and Uruguay is particularly characterized by volatility and illiquidity. As a result, we may experience difficulties in immediately adjusting our portfolio of rural properties in response to any alterations in the economic or business environments. The volatility of the local market could affect our ability to sell and receive the proceeds from such sales, which could give rise to a material adverse effect on our business, results of operations and financial condition. See "Risks Related to Our Business and Industries-A substantial portion of our assets is farmland that is highly illiquid.”
Land Leasing and Agriculture Partnerships. We enter into operating lease agreements based on criteria regarding the quality and projected profitability of the property, as well as our production and yield objectives in the short or medium term. Generally, we become aware of farms available for lease directly through the owners of farms near our farms and in some cases through regional brokers.
We tend to be more open to leasing farmland for sugarcane production than forIn the case of our farming businesses, whereSugar, Ethanol & Energy business, we own the majority of the land that we farm. We lease land for our sugarcane production primarily because leases in this sector are
long term, lasting between one or two sugarcane cycles (with each cycle generally lasting generally 6seven years), which allows us to implement and reap the productivity benefits of our land transformation strategies. Sugarcane lease payments are established in terms of tons of sugarcane per hectare, depending on the productivity of the land in terms of tons per hectare and sucrose content per hectare and also on the distance from the land to the mill. Sugarcane prices are based on the market value of the sugarcane set forth by the regulations of the State of Sao Paulo Sugarcane, Sugar and Alcohol Growers Counsel (Conselho dos Produtores de Cana-de-Açúcar, Açúcar e Álcool do Estado de Sao Paulo, or “Consecana”).Consecana regulations. Given the strategic location of our mills in the region and the inherent inefficiency of growing crops other than sugarcane in this region, we expect to be able to renew our leases for the sugarcane farmland with minimal issues.
With respect to our farmingFarming business, the initial duration of lease agreements is generally one harvest year.harvest-year. Leases of farmland for production of grains include agreements with both fixed and variable lease payments in local currency or U.S. dollars per hectare.
Land Management. We manage our land through an executive committee composed of a country manager, regional manager, farm manager and members of the Technology Adecoagro Group, (“TAG”) thator “TAG,” which meet on a monthly basis. We delegate individual farm management to farm managers, who are responsible for farm operations and receive advisory support from TAG to analyze and determine the most suitable and efficient technologies to be applied. Our executive committee establishes commercial and production rules based on sales, market expectations and risk allocation, and fulfilling production procedures and protocols.
Following an acquisition of property, we make investments in technology in order to improve productivity and to increase its value. Occasionally when we purchase property, a parcel of the property is sub-utilizedsubutilized or the infrastructure may be in need of improvement, including traditional fencing and electrical fencing, irrigation equipment and machinery, among other things.
Property, Plant and Equipment
Our Industrial Facilities
In addition to our farmland, we also own the following principal industrial facilities:
| | | | | | | | | | | | | | | | | | | | |
| Facility | | Province, Country | | Relevant
Operational Data | | Current Use |
| “Christophersen” | | Santa Fe, Argentina | | 19,24012,500 tons of storage capacity. 2,880120 tons per dayhour of drying capacity | | Seedbed and stockpiling plant (1) |
| | | | | | |
| "Las Horquetas" | | Buenos Aires, Argentina | | 5,76024,500 tons of storage capacity. 240 tons per dayhour of drying capacity for grains (120 LPG; 120 natural gas) | | Storage, handling and conditioning |
| “Semillero Itá Caabó” | | Corrientes, Argentina | | Processing capacity of 7,500 tons of rice seeds annually | | - | Rice genetic improvement program |
| | | | | | |
| “Molino Ala — Mercedes” | | Corrientes, Argentina | | Installed capacity of 6,516 tons
of white rice monthly, and husk rice drying capacity of 2,250 tons per day | | Rice processing and drying plant |
| | | | | | |
| “Molino Ala — San Salvador” | | Entre Ríos, Argentina | | Installed capacity of 5,779 tons
of white rice monthly, and husk rice drying capacity of 1,950 tons per day | | Rice processing and drying plant |
| | | | | | |
| Molino Franck | | Santa Fe, Argentina | | Processing capacity of 6,924 tons of white rice monthly, and husk rice drying capacity of 1,650 tons per day | | Rice processing and drying plant |
| | | | | | |
| Molino Paso de los Libres | | Corrientes, Argentina | | Processing capacity of 8,143 tons of white rice monthly, and husk rice drying capacity of 2,100 tons per day | | Rice processing and drying plant |
| Molino Paso Dragon | | Durazno, Uruguay | | Processing capacity of 5,500 tons of white rice monthly, and husk rice drying capacity of 1,100 tons per day | | Rice processing and drying plant |
| Molino Melo | | Tacuarembó, Uruguay | | Processing capacity of 6,924 tons of white rice monthly, and husk rice drying capacity of 1,200 tons per day | | Rice processing and drying plant |
| “Oscuro” | | Corrientes, Argentina | | Husk rice drying capacity of 1,000 tons per day | | Rice conditioning facility |
| “Ita Ibate” | | Corrientes, Argentina | | Husk rice drying capacity of 900 tons per day | | Rice conditioning facility |
| “Bonpland” | | Corrientes, Argentina | | Husk rice drying capacity of 450 tons per day | | Rice conditioning facility |
Free-Stall I, Free-Stall II, III and Free-Stall IIIIV | | Santa Fe, Argentina | | Production capacity of more than 135180 million liters of raw milk
11,104 milking14,400 dairy cows | | Raw milk production |
| | | | | | |
Bio-digesterBiodigester | | Santa Fe, Argentina | | 1.4 MW capacity | | Energy generation |
| Biodigester II | | Santa Fe, Argentina | | 2.0 MW capacity | | Energy generation |
| | | | | | |
| Morteros Facility | | Córdoba, Argentina | | Production capacity of 840,000 liters per day
Reception capacity of 1.2 million liters per day
Storage capacity of 25.8 million liters | | Milk processing facility producing milk powder and semi-hard cheese. Sells products to the export market |
Chivilcoy Facility | | Buenos Aires, Argentina | | Production capacity of 870,000 liters per day
Reception capacity of 1.2 million liters per day
Storage capacity of 1.524.3 million liters | | Milk processing facility producing powdered milk and semi-hard cheese. Sells products to the export market. |
| Chivilcoy Facility | | Buenos Aires, Argentina | | Production capacity of 555,000 liters per day
Reception capacity of 1.2 million liters per day
Storage capacity of 3.5 million liters of fluid milk | | Milk processing facility, producing UHT UP milk, cream and yogurt.flavored milk. Sells products to the domestic marketmarket. |
| "Maní del Plata" | | Córdoba, Argentina | | Shelling capacity of 70,00080,000 tons, blanching capacity of 36,000 tons.
Storage capacity of 50,00070,000 tons of inshellin-shell and 7,50010,000 tons of finished product | | Peanut processing facility producing raw and blanched peanut.peanuts. Sells mainly to the export marketmarket. |
| | | | | | | | | | | | | | | | | | | | |
| "Girasoles del Plata" | | Buenos Aires, Argentina | | Processing capacity of 6 tons/hour of confectionary and 136 tons/hour of bakery.
Storage capacity of 4,00011,020 tons of confectionary. | | Sunflower processing facility producing confectionary and bakery sunflower. Sells mainly to the export marketmarket. |
| “Angélica Agroenergía” | | Mato Grosso do Sul, Brazil | | Installed milling capacity of 5.6 million tons of sugarcane annually, 331,590per annum, 381,105 tons of sugar, 298,431381,105 cubic meters of ethanol, and over 504,000 MWh of energy exports.exported. | | Sugar and ethanol mill producing hydrated ethanol,hydrous and anhydrous ethanol and VHP sugar. Sells energy to local networknetwork. |
| | | | | | |
| “Ivinhema Agroenergía” | | Mato Grosso do Sul, Brazil | | Installed milling capacity of
annually, 362,520per annum, 396,048 tons of sugar, 362,520396,048 cubic meters of ethanol, and over 612,000 MWh of energy exports.exported. | | Sugar and ethanol mill producing hydratedhydrous and anhydrous ethanol and VHP sugar. Sells energy to local networknetwork. |
| “Monte Alegre” | | Minas Gerais, Brazil | | Installed milling capacity of 1.2 million tons of sugarcane per annum, 85,592 tons of sugar, 54,468 cubic meters of ethanol, and over 74,800 MWh of energy exported. | | Sugar and ethanol mill producing hydrous ethanol, VHP sugar and organic sugar. Sells energy to local the network. |
| Biodigester | | Mato Grosso do Sul, Brazil | | 500 Nm3 of biogas per hour; 275 Nm3 of biomethane per hour | | Produces biogas which is then converted into biomethane to replace diesel consumption |
| | | | | | |
(1)Classification of wheat and soybean seeds.
For additional information regarding our property, plant and equipment, see Note 12 of the Consolidated Financial Statements.
Customers
We sell manufactured and agricultural products to a large base of customers. The type and class of customers may differ depending on our business segments, regions and some logistics issues that are very important in our decision making.decision-making. For the year ended December 31, 20202023, more than 89%85% of our sales of crops were sold to ten15 well-known customers, both multinational orinternational and local. Of these customers, the first four casesten customers represented almost 63%75% of our sales, and the remaining sixfollowing five customers represented approximately 26%10% of our net sales in the course of that year.
In the Sugar, Ethanol and Energy segment, sales of ethanol were concentrated inour largest five customers which represented 84%by volume accounted for approximately 64% of totalour ethanol sales of ethanol for the year ended December 31, 2020.2023. Approximately 90%79% of our sales of sugar were concentrated in fivethree customers forin the year ended December 31, 2020. The2023; the remaining 10%21% was dispersed among several other customers. In 2020,2023, 73% of our energy sales were 65% concentrated in six major customers.
Competition
The farming sector is highly fragmented. Although we are one of South America’s leading producers, due to the atomized nature of the farming sector, our overall market share in some of the industries in which we participate is insubstantial. Our production volume, however, improves our ability to negotiate favorable supply, transportation and delivery logistics with our suppliers, third-party transporters, ports and other facilities, and customers. Although competition in agriculture varies considerably by product and sector, in general, there are a large number of producers, and each one of them controls only a small portion of the total production. Therefore, individual producers often have little influence on the market and cause little or no effect on market prices as a result of their individual strategies, explaining why producers are price takers and not price makers. In many cases, the price is established in international market exchanges. As the majority of agricultural products are commodities, which stifles product differentiation, the principal competition factors are cost of production and volume efficiency gains. In addition, agricultural producers face strong foreign competition, and with this competition the factors are often more difficult to identify.
The majority of farming producers in developed countries can rely on specific protectionist policies and subsidies from their governments in order to maintain their position in the market. In general, we have been able to obtain discounts for the acquisition of supplies and excess prices for our production in the farming sector. In this sector, we view SLC Agrícola S.A., BrasilAgro - Companhia Brasileira de Propriedades Agrícolas, Sollus Agrícola, Radar Propriedades Agrícolas, El Tejar S.A., Cresud SACIF y A, MSU S.A.S.A. and Los Grobo Agropecuaria, among others, as our competitors. We also compete in Argentina with retailers of agricultural products, including other branded rice products, such as Molinos Río de la Plata S.A., Dos Hermanos S.H., Sagemüller S.A.S.A. and Cooperativa Arroceros Villa Elisa Ltda.Ltda.
The sugar and ethanol industries are highly competitive. In Brazil, we compete with numerous small-andsmall- and medium-sized sugar and ethanol producers. Despite increased consolidation, the Brazilian sugar and ethanol industries remain highly fragmented, with more than 384424 sugar mills. Some of the largest industry players with whom we compete are Raizen, Biosev, Atvos, Tereos, São Martinho, Jalles Machado, Bunge, Santa Terezinha, Lincoln Junqueira and Coruripe.Coruripe. We also face competition from international sugar producers, such as those in the U.S. and the European Union, where local regulators have historically implemented tariffs, agriculture subsidies and/or other governmental incentive programs, of which some remain, to protect local sugar producers from foreign competition.
The following table describes the Brazilian competitive landscape:
| | | | | |
| | Brazil |
| Number of Mills | 384 424 | |
| Sugarcane crushed (million tons) | 642.7677.6 | |
Ethanol Production (million cubic meters)(1) | 35.6 28.0 | |
| Sugar Production (million tons) | 29.846.9 | |
(1) Only considers ethanol produced from sugarcane. It does not include 6 million cubic meters of ethanol produced from corn.
Source: Ministry of Agriculture &and CONAB
With respect to farmland, there have historically been few companies competing to acquire and lease farmland for the purpose of benefiting from land appreciation and optimization of yields in different commercial activities. However, we believe
that new companies may become active players in the acquisition of farmland and the leasing of sown land, which would add competitors to the market in coming years.
Supplies and Suppliers
Our principal supplies for our farmingFarming business are seeds, fertilizers, pesticidesphytosanitary products and fuel, which represented 8.6%7.1%, 6.7%9.5%, 12.1%11.9% and 3.6%2.9%, respectively, of our total direct costs (including leasing cost). in 2023. Further, these supplies represented 27.5% of our total cost of production (including manufacturing and administrative expenses) for 2020. As we use direct sowing in 99% of our planted area, without requiring soil preparation, fuel represents only 3.2% of the total cost of production for 2020.
Our principal supplies for our sugar, ethanol and energy business are diesel, lubricants and fertilizers, which collectively represented 16.1%28.7% of our total cost of production (including manufacturing and administrative expenses) in 2023. As we use direct sowing in 99.0% of our planted area, without requiring soil preparation, fuel represents only 2.7% of the sugar, ethanoltotal cost of production for 2023.
Our principal supplies for our Sugar, Ethanol and energyEnergy business for 2020.are diesel, lubricants and fertilizers, which collectively represented 18.1% of our total cost of production (including manufacturing and administrative expenses) in 2023. We have an extensive network of suppliers for each of our business segments and for each required input within each segment, resulting in lower reliance on any particular supplier. Our ten10 largest suppliers account for 22.1%30.1% of our total expenditures for supplies in 2020.2023. While we value the relationships we have developed with each of our suppliers given the quality we have come to expect, we do not consider any single supplier to be key to our production.
We have been able to obtain lower prices particularly due to the volume that derives from our large-scale operations.
Seasonality
Our business activities are inherently seasonal. We generally harvest and sell most of our grains (corn, soybean, rice and sunflower) between February and August, with the exception of wheat, which is harvested from December to January. Peanut is harvested from April to May, and sales are executed with higher intensity during the third quarter of the year. Cotton is unique in that while it is typically harvested from June to August, it requires processing which takes about two to three months to complete. Sales in our dairyDairy business segment tend to be more stable. However, milk production is generally higher during the fourth quarter, when the weather is more suitable for production. In general terms, processing of rice and milk tend to be more stable during the year. Although our Mato Grosso do Sul Sugar, Ethanol and Electricity cluster is currently operating under a “non-stop”an “uninterrupted” or “continuous” harvest, and without stopping during the traditional off-season, the Minas Gerais unit, as well as the rest of the sector in Brazil is still primarily operatingoperates mainly with large off-season periods from December/January to March/
April. The result of large off-season periods is fluctuations in our sugar and ethanol sales and in our inventories, usually peaking in December to take advantage of higher prices during the traditional off-season period (i.e., January through April). As a result of the above factors, there may be significant variations in our financial results from one quarter to another.inventories. In addition, our quarterly results may vary as a result of the effects of fluctuations in commodities prices, production yields and costs on the determination of changes in fair value of biological assets and agricultural produce. See “Item 5. Operating and Financial Review and Prospects-A. Operating Results-Critical Accounting Policies and Estimates-Biological Assets and Agricultural Produce.”
Sustainability
Our production model is based on sustainability standards that seek to produce food and renewable energy on a long-term basis. Those standards include best practices and certifications that promote development and health, customer satisfaction and stakeholders'stakeholders’ interest, neighboring community welfare, food care and food safety, and environmental protection. Accordingly, our sustainable approach to farming requires that we take into account not only economic, but also social and environmental aspects specifically adapted to local circumstances. We believe we accomplish these goals through a team committed to our values: trust, transparency, efficiency, innovation, safety and sustainability.
Our peopleGoing forward, we will continue to innovate, be transparent, and report on our progress to accelerate our vision for a better and more sustainable future.
We constantly care about theThe development, health and safety of our employees.personnel is important to us. We also promote enhanced working conditions, while we support training and internal education programs to improve skills and educate with the newest technologies and business practices. We implement and constantly revise our health and safety programs in each of our businesses.
Standardized and Scalable Agribusiness Model
We have adopted an agribusiness model that allows us to engage in large-scale farming activities in an efficient and sustainable manner. Our agribusiness model consists of developing a specialized workforce and defining standard protocols to track crop development and control production variables, thereby enhancing efficient decision making and facilitating
continuous improvement. This approach allows us to grow in scale, execute our expansion plan and efficiently manage various production units spread across different regions by effectively replicating our productive model. Process standardization also helps us assure compliance with local lawlaws and regulations and reduce social and environmental risks.
We continue to develop and implement crop protocols. The purpose of these protocols is to coordinate and consolidate the knowledge on crop management for each area in order to standardize the implementation of these protocols. The protocols contain all the technical information for managing crops. This information is constantly reviewed by agricultural teams and their advisors, making it possible to preserve the technical knowledge of the company and at the same time improve agricultural production and make decisions pursuant to the company’s guidelines. Based on the results of the application of these protocols, we conduct an annual review of the techniques used and their results. This evaluation is done by means of crop campaign analysis, in which all teams review and discuss the last harvest year’sharvest-year’s productive performance and the technological package for the new harvest year.
When processes and protocols are defined, they can be audited and certified by qualified third parties. Adecoagro hasWe previously certified itsour crop and rice production in Argentina under ISO 9001, its biodigestor9000, and we are in the process of certifying our biodigester energy generation in Argentina under ISO 14001 and RTRS in mostthe Round Table on Responsible Soybeans standard, or “RTRS,” for some of our crop operating units. In addition, to this, in 2020 we have certified our paddy rice and peanut production under SAI (Sustainablehas been certified by the Sustainable Agriculture Initiative) squeme.Initiative (SAI) with the Farm Sustainability Assessment (FSA).
In order to achieve efficient scales of production, we have redesigned our field sizes by removing useless cattle infrastructure such as fencing. Larger fields reduce the overlapping of farm works, enhancing operating efficiency, reducing the use of inputs and achieving agronomic timing (planting or harvesting on time). The goal is to reduce operative time and to improve efficiency in the use of inputs. Large-scale production also requires the implementation of advanced technology such as GPS (GlobalGlobal Positioning System), GIS (GeographicSystem, or “GPS,” Geographic Information System)System or “GIS”, and modern machinery as well.
We are also adopting operational protocols and procedures in our industrial facilities to improve control of processing variables. Both of our milk processing facilities have been certified under the FSSC 22000 standard (Food Safety System
Certification), and our Morteros facility has also obtained Kosher and Halal certifications. Incertification. We have also certified four of our six rice mills theunder FSSC 22000, standard is currently under implementation, we have been audited for the FSSC Global Market standard and two of our mills have obtained the Kosherkosher certification. RegardingIn our cropCrops business, our peanut processing facility has beenwas certified for Kosheras kosher and obtained the BRC standard for food safety, and is currently implementing Halal; while our sunflower processing facility has obtained the FSSC 22000 standard and Kosherkosher certification. Most of our industrial facilities are either implementing or have been audited by SMETA,the Sedex Members Ethical Trade Audit, which validates our compliance with health, safety and safetyhuman rights practices, throughouttogether with applicable environmental legislation. Similarly, in 2021, we were subjected to audits under specific standards of our clients at our Chivilcoy milk processing plant, which covered topics such as asset security and corporate social responsibility. We were successful in these audits, which enabled us to continue with the supply chain.relevant commercial relationships.
When market conditions provide price premiums for certified grains or oilseeds, we evaluate the feasibility of implementing specific certifications. Some examples of this are RTRS (Round Table on Responsible Soybeans) and EPA (Environmental Protection Agency, US) certifications for Sustainable Soybeanssustainable soybeans in Argentina. In Brazil, we are certifying sugar-based products for EPA.EPA, Bonsucro, certifications and Fair Trade USA and Fair For Life Organic Sugar Certification (Usina Monte Alegre).
Sugar. Our UMA mill is also certified with Halal, Kosher and FSSC 22000 certifications.
Contractors
Contractors play a significant role in our farmingFarming business model. If cost competitive, we seek to outsource most of the typical farm work, such as planting, spraying and harvesting. Outsourcing allows us to reduce our investments in heavy machinery and equipment such as tractors or harvesters, enhancing the efficient allocation of our capital in our core productive activities. Notwithstanding, we are reviewing the contractor model and comparing it with the use of own machinery in some of our crops and rice operations. We are willing to develop our own-equipment-basedown equipment-based model where efficiencies could be enhanced.
The contractor model in the Argentine humid pampas region has existed for over s years and has developed into a highly competitive market. Contractors have gained extensive expertise and skill in the management of agricultural machinery and have access to modern advanced technology. When working with them, we seek to develop win-win relationships with our contractors by considering them as part of our production team and providing constant technical training and support through our GTA (as defined below) activities.the activities of the Adecoagro Production Teams and the Technical Group (Grupo Técnico Adecoagro) or the “GTA.” We strive to have a number of contractors associated with each farm to generate competition and allow benchmarking to enhance operational efficiency and ensure high-quality service.
In regions where this model is not fully developed, we use a mixed system where we hire the most experienced contractors in the region and we also operate our own machinery. We promote the development of new contractors by providing training and selling them our used machinery. We also promote the movement of selected contractors from developed regions into new marginal regions by offering them an opportunity to grow their businesses. In other regions where there is no established contractor system or there is specific farm work (rice land leveling for instance), we own the majority of the machinery. In our Sugar, Ethanol and Energy business, we own or lease and operate all the agricultural equipment and machinery needed for sugarcane planting, crop protection and harvesting operations. SuchThe performance of such model is performing very wellhas exceeded our expectations, and is encouraging us to consider it for
we are considering its implementation in our Farming businesses, where we actually have recently incorporated some additional planters and harvesters. Our main goal is to achieve high-quality farm works, both when selecting any contractor and when using our own machinery. In Brazil, we partiallyonly employ the contractor model only for specific tasks, such as land leveling, and aerial spraying, among others.
Adecoagro Technical Group (Grupo Tecnico Adecoagro “GTA”)
The GTA is an internal group formed by agronomists, farm managers, technology experts, external advisors, contractors, trainees and suppliers, whose main goal is to excel in production management by providing constant technical and technological education and analysis regarding production technologies. Although the GTA is focused on developing such knowledge under common criteria for the whole company, it also considersevaluates different production systems, such as crops, rice and dairy in Argentina and Uruguay, and sugarcane in Minas Gerais and Mato Grosso do Sul, Brazil. In order toTo achieve theirits goals, the groupGTA meets every 20 daysregularly to analyze and discuss technical aspects of the farming production processes.
The GTA participates in the design of the most efficient and productive land use strategies and the definition of the optimal crop production mix for each farm and region, and supervises and evaluates the implementation of the most profitable and sustainable technologies to be adapted and applied in each region. Additionally, the GTA promotes specific external training courses, facilitates participation in external technical groups, organizes technical farm tours, offers support in establishing the crop planting plan and delivers a full-season analysis for each crop annually. This analysis is essential in order to allow technical improvements to be implemented for the following crop season.
Since the GTA is involved in different regions, it plays a relevant role in spreading best practices among productive regions, including “no-till” and precision agriculture in lesser-developed areas. In order to evaluate and adapt the proper technologies
locally, a vast network of test plots in agrochemicals, seeds, and farm-works are being carried out under specific technical guidelines. Such development is performed to make the necessary technological adjustments in respect of fertilizer levels, the choice of the best product varieties for each crop, the determination of the bestoptimal planting periods, and the improvement in crop management and agricultural mechanization, resulting in higher yields coupled with reduced costs.
In order to continually improve our technical development, we participate in specialized industry groups, such as CREA and AAPRESID in Argentina, with which we share values and goals. “CREA” is a 50-year-old60-year-old farmers’ association focused on developing and supporting technical excellence with local farmers. “AAPRESID” is a technical association of highly innovative farmers specializing in no-till development. We participate in certain CREA and AAPRESID discussion groups in which we share and evaluate common technical matters. We take advantage of their vast network of test plots and we constantly exchange technological knowledge for implementation in our farms. We are also part of the RIA Group, an agricultural innovation network consisting of 11 enterprises, with the goal of increasing innovation in our sustainable production model.
In addition, the GTA is focusing its resources on pursuing improvements troughthrough implementing advanced techniques. Such techniques comprise variable inputs usage by type of soil based on precision agriculture technology, intensification techniques relating to soil occupation times and diversified crop rotations, adjusting “no-till” in rice production, developing sugarcane production technologies involving agricultural mechanization and minimum tillage, and developing cotton production technologies involving “no-till” and crop rotation, among others.
By implementing all these education programs and development activities, the GTA provides to the company with a network that focuses on the fine-tuning and optimization of the efficiencies throughout all the production processes of each business line.
Technology and Best Practices
We have consistently used innovative production techniques to ensure that we are at the forefront of technological improvements and standards in our industry.industry, especially based on regenerative agriculture concepts. For example, we use the “no-till” technology and “crop rotation”crop rotation to improve our crop yields. We also practice the use of “second harvests”second harvests or double cropping where conditions permit, allowingwhich enables us to plant and harvest a second crop from the same farmland in the same harvest year.harvest-year. Our crop production model is based on balanced fertilization, integrated pest and weed management, and crop intensification. We use the innovative silo bag storage method in our rice and cropcrops businesses, allowingwhich enables us to time the entry of our ricecrop production into the market at optimal price points. Additionally, we believe we were the first company in South America to implement the innovative “free-stall”free-stall infrastructure in dairy operations resulting in increased raw milk production compared to our peers. The free-stall method is a model that provides forenables better control over production variables by confining dairy cows into large barns. Those barns, which are equipped with state-of-the-art technology to enhance cow-comfort conditions,cow comfort, such as sand beds, water-spraywater spray cooling systemsystems and fans. In 2023, our free stalls were certified with the animal welfare standard of the International Agricultural Organization (OIA, for its acronym in Spanish) as a result of our good practices promoting animal welfare in production. In addition, installations are equipped with indoor corrals and a mechanical advanced milking system on a rotary platform, allowingwhich enables us to utilizeuse production efficiencies and thereby increase milk production volumes while maximizing our land use, and resulting in significantly higher conversion rates of animal feed into milk.
OurMoreover, our sugarcane harvesting is 98%99.7% mechanized, which has significantly improved operating efficiency, thereforethereby reducing operating costs. We have modern facilities in the sugarSugar, Ethanol and ethanolEnergy business, including advanced sugar and ethanol mills with high-pressure boilers, and thatwhich achieve one of the highest ratios of energy produced per ton of cane milled, according to the Cane Technology Center Benchmark program. Our Angélica sugar plant was the first continuously operative facility in Brazil, requiring no production stoppages between sugar batches.
No-Till
“No-till” is the cornerstone of our crop production technology and the key to maintaining and even increasing the value and productivity of our land assets. “No-till” - —often called zero tillage or direct sowing -sowing— is a technology developed more than 40 years ago to grow crops from year to year without disturbing the soil through tillage, and arose as an opposition to conventional tillage.
Conventional farming consists of using plows to turn and till the soil to remove weeds, mix in soil additives such as fertilizers, and prepare the surface for seeding. Soil tillage leads to unfavorable effects such as soil compaction, loss of organic matter, degradation of soil components, death or disruption of microorganisms, evaporation of soil humidity and soil erosion where topsoil is blown or washed away by wind or rain.
“No-till” farming avoids these negative effects by excluding the use of tillage. The “no-till” technology consists of leaving crop plant residues on the surface of the soil after harvesting a crop. These residues form a mulch or permanent cover protecting the soil from erosion risks caused by heavy rains and strong winds. This protective cover also helps natural precipitation and irrigation water infiltrate the soil effectively while decreasing water loss from evaporation. Absence of tillage helps prevent soil compaction, allowing the soil to absorb more water and roots to grow deeper into the soil. Furthermore, “no-till” reduces the emergence of weeds and enhances biological processes that positively impact soil properties, conserving and even improving the presence of organic matter and microorganisms and associated nutrients (nitrogen, phosphorous, etc)etc.).
The combination of these advantages results in important cost reductions due to a lower use ofthe reduced need for inputs, mainly diesel fertilizers and pesticides,fertilizers, and higher crop yields, thus increasing the profitability of our business. These benefits are achieved in the medium to long term, resulting in a continuous increase of land productivity and thus its value. From an operational standpoint, “no-till” farming facilitates the conditions to performtimely performance of most of the operations, on time such as planting, spraying and harvesting, which enhances the development of large-scale operations and speciallyespecially improves the probability of planting each crop at the optimumoptimal moment.
Crop Rotation
Crop rotation is the practice of growing a series of dissimilar types of crops in the same area in sequential seasons. Crop rotation allows us to better control the buildup of harmful weeds and reduces the incidence of plagues and diseases that often occur when the same commodity is continuously cropped. Crop rotation also allows us to balance the fertility demands of various crops to avoid the excessive depletion of soil nutrients, contributing to a more efficient use of fertilizers and a sustainable use of herbicides and pesticides.phytosanitary products. Crop rotation results in increased yields and reduced production costs, providing a high rate of return. Our crop rotation model is tailored to each of our farming regions based on climatic and soil conditions. For example, in Argentina’s Humid Pampas, our three-year crop rotation cycle involves the planting of a wheat crop followed by a soybean double-crop in the first year, a corn crop in the second year, and a soybean crop in the third year. In some areas of the Argentine Humid Pampas wherewith adequate agro-climatic conditions, are adequate, we enhance our crop rotation by introducing some industrial crops such as peanut and confectionary sunflower.
Second Harvest - Double Cropping
Second harvest, also known as “double cropping”,double cropping, is the practice of consecutively producing two crops on the same land within the same growing year. Double cropping is possible only in regions with long growing seasons, which is determined mainly by climate conditions such as rain and temperature. Double cropping allows us to increase the profitability of our land, diversify our production and commercial risk and enhance operational efficiencies through athe better utilization of machinery, freight, labor and other resources, resulting in a dilution of our fixed costs. Double cropping has important agronomical advantages as well, such as having crops on the land for a longer period of time, which, enhanced by “no-till” and crop rotation practices, results in the improvement of the physical and chemical properties of the soil in the long term. We implement and adapt different double cropping systems for each of our productive regions in Argentina and Uruguay, with the most frequent being wheat/soybean, wheat/corn, sunflower/soybean, corn/soybean and sunflower/corn.
Integrated Pest Management (IPM)
Integrated pest management, (“IPM”)or “IPM,” involves a deep analysis of agronomical, economic and environmental aspects with the goal of determining the most efficient way to control the pests. It simultaneously achieves three main goals: (i) enhancing crop productivity, (ii) reducing use of pesticidesphytosanitary products and (iii) decreasing the risk of agrochemical contamination. The first stage of IPM is to train the people who will be involved in pesticidephytosanitary products usage. The pesticidephytosanitary products to be applied is selected considering local regulations (only locally approved pesticidesphytosanitary products are used) and the minimum resulting environmental risks due to its chemical classification. Additionally, when selecting biotechnologically developed crops, we evaluate the potential reduction of pesticidephytosanitary products uses that may be achieved. The doses of pesticidesphytosanitary products are defined by vendor recommendations and adjusted through agronomical expertise (specific to a crop and a pest). We assess the environmental impact of such phytosanitary products by implementing the use of the Environmental Impact Quotient developed by Cornell University. The timing of pesticidephytosanitary products application is based on an economic threshold that takes into account the crop situation (growing stage, climate conditions), the potential damage of the pest (type, population, growing stage), the presence of “beneficial” pests, and finally, the price relationship between grains and pesticides.phytosanitary products. We also use integrated management to control pests, which entails the use of biological pest controls by breeding and releasing natural enemies of the relevant pest, as is the case with the borer plague in sugarcane.chemical products. The relevance of the pest is measured by implementingthrough the implementation of specific scoutingdefense methodologies which are adapted to large-scale farming. Scoutingagriculture. Control is carried out by trained employees who supervise all the fieldsentire sugar cane area on a weekly basis. Based on the indicators resulting from monitoring, biological and chemical products are recommended to be applied. For biological pest control, natural enemies of the pest in question are released, as is the case with the borer pest in sugarcane. The pesticide doses of phytosanitary products are applied and localized by high-tech machinery, the majoritymost of which is outsourced. IPM machinery is accuratelyAgricultural machines are precisely calibrated to increase its applicationthe efficiency of the applications and to reduce any potential contamination risk. Climaterisk of contamination. Climatic conditions are carefully
taken into account as well, inwhen determining the optimal timingideal time for spraying to avoid risks of drifting and evaporation and leakage risks.
Balanced Fertilization
Balanced fertilization consists of determining an optimum use of fertilizers at the proper grades and in the proper amounts to supply the correct ratio of nutrients and to ensure that the soil will sustain high crop yields over time, consequently decreasing contamination risks. At the beginning of each crop season, we perform extensive soil studies in each of our farms to monitor the amount of organic matter, nitrogen, phosphorus and potassium levels in each field. Based on this analysis and considering the potential yield for each field, the crop rotation, and relative prices between fertilizers and agricultural products, we determine the optimum amount of fertilizer to be applied in order to maximize the economic response of the crop.
Water managementManagement
Since crops need sufficient water to achieve their potential yields, we are engagedengage in techniques aimedthat are designed to increase the efficiency of water usage and at the same time to decrease soil erosion risks. In that regard, “no-till” farming presents strong advantages since it improves rainfall infiltration and increases the soil’s water storage capacity. In areas that may be subject to excess water, we are developing terraces, soil leveling and other techniques intended to decrease runoff and erosion risks. In some of the jurisdictions in which we operate, the use of water for irrigation requires obtaining special permits. For certain irrigated crops such as rice, we focus on the design and operation of rainwater harvesting, collectingwhich is the collection of water from rain in semi-natural reservoirs destined for future irrigation. In addition, we have developed a water recyclerecycling system for each farm where excess of water (derived from drainage and rainfalls)rainfall) can be reused, instead of being drained out of the farm. Channels to conductthat move the water and drain the fields are developed by experts in order to deliver water in the most efficient manner. We have developed Precision Levelingan advanced precision leveling system (with zero or controlled grade level) in most of our rice farms to increase productivity and reduce production costs. This technique involves a precise leveling of the land based on GPS and Laser technology. When fields are accurately leveled, water irrigation requirements are reduced, thus lowering the cost of labor and energy. Efficient management of irrigation results inalso has a positive impact on crop yields. Additionally, as the fields can be larger, there are some operational benefits
We have in place different technologies that can be achieved by reducing machinery working times. Recently,help us reduce water consumption in our rice fields. For example, we have implemented polypipethe poly-pipe irrigation systemsystems in theour most hilly rice-fields.rice fields. This technology consists of deploying plastic pipes to conductmove irrigation water from a big channel to the fields, thusthereby reducing water consumption, alongside with a small reduction ofand the area devoted to infrastructure. In addition, we are usinguse satellite imagery and drones to assess water levels during the rice irrigation season. Through thisThis high-precision surveillance method, we are enhancingallows us to enhance water management, which improves potential yield, while reducingcrop yields and reduces water consumption. Drones use different cameras to detect water levels even when dense canopies cover the fields. In addition to drones, we use satellite images that measure the normalized difference vegetation index (“NDVI”) of land for a rapid and efficient analysis of irrigation including speed and depth. In addition to higher water use efficiency and optimization, satellite images help in the prevention of weed proliferation, the reduction of phytosanitary products and the achievement of higher yields. Other crops, such as corn seed and sunflower seed, are irrigated by highly efficient pivot spraying systems. This type of irrigation system allows us to distribute water uniformly throughout the field, improving the use of water in terms of total millimeters per year. We conduct soil moisture sampling to defineidentify the best moment and amount of water to be used for irrigation in each plot.
Mechanization
We incorporate all available mechanization technology into our business that iswe consider to be cost-effective. We believe that by employing mechanization technology, we improve our operating efficiency and are better able to reach desired economies of scale in our operations. Mechanization also enables us to adopt new associated technologies faster and hastens our development efforts. In our farmingFarming business, we are usinguse cutting-edge mechanized technology for planting, spraying, harvesting and
irrigating and for soil preparation and management. We also employ advanced mechanization technology in our logistics and product processing operations, including transportation, drying operations and grain sorting and storage. We have developed mechanization technology to benefit sugarcane planting and harvesting, which traditionally have not benefittedbenefited from such mechanization.
Synergies
The technologies we employ are very closely linked, and the joint implementation of a number of them willis expected to result in positive synergies for our entire production system. For example, implementation of the “no-till” technology can be enhanced by crop rotations, due to the positive biological effects generated by the different types of roots from each crop in the soil. Benefits of integrated pest management are improved when combined with the “no-till” and crop rotation strategies, since the crop stubble that remains on the soil can be a barrier to some plagues, and because some other pests are specific to a particular crop and the crop rotation can be sufficient to control them. The use of machinery technology for selective spraying
also complements our no-till system. We consider these synergies when we develop our crop seeding schedule. In the case of re-usethe reuse of residues, we benefited from our experience in sugarcane, where almost everything is re-usedreused and no residues are generated. By transferring such conceptual ideas to our dairy operations, we ended up in reusing the manure from the cows to generate renewable electricity.
AgTechAgtech (Agricultural, digital-basedDigital-Based Technology)
Since inception, we have been introducing cutting-edge technologies to increase our production efficiency. As digital and information-based technologies are rapidly advancing, we are currently devoting time and effortseffort to work closely with AgTech Startupslocal and international agtech startups, funds, research associations and other key players that could bring solutions to our operational processes. We are monitoring both local and international startups, with the goal of adopting efficient digital technology in our operations (see “Research & Developments” section).
Industrial Technology
In the recent years, we have incorporated manyseveral industrial facilities to our portfolio so weand have been actively enhancing their performance through the implementation ofusing technology. In the case ofour dairy industry, we have replaced theLPG gas with natural gas as a source of energy from LPG gas to Natural gas in the facility of Morteros, thusthereby reducing both the cost of production and the impactenvironmental impact. At Morteros, we also incorporated technology to produce fat filled (powdered milk that contains vegetable fats instead of butterfat), a product that helps us enhance our operational efficiency and access new markets. At the environment. In the sameChivilcoy facility, we have incorporated the technology to produce Fat Filled, a product that help us to enhance operational efficiency while achieving new markets. In the case of Chivilcoy dairy facility, we have incorporated the technologies to produce and package UHT cream yoghurt and milk with cacao.cacao milk. These incorporationsadvances help us to enhance our milk-based product portfolio. All these three new products are based on our own formulaformulas and are developed by our Productionproduction and Qualityquality team.
Information Technology
We employ the World Class ERP Oracle eBusiness Suite ERP and Oracle Hyperion to standardize and integrate our processes throughout the companyCompany and improve controls and information accuracy and consolidation. The Oracle eBusiness Suite allows us to fulfill our local accounting and fiscal needs while facilitating operational coordination across our geographic areas and lines of business, reducing our operational costs and minimizing duplication and inefficiencies. It also provides our management with consolidated results in a timely manner.
Cyber securityCybersecurity
In accordance with the growing risks in cybersecurity like ransomware, malware, viruses, trojans, system vulnerabilities, hackers and other threats,types of attacks, we have adopted a series of security measures designed to mitigate these risks. We are constantly implementing new technologies and solutions to assist in the prevention of potential and attempted cyber-attacks,cyberattacks, as well as protective measures and contingency plans in the event of an existing attack. We analyze the risks we face on an ongoing basis and, accordingly, strengthen our information technology infrastructure, update our policies, and raise awareness among our employees to enhance our ability to prevent and respond to such risks.
DespiteWe have added several employees to our security measures,cybersecurity team and have contracted a third-party provider specialized in January 2020 we suffered an infection incident with a virus. This incident compromised the networks, and a significant number of servers and personal computers of Adecoagro. However, it did not have a material impact on our information technology, since the production systems were not compromised, nor were the financial and accounting systems or the company's databases. Adecoagro was forced to carry out a contingency plan, in order to restore the affected services, and return to a safe and normalized working condition. Services were recovered during the days following the incident, but critical systems such as billing, sales and merchandise dispatches were available within a few hours after the
event. In response to this event, we have taken several actions. For example, we have created the Cyber Security Officer position; we have hired a cyber-security specialistcybersecurity to help us invalidate and develop our plans to grow our cybersecurity system. This provider is also our 24x7 security operation center (SOC), which receives and analyzes the validation and development of a short, mid and long term plan; and we have already increasedalerts from our monitoring system. This has allowed us to continue increasing the security level inat our facilities. This event has enforcedfacilities, as part of our commitment and decision to continue reinforcing our security systems, and to keep improvingimprove our contingency plans.
Environmental Aspects
We are implementingimplement a production model that reflects a strong commitment to the environment. Our responsibility to the environment begins with complying with local regulations. In order to beTo become better stewards of the environment, we are implementingimplement environmental management plans for our operations. Those plans involve different stages, which include educating our own and outsourced staff, monitoring ecological parameters, preventing negative effects, and correcting deviations. Natural resources such as land, water, air and biodiversity are taken into account when we evaluate both the development of a new production project and the operation of an on-going one.new and ongoing production projects and operations. In that regard, we are constantly evaluating best practices to be implemented in our operations. See “-Technology“—Technology and Best Practices.” With land being one of the most relevant natural resourceresources in our operations, we have developed a sustainable land use strategy that considers factors beyond the requirements of local lawlaws and regulations. There are ecosystems that we do not consider appropriate for agricultural development, such as heavy forests and key wetlands. We evaluate development of other areas (savannahs, natural grasses, bush land, lowlands) only after carrying out an environmental impact assessment. In addition to such evaluations, we analyze the agricultural potential of the land in respect of the soil, the climate, crop productivity and
available technology, among other factors. ThroughUsing this approach, we make sure that weaim to grow the most suitable crop in each region withand be the aim of being the lowest costlowest-cost producer ofin the sector. We then consolidate our analysis into a land transformation plan, which includes the best land use option and implements best practices based on regenerative agriculture such as the “no-till” technology, crop rotations, integrated pest and weed management, balanced fertilization, responsible pesticidephytosanitary products usage and water management. AllIn addition, in 2023, we planted 73,606 hectares of cover crops. Cover crops help prevent water and wind erosion, function as biological fallows, reduce the need to apply phytosanitary products and provide roots that increase soil porosity. We sow these crops and adapt the species to the agro-ecological environmental condition.
These best practices aim to increase resource efficiency and to decrease the risk of contamination and waste production and are consolidated into an environmental management plan, which includes biodiversity management when applicable. We aim to properly implement our sustainable production model to enhance land productivity and therefore increase land value. With respect to pesticidephytosanitary products contamination risks, we are implementingimplement a responsible pesticidephytosanitary products use program, which includes personnel training, personnel protection elements, application recommendations, pesticidephytosanitary products selection criteria, pesticidephytosanitary products handling and storage and after-use pesticidephytosanitary products packages management (which are specifically cleaned, collected and stored for recycling purposes under third parties’third-party programs). In 2021, we began to implement the “Environmental Impact Quotient” indicator, which allows us to assess the potential risk of the application of phytosanitary products and the impact caused by them. Further, in 2023, we used selective spray equipment in 11,999 hectares to reduce the doses of phytosanitary products and apply them only where necessary, which resulted in a 73% reduction in the application of phytosanitary products in those areas. In addition, we periodically train our personnel in our rice fields to raise awareness about the responsible use of phytosanitary products.
Additionally, in some regions where biodiversity matters are relevant, we are implementingimplement biodiversity management plans, which mainly consists of periodically monitoring flora and fauna, detecting significant variations of their populations, and proposing measures to reduce any potential threats to local species. As a result, we are implementing some practices such as prohibitingprohibit hunting on our farms developingand create environmental private protection areas (where natural vegetation is protected by implementing sustainable production practices). As environmental matters require specific expertise and an understanding of complex relationships, we hire highly qualified consultants , and are enteringenter into cooperative arrangements and agreements with educational institutions.
In Brazil, we have the Brazilian ForestryForest Code (Có(Código Florestal Brasileiro) asBrasileiro) is the main source forof our environmental policies. Accordingly,guidelines. In accordance with the Brazilian Forest Code, we analyze and identify all natural areas insidewithin our own farms and insidewithin leased areas and makedraw up a development plan that defines actions for their preservation. Some examples of these activities are the reforestation of Permanent Preservation Areas (Áreas de Preservación Permanente) and Legal Reserve Areas (Áreas de Reserva Legal), Along with natural regeneration techniques, we have produced seedlings of more than 70 native species to reforest those areas. We are strongly committed to the preservation ofpreserving forests and we only develop areas for farmingagriculture if they werehave previously been used for agricultural purposes or for pasture.purposes. We do not operate in massive forests, permanent preservation areas, legal reserves, large wetlands or areas with high biodiversity value. We concern ourselvesare concerned with the protection of riverbanks and the surrounding areas of streams and springs, as they are important for soil conservation and as refuges for native fauna. In that regard, we are implementingcarry out periodic monitoring of wildlifenative fauna and native flora as well.
and water resources. In respect ofto our industrial processing activities, we focus on energy-efficient processes that increasesincrease productivity with minimum waste disposal. At the same time, we constantlyseek to promote the re-usereuse of any by-product or residue within the industrial processes when feasible, or in the fields when theirthe economic analysis make sense.is sensible. A successful example of this approach is the use of manure to produce electricity and the use of bio fertilizersbiofertilizers to grow crops in our Dairy Farm.dairy farms. Another successfulsuccess story is the use of all Sugarsugar and Ethanolethanol industrial by-products (vinasse, filter cake and composted ashes) as bio fertilizersbiofertilizers in our cane fields.
Since November 2017, we are producinghave produced renewable electricity from our bio-digesterbiodigester built in our Dairy Farm.dairy farm. The bio-digesterbiodigester transforms cow manure into biogas with high methane content, which then fuels a cogeneration facility that generates 1.4 MW of Power.electricity. The electricity produced is sold to the grid under a long-term contract with an ArgentineanArgentine federal utility. Additionally, as this project allows us to reduce GHGgreenhouse gas emissions, we have registered the project under the VCS (Verified
Verified Carbon Standard)Standard to deliver carbon credits from the bio-digester.biodigester. In 2011, we received a grant from the Sustainable Energy and Climate Change Initiative fromof the Inter-American Development Bank (SECCI) in order to carry out the pre-feasibility assessment. We have also received a grant from the “AgenciaNational Agency of Scientific and Technologic Promotion (Agencia Nacional de Promoción Científica y Tecnologica”Tecnológica), an agency whichthat promotes technological innovation, to partially fund the investment. In July 2016, we participated ofin Argentina’s “RenovAr” renewable energy auction and entered into a 20-year contract to supply up to 9,145 MWh per year at an average price of US$158.92 per MWh plus bonifications. At UMA,bonuses. Our first biodigester generated around 8,600 MWh of renewable energy last year. In 2023, we have implemented a pilot plant that produces biogas from vinasse, developedalso inaugurated our second biodigester in partnership with Efficiencia, a subsidiaryour free stalls. The incorporation of Companhia Energética de Minas Gerais (“CEMIG”). The technology developed during this project willsecond biodigester is expected to allow us to generate additional energy from vinasse while maintaining the fertilizer recycling potentialprocess a higher volume of UMA. We have replicated this project under a Commercial scale incow manure, and double our Clustergeneration of bioelectricity, thereby contributing to our sustainable development model.
At Usina Ivinhema, in Mato Grosso do Sul, (Brazil). Currently, we are fine-tuningproduce biogas from concentrated vinasse, a by-product of ethanol production. We purify biogas to produce biomethane and use it as fuel in our internal fleet, in line with the production process in orderSustainable Development Goals published by the United Nations, which ask all countries to enhance efficiency. Once the technology start working accordingly, we may expand the capacity in orderguarantee access to maximize the production of biogas in the Cluster.clean and affordable energy, among other objectives. These emission reduction projects could alsoare expected to improve our efficiency by decreasingand thereby reduce
carbon emissions. In 2021, we certified our biogas unit as the first renewable gas plant in Brazil, which allows us to issue and sell carbon emission.credits (gas-recs). Since 2020, we have issued CBios under the RenovaBio program, becoming the first company in Brazil to do so in the local markets. In 2023, we sold more than 443,000 CBios. The better the environmental performance of our operations, the greater the number of CBios we could issue, which drives us to enhance our performance year after year.
Social Programs
Apart fromIn addition to complying with local labor regulations, we seek to promote the personal and professional development of our employees by offering them an adequate working environment with proper health and safety protections. We aim to develop a transparent relationship with local authorities. Finally, one of our main goals is to contribute positively to the social development of the communities in which we operate, creating new jobs, preserving the environment, providing training opportunities through our internship program and assisting with social development. In order to implement our social development programs, we analyze the areas in which we operate and give special attention to education and poverty rates, possible alliances with other social actors, and potential synergies with local government programs. In addition to social development programs, we contribute to community organizations in each area where we operate, such as hospitals, schools, daycare centers and fire stations, among others. WeIn Argentina, we also have a voluntary matching program where Adecoagro matches each donation from our employees at a 2:1 ratio.
Education
Our sugarcane and ricemain initiatives are aligned with the United Nations’ Sustainable Development Goal 4 – Quality Education. Our operations have a very importantsignificant economic impact in the communities where we are located, and we have developed a Social Action Programsocial action program in the various municipalities. In 2005, we started a partnership with Cimientos, in Corrientes, Santa Fe, Santiago del Estero and Entre Rios in Argentina, through which we have awarded 68 educational programs in 204 urban and rural schools located close to our rice operations. These programs benefit 30,528 students. Cimientos is a non-profit organization that promotes equal educational opportunities for children and youth from low-income families in Argentina. In 2023, we participated in Cimientos’ “Futuros Egresados” program, granting scholarships to 47 high-school students in Mercedes and Ita Ibate (Corrientes). In 2016, we started another program together with Conciencia (a local NGO)non-governmental organization) in which we support our employees’ children to complete their education. This new program began in Salta near to Los Guayacanes,In 2023, 21 high-school and 16 children participated. In 2017 we extended the program to the City ofhigher-education students from San Salvador where 18 children(Entre Ríos) and Las Lajitas (Salta) participated and between the two establishments we reached a total of 20 children in thethis program.
In 2019, we made a new alliance with the Reciduca Foundation with the aim of providing school scholarships (10) for young people from the community of Pilar to finish their secondary studies, expand their employment opportunities and promote environmental care. We have supported the program since its inception, and in 2022, we decided to include the community of San Isidro as well, increasing the total number of scholarships granted to 20, which we maintained in 2023.
Additionally, we have partnered with Fundação BradescoWe decided to restructure our participation in the Escola Nota 10 Project in the municipalities of Angélica, Ivinhema and Novo Horizonte do Sul, in Mato Grosso do Sul, Brazil, workingSul. Through the project, we had been providing didactic material for teachers and students and carried out trainings for teachers and educators in municipal public schools with the local municipalitiesgoal of improving basic education (1st to 3rd year). In 2023, we decided to restructure the program to offer better and stronger support for educators. We expanded the proposal so that teachers can become protagonists in education, improving their teaching skills and keeping their pedagogical practices up to date.
Moreover, we participated in the Território do Saber project with the objective of improving the quality of teaching and learning processes in schools by promoting reading. In 2023, we inaugurated a new municipal library in Angélica (Minas Gerais) with a collection of over 800 books that is accessible by more than 350 students and Ivinhema to re-train teachers at their schools, aiming to improve the performance of public schools to a level of regional excellence. We also have partnerships to encourage the habit of reading through the training of teachers of municipal schools as storytellers and investment in libraries.
Nutrition
In Argentina, we work in partnership with two main organizations: the Conin Foundation whichand the Argentine Food Bank Network. The Conin Foundation fights malnourishment in children, focusing its actions in three main aspects:areas: education, assistance and research. In 2020, we donated nearly 308 tons of rice and milk. We also work in partnership with theThe Argentine Food Bank Network to whom we are currently donating approximately 48 tons of processed rice. This network operates in 17 cities and is a nonprofitnon-profit distribution enterprise that serves the community by acquiring donated food and making it available to people who are hungryin need through a network of community agencies. These agencies include school feeding programs, food pantries, soup kitchens, hospices, substance abuse clinics, after-school programs and other nonprofitnon-profit organizations. In 2023, we donated nearly 141 tons of rice and dairy products to more than 70 organizations, including 11 Conin centers and eight food banks.
Additionally, since 2007 we have been contributing food tocollaborated with local organizations such as Solidagro, an alliance between rural corporate institutions and civic organizations that seek to solve famine and malnutrition problems, since 2007.to which we donate our rice on a monthly basis. We are also collaboratingcollaborate with selected soup kitchen initiatives such as Caritas, CONIN.Haciendo Camino, a non-governmental organization fighting malnourishment in children in Santiago del Estero. We have supported the organization for the last several years and made contributions to finance the early childhood program in Los Juries, which reached 60 children in 2023.
Additionally,Prevention of Violence
We seek to train leaders and teams on this topic to understand all aspects of workplace violence. Our “Proteger” program aims to prevent violence, as it seeks to guide and inform employees and the community about possible ways to report and prevent sexual abuse, the exploitation of children and adolescents, rape culture, violence against women and sexual or workplace harassment, while mobilizing society to contribute to this effort.
This program reinforces the idea that we do not accept, under any circumstance, the practice of any type of child labor, including by third-party suppliers and others with whom we may interact. In 2023, 5,329 employees participated in 2019 we agreed on a newan awareness campaign together with a basketball club into combat sexual abuse and the provinceexploitation of Corrientes, Argentina. The campaign was called “Festejá cada punto vale triple” (Celebrate, each pointchildren and adolescents.
It is worth triple). With this campaign for each pointnoting that in 2021, we received the basketball team scores during this season, Adecoagro will donate 3 kilosWoman-Friendly Company Seal (from the Mato Grosso do Sul government), in recognition of riceour practices to the Conin Foundation centers locatedprevent and combat violence within the provincescope of Corrientes. In December 2019, we provided 15 tons of rice to these centers.
Seamos Uno
In connection with the COVID-19 pandemc, we support Seamos Uno, a special campaign that delivered one million boxes of food and hygiene items in the Buenos Aires suburbs and in the Citi of Buenos Aires. This social program brought together companies, non-profit organizations and religious associations. In this effort 1,035,699 families receive this aid and assistance. Adecoagro contributed the following:
•25 thousand liters of milk,
•50 thousand kilos of rice,
•4.1 million kilograms of food delivered at low prices,
•A person from our team dedicated full time for 6 months as Supply Coordinator for the campaign,
•Invitation to our personnel to participate in the project: for each box donated to Seamos Uno by an employee, we donated two additional boxes. As a result, $1,814,524 were raised and 76 employees joined the campaign.
In Brazil, we support several local schools, kindergartens, homes for the elderly and APAEs (local associations to support seriously deficient in the community) with financial investment and training to improve social management. Because of these initiatives, ABRINQ Foundation as Child Friendly Company certified the Monte Alegre unit.
Internship and Young Talent Program
The purpose of our internship and young talent program is to promote the development of highly qualified professionals forfrom the community by providing first-time work experience, good qualitygood-quality training and access to highly technology-oriented operations. We seek to facilitate interns’ future access to the job market while detecting potential key employees. The interns actively participate in the TAG training program, which includes monthly technical meetings, external training and farm tours. In order to accomplish these goals, we promote institutional relationships with local and international universities and high schools. Over 331In 2023, 158 interns haveand young talents participated in our program, during the last 15 years,40 of which 94 were subsequently incorporated into our teams.
Material Agreements
For a description of the material agreements relating to our indebtedness, please see “Item 5.-Operating5. Operating and Financial Review and Prospects-B.Prospects— B. Liquidity and Capital Resources-IndebtednessResources—Indebtedness and Financial Instruments.”
Argentina
Consignment Contract with Establecimiento Las Marías
Our subsidiary, Pilaga S.A. entered into a consignment contract dated February 19, 2000, with Establecimiento Las Marias S.A.C.I.F.A. pursuant to which Las Marias was granted exclusive license to sell the products or imports of Pilagá S.A. in Argentina. For its services, Las Marias collects a commission of 9.56%, calculated over the gross amounts of the sales made by Las Marias on behalf of Pilagá S.A., net of commercial discounts, before VAT and any other applicable tax that is applied in any invoicing. This Agreement was mutually terminated on July 11, 2019 with effects as of December 31, 2019.
Brazil
Sugar Sale Agreements
In 2020,2023, our largest three customers in this segment comprised approximately 72%79% of our sugar sales agreements. Adecoagro Vale do Ivinhema S.A. (via Adecoagro Uruguay S.A.) entered into sugar sales agreements with Louis Dreyfus Commodities Suisse S.A, Engelhart Commodities Trading Partners (formerly known as BTG Pactual Commodities) andS.A., Viterra B.V. (formerly known as Glencore Agriculture B.V.), and BTG Pactual, pursuant to which Adecoagro Vale do Ivinhema S.A. agreed to supply approximately 445,000559,000 metric tons of Brazilian VHP (very high polarization).sugar. This specific amount of sugar was delivered during the 2020 harvest year2023 harvest-year in Paranaguá port, and the price was fixed in reference to the ICE Sugar N°11#11 Futures.
Electric Energy Agreements
In Adecoagro Vale do Ivinhema S.A. entered into an agreement for the sale of energy to CCEE. This agreement is athe result of a public auction by the Brazilian federal government conducted in AugustMay 2008, carries a term of 15 years, and requires Adecoagro Vale do Ivinhema S.A. to supply CCEE with 87,600 MWh annually during the harvest periodsperiod each year (April to December), at a rate of R$196.41/363.94/MWh. The price of energy under the contract is adjusted annually according to inflation.
In August 2010, Adecoagro Vale do Ivinhema S.A. participated in a public auction by the Brazilian federal government. As a result of this auction, Adecoagro Vale do Ivinhema S.A. entered into a second 15-year agreement with CCEE starting in 2011, for the sale of 131,400 MWh per year at a rate of R$265.03/325.44/MWh.
In August 2013, Adecoagro Vale do Ivinhema S.A. participated in another public auction by the Brazilian federal government. As a result of this auction, Adecoagro Vale do Ivinhema S.A. entered into a second 25-year agreement with CCE starting in 2018, for the sale of 87,600 MWh per year at a rate of R$239.66/MWh.
Intellectual Property
As of April 2021, our corporate group2024, we owned 3856 trademarks registered with the Argentine National Intellectual Property Institute, 28 trademarks registered in Brazil and had 11 trademarks in the process of registration. Also, Adeco Brasil and UMA owned 17 trademarksone patent registered with the Brazilian National Industrial Property Institute (“INPI”), and had submitted 10 trademark registration requests, all of which are currently being challenged by third parties or were initially denied by INPI. In addition, Adeco Agropecuaria Brasil S.A. had submitted one trademark for registration. Agroglobal S.A. (now. Adecoagro Uruguay S.A.) has one trademarkfour trademarks registered in Uruguay.
In Argentina, we are required to renew our trademark registrations when they expire at the end of their respective terms. Under the Argentine Trade and Service Marks Law No. 22,362, the term of duration of a registered trademark is 10 years from its issue date, and a trademark may be indefinitely renewed for equal periods thereafter if, within the five-year period prior to each expiration, the trademark was used in the marketing of a product, in the rendering of a service or as the designation of an activity.
In Brazil, title to a trademark is acquired only once its valid registration has been issued by the INPI. During the registration process, the person requesting the trademark merely has an expectation of the right to use the trademark to identify its products or services. Under Law No. 9,279, of May 14, 1996 (the Brazilian Industrial Property Law), the holder of a trademark has the right to its exclusive use throughout Brazil. The term of duration of a registered trademark is 10 years from its issue date, and a trademark may be indefinitely renewed for equal periods thereafter. Within a five-year period from the issue date, the owner has an obligation to use the trademark in the marketing of a product, in the rendering of a service or as the designation of an activity. If the owner does not use the trademark within such a five-year period, it may be subject to a forfeiture process, upon request of any third party with legitimate interest in the trademark. The same forfeiture process may occur if the owner fails to use the trademark continuously for any five-year period, continuously.period. If the trademark is declared forfeited, the trademark rights are terminated.
Insurance
The type and level of insurance coverage we obtain is determined based on consultation with leading insurance brokers. We carry policies with leading U.S., European, and local insurance companies, and we are currently insured against a variety of risks, including losses and damages relating to our plants, equipment and buildings. We believe our level of insurance coverage is customary and appropriate for a company of our size and with respect to our activities. Our insurance currently covers only part of the losses we may incur and does not cover losses on crops due to hail storms, fires or similar risks.
Legal and Administrative Proceedings
In the ordinary course of business, we are subject to certain contingent liabilities with respect to existing or potential claims, lawsuits and other proceedings, including those involving tax, social security, labor lawsuits and other matters. We accrue liabilities when it is probable that future costs will be incurred and such costs can be reasonably estimated. See “Item 8. Financial Information-A.Information —A. Consolidated Statements and Other Financial Information-LegalInformation—Legal and Administrative Proceedings.”
Environmental Regulations and Compliance
Our businesses in the various emerging market countries in which we operate are subject to comprehensive national, state and municipal laws and regulations relating to the preservation and protection of the environment to which those businesses must adhere. These laws and regulations require some of our businesses to obtain permits or licenses that have to be renewed periodically in order to allow us to continue to operate. If such permits or licenses lapse or are not renewed or if we fail to obtain any required environmental licenses and permits, or if we do not comply with any other requirements or obligations established under the applicable environmental laws and regulations, we may be subject to finesadministrative, civil or criminal sanctions and might faceliability (including fines, partial or total suspension of our operations, and suspension or cancellation of our environmental licenses and permits.permits and indemnification and penalties for any damage caused). In
addition, our businesses whichthat hold debt fromwith banks, and multilateral lenders in particular, are typically required to adhere to environmental standards that exceed those of the country in which the business operates (e.g.such businesses operate (e.g., World Bank standards).
We are currently either in compliance with or are in the process of applying for permits that would put us in compliance with all applicable environmental laws and environmental licenses and permits. Specifically, the operational license of the UMA is valid having been issued onuntil September 5, 2016, valid2024 and authorizes us to mill up to 1.2 million tons of sugarcane per year. We intend to apply for 8 years. On June 10, 2014, we applied fora renewal of the renewal oflicense until May 5, 2024. Regarding the operational license for the Angélica mill, we have applied for a renewal on November 18, 2022, which have been issued onwas valid until March 29, 2019, authorizing2023 and authorizes us to mill up to 6.5 million tons of sugarcane per year, valid until March 28, 2023. On April 24, 2015, we obtained an installationyear. The operational license (licença de instalação) forof the Ivinhema mill authorizing her installation. Onis valid until July 23, 2015, we obtained the operational license (licença de operação) from IMASUL authorizing19, 2027, and authorizes us to mill up to 57.2 million tons of sugarcane per year. Currently, the operational license (licença de operação) of the Ivinhema mill is been renewed. The request was filed on March 20, 2019, and on December 03, 2019, we obtained an environmental declaration (declaração ambiental) valid for 12 months authorizing the grinding up to 7.2 million tons. In addition to the installation and operational license, the Ivinhema mill also obtained other permits includingand licenses for other matters such as water capture and gas station operation, among others.operation. Failure to obtain theany necessary environmental licenses may prevent us from operating the Ivinhema mill orand may subject us to sanctions.penalties and fines.
Our operating businesses have theuse or adhere to all required environmental monitoring, equipment and procedures, and we utilize third-party contractors to conduct regular environmental audits. Our environmental expenses relate to consultants that we use to perform environmental impact studies for our development projects and control and monitoring procedures. However, as environmental regulations are expected to become more stringent in some of the countries wherein which we operate, our
environmental compliance costs are likely to increase due to the cost of compliance with any future environmental regulations. While we are not aware of any material environmental liabilities related to our ongoing operations, we may be subject to cleanupclean-up costs, which we do not expect to be material.
Regulation and Control of Agri-Food Production in Argentina
The National Office of Agricultural Commerce Control (Oficina Nacional de Control Comercial Agropecuario, or “ONCCA”) created on November 27, 1996, as a decentralized entity of the Ministry of Agriculture was the agency responsible for controlling the commercialization and manufacturing of agricultural livestock, meat and dairy products in Argentina.
As of February 25, 2011, the ONCCANational Office of Commercial Agriculture and Livestock Control (“Oficina Nacional de Control Comercial Agropecuario” or “ONCCA”) was dissolved pursuant to Decree No. 192/2011. The facultiespowers previously held by the ONCCA have beenwere transferred to the Ministry of Agriculture, Livestock and Fishing (Ministerio de Agricultura, Ganadería y Pesca, or the “Ministry of Agriculture”) of Argentina and to an entitythe Internal Consumer Subsidy Coordination and Evaluation Unit (Unidad de Coordinación y Evaluación de Subsidios al Consumo Interno or “UCESCI”,“UCESCI,” after its acronym in Spanish), an entity created by means of Decree No. 193/2011. Such entity was then dissolved by means of Decree No. 444/2017, which provided thattransferred the powers granted to the former UCESCI will be carried out byto the Ministry of Agriculture. As a result, the Ministry of Agriculture is the enforcement authority ofresponsible for enforcing the decrees issued by the ONCCA andONCCA. After the distribution of tasks established in Decree No. 8/2023 issued on December 11, 2023, under the Administration of President Javier Milei, the Ministry of Economy is in charge of monitoring the agricultural compliance with the commercialization regulations. The Ministry Agriculture will be responsible forEver since, this entity is the administration, allocation and payment of subsidies for wheat, corn and soybean, and will beone in charge of promoting strategies to improve market access conditions for agricultural products, in coordination with other areas of the registry for the export of cattle.National Public Administration with competence in this area.
Under applicable regulations, all persons involved in the commercialization and manufacturing of grains and dairy products must be registered with the Registry of Operators of the Agro-industrial Chain (Registro (Registro Único de Operadores de la Cadena Agroindustrial or “RUCA” after its acronym in Spanish), which provides for the registration of any individual or company involved in the trade and industrialization of agri-foodfood products in the markets for grains, livestock and dairy products and their by-products and/orand derivatives, in the terms provided bypursuant to Resolution No. 302/2012, as amended, issued by the Ministry of Agriculture. This registration must be renewed each year.According to annex I of Resolution No. 21/2017, last amended by Resolution No. 117/2023 of the Federal Secretariat of Agriculture, Livestock and Fisheries, the RUCA has no expiration date, as long as the conditions and requirements established in connection with its granting and validity are met by the operator, and it complies with the obligations imposed by current and future regulations. Grain producers must stock grains at facilities and must keepmaintain a record of the grain stock stored at such facilities.facilities to be filed with the RUCA. Failure to register with the RUCA, or cancellation of such registration, will lead to requirements thatmay result in the operator cease itsceasing of operating activities by the operator and closure its facilities. Moreover, under the organizational chart approved by Decree No. 293/2024, RUCA is currently coordinated by the Undersecretariat for Agricultural Markets and International Negotiations. Agricultural companies may have additional registration obligations depending on the characteristics of grain purchase operations, such as the ones regulated for grain buyers in Resolution No. 438/2023 of the Secretariat of Agriculture, Livestock and Fishing.
On February 26, 2014, the AFIPPublic Income Federal Administration (“Administración Federal de Ingresos Públicos” or “AFIP”) issued Resolution No. 3,593/14, which came into forcebecame effective on April 1, 2014, and2014. This resolution established a Systematic Registration of Movements and GrainsGrain Stocks Regime ((Régimen de Registración Sistemática de Movimientos y Existencias de GranosGranos)) by, which requires all personsproducers involved in the commercialization and manufacturing of grains and dairy products registered within the RUCA mustto report the stock and stock variations (including locations, transporttransportation between the producer’sproducer facilities, etc.) of all grains other agricultural products (other than those to be applied to sowing) held in their ownby them or other third party’s name.
In the eventon behalf of a violationthird party.
Violations of any of the applicable regulations sanctions may be imposed,result in the application of sanctions, including fines, suspensions and suspension orthe cancellation of the registration, which wouldmay, in turn, result in thean immediate cessation of activities and closure of facilities.
On April 15, 2021, the Ministry of Agriculture issued Resolution No. 60/2021, which was published in the Official Gazette on April 19, 2021. This resolution specifies that dairy and grain exporters who did not register an establishment in the RUCA must provide additional information.
The Argentine Grain Stabilization Fund (Fondo Estabilizador del Trigo Argentino), created by Decree No. 132/2022 to contribute to the mitigation of the increase in the price per ton of grain bought by Argentine windmills as a result of the conflict between Russia and Ukraine, was repealed by Resolution No. 124/2024 of the Ministry of Economy, which revoked the relevant trust agreement and ordered the liquidation of this Fund.
Recent Developments
Farmland sale
In April 2024, the Company sold “La Pecuaria” farm, a 3,177 hectare farm located in Uruguay for an aggregate amount of US$ 20.7 million, collected in full at closing. This transaction will result in a pre-tax gain of US$ 5.7 million included in the line item “Other operating income”.
C.ORGANIZATIONAL STRUCTURE
Corporate Structure
We are a corporation organized under the laws of the Grand Duchy of Luxembourg under the form of a société anonyme.anonyme. As of April 27, 2021,2024, we held approximately 100% of the limited partnership interests in Adecoagro LP S.C.S., a société en commandite simple organized under LuxemburgLuxembourg law (representing 99.9999% of interests in Adecoagro LP S.C.S.) with a de minimis remainingthe unlimited partnership interest in Adecoagro LP S.C.S. (representing 0.0001% of interests in Adecoagro LP S.C.S.) being owned by Adecoagro GP S.à r.l, a société à responsibilité limitée organized under LuxemburgLuxembourg law and our substantially wholly-owned subsidiary. Adecoagro LP S.C.S. is a holding company with operating subsidiaries owning farmland and facilities throughout Argentina, Brazil and Uruguay. For a diagram of our Organizational structure as of April 20, 2018,2024, please see “Item 4. Information on the Company – Company—A. History and Development of the Company – Company—History.”
As of April 27, 20212024 our principal shareholders were Al Gharrafa Investment Company, Stichting Pensioenfonds Zorg en Welzijn, Route One Investment Co LP, EMS Capital LP, Directors, Executive Officers and Brandes Investment Partners LP.Company’s employees as a group and Grantham Mayo Van Otterloo & Co LL. See “Item 7. Major Shareholders and Related Party Transactions—A. Major Shareholders.”
D.PROPERTY, PLANTS AND EQUIPMENT
See “B. Business Overview—Land Transformation—Transformation Activities — Our Farms”; “—Property, Plant and Equipment.”
Item 4A. Unresolved Staff Comments
Not applicable.
Item 5. Operating and Financial Review and Prospects
Item 5 of this Annual Report on Form 20-F discusses the Company’s operating and financial review and prospects as of and for the fiscal years ended December 31, 20202023 and 2019. Item 5 “A.2022. For a discussion of the Company’s operating and financial review and prospects as of and for the fiscal years ended December 31, 2022 and 2021, see "Item 5. Operating and Financial Review and Prospects—A. Operating Results—Results of Operations--Year Ended For the year ended December 31, 2019 Compared2022, as compared to Year Endedyear ended December 31, 2018,2021,” Item 5 “Operating and Financial Review and Prospects—“—B. Liquidity and Capital Resources” and Item 5 Operating and Financial Review and Prospects—B. Liquidity and Capital Resources—Cash Flows—Cash Flows for the Year Ended December 31, 2019 Compared to Year Ended December 31, 2018”Resources,” included in our Annual Report on Form 20-F for the fiscal year ended December 31, 20192022 filed with the SEC on April 28, 202026, 2023 which are incorporated herein by reference.
Description of recent changes to our accounting policies
The Company has changed its accounting policy for the presentation of finance income/expenses. Until June 2020, the Company had elected not to segregate the impact of inflation on financial results. The company has decided to change its presentation policy and segregate the impact of inflation over financial results, considering the segregation of such effects provides reliable and more relevant information. Financial results will be presented reflecting interest and exchange difference, net of its inflation effects. This change represents only a reclassification within Financial results and does not have any impact on total financial results, net or net income. This change has been reflected in the comparative periods, thus, comparative figures have been restated. See Note 34 to our Consolidated Financial Statements.
Overview
We are engaged in agricultural, manufacturing and land transformation activities. Our agricultural activities consist of harvesting certain agricultural products, including crops (soybeans, corn, wheat, peanuts, sunflower, etc.), rough rice, and sugarcane, for sale to third parties and for internal use as inputs in our various manufacturing processes, and producing fluid milk. Our manufacturing activities consist of (i) selling manufactured products, including processed peanuts, sunflower rice, sugar, ethanol and energy, among others, (ii) since April 2019, in our acquired milk facilities we produce UHT and UP milk, powder milk and semi-hard cheese, among others; and (iii) providing services, such as grain warehousing and conditioning and handling and drying services, among others. Our land transformation activities consist of the acquisition of farmlands or businesses with underdeveloped or underutilized agricultural land and implementing production technology and agricultural best practices to enhance yields and increase the value of the land. Please seeSee also "“Item“Item 3. Key Information-D.Information—D. Risk Factors —Risks Related to Argentina-the
Argentine law concerningCountries in Which We Operate—Laws on the foreign ownership of rural properties may adversely affect our results of operations and future investments in rural properties in Argentina" and "“Item 3. Key Information-D. Risk Factors —Risks Related to Brazil- Recent changes in Brazilian rules concerning foreign investment in rural properties may adversely affect our investments."properties.”
We are organized into threetwo main lines of business: farming; land transformation;Farming; and sugar, ethanolSugar, Ethanol and energy.Energy. These lines of business consist of sixfour reportable operating segments, which are evaluated by the chief operating decision-maker based upon their economic characteristics, the nature of the products they offer, their production processes and their type and class of customers and distribution methods. Our farmingFarming business is comprised of fourthree reportable operating segments: Crops, Rice Dairy, and All OtherDiary Segments. Each of ourOur Sugar, Ethanol and Energy and Land Transformation linesline of business is also a reportable operating segment. Please see – See “—Operating Segments” for a discussion of our sixfour operating reportable segments.
There are significant economic differences between our agricultural and manufacturing activities. In addition to our agricultural activities, we perform manufacturing activities in the Crops (including peanut and sunflower products), Dairy, Rice and Sugar, Ethanol and Energy segments. Our other agricultural activities including those within Crops and All Other Segments do not involve further manufacturing processes. The table below sets forth our agricultural and manufacturing activities by segment.
| | | | | | | | | | | | | | |
| Segment | | Agricultural Product | | Manufactured Product and Services Rendered |
| Crops | | Soybean, Corn, Wheat, Sunflower and Peanuts among others | | GrainIndustrialized peanuts and sunflower, grain drying and conditioning |
| | | | |
| Rice | | Rough rice | | White rice and brown rice and snacks |
| | | | |
| Dairy | | Fluid milk | | UHT and UP milk, powder milk and semi-hard cheese, among others |
| | | | |
| Sugar, Ethanol and Energy | | Sugarcane | | Sugar, Ethanol and Energy |
Manufacturing Activities
The gross profit of our manufacturing activities is a function of our sales of manufactured products and services rendered and the related costs of manufacturing those products or delivering those services. We recognize an amount of revenue representing the actual dollar amount collected or to be collected from our customers. Our principal costs consist of raw materials, labor and social security expenses, maintenance and repairs, depreciation, lubricants and other fuels, among others. We obtain our raw materials principally from our own agricultural activities and, to a lesser extent, from third parties.
Agricultural Activities
Our agricultural activities involve the management of the biological transformation of biological assets into agricultural produce for sale to third parties, or into agricultural products that we use in our manufacturing activities. We measure our biological assets and agricultural produce in accordance with IAS 41 "Agriculture." IAS 41 requires biological assets to be measured on initial recognition and at each balance sheet date at their fair value less cost to sell, with changes in fair value recognized in the statement of income as they occur. As market prices are generally not available for biological assets while they are growing, we use the present value of expected net cash flows as a valuation technique to determine fair value, as further discussed below in "-Critical Accounting Policies and Estimates." lnNote 32 to our Audited Consolidated Financial Statements. In addition, agricultural produce at the point of harvest is measured at fair value less cost to sell, which is generally determined by reference to the quoted market price in the relevant market. Consequently, the gains and losses arising on initial recognition and changes in fair value of our biological assets and the initial recognition of our agricultural produce at the point of harvest are accounted for in the statement of income in the line item "lnitial"Initial recognition and changes in fair value of biological assets and agricultural produce."
After agricultural produce is harvested, we may hold it in inventory at net realizable value up to the point of sale, which includes market selling price less direct selling expenses, with changes in net realizable value recognized in the statement of income when they occur. When we sell our inventory, we sell at the prevailing market price and we incur direct selling expenses.
We generally recognize the agricultural produce held in inventory at net realizable value with changes recognized in the statement of income as they occur. Therefore, changes in net realizable value represent the difference in value from the last measurement through the date of sale on an aggregated basis.
We consider gains and losses recorded in the line items of the statement of income "lnitial"Initial recognition and changes in fair value of biological assets and agricultural produce" and "Changes in net realizable value of agricultural produce after harvest"
to be realized only when the related produce or manufactured product is sold to third parties and, therefore, converted into cash or other financial assets. Therefore, "realized" gains or losses mean that the related produce or product has been sold
and the proceeds are included in revenues for the year. Please see “–Critical Accounting Policies and Estimates – Biological Assets and Agricultural Produce”See Note 32 to our Audited Consolidated Financial Statements for a discussion of the accounting treatment, financial statement, presentation and disclosure related to our agricultural activities.
Land Transformation activities
TheOur Land Transformation segment includesactivities generally include two types of operations. The first relates to the acquisitionactivities. We generally acquire on of farmlands or businesses with underdeveloped or underutilized agricultural land (land which we have identified as capable of being transformed into more productive farmland by enhancing yields and increasing its future value). When we acquire a farmland business for an acquisition price below its estimated fair value, we recognize an immediate gain (a "purchase bargain gain"). The land acquired is recognized at its fair value at the acquisition date and is subsequently recorded under the revaluation model based on periodic, but at least annual, valuations prepared by an external independent expert.
The second typeWe also may realize the value of operation undertaken within this segment relates to the realization of valuefully developed and transformed farmland through thetheir strategic disposition of assets (i.e. farmland) that may have reached full development potential.disposition. Once we believe certain land has reached full growth potential, we may decide to realize such incremental value through the disposition of the land.
The results of these two activities (purchase bargain gains as a result of opportunistic acquisitions of businesses with underdeveloped or underutilized land below fair market value, and gains on dispositions reflecting the ultimate realization of cash value on dispositions of transformed farmlands) are included separately in the Land Transformation segment.segment of which farms operate (meaning rice or crops).
Land transformation activities themselves are not reflected in this segment; rather, they are reflected in all of our other agricultural activities in other segments. The results of our land transformation strategy are realized as a separate activity upon disposition of transformed farmlands and other rural properties.
A. OPERATING RESULTS
Trends and Factors Affecting Our Results of Operations
COVID-19
The global impact of the COVID-19 outbreak and measures taken to reduce the spread of the virus have had an adverse effect on the global macroeconomic environment, and may continue to create continued economic uncertainty and reduced economic activity. The outbreak has resulted in authorities implementing numerous measures to try to contain the virus, such as travel bans and restrictions, quarantines, shelter-in-place or total lock-down orders and business limitations and shutdowns.
The speed and extent of the spread of COVID-19, and the duration and intensity of resulting business disruption and related financial and social impact, are still uncertain, and such adverse effects on our business and financial position may still be material.
In Brazil, the government created a crisis committee to monitor the impact of COVID-19 in March 2020. Since then, it has announced several measures (tax and others) to address the effects of COVID-19. In this regard, the Brazilian health authorities, as well as several state and municipal authorities have adopted or recommended social distancing measures.
In Argentina, on March 20, 2020 the Argentine government implemented a social, preventive and mandatory isolation regime, prohibiting the circulation of people on routes, roads and public spaces (the “Mandatory Isolation Regime”) which has already been partially reverted as of the day of this report.
As of the date of this report, the activities pursued by our Argentine subsidiaries, related to agricultural production, distribution and commercialization, were exempted from the Mandatory Isolation Regime for being considered “essential” activities. Also our activities in Brazil have no restrictions.
Company measures
Since COVID-19 was declared pandemic by the World Health Organization, the Company committed to provide a safe environment for its employees and contractors, and immediately prepared measures and developed safety protocols to mitigate the eventual risk of being affected by the disease, and to prevent an uncontrolled spread of COVID-19 through the operations of its subsidiaries. Adecoagro has enacted Prevention and Action Protocols tailored for each facility and activity, in addition to constituting Crisis Committees.
Measures taken include but are not limited to: (i) body temperature controls at entrances of each facility and other critical check points, (ii) mandatory distancing in the workplace, (iii) maximum limit of people in the conferences rooms, lunch room and vehicles (iv) sanitary barriers, (v) special protective attire and masks, (vi) mandatory quarantines for those who have been in contact with travelers or with symptomatic persons, (vii) training programs and information about how to prevent the risks of transmission of COVID-19, (viii) hired an infectious disease specialist to further assess on site. Additionally, remote work has been guaranteed for the duration of the Pandemic for employees based in central offices, and a rotation scheme has been implemented for administrative employees based in the farms or industrial facilities.
All our businesses are operating without any major disruption both at the farm and industry levels. However, if the current situation deteriorates and infection rates increase, or a new wave of COVID-19 or other disease spreads, we may be affected in our operations and financial results. Our Sugar & Ethanol business has been negatively affected by the economic turmoil unleashed by the spread of COVID-19 in Brazil, in addition to the collapse in the international price of oil. Demand for ethanol has dropped 60% since March as a consequence of the lockdown, and might continue if the lockdown persists (see“Item 3. Key Information-D. Risk Factors —Risks Related to Our Business and Industries — Ethanol prices are correlated to the price of sugar and are also closely correlated to the price of oil, so that a decline in the price of sugar or a decline in the price of oil will adversely affect our sugar and ethanol businesses" and "We may be exposed to risks related to health epidemics, and the COVID-19 in particular, that could adversely impact our ability to operate our business and results of operations").Most of our businesses are operating without any major disruption both at the farm and industry level as well as on the road and at the ports. However, the demand of our products, mainly ethanol in Brazil, has been reduced as a consequence of the lockdown decided by the authorities in connection with the pandemic. Nevertheless, we are optimizing our production mix, in order to mitigate such reduction in demand.
The Company is closely monitoring the situation and taking all necessary measures at its disposal to preserve human life and its operation.
In the first six months of 2020, our Sugar, Ethanol and Energy business, experienced a decrease in prices of ethanol due to the decrease in international oil prices, and a decrease in demand as a consequence of the reduced circulation of people in response to the pandemic. In light of these factors, we slowed down our crushing pace, implemented a cost reduction plan and maintained the workforce sized to our operational needs. As signs of a partial recovery started to emerge, we revamped our operations and accelerated our crushing pace during the second semester, more than offsetting the lower initial crushing.
Given the uncertainty around the extent and timing of the future spread of COVID-19 or its variants and the imposition or relaxation of protective measures, it is not possible to predict the COVID-19’s effects on the industry, generally, and to reasonably estimate the long-term financial impact on the Company.
(ii) Effects of Yield Fluctuations
The occurrence of severe adverse weather conditions, especially droughts, hail, floods or frost, are unpredictable and may have a potentially devastating impact on agricultural production and may otherwise adversely affect the supply and prices of the agricultural commodities that we sell and use in our business. The effects of severe adverse weather conditions may also reduce yields at our farms (i.e. during April and November 2019 we suffered of drought in Mato Grosso do Sul, which had a major impact in sugarcane yields decrease for the year).farms. Yields may also be affected by plague, disease or weed infection and operational problems.problems, such as Spiroplasma disease, which may affect corn yield. During the 2023/2024 harvest season, due to climatic conditions in some of our productive regions, late corn production might be affected by this plague. See “Item—3. Key Information—D. Risk Factors—Risks Related to Our Business and Industries—Unpredictable weather conditions, including as a result of climate change, pest infestations and diseases may have an adverse impact on agricultural production.”
“La Niña” weather event
“La Niña” is a weather phenomenon caused by the fluctuation of the ocean temperatures in the central and eastern equatorial Pacific due to changes in the atmosphere, which affects the climate of several regions worldwide. When the temperature of the ocean decreases by 0.5°C below the five-quarter average, a so-called “La Niña” weather pattern begins. This weather phenomenon is characterized by below average precipitations during spring and summertime in South America. We have experienced this weather pattern in Argentina and Uruguay, where most of our Farming operations are based, throughout the last three consecutive years and it has extended its effects during the beginning of 2023, resulting in a severe drought in almost all productive regions in Argentina and Uruguay. Our diversification in terms of geographic footprint and crops planted (soybean, peanut, corn, wheat, sunflower, among others), acts as a natural hedge against weather risk, and enables us to adopt defensive strategies such as delaying planting activities and switching between crops which are either more resilient to dry weather or have a later development stage. However, and despite our ability to partially mitigate this effect, during 2023, as a consequence of the La Niña weather event, we foresee that the yields of our different crops had a reduction ranging from 18% to 60%, depending on the crop, thus significantly affecting our results of operations.
The following table sets forth our average crop, rice and sugarcane yields per hectare for the periods indicated:
| | | | 2019/2020 | | 2018/2019 | | 2017/2018 | | % Change | | 2022/2023 | | 2021/2022 | | 2020/2021 | | % Change |
| Harvest
Year | | | Harvest
Year | | 2022/2023 -2021/2022 | | 2021/2022 -2020/2021 |
Corn (1) | | Corn (1) | 4.7 | | | 5.9 | | | 5.7 | | | (20.3) | % | | 3.5 | % |
| Soybean | | Soybean | 1.8 | | | 2.5 | | | 2.5 | | | (28.0) | % | | — | % |
| | Harvest
Year (1) | | Harvest
Year (1) | | Harvest
Year (1) | | 2019/2020 -2018/2019 | | 2018/2019 -2017/2018 |
| Corn (2) | 6.0 | | | 6.5 | | | 4.9 | | | (7.7) | % | | 32.7 | % |
| Soybean | 2.7 | | | 3.2 | | | 2.5 | | | (15.6) | % | | 28.0 | % |
| Soybean (second harvest) | 2.0 | | | 1.4 | | | 1.2 | | | 42.9 | % | | 16.7 | % |
| Wheat (3) | 3.2 | | | 2.9 | | | 2.2 | | | 10.3 | % | | 31.8 | % |
Wheat (2) | |
Wheat (2) | |
Wheat (2) | | 2.3 | | | 3.0 | | | 2.8 | | | (23.3) | % | | 7.1 | % |
| Peanut | Peanut | 3.3 | | | 3.1 | | | 2.1 | | | 6.5 | % | | 47.6 | % | Peanut | 2.0 | | | 2.8 | | 2.8 | | | 3.0 | | 3.0 | | | (28.6) | | (28.6) | % | | (6.7) | % |
| Sunflower | Sunflower | 1.9 | | | 1.6 | | | 1.8 | | | 18.8 | % | | (11.1) | % | Sunflower | 1.8 | | | 1.7 | | 1.7 | | | 1.8 | | 1.8 | | | 5.9 | | 5.9 | % | | (5.6) | % |
| Rice | Rice | 6.7 | | | 5.9 | | | 6.9 | | | 13.6 | % | | (14.5) | % | Rice | 6.4 | | | 6.8 | | 6.8 | | | 7.8 | | 7.8 | | | (5.9) | | (5.9) | % | | (12.8) | % |
| Sugarcane (4) | 79.0 | | | 75.6 | | | 89.3 | | | 4.5 | % | | (15.3) | % |
Sugarcane (3) | | Sugarcane (3) | 79.7 | | | 66.5 | | | 68.6 | | | 19.8 | % | | (3.1) | % |
(1) This column reflects the full harvest season.
(2) Includes sorghum and chia.
(3)(2) Includes barley, rye, oats, chickpea and black pea.
(4)(3) Does not consider harvested area for planting activities.
(iii)
Effects of Fluctuations in Production Costs
We experience fluctuations in our production costs due to the fluctuation in the costs of (i) fertilizers, (ii) agrochemicals, (iii) seeds, (iv) fuel, (v) farm leases and (vi) labor. The use of advanced technology, however, allows us to increase our efficiency, in large part mitigating the fluctuations in production costs. Some examples of how the implementation of production technology has allowed us to increase our efficiency and reduce our costs include the use of no-till technology (also known as “direct sowing”,sowing,” which involves farming without the use of tillage, leaving plant residues on the soil to form a protective cover which positively impacts costs, yields and the soil), crop rotation, second harvest in one year, integrated pest management, and balanced
fertilization techniques to increase the productive efficiency in our farmland. Increased mechanization of harvesting and planting operations in our sugarcane plantations and utilization of modern, high pressurehigh-pressure boilers in our sugar and ethanol mills has also yielded higher rates of energy production per ton of sugarcane milled. In addition, we reuse all the waste from our sugar cane processing, which together with the ashes from the boilers, and the filter cake, undergo a composting process and are used as organic fertilizer to grow sugarcane, allowing us to reduce chemical fertilizer consumption, while contributing to the environment. We also use manure in our dairy farms to generate electricity with biodigesters.
(iv) Effects of Fluctuations in Commodities Prices
Commodity prices have historically experienced substantial fluctuation. For example, between January 1 2020,2023 and December 31, 2020,2023, sugar prices increased by 18.0%2.7%, according to Intercontinental Exchange of New York (“ICE-NY”) data, and ethanol prices increaseddecreased by 1.5%34.2%, according to Escola Superior de Agricultura “Luiz de Queiroz” (“ESALQ”) data. Also, based on Chicago Board of Trade (“CBOT”) data, from January 1, 20202023, and December 31, 2020,2023, soybean prices increased 39.5%decreased 14.3% and corn prices increaseddecreased by 24.8%30.5%. Commodity price fluctuations impactaffect our consolidated statementstatements of income, as follows:
•Initialthe initial recognition and changes in the fair value of biological assets and agricultural produce in respect of unharvested biological assets undergoing biological transformation;
•Changeschanges in net realizable value of agricultural produce for inventory carried at its net realizable value; and
•Salessales of manufactured products and agricultural produce to third parties.
The rapid and widening spread of the COVID-19 impacted the price of the products we sell (i.e.sugar, ethanol, corn, powder milk among others) due to the lower demand and economic activity worldwide. During the first quarter of 2020, sugar prices decreased by 20% according to ICE-NY, ethanol prices decreased 24% according to ESALQ and corn prices decreased by 12.1% based on CBOT. However, during the second semester of the year prices recovered reverting the downside .
The following graphs show the spot market price of some of our main products forbetween December 31, 2017 and December 31, 2023, highlighting the periods indicated:period between January 1 and December 31, 2023:
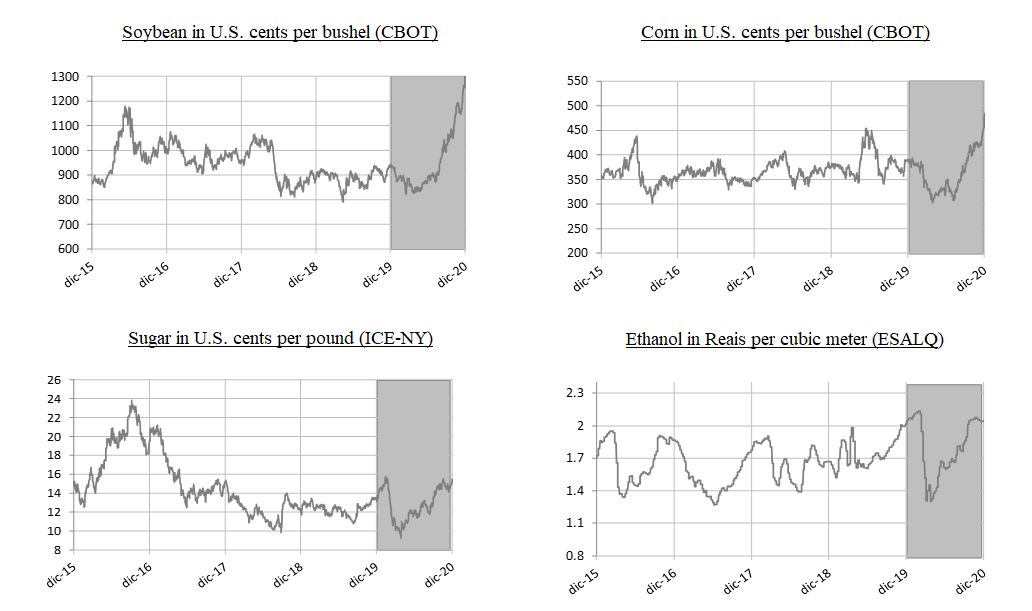
(v) (3) Source: ESALQ
Fiscal Year and Harvest Year
Our fiscal year begins on January 1 and ends on December 31 of each year. However, our production is based on the harvest yearharvest-year for each of our crops and rice. A harvest yearharvest-year varies according to the crop or rice plant and to the climate in which it is grown. Due to the geographic diversity of our farms, the planting period for a given crop or rice may start earlier on one farm than on another, causing differences for their respective harvesting periods. The presentation of production volume (tons) and production area (hectares) in this report in respect of the harvest yearsharvest-years for each of our crops and rice starts with the first day of the planting period at the first farm to start planting in that harvest yearharvest-year to the last day of the harvesting period of the crop or rice planting on the last farm to finish harvesting that harvest year.
On the other hand, production volumes for dairy, processed rice and production volume and production area for sugar, ethanol and energy business, are presented on a fiscal year basis.
Thealong with the financial results in respect of all of our products are presented on a fiscal yearfiscal-year basis.
(vi) Effects of Fluctuations of the Production Area
Our results of operations also depend on the size of the production area. The size of our ownowned and leased area devoted to crop, rice and sugarcane production fluctuates from period to period in connection with the purchase and development of new farmland, the sale of developed farmland, the lease of new farmland and the termination of existing farmland lease agreements. Lease
agreements are usually settled following the harvest season, from July to September for crops and rice, and from May to April for sugarcane. The length of the lease agreements is usually one year for crops, one to five years for rice and five to sixseven years for one-cycle sugarcane or twelve to fourteen14 years for a two-cycle of sugarcane. Regarding crops, the production area can be planted and harvested oneonce or two timestwice per year. As anFor example, wheat can be planted in July and harvested in December. Right after its harvest,Once harvested, soybean can be planted in the same area and harvested in April. As a result, planted and harvested areaareas can exceed themaximize their production area during onein any given year. The production area for sugarcane can exceed the harvested area in one year. Grown sugarcane can be left in the fields and then harvested the following year.
The following table sets forth the production area for the periods indicated:
| | | |
| | | | Year ended December 31, | |
| | | 2020 | | 2019 | | 2018 | | Chg (%) 2020-2019 | | Chg (%) 2019-2018 | 2023 | | 2022 | | 2021 | | Chg (%) 2023-2022 | | Chg (%) 2022-2021 |
| | | | | Hectares | | | | |
Crops (1) | Crops (1) | 161,705 | | | 152,976 | | | 153,970 | | | 5.7 | % | | (0.6) | % |
Crops (1) | |
Crops (1) | | 194,225 | | | 194,236 | | | 176,825 | | | — | % | | 9.8 | % |
| Rice | Rice | 41,544 | | | 40,417 | | | 40,289 | | | 2.8 | % | | 0.3 | % | Rice | 58,452 | | | 60,857 | | 60,857 | | | 44,282 | | 44,282 | | | (4.0) | | (4.0) | % | | 37.4 | % |
| Sugar, Ethanol and Energy | Sugar, Ethanol and Energy | 176,651 | | | 166,041 | | | 153,690 | | | 6.4 | % | | 8.0 | % | Sugar, Ethanol and Energy | 198,747 | | | 192,987 | | 192,987 | | | 185,806 | | 185,806 | | | 3.0 | | 3.0 | % | | 3.9 | % |
(1) Does not include second crop and forage area.
The increase in Crop production area in 2020 is explained by the increase in leased area included in our rotation model that has a higher mix of peanut and sunflower area in the current harvest season. The increase in sugar, ethanol and energy production area in 20202023 is explained by thean increase in the leased hectares that provide sufficient canespace to ensure the sufficiency of our sugarcane supply forduring the entire year in accordance with theour long-term growth plan of the company.plan.
(vii) Effect of Acquisitions, dispositions and land transformation
Our business model includes the transformation of pasture and unproductive land into land suitable for growing various crops and the transformation of inefficient farms into farms suitable for more efficient uses through the implementation of advanced and sustainable agricultural practices, such as "no-till" technology and crop rotation. During approximately the first three to five years of the land transformation process of any given parcel, we must invest heavily in transforming the land, and, accordingly, crop yields during such period tend to be lower than crop yields once the land is completely transformed. After the transformation process has been completed, the land requires less investment, and crop yields gradually increase. As a result, there may be variations in our results from one season to the next according to the amount of land in the process of transformation.
Our business model also includes the identification, acquisition, development and selective disposition of farmlands or other rural properties that after implementing agricultural best practices and increasing crop yields, we believe have the potential to appreciate in terms of their market value. As a part of this strategy, we purchase and sell farms and other rural properties from time to time. Please see also “Risk Factors—Risks Related to Argentina-Argentine law concerning foreign ownership of rural properties may adversely affect our results of operations and future investments in rural properties in Argentina” and “Risk Factors—Risks Related to Brazil—Changes in Brazilian rules concerning foreign investment in rural properties may adversely affect our investments.” included in “Item 3. Risk Factors”.
The results included in the Land Transformation segment are related to the acquisition and disposition of farmland businesses and not to the physical transformation of the land. The decision to acquire and/or dispose of a farmland business depends on several market factors that vary from period to period, rendering the results of these activities in one financial period when an acquisition of disposition occurs not directly comparable to the results in other financial periods when no acquisitions or dispositions occurred.
Our results of operations for earlier periods that do not include a recently completed acquisition or do include farming operations subsequently disposed of may not be comparable to the results of a more recent period that reflects the results of such acquisition or disposition. During 2020 we sold 811.7 hectares for a total consideration of $12.1 million in connection with the partial disposition of the "Abolengo" farm "Abolengo", located in Argentina's humid Pampas; and we also sold 4,633 hectares in connection with the disposition of "Huelen farm", located in the Province of La Pampa, Argentina, for a total consideration of $30.1 million of which $10.1 million were collected at the closing date.
(viii) Macroeconomic Developments in Emerging Markets
We generate nearly all of our revenue from the production of food and renewable energy in emerging markets. Therefore, our operating results and financial condition are directly impacted by macroeconomic and fiscal developments, including fluctuations in currency exchange rates, inflation and interest rate fluctuations, in those markets. The emerging markets where we conduct our business (including Argentina, Brazil and Uruguay) remain subject to such fluctuations. See “Item 3. Key Information—D. Risk Factors—Risks Related to the Countries in Which We Operate—Our results of operations and financial condition are dependent upon economic conditions in the emerging countries in which we operate” and “—Economic and political conditions in the countries in which we operate, and the perception of these conditions in international markets, may adversely impact our business, our access to the capital and debt markets, and our results of operations and financial condition.”
Please referMoreover, economic conditions of the countries in which we operate may be impacted by inflation over domestic prices, which may result in higher costs and affect our revenues. High inflation rates may undermine the conditions that allow us to Item 4 - grow in those countries and induce to macroeconomic volatility, affecting overall competitiveness, increasing social and economic inequality, reducing employment, consumption and the level of economic activity and undermining confidence in the
banking system, which could further limit domestic and international credit availability. In 2023, inflation in local currency in Argentina, Brazil and Uruguay was 211.4%, 4.6% and 5.11%, respectively. We present our results of operations adjusted by the effect of hyperinflationary accounting policies and translation for our Argentine operations according to IAS 29 (see “Presentation of Financial and Other Information—Financial reporting in a hyperinflationary economy). For further detail on the impact of inflation, see “Item 3. Key Information—D. Risk Factors—Risks Related to the Countries in Which We Operate—Inflation in some of the countries in which we operate, along with governmental measures to curb inflation, may have a significant negative effect on the economies of those countries and, as a result, on our financial condition and results of operations.”
In addition, government policies enacted in the countries in which we operate may have a material impact, or could materially affect, the Company’s operations. See “Item 3. Key Information—D. Risk Factors—Risks related to Our Business and Industries—Governmental policies reducing the amount of ethanol required to be added to gasoline, or eliminating tax incentives for flex-fuel vehicles, may adversely affect our business” and “—Our business is subject to significant governmental regulation, which may adversely affect our results of operations and financial condition.” See also “Item 4—Information abouton the Company -Company—B. Business Overview - COVID-19,Overview—Recent Developments,” for additional information concerning the COVID-19 pandemic. See also "“Item 3. Key Information-D. Risk Factors — Risk related to Argentina — The measures taken or to be implemented by the Argentine government in response to the COVID-19 pandemic may have an adverse effect on our business and operations.” and “We may be exposed us to risks related to health epidemics, and the COVID-19 in particular, that could adversely impact our ability to operate our business and results of operations.” and “The measures taken or to be implemented by the Brazilian government in response to the COVID-19 pandemic may cause adverse effect on our business and operations.”macroeconomic events.
(ix) Effects of Export Taxes on Our Products
Following the economic and financial crisis experienced by Argentina in 2002, the Argentine government increased export taxes on agricultural products.
Since December 2015, the only product that had remained subject to export taxes was soybean and its derivatives. However, in September 2018 due to economic volatility, the government imposed a 12% export tax on all goods exported from Argentina. A 12% export tax was imposed on the FOB export price of “primary product” goods (including agricultural goods), subject to a cap of four pesos (ARS 4) per U.S. dollar of the corresponding tax value or official FOB price for primary product goods. For all other products, the cap amount was fixed at three pesos (ARS 3) per U.S. dollar of the corresponding tax value or official FOB price. In December 2019, after a change in Argentina government administration,2023, export taxes were adjusted as per the following table:
| | | | | | | | |
| Product | Export tax | Cap per dollar exported |
| Soybean and derivatives | 33% | — | |
| Corn | 12% | — | |
| Wheat | 12% | — | |
| Peanut | 7%—% | — | |
| Sunflower | 5%—% | — | |
| Cotton | 5% | — | |
| Rice | 5%—% | — | |
| UHT Milk | 12% | $3/usd |
Powder Milk | 9%—% | — | |
| Powdered Milk | —% | — | |
| Cheese | 12%—% | $3/usd— | |
As local prices are determined by taking into consideration the export parity reference,references, any increase or decrease in export taxes would affect our results of operations.
(x) Effects of Foreign Currency Fluctuations
Each of our Argentine, Brazilian and Uruguayan subsidiaries usesuse local currency as its functional currency. A significant portion of our operating costs in Argentina are denominated in Argentine Pesos and most of our operating costs in Brazil are denominated in Brazilian Reais. For each of our subsidiaries’ statements of income, foreign currency transactions are translated into theto local currency, as such subsidiaries’ functional currency, using the exchange rates prevailing as of the dates of the relevant specific transactions. Exchange differences resulting from the settlement of such transactions and from the translation at year-end exchange rates of monetary assets and liabilities denominated in foreign currencies are recognized in the consolidated statement of income ("statement of income") under “finance income” or “finance costs,” as applicable. Our Consolidated Financial Statements are presented in U.S. dollars, and foreign exchange differences that arise in the translation process are disclosed in the consolidated statement of comprehensive income.
As of December 31, 2020,2023, the Argentine Peso-U.S. dollar exchange rate was Ars. 84.2Ps. 808.5 per U.S. dollar as compared to Ars. 59.9Ps. 177.1 per U.S. dollar as of December 31, 2019.2022. As of December 31, 2020,2023, the Real-U.S. dollar exchange rate was R$5.24.86 per U.S. dollar as compared to R$4.025.28 per U.S. dollar as of December 31, 2019.2022.
The following graph shows the Argentine Peso-U.S. dollar rate and the Real-U.S.real-U.S. dollar rate of exchange forbetween December 31, 2017 and December 31, 2023, highlighting the periods indicated:period between January 1 and December 31, 2023:
(1) Source: Bloomberg
Our principal foreign currency fluctuation risk involves changes in the value of the Brazilian Reais and the Argentine Peso relative to the U.S. dollar. Periodically, we evaluate our exposure and consider opportunities to mitigate the effects of currency fluctuations by entering into currency forward contracts and other hedging instruments.
(xi) Seasonality
Our business activities are inherently seasonal. We generally harvest and sell corn, soybean, rice, peanut and sunflower between February and August, and wheat from December to January. With the implementation of “continuous harvest”,the "continuous harvest method,” sugarcane production is more stable during the year; however, the typical harvesting period in Brazil begins between April and May and ends between November and December. Sales of ethanol are generally concentrated during off-season to capture higher seasonal prices. Sales in other business segments, such as in our Dairy segment, tend to be more stable. However, milk sales are generally higher during the fourth quarter, when weather conditions are more favorable for production. As a result of the above factors, there may be significant variations in our results of operations from one quarter to another, since planting activities may be more concentrated in one quarter whereas harvesting activities may be more concentrated in another quarter.compared to another. In addition, our quarterly results may vary as a result of the effects of fluctuations in commodity prices and production yields and costs related to the “Initial recognition and changes in fair value of biological assets and agricultural produce” line item. See “—Critical Accounting Policies and Estimates-Biological Assets and Agricultural Produce.”Note [32] to our Audited Consolidated Financial Statements.
(xii) Capital Expenditures and Other Investments
Capital expenditures totaled US$250.2 million, US$229.1 million and US$205.2 million for the years ended December 31, 2023, 2022 and 2021, respectively. Our capital expenditures during the last fivethree years consisted mainly of expenses related to (i) transforming and increasing the productivity of our land, (ii) planting sugarcane and (iii) expanding and upgrading our production facilities, in concordance to our 5-year plan presented in 2017. Capital expenditures (including both maintenancesuch as the acquisition of Uruguayan rice assets and expansion) totaled $219.7 million for the period ended December 31, 2018, $257.0 million for the period ended December 31, 2019; and $166.8 million for the period ended December 31, 2020. The decrease in 2020 compared to 2019 is primarily due to a 56.1% decrease in expansion capex year-over-year, concluding the investment cycle that started in 2017. See also “Capital Expenditure Commitments.”operations.
(xiii) Effects of Corporate Taxes on Our Income
We are subject to a variety of taxes on our results of operations. The following table shows the applicable income tax rates in effect for 2020:2023:
| | | | | |
| | Tax Rate (%) |
Argentina(1) | 3035 |
Brazil(2) | 34 |
| Uruguay | 25 |
| Spain | 25 |
| Luxembourg | 24.94 |
| Chile | 27 |
(1)IncludingIncludes the Social Contribution on Net Profit (CSLL)(Contribuição Social Sobre o Lucro Líquido).
Critical Accounting Policies and Estimates
We prepare our Consolidated Financial Statements in accordance with IFRS. The critical accounting policies are policies important to the portrayal of a company’s financial condition and operating results, and which require management to make difficult and subjective judgments that are inherently uncertain. Based on this definition, we have identified the following significant accounting policies as critical to the understanding of our Consolidated Financial Statements. The preparation of our Consolidated Financial Statements requires management to make estimates and assumptions that affect the reported amounts of assets and liabilities and disclosure of contingent assets and liabilities at the date of the financial statements and the reported amounts of expenses during the reporting periods. The principal area where our management is required to make significant judgments about estimates where actual results could differ materially from such estimates is in the carrying amount of our biological assets. These estimates and judgments are subject to an inherent degree of uncertainty. We believe that the estimates and judgments upon which we rely are reasonable based upon information available to us at the time that these estimates and judgments are made. We continually evaluate our judgments, estimates and assumptions. To the extent there are material differences between these estimates and actual results, our Consolidated Financial Statements will be affected.
The Company’s critical accounting policies and estimates are consistent with those described in Note 33 to our Audited Consolidated Financial Statements.
Biological Assets and Agricultural Produce
Before harvest, our crops are biological assets. Subsequent to harvest, biological transformation ceases and the harvested crops meet the definition of agricultural produce under IAS 41 “Biological Assets.” As prescribed by IAS 41, we measure growing crops which have not attained significant biological growth at cost less any impairment losses, which approximates fair value. Capitalized expenses for growing crops include land preparation expenses and other direct production expenses incurred during the sowing period including costs of labor, fuel, seeds, agrochemical and fertilizer, among others. We measure biological assets (at initial recognition, when the biological asset has attained significant biological growth, and at each subsequent measurement reporting date) and agricultural produce at the point of harvest at fair value less selling costs. The objective of the fair value model under IAS 41 is to recognize gains and losses arising from such measurements gradually over the asset’s life rather than only on sale or realization. IAS 41 prescribes, among other things, the accounting treatment for biological assets during the period of growth, degeneration, production and procreation, and for the initial measurement of agricultural produce at the point of harvest.
We account for agricultural produce after harvest as inventory, as further described below.
The following table sets forth the way in which we value biological assets and agricultural produce for each of our principal products:
| | | | | | | | | | | | | | | | | | | | | | | |
| Biological Asset | | | | |
| No significant
biological growth | | Significant
biological growth | | Agricultural Produce | | Manufactured Product |
| | | | | | | |
Crops | Crop from planting to approximately 60 days thereafter | | Crop, from approximately 60 days after planting up to the moment of harvest (total period of approximately 3 to 5 months). | | Harvested crop (soybean, corn, wheat, peanut, sunflower, etc.) | | Processed peanut and sunflower |
| | | | | | | |
Rice | Rice plant from planting to approximately 60 days thereafter | | Rice plant, from approximately 60 days after planting up to the moment of harvest (total period of approximately 3 to 4 months). | | Harvested rough rice | | Processed rice (white rice) and rice snacks |
| | | | | | | |
Dairy | Dairy cow is considered a biological asset from birth/purchase to death or sale. | | Fluid milk | | Processed milk (UHT milk, Powder milk, Cheese) |
| | | | | |
Cattle | Beef cattle are considered a biological asset from birth/purchase to death or sale. | | N/A | | N/A |
| | | | | |
Sugar, ethanol and energy | The produce derived from the sugarcane from planting or after harvest up to approximately 30 days thereafter | | The produce derived from the sugarcane, from approximately 30 days after planting until harvest (total period of 10 to 14 months) | | Sugarcane | | Sugar, ethanol and energy |
| | | | | | | |
Valuation Criteria | Cost, which approximates fair value less accumulated impairment losses, if any. For dairy and cattle, fair value less estimated cost to sell. | | Fair value (using discounted cash flow valuation) less cost to sell. | | Net realizable value, except for rough rice and milk which are valued at cost. | | Cost |
Gains and losses that arise from measuring biological assets at fair value less selling costs and measuring agricultural produce at the point of harvest at fair value less selling costs are recognized in the statement of income in the period in which they arise as “Initial recognition and changes in fair value of biological assets and agricultural produce.” We value our inventories of agricultural produce after harvest at net realizable value, except for rough rice, which is valued at cost.
When an active market exists for biological assets, we use the quoted market price in the most relevant market as a basis to determine the fair value of our biological assets, as in the case of cattle. For other biological assets where there is neither an active market nor market-determined prices during the growth cycle, we determine their fair value through the use of discounted cash flow valuation techniques. Therefore, we generally derive the fair value of our growing biological assets from the expected cash flow of the related agricultural produce. The discounted cash flow method requires the input of highly subjective assumptions, including observable and unobservable data. Generally, the estimation of the fair value of biological assets is based on models or inputs that are not observable in the market, and the use of unobservable inputs is significant to the overall valuation of the assets. Various factors influence the availability of observable inputs, including, but not limited to, the type of asset and its location, climate changes and the technology used, among others.
Unobservable inputs are determined based on the best information available, for example, by reference to historical information regarding past practices and results, statistical and agronomical information and other analytical techniques. Changes
in the assumptions underlying such subjective inputs can materially affect the fair value estimate and impact our results of operations and financial condition from period to period.
The DCF method requires the following significant inputs to project revenues and costs:
–Production cycles;
–Production area in hectares;
–Estimated crop and rice yields;
–Estimated sucrose content (Total Recoverable Sugar or TRS) for sugarcane;
–Estimated costs of harvesting and other costs to be incurred until the crops and rice reach maturity (mainly costs of pesticides, herbicides and spraying);
–Estimated transportation costs;
–Market prices; and
–Discount rates.
In contrast to biological assets whose fair value is generally determined using the DCF method, we typically determine the fair value of our agricultural produce at the point of harvest using market prices.
Market prices used in the discounted cash flow model are determined by reference to observable data in the relevant market (e.g., for crops and sugar). Harvesting costs and other costs are estimated based on historical and statistical data. Yields are estimated by our agronomic engineers based on several factors, including the location of the farmland, soil type, environmental conditions, infrastructure and other restrictions and growth at the time of measurement. Yields are subject to a high degree of uncertainty and may be affected by several factors out of our control, including but not limited to extreme or unusual weather conditions, plagues and other diseases. Discount rates reflect current market assessments of the assets involved and the time value of money.
As of December 31, 2020, the impact of a 5% increase (decrease) in estimated yields for sugarcane, with all other variables held constant, would result in an increase (decrease) in the fair value of our plantations less cost to sell of $8.0 million (for 2019 the fair value was $7.1 million). As of December 31, 2020, the impact of a 20% increase (decrease) in estimated yields for rice, with all other variables held constant, would result in an increase (decrease) in the fair value of our plantations less cost to sell of $8.6 million (for 2019 this fair value was $3.8 million) for crops and $7.3 million (2019: $6.2 million).
The significant assumptions discussed above are highly sensitive. Reasonable shifts in assumptions including but not limited to increases or decreases in prices, costs and discount factors used would result in a significant increase or decrease to the fair value of biological assets. In addition, cash flows are projected over a number of years and based on estimated production. Estimates of production in themselves are dependent on various assumptions, in addition to those described above, including but not limited to several factors such as location, environmental conditions and other restrictions. Changes in these estimates could materially impact on estimated production, and could therefore affect estimates of future cash flows used in the assessment of fair value , including the potential impacts of the COVID-19 on commodity prices used in the cash flow model.
The aggregate gains and losses arising during a period on initial recognition and from the changes in fair value less costs to sell of biological assets is affected by the way we treat our harvesting and production costs for accounting purposes. Since IAS 41 does not provide guidance on the treatment of these costs, we generally capitalize all costs directly involved with the management of biological assets. These costs may include labor, planting, fertilizers, agrochemicals, harvesting, irrigation and feeding, among others. Then, the cost of the biological asset is adjusted periodically by the re-measurement of the biological asset at fair value less cost to sell. For example, before significant biological growth is attained, costs and expenses are capitalized as biological assets, and once biological assets reach significant biological growth we adjust biological assets to fair value less cost to sell. Accordingly, capitalized biological assets are adjusted periodically at fair value less cost to sell. At the point of harvest, we recognize the agricultural produce at fair value less cost to sell. The periodic adjustments in fair value less cost to sell reflect period to period gains or losses. After agricultural produce is harvested, we may hold it in inventory at net realizable value up to the point of sale, which includes market selling price less direct selling expenses, with changes in net realizable value recognized in the statement of income as incurred. When we sell our inventory, we sell at the prevailing market price and we incur direct selling expenses.
We generally recognize the agricultural produce of crops held in inventory at net realizable value with changes recognized in the statement of income as they occur. Therefore, changes in net realizable value represent the difference in value from the last measurement through the date of sale on an aggregated basis.
We consider gains and losses recorded in the line items of the statement of income “Initial recognition and changes in fair value of biological assets and agricultural produce” and “Changes in net realizable value of agricultural produce after harvest” to be realized only when the related produce or manufactured product is sold to third parties and, therefore, converted into cash or
other financial assets. Therefore, “realized” gains or losses means that the related produce or product has been sold and the proceeds are included in revenues for the year.
The sale of agricultural produce is revenue as defined in IFRS 15 "Revenue from Contracts with Customers". However, IAS 41 does not provide guidance on the presentation of revenues and costs arising from the selling of biological assets and agricultural produce. Due to the lack of guidance in IAS 41 and based on IAS 1, “Presentation of financial statements,” we present, as a matter of accounting policy, our sales of biological assets and agricultural produce and their respective costs within the lines items “Sales of goods and services rendered” and “Cost of goods and services rendered.” See "Notes 4 and 5" to our Consolidated Financial Statements for a breakdown of sales and costs for goods sold and services rendered. The sale of agricultural produce and biological assets represents the consideration received or receivable for the sale to third parties based generally on the applicable quoted market prices of the respective produce or biological asset in the relevant markets at the point of sale. At the point of sale, our agricultural produce is measured at net realizable value, which reflects the sale price less the direct cost to sell, and our biological assets are measured at fair value less cost to sell, in each case, using the applicable quoted market prices in the relevant markets.
Based on the foregoing, the profit of our agricultural produce is recognized under the line ítems “Initial recognition and changes in fair value of biological assets and agricultural produce” and “Changes in net realizable value of agricultural produce after harvest.” When the agricultural produce is sold to third parties we do not record any additional profit as the gain or loss had already been recognized.
The profit of our manufactured products is recognized when they are sold. The cost of manufactured products includes, among others, the cost of agricultural produce transferred internally at fair market value (i.e. harvested sugarcane, rough rice, fluid milk, etc).
Fair Value of Farmlands and investment property
Property, plant and equipment
Farmlands are recognized at fair value based on periodic, but at least annual, valuations prepared by an external independent expert. A revaluation reserve is credited in shareholders’ equity. The valuation is determined using sales Comparison Approach. Sale prices of comparable properties are adjusted considering the specific aspects of each property, the most relevant premise being the price per hectare (See "Note 34.5 to our Consolidated Financial Statements"). 34.1
Investment property
Investment property consists of farmland for rental or for capital appreciation and not used in production or for sale in the ordinary course of business, and it is measured at fair value. The changes of the Fair value, which is based on an independent external expert, impacts the profit and loss of the period, in the line item Other operating income, net (See "Note 14 and Note 34.6 to our Consolidated Financial Statements)."
Impairment of non-financial assets
At the date of each statement of financial position, we review the carrying amounts of our property, plant and equipment and finite lived intangible assets to determine whether there is any indication that those assets could have suffered an impairment loss. If any such indication exists, the recoverable amount of the asset is estimated in order to determine the extent, if any, of the impairment loss. Where the asset does not generate cash flows that are independently, we estimate the recoverable amount of the cash-generating unit to which the asset belongs. Our property, plant and equipment items generally do not generate independent cash flows.
In the case of Goodwill, any goodwill acquired is allocated to the cash-generating unit (‘CGU’) expected to benefit from the business combination. CGU to which goodwill is allocated is tested for impairment annually, or more frequently if events or changes in circumstances indicate that the carrying amount of the CGU may be impaired. The carrying amount of the CGU is compared to its recoverable amount, which is the higher of fair value less costs to sell and the value in use. An impairment loss is recognized for the amount by which the carrying amount exceeds its recoverable amount. The impairment review requires management to undertake certain significant judgments, including estimating the recoverable value of the CGU to which goodwill is allocated, based on either fair value less costs-to-sell or the value-in-use, as appropriate, in order to reach a conclusion on whether it deems the goodwill is impaired or not. (See "Note 34.1 to our Consolidated Financial Statements").
Incometaxes
We are subject to income taxes in numerous jurisdictions. Significant judgment is required in determining the worldwide provision for income taxes. There are many transactions and calculations for which the ultimate tax determination is uncertain. We recognize liabilities for anticipated tax audit issues based on estimates of whether additional taxes will be due. Where the final tax outcome of these matters is different from the amounts that were initially recorded, such differences will impact the current and deferred income tax assets and liabilities in the period in which such determination is made.
Deferred tax assets are reviewed each reporting date and reduced to the extent that it is no longer probable that sufficient taxable income will be available to allow all or part of the asset to be settled. Deferred tax assets and liabilities are not discounted. The ultimate realization of deferred tax assets is dependent upon the generation of future taxable income during the periods in which those temporary differences become deductible. Management considers the scheduled reversal of deferred tax liabilities, projected future taxable income and tax planning strategies in making this assessment.
Operating Segments
The Company is engaged in agricultural, manufacturing and land transformation activities. Our agricultural activities consist of harvesting certain agricultural products, including crops, rough rice, and sugarcane, for sale to third parties and for internal use as inputs in our various manufacturing processes, and producing fluid milk. The manufacturing activities consist of (i) selling manufactured products, including processed peanuts, sunflower rice, sugar, ethanol and energy, among others, (ii) in producing UHT and UP milk, powdered milk and semi-hard cheese, among other dairy products; and (iii) providing services, such as grain warehousing and conditioning and handling and drying services, among others. The land transformation activities consist of the acquisition of farmlands or businesses with underdeveloped or underutilized agricultural land and implementing production technology and agricultural best practices on the Group’s farmlands to enhance yields and increase their value for potential realization through sale.
According to IFRS 8, “Operating Segments” requires an entity to report financial and descriptive information about its reportable segments, which are operating segments or aggregations of operating segments that meet specified criteria.are identified based on the ‘management approach’. Operating segments are components of an entity about which separate financial information is available that is evaluated regularly by the chief operating decision maker (“CODM”)CODM in deciding how to allocate resources and in assessing performance. The Company’s CODM evaluatesis the businessManagement Committee. IFRS 8 stipulates external segment reporting based on the differences in the nature of its operations, productsCompany’s internal organizational and services. The amount reported for each segment item is the measure reportedmanagement structure and on internal financial reporting to the CODM for these purposes.CODM.
Effective for the year ended December 31, 2023, the Company`s CODM changed its internal reporting mainly to refine the way it views our farming business and its interaction with our overarching land transformation activities embedded within such farming business. Previously, the Company`s CODM reviewed the results of our land transformation strategy as a separate activity upon disposition of transformed farmlands and/or other rural properties, or the acquisition of an under-utilized land. As from the fourth quarter of 2023, the Company`s CODM started allocating any profit from disposition of a farmland or, a bargain purchase gain, as part of the farming activity where such farmland belongs. Our CODM believes that this allocation better aligns the activities which were conducted to achieve the full growth potential of the land through the years with its ultimate realization of incremental value. Therefore, any profit on the realization of land transformation activities is now included in the respective farming business operating segment to which the disposed/acquired land belongs.
Also, the Company`s CODM started allocating the results of our minor cattle activities —which were previously reported as part of “all other segments” since they did not meet the quantitative thresholds for disclosure —to the farmland where the cattle is assigned. The Company maintain cattle as complementary to the farming activities rather than as a separate business itself. Cattle helps preserve the value and productive capacity of the farmlands, avoiding the growth of undesired weeds.
These changes resulted in revisions to the financial information provided to the Company´s CODM on a recurring basis in their evaluation of our financial performance and the decision-making process. The Company´s CODM believes these changes better reflect the performance of our reportable segments. Accordingly, the Company changed the segment reporting under IFRS 8 as further described below. Previously reported segment financial information was recast for the years ended December 31, 2022 and 2021 to reflect the new reportable segment structure. See Note 3 to our Audited Consolidated Financial Statements for further details of this change.
Based on the foregoing, the Company operates in threetwo major lines of business, namely, Farming;Farming and Sugar, Ethanol and Energy; and Land Transformation.Energy.
•–The Company’s ‘Farming’ business“Farming” is further comprised of fourthree reportable segments:
▪•The Company’s ‘Crops’“Crops” segment, which consists of the planting, harvesting and sale of grains, oilseeds and fibers (including wheat, corn, soybeans, peanuts, cotton and sunflowers, among others), and to a lesser extent the provision of grain warehousing/conditioning and handling and drying services to third parties and the purchase and sale of crops produced by third parties. Each underlying crop in this segment does not represent a separate operating segment. Management seeks to maximize the use of the land through the cultivation of one or more type of crops. Types and surface amount of crops cultivated may vary from harvest yearharvest-year to harvest yearharvest-year depending on several factors, some of them out of the Company´sour control. Management is focused on the long-term performance of the productive land, and to that extent, theour performance is assessed considering the aggregated combination, if any, of crops planted in the land. A single manager is responsible for the management of operating activity of all crops rather than for each individual crop.
•The Company’s ‘Rice’“Rice” segment, which consists of the planting, harvesting, processing and marketing of rice;rice, and the genetic development of seeds; and
▪•The Company’s ‘Dairy’“Dairy” segment, which consists of the production and sale of raw milk;milk and industrialized products, including UHT and UP milk, cheese and powderpowdered milk among others.
▪–The Company’s ‘All other segments’ segmentconsists of the aggregation of the remaining non-reportable operating segments, which do not meet the quantitative thresholds for disclosure and for which the Company’s management does not consider them to be of continuing significance, namely, Coffee and Cattle.
•The Company’s ‘Sugar, Ethanol and Energy’ business is also a segment which consists of cultivating sugarcane which is processed in owned sugar mills, transformed into ethanol, sugar and electricity, in addition to biomethane and then marketed;
•The Company’s ‘Land Transformation’ segment comprises the (i) identification and acquisition of underdeveloped and undermanaged farmland businesses; and (ii) realization of value through the strategic disposition of assets (generating profits).
•The Company’s ‘Corporate’ segment comprises certain other activities of a holding function nature not allocable to the segments
In order toTo evaluate the economic performance of our businesses on a monthly basis, the results of operations of our Argentine subsidiaries are based on monthly data that have been adjusted for inflation and converted into the average exchange rate of the U.S. Dollardollar for each month in Argentine subsidiaries.month. These already converted figures are subsequently not readjusted and reconverted. It should be noted thatreconverted subsequently. We also employ this translation methodology for evaluating segment information is the same that the company uses to translate the results of operation from its otheroperations of our subsidiaries from otherin countries that have not been designatedwithout hyperinflationary economies, becauseas it allows for a more accurate analysis of the integral economic performance of its business as a whole.their businesses.
Key Financial and Operating Data
The following table presentstables present selected historical financial and operatingsales data solely for the periods indicated below as it is used for our discussion of results of operations.below:
| | | |
| | |
| | |
| | | | | Year ended December 31, | | | |
| | | | 2020 | | 2019 | | | Chg (%) 2020-2019 | | |
| Sales | Sales | | (In thousands of $) | | | |
| Sales | |
| Sales | |
| Farming Business | |
| Farming Business | |
| Farming Business | Farming Business | | 406,305 | | | 355,355 | | | | 14.3 | % | | |
| Crops | Crops | | 168,461 | | | 166,446 | | | | 1.2 | % | | |
| Soybean(1) | | 44,271 | | | 45,600 | | | | (2.9) | % | | |
| Corn (2) | | 44,475 | | | 59,714 | | | | (25.5) | % | | |
| Wheat (3) | | 14,732 | | | 19,818 | | | | (25.7) | % | | |
| Crops | |
| Crops | |
Soybean (1)(2) | |
Soybean (1)(2) | |
Soybean (1)(2) | |
Corn (3) | |
Corn (3) | |
Corn (3) | |
Wheat (4) | |
Wheat (4) | |
Wheat (4) | |
| Peanut | |
| Peanut | |
| Peanut | Peanut | | 46,708 | | | 28,928 | | | | 61.5 | % | | |
| Sunflower | Sunflower | | 11,066 | | | 8,235 | | | | 34.4 | % | | |
| Sunflower | |
| Sunflower | |
| Cotton Lint | |
| Cotton Lint | |
| Cotton Lint | |
Other crops (4)(5) | Other crops (4)(5) | | 7,209 | | | 4,151 | | | | 73.7 | % | | |
| Other crops (4)(5) | |
Other crops (4)(5) | |
Rice (6) | |
Rice (6) | |
| Rice (6) | Rice (6) | | 101,862 | | | 101,156 | | | | 0.7 | % | | |
| Dairy (7) | Dairy (7) | | 133,474 | | | 83,822 | | | | 59.2 | % | | |
| All other segments (8) | | 2,508 | | | 3,931 | | | | (36.2) | % | | |
Dairy (7) | |
Dairy (7) | |
| Sugar, Ethanol and Energy Business | |
| Sugar, Ethanol and Energy Business | |
| Sugar, Ethanol and Energy Business | Sugar, Ethanol and Energy Business | | 411,459 | | | 531,783 | | | | (22.6) | % | | |
| Sugar | Sugar | | 171,102 | | | 97,710 | | | | 75.1 | % | | |
| Sugar | |
| Sugar | |
| Ethanol | |
| Ethanol | |
| Ethanol | Ethanol | | 199,062 | | | 373,847 | | | | (46.8) | % | | |
| Energy | Energy | | 41,169 | | | 59,652 | | | | (31.0) | % | | |
| Other (9) | | 126 | | | 574 | | | | (78.0) | % | | |
| Energy | |
| Energy | |
Other (8) | |
Other (8) | |
Other (8) | |
| Total | Total | | 817,764 | | | 887,138 | | | | (7.8) | % | | |
| Land Transformation (10) | | 7,934 | | | 2,504 | | | | 216.9 | % | | |
| Total | |
| Total | |
| | | | | | | | | | | | | | | | | | | | | | | | | | | | | | | | | | |
| | | | 2019/2020 | | 2018/2019 | | 2017/2018 | | | | |
| | | | Harvest | | Harvest | | Harvest | | Chg (%) 2019/2020-2018/2019 | | Chg (%) 2018/2019-2017/2018 |
| Production | | | | Year (11) | | Year (11) | | Year (11) | | |
| Farming Business | | | | | | | | | | | | |
| Crops (tons)(12) | | | | 720,106 | | | 649,108 | | | 533,692 | | | 10.9 | % | | 21.6 | % |
| Soybean (tons) | | | | 181,269 | | | 187,226 | | | 171,392 | | | (3.2) | % | | 9.2 | % |
| Corn (tons) (2) | | | | 364,823 | | | 292,698 | | | 258,054 | | | 24.6 | % | | 13.4 | % |
| Wheat (tons) (3) | | | | 104,236 | | | 114,809 | | | 78,640 | | | (9.2) | % | | 46 | % |
| Peanut (tons) | | | | 55,630 | | | 47,785 | | | 19,901 | | | 16.4 | % | | 140.1 | % |
| Sunflower (tons) | | | | 12,652 | | | 5,937 | | | 5,181 | | | 113.1 | % | | 14.6 | % |
| Cotton Lint (tons) | | | | 1,496 | | | 653 | | | 523 | | | 129.1 | % | | 24.8 | % |
| Rice (13) (tons) | | | | 278,348 | | | 239,223 | | | 276,693 | | | 16.4 | % | | (13.5) | % |
| | | | | | | | | | | | | | | | | | | | | | | | | | | | |
| | | Year ended December 31, | | | | |
| | | 2020 | | 2019 | | | | Chg (%) 2020-2019 | | |
| Processed rice (14) (tons) | | 289,797 | | | 279,151 | | | | | 3.8 | % | | |
| Dairy(15) (thousand liters) | | 145,192 | | | 120,069 | | | | | 20.9 | % | | |
| Processed Milk (16) (thousand liters) | | 297,644 | | | 182,261 | | | | | 63.3 | % | | |
| Sugar, Ethanol and Energy Business | | | | | | | | | | |
| Sugar (tons) | | 646,981 | | | 213,256 | | | | | 203.4 | % | | |
| Ethanol (cubic meters) | | 502,170 | | | 756,494 | | | | | (33.6) | % | | |
| Energy (MWh) | | 717,915 | | | 853,139 | | | | | (15.9) | % | | |
| Land Transformation Business (hectares traded) | | 5,444 | | | 6,080 | | | | | (10.5) | % | | |
| | | | | | | | | | | | | | | | | | | | | | | | | | | | | | | | | | | | | | |
| | 2020/2021 | | 2019/2020 | | 2018/2019 | | 2017/2018 | | Chg (%) 2020/2021-2019/2020 | | Chg (%) 2018/2019-2017/2018 |
| | Harvest | | Harvest | | Harvest | | Harvest | | |
| Planted Area | | Year (17) | | Year | | Year | | Year | | |
| | | | | (Hectares) | | | | | | |
| Farming Business (18) | | | | | | | | | | | | |
| Crops | | 223,171 | | | 203,020 | | | 191,209 | | | 194,711 | | | 9.9 | % | | 6.2 | % |
| Soybean | | 68,315 | | | 73,685 | | | 73,305 | | | 81,269 | | | (7.3) | % | | 0.5 | % |
| Corn (2) | | 57,067 | | | 61,685 | | | 47,058 | | | 56,741 | | | (7.5) | % | | 31.1 | % |
| Wheat (3) | | 46,646 | | | 32,799 | | | 40,213 | | | 36,533 | | | 42.2 | % | | (18.4) | % |
| Peanut | | 26,123 | | | 16,814 | | | 15,479 | | | 9,375 | | | 55.4 | % | | 8.6 | % |
| Sunflower | | 16,164 | | | 6,818 | | | 3,824 | | | 2,869 | | | 137.1 | % | | 78.3 | % |
| Cotton | | 3,519 | | | 4,461 | | | 5,316 | | | 3,132 | | | (21.1) | % | | (16.1) | % |
| Forage | | 5,337 | | | 6,758 | | | 6,014 | | | 5 | | | (21.0) | % | | 12.4 | % |
| Rice | | 44,282 | | | 41,544 | | | 40,417 | | | 40,289 | | | 6.6 | % | | 2.8 | % |
| Total Planted Area | | 267,453 | | | 244,564 | | | 231,626 | | | 235,000 | | | 9.4 | % | | 5.6 | % |
| Second Harvest Area | | 45,885 | | | 34,556 | | | 32,219 | | | 35,948 | | | 32.8 | % | | 7.3 | % |
| Leased Area | | 108,245 | | | 97,367 | | | 86,028 | | | 72,115 | | | 11.2 | % | | 13.2 | % |
| Owned Croppable Area (19) | | 107,986 | | | 105,883 | | | 107,364 | | | 122,144 | | | 2.0 | % | | (1.4) | % |
| | | | | | | | | | | | | | | | | | | | | | | | | | | | |
| | | Year ended December 31, | | | | |
| | | 2020 | | 2019 | | | | Chg (%) 2020 - 2019 | | |
| Sugar, Ethanol and Energy Business | | | | | | | | | | |
| Sugarcane plantation | | 176,651 | | | 166,041 | | | | | 6.4 | % | | |
| Owned land | | 8,748 | | | 8,748 | | | | | — | % | | |
| Leased land | | 167,903 | | | 157,293 | | | | | 6.7 | % | | |
(1)Includes soybean, soybean oil and soybean meal.
(2) 2022/2023 does not include soybean planted in Brazil as cover crop during the implementation of the agricultural technique known as meiosis. Revenues corresponding to the sale of this product are booked in the Sugar, Ethanol and Energy business.
(3) Includes sorghum, chia and bean.
(3)(4) Includes barley, rye, oats, chickpea and vetch.
(4)(5) Includes seeds and farming services.
(5)Accumulated adjustment of hyperinflation accounting translation for our Crops segment sales.
(6)Sales Includes sales of processed rice including rough rice purchased from third parties and processed in our own facilities, rice seeds and services.
(7)Includes sales of energy from our bio digester,biodigester, which produces biogas from effluents of our cows.
(8)All other segments include our cattle business which primarily consists of leasing land to a third party based on the price of beef. See “Item 4. Information on the Company-B. Business Overview-Cattle Business”.
(9)Includes operating leases and other services.
(10)Represents capital gains from the sale of land.
(11)
| | | | | | | | | | | | | | | | | | | | | | | | | | | | | | | | | | |
| | | | 2022/2023 | | 2021/2022 | | 2020/2021 | | | | |
| | | | Harvest | | Harvest | | Harvest | | Chg (%) 2022/2023-2021/2022 | | Chg (%) 2021/2022-2020/2021 |
| Production | | | | Year (1) | | Year (1) | | Year (1) | | |
| Farming Business | | | | | | | | | | | | |
| Crops (tons)(2) | | | | 483,855 | | | 769,524 | | | 733,334 | | | (37.1) | % | | 4.9 | % |
| Soybean (tons) (3) | | | | 123,827 | | | 177,963 | | | 172,969 | | | (30.4) | % | | 2.9 | % |
| Corn (tons) (4) | | | | 192,615 | | | 342,621 | | | 327,164 | | | (43.8) | % | | 4.7 | % |
| Wheat (tons) (5) | | | | 83,290 | | | 137,953 | | | 122,749 | | | (39.6) | % | | 12.4 | % |
| Peanut (tons) | | | | 39,306 | | | 62,433 | | | 77,891 | | | (37.0) | % | | (19.8) | % |
| Sunflower (tons) | | | | 32,565 | | | 39,054 | | | 28,436 | | | (16.6) | % | | 37.3 | % |
| Cotton Lint (tons) | | | | 6,224 | | | 4,262 | | | 1,772 | | | 46.0 | % | | 140.5 | % |
| Others | | | | 6029 | | 5238 | | 2353 | | 15.1 | % | | 122.6 | % |
| Rice (tons) (6) | | | | 354,128 | | | 416,735 | | | 346,685 | | | (15.0) | % | | 20.2 | % |
(1) The table reflects the production in respect of harvest yearsharvest-years as of December 31.
(12)(2) Crop production does not include 226,821288,137 tons, 314,000 tons and 128,151300,782 tons of forage produced as of December 31, in the 2019/20202022/2023, 2021/2022 and 2018/2019 harvest years,2020/2021 harvest-years, respectively.
(13)(3) 2021/2022 does not include soybean planted in Brazil as cover crop during the implementation of the agricultural technique known as meiosis. Revenues corresponding to the sale of this product are booked in the Sugar, Ethanol and Energy business.
(4) Includes sorghum.
(5) Includes barley, rye, oats, chickpea and vetch.
(6) Expressed in tons of roughwhite rice equivalent produced on owned and leased farms. The roughwhite rice equivalent we produce, along with additional rough rice we purchase from third parties, is ultimately processed and constitutes the product sold in respect of the rice business.
(14) | | | | | | | | | | | | | | | | | | | | | | | | | | | | |
| | | For the year ended December 31, | | | | |
| | | 2023 | | 2022 | | | | Chg (%) 2023-2022 | | |
| Processed rice (1) (tons) | | 280,246 | | | 396,681 | | | | | (29.4) | % | | |
| Dairy(2) (thousand liters) | | 199,913 | | | 185,583 | | | | | 7.7 | % | | |
| Processed Milk (3) (thousand liters) | | 351,754 | | | 359,435 | | | | | (2.1) | % | | |
| Sugar, Ethanol and Energy Business | | | | | | | | | | |
| Sugar (tons) | | 805,608 | | | 481,919 | | | | | 67.2 | % | | |
| Ethanol (cubic meters) | | 522,508 | | | 540,231 | | | | | (3.3) | % | | |
| Energy (4) (MWh) | | 694,259 | | | 608,964 | | | | | 14.0 | % | | |
| Land Transformation Activity (hectares traded) | | — | | | — | | | | | | | |
(1) Includes rough rice purchased from third parties and processed in our own facilities. Expressed in tons of rough rice (1(one ton of processed rice is approximately equivalent to 1.6 tons of rough rice).
(15)(2) Raw milk produced at our dairy farms.
(16)Own(3) Consists of our and third partiesparties` raw milk processed in our industrial facilities of Morteros and Chivilcoy.
(4) Energy exported to grid.
| | | | | | | | | | | | | | | | | | | | | | | | | | | | | | | | | | | | |
| | 2023/2024 | | 2022/2023 | | 2021/2022 | | | | Chg (%) 2023/2024-2022/2023 | | Chg (%) 2022/2023-2021/2022 |
| | Harvest | | Harvest | | Harvest | | | | |
| Planted Area | | Year (1) | | Year | | Year | | | | |
| | | | | (Hectares) | | | | | | |
| Farming Business (2) | | | | | | | | | | | | |
| Crops | | 232,852 | | | 223,296 | | | 241,192 | | | | | 4.3 | % | | (7.4) | % |
| Soybean (1) | | 88,691 | | | 81,770 | | | 71,074 | | | | | 8.5 | % | | 15.0 | % |
| Corn (3) | | 59,812 | | | 41,411 | | | 57,536 | | | | | 44.4 | % | | (28.0) | % |
| Wheat (4) | | 28,142 | | | 35,789 | | | 46,509 | | | | | (21.4) | % | | (23.0) | % |
| Peanut | | 24,282 | | | 19,813 | | | 22,102 | | | | | 22.6 | % | | (10.4) | % |
| Sunflower | | 10,832 | | | 18,131 | | | 23,092 | | | | | (40.3) | % | | (21.5) | % |
| Cotton | | 5,199 | | | 10,075 | | | 7,427 | | | | | (48.4) | % | | 35.7 | % |
| Others | | 3,692 | | | 2,657 | | | 3,246 | | | | | 38.9 | % | | (18.1) | % |
| Forage | | 12,202 | | | 13,650 | | | 10,206 | | | | | (10.6) | % | | 33.7 | % |
| Rice | | 58,452 | | | 55,648 | | | 60,857 | | | | | 5.0 | % | | (8.6) | % |
| Total Planted Area | | 291,304 | | | 278,944 | | | 302,049 | | | | | 4.4 | % | | (7.6) | % |
| Second Harvest Area | | 26,587 | | | 32,763 | | | 39,967 | | | | | (18.9) | % | | (18.0) | % |
| Leased Area | | 153,040 | | | 130,463 | | | 143,675 | | | | | 17.3 | % | | (9.2) | % |
| Owned Croppable Area (5) | | 99,637 | | | 102,127 | | | 111,464 | | | | | (2.4) | % | | (8.4) | % |
(1) Represents the planting plan for 2020/2021the 2023/2024 campaign. As of December 31, 2020, 90%2023, 89% of the planting plan is seeded.
(18)(2) Includes hectares planted in the second harvest.
(19)(3) Includes sorghum.
(4) Includes barley, rye, oats, chickpea and vetch.
(5) Does not include potential croppable areas being evaluated for transformation and does not include forage area.
| | | | | | | | | | | | | | | | | | | | | | | | |
| | | For the year ended December 31, | | | | |
| | | 2023 | | 2022 | | | | Chg (%) 2023-2022 | | |
| Sugar, Ethanol and Energy Business | | | | | | | | | | |
| Sugarcane plantation | | 198,747 | | | 192,987 | | | | | 3.0 | % | | |
| Owned land | | 10,024 | | | 12,951 | | | | | (22.6) | % | | |
| Leased land | | 188,723 | | | 180,036 | | | | | 4.8 | % | | |
YearFor the year ended December 31, 20202023, as compared to year ended December 31, 20192022
The following table sets forth certain financial information with respect to our consolidated results of operations for the years indicated.
| | | | 2020 | | 2019 | | Chg (%) 2020-2019 | | 2023 | | 2022 | | Chg (%) 2023-2022 |
| | | (In thousands of $) | |
| Sales of goods and services rendered | Sales of goods and services rendered | 817,764 | | | 887,138 | | | (7.8) | % |
| Sales of goods and services rendered | |
| Sales of goods and services rendered | | 1,298,871 | | | 1,347,724 | | | (3.6) | % |
| Cost of goods sold and services rendered | Cost of goods sold and services rendered | (611,946) | | | (671,173) | | | (8.8) | % | Cost of goods sold and services rendered | (973,180) | | | (1,075,747) | | (1,075,747) | | | (9.5) | | (9.5) | % |
| Initial recognition and Changes in fair value of biological assets and agricultural produce | 122,729 | | | 68,589 | | | 78.9 | % |
| Initial recognition and changes in fair value of biological assets and agricultural produce | | Initial recognition and changes in fair value of biological assets and agricultural produce | 87,858 | | | 215,941 | | | (59.3) | % |
| Changes in net realizable value of agricultural produce after harvest | Changes in net realizable value of agricultural produce after harvest | 7,005 | | | 1,825 | | | 283.8 | % | Changes in net realizable value of agricultural produce after harvest | 1,838 | | | (22,293) | | (22,293) | | | (108.2) | | (108.2) | % |
| Margin on Manufacturing and Agricultural Activities Before Operating Expenses | 335,552 | | | 286,379 | | | 17.2 | % |
| Margin on manufacturing and agricultural activities before operating expenses | | Margin on manufacturing and agricultural activities before operating expenses | 415,387 | | | 465,625 | | | (10.8) | % |
| General and administrative expenses | General and administrative expenses | (53,428) | | | (57,202) | | | (6.6) | % | General and administrative expenses | (70,320) | | | (84,287) | | (84,287) | | | (16.6) | | (16.6) | % |
| Selling expenses | Selling expenses | (95,058) | | | (106,972) | | | (11.1) | % | Selling expenses | (129,092) | | | (143,515) | | (143,515) | | | (10.0) | | (10.0) | % |
| Other operating income, net | 1,987 | | | (822) | | | (341.7) | % |
| Profit from Operations Before Financing and Taxation | 189,053 | | | 121,383 | | | 55.7 | % |
| Other operating income / (expense), net | | Other operating income / (expense), net | 25,590 | | | 1,870 | | | 1268 | % |
| Bargain purchase gain on acquisition | | Bargain purchase gain on acquisition | — | | | 10,107 | | | (100) | % |
| Profit from operations | | Profit from operations | 241,565 | | | 249,800 | | | (3.3) | % |
| Finance income | Finance income | 26,054 | | | 8,979 | | | 190.2 | % | Finance income | 157,100 | | | 25,308 | | 25,308 | | | 520.8 | | 520.8 | % |
| Finance costs | Finance costs | (213,776) | | | (126,111) | | | 69.5 | % | Finance costs | (122,087) | | | (137,600) | | (137,600) | | | (11.3) | | (11.3) | % |
| Other financial results - Net gain of inflation effects on the monetary items | 12,064 | | | 16,911 | | | (28.7) | % |
| Other financial results - Net gain / (loss) of inflation effects on monetary items | | Other financial results - Net gain / (loss) of inflation effects on monetary items | 28,816 | | | (2,144) | | | (1444) | % |
| Financial results, net | Financial results, net | (175,658) | | | (100,221) | | | 75.3 | % | Financial results, net | 63,829 | | | (114,436) | | (114,436) | | | (156) | | (156) | % |
| Profit / Before Income Tax | 13,395 | | | 21,162 | | | (36.7) | % |
| Income tax Expense | (12,325) | | | (20,820) | | | (40.8) | % |
| Profit for the Year | 1,070 | | | 342 | | | 212.9 | % |
| Profit before income tax | | Profit before income tax | 305,394 | | | 135,364 | | | 125.6 | % |
| Income tax expense | | Income tax expense | (78,673) | | | (26,758) | | | 194.0 | % |
| Profit for the year | | Profit for the year | 226,721 | | | 108,606 | | | 108.8 | % |
Sales of Goods and Services Rendered
| | | | | | | | | | | | | | | | | | | | | | | | | | | | | | | | | | | |
| Year ended December 31, | Crops | | Rice | | Dairy | | All other segments | | Sugar, Ethanol and Energy | | Total as per
statement of income |
| (In thousands of $) |
| 2020 | 168,461 | | | 101,862 | | | 133,474 | | | 2,508 | | | 411,459 | | | 817,764 | |
| 2019 | 166,446 | | | 101,156 | | | 83,822 | | | 3,931 | | | 531,783 | | | 887,138 | |
| | | | | | | | | | | | | | | | | | | | | | | | | | | | | | | |
| For the year ended December 31, | Crops | | Rice | | Dairy | | | | Sugar, Ethanol and Energy | | Total |
| (In thousands of $) |
| 2023 | 166,253 | | | 230,192 | | | 180,119 | | | | | 722,307 | | | 1,298,871 | |
| 2022 | 277,751 | | | 204,201 | | | 235,012 | | | | | 630,760 | | | 1,347,724 | |
Total salesSales of goods and serviceservices rendered totaled $817.8decreased 3.6%, from $1.35 million 7.8% lower thanfor the year ended December 31, 2022, to $1.30 million for the prior-year period in 2019,2023, primarily as a result of:
•a $111.5 million decrease in our Crops segment driven by: (i) a 35.1% decrease in the volume of soybean, from 167,881 tons for the year ended December 31, 2022, to 108,942 tons during the same period in 2023, a 45.6% and 26.8% decrease in the volume of corn and wheat sold, respectively, from 295,299 and 81,971 tons during the year ended December 31, 2022, to 160,522 and 60,019 tons during the same period in 2023, impacted negatively by adverse weather conditions of La Niña; (ii) a general decrease in crop prices, mainly driven by a 19.7% decrease in soybean prices (from US$486.9 per ton in 2022 to US$391.1 per ton in 2023), and a 45.3% decrease in wheat prices (from US$243 per ton in 2022 to US$133 per ton in 2023); and (iii) a negative impact of US$2.5 million due to the application of hyperinflation accounting and translation to our Argentine operations for the year ended December 31, 2022, compared to a negative impact of US$50.7 million for the same period in 2023;
The following table sets forth the breakdown of sales for the years indicated.
| | | | | | | | | | | | | | | | | | | | | | | | | | | | | | | | | | | | | | | | | | | | | | | | | | | | | |
| | Year ended December 31, | | Year ended December 31, | | Year ended December 31, |
| | 2023 | | 2022 | | % Chg | | 2023 | | 2022 | | % Chg | | 2023 | | 2022 | | % Chg |
| | (In millions of $) | | (In thousands of tons) | | (In $ per ton) |
| Soybean | 42.6 | | | 81.8 | | | (47.9) | % | | 108.9 | | | 167.9 | | | (35.1) | % | | 391.1 | | | 486.9 | | | (19.7) | % |
| Corn (1) | 22.5 | | | 71.2 | | | (68.4) | % | | 160.5 | | | 295.3 | | | (45.6) | % | | 140.1 | | | 241.1 | | | (41.9) | % |
| Wheat | 8.0 | | | 19.9 | | | (59.8) | % | | 60.0 | | | 82.0 | | | (26.8) | % | | 133.0 | | | 243.0 | | | (45.3) | % |
| Peanut | 63.6 | | | 63.0 | | | 1.0 | % | | 49.7 | | | 50.4 | | | (1.4) | % | | 1,280.0 | | | 1,250.3 | | | 2.4 | % |
| Sunflower | 15.4 | | | 24.8 | | | (37.9) | % | | 34.6 | | 32.7 | | 5.81 | % | | $ | 444.3 | | | $ | 758.3 | | | (41.4) | % |
| Others | 14.2 | | | 17.1 | | | (17.1) | % | | | | | | | | | | | | |
| | | | | | | | | | | | | | | | | |
| Total | 166.3 | | | 277.8 | | | (40.1) | % | | | | | | | | | | | | |
•A $120.3a $54.9 million decrease in our Dairy segment mainly due to (i) a 1.8% decrease in volumes sold from 411.6 million liters during the year ended December, 31, 2022 compared to 404.2 million liters during the same period in 2023; and (ii) a negative impact of $1.2 million due to the application of hyperinflation accounting and translation to our Argentine operations during the year ended December 31, 2022, compared to a negative impact of $66.8 million during the same period in 2023.
These effects were partially offset by:
•a US$26.0 million increase in our Rice segment, mainly driven by: (i) a 22.6% increase in the price of white rice, from US$554.0 per ton for the year ended December 31, 2022, to US$679.2 per ton for the same period in 2023, and (ii) a 49% increase in the sale of by-products, from US$26.4 thousand for the year ended December 31, 2022, compared to US$39.3 thousand for the same period in 2023; partially offset by (i) a negative impact of $0.2 million due to the application of hyperinflation accounting and translation to our Argentine operations for the year ended December 31, 2022, compared to a negative impact of $26.2 million for the same period in 2023; and (ii) lower production from 416,735 tons during the year ended December 31, 2022, compared to 354,128 tons during the same period in 2023, mainly driven by La Niña negative impact, which was partially offset due to rice stocks selloff.
•a US$91.7 million increase in our Sugar, Ethanol and Energy segment, mainly due to: (i) a 9.1% decrease23.1% increase in average sugar price, from US$428.40 per ton for the year ended December 31, 2022 to US$527.30 per ton for the same
period in 2023; (ii) a 15.7% increase in the volume of sugar and ethanol sold, measured in TRS (1),equivalent, from 1,6481.392 thousand tons during 2019of TRS for the year ended December 31, 2022 to 1,4981.611 thousand tons of TRS compared to the same period in 2020; (ii)2023; and (iii) energy sales amounted to US$36.0 million, 3.2% higher compared to the same period of last year, driven by an 10.3% increase in selling volumes which fully offset the 5.0% decline in the average selling price.
This was partially offset by a 1.6% lower volume of energy sold, (iii) a 16.7%23.6% decrease in ethanol price,prices, from $488.0US$702 per m3cubic meter for the year ended December 31, 2022, to $536.1 per cubic meter for the same period in 2019 to $406.5 per m3 in 2020, (iv) a 7.8% decrease in sugar price, from $289.6 per ton in 2019 to $266.9 per ton in 2020; and (v) a 30.0 % decrease in energy price, from $59.6 MWh in 2019 to $41.7 MWh in 2020.2023.
The following table sets forth the breakdown of sales of manufactured products for the years indicated.
| | | | | | | | | | | | | | | | | | | | | | | | | | | | | | | | | | | | | | | | | | | | | | | | | | | | | |
| | For the year ended December 31, | | For the year ended December 31, | | For the year ended December 31, |
| | 2023 | | 2022 | | Chg % | | 2023 | | 2022 | | Chg % | | 2023 | | 2022 | | Chg % |
| | (in millions of $) | | (in thousand units) | | (in dollars per unit) |
| Ethanol (cubic meters) | 247.0 | | | 387.1 | | | (36.2) | % | | 460.7 | | | 551.4 | | | (16.4) | % | | 536.1 | | | 702.00 | | (23.6) | % |
| Sugar (tons) | 419.9 | | | 188.8 | | | 122.4 | % | | 796.3 | | | 440.6 | | | 80.7 | % | | 527.3 | | | 428.4 | | | 23.1 | % |
| Energy (MWh) | 36.0 | | | 34.9 | | | 3.2 | % | | 834.4 | | | 706.6 | | | 18.1 | % | | 43.1 | | | 49.4 | | | (12.8) | % |
| Others | 19.5 | | | 20.0 | | | (2.5) | % | | | | | | | | | | | | |
| TOTAL | 722.4 | | | 630.8 | | | 14.5 | % | | | | | | | | | | | | |
| | | | | | | | | | | | | | | | | |
The decrease in volume of sugarfollowing chart sets forth the variables that impact our Sugar and ethanol sold measured in TRS was mainly due to: (i) a reduction from 106.3 thousand tons of sugar processed from third parties during 2019, to null in 2020; and (ii) a decrease of 15.0 thousand tons measured in TRS in 2019, compared to an increase in inventories from an increase of 10.4 thousand tons measured in TRS during 2020. Partially offset by (i) a 1.5% increase in production measured in TRS equivalent, from 1,508 thousand tons during 2019, to 1,531 thousand tons during 2020, mainly explained by a 90% increase in sugar production, from 337.4 tons during 2019 to 641.1 tons during 2020, our high degree of flexibility allowed us to divert our production to sugar taking advantage of the higher relative prices. The increase in production is mainly due (i) a 1.8% increase in sugarcane milled, from 10.9 million tons during 2019 to 11.1 million tons during 2020, mainly explained by an increase in daily milling capacity.Ethanol sales:

The lower volume of energy sold was mainly explained by a 17.8% decrease in cogeneration efficiency, from 78.7 KWh per ton during 2019, to 64.7 KWh per ton in 2020 due tofollowing chart sets forth the variables that impact our decision of suspending the purchase of wood chips to third parties, partially offset by a 29.2% increase in third parties energy commercialization, from 173.1 MWh in 2019 to 223.7 MWh in 2020.Energy sales:
(1)(*) On average, one metric ton of sugarcane contains 140 kilograms of TRS. While a mill can produce either sugar or ethanol, the TRS input requirements differ between these two products. On average, 1.045 kilograms of TRS equivalent are required to produce 1.0 kilogram of sugar, while the amount1.691 kilograms of TRS are required to produce 1one liter of ethanol is 1.691 kilograms
The following figure sets forth the variables that determine our Sugar and Ethanol sales:
The following figure sets forth the variables that determine our Energy sales:
The following table sets forth the breakdown of sales of manufactured products for the years indicated.
| | | | | | | | | | | | | | | | | | | | | | | | | | | | | | | | | | | | | | | | | | | | | | | | | | | | | |
| | Year ended December 31, | | Year ended December 31, | | Year ended December 31, |
| | 2020 | | 2019 | | Chg % | | 2020 | | 2019 | | Chg % | | 2020 | | 2019 | | Chg % |
| | (in millions of $) | | (in thousand units) | | (in dollars per unit) |
| Ethanol (M3) | 199.1 | | | 373.8 | | | (46.8) | % | | 489.7 | | | 766.0 | | | (36.1) | % | | 406.5 | | | 488.0 | | | (16.7) | % |
| Sugar (tons) | 171.1 | | | 97.7 | | | 75.1 | % | | 641.1 | | | 337.4 | | | 90.0 | % | | 266.9 | | | 289.6 | | | (7.8) | % |
| Energy (MWh) | 41.2 | | | 59.7 | | | (31.0) | % | | 987.2 | | | 1,001.2 | | | (1.4) | % | | 41.7 | | | 59.6 | | | (30.0) | % |
| Others | 0.1 | | | 0.6 | | | (78.0) | % | | | | | | | | | | | | |
| TOTAL | 411.5 | | | 531.8 | | | (22.6) | % | | | | | | | | | | | | |
This decrease in sales of goods and services rendered was partially offset by:
•A $49.7 million increase in our Dairy segment mainly cause by (i) a 58.7% increase in volume of dairy products sold including fluid, powder and processed milk, cream, cheese and dairy products measured in liters of milk equivalent, from 215.5 million liters in 2019, to 342.1 million liters in 2020, explained by (a) an increase of 20.9% of fluid milk production in our free-stalls, from 120.1 million liters in 2019, to 145.2 million liters in 2020, due to a 20% increase in the number of
cows from 9,066 average heads in 2019 to 10,876 average heads in 2020; and (b) an increase in fluid milk purchased to third parties to be processed in our industrial facilities, from 60.4 million liters in 2019 to 155.2 million liters in 2020.
This increase is partially offset by (i) a 9.7% decrease in average milk prices, from $0.31 per liter of fluid milk equivalent in 2019 to $0.28 per liter in 2020 despite new products processed with higher margins; and (ii) a negative effect of hyperinflation accounting and translation for our Argentine operations, from a negative impact of $0.9 million effect in 2019 compared to a negative impact of $2.0 million during the same period in 2020.
•A $2.0 million increase in our Crops segment mainly driven by (i) a 40.8% increase in the volume of peanut sold, from 30.6 thousand tons during 2019, to 43.1 thousand tons in 2020, driven by, (a) higher yields, from 3.1 tons per hectare in 2019 to 3.3 tons per hectare in 2020; and (b) higher planted area from 15.5 thousand hectares in 2019, to 16.8 thousand hectares in 2020, (ii) a 14.9% increase in peanut prices from $944.2 per ton in 2019, to $1084.5 per ton in 2020, (iii) a 31.0% increase in the volume of sunflower sold, from 8.4 thousand tons during 2019, to 11.0 thousand tons during 2020, explained by an increase in planted area, from 3.8 thousand hectares in 2019, to 6.8 thousand hectares in 2020; and (iv) a positive effect of hyperinflation accounting and translation for our Argentine operations, from a negative impact of $2.5 million effect in 2019 compared to a negative impact of $1.7 million during the same period in 2020.
This increase was partially offset by (i) a 24.9% decrease in the volume of wheat sold, from 108.8 thousand tons during 2019 to 81.7 thousand tons in 2020, driven by (a) a decrease in inventories of 14.1 thousand tons in 2019, compared to an increase in inventories of 30.6 thousand tons in 2020, (b) lower planted area from 40.2 thousand hectares in 2019, to 32.8 thousand hectares in 2020; (ii) a 24.3% decrease in the volume of corn sold, from 413.9 thousand tons during 2019, to 313.2 thousand tons during 2020, driven by (a) lower yields, from 6.5 tons per hectare in 2019 to 6.0 tons per hectare in 2020, (b) a decrease in inventories of 39.7 thousand tons in 2019, compared to an increase in inventories of 2.9 thousand tons in 2020; and (c) a reduction from 120.0 thousand tons of corn commercialized from third parties in 2019 compared to null in 2020.
The following table sets forth the breakdown of sales for the years indicated.
| | | | | | | | | | | | | | | | | | | | | | | | | | | | | | | | | | | | | | | | | | | | | | | | | | | | | |
| | Year ended December 31, | | Year ended December 31, | | Year ended December 31, |
| | 2020 | | 2019 | | % Chg | | 2020 | | 2019 | | % Chg | | 2020 | | 2019 | | % Chg |
| | (In millions of $) | | (In thousands of tons) | | (In $ per ton) |
| Soybean | 44.3 | | | 45.6 | | | (2.9) | % | | 189.3 | | | 197.8 | | | (4.3) | % | | 234.1 | | | 230.6 | | | 1.5 | % |
| Corn (1) | 44.5 | | | 59.7 | | | (25.5) | % | | 313.2 | | | 413.9 | | | (24.3) | % | | 142.1 | | | 144.2 | | | (1.5) | % |
| Wheat (2) | 14.7 | | | 19.8 | | | (25.8) | % | | 81.7 | | | 108.8 | | | (24.9) | % | | 180.0 | | | 182.0 | | | (1.1) | % |
| Peanut | 46.7 | | | 28.9 | | | 61.6 | % | | 43.1 | | | 30.6 | | | 40.8 | % | | 1,084.5 | | | 944.2 | | | 14.9 | % |
| Sunflower | 11.1 | | | 8.2 | | | 35.4 | % | | 11.0 | | 8.4 | | 29.6 | % | | 1012.9 | | 976.9 | | 3.7 | % |
| Others | 7.2 | | | 4.2 | | | 71.4 | % | | | | | | | | | | | | |
| | | | | | | | | | | | | | | | | |
| Total | 168.5 | | | 166.4 | | | 1.3 | % | | | | | | | | | | | | |
(1)Includes sorghum and popcorn.
(2)Includes barley, rye, oats and chickpea.ethanol.
•A $0.7 million increase in our Rice segment, mainly explained by (i) a 9.3% increase in average selling price from $431.4 per ton in 2019, to $471.4 per ton in 2020, partially offset by (i) a 5.5% decrease in the volume of white rice sold, from 291.3 thousand tons in 2019 to 275.4 thousand tons in 2020; and (ii) a decrease in the sale of by products, from $19.4 million in 2019, to $18.0 million in 2020.
This decrease in volume of white rice sold is mainly driven by a decrease in inventories of 27.7 thousand tons of rough rice equivalent in 2019, compared to a decrease in inventories of 0.4 thousand tons of rough rice equivalent in 2020, partially offset by, (i) 13.6% increase in yields, from 5.9 tons per hectare in 2019, to 6.7 tons per hectare in 2020, (ii) a 2.7% increase in area from 40.4 thousand hectares in 2019, to 41.5 thousand hectares in 2020.
The profit of our agricultural produce is recognized under the line items “Initial recognition and changes in fair value of biological assets and agricultural produce” and “Changes in net realizable value of agricultural produce after harvest”. When the agricultural produce is sold to third parties, we do not record any additional profit or loss as the gain or loss has already been recognized.
The profit of our manufactured products is recognized when they are sold. The cost of manufactured products includes, among others, the cost of agricultural produce transferred internally at fair market value (i.e. harvested sugarcane, rough rice, fluid milk, etc).
Cost of Goods Sold and Services Rendered
| | | | | | | | | | | | | | | | | | | | | | | | | | | | | | | | | | | |
| Year ended December 31, | Crops | | Rice | | Dairy | | All other segments | | Sugar, Ethanol and Energy | | Total as per
statement of income |
| (In thousands of $) |
| 2020 | (149,250) | | | (73,830) | | | (116,007) | | | (1,962) | | | (270,897) | | | (611,946) | |
| 2019 | (156,510) | | | (73,951) | | | (76,694) | | | (3,452) | | | (360,566) | | | (671,173) | |
| | | | | | | | | | | | | | | | | | | | | | | | | | | | | | | |
| For the year ended December 31, | Crops | | Rice | | Dairy | | | | Sugar, Ethanol and Energy | | Total |
| (In thousands of $) |
| 2023 | (143,879) | | | (170,258) | | | (154,473) | | | | | (504,570) | | | (973,180) | |
| 2022 | (255,595) | | | (160,426) | | | (203,885) | | | | | (455,841) | | | (1,075,747) | |
In the case of our agricultural
Agricultural produce sold to third parties (i.e., soybean, corn, wheat and fluid milk), the value of Cost of Goods Sold and Services Rendered is equal to the value of Sales and Services Rendered. The profit of these products is fully recognized under the line items “Initial recognition and changes in fair value of biological assets and agricultural produce” and “Changes in net realizable value of agricultural produce after harvest.” When the agricultural produce is sold to third parties, we do not record any additional profit or loss as the gain or loss has already been recognized.
In the caseThe profit of our manufactured products sold to third parties (i.e., sugar, ethanol, energy, white rice, processed milk and peanut), the profit is recognized when theyproducts are sold. The Cost of Goods and Services Rendered of these products includes, among others, the cost of the agricultural produce (i.e., harvested sugarcane and rough rice), which is the raw material used in the industrial process and is transferred internally from the farm to the industry at fair market value.
Cost of manufactured products sold, and services rendered totaled $611.9 million, 8.8% less than 2019.decreased 9.5%, from US$1.1 billion during the 12-month period ended December 31, 2022, to US$0.9 billion for the same period in 2023. This decrease was primarily due to:
•a $89.7US$111.7 million decrease in our Crops segment, mainly due to lower sales driven by a significant decline in yields attributable to La Niña weather event in Argentina and Uruguay, coupled with a positive impact of US$2.2 million due to the application of hyperinflation accounting and translation to our Argentine operations for the year ended December 31, 2022, compared to a positive impact of US$45.1 million for the same period in 2023.
•a US$49.4 million decrease in our Dairy segment, mainly driven by a positive impact of US$1 million due to the application of hyperinflation accounting and translation to our Argentine operations for the year ended December 31, 2022, compared to a positive impact of US$54.9 million for the same period in 2023;
This effects were partially offset by:
•a US$48.7 million increase in our Sugar, Ethanol and Energy segment, mainly due to (i) the 9.1% decrease in the volume of sugar and ethanol sold measured in TRS coupled with a 17.3% lower unitary cost in dollar terms, mostly explained by the depreciationa 20.6% year-over-year increase in total TRS equivalent produced, on account of the Brazilian Realmore crushing and industrial efficiencies that reduces our costs.higher TRS content per hectare.
•a $7.3US$9.8 million decrease in our Crop segment, explained by mainly by lower peanut costs due to higher depreciation of the Argentinian Peso coupled with higher industrial efficiencies.
•a $0.1 million decreaseincrease in our Rice segment, mainly due to (i) a 5.5% decrease in the volume of whitedriven by higher rough rice sold, coupled with a higher positive impact of hyperinflation accountingprices on international and translations.
Partially offset by:
•a $39.3 million increase in our Dairy segment, explaineddomestic market conditions mainly generated by (i) increase in volume of processed milk sold by our new industrial facilities in Morterossupply issues and Chivilcoy, from 182.3 thousand liters in 2019 compared to 297.6 thousand liters in 2020,heavy droughts held during 2023, respectively; partially offset by (i)a negative impact of US$0.4 million due to the effectapplication of hyperinflation accounting and translation forto our Argentine operations from positive impact of $0.8 million effect in 2019for the year ended December 31, 2022, compared to a positive impact of $1.7US$8.1 million duringfor the same period in 2020; and (ii) lower fluid milk prices, from $0.31 per liter in 2019 to $0.28 per liter in 2020.2023;
Initial Recognition and Changes in Fair Value of Biological Assets and Agricultural Produce
| | | | | | | | | | | | | | | | | | | | | | | | | | | | | | | | | | | |
| Year ended December 31, | Crops | | Rice | | Dairy | | All other segments | | Sugar, Ethanol and Energy | | Total |
| (In thousands of $) |
| 2020 | 40,843 | | | 18,677 | | | 12,344 | | | 1,256 | | | 49,609 | | | 122,729 | |
| 2019 | 29,741 | | | 12,215 | | | 13,510 | | | 13 | | | 13,110 | | | 68,589 | |
| | | | | | | | | | | | | | | | | | | | | | | | | | | | | | | |
| Year ended December 31, | Crops | | Rice | | Dairy | | | | Sugar, Ethanol and Energy | | Total |
| (In thousands of $) |
| 2023 | (10,327) | | | (4,301) | | | 8,050 | | | | | 94,436 | | | 87,858 | |
| 2022 | 64,061 | | | 16,557 | | | 27,257 | | | | | 108,066 | | | 215,941 | |
Initial recognition and changes in fair value of biological assets and agricultural produce totaled $ 122.7decreased 59.3%, from US$215.9 million 78.9% more than 2019.for the year ended December 31, 2022, to US$87.9 million for the same period in 2023. This increasedecrease was mainly due to:
- a US$74.4 million decrease in our Crops segment from US$64.1 million for the year ended December 31, 2022 (US$60.5 million of which were realized gains) to US$10.3 million loss for the same period in 2023 (US$9 million of which were realized losses). This decrease was primarily due to:
•A $36.5a positive impact of US$1.4 million resulting from the application of hyperinflation accounting and translation to our Argentine operations for the year ended December 31, 2022, compared to a negative impact of US$5.5 million for the same period in 2023, coupled with the recognition at fair value of harvested crops, as adjusted for sales costs, which decreased US$68.9 million, from a gain of US$62.1 million for the year ended December 31, 2022, to a loss of US$6.7 million for the same period in 2023, which was mainly driven by the significant decline in yields due to the extreme drought caused by La Niña weather event in Argentina and Uruguay;
- a US$20.8 million decrease in our Rice segment, from US$16.6 million for the year ended December 31, 2022 (US$12.7 million of which were realized gains) to a loss of US$4.3 million for the same period in 2023 (US$1.5 million of which were realized losses). This decrease was due to:
•a US$20.9 million decrease in the recognition at fair value of harvested rice at the point of harvest, as adjusted for sales costs, from a gain of US$16.6 million for the year ended December 31, 2022, to a loss of US$4.3 million for the same period in 2023, mainly driven by a decrease in yields and rice quality due to the heavy droughts experienced during the period throughout the regions where we operate, and a positive impact of US$0.5 million due to hyperinflation accounting and translation for our Argentine operations for the year ended December 31, 2022, compared to a negative impact of US$1.8 million for the same period in 2023;
- a US$19.2 million decrease in our Dairy segment, from US$27.3 million for the year ended December 31, 2022 (US$29.8 million of which were realized) to a gain US$8.1 million for the same period in 2023 (US$26.7 million of which were realized). This decrease was due to:
•an increase in cow nutrition costs mainly driven by La Niña weather event and supply of corn silages production, coupled with a negative impact of US$0.3 million due to the application of hyperinflation accounting and translation to our Argentine operations for the year ended December 31, 2022, compared to a negative impact of $6.0 million in the same period in 2023.
- a US$13.6 million decrease in our Sugar, Ethanol and Energy segment from a gainUS$108.1 million for the year ended December 31, 2022 (US$35.2 million of $13.1 million in 2019 (of which $0.9 million were unrealized losses)gains) to a gain of $49.6US$94.4 million duringfor the same period in 2020 (which includes $19.72023 (including US$15.4 million of unrealized gains)losses). This increasedecrease was mainly due to:
–•A $20.6a US$49.5 million decrease in the recognition at fair value of non-harvested sugarcane, from a gain of US$34.8 million for the year ended December 31, 2022, to a loss of US$14.7 million in the same period in 2023, mainly driven by 2022 unharvested results which comprise a recovery year-over-year in sugarcane productivity level compared to the impact of the decrease in ethanol projected prices by the end of 2023, partially offset by a US$35.3 million increase in the recognition at fair value less cost to sell of non-harvested sugarcane, from a loss of $0.9 million in 2019 to a gain of $.19.7 million in 2020, mainly generated by a 6.4% increase in sugarcane plantation coupled with lower costs in dollar terms during 2020, compared to 2019.
–A $15.9 million increase in the recognition at fair value less cost to sell of harvested sugarcane, from a gain of $14.0US$72.8 million during 2019for the year ended December 31, 2022, to a gain of $29.9US$108.2 million in 2020 due to the increase in sugarcane yields coupled with lower costs in dollar terms during 2020, compared to 2019.
•A $11.1 million increase in our Crops segment from $29.7 million during 2019 (of which $24.2 million were realized) to $40.8 million in 2020 (of which $29.7 million were realized). This increase is primarily due to:
–A $11.4 million increase in the recognition at fair value less cost to sell of harvested crops at the point of harvest, from $28.1 million in 2019, to $39.5 million infor the same period in 2020,2023, mainly due to (i)16% higher grain production; and (ii) lower production costs in dollar terms, due to the depreciation of the Argentine Peso.sugarcane crushed.
Partially offset by:
–The recognition at fair value less cost to sell of non-harvested crops, decreased $0.6 million, from a gain of $2.2 million in 2019 to a gain of $1.6 million in 2020, mainly due to unfavorable weather conditions which decreased expected yields for corn and soybean.
–A negative impact of $0.5 million effect of hyperinflation accounting and translation for our Argentine operations during 2019, compared to a negative impact of $0.9 million in 2020.
•A $6.5 million increase in our Rice segment, from $12.2 million during 2019 (of which $12.7 million were realized) to $18.7 million in 2020 (of which $15.5 million were realized). This increase is due to:
–A $4.4 million increase in the recognition at fair value less cost to sell of harvested rice, from a gain of $32.3 million in 2019 to a gain of $36.7 million in 2020, mainly explained by (i) a 0.8% increase in yields, coupled with (ii) a 2.8% increase in planted area.
–A negative impact of $1.0 million effect of hyperinflation accounting and translation for our Argentine operations during 2019, compared to a negative impact of $0.8 million in 2020.
–A $3.6 million increase in the recognition at fair value less cost to sell of non-harvested rice, from a loss of $1.3 million in 2019 to a gain of $2.2 million in 2020, mainly explained by higher projected prices.
Partially offset by:
•a $1.2 million decrease in our Dairy segment, from $13.5 million in 2019 (of which $13.9 million were realized) to $12.3 million in 2020 (of which $17.8 million were realized), mainly due to:
–A $4.3 million decrease in the recognition at fair value less cost to sell of unrealized production, from a loss of $0.9
million in 2019 to a loss of $5.2 million in the same period in 2020, mainly due to a lower milk selling price, from 0.31 dollar per liter in 2019 to 0.28 dollar per liter in 2020 resulting in lower valuation herd.
Partially offset by:
–A $3.8 million increase in the recognition at fair value less cost to sell of realized production, from $13.9 million during
2019 to $17.7 million in 2020, mainly due to (i) a 20.0% increase in milking cows, from 9,066 average heads in 2019 to
10,876 average heads in 2020 partially offset by (ii) lower milk selling prices, from 0.31 dollar per liter in 2019 to 0.28 dollar per liter in 2020.
Changes in Net Realizable Value of Agricultural Produce after Harvest
| | | | | | | | | | | | | | | | | | | | | | | | | | | | | | | | | | | |
| Year ended December 31, | Crops | | Rice | | Dairy | | All other segments | | Sugar, Ethanol and Energy | | Total |
| (In thousands of $) |
| 2020 | 7,007 | | | — | | | (2) | | | — | | | — | | | 7,005 | |
| 2019 | 1,825 | | | — | | | — | | | — | | | — | | | 1,825 | |
| | | | | | | | | | | | | | | | | | | | | | | | | | | | | | | |
| Year ended December 31, | Crops | | Rice | | Dairy | | | | Sugar, Ethanol and Energy | | Total |
| (In thousands of $) |
| 2023 | 1,994 | | | — | | | — | | | | | (156) | | | 1,838 | |
| 2022 | (21,359) | | | — | | | — | | | | | (934) | | | (22,293) | |
Changes in net realizable value of agricultural produce after harvest is mainly composed by:comprised of: (i) profit or loss from commodity price fluctuations during the period of time the agricultural produce is in inventory, which impactshas an impact over its fair value; (ii) profit or loss from the valuation of forwardforwards contracts related to agricultural produce in inventory; and (iii) profit from direct exports.
Changes in net realizable value of agricultural produce after harvest increased $5.2decreased US$24.1 million, from a gainloss of $1.8US$22.3 million during 2019for the year ended December 31, 2022, to a gain of $7.0US$1.8 million for the same period in 2020. This2023, as a result of a increase is mainly explained byin crop prices after harvest, which resulted in a higher valuationsfair value of our crops held in inventories due to higher prices duringfor the second half of 2020.year ended December 31, 2023.
General and Administrative Expenses
| | | | | | | | | | | | | | | | | | | | | | | | | | | | | | | | | | | | | | | | | | | | | | | |
| Year ended December 31, | Crops | | Rice | | Dairy | | All other segments | | Sugar, Ethanol and Energy | | Land Transformation | | Corporate | | Total |
| (In thousands of $) |
| 2020 | (6,694) | | | (6,899) | | | (4,788) | | | (118) | | | (15,942) | | | (4) | | | (18,983) | | | (53,428) | |
| 2019 | (5,533) | | | (6,605) | | | (4,098) | | | (150) | | | (21,925) | | | — | | | (18,891) | | | (57,202) | |
| | | | | | | | | | | | | | | | | | | | | | | | | | | | | | | | | | | | | | | | | |
| Year ended December 31, | Crops | | Rice | | Dairy | | | | Sugar, Ethanol and Energy | | | | Corporate | | Total |
| (In thousands of $) |
| 2023 | (9,913) | | | (11.273) | | | (6,955) | | | | | (25,591) | | | | (16,588) | | (70,320) |
| 2022 | (13,310) | | | (15.314) | | | (10,197) | | | | | (21,917) | | | | (23,549) | | (84,287) |
Our general and administrative expenses totaled $53.4decreased 16.6%, from US$84.3 million 6.6% less than 2019. Theduring the year ended December 31, 2022, to US$70.3 million during the same period in 2023. This decrease is mainly explaineddriven by an action plan set by the depreciation of the Argentine Pesocompany which aimed to reduce expenses and the Brazilian Real. This was partially offset by an increase in depreciation expenses for Crops, Rice and Dairy segments, mainly due to recent investments. See also “Capital Expenditure Commitments.”
Selling Expenses
| | | | | | | | | | | | | | | | | | | | | | | | | | | | | | | | | | | | | | | | | |
| Year ended December 31, | Crops | | Rice | | Dairy | | All other segments | | Sugar, Ethanol and Energy | | Corporate | | Total |
| (In thousands of $) |
| 2020 | (17,998) | | | (13,923) | | | (13,540) | | | (214) | | | (49,188) | | | (195) | | | (95,058) | |
| 2019 | (12,724) | | | (20,574) | | | (6,234) | | | (182) | | | (67,116) | | | (142) | | | (106,972) | |
Selling expenses totaled $95.1 million, 11.1% less than 2019.
This decrease is explained by:generate savings, among other initiatives.
Selling Expenses
| | | | | | | | | | | | | | | | | | | | | | | | | | | | | | | | | | | | | |
| Year ended December 31, | Crops | | Rice | | Dairy | | | | Sugar, Ethanol and Energy | | Corporate | | Total |
| (In thousands of $) |
| 2023 | (16,114) | | | (26,449) | | | (17,176) | | | | | (69,155) | | | (198) | | | (129,092) | |
| 2022 | (31,682) | | | (34,436) | | | (26,974) | | | | | (50,165) | | | (258) | | | (143,515) | |
Selling expenses decreased 10%, from US$143.5 million for the year ended December 31, 2022, to US$129.1 million for the same period in 2023. This decrease was driven by:
•a $17.9US$18.9 million decreaseincrease in the Sugar, Ethanol and Energy segment, due to lower taxes paid due to sales of sugar and ethanol measured in TRS and lower energy sales, coupled with the depreciationhigher freight costs as a consequence of the Brazilian Real translatedincrease in sugar sales, in order to lower expenses in dollar terms.
•a $6.7US$15.6 million decrease in the Crops segment, due to lower volumes sold and the elimination of export taxes in some of our crops;
•a US$9.8 million decrease in the Dairy segment, due to lower export selling volume; and
•an US$8 million decrease in the Rice segment due to lower volume sold as well as to the decreaseelimination of export taxes.
Other Operating Income, Net
| | | | | | | | | | | | | | | | | | | | | | | | | | | | | | | | | | | | | | | |
| For the year ended December 31, | Crops | | Rice | | Dairy | | | | Sugar, Ethanol and Energy | | | | Corporate | | Total |
| (In thousands of $) |
| 2023 | 15,285 | | | 7,218 | | | 912 | | | | | 2,463 | | | | | (288) | | | 25,590 | |
| 2022 | (341) | | | (544) | | | (11) | | | | | 2,881 | | | | | (115) | | | 1,870 | |
Other operating income increased from a gain of US$1.9 million for the year ended December 31, 2022, to a gain of US$25.6 million for the same period in white rice sales by 5.5%,2023, primarily due to:
•a US$15.6 million increase in our Crops segment due to the revaluation of investment property, coupled with lower tax rate in export market sales, partially offset with the mark-to-market effect of hyperinflation accountingour soybean and translationcorn hedge positions; and
• a US$7.8 million increase in our Rice segment mainly related to the sale of property, plant and equipment in our rice operations.
Bargain purchase gain
| | | | | | | | | | | | | | | | | | | | | | | | | | | | | | | | | | | | | | | | | | | | | | | |
| For the year ended December 31, | Crops | | Rice | | Dairy | | All Other Segments | | Cattle | | Sugar, Ethanol and Energy | | Corporate | | Total |
| (In thousands of $) |
| 2023 | — | | | — | | | — | | | — | | | — | | | — | | | — | | | — | |
| 2022 | — | | | 10,107 | | | — | | | — | | | — | | | — | | | — | | | 10,107 | |
During 2022 bargain purchase gain includes the results from our M&A operation in rice segment, which generated $10.1 million gain.
Financial Results, Net
Our financial results, net increased from a loss of US$114.4 million for the year ended December 31, 2022, to a gain of US$63.8 million for the same period in 2023. The line of Net gain of inflation effects on the monetary items increases from a loss of US$2.1 million for the year ended December 31, 2022, to a gain of US$28.8 million for the same period in 2023. These reflects the results derived from the exposure of our Argentine operations, fromnet monetary position to inflation in Argentina. Monetary assets generate a loss when exposed to inflation while monetary liabilities generate a gain when inflation reduces their outstanding balances in real terms. The positive results are primarily driven by the impact of $0.5 million effect during 2019 compared to a positive impact of $0.2 millioninflation on our accounts payables and short-term debt in 2020.local currency. Inflation rates in Argentina stood at 211.4% and 94.8% in 2023 and 2022, respectively.
Partially offset by:
•a $7.3 million increase in the Dairy segment due to higher exports of powder milk, from 6.2 thousand tons during 2019 to 13.5 thousand tons in 2020, coupled with higher freight costs of our milk destined to internal market from processing facilities to distribution centers of wholesalers.
Other Operating Income, Net
| | | | | | | | | | | | | | | | | | | | | | | | | | | | | | | | | | | | | | | | | | | | | | | |
| Year ended December 31, | Crops | | Rice | | Dairy | | All other segments | | Sugar, Ethanol and Energy | | Land Transformation | | Corporate | | Total |
| (In thousands of $) |
| 2020 | (12,853) | | | 713 | | | (186) | | | 1,067 | | | 5,495 | | | 7,920 | | | (169) | | | 1,987 | |
| 2019 | (2,508) | | | 267 | | | (703) | | | (354) | | | 126 | | | 2,504 | | | (152) | | | (822) | |
Other operating income increased 2.8 million, from a loss of $0.8 million in 2019, to a gain of $2.0 million during 2020, primarily due to:
•a $5.4 million increase in our Sugar, Ethanol & Energy segment mainly explained by the mark-to-market effect of our sugar hedge position, from a gain of $0.1 million in 2019, to a gain of $5.5 million in 2020.
•a $5.4 million increase in Land Transformation segment due to $2.5 million in 2019 for the sale of "Alto Alegre" farm, located in Brazil, for a total consideration of $16.8 million for 6,080 hectares, compared to $7.9 million in 2020 for the sale the sale of Huelen, a 4,633 hectare farm located in La Pampa Province, Argentina for a total consideration of $30.1 million of which $10.1 million were collected at the closing date; and the sale of "Abolengo" farm, a 811 hectare plot in Argentina's humid Pampas for a total consideration of $12.1 million.
•a $1.4 million increase in All Other Segments related to higher net gains from the fair value adjustment of Investment property, composed of own farms under lease agreements (i.e. beef cattle farms).
Partially offset by:
•a $10.3 million decrease in our Crops segment due to the mark-to-market effect of our soybean and corn hedge positions.
Financial Results, Net
Our financial results, net, represented a loss of $175.7 million in 2020, compared to a loss of $100.2 million in 2019. This was mainly due to a 323.6% increase in foreign exchange losses, from a loss of $25.8 million in 2019 to a loss of $109.3 million during the same period in 2020, mainly explained by higher impact on our dollar denominated debt by the 3.7% nominal depreciation of the Brazilian Real in 2019 compared to a 29.2% nominal depreciation of the Brazilian Real in 2020. This was partially offset by a loss of $3.1 million in other expenses in 2019, compared to a gain of $17.1 in other income in 2020 due to positive results in blue chip swap operations in Argentina.
The following table sets forth the breakdown of financial results for the periods indicated.
| | | | Year ended December 31, | | Year ended December 31, |
| | | 2020 | | 2019 | | | | 2023 | | 2022 | | |
| | | (In $ thousand) | | % Change | | (In thousand of $) | | % Change |
| Interest income | Interest income | 4,084 | | | 6,390 | | | (36.1) | % | Interest income | 7,134 | | | 5,781 | | 5,781 | | | 23.4 | | 23.4 | % |
| Interest expense | Interest expense | (58,282) | | | (56,468) | | | 3.2 | % | Interest expense | (31,906) | | | (50,037) | | (50,037) | | | (36.2) | | (36.2) | % |
| Finance Cost - Right-of-use Assets | Finance Cost - Right-of-use Assets | (12,532) | | | (9,524) | | | 31.6 | % | Finance Cost - Right-of-use Assets | (40,203) | | | (31,113) | | (31,113) | | | 29.2 | | 29.2 | % |
| Foreign exchange losses, net | (109,266) | | | (25,779) | | | 323.9 | % |
| Foreign exchange gain/(losses), net | | Foreign exchange gain/(losses), net | 90,930 | | | 19,278 | | | 371.7 | % |
| Cash flow hedge – transfer from equity | Cash flow hedge – transfer from equity | (24,363) | | | (25,484) | | | (4.4) | % | Cash flow hedge – transfer from equity | (36,863) | | | (40,195) | | (40,195) | | | (8.3) | | (8.3) | % |
| Gain from interest rate /foreign exchange rate derivative financial instruments | Gain from interest rate /foreign exchange rate derivative financial instruments | 92 | | | 1,189 | | | (92.3) | % | Gain from interest rate /foreign exchange rate derivative financial instruments | 3,501 | | | (2,384) | | (2,384) | | | (246.9) | | (246.9) | % |
| Taxes | Taxes | (4,559) | | | (4,364) | | | 4.5 | % | Taxes | (5,473) | | | (4,862) | | (4,862) | | | 12.6 | | 12.6 | % |
| Other Income/(Expenses) | 17,104 | | | (3,092) | | | (653.2) | % |
| Other Income | | Other Income | 47,893 | | | (8,760) | | | (646.7) | % |
| Other financial results - Net gain of inflation effects on the monetary items | Other financial results - Net gain of inflation effects on the monetary items | 12,064 | | | 16,911 | | | (28.7) | % | Other financial results - Net gain of inflation effects on the monetary items | 28,816 | | | (2,144) | | (2,144) | | | (1,444.0) | | (1,444.0) | % |
| Total Financial Results | Total Financial Results | (175,658) | | | (100,221) | | | 75.3 | % | Total Financial Results | 63,829 | | | (114,436) | | (114,436) | | | (155.8) | | (155.8) | % |
Income Tax benefit / (expense)
Current income tax totaled an expense of $ 12.3$78.7 million which equates to an effective rate of 92%in 2023, compared to an expense of $0.8 millions which equates and effective tax rate of 98%.$26.8 million in 2022.
TheIn 2023, income tax calculated at the applicable tax rates to profitsapplicable in the respective countries in 2020 would be $4.2where we operate amounted to an expense of US$103.9 million. Income tax expense has been adjusted for (i) a US$30 million expense. The main adjustments to this amount are: (i) $19.2 millionloss related to the application of IAS 29 on Shareholders'to the shareholders’ equity of our Argentine Subsidiaries; (ii) the recognition of unused tax losses of $ 0.7 million and (iii) $7.6 million related to non deductible items. These effects were partially offset by (i) non-taxable income in the amount of $11.0 million related to a Complementary Law in Brazil, which allows the Company to consider as non-taxable income the Government grant related to the ICMS tax and (ii) $6.3US$1.3 million gain for the effect of thedue to changes in the statutory income tax in Argentina.Argentina and (iii) a US$1.6 million loss related to non-deductible items, partially offset by (a) the recognition of unused tax losses for US$39 million, mainly by our Argentine subsidiaries resulting from Tax inflation adjustment (See Note 10 to our Consolidated Financial Statements), and (b) non-taxable income in the amount of US$20.0 million related to a supplementary law in Brazil (Lei Complementar or the “Suplementary Law”) which provides for ICMS tax benefits granted by the Brazilian Government with the objective of subsidizing investments, by excluding such grants from the calculation of tax benefits.
TheIn 2022, income tax calculated at the applicable tax rates to profitsapplicable in the respective countries in 2019 would be $7.2where we operate amounted to an expense of US$43.8 million. Income tax expense has been adjusted for (i) a US$18.2 million expense. The main adjustments to this amount are: (i) $23.8 millionloss related to the application of IAS 29 on Shareholders'to the shareholders’ equity of our Argentine Subsidiaries;subsidiaries; (ii) a US$2.2 million loss due to changes in the statutory income tax in Argentina; and (iii) a US$1.9 million loss related to non-deductible items, partially offset by (a) the recognition of unused tax losses for $ 3US$19.4 million, mainly by our Argentine subsidiaries resulting from Tax inflation adjustment (See Note 10 to our Consolidated Financial Statements), and (iii) $1.5 million related to non deductible items. These effects were partially offset by (i)(b) non-taxable income in the amount of $11.5US$16.9 million related to a Complementary Lawsupplementary law in Brazil (Lei Complementar or the “Supplementary Law”) which allows the Company to consider as non-taxable income the Government grant related to theprovides for ICMS tax and (ii) $3.1 million gain forbenefits granted by the effectBrazilian Government with the objective of subsidizing investments, by excluding such grants from the changes in the statutory incomecalculation of tax in Argentina.benefits.
Profit/(Loss)Profit for the Year
As a result of the foregoing, our net income during 2020total in 2023 and 2022 increased $0.7US$226.9 million from a gain of $0.3and US$108.6 million, in 2019 to a gain of $1.1 million in 2019.respectively.
YEAR ENDED DECEMBER
Year Ended December 31, 2019 COMPARED TO YEAR ENDED DECEMBER2022, as compared to year ended December 31, 20182021
See “Item 5. Operating and Financial Review and Prospects” in our Annual Report on Form 20-F for the fiscal year ended December 31, 20192022 for a comparative discussion for the years ended December 31, 20192022 and 2018.2021.
Reconciliation of non-IFRS measures:
Below are reconciliations of non-IFRS measures related to our consolidated statements of income. See “Presentation of Financial And Other Information—Non-IFRS Financial Measures.”
The following tables show a reconciliation of Adjusted Segment EBITDA to our segments’ profit / (loss) from operations before financing and taxation, the most directly comparable IFRS financial measure, and a reconciliation of Adjusted Consolidated EBITDA to our net profit (loss) for the year, the most directly comparable IFRS financial measure.
| | | | | | | | | | | | | | | | | | | | | | | | | | | | | | | | | | | | | | | | | | | | | |
| | For the year ended December 31, 2023 |
| | Crops | | Rice | | Dairy | | | | Farming
Subtotal | | Sugar,
Ethanol
and
Energy | | | | Corporate | | Total |
| | (In thousands of $) |
Adjusted Segment EBITDA
(unaudited) | | | | | | | | | | | | | | | | | |
Profit/(Loss) from
Operations as per Segment Information | 8,603 | | | 33,891 | | | 17,572 | | | | | 60,066 | | | 219,734 | | | | | (23,675) | | | 256,125 | |
| | | | | | | | | | | | | | | | | |
| Net (gain) from Fair value adjustment of investment property as per Segment Information | (10,199) | | | (1,176) | | | — | | | | | (11,375) | | | — | | | | | — | | | (11,375) | |
| Reverse of revaluation surplus derived from the disposals of assets before taxes | 20,245 | | | — | | | — | | | | | 20,245 | | | — | | | | | — | | | 20,245 | |
Adjusted Segment EBIT (unaudited)(1) | 18,649 | | | 32,715 | | | 17,572 | | | | | 68,936 | | | 219,734 | | | | | (23,675) | | | 264,995 | |
| Depreciation of Property, plant and equipment and amortization of Intangible Assets as per Segment Information | 8,330 | | | 15,154 | | | 10,913 | | | | | 34,397 | | | 175,903 | | | | | 1,275 | | | 211,575 | |
Adjusted Segment EBITDA (unaudited)(1) | 26,979 | | | 47,869 | | | 28,485 | | | | | 103,333 | | | 395,637 | | | | | (22,400) | | | 476,570 | |
| Reconciliation to Profit | | | | | | | | | | | | | | | | | |
| Profit for the year | | | | | | | | | | | | | | | | | 226,721 | |
| Income tax expense | | | | | | | | | | | | | | | | | 78,673 | |
| Interest expense, net | | | | | | | | | | | | | | | | | 24,772 | |
| Foreign exchange, net | | | | | | | | | | | | | | | | | (90,930) | |
| Other financial results - Net (gain) of inflation effects on the monetary items | | | | | | | | | | | | | | | | | (28,816) | |
| Other financial results, net | | | | | | | | | | | | | | | | | 31,145 | |
| Combined effects of IAS 29 and IAS 21 of the Argentine subsidiaries of Profit from operations | | | | | | | | | | | | | | | | | 14,560 | |
| Revaluation surplus derived from the disposals of assets before taxes | | | | | | | | | | | | | | | | | 20,245 | |
| Net (gain) from Fair value adjustment of investment property as per Segment Information | | | | | | | | | | | | | | | | | (11,375) | |
Adjusted Consolidated EBIT (unaudited) (1) | | | | | | | | | | | | | | | | | 264,995 | |
| Depreciation of Property, Plant and Equipment and amortization of Intangible Assets as per Segment Information | | | | | | | | | | | | | | | | | 211,575 | |
Adjusted Consolidated EBITDA (unaudited)(1) | | | | | | | | | | | | | | | | | 476,570 | |
(1)See “Presentation of Financial and Other Information” for the definitions of “Adjusted Segment EBIT,” “Adjusted Consolidated EBIT,” “Adjusted Segment EBITDA” and “Adjusted Consolidated EBITDA.”
| | | | | | | | | | | | | | | | | | | | | | | | | | | | | | | | | | | | | | | | | | | | | |
| | For the year ended December 31, 2022 |
| | Crops | | Rice | | Dairy | | | | Farming
Subtotal | | Sugar,
Ethanol
and
Energy | | | | Corporate | | Total |
| | (In thousands of $) |
Adjusted Segment EBITDA
(unaudited) | | | | | | | | | | | | | | | | | |
Profit/(Loss) from
Operations as per Segment Information | 18,733 | | | 19,792 | | | 21,385 | | | | | 59,910 | | | 212,850 | | | | | (23,806) | | | 248,954 | |
| Bargain purchase gain on acquisition as per Segment Information | — | | | (10,070) | | | — | | | | | (10,070) | | | | | | | | | (10,070) | |
| Net loss from Fair value adjustment of investment property | 2,184 | | | 580 | | | — | | | | | 2,764 | | | — | | | | | — | | | 2,764 | |
Adjusted Segment EBIT (unaudited)(1) | 20,917 | | | 10,302 | | | 21,385 | | | | | 52,604 | | | 212,850 | | | | | (23,806) | | | 241,648 | |
| Depreciation and amortization | 8,017 | | | 12,215 | | | 10,075 | | | | | 30,307 | | | 160,920 | | | | | (22) | | | 191,205 | |
Adjusted Segment EBITDA (unaudited)(1) | 28,934 | | | 22,517 | | | 31,460 | | | | | 82,911 | | | 373,770 | | | | | (23,828) | | | 432,853 | |
| Reconciliation to Profit | | | | | | | | | | | | | | | | | |
| Profit for the year | | | | | | | | | | | | | | | | | 108,606 | |
| Income tax expense | | | | | | | | | | | | | | | | | 26,758 | |
| Interest expense, net | | | | | | | | | | | | | | | | | 44,256 | |
| Foreign exchange, net | | | | | | | | | | | | | | | | | (19,278) | |
| Other financial results - Net loss of inflation effects on the monetary items | | | | | | | | | | | | | | | | | 2,144 | |
| Other financial results, net | | | | | | | | | | | | | | | | | 87,314 | |
| Combined effects of IAS 29 and IAS 21 of the Argentine subsidiaries of Profit from operations | | | | | | | | | | | | | | | | | (846) | |
| Bargain purchase gain on acquisition as per Segment Information | | | | | | | | | | | | | | | | | (10,070) | |
| Net loss from Fair value adjustment of investment property | | | | | | | | | | | | | | | | | 2,764 | |
Adjusted Consolidated EBIT (unaudited)(1) | | | | | | | | | | | | | | | | | 241,648 | |
| Depreciation and amortization | | | | | | | | | | | | | | | | | 191,205 | |
Adjusted Consolidated EBITDA (unaudited)(1) | | | | | | | | | | | | | | | | | 432,853 | |
(1)See “Presentation of Financial and Other Information” for the definitions of “Adjusted Segment EBIT,” “Adjusted Consolidated EBIT,” “Adjusted Segment EBITDA” and “Adjusted Consolidated EBITDA.”
| | | | | | | | | | | | | | | | | | | | | | | | | | | | | | | | | | | | | | | | | | | | | |
| | For the year ended December 31, 2021 |
| | Crops | | Rice | | Dairy | | | | Farming
Subtotal | | Sugar,
Ethanol
and
Energy | | | | Corporate | | Total |
| | (In thousands of $) |
Adjusted Segment EBITDA
(unaudited) | | | | | | | | | | | | | | | | | |
Profit/(Loss) from
Operations as per Segment Information | 49,317 | | | 32,976 | | | 15,757 | | | | | 98,050 | | | 190,873 | | | | | (22,322) | | | 266,601 | |
| Net loss from fair value adjustment of investment property | 2,832 | | | 1,052 | | | — | | | | | 3,884 | | | — | | | | | — | | | 3,884 | |
| | | | | | | | | | | | | | | | | |
Adjusted Segment EBIT (unaudited)(1) | 52,149 | | | 34,028 | | | 15,757 | | | | | 101,934 | | | 190,873 | | | | | (22,322) | | | 270,485 | |
| Depreciation and amortization | 6,583 | | | 8,173 | | | 7,144 | | | | | 21,900 | | | 143,981 | | | | | 738 | | | 166,619 | |
Adjusted Segment EBITDA (unaudited)(1) | 58,732 | | | 42,201 | | | 22,901 | | | | | 123,834 | | | 334,854 | | | | | (21,584) | | | 437,104 | |
| Reconciliation to Profit | | | | | | | | | | | | | | | | | |
| Profit for the year | | | | | | | | | | | | | | | | | 130,717 | |
| Income tax benefit | | | | | | | | | | | | | | | | | 43,837 | |
| Interest expense, net | | | | | | | | | | | | | | | | | 58,455 | |
| Foreign exchange, net | | | | | | | | | | | | | | | | | (18,939) | |
| Other financial results - Net (gain) of inflation effects on the monetary items | | | | | | | | | | | | | | | | | (11,541) | |
| Other financial results, net | | | | | | | | | | | | | | | | | 75,495 | |
| Combined effects of IAS 29 and IAS 21 of the Argentine subsidiaries of Profit from operations | | | | | | | | | | | | | | | | | (11,423) | |
| Net loss from fair value adjustment of investment property | | | | | | | | | | | | | | | | | 3,884 | |
| | | | | | | | | | | | | | | | | |
Adjusted Consolidated EBIT (unaudited)(1) | | | | | | | | | | | | | | | | | 270,485 | |
| Depreciation and amortization | | | | | | | | | | | | | | | | | 166,619 | |
Adjusted Consolidated EBITDA (unaudited)(1) | | | | | | | | | | | | | | | | | 437,104 | |
(1)See “Presentation of Financial and Other Information” for the definitions of “Adjusted Segment EBIT,” “Adjusted Consolidated EBIT,” “Adjusted Segment EBITDA” and “Adjusted Consolidated EBITDA.”
| | | | | | | | | | | | | | | | | | | | |
| Adjusted Net Income | | | | | | |
| | 2023 | | 2022 | | 2021 |
| | (In thousands of $) |
| Profit for the year | | 226,721 | | | 108,606 | | | 130,717 | |
| Foreign exchange gains, net | | (90,930) | | | (19,278) | | | (18,939) | |
| Cash flow hedge – transfer from equity | | 36,863 | | | 40,195 | | | 52,650 | |
| Other financial results - Net (gain) / loss of inflation effects on monetary items | | (28,816) | | | 2,144 | | | (11,541) | |
| Net (gain) / loss from fair value adjustment of investment property | | (10,620) | | | 2,961 | | | 4,331 | |
| Bargain purchase gain on acquisition | | — | | | (10,107) | | | — | |
| Revaluation surplus of farmland sold | | 20,245 | | | — | | | — | |
| Adjusted Net income | | 153,463 | | | 124,521 | | | 157,218 | |
| | | | | | | | | | | | | | | | | | | | | |
| Adjusted Free Cash Flow | 2023 | | 2022 | | 2021 | | | | |
| (In thousands of $) | | | | |
| Net cash generated from operating activities | 434,907 | | | 370,026 | | | 348,662 | | | | | |
| Net cash used in investing activities | (111,552) | | | (299,264) | | | (175,221) | | | | | |
| Interest paid | (55,476) | | | (44,788) | | | (53,587) | | | | | |
| Lease payments | (104,097) | | | (91,175) | | | (62,273) | | | | | |
| Dividends paid to non-controlling interest | — | | | (358) | | | (311) | | | | | |
| Short-term investments | (35,610) | | | 98,010 | | | — | | | | | |
| Reversal of Expansion Capital expenditures (unaudited) | 67,119 | | | 70,786 | | | 58,030 | | | | | |
| Other financial income | (54,687) | | | — | | | (12,708) | | | | | |
| IAS 29 & IAS 21 effect for operating Activities | 16,383 | | | 38,043 | | | 30,666 | | | | | |
| IAS 29 & IAS 21 effect for investing Activities - less the effect over gains on bond arbitrage transactions included in Other financial income | 10,635 | | | 83 | | | 4,896 | | | | | |
| IAS 29 & IAS 21 effect for Interest Paid | 8,253 | | | (77) | | | 1,109 | | | | | |
| Adjusted Free Cash Flow from Operations (unaudited) | 175,875 | | | 141,286 | | | 139,263 | | | | | |
| Expansion Capital expenditures (unaudited) | (67,119) | | | (70,786) | | | (58,030) | | | | | |
| Adjusted Free Cash Flow (unaudited) | 108,756 | | | 70,500 | | | 81,233 | | | | | |
| | | | | | | | | | | | | | | | | | | | | |
| Indebtedness | 2022 | | 2021 | | 2020 | | | | |
| (In thousands of $) | | | | |
| Net Debt (unaudited) | 502,531 | | | 678,528 | | | 617,885 | | | | | |
| Net Debt / Adjusted Consolidated EBITDA (unaudited) | 1.05 x | | 1.56 x | | 1.41 x | | | | |
| | | | | | | | | | | | | | | | | | | | | |
| Reconciliation - Net Debt | 2023 | | 2022 | | 2021 | | | | |
| (In thousands of $) | | | | |
| Total Borrowings | 904,949 | | | 1,007,752 | | | 817,651 | | | | | |
| Cash and cash equivalents | (339,781) | | | (230,653) | | | (199,766) | | | | | |
| Restricted short-term investments | (62,637) | | | (98,571) | | | — | | | | | |
| Net Debt (unaudited) | 502,531 | | | 678,528 | | | 617,885 | | | | | |
Reconciliation of Adjusted Free Cash Flow to Net increase/(decrease) in Cash and Cash Equivalents
| | | | | | | | | | | | | | | | | | | | | |
| | 2023 | | 2022 | | 2021 | | | | |
| (In thousands of $) | | | | |
| Net increase/(decrease) in cash and cash equivalents | 114,612 | | | 47,189 | | | (129,692) | | | | | |
| Interest Paid | (55,476) | | | (44,788) | | | (53,587) | | | | | |
| Lease Payments | (104,097) | | | (91,175) | | | (62,273) | | | | | |
| Dividends paid to non-controlling interest | — | | | (358) | | | (311) | | | | | |
| Restricted short-term investment | (35,610) | | | 98,010 | | | — | | | | | |
| Other financial income | (54,687) | | | — | | | (12,708) | | | | | |
| Net cash used in financing activities | 208,743 | | | 23,573 | | | 303,133 | | | | | |
| IAS 29 & IAS 21 effect for operating activities | 16,383 | | | 38,043 | | | 30,666 | | | | | |
| IAS 29 & IAS 21 effect for investing activities | 10,635 | | | 83 | | | 4,896 | | | | | |
| IAS 29 & IAS 21 effect for interest paid | 8,253 | | | (77) | | | 1,109 | | | | | |
| Adjusted Free Cash Flow (unaudited) | 108,756 | | | 70,500 | | | 81,233 | | | | | |
Reconciliation of Adjusted Free Cash Flow from operations to Net increase/(decrease) in Cash and Cash Equivalents
| | | | | | | | | | | | | | | | | | | | | |
| | 2023 | | 2022 | | 2021 | | | | |
| (In thousands of $) | | | | |
| Net increase/(decrease) in cash and cash equivalents | 114,612 | | | 47,189 | | | (129,691) | | | | | |
| Expansion Capital Expenditures (unaudited) | 67,119 | | | 70,786 | | | 58,030 | | | | | |
| Interest Paid | (55,476) | | | (44,788) | | | (53,587) | | | | | |
| Lease payments | (104,097) | | | (91,175) | | | (62,273) | | | | | |
| Dividends paid to non-controlling interest | — | | | (358) | | | (311) | | | | | |
| Restricted short-term investment | (35,610) | | | 98,010 | | | — | | | | | |
| Other financial income | (54,687) | | | — | | | (12,708) | | | | | |
| Net cash used in financing activities | 208,743 | | | 23,573 | | | 303,133 | | | | | |
| IAS 29 & IAS 21 effect for operating activities | 16,383 | | | 38,043 | | | 30,666 | | | | | |
| IAS 29 & IAS 21 effect for investing activities | 10,635 | | | 83 | | | 4,896 | | | | | |
| IAS 29 & IAS 21 effect for interest paid | 8,253 | | | (77) | | | 1,109 | | | | | |
| Adjusted Free Cash Flow from operations (unaudited) | 175,875 | | | 141,286 | | | 139,264 | | | | | |
B.LIQUIDITY AND CAPITAL RESOURCES
Our liquidity and capital resources are and will be influenced by a variety of factors, including:
•our ability to generate cash flows from our operations;
•the level of our outstanding indebtedness and the interest that we are obligated to pay on such outstanding indebtedness;
•our capital expenditure requirements, which consist primarily of investments in new farmland, in our operations, in equipment and plant facilities and maintenance costs; and
•our working capital requirements.
Our principal sources of liquidity have traditionally consisted of shareholders’ contributions, short and long term borrowings and proceeds received from the disposition of transformed farmland or subsidiaries.
We believe that our working capital will be sufficient during the next 12 months to meet our liquidity requirements.
Years ended December 31, 20202023 and 20192022
The table below reflects our statements of Cash Flow for the fiscal years ended December 31, 20202023 and 2019.2022.
| | | | | | | | | | | | | |
| | Year ended December 31, |
| | 2020 | | 2019 (*) | | |
| | (in thousands of $) |
| Cash and cash equivalents at the beginning of the year | 290,276 | | | 273,635 | | | |
Effect of exchange rate changes and inflation on cash and cash equivalents (d) | (35,284) | | | (17,967) | | | |
Net cash generated from operating activities (a) | 257,125 | | | 322,110 | | | |
Net cash used in investing activities (b) | (121,916) | | | (249,639) | | | |
Net cash used from financing activities (c) | (53,919) | | | (37,863) | | | |
| Cash and cash equivalents at the end of the year | 336,282 | | | 290,276 | | | |
| | | | | | | | | | | | | |
| | Year ended December 31, |
| | 2023 | | 2022 | | |
| | (in thousands of $) |
| Cash and cash equivalents at the beginning of the year | 230,653 | | | 199,766 | | | |
| Net cash generated from operating activities (1) | 434,907 | | | 370,026 | | | |
| Net cash used in investing activities (2) | (111,552) | | | (299,264) | | | |
| Net cash used from financing activities (3) | (208,743) | | | (23,573) | | | |
| Effect of exchange rate changes and inflation on cash and cash equivalents (4) | (5,484) | | | (16,302) | | | |
| Cash and cash equivalents at the end of the year | 339,781 | | | 230,653 | | | |
(a)(1) Includes (14,956)US$ thousands (16,383) and 23,550US$ thousands (38,043) of the combined effect of IAS 29 and IAS 21 of the Argentine subsidiaries for 20202023 and 2019,2022 , respectively.
(b)(2) Includes (429)US$ thousands (41,179) and 2,922US$ thousands (83) of the combined effect of IAS 29 and IAS 21 of the Argentine subsidiaries for 20202023 and 2019,2022, respectively.
(c)(3) Includes 15,694US$ thousands 45,933 and (14,340)US$ thousands 45,359 of the combined effect of IAS 29 and IAS 21 of the Argentine subsidiaries for 20202023 and 2019,2022, respectively.
(d)(4) Includes (309)US$ thousands 11,629 and (12,132)US$ thousands (7,233) of the combined effect of IAS 29 and IAS 21 of the Argentine subsidiaries for 20202023 and 2019,2022, respectively.
(*) Prior periods have been recast to reflect the Company's change in accounting policy for the reclassification within financial results as explained in Note 34.1 of our Consolidated Financial Statements. See Note 34 to our Consolidated Financial Statements.
Operating Activities
Year ended December 31, 20202023
For the year ended December 31, 2020,2023, net cash generated by operating activities was $257.1$434.9 million. During this year, we generated a net gain of $1.1$226.7 million that included non-cash charges relating primarily to depreciation of Property, plant and equipment and Right of use assets for $182.7$274.1 million, interest and other financial expenses, net of $47.7$16.4 million, foreign exchanges losses for $109.3 million, $24.4$36.9 million loss as a result of the reclassification from Equity to Financial results, net in connection with the cash flow hedge accounting and $12.1unrealized losses in initial recognition and changes in fair value of non-harvested biological assets of $17.7 million. All these effects were partially offset by a gain of $8.6 million netas a result of our derivative financial instruments position, foreign exchange gains of $90.9 million, and a $28.8 million gain ofresulting from inflation effects on the monetary items.
In addition, other changes in operating asset and liability balances resulted in a net decrease in cash of $85.2$70.8 million, primarily due to an increasea decrease in trade and other receivables. During 2020payables and an increase in biological assets. For the year ended December 31, 2023, income tax paid totaled $2.1$1.3 million.
The net cash generated by operating activities in 20202023 includes $15.0a $16.4 million of the negative combined effect resulting from the application of IAS 29 and IAS 21 of theby our Argentine subsidiaries. (See “Item 5. Operating and Financial Review and Prospects-A. Operating Results- Critical Accounting Policies and Estimates”).
Year ended December 31, 20192022
For the year ended December 31, 2019,2022, net cash generated by operating activities was $322.1$370.0 million. During this year, we generated a net gain of $0.3$108.6 million that included non-cash charges relating primarily to depreciation of Property, plant and amortizationequipment and Right of $219.6use assets for $254.4 million, interest, finance cost related to lease liabilitiesInterest and other financial expenses, net of $59.9$83.1 million, $25.8 million foreign exchanges losses, $25.5$40.2 million loss as a result of the reclassification from Equity to Financial results, net in connection with the cash flow hedge accounting and $16.9losses for $13.7 million netas a result of our derivative financial instruments position. All these effects were partially offset by an unrealized gain in initial recognition and changes in fair value of inflation effectsnon-harvested biological assets of $44.9 million, foreign exchange gains of $19.3 million and a $10.1 million gain resulting from bargain purchase gain on the monetary items.acquisitions.
In addition, other changes in operating asset and liability balances resulted in a net decrease in cash of $15.6$86.8 million, primarily due to an increase in trade and other receivables.receivables and a decrease in trade and other accounts payable. During 20192022 income tax paid totaled $2.3$8.1 million.
The net cash generated by operating activities in 20192022 includes $23.6a $38.0 million ofnegative combined effect resulting from the positive combined effectapplication of IAS 29 and IAS 21 of theby our Argentine subsidiaries. (See “Item 5. Operating and Financial Review and Prospects-A. Operating Results- Critical Accounting Policies and Estimates”).
Investing Activities
Year ended December 31, 20202023
Net cash used in investing activities totaled $121.9$111.6 million infor the year ended December 31, 2020,2023, primarily due to $63.8an investment of $133.3 million related to the renewal and expansion of our sugarcane plantation; $76.3plantation, a $113.3 million mainly driven byinvestment for the purchase of agricultural and industrial equipment, related to small projects including the ongoingconstruction of our second biodigester in order to increase our biogas production, which later is converted into biomethane and is used to replace our diesel consumption in Brazil, and the conclusion of the construction of our second biodigestor and the upgrade of our cheese equipment to enhance our product portfolio offering in our Dairy business. Net inflows from investing activities were related to financial gains on bond arbitrage transactions for $54.7 million, $37.3 million collected from the sale of farmland and other assets and disposals of short term investment, net of acquisition for $35.6 million.
Net cash used in investing activities in 2023 includes a $41.2 million negative combined effect resulting from the application of IAS 29 and IAS 21 by our Argentine subsidiaries, of which $30.5 million is related to financial gains on bond arbitrage transactions.
Year ended December 31, 2022
Net cash used in investing activities totaled $299.3 million in the expansionyear ended December 31, 2022, primarily due to an investment of crushing capacity in Ivinhema,$103.2 million related to the purchase of industrial equipment for our peanut processing facility coupled with renewal and expansion of our dairy herdsugarcane plantation, a $125.9 million investment for the purchase of agricultural and industrial equipment, as we strive to maintain and expand the crushing capacity of our new free stall.Ivinhema and Angelica mills, capitalization of interharvest costs, the construction of our second biodigestor in our Dairy business and the investments in cheese equipment to enhance our product portfolio offering; and a $98 million investment in US-Treasury bills which are used as collateral of short-term borrowings. Net inflows from investmentsinvesting activities were related to proceeds from the sale of farmland and other assets for $29.7$22.6 million and installments from the sale of subsidiaries and interest income of $25.4$5.2 million. In addition, cash and cash equivalents resulting from our acquisition of Viterra’s operations, net of the first installment of such acquisition, in turn, resulted in an inflow of $1.1 million.
Net cash used in investing activities in 2022 includes $0.4a $0.1 million ofnegative combined effect resulting from the negative combine effectapplication of IAS 29 and IAS 21 of the Argentine subsidiaries.
Year ended December 31, 2019
Net cash used in investing activities totaled $249.6 million in the year ended December 31, 2019, primarily due to $98.6 million related to the renewal and expansion ofby our sugarcane plantation; $156.6 million, mainly driven by the purchase of agricultural and industrial equipment related to the ongoing investment in the expansion of crushing capacity in Ivinhema and the acquisition of two milk processing facilities, two brands from SanCor and one peanut processing facility. Net inflows from investments activities were related to proceeds from the sale of farmland and other assets for $8.5 million and interest income of $7.2 million.
Net cash used in investing activities includes $2.9 million of the positive combine effect of IAS 29 and IAS 21 of the Argentine subsidiaries.
Financing Activities
Year ended December 31, 20202023
Net cash used in financing activities was $53.9$208.7 million in the year ended December 31, 2020,2023, mainly due to lease payments for $104.1 million related to an increase in the planted area and price per hectare, also there was a distribution of $61.2 million to our shareholders via the repurchase of 2.7 million shares, that equaled a total of $26.2 million and the payment cash dividends for an amount of $35.0 million. For the year ended December 31, 2023, interest paid totaled $55.5 million. All these effects were partially offset by proceeds, net of payments of long and short-term borrowings totaled $11.9 million.
Net cash used in financing activities includes a $45.9 million negative combined effect resulting from the application of IAS 29 and IAS 21 by our Argentine subsidiaries, $8.3 million of which is over interest paid.
Year ended December 31, 2022
Net cash used in financing activities was $23.6 million in the year ended December 31, 2022, primarily derived from the incurrence in Brazil ofa new long termlong-term loan for $116.0$41.1 million and from the incurrence of short terma short-term loan of $207.2$347.9 million for our working capital expenditures. All these effects were partially offset by payments of long and short termshort-term borrowings for $34.8$14.0 million and $233.5$192.6 million, respectively. These payments include an $8.0 million payment for the acquisition of certain subsidiaries of Viterra. During this periodyear, interest paid net totaled $60.0$44.8 million and re-purchasethe repurchase of our own shares totaled $4.4$36.8 million.
Net cash used in financing activities includes $15.7a $45.4 million ofnegative-combined effect resulting from the negative combine effectapplication of IAS 29 and IAS 21 of theby our Argentine subsidiaries, $0.1 million of which $1.6 million negative effect areis over Interestinterest paid.
Year endedCapital Expenditure Commitments
As of December 31, 2019
Net cash used by financing activities was $37.9 million in the year ended December 31, 2019, primarily derived from the incurrence in Brazil of new long term loan by Certificados de Recebíveis do Agronegócio (CRA)2023, we had no material commitments for $99.2 million and from the incurrence of short term loan of $194.0 million for our working capital expenditures. All these effects were partially offset by payments of long and short term borrowings for $101.8 million and $131.5 million, respectively. During this period Interest paid net totaled $54.0 million and re-purchase of our own shares totaled $4.3 million.
Net cash used in financing activities includes $14.3 million of the negative combine effect of IAS 29 and IAS 21 of the Argentine subsidiaries, of which $4.4 million positive effect are over Interest paid.
In December 2019, Adecoagro Vale do Ivinhema placed R$ 400.0 million in Certificados de Recebíveis do Agronegócio (CRA), due in November 2027 and bearing an interest of IPCA (Brazilian official inflation rate) + 3.80% per annum.
Cash and Cash Equivalents
Historically, since our cash flows from operations were insufficient to fund our working capital needs and investment plans, we funded our operations with proceeds from short-term and long-term indebtedness and capital contributions from existing and new private investors. In 2011, we raised $421.8 million from an Initial Public Offering (“IPO”) and simultaneous private placement. As of December 31, 2020,2023, our cash and cash equivalents amounted to $336.3$339.8 million.
However, we may need additional cash resources in the future to continue our investment plans. Also, we may need additional cash if we experience a change in business conditions or other developments. We also might need additional cash resources in the future if we find and wish to pursue opportunities for investment, acquisitions, strategic alliances or other similar investments. If we ever determine that our cash requirements exceed our amounts of cash and cash equivalents on hand, we might seek to issue debt or additional equity securities or obtain additional credit facilities or realize the disposition of transformed farmland and/or subsidiaries. Any issuance of equity securities could cause dilution for our shareholders. Any incurrence of additional indebtedness could increase our debt service obligations and cause us to become subject to additional restrictive operating and financial covenants, and could require that we pledge collateral to secure those borrowings, if permitted to do so. It is possible that, when we need additional cash resources, financing will not be available to us in amounts or on terms that would be acceptable to us or at all.
Indebtedness and Financial Instruments
The table below illustrates the maturityFor a description of our indebtedness (excluding obligations under finance leases) and main financial instruments, see Note 26 to our exposure to fixed and variable interest rates:
| | | | | | | | | | | |
| | As of December 31, |
| | 2020 | | 2019 |
| Fixed rate: | | | |
| Less than 1 year(l) | 116,113 | | | 120,154 | |
| Between 1 and 2 years | 52,175 | | | 46,247 | |
| Between 2 and 3 years | 39,844 | | | 55,453 | |
| Between 3 and 4 years | 12,500 | | | 40,725 | |
| Between 4 and 5 years | — | | | 10,331 | |
| More than 5 years | 497,009 | | | 595,550 | |
| Total fixed rate: | 717,641 | | | 868,460 | |
| Variable rate: | | | |
| Less than 1 year(l) | 41,513 | | | 67,924 | |
| Between 1 and 2 years | 32,870 | | | 20,007 | |
| Between 2 and 3 years | 6,035 | | | 7,197 | |
| Between 3 and 4 years | 5,154 | | | 4,692 | |
| Between 4 and 5 years | 28,334 | | | — | |
| More than 5 years | 139,543 | | | — | |
| Total variable rate: | 253,449 | | | 99,820 | |
| Total: | 971,090 | | | 968,280 | |
(1)The Company plans to partially rollover its short term debt using new available lines of credit, or on using operating cash flow to cancel such debt.
Borrowings incurred by the Company’s subsidiaries in Brazil are repayable at various dates between January 2021 and November 2027 and bear either fixed interest rates ranging from 2.50% to 7.95% per annum or variable rates based on LIBOR or other specific base-rates plus spreads ranging from 1.62% to 4.24% per annum. At December 31, 2020 there are no borrowings subject to LIBOR (six months). At December 2019, LIBOR (six months) was 2.88%.
Borrowings incurred by the Company´s subsidiaries in Argentina are repayable at various dates between January 2021 and June 2028 and bear either fixed interest rates ranging from 2.75% and 7.0% per annum or variable rates based on LIBOR or other specific base-rates plus spreads of 4.0% for those borrowings denominated in U.S. Dollar, and a fixed interest rate ranging from 30% to 39% per annum for those borrowings denominated in Argentine pesos.
Brazilian Subsidiaries
The main loans of the Company’s Brazilian Subsidiaries identified below are:
| | | | | | | | | | | | | | | | | | | | | | | | | | | | | |
| Bank | Grant date | Nominal amount | Capital outstanding as of December 31 | Maturity date | Annual interest rate |
| 2020 | 2019 |
| (In millions) | Millions of
Reais | Millions of equivalent Dollars | Millions of
equivalent
Dollars |
| Banco Do Brasil (1) | October 2012 | R$ | 130.0 | | R$ | 36.8 | | 7.08 | | 13.4 | | November 2022 | 2.94% minus 15% of performance bonus |
| Itau BBA FINAME Loan (2) | December 2012 | R$ | 45.9 | | R$ | 7.3 | | 1.40 | | 1.6 | | December 2022 | 2.50% |
| Banco do Brasil / Itaú BBA Finem Loan (3) | September 2013 | R$ | 273.0 | | R$ | 49.4 | | 9.51 | | 16.5 | | January 2023 | 6.83% |
| BNDES Finem Loan (4) | November 2013 | R$ | 215.0 | | R$ | 55.4 | | 10.66 | | 20.8 | | January 2023 | 3.75% |
| ING Bank N.V. (5) | October 2018 | US$ | 75.0 | | | — | | 75.00 | | 75.0 | | October 2023 | 6.33% |
| Certificados Recebíveis do Agronegócio (CRA) | December 2019 | R$ | 405.0 | | R$ | 405.0 | | 77.92 | | 99.2 | | November 2027 | 3,80% + IPCA |
| Banco do Brasil NCE Loan | March 2020 | R$ | 150.0 | | R$ | 75.0 | | 14.43 | | — | | March 2021 | 4.14% |
| Debênture Loan (6) | December 2020 | R$ | 403.2 | | R$ | 403.2 | | 77.59 | | — | | December 2026 | 4,24% + IPCA |
(1)Collateralized by (i) a first degree mortgage of the Carmen (Santa Agua) farm; and (ii) liens over the Ivinhema mill and equipment.
(2)Collateralized by (i) a first degree mortgage of the Carmen (Santa Agua) farm; and (ii) liens over the Ivinhema mill and equipment.
(3)Collateralized by (i) a first degree mortgage of the Carmen (Santa Agua) farm; (ii) liens over the Ivinhema mill and equipment; and (iii) long term power purchase agreements (PPA).
(4)Collateralized by (i) liens over the Ivinhema mill and equipment; and (ii) power sales contracts.
(5)Collateralized by sales contracts.
(6)Collateralized by fiduciary assignment of energy contracts.
In December 2019, Adecoagro Vale do Ivinhema placed R$ 400.0 million in Certificados de Recebíveis do Agronegócio (CRA) adjustable by the IPCA (Brazilian official inflation rate), maturing in November 2027 and bearing an interest of 3.80% per annum. This debt was issued with no guarantee.
Argentinian Subsidiaries
The principal loan of Adeco Agropecuaria S.A. and Pilaga S.A., our Argentinian Subsidiaries is:
| | | | | | | | | | | | | | | | | | | | |
| Bank | Grant date | Nominal
amount | Capital outstanding as of
December 31 | Maturity date | Annual interest rate |
| 2020 | 2019 |
| (In millions) | (In millions) | (In millions) |
| IFC Tranche A (1) | 2016 | US$25.0 | — | 18.18 | September, 2023 | 4% plus LIBOR |
| IFC Tranhce B (1) | 2016 | US$25.0 | — | 14.29 | September, 2021 | 4% plus LIBOR |
| Rabobank (2) | 2018 | US$50.0 | 50.00 | 50.00 | June, 2024 | 6.17% |
| IFC Tranche A (3) | 2020 | US$12.6 | 12.60 | — | June, 2028 | 4% plus LIBOR |
| IFC Tranche B (3) | 2020 | US$9.4 | 9.41 | — | June, 2028 | 4% plus LIBOR |
(1) Collateralized by a US$ 113 million mortgage over Carmen farm, which is property of Adeco Agropecuaria S.A.
(2) Collateralized by the pledged of the shares of Dinaluca S.A., Compañía Agroforestal S.M.S.A. and Girasoles del Plata S.A.
(3) Collateralized by a US$ 241.8 million mortgage over Carmen,Abolengo, San Carlos, Las Horquertas, and La Rosa farm, which is property of Adeco Agropecuaria S.A. A US$ 35.7 million mortgage over El Meridiano farm, which is property of Pilaga S.A. And a US$ 44.3 million mortgage over Santa Lucia farm, which is property of Bañados del Salado S.A.
The above mentioned loans contain customary financial covenants and restrictions which require us to meet pre-defined financial ratios, among other restrictions, as well as restrictions on the payment of dividends. These financial ratios are measured considering the statutory financial statements of the Argentinian Subsidiaries.
Senior Notes 2027
On September 21, 2017, the Company issued senior notes (the “Notes 2027”) for US$ 500 million, at an annual nominal rate of 6%. The Notes will mature on September 21, 2027. Interest on the Notes is payable semi-annually in arrears on March 21 and September 21 of each year, beginning on March 21, 2018. The total proceeds of the issuance net of expenses was $495.7 million.
During 2020 and 2019 the Company was in compliance with all financial covenants.
Short-term Debt.
As of December 31, 2020, our short term debt totaled $157.6 million.
Weaddition, we maintain lines of credit with several banks in order to finance our working capital requirements. We believe that we will continue to be able to obtain additional credit to finance our working capital needs in the future based on our past track record and current market conditions.
C. RESEARCH AND DEVELOPMENT, PATENTS AND LICENSES, ETC.
We are involved in rice breeding and development of new varieties with respect to our rice seed business in Argentina. Our efforts are aimed to improve all processes related to the selection of better materials. The objective is to obtain superior cultivars with better yields, industrial performance, commercial quality and culinary parameters, with market demand being the main driver. For that, we constantly do cross-breeding with many varieties in order to achieve new ones with enhanced features. We do that for different rice types, such as long grain, short grain, and round grain among others. At the field level, we aim our breeding of new varieties and rice hybrids adapted to local conditions and production parameters. At the lab level, we are working with molecular markers, that help us to identify specific DNA details, and thus we can improve quality parameters of the seed, such as purity.
In relation to these objectives, we have concluded agreements with selected research and development institutions such as INTA in Argentina, FLAR and HIAAL in Colombia, EPAGRI, IRGA, BASF and others. Our rice seed research team continuously tests and develops new varieties, applying a highly technified and efficient breeding and selection system. We continue strengthening our partnership with HIAAL (Híbridos de Arroz para América Latina or Rice Hybrids for Latam) to develop hybrid rice seeds, with the goal of expanding the scale of hybrid seed production. In addition to this, we keep working with the National University of Northeast of Argentina, aiming to develop double-haploid seeds, which will help us to reduce the selection process from five to one year.
Since 2008, we have developed and released four new varieties of rice on the market. The latest released variety, called SCS121 CL, was introduced to the program in 2017 and includes Clearfield® technology, developed in collaboration with BASF, and is tolerant to the herbicides that control harmful weeds. In 2020 we have registered a new variety, Ita Caabo 109, which is best suited for the center-south of the rice region. Currently, we have an additional cultivar in the registration process. We have registered our own varieties of rice seeds with the corresponding Argentine authorities, the National Seed Institute (INASE) and the National Registry of Seed Variety Properties (RNPC). With respect to the intellectual property of our seeds, we operate under the standards of ArPOV (Argentine Association of Plant Variety Protection).
We use our seed varieties on our farms and sell them to rice producers in Argentina, Brazil, Uruguay and Paraguay.
We have also developed Zero Grade Level technology in most of our farms, which help us to reduce water consumption and so energy consumption as well. For hilly farms, we are implementing Polypipe irrigation system, where we can also save water an energy. Additionally, for all the farms, we are developing an Irrigation Surveillance methodology based on the use of Drones, water sensors connected through IoT and digital platforms, from which we are improving water management efficiencies and enhancing rice yield performance. In addition to this, we are developing a digital platform where we can centralized all the technical information (seed, planting date, fertilizers, irrigation, farmworks, harvest, etc.) All this information is avaliable online through desk computers and mobile phones. See more details for both cases in “Technology and Best Practices” section.
Regarding our Sugar, & Ethanol business,and Energy segment, we have effectively implemented state-of-the-art technologies such as high pressurehigh-pressure boilers for high cogeneration capacity, full mechanization of agricultural operations with online GPS tracking systems on all vehicles (trucks, combines, planters), and concentrated vinasse system among others. In order toTo optimize the fertilization of sugarcane, we are currently enriching the vinasse with different nutrient concentrations, such as nitrogen, phosphorus, sulfur, boron and zinc. We are also using drones in our plantations in order to improve some operational efficiencies such as planting quality, biological control, weed monitor and pesticidephytosanitary products spraying, among others.
During the lastIn recent years, we have been developing a seedling production method called “MPB” (Muda Pre Brotada or Pre-Sprout Seedling). It briefly consistThis method consists of making the seedling sprout in a greenhouse and planting themit directly on the fields, instead of the traditional planting of billets (sugarcane stalk pieces). Two main goals are pursued through this technique. One is to introducetechnique: the quick introduction of new promising and healthy varieties quickly. Second goal is to obtain aof seeds and the reduction of planting cost, which is achieved by using much less volume of planting seedling per hectare. In addition, and because of this, more land can be applied toused for sugarcane for milling, instead of using that sugarcane for seedling purposes. In 2020,2022, we have produced as much as 1719.6 million of MPB inputs, enough to plant 1,600 hectares of sugarcane.
We are also developing vinasse-to-biogas technology in our Clustercluster in Mato Grosso do Sul (For(for more detailsdetail, see “Sugar,“Item 4. Information of the Company—A. Business Overview—Operations and Principal Activities—Sugar, Ethanol and Energy” in “Operations and Principal Activities” Section)Energy Business”). In 2017, we have obtained a patent for the process to produce biogas from sugarcane vinasse. This patentvinasse, which is owned in equal partstogether with Methanum Engenharia Ambiental. In the industry, we have recently implemented Artificial Intelligenceartificial intelligence alongside an automation process, which is based on Real Time Optimization.real-time optimization. By assessing mass balance and measuring main KPIskey performance indicators every other 10 seconds, the system helphelps us to enhance efficienciesour efficiency all along the industrial processes.
Regarding our Rice business in Argentina, we are involved in the breeding and development of new traits. We seek to improve all processes related to the selection of better rice materials. Our objective is to obtain superior cultivars with better yields, industrial performance, commercial quality, and culinary parameters as driven by the market demand. To that end, we engage in crossbreeding with multiple varieties to achieve new seeds with superior features. We do so for different types of rice, such as long-grain, short-grain and round-grain rice. At the field level, we seek to breed new varieties and rice hybrids adapted to local conditions and production parameters. At the lab level, we are working with molecular markers that help us identify specific DNA details and improve quality parameters of the seed, such as purity.
In connection with these efforts, we have entered into agreements with selected research and development institutions such as Instituto Nacional de Tecnología Agropecuaria in Argentina, Instituto Riograndense do Arroz in Brazil, Híbridos de Arroz para América Latina in Colombia, Fondo Latinoamericano para Arroz de Riego in Colombia, Empresa de pesquisa Agropecuária e Extensão Rural de Santa Catarina in Brazil, and BASF in Germany to develop hybrid rice seeds and expand the scale of hybrid seed production. In addition, we are working with the National University of the Northeast of Argentina to develop double-haploid seeds, which will help us to reduce the selection process from five years to one.
Since 2008, we have developed and released four new varieties of rice on the market. The SCS121 CL was developed in collaboration with BASF and includes Clearfield® technology which makes it tolerant to herbicides that control harmful weeds. In 2020, we registered a new variety, Ita Caabo 109, which is best suited for the center-south rice region in Argentina. Currently, we have an additional cultivar under registration with the relevant Argentine authorities and with respect to the intellectual property of our seeds, we operate under the standards of Argentine Association of Plant Variety Protection.
We use our seed varieties on our farms and sell them to rice producers in Argentina, Brazil, Uruguay and Paraguay.
We have also developed zero grade level technology in most of our farms, which helps us reduce water and energy consumption. For hilly farms, we are implementing a Polypipe irrigation system which also helps us save on water and energy. Additionally, for all of our farms, we are developing an irrigation surveillance system using drones, water sensors connected through the internet-of-things and digital platforms, all of which are improving water management efficiencies and enhancing our rice yields.
In our Crops segment, we are also developing special digital features for each crop to enhance efficiencies in our operations. Currently, we are building precision agricultural solutions, such as crop yield estimation and soil quality classification, to improve our farming accuracy. Furthermore, we have created a new blanched peanut processing line, entirely made with local engineering and purchased a self-driving oven. Additionally, we have added laser technology to our peanut plant to perform the electronic selection and to continue optimizing the quality and safety of our products. We developed our own traceability app, through which peanut customers can scan a QR code on each bag of peanuts to access information regarding the traceability and data of our goods.
With regardsIn addition, we are working on digital platforms for both our Rice and Crops businesses, to create data centers and visualize the information in real-time dashboards including indicators such as seeding, planting date, fertilizers, irrigation, farm works, harvest, and monitoring of all grain stored in silo bags, among others. All this information is available online through computers and mobile phones. See “Item 4. Information of the Company—A. Business Overview—Technology and Best Practices."
In our Dairy segment in Argentina, we have successfully adapted and implemented the Free Stalla free-stall model, inwhich places special emphasis on efficiency and animal welfare. We are currently building our operations. Additionally, we have invested in technologysecond biodigester to produce renewable energy by transforming manure into electric energy. We are constantly testing new technologies to improve the genetics, health and feeding techniques of our cows in ordercows. We seek to enhance ourimprove animal welfare, milk production.quality and productivity. Currently, we are implementing Sexed Semen Technology insexed semen technology for all of our cows, which is delivering excellentobtaining positive results. The primary goal is to enhance the production of females from our own herd. This allowsherd, allowing us to increase the speed-capacity of organic growth by 20% annually, and/or to intensify our cow-genetic selection process. The former beingThis is critical tofor our current Dairy growth project and the latter being key to improve our cow performance (productivity, health and fertility). Besides, we are assessing other technologies such as cow monitoring solutions and innovative health treatments. (See more details in “Dairy Business” in “Operations“Item 4. Information of the Company—A. Business Overview—Operations and Principal Activities” Section)Activities—Dairy Business”).
In the crop business, we are also implementing the same digital platform mentioned above in the rice section, although some features are still being developed for the particularities of each crop. Currently, we are managing all grain stored in silobags through this platform. In order to enhance efficiencies in the operations, we are developing other digital in-house solutions related to Precision Agriculture such as crop yield estimation, soil quality classification and production dashboard among others. We have also developed a Traceability App for the Peanut segment, where we can track all main production and commercial information, with special focus on quality assurance for customers. We are introducing automation in our Peanut facility, where we are sensing processes with high accuracy and timing, and thus helping us to achieve energy savings.
In addition to traditional R&D activities, since we are constantly lookingfostering creativity and ongoing improvement across teams, businesses and regions. We seek to improve efficienciesadopt and develop innovative solutions that we can introduce into our day-to-day operations, changing the way we perform our work and boosting both efficiency and profitability. We have teams in eachBrazil and Argentina involved in the adoption of our businesses,new technology, while we are also engage other companies, start-ups and entrepreneurs to explore, run, test, enhance and jointly develop technologies. We constantly researchingresearch and analyzinganalyze all the available technologies that could be applied into our operations. In addition,While we do not onlystrive to select the best technologies and techniques, but we are also strongly involved in their adaptationadoption process, and we provide feedback and suggestions to our specific needsenhance such technologies.
There are also R&D initiatives to explore ideas, unlock value potential and local circumstances.develop new business units. Our internal research group is comprisedcomposed of interdisciplinary teams (agronomists, veterinarians, industrial engineers, technicians and finance and commercial)commercial personnel). The group offers support to all business lines and through different levels, from the optimization of current operations, evaluation of new technologies, development of new products, to the assessment of a whole new production system.
CurrentlyIn addition, we are actively involved in a network with start-ups, funds, research associations and other key players in the local AgTech (Agriculturalagtech (agricultural, digital-based Technology)technology) ecosystems to find, develop and engage in strategic opportunities. Particularly for startups, we identify any high-potential Startupcompanies that would not only be able tocould provide alternative solutions for our operations and potentiallyfor the market. We continue tomarket as a whole, and evaluate potential investment in Startups thatinvestments if their business models fit our business (see “Technologybusiness. So far, we have invested in four startups focused on reducing chemical usage, improving labor productivity and enhancing logistics, among others. See “Item 4. Information of the Company—A. Business Overview—Technology and Best Practices” section)Practices.”
We do not own any registered patents, industrial models or designs, apart from those described in the paragraphs of this section.
D.TREND INFORMATION
See “Item 5. Operating and Financial Review and Prospects—A. Operating Results—Trends and Factors Affecting Our Results of Operations.”
E CRITICAL ACCOUNTING ESTIMATES
Our critical accounting estimates are consistent with those described in note 32 to our Audited Consolidated Financial Statements.
E.OFF BALANCE SHEET ARRANGEMENT
Not applicable.
F.TABULAR DISCLOSURE OF CONTRACTUAL OBLIGATIONS
The following table summarizes our significant contractual obligations and commitments as of December 31, 2020:
| | | | | | | | | | | | | | | | | |
| At | Less than
1 year | Between
1 and 2 years | Between 2
and 5 years | Over
5 Years | Total |
| (in millions of $) |
Borrowings (1) | 286.6 | | 132.3 | | 197.9 | | 713.3 | | 1,330.1 | |
Leases Liabilities (1) | 36.7 | | 20.6 | | 74.6 | | 65.6 | | 197.5 | |
| Total | 323.3 | | 152.9 | | 272.5 | | 778.9 | | 1,527.6 | |
(1) Includes interest related to borrowings/finance costs related to lease liabilities
G.SAFE HARBOR
See section entitled “Forward-Looking Statements” appearing on page iv in this annual report.
Item 6. Directors, Senior Management and Employees
A.DIRECTORS AND SENIOR MANAGEMENT
Board of Directors
The following table sets forth information for our directors as of the date of this annual report:
| | Name | Name | Position (*) | Date of
appointment | Age | Year term
expires | Name | Position (*) | Date of
appointment | Age | Year term
expires |
| Plínio Musetti | Plínio Musetti | Chairman | 2020 | 67 | 2023 | Plínio Musetti | Chairman | 2023 | 70 | 2026 |
| Mariano Bosch | Mariano Bosch | Director /CEO | 2020 | 51 | 2023 | Mariano Bosch | Director /CEO | 2023 | 54 | 2026 |
| Alan Leland Boyce | Alan Leland Boyce | Director | 2019 | 61 | 2022 | Alan Leland Boyce | Director | 2022 | 64 | 2025 |
| Andrés Velasco Brañes | Andrés Velasco Brañes | Director | 2019 | 60 | 2022 | Andrés Velasco Brañes | Director | 2022 | 63 | 2025 |
| Daniel González | Daniel González | Director | 2020 | 51 | 2023 | Daniel González | Director | 2023 | 54 | 2026 |
| Guillaume Van der Linden | Guillaume Van der Linden | Director | 2021 | 61 | 2024 | Guillaume Van der Linden | Director | 2024 | 64 | 2027 |
| Mark Schachter | Director | 2021 | 41 | 2024 |
| Manuela Vaz Artigas | | Manuela Vaz Artigas | Director | 2024 | 48 | 2027 |
| Ivo Andrés Sarjanovic | Ivo Andrés Sarjanovic | Director | 2021 | 56 | 2024 | Ivo Andrés Sarjanovic | Director | 2024 | 58 | 2027 |
| Alejandra Smith | Director | 2019 | 65 | 2022 |
| Ana Cristina Russo | | Ana Cristina Russo | Director | 2022 | 57 | 2025 |
Plínio Musetti, Alan Leland Boyce, Guillaume van der Linden, Mark Schachter,Manuela Vaz Artigas, Andrés Velasco Brañes, Daniel González , Ivo Andrés Sarjanovic and Alejandra SmithAna Cristina Russo qualify as independent directors in accordance with NYSE standards.
A description of the main tasks currently performed by each director as well as a description of each director’s employment history and education follows:
Plínio Musetti. Mr. Musetti has been a member of the Company’s boardCompany's Board of directorsDirectors since 2011 and an observer since 2010. Mr. Musetti is a Managing Partner of Janos Holding, where he is responsible for long termlong-term equity investments for Familyof family offices in Brazil, following his role as Partner ofsince June 2010. Previously, he was a partner at Pragma Gestão de Patrimonio, since June 2010.Patrimonio. From 2008 to 2009, Mr. Musetti served as the Chief Executive Officer of Satipel Industrial S.A., leading the company’scompany's initial public offering process and aiding its expansion plan and merger with Duratex S.A. From 2002 to 2008, Mr. Musetti served as a partner at JP Morgan Partners and Chief Executive Officer of Vitopel S.A. (JP Morgan Partners’Partners' portfolio company), where he led its private equity investments ininvestment department for Latin America. Mr. Musetti has also served as a Director of Diagnósticos de America S.A. from 2002 to 2009. From 1992 to 2002, Mr. Musetti served as the Chief Executive Officer of Elevadores Atlas, during which time he led the company’scompany's operational restructuring, initial public offering process and the sale to the Schindler Group. Mr. Musetti. In addition, Mr. Musetti is currently servingserves as a Board member of Raia Drogasil S.A. and Grupo Notredame Intermédica. Mr.
Musetti graduatedholds a degree in Civil Engineering and Business Administration from Mackenzie University and attended the Program for Management Development at Harvard Business School in 1989. Mr. Musetti is a Brazilian citizen.
Mariano Bosch. Mr.Mr Bosch is a co-founder of Adecoagro andAdecoagro. Since the beginning he has been the Chief Executive Officerour CEO and is also a member of the Company’s boardBoard of directors since inception (2002). FromDirectors. In 1995 to 2002, Mr. Bosch served ashe founded and was the founder and Chief Executive OfficerCEO of BLS Agribusiness, an agricultural consulting, technical management, and administration company. Mr. BoschHe has a degree in Agricultural Engineering from the University of Buenos Aires and has over 2225 years of experience in agribusiness development. Currently he is an independent board member of the SPAC, Replay Acquisition CORP (RPLA). He is involved in business organizations such as IDEA, AEA, YPO, AACREA, FPC and AAPRESID. He graduated with a degree in Agricultural Engineering fromMariano was distinguished by Endeavor as Entrepreneur of the University of Buenos Aires. In 2018, heYear (2019) and received athe Konex award and in 2019, thefor Businessman of the year Award, by Endeavor. Mr. Bosch is an Argentinean citizenYear in 2018.
Alan Leland Boyce. Mr. Boyce is a co-founder of Adecoagro and has been a member of the Company’s Board of Directors since 2002 and has been Chairman of the Risk and Commercial Committee since 2011. Mr. Boyce is co-founder and Chairman of Materra LLC, a California basedCalifornia-based farmland owner and operator ofwith 15,000 acres of farmland where it growsthey grow pistachios, dates, citrus and organic vegetables. Since 1985, Mr. Boyce has served as the Chief Financial Officer of Boyce Land Co. Inc., a farmland management company that runs 10 farmland limited partnerships in the United States. Mr. Boyce is also the co-founder and CEO of Westlands Solar Farms, the only farmer-owned utility scale solar PVsolarPV developer in California and recently co-founded Prairie Harvest, which has developed efficientis developing hemp growing and harvesting processing technologies to efficiently separate CBD in Canada and the USA.field. Mr. Boyce formerly served as the director of special situations at Soros Fund Management from 1999 to 2007, where he managed an asset portfolio of the Quantum Fund and had principal operational responsibilities for the fund’s investments in South America. Mr. Boyce also served as managing director at the Community Reinvestment Act at Bankers Trust from 1986 to 1999 where he was in charge of fixed-income arbitrage proprietary trading, the bank’s mortgage portfolio and Community Reinvestment Act compliance. In addition, Mr Boyce was senior managing director for investment strategy at Countrywide Financial from 2007 to 2008, and
worked at the U.S. Federal Reserve Board from 1982 to 1984. He graduated withholds a degree in Economics from Pomona College, and has a MastersMaster’s in Business Administration from Stanford University. Mr. Boyce is an American citizen.
Andres Velasco Brañes.Mr. Velasco has been a member of the Company’s boardBoard of directorsDirectors since 2011. Mr. Velasco was the Minister of Finance of Chile between March 2006 and March 2010, and was also the president of the Latin American and Caribbean Economic Association from 2005 to 2007. Prior to enteringworking for the government, sector, Mr. Velasco was Sumitomo-FASID Professor of Development and International Finance and Development at the Harvard University’s John F. Kennedy School, of Government, an appointment he had held since 2000. From 1993 to 2000, he was Assistant and then Associate Professor of Economics and the director of the Center for Latin American and Caribbean Studies at New York University. DuringFrom 1988 to 1989, he was Assistant Professor at Columbia University. Currently Mr. Velasco serves as Adjunct ProfessorDean of the School of Public Policy at Harvard University, and a Tinker Visiting Professor at Columbia University. He also performs consulting services on various economic matters rendering economic advice to an array of clients, including certain of our shareholders. Mr. Velasco has been appointed Dean of New School of Public Policy atthe London School of Economics. Mr. Velasco holds a Ph.D. in economics from Columbia University and was a postdoctoral fellow in political economy at Harvard University and the Massachusetts Institute of Technology. He also received an B.A. in economics and philosophy and an M.A. in international relations from Yale University. Mr. Velasco is a Chilean citizen.
Daniel C. Gonzalez. Mr. Gonzalez has been a member of the Company’s boardBoard of directionsDirectors since April 16, 2014. Mr. Gonzalez holds a degree in Business Administration from the Argentine Catholic University. He served for 14 years inat the investment bankbanking division of Merrill Lynch & Co in Buenos Aires and New York, holdingwhere he held the positions of Head of Mergers and Acquisitions for Latin America and President for the Southern Cone (Argentina, Chile, Peru and Uruguay), among others. While at Merrill Lynch, Mr. Gonzalez played a leading role in several of the most important investment banking transactions in the region and was an active member of the firm’s global fairness opinion committee. He remained as a consultant to Bank of America Merrill Lynch after his departure from the bank.departure. Previously, heMr. Gonzalez was Head of Financial Planning and Investor Relations in at Transportadora de Gas del Sur SA.SA. In addition, Mr. Gonzalez was the Chief FinancialExecutive Officer of YPF Sociedad Anónima, Argentina’s largest corporation, from 2018 to 2020, where he previously served as Chief Financial Officer from 2012 until 2018 and Chief Executive Officer from 2018 until April 2020. Mrto 2018. Mr. Gonzalez is alsocurrently the Executive Director of IDEA (Instituto para el Desarrollo Empresarial Argentino), a member of the Board of Directors of Hidroeléctrica Piedra del Aguila S.A.not-for-profit business council in Argentina. Mr. González is an Argentine citizen. Mr. Gonzalez holds a degree in Business Administration from the Argentine Catholic University.
Guillaume van der LindenLinden. Mr. van der Linden has been a member of the Company’s boardBoard of directorsDirectors since 2009.2011. Since 2007, Mr. van der Linden has also been a Senior Investment Manager at PGGM Vermogensbeheer B.V., currentlywhere he is responsible for investments in emerging markets local currency sovereignmarket debt. FromPreviously, from 1993 to 2007, Mr. van der Linden worked for ING Bank in various roles, including in the risk management and derivatives trading.trading department. From 1988 to 1993, Mr. van der Linden was employed as a management consultant for KPMG and fromby KPMG. From 1985 to 1988, ashe was a corporate finance analyst for Bank Mees & Hope. Mr. van der Linden graduated with Mastersholds Master’s degrees in Economics from Erasmus University Rotterdam and Business Administration from the University of Rochester. Mr. van der Linden is a Dutch citizen.
Mark Schachter.Manuela Vaz Artigas Mr. Schachter has been a. Mrs. Artigas is an independent board member of the Company’sLWSA, Pague Menos SA, Solar Coca Cola and Banco BMG, where she participates and leads a series of committees. In these companies, she has worked on strategy, organization, restructuring, IPO and M&A matters. Her previous roles include CEO of Calila Investimentos, board member of directors since 2009. Mr. Schachter has been a Managing PartnerJCC and Sistema Jangadeiro and partner of Elm Park Capital Management since 2010. From 2004 to 2010, he was a Portfolio Manager with HBK Capital Management where he was responsible for the firm’s North American private credit activities. His responsibilities included corporate credit investments with a primary focus on middle-market lending and other special situation investment opportunities. From 2003 to 2004, Mr. Schachter worked for American Capital, a middle-market private equity and mezzanine firm and worked in the investment banking division of Credit Suisse Group from 2001 to 2003. Mr. Schachter receivedMcKinsey & Company. Mrs. Artigas holds a degree in Business AdministrationEconomics from Unicamp with an MBA from the IveyAnderson Business School at the University of Western OntarioCalifornia Los Angeles, where she graduated as a member of the Anderson Business Society and completedreceived the Program for Leadership Development at Harvard Business School. Mr. SchachterFred Weston Excellence Finance Award. Mrs. Artigas is a Canadian citizen and has permanent American residence.Brazilian citizen.
Ivo Andrés Sarjanovic. Mr. Sarjanovic has been a member of the Company’s Board of Directors since 2018. Mr. Sarjanovic is also currently serving as non-executive Board member of Sucafina S.A. Further, Mr. Sarjanovic is a and lecturer at the University of Geneva’s Master in Commodities program and Universidad Di Tella’s Master of Finances program. Mr. Sarjanovic served as the Chief Executive Officer of Alvean until 2017, during which time he led the company to become the biggest sugar trader in the world. Previously, Mr. Sarjanovic served for more than 25 years inat Cargill International, startingwhere he commenced his career as trader in the Grain and Oilseeds business. While in Cargill he held between years 2000-2011 the position of Vice-president and Global Trading Manager of Oilseeds in Geneva, coordinating worldwide trading and crushing activities, and between 2007-2011 he was also the Africa and Middle East General Manager of Agriculture. From 2011 to 2014 Mr. Sarjanovic held the position of Vice-president and World Manager of Cargill Sugar Operations, playing a leading role in the radical transformation of the organization that led to the strategic decision to spin-off in 2014 the sugar business of Cargill in 2014, creating Alvean Sugar SL, a joint venture integrated with Copersucar, Brazil. Mr. Sarjanovic served asBetween 2007 and 2011, he was also the Chief Executive OfficerAfrica and Middle East General Manager of Alvean until 2017, during which timeAgriculture at Cargill. While in Cargill he ledalso held the company to become the biggest sugar traderposition of Vice-president and Global Trading Manager of Oilseeds in the world. Mr. Sarjanovic is currently non executive director in SucafinaGeneva between 2000 and is serving lectures of “Agricultural Commodities” at the University of Geneva, University Di Tella2011, coordinating worldwide trading and Austral.crushing activities. Mr. Sarjanovic holds a B.A. in Economic Sciences, with a major in Accounting, from the National University of Rosario, Argentina and a MasterMaster’s in Economics from the UniversityUniversidad Francisco Marroquin.Marroquin, in Spain. Additionally, he completed executive studies at IMD in Lausanne, at Oxford University and at Harvard Business School, and was a PhD candidate in Economics at New York University.School. Mr. Sarjanovic is an Argentine/Italian/Argentine, Italian and Swiss citizen.
Alejandra Smith.
Ana Cristina Russo. Ms. Smith is the founder of Edge Consultants,Russo has been a management consulting firm, which helps its clients grow their businesses´ market share profitably, by leveraging strategic and operational expertise. Ms. Smith began her career in Procter & Gamble in 1983, where she acted as Director of the Health & Beauty Business Unit. She held posts in Mexico, Canada and throughout Latin America. In 1994 Ms. Smith joined PepsiCo, initially co-leading the beverages Go to Market technological transformation in the USA. She was later appointed to the team in charge of the M&A of bottlers in Mexico, the largest international division, where she also established a profitable bottled water category. Subsequently, Ms. Smith transferred to the company's Snacks & Food Division to work in the Latin America and Asia Pacific regions as Commercial SVP and Quaker CEO. Ms. Smith worked for two multinational Fortune 100 Companies across the Americas and Asia Pacific. Ms. Smith concurrently serves as an independent member of the boardCompany’s Board of directorsDirectors since 2022. Ms. Russo also serves as the Chief Financial Officer of BEPENSA (wherePatria Investments since October 2022, the leading alternative investment firm focused on LATAM. Since 1996, Mrs. Russo also built a highly successful career within the Philip Morris group, where she serveshas served as Treasurer, Comptroller, Director Financial Planning Easter Europe, Middle East & Africa, Finance Director Central America and Brasil, Chief Financial Officer for Latin America & Canada and Chief Corporate Auditor for different subsidiaries. From
2017 to 2022, she also served as a Managing Director for Central America, Dominican Republic and the Caribbean within the group, with direct presence in nine countries and indirect presence in 24 other countries. In 1996, Mrs. Russo joined Kraft’s financial planning and analysis unit. Before then, in 1994, she joined Remy Cointreau, where she was the Chief Financial Officer for Brazil early in her career, being responsible for the finance, HR, IT, legal, and export/import departments. Previously, in 1989, Mrs. Russo worked for Unilever in the Compensationfinancial planning of the Food Division as Marketing and Evaluation Committee),Category Accountant supporting the definition of strategic plans, marketing and City Express Hotels (as well as in the Audit, Risks and Societal Practices Committee). Ms. Smith is fully bicultural and bilingual,sales programs. Mrs. Russo holds degreesa degree in Business Administration & Economicsfrom Fundação Getúlio Vargas, São Paulo, Brazil as well a post-graduation from the Instituto Tecnológico Autónomo de Mexico (ITAM). Ms. Smithsame university. Mrs. Russo is a MexicanBrazilian and Italian citizen.
Executive Officers
The following table shows certain information with respect to our senior management as of the date of this annual report:
| | Name | Name | | Position | | Year
Designated | | Age | Name | | Position | | Year
Designated | | Age |
| Mariano Bosch | Mariano Bosch | | Chief Executive Officer & Co-founder | | 2002 | | 51 | Mariano Bosch | | Chief Executive Officer & Co-founder | | 2002 | | 54 |
| Carlos A. Boero Hughes | | Chief Financial Officer | | 2008 | | 55 |
| Emilio F. Gnecco | Emilio F. Gnecco | | Chief Legal Officer | | 2005 | | 45 | Emilio F. Gnecco | | Chief Financial Officer | | 2023 | | 48 |
| Renato Junqueira Santos Pereira | Renato Junqueira Santos Pereira | | Director of Sugar and Ethanol Operations | | 2014 | | 44 | Renato Junqueira Santos Pereira | | Director of Sugar and Ethanol Operations | | 2014 | | 47 |
| Mario José Ramón Imbrosciano | Mario José Ramón Imbrosciano | | Director of Business Development | | 2003 | | 51 | Mario José Ramón Imbrosciano | | Director of Business Development | | 2003 | | 54 |
| Leonardo Berridi | Leonardo Berridi | | Country Manager for Brazil | | 2004 | | 61 | Leonardo Berridi | | Country Manager for Brazil | | 2004 | | 64 |
| Ezequiel Garbers | Ezequiel Garbers | | Country Manager for ARG/URU & Co-founder | | 2004 | | 54 | Ezequiel Garbers | | Country Manager for ARG/URU & Co-founder | | 2004 | | 57 |
Mariano Bosch. See “—Board of Directors.”
Carlos A. Boero Hughes. Mr. Boero Hughes is our Chief Financial Officer, covering the company’s operations in Argentina, Brazil and Uruguay, and a member of Adecoagro’s Senior Management since 2008. He began working at Adecoagro in August 2008 overseeing our finance and administrative departments. Mr. Boero Hughes has over 20 years of experience in agricultural business and financial markets. Mr Boero Hughes is also a member of the Board of Directors of Loma Negra C.I.A.S.A. Prior to joining us, he was Chief Financial Officer for South America and Co-Chief Executive Officer
for Noble Group LTD operations in Argentina, Uruguay and Paraguay from October 2006 to July 2008. From 2003 to 2006, he worked at Noble Group LTD as Financial Director for Argentina and Structure Finance Manager for South America. He worked at Citibank N.A. from 1997 to 2003 as Relationship and Product Manager, focused in the agribusiness industry, and at Banco Privado de Inversiones S.A. as Relationship Manager. He also worked for six years at Carlos Romano Boero S.A.I.C., a flour and dairy cow feed mill family company, as Commercial Manager, Local Grain Elevator and Nursery Manager and finally as General Manager. Mr. Boero Hughes holds a degree in Business Administration from the University of Buenos Aires and a Masters in Business Administration from the Argentine Catholic University. He also graduated from INSEAD’s Executive Program in 2007.
Emilio Federico Gnecco. Mr. Gnecco is our Chief LegalFinancial Officer for all operations in Argentina, Brazil and Uruguay and a member of Adecoagro’s Senior Management since 2005. He is responsible for overseeing finance and administrative departments. Before he became the CFO, he was the Chief Legal Officer of Adecoagro, since the inception of the Company in 2002. He was responsible for all legal and corporate matters, compliance, mergers and compliance.acquisitions and financing structures. Before joining us, he was a corporate law associate at the law firm of Marval, O’Farrell & Mairal for more than 8 years, where he specialized in mergers and acquisitions, project financing, structured finance, corporate financing, private equity, joint ventures, mergers and acquisitions and corporate law and business contracts in general. Mr. Gnecco was in charge of Adecoagro’s corporate matters including mergers and acquisitions since our inception in 2002.at Marval, O’Farrell & Mairal. Prior to that, he worked at the National Civil Court of Appeals of the City of Buenos Aires for four years. Mr. Gnecco has a law degree from the University of Buenos Aires, where he graduated with honors.
Renato Junqueira Santos Pereira. Renato Junqueira Santos Pereira is the VP of Sugar, Ethanol &and Energy business and has been a member of the senior management team since 2014. He began working at Adecoagro in 2010 as the Operations Manager for our Sugar, Ethanol &and Energy business and has vast experience in the Brazilian sugarcane industry. Before joining Adecoagro, he served as the CFO of Moema Group, one of the largest sugarcane clusters in Brazil. His main responsibilities at Moema included designing the optimal capital structure to finance the construction of five greenfield mills, preparing the company for an IPO and coordinating the M&A process which culminated in a $1.5 billion dollar sale to Bunge Ltda. Previously, Mr. Pereira held responsibilities as Mill Director and Agricultural Manager in Moema’s mills. He is an Agricultural Engineer from Universidade de Sao Paulo and holds an MBA from the University of California, Davis.
Mario José Ramón Imbrosciano.Mr. Imbrosciano is the head of our Business Development Department for all operations in Argentina, Brazil and Uruguay where he oversees all new business initiatives, and a member of Adecoagro’s Senior Management since 2003. He has over 2730 years of experience in farm management and agriculture production. In addition, from 2022 he is in charge of the development of the Consumer Goods area within the company. Prior to joining Adecoagro, Mr. Imbrosciano was the Chief Operating Officer of Beraza Hnos. S.C., a farming company that owns farms in the humid pampas region of Argentina. He was in charge of production, commercialization and logistics for a 60,000 hectare operation. Mr. Imbrosciano has also worked as a private consultant for various clients. Mr. Imbrosciano received a degree in Agricultural Production Engineering from the Argentine Catholic University and holds a Masters in Business Administration from the Instituto de Altos Estudios of the Universidad Austral.
Leonardo Raúl Berridi. Mr. Berridi is our VP of Business Development and, prior to the Reorganization, had been Adecoagro’s Country Manager for Brazil since the beginning of its operations in Brazil and a member of Adecoagro’s Senior Management since 2004. Mr. Berridi has over 37 years of international experience in agricultural business. Prior to joining us, Mr. Berridi was Vice President of Pago Viejo S.A., a company dedicated to agriculture production and dairy farming in Argentina. He also worked for Trans-Continental Tobacco Corporation as Chief Operating Officer of Epasa (Exportadora de Productos Agrarios S.A.), a company dedicated to producing, processing and exporting tobacco in the north eastnortheast and north westnorthwest of Argentina, and Production Manager of World Wide Tobacco España S.A. in the Caceres and Zamora provinces in Spain. Mr. Berridi holds a degree in Forestry Engineering from the Universidad Nacional de La Plata.
Ezequiel Garbers.Mr. Garbers is the Country ManagerVP for Crops and Rice Business for Argentina and Uruguay, cofounderUruguay. He is a co-founder and a member of Adecoagro’s Senior Management.the Company’s senior management. He coordinates all of our production and human resourcesresource development activities in Argentina and Uruguay. Mr. Garbers has over 2030 years of experience in Integrated Agroindustrial Chains.integrated agroindustrial and food chains. Prior to joining Adecoagro,the Company, he was the Chief Operating Officer of an agricultural consulting and investment company he co-founded, developing projects both within and outside of Argentina, related to crop production and thewhere he developed crop-production, cattle and dairy business.business projects both in Argentina and abroad. Mr. Garbers holds a degree in Agronomic Engineering from the University of Buenos Aires and a MastersMaster’s in Business Administration from the Instituto de Altos Estudios of the Austral University.
Our managers supervise our day-to-day transactionsoperations so as to ensure that all of our general strategic objectives are carried out, and they report to our boardBoard of directors.Directors.
B.COMPENSATION
Compensation of Directors and Executive Officers
The compensation of the Company’s directors is approved annually at the ordinary general shareholders’ meeting. For 2020,In 2023, the aggregate compensation earned by our directors amounted to a grant of up to a total of 53,976 restricted stock shares and $500 thousand in cash. These figures do not include Mr. Mariano Bosch´s compensation in cash nor in restricted shares, which he declined. For year 2021, the aggregate compensation approved to be earned by our directors amounted to a grant of up to a total of 62,88849,080 restricted stock shares and $500 thousand in cash. These figures do not include Mr. Mariano Bosch’s compensation in cash nor in restricted shares, which he declined. In 2024, the aggregate compensation approved to be earned by our directors amounted to a total of 46,968 restricted stock shares and $580 thousand in cash. These figures do not include Mr. Mariano Bosch’s compensation in cash nor in restricted shares, which he declined.
In regards to our executive officers, the compensation package is divided into fixed compensation, namely base salary (32% of total) and variable compensation (68% of total). Within the variable compensation, 37% is cash bonus (short term incentive) and 63% is restricted shares (long term incentive). The aggregate variable compensation package of our executive officers for year 20202023 amounted to $2,150,277$1,509,704 in cash and 603,880253,445 restricted shares granted to our senior management. These grants were made under the Adecoagro Restricted Share and Restricted Stock Unit Plan, as amended. See “—E. Share Ownership—Share Options and Restricted Share and Restricted Stock Unit Plan”.Plan.” Annual cash bonuses are designed to incentivize our named executive officers at a variable level of compensation based on the Company’s financial and operating performance and each executive’s individual performance. Annual executive cash bonuses and stock unit awards are impacted bybased on seniority and individual executive performance. 80%60% of variable performance is related to achievement of financial targets consisting of Adjusted EBITDA, Net Income, Adjusted NetFree Cash Flow from Operations, Cash Earnings and Return on Invested Capital. The remainingCapital; in addition to ESG variables, namely carbon intensity and participation of women in our workforce (both metrics amount for 10% of variable compensation). Additionally, a 20% is based on the achievementlong term share value, associated with the quote of individual objectives and by evaluating each executive’s level of proficiency inAGRO’s share. The remaining 10% correspond to the following competencies: general characteristics, teamwork, professional competencies, environmental and social commitment, problem solving and thinking skills and managerial skills. In the past, actualqualitative targets as stated on an annual basis.
Actual bonus amounts have beenare determined shortly after fiscal year end. Our Chief Executive Officer presents the final calculation of the annual cash bonuses for our named executives to the Compensation Committee of the boardBoard of directors.Directors. The Compensation Committee then reviews actual Company and individual performance, and determines the amount payable consistent with the attainment of such individual’s performance based on the above criteria.payable.
We do not pay or set aside any amounts for pension, retirement or other similar benefits for our officers and directors.
On November 10, 2023, the Company’s Board of Directors approved the adoption of a Compensation Recoupment “Clawback” Policy, to comply with the requirements of Section 10D of the Exchange Act and Section 303A.14 of the NYSE Listed Company Manual. The Compensation Recoupment “Clawback” Policy sets forth the terms and conditions for the prompt recoupment or “clawback” of certain executive compensation in the event of an accounting restatement resulting from material noncompliance with financial reporting requirements under U.S. federal securities laws, as further described therein. The Company’s Compensation Recoupment “Clawback” Policy is attached hereto as Exhibit 97.1.
C.BOARD PRACTICES
Pursuant to our articles of incorporation, the boardBoard of directorsDirectors must be composed of between three3 and eleven11 members. The number of directors is determined and the directors are appointed at the general meeting of shareholders (except in case of a vacancy in the office of a director because of death, retirement, resignation, dismissal, removal or otherwise, the remaining directors may fill such vacancy and appoint a successor in accordance with applicable Luxembourg law).
Currently, the boardBoard of directorsDirectors has eleven9 members. The directors are appointed by the general meeting of shareholders for a period of up to three years; provided, however, the directors shall be elected on a staggered basis, with one-third of the directors being elected each year and provided further that such three yearthree-year term may be exceeded by a period up to the annual general meeting held following the third anniversary of the appointment. Directors may be removed with or without cause (ad nutum) by the general meeting of shareholders by a simple majority of votes cast at a general meeting of shareholders. The directors are eligible for re-election indefinitely.
There are no agreements with majority shareholders, customers, suppliers or others governing the selection of any of the directors or members of senior management. None of our non-executive directors has a service contract with us that provides for benefits upon termination of employment.
The boardBoard of directorsDirectors is empowered to manage Adecoagro and carry out our operations. The boardBoard of directorsDirectors is vested with the broadest powers to manage the business of the Company and to authorize and/or perform all acts of disposal,
management and administration falling within the purposes of Adecoagro and all powers not expressly reserved by Luxembourg law or by our articles of incorporation to the general meeting of shareholders is within the competence of the boardBoard of directors.Directors.
Accordingly, within the limitations established by Luxembourg law and in particular the Luxembourg law of August 10, 1915 on commercial companies (as amended) and our articles of incorporation, the boardBoard of directorsDirectors can take any action (by resolution or otherwise) it deems necessary, appropriate, convenient or fit to implement the purpose of the Company, including without limitation.limitation:
a.execute any acts or contracts on our behalf aimed at fulfilling our corporate purpose, including those for which a special power of attorney is required;
b.carry out any transactions;
c.agree, establish, authorize and regulate our operations, services and expenses;
d.delegate special tasks to directors, regulate the formation and operation of committees and fix the remuneration and compensation of expenses of advisors and/or staff with special duties, with a charge to overhead;
e.appoint, suspend or remove agents or employees, establish their duties, remuneration, and bonuses and grant them the powers that it deems advisable;
f.grant signature authorization to directors and officers, grant general or special powers of attorney, including those to prosecute;
g.call regular and special shareholders’ meetings and establish agendas, submit for the shareholders’ approval our inventory, annual report, balance sheet, statement of income and exhibits, propose depreciation, amortization and reserves that it deems advisable, establish the amount of gains and losses, propose the distribution of earnings and submit all this to the shareholders’ meeting for consideration and resolution;
h.fix the date for the payment of dividends established by the shareholders’ meeting and make their payment; and
i.make decisions relating to the issuance, subscription or payment of shares pursuant to our articles of incorporation and decision of the regular or special shareholders’ meetings.
As of the date of this annual report, the chairman of the boardBoard of directorsDirectors is Mr. Plínio Musetti. The boardBoard of directorsDirectors has the following four committees:five committees and one sub-committee: Audit Committee, Talent Management & Compensation Committee, Risk and Commercial Committee, and Strategy Committee. On May 13, 2011, the former Risk and Strategy Committee split intoand ESG Committee; and Nominating Sub-Committee of the current Risk and Commercial Committee and the StrategyTalent Management & Compensation Committee.
Audit Committee
The Company’s articles of incorporation provide that the boardBoard of directorsDirectors may set up an audit committee. The boardBoard of directorsDirectors has set up an Audit Committee composed bycomprised of independent directors and has appointed Mr. Andrés Velasco Brañes (Chairman), Mr. Mark Schachter and Mrs. Ana Cristina Russo as members of its audit committee, pursuant to board resolutions dated May 19, 2019,5, 2022. Pursuant to the Annual Shareholders´ meeting held on April 17, 2024, Mr. Mark Schachter (Chairman),is no longer a director of the Company, therefore the vacancy left by Mr. Ivo Andrés Sarjanovic and Mr. Andrés Velasco Brañes, as membersSchachter will be filled-in in the next Board of its audit committee.Directors´meeting that will be held in May 2024.
The Company’s articles of incorporation provide that the audit committee shall (a) assist the boardBoard of directorsDirectors in fulfilling its oversight responsibilities relating to the integrity of the Company’s financial statements, including periodically reporting to the boardBoard of directorsDirectors on its activity and the adequacy of the Company’s systems of internal controls over financial reporting; (b) make recommendations for the appointment, compensation, retention and oversight of, and consider the independence of, the Company’s external auditors; (c) review material transactions (as defined in the articles) between the Company or its subsidiaries with related parties (other than transactions that were reviewed and approved by the independent members of the boardBoard of directorsDirectors as defined in the articles of the Company) or other governing body of any subsidiary of the Company or through any other procedures as the boardBoard of directorsDirectors may deem substantially equivalent to the foregoing) to determine whether their terms are consistent with market conditions or are otherwise fair to the Company and its subsidiaries;
and (d) perform such other duties imposed on it by the laws and regulations of the regulated market(s) on which the shares of the Company are listed, applicable to the Company, as well as any other duties entrusted to it by the boardBoard of directors.Directors.
In addition, the charter of the audit committee sets forth, among other things,others, the audit committee’s purpose and responsibilities.
The committee meets at least four times a year and as often as deemed necessary or appropriate in its judgment. During 2023, the Audit Committee held meetings on March 2 and 6, May 3 and 8, August 9 and 11, October 31 and November 3. All members of the Audit Committee were present at all meetings held.
Talent Management & Compensation Committee
The Company has a Talent Management & Compensation Committee (referred to indistinctively as Talent Management & Compensation Committee or Compensation Committee) that reviews and approves the compensation and benefits of the executive officers and other key employees, and makes recommendations to the boardBoard of directorsDirectors regarding principles for compensation, performance evaluation, and retention strategies. It is responsible for administering our share option plans and our restricted share and restricted stock unit plan for executive officers and other key employees. See “—E. Share Ownership—Share Options and Restricted Share and Restricted Stock Unit Plan.” The committee has the discretion to interpret and amend the Plan, and delegate to the Chief Executive Officer the right to award equity-based compensation to executive officers and other key employees.
The committee is also in charge of the interpretation, implementation, control and enforcement of the Company’s Compensation Recoupment or “Clawback” Policy, which sets forth the terms and conditions for the prompt recovery of erroneously awarded incentive-based compensation granted to certain officers of the Company in the event of a restatement of the Company’s financial statements.
employees. The committee meets at least once a year and as needed on the initiative of the Chief Executive Officer or at the request of one of its members. The members of the Compensation Committee, appointed pursuant to board resolutions dated May 19, 2019, are Mr. Daniel González (Chairman), Mr. Guillaume van der Linden, and Mr. Plínio Musetti.
Nominating Sub-Committee
As part of the Talent Management & Compensation Committee, the Company has a Nominating Sub-Committee that selects and recommends to the board the best candidates to fill in vacant board seats, develops and recommends criteria for selecting qualified director candidates to the board, evaluates committee member qualifications, designations and removals, recommend the implementation of corporate governance guidelines, and oversees the evaluation of the board of directors and each committee.
The sub-committee meets at least once a year and as needed on the initiative of the Chief Executive Officer or at the request of one of its members. The members of the sub-committee, appointed pursuant to board resolutions dated March 11, 2022, are Mr. Guillaume van der Linden, Mr. Daniel González (Chairman) and Mr. Plínio Musetti.
Risk and Commercial Committee
The Company has a Risk and Commercial Committee (referred to in distinctively as Risk Committee or Risk and Commercial Committee) that has the duty to (i) make such inquiries as are necessary or advisable to understand and evaluate material business risks and risk management processes as they evolve from time to time; (ii) review with the boardBoard of directorsDirectors and management the guidelines and policies to govern the process for assessing and managing risks; (iii) discuss and review with the boardBoard of directorsDirectors management’s efforts to evaluate and manage the Company’s business from a risk perspective; (iv) request input from the boardBoard of directors,Directors, management and operating staff, as well as from outside resources, as it may deem necessary; (v) discuss with the boardBoard of directorsDirectors and management which elements of enterprise risk are most significant, the prioritization of business risks, and make recommendations as to resource allocation for risk management and risk mitigation strategies and activities; and (vi) oversee the development of plans for risk mitigation in any area which it deems to be a material risk to the Company; and (vii) monitor management’s implementation of such plans, and the effectiveness generally of its risk mitigation strategies and activities.
The committee meets at least four times a year and as often as deemed necessary or appropriate in its judgment. The members of the Risk Committee appointed by the board meeting held on May 19, 20195, 2022 are Mr. Ivo Andrés Sarjanovic
(Chairman), Mr. Andrés Velasco BrañesMark Schachter and Mrs. Ana Cristina Russo. Pursuant to the Annual Shareholders´ meeting held on April 17, 2024, Mr. Guillaume van der Linden.Mark Schachter is no longer a director of the Company, therefore the vacancy left by Mr. Schachter will be filled-in in the next Board of Directors´meeting that will be held in May 2024.
Strategy Committee
The Company’s Strategy Committee has the duty to: (i) discuss and review with the board management’s identification and setting of strategic goals; including potential acquisitions, joint ventures and strategic alliances and dispositions; (ii) make recommendations to the boardBoard of directorsDirectors as to the means of pursuing strategic goals; and (iii) review with the board management’s progress in implementing its strategic decisions and suggest appropriate modifications to reflect changes in market and business conditions.
The committee meets at least four times a year and as often as deemed necessary or appropriate in its judgment. The members of the Strategy Committee appointed by the board meetings held on May 19, 20195, 2022 are Mr. Plínio Musetti (Chairman), Mr. Alan Leland Boyce, Ms. Alejandra SmithMr. Daniel Gonzalez and Mr. Daniel Gonzalez.Ivo Andrés Sarjanovic.
ESG Committee
The Company has an ESG Committee created as part of the efforts to bring Environmental, Social and Governance ("ESG") to the forefront of its agenda and continue integrating these aspects into the overall strategy. The ESG Committee's main duties include (i) discussing and reviewing the company's operations in order to identify potential opportunities to improve our ESG performance; (ii) defining ESG strategies; and (iii) analyzing alternatives to enhance our ESG communication to stakeholders and expand our investor base.
The committee meets at least four times a year and as often as deemed necessary or appropriate in its judgment. The members of ESG Committee appointed by the board meetings held on May 5, 2022 are Mr. Guillaume van der Linden (Chairman), Mr. Alan Leland Boyce and Mr. Andres Velasco.
D.EMPLOYEES
Employees
As of December 31, 2023, we had 9,762 employees, 90% of whom were unionized. In addition, approximately 8% of our workforce is comprised of temporary workers. We strive to comply with all labor laws. Historically, we have had a positive relationship with labor unions.
The following table sets forth our number of employees by each of our business segments:
| | | | | | | | | | | | | | | | | |
| | As of December 31, |
| | 2023 | | 2022 | | 2021 |
| Farming | 2,395 | | | 2,441 | | | 2,156 | |
| Sugar, Ethanol and Energy | 6,256 | | | 6,229 | | | 5,930 | |
| Administrative | 1,111 | | | 1,106 | | | 1,018 | |
| Total | 9,762 | | | 9,776 | | | 9,104 | |
The following table sets forth our number of employees by each country where we operate:
| | | | | | | | | | | | | | | | | |
| | As of December 31, |
| | 2023 | | 2022 | | 2021 |
| Argentina | 2,651 | | | 2,697 | | | 2,488 | |
| Brazil | 6,924 | | | 6,914 | | | 23 | |
| Uruguay | 186 | | | 165 | | | 6,593 | |
| Spain | 1 | | | — | | | — | |
| Total | 9,762 | | | 9,776 | | | 9,104 | |
We do not have any severance agreements with our senior executive directors and managers.
Benefits
The benefits granted to our employees follow the market standard, including health plans and Spanish, English and Portuguese language lessons. In some cases, depending on the working location, we also provide meal, transportation, parking or financial aid for junior employees who are still in college. For senior management, we also provide vehicles.
E.SHARE OWNERSHIP
Share Ownership
The total number of shares of the Company beneficially owned by our directors, executive officers and company´s employees as a group, , as of the date of this annual report, was 6,926,297,6,887,628 which represents 5.88%6.5% of the total shares of the company. See table in “Item 7. Major Shareholders and Related Party Transactions”Transactions—A. Major Shareholders” for information regarding share ownership by our directors and executive officers.
Share Options and Restricted Share and Restricted Stock Unit Plan
Adecoagro/IFH 2004 Stock Incentive Option Plan and Adecoagro/IFH 2007/2008 Equity Incentive Plan
The Company maintains the Adecoagro/IFH 2004 Incentive Option Plan (formerly, the International Farmland Holdings, LLC 2004 Incentive Option Plan, and referred to herein as the “2004 Plan”) and the Adecoagro/IFH 2007/2008 Equity Incentive Plan (formerly, the International Farmland Holdings, LLC 2007/2008 Equity Incentive Plan, and referred to herein as the “2007/2008 Plan”). During 2021, all options of the 2007/2008 Plan expired, thus the plan is not in place any longer”. Initially, the 2004 Plan provided for the grant of options to purchase ordinary units of IFH. In connection with the Reorganization, the Option Plans were amended and restated to provide for the grant of options to purchase ordinary shares of the Company, and all then-outstanding options to purchase IFH ordinary units were converted into options to purchase the Company’s ordinary shares.
The number of ordinary shares reserved and available for issuance under the 2004 Plan are 1,634,220,1,283,818, respectively. Shares subject to awards that become forfeited, cancelled,canceled, expired, withheld upon exercise, reacquired by the Company prior to vesting or otherwise terminated will again be available for future awards under the Option Plans.
Administration and Eligibility
The Option Plans are administered by the Compensation Committee of the Company’s boardBoard of directorsDirectors (the “Committee”). The Committee has general authority to, among other things,others, select individuals for participation, determine the time and amount of grants, and interpret the plans and awards. The Committee determines the vesting requirements of the awards. The Option Plans require that the exercise price of any future grants shall be no less than the greater of the fair market value of our ordinary shares on the date of grant and the par value per ordinary share.
Individuals eligible to receive options under the 2004 Plan include officers and employees.
Amendment and Termination
The boardBoard of directorsDirectors may amend or terminate the Option Plans in its discretion, and the Committee may amend any outstanding options in its discretion, except participant consent will be needed if a participant’s rights are adversely affected. If not previously terminated by the boardBoard of directors,Directors, the Option Plans will terminate on the 10th anniversary of its adoption. The 2004 Plan was amended to extend the term to 20ththe 20th anniversary of its adoption. On August 15, 2023, the Board of Directors of the Company approved the amendment and restatement of the A2004 Plan now known as the Second Amended
and Restated Adecoagro/IFH 2004 Stock Incentive Option Plan to extend for an additional ten years the period to exercise the awards granted under the plan.
Granted Options
Under the 2004 Plan, options to purchase 2,402,228 ordinary shares were granted and the weighted average exercise price of all granted options was $6.67.
Outstanding options under the 2004 Plan vested in three equal installments on the first three anniversaries of the date of grant. Vesting under this Option Plans is generally subject to the participant’s continued service as of each applicable vesting date, and all options terminate 1030 years from the date of grant. No further option under both plans will be granted.
Adecoagro S.A. Amended and Restated Restricted Share and Restricted Stock Unit Plan
On November 11, 2011, the Board of Directors of the Company approved the amendment and restatement of the Adecoagro S.A. Restricted Share Plan, now known as the Amended and Restated Restricted Share and Restricted Stock Unit Plan (as amended from time to time, the “Plan). On December 16, 2020, the Board of Directors of the Company amended the Plan to extend the expiration date to October 28, 2030.
The Plan provides for awards of restricted shares or restricted stock units to employees, officers, members of the boardBoard of directorsDirectors and other service providers of the Company. The purpose of the Plan is to further align the interests of participants with those of the shareholders by providing participants with long-term incentive compensation opportunities tied to the performance of the Company’s ordinary shares.
On March 9, 2021,11, 2022 and March 7, 2023, the Plan was once again amended by the Board of Directors to increase the number of common shares available for issuance with respect to which awards may be made by 1,200.0001,406,565 and 543,800 common shares, respectively. On March 12, 2024 the Board of Directors amended the Plan to increase the number of common shares available for issuance with respect to which awards may be made by 569,500 additional common shares. Currently, the maximum number of common shares with respect to which awards may be made under the Plan is equal to 6,708,930 9,228,795 common shares inclusive of such Shares that are subject to outstanding grants of Awards.awards. To the extent any award under the Plan is canceled, expired, forfeited, surrendered, settled in cash, or otherwise terminated without delivery of shares the shares retained by or returned to the Company will again be available for future awards under the Plan. The shares available for issuance as well as outstanding awards under the Plan are subject to adjustment in the event of a reorganization, stock split, merger or similar change. Under the Plan, as of the date of this annual report, 3,188,536 ordinaryreport, 8,687,285 ordinary shares had been issued to directors, senior management and employees.
Administration and Eligibility
The Plan is administered by the Talent Management & Compensation Committee. TheThis Committee has general authority to grant awards, determine the recipients of awards and prescribe the terms of awards, as well as authority to interpret and apply the terms of the Plan and individual awards. The Committee determines the amount and the vesting requirements of the awards.
Terms of Awards
A grant of restricted shares represents ordinary shares that are issued subject to vesting requirements and transfer restrictions, as determined by the Committee in its discretion. The vesting requirements may be based on the continued employment or service of the participant for a specified time period or on the attainment of specified business performance goals established by the Committee. Subject to the transfer restrictions and vesting requirements of the award, the participant will have the rights of a stockholder of the Company, including voting rights and the right to receive dividends.
The number of restricted shares or restricted stock units awarded to individuals each year will be based on Company performance. Once awarded, the restricted shares or restricted stock units are subject to a service-based vesting schedule and vest in three equal annual installments on the first three anniversaries of the date of grant, subject only to the participant’s continued service to the Company as of each applicable vesting date. Restricted stock units are payable following the vesting of an award in shares.
Amendment and Termination
The boardBoard of directorsDirectors may amend, modify, suspend or terminate the Plan in its discretion, except participant consent will be needed if participants’ rights are adversely affected. If not previously terminated by the boardBoard of directors,Directors, the Plan will terminate on the 20th anniversary of its adoption.
Share Options and Restricted Shares
The total number of ordinary and restricted shares to be issued upon exercise of the options to directors and executive officers as a group under our Option Plans is 1,634,220in1,634,220 in the aggregate. The range of exercise prices per ordinary shares under our 2004 Plan is $5.83 to $8.62 (1,492,890 options). Upon the exercise of all options the only employee that would exceed the 1% holding is Mariano Bosch, who would reach 1.03%.
The total number of restricted stock units to be issued under the Plan to directors and executive officers as a group is 49,211 in the aggregate. Upon receipt of shares under the Plan no single beneficiary would own more than 1% of total outstanding shares.
F.DISCLOSURE OF A REGISTRANT’S ACTION TO RECOVER ERRONEOUSLY AWARDED COMPENSATION
D.EMPLOYEES
Employees
On December 31, 2020, we had 8,716 employees, of whom 92% were unionized. Approximately 7% of our workforce is comprised of temporary workers. We comply with all labor laws. Historically, we have had a positive relationship with the trade unions.
The following table sets forth our number of employees by each of our business segments:
| | | | | | | | | | | | | | | | | |
| | As of December 31, |
| | 2020 | | 2019 | | 2018 |
| Farming and Land Transformation | 1,794 | | | 1,627 | | | 1,136 | |
| Sugar, Ethanol and Energy | 6,093 | | | 5,805 | | | 5,859 | |
| Administrative | 829 | | | 805 | | | 795 | |
| Total | 8,716 | | | 8,237 | | | 7,790 | |
We do not have any severance agreements with our senior executive directors and managers.
Benefits
The benefits granted to our employees follow the market standard, including health plans and Spanish, English and Portuguese language lessons. In some cases, depending on the working location, we also provide meal, transportation, parking or financial aid for junior employees who are still in college. For senior management, we also provide vehicles.Not applicable.
Item 7. Major Shareholders and Related Party Transactions
A.MAJOR SHAREHOLDERS
The following table sets forth the beneficial ownership of our shares for each person known to us to own beneficially at least 5% of our common shares and our directors and executive officers, based on the information most recently available to the Company, as of April 27, 2021.24, 2024. The holders listed below have the same voting rights as all other holders of our shares.
As of April 27, 2021,24, 2024, we had 117,812,864104,134,813 outstanding shares. Beneficial ownership is determined in accordance with the rules and regulations of the SEC. In computing the number of shares beneficially owned by a person and the percentage ownership of that person, we have included shares that the person has the right to acquire within 60 days from April 27, 2021,24, 2024, including through the exercise of any option, warrant or other right or the conversion of any other security.option. These shares, however, are not included in the computation of the percentage ownership of any other person.
| | | | | | | | | | | |
| | Number | | Percent |
| Principal Shareholders: | | | |
| Al Gharrafa Investment Company (1) | 15,983,265 | | | 13.6 | % |
| Stichting Pensioenfonds Zorg en Welzijn (2) | 15,381,385 | | | 13.1 | % |
| Route One Investment LP (3) | 14,444,844 | | | 12.3 | % |
| EMS Capital LP (4) | 11,692,837 | | | 9.9 | % |
| Brandes Investment Partners LP (5) | 7,268,631 | | | 6.2 | % |
| Directors, Executive Officers and Company's employees as a Group* | 6,926,297 | | | 5.9 | % |
| | | | | | | | | | | |
| | Number | | Percent |
| Principal Shareholders: | | | |
| Al Gharrafa Investment Company (1) | 15,983,265 | | | 15.3 | % |
| Stichting Pensioenfonds Zorg en Welzijn (2) | 15,381,385 | | | 14.8 | % |
| EMS Capital LP (3) | 11,883,961 | | | 11.4 | % |
| Route One Investment LP (4) | 11,612,980 | | | 11.2 | % |
| Jennison Associates LLC (5) | 5,371,368 | | | 5.2 | % |
| Directors, Executive Officers and Company's employees as a Group* | 6,887,628 | | | 6.5 | % |
* No single shareholder beneficially owns more than 1% based on the total number of outstanding shares, except fromfor Mariano Bosch and Alan Boyce, which botheach of whom beneficially owns 1,03%1.4% and 1.2%, respectively .respectively.
(1)The address of Al Gharrafa Investment Company is C/O Intertrust Corporate Services (Cayman) Limited, 190 Elgin Street, George Town, Grand Cayman, KY1-9005, Cayman Islands.
(2)The address of Stichting Pensioenfonds Zorg en Welzijn is P.O. BOX 4001 NL-3700 KA Zeist The Netherlands.
(3)The address of EMS Capital LP is 767 Fifth Avenue 46th floor, New York, NY 10153.
(4)The address of Route One Investment LP is 1 Letterman Drive, Building D, Suite 200, San Francisco, CA 94129, United States.
(4)The address of EMS Capital LP is 767 Fifth Avenue 46th floor, New York, NY 10153.
(5)The address of Brandes Investment Partners LPJennison Associates LLC is 11988 El Camino Real, Suite 600, PO Box 919048, San Diego, CA 92130-9048,466 Lexington Avenue, Floor 18, New York, NY 10017, United States.
As of April 27, 2021, 93,735,672 shares, representing 77.0% of our outstanding common24, 2024, 51,479,106 shares were held by United States record holders.holders, representing 49.4% of our outstanding common shares.
B.RELATED PARTY TRANSACTIONS
Share Purchase and Sale Agreement and UMA Right of First Offer Agreement
In connection with the Share Purchase and Sale Agreement, dated February 16, 2006. The IFH Parties also entered into a Right of First Offer Agreement with Marcelo Weyland Barbosa Vieira, Paulo Albert Weyland Vieira, Mario Jorge de Lemos Vieira, and Corina de Almeida Leite, each of which is a current indirect shareholder in IFH, (together the “UMA Members”), dated February 16, 2006, whereby the IFH Parties agreed to grant the UMA Members a right of first offer to acquire the shares of UMA, or all or substantially all of the assets of UMA, or the real property or plot of land where the commercial offices of UMA is currently located and which is currently subject to a right-of-way and easement agreement granted to Mario Corina, Alfenas Agrícola Ltda. The rights granted to each of the UMA Members, their permitted affiliates, assignees, successors or heirs under such agreement are only in effect for as long as such entities hold such an equity interest in IFH or any of its affiliates.
Agriculture Partnership Agreements
Some of our agriculture partnership agreements are entered into with certain minority shareholders of the Company, for a total of 9,946.7 hectares. For the years ended December 31, 2018, 2017 and 2016, we recorded other net amount (payables) or receivables for payments in advance amounting to $(0.2) million, $(0.4) million and $(0.7) million, respectively, and recognized expenses amounting to $2.3 million, $3.3 million and $0.4 million, respectively, in connection with these agreements. Since 2018, these agreements are no longer related parties.
Registration Rights Agreement
In connection with the Reorganization, we entered into a registration rights agreement providing holders of our issued and outstanding common shares on January 28, 2011 (such holders being hereinafter referred to as the “Existing Investors” and such common shares subject to the agreement being hereinafter referred to as the “Registrable Securities”) with certain rights to require us to register their shares for resale under the Securities Act of 1933, as amended (“Securities Act”). Pursuant to the agreement, if holders of a majority of the Registrable Securities notify us, no earlier than 180 days after the effective date of the registration statement previously filed by us on Form F-1, we are required, subject to certain limitations, to file a registration statement under the Securities Act in order to register the resale of the amount of ordinary shares requested by such holders. The underwriters in such an offering will have the right, subject to certain limitations, to limit the number of shares included in such registration. The Existing Investors have the right to require us to file one such registration. In addition, if we propose to register any of our securities under the Securities Act, Existing Investors are entitled to notice of such registration and are entitled to certain “piggyback” registration rights allowing such holders to include their common shares in such registration, subject to certain restrictions. Furthermore, Existing Investors may require us to register the resale of all or a portion of their shares on a registration statement on Form F-3 once we are eligible to use Form F-3. In an underwritten offering, the underwriters have the right, subject to certain restrictions, to limit the number of Registrable Securities Existing Investors may include.
To see a summary of the balances and transactions with related parties, please see Note 3231 to our Consolidated Financial Statements.
Shelf Registration Statement on Form F-3
The Company filed a shelf registration statement on Form F-3 with the U.S. Securities and Exchange Commission (SEC) on September 23, 2013, which was declared effective by the SEC on December 23, 2013. Pursuant to the Shelf Registration Statement, certain shareholders may offer and sell from time to time, in one or more offerings, up to 55,821,281 common shares. The registration of the common shares for disposition by the principal shareholders does not mean that the principal shareholders will actually offer or sell any of the shares. The specifics of future offerings, if any, including the names of participating shareholders, the amount of shares to be offered and the offering price, will be determined at the time of any such offerings and will be described in a prospectus supplement filed at the time of any such offerings.
On March 21, 2016, we completed an underwritten secondary offering of 12.0 million common shares of Adecoagro offered by our shareholders Quantum Partners LP and Geosor Corporation, at a price per share to the public of $11.70 pursuant to the effective shelf registration statement described in the previous paragraph.
Advisory Service Agreement
On April 17, 2019 the Company, executed an Advisory Service Agreement with Mr. Marcelo Vieira (former director of the Company) for a term of 24 months. As consideration for the provision of advisory services under the agreement, the company will pay Mr. Vieira $ 50,000 per each year of the contact, and an award of restricted equity interests in the company with a value of $50,000.
C.INTERESTS OF EXPERTS AND COUNSEL
Not applicable.
Item 8. Financial Information
A.CONSOLIDATED STATEMENTS AND OTHER FINANCIAL INFORMATION.
See Item"Item 18. Financial StatementsStatements" and pagepages F-1 through F-78F-89 for our Consolidated Financial Statements.
Legal and Administrative Proceedings
We are subject to several laws, regulations and business practices of the countries in which we operate. In the ordinary course of business, we are subject to certain contingent liabilities with respect to existing or potential claims, lawsuits and other proceedings, including those involving tax, social security, labor lawsuits and other matters. We accrue liabilities when it is probable that future costs will be incurred and such costs can be reasonably estimated. Currently, we are not engaged in any material litigation or arbitration and no material litigation or claims are known to us to be pending or threatened against us which, either alone or on a combined basis, may result in an adverse effect on our business, results of operations, or cash flows.
In Argentina and Brazil we are engaged in several legal proceedings, including tax, social security, labor, civil, environmental, administrative and other proceedings, for which we have established provisions in an aggregate amount of $3$3.6 million as of December 31, 2020.2023. In addition, there are currently certain legal proceedings pending in which we are involved for which we have not established provisions. In the opinion of our management, the ultimate disposition of any threatened or pending matters, either individually or on a combined basis, will not have a material adverse effect on our combined financial condition, liquidity, or results of operations other than as described below.
The Brazilian government filed a tax enforcement action against UMA to demand excise taxes (Imposto sobre Produtos Industrializados, or “IPI”)(IPI), or a federal value-added tax on industrial products, in the amount of approximately $3.7 million. We have obtained a favorable initial decision from the lower court, which accepted our argument on procedural grounds based on the Brazilian government’s loss of its procedural right to demand the IPI debts. Currently, the case is under review by an appellate court following the appeal filed by the Brazilian government. We have not made any provision for this claim based on legal counsel’s view that the risk of an unfavorable decision in this matter is remote. If this proceeding is decided adversely to us, our results of operations and financial condition may be materially adversely affected.
José Valter Laurindo de Castilhos, Companhia Rio de Janeiro Agropecuária Ltda. and other former owners of the Rio de Janeiro and Conquista Farms have filed suit against us for the payment of a supplementary amount of approximately $39.5$12 million (approximately $48.5 million in updated value), as well as indemnity for moral and material damages, as a result of the alleged breach of the purchase agreement entered into by the parties. The lower court ruled in our favor, allowing us to keep possession of the Rio de Janeiro Farm. This decision has been appealed by Mr. Castilhos to the Superior Court of Justice (“(Superior Tribunal de Justiça”a). The Brazilian Superior Court of Justice dismissed the appeal. The merits of the case are pending judgment by the court of first instance. This decision can be appealed by Mr. Castilhos. We have not made any provision for this claim based on legal counsel’s view that the risk of an unfavorable decision in this matter is remote. If this proceeding is decided adversely to us, our results of operations and financial condition may be materially adversely affected.
Dividend Policy
The amount and payment of dividends will be determined by a simple majority vote at a general shareholders’ meeting, typically but not necessarily, based on the recommendation of our boardBoard of directors.Directors. All shares of our capital stock rank pari passu with respect to the payment of dividends. Pursuant to our articles of incorporation, the boardBoard of directorsDirectors has the power to distribute interim dividends in accordance with applicable Luxembourg law. Dividends may be lawfully declared and paid if our net profits and distributable reserves are sufficient under Luxembourg law.
Under Luxembourg law, at least 5% of our net profits per year must be allocated to the creation of a legal reserve until such reserve has reached an amount equal to 10% of our issued share capital. If the legal reserve subsequently falls below the 10% threshold, at least 5% of the annual net profits again must be allocated toward the reserve. The legal reserve is not available for distribution.
On November 9, 2021, the Board of Directors approved the implementation of a distribution policy as of 2022 (the “Distribution Policy”) to distribute annually a minimum of 40% of the Adjusted Free Cash from Operations generated during the previous year, subject to the conditions set forth by Luxembourg law. The Distribution Policy consists of a cash dividend distribution in a minimum amount of US$30 million per year, and share repurchases under the existing program from time to time as deemed appropriate. Subject to the conditions set forth by Luxembourg law and notably subject to the Company having sufficient distributable reserves, any dividend distribution will be resolved upon either by the general meeting of the
shareholders of the Company or the Board of Directors (through a declaration of advances on dividends). Subject to the decision of the general meeting of the shareholders of the Company or the Board of Directors, dividend payments will be made twice a year, in or around May and November of each year.
On March 12, 2024 the Board of Directors proposed to the general meeting of the shareholders of the Company to declare a dividend of an amount of $35 million to be paid to the outstanding shares and out of the share premium account of the Company in two installments of $17.5 million each and to delegate power to the Board of Directors to determine the record dates and the payment dates therefor.
On April 17, 2024 the annual general meeting of the shareholders of the Company declared a dividend in the amount of $35 million, to be distributed out of the share premium account of the Company in two installments of $17.5 million to the holders of outstanding shares issued by the Company, and to delegate power to the Board of Directors to determine the record dates and the payment dates therefor. On April 18, 2024, the Board of Directors resolved that the record and payment dates for the payment of first installment will be May 14, 2024 and May 29, 2024, respectively, and that the record and payment dates for the payment of the second installment will be on or about November 14, 2024 and November 29, 2024, respectively.
Adecoagro is a holding company and has no material assets other than its ownership of partnership interests in Adecoagro LP SCS, in turn,SCS. As a result, it is a holding entity with no material assets other than its indirect ownership of shares in operating subsidiaries in foreign countries. If we were to distribute a dividend at some point in the future, we would cause the operating subsidiaries to make distributions to Adecoagro LP SCS, which in turn would make distributions to Adecoagro in an amount sufficient to cover any such dividends.
Our subsidiaries in Argentina and Brazil are subject to certain restrictions on their ability to declare or pay dividends. See “Item 5. Operating and Financial Review and Prospects—B. Liquidity and Capital Resources—Indebtedness and Financial Instruments”, and also see “—Risks Related to our Business and Industries—CertainThe terms of our indebtedness and that of certain of our subsidiaries have substantial indebtedness which could impair theirimpose significant restrictions on our operating and financial condition and decrease the amount of dividends we receive.flexibility.”
B.SIGNIFICANT CHANGES
Except as otherwise disclosed in this annual report, there has been no undisclosed significant change since the date of the annual Consolidated Financial Statements.
Item 9. The Offer and Listing
A.OFFER AND LISTING DETAILS
Our common shares have been listed on the NYSE under the symbol “AGRO” since January 28, 2011. As of the date of this report, our issued share capital amounts to $183,572,723,$167.1 million, represented by 122,381,815111,381,815 shares (of which 5,295,7657,295,209 were treasury shares as of December 31, 2020) sharesshares) with a nominal value of $1.50 each. All issued shares are fully paid up.
B.PLAN OF DISTRIBUTION
Not applicable.
C.MARKETS
Our common shares have been listed on the NYSE under the symbol “AGRO” since January 28, 2011. See “—A. Offer and Listing Details.”
D.SELLING SHAREHOLDERS
Not applicable.
E.DILUTION
Not applicable.
F.EXPENSES OF THE ISSUE
Not applicable.
Item 10. Additional Information
A.SHARE CAPITAL
Not applicable.
B.MEMORANDUM AND ARTICLES OF ASSOCIATION
The following is a summary of some of the terms of our common shares, based in particular on our articles of incorporation and the Luxembourg law of August 10, 1915 on commercial companies as amended.
Adecoagro’s shares are governed by Luxembourg law and its articles of incorporation. More information concerning shareholders’ rights can be found in the Luxembourg law on commercial companies dated August 10, 1915, as amended and the articles of incorporation.
The following is a summary of the rights of the holders of our shares that are material to an investment in our common shares. These rights are set out in our articles of association or are provided by applicable Luxembourg law, and may differ from those typically provided to shareholders of U.S. companies under the corporation laws of some states of the United States.
This summary does not contain all information that may be important to you. For more complete information, you should read our updated articles of association, which are attached as an exhibit to this annual report.
General
Adecoagro is a Luxembourg société anonyme (a joint stock company). The Company’s legal name is “Adecoagro S.A.” Adecoagro was incorporated on June 11, 2010 and on October 26, 2010 all the outstanding shares of Adecoagro were acquired by IFH LLC.
On October 30, 2010, the members of IFH LLC transferred pro rata approximately 98% of their membership interests in IFH LLC to Adecoagro in exchange for common shares of Adecoagro. In a series of transactions during 2012, we transferred shares of Adecoagro to certain limited partners of IFH in exchange for their residual interest in IFH, increasing our interest in IFH to approximately 100%.
On January 28, 2011, Adecoagro completed the IPO of its shares on the NYSE. The shares are traded under the symbol “AGRO.”
On March 27, 2015, Adecoagro commenced a series of transactions for the purpose of transferingtransferring the domicile of Adecoagro LP to Luxembourg. In connection with the Adecoagro LP redomiciliation, Adecoagro merged IFH into Adecoagro LP with Adecoagro LP as the surviving entity and Adecoagro GP S.à r.l., a société à responsibilitiéresponsabilité limitée organized under the laws of Luxembourg, became the general partner of Adecoagro LP on April 1, 2015. Also on April 1, 2015, Adecoagro completed the redomiciliation of Adecoagro LP (Delaware) out of Delaware to Luxembourg and Adecoagro LP, without dissolution or liquidation, continued its corporate existence as Adecoagro LP S.C.S., a société en commandite simple organized under Luxembourg law, effective April 2, 2015. For a detailed description of the Adecoagro LP redomiciliation please see “Item 4. Information on the Company—A. History and Development of the Company—History. Since that date the affairs of Adecoagro LP S.C.S. have been governed by its articles of association and Luxembourg law.
Adecoagro is registered with the Luxembourg Registry of Trade and Companies under number B153681. Adecoagro has its registered office at 6 Rue Eugène Ruppert, L-2453, Luxembourg, Grand Duchy of Luxembourg. As from April 30, 2024, the registered office will change from 6 rue Eugène Ruppert, L-2453 Luxembourg to 28 Boulevard F.W. Raiffeisen, L-2411 Luxembourg.
The corporate purpose of Adecoagro, as stated in Article 4 of our articles of incorporation (Purpose Object), is the following: The object of Adecoagro is the holding of participations, in any form whatsoever, in Luxembourg and foreign companies, or other entities or enterprises, the acquisition by purchase, subscription, or in any other manner as well as the transfer by sale, exchange or otherwise of stock, bonds, debentures, notes and other securities or rights of any kind including interests in partnerships, and the holding, acquisition, disposal, investment in any manner (in), development, licensing or sub
licensing of, any patents or other intellectual property rights of any nature or origin as well as the ownership, administration, development and management of its portfolio. Adecoagro may carry out its business through branches in Luxembourg or abroad.
Adecoagro may borrow in any form and proceed to the issuance by private or public means of bonds, convertible bonds and debentures or any other securities or instruments it deems fit.
In a general fashion it may grant assistance (by way of loans, advances, guarantees or securities or otherwise) to companies or other enterprises in which Adecoagro has an interest or which form part of the group of companies to which Adecoagro, belongs or any entity as Adecoagro may deem fit (including upstream or cross stream), take any controlling, management, administrative and/or supervisory measures and carry out any operation which it may deem useful in the accomplishment and development of its purposes.
Finally, Adecoagro can perform all commercial, technical and financial or other operations, connected directly or indirectly in all areas in order to facilitate the accomplishment of its purpose.
Share Capital
On April 20, 2022, the extraordinary general meeting of the shareholders of the Company resolved to reduce the issued share capital of the Company by a nominal amount of $16.5 million by the cancellation of 11,000,000 shares with a nominal value of $1.50 each held in treasury by the Company so that, since April 20, 2022, our issued share capital amounts to $ 167,072,722.50, represented by 111,381,815 shares in issue with a nominal value of $1.50 each.
As of December 31, 20202023, our issued share capital amounted to $183,572,722.50,$167,072,722.50, represented by 122,381,815111,381,815 shares in issue (of which 4,643,3965,376,315 were treasury shares) with a nominal value of $1.50 each. All issued shares are fully paid up.
As of December 31, 2020 Consequently, there were 117,296,951106,005,500 common shares outstanding.
We have an authorized unissued share capital of $220,287,267, including the issued share capital as of April 15, 2020December 31, 2022 of $183,572,722.50$167,072,722.50, and are authorized to issue up to 146,858,178 shares of a nominal value of $1.50 each (taking into account the shares issued as of April 15, 2020)the date hereof) out of such authorized share capital. Our authorized unissued share capital as of April 15, 2020December 31, 2022 is $36,714,544.50.$53,214,544.50.
Our articles of incorporation authorize the boardBoard of directorsDirectors to issue shares within the limits of the authorized un-issuedunissued share capital at such times and on such terms as the board or its delegates may decide for a period ending on April 15, 2025 (unless it is extended, amended or renewed and we currently intend to seek renewals and/or extensions as required from time to time). Accordingly, the board may issue shares within the limits of the authorized (unissued) share capital against contributions in cash, contributions in kind or by way of incorporation of available reserves at such times and on such terms and conditions, including the issue price, as the Board of Directors or its delegate(s) may in its or their discretion resolve while reserving a preemptive subscription right to existing shareholders for any issue of shares.
Our authorized share capital is determined (and may be increased, reduced or extended) by our articles of incorporation, as amended from time to time, by the decision of our shareholders at an extraordinary general shareholders’ meeting with the necessary quorum and majority provided for the amendment of our articles of incorporation. See “—Amendment to the Articles of Incorporation” and “—General Meeting of Shareholders”.
Under Luxembourg law, existing shareholders benefit from a preemptive subscription right on the issuance of shares for cash consideration.consideration (which may however be waived).
Form and Transfer of sharesShares
Our shares are issued in registered form only and are freely transferable. Luxembourg law does not impose any limitations on the rights of Luxembourg or non-Luxembourg residents to hold or vote our shares.
Under Luxembourg law, the ownership of registered shares is evidenced by the inscription of the name of the shareholder, the number of shares held by him or her in the register of shares held at the registered office of the Company. Each transfer of shares in the share register shall be effected by written declaration of transfer to be recorded in the register of shares, such declaration to be dated and signed by the transferor and the transferee, or by their duly appointed agents. We may accept and enter into the share
register any transfer effected pursuant to an agreement or agreements between the transferor and the transferee, true and complete copies of which have been delivered to us.
We may appoint registrars in different jurisdictions, each of whom may maintain a separate register for the shares entered in such register. We have appointed Computershare as our New York registrar and transfer agent. The holders of our shares may elect to be entered in one of the registers and to be transferred from time to time from one register to another register provided that our boardBoard of directorsDirectors may however impose transfer restrictions for shares that are registered, listed, quoted, dealt in, or have been placed in certain jurisdictions in compliance with the requirements applicable therein. The transfer to the register kept at the Company’s registered office may always be requested by a shareholder.
In addition, our articles of incorporation provide that our shares may be held through a securities settlement system or a professional depository of securities. Shares held in such manner have the same rights and obligations as shares recorded in our shareholder register(s) (subject to complying with certain formalities). Shares held through a securities settlement system or a professional depository of securities may be transferred in accordance with customary procedures for the transfer of securities in book-entry form.
Issuance of Shares
Pursuant to Luxembourg law of August 10, 1915 on commercial companies as amended, the issuance of shares in Adecoagro requires the approval by the general meeting of shareholders at the quorum and majority provided for the amendment of our articles of incorporation. See “—Amendment to the Articles of Incorporation” and “—General Meeting of Shareholders”.Shareholders." The general meeting of shareholders may however approve an authorized unissued share capital and authorize
the boardBoard of directorsDirectors to issue shares up to the maximum amount of such authorized unissued share capital for a maximum period of five years. The general meeting may amend, renew or extend such authorized share capital and authorization to the boardBoard of directorsDirectors to issue shares.
We have currently an authorized unissued share capital of $220,287,267, including the issued share capital as of December 31, 2020April 20, 2022 of $183,572,722.50,$167,072,722.50, and are authorized to issue up to 146,858,178 shares of a nominal value of $1.50 each (taking into account the shares already issued)currently issued shares) out of such authorized share capital. As of April 15, 20202024 the authorized un-issuedunissued share capital was $36,714,544.50.$53,214,544.50. Our boardBoard has been authorized to issue shares within the limits of the authorized un-issuedunissued share capital at such times and on such terms as the board or its delegates may decide for a period ending on April 10,15, 2025 (unless it is extended, amended or renewed and we currently intend to seek renewals and/or extensions as required from time to time).
Further, onOn April 15, 2020 the extraordinary general meeting of shareholders adjusted the authorized un-issued share capital from the amount of $3,000,000,000 represented by two billion 2,000,000,000 shares of a nominal value of $1.50 each to $220,287,267 represented by 146,858,178 shares of a nominal value of $1.50 each (which includes the issued share capital) and extended the validity period for 5five more years; until April 10,15, 2025. The extraordinary general meeting of shareholders also resolved that the board may issue shares up to the total number of authorized un-issuedunissued shares until the latter date against contributions in cash or by way of incorporation of available reserves at such times and on such terms and conditions, including the issue price, as the Board of Directors or its delegate(s) may in its or their discretion resolve while reserving a preemptive subscription right to existing shareholders for any issue of shares.
Our articles provide that no fractional shares may be issued.
Our shares have no conversion rights and there are no redemption or sinking fund provisions applicable to our common shares.
Preemptive Rights
Holders of our shares have a pro rata preemptive right to subscribe for any new shares issued for cash consideration or by way of incorporation of available reserves. Our articles provide that in the event of an increase of the issued share capital by the boardBoard of directorsDirectors within the limits of the authorized un-issuedunissued share capital preemptive rights shall always be reserved.
Repurchase of Shares
We cannot subscribe for our own shares.
We may, however, repurchase issued shares or have another person repurchase issued shares for our account, subject in particular to the following conditions:conditions (except in limited circumstances set forth by law)
•the prior authorization of the general meeting of shareholders (at the quorum and majority for ordinary resolutions), which authorization sets forth the terms and conditions of the proposed repurchase and in particular the maximum number of shares to be repurchased, the duration of the period for which the authorization is given (which may not exceed five years) and, in the case of repurchase for consideration, the minimum and maximum consideration per share, must have been obtained;
•the repurchase may not reduce our net assets on a non-consolidated basis to a level below the aggregate of the issued share capital increased by the reserves that we must maintain pursuant to Luxembourg law or its articles of incorporation; and
•only fully paid up shares may be repurchased.
The general meeting of shareholders has authorized that the Company, and/or any wholly-owned subsidiary (and/or any person acting on their behalf), may purchase, acquire, receive or hold shares in the Company under article 430-15 of the Luxembourg law of August 10, 1915, as amended, from time to time up to 10% of the issued share capital, on the following terms and on such terms as referred to below and as shall further be determined by the boardBoard of directorsDirectors of the Company, such authorization being valid (subject to renewal) for a period of five years from January 10, 2011. Such period was thereafter extended to end on April 21, 2026.
Additionally, on April 20, 2022, the general meeting of shareholders authorized the Company, and/or any wholly-owned subsidiary (and/or any person acting on their behalf), to purchase, acquire, receive or hold shares in the Company under article 430-15 of the Luxembourg law of August 10, 1915, as amended, from time to time, up to an additional 10% of the issued share capital, on such terms as determined by the Board of Directors of the Company. This authorization is valid for a period of five years from April 20, 2022.Acquisitions may be made in any manner including without limitation, by tender or other offer(s),offers, buyback program(s),programs, over the stock exchange or in privately negotiated transactions or in any other manner as determined by the boardBoard of directorsDirectors (including derivative transactions or transactions having the same or similar economic effect than an acquisition).
In the case of acquisitions for value:
(i) in the case of acquisitions other than in the circumstances set forth under (ii), for a net purchase price being (x) no less than fifty per cent50% of the lowest stock price and (y) no more than fifty per cent50% above the highest stock price, in each case being the closing price, as reported by the New York City edition of the Wall Street Journal, or, if not reported therein, any other authoritative source to be selected by the boardBoard of directorsDirectors of the Company (hereafter, the closing price), over the ten (10) trading days preceding the date of the purchase (or as the case may be the date of the commitment to the transaction);
(ii) in case of a tender offer (or if deemed appropriate by the boardBoard of directors,Directors, a buyback program),
a. in case of a formal offer being published, for a set net purchase price or a purchase price range, each time within the following parameters: no less than fifty per cent50% of the lowest stock price and (y) no more than fifty per cent50% above the highest stock price, in each case being the closing price over the ten (10) trading days preceding the publication date, provided however that if the stock exchange price during the offer period fluctuates by more than 10%, the boardBoard of directorsDirectors may adjust the offer price or range to such fluctuations;
b. in case a public request for sell offers is made, a price range may be set (and revised by the boardBoard of directorsDirectors as deemed appropriate) provided that acquisitions may be made at a price which is no less than fifty per cent50% of the lowest stock price and (y) no more than fifty per cent50% above the highest stock price, in each case being the closing price over a period determined by the boardBoard of directorsDirectors provided that such period may not start more than five (5) trading days before the sell offer start date of the relevant offer and may not end after the last day of the relevant sell offer period.
In addition, pursuant to Luxembourg law the boardBoard of directorsDirectors may repurchase shares without the prior approval of the general meeting of shareholders if necessary to prevent serious and imminent harm to us or if the acquisition of shares has been made in view of the distribution thereof to the employees.
A share repurchase program was approved by the boardBoard of directorsDirectors of the Company on September 12, 2013 to acquire up to 5% of the total outstanding share capital of the Company to be held as treasury shares (the “Share Repurchase Program”). The Share Repurchase Program was implemented in compliance with the authorization granted by the general meeting of shareholders of the Company, any applicable law, rules or regulations described above and the following limits
approved by the boardBoard of directorsDirectors of the Company. The Share Repurchase Program was approved for a period of 12 months from September 23, 2014 (the date of its announcement) or until reaching the maximum number of shares authorized under the Share Repurchase Program, whichever occurs first. In April 4, 2017, the boardBoard of directorsDirectors amended the Share Repurchase Program to include repurchases under Open Market Transactions, in reliance on the “safe harbour”harbor” from liability for manipulation provided by Rule 10b-18 of the Securities Exchange Act of 1934 (the “Securities Exchange Act”) and in privately negotiated transactions. The Share Repurchase Program was renewed by decision of the Board of Directors on August 11, 202015, 2023 for an additional period of 12 months, ending on September 23, 20212024 or until reaching the maximum number of shares authorized under the Program, whichever occurs first.
Capital Reduction
The articles of incorporation provide that the issued share capital may be reduced, subject to the approval by the general meeting of shareholders at the quorum and majority provided for the amendment of our articles of incorporation. See “—Amendment to the Articles of Incorporation” and “—General Meeting of Shareholders”.
General Meeting of Shareholders
In accordance with Luxembourg law and our articles of incorporation, any regularly constituted general meeting of shareholders of Adecoagro represents the entire body of shareholders of the Company. It shall have the broadest powers to order, carry out or ratify acts relating to the operations of the Company.
The annual general meeting of shareholders of Adecoagro as well as any other meetings of shareholders shall be held in the Grand Duchy of Luxembourg at such place and time as indicated in the notice of the meeting.
Each of our shares entitles the holder thereof to attend our general meeting of shareholders, either in person or by proxy, to address the general meeting of shareholders, and to exercise voting rights, subject to the provisions of our articles of
incorporation. Each share entitles the holder to one vote at a general meeting of shareholders.shareholders, subject to our articles of association. There is no minimum shareholding required to be able to attend or vote at a general meeting of shareholders.
A shareholder may act at any general meeting of shareholders by appointing another person (who need not be a shareholder) as his proxy, which proxy shall be in writing and comply with such requirements as determined by our board with respect to the attendance to the general meeting, and proxy forms in order to enable shareholders to exercise their right to vote. All proxies must be received by us (or our agents) no later than the day preceding the fifth (5th) working day before the date of the general meeting except if our boardBoard of directorsDirectors decides to change such a time frame.
Our articles of incorporation provide that in the case of shares held through the operator of a securities settlement system or depository, a holder of such shares wishing to attend a general meeting of shareholders must receive from such operator or depository a certificate certifying the number of shares recorded in the relevant account on the blocking date and certifying that the shares in the account shall be blocked until the close of the general meeting. Such certificates should be submitted to us no later than the day preceding the fifth working day before the date of the general meeting unless our board fixes a different period.
Our boardBoard of directorsDirectors may determine a date preceding a general meeting as the record date for admission to such general meeting. When convening a general meeting of shareholders, we will publish the convening notice (which must be published at least fifteen15 days before the meeting) in the Recueil Électronique des Sociétés et AssociationAssociations, and in a Luxembourg newspaper and in the case the shares of the Company are listed on a regulated market, in accordance with the publicity requirements of such regulated market applicable to the Company. If all of the shareholders are present or represented at a general meeting of shareholders, the general meeting may be held without prior notice or publication. These convening notices must contain the agenda of the meeting and set out the conditions for attendance and representation at the meeting.
All materials relating to a general meeting of shareholders (including the notice) will be available at the website of Adecoagro at www.adecoagro.com and will be filed with the SEC on Form 6-K. The information on our website is not incorporated by reference in, and does not constitute a part of, this annual report.
Luxembourg law provides that the boardBoard of directorsDirectors is obliged to convene a general meeting of shareholders if shareholders representing, in the aggregate, 10% of the issued share capital so require in writing with an indication of the agenda. In such case, the general meeting of shareholders must be held within one month of the request. If the requested general meeting of shareholders is not held within one month, shareholders representing, in the aggregate, 10% of the issued share capital, may petition the competent president of the district court in Luxembourg to have a court appointee convene the
meeting. Luxembourg law provides that shareholders representing, in the aggregate, 10% of the issued share capital may request that additional items be added to the agenda of a general meeting of shareholders. That request must be made by registered mail sent to the registered office at least five days before the holding of the general meeting of shareholders.
Voting Rights
Each share of our shares entitles the holder thereof to one vote at a general meeting of shareholders.
Luxembourg law distinguishes between “ordinary” general meetings of shareholders and “extraordinary” general meetings of shareholders.
Extraordinary general meetings of shareholders are convened to resolve in particular upon an amendment to the articles of incorporation and certain other limited matters including those described below and are generally subject to the quorum and majority requirements described below. All other general meetings of shareholders are ordinary general meetings of shareholders.
Ordinary General Meetings of Shareholders. At an ordinary general meeting of shareholders there is no quorum requirement, and resolutions are adopted by a simple majority of the votes validly cast, irrespective of the number of shares represented. Abstentions are not considered “votes”.
Extraordinary General Meetings of Shareholders. An extraordinary general meeting of shareholders convened for the purpose of in particular (a) an increase or decrease of the authorized or issued share capital, (b) a limitation or exclusion of preemptive rights, (c) approving a legal merger or de-merger of Adecoagro, (d) dissolution of the Company or (e) an amendment of the articles of incorporation must generally have a quorum of at least 50% of our issued share capital except in limited circumstances provided for by Luxembourg law. If such quorum is not reached, the extraordinary general meeting of
shareholders may be reconvened, pursuant to appropriate notification procedures, at a later date with no quorum requirement applying.
Irrespective of whether the proposed actions described in the preceding paragraph will be subject to a vote at the first or a subsequent extraordinary general meeting of shareholders, such actions are generally subject to the approval of at least two-thirds of the votes validly cast at such extraordinary general meeting of shareholders (except in limited circumstances provided for by Luxembourg law). Abstentions are not considered “votes”.
Appointment and Removal of Directors. Members of the boardBoard of directorsDirectors may be elected by a simple majority of the votes validly cast at any general meeting of shareholders. Under the articles of incorporation, all directors are elected for a period of up to three years with such possible extension as provided therein provided however the directors shall be elected on a staggered basis, with one third (1/3) of the directors being elected each year and provided further that such three year term may be exceeded by a period up to the annual general meeting held following the third anniversary of the appointment. Any director may be removed with or without cause by a simple majority vote at any general meeting of shareholders. The articles of incorporation provide that in case of a vacancy the board ofremaining directors may co-opt a director.director and fill such vacancy.
Neither Luxembourg law nor our articles of incorporation contain any restrictions as to the voting of our shares by non-Luxembourg residents.
Amendment to the Articles of Incorporation
Luxembourg law requires an extraordinary general meeting of shareholders to resolve upon an amendment to the articles of incorporation. The agenda of the extraordinary general meeting of shareholders must indicate the proposed amendments to the articles of incorporation.
An extraordinary general meeting of shareholders convened for the purpose of amending the articles of incorporation must generally have a quorum of at least 50% of our issued share capital. If such a quorum is not reached, the extraordinary general meeting of shareholders may be reconvened at a later date with no quorum according to the appropriate notification procedures. Irrespective of whether the proposed amendment will be subject to a vote at the first or a subsequent extraordinary general meeting of shareholders, the amendment is generally subject to the approval of at least two-thirds of the votes cast at such extraordinary general meeting of shareholders.
Any resolutions to amend the articles of incorporation must be taken before a Luxembourg notary and such amendments must be published in accordance with Luxembourg lawlaw.
Merger and Division
A merger by absorption whereby a Luxembourg company, after its dissolution without liquidation transfers to another company all of its assets and liabilities in exchange for the issuance to the shareholders of the company being acquired of shares in the acquiring company, or a merger effected by transfer of assets to a newly incorporated company, must, in principle, be approved by an extraordinary general meeting of shareholders of the Luxembourg company to be held before a notary. Similarly the de-merger of a Luxembourg company is generally subject to the approval by an extraordinary general meeting of shareholders.
Liquidation
In the event of the liquidation, dissolution or winding-up of Adecoagro, the assets remaining after allowing for the payment of all liabilities will be paid out to the shareholders pro rata to their respective shareholdings. The decision to voluntarily liquidate, dissolve or wind-up require the approval by an extraordinary general meeting of shareholders of the Company to be held before a notary.
No Appraisal Rights
Neither Luxembourg law nor our articles of incorporation provide for any appraisal rights of dissenting shareholders.
Distributions
Subject to Luxembourg law, each share is entitled to participate equally in distributions if and when if declared by the general meeting of shareholders out of funds legally available for such purposes. Pursuant to the articles of incorporation, the
general meeting of shareholders may approve distributions and the boardBoard of directorsDirectors may declare interim distribution, to the extent permitted by Luxembourg law.
Declared and unpaid distributions held by us for the account of the shareholders shall not bear interest. Under Luxembourg law, claims for unpaid distributions will lapse in our favor five years after the date such distribution has been declared.
Annual Accounts
Each year the boardBoard of directorsDirectors must prepare annual accounts, that is, an inventory of the assets and liabilities of Adecoagro together with a balance sheet and a profit and loss account. The boardBoard of directorsDirectors must also prepare, each year, consolidated accounts and management reports on the annual accounts and consolidated accounts. The annual accounts, the consolidated accounts, the management report and the auditor’s reports (inter alia) must be available for inspection by shareholders at the registered office of Adecoagro at least 8eight calendar days prior to the date of the annual general meeting of shareholders.
The annual accounts and the consolidated accounts, after approval by the annual general meeting of shareholders, will need to be filed with the Luxembourg registry of trade and companies within one month after the approval and no more than seven months after the close of the financial year.
Information Rights
Luxembourg law gives shareholders limited rights to inspect certain corporate records 8eight calendar days prior to the date of the annual general meeting of shareholders, including the annual accounts with the list of directors and auditors, the consolidated accounts, the notes to the annual accounts and the consolidated accounts, a list of shareholders whose shares are not fully paid-up, the management reports, the auditor’s report and in case of amendments to the articles, the text of the proposed amendments and the draft of the resulting consolidated articles.
Any registered shareholder is entitled to receive a copy of the annual accounts, the consolidated accounts, the auditor’s reports and the management reports free of charge 8eight calendar days prior to the date of the annual general meeting of shareholders upon request.
Under Luxembourg law, it is generally accepted that a shareholder has the right to receive responses to questions concerning items on the agenda for a general meeting of shareholders, if such responses are necessary or useful for a shareholder to make an informed decision concerning such agenda item, unless a response to such questions could be detrimental to our interests.
One or more shareholders representing at least 10% of the share capital or 10% of the votes attached to all existing securities may ask the boardBoard of directorsDirectors written questions on one or more management operations (opérations de gestion) of the company and, as the case may be, of subsidiaries it controls. In the latter case, the request must be assessed in view of the interest of the companies included within the consolidation. In the absence of response within a period of one month, these shareholders may apply to the court for the appointment of experts instructed to submit a report on the management operations targeted in the question.
Board of Directors
The management of Adecoagro is vested in a boardBoard of directors.Directors. Our articles of incorporation provide that the board must comprise at least three members and no more than eleven11 members. The number of directors is determined and the directors are appointed at the general meeting of shareholders (except in case of a vacancy in the office of a director because of death, retirement, resignation, dismissal, removal or otherwise, the remaining directors may fill such vacancy and appoint a successor in accordance with applicable Luxembourg law).
The directors are appointed for a period of up to three years; provided however the directors shall be elected on a staggered basis, with one-third of the directors being elected each year and provided further that such three year term may be exceeded by a period up to the annual general meeting held following the third anniversary of the appointment. Directors may be removed with or without cause (ad nutum) by the general meeting of shareholders by a simple majority of votes cast at a general meeting of shareholders. The directors shall be eligible for re-election indefinitely. The general shareholders’ meeting may dismiss one or more directors at any time, with or without cause by a resolution passed by simple majority vote, irrespective of the number of shares present at such general shareholders’ meeting.
Currently our board has 9nine members (see “Item 6. Directors, Senior Management and Employees—A. Directors and Senior Management—Board of Directors”). The board meets as often as required by our interests.
A majority of the members of the board in office (and able to vote) present or represented at a board meeting constitutes a quorum, and resolutions are adopted by the simple majority vote of the board members present or represented (and able to vote). The board may also take decisions by means of resolutions in writing signed by all directors.
Our board may delegate the daily management of the business of Adecoagro, as well as the power to represent Adecoagro in its day to dayday-to-day business, to individual directors or other officers or agents of the Company (with power to sub-delegate). In addition, the boardBoard of directorsDirectors may delegate the daily management of the business of Adecoagro, as well as the power to represent Adecoagro in its day to dayday-to-day business to an executive or other committee as it deems fit. The boardBoard of directorsDirectors shall determine the conditions of appointment and dismissal as well as the remuneration and powers of any person or persons so appointed.
Currently the boardBoard of directorsDirectors has appointed the officers listed under “Item 6. Directors, Senior Management and Employees—A. Directors and Senior Management.”
The boardBoard of directorsDirectors may (but shall not be obliged to unless required by law) establish one or more committees (including without limitation an audit committee, a risk and commercial committee, a strategy committee and a compensation committee) and for which it shall, if one or more of such committees are set up, appoint the members (who may be but do not need to be board members), determine the purpose, powers and authorities as well as the procedures and such other rules as may be applicable thereto (subject as to the audit committee as set forth therein).
Currently our board has set up an audit committee. See “Item 6. Directors, Senior Management and Employees—C. Board Practices.” Our board has set up a compensation committee. See “Item 6. Directors, Senior Management and Employees—C. Board Practices.” Our board has set up a risk and commercial committee. See “Item 6. Directors, Senior Management and Employees—C. Board Practices.” Our board has set up a strategy committee. See “Item 6. Directors, Senior Management and Employees—C. Board Practices.”
No director or member of any committee shall, solely as a result of being a director, be prevented from contracting with us, either with regard to his tenure of any office or place of profit or as vendor, purchaser or in any other manner
whatsoever, nor shall any contract in which any director or member of any committee is in any way interested be liable to be avoided, in account of his position as director or member of any committee nor shall any director or member of any committee who is so interested be liable to account for us or the shareholders for any remuneration, profit or other benefit realized by the contract by reason of the director or member of any committee holding that office or of the fiduciary relationship thereby established.
Any director or, as the case may be, member of any committee having a direct or indirect interest in a transaction conflicting with our interest, which has to be considered by the boardBoard of directorsDirectors or the relevant committee, as the case may be, shall be obliged to advise the board or the committee thereof and to cause a record of his statement to be included in the minutes of the meeting. He may not take part in these deliberations nor in the vote of the resolution. At the next following general meeting or boardBoard of directors’Directors’ meeting, before any resolution is put to vote, a special report shall be made on any transactions in which any of the directors or members of any committee may have had an interest conflicting with our interest.
No shareholding qualification for directors is required.
Directors and other officers, past and present, are entitled to indemnification from us to the fullest extent permitted by law against liability and all expenses reasonably incurred by him in connection with any claim, action, suit or proceeding in which he is involved by virtue of his being or having been a director. We may purchase and maintain for any director or other officer insurance against any such liability.
No indemnification shall be provided to any Director or officer against any liability to us or our shareholders by reason of willful misfeasance, bad faith, gross negligence or reckless disregard of the duties involved in the conduct of his office. No indemnification will be provided in the event of a settlement (unless approved by a court of competent jurisdiction or the board), nor will indemnification be provided in proceedings in which that director or officer has been finally adjudicated to have acted in bad faith and not in the interest of the Company.
Transfer Agent and Registrar
The transfer agent and registrar for our common shares is Computershare. The holders of our shares may elect to be entered in one of the registers and to be transferred from time to time from one register to another register provided that our boardBoard of directorsDirectors may however impose transfer restrictions for shares that are registered, listed, quoted, dealt in, or have been placed in certain jurisdictions in compliance with the requirements applicable therein. The transfer to the register kept at the registered office of the Company in Luxembourg may always be requested by a shareholder.
C.MATERIAL CONTRACTS
See “Item 4. Information on the Company—B. Business Overview.Overview—Material Agreements.”
D.EXCHANGE CONTROLS
In
On March 28, 1991, Law No. 23,928 (“Ley de Convertibilidad” or the Argentine Convertibility Law“Convertibility Law”), established a fixed exchange rate according to which the Argentine Central Bank was statutorily obliged to sell U.S. dollars to any individual at a fixed exchange rate of Ps.1.00Peso 1 per $1.00.US$ In December 2001, Argentina experienced a period of severe political, economic, and social crisis, and on January 6, 2002, the Argentine congressCongress enacted Law No. 25,561 (“Ley de Emergencia Pública” or the Public“Public Emergency Law abandoningLaw”) after more than ten years of fixed Peso-U.S. dollarPeso - US$ parity. After devaluing the Peso and setting the official exchange rate at Ps.1.40Peso 1.40 per $1.00,US$, on February 11, 2002, the Argentine government allowed the Peso to float. The shortage of U.S. dollars and their heightened demand caused the Peso to further devaluatedevalue significantly in the first half of 2002. The Argentine Central Bank may indirectly affect this market through2002, reaching its active participation.lowest valuation on June 25, 2002, when the exchange rate was at Pesos 3.90 per US$. Due to the deterioration of the economic and financial situation in Argentina during 2001 and 2002, in addition to the abandonment of the Peso-U.S. dollarPeso - US$ parity, the Argentine government established a number ofseveral monetary and currency exchange control measures, including a partial freeze on bank deposits, the suspension onof the payments of its sovereign foreign debt, restrictions on the transfer of funds out of, or into, Argentina, and the creation of the Single Free Foreign Exchange Market (“(“Mercado Único y Libre de Cambios”Cambios,” which now is called “Mercado“Mercado Libre de Cambios”Cambios”) through which FX Market all purchases and sales of foreign currency must be made. Although since 2003 these restrictions were progressively eased to some extent, as a consequence of the increase ofin the demand in Argentina for U.S. dollars and the capital flow out of Argentina, the Argentine government imposed during 2011 some additional restrictions on the transfer of funds from Argentina and reduced the time required to comply with the mandatory transfer of funds into Argentina.
Most foreign exchange restrictions and the restrictions on the transfer of funds into and out of Argentina that had been enacted since 2011, were lifted by the MacriMacri’s administration in December 2016,2015, reestablishing Argentine residents’ rights to purchase and remit outside of ArgentinaArgentina's foreign currency with no maximum amount and without specific allocation or prior approval.
Due to the foreign exchange crisis that occurred in Argentina after the primary elections in August 2019, and the uncertainties on the presidential elections in October 2019 and the measures to be adopted by a new administration, since September 1, 2019, and effective initially until December 31, 2019, the Argentine Central Bank reinstated rigid restrictions and foreign exchange controls, which have been extended without time limitation by means of Executive Decree No. 91/609/2019 issued on December 28, 2019 by(“Decreto de Control de Exportaciones” or the “Export Controls Decree”), the Argentine Executive Power, andnational government reinstated foreign exchange controls. As the regulatory authority in charge of administering the FX Market, on the same date, the BCRA issued Communication “A” 6862 issued by6770, through which it established, inter alia, the Argentine Central Bank on January 15, 2020 (-cases in which prior BCRA approval is required for the purchase of foreign currency in the FX Market and its transfer abroad. See “Argentine economic“Risk Factors—Risks Related to the Countries in Which We Operate—Economic and political conditions in the countries in which we operate, and perceptionsthe perception of these conditions in the international marketmarkets, may have a directadversely impact on our business, and our access to internationalthe capital and debt markets, and could adversely affect our results of operations and financial condition”.)condition.”
Pursuant to
Later, the effective date of these measures, as further amended and complemented from time to time, and other additional measures adoptedregulations was extended indefinitely by the Argentine Central Bank,government of Alberto Fernández through Decree No. 91/2019 and Communication "A" 6854 and "A" 6856 of the mainBCRA.
Since Javier Milei's recent appointment as president there have already been some eliminations of the previous administration's foreign exchange regulations, but there is still uncertainty as to whether these restrictions will be eliminated or maintained throughout his term. According to the recent presidential press releases, Javier Milei aims in the medium term to unify the different exchange rates and eliminate exchange restrictions. However, before implementing these measures, the current administration has announced that it will resolve the problems associated with the Central Bank’s financial liabilities.
Since the issuance of the Export Controls Decree, the BCRA has periodically issued several regulations to regulate the inflow and outflow of funds through the FX Market, which are all unified under the consolidated text of foreign exchange available at the BCRA’s website: http://www.bcra.gob.ar/Pdfs/Texord/t-excbio.pdf. The most recent and comprehensive communication by the BCRA is Communication “A” 7953, issued on January, 2024.
Current foreign exchange controls in place asArgentina affect the ability of both Argentine and non-Argentine residents to access the FX Market at the so-called official exchange rate to acquire and/or transfer foreign currency to and from Argentina. They affect all industries and cover a wide variety of matters, including, among others, trading activities, imports and exports of goods and services, financial indebtedness, payment of profits and dividends, and repatriation of investments of non-Argentine residents.
Main Features of the Argentine Foreign Exchange Controls Affecting Our Activities and Transactions
Exports of Goods
Proceeds from exports of goods (the countervalue (‘contravalor’) in foreign currency) must be transferred to Argentina and sold for Pesos in the FX Market at the official exchange rate within a maximum term ranging from 15 to 180 calendar days depending on the goods exported and the relationship with the importer. Regardless of the applicable maximum term, upon collection of the export, the proceeds thereof must be repatriated no later than five consecutive days from the date of this report are as follows:collection.
(a) Prior authorization
Amounts collected in foreign currency for insurance claims related to the exported goods must also be repatriated and settled in Pesos in the FX Market, up to the amount of the insured exported goods.
The exporter must appoint a financial entity to track each export transaction. The obligation of repatriation and settlement of foreign currency through the FX Market corresponding to a shipping permit will be considered satisfied when the entity designated for tracking purposes certifies that repatriation and settlement has taken place.
Imports of Goods
Argentine Central Bank is required for thecompanies currently have access to the FX Market for the purchase ofto acquire foreign currency:currency to make payments abroad, provided that certain requirements are met.
• For portfolio investment purposesDifferent requirements apply to goods with customs entry registration, including, among others, that: (i) there is proof of the customs registry of the entry into the country of the goods that originated the payment to be canceled; (ii) the importer has a copy of the commercial invoice issued abroad in the name of the company who made the purchase abroad; and (iii) the documentation presented allows the importer to establish the expiration date of the foreign obligation; and goods with pending customs entry registration must comply with other requirements, including, among others: (i) the documentation allowing to determine the existence of a purchase of goods abroad; (ii) a sworn statement is submitted undertaking to demonstrate the registration of the customs entry of the goods within the term that corresponds according to the type of good to be imported; (iii) elements are provided allowing to guarantee the reasonableness of the amounts to be paid considering the importing activity of the client in recent years and/or the business plans presented by the importer;
Recently, the Central Bank has issued new rules to grant more foreseeability on access to the FX market for more than US$200 per calendar month by individuals who are Argentine residents;
• For portfolio investment purposes by legal entities, local governments, fundsdeferred payments of imported goods and trusts;
• By non-Argentine residents, exceptservices. Since December 15, 2023, the BCRA determined that it will be possible to access the foreign exchange market for certain exemptions;
• Forthe deferred payment of dividends, exceptnew imports of goods with customs entry registration as from December 13, 2023. Importers may access the FX market to acquire foreign currency for payment of imported goods in four installments starting 30 days after the goods’ entry to the country was registered. There are limited exceptions to this rule for the energy and health sector.
Importers may access the FX for deferred payment of imported goods, as follows:
1) 25% of the FOB value of the goods 30 calendar days after their entry;
2) Another 25% 60 days after their entry;
3) Another 25% 90 days after their entry;
4) Outstanding 25% 120 days after their entry.
Please have in mind that no such prior authorizationthe acquisition of foreign currency through the FX market is requiredone of the taxable events of the PAIS tax, currently at a 17.5% for acquisition of foreign currency for the payment of dividends to shareholders who are non-Argentine residents as from January 17, 2020,goods. Please have in mind that when accessing the FX market, the bank collects payment on the PAIS tax on behalf of the importer simultaneously.
In that moment, the bank would collect an amount that (includingextra 17.5% in Pesos of the amount of foreign currency purchased, deducting only the aforementioned advanced payment being made at the time of the access)corresponding import. The advanced payment is made in Pesos and does not exceed 30%accrue interest, so changes in the exchange rate affect the final amount of Pesos to be paid for this tax.
Until recently, importers that intended to access the foreign exchange market were requested to obtain an approved declaration submitted via the SIRA from local authorities. Starting December 13, 2023, according to the Communication “A” 7917 issued by BCRA, it is no longer necessary to have said declaration made through the SIRA in "OUTPUT" status nor to validate the operation in the "Single Current Account" computer system of “Foreign Trade", as previously required. In addition, access to the exchange market may be granted for the deferred payment of new imports of goods with customs entry registration as of December 13, 2023, which will be done according to the schedule established by BCRA depending on the type of good. It is also possible to access the exchange market to pay on a deferred basis for new imports of goods with customs entry registration before the mentioned deadlines when some of the valuecases listed in point 3 of Communication “A” 7917 occur. And finally, prior consent from the BCRA is no longer required for the payment of new capital contributionsimports of foreign direct investments. These contributions must have been madegoods with pending customs registration when, in addition to the local company andremaining applicable requirements, the payment falls within the situations provided for in point 3 of the referred communication.
Exports of Services
Generally, all foreign currency proceeds must have beenbe transferred intoto Argentina and sold for Argentine Pesos throughin the FX Market as from such date, and comply withat the restofficial exchange rate within five consecutive days of collection.
Imports of Services
On December 13, 2023, through Communication “A” 7917, the BCRA ended the validity of the requirements provided inImport System of the regulations;Argentine Republic and Payments for Services Abroad (“SIRASE”).
• For the pre-payment of principal and interest on foreign financial indebtedness with an anticipation of more than three business days in advance to the scheduled maturity dates, unless certain conditions are met;
• For the pre-payment of indebtedness for the import of goods and services, except for certain exemptions;
• For the payment of services with related foreign parties, except for certain exemptions, and;
• Until June 30, 2021Now, for the payment of principal under foreign financial indebtedness with related parties, exceptimports for certain exemptions.
(b) Regardingservices rendered or accrued as from December 13, 2023, they do not require prior approval of the repayment of principal and interest of foreign financial indebtedness, the proceeds of foreign financial loans incurred since September 1, 2019 must be transferred into Argentina and converted into Argentine Pesos throughBCRA or an approved SIRASE declaration. Moreover, a differentiated treatment is established to access the FX Marketmarket depending on the type of service in order forterms of the Argentine resident debtordeadlines to then havemake funds available. However, access to the FX Market will be permitted to pay for new imports for services rendered or accrued as from December 13, 2023, before the repaymentmentioned deadlines when, for instance, accessed with funds originating from imports of principal and interest under suchgoods, financings granted by local financial institutions leveraged by a foreign financial loan on their scheduled maturity. For such purposes, the loan must be declared within the Surveyline of Foreign Assets and Liabilities (Relevamiento de activos y pasivos externos).credit.
(c) AccessOn the other hand, for the payment of imports of services prior to December 13, 2023 prior BCRA approval will be required to access the FX market, except when, for instance, the purchase ofpayment corresponds to transactions financed or guaranteed by local or foreign currency is prohibited for the repayment of local debts and other obligations incurred in foreign currency between Argentine residents as from September 1, 2019, except, among other cases, for obligations instrumented by means of public registries or deeds as of August 30, 2019.financial institutions.
(d) The proceeds obtained from the collections of foreign currency by Argentine residents outside of Argentina for the export of the following goods since September 2, 2019 are subjectFinancial entities may provide access to mandatory transfer into Argentina and conversion into Argentine pesos through the FX Market, within the terms described in each case, computed from the shipment date:
• 15 calendar days for crops and soybean oil;
• 30 calendar days for hydrocarbons and derivatives;
• 60 calendar days for exports between related parties not including the goods described above and for metal ores and precious metals;
• 180 calendar days for all other goods; and
• 365 calendar days for small exports under the EXPORTA SIMPLE program for medium and small companies with annual FOB exports of less than $600,000 and individual exports of less than $15,000 each.
Regardless of the applicable maximum terms described above, upon collection of the export receivables, the proceeds thereof are subject to the mandatory repatriation within the five calendar days computed from the date of payment or collection.
(e) The proceeds from the collection of foreign currency by Argentine residents outside of Argentina for the export of services are subject to mandatory repatriation and conversion into Argentine pesos through the FX Market within five business days computed from the date they are received.
(f) As a general rule, Argentine residents may access the FX Market for the payment of imports of goods. Different requirements applyservices for goods with customs entry registrationexpenses of financial entities of habitual operation, freight and goods with pending customs entry registration. The Argentine importer maytransportation services, among others.
General Requirements to Access the FX Market
Pursuant to foreign exchange regulations, in order to access the FX Market for any type of payment to pay imports of goods with customs entry registration registered in the import payment tracking system (Seguimiento de Pago de Importaciones or “SEPAIMPO”, after its Spanish acronym), provided that certain requirements are met, including,non-Argentine residents, Argentine residents must submit an affidavit stating, among others, the payment is not made before the scheduled maturity date. Payments must be made to the foreign supplier. Goods with pending customs entry registration are subject to a special follow-up regime. In addition, the prior authorization of the Argentine Central Bank is required for the import of luxury goods such as luxury cars and motorbikes, pearls and diamonds, among other luxury goods.
(g) Pursuant to Communication “A” 7001, dated April 30, 2020, as amended, in order to gain access to the FX Market for making any kind of payments, and in addition to applicable requirements, the Argentine Central Bank requires an affidavit from the requestor,that (i) stating that it has not sold in Argentina securities settled against foreign currency or transferred securities to custody accounts outside of Argentina within the immediately preceding 90 calendar days; and (ii) committing not to sell in Argentina securities to be settled against foreign currency or to transfer securities to custody accounts outside of Argentina within the immediately following 90 calendar days.
(h) Communication “A” 7030 of the Argentine Central Bank, dated May 28, 2020, as amended, provides that, for purposes of accessing the FX Market for making payments of, among others things, imports of goods, services rendered by non-Argentine residents, interests in connection with the import of goods and services, dividends and other earnings distributions, principal and interest on financial debt, payment of debt securities with public registry in Argentina, or for making international portfolio investments or transactions with derivatives by legal entities, other purchases of foreign currency for specific allocation and premium, guarantees and payments on interest hedging transactions, the party will be required to file an affidavit (i) stating, that as of such date, all of such party’stheir holdings of foreign currency in Argentina are deposited withat a local financial institution, and (ii) does not hold “liquid external assets” and/or Argentine deposit certificates representative of foreign companies (“Certficados de Depósitos Argentinos” or “CEDEARs”) exceeding US$100,000, subject to certain exceptions. “Liquid external assets” include, among others, demand deposits in foreign financial institutions and that it does not have foreign liquid disposable assets (including, among others,other investments which allow for immediate liquidity in foreign currency gold(such as investments in foreign government securities, funds in investment accounts held abroad, crypto-assets, funds in payment service providers, etc.).
Moreover, the Argentine resident that intends to execute payments through the FX Market must also submit an affidavit confirming that they have not executed any of the following excluding transactions (the “Excluded Transactions”) from the FX Market within the previous 180 calendar days, and savings and checking deposits in non-Argentine financial institutions) for an equivalent of more than US$100,000; and (ii) committing to refrain from executing them in the subsequent 180 calendar days—only regarding securities transactions executed as of April 21, 2023: (i) sale of securities in Argentina settled in foreign currency, (ii) swaps of Argentine securities for foreign assets, (iii) transfer into Argentina and settle for Argentine pesos anyof securities to a foreign depositary, (iv) acquisition of foreign securities in the country with settlement in Pesos, (v) acquisition of CEDEARs, (vi) acquisition of private debt securities issued in foreign jurisdictions, (vii) delivery of funds in local currency or other local assets (excluding funds in foreign currency received outsidedeposited in local financial institutions) to any individual or entity receiving as consideration, either directly or indirectly, or through a related, controlled or controlling entity, external assets, crypto assets or securities deposited abroad.
Further, pursuant to Communication “A” 7746, if the aforementioned Excluded Transactions involve securities issued under local law, the applicable term of Argentina resultingthis affidavit is reduced to the previous 90 days and the commitment to refrain from executing such Excluding Transactions with securities issued under foreign law is also extended to the collection of loans granted to third parties, the collection of deposits or the collectionsubsequent 90 calendar days as of the proceeds resultingpayment through the FX Market.
Moreover, an Argentine resident must identify its direct controllers and submit an affidavit stating whether it has delivered any funds in local currency or other liquid assets to any of its direct controllers in Argentina within the previous 180 calendar days—only regarding securities transactions executed as of April 21, 2023, except for usual transactions involving the acquisition of goods or services between Argentine residents. If so, an additional affidavit must be submitted by such direct controllers stating that they have not executed any of the Excluding Transactions mentioned above in the previous 180 calendar days, and commit to refrain from a sale of an asset, whenexecuting them in the loan was granted,subsequent 180 calendar days. Such 180 calendar days is reduced to 90 calendar days if the deposit was made or the asset was acquired, respectively, after May 28, 2020.transaction involves securities issued under local law.
(i) Foreign Financial Indebtedness
Foreign currency proceeds disbursed by non-Argentine residents as of September 1, 2019, must be transferred to Argentina and sold for Pesos in the FX Market, as a requirement for an Argentine resident not to require prior BCRA approval to access the FX Market to pay principal and interest. In addition, the transaction must have been declared under the Reporting Foreign Assets and Liabilities Regime. See “—Reporting of Foreign Assets and Liabilities Regime.”
Prepayments of principal and interests within more than three business days prior to the scheduled maturity require prior approval by the BCRA, subject to certain exceptions.
Further, prior BCRA approval is currently required to access the FX Market to pay the principal of any foreign financial indebtedness involving related parties, subject to certain exceptions. The BCRA approval has been granted and extended until December 31, 2023. However, it may be further extended in the future. Likewise, as from Communication “A” 4776, BCRA’s prior approval will be required to access the FX Market until such date, for the payment of interest on commercial debts for imports and/or financial indebtedness between related parties.
Obligations between Argentine residents in foreign currency
Access to the FX Market is restricted for the purchase of foreign currency to pay debts and other obligations between Argentine residents originated (“concertadas”) as of September 1, 2019, excluding, among others, any obligations registered in public registries or deeds prior to August 30, 2019.
Mandatory Refinancing of Certain External Debts
Pursuant to Communication “A” 7030,7106 issued by the BCRA, as amended by Communication “A” 7193a supplemented, Argentine residents that hold certain external indebtedness with unrelated parties (including debt securities denominated in foreign currency and 7239,issued in Argentina) must submit a refinancing plan to the Argentine Central Bank providedBCRA to access the FX Market to make payments of principal due on or before December 31, 2023.
Mandatory refinancing obligations imply refinancing at least 60% of the outstanding principal of a debt with a new financing having an average term of not less than two years.
There are certain exceptions to these obligations, including, among others, monthly payments of principal that until June 30, 2021, with certain limited exceptions, accessdo not exceed US$2 million.
Distribution of Profits and Dividends
Access to the FX Market for the payment of importing certain goods or the payment of principal of debts resulting from the import of goods will bedividends to non-resident shareholders is subject to prior BCRA approval, unless the prior approvalfollowing requirements are complied with:
a.Dividends must be the result of closed and audited balance sheets.
b.The total amount paid to non-resident shareholders as dividends shall not exceed the corresponding amount denominated in Pesos, as determined by the shareholders’ meeting.
c.If applicable, the Reporting of Foreign Assets and Liabilities Regime shall have been complied with.
d.The company meets all of the Argentine Central Bank, except where,conditions stipulated in each case, including, among other things,others, recording direct investment contributions settled as of January 17, 2020. In this case, (i) the party files an affidavit stating that the aggregatetotal amount of payments of importstransfers made by such party since January 1, 2020 (includingthrough the payment requested) doesFX Market to pay dividends to non-resident shareholders may not exceed US$1,000,000. Such amount is calculated30% of the total value of the capital contributions made in the relevant local company that entered and settled through the FX Market as the aggregate amount of imports nationalized by the party between January 1, 2020 and the date immediately prior to17, 2020; (ii) access will only be granted after a period of not less than thirty calendar days as of the date of access to the FX Market, plus payments made for other imports not included in the forgoing calculation, less the amount of payments pending for imports with nationalization made between September 1, 2019 and December 31, 2019.
(j) On September 15, 2020, by means of Communication “A” 7106, the Argentine Central Bank restricted the access to FX Market for the payment of principal under foreign financial debt with third parties (other than debt with international or multilateral credit organizations) in excess of US$1,000,000 per month in the aggregate with maturities becoming due between October 15, 2020 and March 31, 2021 to an amount equal to up to 40%settlement of the principal amount originally due;last capital contribution that is considered for determining the aforementioned 30% cap has elapsed; and (iii) evidence of the definitive capitalization of capital contributions must be provided thator, if not available, evidence of filing of the remaining unpaid principal balance is refinanced through a new foreign financial debt with an average lifeprocess of at least two years, with certain limited exceptions. For this purpose,registration of the entities qualifying under this situation were requested to submit a refinancing plancapital contribution before the public registry shall be provided within such guidelines. Similar restrictions and request for a refinancing plan were also put in place for those entities with maturities of principal becoming due between April 1, 2021 and December 31, 2021 (as provided by Communication “A” 7230), for which purposes the Central Bank implemented certain changes with respect to the previous measure. The Argentine Central Bank authorized the prepayment of principal and interest under foreign financial indebtedness in connection with the refinancing described in this paragraph for up to 45365 calendar days from the original stated maturity, subject to compliance with certain additional requirements. The Argentine Central Bank also alloweddate of such initial filing.
In any other event, prior approval from the prepayment of interests on foreign financial indebtedness when such prepaymentBCRA is implemented in connection with the exchange of debt securities and certain additional requirements are met. In addition, pursuant to Communication “A” 7218, dated February 4, 2021, the Argentine Central Bank allowed Argentine residentsrequired to access the FX Market to exchange foreign currency for the paymentdistribution of principalprofits and interest under debt securities registered outsidedividends.
Exports Promotion Program
(k)Pursuant to Decree No. 576/2022, the Argentine Executive Branch created an extraordinary and transitory export promotion program (‘Programa de Incremento Exportador’) (the “Export Promotion Program") to strengthen the reserves of the BCRA. This program is commonly known as “Dólar Soja.” As a general rule, the countervalue of the exported goods must be brought into the country in foreign currency or must be negotiated in the FX Market. In addition, as an incentive for settlement, the program allowed exporters to make their settlements at an exchange rate of Pesos 200 per US$, instead of the official foreign exchange, which on September 4, 2022, was of Pesos 140 per US$. The deadline to settle any foreign currency obtained from exports, including pre-financing and post-financing exports from abroad and settlement advances, made through the Export Promotion Program was September 30, 2022.
Through Decree No. 787/2022, the Export Promotion Program was reestablished, establishing as an incentive an exchange rate of Pesos 230 per US$, with a deadline on December 30, 2022.
Finally, pursuant to Decree 194/2023, the Exports Promotion Program was reinstated, establishing an exchange rate of Pesos 300 per US$ for those export transactions carried out until May 31, 2023, as an incentive, including sale transactions with a price in Pesos to be determined after the sale transaction is executed. This decree sets forth that those who have exported any of the goods listed therein, including, among others, soybean, during an 18-month period immediately preceding the enactment of the decree can become beneficiaries under the Exports Promotion Program.
Adherence to the Export Promotion Program implies that the countervalue of exported soybean crops must be repatriated and settled in the FX Market on or before May 31, 2023. Additionally, exporters must register the Sworn Declarations of Sales Abroad (“Declaraciones Juradas de Ventas al Exterior"or “DJVE”) for goods covered by the program and their final export destinations for consumption under certain conditions.
Adherence to the Export Promotion Program will be voluntary for those who comply with applicable requirements. Registration for the program must be made through the AFIP’s registry system. Moreover, the Export Promotion Program will apply to the goods included in the Decree 194/23 (the “Expanded Goods”), which will have the same exchange benefits as soybean crops in addition to the ability to settle their flows in foreign currency until August 31, 2023.
The Expanded Goods include, among others, the following products:
a.Animal and plant-based products such as fats, oils and waxes, and products of the food industries such as beverages, alcoholic liquids, vinegar and tobacco;
b.From the chemical industry, such as perfumery, toilet or cosmetic preparations;
c.Wood, charcoal and wooden articles, such as corks; and
d.Certain textile materials and articles.
On December 13, the Export Promotion Program was reestablished through the Decree No. 28/2023, with no deadline.
Pursuant to Communications “A” 7609 and “A” 7610, the BCRA established that those participating in the Export Promotion Program will not be allowed to execute any Excluding Transactions (as define above).
Blue-Chip Swaps
Blue chip-swap transactions are capital markets transactions made at the so-called implied rate (tipo de cambio implícito). Currently, there is a significant spread between the US$-Peso official exchange rate (i.e., approximately, US$1-Peso 875) and the implicit exchange rate applicable to blue chip swap transactions (i.e., approximately, US$1- Peso 1025). Blue chip swap transactions could be implemented in different ways, both for the inflow and outflow of funds. [The execution of outbound blue-chip swaps may have an impact on our ability to access the FX Market to conduct our daily operations for a certain period of time. These transactions are made through broker-dealers (“sociedades de bolsa”). Blue chip swaps are regulated by the Argentine Securities Commission (CNV) requiring certain transactions to comply with a minimum holding period of the securities, among others.
Access to the FX Market for the purchase of foreign currency for any of the payments described above is subject to compliance with the foreign indebtedness information regime before the Argentine Central Bank. In addition, to access the FX Market, importers and exporters must register with the Registry created by the Argentine Central Bank containing foreign exchange data on exporters and importers. Any person included in the list to be published by the Argentine Central Bank will be deemed as an obliged party (sujetos obligados) and must be listed in the Registry before April 30, 2021 if they wish to access the foreign exchange market as from May 1, 2021 for transactions involving outflows of funds including swaps and arbitrages. This requirement will not apply when accessing the FX Market for repayment of foreign currency financings granted by local financial entities.Individual Purchases or Investments
Since December 21, 2019, the Argentine congressCongress has passed the Social Solidarity Law, which, among other things, providedothers, established a new 30% taxTax for an Inclusive and Solidary Argentina (Impuesto para una Argentina Inclusiva y Solidaria, or the “PAIS Tax”) on the purchase by Argentine residents of foreign currency for portfolio purposes, the acquisition of goods and services with credit and debit cards and any payments in connection with international passenger transportation. Digital services rendered from outside Argentina (such as hosting, web services, software as a service, streaming services, etc.) are subject to a reduced tax rate of 8.0%.
By resolutionIn addition, the Argentine tax authorities through General Resolution No. 4,815/2020, amended by General Resolution No. 5,463/2023, established an Income Tax and Personal Assets Tax collection regime on the operations subject to this tax which applicable rate is 30%. The acquisition of foreign currency through the CNVFX Market to pay certain services are subject to PAIS tax at a reduced tax rate of 25% and no collection regime applies.
Reporting of Foreign Assets and Liabilities Regime
Argentine residents must report their foreign assets as well as their financial and commercial indebtedness to the BCRA pursuant to Communication “A” 6401, as amended, according to the timetables therein. Compliance with this information regime is a requirement that must be met to access the FX Market and make payments abroad.
Investment Promotion Regime for Exports
Executive Decree No. 878/234/2021 dated January 11, 2021,created the CNV establishedInvestment Promotion Regime for Exports (“Régimen de Fomento de Inversión para las Exportaciones”) (the “Investment Promotion Regime”) to promote economic growth and development in the country. Pursuant to the decree, certain investments exceeding US$100 million destined to the initiation of new productive projects in forestry-industrial, mining, hydrocarbon, manufacturing and agro-industrial activities, as well as for the expansion of existing business units that with certain limited exceptions,require investment in order to processincrease their production, will benefit from a freely applicable amount of up to 20% of any instruction forforeign currency obtained from exports related to the saleproject, to the extent that certain conditions are met (for example, the benefit may not exceed an annual maximum amount equal to 25% of securities acquired with Argentine pesos for U.S. dollars outsidethe gross amount of Argentina, or forthe foreign currency obtained through the FX Market to finance the development of the project, which benefit may only be applied after the first anniversary of the transfer of those securitiesthe foreign currency into Argentina), in order to depositories outsidepay principal and interest on commercial or financial liabilities abroad and profits and dividends corresponding to finalized and audited financial statements, or to repatriate non-resident direct investments. Pursuant to Executive Decree No. 836/2021, the Investment Promotion Regime introduced an additional incentive for investments exceeding US$500 million and US$1,000 million, which sets forth that for each calendar year that the benefit is not used, during the two consecutive years to follow, the beneficiary will enjoy a freely applicable amount of Argentina,up to 40% or up to 60% for investments exceeding US$500 million and $1,000 million, respectively, of the securities must have been heldforeign currency obtained from exports related to the project, to the extent that certain conditions are met (fore example, the benefit may not exceed annual maximum amounts equal to 40% and 60% for at least three business days sinceinvestments exceeding US$500 million and $1,000 million, respectively, of the dategross amount of their creditforeign currency obtained through the FX Market to finance the development of the project, and may be applied after the second anniversary of the first transfer of the foreign currency into Argentina), in the depository’s custody account.order to pay principal and interest on commercial or financial liabilities abroad and profits and dividends that correspond to finalized and audited financial statements, or to repatriate non-resident direct investments.
Pursuant to Decrees Nos. 332/2020 and 376/2020 dated April 1, 2020 and April 20, 2020, respectively, and each as amended, in connection with the COVID-19 crisis, the Argentine government approved government aid for private sector employers. Pursuant to Administrative Decision 591/2020 of the Chief Cabinet of Ministers, entities benefiting from these programs are prohibited from, among other things, making dividend distributions, and purchasing securities with Argentine pesos for their sale for foreign currency or transferring to custody accounts outside of Argentina.Sanctions
The breach of foreign exchange rules is subject to sanctions under Law No. 19,359 (revised text pursuant to(as restated by Decree No. 480/95 and complementary regulations) provides penalties foras further amended) and supplementary regulations (the “Criminal Exchange Regime”). The Criminal Exchange Regime establishes that any act or omission that violates the infringement of any foreign exchange regulations. Penaltiesregulations shall be subject to sanctions under such regime. Sanctions include fines of up to a tenfold increase inten times the amount of the infringing transaction, temporary suspensions, and disqualification, for up toor criminal liability in the event of recidivism. However, fines under the Criminal Exchange Act may not exceed ten years preventingtimes the amount of the largest of the infringing party from acting as importer, exporter and/or as foreign exchange institution, or even prison in event of recidivism.transactions charged within the same summary proceeding.In addition, the Criminal Exchange Regime is applied not only to legal entities, but also to their legal representatives, directors, agents, managers and trustees.
For additional information regarding all current foreign exchange restrictions and exchange control regulations in Argentina, investors should consult their legal advisors and read the applicable rules mentioned herein, as well as any amendments and complementary regulations, which are available at the Argentine Central Bank's website: www.bcra.gob.ar.
Foreign indebtedness information regime
Communique “A” 6401 of the Argentine Central Bank established a reporting regime applicable as of December 31, 2017 for individuals, entities and estates residing in Argentina (the “Obliged Subjects”). The Obliged Subjects must file annual and quarterly or only annual statements with the Argentine Central Bank if the sum of their flows regarding foreign assets and liabilities during the previous calendar year, or their balance of foreign assets and liabilities at the end of the previous calendar year amount to:
•US$ 50,000,000 or more, in which case a quarterly statement must be filed in advance at each quarter, in addition to the annual statement (which may in turn complement and/or ratify the quarterly statements).
•Between US$ 10,000,000 and US$ 50,000,000, in which case only an annual statement must be filed.
•Between US$ 1,000,000 and US$ 10,000,000, in which case only an annual statement must be filed, with an option to use a simplified version of the statement.
The deadlines for submitting the statements will be of 180 calendar days as from the end of the calendar year for annual statements, and 45 calendar days as from the end of the respective quarter for quarterly statements.
Communique “A” 6401 also provides certain definitions and clarifications regarding the five items to be informed, and some concepts such as “residence” and “foreign assets or liabilities”.
For additional information regarding all current foreign exchange restrictions and exchange control regulations in Argentina, investors should consult their legal advisors and read the applicable rules mentioned herein, as well as any amendments and complementarysupplementary regulations, which are available at the Argentine Ministry of Treasury’s website: www.economia.gob.ar, orhttps://www.argentina.gob.ar/economia; and the Argentine Central Bank’sBCRA’s website: www.bcra.gob.ar.
E.TAXATION
MATERIAL LUXEMBOURG TAX CONSIDERATIONS FOR HOLDERS OF COMMON SHARES
The following is a summary discussion of certain Luxembourg tax considerations of the acquisition, ownership and disposition of your shares that may be applicable to you if you acquire our shares. This does not purport to be a comprehensive description of all of the tax considerations that may be relevant to any of the Company’s common shares, and does not purport to include tax considerations that arise from rules of general application or that are generally assumed to be known to holders. This discussion is not a complete analysis or listing of all of the possible tax consequences of such transactions and does not address all tax considerations that might be relevant to particular holders in light of their personal circumstances or to persons that are subject to special tax rules.
It is not intended to be, nor should it be construed to be, legal or tax advice. This discussion is based on Luxembourg laws and regulations as they stand on the date of this annual report and is subject to any change in law or regulations or changes in interpretation or application thereof (and which may possibly have a retroactive effect). Prospective investors should therefore consult their own professional advisers as to the effects of state, local or foreign laws and regulations, including Luxembourg tax law and regulations, to which they may be subject.
As used herein, a “Luxembourg individual” means an individual resident in Luxembourg who is subject to personal income tax (impô(impôt sur le revenu)revenu) on his or her worldwide income from Luxembourg or foreign sources, and a “Luxembourg corporate holder” means a company (that is, a fully taxable entity within the meaning of Article 159 of the Luxembourg Income Tax Law) resident in Luxembourg subject to corporate income tax (impô(impôt sur le revenu des collectivités)s) on its worldwide income from Luxembourg or foreign sources. For purposes of this summary, Luxembourg individuals and Luxembourg corporate holders are collectively referred to as “Luxembourg Holders”.Holders." A “non-Luxembourg Holder” means any investor in shares of Adecoagro other than a Luxembourg Holder.
Tax regime applicable to realized capital gains
Luxembourg Holders
Luxembourg resident individual holders
Capital gains realized by Luxembourg resident individuals who do not hold their shares as part of a commercial or industrial business and who hold no more than 10% of the share capital of the Company will only be taxable if they are realized on a sale of shares that takes place before their acquisition or within the first six months following their acquisition.
Luxembourg resident corporate holders
Capital gains realized upon the disposal of shares by a fully taxable resident corporate holder will in principle be subject to corporate income tax and municipal business tax. The combined applicable rate (including an unemployment fund contribution) is 24.94% for the fiscal year ending 20202024 for a corporate holder established in Luxembourg-City. An exemption from such taxes may be available to the holder pursuant to article 166 of the Luxembourg Income Tax Law subject to the fulfilmentfulfillment of the conditions set forth therein. The scope of the capital gains exemption can be limited in the cases provided by the Grand Ducal Decree of December 21, 2001.
Non-Luxembourg Holders
An individual who is a non-Luxembourg Holder of shares (and who does not have a permanent establishment, a permanent representative or a fixed place of business in Luxembourg) will only be subject to Luxembourg taxation on capital gains arising upon disposal of such shares if such holder has (together with his or her spouse and underage children) directly or indirectly held more than 10% of the capital of Adecoagro at any time during the past five years, and either (i) such holder has been a resident of Luxembourg for tax purposes for at least 15 years and has become a non-resident within the last five years preceding the realization of the gain, subject to any applicable tax treaty, or (ii) the disposal of shares occurs within six months from their acquisition (or prior to their actual acquisition), subject to any applicable tax treaty.
A corporate non-Luxembourg Holder (that is, an entity within the meaning of Article 159 of the Luxembourg Income Tax Law), which has a permanent establishment, a permanent representative or a fixed place of business in Luxembourg to which shares are attributable, will bear corporate income tax and municipal business tax on a gain realized on a disposal of such shares as set forth above for a Luxembourg corporate holder. However, gains realized on the sale of the shares may benefit
from the full exemption provided for by Article 166 of the Luxembourg Income Tax Law and by the Grand Ducal Decree of December 21, 2001 subject in each case to fulfillment of the conditions set out therein.
A corporate non-Luxembourg Holder, which has no permanent establishment in Luxembourg to which the shares are attributable, will bear corporate income tax on a gain realized on a disposal of such shares under the same conditions applicable to an individual non-Luxembourg Holder, as set out above. In principle, a corporate non-Luxembourg holders is only subject to taxation under (ii) above and not to taxation under (i) above. This result obtains from the provision that when a corporate Luxembourg holder migrates abroad and becomes a corporate non-Luxembourg holders,holder, at that moment in time such holder is deemed liquidated for Luxembourg tax purposes and taxation applies at the moment in time.
Tax regime applicable to distributions
Withholding tax
Distributions imputed for tax purposes on newly accumulated profits are subject to a withholding tax of 15%. The rate of the withholding tax may be reduced pursuant to double tax avoidance treaty existing between Luxembourg and the country of residence of the relevant holder, subject to the fulfilmentfulfillment of the conditions set forth therein.
No withholding tax applies if the distribution is made to (i) a Luxembourg resident corporate holder (that is, a fully taxable entity within the meaning of Article 159 of the Luxembourg Income Tax Law), (ii) an undertaking of collective character which is resident of a Member State of the European Union and is referred to by article 2 of the Council Directive of 2011/96 concerning the common fiscal regime applicable to parent and subsidiary companies of different member states of November 20, 2011 (the "Parent Subsidiary Directive"), (iii) a corporation or a cooperative company resident in Norway, Iceland or Liechtenstein and subject to a tax comparable to corporate income tax as provided by the Luxembourg Income Tax Law, (iv) an undertaking with a collective character subject to a tax comparable to corporate income tax as provided by the Luxembourg Income Tax Law which is resident in a country that has concluded a tax treaty with Luxembourg, (v) a
Luxembourg permanent establishment of one of the afore-mentionedaforementioned categories and (vi) a corporation company resident in Switzerland which is subject to corporate income tax in Switzerland without benefiting from an exemption, provided that at the date of payment, the holder holds or commits to hold directly or through a tax transparent vehicle, during an uninterrupted period of at least twelve12 months, shares representing at least 10% of the share capital of Adecoagro or acquired for an acquisition price of at least EUR 1,200,000, and provided that the dividend recipient is not excluded to benefit from the Parent Subsidiary Directive under its mandatory general anti-avoidance rule, as implemented in Luxembourg.
Luxembourg Holders
With the exception of a Luxembourg corporate holders benefittingholder benefiting from the exemption referred to above, Luxembourg individual holders, and Luxembourg corporate holders subject to Luxembourg corporation taxes, must include the distributions paid on the shares in their taxable income, 50% of the amount of such dividends being exempted from tax. The applicable withholding tax can, under certain conditions, entitle the relevant Luxembourg Holder to a tax credit.
Net wealth tax
Luxembourg Holders
Luxembourg net wealth tax will not be levied on a Luxembourg Holder with respect to the shares held unless (i) the Luxembourg Holder is a legal entity subject to net wealth tax in Luxembourg; or (ii) the shares are attributable to an enterprise or part thereof which is carried on through a permanent establishment, a fixed place of business or a permanent representative in Luxembourg.
Net wealth tax is levied annually at the rate depending on the amount the net wealth of enterprises resident in Luxembourg or, a reduced rate of 0.05% for the portion of the net wealth exceeding EUR 500 million, as determined for net wealth tax purposes (i.e. 0.5% on an amount up to EUR 500 million and 0.05% on the amount of taxable net wealth exceeding EUR 500 million). The shares may be exempt from net wealth tax subject to the conditions set forth by Paragraph 60 of the Law of October 16, 1934 on the valuation of assets (Bewertungsgesetz), as amended.
Non-Luxembourg Holders
Luxembourg net wealth tax will not be levied on a non-Luxembourg Holder with respect to the shares held unless the shares are attributable to an enterprise or part thereof which is carried on through a permanent establishment or a permanent representative in Luxembourg.
United States Federal Income Taxation of the Company
Our business assets and properties are located, and all of our employees and executives are based outside the United States. Our business is directly conducted through operating companies organized under the laws of countries other than the United States. These non-U.S. operating companies are indirectly owned by Adecoagro LP SCS, a holding company which is a societesociété commandite simple organized under the laws of Luxembourg. As a partnership that is not engaged in a trade or business within the United States within the meaning of section 864 of the U.S. Internal Revenue Code of 1986, as amended (the “Code”), Adecoagro LP SCS is not itself subject to U.S. federal net income taxes. We acquired approximately 98 percent of Adecoagro LP SCS´s,SCS’s, predecessor company, IFH, prior to undertaking the IPO in exchange for our stock.
Under rules to prevent expatriation of and by U.S. corporations and certain U.S. partnerships under Internal Revenue Code section 7874(b), of the Code, we would be treated as a U.S. domestic corporation if for this purpose (i) we were deemed to have acquired substantially all of the assets constituting the trade or business of a U.S. domestic partnership and (ii) former members of IFH were deemed to own at least 80% of our stock by reason of the transfer of those trade or business assets (ignoring stock issued in the IPO for purposes of the 80% threshold) and (iii) we were found not to conduct substantial business activities in Luxembourg. In that event, we would be subject to U.S. federal net income tax on our worldwide income and dividends we pay to non-U.S. shareholders would be subject to U.S. federal withholding tax at a 30% rate (subject to reduction, to the extent the beneficial owner of the dividend is entitled to claim a reduced rate of withholding under an applicable income tax treaty).
We believe that the restructuring transactions executed prior to or in connection with the IPO should not be subject to section 7874(b). of the Code. Accordingly, we do not believe that we will be subject to U.S. federal income tax on our worldwide income nor do we anticipate paying dividends subject to U.S. federal withholding tax. However, the relevant rules are unclear in certain respects and there is limited guidance on the application of the rules to acquisitions of partnerships or partnership assets constituting a trade or business. Accordingly, we cannot assure youcan provide no assurance that the IRSU.S. Internal Revenue Service (the “IRS”) will not seek to assert that we are a U.S.
domestic corporation, which assertion, if successful could materially increase our U.S. federal income tax liability. Prospective holdersHolders of our common shares who are non-United States persons should also note that, in that event, we would generally be required to withhold tax from any dividends we pay to non-U.S. Holdersholders of our common shares who are not United States persons within the meaning of section 7701(a)(30) of the Code (subject to any applicable income tax treaties applicable to those non-U.S. Holders)such holders).
Shareholders are urged to consult their own tax advisors about the possible application of section 7874.7874 of the Code. The remainder of this discussion assumes that we are not treated as a U.S. corporation for U.S. federal income tax purposes.
Material U.S. Federal Income Tax Considerations for U.S. Holders
The following is a discussion of the material U.S. federal income tax considerations relating to the purchase, ownership and disposition of our common shares. This discussion applies only to beneficial owners of common shares that are “U.S. Holders” (as defined below), who have purchased our common shares in the open market and that hold our common shares as “capital assets” for U.S. federal income tax purposes (generally, property held for investment). This discussion is based on the U.S. Internal Revenue Code, of 1986, as amended, (the “Code”), its legislative history, final, temporary and proposed Treasury regulations, administrative pronouncements, and judicial decisions, and the income tax treaty between Luxembourg and the United States (the “Treaty”), all as of the date hereof, and all of which are subject to change and to differing interpretations (possibly with retroactive effect). No ruling has been sought from the IRS with respect to any U.S. federal income tax consequences described below, and there can be no assurance that the IRS or a court will not take a contrary position.
This discussion does not address all U.S. federal income tax considerations that may be relevant to a particular holder based on its particular circumstances with respect to the acquisition, ownership and disposition of our common shares, and youholders are urged to consult yourtheir own tax advisoradvisors regarding yourtheir specific tax situation.situations. For example, the discussion does not address the tax considerations that may be relevant to U.S. Holders in special tax situations, such as:
•insurance companies;
•tax-exempt organizations (including private foundations)entities, “individual retirement accounts” or “Roth IRAs”;
•brokers or dealers in securities or currencies and traders in securities that elect to mark tomark-to- market;
•banks and financial institutions;
•partnerships or other pass-through entities (or a person holding our common shares through a partnership or other pass-through entity or arrangement treated as such);
•real estate investment trusts and regulated investment companies;
•companies that accumulate earnings to avoid U.S. federal income tax;
•persons who acquire common shares through the exercise of employee share options or other compensation: arrangements;
•persons liable for alternative minimum tax;
•S corporations;
•accrual-method taxpayers subject to special tax accounting rules under Section 451(b) of the Code;
•holders whose functional currency for U.S. federal income tax purposes is not the U.S. dollar ordollar;
•holders that hold shares through non-U.S. brokers of other non-U.S. intermediaries;
•certain former U.S. citizens or residents or U.S. expatriates;
•holders that hold our common shares as part of a hedge, straddle, or conversion or other integrated transaction;
•holders that hold our common shares in connection with a trade or business conducted outside of the United States;
•holders that purchase or sell our common shares as part of a wash sale for U.S. federal income tax purposes; or
•holders that own, directly, indirectly, or constructively, 10% or more of the total combined voting power or value of our common shares.
This discussion does not address the alternative minimum tax consequences of owning common shares or the indirect consequences to holders of equity interests in partnerships or other entities that own our common shares. Moreover, this discussion does not address the state, local and foreign tax consequences of acquiring, owning, or disposing of our common
shares, or any aspect of U.S. federal tax law (such as the estate, generation-skipping and gift tax) other than U.S. federal income taxation.
You are a “U.S. Holder” if you are a beneficial owner of our common shares and you are, for U.S. federal income tax purposes:
•an individual who is a citizen or resident of the United States;
•a corporation, or any other entity taxable as a corporation, created or organized in or under the laws of the United States or any State thereof, including the District of Columbia;
•an estate, the income of which is subject to U.S. federal income taxation regardless of its source; or
•a trust (a) if a court within the United States is able to exercise primary supervision over its administration and one or more U.S. persons have the authority to control all of its substantial decisions or (b) that has a valid election in effect under applicable Treasury regulations to be treated as a U.S. person for U.S. federal income tax purposes.
If a partnership (or an entity or arrangement treated as a partnership for U.S. federal income tax purposes) owns our common shares, the tax treatment of a partner will generally depend upon the status of the partner and upon the activities of the partnership. A partnership that owns our common shares, and partners in such a partnership, should consult their own tax advisors regarding their specific tax situations.
Passive Foreign Investment Company (“PFIC”) Rules
This discussion does not address the alternative minimum tax consequences of owning common shares or the indirect consequences to holders of equity interests in partnerships or other entities that own our common shares. Moreover, this discussion does not address the state, local and foreign tax consequences of acquiring, owning, or disposing of our common shares, or any aspect of U.S. Holders generally will be subject to a special, generally adversefederal tax regime that would differ in certain material respects fromlaw (such as the tax treatment described below if we are, or were to become, a PFIC forestate, generation-skipping and gift tax) other than U.S. federal income tax purposes.taxation.
In general, we will beAs used herein, a PFIC with respect to“U.S. Holder” is a U.S. Holder if, for any taxable year in which the U.S. Holder held our common shares, either (i) at least 75% of our gross income for the taxable year is passive income or (ii) at least 50% of the value (determined on the basis of a quarterly average) of our assets during such taxable year is attributable to assets that produce or are held for the production of passive income. For this purpose, “passive income” generally includes, among other things and subject to certain exceptions, dividends, interest, royalties, rents, annuities, gains from commodities and securities transactions, net foreign currency gains and net gains from assets that produce passive income. If a foreign corporation owns at least 25% by value of the stock of another corporation, the foreign corporation is treated for purposes of the PFIC tests as owning its proportionate share of the assets of the other corporation, and as receiving directly its proportionate share of the other corporation’s income.
If we were to be treated as a PFIC, gain realized on the sale or other disposition of your common shares would in general not be treated as capital gainperson that is, eligible for preferential tax rates in the case of individual, trust or estate U.S. Holders. Instead, if you are a U.S. Holder, unless you make a timely “mark-to-market” election electing to be taxed annually on a mark-to-market basis with respect to your common shares, or you make a timely “qualified electing fund” election electing to be taxed annually on the earnings and gains of the PFIC attributable to your common shares (irrespective of distributions), you would be treated as if you had realized such gain ratably over your holding period in the common shares and would be taxed at the highest tax rate in effect for each such year to which the gain was allocated, together with an interest charge in respect of the tax attributable to each such year except for the current year. In addition, unless you make a timely “mark-to-market” election or “qualified electing fund” election, distributions that you receive from us as a direct or indirect U.S. Holder will not be eligible for the preferential tax rates applicable to qualified dividend income if we are treated as a PFIC with respect to you either in the taxable year of the distribution or the preceding taxable year, but instead will be taxable at the tax rates applicable to ordinary income, and to the extent they are treated as “excess distributions” under the PFIC rules, they will also be subject to the PFIC interest charge described above. A U.S. Holder will be required to make an annual filing with the IRS if such holder holds common shares in any year in which we are classified as a PFIC. With certain exceptions, your common shares will continue to be treated as stock in a PFIC if we were a PFIC at any time during your holding period in your common shares even if we no longer meet the PFIC tests in a later year.
Although the determination of whether a corporation is a PFIC is made annually, and thus may be subject to change, we do not believe that we were a PFIC for U.S. federal income tax purposes, fora beneficial owner of our most recently completedcommon shares and:
•an individual who is a citizen or resident of the United States;
•a corporation, or any other entity taxable year, nor that we will be one for our current taxable year. Theas a corporation, created or organized in or under the laws of the United States or any State thereof, including the District of Columbia; or
•an estate or trust the income of which is subject to U.S. federal income tax rules relating to PFICs are complex. Prospective U.S.
investors are urged to consult their own tax advisers with respect to the application of the PFIC rules to their investment in our common shares. The remainder of this discussion assumes that we are not a PFIC.
Taxation of Dividends
UnderSubject to the passive foreign investment company (“PFIC”) rules discussed below, under the U.S. federal income tax laws and subject to the PFIC rules discussed above, distributions with respect to our common shares (other than certain pro rata distributions of common shares) made to U.S. Holders will, to the extent made from our current or accumulated earnings and profits, as determined under U.S. federal income tax principles, constitute dividends for U.S. federal income tax purposes that are taxable to the U.S. Holder.Holders. Distributions in
excess of our current and accumulated earnings and profits, as determined under U.S. federal income tax principles, will be treated as a non-taxable return of capital to the extent of thea U.S. Holder’s adjusted tax basis in the common shares and thereafter as capital gain from the sale or exchange of the common shares. We do not currently maintain calculations of our earnings and profits under U.S. federal income tax principles. Unless and until these calculations are made, distributions should be presumed to be taxable dividends for U.S. federal income tax purposes. As used below, the term “dividend” means a distribution that constitutes a dividend for U.S. federal income tax purposes.
Dividends (including amounts withheld on account of foreign taxes) paid with respect to our common shares generally will be includible in the gross income of a U.S. Holder as ordinary income on the day on which the dividends are actually or constructively received by the U.S. Holder. Dividends with respect to our common shares will not be eligible for the dividends received deduction allowed to U.S. corporations in respect of dividends received from other U.S. corporations or certain foreign corporations.
If you are an individual, trust or estate U.S. Holder,Subject to applicable limitations, dividends paid on the common shares that constituteto certain non-corporate U.S. Holders may be eligible for taxation as “qualified dividend income” willand therefore may be taxable to you at the preferential rates of taxation applicable to long-term capital gains. Dividends paid ongains, provided that our common shares will be treated as “qualified dividend income” if:
•the common shares are readily tradable on an established securities market in the United States or (b)States. In order to qualify for qualified dividend income treatment, U.S. Holders must meet certain holding period requirements, and we are eligiblemust not be a PFIC for benefits of the income tax treaty between Luxembourg and the United States (the “Treaty”);
•we are not, in the year prior to the year in which the dividend was paid, and are not, in thetaxable year in which the dividend is paid a PFIC;
•or the U.S. Holder holds the common shares for more than 60 days during the 121-day period beginning 60 days before the ex-dividend date and meets other holding period requirements;
•the U.S. Holder is not under an obligation to make related payments with respect to positions in substantially similar or related property.
We believe that our common shares should not be treated as stock of a PFIC for U.S. federal income tax purposes. See “-Passive Foreign Investment Company (“PFIC”) Rules” above.
Aspreceding year. The NYSE, on which our common shares are listed, on the New York Stock Exchange and should qualify as readily tradable onis an established securities market in the United States, so long as they are so listed,and we believe dividends paid by us on our common shares will be qualified dividend income (provided the other conditions listed above are met). There can, however, be no assuranceexpect that our common shares will be consideredshould qualify as readily tradable, on an established securities marketalthough there can be no assurances in the future. However, even if our common shares are not considered readily tradeable on an established securities market in the United States, as long as we are eligible for benefits of the Treaty, dividends paid by us will be qualified dividend income (provided the other conditions listed above are met).this regard. U.S. Holders should consult their own tax advisors regarding the availability of the preferential rates of taxation with respect to dividends in light of their own particular situations, including related restrictions and special rules. Corporate U.S. Holders are taxed on dividend income at the U.S. federal corporate income tax rate whether or not the dividend income is qualified dividend income.
The amount of any cash dividend paid in foreign currency will equal the U.S. dollar value of the dividend, calculated by reference to the exchange rate in effect on the date the distribution is includible in the gross income of the U.S. Holder, regardless of whether the payment is in fact converted to U.S. dollars at that time. A U.S. Holder should not recognize any foreign currency gain or loss in respect of such dividend distribution if such foreign currency is converted into U.S. dollars on the date the dividend distribution is includible in the U.S. Holder’s gross income. If the foreign currency is not converted into U.S. dollars on the date the dividend distribution is includible in the U.S. HoldersHolder’s gross income,income; however, gain or loss may be recognized upon a subsequent conversion of the foreign currency to U.S. dollars. Such foreign currency gain or loss, if any,
generally will be U.S.-source ordinary income or loss and will not be eligible for the preferential tax rate applicable to qualified dividend income. The amount of any distribution of property other than cash will be the fair market value of such property on the date of distribution.
Dividends receivedwill be foreign-source and will include any amount withheld by us in respect of Luxembourg income taxes. Subject to applicable limitations, some of which vary depending upon the U.S. Holder’s particular circumstances, and the discussion below regarding certain Treasury regulations, non-refundable Luxembourg income taxes withheld from dividends (at a rate not exceeding any applicable rate provided by the Treaty in the case of U.S. Holders will constitute foreign-source income and will, depending on the U.S. Holder's circumstances, generally be “passive” or “general” or "foreign branch" income for U.S. foreign tax credit purposes. Subject to limitations under U.S. federal income tax law concerning credits or deductions for foreign taxes and certain exceptions for short-term and hedged positions, a Luxembourg withholding tax imposed on dividends described above under “Material Luxembourg Tax Considerations for Holders of Shares-Tax regime applicable to distributions-Withholding tax” should be treated as a foreign income tax eligible for credit against a U.S. Holder’s U.S. federal income tax liability (or at a U.S. Holder’s election, maythe Treaty) will be deducted in computing taxable income if the U.S. Holder has elected to deduct all foreign income taxes for the taxable year). To the extent a refund of the tax withheld is available to a U.S. Holder under Luxembourg law or under the Treaty, the amount of tax withheld that is refundable will not be eligible for creditcreditable against the U.S. Holder’s U.S. federal income tax liability. Special limitations onThe rules governing foreign tax credits are complex. For example, under Treasury regulations, in the absence of an election to apply the benefits of an applicable income tax treaty, in order for foreign income taxes to dividends subject tobe creditable, the preferentialrelevant foreign income tax rules must be consistent with certain U.S. federal income tax rateprinciples, and we have not determined whether the Luxembourg income tax system meets these requirements. However, the IRS released notices that provide relief from certain of taxationthe provisions of the Treasury regulations described above for qualified dividend income. The rules with respect to foreign tax credits and deductions are complex, andtaxable years ending before the date that a notice or other guidance withdrawing or modifying the temporary relief is issued (or any later date specified in such notice or other guidance). U.S. Holders are urged toshould consult their independent tax advisors regarding the availabilityuse of theforeign taxes in their particular circumstances. In lieu of claiming a foreign tax credit, U.S. Holders may, at their election, deduct foreign taxes, including any Luxembourg income tax, in computing their taxable income, subject to generally applicable limitations under their particular circumstances, includingU.S. law. An election to deduct foreign taxes instead of claiming foreign tax credits applies to all foreign taxes paid or accrued in the effects of the Treaty.taxable year.
Taxation of Capital Gains
Subject to the PFIC rules discussed above,below, gain or loss realized by a U.S. Holder on the sale, exchange or other taxable disposition of common shares will be subject to U.S. federal income taxation as capital gain or loss in an amount equal to the difference between the U.S. dollar value of the amount realized (including the gross amount of the proceeds before the deduction of any foreign tax) on the sale or other taxable disposition and such U.S. Holder’s adjusted tax basis, determined in U.S. dollars, in the common shares. Capital gains of individual, trust or estatenon-corporate U.S. Holders derived with respect to capital assets held for
more than one year generally are eligible for the preferential rates of taxation applicable to long-term capital gains. The deductibility of capital losses is subject to limitations under the Code.
Capital gain or loss, if any, realized by a U.S. Holder on the sale, exchange or other taxable disposition of a common share generally will be treated as U.S.-source income or loss for U.S. foreign tax credit purposes. Consequently, inU.S. Holders should consult their tax advisors regarding the caseuse or deductibility of any Luxembourg taxes imposed on a sale, exchange or other taxable disposition of a common share that is subject to Luxembourg or other foreign income tax imposed on the gain, the U.S. Holder may not be able to use such foreign taxes as a foreign tax credit against their U.S. federal income tax liability on such disposition (i.e., because the income or loss on the disposition would be U.S.-source) but may apply such foreign taxes as a foreign tax credit against U.S. federal income tax due on other income the U.S. Holder may have that is treated as derived from foreign sources in the appropriate foreign tax credit limitation category. Alternatively, the U.S. Holder may take a deduction for the foreign income tax if such holder does not take a credit for any foreign income tax during the taxable year.
If the consideration received for our common shares is paid in foreign currency, the amount realized will be the U.S. dollar value of the payment received translated at the spot rate of exchange on the date of disposition. If our common shares are treated as traded on an established securities market and the relevant U.S. Holder is either a cash basis taxpayer or an accrual basis taxpayer who has made a special election (which must be applied consistently from year to year and cannot be changed without the consent of the IRS), such holder will determine the U.S. dollar value of the amount realized in a foreign currency by translating the amount received at the spot rate of exchange on the settlement date of the sale. If our common shares are not treated as traded on an established securities market, or the relevant U.S. Holder is an accrual basis taxpayer that is not eligible to or does not elect to determine the amount realized using the spot rate on the settlement date, such U.S. Holder will recognize foreign currency gain or loss to the extent of any difference between the U.S. dollar amount realized on the date of disposition (as determined above) and the U.S. dollar value of the currency received at the spot rate on the settlement date. A U.S. Holder’s initial tax basis in our common shares will equal the cost of such common shares. If a U.S. Holder used foreign currency to purchase our common shares, the cost of our common shares will be the U.S. dollar value of the foreign currency purchase price on the date of purchase. If our common shares are treated as traded on an established securities market and the relevant U.S. Holder is either a cash basis taxpayer or an accrual basis taxpayer who has made the special election described above, such holder will determine the U.S. dollar value of the cost of such common shares by translating the amount paid at the spot rate of exchange on the settlement date of the purchase.
NetPassive Foreign Investment Income TaxCompany (“PFIC”) Rules
Certain U.S. Holders that are individuals, estates or trusts that do not fall into a special class of trusts that is exempt from such taxgenerally will be subject to a 3.8% “net investment income”special, generally adverse tax onregime that would differ in certain material respects from the lesser of (1)tax treatment described above if we are, or were to become, a PFIC for U.S. federal income tax purposes.
In general, we will be a PFIC with respect to a U.S. Holder if, for any taxable year in which the U.S. Holder’s “net investment
income” (or “undistributed net investment income” in the caseHolder owns our common shares, either (i) at least 75% of an estate or trust) for the relevant taxable year and (2) the excess of the U.S. Holder’s modified adjustedour gross income for the taxable year over a certain threshold (which inis passive income or (ii) at least 50% of the case of individuals is between $125,000 and $250,000, dependingvalue (generally determined on the individual’s circumstances). A U.S. Holder’s net investment incomebasis of a quarterly average) of our assets during such taxable year is attributable to assets that produce or are held for the production of passive income. For this purpose, “passive income” generally includes, its dividend incomeamong other things and itssubject to certain exceptions, dividends, interest, royalties, rents, annuities, gains from securities transactions, net foreign currency gains and net gains from assets that produce passive income. If a foreign corporation owns at least 25% by value of the dispositionstock of another corporation, the foreign corporation is treated for purposes of the PFIC tests as owning its proportionate share of the assets of the other corporation, and as receiving directly its proportionate share of the other corporation’s income.
Whether we will be a PFIC for the current or future tax year will depend on our assets and income over the course of each such tax year and, as a result, cannot be predicted with certainty as of the date of this annual report. Under circumstances where our cash is not deployed for active purposes, our risk of becoming a PFIC may increase. Although the determination of whether a corporation is a PFIC is made annually, and thus may be subject to change, we do not believe that we were a PFIC for U.S. federal income tax purposes for our most recently completed taxable year. However, there can be no assurance that we will not be a PFIC for any taxable year.
If we are a PFIC for any taxable year during which a U.S. Holder owns our common shares, unless the U.S. Holder makes a timely “mark-to-market” electionelecting to be taxed annually on a mark-to-market basis with respect to such U.S. Holder’s common shares, or makes a timely “qualified electing fund” election electing to be taxed annually on the earnings and gains of the PFIC attributable to such U.S. Holder’s common shares (irrespective of distributions), gain recognized by such U.S. Holder on a sale or other disposition (including certain pledges) of its common shares would be allocated ratably over such U.S. Holder’s holding period in the common shares and would be taxed at the highest tax rate in effect for each such year to which the gain was allocated, together with an interest charge in respect of the tax attributable to each such year except for the current year. In addition, distributions that the U.S. Holder receives from us will not be eligible for the preferential tax rates applicable to qualified dividend income or net gainsif we are derivedtreated as a PFIC with respect to such U.S. Holder either in the ordinary coursetaxable year of the conduct ofdistribution or the preceding taxable year, but instead will be taxable at the tax rates applicable to ordinary income, and to the extent they are treated as “excess distributions” under the PFIC rules, they will also be subject to the PFIC interest charge described above. We do not intend to provide the information necessary to enable U.S. Holders to make a trade or business (other than a trade or business that consists of certain passive or trading activities). Each“qualified electing fund” election.
A U.S. Holder that isgenerally will be required to make an individual, estate or trust isannual filing with the IRS if such holder owns common shares in any year in which we are a PFIC. With certain exceptions, our common shares will continue to be treated as stock in a PFIC with respect to a particular U.S. Holder if we are a PFIC at any time during such U.S. Holder’s holding period in our common shares even if we no longer meet the threshold requirements for PFIC status in a later year.
The U.S. federal income tax rules relating to PFICs are complex. U.S. Holders are urged to consult itstheir own tax advisors regardingwith respect to the applicabilityapplication of the “net investment income” taxPFIC rules to its income and gains in respect of itstheir investment in theour common shares.
Information Reporting and Backup Withholding
In general, dividends on common shares, and payments of the proceeds of a sale, exchange or other taxable disposition of common shares, paid within the U.S. or through certain U.S. related financial intermediaries to a U.S. Holder are subject to information reporting and may be subject to backup withholding unless the holder is an exempt recipient or, in the case of
backup withholding, provides an accurate taxpayer identification number and certifies under penalty of perjury that the holder is a U.S. person and is not subject to backup withholding.
Backup withholding is not an additional tax. Any amounts withheld under the backup withholding rules generally will be allowed as a refund or a credit against a U.S. Holder’s U.S. federal income tax liability, provided that the required information is timely furnished to the IRS.
Certain U.S. Holders who hold interests in “specified foreign financial assets” (as defined in Sectionsection 6038D of the Code) are generally required to file an IRS Form 8938 as part of their U.S. federal income tax returns to report their ownership of such specified foreign financial assets, which may include our common shares, if the total value of those assets exceeds certain thresholds. Financial assets that are held through a U.S. financial institution are not subject to this reporting requirement. Investors who fail to report this required information could become subject to substantial penalties. In addition, in the event a U.S. Holder that is required to file IRS Form 8938 does not file such form, the statute of limitations on the assessment and collection of U.S. federal income taxes of such holder for the related tax year may not close until three years after the date that the required information is filed. U.S. Holders are encouraged to consult with their own tax advisors regarding their tax reporting obligations.
F.DIVIDENDS AND PAYING AGENTS
Not applicable.
G.STATEMENT BY EXPERTS
Not applicable.
H.DOCUMENTS ON DISPLAY
We are required to file annual and special reports and other information with the SEC. You may read and copy any documents filed by the Company at the SEC’s public reference room at 100 F Street, N.E., Room 1580, Washington, D.C. 20549. Please call the SEC at 1-800-SEC-0330 for further information on the public reference room. The SEC also maintains a website at http://www.sec.gov which contains reports and other information regarding registrants that file electronically with the SEC.
I.SUBSIDIARY INFORMATION
Not applicable.
J.ANNUAL REPORT TO SECURITY HOLDERS
If we are required to provide an annual report to security holders in response to the requirements of Form 6-K, we will submit the annual report to security holders in electronic format in accordance with the EDGAR Filer Manual.
Item 11. Quantitative and Qualitative Disclosures About Market Risk
In the normal course of business, we are exposed to commodity price and interest rate risks, primarily related to our crop production activities and changes in exchange rates and interest rates. We manage our exposure to these risks through the use of various financial instruments, none of which are entered into for trading purposes. We have established policies and procedures governing the use of financial instruments, specifically as they relate to the type and volume of such financial instruments. Our use of financial derivative instruments is associated with our core business and is regulated by internal control policies. For further information on our market risks, please see Note 2 to our Consolidated Financial Statements.
Item 12. Description of Securities Other than Equity Securities
A.DEBT SECURITIES
Not applicable.
B.WARRANTS AND RIGHTS
Not applicable.
C.OTHER SECURITIES
Not applicable.
D.AMERICAN DEPOSITORY SHARES
Not applicable.
PART II
Item 13. Defaults, Dividend Arrearages and Delinquencies
Not applicable.
Item 14. Material Modifications to the Rights of Security Holders and Use of Proceeds
Not applicable.
Item 15. Controls and Procedures
a) Disclosure Controls and Procedures
Our company’s management, with the participation of the Chief Executive Officer and Chief Financial Officer, conducted an evaluation pursuant to Rule 13a-15 promulgated under the Securities Exchange Act of 1934, of the effectiveness of our disclosure controls and procedures as of December 31, 2020.2023. There are inherent limitations to the effectiveness of any system of disclosure controls and procedures, including the possibility of human error and the circumvention or overriding of the controls and procedures. Accordingly, even effective disclosure controls and procedures can only provide reasonable assurance of achieving their control objectives. Based on this evaluation, our company’s Chief Executive Officer and Chief Financial Officer concluded that such disclosure controls and procedures were effective as of December 31, 2020.2023.
b) Management’s Annual Report on Internal Control over Financial Reporting
The Company’s Management is responsible for establishing and maintaining adequate internal control over financial reporting as defined in Rules 13a-15(f) and 15d-15(f) under the Securities Exchange Act of 1934. The Company’s internal control over financial reporting is a process designed under the supervision of the Company’s Chief Executive Officer and Chief Financial Officer that: (i) pertains to the maintenance of records that, in reasonable detail, accurately and fairly reflect the transactions and dispositions of the Company’s assets; (ii) provides reasonable assurance that transactions are recorded as necessary to permit preparation of financial statements for external reporting in accordance with generally accepted accounting principles,IFRS, and that receipts and expenditures are being made only in accordance with authorization of the Company’s management and directors; and (iii) provides reasonable assurance regarding prevention or timely detection of unauthorized acquisition, use or disposition of the Company’s assets that could have a material effect on the financial statements.
Because of its inherent limitations, internal control over financial reporting may not prevent or detect misstatements. Also, projections of any evaluation of effectiveness to future periods are subject to the risk that controls may become inadequate because of changes in conditions, or that the degree of compliance with the policies or procedure may deteriorate. The Company, with the participation of its Chief Executive Officer and Chief Financial Officer, has assessed the effectiveness of the Company’s internal control over financial reporting as of December 31, 2020.2023.
We assessed the effectiveness of the Company’s internal controls over financial reporting as of December 31, 2020.2023. In making this assessment, management used the criteria established in “Internal Control — Integrated Framework (2013)” issued by the Committee of Sponsoring Organizations of the Treadway Commission (“COSO”). As a result of this assessment, the Company’s management has determined that the Company’s internal control over financial reporting was effective as of December 31, 2020.2023.
c) Attestation Report of the Registered Public Accounting Firm
The effectiveness of the Company’s internal control over financial reporting as of December 31, 20202023 has been audited by Price Waterhouse & Co S.R.L, an independent registered public accounting firm, our independent auditor, as stated in their report which is included herein at pageon pages F-2 to F-4 of our Consolidated Financial Statements.
d) Changes in internal control over financial reporting
As required by Rule 13a-15(d), under the Exchange Act, our management, including our Chief Executive Officer and Chief Financial Officer, conducted an evaluation of our internal control over financial reporting to determine whether any change occurred during the period covered since the last report that has materially affected, or is reasonably likely to materially affect, our internal control over financial reporting. Based on this evaluation, it has been determined that there has been no
change during the period covered by this annual report that has materially affected, or is reasonably likely to materially affect, our internal control over financial reporting.
Item 16.
Item 16 A.Audit Committee Financial Expert
Our audit committee consistsshall consist of three independent directors: Mr. Andrés Velasco Brañes, Mr. Mark Schachter and Mrs. Ana Cristina Russo. Pursuant to the Annual Shareholders´ meeting held on April 17, 2024, Mr. Mark Schachter is no longer a director of the Company, therefore the vacancy left by Mr. Schachter will be filled-in in the next Board of Directors´ meeting that will be held in May 2024. Our Board of Directors has determined that Mr. Andrés Velasco Brañes and Mr. Ivo Sarjanovic. Our board of directors has determined that Mr. Mark Schachter has the attributes of an “audit committee financial expert” and is independent within the meaning of this Item 16A and satisfies the financial literacy requirements of the NYSE.
Item 16 B.Code of Ethics
We have adopted a code of ethics and business conduct that applies to our directors, executive officers and all employees. The text of our code of ethics is posted on our web site at: www.adecoagro.com. The information on our website is not incorporated by reference in, and does not constitute a part of, this annual report.
Item 16 C.Principal Accountant Fees and Services
The following table sets forth the aggregate fees by categories specified below in connection with certain professional services rendered by Price Waterhouse & Co. S.R.L., a member firm of Price WaterhouseCoopers International Limited Network, an independent registered public accounting public firm, and our principal external auditors, for the periods indicated. Except as set forth below, we did not pay any other fees to our auditors during the periods indicated below.
| | | | | | | | | | | |
| | For the year ended
December 31, |
| | (in thousands of $) |
| | 2020 | | 2019 |
Audit Fees(1) | 1,275 | | | 1,288 | |
Tax fees(2) | — | | | — | |
| Total | 1,275 | | | 1,288 | |
| | | | | | | | | | | |
| | For the year ended
December 31, |
| | (in thousands of $) |
| | 2023 | | 2022 |
Audit Fees(1) | 1,375 | | | 1,386 | |
| | | |
| Total | 1,375 | | | 1,386 | |
(1)“Audit fees” means the aggregate fees billed for professional services rendered by our principal auditors for the audit of our Consolidated Financial Statements and internal control over financial reporting of the Company, the statutory financial statements of the Company and its subsidiaries, and any other audit services required for the SEC or other regulatory filings.
During the fiscal year ended December 31, 20202023 and 2019,2022, no non-audit-related services were provided by our principal auditors.
Audit Committee Approval Policies and Procedures
The Audit Committee has adopted pre-approval policies and procedures requiring that all audit and non-audit services performed by our independent auditors must be pre-approved by the Audit Committee. The Audit Committee annually reviews and pre-approves the services that may be provided by the independent auditors without obtaining specific pre-approval from the Audit Committee. Any service proposals submitted by external auditors that are not pre-approved services need to be discussed and approved by the Audit Committee during its meetings. Once the proposed service is approved, we or our subsidiaries formalize the engagement of services.
The Audit Committee or its Chairman, or any member of the Audit Committee to whom such authority is delegated, may approve in advance any permitted audit or permitted non-audit services and fees up to a predetermined amount. The Audit Committee is authorized to establish other policies and procedures for the pre-approval of such services and fees. The Audit Committee approved all of the non-audit services described above and determined that the provision of such services is compatible with maintaining the independence of Price Waterhouse & Co. S.R.L.
Item 16 D.Exemptions from the Listing Standards for Audit Committees
Not applicable.
Item 16 E.Purchases of Equity Securities by the Issuer and Affiliated Purchasers
| | | | (a) Total Number of
Shares (Units)
Purchased | (b) Average Price
Paid per Share | (c) Total Number of
Shares Purchased as
Part of Publicly
Announced Plans or
Programs | (d) Maximum
Number of Shares
that may yet be
Purchased Under the
Plans or Programs | | (a) Total Number of Shares Purchased (1) | (b) Average Price
Paid per Share | (c) Total Number of
Shares Purchased as
Part of Publicly
Announced Plans or
Programs | (d) Maximum
Number of Shares
that may yet be
Purchased Under the
Plans or Programs |
| 09/1/2013-12/31/2013 | 09/1/2013-12/31/2013 | 654,454 | 7.71 | 654,454 | 5,861,397 | 09/1/2013-12/31/2013 | 654,454 | 7.71 | 654,454 | 5,861,397 |
| 1/1/2014-8/31/2014 | 1/1/2014-8/31/2014 | 1,692,139 | 7.81 | 1,692,139 | 4,591,949 | 1/1/2014-8/31/2014 | 1,692,139 | 7.81 | 1,692,139 | 4,591,949 |
| 9/1/2015-10/31/2015 | 9/1/2015-10/31/2015 | 37,500 | 7.96 | 37,500 | 6,025,916 | 9/1/2015-10/31/2015 | 37,500 | 7.96 | 37,500 | 6,025,916 |
| 9/1/2016-12/31/2016 | 9/1/2016-12/31/2016 | 456,732 | 10.67 | 456,732 | 5,929,278 | 9/1/2016-12/31/2016 | 456,732 | 10.67 | 456,732 | 5,929,278 |
| 1/1/2017-12/31/2017 | 1/1/2017-12/31/2017 | 3,849,445 | 10.29 | 3,849,445 | 5,010,777 | 1/1/2017-12/31/2017 | 3,849,445 | 10.29 | 3,849,445 | 5,010,777 |
| 1/1/2018-4/26/2018 | 1/1/2018-4/26/2018 | 1,613,584 | 9.07 | 1,613,584 | 1,658,228 | 1/1/2018-4/26/2018 | 1,613,584 | 9.07 | 1,613,584 | 1,658,228 |
| 1/1/2019-9/30/2019 | 1/1/2019-9/30/2019 | 297,732 | 5.83 | 297,732 | 5,530,053 | 1/1/2019-9/30/2019 | 297,732 | 5.83 | 297,732 | 5,530,053 |
| 10/1/2019-12/31/2019 | 10/1/2019-12/31/2019 | 398,466 | 6.31 | 398,466 | 5,475,760 | 10/1/2019-12/31/2019 | 398,466 | 6.31 | 398,466 | 5,475,760 |
| 1/1/2020-9/30/2020 | 1/1/2020-9/30/2020 | 772,615 | 5.06 | 772,615 | 4,703,145 | 1/1/2020-9/30/2020 | 772,615 | 5.06 | 772,615 | 4,703,145 |
| 12/1/2020-12/31/2020 | 12/1/2020-12/31/2020 | 66,716 | 6.60 | 66,716 | 5,800,224 | 12/1/2020-12/31/2020 | 66,716 | 6.60 | 66,716 | 5,800,224 |
| 1/1/2021-1/31/2021 | 532,894 | 7.59 | 532,894 | 5,267,330 |
| 2/1/2021-2/28/2021 | 371,251 | 8.06 | 371,251 | 4,896,079 |
| 3/1/2021-3/31/2021 | 289,606 | 8.33 | 289,606 | 4,606,473 |
| 4/1/2021-4/19/2021 | 178,105 | 8.35 | 178,105 | 4,428,368 |
| 1/1/2021-9/24/2021 | | 1/1/2021-9/24/2021 | 5,773,260 | 9.26 | 5,773,260 | 26,964 |
| 9/24/2021-12/31/2021 | | 9/24/2021-12/31/2021 | 1,635,742 | 7.87 | 1,635,742 | 3,998,776 |
| 1/1/2022-9/23/2022 | | 1/1/2022-9/23/2022 | 3,088,816 | 8.05 | 3,088,816 | 909,960 |
| 9/23/2022-12/31/2022 | | 9/23/2022-12/31/2022 | 1,493,811 | 7.95 | 1,493,811 | 3,978,648 |
| 1/1/2023-9/23/2023 | | 1/1/2023-9/23/2023 | 2,004,892 | 9.02 | 2,004,892 | 1,973,756 |
| 9/24/2023-12/31/2023 | | 9/24/2023-12/31/2023 | 740,806 | 10.97 | 740,806 | 4,591,097 |
| 1/1/2024-4/23/2024 | | 1/1/2024-4/23/2024 | 2,427,873 | 10.36 | 2,427,873 | 2,163,224 |
| Total | Total | 11,211,239 | 7.83 | 11,211,239 | |
(1) The total number of shares purchased set forth above were purchased pursuant to the Company´sCompany’s Repurchase Program adopted on September 12, 2013. See “Item 10 – 10—Additional Information – Information—Repurchase of Shares”.
Item 16 F.Change in Registrant’s Certifying Accountant
Not applicable.
Item 16 G.Corporate Governance
Our corporate governance practices are governed by Luxembourg law (particularly the law of August 10th, 1915 on commercial companies) and our articles of association. As a Luxembourg company listed on the NYSE, we are not required to comply with all of the corporate governance listing standards of the NYSE. We, however, believe that our corporate governance practices meet or exceed, in all material respects, the corporate governance standards that are generally required for controlled companies by the NYSE. The following is a summary of the significant ways that our corporate governance practices differ from the corporate governance standards required for listed U.S. companies by the NYSE (provided that our corporate governance practices may differ in non-material ways from the standards required by the NYSE that are not detailed here):
Majority of Independent Directors
Under NYSE standards, U.S. listed companies must have a majority of independent directors. There is no legal obligation under Luxembourg law to have a majority of independent directors on the boardBoard of directors.Directors.
Non-management Directors’ Meetings
Under NYSE standards, non-management directors must meet at regularly scheduled executive sessions without management present and, if such group includes directors who are not independent, a meeting should be scheduled once per year including only independent directors. Neither Luxembourg law nor our Articles of Association require the holding of such meetings and we do not have a set policy for these meetings. Our Articles of Association provide, however, that the board shall meet as often as required by the best interest of the Company. For additional information, see “Item 6. Directors, Senior Management and Employees—A. Directors and Senior Management.”
Communication with Non-Management Directors
NYSE-listed companies are required to provide a method for interested parties to communicate directly with the non-management directors as a group. Shareholders may send communications to the Company’s non-management directors by writing to Mr. Plínio Musetti at Rua Amauri, 255 - 17th Floor, Jardim Europa, São Paulo, SP 01448-000, Brazil, telephone: (5511) 3035-1588. Communications will be referred to the Presiding Director for appropriate action. The status of all outstanding concerns addressed to the Presiding Director will be reported to the boardBoard of directorsDirectors as appropriate.
Audit Committee
Under NYSE standards, listed U.S. companies are required to have an audit committee composed of independent directors that satisfies the requirements of Rule 10A-3 promulgated under the Exchange Act of 1934. Our Articles of Association provide that the boardBoard of directorsDirectors may set up an audit committee. The boardBoard of directorsDirectors has set up an Audit Committee and has appointed Mr. Mark Schachter , Mr. Ivo Andrés Sarjanovic and Mr. Andres Velasco Brañes, Mr. Mark Schachter and Mrs. Ana Cristina Russo as members of its audit committee. Pursuant to the Annual Shareholders´ meeting held on April 17, 2024, Mr. Mark Schachter is no longer a director of the Company, therefore the vacancy left by Mr. Schachter will be filled-in in the next Board of Directors´ meeting that will be held in May 2024. In accordance with NYSE standards, we have an audit committee entirely composed of independent directors. For additional information, see “Item 6. Directors, Senior Management and Employees—C. Board Practices”.Practices.”
Under NYSE standards, all audit committee members of listed U.S. companies are required to be financially literate or must acquire such financial knowledge within a reasonable period and at least one of its members shall have experience in accounting or financial administration. In addition, if a member of the audit committee is simultaneously a member of the audit committee of more than three public companies, and the listed company does not limit the number of audit committees on which its members may serve, then in each case the board must determine whether the simultaneous service would prevent such member from effectively serving on the listed company’s audit committee and shall publicly disclose its decision. No comparable provisions on audit committee membership exist under Luxembourg law or our articles of association.
Standards for Evaluating Director Independence
Under NYSE standards, the board is required, on a case by case basis, to express an opinion with regard to the independence or lack of independence of each individual director. Neither Luxembourg law nor our Articles of Association require the board to express such an opinion. In addition, the definition of “independent” under the rules of the NYSE differs in some non-material respects from the definition contained in our Articles of Association.
Audit Committee Responsibilities
Pursuant to our Articles of Association, the audit committee shall assist the boardBoard of directorsDirectors in fulfilling its oversight responsibilities relating to the integrity of the Company’s financial statements, including periodically reporting to the boardBoard of directorsDirectors on its activity and the adequacy of the Company’s system of internal controls over financial reporting. As per the audit committee charter, as amended, the audit committee shall make recommendations for the appointment, compensation, retention and oversight of, and consider the independence of, the company’s external auditors. The audit committee is required to review material transactions (as defined by the Articles of Association) between us or our subsidiaries with related parties, perform such other duties imposed to it by laws and regulations of the regulated market(s) on which the shares of the Company are listed, and also perform the other duties entrusted to it by the board.
The NYSE requires certain matters to be set forth in the audit committee charter of U.S. listed companies. Our audit committee charter provides for many of the responsibilities that are expected from such bodies under the NYSE standard;
however, due to our equity structure and holding company nature, the charter does not contain all such responsibilities, including provisions related to setting hiring policies for employees or former employees of independent auditors.
Nominating/Corporate Governance Committee.Committee
The NYSE requires that a listed U.S. company have a nominating/corporate governance committee of independent directors and a committee charter specifying the purpose, duties and evaluation procedures of the committee. As permitted under Luxembourg law and our Articles of Association, we do not currentlyWe have a nominating or corporate governance committee.Nominating Sub-Committee, which is part of the Talent Management & Compensation Committee, which consists of three independent directors: Mr. Plínio Musetti, Mr. Daniel González and Mr. Guillaume van der Linden.
Shareholder Voting on Equity Compensation Plans
Under NYSE standards, shareholders of U.S. listed companies must be given the opportunity to vote on equity compensation plans and material revisions thereto, except for employment inducement awards, certain grants, plans and amendments in the context of mergers and acquisitions, and certain specific types of plans. Neither Luxembourg corporate law nor our articles of incorporation require shareholder approval of equity based compensation plans. Luxembourg law only requires approval of the boardBoard of directorsDirectors for the adoption of equity based compensation plans.
Disclosure of Corporate Governance Guidelines
NYSE-listed companies must adopt and disclose corporate governance guidelines. Neither Luxembourg law nor our Articles of Association require the adoption or disclosure of corporate governance guidelines. Our boardBoard of directorsDirectors follows corporate governance guidelines consistent with our equity structure and holding company nature, but we have not codified them and therefore do not disclose them on our website.
Code of Business Conduct and Ethics
Under NYSE standards, listed companies must adopt and disclose a code of business conduct and ethics for directors, officers and employees, and promptly disclose any waivers of the code for directors or executive officers. Neither Luxembourg law nor our Articles of Association require the adoption or disclosure of such a code of conduct.
We have adopted a code of ethics and business conduct that applies to our directors, executive officers and all employees. The text of our code of ethics is posted on our web site at: www.adecoagro.com. And substantially complies with the NYSE´sNYSE’s requirements under the Code of Business Conduct and Ethics.
Chief Executive Officer Certification
A chief executive officer of a U.S. company listed on NYSE must annually certify that he or she is not aware of any violation by the company of NYSE corporate governance standards. In accordance with NYSE rules applicable to foreign private issuers, our chief executive officer is not required to provide NYSE with this annual compliance certification. However, in accordance with NYSE rules applicable to all listed companies, our chief executive officer must promptly notify NYSE in writing after any of our executive officers becomes aware of any noncompliance with any applicable provision of NYSE’s corporate governance standards. In addition, we must submit an executed written affirmation annually and an interim written affirmation each time a change occurs to the board or the audit committee.
Item 16 H.Mine Safety Disclosure
Not applicable.
Item 16 I.Disclosure Regarding Foreign Jurisdictions that Prevent Inspections.
Not applicable.
Item 16 J.Insider Trading Policies
Not applicable.
Item 16 K.Cybersecurity.
Cybersecurity Risk Management
Cybersecurity risk management is an integral part of our Security Information Plan. Our cybersecurity risk management program has been developed to align with our Information Security Policy and with norms based on ISO 27001, the Sarbanes-Oxley framework and the data protection laws for each country in which we operate (e.g., in Brazil, Law No. 13,709/2018; in Argentina, Law No. 25,326; and in Uruguay, Law No. 18,331). Using industry best practices and third-party services, our cybersecurity risk management program provides a framework for handling cybersecurity threats and incidents, including threats and incidents associated with the use of applications developed internally and externally. Under the framework, we conduct vulnerability assessments and tests of our critical infrastructure, as well as coordinate cybersecurity measures across different departments of the Company, such as the segregation of user profiles with certain privileges and the
application of multi-factor authentication to validate identity. The framework also includes procedures for assessing the severity of a cybersecurity threat, identifying the source of such threat, including whether the cybersecurity threat is associated with a third-party service provider, implementing cybersecurity countermeasures and mitigation strategies and informing our Information Security Committee and our board of directors of material cybersecurity threats and incidents.
Our Information Security team also engages third-party security experts for risk assessment and system enhancements. In addition, our Information Security team provides training to all employees annually using one of the largest integrated platforms for security awareness training, which offers simulated phishing attacks.
Our board of directors has overall responsibility for our cybersecurity risk program and delegates cybersecurity risk management to the Information Security Committee. The Information Security Committee, through our Information Security Leader, is responsible for ensuring that management has processes in place designed to identify and evaluate cybersecurity risks to which the Company is exposed. It implements processes and programs to manage cybersecurity risks and mitigate cybersecurity incidents. The Information Security Committee also reports material cybersecurity risks to our full board of directors. The Information Security Leader is responsible for identifying, considering and assessing material cybersecurity risks on an ongoing basis, establishing processes to ensure that such potential cybersecurity risk exposures are monitored, putting in place appropriate mitigation measures and maintaining cybersecurity programs. Our cybersecurity programs are under the direction of our Information Security Leader, who receives reports from our Information Security team and monitors the prevention, detection, mitigation, and remediation of cybersecurity incidents.
Our Information Security Leader (who is the Chief Information Security Officer) and dedicated personnel are certified and experienced information systems security professionals. The Information Security Leader has more than ten years of experience in the agricultural industry, and has more than four years of experience in information security and cybersecurity. He has a diploma in Information Security Management from the National Technological University (“Universidad Tecnológica Nacional”) and a diploma in Cybersecurity in Operation Technology by the Northern University of Santo Tomás de Aquino (“Universidad del Norte de Santo Tomás de Aquino”).
In 2023, we did not identify any cybersecurity threats that have materially affected or are reasonably likely to materially affect our business strategy, results of operations or financial condition. However, there can be no assurance that we can eliminate all risks from cybersecurity threats or provide assurances that we have not experienced an undetected cybersecurity incident. For more information about these risks, see “Item 3. Key Information—D. Risk Factors—Risks Related to Our Business and Industries—Security breaches and other disruptions could compromise our technology infrastructure and information and expose us to processes disruption and liability, which would cause our business and reputation to suffer.”
PART III
Item 17. Financial Statements
We have responded to Item 18 in lieu of responding to this item.
Item 18. Financial Statements.
See pages F-1 through F-87F[88] of this annual report.
Item 19. Exhibits
| | | | | | | | |
| Exhibit Number | | Description |
| 1.1 | | |
| | | |
2.12.1* | | |
| | |
| 4.14 | | |
| | | |
| 4.16 | | |
| | | |
| 4.17 | | |
| | | |
| 4.18 | | |
| | |
| 4.26 | | |
| | | |
| | |
| | |
| 4.28 | | |
| | | |
| 4.29 | | |
| | | |
| 4.30 | | |
| | | |
| 4.35 | | |
| | | |
| 4.39 | | |
| | | |
| | |
| 4.43 | | Indenture dated as of September 21, 2017 by and among Adecoagro S.A., as issuer, Adeco Agropecuaria S.A., Pilaga S.A., Adecoagro Brasil Participações S.A., Adecoagro Vale Do Ivinhema S.A., Usina Monte Alegre Ltda., as Subsidiary guarantors, and The Bank of New York Mellon, as Trustee, Registrar, and Paying Agent. Previously filed as Exhibit 4.43 to the Company’s annual report on Form 20-F for the year ended December 31, 2017 and incorporated herein by reference. |
| | | | | | | | |
| | |
| | |
8.18.1* | | |
| | | |
12.112.1* | | |
| | | |
12.212.2* | | |
| | | |
13.113.1* | | |
| | |
13.213.2* | | |
| | | |
15.115.1* | | |
| | | |
15.215.2* | | |
| | |
| 97.1* | | |
| | |
101.INS101.INS** | | iXBRLInline XBRL Instance Document. |
| | |
101.SCH101.SCH** | | iXBRLInline XBRL Taxonomy Extension Schema Document. |
| | |
101.CAL101.CAL** | | iXBRLInline XBRL Taxonomy Extension Calculation Linkbase Document. |
| | |
101.DEF101.DEF** | | iXBRLInline Taxonomy Extension Definition Linkbase Document. |
| | |
101.LAB101.LAB** | | iXBRLInline XBRL Taxonomy Extension Label Linkbase Document. |
| | |
101.PRE101.PRE** | | iXBRLInline XBRL Taxonomy Extension Presentation Linkbase Document. |
| | |
| 104** | | Cover Page Interactive Data File formatted as Inline XBRL with applicable taxonomy
extension.31information contained in Exhibits 101) |
* Filed with this report
** In accordance with Rule 402 of Regulation S-T, the information in these exhibits shall not be deemed to be “filed” for purposes of Section 18 of the Exchange Act, or otherwise subject to the liability of that section, and shall not be incorporated by reference into any registration statement or other document filed under the Securities Act or the Exchange Act, except as shall be expressly set forth by specific reference in such filing
SIGNATURES
The registrant hereby certifies that it meets all of the requirements for filing on Form 20-F and that it has duly caused and authorized the undersigned to sign this annual report on its behalf.
| | |
| Adecoagro S.A. |
| |
| /s/ Mariano Bosch |
| Name: Mariano Bosch |
| Title: Chief Executive Officer |
Date: April 28, 202126, 2024
| | | | | |
| Table of contents Financial Statements |
| |
| |
| |
| |
| |
| |
| |
| |
| |
| |
| |
| |
| |
| |
| |
| |
| |
| |
| |
| |
| |
| |
| |
| |
| |
| |
| |
| |
| |
| |
| |
| |
| |
| |
| |
| |
| |
| |
| |
| |
| |
| |
Adecoagro S.A.
Consolidated Financial Statements as of December 31, 20202023 and 20192022 and for the years ended December 31, 2020, 20192023, 2022 and 20182021
Report of Independent Registered Public Accounting Firm
To the Board of Directors and Shareholders of Adecoagro S.A.
Opinions on the Financial Statements and Internal Control over Financial Reporting
We have audited the accompanying consolidated statementstatements of financial position of Adecoagro S.A. and its subsidiaries (the “Company”) as of December 31, 20202023 and 2019,2022, and the related consolidated statements of income, comprehensive income, changes in shareholders’ equity and cash flows for each of the three years in the period ended December 31, 2020,2023, including the related notes (collectively referred to as the “consolidated financial statements”). We also have audited the Company’s internal control over financial reporting as of December 31, 2020,2023, based on criteria established in Internal Control - Integrated Framework (2013) issued by the Committee of Sponsoring Organizations of the Treadway Commission (COSO).
In our opinion, the consolidated financial statements referred to above present fairly, in all material respects, the financial position of the Company as of December 31, 20202023 and 2019,2022, and the results of its operations and its cash flows for each of the three years in the period ended December 31, 20202023 in conformity with International Financial ReportingIFRS Accounting Standards as issued by the International Accounting Standards Board. Also in our opinion, the Company maintained, in all material respects, effective internal control over financial reporting as of December 31, 202’,2023, based on criteria established in Internal Control - Integrated Framework (2013) issued by the COSO.
Change in Accounting Principle
As discussed in Note 34.1 to the consolidated financial statements, the Company changed the manner in which it accounts for leases in 2019.
Basis for Opinions
The Company's management is responsible for these consolidated financial statements, for maintaining effective internal control over financial reporting, and for its assessment of the effectiveness of internal control over financial reporting, included in Management's Annual Report on Internal Control over Financial Reporting appearing under Item 15. Our responsibility is to express opinions on the Company’s consolidated financial statements and on the Company's internal control over financial reporting based on our audits. We are a public accounting firm registered with the Public Company Accounting Oversight Board (United States) ("PCAOB")(PCAOB) and are required to be independent with respect to the Company in accordance with the U.S. federal securities laws and the applicable rules and regulations of the Securities and Exchange Commission and the PCAOB.
We conducted our audits in accordance with the standards of the PCAOB. Those standards require that we plan and perform the audits to obtain reasonable assurance about whether the consolidated financial statements are free of material misstatement, whether due to error or fraud, and whether effective internal control over financial reporting was maintained in all material respects.
Our audits of the consolidated financial statements included performing procedures to assess the risks of material misstatement of the consolidated financial statements, whether due to error or fraud, and performing procedures that respond to those risks. Such procedures included examining, on a test basis, evidence regarding the amounts and disclosures in the consolidated financial statements. Our audits also included evaluating the accounting principles used and significant estimates made by management, as well as evaluating the overall presentation of the consolidated financial statements. Our audit of internal control over financial reporting included obtaining an understanding of internal control over financial reporting, assessing the risk that a material weakness exists, and testing and evaluating the design and operating effectiveness of internal control based on the assessed risk. Our audits also included performing such other procedures as we considered necessary in the circumstances. We believe that our audits provide a reasonable basis for our opinions.
Definition and Limitations of Internal Control over Financial Reporting
A company’s internal control over financial reporting is a process designed to provide reasonable assurance regarding the reliability of financial reporting and the preparation of financial statements for external purposes in accordance with generally accepted accounting principles. A company’s internal control over financial reporting includes those policies and procedures that (i) pertain to the maintenance of records that, in reasonable detail,
accurately and fairly reflect the transactions and dispositions of the assets of the company; (ii) provide reasonable assurance that transactions are recorded as necessary to permit preparation of financial statements in accordance with generally accepted accounting principles, and that receipts and expenditures of the company are being made only in accordance with authorizations of management and directors of the company; and (iii) provide reasonable
assurance regarding prevention or timely detection of unauthorized acquisition, use, or disposition of the company’s assets that could have a material effect on the financial statements.
Because of its inherent limitations, internal control over financial reporting may not prevent or detect misstatements. Also, projections of any evaluation of effectiveness to future periods are subject to the risk that controls may become inadequate because of changes in conditions, or that the degree of compliance with the policies or procedures may deteriorate.
Critical Audit Matters
The critical audit mattersmatter communicated below are mattersis a matter arising from the current period audit of the consolidated financial statements that werewas communicated or required to be communicated to the audit committee and that (i) relaterelates to accounts or disclosures that are material to the consolidated financial statements and (ii) involved our especially challenging, subjective, or complex judgments. The communication of critical audit matters does not alter in any way our opinion on the consolidated financial statements, taken as a whole, and we are not, by communicating the critical audit mattersmatter below, providing a separate opinionsopinion on the critical audit mattersmatter or on the accounts or disclosures to which they relate.it relates.
Valuation of Level 3 Biological Assets
As described in Notes 16, 3332 (b) and 34.1133.11 to the consolidated financial statements, the total aggregated fair value of the Company’s level 3 biological assets related to sown land – crops, sown land – rice and sown land – sugarcane was US$ 148198 million atas of December 31, 2020. Fair2023. The fair value of these level 3 biological assets is determined by management using a discounted cash flowsflow model which requires the input of highly subjective assumptions including significant unobservable inputs. The discounted cash flow model included significant judgements and assumptions relating to management’s cash flow projections including future market prices, estimated yields at the point of harvest, estimated production cycle, future costs of harvesting and others costother costs and estimated discount rate.
The principal considerations for our determination that performing procedures relating to the valuation of the Company’s level 3 biological assets related to sown land – crops, sown land – rice and sown land – sugarcane is a critical audit matter are (i) the significant judgment by management when developing the fair value measurement; (ii) a high degree of auditor judgement, subjectivity, and effort in performing procedures and evaluating management’s cash flow projections and significant assumptions related to future market prices, estimated yields at the point of harvest, estimated production cycle, future costs of harvesting and others costother costs and estimated discount rate; and (iii) the audit effort involved the use of professionals with specialized skill and knowledge.
Addressing the matter involved performing procedures and evaluating audit evidence in connection with forming our overall opinion on the consolidated financial statements. These procedures included testing the effectiveness of controls relating to the valuation of the Company’s level 3 biological assets related to sown land – crops, sown land – rice and sown land – sugarcane. These procedures also included, among others evaluating the significant assumptions and methods used by management in developing the fair value measurement including future market prices, estimated yields at the point of harvest, estimated production cycle, future costs of harvesting and others costother costs and estimated discount rate. Evaluating management’s assumptions involved evaluating whether these assumptions were reasonable considering the consistency with external information and past records and testing management’s sensitivity analysis of certain significant assumptions. Professionals with specialized skill and knowledge were used to assist in the evaluation of certain significant assumptions, including estimated yields at the point of harvest and estimated production cycle.
Property, Plant and Equipment and Goodwill Impairment Assessment- Cash Generating Units with Allocated Goodwill in Brazil
As described in Notes 12, 15, 33 (a) and 34.10 to the consolidated financial statements, the Company’s consolidated property, plant and equipment and goodwill balances at December 31, 2020 were US$ 1,358 million and US$ 14.5 million, respectively, of which US$ 519 million was allocated to the cash generating units with
allocated goodwill in Brazil. The Company conducts an impairment test as of September 30 of each year, or more frequently if events or changes in circumstances indicate that the carrying value of the asset or cash generating unit may not be recoverable. An impairment loss is recognized for the amount by which the carrying amount of the asset or cash generating unit exceeds its recoverable amount. The recoverable amounts are estimated for individual assets or, where an individual asset does not generate cash flows independently, the recoverable amount is estimated for the cash generating unit to which the asset belongs. The recoverable amount of the asset or the cash generating unit is the higher of the fair value less costs to sell and value in use. The recoverable amount of cash generating units with allocated goodwill in Brazil was determined based on value in use calculations. The determination of the value in use calculation required the use of significant estimates and assumptions related to management’s cash flow projections, including yield average growth rates, future pricing increases, future cost decrease, discount rates and perpetuity growth rate.
The principal considerations for our determination that performing procedures relating to the impairment assessment of property, plant and equipment and goodwill associated with the cash generating units with allocated goodwill in Brazil is a critical audit matter are (i) the significant judgment by management when developing the value in use calculation of these cash generating units; (ii) a high degree of auditor judgment, subjectivity, and effort in performing procedures and evaluating management’s cash flow projections and significant assumptions related to yield average growth rates, future pricing increases, future cost decrease, discount rates and perpetuity growth rate; and (iii) the audit effort involved the use of professionals with specialized skill and knowledge.
Addressing the matter involved performing procedures and evaluating audit evidence in connection with forming our overall opinion on the consolidated financial statements. These procedures included testing the effectiveness of controls relating to management’s impairment assessment of property, plant and equipment and goodwill associated with the cash generating units with allocated goodwill in Brazil, including controls over the valuation of the Company’s cash generating units. These procedures also included, among others (i) testing management’s process for developing the estimate; (ii) evaluating the appropriateness of the discounted cash flow model; (iii) testing the completeness and accuracy of underlying data used in the model; and (iv) evaluating the reasonableness of the significant assumptions used by management related to yield average growth rates, future pricing increases, future cost decrease, discount rates and perpetuity growth rate. Evaluating management’s assumptions related to yield average growth rates, future pricing increases, future cost decrease, discount rates and perpetuity growth rate involved evaluating whether the assumptions used by management were reasonable considering (i) the current and past performance of the cash generating units; (ii) the consistency with external market and industry data; and (iii) whether these assumptions were consistent with evidence obtained in other areas of the audit. Professionals with specialized skill and knowledge were used to assist in the evaluation of the Company’s discounted cash flow model and the discount rate assumptions.
Buenos Aires, Argentina.
April 28, 2021.
/s/ PRICE WATERHOUSE & CO. S.R.L.
/s/ Jorge Frederico ZabaletaEduardo Alfredo Loiácono (Partner)
Jorge Frederico ZabaletaEduardo Alfredo Loiácono
Buenos Aires, Argentina.
April 26, 2024.
We have served as the Company’s auditor since 2008.
Legal information
Denomination:Name as specified in charter: Adecoagro S.A.
Legal address: Vertigo Naos Building, 6, Rue Eugène Ruppert, L-2453, Luxembourg
Company activity: Agricultural and agro-industrial
Date of registration: June 11, 2010
Expiration of company charter: No term defined
Number of register (RCS Luxembourg): B153.681
Issued Capital Stock: 122,381,815111,381,815 common shares
Outstanding Capital stock: 117,296,951106,005,500 common shares
Treasury shares: 5,084,8645,376,315 common shares
Adecoagro S.A.
Consolidated Statements of Income
for the years ended December 31, 2020, 20192023, 2022 and 20182021
(All amounts in US$ thousands, except shares and per share data and as otherwise indicated)
| | | | Note | 2020 | | 2019 (*) | | 2018 (*) | | Note | 2023 | | 2022 | | 2021 |
| Sales of goods and services rendered | Sales of goods and services rendered | 4 | 817,764 | | | 887,138 | | | 793,239 | |
| Cost of goods sold and services rendered | Cost of goods sold and services rendered | 5 | (611,946) | | | (671,173) | | | (609,965) | |
| Initial recognition and changes in fair value of biological assets and agricultural produce | Initial recognition and changes in fair value of biological assets and agricultural produce | 16 | 122,729 | | | 68,589 | | | 16,195 | |
| Changes in net realizable value of agricultural produce after harvest | Changes in net realizable value of agricultural produce after harvest | | 7,005 | | | 1,825 | | | (909) | |
| Margin on manufacturing and agricultural activities before operating expenses | Margin on manufacturing and agricultural activities before operating expenses | | 335,552 | | | 286,379 | | | 198,560 | |
| General and administrative expenses | General and administrative expenses | 6 | (53,428) | | | (57,202) | | | (56,080) | |
| Selling expenses | Selling expenses | 6 | (95,058) | | | (106,972) | | | (90,215) | |
| Other operating income, net | 8 | 1,987 | | | (822) | | | 104,232 | |
| Other operating income / (expense), net | |
| Bargain purchase gain on acquisition | |
| Profit from operations | Profit from operations | | 189,053 | | | 121,383 | | | 156,497 | |
| Finance income | Finance income | 9 | 26,054 | | | 8,979 | | | 8,394 | |
| Finance costs | Finance costs | 9 | (213,776) | | | (126,111) | | | (163,937) | |
| Other financial results - Net gain of inflation effects on the monetary items | 9 | 12,064 | | | 16,911 | | | (25,211) | |
| Other financial results - Net gain / (loss) of inflation effects on monetary items | |
| Financial results, net | Financial results, net | 9 | (175,658) | | | (100,221) | | | (180,754) | |
| Profit / (Loss) before income tax | | 13,395 | | | 21,162 | | | (24,257) | |
| Income tax (expense) / benefit | 10 | (12,325) | | | (20,820) | | | 1,024 | |
| Profit / (Loss) for the year | | 1,070 | | | 342 | | | (23,233) | |
| Profit before income tax | |
| Income tax expense | |
| Profit for the year | |
| | Attributable to: | |
| Attributable to: | |
| Attributable to: | Attributable to: | | | | | | | | | | |
| Equity holders of the parent | Equity holders of the parent | | 412 | | | (772) | | | (24,622) | |
| Non-controlling interest | Non-controlling interest | | 658 | | | 1,114 | | | 1,389 | |
| | Earnings / (Loss) per share from operations attributable to the equity holders of the parent during the year: | | | |
| Earnings per share attributable to the equity holders of the parent during the year: | |
| Earnings per share attributable to the equity holders of the parent during the year: | |
| Earnings per share attributable to the equity holders of the parent during the year: | |
| Basic earnings per share | |
| Basic earnings per share | |
| Basic earnings per share | Basic earnings per share | 11 | 0.003 | | | (0.007) | | | (0.211) | |
| Diluted earnings per share | Diluted earnings per share | 11 | 0.003 | | | (0.007) | | | (0.211) | |
(*) Prior periods have been recast to reflect the Company's change in accounting policy for the reclassification within financial results as explained in Note 34.1.
The accompanying notes are an integral part of these consolidated financial statements.
F- 36
Adecoagro S.A.
Consolidated Statements of Comprehensive Income
for the years ended December 31, 2020, 20192023, 2022 and 20182021
(All amounts in US$ thousands, except shares and per share data and as otherwise indicated)
| | | | 2020 | | 2019 | | 2018 | | 2023 | | 2022 | | 2021 |
| Profit / (Loss) for the year | 1,070 | | | 342 | | | (23,233) | |
| Profit for the year | |
| Other comprehensive income: | Other comprehensive income: | |
| - Items that may be reclassified subsequently to profit or loss: | - Items that may be reclassified subsequently to profit or loss: | |
| Exchange differences on translating foreign operations | (78,961) | | | (27,828) | | | (121,296) | |
| - Items that may be reclassified subsequently to profit or loss: | |
| - Items that may be reclassified subsequently to profit or loss: | |
| Exchange differences on translation of foreign operations | |
| Exchange differences on translation of foreign operations | |
| Exchange differences on translation of foreign operations | |
| Cash flow hedge, net of income tax | Cash flow hedge, net of income tax | (14,386) | | | (19,420) | | | (32,195) | |
| - Items that will not be reclassified to profit or loss: | - Items that will not be reclassified to profit or loss: | |
| Revaluation surplus net of income tax (Note 12, 14) | 29,453 | | | (31,929) | | | 405,906 | |
| Revaluation surplus net of income tax (Note 12) | |
| Revaluation surplus net of income tax (Note 12) | |
| Revaluation surplus net of income tax (Note 12) | |
| Other comprehensive (loss) / income for the year | Other comprehensive (loss) / income for the year | (63,894) | | | (79,177) | | | 252,415 | |
| Total comprehensive (loss) / income for the year | (62,824) | | | (78,835) | | | 229,182 | |
| Total comprehensive income / (loss) for the year | |
| | Attributable to: | Attributable to: | | |
| Attributable to: | |
| Attributable to: | |
| Equity holders of the parent | |
| Equity holders of the parent | |
| Equity holders of the parent | Equity holders of the parent | (63,353) | | | (75,437) | | | 213,641 | |
| Non-controlling interest | Non-controlling interest | 529 | | | (3,398) | | | 15,541 | |
The accompanying notes are an integral part of these consolidated financial statements.
F- 47
Adecoagro S.A.
Consolidated Statements of Financial Position
as of December 31, 20202023 and 20192022
(All amounts in US$ thousands, except shares and per share data and as otherwise indicated)
| | | | Note | 2020 | | 2019 (*) | | Note | 2023 | | 2022 |
| ASSETS | ASSETS | | | | | ASSETS | | | | |
| Non-Current Assets | Non-Current Assets | | | | | Non-Current Assets | | | | |
| Property, plant and equipment | 12 | 1,358,292 | | | 1,493,220 | |
| Property, plant and equipment, net | |
| Right of use assets | Right of use assets | 13 | 209,694 | | | 238,053 | |
| Investment property | Investment property | 14 | 31,179 | | | 34,295 | |
| Intangible assets | 15 | 26,930 | | | 33,679 | |
| Intangible assets, net | |
| Biological assets | Biological assets | 16 | 14,725 | | | 13,303 | |
| Deferred income tax assets | Deferred income tax assets | 10 | 19,821 | | | 13,664 | |
| Trade and other receivables, net | Trade and other receivables, net | 19 | 52,266 | | | 44,993 | |
| Derivative financial instruments | Derivative financial instruments | 18 | 1,951 | | | 0 | |
| Other assets | Other assets | | 809 | | | 1,034 | |
| Total Non-Current Assets | Total Non-Current Assets | | 1,715,667 | | | 1,872,241 | |
| Current Assets | Current Assets | | | | | Current Assets | | | | |
| Biological assets | Biological assets | 16 | 150,968 | | | 117,133 | |
| Inventories | Inventories | 20 | 133,461 | | | 112,790 | |
| Trade and other receivables, net | Trade and other receivables, net | 19 | 145,662 | | | 127,338 | |
| Derivative financial instruments | Derivative financial instruments | 18 | 151 | | | 1,435 | |
| Other assets | | 45 | | | 94 | |
| | Short-term investment | |
| Short-term investment | |
| Short-term investment | |
| Cash and cash equivalents | Cash and cash equivalents | 21 | 336,282 | | | 290,276 | |
| Total Current Assets | Total Current Assets | | 766,569 | | | 649,066 | |
| TOTAL ASSETS | TOTAL ASSETS | | 2,482,236 | | | 2,521,307 | |
| SHAREHOLDERS EQUITY | SHAREHOLDERS EQUITY | | | | | SHAREHOLDERS EQUITY | | | | |
| Capital and reserves attributable to equity holders of the parent | Capital and reserves attributable to equity holders of the parent | | | | | Capital and reserves attributable to equity holders of the parent | | | | |
| Share capital | Share capital | 23 | 183,573 | | | 183,573 | |
| Share premium | Share premium | 23 | 902,815 | | | 901,739 | |
| Cumulative translation adjustment | Cumulative translation adjustment | | (555,044) | | | (492,374) | |
| Equity-settled compensation | Equity-settled compensation | | 14,795 | | | 15,354 | |
| Cash flow hedge | Cash flow hedge | 2 | (90,689) | | | (76,303) | |
| Other reserves | Other reserves | | 83,406 | | | 66,047 | |
| Treasury shares | Treasury shares | | (7,630) | | | (7,946) | |
| Revaluation surplus | Revaluation surplus | | 343,570 | | | 337,877 | |
| Reserve from the sale of non-controlling interests in subsidiaries | Reserve from the sale of non-controlling interests in subsidiaries | | 41,574 | | | 41,574 | |
| Retained earnings | Retained earnings | | 8,671 | | | 18,728 | |
| Equity attributable to equity holders of the parent | Equity attributable to equity holders of the parent | | 925,041 | | | 988,269 | |
| Non-controlling interest | Non-controlling interest | | 38,683 | | | 40,614 | |
| TOTAL SHAREHOLDERS EQUITY | TOTAL SHAREHOLDERS EQUITY | | 963,724 | | | 1,028,883 | |
| LIABILITIES | LIABILITIES | | | | | LIABILITIES | | | | |
| Non-Current Liabilities | Non-Current Liabilities | | | | | Non-Current Liabilities | | | | |
| Trade and other payables | Trade and other payables | 26 | 290 | | | 3,599 | |
| Borrowings | Borrowings | 27 | 813,464 | | | 780,202 | |
| Lease liabilities | Lease liabilities | 28 | 159,435 | | | 174,570 | |
| Deferred income tax liabilities | Deferred income tax liabilities | 10 | 182,377 | | | 165,508 | |
| Payroll and social liabilities | 29 | 1,075 | | | 1,209 | |
| | Payroll and social security liabilities | |
| Derivatives financial instruments | |
| Provisions for other liabilities | Provisions for other liabilities | 30 | 2,705 | | | 2,936 | |
| Total Non-Current Liabilities | Total Non-Current Liabilities | | 1,159,346 | | | 1,128,024 | |
| Current Liabilities | Current Liabilities | | | | | Current Liabilities | | | | |
| Trade and other payables | Trade and other payables | 26 | 126,315 | | | 106,887 | |
| Current income tax liabilities | Current income tax liabilities | | 760 | | | 754 | |
| Payroll and social liabilities | 29 | 23,333 | | | 25,208 | |
| Payroll and social security liabilities | |
| Borrowings | Borrowings | 27 | 157,626 | | | 188,078 | |
| Lease liabilities | Lease liabilities | 28 | 36,337 | | | 41,814 | |
| Derivative financial instruments | Derivative financial instruments | 18 | 13,141 | | | 1,423 | |
| Provisions for other liabilities | Provisions for other liabilities | 30 | 1,654 | | | 236 | |
| Total Current Liabilities | Total Current Liabilities | | 359,166 | | | 364,400 | |
| TOTAL LIABILITIES | TOTAL LIABILITIES | | 1,518,512 | | | 1,492,424 | |
| TOTAL SHAREHOLDERS EQUITY AND LIABILITIES | TOTAL SHAREHOLDERS EQUITY AND LIABILITIES | | 2,482,236 | | | 2,521,307 | |
(*) Prior periods have been recast to reflect the Company's change in accounting policy for the reclassification within shareholders equity of the initial application of IAS 29 as explained in Note 34.1.
The accompanying notes are an integral part of these consolidated financial statements.
F- 58
Adecoagro S.A.
Consolidated Statements of Changes in Shareholders’ Equity
for the years ended December 31, 2020, 20192023, 2022 and 20182021
(All amounts in US$ thousands, except shares and per share data and as otherwise indicated)
| | | | Attributable to equity holders of the parent | | | Attributable to equity holders of the parent | |
| | | Share capital
(Note 23) | Share
premium
(Note 23) | Cumulative
translation
adjustment | Equity-settled
compensation | Cash flow hedge | Other Reserves | Treasury
shares | Revaluation surplus | Reserve from the sale of non-controlling
interests in subsidiaries | Retained
earnings | Subtotal | Non-
controlling
interest | Total
shareholders’
equity | | Share capital
(Note 22) | Share
premium
(Note 22) | Cumulative
translation
adjustment | Equity-settled
compensation | Cash flow hedge | Other Reserves | Treasury
shares | Revaluation surplus | Reserve from the sale of non-controlling
interests in subsidiaries | Retained
earnings | Subtotal | Non-
controlling
interest | Total
shareholders’
equity |
| Balance at January 1, 2018 | 183,573 | | 908,934 | | (552,604) | | 17,852 | | (24,691) | | 0 | | (6,967) | | 0 | | 41,574 | | 294,150 | | 861,821 | | 29,376 | | 891,197 | |
| Reclassification of "adjustment of opening balance for the application of IAS 29 (Note 29) (***) | — | | — | | 187,941 | | — | | — | | — | | — | | — | | — | | (187,941) | | 0 | | 0 | | 0 | |
| Total equity at the beginning of financial year | 183,573 | | 908,934 | | (364,663) | | 17,852 | | (24,691) | | 0 | | (6,967) | | 0 | | 41,574 | | 106,209 | | 861,821 | | 29,376 | | 891,197 | |
| Loss for the year | — | | — | | — | | — | | — | | | — | | | — | | (24,622) | | (24,622) | | 1,389 | | (23,233) | |
| Balance at January 1, 2021 | |
| | Profit for the year | |
| | Profit for the year | |
| | Profit for the year | |
| Other comprehensive income: | Other comprehensive income: | | | | | | |
–Items that may be reclassified subsequently to profit or loss: | –Items that may be reclassified subsequently to profit or loss: | | | | | | | |
–Items that may be reclassified subsequently to profit or loss: | |
–Items that may be reclassified subsequently to profit or loss: | |
| Exchange differences on translating foreign operations | |
| Exchange differences on translating foreign operations | |
| Exchange differences on translating foreign operations | Exchange differences on translating foreign operations | — | | — | | (113,433) | | — | | — | | — | | — | | — | | — | | — | | (113,433) | | (7,863) | | (121,296) | |
| Cash flow hedge (*) | Cash flow hedge (*) | — | | — | | — | | — | | (32,193) | | — | | — | | — | | — | | — | | (32,193) | | (2) | | (32,195) | |
–Items that will not be reclassified subsequently to profit or loss: | –Items that will not be reclassified subsequently to profit or loss: | |
| Revaluation surplus (**) | Revaluation surplus (**) | — | | — | | — | | — | | — | | — | | — | | 383,889 | | — | | — | | 383,889 | | 22,017 | | 405,906 | |
| Revaluation surplus (**) | |
| Revaluation surplus (**) | |
| | Other comprehensive income for the year | |
| Other comprehensive income for the year | |
| Other comprehensive income for the year | Other comprehensive income for the year | — | | — | | (113,433) | | — | | (32,193) | | — | | — | | 383,889 | | — | | — | | 238,263 | | 14,152 | | 252,415 | |
| Total comprehensive income for the year | Total comprehensive income for the year | — | | — | | (113,433) | | — | | (32,193) | | — | | — | | 383,889 | | — | | (24,622) | | 213,641 | | 15,541 | | 229,182 | |
| | Reserves for the benefit of government grants (1) | Reserves for the benefit of government grants (1) | — | | — | | — | | — | | — | | 32,380 | | — | | — | | — | | (32,380) | | 0 | | 0 | | 0 | |
| Employee share options (Note 24) | | | | | | |
| Reserves for the benefit of government grants (1) | |
| Reserves for the benefit of government grants (1) | |
| | - Forfeited | — | | — | | — | | (40) | | — | | — | | — | | — | | — | | 40 | | 0 | | 0 | | 0 | |
| Restricted shares (Note 24): | | | | | | |
| | Restricted shares (Note 23): | |
| | Restricted shares (Note 23): | |
| | Restricted shares (Note 23): | |
| - Value of employee services | |
| - Value of employee services | |
| - Value of employee services | - Value of employee services | — | | — | | — | | 3,899 | | — | | — | | — | | — | | — | | — | | 3,899 | | 0 | | 3,899 | |
| - Vested | - Vested | — | | 4,775 | | — | | (5,520) | | — | | — | | 745 | | — | | — | | — | | 0 | | 0 | | 0 | |
| Purchase of own shares (Note 23) | — | | (13,206) | | — | | — | | — | | — | | (2,519) | | — | | — | | — | | (15,725) | | 0 | | (15,725) | |
| Dividends | — | | — | | — | | — | | — | | — | | — | | — | | — | | — | | 0 | | (408) | | (408) | |
| Balance at December 31, 2018 | 183,573 | | 900,503 | | (478,096) | | 16,191 | | (56,884) | | 32,380 | | (8,741) | | 383,889 | | 41,574 | | 49,247 | | 1,063,636 | | 44,509 | | 1,108,145 | |
| - Forfeited | |
| - Granted | |
| Purchase of own shares (Note 22) | |
| Dividends to non-controlling interest | |
| Balance at December 31, 2021 | |
(*) Net of 11,322($2,526) of income tax.
(**) Net of 139,223 of Income tax.
(***) Prior periods have been recast to reflect the Company's change in accounting policy for the classification of the adjustment of opening balance for the application of IAS 29 as explained in Note 34.
(1) Correspond to the presumed credit of ICMS (Imposto sobre Circulação de Mercadorias e Prestação de Serviços) over the sale values in our Sugar, ethanol and energy business. (please see Note 25).
The accompanying notes are an integral part of these consolidated financial statements.
F- 6
Adecoagro S.A.
Consolidated Statements of Changes in Shareholders’ Equity
for the years ended December 31, 2020, 2019 and 2018
(All amounts in US$ thousands, except shares and per share data and as otherwise indicated)
| | | | | | | | | | | | | | | | | | | | | | | | | | | | | | | | | | | | | | | | | |
| | Attributable to equity holders of the parent | | |
| | Share capital
(Note 23) | Share
premium
(Note 23) | Cumulative
translation
adjustment | Equity-settled
compensation | Cash flow
hedge | Other Reserves | Treasury
shares | Revaluation surplus | Reserve from the sale of non-controlling interests in subsidiaries | Retained
earnings | Subtotal | Non-
controlling
interest | Total
shareholders’
equity |
| Balance at January 1, 2019 (****) | 183,573 | | 900,503 | | (478,096) | | 16,191 | | (56,884) | | 32,380 | | (8,741) | | 383,889 | | 41,574 | | 49,247 | | 1,063,636 | | 44,509 | | 1,108,145 | |
| Profit for the year | — | | — | | — | | — | | — | | — | | — | | — | | — | | (772) | | (772) | | 1,114 | | 342 | |
| Other comprehensive income: | | | | | | | | | | | | | |
–Items that may be reclassified subsequently to profit or loss: | | | | | | | | | | | | | |
| Exchange differences on translating foreign operations | — | | — | | (14,278) | | — | | — | | — | | — | | (12,183) | | — | | — | | (26,461) | | (1,367) | | (27,828) | |
| Cash flow hedge (*) | — | | — | | — | | — | | (19,419) | | — | | — | | — | | — | | — | | (19,419) | | (1) | | (19,420) | |
–Items that will not be reclassified subsequently to profit or loss: | | | | | | | | | | | — | | | — | |
| Revaluation surplus (**) | — | | — | | — | | — | | — | | — | | — | | (28,785) | | — | | — | | (28,785) | | (3,144) | | (31,929) | |
| Reserve of the revaluation surplus derived from the disposals of assets (***) | — | | — | | — | | — | | — | | — | | — | | (5,044) | | — | | 5,044 | | 0 | | 0 | | 0 | |
| Other comprehensive (loss) / income for the year | — | | — | | (14,278) | | — | | (19,419) | | — | | — | | (46,012) | | — | | 5,044 | | (74,665) | | (4,512) | | (79,177) | |
| Total comprehensive income for the year | — | | — | | (14,278) | | — | | (19,419) | | — | | — | | (46,012) | | — | | 4,272 | | (75,437) | | (3,398) | | (78,835) | |
| | | | | | | | | | | | | |
| Reserves for the benefit of government grants (1) | — | | — | | — | | — | | — | | 34,791 | | — | | — | | — | | (34,791) | | 0 | | 0 | | 0 | |
| | | | | | | | | | | | | |
| - Forfeited | — | | — | | — | | 0 | | — | | 5 | | (5) | | — | | — | | 0 | | 0 | | 0 | | 0 | |
| Restricted shares and restricted units (Note 21): | | | | | | | | | | | | | |
| - Value of employee services | — | | — | | — | | 3,612 | | — | | — | | — | | — | | — | | — | | 3,612 | | 0 | | 3,612 | |
| - Vested | — | | 4,455 | | — | | (4,449) | | — | | — | | 715 | | — | | — | | — | | 721 | | 0 | | 721 | |
| Purchase of own shares (Note 23) | — | | (3,219) | | — | | — | | — | | — | | (1,044) | | — | | — | | — | | (4,263) | | 0 | | (4,263) | |
| - Granted (***) | — | | — | | — | | — | | — | | (1,129) | | 1,129 | | — | | — | | — | | 0 | | 0 | | 0 | |
| Dividends | — | | — | | — | | — | | — | | — | | — | | — | | — | | — | | 0 | | (497) | | (497) | |
| Balance at December 31, 2019 | 183,573 | | 901,739 | | (492,374) | | 15,354 | | (76,303) | | 66,047 | | (7,946) | | 337,877 | | 41,574 | | 18,728 | | 988,269 | | 40,614 | | 1,028,883 | |
(*) Net of 6,752 of Income tax.
(**) Net of 10,480 of Income tax.
(***) Net of 2,978 of Income tax.
(****) Prior periods have been recast to reflect the Company's change in accounting policy for the classification of the adjustment of opening balance for the application of IAS 29 as explained in Note 34.
(1) Correspond to the presumed credit of ICMS (Imposto sobre Circulação de Mercadorias e Prestação de Serviços) over the sale values in our Sugar, ethanol and energy business. (please see Note 25).
The accompanying notes are an integral part of these consolidated financial statements.
F- 7
Adecoagro S.A.
Consolidated Statements of Changes in Shareholders’ Equity
for the years ended December 31, 2020, 2019 and 2018
(All amounts in US$ thousands, except shares and per share data and as otherwise indicated)
| | | | | | | | | | | | | | | | | | | | | | | | | | | | | | | | | | | | | | | | | |
| | Attributable to equity holders of the parent | | |
| | Share capital
(Note 23) | Share
premium
(Note 23) | Cumulative
translation
adjustment | Equity-settled
compensation | Cash flow
hedge | Other reserves | Treasury
shares | Revaluation surplus | Reserve from the sale of non-controlling interests in subsidiaries | Retained
earnings | Subtotal | Non-
controlling
interest | Total
shareholders’
equity |
| Balance at January 1, 2020 | 183,573 | | 901,739 | | (492,374) | | 15,354 | | (76,303) | | 66,047 | | (7,946) | | 337,877 | | 41,574 | | 18,728 | | 988,269 | | 40,614 | | 1,028,883 | |
| Profit for the year | — | | — | | — | | — | | — | | — | | — | | — | | — | | 412 | | 412 | | 658 | | 1,070 | |
| Other comprehensive income: | | | | | | | | | | | | | |
| - Items that may be reclassified subsequently to profit or loss: | | | | | | | | | | | | | |
| Exchange differences on translating foreign operations | — | | — | | (62,670) | | — | | — | | — | | — | | (15,173) | | — | | — | | (77,843) | | (1,118) | | (78,961) | |
| Cash flow hedge (*) | — | | — | | — | | — | | (14,386) | | — | | — | | — | | — | | — | | (14,386) | | 0 | | (14,386) | |
| - Items will not be reclassified to profit or loss: | | | | | | | | | | | | | |
| Revaluation surplus (**) | — | | — | | — | | — | | — | | — | | — | | 28,464 | | — | | — | | 28,464 | | 989 | | 29,453 | |
| Reserve of the revaluation surplus derived from the disposals of assets (***) | — | | — | | — | | — | | — | | — | | — | | (7,598) | | — | | 7,598 | | 0 | | 0 | | 0 | |
| Other comprehensive income for the year | — | | — | | (62,670) | | — | | (14,386) | | — | | — | | 5,693 | | — | | 7,598 | | (63,765) | | (129) | | (63,894) | |
| Total comprehensive income for the year | — | | — | | (62,670) | | — | | (14,386) | | — | | — | | 5,693 | | — | | 8,010 | | (63,353) | | 529 | | (62,824) | |
| | | | | | | | | | | | | |
| Reserves for the benefit of government grants (1) | — | | — | | — | | — | | — | | 18,067 | | — | | — | | — | | (18,067) | | 0 | | 0 | | 0 | |
| | | | | | | | | | | | | |
| | | | | | | | | | | | | |
| | | | | | | | | | | | | |
| Restricted shares (Note 24): | | | | | | | | | | | | | |
| - Value of employee services | — | | — | | — | | 3,266 | | — | | — | | — | | — | | — | | — | | 3,266 | | 0 | | 3,266 | |
| - Vested | — | | 4,182 | | — | | (3,825) | | — | | 383 | | 484 | | — | | — | | — | | 1,224 | | 0 | | 1,224 | |
| - Forfeited | — | | — | | — | | — | | — | | 36 | | (36) | | — | | — | | — | | — | | 0 | | 0 | |
| - Granted | — | | — | | — | | — | | — | | (1,127) | | 1,127 | | — | | — | | — | | — | | — | | — | |
| Purchase of own shares (Note 23) | — | | (3,106) | | — | | — | | — | | — | | (1,259) | | — | | — | | — | | (4,365) | | 0 | | (4,365) | |
| Dividends | — | | — | | — | | — | | — | | — | | — | | — | | — | | — | | 0 | | (2,460) | | (2,460) | |
| Balance at December 31, 2020 | 183,573 | | 902,815 | | (555,044) | | 14,795 | | (90,689) | | 83,406 | | (7,630) | | 343,570 | | 41,574 | | 8,671 | | 925,041 | | 38,683 | | 963,724 | |
(*) Net of 5,729 of Income tax.
(**) Net of 11,790 of Income tax.
(***) Net of 3,458($9,953) of Income tax.
(1) Correspond to the presumed credit of ICMS (Imposto sobre Circulação de Mercadorias e Prestação de Serviços) over the sale values in our Sugar, ethanol and energy business. (please see Note 25)24).
The accompanying notes are an integral part of these consolidated financial statements.
F- 9
Adecoagro S.A.
Consolidated Statements of Changes in Shareholders’ Equity
for the years ended December 31, 2023, 2022 and 2021
(All amounts in US$ thousands, except shares and per share data and as otherwise indicated)
| | | | | | | | | | | | | | | | | | | | | | | | | | | | | | | | | | | | | | | | | |
| | Attributable to equity holders of the parent | | |
| | Share capital
(Note 22) | Share
premium
(Note 22) | Cumulative
translation
adjustment | Equity-settled
compensation | Cash flow
hedge | Other Reserves | Treasury
shares | Revaluation surplus | Reserve from the sale of non-controlling interests in subsidiaries | Retained
earnings | Subtotal | Non-
controlling
interest | Total
shareholders’
equity |
| Balance at January 1, 2022 | 183,573 | | 851,060 | | (514,609) | | 16,073 | | (60,932) | | 106,172 | | (16,909) | | 289,982 | | 41,574 | | 115,735 | | 1,011,719 | | 36,111 | | 1,047,830 | |
| Profit for the year | — | | — | | — | | — | | — | | — | | — | | — | | — | | 108,138 | | 108,138 | | 468 | | 108,606 | |
| Other comprehensive income: | | | | | | | | | | | | | |
–Items that may be reclassified subsequently to profit or loss: | | | | | | | | | | | | | |
| Exchange differences on translating foreign operations | — | | — | | 58,580 | | — | | — | | — | | — | | 35,367 | | — | | — | | 93,947 | | 4,794 | | 98,741 | |
| Cash flow hedge (*) | — | | — | | — | | — | | 16,060 | | — | | — | | — | | — | | — | | 16,060 | | — | | 16,060 | |
–Items that will not be reclassified subsequently to profit or loss: | | | | | | | | | | | | | |
| Revaluation surplus (**) | — | | — | | — | | — | | — | | — | | — | | (43,440) | | — | | — | | (43,440) | | (3,463) | | (46,903) | |
| | | | | | | | | | | | | |
| Other comprehensive (loss) / income for the year | — | | — | | 58,580 | | — | | 16,060 | | — | | — | | (8,073) | | — | | — | | 66,567 | | 1,331 | | 67,898 | |
| Total comprehensive income for the year | — | | — | | 58,580 | | — | | 16,060 | | — | | — | | (8,073) | | — | | 108,138 | | 174,705 | | 1,799 | | 176,504 | |
| | | | | | | | | | | | | |
| Reduction of issued share capital of the company (Note22) | (16,500) | | — | | — | | — | | — | | — | | 16,500 | | — | | — | | — | | — | | — | | — | |
| Reserves for the benefit of government grants (1) | — | | — | | — | | — | | — | | 21,531 | | — | | — | | — | | (21,531) | | — | | — | | — | |
| Employee share options (Note 23): | | | | | | | | | | | | | |
| - Exercised | — | | 2,432 | | — | | (778) | | — | | — | | 470 | | — | | — | | — | | 2,124 | | — | | 2,124 | |
| Restricted shares and restricted units (Note 23): | | | | | | | | | | | | | |
| - Value of employee services | — | | — | | — | | 7,563 | | — | | — | | — | | — | | — | | — | | 7,563 | | — | | 7,563 | |
| - Vested | — | | 4,647 | | — | | (4,066) | | — | | 1,243 | | — | | — | | — | | — | | 1,824 | | — | | 1,824 | |
| - Forfeited | — | | — | | — | | — | | — | | 85 | | (85) | | — | | — | | — | | — | | — | | — | |
| - Granted | — | | — | | — | | — | | — | | (2,106) | | 2,106 | | — | | — | | — | | — | | — | | — | |
| Purchase of own shares (Note 22) | — | | (29,970) | | — | | — | | — | | — | | (6,874) | | — | | — | | — | | (36,844) | | — | | (36,844) | |
| Dividends to shareholders (Note 22) | — | | (35,000) | | — | | — | | — | | — | | — | | — | | — | | — | | (35,000) | | — | | (35,000) | |
| Dividends to non-controlling interest | — | | — | | — | | — | | — | | — | | — | | — | | — | | — | | — | | (358) | | (358) | |
| Balance at December 31, 2022 | 167,073 | | 793,169 | | (456,029) | | 18,792 | | (44,872) | | 126,925 | | (4,792) | | 281,909 | | 41,574 | | 202,342 | | 1,126,091 | | 37,552 | | 1,163,643 | |
(*) Net of $(7,337) of Income tax.
(**) Net of $25,307 of Income tax.
(1) Correspond to the presumed credit of ICMS (Imposto sobre Circulação de Mercadorias e Prestação de Serviços) over the sale values in our Sugar, ethanol and energy business. (please see Note 24).
The accompanying notes are an integral part of these consolidated financial statements.
F- 10
Adecoagro S.A.
Consolidated Statements of Changes in Shareholders’ Equity
for the years ended December 31, 2023, 2022 and 2021
(All amounts in US$ thousands, except shares and per share data and as otherwise indicated)
| | | | | | | | | | | | | | | | | | | | | | | | | | | | | | | | | | | | | | | | | |
| | Attributable to equity holders of the parent | | |
| | Share capital
(Note 22) | Share
premium
(Note 22) | Cumulative
translation
adjustment | Equity-settled
compensation | Cash flow
hedge | Other reserves | Treasury
shares | Revaluation surplus | Reserve from the sale of non-controlling interests in subsidiaries | Retained
earnings | Subtotal | Non-
controlling
interest | Total
shareholders’
equity |
| Balance at January 1, 2023 | 167,073 | | 793,169 | | (456,029) | | 18,792 | | (44,872) | | 126,925 | | (4,792) | | 281,909 | | 41,574 | | 202,342 | | 1,126,091 | | 37,552 | | 1,163,643 | |
| Profit for the year | — | | — | | — | | — | | — | | — | | — | | — | | — | | 226,291 | | 226,291 | | 430 | | 226,721 | |
| Other comprehensive income: | | | | | | | | | | | | | |
| - Items that may be reclassified subsequently to profit or loss: | | | | | | | | | | | | | |
| Exchange differences on translating foreign operations | — | | — | | (147,832) | | — | | — | | — | | — | | (63,523) | | — | | — | | (211,355) | | (10,811) | | (222,166) | |
| Cash flow hedge (*) | — | | — | | — | | — | | 27,748 | | — | | — | | — | | — | | — | | 27,748 | | — | | 27,748 | |
| - Items will not be reclassified to profit or loss: | | | | | | | | | | | | | |
| Revaluation surplus (**) | — | | — | | — | | — | | — | | — | | — | | 112,360 | | — | | — | | 112,360 | | 10,433 | | 122,793 | |
| Reserve of the revaluation surplus derived from the disposals of assets (***) | — | | — | | — | | — | | — | | — | | — | | (13,148) | | — | | 13,148 | | — | | — | | — | |
| Other comprehensive income/ (loss) for the year | — | | — | | (147,832) | | — | | 27,748 | | — | | — | | 35,689 | | — | | 13,148 | | (71,247) | | (378) | | (71,625) | |
| Total comprehensive income/ (loss) for the year | — | | — | | (147,832) | | — | | 27,748 | | — | | — | | 35,689 | | — | | 239,439 | | 155,044 | | 52 | | 155,096 | |
| | | | | | | | | | | | | |
| | | | | | | | | | | | | |
| Reserves for the benefit of government grants (1) | — | | — | | — | | — | | — | | 22,992 | | — | | — | | — | | (22,992) | | — | | — | | — | |
| Employee share options (Note 23): | | | | | | | | | | | | | |
| - Exercised | — | | 236 | | — | | (77) | | — | | — | | 55 | | — | | — | | — | | 214 | | — | | 214 | |
| | | | | | | | | | | | | |
| Restricted shares (Note 23): | | | | | | | | | | | | | |
| - Value of employee services | — | | — | | — | | 6,084 | | — | | — | | — | | — | | — | | — | | 6,084 | | — | | 6,084 | |
| - Vested | — | | 7,528 | | — | | (6,145) | | — | | 1,554 | | — | | — | | — | | — | | 2,937 | | — | | 2,937 | |
| - Forfeited | — | | — | | — | | — | | — | | 30 | | (30) | | — | | — | | — | | — | | — | | — | |
| - Granted | — | | — | | — | | — | | — | | (824) | | 824 | | — | | — | | — | | — | | — | | — | |
| Purchase of own shares (Note 22) | — | | (22,123) | | — | | — | | — | | — | | (4,119) | | — | | — | | — | | (26,242) | | — | | (26,242) | |
| Dividends to shareholders (Note 22) | — | | (35,000) | | — | | — | | — | | — | | — | | — | | — | | — | | (35,000) | | — | | (35,000) | |
| Dividends to non-controlling interest | — | | — | | — | | — | | — | | — | | — | | — | | — | | — | | — | | (1,084) | | (1,084) | |
| Balance at December 31, 2023 | 167,073 | | 743,810 | | (603,861) | | 18,654 | | (17,124) | | 150,677 | | (8,062) | | 317,598 | | 41,574 | | 418,789 | | 1,229,128 | | 36,520 | | 1,265,648 | |
(*) Net of $(8,498) of Income tax.
(**) Net of $(62,988) of Income tax.
(1) Correspond to the presumed credit of ICMS (Imposto sobre Circulação de Mercadorias e Prestação de Serviços) over the sale values in our Sugar, ethanol and energy business. (please see Note 24).
The accompanying notes are an integral part of these consolidated financial statements.
F- 811
Adecoagro S.A.
Consolidated Statements of Cash Flows
for the years ended December 31, 2020, 20192023, 2022 and 20182021
(All amounts in US$ thousands, except shares and per share data and as otherwise indicated)
| | | | Note | 2020 | | 2019 (*) | | 2018 (*) | | Note | 2023 | | 2022 | | 2021 |
| Cash flows from operating activities: | Cash flows from operating activities: | | | | | | | Cash flows from operating activities: | | | | |
| Profit / (Loss) for the year | | 1,070 | | | 342 | | | (23,233) | |
| Profit for the year | |
| Adjustments for: | Adjustments for: | | |
| Income tax expense / (benefit) | 10 | 12,325 | | | 20,820 | | | (1,024) | |
| Income tax expense | |
| Income tax expense | |
| Income tax expense | |
| Depreciation | Depreciation | 12 | 140,579 | | | 173,208 | | | 153,034 | |
| Amortization | Amortization | 15 | 1,293 | | | 1,231 | | | 1,220 | |
| Depreciation of right of use assets | Depreciation of right of use assets | 13 | 40,820 | | | 45,168 | | | 0 | |
| Loss from the disposal of other property items | 8 | (2,198) | | | 329 | | | 95 | |
| (Gain) / loss from the disposal of other property items | |
| Gain from the sale of farmland and other assets | Gain from the sale of farmland and other assets | 8 | (2,064) | | | (1,354) | | | (36,227) | |
| Loss from the sale of subsidiary | | 554 | | | 0 | | | 0 | |
| Acquisition of subsidiaries | 22 | 0 | | | (149) | | | 0 | |
| | Bargain purchase gain on acquisition | |
| | Bargain purchase gain on acquisition | |
| | Bargain purchase gain on acquisition | |
| Net (gain) / loss from the fair value adjustment of Investment properties | Net (gain) / loss from the fair value adjustment of Investment properties | 8 | (1,077) | | | 325 | | | (13,409) | |
| Equity settled share-based compensation granted | Equity settled share-based compensation granted | 7 | 4,316 | | | 4,734 | | | 4,728 | |
| Loss / (gain) from derivative financial instruments and forwards | 8, 9 | 10,058 | | | (469) | | | (51,504) | |
| (Gain) / loss from derivative financial instruments and forwards | |
| Interest, finance cost related to lease liabilities and other financial expense, net | Interest, finance cost related to lease liabilities and other financial expense, net | 9 | 47,686 | | | 59,916 | | | 40,223 | |
| Initial recognition and changes in fair value of non harvested biological assets (unrealized) | | (32,975) | | | (1,720) | | | 30,299 | |
| Initial recognition and changes in fair value of non-harvested biological assets (unrealized) | |
| Changes in net realizable value of agricultural produce after harvest (unrealized) | Changes in net realizable value of agricultural produce after harvest (unrealized) | | 481 | | | 481 | | | 647 | |
| Provision and allowances | Provision and allowances | | 1,940 | | | 2,778 | | | 2,126 | |
| Net (gain) / loss of inflation effects on the monetary items | Net (gain) / loss of inflation effects on the monetary items | 9 | (12,064) | | | (16,911) | | | 25,211 | |
| Foreign exchange losses, net | 9 | 109,266 | | | 25,779 | | | 68,787 | |
| Foreign exchange gains, net | |
| Cash flow hedge – transfer from equity | Cash flow hedge – transfer from equity | 9 | 24,363 | | | 25,484 | | | 38,086 | |
| Subtotal | Subtotal | | 344,373 | | | 339,992 | | | 239,059 | |
| Changes in operating assets and liabilities: | Changes in operating assets and liabilities: | | | | | | | Changes in operating assets and liabilities: | | | | |
| Increase in trade and other receivables | | (55,233) | | | (17,664) | | | (65,942) | |
| (Increase) / Decrease in inventories | | (30,165) | | | 9,998 | | | (41,531) | |
| (Increase) / Decrease in biological assets | | (10,290) | | | (27,037) | | | 2,958 | |
| (Increase) / Decrease in other assets | | (35) | | | (210) | | | (777) | |
| Decrease in derivative financial instruments | | 5,234 | | | 3,997 | | | 50,021 | |
| Increase in trade and other payables | | 828 | | | 13,102 | | | 31,148 | |
| Decrease / (increase) in trade and other receivables | |
| (Increase) / decrease in inventories | |
| (Increase) / decrease in biological assets | |
| Increase in other assets | |
| Increase in derivative financial instruments | |
| Decrease in trade and other payables | |
| Increase in payroll and social security liabilities | Increase in payroll and social security liabilities | | 4,120 | | | 2,565 | | | 5,876 | |
| Increase / (Decrease) in provisions for other liabilities | | 380 | | | (351) | | | (430) | |
| Increase / (decrease) in provisions for other liabilities | |
| Net cash generated from operating activities before taxes paid | Net cash generated from operating activities before taxes paid | | 259,212 | | | 324,392 | | | 220,382 | |
| Income tax paid | Income tax paid | | (2,087) | | | (2,282) | | | (1,869) | |
| Net cash generated from operating activities | Net cash generated from operating activities | (a) | 257,125 | | | 322,110 | | | 218,513 | |
|
(*) Prior periods have been recast to reflect the Company's change in accounting policy for the reclassification within financial results as explained in Note 34.1
The accompanying notes are an integral part of these consolidated financial statements.
F- 912
Adecoagro S.A.
Consolidated Statements of Cash Flows (Continued)
for the years ended December 31, 2020, 20192023, 2022 and 20182021
(All amounts in US$ thousands, except shares and per share data and as otherwise indicated)
| | | | Note | 2020 | | 2019 (*) | | 2018 (*) | | Note | 2023 | | 2022 | | 2021 |
| Cash flows from investing activities: | Cash flows from investing activities: | | | | | | | Cash flows from investing activities: | | | | |
| Acquisition of business, net of cash and cash equivalents acquired | Acquisition of business, net of cash and cash equivalents acquired | | 0 | | | 683 | | | 0 | |
| Purchases of property, plant and equipment | Purchases of property, plant and equipment | 12 | (168,529) | | | (252,450) | | | (207,069) | |
| Purchase of cattle and non current biological assets | 16 | (7,339) | | | (4,950) | | | (5,706) | |
| Purchase of cattle and non-current biological assets | |
| Purchases of intangible assets | Purchases of intangible assets | 15 | (1,122) | | | (8,617) | | | (3,321) | |
| Interest received and others | 9 | 25,421 | | | 7,210 | | | 7,728 | |
| Interest received and others (*) | |
| Proceeds from disposal of other property items | Proceeds from disposal of other property items | | 3,482 | | | 2,652 | | | 1,748 | |
| Proceeds from the sale of farmland and other assets | Proceeds from the sale of farmland and other assets | 22 | 16,022 | | | 5,833 | | | 31,511 | |
| Proceeds from the sale of subsidiary | Proceeds from the sale of subsidiary | 22 | 10,149 | | | 0 | | | 0 | |
| Acquisition of short-term investment | |
| Disposals of short-term investment | |
| Net cash used in investing activities | Net cash used in investing activities | (b) | (121,916) | | | (249,639) | | | (175,109) | |
| | Cash flows from financing activities: | Cash flows from financing activities: | | | | | | |
| Cash flows from financing activities: | |
| Cash flows from financing activities: | | | | | |
| | Proceeds from long-term borrowings | |
| Proceeds from long-term borrowings | |
| Proceeds from long-term borrowings | Proceeds from long-term borrowings | 27 | 116,015 | | | 108,271 | | | 45,536 | |
| Payments of long-term borrowings | Payments of long-term borrowings | 27 | (34,750) | | | (101,826) | | | (124,349) | |
| Proceeds from short-term borrowings | Proceeds from short-term borrowings | 27 | 207,217 | | | 193,977 | | | 318,108 | |
| Payments of short-term borrowings | Payments of short-term borrowings | 27 | (233,540) | | | (131,521) | | | (190,630) | |
| Interest paid | Interest paid | (c) | (60,026) | | | (53,996) | | | (50,021) | |
| | (Payments) / collections of derivatives financial instruments | | (1,687) | | | 1,481 | | | (2,578) | |
| Borrowings prepayment related expenses | |
| Proceeds from exercise of employee share options | |
| (Payments) / Collections of derivatives financial instruments | |
| Lease payments | Lease payments | | (40,336) | | | (49,081) | | | 0 | |
| Purchase of own shares | Purchase of own shares | | (4,365) | | | (4,263) | | | (15,725) | |
| Dividends paid to non-controlling interest | Dividends paid to non-controlling interest | | (2,447) | | | (905) | | | (1,195) | |
| Dividends paid to shareholders | |
| Net cash used from financing activities | Net cash used from financing activities | (d) | (53,919) | | | (37,863) | | | (20,854) | |
| Net increase in cash and cash equivalents | | 81,290 | | | 34,608 | | | 22,550 | |
| Net increase / (decrease) in cash and cash equivalents | |
| Cash and cash equivalents at beginning of year | Cash and cash equivalents at beginning of year | 21 | 290,276 | | | 273,635 | | | 269,195 | |
| Effect of exchange rate changes and inflation on cash and cash equivalents | Effect of exchange rate changes and inflation on cash and cash equivalents | (e) | (35,284) | | | (17,967) | | | (18,110) | |
| Cash and cash equivalents at end of year | Cash and cash equivalents at end of year | 21 | 336,282 | | | 290,276 | | | 273,635 | |
(a) Includes (14,956)(16,383), 23,550(38,043) and 7,598(30,666) of the combined effect of IAS 29 and IAS 21 of the Argentine subsidiaries for 2020, 20192023, 2022 and 2018,2021, respectively.
(b) Includes (429)(41,179), 2,922(83) and 3,935(4,694) of the combined effect of IAS 29 and IAS 21 of the Argentine subsidiaries for 2020, 20192023, 2022 and 2018,2021, respectively.
(c) Includes (1,639)(8,253), 4.40877 and NaN(1,109) of the combined effect of IAS 29 and IAS 21 of the Argentine subsidiaries for 2020, 20192023, 2022 and 2018,2021, respectively.
(d) Includes 15,694, (14,340)45,933, 45,359 and (8,231)41,238 of the combined effect of IAS 29 and IAS 21 of the Argentine subsidiaries for 2020, 20192023, 2022 and 2018,2021, respectively.
(e) Includes (309), (12,132)11,629, (7,233) and (3,302)(5,878) of the combined effect of IAS 29 and IAS 21 of the Argentine subsidiaries for 2020, 20192023, 2022 and 2018,2021, respectively.
Non-cash investing and financing transactions disclosed in other notes are the seller financing of Subsidiaries in Note 22.
(*) Prior periods have been recastIncludes 54,687 related to reflectgains on bond arbitrage transactions (nil in 2022 and 12,708 in 2021) of which the Company's change in accounting policycombined effect of IAS 29 and 21 of the Argentine subsidiaries is 30,544, nil and (202) for the reclassification within financial results as explained in2023, 2022 and 2021, respectively.
For non-cash transactions, see Note 34.113 for Right of Use Assets and related to acquisition of subsidiaries, see Note 21.
The accompanying notes are an integral part of these consolidated financial statements.
F- 1013
Adecoagro S.A.
Notes to the Consolidated Financial Statements
(All amounts in US$ thousands, except shares and per share data and as otherwise indicated)
1. General information
Adecoagro S.A. (the "Company" or "Adecoagro") is the Group’s ultimate parent company and is a société anonyme (stock corporation) organized under the laws of the Grand Duchy of Luxembourg. Adecoagro is a holding company primarily engaged through its operating subsidiaries in agricultural and agro-industrial activities. The Company and its operating subsidiaries are collectively referred to hereinafter as the "Group". These"Group." The Group’s activities are carried out through 3two major lines of business, namely, Farming;Farming and Sugar, Ethanol and Energy and Land Transformation.Energy. The Farming line of business is further comprised of 3three reportable segments, which are described in detail in Note 3 to these Consolidated Financial Statements.
Adecoagro is a Public Company listed in the New York Stock Exchange (NYSE) as a foreign registered company under the ticker symbol of AGRO.
These Consolidated Financial Statements have been approved for issue by the Board of Directors on March 9, 2021.April 26, 2024.
2. Financial risk management
Risk management principles and processes
The Group’s activities are exposed to a variety of financial risks. The Group’s overall risk management program focuses on the unpredictability of financial markets and seeks to minimize the Group’s capital costs by using suitable means of financing and to manage and control the Group’s financial risks effectively. The Group uses financial instruments to hedge certain risk exposures.
The Group’s approach to the identification, assessment and mitigation of risk is carried out by a Risk and Commercial Committee, which focuses on timely and appropriate management of risk.risk management.
The principal financial risks are related to raw material price, end-product price, exchange rate, interest rate, liquidity and credit.credit risk. This section provides a description of the principal risks and uncertainties that could have a material adverse effect on the Group’s strategy, performance, results of operations and financial condition. These risks do not appear in any particular order of potential materiality or probability of occurrence.
In Argentina ongoing economical events forced the government to impose certain restrictions in the exchange markets, such as:currency status and macroeconomic outlook:
–Dividends payments to non residents.
– Set specific deadlines to enter and settle exports
– Prior authorizationThe Argentine subsidiaries of the BCRAGroup operate in an economic context in which main variables have a strong volatility as a consequence of political and economic uncertainties, both in national and international environments. Argentina’s annual inflation rate for the formationyears ended December 31, 2023, 2022 and 2021 was 211.4%, 94.8% and 50.9%, respectively. The Group uses Argentina’s official exchange rate to account for transactions in Argentina, mainly affecting the farming business segment, which as of external assets for companiesDecember 31, 2023, 2022 and 2021 was 808.45, 177.16 and 102.72, respectively, against the U.S. dollar. For the years ended December 31, 2023, 2022 and 2021, Argentina’s official exchange rate against the U.S. dollar increased 356.3%, 72.5% and 22.1%, respectively.
– Prior authorization
On December 10, 2023, a new government took office with the aim to boost a deregulation of the BCRAArgentine economy and other regulations. Certain regulations and/or restrictions have been eased and others remain in force, although it is expected that they will be lifted gradually. However, the scope and timing of the measures, including but not limited to the existing foreign exchange regulations remains uncertain as of the date of these Consolidated Financial Statements.
The Argentine Central Bank under prior administration, had implemented certain measures that control and restrict the ability of companies and individuals to access the foreign exchange market known as MULC (for its acronym in Spanish) for certain transactions. However, the performance of blue-chip swap transactions known as Contado con Liquidacion or CCL (for its acronym in Spanish) was an alternative lawful mechanism. The blue-chip swap transactions are capital markets
Adecoagro S.A.
Notes to the Consolidated Financial Statements (Continued)
(All amounts in US$ thousands, except shares and per share data and as otherwise indicated)
2. Financial risk management (continued)
transactions that could be implemented in different ways, both for the paymentinflow and outflow of debts relatedfunds. . The implicit exchange rate applicable to companies abroadthis type of transactions is higher with respect to the official foreign exchange rate.
– Deferral
The Company is permanently monitoring the evolution of payment of certain public debt instruments.
– Fuel price controlthe program to determine the possible impacts that these new measures could have on the Company’s business and financial position.
•Exchange rate risk
The Group’s cash flows, statement of income and statement of financial position are presented in U.S. Dollars and may be affected by fluctuations in exchange rates. Currency risks, as defined by IFRS 7, arise on account of monetary assets and liabilities being denominated in a currency that is not the functional currency.
A significant majority of the Group’s business activities is conducted in the respective functional currencies of the respective subsidiaries (primarily the Brazilian Reais and the Argentine Peso). However, the Group may transact in currencies other than the respective functional currencies, mainly the U.S. Dollars.Dollar. As such, these subsidiaries may hold U.S. Dollar denominated monetary balances at each year-end as indicated in the tables below.
Adecoagro S.A.
Notes to the Consolidated Financial Statements (Continued)
(All amounts in US$ thousands, except shares and per share data and as otherwise indicated)
2. Financial risk management (continued)
The Group’s net financial position exposure to the U.S. Dollar is managed on a case-by-case basis, partly by hedging certain expected cash flows with foreign exchange derivative contracts.
The following tables show the net monetary position of the respective subsidiaries within the Group categorized by functional currency. Non-U.S. Dollar amounts are presented in U.S. Dollars for purpose of these tables.
| | | |
| | | | 2020 | 2023 |
| | | Subsidiaries’ functional currency | | Subsidiaries’ functional currency |
Net monetary position
(Liability)/ Asset | Net monetary position
(Liability)/ Asset | Argentine
Peso | Brazilian
Reais | Uruguayan
Peso | U.S. Dollar | Total | Net monetary position
(Liability)/ Asset | Argentine
Peso | Brazilian
Reais | Uruguayan
Peso | | U.S. Dollar | Total |
| Argentine Peso | Argentine Peso | (115,097) | | — | | — | | (288) | | (115,385) | |
| Brazilian Reais | Brazilian Reais | — | | (298,039) | | — | | — | | (298,039) | |
| U.S. Dollar | U.S. Dollar | (193,353) | | (307,611) | | 20,720 | | 47,122 | | (433,122) | |
| Uruguayan Peso | Uruguayan Peso | — | | — | | (655) | | — | | (655) | |
| | Total | Total | (308,450) | | (605,650) | | 20,065 | | 46,834 | | (847,201) | |
| Total | |
| Total | |
| | | | 2019 | | 2022 |
| | | Subsidiaries’ functional currency | | Subsidiaries’ functional currency |
Net monetary position
(Liability)/ Asset | Net monetary position
(Liability)/ Asset | Argentine
Peso | Brazilian
Reais | Uruguayan
Peso | U.S. Dollar | Total | Net monetary position
(Liability)/ Asset | Argentine
Peso | Brazilian
Reais | Uruguayan
Peso | U.S. Dollar | Total |
| Argentine Peso | Argentine Peso | (19,733) | | — | | — | | (560) | | (20,293) | |
| Brazilian Reais | Brazilian Reais | — | | (196,081) | | — | | — | | (196,081) | |
| U.S. Dollar | U.S. Dollar | (317,296) | | (438,604) | | 21,586 | | 48,091 | | (686,223) | |
| Uruguayan Peso | Uruguayan Peso | — | | — | | (2,086) | | — | | (2,086) | |
| Total | Total | (337,029) | | (634,685) | | 19,500 | | 47,531 | | (904,683) | |
The Group’s analysis shown on the tables below is carried out based on the exposure of each functional currency subsidiary against the U.S. Dollar. The Group estimated that, other factors being constant, a hypothetical 10% appreciation/depreciation(depreciation) of the U.S. Dollar against the Brazilian real respective functional currencies for the years ended December 31, 20202023 and 2019 would have decreased/increased2022 or the Group’s Profit before income tax for the year. A 10% depreciationUruguayan peso, or a 25% appreciation/(depreciation) of the U.S. Dollar against the functional currencies would have an equal and opposite effect on the income statement.Argentine peso. A portion of this effect would have been recognized as other comprehensive income since a portion of the Company’s borrowings was used as cash flow hedge of the foreign exchange rate risk of a portion of its highly probable future sales in U.S. Dollars (see Hedge Accounting - Cash Flow Hedge below for details).
| | | | | | | | | | | | | | | | | |
| | Functional currency |
| Net monetary position | Argentine
Peso | Brazilian
Reais | Uruguayan
Peso | Total |
| 2020 | U.S. Dollar | (19,335) | | (30,761) | | 2,072 | | (48,024) | |
| 2019 | U.S. Dollar | (31,730) | | (43,860) | | 2,159 | | (73,431) | |
F- 15
Adecoagro S.A.
Notes to the Consolidated Financial Statements (Continued)
(All amounts in US$ thousands, except shares and per share data and as otherwise indicated)
2. Financial risk management (continued)
| | | | | | | | | | | | | | | | | | |
| | Functional currency |
| Net monetary position | Argentine
Peso | Brazilian
Reais | Uruguayan
Peso | | Total |
| 2023 | U.S. Dollar | (22,578) | | (26,249) | | 1,923 | | | (46,904) | |
| 2022 | U.S. Dollar | (44,830) | | (29,037) | | 2,281 | | | (71,586) | |
The tables above only consider the effect of a hypothetical appreciation / depreciation of the U.S. Dollars on the Group’s net financial position. A hypothetical appreciation / depreciation of the U.S. Dollar against the functional currencies of the Group’s subsidiaries has historically had a positive / negative effect, respectively, on the fair value of the Group’s biological assets and the end prices of the Group’s agriculture produce, both of which are generally linked to the U.S. Dollar.
Adecoagro S.A.
Notes to the Consolidated Financial Statements (Continued)
(All amounts in US$ thousands, except shares and per share data and as otherwise indicated)
2. Financial risk management (continued)
Hedge Accounting Cash Flow Hedge
Effective July 1, 2013, theThe Group formally documenteddocuments and designateddesignates cash flow hedging relationships to hedge the foreign exchange rate risk of a portion of its highly probable future sales in U.S. Dollars using a portion of its borrowings denominated in U.S. Dollars, currency forwards and foreign currency floating-to-fixed interest rate swaps.swaps, as needed.
PrincipalGenerally, the principal amounts of long-term borrowings (non-derivative financial instruments) and notional values of foreign currency forward contracts (derivative financial instruments) wereare designated as hedging instruments. These instruments are exposed to Brazilian Reais/ U.S. Dollar foreign currency risks, mainly Brazilian Reais/U.S. Dollar related to operations in Brazil and Argentine Peso/U.S. Dollar in Argentina respectively.related to operations in Argentina. As of December 31, 20202023, and 2019,2022, approximately 15.0% and 19.5%, respectively,4% of projected sales within those countries qualify as highly probable forecast transactions for hedge accounting purposes and wereare designated as hedged items.
The Group has preparedprepares formal documentation in order to support thehedge designation, above, including an explanation of how the designation of the hedging relationship is aligned with the Group’s Risk Management Policy, identification of the hedging instrument, the hedged transactions, the nature of the risk being hedged and an analysis which demonstrates that the hedge is expected to be highly effective. The Group reassesses the prospective and retrospective effectiveness of the hedge on an ongoing basis comparing the foreign currency component of the carrying amount of the hedging instruments and of the highly probable future sales.
Under cash flow hedge accounting, the effect of changes in foreign currency exchange rates on derivative and non-derivative hedging instruments are not be immediately recognized in profit or loss but beare reclassified from equity to profit or loss in the periods when the future sales occur, thus allowing for a more appropriate presentation of the results for the period reflecting the strategy in the Group’s Risk Management Policy.
The Company expectsCurrently, based on the Group’s plans, it is expected that the cash flows will occur and affect profit or loss between 20212024 and 2025.2028.
For the year ended December 31, 2020,2023, a total amount before income taxpre-tax loss of US$ 46,145 gain7,319 (US$ 54,312 gain15,621 pre-tax loss in 2019)2022 and US$ 10,565 loss in 2021) was recognized in other comprehensive income and an amount of US$ 26,03149,737 loss (US$ 15,59441,371 loss in 2019)2022 and US$54,650 loss in 2021) was reclassified from equity to profit or loss within “Financial results, net”.
•Raw material price risk
Inflation in the costs of raw materials and goods and services from industry suppliers and manufacturers presents risks to project economics. A significant portion of the Group’s cost structure includes the cost of raw materials primarily seeds, fertilizers and agrochemicals, among others. Prices for these raw materials may vary significantly.
•End-product price risk
Prices for commodity products have historically been cyclical, reflecting overall economic conditions and changes in capacity within the industry, which affect the profitability of entities engaged in the agribusiness industry. The Group combines
Adecoagro S.A.
Notes to the Consolidated Financial Statements (Continued)
(All amounts in US$ thousands, except shares and per share data and as otherwise indicated)
2. Financial risk management (continued)
different actions to minimize price risk. A percentage of crops are to be sold during and post harvestpost-harvest period. The Group manages minimum and maximum prices for each commodity as well as gross margin per each crop as to decide when and how to sell. End-product price risks are hedged if economically viable and possible by entering into forward contracts with major trading houses or by using derivative financial instruments, consisting mainly of crops and sugar future contracts, but also includes occasionally put and call options. A movement in end-product futures prices would result in a change in the fair value of the end product hedging contracts. These fair value changes, after taxes, are recorded in the consolidated statement of income.
Adecoagro S.A.
Notes to the Consolidated Financial Statements (Continued)
(All amounts in US$ thousands, except shares and per share data and as otherwise indicated)
2. Financial risk management (continued)
Contract positions are designed to ensure that the Group would receive a defined minimum price for certain quantities of its production. The counterparties to these instruments generally are major financial institutions. In entering into these contracts, the Group has assumed the risk that might arise from the possible inability of counterparties to meet the terms of their contracts. The Group does not expect any material losses as a result of counterparty defaults. The Group is also obliged to pay margin deposits and premiums for these instruments. These estimates represent only the sensitivity of the financial instruments to market risk and not the Group exposure to end product price risks as a whole, since the crops and cattle products sales are not financial instruments within the scope of IFRS 7 disclosure requirements.
Liquidity risk
The Group is exposed to liquidity risks, including risks associated with refinancing borrowings as they mature, and that borrowing facilities are not available to meet cash requirements. Failure to manage liquidity risks could have a material impact on the Group’s cash flow and statement of financial position.
Prudent liquidity risk management includes managing the profile of debt maturities and funding sources close oversight of cash flows projections, maintaining sufficient cash, and ensuring the availability of funding from an adequate amount of committed credit facilities and the ability to close out market positions. The Group's ability to fund its existing and prospective debt requirements is managed by maintaining diversified funding sources with adequate available funding lines from high quality lenders; and reaching to have long-term financial facilities.
As of December 31, 2020,2023, cash and cash equivalents of the Group totaled US$ 336.3 million, which could be used for managing liquidity risk.339.8 million.
The tables below analyzes the Group’s non-derivative financial liabilities and derivative financial liabilities into relevant maturity groupings based on the remaining period at the statement of financial position to the contractual maturity date. The amounts disclosed in the table are the contractual undiscounted cash flows and as a result they do not reconcile to the amounts disclosed on the statement of financial position except for short-term payables where discounting is not applied.
| | At December 31, 2020 | Less than
1 year | Between
1 and 2 years | Between 2
and 5 years | Over
5 Years | Total |
| At December 31, 2023 | | At December 31, 2023 | Less than
1 year | Between
1 and 2 years | Between 2
and 5 years | Over
5 Years | Total |
| Trade and other payables | Trade and other payables | 114,523 | | 15 | | 22 | | 253 | | 114,813 | |
| Borrowings | Borrowings | 286,588 | | 132,266 | | 197,941 | | 713,321 | | 1,330,116 | |
| Leases Liabilities | Leases Liabilities | 36,714 | | 20,608 | | 74,565 | | 65,639 | | 197,526 | |
| Derivative financial instruments | Derivative financial instruments | 13,141 | | 0 | | 0 | | 0 | | 13,141 | |
| Total | Total | 450,966 | | 152,889 | | 272,528 | | 779,213 | | 1,655,596 | |
| | At December 31, 2019 | Less than
1 year | Between
1 and 2 years | Between 2
and 5 years | Over
5 Years | Total |
| At December 31, 2022 | | At December 31, 2022 | Less than
1 year | Between
1 and 2 years | Between 2
and 5 years | Over
5 Years | Total |
| Trade and other payables | Trade and other payables | 94,821 | | 3,399 | | 30 | | 170 | | 98,420 | |
| Borrowings | Borrowings | 122,403 | | 154,682 | | 230,058 | | 681,819 | | 1,188,962 | |
| Leases Liabilities | Leases Liabilities | 46,370 | | 52,372 | | 89,259 | | 121,081 | | 309,082 | |
| Derivative financial instruments | Derivative financial instruments | 1,423 | | 0 | | 0 | | 0 | | 1,423 | |
| Total | Total | 265,017 | | 210,453 | | 319,347 | | 803,070 | | 1,597,887 | |
•Interest rate risk
Adecoagro S.A.
Notes to the Consolidated Financial Statements (Continued)
(All amounts in US$ thousands, except shares and per share data and as otherwise indicated)
2. Financial risk management (continued)
The Group’s interest rate risk arises from long-term borrowings at floating rates, which expose the Group to cash flow interest rate risk. Borrowings issued at fixed rates expose the Group to fair value interest rate risk. The interest rate profile of the Group's borrowings is set out in Note 27.26.
Adecoagro S.A.
Notes to the Consolidated Financial Statements (Continued)
(All amounts in US$ thousands, except shares and per share data and as otherwise indicated)
2. Financial risk management (continued)
The Group occasionally manages its cash flow interest rate risk exposure by using floating-to-fixed interest rate swaps. Such interest rate swaps have the economic effect of converting borrowings from floating rates to fixed rates.
The following tables show a breakdown of the Group’s fixed-rate and floating-rate borrowings per currency denomination and functional currency of the subsidiary issuing the loans.debt holder. These analyses are performed after giving effect to interest rate swaps.
The analysis for the year ended December 31, 20202023 and 20192022 is as follows:
| | | | 2020 | | 2023 |
| | | Subsidiaries’ functional currency | | Subsidiaries’ functional currency |
| Rate per currency denomination | Rate per currency denomination | Argentine
Peso | Brazilian
Reais | Uruguayan
Peso | U.S. Dollar | Total | Rate per currency denomination | Argentine
Peso | Brazilian
Reais | Uruguayan
Peso | U.S. Dollar | Total |
| Fixed rate: | Fixed rate: | | | | Fixed rate: | | | |
| Argentine Peso | Argentine Peso | 81,283 | | 0 | | 0 | | 0 | | 81,283 | |
| Brazilian Reais | Brazilian Reais | 0 | | 22,834 | | 0 | | 0 | | 22,834 | |
| U.S. Dollar | U.S. Dollar | 30,671 | | 75,592 | | 2,002 | | 505,259 | | 613,524 | |
| Subtotal fixed-rate borrowings | Subtotal fixed-rate borrowings | 111,954 | | 98,426 | | 2,002 | | 505,259 | | 717,641 | |
| Variable rate: | Variable rate: | | |
| Argentine Peso | |
| Argentine Peso | |
| Argentine Peso | |
| Brazilian Reais | Brazilian Reais | 0 | | 184,123 | | 0 | | 0 | | 184,123 | |
| U.S. Dollar | U.S. Dollar | 66,584 | | 2,742 | | 0 | | 0 | | 69,326 | |
| Subtotal variable-rate borrowings | Subtotal variable-rate borrowings | 66,584 | | 186,865 | | 0 | | 0 | | 253,449 | |
| | Total borrowings as per statement of financial position | Total borrowings as per statement of financial position | 178,538 | | 285,291 | | 2,002 | | 505,259 | | 971,090 | |
| | Total borrowings as per statement of financial position | |
| | Total borrowings as per statement of financial position | |
| | | | 2019 | | 2022 |
| | | Subsidiaries’ functional currency | | Subsidiaries’ functional currency |
| Rate per currency denomination | Rate per currency denomination | Argentine
Peso | Brazilian
Reais | Uruguayan
Peso | U.S. Dollar | Total | Rate per currency denomination | Argentine
Peso | Brazilian
Reais | Uruguayan
Peso | U.S. Dollar | Total |
| Fixed rate: | Fixed rate: | | | | Fixed rate: | | | |
| Argentine Peso | Argentine Peso | 549 | | 0 | | 0 | | 0 | | 549 | |
| Brazilian Reais | Brazilian Reais | 0 | | 142,142 | | 0 | | 0 | | 142,142 | |
| U.S. Dollar | U.S. Dollar | 128,464 | | 77,378 | | 15,113 | | 504,814 | | 725,769 | |
| Subtotal fixed-rate borrowings | Subtotal fixed-rate borrowings | 129,013 | | 219,520 | | 15,113 | | 504,814 | | 868,460 | |
| Variable rate: | Variable rate: | | |
| Brazilian Reais | Brazilian Reais | 0 | | 13,604 | | 0 | | 0 | | 13,604 | |
| Brazilian Reais | |
| Brazilian Reais | |
| U.S. Dollar | U.S. Dollar | 79,339 | | 6,877 | | 0 | | 0 | | 86,216 | |
| Subtotal variable-rate borrowings | Subtotal variable-rate borrowings | 79,339 | | 20,481 | | 0 | | 0 | | 99,820 | |
| | Total borrowings as per statement of financial position | Total borrowings as per statement of financial position | 208,352 | | 240,001 | | 15,113 | | 504,814 | | 968,280 | |
| | Total borrowings as per statement of financial position | |
| | Total borrowings as per statement of financial position | |
For the years ended December 31, 20202023 and 2019,2022, if interest rates on floating-rate borrowings had been 1% higher with all other variables held constant, the Group’s Profit before income tax for the years would have decreased as shown below. A 1% decrease in interest rates would have an equal and opposite effect on the income statement.
Adecoagro S.A.
Notes to the Consolidated Financial Statements (Continued)
(All amounts in US$ thousands, except shares and per share data and as otherwise indicated)
2. Financial risk management (continued)
| | | | 2020 | | 2023 |
| | | Subsidiaries’ functional currency | | Subsidiaries’ functional currency |
| Rate per currency denomination | Rate per currency denomination | Argentine
Peso | Brazilian
Reais | Uruguayan
Peso | U.S. Dollar | Total | Rate per currency denomination | Argentine
Peso | Brazilian
Reais | Uruguayan
Peso | U.S. Dollar | Total |
| Variable rate: | Variable rate: | | | | Variable rate: | | | |
| Argentine peso | | Argentine peso | (515) | — | | — | | — | | (515) |
| Brazilian Reais | Brazilian Reais | 0 | | (1,841) | | 0 | | 0 | | (1,841) | |
| U.S. Dollar | U.S. Dollar | (666) | | (27) | | 0 | 0 | | (693) | |
| Total effects on profit before income tax | Total effects on profit before income tax | (666) | | (1,868) | | 0 | | 0 | | (2,534) | |
| | | | 2019 | | 2022 |
| | | Subsidiaries’ functional currency | | Subsidiaries’ functional currency |
| Rate per currency denomination | Rate per currency denomination | Argentine
Peso | Brazilian
Reias | Uruguayan
Peso | U.S. Dollar | Total | Rate per currency denomination | Argentine
Peso | Brazilian
Reias | Uruguayan
Peso | U.S. Dollar | Total |
| Variable rate: | Variable rate: | | | | Variable rate: | | | |
| Brazilian Reais | Brazilian Reais | 0 | | (136) | | 0 | | 0 | | (136) | |
| U.S. Dollar | U.S. Dollar | (793) | | (69) | | 0 | | 0 | | (862) | |
| Total effects on profit before income tax | Total effects on profit before income tax | (793) | | (205) | | 0 | | 0 | | (998) | |
The sensitivity analysis has been determined assuming that the change in interest rates had occurred at the date of the statement of financial position and had been applied to the exposure to interest rate risk for financial instruments in existence at that date. The 100 basis point increase or decrease represents management's assessment of a reasonable possible change in those interest rates, which have the most impact on the Group, specifically the United States and Brazilian rates over the period until the next annual statement of financial position date.
•Credit risk
The Group’s exposuresexposure to credit risk mainly arise in certain agreementsfrom the potential non-performance of contractual obligations by the parties, in relation to amounts owed for physical product sales, the use of derivative instruments, and the investment of surplus cash balances. The Group is also exposed to political and economic risk events, which may cause non-payment of foreign currency obligations to the Group.
The Group’s policy is to manage credit exposure to trading counterparties within defined trading limits. All of the Group’s significant counterparties are assigned internal credit limits.
The Group regularly sells to a large base of customers. TypeThe type and class of customers may differ depending on the Group’s business segments. For the years ended December 31, 20202023 and 2019,2022, more than 80%73% and 96%71%, respectively, of the Group’s sales of crops were sold to 3630 and 4234 well-known customers (both multinational and local) with a good credit history with the Group. In the rice segment 79% and 74% of sales were sold to 90 and 79 well-known customers for the years ended December 31, 2023 and 2022, respectively. In the Sugar, Ethanol and Energy segment, sales of ethanol were concentrated in 46122 and 5266 customers, which represented 100% of total sales of ethanol for the years ended December 31, 20202023 and 2019,2022, respectively. Approximately 78%79% and 86%100% of the Group’s sales of sugar were concentrated in 76154 and 66158 well-known traders for the years ended December 31, 20202023 and 2019,2022, respectively. The remaining 22%For the years ended December 31, 2023 and 14%, which mainly relates to “crystal sugar”, were dispersed among several customers. In 20202022, 100% and 2019,94% of energy sales are 96% and 94%were concentrated in 5273 and 59 major customers.customers, respectively. In the dairy segment, 65%54% and 70%62% of the sales were concentrated in 2159 and 3653 well-known customers in 2020for the years ended December 31, 2023 and 2019,2022, respectively.
No credit limits were exceeded during the reporting periods and management does not expect any losses from non-performance by these counterparties. If any of the Group’s customers are independently rated, these ratings are used. Otherwise, the Group assesses the credit quality of the customer taking into account its financial position, past experience and other factors (see Note 1817 for details). The Group may seek cash collateral, letter of credit or parent company guarantees, as
Adecoagro S.A.
Notes to the Consolidated Financial Statements (Continued)
(All amounts in US$ thousands, except shares and per share data and as otherwise indicated)
2. Financial risk management (continued)
considered appropriate. Sales to customers are primarily made by credit with customary payment terms. The maximum exposure to credit risk is represented by the carrying amount of each financial asset in the statement of financial position after deducting any impairment allowance. The Group’s exposure of credit risk arising from trade receivables is set out in Note 19.
Adecoagro S.A.
Notes to the Consolidated Financial Statements (Continued)
(All amounts in US$ thousands, except shares and per share data and as otherwise indicated)
2. Financial risk management (continued)
18.
The Group is exposed to counterparty credit risk on cash and cash equivalent balances. The Group holds cash on deposit with a number of financial institutions. The Group manages its credit risk exposure by limiting individual deposits to clearly defined limits. The Group only deposits with high quality banks and financial institutions. As of December 31, 20202023 and 2019,2022, the total amount of cash and cash equivalents mainly comprise cash in banks and short-term bank deposits. The Group is authorized to transact with banks rated “BBB+” or higher. As of both December 31, 20202023 and 2019, 6 and 82022, 5 banks (primarily JP Morgan, Banco Safra, Itaú Nassau, Credit Agricole, Credit SuisseBanco Itaú, Banco Galicia, Portfolio Personal Inversiones and Banco Itaú)FCI) accounted for more than 81%80% and 85%86%, respectively, of the total cash deposited. The remaining amount of cash and cash equivalents relates to cash in hand. Additionally, during the year ended December 31, 2020,2023, the Group invested in fixed-term bank deposits with mainly 5 bank (ING, Credit Agricole, Credit Suisse, JP Morgantwo banks (Banco do Brasil and Banco Galicia y Buenos Aires)Itaú), treasury bills and also entered into derivative contracts (currency forward). The Group’s exposure of credit risk arising from cash and cash equivalents is set out in Note 21.20.
The Group’s primary objective for holding derivative financial instruments is to manage currency exchange rate risk, interest rate risk and commodity price risk. The Group generally enters into derivative transactions with high-credit-quality counterparties and, by policy, limits the amount of credit exposure to any one counterparty based on an analysis of that counterparty's relative credit standing. The amounts subject to credit risk related to derivative instruments are generally limited to the amounts, if any, by which counterparty's obligations exceed the obligations with that counterparty.
The Group also entered into crop commodity futures traded in the established trading markets of Argentina and Brazil through well-rated brokers. Management does not expect any counterparty to fail to meet its obligations.
•Capital risk management
The Group’s objectives when managing capital are to safeguard the Group’s ability to continue as a going concern in order to provide returns for shareholders and benefits for other stakeholders and to maintain an optimal capital structure to reduce the cost of capital. In order to maintain or adjust the capital structure, it may adjust the amount of dividends paid to shareholders, return capital to shareholders, issue new shares or buy own shares or sell assets to reduce debt. Consistent with others in the industry, the Group monitors capital on the basis of the gearing ratio. This ratio is calculated as total debt (including current and non-current borrowings as shown in the consolidated statement of financial position, if applicable) divided by total capital. Total capital is calculated as equity, as shown in the consolidated statement of financial position, plus total borrowings. During the year ended December 31, 2020,2023, the strategy was to maintain the gearing ratio within 0.40 to 0.60, as follows:
| | | | | | | | | | | |
| | 2020 | | 2019 |
| Total borrowings | 971,090 | | | 968,280 | |
| Total equity | 963,724 | | | 1,028,883 | |
| Total capital | 1,934,814 | | | 1,997,163 | |
| Gearing ratio | 0.50 | | | 0.48 | |
| | | | | | | | | | | |
| | 2023 | | 2022 |
| Total borrowings | 904,949 | | | 1,007,752 | |
| Total equity | 1,265,648 | | | 1,163,643 | |
| Total capital | 2,170,597 | | | 2,171,395 | |
| Gearing ratio | 0.42 | | | 0.46 | |
•Derivative financial instruments
As part of its business operations, the Group may uses a variety of derivative financial instruments to manage its exposure to the financial risks discussed above. As part of thisits strategy, the Group may enter into derivatives of (i) interest rate to manage the composition of floating and fixed rate debt; (ii) currency to manage exchange rate risk, and (iii) crop (future contracts and put and call options) to manage its exposure to price volatility stemming from its integrated crop production activities. The Group’s policy is not to use derivatives for speculative purposes.
Adecoagro S.A.
Notes to the Consolidated Financial Statements (Continued)
(All amounts in US$ thousands, except shares and per share data and as otherwise indicated)
2. Financial risk management (continued)
Derivative financial instruments involve, to a varying degree, elements of market and credit risk not recognized in the financial statements. The market risk associated with these instruments resulting from price movements is expected to offset the market risk of the underlying transactions, assets and liabilities, being hedged. The counterparties to the agreements relating to the Group’s contracts generally are large institutions with credit ratings equal to or higher than BBB+. The Group continually monitors the credit rating of such counterparties and seeks to limit its financial exposure to any one financial institution. While the contract or notional amounts of derivative financial instruments provide one measure of the volume of these transactions, they do not represent the amount of the Group’s exposure to credit risk. The amounts potentially subject to credit risk (arising from the possible inability of counterparties to meet the terms of their contracts) are generally limited to the amounts, if any, by which the counterparties’ obligations under the contracts exceed the Group’s obligations to the counterparties.
The following tables show the outstanding positions for each type of derivative contract as of the date of each statement of financial position:
▪ Futures/Futures / options
As of December 31, 2020:2023: | | | | | | | | | | | | | | | | | | | | | | | | | | |
| | | 2023 |
Type of
derivative contract | | Quantities
(thousands)
(**) | | Notional
amount | | Fair
Value Asset/
(Liability) | | (Loss)/Gain
(*) |
| Futures: | | | | | | | | |
| Sale | | | | | | | | |
| | | | | | | | |
| Soybean | | 3 | | | 518 | | | (9) | | | (9) | |
| Wheat | | 2 | | | 537 | | | (12) | | | (12) | |
| Sugar | | 157 | | | 79,404 | | | 8,678 | | | 8,586 | |
| | | | | | | | |
| OTC: | | | | | | | | |
| Sugar | | 112 | | | 55,696 | | | 5,141 | | | 5,250 | |
| | | | | | | | |
| | | | | | | | |
| | | | | | | | |
| | | | | | | | |
| | | | | | | | |
| | | | | | | | |
| | | | | | | | |
| Total | | 274 | | | 136,155 | | | 13,798 | | | 13,815 | |
| | | | | | | | | | | | | | | | | | | | | | | | | | |
| | | 2020 |
Type of
derivative contract | | Quantities
(thousands)
(**) | | Notional
amount | | Fair
Value Asset/
(Liability) | | (Loss)/Gain
(*) |
| Futures: | | | | | | | | |
| Sale | | | | | | | | |
| Corn | | 52 | | | 6,027 | | | (2,846) | | | 2,846 | |
| Soybean | | 32 | | | 7,242 | | | (3,380) | | | 3,380 | |
| Wheat | | (19) | | | (4,272) | | | 151 | | | (151) | |
| Sugar | | 217 | | | 63,025 | | | (6,738) | | | 5,538 | |
| Ethanol | | 1 | | | 277 | | | (20) | | | 3 | |
| | | | | | | | |
| | | | | | | | |
| | | | | | | | |
| | | | | | | | |
| | | | | | | | |
| | | | | | | | |
| | | | | | | | |
| Total | | 283 | | | 72,299 | | | (12,833) | | | 11,616 | |
As of December 31, 2019:
| | | | | | | | | | | | | | | | | | | | | | | | | | |
| | | 2019 |
Type of
derivative contract | | Quantities
(thousands)
(**) | | Notional
amount | | Fair
Value Asset/
(Liability) | | (Loss)/Gain
(*) |
| Futures: | | | | | | | | |
| Sale | | | | | | | | |
| Corn | | 221 | | | 923 | | | 445 | | | (446) | |
| Soybean | | 107 | | | 7,118 | | | 759 | | | (687) | |
| Wheat | | 13 | | | 515 | | | (28) | | | 28 | |
| Sugar | | 101 | | | 29,409 | | | (1,342) | | | 1,155 | |
| | | | | | | | |
| | | | | | | | |
| | | | | | | | |
| | | | | | | | |
| | | | | | | | |
| Total | | 442 | | | 37,965 | | | (166) | | | 50 | |
| | | | | | | | | | | | | | | | | | | | | | | | | | |
| | | 2022 |
Type of
derivative contract | | Quantities
(thousands)
(**) | | Notional
amount | | Fair
Value Asset/
(Liability) | | (Loss)/Gain
(*) |
| Futures: | | | | | | | | |
| Sale | | | | | | | | |
| Corn | | 5 | | | 992 | | | (193) | | | (193) | |
| Soybean | | 34 | | | 12,696 | | | (1,081) | | | (1,085) | |
| Wheat | | 9 | | | 2,956 | | | 111 | | | 115 | |
| Sugar | | 99 | | | 3,437 | | | (1,526) | | | (1,778) | |
| | | | | | | | |
| | | | | | | | |
| | | | | | | | |
| | | | | | | | |
| | | | | | | | |
| | | | | | | | |
| Total | | 147 | | | 20,081 | | | (2,689) | | | (2,941) | |
(*) Included in the line item “(Loss)“gain / Gain(loss) from commodity derivative financial instruments” of Note 8.
(**) All quantities expressed either in tons and m3.or cubic meters, as applicable.
Commodity future contract fair values are computed with reference to quoted market prices on future exchanges.
▪Floating-to-fixed interest rate swaps
In April 2022, one of the Group's subsidiaries in Brazil, Usina Monte Alegre (“UMA”) entered into a R$ 20 million loan with Itaú BBA. The loan bears interest at a fixed rate of 13.23% p.a. Concurrently, UMA entered into a swap agreement, to effectively convert the fixed-interest-rate loan into a variable-interest-rate loan denominated in CDI (an interbank floating interest rate in Reais), plus a fixed rate of 1.29%. The swap matures on March 24, 2024, mirroring the loan’s maturity date, and resulted in a recognition of non-significant losses in 2023.
Adecoagro S.A.
Notes to the Consolidated Financial Statements (Continued)
(All amounts in US$ thousands, except shares and per share data and as otherwise indicated)
2. Financial risk management (continued)
▪Interest rate swap
In December 31, 2020, one of the Group's subsidiarysubsidiaries in Brazil, Adecoagro Vale do Ivinhema entered into aan interest rate swap operationagreement with Itaú BBA infor an aggregate amount of US$400 million. In these operationPursuant to this agreement, Adecoagro Vale do Ivinhema receives IPCA (Extended National Consumer Price Index) plus 4.24% per year and pays CDI (an interbank floating interest rate in Reais) plus 1.85% per year. This swap agreement expires semiannually until December, 2026. This contractagreement resulted in a recognition of a gain of US$ 1.84.2 million in 2020.2023 and a loss of US$2.2 million in 2022.
▪Currency forward
During the year ended December 31, 2020 and 2019 theThe Group entered into several currency forward contracts with Brazilian banks, in order to hedge the fluctuation of the Brazilian Reais against the U.S. Dollar, for a total aggregate amount of US$ 23.83 million. TheseThe currency forward contracts maturity date is between January and April 2024. It resulted in athe recognition of a loss of US$ 1.9 million and US$ 1.1 millionnon-significant losses in 2020 and 2019 respectively.2023.
During the year ended on December 31, 2020,Also, the Group entered into several currency forward contracts in order to hedge the fluctuation of the U.S. Dollar against the Euro for a total notional amount of US$ 2.4 millions.0.8 million. The currency forward contracts maturity date was March 2021. The outstanding contractsis June 2024 and resulted in the recognition of a loss amounting to US$ 0.03 millionnon-significant losses in 2020.2023.
Gains and losses on currency forward contracts are included within “Financial results, net” in the statement of income.
▪Euro-bob price swap
3. Segment information
As Petrobras (the Brazilian oil state company) startedThe Group is engaged in agricultural, manufacturing and land transformation activities. Our agricultural activities consist of harvesting certain agricultural products, including crops, rough rice, and sugarcane, for sale to track the movementsthird parties and for internal use as inputs in its various manufacturing processes, and producing fluid milk. The manufacturing activities consist of (i) selling manufactured products, including processed peanuts, sunflower rice, sugar, ethanol and energy, among others, (ii) in our milk facilities we produce UHT and UP milk, powder milk and semi-hard cheese, among others; and (iii) providing services, such as grain warehousing and conditioning and handling and drying services, among others. The land transformation activities consist of the international gasolineacquisition of farmlands or businesses with underdeveloped or underutilized agricultural land and implementing production technology and agricultural best practices on the Group’s farmlands to set its domestic prices in 2017, the Group's subsidiary in Brazil, Adecoagro Vale do Ivinhema entered into a swap operation in March 2018, which intention was to mitigate the effects of the gasoline volatility in the ethanol prices sold by the company. The swaps expired according to the due datesenhance yields and as of December 31, 2018 all the swaps positions were already liquidated. The Group recorded a loss of US$ 1.6 million.
Adecoagro S.A.
Notes to the Consolidated Financial Statements (Continued)
(All amounts in US$ thousands, except shares and per share data and as otherwise indicated)
3. Segment informationincrease their value for potential realization through sale.
According to IFRS 8, operating segments are identified based on the ‘management approach’. Operating segments are components of an entity about which separate financial information is available that is evaluated regularly by the chief operating decision maker (“CODM”) in deciding how to allocate resources and in assessing performance. The Group’s CODM is the Management Committee. IFRS 8 stipulates external segment reporting based on the Group’s internal organizational and management structure and on internal financial reporting to the chief operating decision maker.
Effective for our year ended December 31, 2023, The Group’s CODM changed its internal reporting mainly to refine the way it views our farming business and its interaction with our overarching land transformation activities embedded within such farming business. Previously, The Group’s CODM reviewed the results of our land transformation strategy as a separate activity upon disposition of transformed farmlands and/or other rural properties, or the acquisition of an under-utilized land. As from the fourth quarter of 2023, The Group’s CODM started allocating any profit from disposition of a farmland or, a bargain purchase gain, as part of the farming activity where such farmland belongs. The CODM believes that this allocation better aligns the activities which were conducted to achieve the full growth potential of the land through the years with its ultimate realization of incremental value. Therefore, any profit on the realization of land transformation activities is now included in the respective farming business operating segment to which the disposed/acquired land belongs.
Also, The Group’s CODM started allocating the results of our minor cattle activities – which were previously reported as part of “all other segments” since they did not meet the quantitative thresholds for disclosure – to the farmland where the cattle is assigned. The Group maintains cattle as complementary to the farming activities rather than as a separate business itself. Cattle helps preserve the value and productive capacity of the farmlands, avoiding the growth of undesired weed.
Adecoagro S.A.
Notes to the Consolidated Financial Statements (Continued)
(All amounts in US$ thousands, except shares and per share data and as otherwise indicated)
3. Segment information (continued)
These changes resulted in revisions to the financial information provided to The Group’s CODM on a recurring basis in their evaluation of our financial performance and the decision-making process. The Group’s CODM believes these changes better reflect the performance of our reportable segments. Accordingly, the Group changed the segment reporting under IFRS 8 as further described below. Previously reported segment financial information was recast for the years ended December 31, 2022 and 2021 to reflect the new reportable segments’ structure.
Based on the foregoing, the Group operates in 3two major lines of business, namely, Farming;Farming and Sugar, Ethanol and Energy; and Land Transformation.Energy
•The Company’s ‘Farming’ is further comprised of 3three reportable segments:
•The Company’s ‘Crops’‘Crops’ Segment which consists of planting, harvesting and sale of grains, oilseeds and fibers (including wheat, corn, soybeans, peanuts, cotton and sunflowers, among others), and to a lesser extent the provision of grain warehousing/conditioning and handling and drying services to third parties. Each underlying crop in this segment does not represent a separate operating segment. Management seeks to maximize the use of the land through the cultivation of one or more type of crops. Types and surface amount of crops cultivated may vary from harvest yearharvest-year to harvest yearharvest-year depending on several factors, some of them out of the Group´sGroup’s control. Management is focused on the long-term performance of the productive land, and to that extent, the performance is assessed considering the aggregated combination, if any, of crops planted in the land. A single manager is responsible for the management of operating activity of all crops rather than for each individual crop.
•The Company’s ‘Rice’‘Rice’ Segment which consists of planting, harvesting, processing and marketing of rice.rice, and the genetic development of seeds.
•The Company’s ‘Dairy’‘Dairy’ Segment which consists of the production and sale of raw milk and industrialized products, including UHT, cheese and powder milk among others.
•The Company’s ‘All Other Segments’ consists of the aggregation of the remaining non-reportable operating segments, which do not meet the quantitative thresholds for disclosure, namely, Coffee and Cattle.
•The Company’s ‘Sugar,‘Sugar, Ethanol and Energy’ Segment which consists of cultivating sugarcane which is processed in owned sugar mills, transformed into ethanol, sugar and electricity, in addition to biomethane and then marketed;
•The Company’s ‘Land Transformation’ Segment comprises the (i) identification and acquisition of underdeveloped and undermanaged farmland businesses; and (ii) realization of value through the strategic disposition of assets (generating profits).
Total segment assets and liabilities are measuredAs further discussed in a manner consistent with that of the Consolidated Financial Statements. These assets and liabilities are allocated based on the operations of the segment and the physical location of the asset.
Effective July 1, 2018,Note 32, the Group appliedapplies IAS 29 “Financial Reporting in Hyperinflationary Economies” (“IAS 29”) to its operations in Argentina. IAS 29 “Financial Reporting in Hyperinflationary Economies” requires that the financial statements of entities whose functional currency is that of a hyperinflationary economy be adjusted for the effects of changes in the general price index and be expressed in terms of the current unit of measurement at the closing date of the reporting period (“inflation accounting”). In order to determine whether an economy is classified as hyperinflationary, IAS 29 sets forth a series of factors to be considered, including whether the amount of cumulative inflation nears or exceeds a threshold of 100 %. Accordingly, Argentina has been classified as a hyperinflationary economy under the terms of IAS 29 from July 1, 2018. (Please see Note 34 - Basis of preparation and presentations).
According to IAS 29, all Argentine Peso-denominated non-monetary items in the statement of financial position are adjusted by applying a general price index from the date they were initially recognized to the end of the reporting period. Likewise, all Argentine Peso-denominated items in the statement of income should beare expressed in terms of the measuring unit current at the end of the reporting period, consequently, income statement items are adjusted by applying a general price index
Adecoagro S.A.
Notes to the Consolidated Financial Statements (Continued)
(All amounts in US$ thousands, except shares and per share data and as otherwise indicated)
3. Segment information (continued)
on a monthly basis from the dates they were initially recognized in the financial statements to the end of the reporting period. This process is called “re-measurement”.
Once the re-measurement process is completed, all Argentine Peso denominated accounts are translated into U.S. Dollars, the Group’swhich is our reporting currency, applying the guidelines in IAS 21 “The Effects of Changes in Foreign Exchange Rates”(“IAS 21”). IAS 21 requires that amounts be translated at the closing rate at the date of the most recent statement of financial position. This process is called “translation”.
The re-measurement and translation processes are applied on a monthly basis until year-end. Due to this process,these processes, the re-measured and translated results of operations for a given month are subject to change until year-end, affecting comparison and analysis.
FollowingHowever, the adoption of IAS 29 to the Argentine operations of the Group, management revised the informationinternal reporting reviewed by the CODM. Accordingly, as from July 1, 2018, (commencement of hyper-inflation accounting in Argentina), the information provided to the CODM departs from the application of IAS 29 and IAS 21 re-measurement and translation processes as follows. Thediscussed above. For segment reporting purposes, the segment results of the ArgentineanArgentine operations for each reporting period were adjusted for inflation and translated into the Group’s reporting currency using the reporting period average exchange rate. The translated amounts were not subsequently re-measured and translated in accordance with the IAS 29 and IAS 21 procedures outlined above. From January 1, 2018 through June 30, 2018, the Group’s segment results were still based on the IFRS measurement principles adopted until June 30, 2018.
guidelines. In order to evaluate the economicsegment’s performance, of businesses on a monthly basis, results of operations in Argentina are based on monthly data that has been adjusted for inflation and converted into the monthly US dollar average exchange rate of the U.S. Dollar each month.rate. These already converted figuresamounts are not subsequently not readjusted and reconverted as described above under IAS 29 and IAS 21. It should be noted that this translation methodology for evaluating segment information is the same that the companyGroup uses to translate results of operationoperations from its other subsidiaries from other countries that have not been designated hyperinflationary economies because it allows for a more accurate analysis of the economic performance of its business as a whole.
The Group’s CODM believes that the exclusion of the re-measurement and translation processes from the segment reporting structure allows for a more useful presentation and facilitates period-to-period comparison and performance analysis.
The following tables show a reconciliation of each reportable segment as per the information reviewed by the CODM and the reportable segment measured in accordance with IAS 29 and IAS 21 as per the Consolidated Financial Statements for the years ended December 31, 2020, 2019 and 2018.
Adecoagro S.A.
Notes to the Consolidated Financial Statements (Continued)
(All amounts in US$ thousands, except shares and per share data and as otherwise indicated)
3. Segment information (continued)
Segment reconciliation for the year ended December 31, 2020:
| | | | | | | | | | | | | | | | | | | | | | | | | | | | | | | | | | | | | | | | | | | | | | | | | | | | | |
| 2020 |
| Crops | | Rice | | Dairy |
| Total segment reporting | | Adjustment | | Total as per statement of income | | Total segment reporting | | Adjustment | | Total as per statement of income | | Total segment reporting | | Adjustment | | Total as per statement of income |
| Sales of goods sold and services rendered | 170,114 | | | (1,653) | | | 168,461 | | | 102,886 | | | (1,024) | | | 101,862 | | | 135,471 | | | (1,997) | | | 133,474 | |
| Cost of goods and services rendered | (150,745) | | | 1,495 | | | (149,250) | | | (74,395) | | | 565 | | | (73,830) | | | (117,754) | | | 1,747 | | | (116,007) | |
| Initial recognition and changes in fair value of biological assets and agricultural produce | 41,777 | | | (934) | | | 40,843 | | | 19,449 | | | (772) | | | 18,677 | | | 12,638 | | | (294) | | | 12,344 | |
| Gain from changes in net realizable value of agricultural produce after harvest | 7,078 | | | (71) | | | 7,007 | | | 0 | | | 0 | | | 0 | | | (2) | | | 0 | | | (2) | |
| Margin on Manufacturing and Agricultural Activities Before Operating Expenses | 68,224 | | | (1,163) | | | 67,061 | | | 47,940 | | | (1,231) | | | 46,709 | | | 30,353 | | | (544) | | | 29,809 | |
| General and administrative expenses | (6,816) | | | 122 | | | (6,694) | | | (7,045) | | | 146 | | | (6,899) | | | (4,896) | | | 108 | | | (4,788) | |
| Selling expenses | (18,265) | | | 267 | | | (17,998) | | | (14,170) | | | 247 | | | (13,923) | | | (13,824) | | | 284 | | | (13,540) | |
| Other operating income, net | (12,846) | | | (7) | | | (12,853) | | | 731 | | | (18) | | | 713 | | | (189) | | | 3 | | | (186) | |
| Profit from Operations Before Financing and Taxation | 30,297 | | | (781) | | | 29,516 | | | 27,456 | | | (856) | | | 26,600 | | | 11,444 | | | (149) | | | 11,295 | |
| | | | | | | | | | | | | | | | | |
| Depreciation and amortization | (5,397) | | | 111 | | | (5,286) | | | (6,652) | | | 147 | | | (6,505) | | | (6,709) | | | 141 | | | (6,568) | |
| Net (loss) / gain from Fair value adjustment of investment property | 0 | | | 0 | | | 0 | | | 0 | | | 0 | | | 0 | | | 0 | | | 0 | | | 0 | |
| | | | | | | | | | | | | | | | | | | | | | | | | | | | | | | | | | | | | | | | | | | | | | | | | | | | | | | | | | | | | | | | | | | | | | | |
| 2020 |
| All other segments | | Land transformation | | Corporate | | Total |
| Total segment reporting | | Adjustment | | Total as per statement of income | | Total segment reporting | | Adjustment | | Total as per statement of income | | Total segment reporting | | Adjustment | | Total as per statement of income | | Total segment reporting | | Adjustment | | Total as per statement of income |
| Sales of goods sold and services rendered | 2,545 | | | (37) | | | 2,508 | | | 0 | | | 0 | | | 0 | | | 0 | | | 0 | | | 0 | | | 822,475 | | | (4,711) | | | 817,764 | |
| Cost of goods and services rendered | (1,984) | | | 22 | | | (1,962) | | | 0 | | | 0 | | | 0 | | | 0 | | | 0 | | | 0 | | | (615,775) | | | 3,829 | | | (611,946) | |
| Initial recognition and changes in fair value of biological assets and agricultural produce | 1,269 | | | (13) | | | 1,256 | | | 0 | | | 0 | | | 0 | | | 0 | | | 0 | | | 0 | | | 124,742 | | | (2,013) | | | 122,729 | |
| Gain from changes in net realizable value of agricultural produce after harvest | 0 | | | 0 | | | 0 | | | 0 | | | 0 | | | 0 | | | 0 | | | 0 | | | 0 | | | 7,076 | | | (71) | | | 7,005 | |
| Margin on Manufacturing and Agricultural Activities Before Operating Expenses | 1,830 | | | (28) | | | 1,802 | | | 0 | | | 0 | | | 0 | | | 0 | | | 0 | | | 0 | | | 338,518 | | | (2,966) | | | 335,552 | |
| General and administrative expenses | (120) | | | 2 | | | (118) | | | 0 | | | (4) | | | (4) | | | (19,319) | | | 336 | | | (18,983) | | | (54,138) | | | 710 | | | (53,428) | |
| Selling expenses | (217) | | | 3 | | | (214) | | | 0 | | | 0 | | | 0 | | | (202) | | | 7 | | | (195) | | | (95,866) | | | 808 | | | (95,058) | |
| Other operating income, net | 1,069 | | | (2) | | | 1,067 | | | 7,934 | | | (14) | | | 7,920 | | | (161) | | | (8) | | | (169) | | | 2,033 | | | (46) | | | 1,987 | |
| Profit from Operations Before Financing and Taxation | 2,562 | | | (25) | | | 2,537 | | | 7,934 | | | (18) | | | 7,916 | | | (19,682) | | | 335 | | | (19,347) | | | 190,547 | | | (1,494) | | | 189,053 | |
| | | | | | | | | | | | | | | | | | | | | | | |
| Depreciation and amortization | (138) | | | 3 | | | (135) | | | 0 | | | 0 | | | 0 | | | (876) | | | 14 | | | (862) | | | (142,288) | | | 416 | | | (141,872) | |
| Net (loss) / gain from Fair value adjustment of investment property | 1,080 | | | (3) | | | 1,077 | | | 0 | | | 0 | | | 0 | | | 0 | | | 0 | | | 0 | | | 1,080 | | | (3) | | | 1,077 | |
Sugar, Ethanol and Energy segment has not been reconciled due to the lack of difference.
Adecoagro S.A.
Notes to the Consolidated Financial Statements (Continued)
(All amounts in US$ thousands, except shares and per share data and as otherwise indicated)
3. Segment information (continued)
Segment reconciliation for the year ended December 31, 2019:
| | | | | | | | | | | | | | | | | | | | | | | | | | | | | | | | | | | | | | | | | | | | | | | | | | | | | |
| 2019 |
| Crops | | Rice | | Dairy |
| Total segment reporting | | Adjustment | | Total as per statement of income | | Total segment reporting | | Adjustment | | Total as per statement of income | | Total segment reporting | | Adjustment | | Total as per statement of income |
| Sales of goods sold and services rendered | 168,938 | | | (2,492) | | | 166,446 | | | 102,162 | | | (1,006) | | | 101,156 | | | 84,767 | | | (945) | | | 83,822 | |
| Cost of goods and services rendered | (159,197) | | | 2,687 | | | (156,510) | | | (74,480) | | | 529 | | | (73,951) | | | (77,532) | | | 838 | | | (76,694) | |
| Initial recognition and changes in fair value of biological assets and agricultural produce | 30,290 | | | (549) | | | 29,741 | | | 13,194 | | | (979) | | | 12,215 | | | 13,741 | | | (231) | | | 13,510 | |
| Gain from changes in net realizable value of agricultural produce after harvest | 1,542 | | | 283 | | | 1,825 | | | 0 | | | 0 | | | 0 | | | 0 | | | 0 | | | 0 | |
| Margin on Manufacturing and Agricultural Activities Before Operating Expenses | 41,573 | | | (71) | | | 41,502 | | | 40,876 | | | (1,456) | | | 39,420 | | | 20,976 | | | (338) | | | 20,638 | |
| General and administrative expenses | (5,446) | | | (87) | | | (5,533) | | | (6,752) | | | 147 | | | (6,605) | | | (4,188) | | | 90 | | | (4,098) | |
| Selling expenses | (12,852) | | | 128 | | | (12,724) | | | (21,072) | | | 498 | | | (20,574) | | | (6,252) | | | 18 | | | (6,234) | |
| Other operating income, net | (2,283) | | | (225) | | | (2,508) | | | 282 | | | (15) | | | 267 | | | (635) | | | (68) | | | (703) | |
| | | | | | | | | | | | | | | | | |
| Profit from Operations Before Financing and Taxation | 20,992 | | | (255) | | | 20,737 | | | 13,334 | | | (826) | | | 12,508 | | | 9,901 | | | (298) | | | 9,603 | |
| | | | | | | | | | | | | | | | | |
| Depreciation and amortization | (4,662) | | | (137) | | | (4,799) | | | (6,994) | | | 171 | | | (6,823) | | | (5,064) | | | 98 | | | (4,966) | |
| Net (loss) / gain from Fair value adjustment of investment property | 0 | | | 0 | | | 0 | | | 0 | | | 0 | | | 0 | | | 0 | | | 0 | | | 0 | |
| | | | | | | | | | | | | | | | | | | | | | | | | | | | | | | | | | | | | | | | | | | | | | | | | | | | | |
| 2019 |
| All other segments | | Corporate | | Total |
| Total segment reporting | | Adjustment | | Total as per statement of income | | Total segment reporting | | Adjustment | | Total as per statement of income | | Total segment reporting | | Adjustment | | Total as per statement of income |
| Sales of goods sold and services rendered | 3,904 | | | 27 | | | 3,931 | | | 0 | | | 0 | | | 0 | | | 891,554 | | | (4,416) | | | 887,138 | |
| Cost of goods and services rendered | (3,412) | | | (40) | | | (3,452) | | | 0 | | | 0 | | | 0 | | | (675,187) | | | 4,014 | | | (671,173) | |
| Initial recognition and changes in fair value of biological assets and agricultural produce | (40) | | | 53 | | | 13 | | | 0 | | | 0 | | | 0 | | | 70,295 | | | (1,706) | | | 68,589 | |
| Gain from changes in net realizable value of agricultural produce after harvest | 0 | | | 0 | | | 0 | | | 0 | | | 0 | | | 0 | | | 1,542 | | | 283 | | | 1,825 | |
| Margin on Manufacturing and Agricultural Activities Before Operating Expenses | 452 | | | 40 | | | 492 | | | 0 | | | 0 | | | 0 | | | 288,204 | | | (1,825) | | | 286,379 | |
| General and administrative expenses | (167) | | | 17 | | | (150) | | | (19,319) | | | 428 | | | (18,891) | | | (57,797) | | | 595 | | | (57,202) | |
| Selling expenses | (171) | | | (11) | | | (182) | | | (165) | | | 23 | | | (142) | | | (107,628) | | | 656 | | | (106,972) | |
| Other operating income, net | (956) | | | 602 | | | (354) | | | (175) | | | 23 | | | (152) | | | (1,137) | | | 315 | | | (822) | |
| | | | | | | | | | | | | | | | | |
| Profit from Operations Before Financing and Taxation | (842) | | | 648 | | | (194) | | | (19,659) | | | 474 | | | (19,185) | | | 121,642 | | | (259) | | | 121,383 | |
| | | | | | | | | | | | | | | | | |
| Depreciation and amortization | (181) | | | 4 | | | (177) | | | (20) | | | 20 | | | 0 | | | (174,578) | | | 337 | | | (174,241) | |
| Net (loss) / gain from Fair value adjustment of investment property | (927) | | | 602 | | | (325) | | | 0 | | | 0 | | | 0 | | | (927) | | | 602 | | | (325) | |
Sugar, Ethanol and Energy, and Land Transformation segments have not been reconciled due to the lack of differences.
Adecoagro S.A.
Notes to the Consolidated Financial Statements (Continued)
(All amounts in US$ thousands, except shares and per share data and as otherwise indicated)
3. Segment information (continued)
For all the Group’s segments, the primary operating performance measure is “Profit or Loss from Operations” measured in accordance with the procedure outlined above. Total segment assets and liabilities are measured in a manner consistent with that of the Consolidated Financial Statements. These assets and liabilities are allocated based on the operations of the segment and the physical location of the asset.
SegmentThe following tables show a reconciliation of the reportable segments information reviewed by our CODM with the reportable segment information measured in accordance with IAS 29 and IAS 21 as per the Consolidated Financial Statements for all years presented. These tables do not include information for the year ended December 31, 2018:
| | | | | | | | | | | | | | | | | | | | | | | | | | | | | | | | | | | | | | | | | | | | | | | | | | | | | |
| 2018 |
| Crops | | Rice | | Dairy |
| Total segment reporting | | Adjustment | | Total as per statement of income | | Total segment reporting | | Adjustment | | Total as per statement of income | | Total segment reporting | | Adjustment | | Total as per statement of income |
| Sales of goods sold and services rendered | 164,538 | | | (9,120) | | | 155,418 | | | 100,013 | | | (4,610) | | | 95,403 | | | 33,201 | | | (3,491) | | | 29,710 | |
| Cost of goods and services rendered | (165,988) | | | 9,052 | | | (156,936) | | | (75,739) | | | 766 | | | (74,973) | | | (31,488) | | | 3,361 | | | (28,127) | |
| Initial recognition and changes in fair value of biological assets and agricultural produce | 36,422 | | | (7,755) | | | 28,667 | | | 8,967 | | | (4,842) | | | 4,125 | | | 7,295 | | | (1,840) | | | 5,455 | |
| Gain from changes in net realizable value of agricultural produce after harvest | 2,704 | | | (3,613) | | | (909) | | | 0 | | | 0 | | | 0 | | | 0 | | | 0 | | | 0 | |
| Margin on Manufacturing and Agricultural Activities Before Operating Expenses | 37,676 | | | (11,436) | | | 26,240 | | | 33,241 | | | (8,686) | | | 24,555 | | | 9,008 | | | (1,970) | | | 7,038 | |
| General and administrative expenses | (4,239) | | | 37 | | | (4,202) | | | (5,070) | | | (869) | | | (5,939) | | | (2,034) | | | (246) | | | (2,280) | |
| Selling expenses | (5,921) | | | 474 | | | (5,447) | | | (15,465) | | | 1,375 | | | (14,090) | | | (983) | | | 41 | | | (942) | |
| Other operating income, net | 4,799 | | | 1,741 | | | 6,540 | | | 275 | | | (58) | | | 217 | | | (1,055) | | | 58 | | | (997) | |
| | | | | | | | | | | | | | | | | |
| Profit from Operations Before Financing and Taxation | 32,315 | | | (9,184) | | | 23,131 | | | 12,981 | | | (8,238) | | | 4,743 | | | 4,936 | | | (2,117) | | | 2,819 | |
| | | | | | | | | | | | | | | | | |
| Depreciation and amortization | (1,697) | | | (329) | | | (2,026) | | | (5,846) | | | (470) | | | (6,316) | | | (2,253) | | | (280) | | | (2,533) | |
| Net (loss) / gain from Fair value adjustment of investment property | 0 | | | 0 | | | 0 | | | 0 | | | 0 | | | 0 | | | 0 | | | 0 | | | 0 | |
| | | | | | | | | | | | | | | | | | | | | | | | | | | | | | | | | | | | | | | | | | | | | | | | | | | | | |
| 2018 |
| All other segments | | Corporate | | Total |
| Total segment reporting | | Adjustment | | Total as per statement of income | | Total segment reporting | | Adjustment | | Total as per statement of income | | Total segment reporting | | Adjustment | | Total as per statement of income |
| Sales of goods sold and services rendered | 1,919 | | | (149) | | | 1,770 | | | 0 | | | 0 | | | 0 | | | 810,609 | | | (17,370) | | | 793,239 | |
| Cost of goods and services rendered | (1,412) | | | 99 | | | (1,313) | | | 0 | | | 0 | | | 0 | | | (623,243) | | | 13,278 | | | (609,965) | |
| Initial recognition and changes in fair value of biological assets and agricultural produce | (806) | | | (393) | | | (1,199) | | | 0 | | | 0 | | | 0 | | | 31,025 | | | (14,830) | | | 16,195 | |
| Gain from changes in net realizable value of agricultural produce after harvest | 0 | | | 0 | | | 0 | | | 0 | | | 0 | | | 0 | | | 2,704 | | | (3,613) | | | (909) | |
| Margin on Manufacturing and Agricultural Activities Before Operating Expenses | (299) | | | (443) | | | (742) | | | 0 | | | 0 | | | 0 | | | 221,095 | | | (22,535) | | | 198,560 | |
| General and administrative expenses | (155) | | | (9) | | | (164) | | | (19,626) | | | 1,433 | | | (18,193) | | | (56,426) | | | 346 | | | (56,080) | |
| Selling expenses | (165) | | | 16 | | | (149) | | | (178) | | | 33 | | | (145) | | | (92,154) | | | 1,939 | | | (90,215) | |
| Other operating income, net | 10,668 | | | 2,728 | | | 13,396 | | | (167) | | | 36 | | | (131) | | | 99,727 | | | 4,505 | | | 104,232 | |
| | | | | | | | | | | | | | | | | |
| Profit from Operations Before Financing and Taxation | 10,049 | | | 2,292 | | | 12,341 | | | (19,971) | | | 1,502 | | | (18,469) | | | 172,242 | | | (15,745) | | | 156,497 | |
| | | | | | | | | | | | | | | | | |
| Depreciation and amortization | (171) | | | (6) | | | (177) | | | 0 | | | 0 | | | 0 | | | (153,169) | | | (1,085) | | | (154,254) | |
| Net (loss) / gain from Fair value adjustment of investment property | 10,680 | | | 2,729 | | | 13,409 | | | 0 | | | 0 | | | 0 | | | 10,680 | | | 2,729 | | | 13,409 | |
Adecoagro S.A.
Notes to the Consolidated Financial Statements (Continued)
(All amounts in US$ thousands, except shares and per share data and as otherwise indicated)
3. Segment information (continued)
Segment reconciliation for the year ended December 31, 2023:
| | | | | | | | | | | | | | | | | | | | | | | | | | | | | | | | | | | | | | | | | | | | | | | | | | | | | |
| 2023 |
| Crops | | Rice | | Dairy |
| Total segment reporting | | Adjustment | | Total as per statement of income | | Total segment reporting | | Adjustment | | Total as per statement of income | | Total segment reporting | | Adjustment | | Total as per statement of income |
| Sales of goods sold and services rendered | 216,912 | | | (50,659) | | | 166,253 | | | 256,347 | | | (26,155) | | | 230,192 | | | 246,875 | | | (66,756) | | | 180,119 | |
| Cost of goods and services rendered | (188,954) | | | 45,075 | | | (143,879) | | | (178,322) | | | 8,064 | | | (170,258) | | | (209,362) | | | 54,889 | | | (154,473) | |
| Initial recognition and changes in fair value of biological assets and agricultural produce | (4,862) | | | (5,465) | | | (10,327) | | | (2,488) | | | (1,813) | | | (4,301) | | | 14,086 | | | (6,036) | | | 8,050 | |
| Gain from changes in net realizable value of agricultural produce after harvest | 2,730 | | | (736) | | | 1,994 | | | — | | | — | | | — | | | — | | | — | | | — | |
| Margin on Manufacturing and Agricultural Activities Before Operating Expenses | 25,826 | | | (11,785) | | | 14,041 | | | 75,537 | | | (19,904) | | | 55,633 | | | 51,599 | | | (17,903) | | | 33,696 | |
| General and administrative expenses | (14,779) | | | 4,866 | | | (9,913) | | | (15,709) | | | 4,436 | | | (11,273) | | | (10,411) | | | 3,456 | | | (6,955) | |
| Selling expenses | (22,450) | | | 6,336 | | | (16,114) | | | (33,407) | | | 6,958 | | | (26,449) | | | (25,488) | | | 8,312 | | | (17,176) | |
| Other operating income / (expense), net | 20,006 | | | (4,721) | | | 15,285 | | | 7,470 | | | (252) | | | 7,218 | | | 1,872 | | | (960) | | | 912 | |
| | | | | | | | | | | | | | | | | |
| Profit from Operations | 8,603 | | | (5,304) | | | 3,299 | | | 33,891 | | | (8,762) | | | 25,129 | | | 17,572 | | | (7,095) | | | 10,477 | |
| | | | | | | | | | | | | | | | | |
| Depreciation and amortization | (8,330) | | | 2,909 | | | (5,421) | | | (15,154) | | | 4,342 | | | (10,812) | | | (10,913) | | | 3,852 | | | (7,061) | |
| Net (loss) / gain from Fair value adjustment of investment property | 10,199 | | | (650) | | | 9,549 | | | 1,176 | | | (105) | | | 1,071 | | | — | | | — | | | — | |
| | | | | | | | | | | | | | | | | | | | | | | | | | | | | | | | | | | | | | | | | | | | | | | |
| | | | | | | | | | | | | 2023 |
| | | | | Corporate | | Total |
| | | | | | | | | | | | | Total segment reporting | | Adjustment | | Total as per statement of income | | Total segment reporting | | Adjustment | | Total as per statement of income |
| Sales of goods sold and services rendered | | | | | | | | | | | | | — | | | — | | | — | | | 1,442,441 | | | (143,570) | | | 1,298,871 | |
| Cost of goods and services rendered | | | | | | | | | | | | | — | | | — | | | — | | | (1,081,208) | | | 108,028 | | | (973,180) | |
| Initial recognition and changes in fair value of biological assets and agricultural produce | | | | | | | | | | | | | — | | | — | | | — | | | 101,172 | | | (13,314) | | | 87,858 | |
| Gain from changes in net realizable value of agricultural produce after harvest | | | | | | | | | | | | | — | | | — | | | — | | | 2,574 | | | (736) | | | 1,838 | |
| Margin on Manufacturing and Agricultural Activities Before Operating Expenses | | | | | | | | | | | | | — | | | — | | | — | | | 464,979 | | | (49,592) | | | 415,387 | |
| General and administrative expenses | | | | | | | | | | | | | (23,061) | | | 6,473 | | | (16,588) | | | (89,551) | | | 19,231 | | | (70,320) | |
| Selling expenses | | | | | | | | | | | | | (305) | | | 107 | | | (198) | | | (150,805) | | | 21,713 | | | (129,092) | |
| Other operating income / (expense), net | | | | | | | | | | | | | (309) | | | 21 | | | (288) | | | 31,502 | | | (5,912) | | | 25,590 | |
| | | | | | | | | | | | | | | | | | | | | | | |
| Profit from Operations | | | | | | | | | | | | | (23,675) | | | 6,601 | | | (17,074) | | | 256,125 | | | (14,560) | | | 241,565 | |
| | | | | | | | | | | | | | | | | | | | | | | |
| Depreciation and amortization | | | | | | | | | | | | | (1,275) | | | 454 | | | (821) | | | (211,575) | | | 11,557 | | | (200,018) | |
| Net gain / (loss) from Fair value adjustment of investment property | | | | | | | | | | | | | — | | | — | | | — | | | 11,375 | | | (755) | | | 10,620 | |
Adecoagro S.A.
Notes to the Consolidated Financial Statements (Continued)
(All amounts in US$ thousands, except shares and per share data and as otherwise indicated)
3. Segment information (continued)
Segment reconciliation for the year ended December 31, 2022: | | | | | | | | | | | | | | | | | | | | | | | | | | | | | | | | | | | | | | | | | | | | | | | | | | | | | |
| 2022 |
| Crops | | Rice | | Dairy |
| Total segment reporting | | Adjustment | | Total as per statement of income | | Total segment reporting | | Adjustment | | Total as per statement of income | | Total segment reporting | | Adjustment | | Total as per statement of income |
| Sales of goods sold and services rendered | 280,329 | | | (2,578) | | | 277,751 | | | 204,396 | | | (195) | | | 204,201 | | | 236,222 | | | (1,210) | | | 235,012 | |
| Cost of goods and services rendered | (257,925) | | | 2,330 | | | (255,595) | | | (160,047) | | | (379) | | | (160,426) | | | (204,924) | | | 1,039 | | | (203,885) | |
| Initial recognition and changes in fair value of biological assets and agricultural produce | 62,567 | | | 1,494 | | | 64,061 | | | 16,032 | | | 525 | | | 16,557 | | | 27,523 | | | (266) | | | 27,257 | |
| Gain from changes in net realizable value of agricultural produce after harvest | (21,495) | | | 136 | | | (21,359) | | | — | | | — | | | — | | | — | | | — | | | — | |
| Margin on Manufacturing and Agricultural Activities Before Operating Expenses | 63,476 | | | 1,382 | | | 64,858 | | | 60,381 | | | (49) | | | 60,332 | | | 58,821 | | | (437) | | | 58,384 | |
| General and administrative expenses | (13,312) | | | 2 | | | (13,310) | | | (15,487) | | | 173 | | | (15,314) | | | (10,378) | | | 181 | | | (10,197) | |
| Selling expenses | (31,894) | | | 212 | | | (31,682) | | | (34,665) | | | 229 | | | (34,436) | | | (27,050) | | | 76 | | | (26,974) | |
| Other operating income / (expense), net | 463 | | | (804) | | | (341) | | | (507) | | | (37) | | | (544) | | | (8) | | | (3) | | | (11) | |
| Bargain purchase gain on acquisition | — | | | — | | | — | | | 10,070 | | | 37 | | | 10,107 | | | — | | | — | | | — | |
| | | | | | | | | | | | | | | | | |
| Profit from Operations | 18,733 | | | 792 | | | 19,525 | | | 19,792 | | | 353 | | | 20,145 | | | 21,385 | | | (183) | | | 21,202 | |
| | | | | | | | | | | | | | | | | |
| Depreciation and amortization | (8,017) | | | 39 | | | (7,978) | | | (12,215) | | | 98 | | | (12,117) | | | (10,075) | | | 57 | | | (10,018) | |
| Net (loss) / gain from Fair value adjustment of investment property | (2,184) | | | (158) | | | (2,342) | | | (580) | | | (39) | | | (619) | | | — | | | — | | | — | |
| | | | | | | | | | | | | | | | | | | | | | | | | | | | | | | | | | | | | | | | | | | | | | | |
| | | | | | | | | | | | | 2022 |
| | | | | Corporate | | Total |
| | | | | | | | | | | | | Total segment reporting | | Adjustment | | Total as per statement of income | | Total segment reporting | | Adjustment | | Total as per statement of income |
| Sales of goods sold and services rendered | | | | | | | | | | | | | — | | | — | | | — | | | 1,351,707 | | | (3,983) | | | 1,347,724 | |
| Cost of goods and services rendered | | | | | | | | | | | | | — | | | — | | | — | | | (1,078,737) | | | 2,990 | | | (1,075,747) | |
| Initial recognition and changes in fair value of biological assets and agricultural produce | | | | | | | | | | | | | — | | | — | | | — | | | 214,188 | | | 1,753 | | | 215,941 | |
| Gain from changes in net realizable value of agricultural produce after harvest | | | | | | | | | | | | | — | | | — | | | — | | | (22,429) | | | 136 | | | (22,293) | |
| Margin on Manufacturing and Agricultural Activities Before Operating Expenses | | | | | | | | | | | | | — | | | — | | | — | | | 464,729 | | | 896 | | | 465,625 | |
| General and administrative expenses | | | | | | | | | | | | | (23,413) | | | (136) | | | (23,549) | | | (84,507) | | | 220 | | | (84,287) | |
| Selling expenses | | | | | | | | | | | | | (257) | | | (1) | | | (258) | | | (144,031) | | | 516 | | | (143,515) | |
| Other operating income / (expense), net | | | | | | | | | | | | | (136) | | | 21 | | | (115) | | | 2,693 | | | (823) | | | 1,870 | |
| | | | | | | | | | | | | | | | | | | | | | | |
| Bargain purchase gain on acquisition | | | | | | | | | | | | | — | | | — | | | — | | | 10,070 | | | 37 | | | 10,107 | |
| Profit from Operations | | | | | | | | | | | | | (23,806) | | | (116) | | | (23,922) | | | 248,954 | | | 846 | | | 249,800 | |
| | | | | | | | | | | | | | | | | | | | | | | |
| Depreciation and amortization | | | | | | | | | | | | | 22 | | | (29) | | | (7) | | | (191,205) | | | 165 | | | (191,040) | |
| Net (loss) / gain from Fair value adjustment of investment property | | | | | | | | | | | | | — | | | — | | | — | | | (2,764) | | | (197) | | | (2,961) | |
Adecoagro S.A.
Notes to the Consolidated Financial Statements (Continued)
(All amounts in US$ thousands, except shares and per share data and as otherwise indicated)
3. Segment information (continued)
Segment reconciliation for the year ended December 31, 2021:
| | | | | | | | | | | | | | | | | | | | | | | | | | | | | | | | | | | | | | | | | | | | | | | | | | | | | |
| 2021 |
| Crops | | Rice | | Dairy |
| Total segment reporting | | Adjustment | | Total as per statement of income | | Total segment reporting | | Adjustment | | Total as per statement of income | | Total segment reporting | | Adjustment | | Total as per statement of income |
| Sales of goods sold and services rendered | 231,817 | | | 11,975 | | | 243,792 | | | 131,093 | | | 4,403 | | | 135,496 | | | 172,803 | | | 10,251 | | | 183,054 | |
| Cost of goods and services rendered | (206,018) | | | (10,216) | | | (216,234) | | | (109,805) | | | (2,348) | | | (112,153) | | | (149,738) | | | (8,339) | | | (158,077) | |
| Initial recognition and changes in fair value of biological assets and agricultural produce | 65,907 | | | 8,185 | | | 74,092 | | | 38,296 | | | 6,798 | | | 45,094 | | | 18,336 | | | 1,559 | | | 19,895 | |
| Gain from changes in net realizable value of agricultural produce after harvest | (10,163) | | | (1,221) | | | (11,384) | | | — | | | — | | | — | | | — | | | — | | | — | |
| Margin on Manufacturing and Agricultural Activities Before Operating Expenses | 81,543 | | | 8,723 | | | 90,266 | | | 59,584 | | | 8,853 | | | 68,437 | | | 41,401 | | | 3,471 | | | 44,872 | |
| General and administrative expenses | (10,356) | | | (834) | | | (11,190) | | | (8,981) | | | (876) | | | (9,857) | | | (4,715) | | | (541) | | | (5,256) | |
| Selling expenses | (22,107) | | | (1,506) | | | (23,613) | | | (16,709) | | | (1,495) | | | (18,204) | | | (20,779) | | | (1,793) | | | (22,572) | |
| Other operating income / (expense), net | 237 | | | (536) | | | (299) | | | (918) | | | (73) | | | (991) | | | (150) | | | (20) | | | (170) | |
| | | | | | | | | | | | | | | | | |
| Profit from Operations | 49,317 | | | 5,847 | | | 55,164 | | | 32,976 | | | 6,409 | | | 39,385 | | | 15,757 | | | 1,117 | | | 16,874 | |
| | | | | | | | | | | | | | | | | |
| Depreciation and amortization | (6,583) | | | (643) | | | (7,226) | | | (8,173) | | | (820) | | | (8,993) | | | (7,144) | | | (797) | | | (7,941) | |
| Net (loss) / gain from Fair value adjustment of investment property | (2,832) | | | (350) | | | (3,182) | | | (1,052) | | | (97) | | | (1,149) | | | — | | | — | | | — | |
| | | | | | | | | | | | | | | | | | | | | | | | | | | | | | | | | | | | | | | | | | | | | | | |
| | | | | | | | | | | | | 2021 |
| | | | | Corporate | | Total |
| | | | | | | | | | | | | Total segment reporting | | Adjustment | | Total as per statement of income | | Total segment reporting | | Adjustment | | Total as per statement of income |
| Sales of goods sold and services rendered | | | | | | | | | | | | | — | | | — | | | — | | | 1,097,723 | | | 26,629 | | | 1,124,352 | |
| Cost of goods and services rendered | | | | | | | | | | | | | — | | | — | | | — | | | (834,062) | | | (20,903) | | | (854,965) | |
| Initial recognition and changes in fair value of biological assets and agricultural produce | | | | | | | | | | | | | — | | | — | | | — | | | 211,198 | | | 16,542 | | | 227,740 | |
| Gain from changes in net realizable value of agricultural produce after harvest | | | | | | | | | | | | | — | | | — | | | — | | | (11,658) | | | (1,221) | | | (12,879) | |
| Margin on Manufacturing and Agricultural Activities Before Operating Expenses | | | | | | | | | | | | | — | | | — | | | — | | | 463,201 | | | 21,047 | | | 484,248 | |
| General and administrative expenses | | | | | | | | | | | | | (22,119) | | | (1,908) | | | (24,027) | | | (65,635) | | | (4,159) | | | (69,794) | |
| Selling expenses | | | | | | | | | | | | | (306) | | | (21) | | | (327) | | | (112,847) | | | (4,815) | | | (117,662) | |
| Other operating income / (expense), net | | | | | | | | | | | | | 103 | | | (21) | | | 82 | | | (18,118) | | | (650) | | | (18,768) | |
| | | | | | | | | | | | | | | | | | | | | | | |
| Profit from Operations | | | | | | | | | | | | | (22,322) | | | (1,950) | | | (24,272) | | | 266,601 | | | 11,423 | | | 278,024 | |
| | | | | | | | | | | | | | | | | | | | | | | |
| Depreciation and amortization | | | | | | | | | | | | | (738) | | | (49) | | | (787) | | | (166,619) | | | (2,309) | | | (168,928) | |
| Net (loss) / gain from Fair value adjustment of investment property | | | | | | | | | | | | | — | | | — | | | — | | | (3,884) | | | (447) | | | (4,331) | |
Adecoagro S.A.
Notes to the Consolidated Financial Statements (Continued)
(All amounts in US$ thousands, except shares and per share data and as otherwise indicated)
3. Segment information (continued)
The following table presents information with respect to the Group’s reportable segments. Certain other activities of a holding function nature not allocable to the segments are disclosed in the column ‘Corporate’.
Segment analysis for the year ended December 31, 2020:2023:
| | | | | | | | | | | | | | | | | | | | | | | | | | | | | | | | | | | | | | | | | | | | | | | | | | | | | |
| | Farming | | Sugar,
Ethanol and Energy | | Land Transformation | | Corporate | | Total |
| | Crops | | Rice | | Dairy | | All other
segments | | Farming
subtotal | | | | |
| Sales of goods and services rendered | 170,114 | | | 102,886 | | | 135,471 | | | 2,545 | | | 411,016 | | | 411,459 | | | 0 | | | 0 | | | 822,475 | |
| Cost of goods sold and services rendered | (150,745) | | | (74,395) | | | (117,754) | | | (1,984) | | | (344,878) | | | (270,897) | | | 0 | | | 0 | | | (615,775) | |
| Initial recognition and changes in fair value of biological assets and agricultural produce | 41,777 | | | 19,449 | | | 12,638 | | | 1,269 | | | 75,133 | | | 49,609 | | | 0 | | | 0 | | | 124,742 | |
| Changes in net realizable value of agricultural produce after harvest | 7,078 | | | 0 | | | (2) | | | 0 | | | 7,076 | | | 0 | | | 0 | | | 0 | | | 7,076 | |
| Margin on manufacturing and agricultural activities before operating expenses | 68,224 | | | 47,940 | | | 30,353 | | | 1,830 | | | 148,347 | | | 190,171 | | | 0 | | | 0 | | | 338,518 | |
| General and administrative expenses | (6,816) | | | (7,045) | | | (4,896) | | | (120) | | | (18,877) | | | (15,942) | | | 0 | | | (19,319) | | | (54,138) | |
| Selling expenses | (18,265) | | | (14,170) | | | (13,824) | | | (217) | | | (46,476) | | | (49,188) | | | 0 | | | (202) | | | (95,866) | |
| Other operating income, net | (12,846) | | | 731 | | | (189) | | | 1,069 | | | (11,235) | | | 5,495 | | | 7,934 | | | (161) | | | 2,033 | |
| Profit / (loss) from operations before financing and taxation | 30,297 | | | 27,456 | | | 11,444 | | | 2,562 | | | 71,759 | | | 130,536 | | | 7,934 | | | (19,682) | | | 190,547 | |
| | | | | | | | | | | | | | | | | |
| Depreciation and amortization | (5,397) | | | (6,652) | | | (6,709) | | | (138) | | | (18,896) | | | (122,516) | | | 0 | | | (876) | | | (142,288) | |
| Net (loss) / gain from Fair value adjustment of investment property | 0 | | | 0 | | | 0 | | | 1,080 | | | 1,080 | | | 0 | | | 0 | | | 0 | | | 1,080 | |
| Reverse of revaluation surplus derived from the disposals of assets before taxes | 0 | | | 0 | | | 0 | | | 0 | | | 0 | | | 0 | | | 10,198 | | | 0 | | | 10,198 | |
| Initial recognition and changes in fair value of biological assets and agricultural produce (unrealized) | 12,211 | | | 3,975 | | | (5,151) | | | 2,258 | | | 13,293 | | | 19,682 | | | 0 | | | 0 | | | 32,975 | |
| Initial recognition and changes in fair value of biological assets and agricultural produce (realized) | 29,566 | | | 15,474 | | | 17,789 | | | (989) | | | 61,840 | | | 29,927 | | | 0 | | | 0 | | | 91,767 | |
| Changes in net realizable value of agricultural produce after harvest (unrealized) | (481) | | | 0 | | | 0 | | | 0 | | | (481) | | | 0 | | | 0 | | | 0 | | | (481) | |
| Changes in net realizable value of agricultural produce after harvest (realized) | 7,559 | | | 0 | | | (2) | | | 0 | | | 7,557 | | | 0 | | | 0 | | | 0 | | | 7,557 | |
| | | | | | | | | | | | | | | | | |
| Farmlands and farmland improvements, net | 454,212 | | | 141,661 | | | 1,911 | | | 53,902 | | | 651,686 | | | 64,065 | | | 0 | | | 0 | | | 715,751 | |
| Machinery, equipment and other fixed assets, net | 39,517 | | | 18,567 | | | 67,859 | | | 539 | | | 126,482 | | | 153,490 | | | 0 | | | 0 | | | 279,972 | |
| Bearer plants, net | 685 | | | 0 | | | 0 | | | 0 | | | 685 | | | 304,144 | | | 0 | | | 0 | | | 304,829 | |
| Work in progress | 820 | | | 23,381 | | | 18,365 | | | 1,178 | | | 43,744 | | | 13,996 | | | 0 | | | 0 | | | 57,740 | |
| Right of use assest | 4,275 | | | 2,472 | | | 1,288 | | | 0 | | | 8,035 | | | 201,365 | | | 0 | | | 294 | | | 209,694 | |
| Investment property | 0 | | | 0 | | | 0 | | | 31,179 | | | 31,179 | | | 0 | | | 0 | | | 0 | | | 31,179 | |
| Goodwill | 5,720 | | | 792 | | | 3,769 | | | 0 | | | 10,281 | | | 4,201 | | | 0 | | | 0 | | | 14,482 | |
| Biological assets | 47,489 | | | 29,062 | | | 12,933 | | | 4,703 | | | 94,187 | | | 71,506 | | | 0 | | | 0 | | | 165,693 | |
| Finished goods | 30,267 | | | 5,970 | | | 6,489 | | | 0 | | | 42,726 | | | 34,315 | | | 0 | | | 0 | | | 77,041 | |
| Raw materials, stocks held by third parties and others | 21,893 | | | 4,519 | | | 7,377 | | | 318 | | | 34,107 | | | 22,313 | | | 0 | | | 0 | | | 56,420 | |
| Total segment assets | 604,878 | | | 226,424 | | | 119,991 | | | 91,819 | | | 1,043,112 | | | 869,395 | | | 0 | | | 294 | | | 1,912,801 | |
| Borrowings | 37,111 | | | 39,686 | | | 103,742 | | | 0 | | | 180,539 | | | 632,985 | | | 0 | | | 157,566 | | | 971,090 | |
| Lease liabilities | 5,920 | | | 3,063 | | | 1,311 | | | 0 | | | 10,294 | | | 185,155 | | | 0 | | | 323 | | | 195,772 | |
| Total segment liabilities | 43,031 | | | 42,749 | | | 105,053 | | | 0 | | | 190,833 | | | 818,140 | | | 0 | | | 157,889 | | | 1,166,862 | |
Adecoagro S.A.
Notes to the Consolidated Financial Statements (Continued)
(All amounts in US$ thousands, except shares and per share data and as otherwise indicated)
3. Segment information (continued)
Segment analysis for the year ended December 31, 2019
| | | | | | | | | | | | | | | | | | | | | | | | | | | | | | | | | | | | | | | | | | | | | | | | | | | | | |
| | Farming | | Sugar,
Ethanol and Energy | | Land Transformation | | Corporate | | Total |
| | Crops | | Rice | | Dairy | | All other
segments | | Farming
subtotal | | | | |
| Sales of goods and services rendered | 168,938 | | | 102,162 | | | 84,767 | | | 3,904 | | | 359,771 | | | 531,783 | | | 0 | | | 0 | | | 891,554 | |
| Cost of goods sold and services rendered | (159,197) | | | (74,480) | | | (77,532) | | | (3,412) | | | (314,621) | | | (360,566) | | | 0 | | | 0 | | | (675,187) | |
| Initial recognition and changes in fair value of biological assets and agricultural produce | 30,290 | | | 13,194 | | | 13,741 | | | (40) | | | 57,185 | | | 13,110 | | | 0 | | | 0 | | | 70,295 | |
| Changes in net realizable value of agricultural produce after harvest | 1,542 | | | 0 | | | 0 | | | 0 | | | 1,542 | | | 0 | | | 0 | | | 0 | | | 1,542 | |
| Margin on manufacturing and agricultural activities before operating expenses | 41,573 | | | 40,876 | | | 20,976 | | | 452 | | | 103,877 | | | 184,327 | | | 0 | | | 0 | | | 288,204 | |
| General and administrative expenses | (5,446) | | | (6,752) | | | (4,188) | | | (167) | | | (16,553) | | | (21,925) | | | 0 | | | (19,319) | | | (57,797) | |
| Selling expenses | (12,852) | | | (21,072) | | | (6,252) | | | (171) | | | (40,347) | | | (67,116) | | | 0 | | | (165) | | | (107,628) | |
| Other operating income, net | (2,283) | | | 282 | | | (635) | | | (956) | | | (3,592) | | | 126 | | | 2,504 | | | (175) | | | (1,137) | |
| | | | | | | | | | | | | | | | | |
| Profit / (loss) from operations before financing and taxation | 20,992 | | | 13,334 | | | 9,901 | | | (842) | | | 43,385 | | | 95,412 | | | 2,504 | | | (19,659) | | | 121,642 | |
| | | | | | | | | | | | | | | | | |
| Depreciation and amortization | (4,662) | | | (6,994) | | | (5,064) | | | (181) | | | (16,901) | | | (157,657) | | | 0 | | | (20) | | | (174,578) | |
| Net (loss) / gain from Fair value adjustment of investment property | 0 | | | 0 | | | 0 | | | (927) | | | (927) | | | 0 | | | 0 | | | 0 | | | (927) | |
| Reverse of revaluation surplus derived from the disposals of assets before taxes | 0 | | | 0 | | | 0 | | | 0 | | | 0 | | | 0 | | | 8,022 | | | 0 | | | 8,022 | |
| Initial recognition and changes in fair value of biological assets and agricultural produce (unrealized) | 6,091 | | | 509 | | | (3,957) | | | (72) | | | 2,571 | | | (851) | | | 0 | | | 0 | | | 1,720 | |
| Initial recognition and changes in fair value of biological assets and agricultural produce (realized) | 24,199 | | | 12,685 | | | 17,698 | | | 32 | | | 54,614 | | | 13,961 | | | 0 | | | 0 | | | 68,575 | |
| Changes in net realizable value of agricultural produce after harvest (unrealized) | (481) | | | 0 | | | 0 | | | 0 | | | (481) | | | 0 | | | 0 | | | 0�� | | | (481) | |
| Changes in net realizable value of agricultural produce after harvest (realized) | 2,023 | | | 0 | | | 0 | | | 0 | | | 2,023 | | | 0 | | | 0 | | | 0 | | | 2,023 | |
| | | | | | | | | | | | | | | | | |
| Farmlands and farmland improvements, net | 474,922 | | | 142,864 | | | 611 | | | 52,874 | | | 671,271 | | | 63,594 | | | 0 | | | 0 | | | 734,865 | |
| Machinery, equipment and other fixed assets, net | 29,038 | | | 25,425 | | | 74,403 | | | 507 | | | 129,373 | | | 316,304 | | | 0 | | | 0 | | | 445,677 | |
| Bearer plants, net | 592 | | | 0 | | | 0 | | | 0 | | | 592 | | | 252,928 | | | 0 | | | 0 | | | 253,520 | |
| Work in progress | 11,457 | | | 15,669 | | | 15,394 | | | 1,214 | | | 43,734 | | | 15,424 | | | 0 | | | 0 | | | 59,158 | |
| Right of use assets | 4,378 | | | 567 | | | 371 | | | 0 | | | 5,316 | | | 231,832 | | | 0 | | | 905 | | | 238,053 | |
| Investment property | 0 | | | 0 | | | 0 | | | 34,295 | | | 34,295 | | | 0 | | | 0 | | | 0 | | | 34,295 | |
| Goodwill | 9,896 | | | 3,890 | | | 0 | | | 817 | | | 14,603 | | | 5,417 | | | 0 | | | 0 | | | 20,020 | |
| Biological assets | 38,404 | | | 21,484 | | | 11,521 | | | 3,673 | | | 75,082 | | | 55,354 | | | 0 | | | 0 | | | 130,436 | |
| Finished goods | 17,830 | | | 5,805 | | | 4,779 | | | 0 | | | 28,414 | | | 36,864 | | | 0 | | | 0 | | | 65,278 | |
| Raw materials,Stocks held by third parties and others | 17,187 | | | 4,876 | | | 5,156 | | | 90 | | | 27,309 | | | 20,203 | | | 0 | | | 0 | | | 47,512 | |
| Total segment assets | 603,704 | | | 220,580 | | | 112,235 | | | 93,470 | | | 1,029,989 | | | 997,920 | | | 0 | | | 905 | | | 2,028,814 | |
| Borrowings | 28,045 | | | 45,602 | | | 100,262 | | | 0 | | | 173,909 | | | 612,329 | | | 0 | | | 182,042 | | | 968,280 | |
| Lease liabilities | 4,857 | | | 490 | | | 378 | | | 0 | | | 5,725 | | | 209,700 | | | 0 | | | 959 | | | 216,384 | |
| Total segment liabilities | 32,902 | | | 46,092 | | | 100,640 | | | 0 | | | 179,634 | | | 822,029 | | | 0 | | | 183,001 | | | 1,184,664 | |
Adecoagro S.A.
Notes to the Consolidated Financial Statements (Continued)
(All amounts in US$ thousands, except shares and per share data and as otherwise indicated)
3. Segment information (continued)
Segment analysis for the year ended December 31, 2018
| | | | | | | | | | | | | | | | | | | | | | | | | | | | | | | | | | | | | | | | | | | | | | | | | | | | | |
| | Farming | | Sugar,
Ethanol and Energy | | Land Transformation | | Corporate | | Total |
| | Crops | | Rice | | Dairy | | All other
segments | | Farming
subtotal | | | | |
| Sales of goods and services rendered | 164,538 | | | 100,013 | | | 33,201 | | | 1,919 | | | 299,671 | | | 510,938 | | | 0 | | | 0 | | | 810,609 | |
| Cost of goods sold and services rendered | (165,988) | | | (75,739) | | | (31,488) | | | (1,412) | | | (274,627) | | | (348,616) | | | 0 | | | 0 | | | (623,243) | |
| Initial recognition and changes in fair value of biological assets and agricultural produce | 36,422 | | | 8,967 | | | 7,295 | | | (806) | | | 51,878 | | | (20,853) | | | 0 | | | 0 | | | 31,025 | |
| Changes in net realizable value of agricultural produce after harvest | 2,704 | | | 0 | | | 0 | | | 0 | | | 2,704 | | | 0 | | | 0 | | | 0 | | | 2,704 | |
| Margin on manufacturing and agricultural activities before operating expenses | 37,676 | | | 33,241 | | | 9,008 | | | (299) | | | 79,626 | | | 141,469 | | | 0 | | | 0 | | | 221,095 | |
| General and administrative expenses | (4,239) | | | (5,070) | | | (2,034) | | | (155) | | | (11,498) | | | (25,302) | | | 0 | | | (19,626) | | | (56,426) | |
| Selling expenses | (5,921) | | | (15,465) | | | (983) | | | (165) | | | (22,534) | | | (69,442) | | | 0 | | | (178) | | | (92,154) | |
| Other operating income, net | 4,799 | | | 275 | | | (1,055) | | | 10,668 | | | 14,687 | | | 48,357 | | | 36,850 | | | (167) | | | 99,727 | |
| Profit / (loss) from operations before financing and taxation | 32,315 | | | 12,981 | | | 4,936 | | | 10,049 | | | 60,281 | | | 95,082 | | | 36,850 | | | (19,971) | | | 172,242 | |
| | | | | | | | | | | | | | | | | |
| Depreciation and amortization | (1,697) | | | (5,846) | | | (2,253) | | | (171) | | | (9,967) | | | (143,202) | | | 0 | | | 0 | | | (153,169) | |
| Net (loss) / gain from Fair value adjustment of investment property | 0 | | | 0 | | | 0 | | | 10,680 | | | 10,680 | | | 0 | | | 0 | | | 0 | | | 10,680 | |
| Initial recognition and changes in fair value of biological assets and agricultural produce (unrealized) | 8,205 | | | (181) | | | (599) | | | 102 | | | 7,527 | | | (37,808) | | | 0 | | | 0 | | | (30,281) | |
| Initial recognition and changes in fair value of biological assets and agricultural produce (realized) | 28,217 | | | 9,148 | | | 7,894 | | | (908) | | | 44,351 | | | 16,955 | | | 0 | | | 0 | | | 61,306 | |
| Changes in net realizable value of agricultural produce after harvest (unrealized) | (647) | | | 0 | | | 0 | | | 0 | | | (647) | | | 0 | | | 0 | | | 0 | | | (647) | |
| Changes in net realizable value of agricultural produce after harvest (realized) | 3,351 | | | 0 | | | 0 | | | 0 | | | 3,351 | | | 0 | | | 0 | | | 0 | | | 3,351 | |
Total segment assets and liabilities are measured in a manner consistent with that of the Consolidated Financial Statements. These assets and liabilities are allocated based on the operations of the segment and the physical location of the asset.
Adecoagro S.A.
Notes to the Consolidated Financial Statements (Continued)
(All amounts in US$ thousands, except shares and per share data and as otherwise indicated)
3. Segment information (continued)
Total reportable segments’ assets and liabilities are reconciled to total assets as per the statement of financial position as follows:
| | | | | | | | | | | |
| | 2020 | | 2019 |
| Total reportable assets as per segment information | 1,912,801 | | | 2,028,814 | |
| Intangible assets (excluding goodwill) | 12,448 | | | 13,659 | |
| Deferred income tax assets | 19,821 | | | 13,664 | |
| Trade and other receivables | 197,928 | | | 172,331 | |
| Other assets | 854 | | | 1,128 | |
| Derivative financial instruments | 2,102 | | | 1,435 | |
| Cash and cash equivalents | 336,282 | | | 290,276 | |
| Total assets as per the statement of financial position | 2,482,236 | | | 2,521,307 | |
| | | | | | | | | | | |
| | 2020 | | 2019 |
| Total reportable liabilities as per segment information | 1,166,862 | | | 1,184,664 | |
| Trade and other payables | 126,605 | | | 110,486 | |
| Deferred income tax liabilities | 182,377 | | | 165,508 | |
| Payroll and social liabilities | 24,408 | | | 26,417 | |
| Provisions for other liabilities | 4,359 | | | 3,172 | |
| Current income tax liabilities | 760 | | | 754 | |
| Derivative financial instruments | 13,141 | | | 1,423 | |
| Total liabilities as per the statement of financial position | 1,518,512 | | | 1,492,424 | |
Non-current assets and revenues and fair value gains and losses are shown by geographic region. These are the regions in which the Group is active: Argentina, Brazil and Uruguay.
As of and for the year ended December 31, 2020:
| | | | Argentina | | Brazil | | Uruguay | | Total |
| Property, plant and equipment | 811,653 | | | 535,857 | | | 10,782 | | | 1,358,292 | |
| | |
| | | Farming | | Sugar,
Ethanol and Energy | | | | Corporate | | Total |
| | |
| Sales of goods and services rendered | |
| Sales of goods and services rendered | |
| Sales of goods and services rendered | |
| Cost of goods sold and services rendered | |
| Initial recognition and changes in fair value of biological assets and agricultural produce | |
| Changes in net realizable value of agricultural produce after harvest | |
| Margin on manufacturing and agricultural activities before operating expenses | |
| General and administrative expenses | |
| Selling expenses | |
| Other operating income / (expense), net | |
| | Profit / (loss) from operations | |
| Profit / (loss) from operations | |
| Profit / (loss) from operations | |
| | Depreciation and amortization | |
| Depreciation and amortization | |
| Depreciation and amortization | |
| Net gain from Fair value adjustment of investment property | |
| Reverse of revaluation surplus derived from the disposals of assets before taxes | |
| Initial recognition and changes in fair value of biological assets and agricultural produce (unrealized) | |
| Initial recognition and changes in fair value of biological assets and agricultural produce (realized) | |
| | Changes in net realizable value of agricultural produce after harvest (unrealized) | |
| Changes in net realizable value of agricultural produce after harvest (unrealized) | |
| Changes in net realizable value of agricultural produce after harvest (unrealized) | |
| Changes in net realizable value of agricultural produce after harvest (realized) | |
| | Farmlands and farmland improvements, net | |
| Farmlands and farmland improvements, net | |
| Farmlands and farmland improvements, net | |
| Machinery, equipment and other fixed assets, net | |
| Bearer plants, net | |
| Work in progress | |
| Right of use assets | |
| Investment property | Investment property | 31,179 | | | 0 | | | 0 | | | 31,179 | |
| Goodwill | Goodwill | 10,280 | | | 4,202 | | | 0 | | | 14,482 | |
| Non-current portion of biological assets | 14,725 | | | 0 | | | 0 | | | 14,725 | |
| | Sales of goods and services rendered | 389,018 | | | 411,779 | | | 21,678 | | | 822,475 | |
| Initial recognition and changes in fair value of biological assets and agricultural produce | 72,391 | | | 50,348 | | | 2,003 | | | 124,742 | |
| Changes in net realizable value of agricultural produce after harvest | 6,770 | | | (88) | | | 394 | | | 7,076 | |
| Biological assets | |
| Finished goods | |
| Raw materials, stocks held by third parties and others | |
| Total segment assets | |
| Borrowings | |
| Lease liabilities | |
| Total segment liabilities | |
Adecoagro S.A.
Notes to the Consolidated Financial Statements (Continued)
(All amounts in US$ thousands, except shares and per share data and as otherwise indicated)
3. Segment information (continued)
As of and
Segment analysis for the year ended December 31, 2019:2022
| | | | Argentina | | Brazil | | Uruguay | | Total |
| Property, plant and equipment | 834,248 | | | 648,471 | | | 10,501 | | | 1,493,220 | |
| | |
| | | Farming | | Sugar,
Ethanol and Energy | | | | Corporate | | Total |
| | |
| Sales of goods and services rendered | |
| Sales of goods and services rendered | |
| Sales of goods and services rendered | |
| Cost of goods sold and services rendered | |
| Initial recognition and changes in fair value of biological assets and agricultural produce | |
| Changes in net realizable value of agricultural produce after harvest | |
| Margin on manufacturing and agricultural activities before operating expenses | |
| General and administrative expenses | |
| Selling expenses | |
| Other operating income / (expense), net | |
| Bargain purchase gain on acquisition | |
| | Profit / (loss) from operations | |
| Profit / (loss) from operations | |
| Profit / (loss) from operations | |
| | Depreciation and amortization | |
| Depreciation and amortization | |
| Depreciation and amortization | |
| Net loss from Fair value adjustment of investment property | |
| | Initial recognition and changes in fair value of biological assets and agricultural produce (unrealized) | |
| Initial recognition and changes in fair value of biological assets and agricultural produce (unrealized) | |
| Initial recognition and changes in fair value of biological assets and agricultural produce (unrealized) | |
| Initial recognition and changes in fair value of biological assets and agricultural produce (realized) | |
| Changes in net realizable value of agricultural produce after harvest (unrealized) | |
| Changes in net realizable value of agricultural produce after harvest (realized) | |
| | Farmlands and farmland improvements, net | |
| Farmlands and farmland improvements, net | |
| Farmlands and farmland improvements, net | |
| Machinery, equipment and other fixed assets, net | |
| Bearer plants, net | |
| Work in progress | |
| Right of use assets | |
| Investment property | Investment property | 34,295 | | | 0 | | | 0 | | | 34,295 | |
| Goodwill | Goodwill | 14,603 | | | 5,417 | | | 0 | | | 20,020 | |
| Non-current portion of biological assets | 13,303 | | | 0 | | | 0 | | | 13,303 | |
| | Sales of goods and services rendered | 229,547 | | | 462,174 | | | 199,833 | | | 891,554 | |
| Initial recognition and changes in fair value of biological assets and agricultural produce | 55,760 | | | 13,167 | | | 1,368 | | | 70,295 | |
| Changes in net realizable value of agricultural produce after harvest | 2,682 | | | (8) | | | (1,132) | | | 1,542 | |
| Biological assets | |
| Finished goods | |
| Raw materials, stocks held by third parties and others | |
| Total segment assets | |
| Borrowings | |
| Lease liabilities | |
| Total segment liabilities | |
Adecoagro S.A.
Notes to the Consolidated Financial Statements (Continued)
(All amounts in US$ thousands, except shares and per share data and as otherwise indicated)
3. Segment information (continued)
Segment analysis for the year ended December 31, 2021
| | | | | | | | | | | | | | | | | | | | | | | | | | | | | | | | | | | | | | | | | | | | | |
| | Farming | | Sugar,
Ethanol and Energy | | | | Corporate | | Total |
| | Crops | | Rice | | Dairy | | | | Farming
subtotal | | | | |
| Sales of goods and services rendered | 231,817 | | | 131,093 | | | 172,803 | | | | | 535,713 | | | 562,010 | | | | | — | | | 1,097,723 | |
| Cost of goods sold and services rendered | (206,018) | | | (109,805) | | | (149,738) | | | | | (465,561) | | | (368,501) | | | | | — | | | (834,062) | |
| Initial recognition and changes in fair value of biological assets and agricultural produce | 65,907 | | | 38,296 | | | 18,336 | | | | | 122,539 | | | 88,659 | | | | | — | | | 211,198 | |
| Changes in net realizable value of agricultural produce after harvest | (10,163) | | | — | | | — | | | | | (10,163) | | | (1,495) | | | | | — | | | (11,658) | |
| Margin on manufacturing and agricultural activities before operating expenses | 81,543 | | | 59,584 | | | 41,401 | | | | | 182,528 | | | 280,673 | | | | | — | | | 463,201 | |
| General and administrative expenses | (10,356) | | | (8,981) | | | (4,715) | | | | | (24,052) | | | (19,464) | | | | | (22,119) | | | (65,635) | |
| Selling expenses | (22,107) | | | (16,709) | | | (20,779) | | | | | (59,595) | | | (52,946) | | | | | (306) | | | (112,847) | |
| Other operating income / (expense), net | 237 | | | (918) | | | (150) | | | | | (831) | | | (17,390) | | | | | 103 | | | (18,118) | |
| Profit / (loss) from operations | 49,317 | | | 32,976 | | | 15,757 | | | | | 98,050 | | | 190,873 | | | | | (22,322) | | | 266,601 | |
| | | | | | | | | | | | | | | | | |
| Depreciation and amortization | (6,583) | | | (8,173) | | | (7,144) | | | | | (21,900) | | | (143,981) | | | | | (738) | | | (166,619) | |
| Net loss from Fair value adjustment of investment property | (2,832) | | | (1,052) | | | — | | | | | (3,884) | | | — | | | | | — | | | (3,884) | |
| | | | | | | | | | | | | | | | | |
| Initial recognition and changes in fair value of biological assets and agricultural produce (unrealized) | 21,428 | | | 5,992 | | | (6,271) | | | | | 21,149 | | | (16,294) | | | | | — | | | 4,855 | |
| Initial recognition and changes in fair value of biological assets and agricultural produce (realized) | 44,479 | | | 32,304 | | | 24,607 | | | | | 101,390 | | | 104,953 | | | | | — | | | 206,343 | |
| Changes in net realizable value of agricultural produce after harvest (unrealized) | (4,001) | | | — | | | — | | | | | (4,001) | | | — | | | | | — | | | (4,001) | |
| Changes in net realizable value of agricultural produce after harvest (realized) | (6,162) | | | — | | | — | | | | | (6,162) | | | (1,495) | | | | | — | | | (7,657) | |
Total reportable segments’ assets and liabilities are reconciled to total assets as per the statement of financial position as follows:
| | | | | | | | | | | |
| | 2023 | | 2022 |
| Total reportable assets as per segment information | 2,488,039 | | | 2,517,876 | |
| Intangible assets (excluding goodwill) | 13,210 | | | 17,576 | |
| Deferred income tax assets | 9,777 | | | 8,758 | |
| Trade and other receivables | 218,115 | | | 228,378 | |
| Other assets | 1,515 | | | 1,701 | |
| Derivative financial instruments | 31,820 | | | 5,342 | |
| Short-term investment | 62,637 | | | 98,571 | |
| Cash and cash equivalents | 339,781 | | | 230,653 | |
| Total assets as per the statement of financial position | 3,164,894 | | | 3,108,855 | |
| | | | | | | | | | | |
| | 2023 | | 2022 |
| Total reportable liabilities as per segment information | 1,283,459 | | | 1,345,732 | |
| Trade and other payables | 191,738 | | | 259,607 | |
| Deferred income tax liabilities | 376,331 | | | 301,414 | |
| Payroll and social liabilities | 38,927 | | | 31,545 | |
| Provisions for other liabilities | 3,599 | | | 3,435 | |
| Current income tax liabilities | 5,023 | | | 422 | |
| Derivative financial instruments | 169 | | | 3,057 | |
| Total liabilities as per the statement of financial position | 1,899,246 | | | 1,945,212 | |
.
Adecoagro S.A.
Notes to the Consolidated Financial Statements (Continued)
(All amounts in US$ thousands, except shares and per share data and as otherwise indicated)
3. Segment information (continued)
Non-current assets and revenues and fair value gains and losses are shown by geographic region. These are the regions in which the Group is active: Argentina, Brazil, Uruguay and others.
As of and for the year ended December 31, 2018:2023:
| | | | Argentina | | Brazil | | Uruguay | | Total | | Argentina | | Brazil | | Uruguay | | Chile | | Total |
| Property, plant and equipment | |
| Investment property | |
| Goodwill | |
| Non-current portion of biological assets | |
| | Sales of goods and services rendered | |
| Sales of goods and services rendered | |
| Sales of goods and services rendered | Sales of goods and services rendered | 207,480 | | | 496,966 | | | 106,163 | | | 810,609 | |
| Initial recognition and changes in fair value of biological assets and agricultural produce | Initial recognition and changes in fair value of biological assets and agricultural produce | 45,985 | | | (13,541) | | | (1,419) | | | 31,025 | |
| Changes in net realizable value of agricultural produce after harvest | Changes in net realizable value of agricultural produce after harvest | 1,148 | | | 1,436 | | | 120 | | | 2,704 | |
As of and for the year ended December 31, 2022:
| | | | | | | | | | | | | | | | | | | | | | | | | | | | | |
| | Argentina | | Brazil | | Uruguay | | Chile | | Total |
| Property, plant and equipment | 914,444 | | | 620,065 | | | 30,846 | | | — | | | 1,565,355 | |
| Investment property | 33,330 | | | — | | | — | | | — | | | 33,330 | |
| Goodwill | 14,359 | | | 4,185 | | | — | | | — | | | 18,544 | |
| Non-current portion of biological assets | 30,622 | | | — | | | — | | | — | | | 30,622 | |
| | | | | | | | | |
| Sales of goods and services rendered | 373,746 | | | 494,215 | | | 472,538 | | | 11,208 | | | 1,351,707 | |
| Initial recognition and changes in fair value of biological assets and agricultural produce | 102,656 | | | 108,066 | | | 3,466 | | | — | | | 214,188 | |
| Changes in net realizable value of agricultural produce after harvest | (21,482) | | | (934) | | | (13) | | | — | | | (22,429) | |
As of and for the year ended December 31, 2021:
| | | | | | | | | | | | | | | | | | | | | | | | | | | | | |
| | Argentina | | Brazil | | Uruguay | | Chile | | Total |
| Sales of goods and services rendered | 284,026 | | | 385,959 | | | 427,661 | | | 77 | | | 1,097,723 | |
| Initial recognition and changes in fair value of biological assets and agricultural produce | 120,255 | | | 88,659 | | | 2,284 | | | — | | | 211,198 | |
| Changes in net realizable value of agricultural produce after harvest | (9,679) | | | (1,496) | | | (483) | | | — | | | (11,658) | |
Adecoagro S.A.
Notes to the Consolidated Financial Statements (Continued)
(All amounts in US$ thousands, except shares and per share data and as otherwise indicated)
4. Sales
| | | | 2020 | | 2019 | | 2018 | | 2023 | | 2022 | | 2021 |
| Manufactured products and services rendered: | Manufactured products and services rendered: | | | | | | Manufactured products and services rendered: | | | |
| Ethanol | Ethanol | 199,062 | | | 373,847 | | | 324,661 | |
| Sugar | Sugar | 171,102 | | | 97,710 | | | 128,377 | |
| Energy | 42,756 | | | 60,913 | | | 57,797 | |
| Energy (*) | |
| | Peanut | |
| Peanut | |
| Peanut | Peanut | 46,708 | | | 28,928 | | | 0 | |
| Sunflower | Sunflower | 10,433 | | | 7,534 | | | 0 | |
| Cotton | Cotton | 1,969 | | | 623 | | | 0 | |
| Rice | 96,397 | | | 97,515 | | | 92,560 | |
| Rice (*) | |
| Fluid milk (UHT) | Fluid milk (UHT) | 54,380 | | | 38,441 | | | 0 | |
| Powder milk | 40,500 | | | 20,722 | | | 8,646 | |
| Other diary products | 17,205 | | | 8,856 | | | 0 | |
| Soybean oil and meal | 0 | | | 1,062 | | | 14,059 | |
| Powder milk (*) | |
| Other diary products (*) | |
| | Services | |
| Services | |
| Services | Services | 4,774 | | | 4,521 | | | 487 | |
| Rental income | Rental income | 584 | | | 564 | | | 643 | |
| Others | Others | 5,623 | | | 3,401 | | | 7,826 | |
| | | 691,493 | | | 744,637 | | | 635,056 | |
| Agricultural produce and biological assets: | Agricultural produce and biological assets: | | | | | | Agricultural produce and biological assets: | | | |
| Soybean | Soybean | 44,271 | | | 44,538 | | | 66,471 | |
| Corn | Corn | 44,475 | | | 59,714 | | | 33,106 | |
| Wheat | Wheat | 14,457 | | | 18,733 | | | 30,091 | |
| Peanut | 0 | | | 0 | | | 1,752 | |
| Rice | |
| | Sunflower | |
| Sunflower | |
| Sunflower | Sunflower | 633 | | | 701 | | | 1,314 | |
| Barley | Barley | 275 | | | 1,085 | | | 1,203 | |
| Seeds | Seeds | 1,732 | | | 734 | | | 461 | |
| Milk | 12,817 | | | 9,977 | | | 19,267 | |
| Raw milk | |
| Cattle | Cattle | 1,959 | | | 3,452 | | | 1,279 | |
| Cattle for dairy | Cattle for dairy | 2,729 | | | 2,169 | | | 1,612 | |
| Others | Others | 2,923 | | | 1,398 | | | 1,627 | |
| 126,271 | | | 142,501 | | | 158,183 | |
| 111,473 | |
| Total sales | Total sales | 817,764 | | | 887,138 | | | 793,239 | |
(*) Includes sales of mwh of energy, tons rice and crops products produced by third parties for an amount of US$2.4 million, US$22.3 million and US$0.8 million respectively (December 31, 2022: sales of mwh of energy, tons rice and power milk US$2.3 million, US$0.9 million and US$1.3 million, respectively and December 31, 2021: sales of mwh of energy, tons rice and butter US$6.5 million, US$4.4 million and US$0.6 million, respectively).
Commitments to sell commodities at a future date
The Group entered into contracts to sell non-financial instruments, mainly sugar, soybean and corn through sales forward contracts. Those contracts are held for purposes of delivery of the non-financial instrument in accordance with the Group’s expected sales. Accordingly, as the own use exception criteria are met;met, those contracts are not recorded as derivatives.
The notional amount of these contracts is US$ 42.273.5 million as of December 31, 2020 (2019:2023 (2022: US$ 71.789.9 million; 2018:2021: US$ 63.375.9 million) and comprised primarily of 3,4199,225 thousand tons of sugar (US$ 5.2 million), 28,534 thousand m3 of ethanol (US$ 1.715.3 million), 698,868539,712 thousand mwh of energy (US$ 30.327.6 million), 9,04553,600 thousand tons of soybean (U$S 2.5(US$17.8 million), 15,51717,208 thousand tons of wheat (US$ 3.14.2 million), and 23,24216,155 thousand tons of corn (US$ 3.43.1 million) which expire between January and December 2021.2024.
Adecoagro S.A.
Notes to the Consolidated Financial Statements (Continued)
(All amounts in US$ thousands, except shares and per share data and as otherwise indicated)
5. Cost of goods sold and services rendered
As ofFor the year ended December 31, 2020:31:
| | | | 2020 |
| | | Crops | | Rice | | Dairy | | All other
segments | | Sugar,
Ethanol and
Energy | | Total |
| Finish goods at the beginning of 2020 (Note 20) | 17,830 | | | 5,805 | | | 4,779 | | | 0 | | | 36,864 | | | 65,278 | |
| | | 2023 |
| | | | Crops | | Rice | | Dairy | | | | Sugar,
Ethanol and
Energy | | Total |
| Finished goods at the beginning of year (Note 19) | |
| Cost of production of manufactured products (Note 6) | Cost of production of manufactured products (Note 6) | 44,074 | | | 79,507 | | | 102,933 | | | 0 | | | 285,627 | | | 512,141 | |
| Purchases | Purchases | 3,648 | | | 0 | | | 0 | | | 0 | | | 6,088 | | | 9,736 | |
| | Agricultural produce | |
| Agricultural produce | |
| Agricultural produce | Agricultural produce | 137,204 | | | 0 | | | 15,546 | | | 1,962 | | | 0 | | | 154,712 | |
| Transfer to raw material | Transfer to raw material | (46,192) | | | (4,256) | | | 0 | | | 0 | | | 0 | | | (50,448) | |
| Direct agricultural selling expenses | Direct agricultural selling expenses | 16,467 | | | 0 | | | 0 | | | 0 | | | 0 | | | 16,467 | |
| Tax recoveries (i) | Tax recoveries (i) | 0 | | | 0 | | | 0 | | | 0 | | | (21,765) | | | (21,765) | |
| Changes in net realizable value of agricultural produce after harvest | Changes in net realizable value of agricultural produce after harvest | 7,007 | | | 0 | | | (2) | | | 0 | | | 0 | | | 7,005 | |
| Finished goods at the end of December 31, 2020 (Note 20) | (30,267) | | | (5,970) | | | (6,489) | | | 0 | | | (34,315) | | | (77,041) | |
| | Loss of idle capacity | |
| Loss of idle capacity | |
| Loss of idle capacity | |
| | Finished goods at the end of the year (Note 19) | |
| | Finished goods at the end of the year (Note 19) | |
| | Finished goods at the end of the year (Note 19) | |
| Exchange differences | Exchange differences | (521) | | | (1,256) | | | (760) | | | 0 | | | (1,602) | | | (4,139) | |
| Cost of goods sold and services rendered, and direct agricultural selling expenses | 149,250 | | | 73,830 | | | 116,007 | | | 1,962 | | | 270,897 | | | 611,946 | |
| Cost of goods sold and services rendered | |
(i) Correspond to the presumed credit of ICMS (Imposto sobre Circulação de Mercadorias e Prestação de Serviços) over the sale values.
As ofFor the year ended December 31, 2019:31:
| | | | 2019 |
| | | Crops | | Rice | | Dairy | | All other
segments | | Sugar,
Ethanol and
Energy | | Total |
| Finished goods at the beginning of 2019 | 29,144 | | | 9,507 | | | 1,170 | | | 0 | | | 39,937 | | | 79,758 | |
| | | 2022 |
| | | | Crops | | Rice | | Dairy | | | | Sugar,
Ethanol and
Energy | | Total |
| Finished goods at the beginning of year | |
| | Cost of production of manufactured products (Note 6) | Cost of production of manufactured products (Note 6) | 33,952 | | | 66,386 | | | 68,851 | | | 0 | | | 354,964 | | | 524,153 | |
| Cost of production of manufactured products (Note 6) | |
| Cost of production of manufactured products (Note 6) | |
| Purchases | Purchases | 21,715 | | | 3,095 | | | 0 | | | 0 | | | 44,577 | | | 69,387 | |
| Acquisition of subsidiaries | |
| Agricultural produce | Agricultural produce | 108,732 | | | 0 | | | 12,146 | | | 3,452 | | | 0 | | | 124,330 | |
| Transfer to raw material | Transfer to raw material | (35,757) | | | 0 | | | 0 | | | 0 | | | 0 | | | (35,757) | |
| Direct agricultural selling expenses | Direct agricultural selling expenses | 15,752 | | | 0 | | | 0 | | | 0 | | | 0 | | | 15,752 | |
| Tax recoveries (i) | Tax recoveries (i) | 0 | | | 0 | | | 0 | | | 0 | | | (32,995) | | | (32,995) | |
| Changes in net realizable value of agricultural produce after harvest | Changes in net realizable value of agricultural produce after harvest | 1,825 | | | 0 | | | 0 | | | 0 | | | 0 | | | 1,825 | |
| Finished goods at the end of December 31, 2019 (Note 20) | (17,830) | | | (5,805) | | | (4,779) | | | 0 | | | (36,864) | | | (65,278) | |
| Loss of idle capacity | |
| Finished goods at the end of the year (Note 19) | |
| Exchange differences | Exchange differences | (1,023) | | | 768 | | | (694) | | | 0 | | | (9,053) | | | (10,002) | |
| Cost of goods sold and services rendered, and direct agricultural selling expenses | 156,510 | | | 73,951 | | | 76,694 | | | 3,452 | | | 360,566 | | | 671,173 | |
| Cost of goods sold and services rendered | |
(i) Correspond to the presumed credit of ICMS (Imposto sobre Circulação de Mercadorias e Prestação de Serviços) over the sale values.
Adecoagro S.A.
Notes to the Consolidated Financial Statements (Continued)
(All amounts in US$ thousands, except shares and per share data and as otherwise indicated)
5. Cost of goods sold and services rendered (continued)
As ofFor the year ended December 31, 2018:31:
| | | | 2018 |
| | | Crops | | Rice | | Dairy | | All other
segments | | Sugar,
Ethanol and
Energy | | Total |
| Finished goods at the beginning of 2018 | 21,146 | | | 8,476 | | | 0 | | | 0 | | | 32,266 | | | 61,888 | |
| Adjustment of opening net book amount for the application of IAS 29 | 42 | | | 1,354 | | | 0 | | | 0 | | | 0 | | | 1,396 | |
| | | 2021 |
| | | | Crops | | Rice | | Dairy | | | | Sugar,
Ethanol and
Energy | | Total |
| Finished goods at the beginning of year | |
| | Cost of production of manufactured products (Note 6) | |
| Cost of production of manufactured products (Note 6) | |
| Cost of production of manufactured products (Note 6) | Cost of production of manufactured products (Note 6) | 17,930 | | | 61,600 | | | 7,546 | | | 36 | | | 349,495 | | | 436,607 | |
| Purchases | Purchases | 63,533 | | | 15,540 | | | 872 | | | 0 | | | 43,531 | | | 123,476 | |
| | Agricultural produce | |
| Agricultural produce | |
| Agricultural produce | Agricultural produce | 104,941 | | | 0 | | | 20,879 | | | 1,277 | | | 0 | | | 127,097 | |
| Transfer to raw material | Transfer to raw material | (24,375) | | | 0 | | | 0 | | | 0 | | | 0 | | | (24,375) | |
| Direct agricultural selling expenses | Direct agricultural selling expenses | 12,629 | | | 0 | | | 0 | | | 0 | | | 0 | | | 12,629 | |
| Tax recoveries (i) | Tax recoveries (i) | 0 | | | 0 | | | 0 | | | 0 | | | (32,380) | | | (32,380) | |
| Changes in net realizable value of agricultural produce after harvest | Changes in net realizable value of agricultural produce after harvest | (909) | | | 0 | | | 0 | | | 0 | | | 0 | | | (909) | |
| Finished goods at the end of December 31, 2018 | (29,144) | | | (9,507) | | | (1,170) | | | 0 | | | (39,937) | | | (79,758) | |
| Loss of idle capacity | |
| Finished goods at the end of the year (Note 19) | |
| Exchange differences | Exchange differences | (8,857) | | | (2,490) | | | 0 | | | 0 | | | (4,359) | | | (15,706) | |
| Cost of goods sold and services rendered, and direct agricultural selling expenses | 156,936 | | | 74,973 | | | 28,127 | | | 1,313 | | | 348,616 | | | 609,965 | |
| Cost of goods sold and services rendered | |
(i) Correspond to the presumed credit of ICMS (Imposto sobre Circulação de Mercadorias e Prestação de Serviços) over the sale values.
Adecoagro S.A.
Notes to the Consolidated Financial Statements (Continued)
(All amounts in US$ thousands, except shares and per share data and as otherwise indicated)
6. Expenses by nature
The Group presents the statement of income is presented under the function of expense method. Under this method, expenses are classified according to their function as part of the line items “cost of goods sold and direct agricultural selling expenses”,services rendered," “general and administrative expenses” and “selling expenses”.
The following table provides the additional disclosure required on the nature of expenses and their relationship to the function within the Group:
Expenses by nature for the year ended December 31, 2020:2023:
| | | | Cost of production of manufactured products (Note 5) | | General and
Administrative
Expenses | | Selling
Expenses | | Total |
| | | Crops | | Rice | | Dairy | | All other
segments | | Sugar,
Ethanol and
Energy | | Total | |
| | | Cost of production of manufactured products (Note 5) | | General and
Administrative
Expenses | | Selling
Expenses | | Total |
| | |
| Salaries, social security expenses and employee benefits | |
| Salaries, social security expenses and employee benefits | |
| Salaries, social security expenses and employee benefits | Salaries, social security expenses and employee benefits | 2,348 | | | 4,466 | | | 7,452 | | | 0 | | | 26,341 | | | 40,607 | | | 25,519 | | | 5,206 | | | 71,332 | |
| Raw materials and consumables | Raw materials and consumables | 448 | | | 3,072 | | | 14,486 | | | 0 | | | 8,743 | | | 26,749 | | | 0 | | | 0 | | | 26,749 | |
| Depreciation and amortization | Depreciation and amortization | 2,929 | | | 2,016 | | | 2,812 | | | 0 | | | 93,211 | | | 100,968 | | | 12,490 | | | 985 | | | 114,443 | |
| Depreciation of right of use assets | Depreciation of right of use assets | 0 | | | 19 | | | 461 | | | 0 | | | 6,208 | | | 6,688 | | | 3,557 | | | 24 | | | 10,269 | |
| Fuel, lubricants and others | Fuel, lubricants and others | 131 | | | 68 | | | 2,030 | | | 0 | | | 16,543 | | | 18,772 | | | 428 | | | 187 | | | 19,387 | |
| Maintenance and repairs | Maintenance and repairs | 639 | | | 1,492 | | | 1,141 | | | 0 | | | 12,581 | | | 15,853 | | | 954 | | | 476 | | | 17,283 | |
| Freights | Freights | 172 | | | 4,617 | | | 1,708 | | | 0 | | | 649 | | | 7,146 | | | 0 | | | 33,111 | | | 40,257 | |
| Export taxes / selling taxes | Export taxes / selling taxes | 0 | | | 0 | | | 0 | | | 0 | | | 0 | | | 0 | | | 0 | | | 35,966 | | | 35,966 | |
| Export expenses | Export expenses | 0 | | | 0 | | | 0 | | | 0 | | | 0 | | | 0 | | | 0 | | | 8,801 | | | 8,801 | |
| Contractors and services | Contractors and services | 1,358 | | | 116 | | | 54 | | | 0 | | | 5,086 | | | 6,614 | | | 0 | | | 0 | | | 6,614 | |
| Energy transmission | Energy transmission | 0 | | | 0 | | | 0 | | | 0 | | | 0 | | | 0 | | | 0 | | | 2,231 | | | 2,231 | |
| Energy power | Energy power | 803 | | | 1,015 | | | 1,879 | | | 0 | | | 764 | | | 4,461 | | | 137 | | | 114 | | | 4,712 | |
| Professional fees | Professional fees | 32 | | | 35 | | | 103 | | | 0 | | | 447 | | | 617 | | | 6,261 | | | 1,060 | | | 7,938 | |
| Other taxes | Other taxes | 20 | | | 76 | | | 97 | | | 0 | | | 2,312 | | | 2,505 | | | 376 | | | 21 | | | 2,902 | |
| Contingencies | Contingencies | 0 | | | 0 | | | 0 | | | 0 | | | — | | | 0 | | | 703 | | | 0 | | | 703 | |
| Lease expense and similar arrangements | Lease expense and similar arrangements | 111 | | | 182 | | | 137 | | | 0 | | | 0 | | | 430 | | | 283 | | | 226 | | | 939 | |
| Third parties raw materials | Third parties raw materials | 3,257 | | | 6,578 | | | 42,051 | | | 0 | | | 13,547 | | | 65,433 | | | 0 | | | 0 | | | 65,433 | |
| Tax recoveries | Tax recoveries | 0 | | | 0 | | | 0 | | | 0 | | | (1,087) | | | (1,087) | | | 0 | | | 0 | | | (1,087) | |
| Others | Others | 524 | | | 1,219 | | | 1,975 | | | 0 | | | 1,613 | | | 5,331 | | | 2,720 | | | 6,650 | | | 14,701 | |
| Subtotal | Subtotal | 12,772 | | | 24,971 | | | 76,386 | | | 0 | | | 186,958 | | | 301,087 | | | 53,428 | | | 95,058 | | | 449,573 | |
| Own agricultural produce consumed | Own agricultural produce consumed | 31,302 | | | 54,536 | | | 26,547 | | | 0 | | | 98,669 | | | 211,054 | | | 0 | | | 0 | | | 211,054 | |
| Total | Total | 44,074 | | | 79,507 | | | 102,933 | | | 0 | | | 285,627 | | | 512,141 | | | 53,428 | | | 95,058 | | | 660,627 | |
Adecoagro S.A.
Notes to the Consolidated Financial Statements (Continued)
(All amounts in US$ thousands, except shares and per share data and as otherwise indicated)
6. Expenses by nature (continued)
Expenses by nature for the year ended December 31, 2019:2022:
| | | |
| | | | Cost of production of manufactured products (Note 5) | | General and
Administrative
Expenses | | Selling
Expenses | | Total | Cost of production of manufactured products (Note 5) | | General and
Administrative
Expenses | | Selling
Expenses | | Total |
| | | Crops | | Rice | | Dairy | | All other
segments | | Sugar,
Ethanol and
Energy | | Total | |
| Salaries, social security expenses and employee benefits | Salaries, social security expenses and employee benefits | 1,880 | | | 4,738 | | | 4,412 | | | 0 | | | 39,768 | | | 50,798 | | | 27,492 | | | 6,211 | | | 84,501 | |
| Salaries, social security expenses and employee benefits | |
| Salaries, social security expenses and employee benefits | |
| Raw materials and consumables | Raw materials and consumables | 314 | | | 6,527 | | | 10,151 | | | 0 | | | 15,683 | | | 32,675 | | | 0 | | | 0 | | | 32,675 | |
| Depreciation and amortization | Depreciation and amortization | 2,581 | | | 1,897 | | | 2,140 | | | 0 | | | 122,025 | | | 128,643 | | | 11,212 | | | 868 | | | 140,723 | |
| Depreciation of right of use assets | Depreciation of right of use assets | 0 | | | 116 | | | 344 | | | 0 | | | 6,794 | | | 7,254 | | | 2,007 | | | 5 | | | 9,266 | |
| | Fuel, lubricants and others | |
| Fuel, lubricants and others | |
| Fuel, lubricants and others | Fuel, lubricants and others | 228 | | | 83 | | | 1,381 | | | 0 | | | 25,430 | | | 27,122 | | | 593 | | | 225 | | | 27,940 | |
| Maintenance and repairs | Maintenance and repairs | 290 | | | 1,120 | | | 985 | | | 0 | | | 19,694 | | | 22,089 | | | 1,755 | | | 534 | | | 24,378 | |
| Freights | Freights | 146 | | | 2,405 | | | 1,959 | | | 0 | | | 784 | | | 5,294 | | | 0 | | | 23,130 | | | 28,424 | |
| Export taxes / selling taxes | Export taxes / selling taxes | 0 | | | 0 | | | 0 | | | 0 | | | 0 | | | 0 | | | 0 | | | 52,312 | | | 52,312 | |
| Export expenses | Export expenses | 0 | | | 0 | | | 0 | | | 0 | | | 0 | | | 0 | | | 0 | | | 5,552 | | | 5,552 | |
| Contractors and services | Contractors and services | 1,051 | | | 138 | | | 40 | | | 0 | | | 9,381 | | | 10,610 | | | 0 | | | 0 | | | 10,610 | |
| Energy transmission | Energy transmission | 0 | | | 0 | | | 0 | | | 0 | | | 0 | | | 0 | | | 88 | | | 3,057 | | | 3,145 | |
| | Energy power | |
| | Energy power | |
| | Energy power | Energy power | 725 | | | 1,298 | | | 1,659 | | | 0 | | | 1,181 | | | 4,863 | | | 145 | | | 145 | | | 5,153 | |
| Professional fees | Professional fees | 20 | | | 65 | | | 127 | | | 0 | | | 175 | | | 387 | | | 8,065 | | | 1,047 | | | 9,499 | |
| Other taxes | Other taxes | 1 | | | 74 | | | 81 | | | 0 | | | 1,241 | | | 1,397 | | | 1,089 | | | 28 | | | 2,514 | |
| Contingencies | Contingencies | 0 | | | 0 | | | 0 | | | 0 | | | 0 | | | 0 | | | 459 | | | 0 | | | 459 | |
| Lease expense and similar arrangements | Lease expense and similar arrangements | 83 | | | 171 | | | 78 | | | 0 | | | 0 | | | 332 | | | 831 | | | 125 | | | 1,288 | |
| Third parties raw materials | Third parties raw materials | 7,136 | | | 5,629 | | | 18,131 | | | 0 | | | 11,243 | | | 42,139 | | | 0 | | | 0 | | | 42,139 | |
| Tax recoveries | Tax recoveries | 0 | | | 0 | | | 0 | | | 0 | | | (396) | | | (396) | | | 0 | | | 0 | | | (396) | |
| Others | Others | 431 | | | 695 | | | 681 | | | 0 | | | 2,324 | | | 4,131 | | | 3,466 | | | 13,733 | | | 21,330 | |
| Subtotal | Subtotal | 14,886 | | | 24,956 | | | 42,169 | | | 0 | | | 255,327 | | | 337,338 | | | 57,202 | | | 106,972 | | | 501,512 | |
| Own agricultural produce consumed | Own agricultural produce consumed | 19,066 | | | 41,430 | | | 26,682 | | | 0 | | | 99,637 | | | 186,815 | | | 0 | | | 0 | | | 186,815 | |
| Total | Total | 33,952 | | | 66,386 | | | 68,851 | | | 0 | | | 354,964 | | | 524,153 | | | 57,202 | | | 106,972 | | | 688,327 | |
Adecoagro S.A.
Notes to the Consolidated Financial Statements (Continued)
(All amounts in US$ thousands, except shares and per share data and as otherwise indicated)
6. Expenses by nature (continued)
Expenses by nature for the year ended December 31, 2018:2021:
| | | |
| | | | Cost of production of manufactured products (Note 5) | | | | | | | Cost of production of manufactured products (Note 5) | | |
| | | Crops | | Rice | | Dairy | | All other
segments | | Sugar,
Ethanol and
Energy | | Total | | General and
Administrative
Expenses | | Selling
Expenses | | Total | | Crops | | Rice | | Dairy | | | | Sugar,
Ethanol and
Energy | | Total | | General and
Administrative
Expenses | | Selling
Expenses | | Total |
| Salaries, social security expenses and employee benefits | Salaries, social security expenses and employee benefits | 0 | | | 5,055 | | | 115 | | | 36 | | | 46,106 | | | 51,312 | | | 29,245 | | | 5,908 | | | 86,465 | |
| Raw materials and consumables | Raw materials and consumables | 733 | | | 4,391 | | | 282 | | | 0 | | | 10,122 | | | 15,528 | | | 0 | | | 0 | | | 15,528 | |
| Depreciation and amortization | Depreciation and amortization | 0 | | | 1,764 | | | 118 | | | 0 | | | 115,253 | | | 117,135 | | | 9,667 | | | 767 | | | 127,569 | |
| Depreciation right-of-use and other leases | |
| | Fuel, lubricants and others | |
| Fuel, lubricants and others | |
| Fuel, lubricants and others | Fuel, lubricants and others | 0 | | | 117 | | | 0 | | | 0 | | | 26,267 | | | 26,384 | | | 614 | | | 192 | | | 27,190 | |
| Maintenance and repairs | Maintenance and repairs | 0 | | | 1,452 | | | 30 | | | 0 | | | 19,715 | | | 21,197 | | | 1,573 | | | 365 | | | 23,135 | |
| Freights | Freights | 47 | | | 2,519 | | | 436 | | | 0 | | | 685 | | | 3,687 | | | 0 | | | 24,700 | | | 28,387 | |
| Export taxes / selling taxes | Export taxes / selling taxes | 0 | | | 0 | | | 0 | | | 0 | | | 0 | | | 0 | | | 0 | | | 42,074 | | | 42,074 | |
| Export expenses | Export expenses | 0 | | | 0 | | | 0 | | | 0 | | | 0 | | | 0 | | | 0 | | | 2,774 | | | 2,774 | |
| Contractors and services | Contractors and services | 2,885 | | | 254 | | | 1,279 | | | 0 | | | 7,901 | | | 12,319 | | | 0 | | | 0 | | | 12,319 | |
| Energy transmission | Energy transmission | 0 | | | 0 | | | 0 | | | 0 | | | 0 | | | 0 | | | 0 | | | 2,689 | | | 2,689 | |
| | Energy power | |
| | Energy power | |
| | Energy power | Energy power | 0 | | | 1,239 | | | 138 | | | 0 | | | 1,340 | | | 2,717 | | | 145 | | | 57 | | | 2,919 | |
| Professional fees | Professional fees | 0 | | | 52 | | | 0 | | | 0 | | | 484 | | | 536 | | | 7,781 | | | 556 | | | 8,873 | |
| Other taxes | Other taxes | 0 | | | 71 | | | 0 | | | 0 | | | 1,841 | | | 1,912 | | | 1,309 | | | 10 | | | 3,231 | |
| Contingencies | Contingencies | 0 | | | 0 | | | 0 | | | 0 | | | 0 | | | 0 | | | 1,345 | | | 0 | | | 1,345 | |
| Lease expense and similar arrangements | Lease expense and similar arrangements | 0 | | | 276 | | | 3 | | | 0 | | | 0 | | | 279 | | | 1,077 | | | 53 | | | 1,409 | |
| Third parties raw materials | Third parties raw materials | 0 | | | 2,913 | | | 0 | | | 0 | | | 13,154 | | | 16,067 | | | 0 | | | 0 | | | 16,067 | |
| Tax recoveries | |
| Others | Others | 3 | | | 1,697 | | | 223 | | | 0 | | | 5,067 | | | 6,990 | | | 3,324 | | | 10,070 | | | 20,384 | |
| Subtotal | Subtotal | 3,668 | | | 21,800 | | | 2,624 | | | 36 | | | 247,935 | | | 276,063 | | | 56,080 | | | 90,215 | | | 422,358 | |
| Own agricultural produce consumed | Own agricultural produce consumed | 14,262 | | | 39,800 | | | 4,922 | | | 0 | | | 101,560 | | | 160,544 | | | 0 | | | 0 | | | 160,544 | |
| Total | Total | 17,930 | | | 61,600 | | | 7,546 | | | 36 | | | 349,495 | | | 436,607 | | | 56,080 | | | 90,215 | | | 582,902 | |
7. Salaries and social security expenses
| | | | 2020 | | 2019 | | 2018 | | 2023 | | 2022 | | 2021 |
| Wages and salaries (i) | Wages and salaries (i) | 89,662 | | | 104,400 | | | 105,931 | |
| Social security costs | Social security costs | 27,430 | | | 30,888 | | | 29,865 | |
| Equity-settled share-based compensation | Equity-settled share-based compensation | 4,316 | | | 4,734 | | | 4,728 | |
| | | 121,408 | | | 140,022 | | | 140,524 | |
|
(i)Includes US$ 27,544,35,007, US$ 32,71430,014 and US$ 32,636,25,105, capitalized in Property, Plant and Equipment for the years 2020, 20192023, 2022 and 2018,2021, respectively.
Adecoagro S.A.
Notes to the Consolidated Financial Statements (Continued)
(All amounts in US$ thousands, except shares and per share data and as otherwise indicated)
8. Other operating income / (expense), net
| | | | 2020 | | 2019 | | 2018 | | 2023 | | 2022 | | 2021 |
| Gain from disposal of farmland and other assets (Note 22) | 2,064 | | | 1,354 | | | 36,227 | |
| Loss from the sale of subsidiaries (Note 22) | (554) | | | 0 | | | 0 | |
| (Loss) / gain from commodity derivative financial instrument | (8,320) | | | (618) | | | 54,694 | |
| Gain / (loss) from commodity derivative financial instrument | |
| | Gain / (loss) from disposal of other property items | |
| Gain / (loss) from disposal of other property items | |
| Gain / (loss) from disposal of other property items | Gain / (loss) from disposal of other property items | 2,198 | | | (329) | | | (95) | |
| Net gain / (loss) from fair value adjustment of investment property | Net gain / (loss) from fair value adjustment of investment property | 1,077 | | | (325) | | | 13,409 | |
| | Gain from disposal of farmland and other assets (Note 21) | |
| Gain from disposal of farmland and other assets (Note 21) | |
| Gain from disposal of farmland and other assets (Note 21) | |
| | Others | |
| Others | |
| Others | Others | 5,522 | | | (904) | | | (3) | |
| | | 1,987 | | | (822) | | | 104,232 | |
9. Financial results, net
| | | | | | | | | | | | | | | | | |
| | 2020 | | 2019 (*) | | 2018 (*) |
| Finance income: | | | | | |
| - Interest income | 4,084 | | | 6,390 | | | 7,728 | |
| - Gain from interest rate/foreign exchange rate derivative financial instruments | 92 | | | 1,189 | | | 0 | |
| - Other income | 21,878 | | | 1,400 | | | 666 | |
| Finance income | 26,054 | | | 8,979 | | | 8,394 | |
| | | | | |
| Finance costs: | | | | | |
| - Interest expense | (58,282) | | | (56,468) | | | (47,266) | |
| - Finance cost related to lease liabilities | (12,532) | | | (9,524) | | | 0 | |
| - Cash flow hedge – transfer from equity (Note 2) | (24,363) | | | (25,484) | | | (38,086) | |
| - Foreign exchange losses, net | (109,266) | | | (25,779) | | | (68,787) | |
| - Taxes | (4,559) | | | (4,364) | | | (3,136) | |
| - Loss from interest rate/foreign exchange rate derivative financial instruments | 0 | | | 0 | | | (3,024) | |
| | | | | |
| - Other expenses | (4,774) | | | (4,492) | | | (3,638) | |
| Finance costs | (213,776) | | | (126,111) | | | (163,937) | |
| Other financial results - Net gain of inflation effects on the monetary items | 12,064 | | | 16,911 | | | (25,211) | |
| Total financial results, net | (175,658) | | | (100,221) | | | (180,754) | |
(*) Prior periods have been recast to reflect the Company's change in accounting policy for the reclassification within financial results as explained in Note 34.1. | | | | | | | | | | | | | | | | | |
| | 2023 | | 2022 | | 2021 |
| Finance income: | | | | | |
| - Interest income | 7,134 | | | 5,781 | | | 4,081 | |
| - Foreign exchange gains, net | 90,930 | | | 19,278 | | | 18,939 | |
| - Gain from interest rate/foreign exchange rate derivative financial instruments | 3,501 | | | — | | | 512 | |
| - Other income | 55,535 | | | 249 | | | 13,138 | |
| Finance income | 157,100 | | | 25,308 | | | 36,670 | |
| | | | | |
| Finance costs: | | | | | |
| - Interest expense | (31,906) | | | (50,037) | | | (62,536) | |
| - Finance cost related to lease liabilities | (40,203) | | | (31,113) | | | (16,502) | |
| - Cash flow hedge – transfer from equity (Note 2) | (36,863) | | | (40,195) | | | (52,650) | |
| | | | | |
| - Taxes | (5,473) | | | (4,862) | | | (7,073) | |
| - Loss from interest rate/foreign exchange rate derivative financial instruments | — | | | (2,384) | | | — | |
| - Borrowings prepayment related expenses (Brazilian subsidiaries) | — | | | — | | | (3,068) | |
| -Finance discount | — | | | — | | | (3,741) | |
| - Other expenses | (7,642) | | | (9,009) | | | (6,111) | |
| Finance costs | (122,087) | | | (137,600) | | | (151,681) | |
| Other financial results - Net gain / (loss) of inflation effects on monetary items | 28,816 | | | (2,144) | | | 11,541 | |
| Total financial results, net | 63,829 | | | (114,436) | | | (103,470) | |
10. Taxation
Adecoagro is subject to the applicable general tax regulations in Luxembourg.
The Group’s income tax has been calculated on the estimated assessable taxable results for the year at the rates prevailing in the respective foreign tax jurisdictions. The subsidiaries of the Group are required to calculate their income taxes on a separate basis according to the rules and regulations of the jurisdictions where they operate. Therefore, the Group is not legally permitted to compensate subsidiaries’ losses against subsidiaries’ income. The details of the provision for the Group’s consolidated income tax are as follows:
| | | | | | | | | | | | | | | | | |
| | 2020 | | 2019 | | 2018 |
| Current income tax | (2,840) | | | 666 | | | (2,846) | |
| Deferred income tax | (9,485) | | | (21,486) | | | 3,870 | |
| Income tax (expense) / benefit | (12,325) | | | (20,820) | | | 1,024 | |
Adecoagro S.A.
Notes to the Consolidated Financial Statements (Continued)
(All amounts in US$ thousands, except shares and per share data and as otherwise indicated)
10. Taxation (continued)
The statutory tax rate in the countries where the Group operates for all of the years presented are:
| | | | | | | | |
Tax Jurisdiction | | Income Tax Rate |
Argentina (i) | | 30 | % |
Brazil | | 34 | % |
Uruguay | | 25 | % |
Spain | | 25 | % |
Luxembourg | | 24.94 | % |
(i) During 2017 and 2019, the Argentine Government introduced changes in the income tax. The income tax rate will be reduced to 30% for the years 2018 to 2020, and to 25% from 2021 onwards. A new tax on dividends is created with a rate of 7% for the years 2018 to 2020, and 13% from 2021 onwards. Considering 2018, 2019 and 2020 resulted in losses for Argentine subsidiaries, no deferred income tax liability was recognized for future withholding tax on dividends.
Deferred tax assets and liabilities of the Group as of December 31, 2020 and 2019, without taking into consideration the offsetting of balances within the same tax jurisdiction, will be recovered or settled as follows:
| | | | | | | | | | | |
| | 2020 | | 2019 |
| Deferred income tax asset to be recovered after more than 12 months | 105,424 | | | 108,294 | |
| Deferred income tax asset to be recovered within 12 months | 23,744 | | | 35,973 | |
| Deferred income tax assets | 129,168 | | | 144,267 | |
| | | |
| Deferred income tax liability to be settled after more than 12 months | (278,035) | | | (292,871) | |
| Deferred income tax liability to be settled within 12 months | (13,689) | | | (3,240) | |
| Deferred income tax liability | (291,724) | | | (296,111) | |
| Deferred income tax (liability) / assets, net | (162,556) | | | (151,844) | |
The gross movement on the deferred income tax account is as follows:
| | | | | | | | | | | |
| | 2020 | | 2019 |
| Beginning of year | (151,844) | | | (151,980) | |
| Exchange differences | 1,536 | | | 4,877 | |
| Changes of fair value valuation for farmlands | (11,790) | | | 10,480 | |
| Acquisition of subsidiary | 0 | | | (3,515) | |
| Disposal of subsidiary | 3,458 | | | 3,730 | |
| Others | (159) | | | (705) | |
| Tax credit relating to cash flow hedge (i) | 5,728 | | | 6,755 | |
| Income tax benefit expense | (9,485) | | | (21,486) | |
| End of year | (162,556) | | | (151,844) | |
(i) Relates to the gain or loss before income tax of cash flow hedge recognized in other comprehensive income amounting to US$ 46,145 for the year ended December 31, 2020 (2019: US$ 75,822); net of the reclassification from Equity to the Income Statement of US$ (26,031) for the year ended December 31, 2020 (2019: US$ (32,305)) | | | | | | | | | | | | | | | | | |
| | 2023 | | 2022 | | 2021 |
| Current income tax | 4,570 | | | (4,655) | | | (4,338) | |
| Deferred income tax | (83,243) | | | (22,103) | | | (39,499) | |
| Income tax expense | (78,673) | | | (26,758) | | | (43,837) | |
Adecoagro S.A.
Notes to the Consolidated Financial Statements (Continued)
(All amounts in US$ thousands, except shares and per share data and as otherwise indicated)
10. Taxation (continued)
The statutory tax rate in the countries where the Group operates for all of the years presented are:
| | | | | | | | |
| Tax Jurisdiction | | Income Tax Rate |
| Argentina (i) | | 35 | % |
| Brazil | | 34 | % |
| Uruguay | | 25 | % |
| Spain | | 25 | % |
| Luxembourg | | 24.94 | % |
| Chile | | 27 | % |
(i) In June 2021, the Argentine Government introduced changes to the income tax laws whereby it established an increasing rate scheme starting at 25% up to 35% for income tax gains over Argentine Pesos 143 million (US$ 0.2 million). The revised scheme was effective as from fiscal year 2021. It also established a 7% withholding tax for dividends.
Deferred tax assets and liabilities of the Group as of December 31, 2023 and 2022, without taking into consideration the offsetting of balances within the same tax jurisdiction, will be recovered or settled as follows:
| | | | | | | | | | | |
| | 2023 | | 2022 |
| Deferred income tax asset to be recovered after more than 12 months | 36,028 | | | 127,878 | |
| Deferred income tax asset to be recovered within 12 months | 43,337 | | | 17,862 | |
| Deferred income tax assets | 79,365 | | | 145,740 | |
| | | |
| Deferred income tax liability to be settled after more than 12 months | (427,360) | | | (371,047) | |
| Deferred income tax liability to be settled within 12 months | (18,559) | | | (67,349) | |
| Deferred income tax liability | (445,919) | | | (438,396) | |
| Deferred income tax liability, net | (366,554) | | | (292,656) | |
The gross movement on the deferred income tax account is as follows:
| | | | | | | | | | | |
| | 2023 | | 2022 |
| Beginning of year | (292,656) | | | (255,527) | |
| Exchange differences | 69,707 | | | (30,187) | |
| Changes of fair value valuation for farmlands | (62,988) | | | 25,307 | |
| Acquisition of subsidiary (Note 21) | — | | | (1,562) | |
| Disposal of farmland | 10,492 | | | — | |
| Others | 632 | | | (1,247) | |
| Tax credit relating to cash flow hedge (i) | (8,498) | | | (7,337) | |
| Income tax expense | (83,243) | | | (22,103) | |
| End of year | (366,554) | | | (292,656) | |
(i) Relates to the gain or loss before income tax of cash flow hedge recognized in other comprehensive income amounting to US$7,319 for the year ended December 31, 2023 (2022: US$15,621; 2021: US$46,145); net of the reclassification from Equity to the Income Statement of US$ 49,737 for the year ended December 31, 2023 (2022: US$ 40,388; 2021: US$26,031).
The movement in the deferred income tax assets and liabilities during the year, without taking into consideration the offsetting of balances within the same tax jurisdiction, is as follows:
| | | | | | | | | | | | | | | | | | | | | | | | | | | | | | | | |
Deferred income tax
liabilities | | Property,
plant and
equipment | | Investment property | | Biological
assets | | Others | | Total |
| At January 1, 2019 | | 270,583 | | | 11,954 | | | 3,466 | | | 2,408 | | | 288,411 | |
| Charged / (credited) to the statement of income | | 31,745 | | | 331 | | | 912 | | | (1,939) | | | 31,049 | |
| Acquisition of subsidiary | | 3,603 | | | 0 | | | 0 | | | 0 | | | 3,603 | |
| | | | | | | | | | |
| | | | | | | | | | |
| Farmlands revaluation | | (10,480) | | | 0 | | | 0 | | | 0 | | | (10,480) | |
| Disposals of subsidiaries | | (3,730) | | | 0 | | | 0 | | | 0 | | | (3,730) | |
| Exchange differences | | (10,862) | | | (378) | | | (199) | | | (1,303) | | | (12,742) | |
| At December 31, 2019 | | 280,859 | | | 11,907 | | | 4,179 | | | (834) | | | 296,111 | |
| Charged / (credited) to the statement of income | | 11,581 | | | (1,928) | | | 6,463 | | | 0 | | | 16,116 | |
| Farmlands revaluation | | 11,521 | | | 269 | | | 0 | | | 0 | | | 11,790 | |
| Disposals of subsidiaries | | (3,513) | | | 0 | | | 0 | | | 0 | | | (3,513) | |
| Exchange differences | | (28,920) | | | (370) | | | 510 | | | 0 | | | (28,780) | |
| At December 31, 2020 | | 271,528 | | | 9,878 | | | 11,152 | | | (834) | | | 291,724 | |
Adecoagro S.A.
Notes to the Consolidated Financial Statements (Continued)
(All amounts in US$ thousands, except shares and per share data and as otherwise indicated)
10. Taxation (continued)
| | | | | | | | | | | | | | | | | | | | | | | | | | | | | | | | |
Deferred income tax
liabilities | | Property,
plant and
equipment | | Investment property | | Biological
assets | | Others | | Total |
| At January 1, 2022 | | 355,158 | | | 9,881 | | | 11,259 | | | 8,757 | | | 385,055 | |
| Charged / (credited) to the statement of income | | 20,354 | | | (2,181) | | | 18,105 | | | 232 | | | 36,510 | |
| Farmlands revaluation | | (25,307) | | | — | | | — | | | — | | | (25,307) | |
| Acquisition of subsidiary | | 1,562 | | | — | | | — | | | — | | | 1,562 | |
| Exchange differences | | 37,379 | | | 1,279 | | | 1,097 | | | 821 | | | 40,576 | |
| At December 31, 2022 | | 389,146 | | | 8,979 | | | 30,461 | | | 9,810 | | | 438,396 | |
| Charged / (credited) to the statement of income | | 18,229 | | | 9,760 | | | (2,984) | | | 12,460 | | | 37,465 | |
| Farmlands revaluation | | 62,988 | | | — | | | — | | | — | | | 62,988 | |
| Acquisition of subsidiaries | | (10,492) | | | — | | | — | | | — | | | (10,492) | |
| Exchange differences | | (75,928) | | | (2,851) | | | (4,097) | | | 438 | | | (82,438) | |
| At December 31, 2023 | | 383,943 | | | 15,888 | | | 23,380 | | | 22,708 | | | 445,919 | |
| Deferred income tax
assets | Deferred income tax
assets | | Provisions | | Tax loss
carry
forwards | | Equity-settled
share-based
compensation | | Borrowings | | Biological
assets | | Others | | Total | Deferred income tax
assets | | Provisions | | Tax loss
carry
forwards | | Equity-settled
share-based
compensation | | Borrowings | | Biological
assets | | Others | | Total |
| At January 1, 2019 | | 3,960 | | | 80,220 | | | 5,302 | | | 0 | | 4,594 | | | 42,355 | | | 136,431 | |
| Charged / (credited) to the statement of income | | (604) | | | 8,017 | | | (1,214) | | | 2,709 | | | (117) | | | 772 | | | 9,563 | |
| Acquisition of subsidiaries | | 7 | | | 134 | | | 0 | | | 0 | | | 0 | | | (53) | | | 88 | |
| Others | | 0 | | | 0 | | | (705) | | | 0 | | | 0 | | | 0 | | | (705) | |
| At January 1, 2022 | |
| (Credited) / charged to the statement of income | |
| | Tax charge relating to cash flow hedge | |
| Tax charge relating to cash flow hedge | |
| Tax charge relating to cash flow hedge | Tax charge relating to cash flow hedge | | 0 | | | 6,755 | | | 0 | | | 0 | | | 0 | | | 0 | | | 6,755 | |
| Exchange differences | Exchange differences | | (126) | | | (3,707) | | | 0 | | | (1,161) | | | 31 | | | (2,902) | | | (7,865) | |
| At December 31, 2019 | | 3,237 | | | 91,419 | | | 3,383 | | | 1,548 | | | 4,508 | | | 40,172 | | | 144,267 | |
| (Credited) / charged to the statement of income | | 4,941 | | | (5,843) | | | (835) | | | 34,017 | | | (4,508) | | | (21,141) | | | 6,631 | |
| Disposal of subsidiary | | 0 | | | 0 | | | 0 | | | 0 | | | 0 | | | (55) | | | (55) | |
| Others | Others | | 0 | | | 0 | | | (60) | | | 0 | | | 0 | | | (99) | | | (159) | |
| At December 31, 2022 | |
| Charged / (credited) to the statement of income | |
| | Tax charge relating to cash flow hedge | |
| Tax charge relating to cash flow hedge | |
| Tax charge relating to cash flow hedge | Tax charge relating to cash flow hedge | | 0 | | | 5,728 | | | 0 | | | 0 | | | 0 | | | 0 | | | 5,728 | |
| Exchange differences | Exchange differences | | (1,152) | | | (20,363) | | | 0 | | | (9,460) | | | 0 | | | 3,731 | | | (27,244) | |
| At December 31, 2020 | | 7,026 | | | 70,941 | | | 2,488 | | | 26,105 | | | 0 | | | 22,608 | | | 129,168 | |
| Others | |
| At December 31, 2023 | |
Tax loss carry forwards in Argentina and Uruguay generally expire within 5 years. Tax loss carry forwards in Brazil and Luxembourg do not expire. However, in Brazil, the taxable profit for each year can only be reduced by tax loss carry forward up to a maximum of 30%.
In order to fully realize the deferred tax asset, the Group will need to generate future taxable income in the countries where the tax loss carry forward were incurred. Based upon the level of historical taxable income and projections for future taxable income over the periods in which the deferred tax assets are deductible
.
As of December 31, 2023, the Group’s tax loss carry forwards and their corresponding jurisdictions are as follows:
Adecoagro S.A.
Notes to the Consolidated Financial Statements (Continued)
(All amounts in US$ thousands, except shares and per share data and as otherwise indicated)
10. Taxation (continued)
taxable income over the periods in which the deferred tax assets are deductible, management believes that as at December 31, 2020, it is probable that the Group will realize some portion of the deferred tax assets in Brazil and Argentina.
As of December 31, 2020, the Group’s tax loss carry forwards and their corresponding jurisdictions are as follows:
| | | | | | | | | | | | | | |
| Jurisdiction | | Tax loss carry forward | | Expiration period |
| Argentina (1) | | 92,84522,158 | | | 5 years |
| Brazil | | 123,509135,479 | | | No expiration date. |
| Uruguay | | 4,8955,173 | | | 5 years |
| Luxembourg | | 34,83216,866 | | | No expiration date. |
(1) As of December 31, 2020,2023, the aging of the determination tax loss carry forward in Argentina is as follows:
| | Year of generation | Year of generation | | Amount | Year of generation | | Amount |
| 2016 | | 701 | |
| 2017 | | 6,966 | |
| 2018 | | 19,181 | |
| | 2019 | |
| 2019 | |
| 2019 | 2019 | | 52,126 | |
| 2020 | 2020 | | 13,871 | |
| 2021 | |
| 2022 | |
| 2023 | |
Deferred income tax assets are recognized for tax loss carry-forwards to the extent that the realization of the related tax benefit through future taxable profits is probable. The Group did not recognize deferred income tax assets of US$ 5.3 million as of December 31, 2020, in respect of losses amounting to US$ 20.2 million that can be carried forward against future taxable income.
The tax on the Group’s profit before income tax differs from the theoretical amount that would arise using the weighted average tax raterates applicable to profits ofin the consolidated entitiesrespective countries as follows:
| | | | 2020 | | 2019 | | 2018 | | 2023 | | 2022 | | 2021 |
| Tax calculated at the tax rates applicable to profits in the respective countries | Tax calculated at the tax rates applicable to profits in the respective countries | (4,184) | | | (7,250) | | | 2,956 | |
| Non-deductible items | Non-deductible items | (7,642) | | | (1,511) | | | (2,249) | |
| Effect of the changes in the statutory income tax rate in Argentina | Effect of the changes in the statutory income tax rate in Argentina | 6,324 | | | 3,115 | | | (1,013) | |
| Unused tax losses | Unused tax losses | (710) | | | (3,742) | | | (4,181) | |
| Tax losses where no deferred tax asset was recognized | Tax losses where no deferred tax asset was recognized | 0 | | | 0 | | | (2,368) | |
| Non-taxable income | Non-taxable income | 11,060 | | | 11,545 | | | 13,069 | |
| Previously unrecognized tax losses now recouped to reduce tax expenses | 1,529 | | | 1,910 | | | 0 | |
Previously unrecognized tax losses now recouped to reduce tax expenses (1) | |
| | Effect of IAS 29 and tax adjustment per inflation in Argentina | |
| Effect of IAS 29 and tax adjustment per inflation in Argentina | |
| Effect of IAS 29 and tax adjustment per inflation in Argentina | Effect of IAS 29 and tax adjustment per inflation in Argentina | (19,239) | | | (23,805) | | | (5,825) | |
| Others | Others | 537 | | | (1,082) | | | 635 | |
| Income tax (expense) / benefit | (12,325) | | | (20,820) | | | 1,024 | |
| Income tax expense | |
(1) 2023 includes 37,151 of adjustment by inflation of tax loss carryforwards in Argentina (16,044 in 2022).
Tax Inflation Adjustment in Argentina
Laws 27,430, 27,468 and 27,541 introduced several amendments to the income tax inflation adjustments provided by the Income Tax Law. According to these provisions, and effective as from fiscal years beginning on or after January 1, 2018, the inflation adjustment procedure set out in Title VI of the Income Tax Law shall be applicable in fiscal years in which the variation of IPC price index, accumulated in the 36 months immediately preceding the end of the relevant fiscal year, is higher than 100%. As from its effectiveness, this procedure is applicable because the variation of the IPC reached the prescribed limits.
However, Section 39 of Law No. 24,073 suspended the application of the provisions of Title VI of the Income Tax Law relating to the income tax inflation adjustment since April 1, 1992 to certain items, such as, fixed assets, inventory, and tax loss carryforwards, among others.
After the economic crisis of 2002, many taxpayers began to question the legality of the provisions suspending the income tax inflation adjustment. Also, the Argentine Supreme Court of Justice issued its verdict in the "Candy" case July 3,
Adecoagro S.A.
Notes to the Consolidated Financial Statements (Continued)
(All amounts in US$ thousands, except shares and per share data and as otherwise indicated)
10. Taxation (continued)
2009 in which it stated that particularly for fiscal year 2002 and considering the serious state of disturbance of that year, the taxpayer could demonstrate that not applying the income tax inflation adjustment resulted in confiscatory income tax rates.
More recently, the Argentine Supreme Court of Justice applied a similar criterion to the 2010, 2011, 2012 and 2014 fiscal years in the cases brought by “Distribuidora Gas del Centro” (10/14/14, 06/02/15, 10/04/16 and 06/25/19), among others, enabling the application of income tax inflation adjustment for periods not affected by a severe economic crisis such as 2002.
The Company believes that the lack of application of the income tax inflation adjustment is confiscatory. Accordingly, based on the precedents and the opinion of external and internal tax advisors, the Company has adjusted all items for inflation including those suspended by Section 39 of Law 24,073 as described above. The net effect of the inflation adjustment resulted in a deferred tax asset of US$121.9 million as of December 31, 2023, of which US$ 104,172 has already been applied.
The application of local tax laws require interpretation, and accordingly involves the application of judgement and is open to challenge by the relevant tax authorities. This gives rise to a level of uncertainty. Provisions for uncertain tax positions are established in accordance with IFRIC 23 based on an assessment of the range of likely tax outcomes in open years and reflecting the strength of technical arguments. Amounts are provided for individual tax uncertainties based on management’s assessment of whether the most likely amount or an expected amount based on a probability weighted methodology is the more appropriate predicter of amounts that the Company is ultimately expected to settle. When making this assessment, the Company utilizes specialist in-house tax knowledge and experience and takes into consideration specialist tax advice from third party advisers on specific items. The Company has not provided any amount in this case based on its belief that it has solid arguments to support its position.
OECD Pillar Two model rules
The Group is within the scope of the OECD (Organization for Economic Cooperation and Development) Pillar Two model rules (the Global Anti-base Erosion rules or GloBE). Pillar Two legislation was enacted in Luxembourg, the jurisdiction in which the company is incorporated, and came into effect from January 2024. Since the Pillar Two legislation was not effective at the reporting date, the group has no related current tax exposure. The group applies the exception to recognizing and disclosing information about deferred tax assets and liabilities related to Pillar Two income taxes, as provided in the amendments to IAS 12 issued in May 2023.
Under Pillar Two, the Group is liable to pay a top-up tax for the difference between its GloBE effective tax rate per jurisdiction and the 15% minimum rate. All jurisdictions within the group have an effective tax rate that exceeds 15%, except for Uruguay. Although Uruguay may have a rate below 15%, we estimate that the impact would not be significant.
Due to the complexities in applying the legislation and calculating GloBE income, the quantitative impact of the enacted or substantively enacted legislation is not yet reasonably estimable. Therefore, even for those jurisdictions with an accounting effective tax rate above 15%, there might still be Pillar Two tax implications. The group is currently engaged with tax specialists to assist it with applying the legislation.
Adecoagro S.A.
Notes to the Consolidated Financial Statements (Continued)
(All amounts in US$ thousands, except shares and per share data and as otherwise indicated)
11. Earnings per share
(a) Basic
Basic earnings per share is calculated by dividing the profit attributable to equity holders of the Group by the weighted average number of shares in issue during the period excluding ordinary shares held as treasury shares (Note 24)23).
| | | | | | | | | | | | | | | | | |
| | 2020 | | 2019 | | 2018 |
| Profit / (loss) from operations attributable to equity holders of the Group | 412 | | | (772) | | | (24,622) | |
| Weighted average number of shares in issue (thousands) | 117,453 | | | 117,252 | | | 116,637 | |
| Basic earnings / (loss) per share from operations | 0.003 | | | (0.007) | | | (0.211) | |
| | | | | | | | | | | | | | | | | |
| | 2023 | | 2022 | | 2021 |
| Profit from operations attributable to equity holders of the Group | 226,291 | | | 108,138 | | | 130,669 | |
| Weighted average number of shares in issue (thousands) | 107,092 | | | 110,079 | | | 115,148 | |
| Basic earnings per share | 2.113 | | | 0.982 | | | 1.135 | |
(b) Diluted
Diluted earnings per share is calculated by adjusting the weighted average number of shares outstanding to assume conversion of all dilutive potential shares. The Group has 2two categories of dilutive potential shares: equity-settled share options and restricted units. For these instruments, a calculation is done to determine the number of shares that could have been acquired at fair value, based on the monetary value of the subscription rights attached to outstanding share options. The number of shares calculated as above is compared with the number of shares that would have been issued assuming the exercise of the equity-settled share options. As of December 31, 2020, thereDuring 2023, the share options outstanding average were 261401 thousands (2019: 645(2022: 361 thousands; 2018: 8512021: 466 thousands) share options/restricted units outstanding that could potentially have a dilutive impact in the future but were antidilutive for the periods presented.options outstanding.
| | | | 2020 | | 2019 | | 2018 | | 2023 | | 2022 | | 2021 |
| Profit / (loss) from operations attributable to equity holders of the Group | 412 | | | (772) | | | (24,622) | |
| Profit from operations attributable to equity holders of the Group | |
| Weighted average number of shares in issue (thousands) | Weighted average number of shares in issue (thousands) | 117,453 | | | 117,252 | | | 116,637 | |
| Adjustments for: | Adjustments for: | |
| - Employee share options and restricted units (thousands) | - Employee share options and restricted units (thousands) | 261 | | | 645 | | | 1,198 | |
| - Employee share options and restricted units (thousands) | |
| - Employee share options and restricted units (thousands) | |
| Weighted average number of shares for diluted earnings per share (thousands) | Weighted average number of shares for diluted earnings per share (thousands) | 117,714 | | | 117,897 | | | 117,835 | |
| Diluted earnings / (loss) per share from operations | 0.003 | | | (0.007) | | | (0.211) | |
| Diluted earnings per share | |
Adecoagro S.A.
Notes to the Consolidated Financial Statements (Continued)
(All amounts in US$ thousands, except shares and per share data and as otherwise indicated)
12. Property, plant and equipment, net
Changes in the Group’s property, plant and equipment, net in 20202023 and 20192022 were as follows:
| | | | Farmlands | | Farmland
improvements | | Buildings and
facilities | | Machinery,
equipment,
furniture and
fittings | | Bearer plants | | Others | | Work in
progress | | Total | | Farmlands | | Farmland
improvements | | Buildings and
facilities | | Machinery,
equipment,
furniture and
fittings | | Bearer plants | | Others | | Work in
progress | | Total |
| At January 1, 2019 | | | | | | | | | | | | | | | |
| Cost | 780,184 | | | 32,718 | | | 344,915 | | | 718,978 | | | 480,049 | | | 21,611 | | | 50,904 | | | 2,429,359 | |
| At January 1, 2022 | | At January 1, 2022 | | | |
| Fair value for farmlands / Cost | |
| Accumulated depreciation | Accumulated depreciation | 0 | | | (16,394) | | | (156,293) | | | (513,830) | | | (247,093) | | | (15,310) | | | 0 | | | (948,920) | |
| Net book amount | Net book amount | 780,184 | | | 16,324 | | | 188,622 | | | 205,148 | | | 232,956 | | | 6,301 | | | 50,904 | | | 1,480,439 | |
| At December 31, 2019 | | | | | | | | | | | | | | | |
| At December 31, 2022 | |
| Opening net book amount | |
| Opening net book amount | |
| Opening net book amount | Opening net book amount | 780,184 | | | 16,324 | | | 188,622 | | | 205,148 | | | 232,956 | | | 6,301 | | | 50,904 | | | 1,480,439 | |
| Exchange differences | Exchange differences | (25,205) | | | (536) | | | (6,846) | | | (8,770) | | | (9,802) | | | (207) | | | (3,170) | | | (54,536) | |
| Additions | Additions | 1,738 | | | 62 | | | 38,570 | | | 62,320 | | | 102,813 | | | 2,160 | | | 54,488 | | | 262,151 | |
| Revaluation surplus | Revaluation surplus | (42,384) | | | 0 | | | 0 | | | 0 | | | 0 | | | 0 | | | 0 | | | (42,384) | |
| Acquisition of subsidiaries | Acquisition of subsidiaries | 815 | | | 0 | | | 24,126 | | | 5,280 | | | 0 | | | 437 | | | 0 | | | 30,658 | |
| Reclassification from investment property | 4,816 | | | 0 | | | 0 | | | 0 | | | 0 | | | 0 | | | 0 | | | 4,816 | |
| | Transfers | |
| Transfers | |
| Transfers | Transfers | 0 | | | 12,643 | | | 13,614 | | | 16,772 | | | 0 | | | 35 | | | (43,064) | | | 0 | |
| Disposals | Disposals | 0 | | | 0 | | | (81) | | | (3,308) | | | 0 | | | (129) | | | 0 | | | (3,518) | |
| Disposals of subsidiaries | (10,379) | | | 0 | | | (571) | | | (22) | | | 0 | | | 0 | | | 0 | | | (10,972) | |
| | Reclassification to non-income tax credits (*) | |
| Reclassification to non-income tax credits (*) | |
| Reclassification to non-income tax credits (*) | Reclassification to non-income tax credits (*) | 0 | | | 0 | | | 0 | | | (226) | | | 0 | | | 0 | | | 0 | | | (226) | |
| Depreciation | Depreciation | 0 | | | (3,213) | | | (24,714) | | | (70,921) | | | (72,447) | | | (1,913) | | | 0 | | | (173,208) | |
| Closing net book amount | Closing net book amount | 709,585 | | | 25,280 | | | 232,720 | | | 206,273 | | | 253,520 | | | 6,684 | | | 59,158 | | | 1,493,220 | |
| | | | Farmlands | | Farmland
improvements | | Buildings and
facilities | | Machinery,
equipment,
furniture and
fittings | | Bearer plants | | Others | | Work in
progress | | Total | | Farmlands | | Farmland
improvements | | Buildings and
facilities | | Machinery,
equipment,
furniture and
fittings | | Bearer plants | | Others | | Work in
progress | | Total |
| At December 31, 2019 | | | | | | | | | | | | | | | |
| At December 31, 2022 | | At December 31, 2022 | | | |
| Fair value for farmlands / Cost | Fair value for farmlands / Cost | 709,585 | | | 44,887 | | | 413,727 | | | 791,024 | | | 573,060 | | | 23,907 | | | 59,158 | | | 2,615,348 | |
| Accumulated depreciation | Accumulated depreciation | 0 | | | (19,607) | | | (181,007) | | | (584,751) | | | (319,540) | | | (17,223) | | | 0 | | | (1,122,128) | |
| Net book amount | Net book amount | 709,585 | | | 25,280 | | | 232,720 | | | 206,273 | | | 253,520 | | | 6,684 | | | 59,158 | | | 1,493,220 | |
| Year ended December 31, 2020 | | | | | | | | | | | | | | | |
| Year ended December 31, 2023 | |
| Opening net book amount | |
| Opening net book amount | |
| Opening net book amount | Opening net book amount | 709,585 | | | 25,280 | | | 232,720 | | | 206,273 | | | 253,520 | | | 6,684 | | | 59,158 | | | 1,493,220 | |
| Exchange differences | Exchange differences | (36,422) | | | (432) | | | (55,368) | | | (112,657) | | | 30,864 | | | (617) | | | (6,445) | | | (181,077) | |
| Additions | Additions | 0 | | | 0 | | | 11,279 | | | 52,350 | | | 72,592 | | | 1,877 | | | 31,192 | | | 169,290 | |
| Revaluation surplus | Revaluation surplus | 41,490 | | | 0 | | | 0 | | | 0 | | | 0 | | | 0 | | | 0 | | | 41,490 | |
| | Reclassification from investment property | 3,127 | | | 0 | | | 0 | | | 0 | | | 0 | | | 0 | | | 0 | | | 3,127 | |
| | Transfers | |
| | Transfers | |
| | Transfers | Transfers | 0 | | | (177) | | | 10,101 | | | 16,182 | | | 0 | | | 59 | | | (26,165) | | | 0 | |
| Disposals | Disposals | (10,118) | | | 0 | | | (73) | | | (3,092) | | | 0 | | | (37) | | | 0 | | | (13,320) | |
| Disposals of subsidiaries | (13,496) | | | 0 | | | 0 | | | 0 | | | 0 | | | 0 | | | 0 | | | (13,496) | |
| | Reclassification to non-income tax credits (*) | |
| Reclassification to non-income tax credits (*) | |
| Reclassification to non-income tax credits (*) | Reclassification to non-income tax credits (*) | 0 | | | 0 | | | 0 | | | (363) | | | 0 | | | 0 | | | 0 | | | (363) | |
| Depreciation | Depreciation | 0 | | | (3,086) | | | (21,055) | | | (62,788) | | | (52,147) | | | (1,503) | | | 0 | | | (140,579) | |
| Closing net book amount | Closing net book amount | 694,166 | | | 21,585 | | | 177,604 | | | 95,905 | | | 304,829 | | | 6,463 | | | 57,740 | | | 1,358,292 | |
| At December 31, 2020 | | | | | | | | | | | | | | | |
| At December 31, 2023 | |
| Fair value for farmlands / Cost | |
| Fair value for farmlands / Cost | |
| Fair value for farmlands / Cost | Fair value for farmlands / Cost | 694,166 | | | 44,278 | | | 379,666 | | | 743,444 | | | 676,516 | | | 25,189 | | | 57,740 | | | 2,620,999 | |
| Accumulated depreciation | Accumulated depreciation | 0 | | | (22,693) | | | (202,062) | | | (647,539) | | | (371,687) | | | (18,726) | | | 0 | | | (1,262,707) | |
| Net book amount | Net book amount | 694,166 | | | 21,585 | | | 177,604 | | | 95,905 | | | 304,829 | | | 6,463 | | | 57,740 | | | 1,358,292 | |
(*) Brazilian federal tax law allows entities to take a percentage of the total cost of the assets purchased as a tax credit. As of December 31, 2023 and 2022, ICMS (Imposto sobre Circulação de Mercadorias e Prestação de Serviços) tax credits were reclassified to trade and other receivables.
Adecoagro S.A.
Notes to the Consolidated Financial Statements (Continued)
(All amounts in US$ thousands, except shares and per share data and as otherwise indicated)
12. Property, plant and equipment, net (continued)
(*) Brazilian federal tax law allows entities to take a percentage of the total cost of the assets purchased as a tax credit. As of December 31, 2020 and 2019, ICMS (Imposto sobre Circulação de Mercadorias e Prestação de Serviços) tax credits were reclassified to trade and other receivables.
Depreciation is calculated using the straight-line method to allocatedallocate their cost over the estimated usefulluseful lives. Farmlands are not depreciated.
| | | | | |
| Farmland improvements | 5-25 years |
| Buildings and facilities | 20 years |
| Furniture and fittings | 10 years |
| Computer equipment | 3-5 years |
| Machinery and equipment | 4-10 years |
| Vehicles | 4-5 years |
| Bearer plants | 6 years - based on productivity |
The assets’ residual values and useful lives are reviewed, and adjusted if appropriate, at each statement of financial position date.
Farmlands are measured at fair value. For all farmlands withvalue using a total valuation of US$ 694 million as of December 31, 2020, the valuation was determined using sales Comparison Approachcomparison approach. prepared by an independent expert. Sale prices of comparable properties are adjusted considering the specific aspects of each property, the most relevant premiseassumption being the price per hectare (Level 3). The Group estimated that, other factors being constant, a 10% reduction on the Salessales price for the periodyear ended December 31, 20202023 would have reduced the value of the farmlands on US$ 6969.4 million (2019:(2022: US$7172.8 million), which would impact, net of its tax effect on the "Revaluation surplus" item in the statement of Changes in Shareholders' Equity. If Should farmlands were stated on thebe carried at historical cost, basis, the amountnet book value as of December 31, 20202023 would behave been US$ 194197.5 million.
Depreciation charges are included in “Cost of production of Biological Assets”,Assets," “Cost of production of manufactures products”, “Generalmanufactured products,”“General and administrative expenses”, “Sellingexpenses,”“Selling expenses” and capitalized in “Property, plant and equipment” for the years ended December 31, 20202023, 2022 and 2019.2021.
During the year ended December 31, 2020,2023, borrowing costs of US$ 3,861 (2019:4.2 million (2022:US$ 13,904)3.3 million) were capitalized as components of the cost of acquisition or construction for qualifying assets.
Certain of the Group’s assets have been pledged as collateral to secure the Group’s borrowings and other payables. The net book value of the pledged assets amounts to US$ 451,904217.8 million as of December 31, 2020 (2019:2023 (2022: US$ 324,129)345.3 million).
Adecoagro S.A.
Notes to the Consolidated Financial Statements (Continued)
(All amounts in US$ thousands, except shares and per share data and as otherwise indicated)
13. Right of use assets, net
Changes in the Group’s right of use assets, net in 20202023 and 2022 were as follows:
| | | | | | | | | | | | | | | | | |
| Agricultural partnerships (*) | | Others | | Total |
| |
| At January 1, 2019 | | | | | |
| Adoption of IFRS 16 | 194,763 | | | 10,174 | | | 204,937 | |
| Exchange differences | 1,582 | | | (14,364) | | | (12,782) | |
| Additions and re-measurements | 60,770 | | | 30,296 | | | 91,066 | |
| Depreciation | (37,278) | | | (7,890) | | | (45,168) | |
| Closing net book amount | 219,837 | | | 18,216 | | | 238,053 | |
| | | | | |
| At December 31, 2020 | | | | | |
| Opening net book amount | 219,837 | | | 18,216 | | | 238,053 | |
| Exchange differences | (47,186) | | | (3,969) | | | (51,155) | |
| Additions and re-measurements | 53,149 | | | 10,467 | | | 63,616 | |
| Depreciation | (33,530) | | | (7,290) | | | (40,820) | |
| Closing net book amount | 192,270 | | | 17,424 | | | 209,694 | |
| | | | | | | | | | | | | | | | | |
| Agricultural partnerships (*) | | Others | | Total |
| At January 1, 2022 | | | | | |
| Opening net book amount | 235,971 | | | 24,805 | | | 260,776 | |
| Exchange differences | 13,223 | | | 1,593 | | | 14,816 | |
| Additions and re-measurements | 140,724 | | | 7,204 | | | 147,928 | |
| | | | | |
| Depreciation | (56,356) | | | (6,983) | | | (63,339) | |
| Closing net book amount | 333,562 | | | 26,619 | | | 360,181 | |
| | | | | |
| At December 31, 2023 | | | | | |
| Opening net book amount | 333,562 | | | 26,619 | | | 360,181 | |
| Exchange differences | 19,095 | | | 1,074 | | | 20,169 | |
| Additions and re-measurements | 95,386 | | | 5,062 | | | 100,448 | |
| Depreciation | (63,195) | | | (10,890) | | | (74,085) | |
| Closing net book amount | 384,848 | | | 21,865 | | | 406,713 | |
(*) Agricultural partnership has an average term of 6 years duration.years.
Depreciation charges are included in “Cost of production of Biological Assets”, “CostAssets,”“Cost of production of manufactures products”, “Generalmanufactured products,”“General and administrative expenses”, “Sellingexpenses,”“Selling expenses” and capitalized in “Property, plant and equipment” for the year ended December 31, 2020.2023, 2022 and 2021.
14. Investment property
Changes in the Group’s investment property in 20202023 and 20192022 were as follows:
| | | | 2020 | | 2019 | | 2023 | | 2022 |
| Beginning of the year | Beginning of the year | 34,295 | | | 40,725 | |
| Net gain / (loss) from fair value adjustment (Note 8) | 1,077 | | | (325) | |
| Reclassification to property, plant and equipment (i) | (3,127) | | | (4,816) | |
| Net gain/(loss) from fair value adjustment (Note 8) | |
| | Exchange difference | |
| Exchange difference | |
| Exchange difference | Exchange difference | (1,066) | | | (1,289) | |
| End of the year | End of the year | 31,179 | | | 34,295 | |
| Fair value | Fair value | 31,179 | | | 34,295 | |
| Net book amount | Net book amount | 31,179 | | | 34,295 | |
(i) Relates with the expiration of contracts with third parties.
The accounting policy for all Investment properties are measured at Fair Value. For all Investment properties withfair value using a total valuation of US$ 31.2 million and US$ 34.2 million as of December 31, 2020 and 2019 respectively, the valuation was determined using Sales Comparison Approachsales comparison approach prepared by an independent expert. Sale prices of comparable properties are adjusted considering the specific aspects of each property, the most relevant premiseassumption being the price per hectare (Level 3). The increase /decreaseincrease/decrease in the Fairfair value of investment property is recognized in the Statement of income under the line item "Other“Other operating income, net"net”. The Group estimated that, other factors being constant, a 10% reduction on the Salessales price for the period ended December 31,
Adecoagro S.A.
Notes to the Consolidated Financial Statements (Continued)
(All amounts in US$ thousands, except shares 2023 and per share data and as otherwise indicated)
14. Investment property (continued)
2020 and 20192022 would have reducedcaused a reduction of US$3.3 million and US$3.3 million respectively in the value of the Investmentinvestment properties, on US$ 3.1 million and US$ 3.4 million respectively, which would impact the line item "Net“Net gain from fair value adjustment ".
15. Intangible assets
Changes in the Group’s intangible assets in 2020 and 2019 were as follows:
| | | | | | | | | | | | | | | | | | | | | | | | | | | | | |
| | Goodwill | | Software | | Trademarks | | Others | | Total |
| At January 1, 2019 | | | | | | | | | |
| Cost | 21,350 | | | 10,165 | | | 2,442 | | | 338 | | | 34,295 | |
| Accumulated amortization | 0 | | | (4,568) | | | (1,556) | | | (262) | | | (6,386) | |
| Net book amount | 21,350 | | | 5,597 | | | 886 | | | 76 | | | 27,909 | |
| Year ended December 31, 2019 | | | | | | | | | |
| Opening net book amount | 21,350 | | | 5,597 | | | 886 | | | 76 | | | 27,909 | |
| Exchange differences | (695) | | | (329) | | | (1) | | | (16) | | | (1,041) | |
| Additions | 0 | | | 2,080 | | | 6,431 | | | 106 | | | 8,617 | |
| Acquisition of subsidiaries | 0 | | | 66 | | | 0 | | | 0 | | | 66 | |
| Disposal | (635) | | | (6) | | | 0 | | | 0 | | | (641) | |
| Amortization charge (i) | 0 | | | (1,147) | | | 0 | | | (84) | | | (1,231) | |
| Closing net book amount | 20,020 | | | 6,261 | | | 7,316 | | | 82 | | | 33,679 | |
| At December 31, 2019 | | | | | | | | | |
| Cost | 20,020 | | | 11,976 | | | 8,872 | | | 428 | | | 41,296 | |
| Accumulated amortization | 0 | | | (5,715) | | | (1,556) | | | (346) | | | (7,617) | |
| Net book amount | 20,020 | | | 6,261 | | | 7,316 | | | 82 | | | 33,679 | |
| Year ended December 31, 2020 | | | | | | | | | |
| Opening net book amount | 20,020 | | | 6,261 | | | 7,316 | | | 82 | | | 33,679 | |
| Exchange differences | (1,687) | | | (954) | | | (80) | | | (35) | | | (2,756) | |
| Additions | 0 | | | 823 | | | 326 | | | 94 | | | 1,243 | |
| | | | | | | | | |
| Disposal | 0 | | | (46) | | | 0 | | | (46) | | | (92) | |
| Disposal of subsidiary | (3,851) | | | 0 | | | 0 | | | 0 | | | (3,851) | |
| Amortization charge (i) | 0 | | | (820) | | | (412) | | | (61) | | | (1,293) | |
| Closing net book amount | 14,482 | | | 5,264 | | | 7,150 | | | 34 | | | 26,930 | |
| At December 31, 2020 | | | | | | | | | |
| Cost | 14,482 | | | 11,799 | | | 9,118 | | | 441 | | | 35,840 | |
| Accumulated amortization | 0 | | | (6,535) | | | (1,968) | | | (407) | | | (8,910) | |
| Net book amount | 14,482 | | | 5,264 | | | 7,150 | | | 34 | | | 26,930 | |
(i)Amortization charges are included in “General and administrative expenses” and “Selling expenses” for the years ended December 31, 2020 and 2019, respectively. There were no impairment charges for any of the years presented (see Note 33 (a))adjustment”.
Adecoagro S.A.
Notes to the Consolidated Financial Statements (Continued)
(All amounts in US$ thousands, except shares and per share data and as otherwise indicated)
16. Biological15. Intangible assets, net
Changes in the Group’s biologicalintangible assets, net in 20202023 and 20192022 were as follows:
| | | | | | | | | | | | | | | | | | | | | | | | | | | | | | | | | | | |
| | 2020 |
| | Crops
(ii) | | Rice
(ii) | | Dairy | | All other
segments | | Sugarcane
(ii) | | Total |
| Beginning of the year | 38,404 | | | 21,484 | | | 11,521 | | | 3,673 | | | 55,354 | | | 130,436 | |
| Increase due to purchases | 0 | | | 0 | | | 0 | | | 580 | | | 0 | | | 580 | |
| Initial recognition and changes in fair value of biological assets (i) | 40,843 | | | 18,677 | | | 12,344 | | | 1,256 | | | 49,609 | | | 122,729 | |
| Decrease due to harvest / disposals | (137,204) | | | (51,673) | | | (42,641) | | | (2,760) | | | (101,967) | | | (336,245) | |
| Costs incurred during the year | 106,889 | | | 41,243 | | | 32,043 | | | 2,003 | | | 81,193 | | | 263,371 | |
| Exchange differences | (1,443) | | | (669) | | | (334) | | | (49) | | | (12,683) | | | (15,178) | |
| End of the year | 47,489 | | | 29,062 | | | 12,933 | | | 4,703 | | | 71,506 | | | 165,693 | |
| | | | | | | | | | | | | | | | | | | | | | | | | | | | | |
| | Goodwill | | Software | | Trademarks | | Others | | Total |
| At January 1, 2022 | | | | | | | | | |
| Cost | 16,626 | | | 14,217 | | | 10,525 | | | 510 | | | 41,878 | |
| Accumulated amortization | — | | | (7,732) | | | (2,334) | | | (475) | | | (10,541) | |
| Net book amount | 16,626 | | | 6,485 | | | 8,191 | | | 35 | | | 31,337 | |
| Year ended December 31, 2022 | | | | | | | | | |
| Opening net book amount | 16,626 | | | 6,485 | | | 8,191 | | | 35 | | | 31,337 | |
| Exchange differences | 1,918 | | | 732 | | | 900 | | | 1 | | | 3,551 | |
| Additions | — | | | 2,306 | | | 423 | | | 768 | | | 3,497 | |
| | | | | | | | | |
| | | | | | | | | |
| | | | | | | | | |
| Amortization charge (i) | — | | | (1,781) | | | (413) | | | (71) | | | (2,265) | |
| Closing net book amount | 18,544 | | | 7,742 | | | 9,101 | | | 733 | | | 36,120 | |
| At December 31, 2021 | | | | | | | | | |
| Cost | 18,544 | | | 17,255 | | | 11,848 | | | 1,279 | | | 48,926 | |
| Accumulated amortization | — | | | (9,513) | | | (2,747) | | | (546) | | | (12,806) | |
| Net book amount | 18,544 | | | 7,742 | | | 9,101 | | | 733 | | | 36,120 | |
| Year ended December 31, 2023 | | | | | | | | | |
| Opening net book amount | 18,544 | | | 7,742 | | | 9,101 | | | 733 | | | 36,120 | |
| Exchange differences | (4,235) | | | (1,631) | | | (2,354) | | | 58 | | | (8,162) | |
| Additions | — | | | 1,284 | | | — | | | 7 | | | 1,291 | |
| | | | | | | | | |
| | | | | | | | | |
| | | | | | | | | |
| Amortization charge (i) | — | | | (1,353) | | | (316) | | | (61) | | | (1,730) | |
| Closing net book amount | 14,309 | | | 6,042 | | | 6,431 | | | 737 | | | 27,519 | |
| At December 31, 2023 | | | | | | | | | |
| Cost | 14,309 | | | 16,908 | | | 9,494 | | | 1,344 | | | 42,055 | |
| Accumulated amortization | — | | | (10,866) | | | (3,063) | | | (607) | | | (14,536) | |
| Net book amount | 14,309 | | | 6,042 | | | 6,431 | | | 737 | | | 27,519 | |
(i)Amortization charges are included in “General and administrative expenses” and “Selling expenses” for the years ended December 31, 2023 and 2022, respectively. There were no impairment charges for any of the years presented (see Note 32 (a)).
| | | | | | | | | | | | | | | | | | | | | | | | | | | | | | | | | | | |
| | 2019 |
| | Crops
(ii) | | Rice
(ii) | | Dairy | | All other
segments | | Sugarcane
(ii) | | Total |
| Beginning of the year | 27,347 | | | 17,173 | | | 10,298 | | | 3,094 | | | 47,475 | | | 105,387 | |
| Increase due to purchases | 0 | | | 0 | | | 0 | | | 1,080 | | | 0 | | | 1,080 | |
| Initial recognition and changes in fair value of biological assets (i) | 29,741 | | | 12,215 | | | 13,510 | | | 13 | | | 13,110 | | | 68,589 | |
| Decrease due to harvest / disposals | (108,732) | | | (39,331) | | | (38,828) | | | (3,452) | | | (103,551) | | | (293,894) | |
| Costs incurred during the year | 93,715 | | | 32,802 | | | 26,735 | | | 3,035 | | | 100,775 | | | 257,062 | |
| Exchange differences | (3,667) | | | (1,375) | | | (194) | | | (97) | | | (2,455) | | | (7,788) | |
| End of the year | 38,404 | | | 21,484 | | | 11,521 | | | 3,673 | | | 55,354 | | | 130,436 | |
(i) Biological asset with a production cycleThe accompanying notes are an integral part of more than one year (that is dairy and cattle) generated “Initial recognition and changes in fair value of biological assets” amounting to US$ 13,600 for the year ended December 31, 2020 (2019: US$ 4,257). In 2020, an amount of US$ 966 (2019: US$ 2,414) was attributable to price changes, and an amount of US$ 12,634 (2019: US$ 1,843) was attributable to physical changes.
(ii) Biological assets that are measured at fair value within level 3 of the hierarchy.
F- 4547
Adecoagro S.A.
Notes to the Consolidated Financial Statements (Continued)
(All amounts in US$ thousands, except shares and per share data and as otherwise indicated)
16. Biological assets (continued)
Cost of production as of December 31, 2020:
| | | | | | | | | | | | | | | | | | | | | | | | | | | | | | | | | | | |
| Crops | | Rice | | Dairy | | All other
segments | | Sugar,
Ethanol and
Energy | | Total |
| Salaries, social security expenses and employee benefits | 2,739 | | | 5,822 | | | 4,215 | | | 672 | | | 9,084 | | | 22,532 | |
| Depreciation and amortization | 40 | | | 0 | | | 0 | | | 0 | | | 3,852 | | | 3,892 | |
| Depreciation of right of use assets | 0 | | | 0 | | | 0 | | | 0 | | | 27,862 | | | 27,862 | |
| Fertilizers, agrochemicals and seeds | 46,406 | | | 9,655 | | | 10 | | | 0 | | | 29,416 | | | 85,487 | |
| Fuel, lubricants and others | 716 | | | 534 | | | 754 | | | 51 | | | 2,053 | | | 4,108 | |
| Maintenance and repairs | 1,040 | | | 4,451 | | | 1,820 | | | 229 | | | 1,921 | | | 9,461 | |
| Freights | 1,832 | | | 453 | | | 118 | | | 49 | | | 0 | | | 2,452 | |
| Contractors and services | 30,819 | | | 15,681 | | | 0 | | | 19 | | | 4,951 | | | 51,470 | |
| Feeding expenses | 0 | | | 0 | | | 13,092 | | | 285 | | | 0 | | | 13,377 | |
| Veterinary expenses | 0 | | | 0 | | | 2,395 | | | 189 | | | 0 | | | 2,584 | |
| Energy power | 51 | | | 2,138 | | | 863 | | | 6 | | | 0 | | | 3,058 | |
| Professional fees | 565 | | | 1,838 | | | 162 | | | 4 | | | 343 | | | 2,912 | |
| Other taxes | 1,185 | | | 100 | | | 8 | | | 83 | | | 51 | | | 1,427 | |
| Lease expense and similar arrangements | 19,694 | | | 109 | | | 3 | | | 2 | | | 1,004 | | | 20,812 | |
| Others | 1,802 | | | 462 | | | 460 | | | 9 | | | 656 | | | 3,389 | |
| Subtotal | 106,889 | | | 41,243 | | | 23,900 | | | 1,598 | | | 81,193 | | | 254,823 | |
| Own agricultural produce consumed | 0 | | | 0 | | | 8,143 | | | 405 | | | 0 | | | 8,548 | |
| Total | 106,889 | | | 41,243 | | | 32,043 | | | 2,003 | | | 81,193 | | | 263,371 | |
Adecoagro S.A.
Notes to the Consolidated Financial Statements (Continued)
(All amounts in US$ thousands, except shares and per share data and as otherwise indicated)|16. Biological assets
16. BiologicalChanges in the Group’s biological assets (continued)in 2023 and 2022 were as follows:
| | | | | | | | | | | | | | | | | | | | | | | | | | | | | | | |
| | 2023 |
| | Crops
(ii) | | Rice
(ii) | | Dairy | | | | Sugarcane
(ii) | | Total |
| Beginning of the year | 72,843 | | | 54,125 | | | 30,045 | | | | | 109,431 | | | 266,444 | |
| Increase due to purchases | 369 | | | 142 | | | — | | | | | — | | | 511 | |
| | | | | | | | | | | |
| Initial recognition and changes in fair value of biological assets (i) | (10,327) | | | (4,301) | | | 8,050 | | | | | 94,436 | | | 87,858 | |
| Decrease due to harvest / disposals | (116,007) | | | (58,110) | | | (57,262) | | | | | (245,325) | | | (476,704) | |
| Costs incurred during the year | 130,965 | | | 57,990 | | | 51,901 | | | | | 146,592 | | | 387,448 | |
| Exchange differences | (22,298) | | | (17,003) | | | (9,543) | | | | | 11,324 | | | (37,520) | |
| End of the year | 55,545 | | | 32,843 | | | 23,191 | | | | | 116,458 | | | 228,037 | |
Cost of production as of December 31, 2019:
| | | | | | | | | | | | | | | | | | | | | | | | | | | | | | | | | | | |
| Crops | | Rice | | Dairy | | All other
segments | | Sugar,
Ethanol and
Energy | | Total |
| Salaries, social security expenses and employee benefits | 2,600 | | | 5,192 | | | 3,776 | | | 582 | | | 10,657 | | | 22,807 | |
| Depreciation and amortization | 3 | | | 0 | | | 0 | | | 0 | | | 5,465 | | | 5,468 | |
| Depreciation of right of use assets | 0 | | | 0 | | | 0 | | | 0 | | | 31,190 | | | 31,190 | |
| Fertilizers, agrochemicals and seeds | 40,767 | | | 9,924 | | | 0 | | | 33 | | | 40,355 | | | 91,079 | |
| Fuel, lubricants and others | 886 | | | 678 | | | 889 | | | 77 | | | 3,031 | | | 5,561 | |
| Maintenance and repairs | 996 | | | 2,648 | | | 1,582 | | | 253 | | | 2,254 | | | 7,733 | |
| Freights | 1,446 | | | 318 | | | 89 | | | 151 | | | 0 | | | 2,004 | |
| Contractors and services | 27,782 | | | 10,745 | | | 3 | | | 96 | | | 5,161 | | | 43,787 | |
| Feeding expenses | 3 | | | 0 | | | 10,538 | | | 810 | | | 0 | | | 11,351 | |
| Veterinary expenses | 0 | | | 0 | | | 2,020 | | | 209 | | | 0 | | | 2,229 | |
| Energy power | 69 | | | 2,310 | | | 979 | | | 10 | | | 0 | | | 3,368 | |
| Professional fees | 196 | | | 74 | | | 138 | | | 4 | | | 214 | | | 626 | |
| Other taxes | 1,182 | | | 105 | | | 8 | | | 96 | | | 43 | | | 1,434 | |
| Lease expense and similar arrangements | 14,767 | | | 53 | | | 3 | | | 8 | | | 1,417 | | | 16,248 | |
| Others | 3,018 | | | 755 | | | 307 | | | 28 | | | 988 | | | 5,096 | |
| Subtotal | 93,715 | | | 32,802 | | | 20,332 | | | 2,357 | | | 100,775 | | | 249,981 | |
| Own agricultural produce consumed | 0 | | | 0 | | | 6,403 | | | 678 | | | 0 | | | 7,081 | |
| Total | 93,715 | | | 32,802 | | | 26,735 | | | 3,035 | | | 100,775 | | | 257,062 | |
Biological assets in December 31, 2020 and 2019 were as follows:
| | | | | | | | | | | |
| | 2020 | | 2019 |
| Non-current | | | |
| Cattle for dairy production (i) | 12,600 | | | 11,397 | |
| Breeding cattle (ii) | 2,003 | | | 1,783 | |
| Other cattle (ii) | 122 | | | 123 | |
| | 14,725 | | | 13,303 | |
| Current | | | |
| Breeding cattle (iii) | 2,578 | | | 1,677 | |
| Other cattle (iii) | 333 | | | 214 | |
| Sown land – crops (ii) | 47,489 | | | 38,404 | |
| Sown land – rice (ii) | 29,062 | | | 21,484 | |
| Sown land – sugarcane (ii) | 71,506 | | | 55,354 | |
| | 150,968 | | | 117,133 | |
| Total biological assets | 165,693 | | | 130,436 | |
| | | | | | | | | | | | | | | | | | | | | | | | | | | | | | | |
| | 2022 |
| | Crops
(ii) | | Rice
(ii) | | Dairy | | | | Sugarcane
(ii) | | Total |
| Beginning of the year | 60,615 | | | 44,257 | | | 18,979 | | | | | 71,327 | | | 195,178 | |
| Increase due to purchases | 3,028 | | | 704 | | | — | | | | | — | | | 3,732 | |
| Acquisition of subsidiary | — | | | 1,676 | | | — | | | | | — | | | 1,676 | |
| Initial recognition and changes in fair value of biological assets (i) | 64,061 | | | 16,557 | | | 27,257 | | | | | 108,066 | | | 215,941 | |
| Decrease due to harvest / disposals | (245,660) | | | (81,424) | | | (79,474) | | | | | (202,298) | | | (608,856) | |
| | | | | | | | | | | |
| Costs incurred during the year | 181,163 | | | 68,432 | | | 60,826 | | | | | 128,308 | | | 438,729 | |
| Exchange differences | 9,636 | | | 3,923 | | | 2,457 | | | | | 4,028 | | | 20,044 | |
| End of the year | 72,843 | | | 54,125 | | | 30,045 | | | | | 109,431 | | | 266,444 | |
(i)Classified as bearer Biological asset with a production cycle of more than one year (that is dairy and mature biological assets.
(ii)Classified as consumablecattle) generated “Initial recognition and immature biological assets.
(iii)Classified as consumable and mature biological assets.
Adecoagro S.A.
Notes to the Consolidated Financial Statements (Continued)
(All amountschanges in US$ thousands, except shares and per share data and as otherwise indicated)
16. Biological assets (continued)
The fair value less estimated point of sale costs of agricultural produce at the point of harvest amountedbiological assets” amounting to US$ 290,84415,795 for the year ended December 31, 2020 (2019:2023 (2022: US$ 251,614)26,978). In 2023, an amount of US$3,999 (2022: US$4,653) was attributable to price changes, and an amount of US$11,796 (2022: US$22,325) was attributable to physical changes.
The following table presents the Group´s biological(ii) Biological assets that are measured at fair value at December 31, 2020 and 2019 (see Note 18 to seewithin level 3 of the description of each fair value level):hierarchy.
| | | | | | | | | | | | | | | | | | | | | | | | | | | | | | | | | | | | | | | | | | | | | | | |
| | 2020 | | 2019 |
| | Level 1 | | Level 2 | | Level 3 | | Total | | Level 1 | | Level 2 | | Level 3 | | Total |
| | | | | | | | | | | | | | | |
| Cattle for dairy production | 0 | | | 12,600 | | | 0 | | | 12,600 | | | 0 | | | 11,397 | | | 0 | | | 11,397 | |
| Breeding cattle | 4,581 | | | 0 | | | 0 | | | 4,581 | | | 3,460 | | | 0 | | | 0 | | | 3,460 | |
| Other cattle | 0 | | | 455 | | | 0 | | | 455 | | | 0 | | | 337 | | | 0 | | | 337 | |
| Sown land – sugarcane | 0 | | | 0 | | | 71,506 | | | 71,506 | | | 0 | | | 0 | | | 55,354 | | | 55,354 | |
| Sown land – crops | 0 | | | 0 | | | 47,489 | | | 47,489 | | | 0 | | | 0 | | | 38,404 | | | 38,404 | |
| Sown land – rice | 0 | | | 0 | | | 29,062 | | | 29,062 | | | 0 | | | 0 | | | 21,484 | | | 21,484 | |
There were no transfers between any levels during the year.
The following significant unobservable inputs were used to measure the Group´s biological assets using the discounted cash flow valuation technique:
| | | | | | | | | | | | | | | | | | | | | | | | | | |
| Description | | Unobservable
inputs | | Range of unobservable inputs | | Relationship of unobservable
inputs to fair value |
| | | | | 2020 | | 2019 | | |
| Sown land – sugarcane | | Sugarcane yield – tonnes per hectare; Sugarcane TRS (kg of sugar per ton of cane) Production Costs – US$ per hectare. (Include maintenance, harvest and leasing costs)
| | '-Sugarcane yield: 60-100 tn/ha -Sugarcane TRS: 120-140 kg of sugar/ton of cane -Maintenance costs: 400-600 US$/ha -Harvest costs: 6.0-12.0 US$/ton of cane -Leasing costs: 12.0-14.4 tn/ha | | '-Sugarcane yield: 60-100tn/ha - Sugarcane TRS: 120-140kg of sugar/ton of cane - Maintenance costs: 500-700 US$/ha - Harvest costs: 9.0-15.0 US$/ton of cane - Leasing costs: 12.0-14.4 tn/ha | | The higher the sugarcane yield, the higher the fair value. The higher the maintenance, harvest and leasing costs per hectare, the lower the fair value. The higher the TRS of sugarcane, the higher the fair value.
|
| Sown land – crops | | Crops yield – tonnes per hectare; Commercial Costs – US$ per hectare;
Production Costs – US$ per hectare.
| | '- Crops yield: 0.95 – 5.5 tn/ha for Wheat, 2.5 – 11 tn/ha for Corn, 0.8 - 3.8 tn/ha for Soybean, 0.6 - 3 for Sunflower and 2.5 - 3.5 tn/ha for Peanut - Commercial Costs: 6-43 US$/tn for Wheat, 2-51 US$/ton for Corn, 7-59 US$/ton for Soybean, 1-71 US$/ton for Sunflower and 22-31 US$/ha for Peanut - Production Costs: 115-612 US$/ha for Wheat, 198-990 US$/ha for Corn, 159-750 US$/ha for Soybean, 233-641 US$/ha for Sunflower and 695-1400 US$/ha for Peanut | | '- Crops yield: 0.95 – 4.69 tn/ha for Wheat, 2.5 – 10 tn/ha for Corn, 1.19 - 3.8 tn/ha for Soybean and 1.6-3 for Sunflower - Commercial Costs: 6-43 US$/ha for Wheat, 2-51 US$/ha for Corn, 7-59 US$/ha for Soybean and 2-71 US$/ha for Sunflower - Production Costs: 115-574 US$/ha for Wheat, 198-859 US$/ha for Corn, 159-679 US$/ha for Soybean and 233-641 US$/ha for Sunflower | | The higher the crops yield, the higher the fair value. The higher the commercial and direct costs per hectare, the lower the fair value.
|
| Sown land – rice | | Rice yield – tonnes per hectare;
Commercial Costs – US$ per hectare;
Production Costs – US$ per hectare. | | '-Rice yield: 6.5 -7.5 tn/ha -Commercial Costs: 8-16 US$/ha -Production Costs: 750-950 US$/ha | | '-Rice yield: 6.5 -7.5 tn/ha -Commercial Costs: 8-12 US$/ha -Production Costs: 750-950 US$/ha | | The higher the rice yield, the higher the fair value. The higher the commercial and direct costs per hectare, the lower the fair value.
|
Adecoagro S.A.
Notes to the Consolidated Financial Statements (Continued)
(All amounts in US$ thousands, except shares and per share data and as otherwise indicated)
16. Biological assets (continued)
AsCost of December 31, 2020, the impact of a reasonable 10% increase (decrease) in estimated costs, with all other variables held constant, would result in a decrease (increase) in the fair value of the Group’s plantations less cost to sell of US$ 14.7 million for sugarcane, US$ 3.7 million for crops and US$ 3.7 million for rice.
As of December 31, 2019, the impact of a reasonable 10% increase (decrease) in estimated costs, with all other variables held constant, would result in a decrease (increase) in the fair value of the Group’s plantations less cost to sell of US$ 7.9 million for sugarcane, US$ 2.8 million for crops and US$ 2.0 million for rice.
17. Investments in joint ventures
The table below lists the Group’s investment in joint venturesproduction for the year ended December 31, 2018:2023:
| | | | | | | | |
| | % of ownership interest held |
Name of the entity | Country of
incorporation and operation | 2018 |
CHS AGRO S.A. | Argentina | 50 | % |
| | | | | | | | | | | | | | | | | | | | | | | | | | | | | | | |
| Crops | | Rice | | Dairy | | | | Sugar,
Ethanol and
Energy | | Total |
| Salaries, social security expenses and employee benefits | 3,572 | | | 10,333 | | | 7,280 | | | | | 13,553 | | | 34,738 | |
| Depreciation and amortization | — | | | — | | | — | | | | | 5,192 | | | 5,192 | |
| Depreciation of right of use assets | — | | | — | | | — | | | | | 56,256 | | | 56,256 | |
| Fertilizers, agrochemicals and seeds | 63,742 | | | 17,333 | | | — | | | | | 49,125 | | | 130,200 | |
| Fuel, lubricants and others | 860 | | | 979 | | | 903 | | | | | 3,924 | | | 6,666 | |
| Maintenance and repairs | 1,958 | | | 6,351 | | | 3,175 | | | | | 3,494 | | | 14,978 | |
| Freights | 1,534 | | | 473 | | | 109 | | | | | — | | | 2,116 | |
| Contractors and services | 30,694 | | | 17,447 | | | — | | | | | 10,731 | | | 58,872 | |
| Feeding expenses | 1,578 | | | 189 | | | 23,711 | | | | | — | | | 25,478 | |
| Veterinary expenses | 126 | | | 65 | | | 2,334 | | | | | — | | | 2,525 | |
| Energy power | 29 | | | 1,847 | | | 1,339 | | | | | — | | | 3,215 | |
| Professional fees | 282 | | | 287 | | | 219 | | | | | 393 | | | 1,181 | |
| Other taxes | 480 | | | 142 | | | 148 | | | | | 52 | | | 822 | |
| Lease expense and similar arrangements | 24,536 | | | 1,547 | | | — | | | | | 2,100 | | | 28,183 | |
| Others | 867 | | | 925 | | | 487 | | | | | 1,772 | | | 4,051 | |
| Subtotal | 130,258 | | | 57,918 | | | 39,705 | | | | | 146,592 | | | 374,473 | |
| Own agricultural produce consumed | 707 | | | 72 | | | 12,196 | | | | | — | | | 12,975 | |
| Total | 130,965 | | | 57,990 | | | 51,901 | | | | | 146,592 | | | 387,448 | |
On February 26, 2013, the Group formed CHS AGRO, a joint venture with CHS Inc. CHS Inc. is a leading farmer-owned energy, grains and foods company based in the United States. The Group holds a 50% interest in CHS AGRO. On October 2014, CHS AGRO finished its sunflower processing plant in the city of Pehuajo, Province of Buenos Aires, Argentina.
In January 2019, the Company acquired, the remaining 50% of CHS Agro S.A. a joint venture between the Company and CHS Argentina S.A. After this acquisition, the Company own 100% of CHS Agro S.A. which has since been renamed as Girasoles del Plata S.A. (See Note 22). Thus, the Company is not part of any Joint Venture as of December 31, 2020 and 2019.
The following amounts represent the income and expenses of the joint ventures:
| | | | | |
| 2018 |
Income | 9,305 | |
Expenses | (31,989) | |
Loss before income tax | (22,684) | |
When the share of losses of an investee equals or exceeds the carrying amount of an investment the Group discontinue applying the equity method, the investment is reduced to zero and does not record additional losses. This was the case in 2018.
Adecoagro S.A.
Notes to the Consolidated Financial Statements (Continued)
(All amounts in US$ thousands, except shares and per share data and as otherwise indicated)
16. Biological assets (continued)
Cost of production for the year ended December 31, 2022:
| | | | | | | | | | | | | | | | | | | | | | | | | | | | | | | |
| Crops | | Rice | | Dairy | | | | Sugar,
Ethanol and
Energy | | Total |
| Salaries, social security expenses and employee benefits | 5,534 | | | 11,319 | | | 7,592 | | | | | 11,795 | | | 36,240 | |
| | | | | | | | | | | |
| Depreciation and amortization | — | | | — | | | — | | | | | 5,024 | | | 5,024 | |
| Depreciation of right of use assets | — | | | — | | | — | | | | | 42,166 | | | 42,166 | |
| Fertilizers, agrochemicals and seeds | 68,971 | | | 17,220 | | | — | | | | | 46,020 | | | 132,211 | |
| Fuel, lubricants and others | 1,078 | | | 1,468 | | | 1,419 | | | | | 4,636 | | | 8,601 | |
| Maintenance and repairs | 1,913 | | | 6,693 | | | 3,979 | | | | | 3,172 | | | 15,757 | |
| Freights | 4,245 | | | 609 | | | 202 | | | | | — | | | 5,056 | |
| | | | | | | | | | | |
| | | | | | | | | | | |
| Contractors and services | 49,533 | | | 22,321 | | | — | | | | | 8,620 | | | 80,474 | |
| | | | | | | | | | | |
| Feeding expenses | 271 | | | 101 | | | 24,940 | | | | | — | | | 25,312 | |
| Veterinary expenses | 217 | | | 84 | | | 3,715 | | | | | — | | | 4,016 | |
| Energy power | 47 | | | 5,447 | | | 1,286 | | | | | — | | | 6,780 | |
| Professional fees | 552 | | | 404 | | | 309 | | | | | 489 | | | 1,754 | |
| Other taxes | 1,273 | | | 249 | | | 14 | | | | | 128 | | | 1,664 | |
| | | | | | | | | | | |
| Lease expense and similar arrangements | 45,794 | | | 968 | | | — | | | | | 4,978 | | | 51,740 | |
| | | | | | | | | | | |
| | | | | | | | | | | |
| Others | 925 | | | 1,394 | | | 386 | | | | | 1,280 | | | 3,985 | |
| Subtotal | 180,353 | | | 68,277 | | | 43,842 | | | | | 128,308 | | | 420,780 | |
| Own agricultural produce consumed | 810 | | | 155 | | | 16,984 | | | | | — | | | 17,949 | |
| Total | 181,163 | | | 68,432 | | | 60,826 | | | | | 128,308 | | | 438,729 | |
Biological assets in December 31, 2023 and 2022 were as follows:
| | | | | | | | | | | |
| | 2023 | | 2022 |
| Non-current | | | |
| Cattle for dairy production (i) | 23,191 | | | 29,483 | |
| Breeding cattle (ii) | 371 | | | 821 | |
| Other cattle (ii) | 144 | | | 318 | |
| | | |
| | | |
| | 23,706 | | | 30,622 | |
| Current | | | |
| Breeding cattle (iii) | 6,037 | | | 7,075 | |
| Other cattle (iii) | — | | | 562 | |
| Sown land – crops (ii) | 49,813 | | | 66,002 | |
| Sown land – rice (ii) | 32,023 | | | 52,752 | |
| Sown land – sugarcane (ii) (iv) | 116,458 | | | 109,431 | |
| | 204,331 | | | 235,822 | |
| Total biological assets | 228,037 | | | 266,444 | |
(i)Classified as bearer and mature biological assets.
(ii)Classified as consumable and immature biological assets.
(iii)Classified as consumable and mature biological assets.
(iv)It includes 3,833 and 4,849 of crops planted in sugarcane farms.
Adecoagro S.A.
Notes to the Consolidated Financial Statements (Continued)
(All amounts in US$ thousands, except shares and per share data and as otherwise indicated)
16. Biological assets (continued)
The fair value less estimated point of sale costs of agricultural produce at the point of harvest amounted to US$419,442 for the year ended December 31, 2023 (2022: US$522,894).
The following table presents the Group’s biological assets that are measured at fair value at December 31, 2023 and 2022 (See Note 17 for a the description of each fair value level):
| | | | | | | | | | | | | | | | | | | | | | | | | | | | | | | | | | | | | | | | | | | | | | | |
| | 2023 | | 2022 |
| | Level 1 | | Level 2 | | Level 3 | | Total | | Level 1 | | Level 2 | | Level 3 | | Total |
| | | | | | | | | | | | | | | |
| Cattle for dairy production | — | | | 23,191 | | | — | | | 23,191 | | | — | | | 29,483 | | | — | | | 29,483 | |
| Breeding cattle | 6,408 | | | — | | | — | | | 6,408 | | | 7,896 | | | — | | | — | | | 7,896 | |
| Other cattle | — | | | 144 | | | — | | | 144 | | | — | | | 880 | | | — | | | 880 | |
| Sown land – sugarcane | — | | | — | | | 116,458 | | | 116,458 | | | — | | | — | | | 109,431 | | | 109,431 | |
| Sown land – crops | — | | | — | | | 49,813 | | | 49,813 | | | — | | | — | | | 66,002 | | | 66,002 | |
| Sown land – rice | — | | | — | | | 32,023 | | | 32,023 | | | — | | | — | | | 52,752 | | | 52,752 | |
There were no transfers between any levels during the year.
The following significant unobservable inputs were used to measure the Group’s biological assets using the discounted cash flow valuation technique:
| | | | | | | | | | | | | | | | | | | | | | | | | | |
| Description | | Unobservable
inputs | | Range of unobservable inputs | | Relationship of unobservable
inputs to fair value |
| | | | | 2023 | | 2022 | | |
| Sown land – sugarcane | | Sugarcane yield – tonnes per hectare; Sugarcane TRS (kg of sugar per ton of cane) Production Costs – US$ per hectare. (Include maintenance, harvest and leasing costs)
| | '-Sugarcane yield: 50-100 tonnes/ha -Sugarcane TRS: 120-140 kg of sugar/tonnes of cane -Maintenance costs: 550-850 US$/ha -Harvest costs: 7.0-13.0 US$/tonnes of cane -Leasing costs: 12.0-14.4 tonnes/ha-Discount rate: 14.44% in Brazilian real. | | '-Sugarcane yield: 50-100 tonnes/ha - Sugarcane TRS: 120-140kg of sugar/tonnes of cane - Maintenance costs: 500-800 US$/ha - Harvest costs: 6.0-12.0 US$/ tonnes of cane - Leasing costs: 12.0-14.4 tonnes/ha-Discount rate: 16.49% in Brazilian real. | | The higher the sugarcane yield, the higher the fair value. The higher the maintenance, harvest and leasing costs per hectare, the lower the fair value. The higher the TRS of sugarcane, the higher the fair value.
|
| Sown land – crops | | Crops yield – tonnes per hectare; Commercial Costs – US$ per hectare;
Production Costs – US$ per hectare.
| | '- Crops yield: 0.37 – 4.6 tonnes/ha for Wheat, 3.6 – 11 tonnes/ha for Corn, 0.9 - 3.7 tonnes/ha for Soybean, 0.8 - 2.2 for Sunflower and 2.4 - 3.6 tonnes/ha for Peanut - Commercial Costs: 14-39 US$/tonnes for Wheat, 16-65 US$/tonnes for Corn, 21-48 US$/tonnes for Soybean, 22-65 US$/tonnes for Sunflower and 25-56 US$/ha for Peanut - Production Costs: 143-823 US$/ha for Wheat, 231-1318 US$/ha for Corn, 193-776 US$/ha for Soybean, 215-1000 US$/ha for Sunflower and 861-1866 US$/ha for Peanut-Discount rate: 6% in US$. | | '- Crops yield: 1.00 – 5.6 tonnes/ha for Wheat, 1.6 – 13 tonnes/ha for Corn, 0.4 - 5.0 tonnes/ha for Soybean, 0.9-2.2 for Sunflower and 1.8 - 5.1 tonnes/ha for Peanut - Commercial Costs: 13-45 US$/ha for Wheat, 16-65 US$/ha for Corn, 21-65 US$/ha for Soybean, 17-36 US$/ha for Sunflower and 28.0 - 46.0 US$/ha for Peanut - Production Costs: 200-840 US$/ha for Wheat, 325-1500 US$/ha for Corn, 260-1100 US$/ha for Soybean, 280-890 US$/ha for Sunflower and 756.0 - 2,000.0 US$/ha for Peanut-Discount rate: 6% in US$. | | The higher the crops yield, the higher the fair value. The higher the commercial and direct costs per hectare, the lower the fair value.
|
| Sown land – rice | | Rice yield – tonnes per hectare;
Commercial Costs – US$ per hectare;
Production Costs – US$ per hectare. | | '-Rice yield: 4.7 -6.4 tonnes/ha -Commercial Costs: 2-5 US$/ha -Production Costs: 1033-3121 US$/ha-Discount rate: 6% in US$. | | '-Rice yield: 1.4 -9.2 tonnes/ha -Commercial Costs: 3-23 US$/ha -Production Costs: 760-1250 US$/ha-Discount rate: 6% in US$. | | The higher the rice yield, the higher the fair value. The higher the commercial and direct costs per hectare, the lower the fair value.
|
Adecoagro S.A.
Notes to the Consolidated Financial Statements (Continued)
(All amounts in US$ thousands, except shares and per share data and as otherwise indicated)
16. Biological assets (continued)
As of December 31, 2023, the impact of a reasonable 10% increase / (decrease) in estimated costs, with all other variables held constant, would result in a decrease (increase) in the fair value of the Group’s biological asset less cost to sell of US$23.3 million for sugarcane, US$3.4 million for crops and US$6.5 million for rice.
As of December 31, 2022, the impact of a reasonable 10% increase / (decrease) in estimated costs, with all other variables held constant, would result in a decrease (increase) in the fair value of the Group’s biological asset less cost to sell of US$18.5 million for sugarcane, US$3.8 million for crops and US$6.0 million for rice.
“La Niña” weather event
“La Niña” is a weather phenomenon caused by the fluctuation of the ocean temperatures in the central and eastern equatorial Pacific due to changes in the atmosphere, which affects the climate of several regions worldwide. When the temperature of the ocean decreases by 0.5°C below the five-quarter average, a so called “La Niña” weather pattern begins. This whether phenomenon is characterized by below average precipitations during spring and summertime in South America. We have experienced this weather pattern in Argentina and Uruguay, where most of our Farming operations are based, throughout the last three consecutive years and it has extended its effects during the beginning of 2023 and continue affecting production as of today, resulting in a severe drought in almost all productive regions in Argentina and Uruguay. Our diversification in terms of geographic footprint and crops planted (soybean, peanut, corn, wheat, sunflower, among others), acts as a natural hedge against weather risk, and enables us to adopt defensive strategies such as delaying planting activities and switching between crops which are either more resilient to dry weather or have a later development stage. However, and despite our ability to partially mitigate this effect, during 2023, as a consequence of the La Niña weather event, we foresee that the yields of our different crops had a reduction ranging from 18% to 60%, depending on the crop, thus significantly affecting our results of operations.
17. Financial instruments by category
The Group classified its financial assets in the following categories:
(a) Financial assets at fair value through profit or loss
Financial assets at fair value through profit or loss are financial assets held for trading. A financial asset is classified in this category if acquired principally for the purpose of selling in the short-term. Derivatives are also categorized as held for trading unless they are designated as hedges. For all years presented, the Group’s financial assets at fair value through profit or loss comprise mainly short-term investment and derivative financial instruments.
(b) Financial assets at amortized cost.
Financial assets at amortized cost, namely loans and receivables, are non-derivative financial assets with fixed or determinable payments that are not quoted in an active market. Loans and receivables comprise “trade and other receivables” and “cash and cash equivalents” in the statement of financial position.
The following tables show the carrying amounts of financial assets and financial liabilities by category of financial instrument and reconciliation to the corresponding line item in the statements of financial position, as appropriate. Since the line items “Trade and other receivables, net” and “Trade and other payables” contain both financial instruments and non-financial assets or liabilities (such as other tax receivables or advance payments for services to be received in the future), the reconciliation is shown in the columns headed “Non-financial assets” and “Non-financial liabilities”.
| | | | | | | | | | | | | | | | | | | | | | | | | | | | | |
| | Financial assets at amortized cost | | Assets at fair
value through
profit or loss | | Subtotal
financial
assets | | Non-
financial
assets | | Total |
| December 31, 2020 | | | | | | | | | |
| Assets as per statement of financial position | | | | | | | | | |
| Trade and other receivables | 109,231 | | | 0 | | | 109,231 | | | 88,697 | | | 197,928 | |
| Derivative financial instruments | 0 | | | 2,102 | | | 2,102 | | | 0 | | | 2,102 | |
| Cash and cash equivalents | 336,282 | | | 0 | | | 336,282 | | | 0 | | | 336,282 | |
| Total | 445,513 | | | 2,102 | | | 447,615 | | | 88,697 | | | 536,312 | |
Adecoagro S.A.
Notes to the Consolidated Financial Statements (Continued)
(All amounts in US$ thousands, except shares and per share data and as otherwise indicated)
17. Financial instruments by category (continued)
| | | | | | | | | | | | | | | | | | | | | | | | | | | | | |
| | Financial assets at amortized cost | | Financial assets at fair
value through
profit or loss | | Subtotal
financial
assets | | Non-
financial
assets | | Total |
| December 31, 2023 | | | | | | | | | |
| Assets as per statement of financial position | | | | | | | | | |
| Trade and other receivables | 113,831 | | | — | | | 113,831 | | | 104,284 | | | 218,115 | |
| Derivative financial instruments | — | | | 31,820 | | | 31,820 | | | — | | | 31,820 | |
| Short term investment | — | | | 62,637 | | | 62,637 | | | — | | | 62,637 | |
| Cash and cash equivalents | 339,781 | | | — | | | 339,781 | | | — | | | 339,781 | |
| Total | 453,612 | | | 94,457 | | | 548,069 | | | 104,284 | | | 652,353 | |
| | | | Liabilities at
fair value
through profit
or loss | | Financial
liabilities at
amortized cost | | Subtotal
financial
liabilities | | Non-
financial
liabilities | | Total | | Financial
liabilities at
amortized cost | | Liabilities at
fair value
through profit
or loss | | Subtotal
financial
liabilities | | Non-
financial
liabilities | | Total |
| Liabilities as per statement of financial position | Liabilities as per statement of financial position | | | | | | | | | | Liabilities as per statement of financial position | | | |
| Trade and other payables | Trade and other payables | 0 | | | 114,813 | | | 114,813 | | | 11,792 | | | 126,605 | |
| Borrowings (i) | Borrowings (i) | 0 | | | 971,090 | | | 971,090 | | | 0 | | | 971,090 | |
| | Leases Liabilities | Leases Liabilities | 0 | | | 195,772 | | | 195,772 | | | 0 | | | 195,772 | |
| Leases Liabilities | |
| Leases Liabilities | |
| Derivative financial instruments (i) | Derivative financial instruments (i) | 13,141 | | | 0 | | | 13,141 | | | 0 | | | 13,141 | |
| Total | Total | 13,141 | | | 1,281,675 | | | 1,294,816 | | | 11,792 | | | 1,306,608 | |
| | | | | | | | | | | | | | | | | | | | | | | | | | | | | |
| | Financial assets at amortized cost | | Financial assets at fair
value through
profit or loss | | Subtotal
financial
assets | | Non-
financial
assets | | Total |
| December 31, 2022 | | | | | | | | | |
| Assets as per statement of financial position | | | | | | | | | |
| Trade and other receivables | 108,025 | | | — | | | 108,025 | | | 120,353 | | | 228,378 | |
| Derivative financial instruments | — | | | 5,342 | | | 5,342 | | | — | | | 5,342 | |
| Short term investment | — | | | 98,571 | | | 98,571 | | | — | | | 98,571 | |
| Cash and cash equivalents | 230,653 | | | — | | | 230,653 | | | — | | | 230,653 | |
| Total | 338,678 | | | 103,913 | | | 442,591 | | | 120,353 | | | 562,944 | |
Adecoagro S.A.
Notes to the Consolidated Financial Statements (Continued)
(All amounts in US$ thousands, except shares and per share data and as otherwise indicated)
17. Financial instruments by category (continued)
| | | | | | | | | | | | | | | | | | | | | | | | | | | | | |
| | Financial
liabilities at
amortized cost | | Liabilities at
fair value
through profit
or loss | | Subtotal
financial
liabilities | | Non-
financial
liabilities | | Total |
| Liabilities as per statement of financial position | | | | | | | | | |
| Trade and other payables | 214,990 | | | — | | | 214,990 | | | 44,617 | | | 259,607 | |
| Borrowings (i) | 1,007,752 | | | — | | | 1,007,752 | | | — | | | 1,007,752 | |
| Leases Liabilities | 337,980 | | | — | | | 337,980 | | | — | | | 337,980 | |
| Derivative financial instruments (i) | — | | | 3,057 | | | 3,057 | | | — | | | 3,057 | |
| Total | 1,560,722 | | | 3,057 | | | 1,563,779 | | | 44,617 | | | 1,608,396 | |
(i) Effective July 1, 2013, theThe Group formally documenteddocuments and designateddesignates cash flow hedging relationships to hedge the foreign exchange rate risk of a portion of its highly probable future sales in U.S. Dollars using a portion of its borrowings denominated in U.S. Dollars, currency forwards and foreign currency floating-to-fixed interest rate swaps (see(See Note 2).
Adecoagro S.A.
Notes to the Consolidated Financial Statements (Continued)
(All amounts in US$ thousands, except shares and per share data and as otherwise indicated)
18. Financial instruments by category (continued)
| | | | | | | | | | | | | | | | | | | | | | | | | | | | | |
| | Financial assets at amortized cost | | Assets at fair
value through
profit or loss | | Subtotal
financial
assets | | Non-
financial
assets | | Total |
| December 31, 2019 | | | | | | | | | |
| Assets as per statement of financial position | | | | | | | | | |
| Trade and other receivables | 88,113 | | | 0 | | | 88,113 | | | 84,218 | | | 172,331 | |
| Derivative financial instruments | 0 | | | 1,435 | | | 1,435 | | | 0 | | | 1,435 | |
| Cash and cash equivalents | 290,276 | | | 0 | | | 290,276 | | | 0 | | | 290,276 | |
| Total | 378,389 | | | 1,435 | | | 379,824 | | | 84,218 | | | 464,042 | |
| | | | | | | | | | | | | | | | | | | | | | | | | | | | | |
| | Liabilities at
fair value
through profit
or loss | | Financial
liabilities at
amortized cost | | Subtotal
financial
liabilities | | Non-
financial
liabilities | | Total |
| Liabilities as per statement of financial position | | | | | | | | | |
| Trade and other payables | 0 | | | 98,420 | | | 98,420 | | | 12,066 | | | 110,486 | |
| Borrowings (i) | 0 | | | 968,280 | | | 968,280 | | | 0 | | | 968,280 | |
| Leases Liabilities | 0 | | | 216,384 | | | 216,384 | | | 0 | | | 216,384 | |
| Derivative financial instruments (i) | 1,423 | | | 0 | | | 1,423 | | | 0 | | | 1,423 | |
| Total | 1,423 | | | 1,283,084 | | | 1,284,507 | | | 12,066 | | | 1,296,573 | |
(i) Effective July 1, 2013 the Group formally documented and designated cash flow hedging relationships to hedge the foreign exchange rate risk of a portion of its highly probable future sales in U.S. Dollars using a portion of its borrowings denominated in U.S. Dollars, currency forwards and foreign currency floating-to-fixed interest rate swaps (see Note 2)2 for details).
Because of the short maturities of most trade accounts receivable and payable, other receivables and liabilities, and cash and cash equivalents, their carrying amounts at the closing date do not differ significantly from their respective fair values. The fair value of long-term borrowings is disclosed in Note 27.26.
Income, expense, gains and losses on financial instruments can be assigned to the following categories:
| | | | | | | | | | | | | | | | | | | | | | | |
| | Financial asset / liabilities at amortized cost | | Assets/ liabilities
at fair value
through profit or
loss | | Other financial
liabilities at
amortized cost | | Total |
| December 31, 2020 | | | | | | | |
| Interest income (i) | 4,084 | | | 0 | | | 0 | | | 4,084 | |
| Interest expense (i) | (58,282) | | | 0 | | | 0 | | | (58,282) | |
| Foreign exchange (losses) / gain (i) | (109,266) | | | 0 | | | 0 | | | (109,266) | |
| Loss from derivative financial instruments (ii) | 0 | | | (8,228) | | | 0 | | | (8,228) | |
| Finance cost related to lease liabilities | (12,532) | | | 0 | | | 0 | | | (12,532) | |
| | | | | | | |
| | | | | | | | | | | | | | | | | | | |
| | Financial asset / liabilities at amortized cost | | Assets/ liabilities
at fair value
through profit or
loss | | | | Total |
| December 31, 2023 | | | | | | | |
| Interest income (i) | 7,134 | | | — | | | | | 7,134 | |
| Interest expense (i) | (31,906) | | | — | | | | | (31,906) | |
| Foreign exchange gain (i) | 90,930 | | | — | | | | | 90,930 | |
| Gain from derivative financial instruments (ii) | 47 | | | 10,367 | | | | | 10,414 | |
| Finance cost related to lease liabilities | (40,203) | | | — | | | | | (40,203) | |
| | | | | | | |
F- 51
Adecoagro S.A.
Notes to the Consolidated Financial Statements (Continued)
(All amounts in US$ thousands, except shares and per share data and as otherwise indicated)
18. Financial instruments by category (continued)
| | | | Financial assets / liabilities at amortized cost | | Assets/ liabilities
at fair value
through profit or
loss | | Other financial
liabilities at
amortized cost | | Total |
| December 31, 2019 | | | | | | | |
| | |
| | | Financial assets / liabilities at amortized cost | | Assets/ liabilities
at fair value
through profit or
loss | | | | Total |
| December 31, 2022 | | December 31, 2022 | | | | | | | |
| Interest income (i) | Interest income (i) | 6,390 | | | 0 | | | 0 | | | 6,390 | |
| Interest expense (i) | Interest expense (i) | (56,441) | | | (27) | | | 0 | | (56,468) | |
| Foreign exchange gains losses (i) | (19,807) | | | (5,972) | | | 0 | | | (25,779) | |
| (Loss) / gain from derivative financial instruments (ii) | (870) | | | 1,441 | | | 0 | | | 571 | |
| Foreign exchange gains (i) | |
| Loss from derivative financial instruments (ii) | |
| Finance cost related to lease liabilities | Finance cost related to lease liabilities | (9,524) | | | 0 | | | 0 | | | (9,524) | |
|
(i)Included in “Financial Results, net” in the consolidated statement of income.
(ii)Included in “Other operating income, net” and “Financial Results, net” in the consolidated statement of income.
Adecoagro S.A.
Notes to the Consolidated Financial Statements (Continued)
(All amounts in US$ thousands, except shares and per share data and as otherwise indicated)
17. Financial instruments by category (continued)
Determining fair values
IFRS 13 defines fair value as the price that would be received to sell an asset or paid to transfer a liability in an orderly transaction between market participants at the measurement date. All financial instruments recognized at fair value are allocated to one of the valuation hierarchy levels of IFRS 13. This valuation hierarchy provides for three levels. The allocation reflects which of the fair values derive from transactions in the market and where valuation is based on models because market transactions are lacking. The level in the fair value hierarchy is categorized in its entirety is determined on the basis of the lowest level input that is significant to the fair value measurement in its entirety.
As of December 31, 20202023 and 2019,2022, the financial instruments recognized at fair value on the statement of financial position comprise derivative financial instruments.
In the case of Level 1, valuation is based on unadjusted quoted prices in active markets for identical financial assets that the Group can refer to at the date of the statement of financial position. The financial instruments the Group has allocated to this level mainly comprise crop futures and options traded on the stock market.
Derivatives not traded on the stock market allocated to Level 2 are valued using models based on observable market data. The financial instruments the Group has allocated to this level mainly comprise interest-rate swaps and foreign-currency interest-rate swaps.
In the case of Level 3, the Group uses valuation techniques not based on inputs observable in the market. This is only permissible insofar as no observable market data are available. The Group does not have financial instruments allocated to this level for any of the years presented.
The following tables present the Group’s financial assets and financial liabilities that are measured at fair value as of December 31, 20202023 and 20192022 and their allocation to the fair value hierarchy:
| | | | | | Level 1 | | Level 2 | | Total | | | | Level 1 | | Level 2 | | Total |
| Assets | Assets | | | | | | | | Assets | | | |
| Derivative financial instruments | Derivative financial instruments | 2020 | | 151 | | | 1,951 | | | 2,102 | |
Short-term investment (1) | |
| Derivative financial instruments | Derivative financial instruments | 2019 | | 1,257 | | | 178 | | | 1,435 | |
Short-term investment (1) | |
| | Liabilities | |
| Liabilities | |
| Liabilities | Liabilities | | | | | | | | | | |
| Derivative financial instruments | Derivative financial instruments | 2020 | | (12,984) | | | (157) | | | (13,141) | |
| Derivative financial instruments | Derivative financial instruments | 2019 | | (1,423) | | | 0 | | | (1,423) | |
(1) US-Treasury Bills with maturity from the date of acquisition longer than 90 days used as collateral for short-term borrowings. As of December, 2023, US$ 59,475 (US$ 98,571 as of December 31, 2022) of these US T-bills are used as collateral for short-term borrowings and are not available for use by other entities of the Group. See Note 26.
Adecoagro S.A.
Notes to the Consolidated Financial Statements (Continued)
(All amounts in US$ thousands, except shares and per share data and as otherwise indicated)
18. Financial instruments by category (continued)
There were no transfers within level 1 and 2 during the years ended December 31, 20202023 and 2019.2022.
When no quoted prices in an active market are available, fair values (particularly with derivatives) are based on recognized valuation methods. The Group uses a range of valuation models for this purpose, details of which may be obtained from the following table:
| | | | | | | | | | | | | | | | | | | | | | | | | | | | | | | | |
| Class | | Pricing Method | | Parameters | | Pricing Model | | Level | | Total |
| | | | | | | | | | |
| Futures | | Quoted price | | — | | — | | 1 | | (12,833) | |
| | | | | | | | | | |
| | | | | | | | | | |
| | | | | | | | | | |
| NDF | | Quoted price | | Swap curve | | Present value method | | 2 | | (30) | |
| | | | | | | | | | |
| Interest-rate swaps | | Theoretical price | | Money market interest-rate curve | | Present value method | | 2 | | 1,824 | |
| | | | | | | | | | | (11,039) | |
Adecoagro S.A.
Notes to the Consolidated Financial Statements (Continued)
(All amounts in US$ thousands, except shares and per share data and as otherwise indicated)
19. | | | | | | | | | | | | | | | | | | | | | | | | | | | | | | | | |
| Class | | Pricing Method | | Parameters | | Pricing Model | | Level | | Total |
| | | | | | | | | | |
| Futures | | Quoted price | | — | | — | | 1 | | 8,657 |
| | | | | | | | | | |
| Options/OTC | | Quoted price | | — | | — | | 1 | | 5,141 |
| | | | | | | | | | |
| | | | | | | | | | |
| | | | | | | | | | |
| NDF | | Quoted price | | Foreign-exchange curve | | Present value method | | 1 | | (47) | |
| | | | | | | | | | |
| Interest-rate swaps | | Theoretical price | | Money market interest-rate curve | | Present value method | | 2 | | 17,900 | |
| | | | | | | | | | |
| US-Treasury Bills | | Quoted price | | — | | — | | 1 | | 62,637 | |
| | | | | | | | | | |
18. Trade and other receivables, net
| | | | 2020 | | 2019 | | 2023 | | 2022 |
| Non-current | Non-current | | | | Non-current | | | |
| | Advances to suppliers | Advances to suppliers | 1,704 | | | 723 | |
| | Advances to suppliers | |
| | Advances to suppliers | |
| Income tax credits | Income tax credits | 5,283 | | | 5,240 | |
| Non-income tax credits (i) | Non-income tax credits (i) | 18,195 | | | 16,895 | |
| Judicial deposits | Judicial deposits | 2,188 | | | 2,596 | |
| Receivable from disposal of subsidiary (Note 22) | 23,093 | | | 17,047 | |
| Receivable from disposal of subsidiary (Note 21) | |
| | Other receivables | |
| Other receivables | |
| Other receivables | Other receivables | 1,803 | | | 2,492 | |
| Non-current portion | Non-current portion | 52,266 | | | 44,993 | |
| Current | Current | | | | Current | | | |
| Trade receivables | Trade receivables | 58,530 | | | 55,271 | |
| | Less: Allowance for trade receivables | Less: Allowance for trade receivables | (3,965) | | | (3,773) | |
| Less: Allowance for trade receivables | |
| Less: Allowance for trade receivables | |
| Trade receivables – net | Trade receivables – net | 54,565 | | | 51,498 | |
| Prepaid expenses | Prepaid expenses | 10,427 | | | 12,521 | |
| Advances to suppliers | Advances to suppliers | 17,751 | | | 14,417 | |
| Income tax credits | Income tax credits | 1,709 | | | 1,059 | |
| Non-income tax credits (i) | Non-income tax credits (i) | 33,628 | | | 33,363 | |
| Receivable from disposal of subsidiary (Note 22) | 15,506 | | | 5,716 | |
| Receivable from disposal of subsidiary (Note 21) | |
| Cash collateral | Cash collateral | 36 | | | 23 | |
| | Other receivables | |
| Other receivables | |
| Other receivables | Other receivables | 12,040 | | | 8,741 | |
| Subtotal | Subtotal | 91,097 | | | 75,840 | |
| Current portion | Current portion | 145,662 | | | 127,338 | |
| Total trade and other receivables, net | Total trade and other receivables, net | 197,928 | | | 172,331 | |
(i) Includes US$ 363 (2019:293 (2022: US$ 226)158) reclassified from property, plant and equipment.
The fair values of current trade and other receivables approximate their respective carrying amounts due to their short-term nature. The fair values of non-current trade and other receivables approximate their carrying amount, as the impact of discounting is not significant.
The carrying amounts of the Group’s trade and other receivables are denominated in the following currencies (expressed in U.S. Dollars):
| | | | | | | | | | | |
| | 2020 | | 2019 |
| Currency | | | |
| U.S. Dollar | 56,531 | | | 37,131 | |
| Argentine Peso | 55,433 | | | 45,520 | |
| Uruguayan Peso | 811 | | | 999 | |
| Brazilian Reais | 85,153 | | | 88,681 | |
| | 197,928 | | | 172,331 | |
As of December 31, 2020 trade receivables of US$ 11,623 (2019: US$ 5,052) were past due but not impaired. The aging analysis of these receivables indicates that US$ 977 and US$ 318 are over 6 months in December 31, 2020 and 2019, respectively.
Since January 1, 2018, for trade receivables, the Company applies the simplified approach permitted by IFRS 9, which requires expected lifetime losses to be recognized from initial recognition of the receivables.
Adecoagro S.A.
Notes to the Consolidated Financial Statements (Continued)
(All amounts in US$ thousands, except shares and per share data and as otherwise indicated)
19.18. Trade and other receivables, net (continued)
The carrying amounts of the Group’s trade and other receivables are denominated in the following currencies (expressed in U.S. Dollars):
| | | | | | | | | | | |
| | 2023 | | 2022 |
| Currency | | | |
| U.S. Dollar | 88,811 | | | 89,760 | |
| Argentine Peso | 24,304 | | | 54,801 | |
| Uruguayan Peso | 6,570 | | | 2,229 | |
| Brazilian Reais | 98,430 | | | 81,588 | |
| | | |
| | 218,115 | | | 228,378 | |
As of December 31, 2023 trade receivables of US$22,989 (2022: US$22,933) were past due but not impaired. The aging analysis of these receivables indicates that US$449 and US$741 are over 6 months in December 31, 2023 and 2022, respectively.
Effective January 1, 2018, for trade receivables, the Group applies the simplified approach permitted by IFRS 9, which requires expected lifetime losses to be recognized from initial recognition of the receivables.
Delinquency in payments wasis an indicator that a receivable may be impaired. However, management considers all available evidence in determining when a receivable is impaired. Generally, trade receivables, which are more than 180 days past due are fully provided for. However, certain receivables 180+ days overdue are not provided for based on a case-by-case analysis of credit quality analysis. Furthermore, receivables, which are not 180+ days overdue, may be provided for if specific analysis indicates a potential impairment.
Movements on the Group’s allowance for trade receivables are as follows:
| | | | 2020 | | 2019 | | 2018 | | 2023 | | 2022 | | 2021 |
| At January 1 | At January 1 | 3,773 | | | 2,503 | | | 1,002 | |
| Charge of the year | Charge of the year | 2,192 | | | 3,656 | | | 2,468 | |
| Acquisition of subsidiary | 0 | | | 46 | | | 0 | |
| | Unused amounts reversed | |
| Unused amounts reversed | |
| Unused amounts reversed | Unused amounts reversed | (769) | | | (1,314) | | | (237) | |
| Used during the year | Used during the year | (446) | | | (48) | | | (281) | |
| Exchange differences | Exchange differences | (785) | | | (1,070) | | | (449) | |
| At December 31 | At December 31 | 3,965 | | | 3,773 | | | 2,503 | |
The creation and release of allowance for trade receivables have been included in “Selling expenses” in the statement of income. Amounts charged to the allowance account are generally written off, when there is no expectation of recovering additional cash.
The maximum exposure to credit risk at the reporting date is the carrying value of each class of receivable mentioned above.
As of December 31, 2020,2023, approximately 50% (2019: 25%70% (2022: 72%) of the outstanding unimpaired trade receivables (neither past due not impaired) relate to sales to 2420 well-known multinational companies with good credit quality standing, including but not limited to ItersnackCDA Alimentos S.A., Intersnack Procurement B.V., Camara de Comercializacao de Energia Electrica CCEE, The Real Peunats Company, Interfood AmericasBV, YPF S.A., Mastellone Hnos. S.A.Taurus Distribuidora de Petroleo Ltda., Companhia de Distribuição Araguaia,Cargill S.A.C.I., Schettino hermanos S.R.L., among others. Most of these entities or their parent companies are externally credit-rated. The Group reviews these external ratings from credit agencies.
The remaining percentage as of December 31, 20202023 and 20192022 of the outstanding unimpaired trade receivables (neither past due nor impaired) relate to sales to a dispersed large quantity of customers for which external credit ratings may not be available. However, the total base of customers without an external credit rating is relatively stable.
Adecoagro S.A.
Notes to the Consolidated Financial Statements (Continued)
(All amounts in US$ thousands, except shares and per share data and as otherwise indicated)
18. Trade and other receivables, net (continued)
New customers with less than six months of history with the Group are closely monitored. The Group has not experienced credit problems with these new customers to date. The majority of the customers for which an external credit rating is not available are existing customers with more than six months of history with the Group and with no defaults in the past. A minor percentage of customers may have experienced some non-significant defaults in the past but fully recovered.
20.19. Inventories
| | | | | | | | | | | |
| | 2020 | | 2019 |
| Raw materials | 56,420 | | | 47,501 | |
| Finished goods (Note 5) (1) | 77,041 | | | 65,278 | |
| | | |
| Others | 0 | | | 11 | |
| | 133,461 | | | 112,790 | |
| | | | | | | | | | | |
| | 2023 | | 2022 |
| Raw materials | 76,440 | | | 121,306 | |
| Finished goods (Note 5) | 179,611 | | | 152,716 | |
| | | |
| | | |
| | 256,051 | | | 274,022 | |
(1) Finished goods of Crops reportable segment are valued at fair value.
20. Cash and cash equivalents
| | | | | | | | | | | |
| | 2023 | | 2022 |
| Cash at bank and on hand | 179,068 | | | 146,242 | |
| Short-term bank deposits | 160,713 | | | 84,411 | |
| | 339,781 | | | 230,653 | |
21. Acquisitions and disposals
Disposals
In September 2023, the Company sold “El Meridiano” farm, a 6,302 hectares farm located in the Province of Buenos Aires, Argentina for an aggregate amount of US$ 48 million, collected in full. This transaction resulted in a pre-tax gain of US$ 6.3 million included in the line item “Other operating income / (expense), net”.
The Group did not complete any disposals during the years ended December 31, 2022 and 2021.
Acquisitions
2023 Acquisition Activity
The Group did not complete any acquisitions during the year ended December 31, 2023
2022 Acquisition Activity
During the year ended December 31, 2022, we completed one business combination, as follows:
Acquisition of subsidiaries of Viterra Group in Argentina and Uruguay
On May 3, 2022, (the “Closing Date”) the Group, through certain subsidiaries consummated the acquisition of the rice operations in Uruguay and Argentina of the Viterra Group, comprising a 100% ownership of Molinos Libres S.A. (Argentina), Viterra Uruguay S.A. (Uruguay) and Paso Dragón S.A. (Uruguay). The transaction also included the acquisition of certain leasing agreements. All of the acquired subsidiaries form part of the Rice Business Segment.
The terms and conditions of the agreement contemplate the payment, subject to adjustments, of a purchase price of approximately US$ 17.8 million payable in three annual installments and the assumption of the existing financial debt for an amount of US$ 17.9 million. As of the date of this Financial Statements, all installments have been cancelled.
Adecoagro S.A.
Notes to the Consolidated Financial Statements (Continued)
(All amounts in US$ thousands, except shares and per share data and as otherwise indicated)
21. CashThe Company has made an allocation of the estimated purchase price to the identifiable assets acquired and cash equivalents
| | | | | | | | | | | |
| | 2020 | | 2019 |
| Cash at bank and on hand | 178,079 | | | 124,701 | |
| Short-term bank deposits | 158,203 | | | 165,575 | |
| | 336,282 | | | 290,276 | |
22. Disposalsliabilities assumed based on their fair values at acquisition date. The Company has made significant assumptions and acquisitions
estimates in determining the purchase price, including the contingent payment and the allocation of the estimated purchase price in these consolidated financial statements.
AcquisitionsAs the fair value of the identifiable net assets acquired was greater than the total consideration paid, negative goodwill arises on the acquisition. The negative goodwill is recognized as “Bargain purchase gain on acquisition” in the income statement for the year end December 31, 2022 reflecting the opportunity to acquire the rice operations in Argentina and Uruguay from an outgoing market player.
In January 2019,The following table summarizes the Company acquired, the remaining 50% of CHS Agro S.A. a joint venture between the Company and CHS Argentina S.A. After this acquisition, we own 100% of CHS Agro S.A. which has since been renamed as Girasoles del Plata S.A. The consideration for this operation was nominal. At the day of the acquisition, we had our participation valued at 0. As a result of this transaction, the Company recognized a gain in the line item Other Operating Income of USD 0.2 million.purchase price:
Net | | | | | | | | |
| Purchase consideration: | | |
| Amount paid in cash | | 1,512 | |
| Amounts to be paid in installments (*) | | 16,242 | |
| Total purchase consideration | | 17,754 | |
| Fair value of net assets acquired | | 27,507 | |
| Bargain purchase on acquisition over the total purchase consideration | | 9,753 | |
During 2023, an amount of US$3,193 of the installments was paid.
(*) Amounts to be paid in installments were discounted at present value as of the date of acquisition at a 6.5% discount rate.
The assets and liabilities at the date of acquisition are as follows:
| | | | | |
| Cash and cash equivalents | 3,266 | |
| Trade and other receivables | 21,068 | |
| Inventories | 50,891 | |
| Biological assets | 1,676 | |
| Property, plant and equipment | 21,80021,479 | |
| Total Assets | Intangible assets, net98,380 | | 41 |
Inventories | 1,866 | |
Trade and other receivables, netpayables | (50,062) | |
| Payroll and other liabilities | 4,492 (961) | |
| Borrowings | (17,738) | |
| Deferred income tax liabilities | (1,812) | | (4,546) |
Trade andProvision for other payables | (1,031) | |
Current income tax liabilities | (5)(300) | |
| Total Liabilities | Payroll and Social liabilities(70,873) | | (153) |
BorrowingsFair value of Net Assets Acquired | (23,062) | |
Cash and cash equivalents added as a result of the business combination | 747 | |
Total net assets added as a result of business combination | 14927,507 | |
Fair value of previously held equity interest | 74 | |
Gain for bargain purchase | 75 | |
In January 2019,The Company used a replacement cost method or a market approach, as appropriate, to measure the Company acquired 100%fair value of Olam Alimentos S.A. whose principal asset is a peanuts processing facility located in the Province of Córdoba, (currently Mani del Plata S.A.) from Olam International Ltd. The consideration for this acquisition was USD 10 million to be disbursed in 3 installments, with the firstproperty, plant and second payments made at closing. This transaction qualifies as a purchase of assets.equipment.
In February 2019,All other net tangible assets were valued at their respective carrying amounts, as the Company acquired 2 dairy facilities from SanCor Cooperativas Unidas Limitada ("SanCor"). The first facility is located in Chivilcoy, Province of Buenos Aires and processes fluid milk while the second facility is located in Morteros, Province of Cordoba and produces powder milk and cheese. Together withbelieves that these facilities, we also acquired the brands Las Tres Niñas and Angelita. The total consideration for these operations was US$ 47 million. This transaction qualifies as a purchase of assets.amounts approximate their current fair values.
DisposalsA decrease in the fair value of assets acquired, or an increase in the fair value of liabilities assumed, from those preliminary valuations would result in a dollar-for-dollar corresponding decrease in the “Bargain purchase on acquisition”.
In December 2020, the Company completed the sale of Global Seward S.L.U. and Peak City S.L.U. wholly owned subsidiaries, which main underlying asset is Huelen Farm at the selling price of US$ 30.1 millions, USD 10.1 million were collected at the closing date, and the balance will be collected in 2 annual installments. This transaction resulted in a loss
Adecoagro S.A.
Notes to the Consolidated Financial Statements (Continued)
(All amounts in US$ thousands, except shares and per share data and as otherwise indicated)
21. Acquisitions and disposals (continued)
Acquisition-related costs of US$ 193 are included in General and administrative expenses in the Consolidated Statement of Income.
The following table summarizes the sales of goods and services rendered and profit from operations of the subsidiaries acquired included in the consolidated financial statements of income for the year end December 31, 2022 as from the date of acquisition:
| | | | | | | | |
| | Period from the date of acquisition to December 31 2022 |
| Sales of goods and services rendered | | 61,363 | |
| Profit from operations | | 6,131 | |
If the acquisition had occurred on January 1, 2022 consolidated pro-forma sales of goods and services rendered, profit from operations and profit for the year, for the year ended 31 December 2022 would have been US$ 1,369,462, US$ 249,462 and US$ 106,950.
2021 Acquisition Activity
The Group did not complete any acquisitions during the year ended December 31, 2021
22. Shareholders' contributions
The share capital of the Group is represented by common shares with a nominal value of US$1.5 per share and one vote each.
| | | | | | | | | | | |
| | Number of shares | | Share capital and
share premium |
| At January 1, 2021 | 122,382 | | | 1,086,388 | |
| | | |
| Restricted shares granted and units vested (Note 23) | — | | | 3,594 | |
| Purchase of own shares | — | | | (55,349) | |
| At December 31, 2021 | 122,382 | | | 1,034,633 | |
| Reduction of issued share capital of the company | (11,000) | | | (16,500) | |
| Employee share options exercised (Note 22) (1) | — | | | 2,432 | |
| Restricted shares granted and units vested (Note 23) | — | | | 4,647 | |
| Purchase of own shares | — | | | (29,970) | |
| Dividends paid to shareholders | — | | | (35,000) | |
| At December 31, 2022 | 111,382 | | | 960,242 | |
| | | |
| Employee share options exercised (Note 22) (1) | — | | | 236 | |
| Restricted shares granted (Note 23) | — | | | 7,528 | |
| Purchase of own shares | — | | | (22,123) | |
| Dividends provided for and paid to mayor shareholders | — | | | (35,000) | |
| At December 31, 2023 | 111,382 | | | 910,883 | |
(1)Treasury shares were used to settle these options, units and grants.
Decision of the Extraordinary General Shareholders’ meeting
On April 20, 2022 the extraordinary general meeting of the shareholders of the Company resolved to reduce the issued share capital of the Company by an amount of $16,500,000 by the cancellation of 11,000,000 shares with a nominal value of
Adecoagro S.A.
Notes to the Consolidated Financial Statements (Continued)
(All amounts in US$ thousands, except shares and per share data and as otherwise indicated)
22. Disposals and acquisitionsShareholders' contributions (continued)
before tax of US$ 0.6 million included$1.50 each held in the line item “Other operating income”, and also in the reclassification of Revaluation surplus to retained earnings of US$ 2.2 million.
In June 2020,treasury by the Company collected US$ 12.1 million in consideration ofso that, as from April 20, 2022, the sale of 811.70 hectares farm in the Province of Santa Fe, Argentina. This transaction resulted in a gain before tax of US$ 2.1 million included in the line item “Other operating income” and also in the reclassification of Revaluation surplus to retained earnings before income tax of US$ 8.0 million reflected in the Statements of changes in shareholders equity.
In January 2019, we completed the sale of Q065 Negócios Imobiliários Ltda., a wholly owned subsidiary, which main underlying asset is the Alto Alegre Farm, for a selling price of US$ 16.6 million (Reais 62.5 million), of which US$ 2.2 million (Reais 8.4 million) has already been collected and the balance will be collected in 7 annual installments starting in June 2019. This transaction resulted in a gain before tax of US$ 1.5 million, and also in the reclassification of Revaluation surplus to retained earnings of US$ 8.0 million.
In June 2018, the Group completed the sale of Q43 Negócios Imobiliários Ltda., a wholly owned subsidiary , which main underlying asset is the Conquista Farm, for a selling price of US$ 18.4 million (Reais 68 million), of which US$ 5.6 million (Reais 21.4 million) has already been collected and the balance will be collected in 4 annual installments starting in June 2019. This transaction resulted in a gain of US$ 14 million, included in “Other operating income” under the line item “Gain from the sale of farmland and other assets”.
In May 2018, the Group completed the sale of Q45 Negócios Imobiliários Ltda., a wholly owned subsidiary, which main underlying asset is the Rio De Janeiro Farm, for a selling price of US$ 34 million (Reais 120 million), which was fully collected as of the date of these financial statements. This transaction resulted in a gain of US$ 22 million included in “Other operating income” under the line item “Gain from the sale of farmland and other assets”.
Adecoagro S.A.
Notes to the Consolidated Financial Statements (Continued)
(All amounts in US$ thousands, except shares and per share data and as otherwise indicated)
23. Shareholders' contributions
Theissued share capital of the Group isamounts to $167,072,722.50, represented by common111,381,815 shares in issue with a nominal value of US$ 1.5 per share and one vote$1.50 each.
| | | | | | | | | | | |
| | Number of shares | | Share capital and
share premium |
| At January 1, 2018 | 122,382 | | | 1,092,507 | |
| Employee share options exercised (Note 24) (1) | 0 | | | 0 | |
| Restricted shares and units vested (Note 24) | 0 | | | 4,775 | |
| Purchase of own shares | 0 | | | (13,206) | |
| At December 31,2018 | 122,382 | | | 1,084,076 | |
| Restricted shares and units vested (Note 24) | 0 | | | 4,455 | |
| Purchase of own shares | 0 | | | (3,219) | |
| At December 31,2019 | 122,382 | | | 1,085,312 | |
| | | |
| Restricted shares units vested (Note 24) | 0 | | | 4,182 | |
| Purchase of own shares | 0 | | | (3,106) | |
| At December 31,2020 | 122,382 | | | 1,086,388 | |
(1)Treasury shares were used to settle these options and units.
Share Repurchase Program
On September 24, 2013, the Board of Directors of the Company has authorized a share repurchase program for up to 5% of its outstanding shares. The repurchase program has commenced on September 24, 2013 and is reviewed by the Board of Directors after each 12-month period. On August 11, 2020,15, 2023, the Board of Directors approved the extensionrenewal of the program, and also its extension for an additional twelve-month period, ending September 23, 2021.2024.
Repurchases of shares under the program are made from time to time in open market transactions in compliance with the trading conditions of Rule 10b-18 under the U.S. Securities Exchange Act of 1934, as amended, and applicable rules and regulations. The share repurchase program does not require Adecoagro to acquire any specific number or amount of shares and may be modified, suspended, reinstated or terminated at any time in the Company’s discretion and without prior notice.
As of December 31, 2020,2023, the Company repurchased 9,957,07824,694,405 shares under this program, of which 4,406,2468,448,951 have been applied to some exercise of the Company’s stock option plan and restricted stock units plan.and the grant of restricted shares. In 2020, 20192023, 2022 and 20182021 the Company repurchased shares for an amount of US$ 4,365,26.2 million; US$ 4,26336.8 million and US$ 15,725,66.5 million respectively. The outstanding treasury shares as of December 31, 20202023 totaled 5,084,864.5,376,315 common shares.
Dividend distribution
On April 17, 2024 the general meeting of the shareholders of the Company resolved the payment of an annual dividend of $35 million to be paid to outstanding shares in two installments during May and November 2024.
On April 19, 2023 the general meeting of the shareholders of the Company resolved the payment of an annual dividend of $35 million to be paid to outstanding shares in two installments. The first payment of the year 2023, of US$ 17.5 million (0.1626 per share) was made on May 24, 2023 and the second installment was made in November 24, 2023 (0.1649 per share).
On April 20, 2022 the general meeting of the shareholders of the Company resolved the payment of an annual dividend of US$ 35 million to be paid to outstanding shares in two installments in May and November. The first payment, of US$ 17.5 million (0.1572 per share) was made on May 17, 2022 and the second also US$ 17.5 million (0.1602 per share) installment was made on November 17, 2022.
Adecoagro S.A.
Notes to the Consolidated Financial Statements (Continued)
(All amounts in US$ thousands, except shares and per share data and as otherwise indicated)
24.23. Equity-settled share-based payments
The Group has set a “2004 Incentive Option Plan” and a “2007/2008 Equity Incentive Plan” (collectively referred to as “Option Schemes”) under which the Group granted equity-settled options to senior managers and selected employees of the Group's subsidiaries with a term of ten years. Additionally, in 2010 the Group has set a “Adecoagro Restricted Share and Restricted Stock Unit Plan” (referred to as “Restricted Share Plan”) under which the Group grants restricted stock units and restricted shares to senior and medium management and key employees of the Group’s subsidiaries.
(a)Option Schemes
The fair value of the options under the Option Schemes was measured at the date of grant using the Black-Scholes valuation technique.
As of the date of these financial statements all options has already been vested and expensed.
The Adecoagro/ IFH 2004 Stock Incentive Option Plan was effectively established in 2004 and is administered by the Compensation Committee of the Company. Options are exercisable over a ten-year period. In May 2014 this periodThe 2004 Plan was extended for another ten year-period.amended to extend the term to the 20th anniversary of its adoption.
Movements in the number of equity-settled options outstanding and their related weighted average exercise prices under the Adecoagro/ IFH 2004 Stock Incentive Option Plan are as follows:
| | 2020 | | 2019 | | 2018 |
| 2023 | | | 2023 | | 2022 | | 2021 |
| | | Average
exercise
price per
share | | Options
(thousands) | | Average
exercise
price per
Share | | Options
(thousands) | | Average
exercise
price per
Share | | Options
(thousands) | | Average
exercise
price per
share | | Options
(thousands) | | Average
exercise
price per
Share | | Options
(thousands) | | Average
exercise
price per
Share | | Options
(thousands) |
| At January 1 | At January 1 | 6.66 | | | 1,634 | | | 6.66 | | | 1,634 | | | 6.66 | | | 1,634 | |
| | Exercised | Exercised | 0 | | | 0 | | | 0 | | | 0 | | | 0 | | | 0 | |
| Exercised | |
| Exercised | |
| At December 31 | At December 31 | 6.66 | | | 1,634 | | | 6.66 | | | 1,634 | | | 6.66 | | | 1,634 | |
Options outstanding at year end under this Plan have the following expiry date and exercise prices:
| | | | | | | | | | | | | | | | | | | | | | | |
| | Exercise
price per share | | Shares (in thousands) |
| Expiry date (i): | | 2020 | | 2019 | | 2018 |
| May 1, 2024 | 5.83 | | | 496 | | | 496 | | | 496 | |
| May 1, 2025 | 5.83 | | | 452 | | | 452 | | | 452 | |
| January 1, 2026 | 5.83 | | | 142 | | | 142 | | | 142 | |
| February 16, 2026 | 7.11 | | | 103 | | | 103 | | | 103 | |
| October 1, 2026 | 8.62 | | | 441 | | | 441 | | | 441 | |
| | | | | | | | | | | | | | | | | | | | | | | |
| | Exercise
price per share | | Shares (in thousands) |
| Expiry date (i): | | 2023 | | 2022 | | 2021 |
| May 1, 2034 | 5.83 | | | 400 | | | 400 | | | 496 | |
| May 1, 2035 | 5.83 | | | 363 | | | 369 | | | 452 | |
| January 1, 2036 | 5.83 | | | 94 | | | 124 | | | 142 | |
| February 16, 2036 | 7.11 | | | 84 | | | 84 | | | 103 | |
| October 1, 2036 | 8.62 | | | 343 | | | 344 | | | 441 | |
(i) On May 2014, the Board of directorsDirectors decided to extend the expired date of the Plan.
The Adecoagro/ IFH 2007/ 2008 Equity Incentive Plan was effectively established in late 2007 and expired during 2020, with no options excercised.
Adecoagro S.A.
Notes to the Consolidated Financial Statements (Continued)
(All amounts in US$ thousands, except shares and per share data and as otherwise indicated)
24.23. Equity-settled unit-based payments (continued)
(b)Restricted Share / Restricted Stock Unit Plan
The Restricted Share and Restricted Stock Unit Plan was effectively established in 2010 and amended in November 2011. It is administered by the Compensation Committee of the Company. Restricted shares or units under these Plan vest over a 3-year period from the date of grant at 33% on each anniversary of the grant date. Participants are entitled to receive one common share of the Company for each restricted share or restricted unit granted. There are no performance requirements for the delivery of common shares, except that a participant’s employment with the Group must not have been terminated prior to the relevant vesting date. If the participant ceases to be an employee for any reason, any unvested restricted share or unit shall not be converted into common shares. The maximum number of ordinary shares with respect to which awards may be made under the Plan is 5,379,164,8,659,295, of which 3,809,3226,337,880 have already been vested and 1,396,221 will be vested on future periods.vested. The maximum numbers of ordinary shares are revised annually.
At December 31, 2020,2023, the Group recognized compensation expense US$ 4.56.9 million related to the restricted stock units granted under the Restricted Share Plan (2019:(2022: US$ 4.810.9 million and 2017:2020: US$ 4.96.6 million).
.
The restricted shares under the Restricted Share Plan were measured at fair value at the date of grant.
Key grant-date fair value and other assumptions under the Restricted Share Plan are detailed below:
| | Grant Date | Grant Date | Apr 1,
2018 | | May 15,
2018 | | Apr 1,
2019 | | May 15,
2019 | | Apr 1,
2020 | | May 12,
2020 | Grant Date | Apr 1,
2021 | | May 13,
2021 | | Apr 1,
2022 | | Apr 20,
2022 | | Mar 17,
2023 | | Apr 20,
2023 |
| Fair value | Fair value | 8.43 | | | 9.10 | | | 7.00 | | | 7.20 | | | 5.65 | | | 7.45 | |
| Possibility of ceasing employment before vesting | 0 | % | | 0 | % | | 0 | % | | 0 | % | | 0 | % | | 0 | % |
|
Movements in the number of restricted shares outstanding under the Restricted Share Plan are as follows:
| | | | Restricted shares (thousand) | | Restricted stock units (thousands) | | Restricted shares (thousand) | | Restricted stock units (thousands) |
| | | 2020 | | 2019 | | 2020 | | 2019 | | 2018 | | 2023 | | 2022 | | 2021 |
| At January 1 | At January 1 | 750 | | | 0 | | | 508 | | | 976 | | | 969 | |
| Granted (1) | Granted (1) | 751 | | | 753 | | | 0 | | | 20 | | | 530 | |
| Forfeited | Forfeited | (24) | | | (3) | | | (10) | | | (12) | | | (25) | |
| Vested | Vested | (255) | | | 0 | | | (324) | | | (476) | | | (498) | |
| At December 31 | At December 31 | 1,222 | | | 750 | | | 174 | | | 508 | | | 976 | |
(1) Approved by the Board of Directors of March 10, 20207, 2023 and the Shareholders Meeting of April 15, 2020.19, 2023.
25.24. Legal and other reserves
According to the laws of certain of the countries in which the Group operates, a portion of the profit of the year (5%) is separated to constitute legal reserves until they reach legal capped amounts. These legal reserves are not available for dividend distribution and can only be released to absorb losses. The legal limit of these reserves has not been met.
Legal and other reserves amount to US$ 9,66226,124 as of December 31, 2020 (2019:2023 (2022: US$ 8,375)22,187) and are included within the balance of retained earnings in the statement of changes in shareholders’ equity.
The Company may make distributions in the form of dividends or otherwise to the extent that it has distributable retained earnings or available distributable reserves (including share premium) that result from the Stand Alone Financial Statements prepared in accordance with Luxembourg GAAP. NaNNo distributable retained earning result from the Stand Alone Financial Statements of the Company as of December 31, 2020,2023, but the Company has distributable reserves in excess of US$ 935,297.789,021.
Adecoagro S.A.
Notes to the Consolidated Financial Statements (Continued)
(All amounts in US$ thousands, except shares and per share data and as otherwise indicated)
25.24. Legal and other reserves (continued)
In the other reserves line, it is included the benefit that the Company has regarding ICMS conceded by the government of the Estate of Mato Grosso do Sul. In accordance with the Complementary Law 160/17, grants related to ICMS, conceded by any Estate of Brazil, were considered as Investments Grants. This investment grants will not be computed to calculate income tax, since they were accounted as an Equity Reserve. This reserve cannot be distribute,distributed, unless income tax is paid on the reserve.
26.25. Trade and other payables
| | | | 2020 | | 2019 | | 2023 | | 2022 |
| Non-current | Non-current | | | | Non-current | | | |
| Payable from acquisition of property, plant and equipment | 0 | | | 3,394 | |
| Trade payables | |
| Payable from acquisition of subsidiary (Note 21) | |
| Other payables | Other payables | 290 | | | 205 | |
| | | 290 | | | 3,599 | |
| Current | Current | | | | Current | | | |
| Trade payables | Trade payables | 110,662 | | | 90,594 | |
| Advances from customers | Advances from customers | 4,755 | | | 2,980 | |
| | Taxes payable | Taxes payable | 7,037 | | | 9,086 | |
| Payables from acquisition of property, plant and equipment | 3,569 | | | 3,596 | |
| Taxes payable | |
| Taxes payable | |
| Dividends to be paid | |
| Payable from acquisition of subsidiary (Note 21) | |
| Other payables | Other payables | 292 | | | 631 | |
| | | 126,315 | | | 106,887 | |
| Total trade and other payables | Total trade and other payables | 126,605 | | | 110,486 | |
The fair values of current trade and other payables approximate their respective carrying amounts due to their short-term nature. The fair values of non-current trade and other payables approximate their carrying amounts, as the impact of discounting is not significant.
27.26. Borrowings
| | | | 2020 | | 2019 | | 2023 | | 2022 |
| Non-current | Non-current | | | | Non-current | | | |
| Senior Notes | Senior Notes | 497,009 | | | 496,564 | |
| Bank borrowings | Bank borrowings | 316,455 | | | 283,638 | |
| | | |
| | | | 813,464 | | | 780,202 | |
| Current | Current | | | | Current | | | |
| Senior Notes | Senior Notes | 8,250 | | | 8,250 | |
| Bank overdrafts | Bank overdrafts | 50,447 | | | 27 | |
| Bank borrowings | Bank borrowings | 98,929 | | | 179,801 | |
| | | | 157,626 | | | 188,078 | |
| | |
| | |
| Total borrowings | Total borrowings | 971,090 | | | 968,280 | |
As of December 31, 2020,2023, total bank borrowings include collateralized liabilities of US$ 97,999 (2019:77,055 (2022: US$ 210,525)188,058). These loans are mainly collateralized by property, plant and equipment, sugarcane plantations, sugar export contracts, and shares of certain subsidiaries of the Group.
Adecoagro S.A.
Notes to the Consolidated Financial Statements (Continued)
(All amounts in US$ thousands, except shares and per share data and as otherwise indicated)
27.26. Borrowings (continued)
Notes 2027
On September 21, 2017, the Company issued senior notes (the “Notes”) for a total amount of US$500 million, at an annual nominalfixed rate of 6%. The Notes will mature on September 21, 2027. Interest on the Notes are payable semi-annually in arrears on March 21 and September 21 of each year. The total proceeds nets of expenses was US$495.7 million.
The Notes are fully and unconditionally guaranteed on a senior unsecured basis by certain of our current and future subsidiaries. As of the Issue Date,December 31, 2023, Adeco Agropecuaria S.A., Adecoagro Brasil Participações S.A., Adecoagro Vale do Ivinhema S.A., Pilagá S.A. and Usina Monte Alegre Ltda. are the only Subsidiary Guarantors.
The Notes contain customary financial covenants and restrictions which require us to meet pre-defined financial ratios, among other restrictions. During 2020As of December 31, 2023 and 20192022 the Group was in compliance with these financial covenants.
Debt maturity breakdown
The maturity of the Group's borrowings and the Group's exposure to fixed and variable interest rates is as follows:
| | | | 2020 | | 2019 | | 2023 | | 2022 |
| Fixed rate: | Fixed rate: | | | | Fixed rate: | | | |
| Less than 1 year | Less than 1 year | 116,113 | | | 120,154 | |
| Between 1 and 2 years | Between 1 and 2 years | 52,175 | | | 46,247 | |
| Between 2 and 3 years | Between 2 and 3 years | 39,844 | | | 55,453 | |
| Between 3 and 4 years | 12,500 | | | 40,725 | |
| | Between 4 and 5 years | |
| Between 4 and 5 years | |
| Between 4 and 5 years | Between 4 and 5 years | 0 | | | 10,331 | |
| More than 5 years | More than 5 years | 497,009 | | | 595,550 | |
| | | 717,641 | | | 868,460 | |
| Variable rate: | Variable rate: | | | | Variable rate: | | | |
| Less than 1 year | Less than 1 year | 41,513 | | | 67,924 | |
| Between 1 and 2 years | Between 1 and 2 years | 32,870 | | | 20,007 | |
| Between 2 and 3 years | Between 2 and 3 years | 6,035 | | | 7,197 | |
| Between 3 and 4 years | Between 3 and 4 years | 5,154 | | | 4,692 | |
| Between 4 and 5 years | Between 4 and 5 years | 28,334 | | | 0 | |
| More than 5 years | More than 5 years | 139,543 | | | 0 | |
| | | 253,449 | | | 99,820 | |
| | | 971,090 | | | 968,280 | |
Borrowings incurred by the Group’s subsidiaries in Brazil are repayable at various dates between January 20212024 and November 2027September 2030 and bear either fixed interest rates ranging from 2.50%6.80% to 7.95%13.23% per annum or variable rates based on LIBOR or other specific base-rates plus spreads ranging from 1.62%8.60% to 4.24%14.24% per annum. At December 31, 2020 there are no borrowings subject to LIBOR (six months). At December 2019, LIBOR (six months) was 2.88%.
Borrowings incurred by the Group´sGroup’s subsidiaries in Argentina are repayable at various dates between January 20212024 and June 2028 and bear either fixedno interest rates ranging from 2.75% and 7.0% per annumrate or variable rates based on LIBOR or other specific base-rates plus spreads of 4.0%4.4% for those borrowings denominated in U.S. Dollar, and a fixed interest rates ranging from 30%74.5% to 39%117% per annum for those borrowings denominated in Argentine pesos.
Adecoagro S.A.
Notes to the Consolidated Financial Statements (Continued)
(All amounts in US$ thousands, except shares and per share data and as otherwise indicated)
27.26. Borrowings (continued)
Brazilian Subsidiaries
The main loans of the Group’s Brazilian Subsidiaries are:
| | | | | | | | | | | | | | | | | | | | | | | | | | | | | |
| Bank | Grant date | Nominal amount | Capital outstanding as of December 31 | Maturity date | Annual interest rate |
| 2020 | 2019 |
| (In millions) | Millions of
Reais | Millions of equivalent Dollars | Millions of
equivalent
Dollars |
| Banco Do Brasil (1) | October 2012 | R$ | 130.0 | | R$ | 36.8 | | 7.08 | | 13.4 | | November 2022 | 2.94% minus 15% of performance bonus |
| Itau BBA FINAME Loan (2) | December 2012 | R$ | 45.9 | | R$ | 7.3 | | 1.40 | | 1.6 | | December 2022 | 2.50% |
| Banco do Brasil / Itaú BBA Finem Loan (3) | September 2013 | R$ | 273.0 | | R$ | 49.4 | | 9.51 | | 16.5 | | January 2023 | 6.83% |
| BNDES Finem Loan (4) | November 2013 | R$ | 215.0 | | R$ | 55.4 | | 10.66 | | 20.8 | | January 2023 | 3.75% |
| ING Bank N.V. (5) | October 2018 | US$ | 75.0 | | | 0 | | 75.00 | | 75.0 | | October 2023 | 6.33% |
| Certificados Recebíveis do Agronegócio (CRA) | December 2019 | R$ | 405.0 | | R$ | 405.0 | | 77.92 | | 99.2 | | November 2027 | 3.80% + IPCA |
| Banco do Brasil NCE Loan | March 2020 | R$ | 150.0 | | R$ | 75.0 | | 14.43 | | 0 | | March 2021 | 4.14% |
| Debênture Loan (6) | December 2020 | R$ | 403.2 | | R$ | 403.2 | | 77.59 | | 0 | | December 2026 | 4.24% + IPCA |
| | | | | | | | | |
| | | | | | | | | |
| | | | | | | | | |
| | | | | | | | | | | | | | | | | | | | | | | | | | | | | |
| Bank | Grant date | Nominal amount | Capital outstanding as of December 31 | Maturity date | Annual interest rate |
| 2023 | 2022 |
| (In millions) | Millions of
Brazilian Real | Millions of equivalent Dollars | Millions of
equivalent
Dollars |
| Certificados Recebíveis do Agronegócio (CRA) | December, 2019 | R$ | 400.0 | | R$ | 400.0 | | 82.6 | | 76.7 | | November-27 | 3.80% + IPCA |
| Debênture (1) | December, 2020 | R$ | 400.0 | | R$ | 400.0 | | 82.6 | | 76.7 | | December-26 | 4.24% + IPCA |
| | | | | | | | | |
| | | | | | | | | |
| | | | | | | | | |
| | | | | | | | | |
| | | | | | | | | |
| | | | | | | | | |
| Banco do Brasil (CCB) | December, 2020 | R$ | 30.0 | | R$ | 15.0 | | 3.1 | | 5.7 | | January-24 | CDI + 2.32% |
| Itaú BBA (NCR) | June, 2023 | R$ | 40.0 | | R$ | 40.0 | | 8.3 | | — | | March 2024 | CDI + 1.48% |
(1)Collateralized by (i) a first degree mortgage of the Carmen (Santa Agua) farm; and (ii) liens over the Ivinhema mill and equipment.
(2)Collateralized by (i) a first degree mortgage of the Carmen (Santa Agua) farm; and (ii) liens over the Ivinhema mill and equipment.
(3)Collateralized by (i) a first degree mortgage of the Carmen (Santa Agua) farm; (ii) liens over the Ivinhema mill and equipment; and (iv) long term power purchase agreementsagreement (PPA).
(4)
Collateralized by (i) liens over the Ivinhema mill and equipment; and (ii) power sales contracts.
(5)Collateralized by sales contracts.
(6)Collateralized by fiduciary assignment of energy contracts.
In December 2019, Adecoagro Vale do Ivinhema placed R$400.0 million in Certificados de Recebíveis do Agronegócio (CRA) adjustable by the IPCA (Brazilian official inflation rate), maturing in November 2027 and bearing an interest 3.80% per annum. This debt was issued with no guarantee.
The above mentioned loans, except the CRA, contain certain customary financial covenants and restrictions which require usthe Brazilian subsidiaries to meet pre-defined financial ratios, among other restrictions, as well as restrictions on the payment of dividends. These financial ratios are measured considering the statutory financial statements of the Brazilian Subsidiaries.
During 2020As of December 31, 2023 and 20192022 the Group was in compliance with all financial covenants.
Adecoagro S.A.
Notes to the Consolidated Financial Statements (Continued)
(All amounts in US$ thousands, except shares and per share data and as otherwise indicated)
27. Borrowings (continued)
Argentinian Subsidiaries
The main loans of the Group’s Argentinian Subsidiaries are:
| | | | | | | | | | | | | | | | | | | | |
| Bank | Grant date | Nominal
amount | Capital outstanding as of
December 31 | Maturity date | Annual interest rate |
| 2020 | 2019 |
| (In millions) | (In millions) | (In millions) |
| IFC Tranche A (1) | 2016 | US$25.0 | 0 | 18.18 | September, 2023 | 4% plus LIBOR |
| IFC Tranhce B (1) | 2016 | US$25.0 | 0 | 14.29 | September, 2021 | 4% plus LIBOR |
| Rabobank (2) | 2018 | US$50.0 | 50.00 | 50.00 | June, 2024 | 6.17% |
| IFC Tranche A (3) | 2020 | US$12.6 | 12.60 | 0 | June, 2028 | 4% plus LIBOR |
| IFC Tranche B (3) | 2020 | US$9.4 | 9.41 | 0 | June, 2028 | 4% plus LIBOR |
| | | | | | | | | | | | | | | | | | | | |
| Bank | Grant date | Nominal
amount | Capital outstanding as of
December 31 | Maturity date | Annual interest rate |
| 2023 | 2022 |
| (In millions) | (In millions) | (In millions) |
| | | | | | |
| | | | | | |
| | | | | | |
| IFC (1) | 2020 | US$20.0 | 16.33 | 18.60 | June, 2028 | 4% plus SOFR |
| | | | | | |
(1) Collateralized by a US$ 113 100.0million mortgage over Carmen, farm,Abolengo and San Carlos farms, which isare property of Adeco Agropecuaria S.A.
(2) Collateralized by the pledged of the shares of Dinaluca S.A., Compañía Agroforestal S.M.S.A. and Girasoles del Plata S.A.
(3)
Collateralized by a US$ 241.8 million mortgage over Carmen,Abolengo, San Carlos, Las Horquertas, and La Rosa farm, which is property of Adeco Agropecuaria S.A. A US$ 35.7 million mortgage over El Meridiano farm, which is property of Pilaga S.A. And a US$ 44.3 million mortgage over Santa Lucia farm, which is property of Bañados del Salado S.A.
Loan with International Finance Corporation (IFC)
In June 2020, our Argentine subsidiaries, Adeco Agropecuaria S.A., Pilagá S.A. and L3N S.A. entered into a US$100 million loan agreement with International Finance Corporation (IFC), member of the World Bank Group. The loan's tenor is eight years, including a two-year grace period, originally with a rate of LIBOR + 4%. In October 2020, US$22 million has been received. In December 2021, we entered into an amendment reducing the total amount to US$ 60 million, that the group could request the withdrawal until June, 2022. If the Company withdraw the full amount, the rate would be reduced to LIBOR + 3%.
The loan contains customary financial covenants and restrictions which require us to meet pre-defined financial ratios, among other restrictions. Publication of LIBOR ceased at the end of June 2023. During April 2023, it was agreed with IFC to
Adecoagro S.A.
Notes to the Consolidated Financial Statements (Continued)
(All amounts in US$ thousands, except shares and per share data and as otherwise indicated)
26. Borrowings (continued)
use Secured Overnight Financing Rate (SOFR), replacing the LIBOR since July 1st, 2023. All the other provisions of the loan agreement continue in full force and effect.
The above mentioned loans contain certain customary financial covenants and restrictions which require us to meet pre-defined financial ratios, among other restrictions, as well as restrictions on the payment of dividends. These financial ratios are measured considering the statutory financial statements of the Argentinian Subsidiaries.
During 2020As of December 31, 2023 and 20192022 the Group was in compliance with all financial covenants.
The carrying amount of short-term borrowings is approximate its fair value due to the short-term maturity. Long term borrowings subject to variable rate approximate their fair value.The fair value of long-term subject to fix rate do not significant differ from their fair value. The fair value (level 2) of the notes as of December 31, 20192023 and 20202022 equals US$ 497485.3 million and US$ 528474.3 million, 99.49%97.06% and 105.65%94.86% of the nominal amount, respectively.
The breakdown of the Group´sGroup’s borrowing by currency is included in Note 2 - Interest rate risk.
Evolution of the Group's borrowings as December 31, 2023 and 2022 is as follow:
| | | | | | | | | | | |
| | 2023 | | 2022 |
| Amount at the beginning of the year | 1,007,752 | | | 817,651 | |
| | | |
| Proceeds from long term borrowings | 7,739 | | | 41,082 | |
| Payments of long term borrowings | (24,105) | | | (14,012) | |
| Proceeds from short term borrowings | 448,532 | | | 347,928 | |
| Payments of short term borrowings | (420,276) | | | (192,648) | |
| Payments of interest (1) | (43,457) | | | (33,189) | |
| Accrued interest | 33,495 | | | 51,596 | |
| Acquisition of subsidiaries (Note 21) | — | | | 17,738 | |
| Exchange differences, inflation and translation, net | (105,465) | | | (30,489) | |
| | | |
| | | |
| Others | 734 | | | 2,095 | |
| Amount at the end of the year | 904,949 | | | 1,007,752 | |
(1) Excludes payment of interest related to trade and other payables.
27. Lease liabilities
| | | | | | | | | | | |
| 2023 | | 2022 |
| Lease liabilities | | | |
| Non-current | 325,569 | | | 283,549 | |
| Current | 52,941 | | | 54,431 | |
| 378,510 | | | 337,980 | |
Adecoagro S.A.
Notes to the Consolidated Financial Statements (Continued)
(All amounts in US$ thousands, except shares and per share data and as otherwise indicated)
27. BorrowingsLease liabilities (continued)
Evolution of the Group's borrowings as December 31, 2020 and 2019 is as follow:
| | | | | | | | | | | |
| | 2020 | | 2019 |
| Amount at the beginning of the year | 968,280 | | | 862,116 | |
| | | |
| Proceeds from long term borrowings | 116,015 | | | 108,271 | |
| Payments of long term borrowings | (34,750) | | | (101,826) | |
| Proceeds from short term borrowings | 207,217 | | | 193,977 | |
| Payments of short term borrowings | (233,540) | | | (131,521) | |
| Payments of interest (1) | (57,914) | | | (51,529) | |
| Accrued interest | 52,800 | | | 53,277 | |
| Acquisition of subsidiaries | 0 | | | 12,823 | |
| Exchange differences, inflation and translation, net | (55,612) | | | 7,284 | |
| Others | 8,594 | | | 15,408 | |
| Amount at the end of the year | 971,090 | | | 968,280 | |
(1) Excludes payment of interest related to trade and other payables.
28. Lease liabilities
| | | | | | | | | | | |
| 2020 | | 2019 |
| Lease liabilities | | | |
| Non-current | 159,435 | | | 174,570 | |
| Current | 36,337 | | | 41,814 | |
| 195,772 | | | 216,384 | |
The maturity of the Group´sGroup’s lease liabilities is as follows:
| | | | | | | | | | | |
| 2023 | | 2022 |
| Less than 1 year | 52,941 | | | 54,431 | |
| Between 1 and 2 years | 66,474 | | | 61,931 | |
| Between 2 and 3 years | 61,398 | | | 50,839 | |
| Between 3 and 4 years | 47,677 | | | 41,781 | |
| Between 4 and 5 years | 39,254 | | | 31,231 | |
| More than 5 years | 110,766 | | | 97,767 | |
| 378,510 | | | 337,980 | |
| | | | | | | | | | | |
| 2020 | | 2019 |
| Less than 1 year | 36,337 | | | 41,814 | |
| Between 1 and 2 years | 20,276 | | | 46,657 | |
| Between 2 and 3 years | 30,228 | | | 28,197 | |
| Between 3 and 4 years | 23,920 | | | 21,160 | |
| Between 4 and 5 years | 19,951 | | | 18,427 | |
| More than 5 years | 65,060 | | | 60,129 | |
| 195,772 | | | 216,384 | |
| | | | | | | | | | | | | | | | | |
| Agricultural "partnerships" | | Others | | Total |
| Amount at the beginning of the year 2022 | 222,013 | | 24,841 | | 246,854 | |
| Exchange differences | 10,230 | | | 4,433 | | 14,663 | |
| Additions and re-measurement | 143,952 | | 9,898 | | 153,850 | |
| Disposal | (3,277) | | | (2,644) | | | (5,921) | |
| Payments | (89,806) | | | (12,773) | | | (102,579) | |
| Finance cost related to lease liabilities | 28,954 | | 2,159 | | 31,113 | |
| Closing net book amount | 312,066 | | | 25,914 | | | 337,980 | |
| | | | | |
| Amount at the beginning of the year 2023 | 312,066 | | 25,914 | | 337,980 | |
| Exchange differences | 17,062 | | | 1,151 | | 18,213 | |
| Additions and re-measurement | 96,294 | | 5,061 | | 101,355 | |
| Disposal | (908) | | | — | | | (908) | |
| Payments | (104,261) | | | (14,072) | | | (118,333) | |
| Finance cost related to lease liabilities | 36,906 | | 3,297 | | 40,203 | |
| Closing net book amount | 357,159 | | | 21,351 | | | 378,510 | |
| | | | | | | | | | | |
| | 2023 | | 2022 |
| Non-current | | | |
| Social security payable | 1,570 | | | 1,581 | |
| | 1,570 | | | 1,581 | |
| Current | | | |
| Salaries payable | 4,498 | | | 4,050 | |
| Social security payable | 4,062 | | | 4,693 | |
| Provision for vacations | 12,783 | | | 11,487 | |
| Provision for bonuses | 16,014 | | | 9,734 | |
| | 37,357 | | | 29,964 | |
| Total payroll and social security liabilities | 38,927 | | | 31,545 | |
Adecoagro S.A.
Notes to the Consolidated Financial Statements (Continued)
(All amounts in US$ thousands, except shares and per share data and as otherwise indicated)
29. Payroll and social security liabilities
| | | | | | | | | | | |
| | 2020 | | 2019 |
| Non-current | | | |
| Social security payable | 1,075 | | | 1,209 | |
| | 1,075 | | | 1,209 | |
| Current | | | |
| Salaries payable | 2,774 | | | 3,290 | |
| Social security payable | 2,827 | | | 3,025 | |
| Provision for vacations | 6,866 | | | 8,808 | |
| Provision for bonuses | 10,866 | | | 10,085 | |
| | 23,333 | | | 25,208 | |
| Total payroll and social security liabilities | 24,408 | | | 26,417 | |
30.29. Provisions for other liabilities
The Group is subject to several laws, regulations and business practices of the countries where it operates. In the ordinary course of business, the Group is subject to certain contingent liabilities with respect to existing or potential claims, lawsuits and other proceedings, including those involving tax, labor and social security, administrative and civil and other matters. The Group accrues liabilities when it is probable that future costs will be incurred and it can reasonably estimate them. The Group bases its accruals on up-to-date developments, estimates of the outcomes of the matters and legal counsel experience in contesting, litigating and settling matters. As the scope of the liabilities becomes better defined or more information is available, the Group may be required to change its estimates of future costs, which could have a material effect on its results of operations and financial condition or liquidity.
The table below shows the movements in the Group's provisions for other liabilities categorized by type of provision:
| | | | Labor, legal and
other claims | | Others | | Total | | Labor, legal and
other claims | | Others | | Total |
| At January 1, 2019 | 3,620 | | | 5 | | | 3,625 | |
| At January 1, 2022 | |
| Additions | Additions | 527 | | | 41 | | | 568 | |
| Acquisition of subsidiaries | |
| Used during year | Used during year | (774) | | | 0 | | | (774) | |
| Exchange differences | Exchange differences | (247) | | | 0 | | | (247) | |
| At December 31, 2019 | 3,126 | | | 46 | | | 3,172 | |
| At December 31, 2022 | |
| Additions | Additions | 890 | | | 1,449 | | | 2,339 | |
| | Used during year | |
| Used during year | |
| Used during year | Used during year | (407) | | | 0 | | | (407) | |
| Exchange differences | Exchange differences | (745) | | | 0 | | | (745) | |
| At December 31, 2020 | 2,864 | | | 1,495 | | | 4,359 | |
| At December 31, 2023 | |
Analysis of total provisions:
| | | | 2020 | | 2019 | | 2023 | | 2022 |
| Non current | Non current | 2,705 | | | 2,936 | |
| Current | Current | 1,654 | | | 236 | |
| | | 4,359 | | | 3,172 | |
The Group is engaged in several legal proceedings, including tax, labor, civil, administrative and other proceedings in Brazil, which qualified as contingent liabilities for an aggregate claimed nominal amount of US$ 73.778.5 million and US$ 22.478.5 million as of December 31, 20202023 and 2019,2022, respectively. The main addition in the year 2020These amounts refers to a claim of the tax authorities in Brazil of the exclusion of the calculation base of Income Tax of the accelerated depreciation of rural activity as provided for in article 6 of Provisional Measure 2,159-70 / 01 and in Article 325 of the Income Tax Regulation / 18.
Adecoagro S.A.
Notes to the Consolidated Financial Statements (Continued)
(All amounts in US$ thousands, except shares and per share data and as otherwise indicated)
31.30. Group companies
The following table details the subsidiaries that comprised the Group as of December 31, 20202023 and 2019:2022:
| | | | | | | | 2020 | | 2019 | | | | | | 2023 | | 2022 |
| | | Activities | | Country of
incorporation
and operation | | Ownership
percentage
held if not
100 % | | Ownership
percentage
held if not
100 % | | Activities | | Country of
incorporation
and operation | | Ownership
percentage
held if not
100 % |
| Details of principal subsidiary undertakings: | Details of principal subsidiary undertakings: | | | | | | | | Details of principal subsidiary undertakings: | | | | | |
| Operating companies (unless otherwise stated): | Operating companies (unless otherwise stated): | | | | | | | | Operating companies (unless otherwise stated): | | | | | |
| Adeco Agropecuaria S.A. | Adeco Agropecuaria S.A. | (a) | | Argentina | | 0 | | | 0 | |
| Pilagá S.A. | Pilagá S.A. | (a) | | Argentina | | 99.94 | % | | 99.94 | % | Pilagá S.A. | (a) | | Argentina | | 99.98 | % | | 99.98 | % |
| Cavok S.A. | Cavok S.A. | (a) | | Argentina | | 51 | % | | 51 | % | Cavok S.A. | (a) | | Argentina | | 51 | % | | 51 | % |
| Establecimientos El Orden S.A. | Establecimientos El Orden S.A. | (a) | | Argentina | | 51 | % | | 51 | % | Establecimientos El Orden S.A. | (a) | | Argentina | | 51 | % | | 51 | % |
| Bañado del Salado S.A. | Bañado del Salado S.A. | (a) | | Argentina | | 0 | | | 0 | |
| Agro Invest S.A. | Agro Invest S.A. | (a) | | Argentina | | 51 | % | | 51 | % | Agro Invest S.A. | (a) | | Argentina | | 51 | % | | 51 | % |
| Forsalta S.A. | Forsalta S.A. | (a) | | Argentina | | 51 | % | | 51 | % | Forsalta S.A. | (a) | | Argentina | | 51 | % | | 51 | % |
| Dinaluca S.A. | Dinaluca S.A. | (a) | | Argentina | | 0 | | | 0 | |
| Simoneta S.A. | (a) | | Argentina | | (*) | | 0 | |
| Compañía Agroforestal S.M.S.A. | Compañía Agroforestal S.M.S.A. | (a) | | Argentina | | 0 | | | 0 | |
| Energía Agro S.A.U. | Energía Agro S.A.U. | (a) | | Argentina | | 0 | | | 0 | |
| L3N S.A. | L3N S.A. | (d) | | Argentina | | 0 | | | 0 | |
| Maní del Plata S.A. | Maní del Plata S.A. | (a) | | Argentina | | 0 | | | 0 | |
| Girasoles del Plata S.A. | Girasoles del Plata S.A. | (a) | | Argentina | | 0 | | | 0 | |
| Adeco Agropecuaria Brasil S.A. | (b) | | Brazil | | 0 | | | 0 | |
| Molinos Libres S.A.U. | |
| | Adeco Agropecuaria Brasil Ltda. | |
| Adeco Agropecuaria Brasil Ltda. | |
| Adeco Agropecuaria Brasil Ltda. | |
| Adecoagro Vale do Ivinhema S.A. ("AVI") | Adecoagro Vale do Ivinhema S.A. ("AVI") | (b) | | Brazil | | 0 | | | 0 | |
| Usina Monte Alegre Ltda. ("UMA") | Usina Monte Alegre Ltda. ("UMA") | (b) | | Brazil | | 0 | | | 0 | |
| Monte Alegre Energia Ltda. | (b) | | Brazil | | 0 | | | 0 | |
| Adecoagro Biogas LTDA. (ex Adecoagro GD LTDA.) | |
| Monte Alegre Combustiveis Ltda. | |
| Adecoagro Energia Ltda. | Adecoagro Energia Ltda. | (b) | | Brazil | | 0 | | | 0 | |
| Adecoagro Agricultura e Participação Ltda. | Adecoagro Agricultura e Participação Ltda. | (b) | | Brazil | | 0 | | | 0 | |
| Methanum Engenharia Ambiental Ltda. | |
| Angelica Energia Ltda. | |
| Ivinhema Energia Ltda. | |
| Kelizer S.A. | Kelizer S.A. | (a) | | Uruguay | | 0 | | | 0 | |
| Adecoagro Uruguay S.A. | Adecoagro Uruguay S.A. | (a) | | Uruguay | | 0 | | | 0 | |
| Arroz del Plata S.A. (ex Viterra Uruguay S.A.) | |
| Paso Dragón S.A. | |
| Adecoagro Chile S.P.A | |
| Holdings companies: | Holdings companies: | | | | | | Holdings companies: | | | | | | | |
| Adeco Brasil Participações S.A. | — | | Brazil | | 0 | | | 0 | |
| Adecoagro Brasil Participações S.A. | |
| Adecoagro LP S.C.S. | Adecoagro LP S.C.S. | — | | Luxembourg | | 0 | | | 0 | |
| Adecoagro GP S.a.r.l. | Adecoagro GP S.a.r.l. | — | | Luxembourg | | 0 | | | 0 | |
| Ladelux S.C.A. | — | | Uruguay | | 0 | | | 0 | |
| Ladelux S.A. | |
| Spain Holding Companies | Spain Holding Companies | (c) | | Spain | | 0 | | | 0 | |
(a) Mainly crops, rice, cattle and others.
(b) Mainly sugarcane, ethanol and energy.
(c) Comprised by (1) wholly owned subsidiaries: Kadesh Hispania S.L.U.; Leterton España S.L.U.; Global Asterion S.L.U.; Global Acasto S.L.U.; Global Laertes S.L.U.; Global Seward S.L.U. (*); Global Pindaro S.L.U.; Global Pileo S.L.U.; Peak Texas S.L.U.; Peak City S.L.U. (*); Global Neimoidia S.L.U. and 51% controlled subsidiaries; Global Acamante S.L.U.; Global Carelio S.L.U.; Global Calidon S.L.U.; Global Mirabilis S.L.U. Global Anceo S.L.U.Global Hisingen S.L.U.
(d) Mainly dairy
(*) Simoneta S.A., Global Seward S.L.U. and Peak City S.L.U. were sold during December 2020. See Note 22.
Adecoagro S.A.
Notes to the Consolidated Financial Statements (Continued)
(All amounts in US$ thousands, except shares and per share data and as otherwise indicated)
31.30. Group companies (continued)
The percentage voting right for each principal subsidiary is the same as the percentage of capital stock held. Issued share capital represents only ordinary shares/ quotas, units or their equivalent. There are no preference shares or units issued in any subsidiary undertaking.
According to the laws of certain of the countries in which the Group operates, 5% of the profit of the year is separated to constitute legal reserves until they reach legal capped amounts (20% of total capital). These legal reserves are not available for dividend distribution and can only be released to absorb losses. The Group’s joint ventures have not reached the legal capped amounts.
32.31. Related-party transactions
The following is a summary of the balances and transactions with related parties:
| | | | | | | | | | | | | | | | | | | | | | | | | | | | | | | | | | | | | | | | | | | | |
| Related party | | Relationship | | Description of transaction | | Income (loss) included in the
statement of income | | Balance receivable
(payable)/(equity) |
| 2020 | | 2019 | | 2018 | | 2020 | | 2019 |
| | | | | | | | | | | | | | |
| | | | | | | | | | | | | | |
| | | | | | | | | | | | | |
| | | | | | | | | | | | | |
| | | | | | | | | | | | | | |
| | | | | | | | | | | | | | |
| | | | | | | | | | | | | | |
| Directors and senior management | | Employment | | Compensation selected employees | | (5,232) | | | (5,232) | | | (7,122) | | | (15,499) | | | (15,499) | |
| | | | | | | | | | | | | | |
| Girasoles del Plata S.A (i) | | Joint venture | | Sales of goods | | 0 | | | 0 | | | 456 | | | 0 | | | 0 | |
| | | | Services | | 0 | | | 0 | | | 210 | | | 0 | | | 0 | |
| | | | Interest income | | 0 | | | 0 | | | 242 | | | 0 | | | 0 | |
(i)Since February 2019, Girasoles del Plata S.A. (formerly CHS Agro S.A.) is fully part of the Group.
Adecoagro S.A.
Notes to the Consolidated Financial Statements (Continued)
(All amounts in US$ thousands, except shares and per share data and as otherwise indicated) | | | | | | | | | | | | | | | | | | | | | | | | | | | | | | | | | | | | | | | | | | | | |
| Related party | | Relationship | | Description of transaction | | Loss included in the
statement of income | | Balance receivable
(payable)/(equity) |
| 2023 | | 2022 | | 2021 | | 2023 | | 2022 |
| | | | | | | | | | | | | | |
| | | | | | | | | | | | | | |
| | | | | | | | | | | | | |
| | | | | | | | | | | | | |
| | | | | | | | | | | | | | |
| | | | | | | | | | | | | | |
| | | | | | | | | | | | | | |
| Management and selected employees | | Employment | | Compensation selected employees | | (8,218) | | | (11,497) | | | (7,883) | | | (18,781) | | | (18,917) | |
| | | | | | | | | | | | | | |
33. Critical32. Material accounting estimates and judgments
Critical accounting policies are those that are most important to the portrayal of the Group’s financial condition, results of operations and cash flows, and require management to make difficult, subjective or complex judgments and estimates about matters that are inherently uncertain. Management bases its estimates on historical experience and other assumptions that it believes are reasonable. The Group’s critical accounting policies are discussed below.
Actual results could differ from estimates used in employing the critical accounting policies and these could have a material impact on the Group’s results of operations. The Group also has other policies that are considered key accounting policies, such as the policy for revenue recognition. However, these other policies, which are discussed in the notes to the Group’s financial statements, do not meet the definition of critical accounting estimates, because they do not generally require estimates to be made or judgments that are difficult or subjective.
(a)Impairment of non-financial assets
At the date of each statement of financial position, the Group reviews the carrying amounts of its property, plant and equipment and finite lived intangible assets to determine whether there is any indication that those assets could have suffered an impairment loss. If any such indication exists, the recoverable amount of the asset is estimated in order to determine the extent, if any, of the impairment loss. Where the asset does not generate cash flows that are independently,independent from other assets, the Group estimates the recoverable amount of the cash-generating unit to which the asset belongs. The Group’s property, plant and equipment items generally do not generate independent cash flows.
In the case of Goodwill,goodwill, any goodwill acquired is allocated to the cash-generating unit (‘CGU’) expected to benefit from the business combination. CGU to which goodwill is allocated is tested for impairment annually (every September), or more frequently if events or changes in circumstances indicate that the carrying amount of the CGU may be impaired. The carrying amount of the CGU is compared to its recoverable amount, which is the higher of fair value less costs to sell and the value in use. An impairment loss is recognized for the amount by which the carrying amount exceeds its recoverable amount. The impairment review requires management to undertake certain significant judgments, including estimating the recoverable value of the CGU to which goodwill is allocated, based on either fair value less costs-to-sell or the value-in-use, as appropriate, in order to reach a conclusion on whether it deems the goodwill is impaired or not.
For purposes of the impairment testing, each CGU represents the smallest identifiable group of assets that generate cash inflows that are largely independent of the cash inflows from other assets or group of assets.
Adecoagro S.A.
Notes to the Consolidated Financial Statements (Continued)
(All amounts in US$ thousands, except shares and per share data and as otherwise indicated)
32. Material accounting estimates and judgments (continued)
Farmlands may be used for different activities that may generate independent cash flows. ThoseFor those farmlands that are used for more than one segment activity (i.e. crops and cattle or rental income), the farmland is further subdivided into two or more CGUs, as appropriate, for purposes of impairment testing. For its properties in Brazil, management identified a farmland together with its related mill as separate CGUs. Most of the farmlands in Argentina and Uruguay are treated as single CGUs.
Based on these criteria, management identified a total amount of 4042 CGUs as of September 30, 20202023 and 4042 CGUs as of September 30, 2019.2022.
As of September 30, 20202023 and 2019,2022, due to the fact that there were no impairment indicators, the Group only tested those CGUs with allocated goodwill in Argentina and Brazil.
CGUs tested based on a fair-value-less-costs-to-sell model at September 30, 20202023 and 2019:2022:
As of September 30, 2020,2023, the Group identified 1110 CGUs in Argentina (2019: 11(2022: 10 CGUs) to be tested based on this model (all CGUs with allocated goodwill). Estimating the fair value less costs-to-sell is based on the best information available, and refers to the amount at which the CGU could be bought or sold in a current transaction between willing parties. Management may be assisted by the work of external advisors.independent experts. When using this model, the Group applies the “sales comparison approach” as its method of valuing most properties, which relies on results of sales of similar agricultural properties to estimate the value of the CGU. This approach is based on the theory that the fair value of a property is directly related to the selling prices of similar properties.
Adecoagro S.A.
Notes to the Consolidated Financial Statements (Continued)
(All amounts in US$ thousands, except shares and per share data and as otherwise indicated)
33. Critical accounting estimates and judgments (continued)
Fair values are determined by extensive analysis which includes current and potential soil productivity of the land (the ability to produce crops and maintain livestock) projected margins derived from soil use, rental value obtained for soil use, if applicable, and other factors such as climate and location. Farmland ratings are established by considering such factors as soil texture and quality, yields, topography, drainage and rain levels. Farmland may contain farm outbuildings. A farm outbuilding is any improvement or structure that is used for farming operations. Outbuildings are valued based on their size, age and design.
Based on the factors described above, each farm property is assigned different soil classifications for the purposes of establishing a value, Soil classifications quantify the factors that contribute to the agricultural capability of the soil. Soil classifications range from the most productive to the least productive.
The first step to establishing an assessment for a farm property is a sales investigation that identifies the valid farm sales in the area where the farm is located. A price per hectare is assigned for each soil class within each farm property. This price per hectare is determined based on the quantitative and qualitative analysis mainly described above.
The results are then tested against actual sales, if any, and current market conditions to ensure the values produced are accurate, consistent and fair.
The following table shows only the 1110 CGUs (2019: 11(2022: 10 CGUs) where goodwill was allocated at each period end and the corresponding amount of goodwill allocated to each one:
| | | | | | | | | | | | | | |
| CGU / Operating segment / Country | | September 30, 2020 | | September 30, 2019 |
| La Carolina / Crops / Argentina | | 168 | | | 162 | |
| La Carolina / Cattle / Argentina | | 27 | | | 26 | |
| El Orden / Crops / Argentina | | 180 | | | 175 | |
| El Orden / Cattle / Argentina | | 7 | | | 6 | |
| La Guarida / Crops / Argentina | | 1,196 | | | 1,158 | |
| La Guarida / Cattle / Argentina | | 616 | | | 597 | |
| Los Guayacanes / Crops / Argentina | | 2,215 | | | 2,145 | |
| Doña Marina / Rice / Argentina | | 3,856 | | | 3,734 | |
| Huelen / Crops / Argentina (1) | | 3,838 | | | 3,716 | |
| El Colorado / Crops / Argentina | | 1,918 | | | 1,857 | |
| El Colorado / Cattle / Argentina | | 19 | | | 18 | |
| Closing net book value of goodwill allocated to CGUs tested (Note 15) | | 14,040 | | | 13,594 | |
| Closing net book value of PPE items allocated to CGUs tested | | 161,010 | | | 162,844 | |
| Total assets allocated to CGUs tested | | 175,050 | | | 176,438 | |
(1) Dispose on December 2020, see Note 22.
F- 72
Adecoagro S.A.
Notes to the Consolidated Financial Statements (Continued)
(All amounts in US$ thousands, except shares and per share data and as otherwise indicated)
32. Material accounting estimates and judgments (continued)
| | | | | | | | | | | | | | |
| CGU / Operating segment / Country | | September 30, 2023 | | September 30, 2022 |
| La Carolina / Crops / Argentina | | 242 | | | 242 | |
| La Carolina / Cattle / Argentina | | 39 | | | 39 | |
| El Orden / Crops / Argentina | | 261 | | | 260 | |
| El Orden / Cattle / Argentina | | 10 | | | 9 | |
| La Guarida / Crops / Argentina | | 1,731 | | | 1,726 | |
| La Guarida / Cattle / Argentina | | 892 | | | 889 | |
| Los Guayacanes / Crops / Argentina | | 3,206 | | | 3,196 | |
| Doña Marina / Rice / Argentina | | 5,582 | | | 5,565 | |
| El Colorado / Crops / Argentina | | 2,776 | | | 2,768 | |
| El Colorado / Cattle / Argentina | | 28 | | | 27 | |
| Closing net book value of goodwill allocated to CGUs tested (Note 15) | | 14,767 | | | 14,721 | |
| Closing net book value of PPE items allocated to CGUs tested | | 143,976 | | | 143,585 | |
| Total assets allocated to CGUs tested | | 158,743 | | | 158,306 | |
Based on the testing above, the Group determined that none of the CGUs, with allocated goodwill, were impaired at September 30, 20202023 and 2019.2022.
CGUs tested based on a value-in-use model at September 30, 20202023 and 2019:2022:
As of September 30, 2020,2023, the Group identified 2 CGUs (2019:(2022: 2 CGUs) in Brazil to be tested based on this model (all CGUs with allocated goodwill). The determination of the value-in-use calculation required the use of significant estimates and assumptions related to management’s cash flow projections. In performing the value-in-use calculation, the Group applied pre-tax rates to discount the future pre-tax cash flows. In each case, these key assumptions have been made by management
Adecoagro S.A.
Notes to the Consolidated Financial Statements (Continued)
(All amounts in US$ thousands, except shares and per share data and as otherwise indicated)
33. Critical accounting estimates and judgments (continued)
reflecting past experience and are consistent with relevant external sources of information, such as appropriate market data. In calculating value-in-use, management may be assisted by the work of external advisors.
The key assumptions used by management in the value-in-use calculations which are considered to be most sensitive to the calculation are:
| | Key Assumptions | Key Assumptions | | September 30, 2020 | | September 30, 2019 | Key Assumptions | | September 30, 2023 | | September 30, 2022 |
| Financial projections | Financial projections | | Covers 4 years for UMA (*) | | Covers 4 years for UMA (*) | Financial projections | | Covers 5 years for UMA (*) |
| Covers 7 years for AVI (**) | | Covers 7 years for AVI (**) |
| | Covers 5 years for AVI (**) | | | | Covers 5 years for AVI (**) | | Covers 5 years for AVI (**) |
| Yield average growth rates | Yield average growth rates | | 0-1% | | 0-1% | Yield average growth rates | | 0-2% | | 0-1% |
| Future pricing increases | Future pricing increases | | 1.76% per annum | | 0.11% per annum | Future pricing increases | | 0.46% per annum | | 1.21% per annum |
| Future cost decrease | Future cost decrease | | 0.33% per annum | | 0.78% per annum | Future cost decrease | | 0.96% per annum | | 0.25% per annum |
| Discount rates | Discount rates | | 7% | | 7% | Discount rates | | 5.2% |
| Perpetuity growth rate | Perpetuity growth rate | | 1% | | 1% | Perpetuity growth rate | | 1% |
(*) UMA stands for Usina Monte Alegre LTDA.
(**) AVI stands for Adecoagro Vale Do Ivinhema S.A.
Discount rates are based on the risk-free rate for U. S. government bonds, adjusted for a risk premium to reflect the increased risk of investing in South America and Brazil in particular. The risk premium adjustment is assessed for factors specific to the respective CGUs and reflects the countries that the CGUs operate in.
Adecoagro S.A.
Notes to the Consolidated Financial Statements (Continued)
(All amounts in US$ thousands, except shares and per share data and as otherwise indicated)
32. Material accounting estimates and judgments (continued)
The following table shows only the 2 CGUs where goodwill was allocated at each period end and the corresponding amount of goodwill allocated to each one:
| | CGU/ Operating segment | CGU/ Operating segment | | September 30, 2020 | | September 30, 2019 | CGU/ Operating segment | | September 30, 2023 | | September 30, 2022 |
| AVI / Sugar, Ethanol and Energy | AVI / Sugar, Ethanol and Energy | | 2,815 | | | 3,813 | |
| UMA / Sugar, Ethanol and Energy | UMA / Sugar, Ethanol and Energy | | 1,056 | | | 1,430 | |
| Closing net book value of goodwill allocated to CGUs tested (Note 15) | Closing net book value of goodwill allocated to CGUs tested (Note 15) | | 3,871 | | | 5,243 | |
| Closing net book value of PPE items allocated to CGUs tested | Closing net book value of PPE items allocated to CGUs tested | | 494,077 | | | 614,702 | |
| Total assets allocated to 2 CGUs tested | Total assets allocated to 2 CGUs tested | | 497,948 | | | 619,945 | |
Based on the testing above, the Group determined that none of the CGUs, with allocated goodwill, were impaired at September 30, 20202023 and 2019.2022.
Management views these assumptions are conservative and does not believe that any reasonable change in the assumptions would cause the carrying value of these CGU’s to exceed the recoverable amount.
The Company'sGroup’s goodwill and property, plant and equipment balances allocated to the cash generating units with allocated goodwill in Argentina were US$ 9.8 million and US$ 148.9 million, respectively, and goodwill and property, plant and equipment allocated to the cash generating units with allocated goodwill in Brazil were U$S 147US$ 4.5 million and U$S 519648 million, respectively atas of December 31, 2020.2023.
As of December 31, 2020,2023, the Group determined that there isare no indicators of impairment.
(b) Biological assets
The nature of the Group’s biological assets and the basis of determination of their fair value are explained under Note 34.11.33.11. The discounted cash flow model requires the input of highly subjective assumptions including observable and unobservable data. Generally the estimation of the fair value of biological assets is based on models or inputs that are not observable in the market and the use of such unobservable inputs is significant to the overall valuation of the assets. These
Adecoagro S.A.
Notes to the Consolidated Financial Statements (Continued)
(All amounts in US$ thousands, except shares and per share data and as otherwise indicated)
33. Critical accounting estimates and judgments (continued)
inputs are determined based on the best information available, for example by reference to historical information of past practices and results, statistical and agronomic information, and other analytical techniques. The discounted cash flow model includes significant assumptions relating to the cash flow projections including future market prices, estimated yields at the point of harvest, estimated production cycle, future costs of harvesting and other costs, and estimated discount rate.
Market prices are generally determined by reference to observable data in the principal market for the agricultural produce. Harvesting costs and other costs are estimated based on historical and statistical data. Yields are estimated based on several factors including the location of the farmland and soil type, environmental conditions, infrastructure and other restrictions and growth at the time of measurement. Yields are subject to a high degree of uncertainty and may be affected by several factors out of the Group’s control including but not limited to extreme or unusual weather conditions, plagues and other crop diseases, among other factors.
The significant assumptions discussed above are highly sensitive. Reasonable shifts in assumptions including but not limited to increases or decreases in prices, costs and discount factors used would result in a significant increase or decrease to the fair value of biological assets. In addition, cash flows are projected over a number of years and based on estimated production. Estimates of production in themselves are dependent on various assumptions, in addition to those described above, including but not limited to several factors such as location, environmental conditions and other restrictions. Changes in these estimates could materially impact on estimated production, and could therefore affect estimates of future cash flows used in the assessment of fair value (see Note 16).
Adecoagro S.A.
Notes to the Consolidated Financial Statements (Continued)
(All amounts in US$ thousands, except shares and per share data and as otherwise indicated)
32. Material accounting estimates and judgments (continued)
(c) Income taxes
The Group is subject to income taxes in numerous jurisdictions. Significant judgment is required in determining the worldwide provision for income taxes. There are many transactions and calculations for which the ultimate tax determination is uncertain. The Group recognizes liabilities for anticipated tax audit issues based on estimates of whether additional taxes will be due. Where the final tax outcome of these matters is different from the amounts that were initially recorded, such differences will impact the current and deferred income tax assets and liabilities in the period in which such determination is made.
Deferred tax assets are reviewed each reporting date and reduced to the extent that it is no longer probable that sufficient taxable income will be available to allow all or part of the asset to be settled. Deferred tax assets and liabilities are not discounted. The ultimate realization of deferred tax assets is dependent upon the generation of future taxable income during the periods in which those temporary differences become deductible. Management considers the scheduled reversal of deferred tax liabilities, projected future taxable income and tax planning strategies in making this assessment (see Note 10).
(d) Fair value for farmlands and investment property
Property, plant and equipment
Farmlands are recognized at fair value based on periodic, but at least annual, valuations prepared by an external independent expert. A revaluation reserve is credited in shareholders’ equity. The valuation is determined using sales Comparison Approach.comparison approach. Sale prices of comparable properties are adjusted considering the specific aspects of each property, the most relevant premise being the price per hectare (Level 3) (see Note 12).
Investment property
Investment property consists of farmland for rental or for capital appreciation and not used in production or for sale in the ordinary course of business, and it is measured at fair value. The changes ofin the Fairfair value, which is based on an independent external expert, impacts the profit and loss of the period, in the line item Other operating income, net (see Note 14).
(e) Purchase price allocation
The acquisition method of accounting is used to account for all acquisitions. Under this method, assets acquired and liabilities assumed of the Company are measured at fair value for financial reporting purposes. In estimating the fair value of an asset or a liability, the Company uses market-observable data to the extent it is available. Where Level 1 inputs are not available, the Company estimates the fair value of an asset or a liability by converting future amounts (e.g. cash flows or income and expenses) to a single current (i.e. discounted) amount.
Management applied judgement in estimating the fair value of certain identifiable assets acquired, which involved the use of estimates and assumptions, including the timing and amounts of cash flow projections and discount rates, as applicable.
Adecoagro S.A.
Notes to the Consolidated Financial Statements (Continued)
(All amounts in US$ thousands, except shares and per share data and as otherwise indicated)
33. Summary of material accounting policies
34. Summary of significant accounting policies
The principal accounting policies applied in the preparation of these Consolidated Financial Statements are set out below. These policies have been consistently applied to all the years presented, unless otherwise stated.
Financial reporting in a hyperinflation economy
IAS 29 “Financial Reporting in Hyperinflationary Economies” requires that the financial statements of entities whose functional currency is that of a hyperinflationary economy to be adjusted for the effects of changes in a suitable general price index and to be expressed in terms of the current unit of measurement at the closing date of the reporting period. Accordingly, the inflation produced from the date of acquisition or from the revaluation date, as applicable, must be computed in the non-monetary items.
In order to conclude on whether an economy is categorized as hyperinflationary under the terms of IAS 29, the Standard details a series of factors to be considered, including the existence of a cumulative inflation rate in three years that approximates or exceeds 100 %.
Since 2018, when cumulative inflation rate in three years exceeded the 100% threshold, Argentina´sArgentina’s operations are considered to be under hyperinflationary economy for accounting purposesunderpurposes under the terms of IAS 29 and since then, it has been applied IAS 29 in the financial reporting of its subsidiaries and associates with Argentine peso as functional currency.
Financial statements of a foreign entity with a functional currency of a country that has a highly inflationary economy, are restated to reflect changes in the general price level or index in that country before translation into U.S. Dollars. In adjusting for hyperinflation, a general price index is applied to all non-monetary items in the financial statements (including equity) and the resulting gain or loss, which is the gain or loss on the entity's net monetary position, is recognized in the income statement. Monetary items in the closing statement of financial position are not adjusted. The Group treated all Argentine subsidiaries as a hyperinflationary economy as all of them have argentineArgentine peso as functional currency. The results and financial position of all foreign entities with a functional currency of a country that has a highly inflationary economy are translated at closing rates after the restatement for changes in the general purchasing power argentineArgentine peso.
The inflation adjustment on the years 2020, 20192023, 2022 and 20182021 was calculated by means of conversion factor derived from the Argentine price indexes published by the National Institute of Statistics and the year-over-year change in the index was 1.361; 1.5383.114; 1.9479 and 1.476,1.509, respectively.
The main procedures for the above-mentioned adjustment are as follows:
•Monetary assets and liabilities which are carried at amounts current at the balance sheet date are not restated because they are already expressed in terms of the monetary unit current at the balance sheet date.
•Non-monetary assets and liabilities which are not carried at amounts current at the balance sheet date, and components of shareholders' equity are adjusted by applying the relevant conversion factors.
•All items in the income statement are restated by applying the relevant conversion factors.
•The effect of inflation on the Company’s net monetary position is included in the income statement, in "Other financial results" (Note 9).
•The ongoing application of the re-translation of comparative amounts to closing exchanges rates under IAS 21 and the hyperinflation adjustments required by IAS 29 will lead to a difference in addition to the difference arising on the application of hyperinflation accounting.
Adecoagro S.A.
Notes to the Consolidated Financial Statements (Continued)
(All amounts in US$ thousands, except shares and per share data and as otherwise indicated)
34. Summary of significant accounting policies (continued)
The comparative figures in these Consolidated Financial Statements presented in a stable currency are not adjusted for subsequent changes in the price level or exchange rates. This resulted in a difference between the closing equity of the previous year and the opening equity of the current year. The Company recognized this initial difference directly in equity.
Adecoagro S.A.
Notes to the Consolidated Financial Statements (Continued)
(All amounts in US$ thousands, except shares and per share data and as otherwise indicated)
33. Summary of preparation and presentationmaterial accounting policies (continued)
The Consolidated Financial Statements of the Group have been prepared in accordance with International Financial ReportingIFRS Accounting Standards (IFRS) ofas issued by the International Accounting Standards Board (IASB) and the Interpretations of the International Financial Reporting Interpretations Committee (IFRIC). All IFRS Accounting Standards as issued by the IASB, effective at the time of preparing these Consolidated Financial Statements have been applied.
The Consolidated Financial Statements have been prepared under the historical cost convention as modified by financial assets and financial liabilities (including derivative instruments) at fair value through profit or loss, biological assets and agricultural produce at the point of harvest and farmlands measured at fair value.
The preparation of Consolidated Financial Statements in conformity with IFRS Accounting Standards as issued by the IASB requires the use of certain critical accounting estimates. It also requires management to exercise its judgment in the process of applying the Group’s accounting policies. The areas involving a higher degree of judgment or complexity, or areas where assumptions and estimates are significant to the Consolidated Financial Statements are disclosed in Note 34.33.
DescriptionNew and Amended Financial Reporting Standards and Interpretations, effective for the financial year beginning on January 1, 2023
Amendments to IAS 1 - Presentation of Financial Statements – Disclosure of Accounting Policies: The objective of these amendments is to improve the disclosure of accounting policies, changed during the year.which require entities to disclose material accounting policies rather than significant accounting policies. This modification was published in February 2021 and is in effect for fiscal years beginning on or after January 1, 2023.
ReclassificationNo other IFRS Accounting Standards as issued by the IASB or IFRIC Interpretation issued effective for the first time for the financial year beginning on January 1, 2023 has a material impact over these Financial Statements.
DuringNew and Amended Reporting Standards and Interpretations issued, but not yet effective for the period ended September 30, 2020, the Company has changed its accounting policy related to the application of IAS 29, Inflation Accounting, that was implemented in 2018. The cumulative initial effect of inflation accounting until December 31, 2017 dividedfinancial year beginning on January 1, 2023 and not early adopted by the exchange rate at that date was recognized directly in equity, in the line “Adjustment of opening balance for the application of IAS 29”, as part of retained earnings. The ongoing effect of hyperinflation adjustment and retranslation of comparative amounts to closing exchange rates after initial recognition was recognized in Other Comprehensive Income, as part of the cumulative translation adjustment (“CTA”).Company
The Company has change its accounting policy forevaluated the presentationrelevance of the effect of the initial application of IAS 29,new and reclassified it to Other Comprehensive Income, as part of the cumulative translation adjustment (“CTA”); instead of presenting it within retained earnings. This change in the presentation policy was in order to provide uniformity of disclosure for the same concept and only required a reclassification of the constituent elements of the equity and does not affect total shareholders equity.
| | | | | | | | | | | | | | | | | | | | | | | | | | | | | | | | | | | |
| January 01, 2018 | | December 31, 2018 | | December 31, 2019 |
| (Previously stated) | Increase / (Decrease) | (Revised) | | (Previously stated) | Increase / (Decrease) | (Revised) | | (Previously stated) | Increase / (Decrease) | (Revised) |
| Retained Earnings | 294,150 | | (187,941) | | 106,209 | | | 237,188 | | (187,941) | | 49,247 | | | 206,669 | | (187,941) | | 18,728 | |
| Cumulative Translation Adjustment | (552,604) | | 187,941 | | (364,663) | | | (666,037) | | 187,941 | | (478,096) | | | (680,315) | | 187,941 | | (492,374) | |
| Subtotal attributable to equity holders of the parent | 861,821 | | 0 | | 861,821 | | | 1,063,636 | | 0 | | 1,063,636 | | | 988,269 | | 0 | | 988,269 | |
In addition, and related to hyperinflation accounting, the Company has changed its accounting policy for the presentation of finance income /expenses. Until June 2020, the Company had elected not to segregate the impact of inflation on financial results. The company has decided to change its presentation policy and segregate the impact of inflation over financial results, considering the segregation of such effects provides reliable and more relevant information. Financial results will be presented reflecting interest and exchange difference, net of its inflation effects. This change represents only a reclassification within Financial results and does not have any impact on total financial results, net or net income.
Adecoagro S.A.
Notes to the Consolidated Financial Statements (Continued)
(All amounts in US$ thousands, except shares and per share data and as otherwise indicated)
34.1 Basis of preparation and presentation (continued)
| | | | | | | | | | | | | | | | | | | | | | | |
| December 31, 2019 | | December 31, 2018 |
| (Previously stated) | Increase / (Decrease) | (Revised) | | (Previously stated) | Increase / (Decrease) | (Revised) |
| - Interest income | 7,319 | | (929) | | 6,390 | | | 7,915 | | (187) | | 7,728 | |
| Finance income | 9,908 | | (929) | | 8,979 | | | 8,581 | | (187) | | 8,394 | |
| - Interest expense | (60,134) | | 3,666 | | (56,468) | | | (51,577) | | 4,311 | | (47,266) | |
| - Cash flow hedge - transfer from equity | (15,594) | | (9,890) | | (25,484) | | | (26,693) | | (11,393) | | (38,086) | |
| - Foreign exchange losses, net | (108,458) | | 82,679 | | (25,779) | | | (183,195) | | 114,408 | | (68,787) | |
| Finance costs | (202,566) | | 76,455 | | (126,111) | | | (271,263) | | 107,326 | | (163,937) | |
| Other financial result - Net gain of inflation effects on the monetary items | 92,437 | | (75,526) | | 16,911 | | | 81,928 | | (107,139) | | (25,211) | |
| Total financial results, net | (100,221) | | 0 | | (100,221) | | | (180,754) | | 0 | | (180,754) | |
Both changes have been reflected in the comparative periods, thus, comparative figures have been restated.
Early adoption of IFRS 3 Amendment
The IASB has issued narrow-scope amendments to IFRS 3,'Business combinations', to improve the definition of a business.
The amended definition emphasizes that the output of a business is to provide goods and services to customers, whereas the previous definition focused on returns in the form of dividends, lower costs or other economic benefits to investors and others.
Entities are required to apply the amendments to transactions for which the acquisition date is on or after the beginning of the first annual reporting period beginning on or after 1 January 2020. The Company applied this amendment form the period beginning on 1 January 2019.
Description of accounting policies changed during last year
Leases
For fiscal years beginning on January 1st, 2019 and onward the adoption of IFRS 16 - Leases it is mandatory.
IFRS 16 was adopted following the simplified approach, without restating comparative. The reclassifications and the adjustments arising from the new lease accounting rules are directly recognized in the opening balance sheet on January 1, 2019.
On adoption of IFRS 16, the Company recognized lease liabilities in relation to leases which had previously been classified as ‘operating leases’ under the principles of IAS 17 Leases For the initial recognition, these liabilities were measured at the present value of the remaining lease payments, discounted using the lessee’s incremental borrowing rate as of January 1, 2019.
The adoption of IFRS 16 Leases from January 1, 2019, resulted in changes in accounting policies and adjustments to the amounts recognized in the financial statements.
Adecoagro S.A.
Notes to the Consolidated Financial Statements (Continued)
(All amounts in US$ thousands, except shares and per share data and as otherwise indicated)
34.1 Basis of preparation and presentation (continued)
Right-of-use assets
The total of the right-of-use assets are included under such type in the Statement of Financial Position:
| | | | | | | | | | | |
| | Right of use | | Lease liabilities |
| | | |
| Closing balance as of December 31, 2018 | 0 | | | 0 | |
| Initial recognition | 204,937 | | | (204,937) | |
| Reclassifications from Trade and other receivables, net | 0 | | | 26,794 | |
| Opening balance as of January 1, 2019 | 204,937 | | | (178,143) | |
Accounting policies for right of use and lease liabilities are disclosed in Note 34.7 Leases
New standards and interpretations not yet adoptedeffective and concluded that they were not relevant for the Group except that the IASB issued IFRS 18 “Presentation and Disclosure in Financial Statements” on April 9, 2024 which is currently under analysis by the Company.
CertainIn particular, although IFRS 18 will replace IAS 1, many of the other existing principles in IAS 1 are retained, with limited changes. The key new accounting standardsconcepts introduced in IFRS 18 relate to the structure of the statement of profit or loss, required disclosures in the financial statements for certain profit or loss performance measures that are reported outside an entity’s financial statements (that is, management-defined performance measures); and enhanced principles on aggregation and disaggregation which apply to the primary financial statements and notes in general. IFRS 18 will not impact the recognition or measurement of items in the financial statements, but it might change what an entity reports as its ‘operating profit or loss’. IFRS 18 will apply for reporting periods beginning on or after January 1, 2027 and also applies to comparative information.
The relevance of other new regulations, modifications and interpretations havenot yet effective has been publishedevaluated and it was concluded that they are not mandatoryrelevant for 31 December 2020 reporting periods and have not been early adopted by the group. These standards are not expected to have a material impact on the entity in the current or future reporting periods and on foreseeable future transactions.Group.
34.233.2 Scope of consolidation
The Consolidated Financial Statements include the results of the Company and all of its subsidiaries from the date that control commences to the date that control ceases. They also include the Group’s share of the net income of its jointly-controlled entities on an equity-accounted basis from the point at which joint control commences, to the date that it ceases.
(a) Subsidiaries
Adecoagro S.A.
Notes to the Consolidated Financial Statements (Continued)
(All amounts in US$ thousands, except shares and per share data and as otherwise indicated)
33.2 Scope of consolidation (continued)
Subsidiaries are all entities over which the Group has control. The Group controls an entity when the Group is exposed to, or has rights to, variable returns from its involvement with the entity and has the ability to affect those returns through its power over the entity. Subsidiaries are fully consolidated from the date that control commences and deconsolidated from the date that control ceases.
The Group uses the acquisition method of accounting to account for business combinations. The consideration transferred for the acquisition of a subsidiary is the fair value of the assets transferred, the liabilities incurred and the equity interests issued by the Group. The consideration transferred includes the fair value of any asset or liability resulting from a contingent consideration arrangement. Acquisition-related costs are expensed as incurred. Identifiable assets acquired and liabilities and contingent liabilities assumed in a business combination are measured initially at their fair values at the acquisition date.
The Group recognizes any non-controlling interest in the acquiree on an acquisition-by-acquisition basis either at fair value or at the non-controlling interest’s proportionate share of the acquiree’s net assets.
The excess of the consideration transferred, the amount of any non-controlling interest in the acquiree and the acquisition-date fair value of any previous equity interest in the acquiree over the fair value of the identifiable net assets acquired is recorded as goodwill. The excess of consideration over the fair value of the Group’s share of the identifiable net assets acquired is recorded as goodwill. If the consideration is less than the fair value of the net assets of the subsidiary acquired, the difference is recognized directly in the statement of income under the line item “Bargain purchase gain on acquisition”.
Inter-company transactions, balances and unrealized gains on transactions between group companies are eliminated. Unrealized losses are also eliminated. Accounting policies of subsidiaries have been changed where necessary to ensure consistency with the policies adopted by the Group.
(b) Disposal of subsidiaries
When the Group ceases to have control any retained interest in the entity is re-measured to its fair value at the date when control is lost, with the change in carrying amount recognized in profit or loss. The fair value is the initial carrying
Adecoagro S.A.
Notes to the Consolidated Financial Statements (Continued)
(All amounts in US$ thousands, except shares and per share data and as otherwise indicated)
34.2 Scope of consolidation (continued)
amount for the purposes of subsequently accounting for the retained interest as an associate, joint venture or financial asset. In addition, any amount previously recognized in other comprehensive income in respect of that entity is accounted for as if the Group had directly disposed of the related assets or liabilities. This may mean that amounts previously recognized in other comprehensive income are reclassified to profit or loss, except for the related revaluation surplus which is reclassified to retained earnings.
34.333.3 Segment reporting
According to IFRS 8, operating segments are identified based on the ‘management approach’. This approach stipulates external segment reporting based on the Group’s internal organizational and management structure and on internal financial reporting to the chief operating decision maker (the Management Committee in the case of the Company)
34.433.4 Foreign currency translation
(a) Functional and presentation currency
Items included in the financial statements of each of the Group’s entities are measured using the currency of the primary economic environment in which the entity operates (‘the functional currency’). The Consolidated Financial Statements are presented in US dollars, which is the Group’s presentation currency.
Argentine currency status
Adecoagro S.A.
Notes to the Consolidated Financial Statements (Continued)
(All amounts in US$ thousands, except shares and per share data and as otherwise indicated)
33.4 Foreign currency translation (continued)
Since the second half of 2019, the Argentine government instituted certain foreign currency exchange controls, which may restrict or partially restrict access to foreign currency, like the U.S. dollars, to make payments abroad, either for foreign debt or the importation of goods or services, dividend payments and others, without prior authorization. Those regulations have continued to evolve, sometimes making them more or less stringent depending on the Argentine government’s perception of availability of sufficient national foreign currency reserves. The above has led to the existence of an informal foreign currency market where foreign currencies quote at levels significantly higher than the official exchange rate. However, the only exchange rate available for external commerce is the official exchange rate, which as of December 31, 2022 was Pesos 177 per dollar.
We use Argentina’s official exchange rate to record the accounts of Argentine subsidiaries.
(b) Transactions and balances
Foreign currency transactions are translated into the functional currency using the exchange rates prevailing at the dates of the transactions or valuation where items are remeasured. Foreign exchange gains and losses resulting from the settlement of such transactions and from the translation at year-end exchange rates of monetary assets and liabilities denominated in foreign currencies are recognized in the statement of income, in the line Item “Finance income” or “Finance cost”, cost,”as appropriate.
(c) Group companies
The results and financial position of Group entities (except those that has the currency of a hyper-inflationary economy - Argentine subsidiaries) that have a functional currency different from the presentation currency are translated into the presentation currency as follows:
•assets and liabilities for each statement of financial position presented are translated at the closing rate at the date of that statement of financial position;
•income and expenses for each statement of income are translated at average exchange rates (unless this average is not a reasonable approximation of the cumulative effect of the rates prevailing on the transaction dates, in which case income and expenses are translated at the rate on the dates of the transactions); and
•all resulting exchange differences are recognized as a separate component of equity.
When a foreign operation is sold, exchange differences that were recorded in equity are recognized in the statement of income as part of the gain or loss on sale.
Goodwill and fair value adjustments arising on the acquisition of a foreign entity are treated as assets and liabilities of the foreign entity and translated at the closing rate.
Adecoagro S.A.
Notes to the Consolidated Financial Statements (Continued)
(All amounts in US$ thousands, except shares and per share data and as otherwise indicated)
34.533.5 Property, plant and equipment
Farmlands are initially recorded at fair value and subsequently under the revaluation model based on periodic, but at least annual, valuations prepared by an external independent expert. A revaluation reserve is credited in shareholders’ equity. All other property, plant and equipment is recorded at cost, less accumulated depreciation and impairment losses, if any. Historical cost comprises the purchase price and any costs directly attributable to the acquisition. Under the definition of Property plant and equipment is included the bearer plants, such as sugarcane and coffee trees.
Where individual components of an item of property, plant and equipment have different useful lives, they are accounted for as separate items, which are depreciated separately.
Subsequent costs are included in the asset’s carrying amount or recognized as a separate asset, as appropriate, only when it is probable that future economic benefits associated with the item will flow to the Group and the cost of the item can be measured reliably. The carrying amount of the replaced part is derecognized. All other repairs and maintenance are charged to the statement of income when they are incurred.
The depreciation methodsaccompanying notes are an integral part of these consolidated financial statements.
F- 79
Adecoagro S.A.
Notes to the Consolidated Financial Statements (Continued)
(All amounts in US$ thousands, except shares and periods used by the group are disclosed in Note 12.per share data and as otherwise indicated)
33.5 Property, plant and equipment (continued)
Gains and losses on disposals are determined by comparing the proceeds with the carrying amount and are recognized within “Other operating income, net” in the consolidated statement of income.
34.633.6 Investment property
Investment property consists of farmland for rental or for capital appreciation and not used in production or for sale in the ordinary course of business, and it is measured at fair value net of any impairment losses if any. The changesvalue. Changes of the Fairfair value, which is based on an independent external expert, impacts the profit and loss of the period, in the line item Other operating income, net.
34.733.7 Leases
Leases are recognized as a right-of-use asset and corresponding liability at the date of which the leased asset is available for use by the group. Each lease payment is allocated between the liability and finance cost. The finance cost is charged to profit or loss over the lease period so as to produce a constant periodic rate of interest on the remaining balance of the liability for each period. The right-of-use asset is depreciated over the shorter of the asset's useful life and the lease term on a straight-line basis.
In determining the lease term, the Company considers all facts and circumstances that create an economic incentive to exercise an extension option, or not exercise a termination option. Extension options (or periods after termination options) are only included in the lease term if the lease is reasonably certain to be extended (or not terminated).
Short term leases are recognized on a straight line basis as an expense in the income statement.
Accounting as lessee
The Company recognizes a right-of-use asset and a lease liability at the commencement date of each lease contract that grants the right to control the use of an identified asset during a period of time. The commencement date is the date in which the lessor makes an underlying asset available for use by the lessee. The Company applied exemptions for leases with a duration lower than 12 months, with a value lower than thirty thousand dollars and/or with clauses related to variable payments. These leases have been considered as short-term leases and, accordingly, no right-of-use asset or lease liability have been recognized.
At initial recognition, the right-of-use asset is measured considering:
Adecoagro S.A.
Notes to the Consolidated Financial Statements (Continued)
(All amounts in US$ thousands, except shares and per share data and as otherwise indicated)
34.7 Leases (continued)
•The value of the initial measurement of the lease liability;
•Any lease payments made at or before the commencement date, less any lease incentives; and
•Any initial direct costs incurred by the lessee; and
After initial recognition, the right-of-use assets are measured at cost, less any accumulated depreciation and/or impairment losses, and adjusted for any re-measurement of the lease liability.
Depreciation of the right-of-use asset is calculated using the straight-line method over the estimated duration of the lease contract.
The lease liability is initially measured at the present value of the lease payments that are not paid at such date, including the following concepts:
•Variable lease payments that depend on an index or rate, initially measured using the index or rate as of the commencement date;
•Amounts expected to be payable by the lessee under residual value guarantees;
•The exercise price of a purchase option if the lessee is reasonably certain to exercise that option; and
•Payments of penalties for terminating the lease, if the lease term reflects the lessee exercising an option to terminate the lease;
•Fixed payments, less any lease incentives receivable;
Adecoagro S.A.
Notes to the Consolidated Financial Statements (Continued)
(All amounts in US$ thousands, except shares and per share data and as otherwise indicated)
33.7 Leases (continued)
After the commencement date, the Company measures the lease liability by:
•Increasing the carrying amount to reflect interest on the lease liability;
•Reducing the carrying amount to reflect lease payments made; and
•Re-measuring the carrying amount to reflect any reassessment or lease modifications.
The above mentioned inputs for the valuation of the right of use assets and lease liabilities including the determination of the contracts within the scope of the standard, the contract term ant interest rate used in the discounted cash flow involved a high degree of management´smanagement’s estimations.
34.833.8 Goodwill
Goodwill represents future economic benefits arising from assets that are not capable of being individually identified and separately recognized by the Group on an acquisition. Goodwill on acquisition is initially measured at cost. being the excess of the consideration over the fair value of the Group’s share of net assets of the acquired subsidiary undertaking at the acquisition date. Following initial recognition, goodwill is measured at cost less any accumulated impairment losses. It is allocated to those cash generating units expected to benefit from the acquisition for the purpose of impairment testing. Goodwill ais included within “Intangible assets” on the statement of financial position. Goodwill arising on the acquisition of foreign entities is treated as an asset of the foreign entity denominated in the local currency and translated at the closing rate.
Goodwill is not amortized but tested for impairment on an annual basis, or more frequently if there is an indication of impairment (see Note 3433 (a)). Gains and losses on the disposal of a Group entity include any goodwill relating to the entity sold (see Note 35.10)33.10).
Adecoagro S.A.
Notes to the Consolidated Financial Statements (Continued)
(All amounts in US$ thousands, except shares and per share data and as otherwise indicated)
34.933.9 Other intangible assets
Other intangible assets that are acquired by the Group, which have finite useful lives, are measured at cost less accumulated amortization and impairment losses, if any. These intangible assets comprise mainly trademarks and computer software and are amortized in the statement of income on a straight-line basis over their estimated useful lives estimated to be 10 to 20 years and 3 to 5 years, respectively.
34.1033.10 Impairment of assets
Goodwill
The Company conducts an impairment test annually or more frequently if events or changes in circumstances indicate that the carrying amount may not be recoverable. An impairment loss is recognized for the amount by which the carrying amount exceeds its recoverable amount. For the purpose of impairment testing, assets are grouped at the lowest levels for which there are separately identifiable cash flows, known as cash-generating units. If the recoverable amount of the cash-generating unit is less than its carrying amount, the impairment loss is allocated first to reduce the carrying amount of any goodwill allocated to the cash generating unit and then to the other assets of the unit pro-rata on the basis of the carrying amount of each asset may in the unit. Impairment losses recognized for goodwill cannot be reversed in a subsequent period. Recoverable amount is the higher of the fair value less costs to sell and value in use. In determining the value in use, the estimated future cash flows are discounted to their present value using a pre-tax discount rate that reflects current market assessments of the time value of money and the risks specific to the asset for which the estimates of future cash flows have not been adjusted (see Note 3433 (a) for details).
Property, plant and equipment and finite lived intangible assets
At each statement of financial position date, the Group reviews the carrying amounts of its property, plant and equipment and other intangible assets which have finite lives to determine whether there is any indication that those assets have suffered an impairment loss. If any such indication exists, the recoverable amount of the asset is estimated in order to determine the extent, if any, of the impairment loss. Where the asset does not generate cash flows that are independent from other assets, the Group estimates the recoverable amount of the cash-generating unit to which the asset belongs.
Adecoagro S.A.
Notes to the Consolidated Financial Statements (Continued)
(All amounts in US$ thousands, except shares and per share data and as otherwise indicated)
33.10 Impairment of assets (continued)
If the recoverable amount of an asset or cash-generating unit is estimated to be less than its carrying amount, that carrying amount is reduced to its recoverable amount. An impairment loss is recognized immediately in the statement of income.
Where an impairment loss subsequently reverses, the carrying amount of the asset or cash-generating unit is increased to the revised estimate of its recoverable amount, not to exceed the carrying amount that would have been determined had no impairment loss been recognized for the asset or cash-generating unit in prior years. A reversal of an impairment loss is recognized immediately in the statement of income.
34.1133.11 Biological assets
Biological assets comprise growing crops (mainly corn, wheat, soybeans, sunflower peanuts and rice), sugarcane, coffee and livestock (growing herd and cattle for dairy production).
The Group distinguishes between consumable and bearer biological assets, and between mature and immature biological assets. “Consumable” biological assets are those assets that may be harvested as agriculture produce or sold as biological assets, for example livestock intended for dairy production. “Bearer” biological assets are those assets capable of producing more than one harvest, for example sugarcane or livestock from which raw milk is produced. “Mature” biological assets are those that have attained harvestable specifications (for consumable biological assets) or are able to sustain regular harvests (for bearer biological assets). “Immature” biological assets are those assets other than mature biological assets.
Adecoagro S.A.
Notes to the Consolidated Financial Statements (Continued)
(All amounts in US$ thousands, except shares and per share data and as otherwise indicated)
34.11 Biological assets (continued)
Costs are capitalized as biological assets if, and only if, (a) it is probable that future economic benefits will flow to the entity, and (b) the cost can be measured reliably. The Group capitalizes costs such as: planting, harvesting, weeding, seedlings, irrigation, agrochemicals, fertilizers and a systematic allocation of fixed and variable production overheads that are directly attributable to the management of biological assets, among others. Costs that are expensed as incurred include administration and other general overhead and unallocated production overhead, among others.
Biological assets, both at initial recognition and at each subsequent reporting date, are measured at fair value less costs to sell, except where fair value cannot be reliably measured. Cost approximates fair value when little biological transformation has taken place since the costs were originally incurred or the impact of biological transformation on price is not expected to be material.
Gains and losses that arise on measuring biological assets at fair value less costs to sell and measuring agricultural produce at the point of harvest at fair value less costs to sell are recognized in the statement of income in the period in which they arise in the line item “Initial recognition and changes in fair value of biological assets and agricultural produce”.
Where there is an active market for a biological asset or agricultural produce, quoted market prices in the most relevant market are used as a basis to determine the fair value. Otherwise, when there is no active market or market-determined prices are not available, fair value of biological assets is determined through the use of valuation techniques.
Therefore, the fair value of biological assets is generally derived from the expected discounted cash flows of the related agricultural produce. The fair value of the agricultural produce at the point of harvest is generally derived from market determined prices.
A general description of the determination of fair values based on the Company’s business segments follow:
•Growing crops including rice:
Growing crops, for which biological growth is not significant, are measured at cost, which approximates fair value. Expenditure on growing crops includes land preparation expenses and other direct expenses incurred during the sowing period including labor, seedlings, agrochemicals and fertilizers among others.
Otherwise, biological assets are measured at fair value less estimated point-of-sale costs at initial recognition and at any subsequent period. Point-of-sale costs include all costs that would be necessary to sell the assets
The accompanying notes are an integral part of these consolidated financial statements.
F- 82
Adecoagro S.A.
Notes to the Consolidated Financial Statements (Continued)
(All amounts in US$ thousands, except shares and per share data and as otherwise indicated)
33.11 Biological assets (continued)
The fair value of growing crops including rice is measured based on a formula, which takes into consideration the estimate of crop yields, estimated market prices and costs, and discount rates. Estimated yields are determined based on several factors including location of farmland, environmental conditions and other restrictions and growth at the time of measurement. Yields are multiplied by sown hectares to determine the estimated tons of crops including rice to be obtained. The tons are then multiplied by a net cash flow determined at the future crop prices less the direct costs to be incurred. This amount is discounted at a discount rate, which reflects current market assessments of the assets involved and the time value of money.
•Growing herd and cattle:
Livestock are measured at fair value less estimated point-of-sale costs, with any changes therein recognized in the statement of income, on initial recognition as well as subsequently at each reporting period. The fair value of livestock is determined based on the actual selling prices less estimated point-of-sale costs in the markets where the Group operates.
•Sugarcane:
Sugarcane planting costs form part of Property plant and equipment. The agricultural produce growing on sugarcane is classified as biological assets and are measured at fair value less cost to sell. The fair value of agricultural produce growing on sugarcane depends on the variety, location and maturity of the plantation.
Adecoagro S.A.
Notes to the Consolidated Financial Statements (Continued)
(All amounts in US$ thousands, except shares and per share data and as otherwise indicated)
34.11 Biological assets (continued)
Agricultural produce growing in the Sugarcane, for which biological growth is not significant, is valued at cost, which approximates fair value. Expenditure on the agricultural produce growing in the sugarcane consists mainly of labor, agrochemicals and fertilizers among others. When it has attained significant biological growth, it is measured at fair value through a discounted cash flow model. Estimated revenues are based on estimated yearly production volume (which will be destined to sugar, ethanol, energy and raw cane production) and the price is calculated as the average of daily prices for sugar future contracts (Sugar #11 ICE-NY contracts) for a six months period. Projected costs include maintenance and land leasing among others. These estimates are discounted at an appropriate discount rate.
34.1233.12 Inventories
Inventories comprise of raw materials, finished goods (including harvested agricultural produce and manufactured goods) and others.
Harvested agricultural produce (except for rice and milk) are measured at net realizable value until the point of sale because there is an active market in the produce, there is a negligible risk that the produce will not be sold and there is a well-established practice in the industry carrying the inventories at net realizable value. Changes in net realizable value are recognized in the statement of income in the period in which they arise under the line item “Changes in net realizable value of agricultural produce after harvest”.
All other inventories (including rice and milk) are measured at the lower of cost and net realizable value. Cost is determined using the weighted average method.
34.1333.13 Financial assets
Financial assets are classified in the following categories: at fair value through profit or loss and at amortized cost, namely loans and receivables. The classification depends on the purpose for which the financial assets were acquired. Management determines the classification of its financial assets at initial recognition (see Note 18)17).
(a) Recognition and measurement
Regular purchases and sales of financial assets are recognized on the trade-date – the date on which the Group commits to purchase or sell the asset. Financial assets not carried at fair value through profit or loss are initially recognized at fair value plus transaction costs. Financial assets carried at fair value through profit or loss are initially recognized at fair value and transaction costs are expensed in the statement of income. Financial assets are derecognized when the rights to receive cash
Adecoagro S.A.
Notes to the Consolidated Financial Statements (Continued)
(All amounts in US$ thousands, except shares and per share data and as otherwise indicated)
33.13 Financial assets (continued)
flows from the investments have expired or have been transferred and the Group has transferred substantially all risks and rewards of ownership. Financial assets at fair value through profit or loss are subsequently carried at fair value. Loans and receivables are subsequently carried at amortized cost using the effective interest method.
Gains or losses arising from changes in the fair value of the “financial assets at fair value through profit or loss” category are presented in the statement of income within “Other operating income, net” in the period in which they arise.
If the market for a financial asset is not active (and for unlisted securities), the Group establishes fair value by using valuation techniques. These include the use of recent arm’s length transactions, reference to other instruments that are substantially the same, discounted cash flow analysis, and option pricing models, making maximum use of market inputs and relying as little as possible on entity-specific inputs.
The Group assesses at each statement of financial position date whether there is objective evidence that a financial asset or a group of financial assets is impaired. Impairment testing of trade receivables is described in Note 35.15.
Adecoagro S.A.
Notes to the Consolidated Financial Statements (Continued)
(All amounts in US$ thousands, except shares and per share data and as otherwise indicated)
34.13 Financial assets (continued)33.15.
(b) Offsetting financial instruments
Financial assets and liabilities are offset and the net amount reported in the statement of financial position when there is a legally enforceable right to offset the recognized amounts and there is an intention to settle on a net basis, or realize the asset and settle the liability simultaneously. This right must not be contingent on future events and must be enforceable in any case.
34.14 Derivative financial instruments and hedging activities
Derivatives are initially recognized at fair value on the date a derivative contract is entered into and are subsequently remeasured at their fair value. Commodity future contract fair values are computed with reference to quoted market prices on future exchanges markets. The fair values of commodity options are calculated using year-end market rates together with common option pricing models. The fair value of interest rate swaps has been calculated using a discounted cash flow analysis.
The Group manages exposures to financial and commodity risks using hedging instruments that provide the appropriate economic outcome. The principal hedging instruments used may include commodity future contracts, put and call options, foreign exchange forward contracts and interest rate swaps. The Group does not use derivative financial instruments for speculative purposes.
The Group’s policy is to apply hedge accounting to hedging relationships where it is both permissible under IFRS 9, practical to do so and its application reduces volatility, but transactions that may be effective hedges in economic terms may not always qualify for hedge accounting under IFRS 9. Any derivatives that the Group holds to hedge these exposures are classified as “held for trading” and are shown in a separate line on the face of the statement of financial position. The method of recognizing gains or losses on derivatives depends on whether the derivative is designated as a hedging instrument, and if so, the nature of the item being hedged. Gains and losses on commodity derivatives are classified within “Other operating income, net”. Gains and losses on interest rate and foreign exchange rate derivatives are classified within ‘Financial results, net’. The Group designates certain derivatives as hedges of the foreign currency risk associated with highly probable forecast transactions (cash flow hedge).
The Group documents at the inception of the transaction the relationship between hedging instruments and hedged items, as well as its risk management objectives and strategy for undertaking various hedging transactions. The Group also documents its assessment, both at hedge inception and on an ongoing basis, of whether the instruments that are used in hedging transactions are highly effective in offsetting changes in fair value or cash flows of hedged items.
Cash flow hedge
The effective portion of the gain or loss on the instruments that are designated and qualify as cash flow hedges is recognized in other comprehensive income. The gain or loss relating to the ineffective portion is recognized immediately in the statement of income within "Finance income” or “Finance cost”, cost,”as appropriate.
Adecoagro S.A.
Notes to the Consolidated Financial Statements (Continued)
(All amounts in US$ thousands, except shares and per share data and as otherwise indicated)
33.14 Derivative financial instruments and hedging activities
Amounts accumulated in equity are reclassified to profit or loss in the periods when the hedged item affects profit or loss. The gain or loss relating to the effective portion is recognized in the statement of income within "Finance income” or “Finance cost”, as appropriate.
When a hedging instrument expires or is sold, or when a hedge no longer meets the criteria for hedge accounting, any cumulative gain or loss existing in equity at that time remains in equity and is recognized when the forecast transaction is ultimately recognized in the statement of income. When a forecast transaction is no longer expected to occur, the cumulative gain or loss that was reported in equity is immediately transferred to the statement of income.
Adecoagro S.A.
Notes to the Consolidated Financial Statements (Continued)
(All amounts in US$ thousands, except shares and per share data and as otherwise indicated)
34.1533.15 Trade and other receivables and trade and other payables
Trade receivables are recognized initially at fair value and subsequently measured at amortized cost using the effective interest method. In the case of receivables, less allowance for trade receivables.
The group applies the IFRS 9 simplified approach to measuring expected credit losses which uses a lifetime expected loss allowance for all trade receivables. To measure the expected credit losses, trade receivables have been grouped based on shared credit risk characteristics and the days past due.
34.1633.16 Short-term investment
Financial assets at fair value through profit or loss are valued at the initial recognition and subsequently at fair value and recognizing the variation in the Statement of income in the line Financial results.
33.17 Cash and cash equivalents
Cash and cash equivalents includes cash in hand, deposits held at call with banks and other short-term highly liquid investments with original maturities of three months or less. In the statements of cash flows, interest paid is presented within financing cash flows and interest received is presented within investing activities.
34.1733.18 Borrowings
Borrowings are initially recognized at fair value, net of transaction costs incurred. Borrowings are subsequently measured at amortized cost using the effective interest method. Borrowing costs are capitalized during the period of time that is required to complete and prepare the asset for its intended use.
34.1833.19 Provisions
Provisions are recognized when (i) the Group has a present legal or constructive obligation as a result of past events; (ii) it is probable that an outflow of resources will be required to settle the obligation; and (iii) a reliable estimate of the amount of the obligation can be made. Provisions are measured at the present value of the expenditures expected to be required to settle the obligation using a pre-tax rate that reflects current market assessments of the time value of money and the risks specific to the obligation.
34.1933.20 Onerous contracts
The Group enters into contracts, which require the Group to sell commodities in accordance with the Group's expected sales. These contracts do not qualify as derivatives. These contracts are not recognized until at least one of the parties has performed under the agreement. However, when the contracts are onerous, the Group recognizes the present obligation under the contracts as a provision included within “Provision and other liabilities” in the statement of financial position. Losses under these onerous contracts are recognized within “Other operating income, net” in the statement of income.
Adecoagro S.A.
Notes to the Consolidated Financial Statements (Continued)
(All amounts in US$ thousands, except shares and per share data and as otherwise indicated)
33.21 Current and deferred income tax
The Group’s tax benefit or expense for each year comprises the charge for current tax payable and deferred taxation attributable to the Group’s operating subsidiaries. Tax is recognized in the statement of income, except to the extent that it relates to items recognized directly in equity. In this case, the tax is also recognized in equity.
The current income tax charge is calculated on the basis of the tax laws enacted at the date of the statement of financial position in the countries where the Group’s subsidiaries operate and generate taxable income. Management periodically evaluates positions taken in tax returns with respect to situations in which applicable tax regulation is subject to interpretation.interpretation and considers whether it is probable that a taxation authority will accept an uncertain tax treatment. The Group measures its tax balances either based on the most likely amount or the expected value, depending on which method provides a better prediction of the resolution of the uncertainty. It establishes provisions where appropriate on the basis of amounts expected to be paid to the tax authorities.
Deferred income tax is recognized, using the liability method, on temporary differences arising between the tax bases of assets and liabilities and their carrying amounts in the Consolidated Financial Statements. However, the deferred income tax is not accounted for if it arises from initial recognition of an asset or liability in a transaction other than a business combination that at the time of the transaction affects neither accounting nor taxable profit or loss. Deferred income tax is determined using tax rates (and laws) effective in the countries where the Group’s subsidiaries operate and generate taxable income.
Adecoagro S.A.
Notes to the Consolidated Financial Statements (Continued)
(All amounts in US$ thousands, except shares and per share data and as otherwise indicated)
34.20 Current and deferred income tax (continued)
Deferred income tax assets are recognized only to the extent that it is probable that future taxable profit will be available against which the temporary differences can be utilized.
Deferred income tax is provided on temporary differences arising on investments in subsidiaries, except where the timing of the reversal of the temporary difference is controlled by the Group and it is probable that the temporary difference will not reverse in the foreseeable future.
The Group is able to control the timing of dividends from its subsidiaries and hence does not expect to remit overseas earnings in the foreseeable future in a way that would result in a charge to taxable profit. Hence deferred tax is recognized in respect of the retained earnings of overseas subsidiaries only to the extent that, at the date of the statement of financial position, dividends have been accrued as receivable or a binding agreement to distribute past earnings in future has been entered into by the subsidiary.
34.2133.22 Revenue Recognition
The Group’s primary activities comprise agricultural and agro-industrial activities.
The Group’s agricultural activities comprise growing and selling agricultural produce. In accordance with IAS 41 “Agriculture”, cattle are measured at fair value with changes therein recognized in the statement of income as they arise. Agricultural produce is measured at net realizable value with changes therein recognized in the statement of income as they arise. Therefore, sales of agricultural produce and cattle generally do not generate any separate gains or losses in the statement of income.
The Group’s agro-industrial activities comprise the selling of manufactured products (i.e. industrialized rice, milk-related products, ethanol, sugar, energy, among others). These sales are measured at the fair value of the consideration received or receivable, net of returns and allowances, trade and other discounts, and sales taxes, as applicable.
Revenue is recognized when the full control have been transferred to the buyer, recovery of the consideration is probable, the associated costs and possible return of goods can be estimated reliably, and there is no continuing management involvement with the goods. Transfers of control vary depending on the individual terms of the contract of sale. Revenues are recognised when control of the products has transferred, being when the products are delivered to the customer, having this full discretion over the channel and price to sell the products, and there is no unfulfilled obligation that could affect the customer’s acceptance of the products.
Adecoagro S.A.
Notes to the Consolidated Financial Statements (Continued)
(All amounts in US$ thousands, except shares and per share data and as otherwise indicated)
33.22 Revenue Recognition (continued)
The Group also provides certain agricultural-related services such as grain warehousing/conditioning and other services, e.g. handling and drying services. Revenue from services is recognized as services are provided.
The Group leases owned farmland property to third parties under operating lease agreements. Rental income is recognized on a straight-line basis over the period of the lease.
The Group is a party to a 15-year25-year power agreement for the sale of electricity which expires in 2042. The delivery period starts in April and ends in November of each year. The Group is also a party to 2two 15-year power agreements which delivery period starts in March and ends in December of each year, these 2two agreements will expire in 2024 and 2025, respectively. Prices under all the agreements are adjusted annually for inflation. Revenue related to the sale of electricity under these 2two agreements is recorded based upon output delivered.
Adecoagro S.A.
Notes to the Consolidated Financial Statements (Continued)
(All amounts in US$ thousands, except shares and per share data and as otherwise indicated)
34.2233.23 Farmlands sales
The Group’s strategy is to profit from land appreciation value generated through the transformation of its productive capabilities. Therefore, the Group may seek to realize value from the sale of farmland assets and businesses.
Farmland sales are not recognized until (i) the sale is completed, (ii) the Group has determined that it is probable the buyer will pay, (iii) the amount of revenue can be measured reliably, and (iv) the Group has transferred to the buyer the risk of ownership, and does not have a continuing involvement. Gains from “farmland sales” are included in the statement of income under the line item “Other operating income, net”.
34.2333.24 Assets held for sale and discontinued operations
When the Group intends to dispose of, or classify as held for sale, a business component that represents a separate major line of business or geographical area of operations, or a subsidiary acquired exclusively with a view to resale, it classifies such operations as discontinued. The post tax profit or loss of the discontinued operations is shown as a single amount on the face of the statement of income, separate from the other results of the Group. Assets and liabilities classified as held for sale are measured at the lower of carrying value and fair value less costs to sell.
Non-current assets and disposal groups are classified as held for sale if their carrying amount will be recovered through a disposal rather than through continuing use. This condition is regarded as met only when management is committed to the sale (disposal), the sale (disposal) is highly probable and expected to be completed within one year from classification and the asset is available for immediate sale (disposal) in its present condition. The statements of income for the comparative periods are represented to show the discontinued operations separate from the continuing operations.
34.2433.25 Earnings per share
Basic earnings per share is calculated by dividing the net income for the year attributable to equity holders of the parent by the weighted average number of ordinary shares outstanding during the year. Diluted net earnings per share is computed by dividing the net income for the period by the weighted average number of ordinary shares outstanding, and when dilutive, adjusted for the effect of all potentially dilutive shares, including share options, on an as-if converted basis.
34.2533.26 Equity-settled share-based payments
The Group issues equity settled share-based payments to certain directors, senior management and employees. Options under the awards were measured at fair value at the date of grant. An expense is recognized to spread the fair value of each award over the vesting period on a straight-line basis, after allowing for an estimate of the awards that will eventually vest. The estimate of the level of vesting is reviewed at least annually, with any impact on the cumulative charge being recognized immediately.
Adecoagro S.A.
Notes to the Consolidated Financial Statements (Continued)
(All amounts in US$ thousands, except shares and per share data and as otherwise indicated)
33.27 Research and development
Research phase expenditure is expensed as incurred. Development expenditure is capitalized as an internally generated intangible asset only if it meets strict criteria, relating in particular to technical feasibility and generation of future economic benefits. Research expenses have been immaterial to date. The Group has not capitalized any development expenses to date.
Adecoagro S.A.
Notes to the Consolidated Financial Statements (Continued)
(All amounts in US$ thousands, except shares and per share data and as otherwise indicated)
35. Information related to COVID-19 pandemic
In December 2019, a novel strain of coronavirus (“COVID-19”) was reported to have surfaced in China and started spreading to the rest of the world in early 2020. The COVID-19 virus is impacting economic activity worldwide and poses the risk that Adecoagro or its employees, contractors, suppliers, customers and other business partners may be prevented from conducting certain business activities for an indefinite period of time, including due to shutdowns mandated by governmental authorities or otherwise adopted by companies as a preventive measure. Given the uncertainty around the extent and timing of the future spread of COVID-19 and the imposition or relaxation of protective measures, it is not possible to predict the COVID-19’s effects on the industry, generally, and to reasonably estimate the financial effect on the Company.34. Subsequents events
In Brazil,April 2024, the government createdCompany sold “La Pecuaria” farm, a crisis committee to monitor the impact3,177 hectares farm located in Uruguay for an aggregate amount of COVID-19US$ 20.7 million, collected in March 2020. Since then, it has announced several measures (tax and others) to address the effectsfull at closing. This transaction will result in a pre-tax gain of COVID-19. In this regard, the Brazilian health authorities, as well as several state and municipal authorities have adopted or recommended social distancing measures.
In Argentina, on March 20, 2020 the Argentine government implemented a social, preventive and mandatory isolation regime, prohibiting the circulation of people on routes, roads and public spaces (the “Mandatory Isolation Regime”) which has already been partially reverted as of the day of this report.
As of the date of this report, the activities pursued by our Argentine subsidiaries, related to agricultural production, distribution and commercialization, were exempted from the Mandatory Isolation Regime for being considered “essential” activities. Also our activities in Brazil have no restrictions
In order to guarantee the hygiene and safety conditions established by the Ministry of Health and to preserve the health of the employees in our subsidiaries, Adecoagro has enacted Prevention and Action Protocols tailored for each facility, in addition to constituting Crisis Committees. Measures taken include but are not limited to: (i) daily temperature check upon arrival to the facility, (ii) mandatory distancingUS$ 5.7 million included in the workplace, (iii) maximum limit of people in the lunch room and vehicles (iv) sanitary barriers, (iv) special protective attire. Additionally, remote work has been guaranteed for the duration of the Mandatory Isolation Regime for employees based in central offices, and a rotation scheme has been implemented for administrative employees based in the farms or industrial facilities.
Most of our businesses areline item “Other operating without any major disruption both at the farm and industry level as well as on the road and at the ports. However, the demand of our products, mainly ethanol in Brazil, has been reduced as a consequence of the lockdown decided by the authorities in connection with the pandemic. Nevertheless, we are optimizing our production mix, in order to mitigate such reduction in demand.
The Company is closely monitoring the situation and taking all necessary measures at its disposal to preserve human life and its operation.income”.