Not applicable.
Not applicable
Not applicable
Not applicable
Not applicable
The following selected financial data of Intellipharmaceutics has been derived from the audited consolidated financial statements of the Company as at and for the years ended November 30, 2017, 2016, 2015, 2014, 2013, and 2012.2013. As a result of the IPC Arrangement Transaction (as defined and described in Item 4.A below) completed on October 22, 2009, we selected a November 30 year end. The comparative number of shares issued and outstanding, basic and diluted loss per share have been amended to give effect to this arrangement transaction. These statements were prepared in accordance with accounting principles generally accepted in the United States of America (“U.S. GAAP”). All dollar amounts in this annual report are expressed in United States dollars (“U.S. dollars”), unless otherwise indicated.
(in thousands of U.S. dollars, except for per share data)
As at and for the year ended November 30, 2016 | As at and for the year ended November 30, 2015 | As at and for the year ended November 30, 2014 | As at and for the year ended November 30, 2013 | As at and for the year ended November 30, 2012 | As at and for the year ended November 30, 2017 | As at and for the year ended November 30, 2016 | As at and for the year ended November 30, 2015 | As at and for the year ended November 30, 2014 | As at and for the year ended November 30, 2013 | |
$ | $ | $ | $ | $ | ||||||
| Revenue | 2,247 | 4,094 | 8,770 | 1,527 | 107 | 5,504 | 2,247 | 4,094 | 8,770 | 1,527 |
| Loss for the period | (10,144) | (7,436) | (3,856) | (11,495) | (6,137) | |||||
| Loss for the year | (8,857) | (10,144) | (7,436) | (3,856) | (11,495) | |||||
| Total assets | 7,974 | 5,224 | 7,875 | 4,380 | 2,475 | 7,397 | 7,974 | 5,224 | 7,875 | 4,380 |
| Total liabilities | 6,858 | 5,362 | 2,966 | 10,335 | 4,243 | 7,010 | 6,858 | 5,362 | 2,966 | 10,335 |
| Net assets | 1,116 | (138) | 4,909 | (5,955) | (1,768) | 386 | 1,116 | (138) | 4,909 | (5,955) |
| Capital stock | 29,831 | 21,481 | 18,941 | 11,721 | 6,129 | 35,290 | 29,831 | 21,481 | 18,941 | 11,721 |
| Loss per share - basic and diluted | (0.38) | (0.31) | (0.17) | (0.58) | (0.36) | (0.29) | (0.38) | (0.31) | (0.17) | (0.58) |
| Dividends | Nil | Nil | Nil | Nil | Nil | |||||
| Weighted average common shares | 26,700 | 23,768 | 23,051 | 19,671 | 17,259 | 31,014 | 26,700 | 23,768 | 23,051 | 19,671 |
The following table sets forth the average exchange rate for one Canadian dollar expressed in terms of one U.S. dollar for the fiscal years 2012, 2013, 2014, 2015, 2016 and 2016.2017. The average rate is calculated using the average of the exchange rates on the last day of each month during the period.
AVERAGE | AVERAGE | |
| 2012 | 0.9977 | |
| 2013 | 1.0241 | 1.0241 |
| 2014 | 0.9115 | 0.9115 |
| 2015 | 0.7934 | 0.7934 |
| 2016 | 0.7532 | 0.7532 |
| 2017 | 0.7598 |
The following table sets forth the high and low exchange rates for each month during the previous six months.
LOW | HIGH | |
| August 2016 | 0.7587 | 0.7828 |
| September 2016 | 0.7548 | 0.7786 |
| October 2016 | 0.7461 | 0.7631 |
| November 2016 | 0.7363 | 0.7498 |
| December 2016 | 0.7377 | 0.7622 |
| January 2017 | 0.7442 | 0.7675 |
| February 2017 (through February 27, 2017) | 0.7680 | 0.7595 |
LOW | HIGH | |
| August 2017 | 0.7840 | 0.8012 |
| September 2017 | 0.8013 | 0.8245 |
| October 2017 | 0.7756 | 0.8018 |
| November 2017 | 0.7759 | 0.7885 |
| December 2017 | 0.7760 | 0.7971 |
| January 2018 | 0.7978 | 0.8135 |
| February 2018 (through February 27, 2018) | 0.7849 | 0.8138 |
The exchange rates are based upon the noon buying rate as quoted by The Bank of Canada. At February 27, 2017,2018, the exchange rate for one Canadian dollar expressed in terms of one U.S. dollar, as quoted by The Bank of Canada at 4 p.m. Eastern Time, equaled $0.7597.$0.7849.
Not applicable.
Not applicable.
Prospects for companies in the pharmaceutical industry generally may be regarded as uncertain given the research and development nature of the industry and uncertainty regarding the prospects of successfully commercializing product candidates and, accordingly, investments in companies such as ours should be regarded as very speculative. An investor should carefully consider the risks and uncertainties described below, as well as other information contained in this annual report. The list of risks and uncertainties described below is not an exhaustive list. Additional risks and uncertainties not presently known to us or that we believe to be immaterial may also adversely affect our business. If any one or more of the following risks occur, our business, financial condition and results of operations could be seriously harmed. Further, if we fail to meet the expectations of the public market in any given period, the market price of our common shares could decline. If any of the following risks actually occurs, our business, operating results, or financial condition could be materially adversely affected.
Our activities entail significant risks. In addition to the usual risks associated with a business, the following is a general description of certain significant risk factors which may be applicable to us.
Risks related to our Company
Our business is capital intensive and requires significant investment to conduct research and development, clinical and regulatory activities necessary to bring our products to market, which capital may not be available in amounts or on terms acceptable to us, if at all.all.
Our business requires substantial capital investment in order to conduct the research and development,R&D, clinical and regulatory activities necessary and to defend against patent litigation claims in order to bring our products to market and to establish commercial manufacturing, marketing and sales capabilities. As more fully discussed under “Item 5. Operating and Financial Review and Prospects - B. “Liquidity and Capital Resources,” as of November 30, 2016,2017, we had a cash balance of $4.1$1.9 million. As of February 27, 2017,15, 2018 (the date of filing of the Company’s Management Discussion and Analysis of Financial Condition and Results of Operations and Audited Annual Financial Statements for the year ended November 30, 2017), our cash balance was $2.7$0.6 million. We currently expect to satisfy our operating cash requirements until June 20172018 from cash on hand. However, wehand and quarterly profit share payments from Par Pharmaceutical, Inc., or Par, and Mallinckrodt LLC, or Mallinckrodt. We may need to obtain additional funding prior to that time as we pursuefurther the development of our product candidates and if we accelerate our product commercialization activities. If necessary, we expect to utilize our at-the-market offering program to bridge any funding shortfall in the first and second quarters of 2017. In the second half of fiscal 2017, we expect revenues to improve as we prepare for the launch of our tentatively approved generic Seroquel XR® (quetiapine fumarate extended release tablet) on the expiry of the first filer exclusivity periods of Par Pharmaceutical, Inc. (“Par”) and Accord Healthcare (“Accord”) in May 2017, although there can be no assurance as to when or if any launch will occur, or if generic Seroquel XR® will be successfully commercialized. Our future operations are highly dependent upon our ability to raise additional capital to support advancing our product pipeline through continued research and development activities which are at higher-than-currently projected levels and to fund any significant expansion of our operations. Although there can be no assurances, such capital may come from revenues from the sales of our generic Focalin XR® capsules, from proceeds of our at-the-market offering program (see “Share Capital – Prior Sales”, in Item 10, below for a further description of our at-the-market offering program), from potential revenues from the sales of our tentatively approved generic Seroquel XR® and from potential partnering opportunities. Other potential sources of capital may include payments from licensing agreements, cost savings associated with managing operating expense levels, other equity and/or debt financings, and/or new strategic partnership agreements which fund some or all costs of product development. If necessary, and conditions permit, we may utilize the equity markets to bridge any funding shortfall and to provide capital to continue to advance our most promising product candidates. Our future operations are highly dependent upon our ability to source additional capital to support advancing our product pipeline through continued R&D activities and to fund any significant expansion of our operations. Our ultimate success will depend on whether our product candidates receive the approval of the FDA or Health Canada and whether we are able to successfully market approved products. We cannot be certain that we will be able to receive FDA or Health Canada approval for any of our current or future product candidates, that we will reach the level of sales and revenues necessary to achieve and sustain profitability, or that we can secure other capital sources on terms or in amounts sufficient to meet our needs or at all. Our cash requirements for R&D during any period depend on the number and extent of the R&D activities we focus on. At present, we are working principally on our Oxycodone ER 505(b)(2), and selected generic, product candidate development projects. Our development of Oxycodone ER will require significant expenditures, including costs to defend against the Purdue litigation. For our RegabatinTM XR 505(b)(2) product candidate, Phase III clinical trials can be capital intensive, and will only be undertaken consistent with the availability of funds and a prudent cash management strategy. We anticipate some investment in fixed assets and equipment over the next several months, the extent of which will depend on cash availability.
The availability of equity or debt financing will be affected by, among other things, the results of our research and development,R&D, our ability to obtain regulatory approvals, our success in commercializing approved products with our commercializationcommercial partners and the market acceptance of our products, the state of the capital markets generally, strategic alliance agreements, and other relevant commercial considerations. In addition, if we raise additional funds by issuing equity securities, our then existing security holders will likely experience dilution, and the incurring of indebtedness would result in increased debt service obligations and could require us to agree to operating and financial covenants that would restrict our operations. In the event that we do not obtain sufficient additional capital, it will raise substantial doubt about our ability to continue as a going concern and realize our assets and pay our liabilities as they become due. Our cash outflows are expected to consist primarily of internal and external researchR&D, legal and developmentconsulting expenditures to advance our product pipeline.pipeline and selling, general and administrative expenses to support our commercialization efforts. Depending upon the results of our research and developmentR&D programs, the Purdue litigation (as defined below) and the availability of financial resources, we could decide to accelerate, terminate, or reduce certain projects, or commence new ones. Any failure on our part to successfully commercialize approved products or raise additional funds on terms favorable to us or at all, may require us to significantly change or curtail our current or planned operations in order to conserve cash until such time, if ever, that sufficient proceeds from operations are generated, and could result in ourus not taking advantage of business opportunities, in the termination or delay of clinical trials or ourus not taking any necessary actions required by the FDA or Health Canada for one or more of our product candidates, in curtailment of our product development programs designed to identify new product candidates, in the sale or assignment of rights to our technologies, products or product candidates, and/or our inability to file ANDAs, Abbreviated New Drug Submissions (“ANDSs”), or NDAs, at all or in time to competitively market our products or product candidates.
Delays, suspensions and terminations in our preclinical studies and clinical trials could result in increased costs to us and delay our ability to generate product revenues.
The commencement of clinical trials can be delayed for a variety of reasons, including delays in:
●
demonstrating sufficient safety and efficacy to obtain regulatory approval to commence a clinical trial;
●
reaching agreement on acceptable terms with prospective contract research organizations and clinical trial sites;
●
manufacturing sufficient quantities of a drug candidate;
●
obtaining institutional review board approval to conduct a clinical trial at a prospective clinical trial site;
●
patient enrollment; and
●
for controlled substances, obtaining specific permission to conduct a study, and obtaining import and export permits to ship study samples.
Once a clinical trial has begun, it may be delayed, suspended or terminated due to a number of factors, including:
●
the number of patients that participate in the trial;
●
the length of time required to enroll suitable subjects;
●
the duration of patient follow-up;
●
the number of clinical sites included in the trial;
●
changes in regulatory requirements or regulatory delays or clinical holds requiring suspension or termination of the trials;
●
delays, suspensions or termination of clinical trials due to the institutional review board overseeing the study at a particular site;
●
failure to conduct clinical trials in accordance with regulatory requirements;
●
unforeseen safety issues, including serious adverse events or side effects experienced by participants; and
●
inability to manufacture, through third party manufacturers, adequate supplies of the product candidate being tested.
Based on results at any stage of product development, we may decide to repeat or redesign preclinical studies or clinical trials, conduct entirely new studies or discontinue development of products for one or all indications. In addition, our product candidates may not demonstrate sufficient safety and efficacy in pending or any future preclinical testing or clinical trials to obtain the requisite regulatory approvals. Even if such approvals are obtained for our products, they may not be accepted in the market as a viable alternative to other products already approved or pending approvals.
If we experience delays, suspensions or terminations in a preclinical study or clinical trial, the commercial prospects for our products will be harmed, and our ability to generate product revenues will be delayed or we may never be able to generate such revenues.
We have a history of operating losses, which may continue in the foreseeable future.
We have incurred net losses from inception through November 30, 20162017 and had an accumulated deficit of $63,016,019$71,873,459 as of such date, and have incurred additional losses since such date. As we engage in the development of products in our pipeline, we willmay continue to incur further losses. Therelosses.There can be no assurance that we will ever be able to achieve or sustain profitability or positive cash flow. Our ultimate success will depend on whetherhow many of our product candidates receive the approval of the FDA or Health Canada and whether we are able to successfully market approved products. We cannot be certain that we will be able to receive FDA or Health Canada approval for any of our current or future product candidates, or that we will reach the level of sales and revenues necessary to achieve and sustain profitability.
Loss of key scientists and failure to attract qualified personnel could limit our growth and negatively impact our operations.
We are dependent upon the scientific expertise of Dr. Isa Odidi, our Chairman and Chief Executive Officer, and Dr. Amina Odidi, our President and Chief Operating Officer. Although we employ other qualified scientists, Drs. Isa and Amina Odidi are our only employees with the knowledge and experience necessary for us to continue development of controlled-release products. We do not maintain key-person life insurance on any of our officers or
employees. Although we have employment agreements with key members of our management team, each of our employees may terminate his or her employment at any time. The success of our business depends, in large part, on our continued ability to attract and retain highly qualified management, scientific, manufacturing and sales and marketing personnel, on our ability to successfully integrate many new employees, and on our ability to develop and maintain important relationships with leading research and medical institutions and key distributors. If we lose the services of our executive officers or other qualified personnel or are unable to attract and retain qualified individuals to fill these roles or develop key relationships, our business, financial condition and results of operations could be materially adversely affected.
Our intellectual property may not provide meaningful protection for our products and product candidates.
We hold certain U.S., Canadian and foreign patents and have pending applications for additional patents outstanding. We intend to continue to seek patent protection for, or maintain as trade secrets, all of our commercially promising drug delivery platforms and technologies. Our success depends, in part, on our and our collaborative partners’ ability to obtain and maintain patent protection for products and product candidates, maintain trade secret protection and operate without infringing the proprietary rights of third parties. Without patent and other similar protection, other companies could offer substantially identical products without incurring sizeable development costs which could diminish our ability to recover expenses of and realize profits on our developed products. If our pending patent applications are not approved, or if we are unable to obtain patents for additional developed technologies, the future protection for our technologies will remain uncertain. Furthermore, third parties may independently develop similar or alternative technologies, duplicate some or all of our technologies, design around our patented technologies or challenge our issued patents. Such third parties may have filed patent applications, or hold issued patents, relating to products or processes competitive with those we are developing or otherwise restricting our ability to do business in a particular area. If we are unable to obtain patents or otherwise protect our trade secrets or other intellectual property and operate without infringing on the proprietary rights of others, our business, financial condition and results of operations could be materially adversely affected.
We may be subject to intellectual property claims that could be costly and could disrupt our business.
Third parties may claim we have infringed their patents, trademarks, copyrights or other rights. We may be unsuccessful in defending against such claims, which could result in the inability to protect our intellectual property rights or liability in the form of substantial damages, fines or other penalties such as injunctions precluding our manufacture, importation or sales of products. The resolution of a claim could also require us to change how we do business or enter into burdensome royalty or license agreements. Insurance coverage may be denied or may not be adequate to cover every claim that third parties could assert against us. Even unsuccessful claims could result in significant legal fees and other expenses, diversion of management’s time and disruptions in our business. Any of these claims could also harm our reputation.
We are a defendant in purported securities class-action litigation matter and are at risk of additional similar litigation in the future that could divert management’s attention and adversely affect our business and could subject us to significant liabilities.
We are a defendant in a purported securities class action litigation matter as described under Item 8.A below. The defense of such litigation matters may increase our expenses and divert our management’s attention and resources and any unfavorable outcome could have a material adverse effect on our business and results of operations. Any adverse determination in such litigation matters, or any amounts paid to settle such litigation matters could require that we make significant payments. In addition, we may in the future be the target of other securities class actions or similar litigation. See Item 8.A below.
We rely on maintaining as trade secrets our competitively sensitive know-how and other information. Intentional or unintentional disclosure of this information could impair our competitive position.
As to many technical aspects of our business, we have concluded that competitively sensitive information is either not patentable or that for competitive reasons it is not commercially advantageous to seek patent protection. In these circumstances, we seek to protect this know-how and other proprietary information by maintaining it in confidence as a trade secret. To maintain the confidentiality of our trade secrets, we generally enter into agreements that contain confidentiality provisions with our employees, consultants, collaborators, contract manufacturers and advisors upon commencement of their relationships with us. These provisions generally require that all confidential information developed by the individual or made known to the individual by us during the course of the individual’s relationship with us be kept confidential and not disclosed to third parties. We may not have these arrangements in place in all circumstances, and the confidentiality provisions in our favour may be breached. We may not become aware of, or have adequate remedies in the event of, any such breach. In addition, in some situations, the confidentiality provisions in our favour may conflict with, or be subject to, the rights of third parties with whom our employees, consultants, collaborators, contract manufacturers or advisors have previous employment or consulting relationships. To the extent that our employees, consultants, collaborators, contract manufacturers or advisors use trade secrets or know-how owned by others in their work for us, disputes may arise as to the ownership of relative inventions. Also, others may independently develop substantially equivalent trade secrets, processes and know-how, and competitors may be able to use this information to develop products that compete with our products, which
could adversely impact our business. The disclosure of our trade secrets could impair our competitive position. Adequate remedies may not exist in the event of unauthorized use or disclosure of our confidential information.
Approvals for our product candidates may be delayed or become more difficult to obtain if the FDA institutes changes to its approval requirements.
The FDA may institute changes to its ANDA approval requirements, which may make it more difficult or expensive for us to obtain approval for our new generic products. For instance, in July 2012, the Generic Drug Fee User Amendments of 2012 (“GDUFA”) waswere enacted into law. The GDUFA legislation implemented substantial fees for new ANDAs, Drug Master Files, product and establishment fees and a one-time fee for back-logged ANDAs pending approval as of October 1, 2012. In return, the program is intended to provide faster and more predictable ANDA reviews by the FDA and more timely inspections of drug facilities. For the FDA’s fiscal years 2016 and 2017, respectively, the user fee rates are $76,030 and $70,480 for new ANDAs, $38,020 and $35,240 for “Prior Approval Supplements,” and $17,434 for each ANDA already on file at the FDA. For the FDA’s fiscal year 2016 and 2017, there is also an annual facility user fee of $258,905 and $273,646, respectively. Effective October 1, 2017, for the FDA’s fiscal year 2018, the FDA will charge an annual facility user fee of $226,087 plus a new general program fee of $159,079. Under GDUFA, generic product companies face significant penalties for failure to pay the new user fees, including rendering an ANDA not “substantially complete” until the fee is paid. It is currently uncertain the effect the new fees will have on our ANDA process and business. However, any failure by us or our suppliers to pay the fees or to comply with the other provisions of GDUFA may adversely impact or delay our ability to file ANDAs, obtain approvals for new generic products, generate revenues and thus may have a material adverse effect on our business, results of operations and financial condition.
Recent and future legal developments could make it more difficult and costly for us to obtain regulatory approvals for our product candidates and negatively affect the prices we may charge.
In the United States and elsewhere, recent and proposed legal and regulatory changes to healthcare systems could prevent or delay our receipt of regulatory approval for our product candidates, restrict or regulate our post-approval marketing activities, and adversely affect our ability to profitably sell our products. We do not know whether additional legislative changes will be enacted, or whether the FDA’s regulations, guidance or interpretations will be changed, or what impact any such changes will have, if any, on our ability to obtain regulatory approvals for our product candidates. Further, the U.S. Centers for Medicare and Medicaid Services, or CMS, frequently changes product descriptors, coverage policies, product and service codes, payment methodologies and reimbursement values. Also, increased scrutiny by the U.S. Congress of the FDA’s approval process could significantly delay or prevent our receipt of regulatory approval for our product candidates and subject us to more stringent product labeling and post-marketing testing and other requirements.
In addition, the current U.S. White House administration has expressed concerns regarding existing trade agreements, such as North American Free Trade Agreement (NAFTA), and raised the possibility of imposing significant increases on tariffs on goods imported into the United States, which could adversely impact our sale of products into the United States.
We operate in a highly litigious environment.
From time to time, we are subjectmay be exposed to claims and legal proceedings.actions in the normal course of business. As of the date of this annual report, we are not aware of any pending or threatened material litigation claims against us other than as described below and under Item 8.A below. Litigation to which we are, or may be, subject could relate to, among other things, our patent and other intellectual property rights or such rights of others, business or licensing arrangements with other persons, product liability or financing activities. Such litigation could include an injunction against the manufacture or sale of one or more of our products or potential products or a significant monetary judgment, including a possible punitive damages award, or a judgment that certain of our patent or other intellectual property rights are invalid or unenforceable or infringe the intellectual property rights of others. If such litigation is commenced, our business, results of operations, financial condition and cash flows could be materially adversely affected.
There has been substantial litigation in the pharmaceutical industry concerning the manufacture, use and sale of new products that are the subject of conflicting patent rights. When we file an ANDA or 505(b)(2) NDA for a bioequivalent version of a drug, we may, in some circumstances, be required to certify to the FDA that any patent which has been listed with the FDA as covering the branded product has expired, the date any such patent will expire, or that any such patent is invalid or will not be infringed by the manufacture, sale or use of the new drug for which the application is submitted. Approval of an ANDA is not effective until each listed patent expires, unless the applicant certifies that the patents at issue are not infringed or are invalid and so notifies the patent holder and the holder of the branded product. A patent holder may challenge a notice of non-infringement or invalidity by suing for patent infringement within 45 days of receiving notice. Such a challenge prevents FDA approval for a period which ends 30 months after the receipt of notice, or sooner if an appropriate court rules that the patent is invalid or not infringed. From time to time, in the ordinary course of business, we face and have faced such challenges and may continue to do so in the future.
Brand-name pharmaceutical manufacturers routinely bring patent infringement litigation against ANDA applicants seeking FDA approval to manufacture and market generic forms of their branded products. We are routinely subject to patent litigation that can delay or prevent our commercialization of products, force us to incur substantial expense to defend, and expose us to substantial liability.
In July 2017, three complaints were filed in the U.S. District Court for the Southern District of New York asserting claims under the federal securities laws against us and two of our executive officers on behalf of a putative class of purchasers of our securities (the “S.D.N.Y. Action”). In a subsequent order, the Court consolidated the three actions under the caption Shanawaz v. Intellipharmaceutics Int’l Inc., et al., No. 1:17-cv-05761 (S.D.N.Y.), appointed lead plaintiffs in the consolidated action, and approved lead plaintiffs’ selection of counsel. Lead plaintiffs filed a consolidated amended complaint on January 29, 2018. In the amended complaint, lead plaintiffs purport to assert claims on behalf of a putative class consisting of purchasers of our securities between May 21, 2015 and July 26, 2017. The amended complaint alleges that the defendants violated Sections 10(b) and 20(a) of the Securities Exchange Act of 1934, as amended (“U.S. Exchange Act”) and Rule 10b-5 promulgated thereunder by making allegedly false and misleading statements or failing to disclose certain information regarding our NDA for Oxycodone ER abuse-deterrent oxycodone hydrochloride extended release tablets. The complaint seeks, among other remedies, unspecified damages, attorneys’ fees and other costs, equitable and/or injunctive relief, and such other relief as the court may find just and proper. Under a scheduling order approved by the Court, the defendants must respond to the amended complaint by March 30, 2018. We intend to vigorously defend our company against the claims asserted in the consolidated action.
We cannot ensure the availability of raw materials.
Certain raw materials necessary for the development and subsequent commercial manufacture of our product candidates may be proprietary products of other companies. While we attempt to manage the risk associated with such proprietary raw materials, if our efforts fail, or if there is a material shortage, contamination, and/or recall of such materials, the resulting scarcity could adversely affect our ability to develop or manufacture our product candidates. In addition, many third party suppliers are subject to governmental regulation and, accordingly, we are dependent on the regulatory compliance of, as well as on the strength, enforceability and terms of our various contracts with, these third party suppliers.
Further, the FDA requires identification of raw material suppliers in applications for approval of drug products. If raw materials are unavailable from a specified supplier, the supplier does not give us access to its technical information for our application or the supplier is not in compliance with FDA or other applicable requirements, FDA approval of the supplier could delay the manufacture of the drug involved. Any inability to obtain raw materials on a timely basis, or any significant price increases which cannot be passed on to customers, could have a material adverse effect on our business, results of operations, financial condition and cash flows.
Our product candidates may not be successfully developed or commercialized.
Successful development of our product candidates is highly uncertain and is dependent on numerous factors, many of which are beyond our control. Products that appear promising in research or early phases of development may fail to reach later stages of development or the market for several reasons including:
●
for ANDA candidates, bioequivalence studies results may not meet regulatory requirements or guidelines for the demonstration of bioequivalence;
●
for NDA candidates, a product may not demonstrate acceptable large-scale clinical trial results, even though it demonstrated positive preclinical or initial clinical trial results;
●
for NDA candidates, a product may not be effective in treating a specified condition or illness;
●
a product may have harmful side effects on humans;
●
products may fail to receive the necessary regulatory approvals from the FDA or other regulatory bodies, or there may be delays in receiving such approvals;
●
changes in the approval process of the FDA or other regulatory bodies during the development period or changes in regulatory review for each submitted product application may also cause delays in the approval or result in rejection of an application;
●
difficulties may be encountered in formulating products, scaling up manufacturing processes or in getting approval for manufacturing;
●
difficulties may be encountered in the manufacture and/or packaging of our products;
●
once manufactured, our products may not meet prescribed quality assurance and stability tests;
●
manufacturing costs, pricing or reimbursement issues, other competitive therapeutics, or other commercial factors may make the product uneconomical; and
●
the proprietary rights of others, and their competing products and technologies, may prevent the product from being developed or commercialized.
Further, success in preclinical and early clinical trials does not ensure that large-scale clinical trials will be successful, nor does success in preliminary studies for ANDA candidates ensure that bioequivalence studies will be successful. Results are frequently susceptible to varying interpretations that may delay, limit or prevent regulatory approvals. The length of time necessary to complete bioequivalence studies or clinical trials and to submit an
application for marketing approval for a final decision by a regulatory authority varies significantly and may be difficult to predict.
As a result, there can be no assurance that any of our product candidates currently in development will ever be successfully commercialized.commercialized.
Near-term revenue depends significantly on the success of our first filed ANDA (“lead”)commercialized product, our once daily generic Focalin XR®XR® (dexmethylphenidate hydrochloride extended-release), and our second commercialized product, generic Seroquel XR® (quetiapine fumarate extended release).
We have invested significant time and effort in the development of our leadfirst ANDA product, our once daily generic Focalin XR® (dexmethylphenidate hydrochloride extended-release)XR® capsules, for which we received final approval from the FDA in November 2013 under the Company ANDA (as defined below) to launch the 15 and 30 mg strengths. Commercial sales of these strengths were launched immediately by our commercialization partner in the U.S., Par. Our 5, 10, 20 and 40 mg strengths were also then tentatively FDA approved, subject to the right of Teva Pharmaceuticals USA, Inc. (“Teva”) to 180 days of generic exclusivity from the date of first launch of such products. Teva launched its own 5, 10, 20 and 40 mg strengths of generic Focalin XR®XR® capsules on November 11, 2014, February 2, 2015, June 22, 2015 and November 19, 2013, respectively. In January 2017, Par launched the 25 and 35 mg strengths of its generic Focalin XR®XR® capsules in the U.S., and in May 2017, Par launched the 10 and 20 mg strengths, complementing the 15 and 30 mg strengths of our generic Focalin XR® currentlyXR® marketed by Par. The FDA recently had granted final approval under the Par ANDA (as defined below) for its generic Focalin XR®XR® capsules in the 5, 10, 15, 20, 25, 30, 35 and 40 mg strengths. As the first filer of an ANDA for generic Focalin XR®XR® in the 25 and 35 mg strengths, Par hashad 180 days of U.S. generic marketing exclusivity for those strengths. We believeIn November 2017, Par is preparing to launch alllaunched the remaining 5 and 40 mg strengths of generic Focalin XR®, complementing the 10, 15, 20, 25, 30 and 35 mg strengths previously launched and marketed by Par and providing us with the full line of general Focalin XR® strengths available in the first half of 2017.U.S. market. Under a license and commercialization agreement between us and Par (as amended, the “Par agreement”), we receive calendar quarterly profit-share payments on Par’s U.S. sales of generic Focalin XR®XR®. We expect sales of the 25 and 35 mg strength to improve our revenues significantly in 2017. There can be no assurance as to when or ifwhether any further launches will occur for the remaining strengths or if they will be successfully commercialized. We depend significantly on the actions of our commercializationmarketing partner Par in the prosecution, regulatory approval and commercialization of our generic Focalin XR®XR® capsules and on their timely payment to us of the contracted calendar quarterly payments as they come due.
We have also invested significant time and effort in the development of our second ANDA product, our generic Seroquel XR® tablets in the 50, 150, 200, 300 and 400 mg strengths, and in May 2017 our ANDA received final FDA approval for all of these strengths. Our approved product is a generic equivalent for the corresponding strengths of the branded product Seroquel XR® sold in the U.S. by AstraZeneca. The Company manufactured and shipped commercial quantities of all strengths of generic Seroquel XR® to our marketing and distribution partner Mallinckrodt, and Mallinckrodt launched all strengths in June 2017. In October 2016, we announced a license and commercial supply agreement with Mallinckrodt, granting Mallinckrodt an exclusive license to market, sell and distribute in the U.S. the following extended release drug product candidates (the “licensed products”) which have either been launched (generic Seroquel XR®) or for which we have ANDAs filed with the FDA (the “Mallinckrodt agreement”):
●
Quetiapine fumarate extended-release tablets (generic Seroquel XR®) – Approved by FDA and launched
●
Desvenlafaxine extended-release tablets (generic Pristiq®) – ANDA Under FDA Review
●
Lamotrigine extended-release tablets (generic Lamictal® XR™) – ANDA Under FDA Review
Under the terms of the 10-year agreement, we received a non-refundable upfront payment of $3 million in October 2016. In addition, the agreement also provides for a long-term profit sharing arrangement with respect to these licensed products (which includes up to $11 million in cost recovery payments that are payable on future sales of licensed product). We have agreed to manufacture and supply the licensed products exclusively for Mallinckrodt on a cost plus basis. The Mallinckrodt agreement contains customary terms and conditions for an agreement of this kind, and is subject to early termination in the event we do not obtain FDA approvals of the Mallinckrodt licensed products by specified dates, or pursuant to any one of several termination rights of each party. There can be no assurance whether any strengths of our generic Seroquel XR® will be successfully commercialized. We depend significantly on the actions of our marketing partner Mallinckrodt in the commercialization of our generic Seroquel XR® tablets and on their timely payment to us of the contracted payments as they come due.
Our near term ability to generate significant revenue will depend upon successful commercialization of our products in the U.S., where the branded Focalin XR®XR® product isand the branded Seroquel XR® product are in the market. Although we have several other products in our pipeline, and recently received final approval from the FDA for our generic Keppra XR®XR® (levetiracetam extended-release tablets), and our generic Glucophage® XR, for the 500 and 750 mg strengths and tentativefinal approval from the FDA for allour metformin hydrochloride extend release tablets in the 500 and 750 mg strengths, of our generic Seroquel XR® (quetiapine fumarate extended release) which is partnered with Mallinckrodt LLC (“Mallinckrodt”), the majority of the products in our pipeline are at earlier stages of development. We will be exploring licensing and commercial alternatives for our generic Keppra XR®XR® product strengths that have been recently approved by the FDA. We are also actively evaluating options to realize commercial returns from the new approval of our generic Glucophage®Glucophage® XR.
Our significant expenditures on research and development may not lead to successful product introductions.
We conduct research and development primarily to enable us to manufacture and market pharmaceuticals in accordance with FDA regulations. Typically, research expenses related to the development of innovative compounds and the filing of NDAs are significantly greater than those expenses associated with ANDAs. As we continue to develop new products, our research expenses will likely increase. We are required to obtain FDA approval before marketing our drug products and the approval process is costly and time consuming. Because of the inherent risk associated with research and development efforts in our industry, particularly with respect to new drugs, our research and development expenditures may not result in the successful introduction of FDA approved new pharmaceuticals.
We may not have the ability to develop or license, or otherwise acquire, and introduce new products on a timely basis.
Product development is inherently risky, especially for new drugs for which safety and efficacy have not been established and the market is not yet proven. Likewise, product licensing involves inherent risks including uncertainties due to matters that may affect the achievement of milestones, as well as the possibility of contractual disagreements with regard to terms such as license scope or termination rights. The development and
commercialization process, particularly with regard to new drugs, also requires substantial time, effort and financial resources. The process of obtaining FDA or other regulatory approval to manufacture and market new and generic pharmaceutical products is rigorous, time consuming, costly and largely unpredictable. We, or a partner, may not be successful in obtaining FDA or other required regulatory approval or in commercializing any of the product candidates that we are developing or licensing.
Our business and operations are increasingly dependent on information technology and accordingly we would suffer in the event of computer system failures, cyber-attacks or a deficiency in cyber-security.
Our internal computer systems, and those of a current and/or future drug development or commercialization partner of ours, may be vulnerable to damage from cyber-attacks, computer viruses, malware, natural disasters, terrorism, war, telecommunication and electrical failures. The risk of a security breach or disruption, particularly through cyber-attacks, including by computer hackers, foreign governments, and cyber terrorists, has generally increased as the number, intensity and sophistication of attempted attacks and intrusions have increased. If such an event were to occur and cause interruptions in our operations or those of a drug development or commercialization partner, it could result in a material disruption of our product development programs. For example, the loss of clinical trial data from completed or ongoing or planned clinical trials could result in delays in our regulatory approval efforts and significantly increase our costs to recover or reproduce the data. To the extent that any disruption or security breach was to result in a loss of or damage to our data or applications, or inappropriate disclosure of confidential or proprietary information, we could incur material legal claims and liability, damage to our reputation, and the further development of our drug candidates could be adversely affected.
Our business can be impacted by wholesaler buying patterns, increased generic competition and, to a lesser extent, seasonal fluctuations, which may cause our operating results to fluctuate.
We believe that the revenues derived from our generic Focalin XR®XR® capsules and generic Seroquel XR® tablets are subject to wholesaler buying patterns, increased generic competition negatively impacting price, margins and market share consistent with industry post-exclusivity experience and, to a lesser extent, seasonal fluctuations in relation to generic Focalin XR® capsules (as these products are indicated for conditions including attention deficit hyperactivity disorder which we expect may see increases in prescription rates during the school term and declines in prescription rates during the summer months). Accordingly, these factors may cause our operating results to fluctuate.
We may not achieve our projected development goals in the time frames we announce and expect.
We set goals regarding the expected timing of meeting certain corporate objectives, such as the commencement and completion of clinical trials, anticipated regulatory approval and product launch dates. From time to time, we may make certain public statements regarding these goals. The actual timing of these events can vary dramatically due to, among other things, insufficient funding, delays or failures in our clinical trials or bioequivalence studies, the uncertainties inherent in the regulatory approval process, such as failure to secure appropriate product labeling approvals, requests for additional information, delays in achieving manufacturing or marketing arrangements necessary to commercialize our product candidates and failure by our collaborators, marketing and distribution partners, suppliers and other third parties to fulfill contractual obligations. In addition, the possibility of a patent infringement suit regarding one or more of our product candidates could delay final FDA approval of such candidates. If we fail to achieve one or more of these planned goals, the price of our common shares could decline.
We have limited manufacturing, sales, marketing or distribution capability and we must rely upon third parties for such.
While we have built our own manufacturing facility onsite in Toronto, we depend on third-party manufacturers to supply pharmaceutical ingredients and will be reliant on a third-party manufacturer to produce certain of our products and product candidates. Third-party manufacturers must be able to meet our deadlines, as well as adhere to quality standards and specifications. Our reliance on third parties for the manufacture of pharmaceutical ingredients and finished products creates a dependency that could severely disrupt our research and development, our clinical testing, and ultimately our sales and marketing efforts if the source of such supply proves to be unreliable or unavailable. If our own manufacturing operation or any contracted manufacturing operation is unreliable or unavailable, we may not be able to move forward and our entire business plan could fail. There is no assurance that our own manufacturing operation or any third-party manufacturers will be able to meet commercialized scale production requirements in a timely manner or in accordance with applicable standards or current cGMP.
If our manufacturing facility is unable to manufacture our product(s) or the manufacturing process is interrupted due to failure to comply with regulations or for other reasons, it could have a material adverse impact on our business.
If our manufacturing facility fails to comply with regulatory requirements or encounter other manufacturing difficulties, it could adversely affect our ability to supply products. All facilities and manufacturing processes used for the manufacture of pharmaceutical products are subject to inspection by regulatory agencies at any time and must be operated in conformity with cGMP regulations. Compliance with FDA and Health Canada cGMP requirements applies to both drug products seeking regulatory approval and to approved drug products. In complying with cGMP requirements, pharmaceutical manufacturing facilities must continually expend significant time, money and effort in production, record-keeping and quality assurance and control so that their products meet applicable specifications and other requirements for product safety, efficacy and quality. Failure to comply with applicable legal requirements subjects our manufacturing facility to possible legal or regulatory action, including shutdown, which may adversely affect our ability to manufacture product. Were we not able to manufacture products at our manufacturing facility because of regulatory, business or any other reasons, the manufacture and marketing of these products would be interrupted. This could have a material adverse impact on our business, results of operations, financial condition, cash flows and competitive position.
The use of legal and regulatory strategies by competitors with innovator products, including the filing of citizen petitions, may delay or prevent the introduction or approval of our product candidates, increase our costs associated with the introduction or marketing of our products, or significantly reduce the profit potential of our product candidates.
Companies with innovator drugs often pursue strategies that may serve to prevent or delay competition from alternatives to their innovator products. These strategies include, but are not limited to:
●
filing “citizen petitions” with the FDA that may delay competition by causing delays of our product approvals;
●
seeking to establish regulatory and legal obstacles that would make it more difficult to demonstrate a product’s bioequivalence or “sameness” to the related innovator product;
●
filing suits for patent infringement that automatically delay FDA approval of products seeking approval based on the Section 505(b)(2) pathway;
●
obtaining extensions of market exclusivity by conducting clinical trials of innovator drugs in pediatric populations or by other methods;
●
persuading the FDA to withdraw the approval of innovator drugs for which the patents are about to expire, thus allowing the innovator company to develop and launch new patented products serving as substitutes for the withdrawn products;
●
seeking to obtain new patents on drugs for which patent protection is about to expire; and
●
initiating legislative and administrative efforts in various states to limit the substitution of innovator products by pharmacies.
These strategies could delay, reduce or eliminate our entry into the market and our ability to generate revenues from our products and product candidates.
Our products may not achieve expected levels of market acceptance, thereby limiting our potential to generate revenue.
Even if we are able to obtain regulatory approvals for our product candidates, the success of any of our products will be dependent upon market acceptance. Levels of market acceptance for any products marketed by us could be affected by several factors, including:
●
the availability of alternative products from competitors;
●
the prices of our products relative to those of our competitors;
●
the number of competitive product entries, and the nature and extent of any aggressive pricing and rebate activities that may follow;
●
the timing of our market entry;
●
the ability to market our products effectively at the retail level; and
●
the acceptance of our products by government and private formularies.
Some of these factors are not within our control, and our proposed products may not achieve levels of market acceptance anticipated by us. Additionally, continuing and increasingly sophisticated studies of the proper utilization, safety and efficacy of pharmaceutical products are being conducted by the industry, government agencies and others which can call into question the utilization, safety and efficacy of our products and any product candidates we are currently developing or may develop in the future. These studies could also impact a future product after it has been marketed. In some cases, studies have resulted, and may in the future result, in the discontinuance of product marketing or requirement of other risk management programs such as the need for a patient registry. The failure of our products and any of our product candidates, once approved, to achieve market acceptance would limit our ability to generate revenue and would adversely affect our results of operations.
The risks and uncertainties inherent in conducting clinical trials could delay or prevent the development and commercialization of our own branded products, which could have a material adverse effect on our results of operations, liquidity, financial condition, and growth prospects.
There are a number of risks and uncertainties associated with clinical trials, which may be exacerbated by our relatively limited experience in conducting and supervising clinical trials and preparing NDAs. The results of initial clinical trials may not be indicative of results that would be obtained from large scale testing. Clinical trials are often conducted with patients having advanced stages of disease and, as a result, during the course of treatment these patients can die or suffer adverse medical effects for reasons that may not be related to the pharmaceutical agents being tested, but which nevertheless affect the clinical trial results. In addition, side effects experienced by the patients may cause delay of approval of our product candidates or a limited application of an approved product. Moreover, our clinical trials may not demonstrate sufficient safety and efficacy to obtain FDA approval.
Failure can occur at any time during the clinical trial process and, in addition, the results from early clinical trials may not be predictive of results obtained in later and larger clinical trials, and product candidates in later clinical trials may fail to show the desired safety or efficacy despite having progressed successfully through earlier clinical testing. A number of companies in the pharmaceutical industry have suffered significant setbacks in clinical trials, even in advanced clinical trials after showing positive results in earlier clinical trials. In the future, the completion of clinical trials for our product candidates may be delayed or halted for many reasons, including those relating to the following:
●
delays in patient enrollment, and variability in the number and types of patients available for clinical trials;
●
regulators or institutional review boards may not allow us to commence or continue a clinical trial;
●
our inability, or the inability of our partners, to manufacture or obtain from third parties materials sufficient to complete our clinical trials;
●
delays or failures in reaching agreement on acceptable clinical trial contracts or clinical trial protocols with prospective clinical trial sites;
●
risks associated with trial design, which may result in a failure of the trial to show statistically significant results even if the product candidate is effective;
●
difficulty in maintaining contact with patients after treatment commences, resulting in incomplete data;
●
poor effectiveness of product candidates during clinical trials;
●
safety issues, including adverse events associated with product candidates;
●
the failure of patients to complete clinical trials due to adverse side effects, dissatisfaction with the product candidate, or other reasons;
●
governmental or regulatory delays or changes in regulatory requirements, policy and guidelines; and
●
varying interpretation of data by the FDA or other applicable foreign regulatory agencies.
In addition, our product candidates could be subject to competition for clinical study sites and patients from other therapies under development by other companies which may delay the enrollment in or initiation of our clinical trials. Many of these companies have significantly more resources than we do.
The FDA or other foreign regulatory authorities may require us to conduct unanticipated additional clinical trials, which could result in additional expense and delays in bringing our product candidates to market. Any failure
or delay in completing clinical trials for our product candidates would prevent or delay the commercialization of our product candidates. There can be no assurance our expenses related to clinical trials will lead to the development of brand-name drugs which will generate revenues in the near future. Delays or failure in the development and commercialization of our own branded products could have a material adverse effect on our results of operations, liquidity, financial condition, and our growth prospects.
We rely on third parties to conduct clinical trials for our product candidates, and if they do not properly and successfully perform their legal and regulatory obligations, as well as their contractual obligations to us, we may not be able to obtain regulatory approvals for our product candidates.
We design the clinical trials for our product candidates, but rely on contract research organizations and other third parties to assist us in managing, monitoring and otherwise carrying out these trials, including with respect to site selection, contract negotiation and data management. We do not control these third parties and, as a result, they may not treat our clinical studies as their highest priority, or in the manner in which we would prefer, which could result in delays. Although we rely on third parties to conduct our clinical trials, we are responsible for confirming that each of our clinical trials is conducted in accordance with our general investigational plan and protocol. Moreover, the FDA and foreign regulatory agencies require us to comply with regulations and standards, commonly referred to as good clinical practices, for conducting, recording and reporting the results of clinical trials to ensure that the data and results are credible and accurate and that the trial participants are adequately protected. Our reliance on third parties does not relieve us of these responsibilities and requirements. The FDA enforces good clinical practices through periodic inspections of trial sponsors, principal investigators and trial sites. If we, our contract research organizations or our study sites fail to comply with applicable good clinical practices, the clinical data generated in our clinical trials may be deemed unreliable and the FDA
may require us to perform additional clinical trials before approving our marketing applications. There can be no assurance that, upon inspection, the FDA will determine that any of our clinical trials comply with good clinical practices. In addition, our clinical trials must be conducted with product manufactured under the FDA’s current Good Manufacturing Practices (“cGMP”) regulations. Our failure, or the failure of our contract manufacturers, if any are involved in the process, to comply with these regulations may require us to repeat clinical trials, which would delay the regulatory approval process.
If third parties do not successfully carry out their duties under their agreements with us; if the quality or accuracy of the data they obtain is compromised due to failure to adhere to our clinical protocols or regulatory requirements; or if they otherwise fail to comply with clinical trial protocols or meet expected deadlines, our clinical trials may not meet regulatory requirements. If our clinical trials do not meet regulatory requirements or if these third parties need to be replaced, such clinical trials may be extended, delayed, suspended or terminated. If any of these events occur, we may not be able to obtain regulatory approval of our product candidates, which could have a material adverse effect on our results of operations, financial condition and growth prospects.
Competition in our industry is intense, and developments by other companies could render our products and product candidates obsolete.
Many of our competitors, including medical technology, pharmaceutical or biotechnology and other companies, universities, government agencies, or research organizations, have substantially greater financial and technical resources and production and marketing capabilities than we have. They also may have greater experience in conducting bioequivalence studies, preclinical testing and clinical trials of pharmaceutical products, obtaining FDA and other regulatory approvals, and ultimately commercializing any approved products. Therefore, our competitors may succeed in developing and commercializing technologies and products that are more effective than the drug delivery technologies we have developed or we are developing or that will cause our technologies or products to become obsolete or non-competitive, and in obtaining FDA approval for products faster than we could. These developments could render our products obsolete and uncompetitive, which would have a material adverse effect on our business, financial condition and results of operations. Even if we commence further commercial sales of our products, we will be competing against the greater manufacturing efficiency and marketing capabilities of our competitors, areas in which we have limited or no experience.
We rely on collaborative arrangements with third parties that provide manufacturing and/or marketing support for some or all of our products and product candidates. Even if we find a potential partner, we may not be able to negotiate an arrangement on favourable terms or achieve results that we consider satisfactory. In addition,
such arrangements can be terminated under certain conditions and do not assure a product’s success. We also face intense competition for collaboration arrangements with other pharmaceutical and biotechnology companies.
Although we believe that our ownership of patents for some of our drug delivery products will limit direct competition with these products, we must also compete with established existing products and other promising technologies and other products and delivery alternatives that may be more effective than our products and proposed products. In addition, we may not be able to compete effectively with other commercially available products or drug delivery technologies.
We require regulatory approvals for any products that use our drug delivery technologies.
Our drug delivery technologies can be quite complex, with many different components. The development required to take a technology from its earliest stages to its incorporation in a product that is sold commercially can take many years and cost a substantial amount of money. Significant technical challenges are common as additional products incorporating our technologies progress through development.
Any particular technology such as our abuse-deterrent technology may not perform in the same manner when used with different therapeutic agents, and therefore this technology may not prove to be as useful or valuable as originally thought, resulting in additional development work.
If our efforts do not repeatedly lead to successful development of product candidates, we may not be able to grow our pipeline or to enter into agreements with marketing and distribution partners or collaborators that are willing to distribute or develop our product candidates. Delays or unanticipated increases in costs of development at any stage, or failure to solve a technical challenge, could adversely affect our operating results.
If contract manufacturers fail to devote sufficient time and resources to our concerns, or if their performance is substandard, the commercialization of our products could be delayed or prevented, and this may result in higher costs or deprive us of potential product revenues.
We rely on contract manufacturers for certain components and ingredients of our clinical trial materials, such as active pharmaceutical ingredients (“APIs”), and we may rely on such manufacturers for commercial sales purposes as well. Our reliance on contract manufacturers in these respects will expose us to several risks which could delay or prevent the commercialization of our products, result in higher costs, or deprive us of potential product revenues, including:
●
Difficulties in achieving volume production, quality control and quality assurance, or technology transfer, as well as with shortages of qualified personnel;
●
The failure to establish and follow cGMP and to document adherence to such practices;
●
The need to revalidate manufacturing processes and procedures in accordance with FDA and other nationally mandated cGMPs and potential prior regulatory approval upon a change in contract manufacturers;
●
Failure to perform as agreed or to remain in the contract manufacturing business for the time required to produce, store and distribute our products successfully;
●
The potential for an untimely termination or non-renewal of contracts; and
●
The potential for us to be in breach of our collaboration and marketing and distribution arrangements with third parties for the failure of our contract manufacturers to perform their obligations to us.
In addition, drug manufacturers are subject to ongoing periodic unannounced inspection by the FDA and corresponding state and foreign agencies to ensure strict compliance with cGMP and other government regulations. While we may audit the performance of third-party contractors, we will not have complete control over their compliance with these regulations and standards. Failure by either our third-party manufacturers or by us to comply with applicable regulations could result in sanctions being imposed on us, including fines, injunctions, civil penalties, failure of applicable regulatory authorities to grant review of submissions or market approval of drugs, delays, suspension or withdrawal of approvals, product seizures or recalls, operating restrictions, facility closures and criminal prosecutions, any of which could harm our business.
We are subject to currency rate fluctuations that may impact our financial results.
Our financial results are reported in U.S. dollars and our revenues are payable in U.S. dollars, but the majority of our expenses are payable in Canadian dollars. There may be instances where we have net foreign currency exposure. Any fluctuations in exchange rates will impact our financial results.
We are exposed to risks arising from the ability and willingness of our third-party commercialization partners to provide documentation that may be required to support information on revenues earned by us from those commercialization partners.
If our third-party commercialization partners, from whom we receive revenues, are unable or unwilling to supply necessary or sufficient documentation to support the revenue numbers in our financial statements in a timely manner to the satisfaction of our auditors, this may lead to delays in the timely publication of our financial results, our ability to obtain an auditor’s report on our financial statements and our possible inability to access the financial markets during the time our results remain unpublished.
We rely on commercial partners, and may rely on future commercial partners, to market and commercialize our products and, if approved, our product candidates, and one or more of those commercial partners may fail to develop and effectively commercialize our current, and any future, products.
Our core competency and strategic focus is on drug development and we now, and may in the future, utilize strategic commercial partners to assist in the commercialization of our products and our product candidates, if approved by the FDA. If we enter into strategic partnerships or similar arrangements, we will rely on third parties for financial resources and for commercialization, sales and marketing. Our commercial partners may fail to develop or effectively commercialize our current, and any future products, for a variety of reasons, including, among others, because they may face intense competition, they lack adequate financial or other resources or they decide to focus on other initiatives or priorities. Any failure of our third-party commercial partners to successfully market and commercialize our products and product candidates would diminish our revenues.
We have limited sales, marketing and distribution experience.
We have limited experience in the sales, marketing, and distribution of pharmaceutical products. There can be no assurance that, if required, we would be able to establish sales, marketing, and distribution capabilities or make arrangements with our collaborators, licensees, or others to perform such activities or that such efforts would be successful. If we fail to establish successful marketing and sales capabilities or to make arrangements with third parties, our business, financial condition and results of operations will be materially adversely affected.
Our significant shareholders have the ability to exercise significant influence over certain corporate actions.
Our principal shareholders, Drs. Amina and Isa Odidi, our President and Chief Operating Officer and our Chairman and Chief Executive Officer, respectively, and Odidi Holdings Inc., a privately-held company controlled by Drs. Amina and Isa Odidi, owned in the aggregate approximately 19.17%16.7% of our issued and outstanding common shares as of February 27, 20172018 (and collectively beneficially owned in the aggregate approximately 28.2%25.6% of our common shares, including common shares issuable upon the exercise of outstanding options and the conversion of the debenture in respect of the loan to us in the original principal amount of $1,500,000 by Drs. Isa and Amina Odidi (the “Debenture”), of which $1,350,000 remains outstanding, that are exercisable or convertible within 60 days of the date hereof). As a result, the principal shareholders have the ability to exercise significant influence over all matters submitted to our shareholders for approval whether subject to approval by a majority of holders of our common shares or subject to a class vote or special resolution requiring the approval of 66⅔% of the votes cast by holders of our common shares, in person or by proxy.
Our effective tax rate may vary.
Various internal and external factors may have favorable or unfavorable effects on our future effective tax rate. These factors include, but are not limited to, changes in tax laws, regulations and/or rates, changing interpretations of existing tax laws or regulations, future levels of research and development spending, the availability of tax credit programs for the reimbursement of all or a significant proportion of research and development spending, and changes in overall levels of pre-tax earnings. At present, we qualify in Canada for certain research tax credits for qualified scientific research and experimental development pertaining to our drug delivery technologies and drug products in research stages. If Canadian tax laws relating to research tax credits were substantially negatively altered or eliminated, or if a substantial portion of our claims for tax credits were denied by the relevant taxing authorities, pursuant to an audit or otherwise, it would have a material adverse effect upon our financial results.
The effect of discussion in the United States Congress. Such legislation could significantly alter the existing Code. We cannot predict whether, when, or to what extent U.S. federal income tax laws, regulations, interpretations, or rulings willlaw changes enacted in 2017 on the U.S. corporate income tax burden on our future U.S. operations cannot be issued, nor ispredicted. Although such legislation reduced the long-term impactmaximum corporate income tax rate from 35% to 21%, it also introduced several changes that could increase our effective rate of proposed comprehensive tax reforms known at this time. We could be adversely affectedon our net operating income. For example, if our operations are highly leveraged, the new limitations on business interest deductions may prevent us from being able to reduce our corporate income tax base by changes as a resultsignificant amount of comprehensive tax reform.interest incurred on debt necessary to fund operations. In addition, newly enacted limitations on a corporation’s ability to reduce its taxable income
by net operating loss carryovers may prevent us from using prior year accumulated losses fully to offset taxable income earned in profitable years. Finally, if we make significant payments for interest, royalties, services and otherwise deductible items to our foreign affiliates, the base erosion minimum tax enacted last year may apply to increase our effective rate of U.S. corporate income tax.
Risks related to our Industry
Generic drug manufacturers will increase competition for certain products and may reduce our expected royalties.
Part of our product development strategy includes making NDA filings relating to product candidates involving the novel reformulation of existing drugs with active ingredients that are off-patent. Such NDA product candidates, if approved, are likely to face competition from generic versions of such drugs in the future. Regulatory approval for generic drugs may be obtained without investing in costly and time consuming clinical trials. Because of substantially reduced development costs, manufacturers of generic drugs are often able to charge much lower prices for their products than the original developer of a new product. If we face competition from manufacturers of generic drugs on products we may commercialize, such as our once-daily RexistaTMOxycodone ER product candidate, (abuse-deterrent oxycodone hydrochloride extended release tablets), the prices at which such of our products are sold and the revenues we may receive could be reduced.
Revenues from generic pharmaceutical products typically decline as a result of competition, both from other pharmaceutical companies and as a result of increased governmental pricing pressure.
Our generic drugs face intense competition. Prices of generic drugs typically decline, often dramatically, especially as additional generic pharmaceutical companies (including low-cost generic producers based in China and India) receive approvals and enter the market for a given product and competition intensifies. Consequently, our ability to sustain our sales and profitability on any given product over time is affected by the number of new companies selling such product and the timing of their approvals.
In addition, intense pressure from government healthcare authorities to reduce their expenditures on prescription drugs could result in lower pharmaceutical pricing, causing decreases in our revenues.
Furthermore, brand pharmaceutical companies continue to defend their products vigorously. For example, brand companies often sell or license their own generic versions of their products, either directly or through other generic pharmaceutical companies (so-called “authorized generics”). No significant regulatory approvals are required for authorized generics, and brand companies do not face any other significant barriers to entry into such market. Brand companies may seek to delay introductions of generic equivalents through a variety of commercial and regulatory tactics. These actions may increase the costs and risks of our efforts to introduce generic products and may delay or prevent such introduction altogether.
Market acceptance of our products will be limited if users of our products are unable to obtain adequate reimbursement from third-party payers.
Government health administration authorities, private health insurers and other organizations generally provide reimbursement for products like ours, and our commercial success will depend in part on whether appropriate reimbursement levels for the cost of our products and related treatments are obtained from government authorities, private health insurers and other organizations, such as health maintenance organizations and managed care organizations. Even if we succeed in bringing any of our products to market, third-party payers may not provide reimbursement in whole or in part for their use.
Significant uncertainty exists as to the reimbursement status of newly approved health care products. Some of our product candidates, such as our once-daily Rexista™ (abuse-deterrent oxycodone hydrochloride extended release tablets),Oxycodone ER, are intended to replace or alter existing therapies or procedures. These third-party payers may conclude that our products are less safe, less effective or less economical than those existing therapies or procedures. Therefore, third-party payers may not approve our products for reimbursement. We may be required to make substantial pricing concessions in order to gain access to the formularies of large managed-care organizations. If third party payers do not approve our products for reimbursement or fail to reimburse them adequately, sales will suffer as some physicians or their patients may opt for a competing product that is approved for reimbursement or is adequately reimbursed. Even if third-party payers make reimbursement available, these payers’ reimbursement policies may adversely affect our ability and our potential marketing and distribution partners’ ability to sell our products on a profitable basis.
We are subject to significant costs and uncertainties related to compliance with the extensive regulations that govern the manufacturing, labeling, distribution, cross-border imports and promotion of pharmaceutical products as well as environmental, safety and health regulations.
Governmental authorities in the United States and Canada regulate the research and development, testing and safety of pharmaceutical products. The regulations applicable to our existing and future products may change. Regulations require extensive clinical trials and other testing and government review and final approval before we can market our products. The cost of complying with government regulation can be substantial and may exceed our available resources, causing delay or cancellation of our product introductions.
Some abbreviated application procedures for controlled-release drugs and other products, including those related to our ANDA filings, or to the ANDA filings of unrelated third parties in respect of drugs similar to or chemically related to those of our ANDA filings, are or may become the subject of petitions filed by brand-name drug manufacturers or other ANDA filers seeking changes from the FDA in the interpretation of the statutory approval requirements for particular drugs as part of their strategy to thwart or advance generic competition. We cannot predict whether the FDA will make any changes to its interpretation of the requirements applicable to our ANDA applications as a result of these petitions, or whether unforeseen delays will occur in our ANDA filings while the FDA considers such petitions or changes or otherwise, or the effect that any changes may have on us. Any such changes in FDA interpretation of the statutes or regulations, or any legislated changes in the statutes or regulations, may make it more difficult for us to file ANDAs or obtain further approval of our ANDAs and generate revenues and thus may materially harm our business and financial results.
Any failure or delay in obtaining regulatory approvals could make it so that we are unable to market any products we develop and therefore adversely affect our business, results of operations, financial condition and cash flows. Even if product candidates are approved in the United States or Canada, regulatory authorities in other countries must approve a product prior to the commencement of marketing the product in those countries. The time required to obtain any such approval may be longer than in the United States or Canada, which could cause the introduction of our products in other countries to be cancelled or materially delayed.
The manufacturing, distribution, processing, formulation, packaging, labeling, cross-border importation and advertising of our products are subject to extensive regulation by federal agencies, including in the United States, the FDA, Drug Enforcement Administration, Federal Trade Commission, Consumer Product Safety Commission and Environmental Protection Agency in the U.S.,United States, and Health Canada and Canada Border Services Agency in Canada, among others. We are also subject to state and local laws, regulations and agencies. Compliance with these regulations requires substantial expenditures of time, money and effort in such areas as production and quality control to ensure full technical compliance. Failure to comply with FDA and Health Canada and other governmental regulations can result in fines, disgorgement, unanticipated compliance expenditures, recall or seizure of products, total or partial suspension of production or distribution, suspension of the FDA’s or Health Canada’s review of NDAs, ANDAs or ANDSs, as the case may be, enforcement actions, injunctions and civil or criminal prosecution.
Environmental laws have changed in recent years and we may become subject to stricter environmental standards in the future and face larger capital expenditures in order to comply with environmental laws. We are subject to extensive federal, state, provincial and local environmental laws and regulations which govern the discharge, emission, storage, handling and disposal of a variety of substances that may be used in, or result from, our operations. We are also subject periodically to environmental compliance reviews by environmental, safety, and health regulatory agencies and to potential liability for the remediation of contamination associated with both present and past hazardous waste generation, handling, and disposal activities. We cannot accurately predict the outcome or timing of future expenditures that we may be required to make in order to comply with the federal, state, local and provincial environmental, safety, and health laws and regulations that are applicable to our operations and facilities.
There has been an increased public awareness of the problems associated with the potential for abuse of opioid-based medications.
There has been increasing legislative attention to opioid abuse in the U.S., including passage of the 2016 Comprehensive Addiction and Recovery Act and the 21st Century Cures Act, which, among other things, strengthens state prescription drug monitoring programs and expands educational efforts for certain populations. These laws could result in fewer prescriptions being written for opioid drugs, which could impact future sales of our Oxycodone ER and related opioid product candidates.
Federal, state and local governmental agencies have increased their level of scrutiny of commercial practices of companies marketing and distributing opioid products, resulting in investigations, litigation and regulatory intervention affecting other companies. A number of counties and municipalities have filed lawsuits against pharmaceutical wholesale distributors, pharmaceutical manufacturers and retail chains related to the distribution of prescription opioid pain medications. Policy makers and regulators are seeking to reduce the impact of opioid abuse on families and communities and are focusing on policies aimed at reversing the potential for abuse. In furtherance of those efforts, the FDA has developed an Action Plan and has committed to enhance safety labeling, require new data, strengthen post-market requirements, update the REMS program, expand access to and encourage the development of abuse-deterrent formulations and alternative treatments, and re-examine the risk-benefit profile of opioids to consider the wider public health effects of opioids, including the risk of misuse. Several states also have passed laws and have employed other clinical and public health strategies to curb prescription drug abuse, including prescription limitations, increased physician education requirements, enhanced monitoring programs, tighter restrictions on access, and greater oversight of pain clinics. This increasing scrutiny and related governmental and private actions, even if not related to a product that we intend to make, could have an unfavorable impact on the overall market for opioid-based products such as our Oxycodone ER product candidate, or otherwise negatively affect our business.
Healthcare reform measures could hinder or prevent the commercial success of our products and product candidates.
In the United States, there have been, and we expect there will continue to be, a number of legislative and regulatory changes to the healthcare system that could affect our future revenues and potential profitability. Federal and state lawmakers regularly propose and, at times, enact legislation that results in significant changes to the
healthcare system, some of which are intended to contain or reduce the costs of medical products and services. An example of this is the Patient Protection and Affordable Care Act, as amended by the Health Care and Education Reconciliation Act, or, collectively, the Affordable Care Act. In addition, other legislative changes have been proposed and adopted in the U.S. since the Affordable Care Act was enacted.
We expect that the new presidential administration and U.S. Congress will seek to modify, repeal, or otherwise invalidate all, or certain provisions of, the Affordable Care Act. Since taking office, President Trump has continued to support the repeal of all or portions of the Affordable Care Act and the House and Senate have recently taken certain action in furtherance of this goal.
We also expect that additional state and federal healthcare reform measures will be adopted in the future, any of which could limit the amounts that federal and state governments will pay for healthcare products and services, and which could result in reduced demand for our products once approved or additional pricing pressures, and may adversely affect our operating results.
Our ability to market and promote our Rexista™Oxycodone ER product candidate (abuse-deterrent oxycodone hydrochloride extended release tablets) and its abuse-deterrent features will be determined by FDA-approved labeling requirements.
The commercial success of our Rexista™Oxycodone ER product candidate (abuse-deterrent oxycodone hydrochloride extended release tablets) will depend upon our ability to obtain requested FDA-approved labeling describing its abuse-deterrent features. Our failure to achieve FDA approval of requested product labeling containing such information will prevent us from advertising and promoting the abuse-deterrent features of our product candidate in a way to differentiate it from competitive products. This would make our product candidate less competitive in the market. Moreover, FDA approval is required in order to make claims that a product has an abuse-deterrent effect.
In April 2015, the FDA published final guidance with respect to the evaluation and labeling of abuse-deterrent opioids. The guidance provides direction as to the studies and data required for obtaining abuse-deterrent claims in a product label. If a product is approved by the FDA to include such claims in its label, the applicant may use the approved labeling information about the abuse-deterrent features of the product in its marketing efforts to physicians.
Although we intend to provide data to the FDA to support approval of abuse-deterrence label claims for Rexista™,Oxycodone ER, there can be no assurance that Rexista™Oxycodone ER or any of our other product candidates will receive FDA-approved labeling that describes the abuse-deterrent features of such products. The FDA may find that our studies and data do not support our requested abuse-deterrent labeling or that our product candidate does not provide substantial abuse-deterrence benefits because, for example, its deterrence mechanisms do not address the way it is most likely to be abused. Furthermore, the FDA could change its guidance, which could require us to conduct additional studies or generate additional data. If the FDA does not approve our requested abuse-deterrent labeling, we will be limited in our ability to promote Rexista™Oxycodone ER based on its abuse-deterrent features and, as a result, our business may suffer.
We are subject to product liability costs for which we may not have or be able to obtain adequate insurance coverage.
The testing and marketing of pharmaceutical products entails an inherent risk of product liability. Liability exposures for pharmaceutical products can be extremely large and pose a material risk. In some instances, we may be or may become contractually obligated to indemnify third parties for such liability. Our business may be materially and adversely affected by a successful product liability claim or claims in excess of any insurance
coverage that we may have. Further, even if claims are not successful, the costs of defending such claims and potential adverse publicity could be harmful to our business.
While we currently have, and in some cases are contractually obligated to maintain, insurance for our business, property and our products as they are administered in bioavailability/bioequivalence studies, first and third party insurance is increasingly costly and narrow in scope. Therefore, we may be unable to meet such contractual obligations or we may be required to assume more risk in the future. If we are subject to third party claims or suffer a loss or damage in excess of our insurance coverage, we may be required to bear that risk in excess of our insurance limits. Furthermore, any first or third party claims made on our insurance policy may impact our ability to obtain or maintain insurance coverage at reasonable costs or at all in the future.
Our products involve the use of hazardous materials and waste, and as a result we are exposed to potential liability claims and to costs associated with complying with laws regulating hazardous waste.
Our research and development activities involve the use of hazardous materials, including chemicals, and are subject to Canadian federal, provincial and local laws and regulations governing the use, manufacture, storage, handling and disposal of hazardous materials and waste products. It is possible that accidental injury or contamination from these materials may occur. In the event of an accident, we could be held liable for any damages, which could exceed our available financial resources. Further, we may not be able to maintain insurance to cover these costs on acceptable terms, or at all. In addition, we may be required to incur significant costs to comply with environmental laws and regulations in the future.
Our operations may be adversely affected by risks associated with international business.
We may be subject to certain risks that are inherent in an international business, including:
●
varying regulatory restrictions on sales of our products to certain markets and unexpected changes in regulatory requirements;
●
tariffs, customs, duties, and other trade barriers;
●
difficulties in managing foreign operations and foreign distribution partners;
●
longer payment cycles and problems in collecting accounts receivable;
●
political risks;
●
foreign exchange controls that may restrict or prohibit repatriation of funds;
●
export and import restrictions or prohibitions, and delays from customs brokers or government agencies;
●
seasonal reductions in business activity in certain parts of the world; and
●
potentially adverse tax consequences.
Depending on the countries involved, any or all of the foregoing factors could materially harm our business, financial condition and results of operations.
In the event we pursue growth through international operations, such growth could strain our resources, and if we are unable to manage any growth we may experience, we may not be able to successfully implement our business plan.
In connection with any geographic expansion we may pursue, international operations would involve substantial additional risks, including, among others: difficulties complying with the U.S. Foreign Corrupt Practices Act and other applicable anti-bribery laws. difficulties maintaining compliance with the various laws and regulations of multiple jurisdictions that may be applicable to our business, many of which may be unfamiliar to us. more complexity in our regulatory and accounting compliance. differing or changing obligations regarding taxes, duties or other fees. limited intellectual property protection in some jurisdictions. risks associated with currency exchange and convertibility, including vulnerability to appreciation and depreciation of foreign currencies. uncertainty related to developing legal and regulatory systems and standards for economic and business activities in some jurisdictions. trade restrictions or barriers, including tariffs or other charges and import-export regulations, changes in applicable laws or policies. the impact of and response to natural disasters. and the potential for war, civil or political unrest and economic and financial instability. The occurrence of any of these risks could limit our ability to pursue international expansion, increase our costs or expose us to fines or other legal sanctions, any of which could negatively impact our business, reputation and financial condition.
Risks related to our common shares
Our share price has been highly volatile and our shares could suffer a further decline in value.
The trading price of our common shares has been highly volatile and could continue to be subject to wide fluctuations in price in response to various factors, many of which are beyond our control, including:
●
sales of our common shares, including any sales made in connection with future financings;
●
announcements regarding new or existing corporate relationships or arrangements;
●
announcements by us of significant acquisitions, joint ventures, or capital commitments;
●
actual or anticipated period-to-period fluctuations in financial results;
●
clinical and regulatory development regarding our product candidates;
●
litigation or threat of litigation;
●
failure to achieve, or changes in, financial estimates by securities analysts;
●
comments or opinions by securities analysts or members of the medical community;
●
announcements regarding new or existing products or services or technological innovations by us or our competitors;
●
conditions or trends in the pharmaceutical and biotechnology industries;
●
additions or departures of key personnel or directors;
●
economic and other external factors or disasters or crises;
●
limited daily trading volume; and
●
developments regarding our patents or other intellectual property or that of our competitors.
In addition, the stock market in general and the market for drug development companies in particular have experienced significant price and volume fluctuations that have often been unrelated or disproportionate to the operating performance of those companies. Further, there has been significant volatility in the market prices of securities of life science companies. In the past, following periods of volatility in the market price of a company’s securities, securities class action litigation has often been instituted.instituted, such as the S.D.N.Y. Action. A securities class action suit against us could result in substantial costs, potential liabilities, and the diversion of management’s attention and resources.
A large number of our common shares could be sold in the market in the near future, which could depress our stock price.
As of February 27, 2017,2018, we had approximately 30.034.7 million common shares outstanding. In addition, a substantial portion of our shares are currently freely trading without restriction under the Securities Act of 1933, as amended (“U.S. Securities Act”), having been registered for resale or held by their holders for over one yearsix months and are eligible for sale under Rule 144. In addition, in November 2013, we established an at-the-market equity program pursuant to which we originally could, from time to time, sell up to 5,305,484 of our common shares for up to an aggregate of $16.8 million (or such lesser amount as may then be permitted under applicable exchange rules and securities laws and regulations). As of February 27, 20172018 we have issued and sold 3,853,557an aggregate of 4,740,350 common shares with an aggregate offering price of $11,908,312$13,872,929 under the at-the-market program. We currently may offer and sell our common shares with an aggregate purchase price of up to $4,891,688 pursuant to the at-the-market program. Roth Capital Partners, LLC (“Roth”) received compensation of $335,987$392,827 in connection with such sales. We are not required to sell shares under the equity distribution agreement. There can be no assurance that any additional shares will be sold under our at-the-market program.
On June 4, 2014,July 17, 2017, the Company’s most recent registration statement on Form F-3 was declared effective by the United States Securities and Exchange Commission (“SEC”) (the “Shelf Registration Statement”), and on June 5, 2014, the Company filed a final short form base shelf prospectus with securities regulatory authorities in each of the provinces and territories of Canada, except Quebec. These documents allow. The Shelf Registration Statement allows for, subject to securities regulatory requirements and limitations, the potential offering of up to an aggregate of US$100 million of the Company’s common shares, preference shares, warrants, subscription receipts, subscription rights and units, or any combination thereof, from time to time in one or more offerings, and are intended to give the Company the flexibility to take advantage of financing opportunities when, and if, market conditions are favorable to the Company. The specific terms of such future offerings, if any, would be established, subject to the approval of the Company’s board of directors, at the time of such offering and will be described in detail in a prospectus supplement filed at the time of any such offering. To the extent any securities of the Company are issued by the Company under the Shelf Registration Statement or the shelf prospectus, a shareholder’s percentage ownership will be diluted and our stock price could be further adversely affected. As of February 27, 2017,February27, 2018, the Company has not sold any securities under the Shelf Registration Statement, or the shelf prospectus, other than (i) the sale since June 4, 2014July 17, 2017 of 2,164,057485,239 common shares under the Company’s at-the-market program referred to above and (ii) the sale of units,3,636,364 common shares and warrants under the Dawson James
On October 22, 2009, IntelliPharmaCeutics Ltd. (“IPC Ltd.”) and Vasogen Inc. (“Vasogen”) completed a plan of arrangement and merger (the “IPC Arrangement Agreement”), resulting in the formation of the Company. Our shareholders who received shares under the IPC Arrangement Agreement who were not deemed “affiliates” of either Vasogen, IPC Ltd. or us prior to the IPC Arrangement Agreement were able to resell the common shares that they received without restriction under the U.S. Securities Act. The common shares received by an “affiliate” after the IPC Arrangement Agreement or who were “affiliates” of either Vasogen, IPC Ltd. or us prior to the IPC Arrangement Agreement are subject to certain restrictions on resale under Rule 144.144.
As of February 27, 2017,2018, there are currently common shares issuable upon the exercise of outstanding options and warrants and the conversion of an outstanding convertible debenture for an aggregate of approximately 7,845,60310,257,909 common shares. To the extent any of our options and warrants areis exercised and the convertible debenture is converted, a shareholder’s percentage ownership will be diluted and our stock price could be further adversely affected. Moreover, as the underlying shares are sold, the market price could drop significantly if the holders of these restricted shares sell them or if the market perceives that the holders intend to sell these shares.
We have no history or foreseeable prospect of paying cash dividends.
We have not paid any cash dividends on our common shares and do not intend to pay cash dividends in the foreseeable future. We intend to retain future earnings, if any, for reinvestment in the development and expansion of our business. Dividend payments in the future may also be limited by loan agreements or covenants contained in other securities we may issue. Any future determination to pay cash dividends will be at the discretion of our board of directors and depend on our financial condition, results of operations, capital and legal requirements and such other factors as our board of directors deems relevant.
There may not be an active, liquid market for our common shares.
There is no guarantee that an active trading market for our common shares will be maintained on the NASDAQ Capital Market (“NASDAQ”)Nasdaq or the Toronto Stock Exchange (“TSX”). Investors may not be able to sell their shares quickly or at the latest market price if trading in our common shares is not active.
There may be future sales or other dilution of our equity, which may adversely affect the market price of our common shares.
The Company may, from time to time, issue additional common shares, including any securities that are convertible into or exchangeable for, or that represent the right to receive, common shares. The market price of our common shares could decline as a result of sales of common shares or securities that are convertible into or exchangeable for, or that represent the right to receive, common shares after this offering or the perception that such sales could occur.
Future sales of our common shares may cause the prevailing market price of our common shares to decrease.
We have registered a substantial number of outstanding common shares and common shares that are issuable upon the exercise of outstanding warrants. If the holders of our registered common shares choose to sell such shares in the public market or if holders of our warrants exercise their purchase rights and sell the underlying common shares in the public market, or if holders of currently restricted common shares choose to sell such shares in the public market, the prevailing market price for our common shares may decline. The sale of shares issued upon the exercise of our warrants (and options) could also further dilute the holdings of our then existing shareholders. In addition, future public sales by holders of our common shares could impair our ability to raise capital through equity offerings.
Future issuances of our shares could adversely affect the trading price of our common shares and could result in substantial dilution to shareholders.
We may need to issue substantial amounts of common shares in the future. In this regard, in November 2013, we entered into an at-the-market program pursuant to which we may,originally could, from time to time, sell up to 5,305,484 of our common shares for up to an aggregate of $16.8 million (or such lesser amount as may then be permitted under applicable securities laws and regulations) of our common shares on NASDAQ or otherwise.. As of February 27, 2017,2018 we have issued and sold 3,853,557an aggregate of 4,740,350 common shares with an aggregate offering price of $11,908,312$13,872,929 under the at-the-market program. We currently may offer and sell our common shares with an aggregate purchase price of up to $4,891,688 pursuant to theoriginal at-the-market program. There can be no assurance that any additional shares will be sold under our at-the-market program. To the extent that the market price of our common shares declines, we will need to issue an increasing number of common shares per dollar of equity investment. In addition to our common shares issuable in connection with the exercise of our outstanding warrants, our employees, and directors will hold rights to acquire substantial amounts of our common shares. In order to obtain future financing if required, it is likely that we will issue additional common shares or financial instruments that are exchangeable for or convertible into common shares. Also, in order to provide incentives to employees and induce prospective employees and consultants to work for us, we may offer and issue options to purchase common shares and/or rights exchangeable for or convertible into common shares. Future issuances of shares could result in substantial dilution to shareholders. Capital raising activities, if available, and dilution associated with such activities could cause our share price to decline. In addition, the existence of common share purchase warrants may encourage short selling by market participants. Also, in order to provide incentives to current employees and directors and induce prospective employees and consultants to work for us, we have historically granted options and deferred share units (“DSUs”), and intend to continue to do so or offer and issue other rights exchangeable for or convertible into common shares. Future issuances of shares could
result in substantial dilution to all our shareholders. In addition, future public sales by holders of our common shares could impair our ability to raise capital through any future equity offerings.
On June 4, 2014,July 17, 2017, the Shelf Registration Statement was declared effective by the SEC and on June 5, 2014, the Company filed a final short form base shelf prospectus with securities regulatory authorities in each of the provinces and territories of Canada, except Quebec. These documents allowSEC. The Shelf Registration Statement allows for, subject to securities regulatory requirements and limitations, the potential offering of up to an aggregate of US $100 million of the Company’s common shares, preference shares, warrants, subscription receipts, subscription rights and units, or any combination thereof, from time to time in one or more offerings, and are intended to give the Company the flexibility to take advantage of financing opportunities when, and if, market conditions are favorable to the Company. The specific terms of such future offerings, if any, would be established, subject to the approval of the Company’s board of directors, at the time of such offering and will be described in detail in a prospectus supplement filed at the time of any such offering. As of February 27, 2017,2018, the Company has not sold any securities under the Shelf Registration Statement or the shelf prospectus, other than (i) the sale since June 4, 2014July 17, 2017 of 2,164,057485,239 common shares under the Company’s at-the-market program referred to above and (ii) the sale of units,3,636,364 common shares and warrants under the Dawson James UnderwritingWainwright Agreement referred to above, and (iii) the issuance of 1,015,068 common shares pursuant to warrants previously issued, and there can be no assurance that any additional securities will be sold under the Shelf Registration Statement or the shelf prospectus.prospectus.
We may in the future issue preference shares which could adversely affect the rights of holders of our common shares and the value of such shares.
Our board of directors has the ability to authorize the issue of an unlimited number of preference shares in series, and to determine the price, rights, preferences and privileges of those shares without any further vote or action by the holders of our common shares. Although we have no preference shares issued and outstanding, preference shares issued in the future could adversely affect the rights and interests of holders of our common shares.
Our common shares may not continue to be listed on the TSX.
Failure to maintain the applicable continued listing requirements of the TSX could result in our common shares being delisted from the TSX. The TSX will normally consider the delisting of securities if, in the opinion of the exchange, it appears that the public distribution, price, or trading activity of the securities has been so reduced as to make further dealings in the securities on TSX unwarranted. Specifically,For example, participating securities may be delisted from the TSX if, among other things, the market value of an issuer’s securities that are listed on the TSX is less than C$3,000,000 over any period of 30 consecutive trading days. In such circumstances, the TSX may placenotify an issuer that it is under a delisting review pursuant to whichand the issuer wouldwill normally be reviewed undergiven up to 120 days from the date of such notification (the “delisting review period”) to correct the fall in market value and such other deficiencies noted by the TSX. At any time prior to the end of the delisting review period, the TSX will provide the issuer with an opportunity to be heard where the issuer may present submissions to satisfy the TSX that all deficiencies identified in the TSX’s remedial review processnotice have been rectified. If at the conclusion of the hearing the issuer cannot satisfy the TSX that the deficiencies identified have been rectified and typically be granted 120 daysthat no other delisting criteria are then applicable to comply with all requirements for continued listing. the issuer, the TSX will determine whether to delist the issuer’s securities.
If the market price of our common shares declines further or we are unable to maintain other listing requirements, the TSX could commence a remedial review process that could leadmay determine to the delisting ofdelist our common shares from the TSX. Further, if we complete a sale, merger, acquisition, or alternative strategic transaction, we will have to consider if the continued listing of our common shares on the TSX is appropriate, or possible.
shares. If our common shares are no longer listed on the TSX, they may be eligible for listing on the TSX Venture Exchange. In the event that we are not able to maintain a listing for our common shares on the TSX or the TSX Venture Exchange, it may be extremely difficult or impossible for shareholders to sell their common shares in Canada. Moreover, if we are delisted from the TSX, but obtain a substitute listing for our common shares on the TSX Venture Exchange, our common shares will likely have less liquidity and more price volatility than experienced on the TSX.
Shareholders may not be able to sell their common shares on any such substitute exchange in the quantities, at the times, or at the prices that could potentially be available on a more liquid trading market. As a result of these factors, if our common shares are delisted from the TSX, the price of our common shares is likely to decline.
Our common shares may not continue to be listed on NASDAQ.
Nasdaq.
Failure to meet the applicable quantitative and/or qualitative maintenance requirements of NASDAQNasdaq could result in our common shares being delisted from NASDAQ.Nasdaq. For continued listing, NASDAQNasdaq requires, among other things, that listed securities maintain a minimum bid price of not less than $1.00 per share. If the bid price falls below the $1.00 minimum for more than 30 consecutive trading days, an issuer will typically have 180 days to satisfy the $1.00 minimum bid price, which must be maintained for a period of at least ten trading days in order to regain compliance.
If we are delisted from NASDAQ,Nasdaq, our common shares may be eligible for trading on an over-the-counter market in the United States. In the event that we are not able to obtain a listing on another U.S. stock exchange or quotation service for our common shares, it may be extremely difficult or impossible for shareholders to sell their common shares in the United States. Moreover, if we are delisted from NASDAQ,Nasdaq, but obtain a substitute listing for our common shares in the United States, it will likely be on a market with less liquidity, and therefore experience potentially more price volatility than experienced on NASDAQ.Nasdaq. Shareholders may not be able to sell their common shares on any such substitute U.S. market in the quantities, at the times, or at the prices that could potentially be available on a more liquid trading market. As a result of these factors, if our common shares are delisted from NASDAQ,Nasdaq, the price of our common shares is likely to decline. In addition, a decline in the price of our common shares will impair our ability to obtain financing in the future.
In September 2017, the Company announced that it has received written notification from Nasdaq notifying the Company that it is not in compliance with the minimum market value of listed securities requirement set forth in Nasdaq Rules for continued listing on Nasdaq. Nasdaq Listing Rule 5550(b)(2) requires listed securities to maintain a minimum market value of $35.0 million, and Listing Rule 5810(c)(3)(C) provides that a failure to meet the minimum market value requirement exists if the deficiency continues for a period of 30 consecutive business days. Based on the market value of the Company’s common shares for the 30 consecutive business days from August 8, 2017, the Company no longer meets the minimum market value of listed securities requirement. In accordance with Nasdaq Listing Rule 5810(c)(3)(C), the Company has been provided 180 calendar days, or until March 19, 2018, to regain compliance with Nasdaq Listing Rule 5550(b)(2). To regain compliance, the Company’s common shares must have a market value of at least $35.0 million for a minimum of 10 consecutive business days. In the event the Company does not regain compliance by March 19, 2018, the Company may be eligible for additional time to regain compliance. If not, our securities may be delisted from Nasdaq.
In December 2017, we announced that we were notified by Nasdaq that the minimum bid price per share for our common shares was below $1.00 for a period of 30 consecutive business days and that we did not meet the minimum bid price requirement set forth in Nasdaq Listing Rule 5550(a)(2). We have a period of 180 calendar days, or until June 4, 2018, to regain compliance with Nasdaq’s minimum bid price requirement. To regain compliance, our common shares must have a closing bid price of at least $1.00 for a minimum of 10 consecutive business days. In the event we do not regain compliance by June 4, 2018, we may be eligible for additional time to regain compliance. If not, our securities may be delisted from Nasdaq.
There can be no assurance that we will be able to comply with all applicable Nasdaq continued listing standards. If we are unable to do so, our common shares may no longer be listed on Nasdaq or another national securities exchange and the liquidity and market price of our common shares may be adversely affected. If our common shares are delisted from Nasdaq, they may trade on the over-the-counter market, which may be a less liquid market. In such case, our shareholders’ ability to trade, or obtain quotations of the market value of, common shares of the Company would be severely limited because of lower trading volumes and transaction delays. These factors could contribute to lower prices and larger spreads in the bid and ask prices for our securities.
If our common shares are not listed on a national securities exchange, compliance with applicable state securities laws may be required for subsequent offers, transfers and sales of the common shares.
Because our common shares are listed on Nasdaq, we are not required to register or qualify in any state the subsequent offer, transfer or sale of the common shares. If our common shares are delisted from Nasdaq and are not eligible to be listed on another national securities exchange, subsequent transfers of our common shares by U.S. holders may not be exempt from state securities laws. In such event, it will be the responsibility of the holder of common shares to register or qualify the common shares for any subsequent offer, transfer or sale in the United States or to determine that any such offer, transfer or sale is exempt under applicable state securities laws.
Our common shares are listed for trading in the United States and may become subject to the Securities and Exchange Commission’s penny stock rules.
Transactions in securities that are traded in the United States by companies with net tangible assets of $5,000,000 or less and a market price per share of less than $5.00 that are not traded on NASDAQNasdaq or on other securities exchanges may be subject to the “penny stock” rules promulgated under the Securities Exchange Act of 1934, as amended (“U.S. Exchange Act”).Act. Under these rules, broker-dealers who recommend such securities to persons other than institutional investors must:
●
make a special written suitability determination for the purchaser;
●
receive the purchaser’s written agreement to a transaction prior to sale;
●
provide the purchaser with risk disclosure documents which identify risks associated with investing in “penny stocks” and which describe the market for these “penny stocks” as well as a purchaser’s legal remedies; and
●
obtain a signed and dated acknowledgment from the purchaser demonstrating that the purchaser has actually received the required risk disclosure document before a transaction in a “penny stock” can be completed.
As a result of these requirements, if our common shares are at such time subject to the “penny stock” rules, broker-dealers may find it difficult to effectuate customer transactions and trading activity in these shares in the United States may be significantly limited. Accordingly, the market price of the shares may be depressed, and investors may find it more difficult to sell the shares.
As a foreign private issuer in the United States, we are subject to different U.S. securities laws and rules than a domestic U.S. issuer.
As a foreign private issuer under U.S. securities laws we are not required to comply with all the periodic disclosure requirements of the U.S. Exchange Act applicable to domestic United States companies and therefore the publicly available information about us may be different or more limited than if we were a United States domestic issuer. In addition, our officers, directors, and principal shareholders are exempt from the “real time” reporting and “short swing” profit recovery provisions of Section 16 of the U.S. Exchange Act and the rules thereunder. Although under Canadian rules, our officers, directors and principal shareholders are generally required to file on SEDI (www.sedi.ca)(www.sedi.ca) reports of transactions involving our common shares within five calendar days of such transaction, our shareholders may not know when our officers, directors and principal shareholders purchase or sell our common shares as timely as they would if we were a United States domestic issuer.
We are exposed to risks if we are unable to comply with laws and future changes to laws affecting public companies, including the Sarbanes-Oxley Act of 2002, and also to increased costs associated with complying with such laws.
Any future changes to the laws and regulations affecting public companies, as well as compliance with existing provisions of the Sarbanes-Oxley Act of 2002 (“SOX”) in the United States and applicable Canadian securities laws, regulations, rules and policies, may cause us to incur increased costs to comply with such laws and requirements, including, among others, hiring additional personnel and increased legal, accounting and advisory fees. Delays, or a failure to comply with applicable laws, rules and regulations could result in enforcement actions, the assessment of other penalties and civil suits. The new laws and regulations may increase potential costs to be borne under indemnities provided by us to our officers and directors and may make it more difficult to obtain certain types of insurance, including liability insurance for directors and officers; as such, we may be forced to accept reduced policy limits and coverage or incur substantially higher costs to obtain the same or similar coverage. The impact of these events could also make it more difficult to attract and retain qualified persons to serve on our board of directors, or as executive officers.
We are required annually to review and report on the effectiveness of our internal control over financial reporting in accordance with SOX Section 404 and Multilateral Instrument 52-109 – Certification of Disclosure in Issuer’s Annual and Interim Filings of the Canadian Securities Administrators. The results of this review are reported in our Annual Report on Form 20-F and in our Management Discussion and Analysis.
Management’s review is designed to provide reasonable, not absolute, assurance that all material weaknesses in our internal controls are identified. Material weaknesses represent deficiencies in our internal controls that may not prevent or detect a misstatement occurring which could have a material adverse effect on our quarterly or annual financial statements. In addition, there can be no assurance that any remedial actions we take to address any material weaknesses identified will be successful, nor can there be any assurance that further material weaknesses will not be identified in future years. Material errors, omissions or misrepresentations in our disclosures that occur as a result of our failure to maintain effective internal control over financial reporting could have a material adverse effect on our business, financial condition, results of operations, and the value of our common shares.
We may be classified as a “passive foreign investment company” or “PFIC” for U.S. income tax purposes, which could have significant and adverse tax consequences to U.S. investors.
The possible classification of our company as a passive foreign investment company (“PFIC”) for U.S. federal income tax purposes could have significant and adverse tax consequences for U.S. Holders (as defined in Item 10 below) of our common shares and preference shares (collectively, “shares”). It may be possible for U.S. holders of shares to mitigate certain of these consequences by making an election to treat us as a “qualified electing fund” or “QEF” under Section 1295 of the Code (a “QEF Election”) or a mark-to-market election under Section 1296 of the Internal Revenue Code of 1986, as amended (the “Code”). A non-U.S. corporation generally will be a PFIC if, for a taxable year (a) 75% or more of the gross income of such corporation for such taxable year consists of specified types of passive income or (b) on average during the year, 50% or more of the assets held by such corporation either produce passive income or are held for the production of passive income, based on the fair market value of such assets (or on the adjusted tax basis of such assets, if such non-U.S. corporation is not publicly traded and either is a “controlled foreign corporation” under Section 957(a) of the Code, or makes an election to determine whether it is a PFIC based on the adjusted basis of the assets).
The determination of whether we are, or will be, a PFIC for a taxable year depends, in part, on the application of complex U.S. federal income tax rules, which are subject to various interpretations. Although the matter is not free from doubt, weWe believe that we were not a PFIC during our 20162017 taxable year and will not likely be a PFIC during our 20172018 taxable year. Because PFIC status is based on our income, assets and activities for the entire taxable year, and our market capitalization, it is not possible to determine whether we will be characterized as a PFIC for the 20172018 taxable year until after the close of the taxable year. The tests for determining PFIC status are subject to a number of uncertainties. These tests are applied annually, and it is difficult to accurately predict future income, assets and activities relevant to this determination. In addition, because the market price of our common shares is likely to fluctuate, the market price may affect the determination of whether we will be considered a PFIC. There can be no assurance that we will not be considered a PFIC for any taxable year (including our 20172018 taxable
year). Absent one of the elections described above, if we are a PFIC for any taxable year during which a U.S. holder holds our shares, some of the consequences from PFIC status during that year will affect such holder’s U.S. income tax treatment in subsequent years during which we generally will continue to be treated as a PFIC regardless of whether we cease todo not meet the PFIC tests in one or more subsequent years.tests. Accordingly, no assurance can be given that we will not constitute a PFIC in the current (or any future) tax year or that the Internal Revenue Service (the “IRS”) will not challenge any determination made by us concerning our PFIC status.
If we are a PFIC, the U.S. federal income tax consequences to a U.S. holder of the ownership and disposition of our shares will depend on whether such U.S. holder makes a QEF or mark-to-market election. Unless otherwise provided by the IRS, a U.S. holder of our shares is generally required to file an informational return annually to report its ownership interest in the Company during any year in which we are a PFIC.
The foregoing does not purport to be a complete enumeration or explanation of the tax risks involved in an investment in our company. Prospective investors should read this entire annual report and consult with their own legal, tax and financial advisors before deciding to invest in our company.
It may be difficult to obtain and enforce judgments against us because of our Canadian residency.
We are governed by the laws of Canada. All of our directors and officers are residents of Canada and all or a substantial portion of our assets and the assets of such persons may be located outside of the United States. As a result, it may be difficult for shareholders to effect service of process upon us or such persons within the United States or to realize in the United States on judgments of courts of the United States predicated upon the civil liability provisions of the U.S. federal securities laws or other laws of the United States. In addition, there is doubt as to the enforceability in Canada of liabilities predicated solely upon U.S. federal securities law against us, our directors, controlling persons and officers who are not residents of the United States, in original actions or in actions for enforcements of judgments of U.S. courts.
The Company was incorporated under the Canada Business Corporations Act by certificate and articles of arrangement dated October 22, 2009.
Our registered principal office is located at 30 Worcester Road, Toronto, Ontario, Canada M9W 5X2. Our telephone number is (416) 798-3001 and our facsimile number is (416) 798-3007.
Our agent for service in the United States is Corporation ServiceCorporate Services Company at 1090 Vermont1180 Avenue N.W., Washington, D.C. 20005.of the Americas, New York New York, 10036.
On October 19, 2009, the shareholders of IPC Ltd. and Vasogen approved the IPC Arrangement Agreement that resulted in the October 22, 2009 court-approved merger of IPC Ltd. and another U.S. subsidiary of Intellipharmaceutics Inc., coincident with an arrangement pursuant to which a predecessor of the Company combined with 7231971 Canada Inc., a new Vasogen company that acquired substantially all of the assets and certain liabilities of Vasogen, including the proceeds from its non-dilutive financing transaction with Cervus LP (the “IPC Arrangement Transaction”). The completion of the IPC Arrangement Transaction on October 22, 2009 resulted in the formation of the Company, which is incorporated under the laws of Canada. The common shares of the Company are traded on the TSX and NASDAQ.Nasdaq.
For the years ended November 30, 2017, 2016 2015 and 2014,2015, we spent a total of $9,271,353, $8,166,736 $7,247,473 and $8,020,201,$7,247,473, respectively, on research and development. Over the past three fiscal years and up to February 27, 2017,2018, we have raised approximately $17,848,279$17,241,223 in gross proceeds from the issuance of equity and convertible debt securities. Our common shares are listed on the TSX under the symbol “I” and on NASDAQNasdaq under the symbol “IPCI”.
During the last and current financial year, we have not been aware of any indications of public takeover offers by third parties in respect of the Company’s shares or by the Company in respect of other companies’ shares.
For additional information on key events, see Item 4.B below.
Recent Corporate Developments
●
In February 2018, we and the FDA discussed a previously-announced Complete Response Letter (“CRL”) for Oxycodone ER, including issues related to the blue dye in the product candidate. Based on the meeting, the product candidate will no longer include the blue dye. The blue dye was intended to act as an additional deterrent if Oxycodone ER is abused and serve as an early warning mechanism to flag potential misuse or abuse. The FDA confirmed that the removal of the blue dye is unlikely to have any impact on formulation quality and performance. As a result, we will not be required to repeat in vivo bioequivalence studies and pharmacokinetic studies submitted in the Oxycodone ER NDA. The FDA also indicated that, from an abuse liability perspective, Category 1 studies will not have to be repeated on Oxycodone ER with the blue dye removed.
●
In December 2017, we were notified by Nasdaq that the minimum bid price per share for our common shares was below $1.00 for a period of 30 consecutive business days and that we did not meet the minimum bid price requirement set forth in Nasdaq Listing Rule 5550(a)(2). We have a period of 180 calendar days, or until June 4, 2018, to regain compliance with Nasdaq’s minimum bid price requirement. To regain compliance, our common shares must have a closing bid price of at least $1.00 for a minimum of 10 consecutive business days. In the event we do not regain compliance by June 4, 2018, we may be eligible for additional time to regain compliance. If not, our securities may be delisted from Nasdaq.
●
In November 2017, our U.S. marketing partner, Par, launched the 5 and 40 mg strengths of its generic Focalin XR® capsules in the United States, which followed the launch in May 2017 of the 10 and 20 mg strengths in the United States. The launch of the 5 and 40 mg strengths and the 10 and 20 mg strengths complements the 15, 25, 30 and 35 mg strengths of generic Focalin XR® previously launched and marketed by Par. Under a licensing and commercialization agreement between us and Par, we receive quarterly profit-share payments on Par’s U.S. sales of generic Focalin XR®. The Par launches of the additional strengths provided us with the full line of generic Focalin XR® strengths available in the U.S. market. In January 2017, Par had launched the 25 and 35 mg strengths of its generic Focalin XR® capsules in the U.S., complementing the 15 and 30 mg strengths of our generic Focalin XR® already being marketed by Par.
●
In October 2017, we completed a registered direct offering consisting of 3,636,364 common shares at a price of $1.10 per share for gross proceeds of approximately $4 million. We also issued to the investors warrants to purchase an aggregate of 1,818,182 common shares at an exercise price of $1.25 per share. The warrants are exercisable six months following the October 13, 2017 closing date and will expire 30 months after the date they become exercisable. The common shares (but not the warrants or the common shares underlying the warrants) were offered by us through a prospectus supplement pursuant to our shelf registration statement on Form F-3 as previously filed and declared effective by the Securities and Exchange Commission (“SEC”) and the base prospectus contained therein (Registration Statement No. 333-218297). The warrants described above were offered in a private placement under Section 4(a)(2) of the U.S Securities Act, and Regulation D promulgated thereunder and, along with the common shares underlying the warrants, have not been registered under the U.S. Securities Act, or applicable state securities laws.
●
In September 2017, we were notified by Nasdaq that we are not in compliance with the minimum market value of listed securities requirement set forth in Nasdaq Rules for continued listing on Nasdaq. Nasdaq Listing Rule 5550(b)(2) requires listed securities to maintain a minimum market value of $35.0 million. A failure to meet the minimum market value requirement exists if the deficiency continues for a period of 30 consecutive business days. Based on the market value of our common shares for the 30 consecutive business days from August 8, 2017, we no longer meet the minimum market value of listed securities requirement. We were provided 180 calendar days, or until March 19, 2018, to regain compliance with Nasdaq Listing Rule 5550(b)(2). To regain compliance, our common shares must have a market value of at least $35.0 million for a minimum of 10 consecutive business days. In the event we do not regain compliance by March 19, 2018, we may be eligible for additional time to regain compliance. If not, our securities may be delisted from Nasdaq.
●
In September 2017, we received the above referenced CRL for our Oxycodone ER NDA, indicating that the FDA could not approve the application in its present form. In its CRL, the FDA provided certain recommendations and requests for information, including that we complete the relevant Category 2 and Category 3 studies to assess the abuse-deterrent properties of Oxycodone ER by the oral and nasal routes of administration. The FDA also requested additional information related to the inclusion of the blue dye in the Oxycodone ER formulation, and that we submit an alternate proposed proprietary name for Oxycodone ER. We were given one year from September 2017 to respond to the CRL, and can request additional time if necessary.
●
In July 2017, three complaints were filed in the U.S. District Court for the Southern District of New York asserting claims under the federal securities laws against us and two of our executive officers on behalf of a putative class of purchasers of our securities. In a subsequent order, the Court consolidated the three actions under the caption Shanawaz v. Intellipharmaceutics Int’l Inc., et al., No. 1:17-cv-05761 (S.D.N.Y.), appointed lead plaintiffs in the consolidated action, and approved lead plaintiffs’ selection of counsel. Lead plaintiffs filed a consolidated amended complaint on January 29, 2018. In the amended complaint, lead plaintiffs purport to assert claims on behalf of a putative class consisting of purchasers of our securities between May 21, 2015 and July 26, 2017. The amended complaint alleges that the defendants violated Sections 10(b) and 20(a) of the U.S. Exchange Act and Rule 10b-5 promulgated thereunder by making allegedly false and misleading statements or failing to disclose certain information regarding our NDA for Oxycodone ER abuse-deterrent oxycodone hydrochloride extended release tablets. The complaint seeks, among other remedies, unspecified damages, attorneys’ fees and other costs, equitable and/or injunctive relief, and such other relief as the court may find just and proper. Under a scheduling order approved by the Court, the defendants must respond to the amended complaint by March 30, 2018. We intend to vigorously defend our company against the claims asserted in the consolidated action.
●
In July 2017, a joint meeting of the Anesthetic and Analgesic Drug Products Advisory Committee and Drug Safety and Risk Management Advisory Committee of the FDA (the “Advisory Committees”) was held to review our NDA for Oxycodone ER abuse-deterrent oxycodone hydrochloride extended release tablets. The Advisory Committees voted 22 to 1 in finding that our NDA for Oxycodone ER should not be approved at that time. The Advisory Committees also voted 19 to 4 that we did not demonstrate that Oxycodone ER has properties that can be expected to deter abuse by the intravenous route of administration, and 23 to 0 that there is not sufficient data for Oxycodone ER to support inclusion of language regarding abuse-deterrent properties in the product label for the intravenous route of administration. The Advisory Committees expressed a desire to review the additional safety and efficacy data for Oxycodone ER that may be obtained from human abuse potential studies for the oral and intranasal routes of administration.
●
In June 2017, Mallinckrodt, in its capacity as our marketing and distribution partner, launched all strengths of our generic Seroquel XR® in the United States. This launch followed the final approval in May 2017 from the FDA for our ANDA for quetiapine fumarate extended-release tablets in the 50, 150, 200, 300 and 400 mg strengths. The approved product is a generic equivalent of the corresponding strengths of the branded product Seroquel XR® sold in the United States by Astra Zeneca Pharmaceuticals LP (“AstraZeneca”). Under its license and commercial supply agreement with Mallinckrodt, we manufacture and supply generic Seroquel XR® for Mallinckrodt to market, sell and distribute in the United States. That agreement also includes two other product candidates, our generic Pristiq® and generic Lamictal® XR™, for which we have ANDAs under FDA review.
●
In April 2017, we received notice that the Purdue litigation plaintiffs had commenced patent infringement proceedings against us in the U.S. District Court for the District of Delaware in respect of our NDA filing for our Oxycodone ER product candidate, alleging that it infringes six (6) out of the sixteen (16) patents associated with the branded product OxyContin ® listed in the Orange Book. In our NDA filed in November 2016 for Oxycodone ER, we relied on the 505(b)(2) regulatory pathway and referenced data from Purdue Pharma L.P.’s file for its OxyContin® extended release oxycodone hydrochloride. Our Oxycodone ER application was accepted by the FDA for further review in February 2017. We certified to the FDA that we believed that our Oxycodone ER product candidate would not infringe the OxyContin® patents, or that such patents are invalid, and so notified Purdue Pharma L.P. and the other owners of the subject patents listed in the Orange Book of such certification. The complaint seeks injunctive relief as well as attorneys’ fees and costs and such other and further relief as the Court may deem just and proper. As a result of the commencement of these legal proceedings, the FDA is stayed for 30 months from granting final approval to our Oxycodone ER product candidate. That time period commenced on February 24, 2017, when the Purdue litigation plaintiffs received notice of our certification concerning the patents, and will expire on August 24, 2019, unless the stay is earlier terminated by a final declaration of the courts that the patents are invalid, or are not infringed, or the matter is otherwise settled among the parties. A trial date for the Purdue litigation has been set for October 22, 2018. We are confident that we do not infringe the subject patents, and will vigorously defend against these claims.
●
In February 2017, the FDA accepted for filing the NDA we filed in November 2016 seeking authorization to market our Oxycodone ER product candidate in the 10, 15, 20, 30, 40, 60 and 80 mg strengths. The submission is supported by pivotal pharmacokinetic studies that demonstrated that our Oxycodone ER product candidate is bioequivalent to OxyContin®. The submission also includes abuse-deterrent studies conducted to support abuse-deterrent label claims related to abuse of the drug by various pathways.
●
In February 2017, we received final approval from the FDA for our ANDA for metformin hydrochloride extended release tablets in the 500 mg and 750 mg strengths. Our newly approved product is a generic equivalent for the corresponding strengths of the branded product Glucophage®Glucophage® XR sold in the United States by Bristol-Myers Squibb. We are actively evaluating options to realize commercial returns from this new approval.
Our Company
We are a pharmaceutical company specializing in the research, development and manufacture of novel and generic controlled-release and targeted-release oral solid dosage drugs. Our patented Hypermatrix™Hypermatrix™ technology is a multidimensional controlled-release drug delivery platform that can be applied to the efficient development of a wide range of existing and new pharmaceuticals. Based on this technology platform, we have developed several drug delivery systems and a pipeline of products (some of which have received FDA approval) and product candidates in various stages of development, including ANDAs filed with the FDA (and one ANDS filed with Health Canada) and one NDA filing, in therapeutic areas that include neurology, cardiovascular, gastrointestinal tract (“GIT”), diabetes and pain.
In November 2005, we entered into the license and commercialization agreement between Par and us, pursuant to which we granted Par an exclusive, royalty-free license to make and distribute in the U.S. all strengths of our generic Focalin XR® capsules for a period of 10 years from the date of commercial launch (which was November 19, 2013). Under the Par agreement, we made a filing with the FDA for approval to market generic Focalin XR® capsules in various strengths in the U.S. (the “Company ANDA”), and are the owner of that Company ANDA, as approved in part by the FDA. We retain the right to make and distribute all strengths of the generic product outside of the U.S. Calendar quarterly profit-sharing payments for its U.S. sales under the Company ANDA are payable by Par to us as calculated pursuant to the Par agreement. Within the purview of the Par agreement, Par also applied for and owns an ANDA pertaining to all marketed strengths of generic Focalin XR® (the “Par ANDA”), and is now approved by the FDA, to market generic Focalin XR® capsules in all marketed strengths in the U.S. As with the Company ANDA, calendar quarterly profit-sharing payments are payable by Par to us for its U.S. sales of generic Focalin XR® under the Par ANDA as calculated pursuant to the Par agreement.
We received final approval from the FDA in November 2013 under the Company ANDA to launch the 15 and 30 mg strengths of our generic Focalin XR® (dexmethylphenidate hydrochloride extended-release) capsules. Commercial sales of these strengths were launched immediately by our commercialization partner in the U.S., Par.
In February 2016, we received final approval from the FDA of our ANDA for generic Keppra XR® (levetiracetam extended-release tablets)extended-release) tablets for the 500 and 750 mg strengths. Our generic Keppra XR® is a generic equivalent for the corresponding strengths of the branded product Keppra XR® sold in the U.S. by UCB, Inc., and is indicated for use in the treatment of partial onset seizures associated with epilepsy. We are aware that several other generic versions of this product are currently available and serve to limit the overall market opportunity. We are actively exploring the best approach to maximize our commercial returns from this approval. There can be no assurance that our generic Keppra XR® for the 500 and 750 mg strengths will be successfully commercialized.
In February 2017, we received final approval from the FDA for our ANDA for metformin hydrochloride extended release tablets in the 500 mg and 750 mg strengths. Our newly approved product is a generic equivalent for the corresponding strengths of the branded product Glucophage®Glucophage® XR sold in the United States by Bristol-Myers Squibb. We are aware that other generic versions of this product are currently available in the market.market and serve to limit the overall market opportunity. We are actively evaluating options to realize commercial returns from this new approval.approval through a potential partnership arrangement. There can be no assurance that our metformin extended-release tablets for the 500 mg and 750 mg strengths will be successfully commercialized.
In October 2016, we received tentative approval from the FDA for itsour ANDA for quetiapine fumarate extended-release tablets in the 50, 150, 200, 300 and 400 mg strengths and in May 2017, our ANDA received final FDA approval for all of these strengths. Our tentatively-approvedapproved product is a generic equivalent for the corresponding strengths of the branded product Seroquel XR® sold in the U.S. by AstraZeneca. Pursuant to a settlement agreement between us and AstraZeneca dated July 30, 2012, we arewere permitted to launch our generic versions of the 50, 150, 200, 300 and 400 mg strengths of generic Seroquel XR®, on November 1, 2016, subject to FDA final approval of our ANDA for those strengths. Such FDA final approval is subject to a 180 day exclusivity period relating to a prior filer or filersWe have manufactured and shipped commercial quantities of a generic equivalent of the branded product. The first filer rights are shared by Par and Accord. We believe that in early November 2016, Par launched the 50, 100, 200, and 300 mg strengths, and Accord launched the 400 mg strength. If we receive final approval to launch our generic version of the 50, 100, 200, 300, and 400 mgall strengths of generic Seroquel XR® six months after the date of launch by the respective first filers, we andto our marketing and distribution partner for generic Seroquel XR®Mallinckrodt, and Mallinckrodt launched all strengths in the U.S., Mallinckrodt, are working diligently towards a launch of these strengths upon final approval.June 2017. There can be no assurance that our quetiapine fumarate extended-release tablets in any of the 50, 150, 200, 300 and 400 mg strengths will receive final FDA approval, or if approved, that they will be successfully commercialized.
In October 2016, we announced the Mallinckrodt agreement, grantingwhich grants Mallinckrodt an exclusive license to market, sell and distribute in the U.S. the following extended release licensed products which have either been launched (generic Seroquel XR®) or for which we have ANDAs filed with the FDA:
Quetiapine fumarate extended-release tablets (generic Seroquel XR®) – ANDA Tentatively Approved–Approved by FDA and launched
●
Desvenlafaxine extended-release tablets (generic Pristiq®) – ANDA Under FDA Review
●
Lamotrigine extended-release tablets (generic Lamictal® XR™) – ANDA Under FDA Review
Under the terms of the 10-year agreement, we received a non-refundable upfront payment of $3 million in October 2016. In addition, the agreement also provides for a long-term profit sharing arrangement with respect to these licensed products (which includes up to $11 million in cost recovery payments to us)that are payable on future sales of licensed product). We have agreed to manufacture and supply the licensed products exclusively for Mallinckrodt on a cost plus basis. The Mallinckrodt agreement contains customary terms and conditions for an agreement of this kind, and is subject to early termination in the event we do not obtain FDA approvals of the Mallinckrodt licensed products by specified dates, or pursuant to any one of several termination rights of each party.
Our goal is to leverage our proprietary technologies and know-how in order to build a diversified portfolio of commercialized products that generate revenue. We intend to do this by advancing our products from the formulation stage through product development, regulatory approval and manufacturing. We believe that full integration of development and manufacturing will help maximize the value of our drug delivery technologies, products and product candidates. We also believe that out-licensing sales and marketing to established organizations, when it makes economic sense to do so, will improve our return from our products while allowing us to focus on our core competencies. We expect expenditures in investing activities for the purchase of production, laboratory and computer equipment and the expansion of manufacturing and warehousing capability to be higher as we prepare for the commercialization of ANDAs, one NDA and one ANDS that are pending FDA and Health Canada approval, respectively.
Our Strategy
Our Hypermatrix™ technologies are central to the development and manufacture of novel and generic controlled-release and targeted-release oral solid dosage drugs. The Hypermatrix™ technologies are a multidimensional controlled-release drug delivery platform that we believe can be applied to the efficient development of a wide range of existing and new pharmaceuticals. We believe that the flexibility of these technologies allows us to develop complex drug delivery solutions within an industry-competitive timeframe. Based on this technology platform, we have developed several drug delivery systems and a pipeline of products (some of which have received FDA approval) and product candidates in various stages of development, including ANDAs filed with the FDA (and one ANDS filed with Health Canada) and one NDA filing, in therapeutic areas that include neurology, cardiovascular, GIT, diabetes and pain. Certain, but not all, of the products in our pipeline may be developed from time to time for third parties pursuant to drug development agreements with those third parties, under which our commercialization partner generally pays certain of the expenses of development, sometimes
makes certain milestone payments to us and receives a share of revenues or profits if the drug is developed successfully to completion, the control of which is generally in the discretion of our drug development partner.
The principal focus of our development activities previously targeted difficult-to-develop controlled-release generic drugs which follow an ANDA regulatory path. Our current development effort is increasingly directed towards improved difficult-to-develop controlled-release drugs which follow an NDA 505(b)(2) regulatory pathway. We have increased our research and development (“R&D”) emphasis towards specialty new product development, facilitated by the 505(b)(2) regulatory pathway, by advancing the product development program for both Rexista™Oxycodone ER and Regabatin™. The technology that is central to our abuse deterrent formulation of our Rexista™Oxycodone ER is the novel Point of Divergence Drug Delivery System (“nPODDDS™”). nPODDDS™ is designed to provide for certain unique drug delivery features in a product. These include the release of the active substance to show a divergence in a dissolution and/or bioavailability profile. The divergence represents a point or a segment in a release timeline where the release rate, represented by the slope of the curve, changes from an initial rate or set of rates to another rate or set of rates, the former representing the usually higher rate of release shortly after ingesting a dose of the drug, and the latter representing the rate of release over a later and longer period of time, being more in the nature of a controlled-release or sustained action. It is applicable for the delivery of opioid analgesics in which it is desired to discourage common methods of tampering associated with misuse and abuse of a drug, and also dose dumping in the presence of alcohol. It can potentially retard tampering without interfering with the bioavailability of the product.
In addition, our Paradoxical OverDose Resistance Activating Systems (“PODRAS™”) delivery technology was initially introduced to enhance our Rexista™ (abuse deterrent oxycodone hydrochloride extended release tablets)Oxycodone ER product candidate. The PODRAS™ delivery technology platform was designed to prevent overdose when more pills than prescribed are swallowed intact. Preclinical studies of prototypes of oxycodone with PODRASTM technology suggest that, unlike other third-party abuse-deterrent oxycodone products in the marketplace, if more tablets than prescribed are deliberately or inadvertently swallowed, the amount of drug active released over 24 hours may be substantially less than expected. However, if the prescribed number of pills is swallowed, the drug release should be as expected. Certain aspects of our PODRAS technology are covered by U.S. Patent Nos. 9,522,119, 9,700,515, 9,700,516 and 9,801,939 and Canadian patents recentlyPatent No. 2,910,865 issued by the U.S. Patent and Trademark Office and the Canadian Intellectual Property Office in respect of “Compositions and Methods for Reducing Overdose.”Overdose” in December 2016, July 2017 and October 2017. The issuance of these patents provides us with the opportunity to accelerate our PODRASTM development in the first half of 2018 by pursuing proof of concept studies in humans. We intend to incorporate this technology in an alternate Oxycodone ER product candidate.
The NDA 505(b)(2) pathway (which relies in part upon the FDA’s findings for a previously approved drug) both accelerates development timelines and reduces costs in comparison to NDAs for new chemical entities.
An advantage of our strategy for development of NDA 505(b)(2) drugs is that our product candidates can, if approved for sale by the FDA, potentially enjoy an exclusivity period which may provide for greater commercial opportunity relative to the generic ANDA route.
The market we operate in is created by the expiration of drug product patents, challengeable patents and drug product exclusivity periods. There are three ways that we employ our controlled-release technologies, which we believe represent substantial opportunities for us to commercialize on our own or develop products or out-license our technologies and products:
●
For existing controlled-release (once-a-day) products whose APIs are covered by drug molecule patents about to expire or already expired, or whose formulations are covered by patents about to expire, already expired or which we believe we do not infringe, we can seek to formulate generic products which are bioequivalent to the branded products. Our scientists have demonstrated a successful track record with such products, having previously developed several drug products which have been commercialized in the U.S. by their former employer/clients. The regulatory pathway for this approach requires ANDAs for the U.S. and ANDSs for Canada.
●
For branded immediate-release (multiple-times-per-day) drugs, we can formulate improved replacement products, typically by developing new, potentially patentable, controlled-release once-a-day drugs. Among other out-licensing opportunities, these drugs can be licensed to and sold by the pharmaceutical company that made the original immediate-release product. These can potentially protect against revenue erosion in the brand by providing a clinically attractive patented product that competes favorably with the generic immediate-release competition that arises on expiry of the original patent(s). The regulatory pathway for this approach requires NDAs via a 505(b)(2) application for the U.S. or corresponding pathways for other jurisdictions where applicable.
●
Some of our technologies are also focused on the development of abuse-deterrent and overdose preventive pain medications. The growing abuse and diversion of prescription “painkillers”, specifically opioid analgesics, is well documented and is a major health and social concern. We believe that our technologies and know-how are aptly suited to developing abuse-deterrent pain medications. The regulatory pathway for this approach requires NDAs via a 505(b)(2) application for the U.S. or corresponding pathways for other jurisdictions where applicable.
We intend to collaborate in the development and/or marketing of one or more products with partners, when we believe that such collaboration may enhance the outcome of the project. We also plan to seek additional collaborations as a means of developing additional products. We believe that our business strategy enables us to reduce our risk by (a) having a diverse product portfolio that includes both branded and generic products in various therapeutic categories, and (b) building collaborations and establishing licensing agreements with companies with greater resources thereby allowing us to share costs of development and to improve cash-flow. There can be no assurance that we will be able to enter into additional collaborations or, if we do, that such arrangements will be commercially viable or beneficial.
Our Drug Delivery Technologies
Hypermatrix™
Our scientists have developed drug delivery technology systems, based on the Hypermatrix™ platform, that facilitate controlled-release delivery of a wide range of pharmaceuticals. These systems include several core technologies, which enable us to flexibly respond to a wide range of drug attributes and patient requirements, producing a desired controlled-release effect. Our technologies have been incorporated in drugs manufactured and sold by major pharmaceutical companies.
This group of drug delivery technology systems is based upon the drug active ingredient (“drug active”active”) being imbedded in, and an integral part of, a homogeneous (uniform), core and/or coatings consisting of one or more polymers which affect the release rates of drugs, other excipients (compounds other than the drug active), such as for instance lubricants which control handling properties of the matrix during fabrication, and the drug active itself. The Hypermatrix™ technologies are the core of our current marketing efforts and the technologies underlying our existing development agreements.
nPODDDS™
In addition to continuing efforts with Hypermatrix™ as a core technology, our scientists continue to pursue novel research activities that address unmet needs. Rexista™ (abuse deterrent oxycodone hydrochloride extended release tablets)Oxycodone ER is an NDA candidate, with a unique long acting oral formulation of oxycodone intended to treat moderate-to-severe pain. The formulation is intended to present a significant barrier to tampering when subjected to various forms of physical and chemical manipulation commonly used by abusers. It is also designed to prevent dose dumping when inadvertently co-administered with alcohol. The technology that supports our abuse deterrent formulation of oxycodone is the nPODDDS™ Point of Divergence Drug Delivery System. The use of nPODDDS™ does not interfere with the bioavailability of oxycodone. We intend to apply the nPODDDS™ technology platforms to other extended release opioid drug candidates (e.g., oxymorphone, hydrocodone, hydromorphone and morphine) utilizing the 505(b)(2) regulatory pathway.
PODRAS™
Our Paradoxical OverDose Resistance Activating System (PODRAS™)PODRAS™ delivery technology is designed to prevent overdose when more pills than prescribed are swallowed intact. Preclinical studies of prototypes of oxycodone with PODRAS technology suggest that, unlike other third-party abuse-deterrent oxycodone products in the marketplace, if more tablets than prescribed are deliberately or inadvertently swallowed, the amount of drug active released over 24 hours may be substantially less than expected. However, if the prescribed number of pills is swallowed, the drug release should be as expected. We are currently working on an alternate RexistaTMOxycodone ER product candidate incorporating our PODRAS™ delivery technology. In April 2015, the FDA published Guidance for Industry: Abuse-Deterrent Opioids — Evaluation and Labeling,, which cited the need for more efficacious abuse-deterrence
technology. In this Guidance, the FDA stated, “opioid products are often manipulated for purposes of abuse by different routes of administration or to defeat extended-release properties, most abuse-deterrent technologies developed to date are intended to make manipulation more difficult or to make abuse of the manipulated product less attractive or less rewarding. It should be noted that these technologies have not yet proven successful at deterring the most common form of abuse—swallowing a number of intact capsules or tablets to achieve a feeling of euphoria.” The FDA reviewed our request for Fast Track designation for our abuse deterrent RexistaTMOxycodone ER development program incorporating PODRAS™, and in May 2015 notified us that the FDA had concluded that we met the criteria for Fast Track designation. Fast Track is a designation assigned by the FDA in response to an applicant’s request which meets FDA criteria. The designation mandates the FDA to facilitate the development and expedite the review of drugs intended to treat serious or life threatening conditions and that demonstrate the potential to address unmet medical needs. This could potentially result in accelerated approval for Rexista™ incorporating PODRAS™, thereby making it available to patients earlier than would be traditionally possible.
In December 2016, July 2017 and October 2017, we announcedobtained that U.S. Patent No.Nos. 9,522,119, 9,700,515, 9,700,516 and 9,801,939 and Canadian Patent No. 2,910,865 were issued by the U.S. Patent and Trademark Office and the Canadian Intellectual Property Office in respect of “Compositions and Methods for Reducing Overdose”. The issued patents cover aspects of the PODRAS™ delivery technology. The issuance of these patents represents a significant advance in our abuse deterrence technology platform. The PODRAS™PODRAS™ platform has the potential to positively differentiate our technology from others of which we are aware, and may represent an important step toward addressing the FDA’s concern over the ingestion of a number of intact pills or tablets. In addition to its use with opioids, the PODRAS™PODRAS™ platform is potentially applicable to a wide range of drug products, inclusive of over-the-counter drugs, that are intentionally or inadvertently abused and cause harm by overdose to those who ingest them. The issuance of these patents provides us the opportunity to accelerate our PODRAS™ development plan by pursuing proof of concept studies in humans. We intend to incorporate this technology in an alternate RexistaTMOxycodone ER product candidate. We intend to apply the PODRAS™PODRAS™ technology platforms to other extended release opioid drug candidates (e.g., oxymorphone, hydrocodone, hydromorphone and morphine) utilizing the 505(b)(2) regulatory pathway.
The Hypermatrix™ Family of Technologies
Our platform of HypermatrixTMHypermatrix™ drug delivery technologies include, but are not limited to, IntelliFoamTMIntelliFoam™, IntelliGITransporterTMIntelliGITransporter™, IntelliMatrixTMIntelliMatrix™, IntelliOsmoticsTMIntelliOsmotics™, IntelliPasteTMIntelliPaste™, IntelliPelletsTMIntelliPellets™, IntelliShuttleTMIntelliShuttle™, nPODDDSTMnPODDDS™ and PODRAS™. Some of their key attributes are described below.
These technologies provide a broad range of release profiles, taking into account the physical and chemical characteristics of a drug product, the therapeutic use of the particular drug, and the optimal site for release of the API in the GIT. At present those technologies have been applied in the laboratory and/or in bioavailability/bioequivalence studies in man to such orally administered small molecule drugs as are used in the treatment of neurological, cardiovascular, GIT, diabetes, pain and other significant indications.
IntelliFoam™
The IntelliFoam™ technology is based on the drug active being embedded in, but separate from a syntactic foam substrate, the properties of which are used to modulate the release of the drug active. The drug actives are embedded in a resin polymer matrix.
IntelliGITransporter™
The IntelliGITransporter™ technology consists of an active drug immobilized in a homogeneous (uniform) matrix structure. A precise choice of mix ratios, polymers, and other ingredients imparts characteristics which protect the drug composition from mechanical degradation due to digestion, and/or from chemical degradation in the acidic stomach environment, and ensures that this technology allows control of release as well as releasing the medication at certain parts of the stomach or intestines without significant food effects or unintentional premature release of the entire drug dose. We believe that this technology is most useful for drug molecules with characteristics such as very low or very high potency, opiate analgesics (pain medications derived from the chemical compounds found in opium), or susceptibility to acid degradation. It is also useful for products where a zero-order (constant rate over time, independent of the amount of drug available for dissolution) release profile is desirable.
IntelliMatrix™
The IntelliMatrix™ technology is a proprietary blend of several polymers. Depending on the constituents of the blend and the manner in which these interact, the use of the blend with a drug allows the drug to be released at predetermined rates, while imparting protective characteristics to both the drug and the GIT. This is most useful for drugs which require precisely controlled first-order release profiles, where the amount released with time is dependent on one component like the amount of drug available for dissolution.
IntelliOsmotics™
The IntelliOsmotics™ technology is based upon the inclusion of multiple populations of polymers with distinct chemical bonding characteristics. These set up a complex matrix of hydrophilic (water attracting) and hydrophobic (water repelling) domains. When the tablet or bead is in an aqueous environment, like gastric contents, a “mixture” of water-soluble polymer and drug core is surrounded by gel layer(s) of water-insoluble polymer. Osmotic pressure drives the drug out when solvent passes through the gel layer while the polymer molecules remain. This permits control of the rate of release of the drug active by the variation of polymer ratios. This technology is most useful for drug molecules which require precisely controlled pseudo-first-order release profiles, where the rate of release is proportional to the amount available for dissolution as well as being proportional to one other component; however the effect of the amount of drug is overriding, so that the rate appears first-order. This type of release control can be useful when attempting to match difficult profiles for generic formulation.
IntelliPaste™
The IntelliPaste™ technology is comprised of blends of multiple polymers, oils, excipients and drug active(s) which result in a paste-in-a-capsule dosage form. The physical attributes of the paste include that it is thixotropic, pseudoplastic and non-Newtonian or, in layman’s terms, like toothpaste. Typically, it is formulated as having very low solubility in water or oil, and low solubility in alcohol. These characteristics enable the resulting drug product to have tamper-deterrent properties, and to resist dissolution in even high concentrations of alcohol. As a result, IntelliPaste™ is our preferred delivery technology for the controlled delivery of opiates, narcotics and other central nervous system drug products which are susceptible to unlawful diversion or abuse.
IntelliPellets™
The IntelliPellets™ technology consists of one or more type (population) of granule, bead, pellet, or tablet in a holding chamber or reservoir, such as a hard gelatin capsule. Each type (population) may be uniquely different from the other in the manner or rate it releases the drug. Our IntelliPellets™ technology is designed to control, prolong, delay or modify the release of drugs. It is particularly useful for the delivery of multiple drugs, for delayed, timed, pulsed or for chronotherapeutic drug delivery, designed to mimic our internal clocks for therapeutic optimization (the drug is delivered in the right amount for the patient at the right time). This technology is most useful for the delivery of multiple-drug cocktails, or in situations where the timing of a single dose or the sequencing of multiple doses of the same drug is important.
IntelliShuttle™
The IntelliShuttle™ technology provides for drug release past the stomach, such as for drugs required for action beyond the stomach, for drugs which could be destroyed by the stomach environment, or for drugs which could harm the stomach itself. This technology “shuttles” the drug past the stomach to be released at predetermined times or sites where appropriate for optimum therapeutic effect. This technology is most useful for acid labile drug molecules (drugs that are destroyed in acid environment), such as the proton pump inhibitors, of which well-known omeprazole (Prilosec) and lansoprazole (Prevacid) are examples, or for drug molecules which may harm the stomach, of which the well-known aspirin is an example.
Each of the above-noted proprietary technologies was fully developed and ready for application to client drug delivery requirements from the date of our inception. Each of them has been utilized and applied to client drug delivery requirements under our existing and previous development contracts; in several instances more than one technology has been applied to a single drug development. We continue to develop all of our existing technologies and to conduct the necessary research to develop new products and technologies.
Our Products and Product Candidates
The table below shows the present status of our ANDA, ANDS and NDA products and product candidates that have been disclosed to the public.
| Generic name | Brand | Indication | Stage of Development(1) | Regulatory Pathway | Market Size (in millions)(2) | Rights(3) |
| Dexmethylphenidate hydrochloride extended-release capsules | Focalin XR® | Attention deficit hyperactivity disorder | Received final approval for 5, 10, FDA(4) | ANDA | Intellipharmaceutics and Par | |
| Levetiracetam extended-release tablets | Keppra XR® | Partial onset seizures for epilepsy | Received final approval for the 500 and 750 mg strengths from FDA | ANDA | Intellipharmaceutics | |
| Venlafaxine hydrochloride extended-release capsules | Effexor XR® | Depression | ANDA application for commercialization approval for 3 strengths under review by FDA | ANDA | Intellipharmaceutics | |
| Pantoprazole sodium delayed- release tablets | Protonix® | Conditions associated with gastroesophageal reflux disease | ANDA application for commercialization approval for 2 strengths under review by FDA | ANDA | Intellipharmaceutics | |
Metformin hydrochloride extended-release tablets | Glucophage® XR | Management of type 2 diabetes | Received final approval for 500 and 750 mg strengths from FDA | ANDA | $ (500 and 750 mg only) | Intellipharmaceutics |
| Quetiapine fumarate extended-release tablets | Seroquel XR® | Schizophrenia, bipolar disorder & major depressive disorder | Received | ANDA ANDS | Intellipharmaceutics and Mallinckrodt | |
| Lamotrigine extended-release tablets | Lamictal® XR™ | Anti-convulsant for epilepsy | ANDA application for commercialization approval for 6 strengths under review by FDA | ANDA | Intellipharmaceutics and Mallinckrodt | |
| Desvenlafaxine extended-release tablets | Pristiq® | Depression | ANDA application for commercialization approval for 2 strengths under review by FDA | ANDA | Intellipharmaceutics and Mallinckrodt | |
| Trazodone hydrochloride extended release tablets | Depression | ANDA application for commercialization approval for 2 strengths under review by FDA | ANDA | Intellipharmaceutics | ||
| Carvedilol phosphate extended-release capsules | Coreg CR® | Heart failure, hypertension | Late-stage development | ANDA | Intellipharmaceutics | |
| Oxycodone hydrochloride controlled-release capsules | OxyContin® | Pain | NDA application accepted February 2017 and under review by | NDA 505(b)(2) | Intellipharmaceutics | |
| Pregabalin extended-release capsules | Lyrica® | Neuropathic pain | Investigational New Drug (“IND”) application submitted in August 2015 | NDA 505(b)(2) | Intellipharmaceutics | |
| Ranolazine extended-release tablets | Ranexa® | Chronic angina | ANDA application for commercialization approval for 2 strengths under review by FDA | ANDA | Intellipharmaceutics |
Notes:
(1)
There can be no assurance as to when, or if at all, the FDA or Health Canada will approve any product candidate for sale in the U.S. or Canadian markets.
(2)
Represents sales for all strengths, unless otherwise noted, for the 12 months ended January 20172018 in the U.S., including sales of generics in TRx MBS Dollars, which represents projected new and refilled prescriptions representing a standardized dollar metric based on manufacturer’s published catalog or list prices to wholesalers, and does not represent actual transaction prices and does not include prompt pay or other discounts, rebates or reductions in price. Source: Symphony Health Solutions.Solutions Corporation. The information attributed to Symphony Health Solutions Corporation herein is provided as is, and Symphony makes no representation and/or warranty of any kind, including but not limited to, the accuracy and/or completeness of such information.
(3)
For unpartnered products, we are exploring licensing agreement opportunities or other forms of distribution. While we believe that licensing agreements are possible, there can be no assurance that any can be secured.
(4)
Includes a Company ANDA final approval for our 15 and 30 mg strengths, and a Par ANDA final approval for their 5, 10, 15, 20, 25, 30, 35 and 40 mg strengths. Profit sharing payments to us under the Par agreement are the same irrespective of the ANDA owner.
We typically select products for development that we anticipate could achieve FDA or Health Canada approval for commercial sales several years in the future. However, the length of time necessary to bring a product to the point where the product can be commercialized can vary significantly and depends on, among other things,
the availability of funding, design and formulation challenges, safety or efficacy, patent issues associated with the product, and FDA and Health Canada review times.
Dexmethylphenidate Hydrochloride – Generic Focalin XR®XR® (a registered trademark of the brand manufacturer)
Dexmethylphenidate hydrochloride, a Schedule II restricted product (drugs with a high potential for abuse) in the U.S., is indicated for the treatment of attention deficit hyperactivity disorder. In November 2005, we entered into the Par agreement,, pursuant to which we granted Par an exclusive, royalty-free license to make and distribute in the U.S. all of our FDA approved strengths of our generic Focalin XR® (dexmethylphenidate hydrochloride extended-release)XR® capsules for a period of 10 years from the date of commercial launch (which was November 19, 2013). Under the Par agreement, we made a filing with the FDA for approval to market generic Focalin XR® capsules in various strengths in the U.S. (the “Company ANDA”), and are the owner of that Company ANDA, as approved in part by the FDA. We retain the right to make and distribute all strengths of the generic product outside of the U.S. Calendar quarterly profit-sharing payments for its U.S. sales under the Company ANDAof all strengths of generic Focalin XR® are payable by Par to us as calculated pursuant to the Par agreement. Within the purview of the Par agreement, Par also applied for and owns an ANDA pertaining to all marketed strengths of generic Focalin XR® (the “Par ANDA”), and is now approved by the FDA, to market generic Focalin XR® capsules in all marketed strengths in the U.S. As with the Company ANDA, calendar quarterly profit-sharing payments are payable by Par to us for its U.S. sales of generic Focalin XR® under the Par ANDA as calculated pursuant to the Par agreement.
We received final approval from the FDA in November 2013 under the Company ANDA to launch the 15 and 30 mg strengths of our generic Focalin XR® (dexmethylphenidate hydrochloride extended-release)XR® capsules. Commercial sales of these strengths were launched immediately by our commercialization partner in the U.S., Par. Our 5, 10, 20 and 40 mg strengths were also then tentatively FDA approved, subject to the right of Teva to 180 days of generic exclusivity from the date of first launch of such products. Teva launched its own 5, 10, 20 and 40 mg strengths of generic Focalin XR® capsules on November 11, 2014, February 2, 2015, June 22, 2015 and November 19, 2013, respectively. In January 2017, Par launched the 25 and 35 mg strengths of its generic Focalin XR®XR® capsules in the U.S., and in May 2017, Par launched the 10 and 20 mg strengths, complementing the 15 and 30 mg strengths of our generic Focalin XR® currentlyXR® marketed by Par. The FDA recently had granted final approval underIn November 2017, Par launched the Par ANDA for its generic Focalin XR® capsules in theremaining 5 10, 15, 20, 25, 30, 35 and 40 mg strengths. We believe Par is preparing to launch allstrengths providing us with the remaining strengths in the first half of 2017. As the first filer of an ANDA for generic Focalin XR® in the 25 and 35 mg strengths, Par has 180 days of U.S. generic marketing exclusivity for those strengths. We expect sales of the 25 and 35 mg strength to significantly improve our revenues in 2017. Under the Par agreement, we receive quarterly profit share payments on Par’s U.S. salesfull line of generic Focalin XR®. There can be no assurance as to when or if any further launches will occur forXR® strengths available in the remaining strengths, or if they will be successfully commercialized.U.S. market.
Levetiracetam – Generic Keppra XR®XR® (a registered trademark of the brand manufacturer)
We received final approval from the FDA in February 2016 for the 500 mg and 750 mg strengths of our generic Keppra XR®XR® (levetiracetam extended-release) tablets. Keppra XR®XR®, and the drug active levetiracetam, are indicated for use in the treatment of partial onset seizures associated with epilepsy. We are aware that several other generic versions of this product are currently available and serve to limit the overall market opportunity. We are actively exploring the best approach to maximize the commercial returns from the newthis approval. There can be no assurance that the Company'sour generic Keppra XR®XR® for the 500 and 750 mg strengths will be successfully commercialized.
Metformin hydrochloride – Glucophage®–Glucophage® XR (a registered trademark of the brand manufacturer)
We received final approval from the FDA in February 2017 for the 500 mg and 750 mg strengths of our generic Glucophage®Glucophage® XR (metformin hydrochloride extended release) tablets. Glucophage®Glucophage® XR, and the drug active metformin, are indicated for use in the management of type 2 diabetes treatment. We are actively evaluatingaware that several other generic versions of this product are currently available and serve to limit the overall market opportunity. We are continuing to evaluate options to realize commercial returns from this new approval. There can be no assurance that our metformin extended-release tablets for the 500 mg and 750 mg strengths will be successfully commercialized.
One of our non-generic products under development is our Rexista™ (abuse deterrent oxycodone hydrochloride extended release tablets)Oxycodone ER product candidate, intended as an abuse- and alcohol-deterrent controlled-release oral formulation of oxycodone hydrochloride for the relief of pain. Rexista™Our Oxycodone ER is a new drug candidate, with a
unique long acting oral formulation of oxycodone intended to treat moderate-to-severe pain when a continuous, around the clock opioid analgesic is needed for an extended period of time. The formulation is intended to present a significant barrier to tampering when subjected to various forms of physical and chemical manipulation commonly used by abusers. It is also designed to prevent dose dumping when inadvertently co-administered with alcohol. Dose dumping is the rapid release of an active ingredient from a controlled-release drug into the blood stream that can result in increased toxicity, side effects, and a loss of efficacy. Dose dumping can result by consuming the drug through crushing, taking with alcohol, extracting with other beverages, vaporizing or injecting. In addition, when crushed or pulverized and hydrated, the proposed extended release formulation is designed to coagulate instantaneously and entrap the drug in a viscous hydrogel, which is intended to prevent syringing, injecting and snorting. Our Rexista™Oxycodone ER formulation is difficult to abuse through the application of heat or an open flame, making it difficult to inhale the active ingredient from burning. Our Rexista™ formulation contains a blue dye that is emitted once the tablet is tampered with or crushed. This stigmatizing blue dye may act as a deterrent if abused orally or via the intra-nasal route and may also serve as an early warning mechanism to flag potential misuse or abuse.
In March 2015, we announced the results of three definitive open label, blinded, randomized, cross-over, Phase I pharmacokinetic clinical trials in which Rexista™our Oxycodone ER was compared to the existing branded drug Oxycontin®OxyContin® under single dose fasting, single dose steady-state fasting and single dose fed conditions in healthy volunteers. We had reported that the results from all three studies showed that Rexista™Oxycodone ER met the bioequivalence criteria (90% confidence interval of 80% to 125%) for all matrices, i.e., on the measure of maximum plasma concentration or Cmax, on the measure of area under the curve time (AUCt) and on the measure of area under the curve infinity (AUCinf)(AUCinf).
In May 2015, the FDA provided us with notification regarding our IND submission for Rexista™Oxycodone ER indicating that we would not be required to conduct Phase III studies if bioequivalence to Oxycontin®OxyContin® was demonstrated based on pivotal bioequivalence studies.
In January 2016, we announced that pivotal bioequivalence trials of our Rexista™,Oxycodone ER, dosed under fasted and fed conditions, had demonstrated bioequivalence to Oxycontin® (oxycodone hydrochloride)OxyContin® extended release tablets as manufactured and sold in the U.S. by Purdue Pharma LP.L.P. The study design was based on FDA recommendations and compared the lowest and highest strengths of exhibit batches of our Rexista™Oxycodone ER to the same strengths of Oxycontin®OxyContin®. The results show that the ratios of the pharmacokinetic metrics, Cmax, AUC0-tAUC0-t and AUC0-fAUC0-f for Rexista™Oxycodone ER vs. Oxycontin®OxyContin®, are within the interval of 80% - 125% required by the FDA with a confidence level exceeding 90%.
In July 2016, we announced the results of a food effect study conducted on our behalf for Rexista™.Oxycodone ER. The study design was a randomized, one-treatment two periods, two sequences, crossover, open label, laboratory-blind bioavailability study for Rexista™Oxycodone ER following a single 80 mg oral dose to healthy adults under fasting and fed conditions. The study showed that Rexista™Oxycodone ER can be administered with or without a meal (i.e., no food effect). Rexista™Oxycodone ER met the bioequivalence criteria (90% confidence interval of 80% to 125%) for all matrices, involving maximum plasma concentration and area under the curve (i.e., Cmax ratio of Rexista™Oxycodone ER taken under fasted conditions to fed conditions, and AUC metrics taken under fasted conditions to fed conditions). We believe that Rexista™Oxycodone ER is well differentiated from currently marketed oral oxycodone extended release products.
In November 2016, we filed an NDA seeking authorization to market our Rexista™ (abuse-deterrent oxycodone hydrochloride extended release tablets)Oxycodone ER in the 10, 15, 20, 30, 40, 60 and 80 mg strengths.strengths, relying on the 505(b)(2) regulatory pathway which allowed us to reference data from Purdue Pharma L.P.’s file for its OxyContin®. In February 2017, the FDA accepted for filing this NDA. The FDA hasour NDA and set a Prescription Drug User Fee Act (“PDUFA”) target action date of September 25, 2017.
Our NDA was filed under Paragraph IV of the Hatch-Waxman Act, as amended. TheWe certified to the FDA has accepted the filing for further review. We have, within the period provided in Paragraph IV, notified the brand owner of Oxycontin®, and all holdersthat we believed that our Oxycodone ER product candidate would not infringe any of the OxycontinOxyContin® patents listed in the Orange Book, that we have filed an NDA with the FDA for marketing approval for Rexista™, and have certified that Rexista™ would not infringe the Oxycontin® patents or that the Oxycontin®such patents are invalid. This notice may give rise, within a prescribed time of 45 days, to patent infringement litigation against us by the owner of the branded product Oxycontin®invalid, and by theso notified all holders of the Oxycontin®subject patents of such certification. On April 7, 2017, we received notice that the Purdue litigation plaintiffs had commenced patent infringement proceedings against us in the U.S. District Court for the District of Delaware in respect of our NDA filing for Oxycodone ER, alleging that our Oxycodone ER product infringes six (6) out of the sixteen (16) patents. IfThe complaint seeks injunctive relief as well as attorneys’ fees and costs and such litigation is instituted withinother and further relief as the prescribed time limits,Court may deem just and proper. An answer and counterclaim have been filed. As a result of the commencement of these legal proceedings, the FDA will beis stayed for 30 months from the date of such notice from granting final marketing approval to us for Rexista™,our Oxycodone ER product candidate. That time period commenced on February 24, 2017, when the Purdue litigation plaintiffs received notice of our certification concerning the patents, and will expire on August 24, 2019, unless prior to the expiry of such 30 months all parties settle the litigation in such way as to permit the marketing of Rexista™ (if then approved), or therestay is earlier terminated by a final decisiondeclaration of the courts that either the Oxycontin®patents wereare invalid, or are not validinfringed, or the matter is otherwise settled among the parties. A trial date for the Purdue litigation has been set for October 22, 2018. We are confident that Rexista™ didwe do not infringe the Oxycontin®subject patents, and will vigorously defend against these claims. patents.
In June 2017, we announced that a FDA Advisory Committees meeting was scheduled for July 26, 2017 to review our NDA for Oxycodone ER. The submission requested that our Oxycodone ER product candidate include product label claims to support the inclusion of language regarding abuse-deterrent properties for the intravenous route of administration.
In July 2017, we announced that the FDA Advisory Committees voted 22 to 1 in finding that our NDA for Oxycodone ER should not be approved at this time. The Advisory Committees also voted 19 to 4 that the Company had not demonstrated that Oxycodone ER has properties that can be expected to deter abuse by the intravenous route of administration, and 23 to 0 that there was not sufficient data for Oxycodone ER to support inclusion of language regarding abuse-deterrent properties in the product label for the intravenous route of administration. The Advisory Committees expressed a desire to review the additional safety and efficacy data for Oxycodone ER that may be obtained from human abuse potential studies for the oral and intranasal routes of administration.
In September 2017, we received a CRL from the FDA for the Oxycodone ER NDA. In its CRL, the FDA provided certain recommendations and requests for information, including that we complete Category 2 and Category 3 studies to assess the abuse-deterrent properties of Oxycodone ER by the oral and nasal routes of administration. The FDA also requested additional information related to the inclusion of the blue dye in the Oxycodone ER formulation, which is intended to deter abuse. The FDA also requested that we submit an alternate proposed proprietary name for Oxycodone ER. The FDA determined that it could not approve the application in its present form. We were given one year from September 2017 to respond to the CRL, and can request additional time if necessary.
The FDA is actively developing a regulatory program for the narcotic analgesic class of products. In April 2015, the FDA issued a guidance document, “Abuse-Deterrent Opioids –— Evaluation and Labeling,” to assist the industry in developing new formulations of opioid drugs with abuse-deterrent properties. We adhered to the April 2015 guidance document in pursuing various abuse deterrent label claims when we filed our NDA for Rexista™Oxycodone ER.
In February 2018, we and the FDA discussed the above-referenced CRL for Oxycodone ER, including issues related to the blue dye in the product candidate. Based on the meeting, the product candidate will no longer include the blue dye. The blue dye was intended to act as an additional deterrent if Oxycodone ER is abused and serve as an early warning mechanism to flag potential misuse or abuse. The FDA confirmed that the removal of the blue dye is unlikely to have any impact on formulation quality and performance. As a result, we can leverage our core competencieswill not be required to repeat in drug deliveryvivo bioequivalence studies and formulation forpharmacokinetic studies submitted in the development of products targeted towards abuse-deterrent opioid analgesics used in pain management.Oxycodone ER NDA. The advantage of our strategy for development of NDA drugs isFDA also indicated that, our products, if approved for sale, may enjoy a sales exclusivity period. Furthermore, it mayfrom an abuse liability perspective, Category 1 studies will not have to be possible to establish and defendrepeated on Oxycodone ER with the intellectual property surrounding our tamper-deterrent opioid analgesic products.blue dye removed.
There can be no assurance that the studies will be adequate, that we will not be required to conduct further studies for Rexista™,Oxycodone ER, that the FDA will approve any of our requested abuse-deterrence label claims or that the FDA will ultimately approve our NDA for the sale of Rexista™Oxycodone ER in the U.S. market, or that it will ever be successfully commercialized.
Quetiapine fumarate extended-release tablets -– Generic Seroquel XR®XR® (a(a registered trademark of the brand manufacturer)
In October 2016, we received tentative approval from the FDA for our ANDA for quetiapine fumarate extended-release tablets in the 50, 150, 200, 300 and 400 mg strengths, and in May 2017, our ANDA received final FDA approval for all of these strengths. Our tentatively-approvedapproved product is a generic equivalent for the corresponding strengths of the branded product Seroquel XR® sold in the U.S. by AstraZeneca. Pursuant to a settlement agreement between us and AstraZeneca dated July 30, 2012, we arewere permitted to launch our generic versions of the 50, 150, 200, 300 and 400 mg strengths of generic Seroquel XR®, on November 1, 2016, subject to FDA final approval of our ANDA for those strengths. SuchOur final FDA final approval is subject to afollowed the expiry of 180 day exclusivity period relatingperiods granted to a prior filer orthe first filers of a generic equivalent ofequivalents to the branded product. The first filer rights areproduct, which were shared by Par and Accord. Accord Healthcare.
We believe that in early November 2016, Par launched the 50, 100, 200,manufactured and 300 mg strengths, and Accord launched the 400 mg strength. If we receive final approval to launch our generic versionshipped commercial quantities of the 50, 100, 200, 300, and 400 mgall strengths of generic Seroquel XR® six months after the date of launch by the respective first filers, we andto our marketing and distribution partner for generic Seroquel XR®Mallinckrodt, and Mallinckrodt launched all strengths in the U.S., Mallinckrodt, are working diligently towards a launch of these strengths upon final approval. There can be no assurance that our quetiapine fumarate extended-release tablets in any of the 50, 150, 200, 300 and 400 mg strengths will receive final FDA approval, or if approved, that they will be successfully commercialized.June 2017.
Regabatin™ XR (Pregabalin(Pregabalin Extended-Release)
Another Intellipharmaceutics non-generic controlled-release product under development is Regabatin™ XR, pregabalin extended-release capsules. Pregabalin is indicated for the management of neuropathic pain associated with diabetic peripheral neuropathy, postherpetic neuralgia, spinal cord injury and fibromyalgia. A controlled-release version of pregabalin should reduce the number of doses patients take, which could improve patient compliance, and therefore possibly enhance clinical outcomes. Lyrica®Lyrica® pregabalin, twice-a-day (“BID”) dosage and three-times-a-day (“TID”) dosage, are drug products marketed in the U.S. by Pfizer Inc. There is no controlled-release formulation on the market at this time. AIn October 2017, Pfizer also received approval for a Lyrica CR, a controlled-release version of pregabalin should reduce the number of doses patients take, potentially improving patient compliance, and therefore potentially improving clinical outcomes.pregabalin.
In 2014, we conducted and analyzed the results of six Phase I clinical trials involving a twice-a-day formulation and a once-a-day formulation. For formulations directed to certain indications which include fibromyalgia, the results suggested that Regabatin™ XR 82.5 mg BID dosage was comparable in bioavailability to Lyrica®Lyrica® 50 mg (immediate-release pregabalin) TID dosage. For formulations directed to certain other indications which include neuropathic pain associated with diabetic peripheral neuropathy, the results suggested that Regabatin™ XR 165 mg once-a-day dosage was comparable in bioavailability to Lyrica®Lyrica® 75 mg BID dosage.
In March 2015, the FDA accepted a Pre-Investigational New Drug (“Pre-IND”) meeting request for our once-a-day Regabatin™ XR non-generic controlled release version of pregabalin under the NDA 505(b)(2) regulatory pathway, with a view to possible commercialization in the U.S. at some time following the December 30, 2018 expiry of the patent covering the pregabalin molecule. Regabatin™ XR is based on our controlled release drug delivery technology platform which utilizes the symptomatology and chronobiology of fibromyalgia in a formulation intended to provide a higher exposure of pregabalin during the first 12 hours of dosing. Based on positive feedback and guidance from the FDA, we submitted an IND application for Regabatin™ XR in August 2015. The FDA completed its review of the IND application and provided constructive input that we will use towards further development of the program. We believe our product candidate has significant additional benefits to existing treatments and are currently evaluating strategic options to advance this opportunity.
There can be no assurance that any additional Phase I or other clinical trials we conduct will meet our expectations, that we will have sufficient capital to conduct such trials, that we will be successful in submitting an NDA 505(b)(2) filing with the FDA, that the FDA will approve this product candidate for sale in the U.S. market, or that it will ever be successfully commercialized.
Other Potential Products and Markets
We continue efforts to identify opportunities overseas, including in China that could if effectuated provide product distribution alternatives through partnerships and therefore would not likely require an investment or asset acquisition by us. We recently visited China where discussions toward establishing a partnership to facilitate future development activities are ongoing. We have not at this time entered into and may not ever enter into any such arrangements. These opportunities could potentially involve out-licensing of our products, third-party manufacturing supply and more efficient access to pharmaceutical ingredients and therefore assist with the development of our product pipeline.
COMPETITIVE ENVIRONMENT
We are engaged in a business characterized by extensive research efforts, rapid technological developments and intense competition. Our competitors include medical technology, pharmaceutical, biotechnology and other companies, universities and research institutions. All of these competitors currently engage in, have engaged in or may engage in the future, in development, manufacturing, marketing and commercialization of new pharmaceuticals and existing pharmaceuticals, some of which may compete with our present or future products and product candidates.
Our drug delivery technologies may compete with existing drug delivery technologies, as well as new drug delivery technologies that may be developed or commercialized in the future. Any of these drugs and drug delivery technologies may receive government approval or gain market acceptance more rapidly than our products and product candidates. As a result, our products and product candidates may become non-competitive or obsolete.
We believe that our ability to successfully compete will depend on, among other things, the efficacy, safety and reliability of our products and product candidates, the timing and scope of regulatory approval, the speed at which we develop product candidates, our, or our commercialization partners’, ability to manufacture and sell commercial quantities of a product to the market, product acceptance by physicians and other professional healthcare providers, the quality and breadth of our technologies, the skills of our employees and our ability to recruit and retain skilled employees, the protection of our intellectual property, and the availability of substantial capital resources to fund development and commercialization activities.
MANUFACTURING
We have internal manufacturing capabilities consisting of current Good Laboratory Practices (“cGLP”) research laboratories and a cGMP manufacturing plant for solid oral dosage forms at our 30 Worcester Road facility in Toronto. Raw materials used in manufacturing our products are available from a number of commercial sources and the prices for such raw materials are generally not particularly volatile. In October 2014, the FDA provided us with written notification that our Toronto, Canada manufacturing facility at 30 Worcester Road had received an “acceptable” classification. Such inspections are carried out on a regular basis by the FDA and an “acceptable” classification is necessary to permit
us to be in a position to receive final approvals for ANDAs and NDAs and to permit manufacturing of drug products intended for commercial sales in the United States after any such approvals. Similarly, Health Canada completed an inspection of our 30 Worcester Road facility in September 2015 which resulted in a “compliant” rating. Once we have completed certain renovations to our newly-leased property at 22 Worcester Road property (see “D. Property, Plant and Equipment”, below for a further description of our facilities), we would request an inspection by regulatory agencies which will determine compliance of the facility with cGMP.
INTELLECTUAL PROPERTY
Proprietary rights are an important aspect of our business. These include know-how, trade secrets and patents. Know-how and trade secrets are protected by internal company policies and operating procedures, and where necessary, by contractual provisions with development partners and suppliers. We also seek patent protection for inventive advances which form the bases of our drug delivery technologies. With respect to particular products, we may seek patent protection on the commercial composition, our methods of production and our uses, to prevent the unauthorized marketing and sale of competitive products.
Patents which relate to and protect various aspects of our HypermatrixTM family of drug delivery technologies include the following United States, Japanese, Chinese, Indian, Canadian and European patents which have been issued to us:
| Country | Issue Date | Issue No. | Title |
| U.S.A. | October 31, 2017 | 9,801,939 | Compositions and Methods For Reducing Overdose |
| U.S.A. | July 11, 2017 | 9,700,516 | Compositions and Methods For Reducing Overdose |
| U.S.A. | July 11, 2017 | 9,700,515 | Compositions and Methods For Reducing Overdose |
| U.S.A. | Dec 20, 2016 | 9,522,119 | Compositions and Methods For Reducing Overdose |
| U.S.A. | July 14, 2015 | 9,078,827 | Pharmaceutical Composition Having Reduced Abuse Potential |
| U.S.A. | Aug 12, 2014 | 8,802,139 | Proton Pump-Inhibitor-Containing Capsules Which Comprise Subunits Differently Structured For A Delayed Release Of The Active Ingredient |
| U.S.A. | Dec 10, 2013 | 8,603,520 | Oral Multi-functional Pharmaceutical Capsule Preparations of Proton Pump Inhibitors |
| U.S.A. | Mar 12, 2013 | 8,394,409 | Controlled Extended Drug Release Technology |
| U.S.A. | Mar 15, 2011 | 7,906,143 | Controlled Release Pharmaceutical Delivery Device and Process for Preparation Thereof |
| U.S.A. | Dec 28, 2010 | 7,858,119 | Extended Release Pharmaceuticals |
| U.S.A. | Aug 15, 2006 | 7,090,867 | Novel Controlled Release Delivery Device for Pharmaceutical Agents Incorporating Microbial Gum |
| U.S.A. | Oct 5, 2004 | 6,800,668 | Syntactic Deformable Foam Compositions and Methods for Making |
| U.S.A. | Nov 25, 2003 | 6,652,882 | Controlled Release Formulation Containing Bupropion |
| U.S.A. | Aug 19, 2003 | 6,607,751 | Novel Controlled Release Delivery Device for Pharmaceutical Agents Incorporating Microbial Gum |
| U.S.A. | Nov 12, 2002 | 6,479,075 | Pharmaceutical Formulations for Acid Labile Substances |
| U.S.A. | Oct 2, 2001 | 6,296,876 | Pharmaceutical Formulations for Acid Labile Substances |
| Japan | Aug 28, 2015 | 5,798,293 | Pharmaceutical Composition Having Reduced Abuse Potential |
| Japan | Jan 17, 2014 | 5,457,830 | Controlled Release Delivery Device Comprising An Organosol Coat |
| Japan | Aug 8, 2014 | 5,592,547 | Drug Delivery Composition |
| Japan | Aug 30, 2013 | 5,349,290 | Drug Delivery Composition |
| India | Feb 10, 2015 | 265,141 | Pharmaceutical Composition Having Reduced Abuse Potential |
| Europe | Nov 26, 2014 | 2,007,360 | Controlled Release Delivery Device Comprising an Organosol Coat |
| Canada | May 26, 2015 | 2,579,382 | Controlled Release Composition Using Transition Coating, And Method Of Preparing Same |
| Canada | Jan 28, 2014 | 2,571,897 | Controlled Extended Drug Release Technology |
| Canada | Apr 8, 2014 | 2,576,556 | Disintegrant Assisted Controlled Release Technology |
| Canada | Mar 11, 2014 | 2,648,280 | Controlled Release Delivery Device Comprising an Organosol Coat |
| Canada | Jun 19, 2012 | 2,626,558 | Pharmaceutical Composition having Reduced Abuse Potential |
| Canada | Sep 25, 2012 | 2,529,984 | Oral Multi-Functional Pharmaceutical Capsule Preparations of Proton Pump Inhibitors |
| Canada | Feb 22, 2011 | 2,459,857 | Combinatorial Type Controlled Release Drug Delivery Device |
| Canada | Mar 15, 2005 | 2,435,276 | Syntactic Deformable Foam Compositions and Methods for Making |
| Canada | Nov 29, 2016 | 2,910,865 | Compositions and Methods For Reducing Overdose |
| China | May 11, 2016 | ZL200780019665.5 | Drug Delivery Composition |
| China | Nov 25, 2015 | ZL200780025611.X | Pharmaceutical Composition Having Reduced Abuse Potential |
In addition to these issued patents, we have several U.S. patent applications, and corresponding foreign applications pending, including Patent Cooperation Treaty - national stage processing and entry applications, relating to various aspects of our HyperMatrixTM drug delivery technologies, including methods and compositions for coating of tablets and beads, compositions incorporating disintegrants to assist in controlled release, compositions incorporating multiple drug actives, and compositions directed to classes of drug actives designed as therapies for specific indications and compositions intended to enhance deterrence of willful abuse of narcotic compositions.
REGULATORY REQUIREMENTS
We focus on the development of both branded drug products (which require NDAs) and generic drug products (which require ANDAs). The research and development, manufacture and marketing of controlled-release pharmaceuticals are subject to regulation by U.S., Canadian and other governmental authorities and agencies. Such national agencies and other federal, state, provincial and local entities regulate the testing, manufacturing, safety and promotion of our products. The regulations applicable to our products may change as the currently limited number of approved controlled-release products increases and regulators acquire additional experience in this area.
United States Regulation
New Drug Application
We will be required by the FDA to comply with NDA procedures for our branded products prior to commencement of marketing by us or our licensees. New drug compounds and new formulations for existing drug compounds which cannot be filed as ANDAs, but follow a 505(b)(2) regulatory pathway, are subject to NDA procedures.
These procedures for a new drug compound include (a) preclinical laboratory and animal toxicology tests; (b) scaling and testing of production batches; (c) submission of an IND, and subsequent approval is required before any human clinical trials can commence; (d) adequate and well controlled replicate human clinical trials to establish the safety and efficacy of the drug for its intended indication; (e) the submission of an NDA to the FDA; and (f) FDA approval of an NDA prior to any commercial sale or shipment of the product, including pre-approval and post-approval inspections of our manufacturing and testing facilities. If all of this data in the product application is owned by the applicant, the FDA will issue its approval without regard to patent rights that might be infringed or exclusivity periods that would affect the FDA’s ability to grant an approval if the application relied upon data which the applicant did not own.
Preclinical laboratory and animal toxicology tests may have to be performed to assess the safety and potential efficacy of the product. The results of these preclinical tests, together with information regarding the methods of manufacture of the products and quality control testing, are then submitted to the FDA as part of an IND requesting authorization to initiate human clinical trials. Once the IND notice period has expired, clinical trials may be initiated, unless an FDA hold on clinical trials has been issued.
A new formulation for an existing drug compound requires a 505(b)(2) application. This application contains full reports of investigations of safety and effectiveness but at least some information required for approval comes from studies not conducted by or for the applicant for which the applicant has not obtained a right of reference. A 505(b)(2) application is submitted when some specific information necessary for approval is obtained from: (1) published literature and/or (2) the FDA findings of safety and effectiveness for an approved drug. The FDA has implemented this approach to encourage innovation in drug development without requiring duplicative studies while protecting the patent and exclusivity rights for the approved drug. A 505(b)(2) application can be submitted for a New Chemical Entity, a New Molecular Entity or any changes to previously approved drugs such as dosage form, strength, route of administration, formulation, indication, or bioinequivalence where the application may rely on the FDA’s finding on safety and effectiveness of the previously approved drug. In addition, the applicant may also submit a 505(b)(2) application for a change in drug product that is eligible for consideration pursuant to a suitability petition. For example, a 505(b)(2) application would be appropriate for a controlled-release product that is bioinequivalent to a reference listed drug where the proposed
product is at least as bioavailable and the pattern of release is at least as favorable as the approved pharmaceutically equivalent product. A 505(b)(2) application may be granted three years of exclusivity if one or more clinical investigations, other than bioavailability/bioequivalence studies, was essential to the approval and conducted or sponsored by the applicant; five years of exclusivity granted if it is for a new chemical entity. A 505(b)(2) application may also be eligible for orphan drug and pediatric exclusivity.
A 505(b)(2) application must contain the following: (1) identification of those portions of the application that rely on the information the applicant does not have a right of reference, (2) identification of any or all listed drugs by established name, proprietary name, dosage form, strength, route of administration, name of the listed drug’s sponsor, and the application number if application relies on the FDA’s previous findings of safety and effectiveness for a listed drug, (3) information with respect to any patents that claim the drug or the use of the drug for which approval is sought, (4) patent certifications or statement with respect to any relevant patents that claim the listed drug, (5) if approval for a new indication, and not for the indications approved for the listed drug, a certification so stating, (6) a statement as to whether the listed drug has received a period of marketing exclusivity, (7) Bioavailability/Bioequivalence studies comparing the proposed product to the listed drug (if any) and (8) studies necessary to support the change or modification from the listed drugs or drugs (if any). Before submitting the application, the applicant should submit a plan to identify the types of bridging studies that should be conducted and also the components of application that rely on the FDA’s findings of safety and effectiveness of a previously approved drug product. We intend to generate all data necessary to support FDA approval of the applications we
file. A 505(b)(2) application must provide notice of certain patent certifications to the NDA holder and patent owner, and approval may be delayed due to patent or exclusivity protections covering an approved product.
Clinical trials involve the administration of a pharmaceutical product to individuals under the supervision of qualified medical investigators who are experienced in conducting studies under “Good Clinical Practice” guidelines. Clinical studies are conducted in accordance with protocols that detail the objectives of a study, the parameters to be used to monitor safety and the efficacy criteria to be evaluated. Each protocol is submitted to the FDA and to an Institutional Review Board prior to the commencement of each clinical trial. Clinical studies are typically conducted in three sequential phases, which may overlap. In Phase I, the initial introduction of the product into human subjects, the compound is tested for absorption, safety, dosage, tolerance, metabolic interaction, distribution, and excretion. Phase II involves studies in a limited patient population with the disease to be treated to (1) determine the efficacy of the product for specific targeted indications, (2) determine optimal dosage and (3) identify possible adverse effects and safety risks. In the event Phase II evaluations demonstrate that a pharmaceutical product is effective and has an acceptable safety profile, Phase III clinical trials are undertaken to further evaluate clinical efficacy of the product and to further test its safety within an expanded patient population at geographically dispersed clinical study sites. Periodic reports on the clinical investigations are required.
We, or the FDA, may suspend clinical trials at any time if either party believes the clinical subjects are being exposed to unacceptable health risks. The results of the product development, analytical laboratory studies and clinical studies are submitted to the FDA as part of an NDA for approval of the marketing and commercialization of a pharmaceutical product.
Abbreviated New Drug Application
In certain cases, where the objective is to develop a generic version of an approved product already on the market in controlled-release dosages, an ANDA may be filed in lieu of filing an NDA. Under the ANDA procedure, the FDA waives the requirement to submit complete reports of preclinical and clinical studies of safety and efficacy and instead requires the submission of bioequivalency data, that is, demonstration that the generic drug produces the same effect in the body as its brand-name counterpart and has the same pharmacokinetic profile, or change in blood concentration over time. The ANDA procedure is available to us for a generic version of a drug product approved by the FDA. In certain cases, an ANDA applicant may submit a suitability petition to the FDA requesting permission to submit an ANDA for a drug product that differs from a previously approved reference drug product (the “Listed Drug”) when the change is one authorized by statute. Permitted variations from the Listed Drug include changes in: (1) route of administration, (2) dosage form, (3) strength and (4) one of the active ingredients of the Listed Drug when the Listed Drug is a combination product. The FDA must approve the petition before the ANDA may be submitted. An applicant is not permitted to petition for any other kinds of changes from Listed Drugs. The information in a suitability petition must demonstrate that the change from the Listed Drug requested for the proposed drug product may be adequately evaluated for approval without data from investigations to show the proposed drug product’s safety or effectiveness. The advantages of an ANDA over an NDA include reduced research and development costs associated with bringing a product to market, and generally a shorter review and approval time at the FDA.
GDUFA implemented substantial fees for new ANDAs, Drug Master Files, product and establishment fees and a one-time fee for back-logged ANDAs pending approval as of October 1, 2012. In return, the program is intended to provide faster and more predictable ANDA reviews by the FDA and more timely inspections of drug facilities. For the FDA’s fiscal years 2016 and 2017, respectively, the user fee rates are $76,030 and $70,480$70,480 for new ANDAs, $38,020$38,020 and $35,240 for Prior Approval Supplements, and $17,434$17,434 for each ANDA already on file at the FDA. For the FDA’s fiscal years 2016 and 2017, there is also an annual facility user fee of $258,905 and $273,646, respectively. Effective October 1, 2017, for the FDA’s fiscal year 2018, the FDA will charge an annual facility user fee of $226,087 plus a new general program fee of $159,079. Under GDUFA, generic product companies face significant penalties for failure to pay the new user fees, including rendering an ANDA not “substantially complete” until the fee is paid. It is currently uncertain the effect the new fees will have on our ANDA process and business. However, any failure by us or our suppliers to pay the fees or to comply with the other provisions of GDUFA may adversely impact or delay our ability to file ANDAs, obtain approvals for new generic products, generate revenues and thus may have a material adverse effect on our business, results of operations and financial condition.
Patent Certification and Exclusivity Issues
ANDAs and/or NDAs, filed under Paragraph IV of the Hatch Waxman Act, which seek approval by a non-brand owner to market a generic version of a branded drug product prior to the expiry of patents owned or listed in the Orange Book (the “Listed Patents”) as applicable to the brand owner’s product, are required to include certifications pursuant to Paragraph IV that either the Listed Patents are invalid or that the applicant’s drug product does not infringe the Listed Patents. In such circumstances, the owner of the branded drug and/or the holder of the patents may commence patent infringement litigation against the applicant. In such a case, the FDA is not empowered to approve such pending ANDA or NDA until the expiry of 30 months from the commencement of such litigation, unless within such 30 month period the said patents are found to be invalid, or the drug product covered by the ANDA or NDA is finally found by a court not to infringe such patents.
Under the U.S. Food, Drug and Cosmetic Act (“FDC Act”), the first filer of an ANDA (but not an NDA) with a “non-infringement” certification is entitled, if its drug product is approved, to receive 180 days of market exclusivity. Subsequent filers of generic products, if non-infringing and approved by the FDA, are entitled to market their products six months after the first commercial marketing of the first filer’s generic product. A company having FDA approval and permission from the original brand owner is able to market an authorized generic at any time. The 180-day exclusivity period can be forfeited if the first applicant withdraws its application or the FDA considers the application to have been withdrawn, the first applicant amends or withdraws Paragraph IV Certification for all patents qualifying for 180 day exclusivity, or the first applicant fails to obtain tentative approval within 30 months after the date filed, unless failure is due to a change in review requirements. The preservation of the 180 day exclusivity period related to the first-to-file status of a drug not approved within 30 months after the date filed, generally requires that an application be made to the FDA for extension of the time period where the delay has been due to a change in the review requirements for the drug. The approval of the continued first-to-file status in such circumstances is subject to the discretion of the FDA. There can be no assurance that the FDA would accede to such a request if made.
Patent expiration refers to expiry of U.S. patents (inclusive of any extensions) on drug compounds, formulations and uses. Patents outside the United States may differ from those in the United States. Under U.S. law, the expiration of a patent on a drug compound does not create a right to make, use or sell that compound. There may be additional patents relating to a person’s proposed manufacture, use or sale of a product that could potentially prohibit such person’s proposed commercialization of a drug compound.
The FDC Act contains other market exclusivity provisions that offer additional protection to pioneer drug products which are independent of any patent coverage that might also apply. Exclusivity refers to the fact that the effective date of approval of a potential competitor’s ANDA for a generic of the pioneer drug may be delayed or, in certain cases, an ANDA may not be submitted until the exclusivity period expires. Five years of exclusivity are granted to the first approval of a “new chemical entity”. Three years of exclusivity may apply to products which are not new chemical entities, but for which new clinical investigations are essential to the approval. For example, a new indication for use, or a new dosage strength of a previously approved product, may be entitled to exclusivity, but only with respect to that indication or dosage strength. Exclusivity only offers protection against a competitor entering the market via the ANDA route, and does not operate against a competitor that generates all of its own data and submits a full NDA.
If applicable regulatory criteria are not satisfied, the FDA may deny approval of an NDA or an ANDA or may require additional testing. Product approvals may be withdrawn if compliance with current or future regulatory standards is not maintained or if problems occur after the product reaches the market. The FDA may require further testing and surveillance programs to monitor the pharmaceutical product that has been commercialized. Non-compliance with applicable requirements can result in additional penalties, including product seizures, injunction actions and criminal prosecutions.
Canadian Regulation
The requirements for selling pharmaceutical drugs in Canada are substantially similar to those of the United States described above.
Investigational New Drug Application
Before conducting clinical trials of a new drug in Canada, we must submit a Clinical Trial Application (“CTA”) to the Therapeutic Products Directorate (“TPD”). This application includes information about the proposed trial, the methods of manufacture of the drug and controls, preclinical laboratory and animal toxicology tests on the safety and potential efficacy of the drug, and information on any previously executed clinical trials with the new drug. If, within 30 days of receiving the application, the TPD does not notify us that our application is unsatisfactory, we may proceed with clinical trials of the drug. The phases of clinical trials are the same as those described above under “United“United States Regulation – New Drug Application”Application”.
New Drug Submission
Before selling a new drug in Canada, we must submit a New Drug Submission (“NDS”) or Supplemental New Drug Submission (“sNDS”) to the TPD and receive a Notice of Compliance (“NOC”) from the TPD to sell the drug. The submission includes information describing the new drug, including its proper name, the proposed name under which the new drug will be sold, a quantitative list of ingredients in the new drug, the methods of manufacturing, processing, and packaging the new drug, the controls applicable to these operations, the tests conducted to establish the safety of the new drug, the tests to be applied to control the potency, purity, stability and safety of the new drug, the results of bio-pharmaceutics and clinical trials as appropriate, the intended indications for which the new drug may be prescribed and the effectiveness of the new drug when used as intended. The TPD reviews the NDS or sNDS. If the submission meets the requirements of Canada’s Food and Drugs Act and Regulations, the TPD will issue an NOC for the new drug.
Where the TPD has already approved a drug for sale in controlled-release dosages, we may seek approval from the TPD to sell an equivalent generic drug through an ANDS. In certain cases, the TPD does not require the manufacturer of a proposed drug that is claimed to be equivalent to a drug that has already been approved for sale and marketed, to conduct clinical trials; instead, the manufacturer must satisfy the TPD that the drug is bioequivalent to the drug that has already been approved and marketed.
The TPD may deny approval or may require additional testing of a proposed new drug if applicable regulatory criteria are not met. Product approvals may be withdrawn if compliance with regulatory standards is not maintained or if problems occur after the product reaches the market. Contravention of Canada’s Food and Drugs Act and Regulations can result in fines and other sanctions, including product seizures and criminal prosecutions.
Proposals have recently been made that, if implemented, would significantly change Canada’s drug approval system. In general, the recommendations emphasize the need for efficiency in Canadian drug review. Proposals include establishment of a separate agency for drug regulation and modeling the approval system on those found in European Union countries. There is no assurance, however, that such changes will be implemented or, if implemented, will expedite the approval of new drugs.
The Canadian government has regulations which can prohibit the issuance of an NOC for a patented medicine to a generic competitor, provided that the patentee or an exclusive licensee has filed a list of its Canadian patents covering that medicine with the Minister of Health and Welfare. After submitting the list, the patentee or an exclusive licensee can commence a proceeding to obtain an order of prohibition directed to the Minister prohibiting him or her from issuing an NOC. The minister may be prohibited from issuing an NOC permitting the importation or sale of a patented medicine to a generic competitor until patents on the medicine expire or the waiver of infringement and/or validity of the patent(s) in question is resolved by litigation in the manner set out in such regulations. There may be additional patents relating to a company’s proposed manufacture, use or sale of a product that could potentially prohibit such company’s proposed commercialization of a drug compound.
Certain provincial regulatory authorities in Canada have the ability to determine whether the consumers of a drug sold within such province will be reimbursed by a provincial government health plan for that drug by listing drugs on formularies. The listing or non-listing of a drug on provincial formularies may affect the prices of drugs sold within provinces and the volume of drugs sold within provinces.
Additional Regulatory Considerations
Sales of our products by our licensees outside the United States and Canada will be subject to regulatory requirements governing the testing, registration and marketing of pharmaceuticals, which vary widely from country to country.
Under the U.S. Generic Drug Enforcement Act, ANDA applicants (including officers, directors and employees) who are convicted of a crime involving dishonest or fraudulent activity (even outside the FDA regulatory context) are subject to debarment. Debarment is disqualification from submitting or participating in the submission of future ANDAs for a period of years or permanently. The Generic Drug Enforcement Act also authorizes the FDA to refuse to accept ANDAs from any company which employs or uses the services of a debarred individual. We do not believe that we receive any services from any debarred person.
In addition to the regulatory approval process, pharmaceutical companies are subject to regulations under provincial, state and federal law, including requirements regarding occupational safety, laboratory practices, environmental protection and hazardous substance control, and may be subject to other present and future local, provincial, state, federal and foreign regulations, including possible future regulations of the pharmaceutical industry. We believe that we are in compliance in all material respects with such regulations as are currently in effect.
Before medicinal products can be distributed commercially, a submission providing detailed information must be reviewed and approved by the applicable government or agency in the jurisdiction in which the product is to be marketed. The regulatory review and approval process varies from country to country.
The following chart shows the corporate relationship structure of Intellipharmaceutics and its three wholly-owned subsidiaries, including jurisdictions of incorporation, as of February 27, 2017.2018.

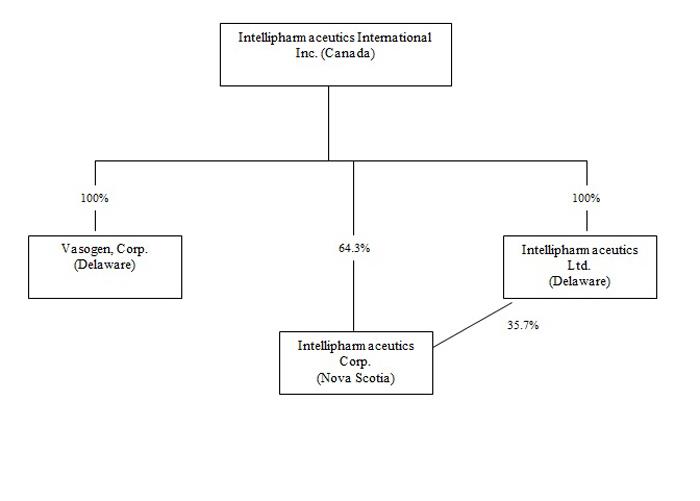
For over ten years, we have occupied a 25,000 square foot facility at 30 Worcester Road, Toronto, Ontario, Canada M9W 5X2, that we leased up to the year ended November 30, 2015 at a rental rate of approximately $90,000
per year, and with us responsible for utilities, municipal taxes and operating expenses for the leased property. On December 1, 2015, we entered into a new lease agreement for the combined properties comprising our premises that we currently operate from at 30 Worcester Road (“30 Worcester Road”), as well as a 40,000 square foot building on the adjoining property located at 22 Worcester Road, which is owned indirectly by the same landlord (“22 Worcester Road”) and collectively with 30 Worcester Road, the “(“combined properties”) for a five-year term with a five-year renewal option. Basic rent over the five-year term is C$240,000 per annum, subject to an annual consumer price inflation adjustment, and we are responsible for utilities, municipal taxes and operating expenses for the leased property. With these two leased premises, we now have use of 65,000 square feet of commercial space to accommodate our growth objectives over the next several years. We also have an option to purchase the combined properties after March 1, 2017 and up to November 30, 2020 based on a fair value purchase formula. We use our facility at 30 Worcester Road as a current Good Laboratory Practices research laboratory, office space, and current Good Manufacturing Practices scale-up and small to medium-scale manufacturing plant for solid oral dosage forms. The facility at 30 Worcester Road consists of approximately 4,900 square ft. for administrative space, 4,300 square ft. for R&D, 9,200 square ft. for manufacturing, and 3,000 square ft. for warehousing. The 22 Worcester Road building provides approximately 35,000 square feet of warehouse space and approximately 5,000 square feet of office space. The current lease also provides us with a right of first refusal to purchase the combined properties. The landlord is required to provide us with prior written notice and the desired sale price for the combined properties prior to offering the premises to a third party or on the open market. We have five business days to accept such offer and purchase price for a transaction to close within 60 days of the notice. If we decline the offer, the landlord is entitled to offer and sell the properties for a purchase price of not less than the price offered to us for a period of 180 days, after which time the landlord is again obliged to offer the properties to us before offering them to a third party or on the open market.
We continually monitor our facility requirements in the context of our needs and we expect these requirements to change commensurately with our activities.
In October 2014, the FDA provided us with written notification that our Toronto, Canada manufacturing facility at 30 Worcester Road had received an “acceptable” classification. Such inspections are carried out on a regular basis by the FDA and an “acceptable” classification is necessary to permit us to be in a position to receive final approvals for ANDAs and NDAs and to permit manufacturing of drug products intended for commercial sales in the United States after any such approvals. Similarly, Health Canada completed an inspection of our 30 Worcester Road facility in September 2015 which resulted in a “compliant” rating. Once we have completed certain renovations to our newly-leased warehouse and office property at 22 Worcester Road property, we would request an inspection by regulatory agencies which will determine compliance of the facility with cGMP.
Not applicable.
The following discussion and analysis should be read in conjunction with the audited annual consolidated financial statements of the Company and notes thereto. See “Item 18. Financial Statements”. The consolidated financial statements have been prepared in accordance with U.S. GAAP. All amounts are expressed in United States dollars unless otherwise noted. Annual references are to the Company’s fiscal years, which ended on November 30, 2017, 2016 2015 and 2014.2015.
Our results of operations have fluctuated significantly from period to period in the past and are likely to do so in the future. We anticipate that our quarterly and annual results of operations will be impacted for the foreseeable future by several factors, including the timing of approvals to market our product candidates in various jurisdictions and any resulting licensing revenue, milestone revenue, product sales, the number of competitive entries, marketproducts and the extent of any aggressive pricing activity, wholesaler buying patterns, the timing and amount of payments received pursuant to our current and future collaborations with third parties, the existence of any first-to-file exclusivity periods, and the progress and timing of expenditures related to our research, development and commercialization efforts. Due to these fluctuations, we
presently believe that the period-to-period comparisons of our operating results are not a reliable indication of our future performance.
Over the last several years, the FDA, through the Office of Generic Drugs (“OGD”) that approves ANDAs, has experienced a significant deterioration in ANDA approval timelines. The Company believes that the median ANDA approval time for ANDAs filed in 2012 or prior is approximately 47 months. The FDA has attributed this backlog principally to:
●
significant growth in ANDA submissions, particularly foreign submissions
●
an increase in the number of complex products
●
an increase in the number of foreign site inspections
●
limited resources to handle the growth and complexity of submissions
In order to address the significant backlog, GDUFA was passed. Under GDUFA, the OGD has been collecting new user fees from generic drug companies designed, among other things, to fund the increase in resources required to deal with the approval backlog as well as restructure the OGD to effectively deal with ANDA timelines on a go forward basis. The Company currently has 6 ANDAs4ANDAs that were filed in 2012 or prior that are still pending final FDA approval that exceed the 47 month median. We believe that the FDA has made positive strides in restructuring the OGD to address the ANDA approval backlog and we remain optimistic that the FDA will be successful in reducing the backlog; however, there can be no assurance as to when or if the FDA will approve any of our ANDA product candidates.
Revised Prior Quarter Amounts
While preparing our November 30, 2016 year-end financial statements, we identified and corrected a non-cash error related to the accounting for the modification of performance-based stock options. In April 2016, our shareholders approved a two-year extension of the expiry date of the performance-based options from September 2016 to September
2018. We have determined that this modification resulted in a non-cash expense that should have been reflected in our 2016 second quarter results. As stock-based compensation is a non-cash item, this error did not impact net cash provided from operations in the second quarter, nor does it have any impact on our annual financial statements for the year ended November 30, 2016. This error resulted in an understatement of second quarter stock-based compensation charged to R&D expense, with a corresponding understatement of additional paid in capital, of $1,177,782. We have determined to record the expense in the 2016 fourth quarter ended November 30, 2016.
The following are selected financial data for the years ended November 30, 2017, 2016 2015 and 2014.2015.
| For the years ended | |||||||
November 30, | November 30, | November 30, | Change | Change | |||
2017 | 2016 | 2015 | 2017 vs 2016 | 2016 vs 2015 | |||
$ | $ | $ | $ | % | $ | % | |
| Revenue: | |||||||
| Licensing | 5,025,350 | 2,209,502 | 4,093,781 | 2,815,848 | 127% | (1,884,279) | -46% |
| Up-front fees | 479,102 | 37,500 | - | 441,602 | 1178% | 37,500 | N/A |
5,504,452 | 2,247,002 | 4,093,781 | 3,257,450 | 145% | (1,846,779) | -45% | |
| Cost of goods sold | 704,006 | - | - | 704,006 | N/A | - | N/A |
| Gross Margin | 4,800,446 | 2,247,002 | 4,093,781 | 2,553,444 | 114% | (1,846,779) | -45% |
| Expenses: | |||||||
| Research and development | 9,271,353 | 8,166,736 | 7,247,473 | 1,104,617 | 14% | 919,263 | 13% |
| Selling, general and administrative | 3,287,914 | 3,546,132 | 3,581,913 | (258,218) | -7% | (35,781) | -1% |
| Depreciation | 506,961 | 385,210 | 377,849 | 121,751 | 32% | 7,361 | 2% |
13,066,228 | 12,098,078 | 11,207,235 | 968,150 | 8% | 890,843 | 8% | |
| Loss from operations | (8,265,782) | (9,851,076) | (7,113,454) | 1,585,294 | -16% | (2,737,622) | 38% |
| Net foreign exchange (loss) gain | (80,093) | (22,470) | 46,211 | (57,623) | 256% | (68,681) | -149% |
| Interest income | 15,037 | 207 | 1,507 | 14,830 | 7164% | (1,300) | -86% |
| Interest expense | (389,239) | (270,238) | (256,629) | (119,001) | 44% | (13,609) | 5% |
| Financing cost | (137,363) | - | - | (137,363) | N/A | - | N/A |
| Extinguishment loss | - | - | (114,023) | - | N/A | 114,023 | N/A |
| Net loss | (8,857,440) | (10,143,577) | (7,436,388) | 1,286,137 | -13% | (2,707,189) | 36% |
For the years ended | Change | Change | |||||
November 30, 2016 | November 30, 2015 | November 30, 2014 | 2016 vs 2015 | 2015 vs 2014 | |||
| $ | $ | $ | $ | % | $ | % | |
| Revenue: | |||||||
| Licensing | 2,209,502 | 4,093,781 | 8,415,540 | (1,884,279) | -46% | (4,321,759) | -51% |
| Milestone | - | - | 354,153 | - | N/A | (354,153) | -100% |
| Up-front fees | 37,500 | - | - | 37,500 | N/A | - | N/A |
2,247,002 | 4,093,781 | 8,769,693 | (1,846,779) | -45% | (4,675,912) | -53% | |
| Expenses: | |||||||
| Research and development | 8,166,736 | 7,247,473 | 8,020,201 | 919,263 | 13% | (772,728) | -10% |
| Selling, general and administrative | 3,546,132 | 3,581,913 | 3,900,803 | (35,781) | -1% | (318,890) | -8% |
| Depreciation | 385,210 | 377,849 | 381,385 | 7,361 | 2% | (3,536) | -1% |
12,098,078 | 11,207,235 | 12,302,389 | 890,843 | 8% | (1,095,154) | -9% | |
| Loss from operations | (9,851,076) | (7,113,454) | (3,532,696) | (2,737,622) | 38% | (3,580,758) | 101% |
| Net foreign exchange (loss) gain | (22,470) | 46,211 | 10,896 | (68,681) | -149% | 35,315 | 324% |
| Interest income | 207 | 1,507 | 4,898 | (1,300) | -86% | (3,391) | -69% |
| Interest expense | (270,238) | (256,629) | (339,451) | (13,609) | 5% | 82,822 | -24% |
| Extinguishment loss | - | (114,023) | - | 114,023 | N/A | (114,023) | N/A |
| Net loss | (10,143,577) | (7,436,388) | (3,856,353) | (2,707,189) | 36% | (3,580,035) | 93% |
Revenue
The Company recorded revenues of $5,504,452 for the year ended November 30, 2017 versus $2,247,002 for the year ended November 30, 2016. Revenues consisted primarily of licensing revenues from commercial sales of the 10,15, 20, 25, 30 and 35 mg of generic Focalin XR® under the Par agreement. The increase in revenues in the current year period is primarily due to the launch in January 2017 of the 25 and 35 mg strengths of generic Focalin XR® capsules in the U.S and also reflects revenue from the Company’s generic Seroquel XR® launched by Mallinckrodt in June 2017. The Company’s revenues on the 25 and 35 mg strengths of generic Focalin XR® showed some decline commencing July 2017 when their 6 month exclusivity expired, but have since leveled off. The 15 and 30mg strengths continue to perform well, with the 10 and 20 mg strengths contributing less due to their launch date being late August 2017. The 5 and 40 mg strengths did not contribute at all to top line revenue in fiscal 2017 as the products were not in the market until after year end. Revenues from generic Seroquel XR® were considerably lower than originally anticipated, primarily due to timing of the product launch, which was several weeks after other generics entered the market. As such, it is expected to take some time to gain market share as wholesaler contracts come up for renewal. Revenues under the Par and Mallinckrodt agreements represents the commercial sales of the generic products in those strengths and may not be representative of future sales.
Cost of goods sold
The Company recorded cost of goods sold of $704,006 for the year ended November 30, 2017 versus $Nil for the year ended November 30, 2016. Cost of sales for the year ended November 30, 2017, reflects the Company’s shipments of generic Seroquel XR® to Mallinckrodt which are manufactured by the Company and supplied to Mallinckrodt on a cost-plus basis. This product was not marketed or sold prior to fiscal 2017.
Research and Development
Expenditures for R&D for the year ended November 30, 2017 were higher by $1,104,617 compared to the year ended November 30, 2016. The increase is primarily due to higher stock option compensation expense as a result of certain performance based stock options vesting upon FDA approval of quetiapine fumarate extended release tablets in the 50, 150, 200, 300 and 400 mg strengths, as detailed below. R&D expenses are also higher due to higher third party consulting fees associated with our preparation for the FDA Advisory Committee meeting in relation to our Oxycodone ER NDA filing. As noted above under “Revised Prior Quarter Amounts”, the R&D expenses for the year ended November 30, 2016 were revised higher by $1,177,782 as a result of our shareholders approving an extension of the expiry date of certain performance based stock options.
In the year ended November 30, 2017, we recorded $1,654,051 of expenses for stock-based compensation for R&D employees, of which $1,577,772 was for expenses related to performance based stock options which vested on FDA approval for metformin hydrochloride extended release tablets in February 2017 and FDA approval of our quetiapine fumarate extended release tablets in May 2017. In the year ended November 30, 2016, we recorded $1,995,805 as expense for stock based compensation for R&D employees, of which $620,632 was for expenses related to performance based stock options which vested on FDA approval of our generic Keppra XR® in February 2016.
After adjusting for the stock-based compensation expenses discussed above, expenditures for R&D for the year ended November 30, 2017 were higher by $1,446,371 compared to the year ended November 30, 2016. The increase was primarily due to costs related to preparing for the FDA Advisory Committee meeting, an increase in third party R&D expenditures and higher compensation expense.
Selling, General and Administrative
Selling, general and administrative expenses were $3,287,914 for the year ended November 30, 2017 in comparison to $3,546,132 for the year ended November 30, 2016, a decrease of $258,218. The decrease is due to lower wages and benefits and administrative costs offset by higher expenses related to marketing cost and occupancy cost discussed in greater detail below.
Expenditures for wages and benefits for the year ended November 30, 2017 were $1,240,361 in comparison to $1,454,501 in the year ended November 30, 2016. For the year ended November 30, 2017, we recorded $95,948 as expense for stock-based compensation compared to an expense of $265,639 for the year ended November 30, 2016. After adjusting for the stock-based compensation expenses, expenditures for wages for the year ended November 30, 2017 were lower by $44,449 compared to the year ended November 30, 2016. The decrease is attributable to the accrual of bonuses to certain management employees in the year ended November 30, 2016, there were no bonuses paid in the year ended November 30, 2017.
Administrative costs for the year ended November 30, 2017 were $1,402,253 in comparison to $1,558,633 in the year ended November 30, 2016. The decrease relates primarily to lower professional fees.
Marketing costs for the year ended November 30, 2017 were $502,688 in comparison to $413,646 in the year ended November 30, 2016. The increase is primarily the result of an increase in travel expenditures related to business development and investor relations activities.
Occupancy costs for the year ended November 30, 2017 were $142,612 in comparison to $119,352 for the year ended November 30, 2016. The increase is due to the incremental cost of leasing an adjoining facility in order to meet the Company’s anticipated growth requirements.
Depreciation
Depreciation expenses for the year ended November 30, 2017 were $506,961 in comparison to $385,210 in the year ended November 30, 2016. The increase is primarily due to the additional investment in production, laboratory and computer equipment during the year ended November 30, 2017.
Foreign Exchange Loss
Foreign exchange loss was $80,093 for the year ended November 30, 2017 in comparison to a loss of $22,470 in the year ended November 30, 2016. The foreign exchange loss for the year ended November 30, 2017 was due to the weakening of the Canadian dollar against the U.S. dollar during the year ended November 30, 2017 as the exchange rates changed to $1.00 for C$1.2888 as at November 30, 2017 from $1.00 for C$1.3429 as at November 30, 2016. The foreign exchange loss for the year ended November 30, 2016 was due to the weakening of the Canadian dollar against the U.S. dollar during the year ended November 30, 2016 as the exchange rates changed to $1.00 for C$1.3429 as at November 30, 2016 from $1.00 for C$1.3353 as at November 30, 2015.
Interest Income
Interest income for the year ended November 30, 2017 was higher by $14,830 in comparison to the prior period. For the year ended November 30, 2017 interest was higher largely due to interest received on input tax credit refunds under the SR&ED program.
Interest Expense
Interest expense for the year ended November 30, 2017 was higher by $119,001 compared with the prior period. This is due to interest expense paid in 2017 on the Debenture which accrues interest payable at 12% annually and the related conversion option embedded derivative accreted at an annual imputed interest of approximately 15.2%, in comparison to the first nine months of 2016 when the Debenture imputed interest was approximately 4.2%.
Net Loss
The Company recorded net loss for the year ended November 30, 2017 of $8,857,440 or $0.29 per common share, compared with a net loss of $10,143,577 or $0.38 per common share for the year ended November 30, 2016. In the year ended November 30, 2017, the net loss was attributed to the ongoing R&D and selling, general and administrative expenses, partially offset by licensing revenues from commercial sales of generic Focalin XR® and to a lesser extent, sales of generic Seroquel XR® shipped to Mallinckrodt. The net loss in 2017 is lower compared to 2016 due to higher licensing revenues which were partially offset by an increase in performance based stock option expense and higher third party R&D expenditures. Revenue from commercial sales of generic Focalin XR® and generic Seroquel XR® in the year ended November 30, 2017, was $4,269,691 versus $2,209,502 in fiscal 2016. This is primarily due to the launch of additional strengths of generic Focalin XR® in 2017 as well as the launch of generic Seroquel XR®, In the year ended November 30, 2016, the higher net loss was primarily attributed to lower licensing revenues from commercial sales of generic Focalin XR® for 2016. To a lesser extent, the higher loss for the 2016 period was due to the accrual of management bonuses and additional compensation costs related to vested performance options as a result of the FDA approval of generic Keppra XR® and the Company’s shareholders approving an extension of the expiry date of the performance based stock options.
Year Ended November 30, 2016 Compared to the Year Ended November 30, 2015
Revenue
The Company recorded revenues of $2,247,002 for the year ended November 30, 2016 versus $4,093,781 for the year ended November 30, 2015. For the year ended November 30, 2016, we recognized licensing revenue of $2,209,502 from commercial sales of 15 and 30 mg strengths of generic Focalin XR® (dexmethylphenidate hydrochloride extended-release) capsules under the Par agreement. The decrease in revenues is primarily due to increased competition and a softening of pricing conditions for our generic Focalin XR® capsules. A fifth generic competitor entered the market in the second half of 2015, resulting in increased price competition and lower market share. Based on the most recent two month trend, our market share for the 15 and 30 mg
strengths iswas approximately 30% for the combined strengths of our generic Focalin XR® capsules. Revenue under the Par agreement represents the commercial sales of the generic product in those strengths and may not be representative of future sales. In addition, during the year ended November 30, 2016, the Company received a non-refundable up-front payment of $3,000,000 from Mallinckrodt pursuant to the Mallinckrodt agreement, of which $37,500 was recognized as revenue. Such up-front fees are recognized over the expected 10 year term of the contract. There were no up-front fees recognized in the year ended November 30, 2015.
Research and Development
Expenditures for R&D for the year ended November 30, 2016 were higher by $919,263 compared to the year ended November 30, 2015. The increase is primarily due to higher stock option compensation expense as a result of certain performance based stock options vesting upon FDA approval of generic Keppra XR®, and additional compensation costs related to vested performance options as a result of the Company’s shareholders approving a two year extension of the expiry date of the performance-basedperformance based stock options from September 2016 to September 2018, partially offset by lower spending for ongoing R&D work, as detailed below.
In the year ended November 30, 2016 we recorded $1,995,805 as expense for stock based compensation for R&D employees, of which $620,632 was for expenses related to performance-basedperformance based stock options which vested on FDA approval of our generic Keppra XR® in February 2016. As a result of the modification of the performance based stock option expiry date, we recorded additional compensation costs of $1,177,782 related to vested performance options during the year ended November 30, 2016. In the year ended November 30, 2015, we recorded $152,231 as expenses for stock-based compensation expense.
After adjusting for the stock-based compensation expenses discussed above, expenditures for R&D for the year ended November 30, 2016 were lower by $924,311 compared to the year ended November 30, 2015. This is primarily due to the fact that during the year ended November 30, 2016 we incurred lower expenditures on the development of several generic product candidates (specifically for clinical studies), partially offset by an accrual of bonuses to certain management employees, compared to the year ended November 30, 2015. There were no management bonuses paid in the year ended November 30, 2015.
Selling, General and Administrative
Selling, general and administrative expenses were $3,546,132 for the year ended November 30, 2016 in comparison to $3,581,913 for the year ended November 30, 2015, a decrease of $35,781. The decrease iswas due to a decrease in corporate legal activities and other professional fees, offset by an expense for management bonuses discussed in greater detail below.
Expenditures for wages and benefits for the year ended November 30, 2016 were $1,454,501 in comparison to $1,305,614 in the year ended November 30, 2015, an increase of $148,887, primarily due to the accrual of bonuses to certain management employees. There were no bonuses paid in the year ended November 30, 2015. For
the year ended November 30, 2016, we recorded $265,639 as an expense for stock-based compensation compared to an expense of $265,587 for the year ended November 30, 2015.
Administrative costs for the year ended November 30, 2016 were $1,558,633 in comparison to $1,751,315 in the year ended November 30, 2015. The decrease iswas primarily due to a decrease in expenditures in corporate legal activities and other professional fees.
Marketing costs for the year ended November 30, 2016 were $413,646 in comparison to $434,902 in the year ended November 30, 2015. The decrease iswas attributable to the decrease in travel expenditures related to business development and investor relations activities.
Occupancy costs for the year ended November 30, 2016 were $119,352 in comparison to $90,082 for the year ended November 30, 2015. The increase iswas due to the incremental cost of leasing an adjoining facility in order to meet the Company’s anticipated growth requirements.
Depreciation
Depreciation expenses for the year ended November 30, 2016 were $385,210 in comparison to $377,849 in the year ended November 30, 2015. The increase iswas primarily due to the additional investment in production, laboratory and computer equipment during the year ended November 30, 2016.
Net Foreign Exchange (Loss) Gain
Foreign exchange loss was $22,470 for the year ended November 30, 2016 in comparison to a gain of $46,211 in the year ended November 30, 2015. The foreign exchange loss for the year ended November 30, 2016 was due to the weakening of the Canadian dollar against the U.S. dollar during the year ended November 30, 2016 as the exchange rates changed to $1.00 for C$1.3429 as at November 30, 2016 from $1.00 for C$1.3353 as at November 30, 2015. During the year ended November 30, 2016, the exchange rate averaged $1.00 for C$1.3276 compared to the year ended November 30, 2015, when the exchange rate averaged $1.00 for C$1.2603.
Interest Income
Interest income for the year ended November 30, 2016 was lower by $1,300 in comparison to the prior period. For the year ended November 30, 2016 interest was lower largely due to lower average amounts of cash on hand compared to the year ended November 30, 2015.
Interest Expense
Interest expense for the year ended November 30, 2016 was higher by $13,609 compared with the prior period. This is primarily because the interest expense paid on the Debenture which accrues interest payable at 12% annually and the related conversion option embedded derivative accreted at an annual imputed interest of approximately 6.6% in fiscal 2016. During the fiscal year 2015, the conversion option embedded derivative accreted at an annual imputed interest of approximately 15%, offset by a credit to interest expense at an imputed interest rate of 14.6%, during the third quarter of 2015, due to the extinguishment of the debt from an accounting perspective.
Net Loss
The Company recorded net loss for the year ended November 30, 2016 of $10,143,577 or $0.38 per common share, compared with a net loss of $7,436,388 or $0.31 per common share for the year ended November 30, 2015. In the year ended November 30, 2016, the higher net loss iswas primarily attributed to lower licensing revenues from commercial sales of generic Focalin XR®XR® for 2016. To a lesser extent, the higher loss for the 2016 period was due to the accrual of management bonuses and additional compensation costs related to vested performance options as a result of the FDA approval of generic Keppra XR®XR® and the Company’s shareholders approving an extension of the expiry date of the performance based stock options. In the year ended November 30, 2015, the net loss iswas attributed to the ongoing R&D and selling, general and administrative expense, partially offset by licensing revenue.
For the years ended | ||||||||||||||
For the years ended | November 30, | Change | ||||||||||||
November 30, 2016 | November 30, 2015 | November 30, 2014 | Change (2016 vs 2015) | Change (2015 vs 2014) | 2017 | 2016 | 2015 | (2017 vs 2016) | (2016 vs 2015) | |||||
$ | % | $ | % | $ | $ | $ | $ | % | $ | % | ||||
| Cash flows used in operating activities | (6,254,985) | (3,782,164) | (1,714,913) | (2,472,821) | 65% | (2,067,251) | 121% | (6,105,785) | (6,254,985) | (3,782,164) | 149,200 | -2% | (2,472,821) | 65% |
| Cash flows provided from financing activities | 9,159,623 | 1,733,865 | 5,957,275 | 7,425,758 | 428% | (4,223,410) | -71% | 5,682,168 | 9,159,623 | 1,733,865 | (3,477,455) | -38% | 7,425,758 | 428% |
| Cash flows used in investing activities | (515,410) | (430,480) | (768,973) | (84,930) | 20% | 338,493 | -44% | (1,823,746) | (515,410) | (430,480) | (1,308,336) | 254% | (84,930) | 20% |
| Increase (decrease) in cash | 2,389,228 | (2,478,779) | 3,473,389 | 4,868,007 | 196% | (5,952,168) | -171% | (2,247,363) | 2,389,228 | (2,478,779) | (4,636,591) | -194% | 4,868,007 | -196% |
| Cash, beginning of period | 1,755,196 | 4,233,975 | 760,586 | (2,478,779) | -59% | 3,473,389 | 457% | |||||||
| Cash, end of period | 4,144,424 | 1,755,196 | 4,233,975 | 2,389,228 | 136% | (2,478,779) | -59% | |||||||
| Cash, beginning of year | 4,144,424 | 1,755,196 | 4,233,975 | 2,389,228 | 136% | (2,478,779) | -59% | |||||||
| Cash, end of year | 1,897,061 | 4,144,424 | 1,755,196 | (2,247,363) | -54% | 2,389,228 | 136% | |||||||
The Company had cash of $4,144,424$1,897,061 as at November 30, 20162017 compared to $1,755,196$4,144,424 as at November 30, 2015 and compared to $4,233,975 as at2016. The decrease in cash during the year ended November 30, 2014.2017 was mainly a result of our ongoing expenditures in R&D and selling, general, and administrative expenses, which includes increased consulting fees incurred to prepare for the July 26, 2017 FDA Advisory Committee meeting and an increase in purchases of plant and production equipment to support our generic Seroquel XR® launch, which were only partially offset by higher cash receipts from commercialized sales of our generic Focalin XR® and cash receipts provided from financing activities derived from common share sales under the Company’s at-the-market offering program and the Company’s underwritten public offering in October 2017. The increase in cash during the year ended November 30, 2016 was mainly a result of an increase in cash flows provided from financing activities which were mainly from the Company’s underwritten public offering in June 2016 and common share sales under the Company’s at-the-market offering program, the receipt of a non-refundable upfront payment of $3,000,000 under the Mallinckrodt agreement, partially offset by lower cash receipts relating to commercialized sales of our generic Focalin XR®XR® and a reduction in accounts payable and accrued liabilities. The decrease in cash during the year ended November 30, 2015 was mainly a result of lower cash receipts relating to commercial sales of our generic Focalin XR®XR® capsules for the 15 and 30 mg strengths, an increase in cash flow used in operating activities related to R&D activities, a decrease in cash flows provided from financing activities which were mainly from common share sales under the Company’s at-the-market offering program, partially offset by a decrease in purchases of production, laboratory and computer equipment. The increase in cash during the year ended November 30, 2014 was mainly a result of the decrease in cash flows used in operating activities due to payments received from the commercial sales of our generic Focalin XR® capsules for the 15 and 30 mg strengths, cash flows from financing activities which were mainly from our at-the-market financing and several warrant exercise, partially offset by an increase in purchases of production, laboratory and computer equipment.
For the year ended November 30, 2016,2017, net cash flows used in operating activities increaseddecreased to $6,254,985$6,105,785 as compared to net cash flows used in operating activities for the year ended November 30, 20152016 of $3,782,164.$6,254,985. The decrease was primarily due to a significant reduction in accounts payable and accrued liabilities in fiscal 2016 as well as a reduction of inventory and accounts receivable levels in fiscal 2017. The November 30, 2016 increasedecrease was due to lower cash receipts relating to commercial sales of our generic Focalin XR®XR® capsules by Par for the 15 and 30 mg strengths and a reduction in accounts payable and accrued liabilities, partially offset by the receipt of a non-refundable upfront payment of $3,000,000 under the Mallinckrodt agreement. For the year ended November 30, 2015, net cash flows used in operating activities increased to $3,782,164 as compared to net cash flows used in operating activities for the year ended November 30, 2014 of $1,714,913. The increase from 2014 was due to the receipt of approximately $4,622,157, as our payment relating to commercial sales of generic Focalin XR® capsules by Par for the 15 and 30 mg strengths of the drug product under the Par agreement for the period December 1, 2014 to November 30, 2015 compared to the payment to us of $8,465,466 for the period December 1, 2013 to November 30, 2014.
R&D costs, which are a significant portion of the cash flows used in operating activities, related to continued internal research and developmentR&D programs are expensed as incurred. However, equipment and supplies are capitalized and amortized over their useful lives if they have alternative future uses. For the year ended November 30, 2017 and the year ended November 30, 2016, R&D expense was $9,271,353, and $8,166,736, respectively. The increase was mainly due to consulting fees associated with our preparation for the FDA Advisory Committee meeting in relation to our Oxycodone ER NDA filing and the increase due to stock based compensation expenses of $1,577,772 related to vested performance options during the year ended November 30, 2017. For the year ended November 30, 2016 and year ended November 30, 2015, R&D expense was $8,166,736, and $7,247,473, respectively. The increase in fiscal 2016 over fiscal 2015 was mainly due to stock based compensation expenses of $1,177,782 related to vested performance options during the year ended November 30, 2016, management bonuses and an increase in stock options expense, partially offset by lower expenditures on third party R&D expenditures.
For the year ended November 30, 20152017, net cash flows provided from financing activities of $5,682,168 principally related to the Company completing an underwritten public offering in October 2017 of 3,636,364 common shares, at a price of $1.10 per share and year ended November 30, 2014, R&D expense before stock option expense was $7,095,242 and $6,749,894, respectively. The increase in expenses in 2015 relativewarrants to 2014 was in part as a resultpurchase an aggregate of capital expenditures on production and analytical equipment and expenses1,818,182 common shares, for the procurementgross proceeds of active raw materials, conducting clinical studies$4,000,000, at-the-market issuances of common shares, and to a lesser extent, hiringthe exercise of additional personnel.
offering were $3,499,508, after deducting offering expenses. For the year ended November 30, 2016, net cash flows provided from financing activities of $9,159,623 principally related to the June 2016 underwritten public offering. The Company issued at the initial closing of the offering an aggregate of 3,229,814 common shares and warrants to purchase an additional 1,614,907 common shares. The underwriter also purchased at such closing additional warrants to acquire 242,236 common shares pursuant to the over-allotment option exercised in part by the underwriter. The Company subsequently sold an aggregate of 459,456 additional common shares at the public offering price of $1.61 per share in connection with subsequent partial exercises of the underwriter’s over-allotment option. The closings of these partial exercises
brought the total net proceeds from the June 2016 offering to approximately $5,137,638, after deducting the underwriter’s discount and estimated offering expenses. In addition, the increase in financing activities during the year ended November 30, 2016, an aggregate of 1,471,260 common shares were sold on NASDAQ for gross proceeds of $3,469,449, with net proceedswas related to us of $3,368,674, under the at-the-market offering program. Duringissuances of common shares.
For the year ended November 30, 2015, an aggregate2017, net cash flows used in investing activities of 471,439 common shares were sold for gross proceeds$1,823,746 related primarily to purchase of $1,290,168, with net proceedsplant and production equipment required to us of $1,254,178 under the at-the-market offering program. During the year ended November 30, 2014, an aggregate of 1,689,500 common shares were sold for gross proceeds of $6,571,673, with net proceeds to us of $6,390,670 under the at-the-market offering program. As a result of prior sales of the Company’s common shares under the equity distribution agreement, the Company currently may offer and sell its common shares with an aggregate purchase price of up to $4,891,688 (or such lesser amount as may then be permitted under applicable securities laws and regulations) pursuant tosupport our at-the-market program. There can be no assurance that any additional shares will be sold under the at-the-market program.
generic Seroquel XR® launch. For the year ended November 30, 2016, net cash flows used in investing activities of $515,410 related mainly to purchase of production, laboratory and computer equipment. For the year ended November 30, 2015, net cash flows used in investing activities of $430,480 related mainly to the purchase of production, laboratory and computer equipment due to the acceleration of product development activities. For the year ended November 30, 2014, net cash flows used in investing activities of $768,973 related mainly to the purchases of production, laboratory and computer equipment due to the acceleration of product development activities.
All non-cash items have been eliminatedadded back or deducted from the consolidated audited statements of cash flows.
strategy. We anticipate some investment in fixed assets and equipment over the next several months, the extent of which will depend on cash availability.
On December 1, 2015, the Company entered into a new lease agreement for the combined properties comprising the Company’s premises that it currently operates from at 30 Worcester Road, as well as a 40,000 square foot building on the adjoining property located at 22 Worcester Road, which is owned indirectly by the same landlord (collectively, the “combined properties”), for a five-year term with a five-year renewal option. Basic rent over the five year term is C$240,000 per annum, subject to an annual consumer price inflation adjustment and the Company responsible for utilities, municipal taxes and operating expenses for the leased property. With these two leased premises, the Company now has use of 65,000 square feet of commercial space to accommodate its growth objectives over the next several years. The Company also has an option to purchase the combined properties after March 1, 2017 and up to November 30, 2020 based on a fair value purchase formula. The Company uses its facility at 30 Worcester Road as a current Good Laboratory Practices research laboratory, office space, and current Good Manufacturing Practices scale-up and small to medium-scale manufacturing plant for solid oral dosage forms. The facility at 30 Worcester Road consists of approximately 4,900 square ft. for administrative space, 4,300 square ft. for R&D, 9,200 square ft. for manufacturing, and 3,000 square ft. for warehousing. The 22 Worcester Road building provides approximately 35,000 square feet of warehouse space and approximately 5,000 square feet of office space. The current lease also provides the Company with a right of first refusal to purchase the combined properties. The landlord is required to provide the Company with prior written notice and the desired sale price for the combined properties prior to offering the premises to a third party or on the open market. The Company has five business days to accept such offer and purchase price for a transaction to close within 60 days of the notice. If the Company declines the offer, the landlord is entitled to offer and sell the properties for a purchase price of not less than the price offered to the Company for a period of 180 days, after which time the landlord is again obliged to offer the properties to the Company before offering them to a third party or on the open market.
Effective December 1, 2016,September 28, 2017, the maturity date for the Debenture in respect of the $1,500,000 loan to the Company by Drs. Isa and Amina Odidi was extended to AprilOctober 1, 2017 and a principal repayment of $150,000 was made at the time of the extension.2018. The Company currently expects to repay the current netoutstanding principal amount of $1,350,000 on or about AprilOctober 1, 2017,2018, if the Company then has cash available.
The availability of equity or debt financing will be affected by, among other things, the results of our research and development,R&D, our ability to obtain regulatory approvals, our success in commercializing approved products with our commercializationcommercial partners and the market acceptance of our products, the state of the capital markets generally, strategic alliance agreements, and other relevant commercial considerations. In addition, if we raise additional funds by issuing equity securities, our then existing security holders will likely experience dilution, and the incurring of indebtedness would result in increased debt service obligations and could require us to agree to operating and financial covenants that would restrict our operations. In the event that we do not obtain sufficient additional capital, it will raise substantial doubt about our ability to continue as a going concern and realize our assets and pay our liabilities as they become due. Our cash outflows are expected to consist primarily of internal and external R&D, legal and consulting expenditures to advance our product pipeline and selling, general and administrative expenses to support our commercialization efforts. Depending upon the results of our research and developmentR&D programs, the Purdue plaintiffs patent litigation case and the availability of financial resources, we could decide to accelerate, terminate, or reduce certain projects, or commence new ones. Any failure on our part to successfully commercialize approved products or raise additional funds on terms favorable to us or at all, may require us to significantly change or curtail our current or planned operations in order to conserve cash until such time, if ever, that sufficient proceeds from operations are generated, and could result in ourus not taking advantage of business opportunities, in the termination or delay of clinical trials or ourus not taking any necessary actions required by the FDA or Health Canada for one or more of our product candidates, in curtailment of our product development programs designed to identify new product candidates, in the sale or assignment of rights to our technologies, products or product candidates, and/or our inability to file ANDAs, ANDSs or NDAs at all or in time to competitively market our products or product candidates.
We expense R&D costs. For the years ended November 30, 2017, 2016 2015 and 2014,2015, R&D expense was $8,166,736,$9,271,353, $8,166,736 and $7,247,473, and $8,020,201, respectively.
It is important to note that historical patterns of revenue and expenditures cannot be taken as an indication of future revenue and expenditures. Net loss has been somewhat variable over the last eight quarters, and has been impacted primarily by the commercial sales of generic Focalin XR® capsules, for the 15 and 30 mg strengths, the level of our R&D spending, availability of funding and the vesting or modification of performance based stock options. The lower net loss in the fourth quarter of 2017 is primarily attributed to lower R&D spending and selling, general and administrative expenses, partially offset by lower licensing revenues. The higher net loss in the third quarter of 2017 is primarily due to lower licensing revenue as a result of the expiration of exclusivity on the 25 and 35 mg strengths of generic Focalin XR® resulting in higher than normal wholesaler returns, along with higher expenses related to the FDA Advisory Committee meeting in July 2017. The lower net loss in the second quarter of 2017 is primarily attributed to higher licensing revenues from commercial sales of generic Focalin XR® in the 25 and 35 mg strengths complementing the 15 and 30 mg strengths of our generic Focalin XR® marketed by Par, partially offset by an increase in performance based options expense and higher third party consulting fees. The lower net loss in the fair value adjustmentfirst quarter of derivative liabilities.2017 is primarily attributed to higher licensing revenues from commercial sales of generic Focalin XR® due to Par’s launch of the 25 and 35 mg strengths of its generic Focalin XR® capsules in that quarter, partially offset by an increase in performance based stock options expense and legal and other professional fees. The higher net loss in the fourth quarter of 2016 is attributable to the lower licensing revenues from commercial sales of generic Focalin XR® for the fourth quarter of 2016, the accrual of management bonuses (there were no management bonuses paid in fiscal 2015) and additional compensation costs related to vested performance based stock options as a result of the Company’s shareholders approving an extension of the expiry date of the performance-basedperformance based stock option.options. As noted above under “Revised“Revised Prior Quarter Amounts”Amounts”, the latter item represents a non-cash error related to the modification of performance-based stock options that should have been expensed in the second quarter of 2016, resulting in the fourth quarter net loss being overstated by $1,177,782 and the second quarter net loss understated by the same amount. This non-cash error has no effect onThe net losses in the full year 2016 results. The higher net loss in thefirst, second and third quarter of 2016 isare fairly consistent and attributable to the lower licensing revenues from commercial sales of generic Focalin XR® for the third quarter of 2016, as the Company continued to face stiffer generic competition throughout fiscal 2016. The net loss in the second quarter of 2016 relative to the second quarter of 2015 is attributed to lower licensing revenues from commercial sales of generic Focalin XR® foras the second quarter of 2016 dueCompany continued to increasedface stiff generic competition a softening of pricing conditions and margin compression. As noted above, second quarter 2016 net loss was understated by $1,177,782 due to a non-cash error related to the modification of performance-based stock options for which the expense was charged to the fourth quarter ofthroughout fiscal 2016. The net loss in the first quarter of 2016 relative to the first quarter of 2015 was attributed to lower licensing revenues compared to the prior period and higher R&D expenses, mainly due to higher stock options expense as a result of certain performance based stock options vesting upon FDA approval of generic Keppra XR®, partially offset by lower selling, general and administrative expenses. The higher net loss in the fourth quarter of 2015 in comparison to the third quarter of 2015 is attributed to ongoing R&D and selling, general and administrative expense, including a significant increase in third party clinical studies. The higher net loss in the third quarter of 2015 in comparison to the second quarter of 2015 is attributed to the lower licensing revenue from generic Focalin XR® capsules due to the entry of a fifth generic competitor and ongoing R&D and selling, general and administrative expense, including a significant increase in third party clinical studies. The net loss in the second quarter of 2015 is attributed to the ongoing R&D and selling, general and administrative expense, including an increase in third party clinical studies, partially offset by licensing revenue from generic Focalin XR® capsules. The net loss in the first quarter of 2015 was attributed to lower licensing revenues compared to the prior period, partially offset by lower R&D and selling, general and administrative expenses. This is primarily due to the loss of exclusivity on the 15 mg strength of our generic Focalin XR® capsules. In the first quarter of 2015 we faced four generic competitors and a softening of pricing conditions and market share, consistent with industry post-exclusivity experience. The net loss in the third and fourth quarter of 2014 is attributed to the ongoing R&D and selling, general and administrative expense, as well as the loss of exclusivity period for the 15 mg strength of generic Focalin XR® capsules in the third quarter, allowing more competitors into the market, which negatively impacted our licensing revenue from generic Focalin XR® capsules. The net loss in the second quarter of 2014 is attributed to the ongoing R&D and selling, general and administrative expense, including an increase in stock-based compensation expense, payment of bonuses to certain management employees, increased salaries to certain non-management employees, partially offset by licensing revenue and milestone revenue from our generic Focalin XR® capsules.
The following selected financial information is derived from our unaudited interim consolidated financial statements.
(Loss) per share | ||||||||
| Quarter Ended | Revenue | Net loss | Basic(1) | Diluted(1) | Revenue | Net loss | Loss per share | |
$ | $ | Basici | Dilutedi | |||||
$ | ||||||||
| November 30, 2017 | 1,077,835 | (2,510,936) | (0.08) | |||||
| August 31, 2017 | 1,189,739 | (2,550,314) | (0.08) | |||||
| May 31, 2017 | 2,001,512 | (1,805,329) | (0.06) | |||||
| February 28, 2017 | 1,235,366 | (1,990,861) | (0.07) | |||||
| November 30, 2016 | 569,096 | (3,913,304) | (0.13) | (0.13) | 569,096 | (3,913,304) | (0.13) | |
| August 31, 2016 | 554,925 | (2,110,156) | (0.07) | (0.07) | 554,925 | (2,110,156) | (0.07) | |
| May 31, 2016 | 556,004 | (2,000,077) | (0.08) | (0.08) | 556,044 | (2,000,077) | (0.08) | |
| February 29, 2016 | 566,937 | (2,120,040) | (0.09) | (0.09) | 566,937 | (2,120,040) | (0.09) | |
| November 30, 2015 | 845,103 | (3,132,788) | (0.13) | (0.13) | ||||
| August 31, 2015 | 840,748 | (1,881,670) | (0.08) | (0.08) | ||||
| May 31, 2015 | 1,268,245 | (1,507,270) | (0.06) | (0.06) | ||||
| February 28, 2015 | 1,139,685 | (914,660) | (0.04) | (0.04) | ||||
(1)
Quarterly per share amounts may not sum due to rounding.
The Company, as part of its ongoing business, does not participate in transactions that generate relationships with unconsolidated entities or financial partnerships, such as entities often referred to as structured finance or special purpose entities (“SPE”), which would have been established for the purpose of facilitating off-balance sheet arrangements or other contractually narrow or limited purposes. As of November 30, 2016,2017, the Company was not involved in any material unconsolidated SPE transactions.
In the table below, we set forth our enforceable and legally binding obligations and future commitments and obligations related to all contracts. Some of the figures we include in this table are based on management’s estimate and assumptions about these obligations, including their duration, the possibility of renewal, anticipated actions by third parties, and other factors. The Company has entered into capital lease agreements for laboratory equipment where the lease obligation will end in fiscal 2017.Operating lease obligations relate to the lease of premises for the combined properties, comprising the Company’s premises that it currently operates from at 30 Worcester Road as well as the adjoining property at 22 Worcester Road, which is indirectly owned by the same landlord, which will expire in November 2020 with a 5 year renewal option. The Company also has an option to purchase the combined properties after March 1, 2017 and up to November 30, 2020 based on a fair value purchase formula, but does not currently expect to exercise this option in 2017.
2018.
2018.
Payments Due by Period | |||||
| Contractual Obligations | Total | Less than 1 Year | 1 - 3 Years | 3 - 5 Years | More than 5 Years |
| Third parties | |||||
| Accounts payable | $807,295 | $807,295 | $- | $- | $- |
| Accrued liabilities | 384,886 | 384,886 | - | - | - |
| Capital lease | 14,829 | 14,829 | - | - | - |
| Operating lease | 718,944 | 179,736 | 539,208 | - | - |
| Related parties | |||||
| Employee costs payable | 1,044,151 | 1,044,151 | - | - | - |
| Convertible debenture | 1,574,908 | 1,574,908 | - | - | - |
Total contractual obligations | $4,545,013 | $4,005,805 | $539,208 | $- | $- |
Payments Due by Year | |||||
| Contractual Obligations | Total | Less than 1 Year | 1 - 3 Years | 3 - 5 Years | More than 5 Years |
$ | $ | $ | $ | $ | |
| Third parties | |||||
| Accounts payable | 2,060,084 | 2,060,084 | - | - | - |
| Accrued liabilities | 782,369 | 782,369 | - | - | - |
| Operating lease | 558,660 | 186,220 | 372,440 | - | - |
| Related parties | |||||
| Employee costs payable | 214,980 | 214,980 | - | - | - |
| Convertible debenture | 1,512,332 | 1,512,332 | - | - | - |
| Total contractual obligations | 5,128,425 | 4,755,985 | 372,440 | - | - |
See “Disclosure Regarding Forward-Looking Information” in the introduction to this annual report.
DIRECTORS AND OFFICERS
The name and province/state of residence of each of our directors and officers as at the date hereof, the office presently held, principal occupation, and the year each director first became a director of the Company or its predecessor, IPC Ltd., are set out below. Each director is elected to serve until the next annual meeting of our shareholders or until his or her successor is elected or appointed. Officers are appointed annually and serve at the discretion of the board of directors (the “Board”Board”).
| Name and Province of Residence | Position held with the Company | Principal Occupations During the Last 5 Years | Other Public Company Boards | Director Since |
Dr. Isa Odidi Ontario, Canada | Chairman of the Board and Chief Executive Officer | Officer of the Company | None | September 2004 |
Dr. Amina Odidi Ontario, Canada | President, Chief Operating Officer and Director | Officer of the Company | None | September 2004 |
Dr. Eldon R. Smith(1) Alberta, Canada | Director | President and CEO of Eldon R. Smith and Associates Ltd., a consulting business and Professor Emeritus at the University of Calgary, Faculty of Medicine | October 2009 | |
Bahadur Madhani(1) Ontario, Canada | Director | Chief Executive Officer of Equiprop Management Limited, a consulting business. | None | March 2006 |
Kenneth Keirstead(1) New Brunswick, Canada | Director | Executive Manager of Lyceum Group, a consulting | None | January 2006 |
Dr. Patrick Yat Ontario, Canada | Vice-President, | Officer of the Company | None | N/A |
Andrew Patient Ontario, Canada | Chief Financial Officer | Officer of the Company since | None | N/A |
(1)
Member of the Audit Committee, Compensation Committee and CompensationCorporate Governance Committee.
(2)
Each of the foregoing individuals named in the above table has been engaged in the principal occupation set forth opposite his or her name during the past five years.
John Allport served as the Company’s Vice President, Legal Affairs and Licensing and as a director from September 2004 until his resignation (effective May 17, 2017) for personal reasons. Mr. Allport entered into a consulting agreement with the Company effective May 17, 2017 to provide ongoing services to the Company on an as-needed basis. Michael Campbell served as General Counsel and Corporate Secretary from July 10, 2017 until his resignation (effective February 22, 2018) for personal reasons.
As of February 27, 2017,2018, the directors and executive officers of the Company as a group owned, directly and indirectly, or exercise control or direction over 6,121,9805,948,280 common shares, representing approximately 20.3%17.1% of the issued and outstanding common shares of the Company (and beneficially owned approximately 10,996,13211,220,830 common
shares representing 31.4%28.1% of our common shares including common shares issuable upon the exercise of outstanding options and the conversion of the outstanding convertible debenture that are exercisable or convertible within 60 days of the date hereof). Our principal shareholders, Drs. Amina and Isa Odidi, our President and Chief Operating Officer and our Chairman and Chief Executive Officer, respectively, and Odidi Holdings Inc., a privately-held company controlled by Drs. Amina and Isa Odidi, owned in the aggregate directly and indirectly 5,781,312 common shares, representing approximately 19.17%16.7% of our issued and outstanding common shares of the Company (and collectively beneficially owned in the aggregate approximately 9,552,4649,935,526 common shares representing 28.2%25.6% of our common shares including common shares issuable upon the exercise of outstanding options and the conversion of the outstanding convertible debenture that are exercisable or convertible within 60 days of the date hereof). (Reference is made to the section entitled “E. Share Ownership” under this “Item 6. Directors, Senior Management and Employees” for additional information regarding the options to purchase common shares held by directors and officers of the Company and the convertible debenture held by Drs. Amina and Isa Odidi.) As a result, the principal shareholders have the ability to exercise significant influence over all matters submitted to our shareholders for approval whether subject to approval by a majority of holders of our common shares or subject to a class vote or special resolution requiring the approval of 66⅔% of the votes cast by holders of our common shares, in person or by proxy.
Drs. Isa Odidi and Amina Odidi are spouses to each other.
Compensation Discussion and Analysis
Background – We are a pharmaceutical company specializing in the research, development and manufacture of novel and generic controlled-release and targeted-release oral solid dosage drugs. Our patented Hypermatrix™ technology is a multidimensional controlled-release drug delivery platform that can be applied to the efficient development of a wide range of existing and new pharmaceuticals. Based on this technology platform, we have developed several drug delivery systems and a pipeline of products (some of which have received FDA approval) and product candidates in various stages of development, including ANDAs filed with the FDA (and one ANDS filed with Health Canada) and one NDA filing, in therapeutic areas that include neurology, cardiovascular, GIT, diabetes and pain. As of November 30, 2016,2017, the Company had 5462 full-time employees engaged in administration and research and development.
Compensation Governance -– The Company’s Compensation Committee is comprised of three directors, Messrs. Madhani, Keirstead and Smith, each of whom is considered “independent” within the meaning of section 2.4 of Form 51-102F6 – Statement of Executive Compensation. Each member of the Compensation Committee has sufficient experience in order to make decisions on the suitability of the Company’s compensation policies and practices.
The Compensation Committee recommends compensation policies concerning officers and senior management to the Board. The Corporate Governance Committee recommends compensation policies concerning independent directors to the Board. The Board makes the final determinations regarding the adequacy and form of the compensation for non-executive directors to ensure that such compensation realistically reflects the responsibilities and risks involved, without compromising a director’s independence. Further details relating to the role and function of the Compensation Committee and the Corporate Governance Committee is provided in Item 6.C.
Risk Management - – The Board is responsible for identifying the principal risks of the Company’s business and ensuring the implementation of appropriate systems to manage these risks. Through the Compensation Committee, the Board is involved in the design of compensation policies to meet the specific compensation objectives discussed below and considers the risks relating to such policies, if any. The Compensation Committee is ultimately responsible for ensuring compliance of the compensation policies and practices of the Company. To date,
the Board and Compensation Committee have not identified any risks arising from the Company’s compensation policies and practices that would be reasonably likely to have a material adverse effect on the Company.
Objectives -– The overall objectives of the Company’s compensation program include: (a) attracting and retaining talented executive officers; (b) aligning the interests of those executive officers with those of the Company; and (c) linking individual executive officer compensation to the performance of the Company. The Company’s compensation program is currently designed to compensate executive officers for performance of their duties and to reward certain executive officers for performance relative to certain milestones applicable to their services.
Elements of Compensation -– The elements of compensation awarded to, earned by, paid to, or payable to the Named Executive Officers (as hereinafter defined) for the most recently completed financial year are: (a) base salary and discretionary bonuses; (b) long-term incentives in the form of stock options; (c) restricted share unit awards; and (d) perquisites and personal benefits. Prior to the most recently completed financial year, the Named Executive Officers have also received option-based awards which were assumed by the Company pursuant to the plan of arrangement completed on October 22, 2009.
Base Salary and Discretionary Bonus -– Base salary is a fixed element of compensation payable to each Named Executive Officer for performing his or her position’s specific duties. The amount of base salary for a Named Executive Officer has been determined through negotiation of an employment agreement with each Named Executive Officer (see “Employment Agreements” below). While base salary is intended to fit into the Company’s overall compensation objectives by serving to attract and retain talented executive officers, the size of the Company and the nature and stage of its business also impact the level of base salary. To date, the level of base salary has not impacted the Company’s decisions about any other element of compensation and the Board may consider discretionary bonuses for individual employees based on exceptional performance by such individuals in a particular fiscal year.
Option-Based Awards -– Option-based awards are a variable element of compensation that rewards each Named Executive Officer for individual and corporate performance overall determined by the Board. Option-based awards are intended to fit into the Company’s overall compensation objectives by aligning the interests of all Named Executive Officers with those of the Company, and linking individual Named Executive Officer compensation to the performance of the Company. The Board, which includes threetwo of the five Named Executive Officers, is responsible for setting and amending any equity incentive plan under which an option-based award is granted.
The Company has in place a stock option plan (the “Option Plan”) for the benefit of certain officers, directors, employees and consultants of the Company, including the Named Executive Officers (as described in greater detail in Item 6.E below). Named Executive Officers have been issued options under such plan.
The Company has also granted performance-based options to Dr. Isa Odidi and Dr. Amina Odidi pursuant to a separate option agreement, which was negotiated at the same time as their employment agreements. These options vest upon the Company attaining certain milestones relating to FDA filings and approvals for Company drugs, such that 276,394 options vest in connection with each of the FDA filings for the first five Company drugs and 276,394 options vest in connection with each of the FDA approvals for the first five Company drugs.
The Company’s Option Plan was adopted effective October 22, 2009 as part of the IPC Arrangement Agreement approved by the shareholders of IPC Ltd., the predecessor company, at the meeting of shareholders on October 19, 2009. Subject to the requirements of the Option Plan, the Board, with the assistance of the Compensation Committee, has the authority to select those directors, officers, employees and consultants to whom options will be granted, the number of options to be granted to each person and the price at which common shares of the Company may be purchased. Grants are determined based on individual and aggregate performance as determined by the Board.
RSUs -– The Company established a restricted share unit plan (the “RSU Plan”) to form part of its incentive compensation arrangements available for officers and employees of the Company and its designated affiliates (as described in greater detail it Item 6.E) as of May 28, 2010, when the RSU Plan received shareholder approval.
Perquisites and personal benefits -– The Company also provides perquisites and personal benefits to its Named Executive Officers, including basic employee benefit plans, which are available to all employees, and a car allowance to cover the cost of an automobile for business purposes. These perquisites and personal benefits were determined through negotiation of an employment agreement with each Named Executive Officer (see “Employment Agreements” below). While perquisites and personal benefits are intended to fit into the Company’s overall compensation objectives by serving to attract and retain talented executive officers, the size of the Company and the nature and stage of its business also impact the level of perquisites and benefits. To date, the level of perquisites and benefits has not impacted the Company’s decisions about any other element of compensation.
Other Compensation-Related Matters - – The Company’s Share Trading Policy prohibits all directors and officers of the Company from, among other things, engaging in any short sales designed to hedge or offset a decrease in market value of the securities of the Company.
Executive Compensation
The following table sets forth all direct and indirect compensation for, or in connection with, services provided to the Company for the financial years ended November 30, 2016,2017, November 30, 20152016 and November 30, 20142015 in respect of the Chief Executive Officer of the Company, the Chief Financial Officer,Officers (current and former), and two other officers of the Company who earned greater than $150,000 in total compensation in the fiscal year ended November 30, 2016 (“2017(“Named Executive Officers”).
SUMMARY COMPENSATION TABLE
Non-equity incentive plan compensation (U.S.$)(f) | |||||||||
| Name and principal position(a) | Year(b) | Salary (U.S.$)(1)(c) | Share-based awards (U.S.$)(d) | Option- based awards (U.S.$)(2)(e) | Annual incentive plans(3) | Long-term incentive plans | Pension value (U.S.$)(g) | All other compensation (U.S.$)(4)(h) | Total compensation (U.S.$)(i) |
| Dr. Isa Odidi,Chairman & Chief Executive Officer | 2016 | 340,464 | N/A | $703,016 | 340,464 | N/A | N/A | 13,558 | 1,397,502 |
| 2015 | 358,617 | N/A | 68,644 | N/A | N/A | N/A | 14,678 | 441,939 | |
| 2014 | 581,965 | N/A | 99,615 | 182,299 | N/A | N/A | 10,938 | 775,202 | |
| Dr. Amina Odidi,President & Chief Operating Officer | 2016 | 340,464 | N/A | $703,016 | 340,464 | N/A | N/A | 13,558 | 1,397,502 |
| 2015 | 358,617 | N/A | 68,644 | N/A | N/A | N/A | 14,678 | 441,939 | |
| 2014 | 581,965 | N/A | 99,615 | 182,299 | N/A | N/A | 10,938 | 775,202 | |
| John Allport,VP Legal Affairs & Licensing | 2016 | 109,220 | N/A | $50,346 | 56,493 | N/A | N/A | 13,558 | 229,617 |
| 2015 | 115,043 | N/A | 39,225 | N/A | N/A | N/A | 14,678 | 168,946 | |
| 2014 | 132,167 | N/A | 99,615 | 91,149 | N/A | N/A | 10,938 | 333,869 | |
Domenic Della Penna, Chief Financial Officer(5) | 2016 | 225,972 | N/A | $64,076 | 112,986 | N/A | N/A | 13,558 | 416,592 |
| 2015 | 218,185 | N/A | 76,810 | N/A | N/A | N/A | 14,281 | 309,276 | |
| 2014 | 5,222 | N/A | 34,573 | N/A | N/A | N/A | 342 | 40,137 | |
Non-equity incentive plan compensation (U.S.$)(f) | |||||||||
| Name and principal position(a) | Year(b) | Salary (U.S.$)(1)(c) | Share-based awards (U.S.$)(d) | Option-based awards (U.S.$)(2)(e) | Annual incentive plans(3) | Long-term incentive plans | Pension value (U.S.$)(g) | All other compensation (U.S.$)(4)(h) | Total compensation (U.S.$)(i) |
| Dr. Isa Odidi, Chairman & Chief Executive Officer | 2017 | 343,430 | N/A | 1,609,573 | N/A | N/A | N/A | 13,676 | 1,966,680 |
| 2016 | 340,464 | N/A | 703,016 | 340,464 | N/A | N/A | 13,558 | 1,397,502 | |
| 2015 | 358,617 | N/A | 68,644 | N/A | N/A | N/A | 14,678 | 441,939 | |
| Dr. Amina Odidi, President & Chief Operating Officer | 2017 | 343,430 | N/A | 1,609,573 | N/A | N/A | N/A | 13,676 | 1,966,680 |
| 2016 | 340,464 | N/A | 703,016 | 340,464 | N/A | N/A | 13,558 | 1,397,502 | |
| 2015 | 358,617 | N/A | 68,644 | N/A | N/A | N/A | 14,678 | 441,939 | |
| John Allport, Former VP Legal Affairs & Licensing(5) | 2017 | 59,676 | N/A | N/A | N/A | N/A | N/A | 7,408 | 67,084 |
| 2016 | 109,220 | N/A | 50,346 | 56,493 | N/A | N/A | 13,558 | 229,617 | |
| 2015 | 115,043 | N/A | 39,225 | N/A | N/A | N/A | 14,678 | 168,946 | |
| Domenic Della Penna, Former Chief Financial Officer(6) | 2017 | 189,662 | N/A | N/A | N/A | N/A | N/A | 10,257 | 199,919 |
| 2016 | 225,972 | N/A | 64,076 | 112,986 | N/A | N/A | 13,558 | 416,592 | |
| 2015 | 218,185 | N/A | 76,810 | N/A | N/A | N/A | 14,281 | 309,276 | |
| Andrew Patient, Chief Financial Officer(7) | 2017 | 54,395 | N/A | 19,800 | N/A | N/A | N/A | 3,419 | 77,614 |
Notes:
(1)
Salaries paid by the Company to each Named Executive Officer are paid in Canadian dollars. All amounts are expressed in U.S. dollars converted at the exchange rate of U.S.$ 0.75320.7598 to C$1.00 (2015(2016 – U.S. $0.7934; 2014$0.7932; 2015 – U.S. $0.9115)$0.7934) being the average closing exchange rate quoted by the Bank of Canada for the respective periods. Salary includes all amounts paid or payable to the Named Executive Officer. Actual amount paid to each Named Executive Officer in fiscal 2017, 2016 2015 and 20142015 are as disclosed in the table.
(2)
The Company entered into a separate acknowledgement and agreement with Drs. Isa and Amina Odidi dated October 22, 2009 to be bound by the performance-based stock option agreement dated September 10, 2004 pursuant to which Drs. Isa and Amina Odidi are entitled to purchase up to 2,763,940 of the Company’s common shares upon payment of U.S. $3.62 per share, subject to satisfaction of the performance vesting conditions. The value of the option-based awards are determined using the Black-Scholes pricing model calculated as at the award date.
(3)
Amount awarded at the discretion of the Board. This bonus was paid in the second quarter of 2017.
(4)
“All other compensation” includes car allowances and other miscellaneous benefits.
(5)
Mr. Allport, a consultant to the Company, served as the Company’s Vice President, Legal Affairs and Licensing and as a director from September 2004 until his resignation effective on May 17, 2017.
(6)
Mr. Della Penna served as the Company’s Chief Financial Officer from November 24, 2014 until his resignation effective on September 6, 2017.
(7) Mr. Patient was appointed as Chief Financial Officer of the Company effective September 6, 2017.
During the fiscal year ended November 24, 2014.30, 2017, Mr. Campbell received salary, option-based awards, all other compensation and total compensation of $90,226, $20,825, $5,414, and $116,465, respectively.
Significant factors necessary to understand the information disclosed in the Summary Compensation Table above include the terms of each Named Executive Officer’s employment agreement and the terms of the separate agreement relating to performance-based options applicable to Drs. Isa and Amina Odidi described below.
Employment Agreements
The employment agreement with Dr. Isa Odidi, the Chief Executive Officer of the Company, effective September 1, 2004 entitles Dr. Isa Odidi to receive a base salary of U.S. $200,000 per year, which is paid in Canadian dollars, to be increased annually each year during the term of the agreement by twenty percent of the prior year’s salary. In addition, he is entitled to: (a) participate in the Option Plan; (b) participate in all employee benefit plans and programs, except for the RSU Plan and DSU Plan; and (c) a car allowance of up to U.S. $1,000 per month. The initial term of the employment agreement was until September 30, 2007, at which time, pursuant to the terms of the agreement, the agreement was deemed to be extended automatically for an additional three-year period on the same terms and conditions (i.e. until September 30, 2010). The agreement will continue to be extended automatically for successive additional three-year periods on the same terms unless the Company gives Dr. Odidi contrary written notice at least two years prior to the date on which the agreement would otherwise be extended. See “Termination and Change of Control Benefits” below. Dr. Odidi’s employment agreement was amended on August 1, 2007 and June 8, 2009 to include intellectual property, non-competition and non-solicitation provisions in favour of the Company. In April 2010, Dr. Isa Odidi offered and agreed to amend his employment agreement effective as of December 1, 2009, to eliminate the right to annual increases in his base salary of twenty per cent each year; and agreed to roll back his base salary effective December 1, 2009 to the level payable under the employment agreement for the period from September 2008 to August 2009, being C$452,000 per year. Under this amendment, the base salary is open to potential increase on an annual basis at the discretion of the Board and Dr. Isa Odidi is eligible to receive a performance bonus, based on the performance, including that of Dr. Odidi and the Company, as may be determined in the discretion of the Board. In February 2012, Dr. Isa Odidi received a grant of 300,000 options of which 200,000 vested immediately on issuance and the remaining 100,000 options vested on February 17, 2013 at an exercise price of $3.27C$3.27 per share. In April 2013, Dr. Isa Odidi received a grant of 75,000 options of which 37,500 vested immediately on issuance and the remaining 37,500 options vested on November 30, 2013 at an exercise price of $1.81C$1.81 per share. In March 2014, Dr. Isa Odidi received a grant of 50,000 options of which 25,000 vested immediately on issuance and the remaining 25,000 options vested on November 30, 2014 at an exercise price of $4.29C$4.29 per share. In November 2015, Dr. Isa Odidi received a grant of 70,000 options of which 49,000 vested immediately on issuance, with the remaining 21,000 options vested on November 30, 2016 at an exercise price of $2.52C$2.52 per share. In August 2016, Dr. Isa Odidi received a grant of 90,000 options of which 60,000 vested immediately on issuance, with the remaining 30,000 to vest on November 30, 2017 at an exercise price of $2.43C$2.42 per share.
In November 2017, Dr. Isa Odidi received a grant of 70,000 options of which 23,334 vested immediately on issuance, with the remaining 23,333 to vest on November 30, 2018 and 23,333 to vest on November 30, 2019 at an exercise price of C$1.15 per share.
In November 2017, Dr. Isa Odidi received a grant of 70,000 options of which 23,334 vested immediately on issuance, with the remaining 23,333 to vest on November 30, 2018 and 23,333 to vest on November 30, 2019 at an exercise price of C$1.15 per share.
The employment agreement with Dr. Amina Odidi, the President and Chief Operating Officer of the Company, effective September 1, 2004 entitles Dr. Amina Odidi to receive a base salary of U.S.$200,000,$200,000, which is paid in Canadian dollars, per year, to be increased annually each year during the term of the agreement by twenty percent of the prior year’s salary. In addition, she is entitled to: (a) participate in the Option Plan; (b) participate in
all employee benefit plans and programs, except for the RSU Plan and DSU Plan; and (c) a car allowance of up to U.S. $1,000 per month. The initial term of the employment agreement was until September 30, 2007, at which time, pursuant to the terms of the agreement, the agreement was deemed to be extended automatically for an additional three-year period on the same terms and conditions (i.e. until September 30, 2010). The agreement will continue to be extended automatically for successive additional three-year periods on the same terms unless the Company gives Dr. Odidi contrary written notice at least two years prior to the date on which the agreement would otherwise be extended. See “Termination and Change of Control Benefits” below. Dr. Odidi’s employment agreement was amended on August 1, 2007 and June 8, 2009 to include intellectual property, non-competition and non-solicitation provisions in favour of the Company. In April 2010, Dr. Amina Odidi offered and agreed to amend her employment agreement effective as of December 1, 2009, to eliminate the right to annual increases in her base salary of twenty per cent each year; and agreed to roll back her base salary effective December 1, 2009 to the level payable under the employment agreement for the period from September 2008 to August 2009, being C$452,000 per year. Under this amendment, the base salary is open to potential increase on an annual basis at the discretion of the Board and Dr. Amina Odidi is eligible to receive a performance bonus, based on the performance, including that of Dr. Odidi and the Company, as may be determined in the discretion of the Board. In February 2012, Dr. Amina Odidi received
a grant of 300,000 options of which 200,000 vested immediately on issuance and the remaining 100,000 options vested on February 17, 2013 at an exercise price of $3.27C$3.27 per share. In April 2013, Dr. Amina Odidi received a grant of 75,000 options of which 37,500 vested immediately on issuance and the remaining 37,500 options vested on November 30, 2013 at an exercise price of $1.81C$1.81 per share. In March 2014, Dr. Amina Odidi received a grant of 50,000 options of which 25,000 vested immediately on issuance and the remaining 25,000 options vested on November 30, 2014 at an exercise price of $4.29C$4.29 per share. In November 2015 Dr. Amina Odidi received a grant of 70,000 options of which 49,000 vested immediately on issuance, with the remaining 21,000 options vested on November 30, 2016 at an exercise price of $2.52C$2.52 per share. In August 2016, Dr. Amina Odidi received a grant of 90,000 options of which 60,000 vested immediately on issuance, with the remaining 30,000 to vest on November 30, 2017 at an exercise price of $2.43C$2.42 per share.
In November 2017, Dr. Isa Odidi received a grant of 70,000 options of which 23,334 vested immediately on issuance, with the remaining 23,333 to vest on November 30, 2018 and 23,333 to vest on November 30, 2019 at an exercise price of C$1.15 per share .
In November 2017, Dr. Isa Odidi received a grant of 70,000 options of which 23,334 vested immediately on issuance, with the remaining 23,333 to vest on November 30, 2018 and 23,333 to vest on November 30, 2019 at an exercise price of C$1.15 per share .
In addition, the Company entered into a separate acknowledgement and agreement with Drs. Isa and Amina Odidi dated October 22, 2009 to be bound by the performance-based stock option agreement dated September 10, 2004 pursuant to which Drs. Isa and Amina Odidi are entitled to purchase up to 2,763,940 of the Company’s common shares. These options were not granted under the Option Plan. These options vest upon the Company attaining certain milestones related to the FDA filings and approvals for Company drugs. The options are exercisable at a price of U.S.$3.62$3.62 per share and were to expire in September 2014. Effective March 27, 2014, the Company’s shareholders approved a two year extension of the performance-based stock option expiry date to September 2016. Effective April 19, 2016, the Company’s shareholders approved a further two year extension of the performance-based stock option expiry date to September 2018. As of the date hereof, 2,211,1522,487,546 of these options have vested and are exercisable. These options were not granted under
Domenic Della Penna had served as the Option Plan.
Company’s Chief Financial Officer from November 2014 until his resignation effective on September 6, 2017. The employment agreement with DomenicMr. Della Penna, the Chief Financial Officer of the Company, effective November 24, 2014, entitlesprovided for Mr. Della Penna to receive a base salary of C$275,000, which iswas paid in Canadian dollars, per year and which was increased by the Board on a discretionary basis for 2015 to C$300,000 and C$325,000 for 2017 and future years.2017. In addition, he iswas entitled to: (a) participate in the Option Plan; (b) participate in all employee benefit plans and programs; and (c) a car allowance of C$1,500 per month. The agreement providesprovided for automatic renewal from year to year in absence of notice of termination from the Company at least 60 days prior to the anniversary date. If the agreement iswas terminated without cause, it requiresrequired payment to Mr. Della Penna based upon a formula that commences with the equivalent of approximately three months’ base salary and increases by approximately six weeks of base salary for every full year of service. If such termination without cause occursoccurred within six months of a change of control of the Company that occursoccurred after November 24, 2015, it requiresrequired payment to Mr. Della Penna based on a formula that commences with the equivalent of approximately thirteen months’ base salary and increases by approximately six weeks for every full year of service. Mr. Della Penna’s employment agreement containscontained intellectual property, non-competition and non-solicitation provisions in favour of the Company. Mr. Della Penna was granted 60,000 options, of which 15,000 vested immediately on issuance, 15,000 vested on November 30, 2015 and the remaining options vest as to 15,000 each year on November 30, 2016 and 2017 at an exercise price of $3.22C$3.22 per share. In November 2015, Mr. Della Penna received a grant of 50,000 options of which 35,000 vested immediately on issuance, with the remaining 15,000 options vested on November 30, 2016 at an exercise price of $2.52C$2.52 per share. In August 2016, Mr. Della Penna received a grant of 70,000 options, of
which 47,000 vested immediately, with the remaining 23,000 to vest on November 30, 2017 at an exercise price of $2.43C$2.42 per share.share. Mr. Della Penna’s options ceased to be exercisable 120 days after he ceased to be employed by the Company.
The employment agreement with John Allport,Andrew Patient, the Vice President Legal Affairs and Licensing,Chief Financial Officer of the Company, dated August 30, 2017, effective September 1, 20046, 2017 entitles Mr. AllportPatient to receive a base salary of C$95,000,300,000, which is paid in Canadian dollars, per year. In addition, he is entitled to: (a) participate in the Option Plan; (b) participate in all employee benefit plans and programs; and (c) a car allowance of C$1,500 per month. The agreement provides for automatic renewal on December 31 each year from year to year in absence of notice of termination from the Company at least 90 days prior to the end of the then applicable term. If the agreement is terminated without cause, it requires payment to Mr. Patient of 3 months' base salary, plus 6 weeks' base salary for every full year of service, up to a combined maximum of 12 months. If such termination occurs within six months of a change of control of the Company, it requires payment to Mr. Patient of thirteen months' base salary, plus 6 weeks' base salary for every full year of service, up to a combined maximum of 18
months. Mr. Patient’s employment agreement contains intellectual property, non-competition and non-solicitation provisions in favour of the Company. Mr. Patient was granted 60,000 options, of which 20,000 vested immediately on issuance, 20,000 vest on October 20, 2018 and the remaining 20,000 vest on October 20, 2019 at an exercise price of C$1.27 per share. In November 2017, Mr. Patient received a grant of 15,000 options of which 5,000 vested immediately on issuance, 5,000 vest on November 30, 2018 and the remaining 5,000 vest on November 30, 2019 at an exercise price of C$1.15 per share.
John Allport had served as the Company’s Vice President Legal Affairs and Licensing and as a director from September 2004 until his resignation effective on May 17, 2017. The employment agreement with Mr. Allport, effective September 1, 2004, provided for Mr. Allport to receive a base salary of C$95,000, which was paid in Canadian dollars, per year. In addition, he was entitled to: (a) participate in the Option Plan; (b) participate in all employee benefit plans and programs; and (c) a car allowance of C$1,000 per month. The employment agreement iswas for an indefinite term subject to termination on six months’ notice. In December 2011, Mr. Allport’s base salary was increased to C$145,000. In February 2012, Mr. Allport received a grant of 250,000 options of which 175,000 vested immediately on issuance and the remaining 75,000 options vested on February 17, 2013 at an exercise price of $3.27C$3.27 per share. Mr. Allport’s employment agreement includesincluded intellectual property, non-competition and non-solicitation provisions in favour of the Company. In April 2013, Mr. Allport received a grant of 25,000 options of which 12,500 vested immediately on issuance and the remaining 12,500 options vested on November 30, 2013 at an exercise price of $1.81C$1.81 per share. In March 2014, Mr. Allport received a grant of 50,000 options of which 25,000 vested immediately on issuance and the remaining 25,000 options vested on November 30, 2014 at an exercise price of $4.29C$4.29 per share. In November 2015, Mr. Allport received a grant of 40,000 options of which 28,000 vested immediately on issuance, with the remaining 12,000 options vested on November 30, 2016 at an exercise price of $2.52C$2.52 per share. In August 2016, Mr. Allport received a grant of 55,000 options of which 37,000 vested on issuance, with the remaining 18,000 to vest on November 30, 2017 at an exercise price of $2.43C$2.42 per share.
Mr. Allport entered into a consulting agreement with the Company effective May 17, 2017 to provide on-going services to the Company on an as-needed basis. The consulting agreement provides that Mr. Allport is to serve as a consultant to the Company to provide pharmaceutical business consulting services when requested from time to time. The agreement is terminable by either the Company or Mr. Allport on less than one-month notice and provides for such consideration as is mutually agreed from time to time. The consulting agreement includes intellectual property, non-competition and non-solicitation provisions in favour of the Company.
Mr. Allport entered into a consulting agreement with the Company effective May 17, 2017 to provide on-going services to the Company on an as-needed basis. The consulting agreement provides that Mr. Allport is to serve as a consultant to the Company to provide pharmaceutical business consulting services when requested from time to time. The agreement is terminable by either the Company or Mr. Allport on less than one-month notice and provides for such consideration as is mutually agreed from time to time. The consulting agreement includes intellectual property, non-competition and non-solicitation provisions in favour of the Company.
The employment agreement with Michael Campbell, the former General Counsel & Corporate Secretary of the Company, effective June 15, 2017 entitled Mr. Campbell to receive a base salary of C$300,000, which is paid in Canadian dollars, per year. In addition, he was entitled to: (a) participate in the Option Plan; (b) participate in all employee benefit plans and programs; and (c) a car allowance of C$1,500 per month. The agreement provided for automatic renewal on December 31 each year from year to year in absence of notice of termination from the Company at least 90 days prior to the end of the then applicable term. If the agreement was terminated without cause, it required payment to Mr. Campbell of 3 months' base salary, plus 6 weeks' base salary for every full year of service, up to a combined maximum of 12 months. If such termination occurred within six months of a change of control of the Company, it required payment to Mr. Campbell of thirteen months' base salary, plus 6 weeks' base salary for every full year of service, up to a combined maximum of 18 months. Mr. Campbell's employment agreement contains intellectual property, non-competition and non-solicitation provisions in favour of the Company. Mr. Campbell was granted 60,000 options, of which 20,000 vested immediately on issuance, 20,000 vest on October 20, 2018 and the remaining 20,000 vest on October 20, 2019 at an exercise price of C$1.27 per share. In November 2017, Mr. Campbell received a grant of 25,000 options of which 8,334 vested immediately on issuance, 8,333 vest on November 30, 2018 and the remaining 8,333 vest on November 30, 2019 at an exercise price of C$1.15 per share. Mr. Campbell’s options will cease to be exercisable 120 days after ceasing to be employed by the Company.
Incentive Plan Awards
Outstanding Option-Based Awards and Share-Based Awards – The following table sets forth for each Named Executive Officer all awards outstanding at the end of the most recently completed financial year, including awards granted before the most recently completed financial year. Each option grant allows the holder to purchase one of the Company’s common shares.
| Name(a) | Number of securities underlying unexercised options (#)(b) | Option exercise price (U.S.$)(c) | Option expiration date(d) | Value of unexercised in-the-money options (U.S.$)(e) | Number of shares or units of shares that have not vested (#)(f) | Market or payout value of share-based awards that have not vested (U.S.$)(g) | |
Drs. Isa Odidi and Amina Odidi(1) | 2,763,940 | US$3.62 | Sept. 10, 2018 | N/A | N/A | N/A | |
| Dr. Isa Odidi | 300,000 75,000 50,000 70,000 90,000 70,000 | C$3.27 C$1.81 C$4.29 C$2.52 C$ C$1.15 | Feb. 16, 2022 Apr. 13. 2020 Feb. 28, 2019 Nov. 30, 2020 Aug. 31, 2021 | Nov. 30, 2022 | N/A N/A N/A N/A N/A N/A | N/A N/A N/A N/A N/A N/A | N/A N/A N/A N/A N/A N/A |
Dr. Amina Odidi | 300,000 75,000 50,000 70,000 90,000 70,000 | C$3.27 C$1.81 C$4.29 C$2.52 C$ C$1.15 | Feb. 16, 2022 Apr. 13. 2020 Feb. 28, 2019 Nov. 30, 2020 Aug. 31, 2021 | Nov. 30, 2022 | N/A N/A N/A N/A N/A N/A | N/A N/A N/A N/A N/A N/A | N/A N/A N/A N/A N/A N/A |
John Allport(2) | 250,000 25,000 50,000 40,000 55,000 | C$3.27 C$1.81 C$4.29 C$2.52 C$ 2.42 | Feb. 16. 2022 Apr. 13, 2020 Feb. 28, 2019 Nov. 30, 2020 Aug. 31, 2021 | N/A N/A | N/A N/A N/A N/A N/A | N/A N/A N/A N/A N/A | |
Domenic Della Penna | 60,000 50,000 70,000 | C$3.22 C$2.52 C$ 2.42 | Nov. 30, 2024 Nov. 30, 2020 Aug. 31, 2021 | N/A | N/A N/A N/A | N/A N/A N/A | |
| Andrew Patient, Chief Financial Officer(5) | 60,000 15,000 | C$1.27 C$1.15 | Oct. 20, 2027 Nov. 30, 2022 | N/A | N/A | N/A | |
Notes:
(1)
These option-based awards are held jointly.
(2)
Mr. Allport, a consultant to the Company, served as the Company’s Vice President Legal Affairs and Licensing and as a director from September 2004, until his resignation May 17, 2017.
(3)
The value of unexercised options at year-end is calculated by subtracting the option exercise price from the closing price of the common shares of the Company on the TSX for C$ exercise prices and Nasdaq for US$ exercise prices on November 30, 20162017 (C$3.701.09 and $2.79,$0.85, respectively) and multiplying the result by the number of common shares underlying an option.
(4)
Mr. Della Penna served as the Company’s Chief Financial Officer from November 24, 2014 until his resignation effective September 6, 2017. Mr. Della Penna’s options ceased to be exercisable 120 days after he ceased to be employed by the Company.
(5)
Mr. Patient was appointed as Chief Financial Officer of the Company effective September 6, 2017.
As of November 24, 2014.
Incentive Plan Awards – Value Vested or EarningEarned During the Year – The following table sets forth details of the value vested or earned during the most recently completed financial year for each incentive plan award.
| Name | Option-based awards - Value vested during the year (U.S.$) | Share-based awards - Value vested during the year (U.S.$) | Non-equity incentive plan compensation - Value earned during the year (U.S.$) |
| (a) | (b)(1) | (c) | (d) |
| Drs. Isa Odidi | N/A | N/A | N/A |
| Dr. Amina Odidi | N/A | N/A | N/A |
| John | N/A | N/A | N/A |
| Domenic Della | N/A | N/A | N/A |
| Andrew Patient, Chief Financial Officer(4) | N/A | N/A | N/A |
Notes:
(1)
The amount represents the theoretical total value if the options had been exercised on the vesting date, established by calculating the difference between the closing price of the common shares of the Company on the TSX on the vesting date and the exercise price.
(2)
Mr. Allport, a consultant to the Company, served as the Company’s Vice President Legal Affairs and Licensing and as a director from September 2004, until his resignation May 17, 2017.
(3)
Mr. Della Penna served as the Company’s Chief Financial Officer from November 24, 2014 until his resignation effective September 6, 2017. Mr. Della Penna’s options ceased to be exercisable 120 days after he ceased to be employed by the Company.
(4)
Mr. Patient was appointed as Chief Financial Officer of the Company effective November 24, 2014.September 6, 2017.
Pension Plan Benefits
The Company does not provide a defined benefit pension plan or a defined contribution pension plan for any of its Named Executive Officers, nor does it have a deferred compensation pension plan for any of its Named Executive Officers. There are no amounts set aside or accrued by the Company or its subsidiaries to provide pension, retirement or similar benefits.
Termination and Change of Control Benefits
The employment agreement with each of Dr. Isa Odidi and Dr. Amina Odidi (collectively the “Odidis”), by virtue of it being a fixed-term agreement with automatic renewal provisions, effectively provides for payments to the Odidis following termination of the employment agreement unless the agreement has been terminated in accordance with its terms. As a result, if either of the Odidis had been terminated on the last business day of the Company’s most recently completed financial year, it is estimated that an amount of up to approximately C$1.42.2 million would be payable to each of the Odidis, which is the amount that would have been payable to September 30, 2019,2022, at each of the Odidis’ current annual salary level. Given their nature as fixed term employment agreements, if notice is properly provided to not renew the agreement following the term ending September 30, 2019,2022, then as such date approaches the amount payable upon termination to the Odidis will decrease to the point where no amount would be payable upon termination as at September 30, 2019.2022. Any termination of the employment of the Odidis must be undertaken by and is subject to the prior approval of the Board. There are no payments applicable under the employment agreements of the Odidis relating to a change of control of the Company.
For a discussion of certain termination and change of control benefits under the employment agreement with Mr. Della Penna,Patient, see the description of his employment agreement under the heading “Employment Agreements” above.
Director Compensation
The following table sets forth all amounts of compensation provided to the non-executive directors for the Company’s most recently completed financial year.
| Name | Fees earned | Share-based awards | Option-based awards | Non-equity incentive plan compensation | Pension value | All other compensation | Total | |
| (a) | (b) | (c)(1) | (d)(2) | (e) | (f) | (g) | (h) | |
| Eldon Smith | - | $C40,000 | $C18,442 | N/A | N/A | N/A | $C58,442 | |
| Kenneth Keirstead | $C40,000 | N/A | $C18,442 | N/A | N/A | N/A | $C58,442 | |
| Bahadur Madhani | $C45,000 | N/A | $C18,442 | N/A | N/A | N/A | $C63,442 |
Notes:
(1)
DSUs that were earned. Does not include DSUs earned in the previous financial year and granted in the most recently completed financial year.
(2)
Option-based awards for fiscal year 20162017 were issued on November 30, 2016.2017.
Significant factors necessary to understand the information disclosed in the Director Compensation Table above include the following: Non-management directors receive an annual retainer of $25,000 paid in Canadian dollars. The Audit Committee chair receives an annual retainer of $10,000 paid in Canadian dollars. The Corporate Governance Committee chair and Compensation Committee Chair, each receives an annual retainer of $5,000 paid in Canadian dollars. Non-chair committee members, are paid an additional $2,500 per year per committee paid in Canadian dollars. Meetings will result in an additional $1,000 per day per meeting paid in Canadian dollars.
Outstanding Option-Based Awards and Share-Based Awards – The following table sets forth all amounts of option-based and share-based awards to the non-executive directors for the Company’s most recently completed financial year.
Option-based Awards | Share-based Awards | ||||||
Name | Number of securities underlying unexercised options (#) | Option exercise price (U.S.$) | Option expiration date | Value of unexercised in-the-money options (U.S.$) | Number of shares or units of shares that have not vested (#) | Market or payout value of share-based awards that have not vested (U.S.$) | |
(a) | (b) | (c) | (d) | (e)(1) | (f)(2) | (g)(3) | |
Eldon Smith | 10,000 25,000 37,500 37,500 20,000 35,000 40,000 | C$2.88 C$1.81 C$3.22 C$4.29 C$2.52 C$ C$1.15 | Oct. 22, 2019 Apr. 13, 2020 Nov. 30, 2019 Feb. 28, 2019 Nov. 30, 2020 Aug. 31, 2021 Nov. 30, 2022 | N/A | N/A N/A N/A N/A N/A N/A | N/A N/A N/A N/A N/A N/A | C$102,603 N/A N/A N/A N/A N/A N/A |
Kenneth Keirstead | 10,000 25,000 37,500 37,500 20,000 35,000 40,000 | C$2.88 C$1.81 C$3.22 C$4.29 C$2.52 C$ C$1.15 | Oct. 22, 2019 Apr. 13, 2020 Nov. 30, 2019 Feb. 28, 2019 Nov. 30, 2020 Aug. 31, 2021 | Nov. 30, 2022 | N/A N/A N/A N/A N/A N/A N/A | N/A N/A N/A N/A N/A N/A N/A | N/A N/A N/A N/A N/A N/A N/A |
Bahadur Madhani | 10,000 25,000 37,500 37,500 20,000 35,000 40,000 | C$2.88 C$1.81 C$3.22 C$4.29 C$2.52 C$ C$1.15 | Oct. 22, 2019 Apr. 13, 2020 Nov. 30, 2019 Feb. 28, 2019 Nov. 30, 2020 Aug. 31, 2021 | Nov. 30, 2022 | N/A N/A N/A N/A N/A N/A N/A | N/A N/A N/A N/A N/A N/A N/A | N/A N/A N/A N/A N/A N/A N/A |
Notes:
(1)
The value of unexercised options at year-end is calculated by subtracting the option exercise price from the closing price of the common shares of the Company on the TSX on November 30, 20162017 (C$3.70)1.09) and multiplying the result by the number of common shares underlying an option.
(2)
These DSUs are permitted to be redeemed only following termination of Board service. Includes DSUs earned as at November 30, 2016.2017.
(3)
The value of DSUs at year-end is calculated from the closing price of the common shares of the Company on the TSX on November 30, 20162017 (C$3.70)1.09) and multiplying by the number of common shares underlying a DSU.
Incentive Plan Awards – Value Vested or Earned During the Year – The following table sets forth all amounts of option-based and share-based awards vested to the non-executive directors of the Company for the most recently completed financial year and no non-equity incentive plan compensation was earned during the most recently completed financial year.
| Name | Option-based awards - Value vested during the year (U.S.$) | Share-based awards - Value vested during the year (U.S.$) | Non-equity incentive plan compensation - Value earned during the year (U.S.$) |
| (a) | (b)(1) | (c)(2) | (d) |
| Eldon Smith | N/A | N/A | Nil |
| Kenneth Keirstead | N/A | N/A | Nil |
| Bahadur Madhani | N/A | N/A | Nil |
Notes:
(1)
The amount represents the theoretical total value if the options had been exercised on the vesting date, established by calculating the difference between the closing price of the common shares of the Company on the TSX on the vesting date and the exercise price.
(2)
The amount represents the theoretical total value of DSUs which were fully vested on their respective dates of issuance. DSUs are issued at the calculated market value of a common share on the date of issuance.
Directors’ and Officers’ Liability Insurance
The Company maintains insurance for the liability of its directors and officers arising out of the performance of their duties. The total amount of such insurance maintained is $8,000,000$10,000,000 subject to a deductible loss payable of $150,000 to $250,000 by the Company.Company of $1,000,000 (for securities claims) or $500,000 (for other claims). The premium payable by the Company for the period from October 25, 2016November 30, 2017 to October 25, 2017November 30, 2018 is $99,775.$194,500.
Board of Directors
See Items 6.A and 6.B.
Committees of the Board of Directors
AUDIT COMMITTEE
The Audit Committee of the Board monitors our financial activities, policies, and internal control procedures. The Audit Committee assists the Board in fulfilling its oversight responsibility to shareholders, potential shareholders, the investment community, and others with respect to the Company’s financial statements, financial reporting process,
systems of internal accounting and disclosure controls, performance of the external auditors, and risk assessment and management. The Audit Committee has the power to conduct or authorize investigations into any matters within its scope of responsibilities, with full access to all books, records, facilities and personnel of the Company, its auditors and its legal advisors. In connection with such investigations or otherwise in the course of fulfilling its responsibilities under the Audit Committee Charter, the Audit Committee has the authority to independently retain special legal, accounting, or other consultants to advise it.
Audit Committee Charter
The charter of the Audit Committee can be found on the Company’s website at www.intellipharmaceutics.com.
Composition of the Audit Committee
Our Audit Committee is comprised of Kenneth Keirstead, Bahadur Madhani and Dr. Eldon Smith, each of whom is considered independent and financially literate (as such terms are defined under applicable Canadian securities legislation) and satisfies the independence criteria of Rule 10A3-(b)(1) under the U.S. Exchange Act. The members of the Audit Committee have selected a Chair from amongst themselves, being Mr. Madhani.
Under the Securities and Exchange Commission rules implementing the Sarbanes-Oxley Act of 2002, Canadian issuers filing reports in the United States must disclose whether their audit committees have at least one “audit committee financial expert”. Additionally, under NASDAQNasdaq Listing Rule 5605(c)(2)(A), NASDAQNasdaq requires that one member of the audit committee be financially sophisticated, meaning that they must have “past employment experience in finance or accounting, requisite professional certification in accounting, or any other comparable experience or background which results in the individual’s financial sophistication, including being or having been a chief executive officer, chief financial officer or other senior officer with financial oversight responsibilities.” The Board has determined that Mr. Madhani qualifies as an audit committee financial expert under the applicable Securities and Exchange Commission rules and as financially sophisticated under the applicable NASDAQNasdaq rules.
Relevant Education and Experience
Kenneth Keirstead is educated in clinical biochemistry as a graduate of the Pathology Institute in Halifax; and business administration, as a graduate of the College of William and Mary and Columbia University. Mr. Keirstead has been a director of the Company since January 2006. He has worked in the healthcare delivery and pharmaceutical industries for over 45 years. He was President and CEO, Sanofi Winthrop Canada Inc.; General Manager, Squibb Medical Systems International; President, Chemfet International and President, Quinton Instruments among other positions. Mr. Keirstead has published studies and reports on healthcare and related services topics. Since 1998 Mr. Keirstead’s principal occupation has been as Executive Manager of the Lyceum Group, a Canadian consulting services company primarily active in the healthcare field, of which Mr. Keirstead is the founder.
Bahadur Madhani is a chartered accountant who has been a director of the Company since March 31, 2006. He was a member of the advisory board of Quebecor Ontario and former Chairman of United Way of Toronto, former Chair of YMCA of Greater Toronto, former Chair of Nelson Mandela Children’s Fund Canada, former Chair of YMCA Canada and former Chair, Toronto Grants Review Team of the Ontario Trillium Foundation. He was awarded membership in the Order of Canada in 2001. Since 1983, Mr. Madhani’s principal occupation has been as President and CEO of Equiprop Management Limited, a Canadian property management company of which Mr. Madhani is the principal shareholder.
Dr. Eldon Smith is a medical doctor who graduated from the Dalhousie University Medical School and who has been a director of the Company since October 2009. He is president and CEO of Eldon R. Smith and Associates Ltd. a private healthcare consulting company. He is also professor emeritus at the University of Calgary, where he served as the Dean of the Faculty of Medicine subsequent to being Head of the Department of Medicine and the Division of Cardiology. Dr. Smith is past-President of the Canadian Cardiovascular Society and served as Chairman of the Scientific Review Committee of the Heart and Stroke Foundation of Canada. Dr. Smith was appointed as an Officer of the Order of Canada. In October 2006, Dr. Smith was appointed by the Honourable Tony Clement, Minister of Health, to chair the Steering Committee responsible for developing a new Heart-Health strategy to fight heart disease in Canada. Dr. Smith currently serves as Chairman of the Libin Cardiovascular Institute of Alberta and of Logiq Asset Management Inc. (formerly Aston Hill Financial Inc.) and is a director of Resverlogix Corp, and Zenith Epigenetics Corp, and is a past director of Canadian Natural Resources Limited.Capital Corp.
Pre-Approval Policies and Procedures
The Audit Committee reviewed with the independent auditor (who is responsible for expressing an opinion on the conformity of the Company’s audited financial statements with accounting principles generally accepted in the United States of America) their judgments as to the quality, not just the acceptability, of the Company’s accounting principles and such other matters as are required to be discussed with the Audit Committee under Canadian and United States generally accepted auditing standards. In addition, the Audit Committee has discussed with the independent auditor the auditor’s independence from management and the Company including the matters in the written disclosures provided to the Audit Committee by the independent auditor, and considered the compatibility of non-audit services with the auditor’s independence.
The Company’s independent auditor is accountable to the Board and to the Audit Committee. The Board, through the Audit Committee, has the ultimate responsibility to evaluate the performance of the independent auditor, and through the shareholders, to appoint, replace and compensate the independent auditor. Under the Sarbanes-Oxley Act of 2002, the independent auditor of a public company is prohibited from performing certain non-audit services. The Audit Committee has adopted procedures and policies for the pre-approval of non-audit services, as described in the Audit Committee Charter. Under the terms of such policies and procedures, the Audit Committee has adopted a list of pre-approved services, including audit and audit-related services and tax services, and a list of prohibited non-audit services deemed inconsistent with an auditor’s independence.
The list of pre-approved services includes:
1.
Audit Services
●
Audits of the Company’s consolidated financial statements;
●
Statutory audits of the financial statements of the Company’s subsidiaries;
2.
Audit-Related Services
●
Reviews of the quarterly consolidated financial statements of the Company;
●
Services associated with registration statements, prospectuses, periodic reports and other documents filed with securities regulatory bodies (such as the SEC and the Ontario Securities Commission) or other documents issued in connection with securities offerings (e.g., comfort letters and consent letters) and assistance in responding to comment letters from securities regulatory bodies;
●
Special attest services as required by regulatory and statutory requirements;
●
Regulatory attestation of management reports on internal controls as required by the regulators; and
●
Consultations with the Company’s management as to the accounting or disclosure treatment of transactions or events and/or the actual or potential impact of final or proposed rules, standards or interpretations by the securities regulatory authorities, accounting standard setting bodies (such as the Financial Accounting Standards Board or Chartered Professional Accountants of Canada), or other regulatory or standard setting bodies.
●
Presentations or training on accounting or regulatory pronouncements;
●
Due diligence services related to accounting and tax matters in connection with potential acquisitions / dispositions; and
3.
Tax Services
a.
Compliance Services
●
Assistance with the preparation of corporate income tax returns and related schedules for the Company and its subsidiaries;
●
Assistance with the preparation of Scientific Research & Experimental Development investment tax credit claims and amended tax returns of the Company; and
●
Assistance in responding to Canada Revenue Agency or Internal Revenue Service on proposed reassessments and other matters.matters;
b.
Canadian & International Planning Services
●
Advice with respect to cross-border/transfer pricing tax issues;
●
Advice related to the ownership of corporate intellectual property in jurisdictions outside of Canada;
●
Assistance in interpreting and understanding existing and proposed domestic and international legislation, and the administrative policies followed by various jurisdictions in administering the law, including assisting in applying for and requesting advance tax rulings or technical interpretations;
●
Assistance in interpreting and understanding the potential impact of domestic and foreign judicial tax decisions;
●
Assistance and advising on routine planning matters; and
●
Assistance in advising on the implications of the routine financing of domestic and foreign operations, including the tax implications of using debt or equity in structuring such financing, the potential impact of non-resident withholding tax and the taxation of the repatriation of funds as a return of capital, a payment of a dividend, or a payment of interest.interest;
c.
Commodity Tax Services
●
Assistance regarding Harmonized Sales Tax/Goods and Services Sales Tax/Provincial Sales Tax/Customs/Property Tax filings and assessments;
●
Commodity tax advice and compliance assistance with business reorganizations;
●
Advice and assistance with respect to government audits/assessments;
●
Advice with respect to other provincial tax filings and assessments; and
●
Assistance with interpretations or rulings.rulings;
4.
All Other Services
●
Advice and documentation assistance with respect to internal controls over financial reporting and disclosure controls and procedures of the Company.
The list of prohibited services includes:
●
Bookkeeping or other services related to the preparation of accounting records or financial statements;
●
Financial information systems design and implementation;
●
Appraisal or valuation services for financial reporting purposes;
●
Actuarial services for items recorded in the financial statements;
●
Internal audit outsourcing services;
●
Management functions;
●
Human resources;
●
Certain corporate finance and other services;
●
Legal services; and
●
Certain expert services unrelated to the audit.
The Audit Committee also discusses with the Company’s independent auditor the overall scope and plans for their audit. The Audit Committee meets with the independent auditor, with and without management present, to discuss the results of their examination, their evaluations of the Company’s internal controls, and the overall quality of the Company’s financial reporting. The Audit Committee held four4 meetings during the period from December 1, 20152016 to November 30, 2016.2017.
In reliance on the reviews and discussions referred to above, the Audit Committee recommended to the Board (and the Board approved) that the audited consolidated financial statements be included in the Annual Report
for the year ended November 30, 20162017 for filing with the Canadian provincial securities commissions and the SEC.
COMPENSATION NOMINATING,COMMITTEE AND CORPORATE GOVERNANCE COMMITTEE
Compensation Committee Mandate and Purpose
The Compensation Committee of the Board is a standing committee of the Board whose primary function is to assist the Board in fulfilling its responsibilities relating to:
●
the development, review and periodic approval of the Company’s compensation philosophy that attracts and retains key executives and employees, while supporting the overall business strategy and objectives and links compensation with business objectives and organizational performance;
●
evaluate and approve all compensation of executive officers including salaries, bonuses and equity compensation that are required to be determined;
●
review the Company’s Option Plan, the employee RSU plan and the DSU plan on an annual basis;
●
review and make recommendations to the Board on compensation payable to senior officers of the Company to be hired subsequent to the adoption of the Charter; and
●
produce a report annually on executive officer compensation for inclusion in the proxy circular of the Company.
Compensation Committee Charter
The charter of the Compensation Committee can be found on the Company’s website at www.intellipharmaceutics.com.
Composition of the Compensation Committee
The Compensation Committee is composed of Kenneth Keirstead, Bahadur Madhani and Dr. Eldon Smith, each of whom is considered independent and is a director of the Company. All of the members shall be “independent” as such term is defined in applicable securities legislation. In no case shall a member be a current employee or immediate family member of a current employee. The members of the Compensation Committee have selected a Chair from amongst themselves, being Dr. Eldon Smith.
Corporate Governance Committee Mandate and Purpose
The Corporate Governance Committee of the Board is a standing committee of the Board whose primary function is to assist the Board in dealing with the corporate governance matters described in the Charter.
Corporate Governance Committee Charter
The charter of the Corporate Governance Committee can be found the Company’s website at www.intellipharmaceutics.com.
Composition of the Corporate Governance Committee
The Corporate Governance Committee is composed of three directors, two of whom shall be “independent” as such term is defined in applicable securities legislation. Kenneth Keirstead, and Dr. Eldon Smith isand Bahadur Madhani, each considered independent andof whom is a director of the Company. John Allport, an officer of the Company, is not considered independent and is a director of the Company. The members of the Corporate Governance Committee have selected a Chair from amongst themselves, being Kenneth Keirstead.
The number of full-time employees as of each of last three fiscal years is as follows:
| November 30, 2016 | November 30, 2015 | November 30, 2014 | November 30, 2017 | November 30, 2016 | November 30, 2015 | |
| Research Employees | 44 | 40 | 35 | 51 | 40 | 35 |
| Administrative Employees | 10 | 12 | 11 | 11 | 12 | 11 |
Our employees are not governed by a collective agreement. We have not experienced a work stoppage and believe our employee relations are satisfactory.
The nature of our business requires the recruitment and retention of a highly educated and skilled workforce, including highly qualified management, scientific and manufacturing personnel for innovation, research and development. Typically a high proportion of our employees have a Bachelor’s degree or higher. For each of the last three fiscal years, all employees of the Company were employed at the Company’s offices in Toronto.
The following table states the names of the directors and officers of the Company, the positions within the Company now held by them, and the approximate number of common shares of the Company beneficially owned or over which control or direction is exercised by each of them as of February 27, 2017.
| Name | Position with the Company | Number of Common Shares Owned | Percentage of Common Shares Owned | Number of Stock Options Held(2) | Exercise Price | Option Expiry dd/mm/yyyy | Number of Currently Exercisable Options(4) | Number of Common Shares Issuable on Conversion of Convertible Debt | Number of Deferred Share Units Held | Number of Restricted Share Units Held |
| Dr. Isa Odidi | Chief Executive Officer and Chairman of the Board and Director of the Company | 5,781,312(1) | 19.17% | 2,763,940 300,000 75,000 50,000 70,000 90,000 | $3.62 C$3.27 C$1.81 C$4.29 C$2.52 C$2.43 | 10/09/2016 16/02/2022 13/04/2020 28/02/2019 30/11/2020 31/08/2021 | 2,211,152 300,000 75,000 50,000 70,000 60,000 | 450,000(3) | N/A | N/A |
| Dr. Amina Odidi | President, Chief Operating Officer and Director of the Company | 5,781,312(1) | 19.17% | 2,763,940 300,000 75,000 50,000 70,000 90,000 | $3.62 C$3.27 C$1.81 C$4.29 C$2.52 C$2.43 | 10/09/2016 16/02/2022 13/04/2020 28/02/2019 30/11/2020 31/08/2021 | 2,211,152 300,000 75,000 50,000 70,000 60,000 | 450,000(3) | N/A | N/A |
| John N. Allport | Vice-President, Legal Affairs and Licensing and Director of the Company | 110,558 | 0.37% | 250,000 25,000 50,000 40,000 55,000 | C$3.27 C$1.8 1C$4.29 C$2.52 C$2.43 | 16/02/2022 13/04/2020 28/02/2019 30/11/2020 31/08/2021 | 250,000 25,000 50,000 40,000 37,000 | N/A | N/A | Nil |
| Dr. Eldon R. Smith | Director of the Company | 21,731 | 0.07% | 10,000 25,000 37,500 37,500 20,000 35,000 | C$2.88 C$1.81 C$4.29 C$3.22 C$2.52 C$2.43 | 22/10/2019 13/04/2020 28/02/2019 30/11/2019 30/11/2020 31/08/2021 | 10,000 25,000 37,500 37,500 20,000 24,000 | N/A | 79,099 | N/A |
| Kenneth Keirstead | Director of the Company | Nil | Nil | 10,000 25,000 37,500 37,500 20,000 35,000 | C$2.88 C$1.81 C$4.29 C$3.22 C$2.52 C$2.43 | 22/10/2019 13/04/2020 28/02/2019 30/11/2019 30/11/2020 31/08/2021 | 10,000 25,000 37,500 37,500 20,000 24,000 | N/A | Nil | N/A |
| Bahadur Madhani | Director of the Company | 7,507 | 0.03% | 10,000 25,000 37,500 37,500 20,000 35,000 | C$2.88 C$1.81 C$4.29 C$3.22 C$2.52 C$2.43 | 22/10/2019 13/04/2020 28/02/2019 30/11/2019 30/11/2020 31/08/2021 | 10,000 25,000 37,500 37,500 20,000 24,000 | N/A | Nil | N/A |
| Dr. Patrick Yat | Vice-President Pharmaceutical Analysis and Chemistry of the Company | 27,172 | 0.09% | 50,000 15,000 15,000 25,000 | C$3.82 C$1.81 C$2.52 C$2.43 | 24/05/2021 13/04/2020 30/11/2020 31/08/2021 | 50,000 15,000 15,000 17,000 | N/A | N/A | Nil |
| Domenic Della Penna | Chief Financial Officer of the Company | 173,700 | 0.58% | 60,000 50,000 70,000 | C$3.22 C$2.52 C$2.43 | 30/11/2024 30/11/2020 31/08/2021 | 45,000 50,000 47,000 | N/A | N/A | Nil |
| Totals | 6,121,980 | 20.30% | 5,133,940 | 4,424,152 | 450,000 | 79,099 | Nil |
| Name | Position with the Company | Number of Common Shares Owned | Percentage of Common Shares Owned | Number of Stock Options Held(2) | Exercise Price | Option Expiry dd/mm/yyyy | Number of Currently Exercisable Options(4) | Number of Common Shares Issuable on Conversion of Convertible Debt | Number of Deferred Share Units Held | Number of Restricted Share Units Held |
| Dr. Isa Odidi | Chief Executive Officer and Chairman of the Board and Director of the Company | 5,781,312(1) | 16.66% | 2,763,940 300,000 75,000 50,000 70,000 90,000 70,000 | $3.62 C$3.27 C$1.81 C$4.29 C$2.52 C$2.42 C$1.15 | 10/09/2018 16/02/2022 13/04/2020 28/02/2019 30/11/2020 31/08/2021 30/11/2022 | 2,487,546 300,000 75,000 50,000 70,000 90,000 23,334 | 450,000(3) | N/A | N/A |
| Dr. Amina Odidi | President, Chief Operating Officer and Director of the Company | 5,781,312(1) | 16.66% | 2,763,940 300,000 75,000 50,000 70,000 90,000 70,000 | $3.62 C$3.27 C$1.81 C$4.29 C$2.52 C$2.42 C$1.15 | 10/09/2018 16/02/2022 13/04/2020 28/02/2019 30/11/2020 31/08/2021 30/11/2022 | 2,487,546 300,000 75,000 50,000 70,000 90,000 23,334 | 450,000(3) | N/A | N/A |
| John N. Allport | Consultant; Former Vice-President, Legal Affairs and Licensing and Former Director of the Company | 110,558 | 0.32% | 250,000 25,000 50,000 40,000 55,000 | C$3.27 C$1.81 C$4.29 C$2.52 C$2.42 | 16/02/2022 13/04/2020 28/02/2019 30/11/2020 31/08/2021 | 250,000 25,000 50,000 40,000 55,000 | N/A | N/A | Nil |
| Dr. Eldon R. Smith | Director of the Company | 21,731 | 0.06% | 10,000 25,000 37,500 37,500 20,000 35,000 40,000 | C$2.88 C$1.81 C$4.29 C$3.22 C$2.52 C$2.42 C$1.15 | 22/10/2019 13/04/2020 28/02/2019 30/11/2019 30/11/2020 31/08/2021 30/11/2022 | 10,000 25,000 37,500 37,500 20,000 35,000 13,334 | N/A | 94,131 | N/A |
| Kenneth Keirstead | Director of the Company | Nil | Nil | 10,000 25,000 37,500 37,500 20,000 35,000 40,000 | C$2.88 C$1.81 C$4.29 C$3.22 C$2.52 C$2.42 C$1.15 | 22/10/2019 13/04/2020 28/02/2019 30/11/2019 30/11/2020 31/08/2021 30/11/2022 | 10,000 25,000 37,500 37,500 20,000 35,000 13,334 | N/A | Nil | N/A |
| Bahadur Madhani | Director of the Company | 7,507 | 0.02% | 10,000 25,000 37,500 37,500 20,000 35,000 40,000 | C$2.88 C$1.81 C$4.29 C$3.22 C$2.52 C$2.42 C$1.15 | 22/10/2019 13/04/2020 28/02/2019 30/11/2019 30/11/2020 31/08/2021 30/11/2022 | 10,000 25,000 37,500 37,500 20,000 35,000 13,334 | N/A | Nil | N/A |
| Dr. Patrick Yat | Vice-President, Chemistry and Analytical Services | 27,172 | 0.08% | 50,000 15,000 15,000 25,000 15,000 | C$3.82 C$1.81 C$2.52 C$2.42 C$1.15 | 24/05/2021 13/04/2020 30/11/2020 31/08/2021 30/11/2022 | 50,000 15,000 15,000 25,000 5,000 | N/A | N/A | Nil |
| Andrew Patient | Chief Financial Officer of the Company | Nil | Nil | 60,000 15,000 | C$1.27 C$1.15 | 20/10/2027 30/11/2022 | 20,000 5,000 | N/A | N/A | Nil |
| Totals | 5,948,280 | 17.14% | 5,388,940 | 4,822,550 | 450,000 | 94,131 | Nil |
Notes:
(1)
Represents shares owned of record by Odidi Holdings Inc., a privately-held company controlled by Drs. Amina and Isa Odidi. In addition, 2,763,940 performance-based options are held by Drs. Amina and Isa Odidi, and 585,000655,000 stock options are held by each of Dr. Isa Odidi and Dr. Amina Odidi.
(2)
For information regarding option expiration dates and exercise price refer to the tables included under Item 6.B.
(3)
On January 10, 2013, the Company completed a private placement financing of the Debenture in the original principal amount of $1.5 million, which was originally due to mature January 1, 2015. The Debenture bears interest at a rate of 12% per annum, payable monthly, is pre-payable at any time at the option of the Company, and was convertible at any time into 500,000 common shares at a conversion price of US$3.00 per common share at the option of the holder. Drs. Isa and Amina Odidi, principal stockholders, directors and executive officers of the Company provided the Company with the $1.5 million of the proceeds for the Debenture. Effective October 1, 2014, the original maturity date for the Debenture was extended to July 1, 2015; effective June 29, 2015, the July 1, 2015 maturity date was extended to January 1, 2016; effective as of December 8, 2015, the maturity date was extended to July 1, 2016; and effective May 26, 2016, the maturity date of the Debenture was further extended to December 1, 2016. Effective December 1, 2016, the maturity date for the Debenture was extended to April 1, 2017 and a principal repayment of $150,000 was made at the time of the extension. After giving effect to such partial repayment, the Debenture is convertible at any time into 450,000 common shares at a conversion price of $3.00 per common share at the option of the holder. The maturity date of the Debenture has been further extended to October 1, 2018. The Company currently expects to repay the current net amount of $1,350,000 on or about AprilOctober 1, 2017,2018, if the Company then has cash available.
(4)
Includes options exercisable within 60 days of the date of this filing.
As of February 27, 2017,2018, the directors and executive officers of the Company as a group owned, directly or indirectly, or exercised control or direction over 6,121,9805,948,280 common shares, representing approximately 20.3%17.1% of the issued common shares of the Company (and beneficially owned approximately 10,996,13211,220,830 common shares representing 31.4%28.1% of our common shares including common shares issuable upon the exercise of outstanding options and the conversion of the convertible debenture that are exercisable or convertible within 60 days of the date hereof). As of February 27, 2018, Mr. Campbell owned options (exercisable until October 20, 2027) to purchase 60,000 common shares at a price of C$1.27 and options (exercisable until November 30, 2022) to purchase 25,000 common shares at a price of C$1.15. Mr. Campbell’s options will cease to be exercisable 120 days after he ceases to be employed by the Company.
The Company has in place the Option Plan for the benefit of certain officers, directors, employees and consultants of the Company, including the Named Executive Officers (see below under “Employee“Employee Stock Option Plan”Plan”). Certain Named Executive Officers have been issued options under such plan. The Company has also granted performance-based options to Dr. Isa Odidi and Dr. Amina Odidi pursuant to a separate option agreement, which was negotiated with the Named Executive Officers at the same time as their employment agreements. These options vest upon the Company attaining certain milestones relating to FDA filings and approvals for Company drugs, such that 276,394 options vest in connection with each of the FDA filings for the first five Company drugs and 276,394 options vest in connection with each of the FDA approvals for the first five Company drugs. To date, the level of these performance-based options has been taken into account by the Board and impacted the Company’s decisions about base salary and option-based awards under the Option Plan for the Named Executive Officers. No other performance-based options have been granted to any other Named Executive Officer.
Employee Stock Option Plan
The Option Plan was adopted effective October 22, 2009 as part of the IPC Arrangement Transaction approved by the shareholders of IPC Ltd., our predecessor company, at the meeting of shareholders on October 19, 2009. Subject to the requirements of the Option Plan, the Board, with the assistance of the Compensation Committee, has the authority to select those directors, officers, employees and consultants to whom options will be granted, the number of options to be granted to each person and the price at which common shares of the Company may be purchased. Grants are determined based on individual and aggregate performance as determined by the Board.
The key features of the Option Plan are as follows:
●
The eligible participants are full-time and part-time employees, officers and directors of, or consultants to, the Company or its affiliates, which may be designated from time to time by the Board.
●
The fixed maximum percentage of common shares issuable under the Option Plan is 10% of the issued and outstanding common shares from time to time. The Option Plan will automatically “reload” after the exercise of an option provided that the number of common shares issuable under the Option Plan does not then exceed the maximum percentage of 10%.
●
There are no restrictions on the maximum number of options which may be granted to insiders of the Company other than not more than 1% of the total common shares outstanding on a non-diluted basis can be issued to non-executive directors of the Company pursuant to options granted under the Option Plan and the value of any options granted to any non-executive director of the Company, shall not, on an annual basis, exceed $100,000.
●
The Board determines the exercise price of each option at the time the option is granted, provided that such price is not lower than the “market price” of common shares at the time the option is granted. “Market price” means the volume weighted average trading price of common shares on the TSX, or another stock exchange where the majority of the trading volume and value of common shares occurs, for the five trading days immediately preceding the relevant date, calculated in accordance with the rules of such stock exchange.
●
Unless otherwise determined by the Board, each option becomes exercisable as to 33⅓% on a cumulative basis, at the end of each of the first, second and third years following the date of grant.
●
The period of time during which a particular option may be exercised is determined by the Board, subject to any Employment Contract or Consulting Contract (both as hereinafter defined), provided that no such option term shall exceed 10 years.
●
If an option expiration date falls within a “black-out period” (a period during which certain persons cannot trade common shares pursuant to a policy of the Company’s respecting restrictions on trading), or immediately following a black-out period, the expiration date is automatically extended to the date which is the tenth business day after the end of the black-out period.
Options may terminate prior to expiry of the option term in the following circumstances:
●
on death of an optionee, options vested as at the date of death are immediately exercisable until the earlier of 180 days from such date and expiry of the option term; and
●
if an optionee ceases to be a director, officer, employee or consultant of the Company for any reason other than death, including receipt of notice from the Company of the termination of his, her or its Employment Contract or Consulting Contract (as defined below), options vested as at the date of termination are exercisable until the earlier of 120 days following such date and expiry of the option term, subject however to any contract between the Company and any employee relating to, or entered into in connection with, the employment of the employee or between the Company and any director with respect to his or her directorship or resignation there from (an “Employment Contract”), any contract between the Company and any consultant relating to, or entered into in connection with, services to be provided to the Company (a “Consulting Contract”) or any other agreement to which the Company is a party with respect to the rights of such person upon termination or change in control of the Company.
●
Options and rights related thereto held by an optionee are not to be assignable or transferable except on the death of the optionee.
●
If there is a take-over bid (within the meaning of the Securities Act (Ontario)) made for all or any of the issued and outstanding common shares of the Company, then all options outstanding become immediately exercisable in order to permit common shares issuable under such options to be tendered to such bid.
●
If there is a consolidation, merger, amalgamation or statutory arrangement involving the Company, separation of the business of the Company into two or more entities or sale of all or substantially all of the assets of the Company to another entity, the optionees will receive, on exercise of their options, the consideration they would have received had they exercised their options immediately prior to such event. In such event and in the event of a securities exchange take-over bid, the Board may, in certain circumstances, require optionees to surrender their options if replacement options are provided. In the context of a cash take-over bid for 100% of the issued and outstanding common shares of the Company, optionees may elect to conditionally surrender their options or, if provided for in an agreement with the offeror, automatically exchange their options for options of the offeror.
●
The Board may from time to time in its absolute discretion amend, modify and change the provisions of the Option Plan or any options granted pursuant to the Option Plan, provided that any amendment, modification or change to the provisions of the Option Plan or any options granted pursuant to the Option Plan shall:
●
not adversely alter or impair any option previously granted;
●
be subject to any regulatory approvals, where required, including, where applicable, the approval of the TSX and/or such other exchange as may be required; and
●
not be subject to shareholder approval in any circumstances, except where the amendment, modification or change to the Option Plan or option would:
(i)
reduce the exercise price of an option held by an insider of the Company;
(ii)
extend the term of an option held by an insider beyond the original expiration date (subject to such date being extended in a black-out extension situation);
(iii)
increase the fixed maximum percentage of common shares issuable under the Option Plan; or
(iv)
amend the amendment provision of the Option Plan;
in which case the amendment, modification or change will be subject to shareholder approval in accordance with the rules of the TSX and/or such other exchange as may be required. Amendments to the Option Plan not requiring shareholder approval may for example include, without limitation:
●
amendments of a “housekeeping nature”, including any amendment to the Option Plan or an option that is necessary to comply with applicable law or the requirements of any regulatory authority or stock exchange;
●
changes to the exercise price of an option to an exercise price not below the “market price” unless the change is a reduction in the exercise price of an option held by an insider of the Company;
●
amendments altering, extending or accelerating any vesting terms or conditions in the Option Plan or any options;
●
changes amending or modifying any mechanics for exercising an option;
●
amendments changing the expiration date (including acceleration thereof) or changing any termination provision in any option, provided that such change does not entail an extension beyond the original expiration date of such option (subject to such date being extended in a black-out extension situation);
●
amendments introducing a cashless exercise feature, payable in securities, whether or not such feature provides for a full deduction of the number of underlying securities from the Option Plan maximum;
●
amendments changing the application of the provisions of the Option Plan dealing with adjustments in the number of shares, consolidations and mergers and take-over bids;
●
amendments adding a form of financial assistance or amending a financial assistance provision which is adopted;
●
amendments changing the eligible participants of the Option Plan; and
●
amendments adding a deferred or restricted share unit provision or any other provision which results in participants receiving securities while no cash consideration is received by the Company.
The Board may discontinue the Option Plan at any time without consent of the participants under the Option Plan provided that such discontinuance shall not adversely alter or impair any option previously granted.
A copy of the Option Plan is available upon request in writing to the Chief Financial Officer of the Company at 30 Worcester Road, Toronto, Ontario, M9W 5X2 or on www.sedar.com.
A total of the3,064,172 options to purchase common shares issued and outstanding as at February 27, 2017. Of the options authorized for issuance under the Option Plan, a total of 2,621,344 have been issued, representing 8.7%8.8% of the shares issued and outstanding as of February 27, 2017.2018. As of February 27, 2017, 156,5002018, 172,000 options have been exercised under the Plan.
The Company has also granted performance-based options to Dr. Isa Odidi and Dr. Amina Odidi pursuant to a separate option agreement, which was negotiated at the same time as their employment agreements. These options vest upon the Company attaining certain milestones relating to FDA filings and approvals for the development of Company drugs, such that 276,394 options vest in connection with each of the FDA filings for the first five Company drugs and 276,394 options vest in connection with each of the FDA approvals for the first five Company drugs. To date, the level of these performance-based options has been taken into account by the Board and impacted the Company’s decisions about base salary and option-based awards under the Option Plan for the said Named Executive Officers.
Restricted Share Unit Awards for Officers & Employees
The Company established the RSU Plan to form part of its incentive compensation arrangements available for officers and employees of the Company and its designated affiliates as of May 28, 2010, when the RSU Plan received shareholder approval.
The key features of the RSU Plan are as follows:
●
The stated purpose of the RSU Plan is to advance the interests of the Company through the motivation, attraction and retention of employees and officers of the Company and the designated affiliates of the Company and to secure for the Company and the shareholders of the Company the benefits inherent in the ownership of common shares by employees and officers of the Company, it being generally recognized that share incentive plans aid in attracting, retaining and encouraging employees and officers due to the opportunity offered to them to acquire a proprietary interest in the Company and to align their interests with those of the Company. Employees and officers, including both full-time and part-time employees, of the Company and any designated affiliate of the Company, but not any directors of the Company, are eligible to participate under the RSU Plan. By the terms of the RSU Plan, Dr. Isa Odidi, the Chief Executive Officer of the Company, and Dr. Amina Odidi, the President and Chief Operating Officer of the Company, are specifically not eligible to participate.
●
The RSU Plan is administered by the Board or a committee thereof, which will determine, from time to time, who may participate in the RSU Plan, the number of RSUs to be awarded and the terms of each RSU, all such determinations to be made in accordance with the terms and conditions of the RSU Plan, based on individual and/or corporate performance factors as determined by the Board.
●
The number of common shares available for issuance upon the vesting of RSUs awarded under the RSU Plan is limited to an aggregate of 330,000 common shares of the Company representing approximately 1.4%1.0% of the issued and outstanding common shares of the Company as of February 27, 2017.2018.
●
A separate notional account will be maintained for each participant under the RSU Plan. Each such account will be credited with RSUs awarded to the participant from time to time by way of a bookkeeping entry in the books of the Company. On the vesting of the RSUs and the corresponding issuance of common shares to the participant, or on the forfeiture and cancellation of the RSUs, the RSUs credited to the participant’s account will be cancelled.
●
At the time of the award of RSUs, the Board will determine in its sole discretion the vesting criteria (whether based on time or performance measures of individual and/or corporate performance) applicable to the awarded RSUs. Unless otherwise determined by the Board at the time of the award, RSUs will vest in respect of 33 1/3% of the common shares subject to the RSUs on the first day after each of the first three anniversaries of the award date of such RSU. Notwithstanding the foregoing, all vesting and issuances or payments, as applicable, will be completed no later than December 15 of the third calendar year commencing after an award date.
●
The RSU Plan provides that any unvested RSUs will vest at such time as determined by the Board in its sole discretion such that participants in the RSU Plan will be able to participate in a change of control transaction, including by surrendering such RSUs to the Company or a third party or exchanging such RSUs, for consideration in the form of cash and/or securities.
●
Under the RSU Plan, should the vesting of an RSU fall within a blackout period or within nine business days following the expiration of a blackout period, the vesting will be automatically extended to the tenth business day after the end of the blackout period.
●
If an “event of termination” of employment has occurred, any and all common shares corresponding to any vested RSUs in a participant’s account, if any, will be issued as soon as practicable after the event of termination to the former participant. If an event of termination has occurred, any unvested RSUs in the participant’s account will, unless otherwise determined by the Board in its discretion, forthwith and automatically be forfeited by the participant and cancelled. Notwithstanding the foregoing, if a participant is terminated for just cause, each unvested RSU in the participant’s account will be forfeited by the participant and cancelled. An “event“event of termination”termination” is defined under the RSU Plan as an event whereby a participant ceases to be eligible under the RSU Plan and is deemed to have occurred by the giving of any notice of termination of employment (whether voluntary or involuntary and whether with or without cause), retirement, or any cessation of employment for any reason whatsoever, including disability or death.
●
No rights under the RSU Plan and no RSUs awarded pursuant to the provisions of the RSU Plan are assignable or transferable by any participant other than pursuant to a will or by the laws of descent and distribution.
●
Under the RSU Plan, the Board may from time to time in its absolute discretion amend, modify and change the provisions of the RSU Plan or any RSUs awarded pursuant to the Plan, provided that any amendment will:
●
not adversely alter or impair any RSU previously awarded except as permitted by the adjustment provisions in the RSU Plan;
●
be subject to any regulatory approvals including, where required, the approval of the TSX;
●
be subject to shareholder approval in accordance with the rules of the TSX in circumstances where the amendment, modification or change to the RSU Plan or RSUs would:
(i)
allow for the assignment or transfer of any right under the RSU Plan or a RSU awarded pursuant to the provisions of the RSU Plan other than as provided for under the assignability provisions in the RSU Plan;
(ii)
increase the fixed maximum number of common shares which may be issued pursuant to the RSU Plan; or
(iii)
amend the amendment provisions of the RSU Plan; and
●
not be subject to shareholder approval in circumstances (other than those listed in the paragraph immediately above), including, but not limited to, circumstances where the amendment, modification or change to the RSU Plan or RSU would:
(i)
be of a “housekeeping nature”, including any amendment to the RSU Plan or a RSU that is necessary to comply with applicable law or the requirements of any regulatory authority or stock exchange and any amendment to the RSU Plan or a RSU to correct or rectify any ambiguity, defective provision, error or omission therein, including any amendment to any definitions therein;
(ii)
alter, extend or accelerate any vesting terms or conditions in the RSU Plan or any RSU;
(iii)
change any termination provision in any RSU;
(iv)
introduce features to the RSU Plan that would permit the Company to, instead of issuing common shares from treasury upon the vesting of the RSUs, retain a broker and make payments for the benefit of participants to such broker who would purchase common shares through the facilities of the TSX for such participants;
(v)
(vi)
change the application of the adjustment provisions of the RSU Plan or the change of control provisions of the RSU Plan; or
(vii)
change the eligible participants under the RSU Plan.
A copy of the RSU Plan is available upon request in writing to the Chief Financial Officer of the Company at 30 Worcester Road, Toronto, Ontario, M9W 5X2.
The 330,000 common shares that are currently authorized for issuance under the RSU Plan represent approximately 1.4%1.0% of the Company’s common shares issued and outstanding as at February 27, 2017.2018. No RSUs have been issued and none are outstanding as of February 27, 2017.2018.
Deferred Share Unit Awards for Outside Directors
The Company established as of May 28, 2010 when it received shareholder approval, a deferred share unit plan (the “DSU Plan”) to permit directors who are not officers of the Company, to defer receipt of all or a portion of their Board fees until termination of Board service and to receive such fees in the form of common shares at that time.
The key features of the DSU Plan are as follows:
●
The DSU Plan is administered by the Board or a committee thereof. Members of the Board who are not salaried officers or employees of the Company or a related corporation are eligible to participate under the DSU Plan. By the terms of the DSU Plan, Dr. Isa Odidi, the Chief Executive Officer of the Company, and Dr. Amina Odidi, the President and Chief Operating Officer of the Company, are specifically not eligible to participate.
●
The number of common shares available for issuance upon redemption of DSUs issued under the DSU Plan is limited to 110,000 common shares of the Company, representing approximately 0.4%0.3% of the total number of issued and outstanding common shares as of the date hereof.February 27, 2018.
●
Each participant may elect to be paid a minimum of 20% up to a maximum of 100%, in 10% increments, of Board fees in the form of DSUs in lieu of being paid such fees in cash. On the date on which Board fees are payable (on a quarterly basis), the number of DSUs to be credited to the participant is determined by dividing an amount equal to the designated percentage of the Board fees that the participant has elected to have credited in DSUs on that fee payment date, by the calculated market value of a common share (typically on the TSX) on that fee payment date. The market value of a common share is the weighted average trading price of the common shares on any exchange where the common shares are listed (including the TSX) for the last five trading days prior to such day. If dividends are declared by the Company, a participant will also be credited with dividend equivalents in the form of additional DSUs based on the number of DSUs the participant holds on the record date for the payment of a dividend. Dividend equivalents are calculated by dividing (i) the amount obtained by multiplying the amount of the dividend declared and paid per common share by the number of DSUs in the participant’s account on the record date for the payment of such dividend, by (ii) the market value of a common share on that dividend payment date. The market value of a common share is the weighted average trading price of the common shares on any exchange where the common shares are listed (including the TSX) for the last five trading days prior to such day.
●
A participant is permitted to redeem his/her DSUs only following termination of Board service by way of retirement, non-re-election as a director, resignation or death. Upon redemption of DSUs, the Company will issue to the participant common shares of the Company equal to the number of DSUs to be redeemed.
●
A separate notional account is maintained for each participant under the DSU Plan. Each such account will be credited with DSUs issued to the participant from time to time by way of a bookkeeping entry in the books of the Company. The DSUs credited to the participant’s account will be cancelled as of the applicable redemption date and following redemption of all DSUs credited to the participant’s account, such participant’s account will be closed.
●
No rights under the DSU Plan and no DSUs credited pursuant to the provisions of the DSU Plan are assignable or transferable by any participant other than pursuant to a will or by the laws of descent and distribution.
●
Under the DSU Plan, the Board may from time to time in its absolute discretion amend, modify and change the provisions of the DSU Plan or any DSUs issued pursuant to the DSU Plan, provided that any amendment will:
●
not adversely alter or impair any DSU previously credited without such participant’s consent in writing except as permitted by the adjustment provisions in the DSU Plan;
●
be subject to any regulatory approvals including, where required, the approval of the TSX;
●
be subject to shareholder approval in accordance with the rules of the TSX in circumstances where the amendment, modification or change to the DSU Plan or DSU would:
(i)
allow for the assignment or transfer of any right under the DSU Plan or a DSU credited pursuant to the provisions of the DSU Plan other than as provided for under the assignability provisions in the DSU Plan;
(ii)
increase the fixed maximum number of common shares which may be issued pursuant to the DSU Plan; or
(iii)
amend the amendment provisions of the DSU Plan; and
●
not be subject to shareholder approval in circumstances (other than those listed in the paragraph immediately above), including, but not limited to, circumstances where the amendment, modification or change to the DSU Plan or DSU would:
(i)
be of a “housekeeping nature”, including any amendment to the DSU Plan or a DSU that is necessary to comply with applicable law or the requirements of any regulatory authority or stock exchange and any amendment to the DSU Plan or a DSU to correct or rectify any ambiguity, defective provision, error or omission therein, including any amendment to any definitions therein;
(ii)
introduce features to the DSU Plan that would permit the Company to, instead of issuing common shares from treasury upon the redemption of the DSUs, retain a broker and make payments for the benefit of participants to such broker who would purchase common shares through the facilities of the TSX for such participants;
(iii)
introduce features to the DSU Plan that would permit the Company to, instead of issuing common shares from treasury upon the redemption of the DSUs, make lump sum cash payments to participants;
(iv)
change the application of the adjustment provisions of the DSU Plan; or
(v)
change the eligible participants under the DSU Plan.
A copy of the DSU Plan is available upon request in writing to the Chief Financial Officer of the Company at 30 Worcester Road, Toronto, Ontario, M9W 5X2.
The 110,000 common shares that are currently authorized for issuance under the DSU Plan represent approximately 0.4%0.3% of the Company’s common shares issued and outstanding as at February 27, 2017.2018. A total of 79,099102,791 DSUs have been issued, representing common share rights that comprise approximately 0.26%0.3% of the common shares issued and outstanding as at February 27, 2017.2018.
Perquisites and Personal Benefits
The Company also provides perquisites and personal benefits to its Named Executive Officers, including basic employee benefit plans, which are available to all employees, and a car allowance to cover the cost of an automobile for business purposes. These perquisites and personal benefits were determined through negotiation of an employment agreement with each Named Executive Officer (see “Employment Agreements” above). While perquisites and personal benefits are intended to fit into the Company’s overall compensation objectives by serving to attract and retain talented executive officers, the size of the Company and the nature and stage of its business also impact the level of perquisites and benefits. To date, the level of perquisites and benefits has not impacted the Company’s decisions about any other element of compensation.
Other Compensation-Related Matters
The Company’s Share Trading Policy prohibits all directors and officers of the Company from, among other things, engaging in any short sales designed to hedge or offset a decrease in market value of the securities of the Company.
Item 7.
In March 2013October 2017 we completed a registered direct offering of units of common shares and warrants, in July 2013a private placement of common share purchase warrants. In June 2016 we completed an underwritten public offering of units of common shares and warrants, and in November 2013 we entered into an at-the-market equity distribution agreement pursuant to which we may, from time to time, sell our common shares, all of which resulted in a significant change in the percentage ownership of our principal shareholders, Drs. Amina and Isa Odidi, our President and Chief Operating Officer and our Chairman and Chief Executive Officer, respectively, and Odidi Holdings Inc., a privately-held company controlled by Drs. Amina and Isa Odidi (a decrease to approximately 19.17%16.7%) of our then-issued and outstanding common shares of the Company subsequent(subsequent to the offering) (See “Prior Sales”). As of February 27, 2017,2018, Drs. Amina and Isa Odidi, our President and Chief Operating Officer and our Chairman and Chief Executive Officer, respectively, and Odidi Holdings Inc., a privately-held company controlled by Drs. Amina and Isa Odidi, own in the aggregate directly and indirectly 5,781,312 common shares, representing approximately 19.17%16.7% of our issued and outstanding common shares of the Company (and collectively beneficially owned in the aggregate approximately 9,552,4649,935,526 common shares representing 28.2%25.6% of our common shares including common shares issuable upon the exercise of outstanding options and the conversion of the outstanding convertible debenture that are exercisable or convertible within 60 days of the date hereof). (Reference is made to the section entitled “E. Share Ownership” under “Item 6. Directors, Senior Management and Employees” for additional information regarding the options to purchase common shares and the convertible debenture held by Drs. Amina and Isa Odidi.) On February 14, 2018, Armistice Capital, LLC filed a Schedule 13G amendment with the SEC disclosing beneficial ownership of 1,936,000 common shares, representing approximately 5.58% of our outstanding common shares. To our knowledge, no other shareholder owns more than 5% of the issued and outstanding common shares of the Company.
There are no arrangements, known to the Company, the operation of which may at a subsequent date result in a change in control of the Company.
No holder of common shares has different voting rights from any other holders of common shares.
As at December 31, 2016,2017 there were a total of 346 registered holders of record of our common shares, of which 248 holders were registered with addresses in Canada holding in the aggregate approximately 23.51%20.29% of our outstanding common shares, 47 holders were registered with addresses in the United States holding in the aggregate approximately 76.49%79.71% of our 34,704,515 outstanding common shares, and 51 holders were registered with addresses in other nations holding in the aggregate less than 1% of our outstanding common shares. We believe that the number of beneficial owners of our common shares is substantially greater than the number of record holders, because a large portion of our common shares are held in broker “street names”.
During the year ended November 30, 2014, we had repaid an outstanding related party loan payable to Dr. Isa Odidi and Dr. Amina Odidi, our principal stockholders, directors and executive officers. Repayments of the related party loan were restricted under the terms of the loan such that the principal amount thereof was payable when payment was required solely out of (i) revenues earned by IPC Corp following the effective date of October 22, 2009 (“effective date”), and/or proceeds received by IPC Corp or its affiliates from the offering of its securities after the effective date (other than the proceeds from the transactions completed in February 2011, March 2012, March 2013 and July 2013), and/or amounts received by IPC Corp for scientific research tax credits of IPC Corp and (ii) up to C$800,000 of the Net Cash from the Vasogen transaction (as defined in the IPC Arrangement Agreement). In March 2014, we repaid the entire outstanding related party loan principal, in the amount of $690,049 (C$764,851) out of licensing revenues earned by IPC Corp and made interest payments of $48,504 (C$53,762) in respect of the promissory note in accordance with the IPC Arrangement Agreement.
In January 2013, we completed a private placement financing of an unsecured Debenture in the original principal amount of $1.5 million. The Debenture bears interest at a rate of 12% per annum, payable monthly, is pre-payable at any time at the option of the Company, and is convertible at any time into 500,000 common shares at a conversion price of $3.00 per common share at the option of the holder. Drs. Isa and Amina Odidi, our principal stockholders, directors and executive officers provided us with the original $1.5 million of the proceeds for the Debenture. EffectiveIn December 1, 2016, the maturity date for the Debenture was extended to April 1, 2017 and a
principal repayment of $150,000 was made aton the timeDebenture and the maturity date was extended. The maturity date of the extension.Debenture has been further extended to October 1, 2018. The Company currently expects to repay the current net amount of $1,350,000 on or about AprilOctober 1, 2017,2018, if the Company then has cash available.
Since the beginning of the Company’s preceding three financial years to the date hereof, other than discussed above in this item 7, there have been no transactions or proposed transactions which are material to the Company or to any associate, holder of 10% of the Company’s outstanding shares, director or officer or any transactions that are unusual in their nature or conditions to which the Company or any of its subsidiaries was a party.
The Company’s Corporate Governance Committee, made up of independent directors, oversees any potential transaction and negotiation that could give rise to a related party transaction or create a conflict of interest, and conducts an appropriate review.
Item 8.
Reference is made to “Item 18. Financial Statements” for the financial statements included in this annual report.
Legal Proceedings and Regulatory Actions
From time to time, we may be exposed to claims and legal actions in the normal course of business. As at November 30, 2016,2017, and continuing as at February 27, 2017,2018, we are not aware of any pending or threatened material litigation claims against us.us other than the following matters.
In November 2016, we filed an NDA for our Oxycodone ER product candidate relying on the 505(b)(2) regulatory pathway, which allowed us to reference data from Purdue Pharma L.P.’s file for its OxyContin® extended release oxycodone hydrochloride. Our Oxycodone ER application was accepted by the FDA for further review in February 2017. We certified to the FDA that we believed that our Oxycodone ER product candidate would not infringe any of the OxyContin® patents listed in the Orange Book, or that such patents are invalid, and so notified Purdue Pharma L.P. and the other owners of the subject patents listed in the Orange Book of such certification. On April 7, 2017, we received notice that the Purdue litigation plaintiffs had commenced patent infringement proceedings against us in the U.S. District Court for the District of Delaware in respect of our NDA filing for Oxycodone ER, alleging that Oxycodone ER infringes six (6) out of the sixteen (16) patents. The complaint seeks injunctive relief as well as attorneys’ fees and costs and such other and further relief as the Court may deem just and proper. An answer and counterclaim have been filed.
As a result of the commencement of these legal proceedings, the FDA is stayed for 30 months from granting final approval to our Oxycodone ER product candidate. That time period commenced on February 24, 2017, when the Purdue litigation plaintiffs received notice of our certification concerning the patents, and will expire on August 24, 2019, unless the stay is earlier terminated by a final declaration of the courts that the patents are invalid, or are not infringed, or the matter is otherwise settled among the parties. A trial date for the Purdue litigation has been set for October 22, 2018. We are confident that we do not infringe the subject patents, and will vigorously defend against these claims.
In July 2017 , three complaints were filed in the U.S. District Court for the Southern District of New York asserting claims under the federal securities laws against us and two of our executive officers on behalf of a putative class of purchasers of our securities. In a subsequent order, the Court consolidated the three actions under the caption Shanawaz v. Intellipharmaceutics Int’l Inc., et al., No. 1:17-cv-05761 (S.D.N.Y.), appointed lead plaintiffs in the consolidated action, and approved lead plaintiffs’ selection of counsel. Lead plaintiffs filed a consolidated amended complaint on January 29, 2018. In the amended complaint, lead plaintiffs purport to assert claims on behalf of a putative class consisting of purchasers of our securities between May 21, 2015 and July 26, 2017. The amended complaint alleges that the defendants violated Sections 10(b) and 20(a) of the U.S Exchange Act and Rule 10b-5 promulgated thereunder by making allegedly false and misleading statements or failing to disclose certain information regarding our NDA for Oxycodone ER abuse-deterrent oxycodone hydrochloride extended release tablets. The complaint seeks, among other remedies, unspecified damages, attorneys’ fees and other costs, equitable and/or injunctive relief, and such other relief as the court may find just and proper. Under a scheduling order approved by the Court, the defendants must respond to the amended complaint by March 30, 2018. We intend to vigorously defend our company against the claims asserted in the consolidated action.
Dividend PolicyPolicy
We have not paid any cash dividends on our common shares and do not intend to pay cash dividends in the foreseeable future. We intend to retain future earnings, if any, for reinvestment in the development and expansion of our business. Dividend payments in the future may also be limited by loan agreements or covenants contained in other securities we may issue. Any future determination to pay cash dividends will be at the discretion of our board of directors and depend on our financial condition, results of operations, capital and legal requirements and such other factors as our board of directors deems relevant.
No significant changes occurred since the date of our annual consolidated financial statements included elsewhere in this annual report.
Not Applicable, except for Item 9.A.4 and Item 9.C.
Our common shares are currently listed on NASDAQNasdaq and on the TSX, in each case under the symbols “IPCI” and “I”, respectively.symbol “IPCI.” Our shares began trading on October 22, 2009, when the transaction with Vasogen was completed. The following table indicates, for the relevant periods, the high and low prices of our common shares on NASDAQNasdaq and on the TSX:
NASDAQ (U.S.$) | TSX (C$) | NASDAQ (U.S.$) | TSX (C$) | |||||
| Annual | High | Low | High | Low | High | Low | High | Low |
| 2017 | 3.12 | 0.81 | 4.09 | 1.00 | ||||
| 2016 | 3.35 | 1.41 | 4.50 | 1.78 | 3.35 | 1.41 | 4.50 | 1.78 |
| 2015 | 3.92 | 1.73 | 4.99 | 2.16 | 3.92 | 1.73 | 4.99 | 2.16 |
| 2014 | 5.18 | 1.94 | 5.77 | 2.14 | 5.18 | 1.94 | 5.77 | 2.14 |
| 2013 | 6.46 | 1.50 | 6.70 | 1.55 | 6.46 | 1.50 | 6.70 | 1.55 |
| 2012 | 3.82 | 1.88 | 3.55 | 1.81 | ||||
�� | ||||||||
| Quarterly | ||||||||
| 2016 | ||||||||
| 2017 | ||||||||
| Fourth quarter | 3.35 | 1.69 | 4.50 | 2.21 | 1.25 | 0.82 | 1.58 | 1.00 |
| Third quarter | 2.06 | 1.41 | 2.61 | 1.78 | 2.92 | 0.81 | 3.73 | 1.00 |
| Second quarter | 2.42 | 1.53 | 3.22 | 2.00 | ||||
| First quarter | 3.19 | 1.83 | 4.20 | 2.46 | ||||
| 2015 | ||||||||
| Fourth quarter | 2.32 | 1.73 | 2.95 | 2.16 | ||||
| Third quarter | 3.87 | 1.92 | 4.99 | 2.25 | ||||
| Second quarter | 3.92 | 2.28 | 4.86 | 2.95 | ||||
| First quarter | 2.94 | 1.96 | 3.33 | 2.49 | ||||
| 2014 | ||||||||
| Fourth quarter | 4.48 | 3.05 | 4.17 | 2.77 | ||||
| Third quarter | 5.18 | 3.21 | 4.49 | 2.14 | ||||
| Second quarter | 4.19 | 1.94 | 5.77 | 3.53 | ||||
| First quarter | 3.80 | 2.51 | 4.82 | 3.28 | ||||
| 2013 | ||||||||
| Fourth quarter | 6.46 | 1.63 | 6.70 | 1.72 | ||||
| Third quarter | 3.72 | 1.50 | 3.84 | 1.55 | ||||
| Second quarter | 2.23 | 1.57 | 2.35 | 1.60 | ||||
| First quarter | 2.59 | 1.72 | 2.56 | 1.77 | ||||
| 2012 | ||||||||
| Fourth quarter | 3.16 | 1.88 | 3.17 | 1.81 | ||||
| Third quarter | 3.49 | 2.40 | 3.54 | 2.49 | ||||
| Second quarter | 3.19 | 2.64 | 3.38 | 2.51 | ||||
| First quarter | 3.82 | 2.41 | 3.55 | 2.53 | ||||
NASDAQ (U.S.$) | TSX (C$) | |||
| Most recent 6 months | High | Low | High | Low |
| February 2017 | 2.99 | 2.11 | 4.05 | 2.78 |
| January 2017 | 2.96 | 2.46 | 3.91 | 3.24 |
| December 2016 | 3.05 | 2.63 | 4.09 | 3.50 |
| November 2016 | 3.35 | 2.44 | 4.50 | 3.28 |
| October 2016 | 3.33 | 2.08 | 4.40 | 2.75 |
| September 2016 | 2.34 | 1.69 | 2.95 | 2.21 |
| August 2016 | 2.06 | 1.71 | 2.61 | 2.23 |
| Second quarter | 2.69 | 1.81 | 3.57 | 2.48 |
| First quarter | 3.12 | 2.11 | 4.09 | 2.78 |
| 2016 | ||||
| Fourth quarter | 3.35 | 1.69 | 4.50 | 2.21 |
| Third quarter | 2.06 | 1.41 | 2.61 | 1.78 |
| Second quarter | 2.42 | 1.53 | 3.22 | 2.00 |
| First quarter | 3.19 | 1.83 | 4.20 | 2.46 |
| 2015 | ||||
| Fourth quarter | 2.32 | 1.73 | 2.95 | 2.16 |
| Third quarter | 3.87 | 1.92 | 4.99 | 2.25 |
| Second quarter | 3.92 | 2.28 | 4.86 | 2.95 |
| First quarter | 2.94 | 1.96 | 3.33 | 2.49 |
| 2014 | ||||
| Fourth quarter | 4.48 | 3.05 | 4.17 | 2.77 |
| Third quarter | 5.18 | 3.21 | 4.49 | 2.14 |
| Second quarter | 4.19 | 1.94 | 5.77 | 3.53 |
| First quarter | 3.80 | 2.51 | 4.82 | 3.28 |
| 2013 | ||||
| Fourth quarter | 6.46 | 1.63 | 6.70 | 1.72 |
| Third quarter | 3.72 | 1.50 | 3.84 | 1.55 |
| Second quarter | 2.23 | 1.57 | 2.35 | 1.60 |
| First quarter | 2.59 | 1.72 | 2.56 | 1.77 |
NASDAQ (U.S.$) | TSX (C$) | |||
| Most recent 6 months | High | Low | High | Low |
| February 2018 | 0.82 | 0.61 | 1.02 | 0.78 |
| January 2018 | 1.05 | 0.77 | 1.29 | 0.97 |
| December 2017 | 0.89 | 0.70 | 1.15 | 0.92 |
| November 2017 | 0.97 | 0.84 | 1.23 | 1.09 |
| October 2017 | 1.25 | 0.88 | 1.58 | 1.13 |
| September 2017 | 1.17 | 0.82 | 1.50 | 1.00 |
| August 2017 | 1.30 | 0.81 | 1.62 | 1.00 |
Item 10.
Our authorized share capital consists of an unlimited number of common shares, all without nominal or par value and an unlimited number of preference shares issuable in series. At November 30, 2016,2017, there were 29,789,99234,704,515 common shares and no preference shares issued and outstanding compared to 24,244,05034,704,515 common shares and no preference shares issued and outstanding at December 1, 2016.2017. As of February 27, 2017,2018, there were 30,155,83634,704,515 common shares and no preference shares issued and outstanding.
The reasons for the increase in common shares issued were as follows. In our June 2016October 2017, the Company completed an underwritten public offering we issued at the initial closing of the offering an aggregate of 3,229,8143,636,364 common shares andat a price of $1.10 per share. The Company also issued to the investors warrants to purchase an additional 1,614,907aggregate of 1,818,182 common shares. The underwriter also purchased at suchwarrants will be exercisable six months following the closing additional warrants to acquire 242,236 common shares pursuant todate and will expire 30 months after the over-allotment option exercised in part by the underwriter. We subsequently solddate they become exercisable, have a term of three years and an aggregate of 459,456 additional common shares at the public offeringexercise price of $1.61$1.25 per share in connection with subsequent partial exercises of the underwriter’s over-allotment option. The closings of these partial exercises brought the total net proceeds from the offering to $5,137,638, after deducting the underwriter’s discount and estimated offering expenses.common share. In November 2013, we established an at-the-market equity program pursuant to which we could sell up to 5,305,484 of our common shares for up to an aggregate of $16.8 million (or
such lesser amount as may then be permitted under applicable securities laws and regulations). As of February 27, 20172018, we have issued and sold 3,853,5574,740,350 common shares with an aggregate offering price of $11,908,312$13,872,929 under the at-the-market program. Roth received compensation of $335,987$392,827 in connection with such sales. During the three months ended November 30, 2016,2017, an aggregate of 497,949 (201550,000 (2016 – 170,439)497,949) of our common shares were sold on NASDAQNasdaq for gross proceeds of $1,507,400 (2015$46,025 (2016 – 319,805)$1,507,400) and net proceeds of $1,464,759 (2015$44,853 (2016 – 310,939)$1,464,759) under the at-the-market offering program. Roth received aggregate compensation of $42,641$1,171 in connection with such sales. During the year ended November 30, 2016,2017, an aggregate of 1,471,260 (20151,108,150 (2016 – 471,439)1,471,260) of our common shares were sold on NASDAQNasdaq for gross proceeds of $3,469,449 (2015$2,541,640 (2016 - $1,290,168)$3,469,449) and net proceeds of $3,368,674 (2015$2,468,474 (2016 - $1,254,178)$3,368,674) under the at-the-market offering program. Roth received aggregate compensation of $100,775 (2015$73,166 (2016 - $38,889)$100,775) in connection with such sales. There can be no assurance that any additional shares will be sold under our at-the-market program.
Common Shares
Each of our common shares entitles the holder thereof to one vote at any meeting of shareholders of the Company, except meetings at which only holders of a specified class of shares are entitled to vote. Common shares are entitled to receive, as and when declared by the board of directors, dividends in such amounts as shall be determined by the board of directors. The holders of common shares have the right to receive the remaining property of the Company in the event of liquidation, dissolution, or winding-up of the Company, whether voluntary or involuntary.
Preference Shares
The preference shares may at any time and from time to time be issued in one or more series. The board of directors will, by resolution, from time to time, before the issue thereof, fix the rights, privileges, restrictions and conditions attaching to the preference shares of each series. Except as required by law, the holders of any series of preference shares will not as such be entitled to receive notice of, attend or vote at any meeting of the shareholders of the Company. Holders of preference shares will be entitled to preference with respect to payment of dividends and the distribution of assets in the event of liquidation, dissolution or winding-up of the Company, whether voluntary or involuntary, or any other distribution of the assets of the Company among its shareholders for the purpose of winding up its affairs, on such shares over the common shares and over any other shares ranking junior to the preference shares.
Warrants
At November 30, 2016,2017, an aggregate of 2,147,8063,979,797 common shares were issuable upon the exercise of outstanding common share purchase warrants, with a weighted average exercise price of $2.02$1.64 per common share. At February 27, 2017,2018, an aggregate of 2,010,3193,979,797 common shares were issuable upon the exercise of outstanding common share purchase warrants, with a weighted average exercise price of $2.03$1.64 per common share.
Options
At November 30, 2016,2017, an aggregate of 5,392,4605,828,112 common shares were issuable upon the exercise of outstanding options, with a weighted average exercise price of $3.48$3.20 per common share and up to 350,479406,280 additional common shares were reserved for issuance under our stock option plan.
Options outstanding | Options exercisable | ||||||
Exercise price | Number outstanding | Weighted average exercise price per share | Weighted average remaining contract life (years) | Weighted average grant due fair value | Number exercisable | Weighted average exercise price per share | Weighted average grant date fair value |
$ | $ | $ | $ | $ | |||
Under 2.50 - | - | - | - | - | - | - | - |
| 2.51 - 5.00 | 5,360,835 | 3.31 | 0.96 | 1.74 | 4,364,985 | 3.27 | 1.78 |
| 5.01 - 10.00 | - | - | - | - | - | - | - |
| 10.01 - 100.00 | 31,625 | 33.02 | 0.99 | 25.98 | 31,625 | 33.02 | 25.98 |
5,392,460 | 3.48 | 4,396,610 | 3.49 | ||||
As of February 27, 2017,2018, there were 5,385,2845,669,835 common shares issuable upon the exercise of outstanding options. The weighted average exercise price of these options is $3.44$3.13 per common share. As at February 27, 2017,2018, up to 394,240564,557 additional common shares were reserved for issuance under our Option Plan.
Options outstanding | Options exercisable | |||||||
Weighted | Weighted | Weighted | Weighted | Weighted | ||||
average | average | average | average | average | ||||
exercise | remaining | grant | exercise | grant | ||||
Exercise | Number | price per | contract | due | Number | price per | date | |
price | outstanding | share | life (years) | fair value | exercisable | share | fair value | |
$ | $ | $ | $ | |||||
Under 2.50 | 1,251,000 | 1.43 | 3.93 | 0.99 | 920,341 | 1.49 | 1.07 | |
| 2.51 - 5.00 | 4,560,835 | 3.50 | 1.81 | 1.84 | 4,284,441 | 3.49 | 1.86 | |
| 5.01 - 10.00 | - | - | - | - | - | - | - | |
| 10.01 - 100.00 | 16,277 | 29.11 | 0.21 | 22.89 | 16,277 | 29.11 | 22.89 | |
5,828,112 | 3.20 | 5,221,059 | 3.30 | |||||
Convertible Debenture
On January 10, 2013, we completed a private placement financing of an unsecured Debenture in the original principal amount of $1.5 million. The Debenture was originally due to mature on January 1, 2015, but effective October 1, 2014, the maturity date was extended to July 1, 2015; effective June 29, 2015, the July 1, 2015 maturity date was extended to January 1, 2016; and effective as of December 8, 2015, the maturity date was extended to July 1, 2016. Effective May 26, 2016, the maturity date of the Debenture was further extended to December 1, 2016. The Debenture bears interest at a rate of 12% per annum, payable monthly, is pre-payable at any time at the option of the Company, and was convertible at any time into 500,000 common shares at a conversion price of $3.00 per common share at the option of the holder. Drs. Isa and Amina Odidi, our principal stockholders, directors and executive officers provided us with the $1.5 million of the proceeds for the Debenture. Effective December 1, 2016, the maturity date for the Debenture was extended to April 1, 2017 and a principal repayment of $150,000 was made at the time of the extension. After giving effect to such partial repayment, the Debenture is convertible at any time into 450,000 common shares at a conversion price of $3.00 per common share at the option of the holder. Effective March 28, 2017, the maturity date of the Debenture was extended to October 1, 2017. Effective September 28, 2017, the maturity date of the Debenture was further extended to October 1, 2018. The Company currently expects to repay the current net amount of $1,350,000 on or about AprilOctober 1, 2017,2018, if the Company then has cash available.
Deferred Share Units
At November 30, 2016,2017, there were 76,74394,131 DSUs issued and outstanding. From November 30, 20162017 to February 27, 2017,2018, an additional 2,3568,660 DSUs have been issued. At February 27, 2017, 30,9012018, 7,209 additional DSUs are reserved for issuance under our DSU plan.
Restricted Share Units
At November 30, 2016,2017, there were no restricted share units (“RSUs”) issued and outstanding. From November 30, 20162017 to the date of this report, no RSUs have been issued. At the date of this report,February 27, 2018, 330,000 RSUs are reserved for issuance under our RSU Plan.
Registration Rights
We conducted a private placement issuance of units comprised of common shares and warrants in February, 2011, which was exempt from registration under the U.S. Securities Act pursuant to Regulation D and Section 4(2) and/or Regulation S thereof and such other available exemptions. As such, the common shares, the warrants, and the common shares underlying the warrants may not be offered or sold in the United States unless they are registered under the U.S. Securities Act, or an exemption from the registration requirements of the U.S. Securities Act is available.
In connection with the private placement, we agreed to file a registration statement on Form F-3 (“Registration Statement”) within 40 days after the closing and use our best efforts to have it declared effective within 150 days after the closing to register (i) 100% of the common shares issued in the private placement; and (ii) 100% of the common shares underlying the investor warrants issued in the private placement (collectively, the private placement or the “Registrable Securities”).
The Registration Statement was declared effective as of March 30, 2011. If (i) the Registration Statement ceases to be continuously effective for more than twenty consecutive calendar days or more than an aggregate of thirty calendar days during any consecutive 12-month period, or (ii) at a time in which the Registrable Securities cannot be sold under the Registration Statement, we shall fail for any reason to satisfy the current public information requirement under Rule 144 as to the applicable Registrable Securities, we shall pay to the investors, on a pro rata basis, partial liquidated damages of one percent (1%) of the aggregate purchase price paid by each investor on the occurrence of an event listed above and for each calendar month (pro rata for any period less than a calendar month) from an event, until cured.
The securities shall cease to be Registrable Securities when (i) they have been sold (A) pursuant to a registration statement; or (B) in accordance with Rule 144 or any other rule of similar effect; or (ii) such securities become eligible for resale without volume or manner-of-sale restrictions, and when either we are compliant with any current public information requirements pursuant to Rule 144 or the current public information requirements no longer apply.
Prior Sales
On March 15, 2012, we completed a registered direct common share offering for gross proceeds of $5,000,000. We sold an aggregate of 1,818,182 shares to U.S. institutional investors at a price of $2.75 per share.
In January 2013, we completed a private placement financing of a Debenture in the original principal amount of $1.5 million. The Debenture was originally due to mature on January 1, 2015, but effective October 1, 2014, the maturity date was extended to July 1, 2015; effective June 29, 2015, the maturity date was extended to January 1, 2016; effective as of December 8, 2015, the maturity date was extended to July 1, 2016; and effective May 26, 2016, the maturity date of the Debenture was further extended to December 1, 2016. The Debenture bears interest at a rate of 12% per annum, payable monthly, is pre-payable at any time at our option, and was convertible at any time into 500,000 common shares at a conversion price of US $3.00 per common share at the option of the holder. Drs. Isa and Amina Odidi, our principal stockholders, directors and executive officers provided us with the $1.5 million of the proceeds for the Debenture. Effective December 1, 2016, the maturity date for the Debenture was extended to April 1, 2017 and a principal repayment of $150,000 was made at the time of the extension. After giving effect to such partial repayment, the Debenture is convertible at any time into 450,000 common shares at a conversion price of $3.00 per common share at the option of the holder. WeThe maturity date of the Debenture has been further extended to October 1, 2018. The Company currently expectexpects to repay the current net amount of $1,350,000 on or about AprilOctober 1, 2017,2018, if wethe Company then havehas cash available.
In March 2013, we completed a registered direct unit offering for gross proceeds of $3,121,800. We sold an aggregate of 1,815,000 units at a price of $1.72 per unit. The units were comprised of an aggregate of 1,815,000 common shares and warrants to purchase an additional 453,750 common shares. The warrants are exercisable for a term of five years and have an exercise price of $2.10 per common share.
In July 2013, we completed an underwritten public offering of 1,500,000 units of common shares and warrants for gross proceeds of $3,075,000 at a price of $2.05 per unit. The units were comprised of an aggregate of 1,500,000 common shares and warrants to purchase an additional 375,000 common shares. The warrants have a term of five years and an exercise price of $2.55 per common share.
In November 2013, we entered into an equity distribution agreement with Roth, pursuant to which we may from time to time sell up to 5,305,484 of our common shares for up to an aggregate of $16.8 million (or such lesser amount as may then be permitted under applicable exchange rules and securities laws and regulations) through at-the-market issuances on the NASDAQNasdaq or otherwise. Under the equity distribution agreement, we may at our discretion, from time to time, offer and sell common shares through Roth or directly to Roth for resale. Sales of common shares through Roth, if any, will be made at such time and at such price as are acceptable to us, from time to time, by means of ordinary brokers’ transactions on the NASDAQNasdaq or otherwise at market prices prevailing at the time of sale or as determined by us. We currently plan to use any net proceeds from the at-the-market offering for general corporate purposes, including funding research, product development and other corporate development opportunities and to possibly fund costs and other expenses relating to our current leased facility or any additional space,facilities to accommodate our anticipated growth requirements, and, although we have no present
understanding, commitments or agreements to do so, potential acquisition of, or investment in, companies and technologies that complement our business. We are not required to sell shares under the equity distribution agreement. We will pay Roth a commission, or allow a discount, of 2.75% of the gross proceeds we receive from any sales of our common shares under the equity distribution agreement. Any sales of shares under our at-the-market offering program will be made pursuant to an effective shelf registration statement on Form F-3 filed with the SEC. We have also agreed to reimburse Roth for certain expenses relating to the offering. As of February 27, 2017,2018, we have issued and sold 3,853,5574,740,350 common shares with an aggregate offering price of $11,908,312$13,872,929 under the at-the-market program. Roth received aggregate compensation of $335,987$392,827 in connection with such sales. We currentlyAs a result of prior sales of the Company’s common shares under the equity distribution agreement, the Company may in the future offer and sell ourits common shares with an aggregate purchase price of up to $4,891,688$2,927,071, or such lesser amount as may then be permitted under applicable exchange rules and securities laws and regulations, pursuant to the at-the-market program. Under Toronto Stock Exchange rules, the number of common shares that may currently be offered under the at-the-market program is 565,134 common shares. The Company intends to remove or amend this limitation, although no assurance can be given that the limitation will be removed or amended. There can be no assurance that any additional shares will be sold under our at-the-market program. Subsequent
to the year ended November 30, 2016,2017, share issuance costs of Nil were recorded against the cost of the shares issued and recognized in capital stock. As at November 30, 2016, $951,5512017, $1,334,873 of the share issuance costs has been recorded against the cost of the shares issued and recognized in capital stock.
Pursuant to an Underwriting Agreement between the Company and Dawson James Securities, Inc., dated May 27, 2016 (the “Dawson James Underwriting Agreement”), in June 2016, we completed an underwritten public offering of 3,229,814 units of common shares and warrants, at a price of $1.61 per unit. The warrants are currently exercisable, have a term of five years and an exercise price of $1.93 per common share. We issued at the initial closing of the offering an aggregate of 3,229,814 common shares and warrants to purchase an additional 1,614,907 common shares. The underwriter also purchased at such closing additional warrants to acquire 242,236 common shares pursuant to the over-allotment option exercised in part by the underwriter. We subsequently sold an aggregate of 459,456 additional common shares at the public offering price of $1.61 per share in connection with subsequent partial exercises of the underwriter’s over-allotment option. The closings of these partial exercises brought the total net proceeds from the offering to approximately $5.1 million, after deducting the underwriter’s discount and offering expenses.
On June 4, 2014,July 17, 2017, the Shelf Registration Statement was declared effective by the SEC and on June 5, 2014, the Company filed a final short form base shelf prospectus with securities regulatory authorities in each of the provinces and territories of Canada, except Quebec. These documents allowSEC. The Shelf Registration Statement allows for, subject to securities regulatory requirements and limitations, the potential offering of up to an aggregate of US $100 million of the Company’s common shares, preference shares, warrants, subscription receipts, subscription rights and units, or any combination thereof, from time to time in one or more offerings, and areis intended to give the Company the flexibility to take advantage of financing opportunities when, and if, market conditions are favorable to the Company. The specific terms of such future offerings, if any, would be established, subject to the approval of the Company’s board of directors, at the time of such offering and will be described in detail in a prospectus supplement filed at the time of any such offering. To the extent that any securities are issued by the Company under the shelf prospectus,Shelf Registration Statement, a shareholder’s’shareholder’s percentage ownership will be diluted and our stock price could be adversely affected. As of February 27, 2017,2018, the Company has not sold any securities under the Shelf Registration Statement, or the shelf prospectus, other than the sale since June 4, 2014July 17, 2017 of (i) 2,164,057485,239 common shares under the Company’s at-the-market program referred to above and (ii) the sale of units,3,636,364 common shares and warrants under the Dawson James UnderwritingWainwright Agreement referred to above, and (iii) the issuance of 1,015,068 common shares pursuant to warrants previously issued, and there can be no assurance that any additional securities will be sold under the Shelf Registration Statement or the shelf prospectus.
Pursuant to a placement agent agreement dated October 10, 2017 between the 12-month period ended November 30, 2016,Company and H.C. Wainwright & Co., LLC (the “Wainwright Agreement”), in October 2017, we completed a registered direct offering consisting of 3,636,364 common shares at a price of $1.10 per share for gross proceeds of approximately $4 million. We also issued to the investors warrants to purchase an aggregate of 357,9121,818,182 common shares at an exercise price of $1.25 per share. The warrants are exercisable six months following the October 13, 2017 closing date and will expire 30 months after the date they become exercisable. The common shares (but not the warrants or the common shares underlying the warrants) were exercised.offered by us through a prospectus supplement pursuant to our shelf registration statement on Form F-3 as previously filed and declared effective by the SEC and the base prospectus contained therein (Registration Statement No. 333-218297). The warrants described above were offered in a private placement under Section 4(a)(2) of the U.S. Securities Act, and Regulation D promulgated thereunder and, along with the common shares underlying the warrants, have not been registered under the U.S. Securities Act, or applicable state securities laws. The Company also issued to the placement agents 181,818 warrants to purchase a share of common stock at an exercise price of $1.375 per share. The total net proceeds from the offering were $3.5 million, after deducting offering expenses.
During the 12-month period ended November 30, 2016, 460,0002017, warrants to purchase an aggregate of 168,009 common shares were exercised.
During the 12-month period ended November 30, 2017, 496,000 options were granted and 27,5002,000 options were exercised.
Also during the 12-month period ended November 30, 2016,2017, a total of 16,74117,388 deferred share units were granted.
The Company was formed under the Canada Business Corporations Act (the “CBCA”) by articles of arrangement dated October 22, 2009 (the “Articles”) in the IPC Arrangement Transaction discussed in Item 15. The Company is the successor issuer to Vasogen Inc. for reporting purposes under the U.S. Exchange Act. The
authorized share capital of the Company consists of an unlimited number of common shares, all without nominal or par value and an unlimited number of preference shares issuable in series.
Provisions as to the modification, amendment or variation of rights and provisions of each class of shares are contained in the CBCA and the regulations promulgated thereunder. Certain fundamental changes to the Articles will require the approval of at least two-thirds of the votes cast on a resolution submitted to a special meeting of the Company’s shareholders called for the purpose of considering the resolution. These items include (i) certain amendments to the provisions relating to the outstanding capital of the Company, (ii) a sale of all or substantially all of the assets of the Company, (iii) an amalgamation of the Company with another company, other than a subsidiary, (iv) a winding-up of the Company, (v) a continuance of the Company into another jurisdiction, (vi) a statutory court approved arrangement under the CBCA (essentially a corporate reorganization such as an amalgamation, sale of assets, winding-up, etc.), or (vii) a change of name.
Under the CBCA, a corporation cannot repurchase its shares or pay or declare dividends if there are reasonable grounds for believing that (a) the corporation is, or after payment would be, unable to pay its liabilities as they become due, or (b) after the payment, the realizable value of the corporation’s assets would be less than the aggregate of (i) its liabilities and (ii) its stated capital of all classes of its securities. Generally, stated capital is the amount paid on the issuance of a share unless the stated capital has been adjusted in accordance with the CBCA.
General
The Articles do not contain any restrictions on the business the Company may carry on.
Directors
The Company’s By-Law No. 1 (a by-law relating generally to the transaction of the business and affairs of the Company) provides for the indemnification of the directors and officers of the Company, former directors and officers of the Company against all costs, charges and expenses, including an amount paid to settle an action or satisfy a judgment, reasonably incurred by the individual in respect of any civil, criminal, administrative, investigative or other proceeding in which the individual is involved because of that association with the Company, subject to certain limitations in By-Law No. 1 and the limitations in the CBCA.
The Company may also indemnify other individuals who act or acted at the Company’s request as a director or officer, or an individual acting in a similar capacity, of another entity.
Annual and Special Meetings
Meetings of shareholders are held at such place, at such time, on such day and in such manner as the Board may, subject to the CBCA and any other applicable laws, determine from time to time. The only persons entitled to attend a meeting of shareholders are those persons entitled to notice thereof, those entitled to vote thereat, the directors, the auditors of the Company and any others who may be entitled or required under the CBCA to be present at the meeting. Under the CBCA, notice of the meeting is required to be given not less than 21 days and not more than 60 days prior to the meeting. Shareholders on the record date are entitled to attend and vote at the meeting. The quorum for the transaction of business at any meeting of shareholders is at least two persons present at the opening of the meeting who are entitled to vote either as shareholders or proxyholders, representing collectively not less than 5% of the outstanding shares of the Company entitled to be voted at the meeting.
Other
There is no by-law provisions governing the ownership threshold above which shareholder ownership must be disclosed. However, there are disclosure requirements pursuant to applicable Canadian law.
There are no provisions in either the Company’s Articles or By-Law No. 1 that would have the effect of delaying, deferring or preventing a change in control of the Company and that would operate only with respect to a merger, acquisition or corporate restructuring involving the Company or its subsidiary.
There are no limitations on the rights to own securities, including the rights of non-resident or foreign shareholders to hold or exercise voting rights on the securities imposed by foreign law or by the charter or other constituent document of the Company.
Except for contracts entered into in the ordinary course of business and not required to be filed under Canadian securities laws, the only contracts which are regarded as material and which were entered into by the Company within the two years immediately preceding the date of this annual report, are:
●
On November 21, 2005, the Company entered into the Par agreement pursuant to which the Company granted Par an exclusive, royalty-free license to make and distribute in the United States all strengths of our generic versions of the branded product Focalin XR®XR® for a period of 10 years from the date of commercial launch (which was November 19, 2013). Under the Par agreement, we filed the Company ANDA with the FDA for approval to market generic Focalin XR®XR® capsules in various strengths in the U.S., and are the owner of that Company ANDA, as approved in part by the FDA. We retain the right to make and distribute all strengths of the generic product outside of the U.S. Calendar quarterly profit-sharing payments for its U.S. sales under the Company ANDA are payable by Par to us as calculated pursuant to the Par agreement. Within the purview of the Par agreement, Par also applied for and owns the Par ANDA pertaining to all marketed strengths of generic Focalin XR®XR®, and is now approved by the FDA, to market generic Focalin XR®XR® capsules in all marketed strengths in the U.S. As with the Company ANDA, calendar quarterly profit-sharing payments are payable by Par to us for its U.S. sales of generic Focalin XR®XR® under the Par ANDA as calculated pursuant to the Par agreement. The Company is responsible under the Par agreement for the development of the product and most related costs which, with the applications to and recent approvals by the FDA, the Company now considers to be completed.
●
In October 2016, the Company entered into the Mallinckrodt agreement, granting Mallinckrodt an exclusive license to market, sell and distribute in the U.S. the following extended release drug product candidates (the “licensed products”“licensed products”) for which the Company has ANDAs filed with the FDA:
●
●
●
Under the terms of this 10-year agreement, the Company received a non-refundable upfront payment of $3 million in October 2016. In addition, the Mallinckrodt agreement also provides for a long-term profit sharing arrangement with respect to these licensed products (which includes up to $11 million in cost recovery payments to the Company). The Company has agreed to manufacture and supply the licensed products exclusively for Mallinckrodt on a cost plus basis, and Mallinckrodt has agreed that the Company will be its sole supplier of the licensed products marketed in the U.S. The Mallinckrodt agreement contains customary terms and conditions for an agreement of this kind, and is subject to early termination in the event we do not obtain FDA approvals of the Mallinckrodt licensed products by specified dates, or pursuant to any one of several termination rights of each party.
●
The acknowledgement and agreement of the Company dated October 22, 2009 to be bound by the performance based stock option agreement dated September 10, 2004 pursuant to which Drs. Isa and Amina Odidi are entitled to purchase up to 2,763,940 of the Company’s shares upon payment of $3.62 per share, subject to satisfaction of the performance vesting conditions being the acceptance by the FDA of the filing of an application for approval of a drug product or the approval of such an application;application.
●
The amended and restated promissory note dated October 22, 2009 for up to C$2,300,000 issued by IPC Corp to Isa Odidi and Amina Odidi for advances that may be made by them from time to time to the Company. As at November 30, 2015 and November 30, 2014, no amount was outstanding. No at-the-market offering proceeds were used in payment of the promissory note; andnote.
●
The Debenture dated January 10, 2013 for $1.5 million issued by the Company to Isa Odidi and Amina Odidi for the loan of $1.5 million made by them to the Company. The Debenture was originally due to mature on January 1, 2015, but effective October 1, 2014, the maturity date was extended to July 1, 2015; effective June 29, 2015, the maturity date was extended to January 1, 2016; and effective as of December 8, 2015, the maturity date was further extended to July 1, 2016; and effective May 26, 2016, the maturity date of the Debenture was extended to December 1, 2016. Effective December 1, 2016, the maturity date for the Debenture was extended to April 1, 2017 and a principal repayment of $150,000 was made at the time of the extension. After giving effect to such partial repayment, the Debenture is convertible at any time into 450,000 common shares at a conversion price of $3.00 per common share at the option of the holder. The maturity date of the Debenture has been further extended to October 1, 2018. The Company currently expects to repay the current net amount of $1,350,000 on or about AprilOctober 1, 2017,2018, if the Company then has cash available.
●
Pursuant to the Dawson James Underwriting Agreement, in June 2016, we completed an underwritten public offering of 3,229,814 units of common shares and warrants, at a price of $1.61 per unit. The warrants are currently exercisable, have a term of five years and an exercise price of $1.93 per common share. We issued at the initial closing of the offering an aggregate of 3,229,814 common shares and warrants to purchase an additional 1,614,907 common shares. The underwriter also purchased at such closing additional warrants to acquire 242,236 common shares pursuant to the over-allotment option exercised in part by the underwriter. We subsequently sold an aggregate of 459,456 additional common shares at the public offering price of $1.61 per share in connection with subsequent partial exercises of the underwriter’s over-allotment option. The closings of these partial exercises brought the total net proceeds from the offering to approximately $5.1 million, after deducting the underwriter’s discount and offering expenses.
Pursuant to the Wainwright Agreement, in October 2017, we completed a registered direct offering consisting of 3,636,364 common shares at a price of $1.10 per share for gross proceeds of approximately $4 million. We also issued to the investors warrants to purchase an aggregate of 1,818,182 common shares at an exercise price of $1.25 per share. The warrants are exercisable six months following the October 13, 2017 closing date and will expire 30 months after the date they become exercisable. The common shares (but not the warrants or the common shares underlying the warrants) were offered by us through a prospectus supplement pursuant to our shelf registration statement on Form F-3 as previously filed and declared effective by the SEC and the base prospectus contained therein (Registration Statement No. 333-218297). The warrants described above were offered in a private placement under Section 4(a)(2) of the U.S. Securities Act, and Regulation D promulgated thereunder and, along with the common shares underlying the warrants, have not been registered under the U.S. Securities Act, or applicable state securities laws. The Company also issued to the placement agents 181,818 warrants to purchase a share of common stock at an exercise price of $1.375 per share. The total net proceeds from the offering were $3.5 million, after deducting offering expenses.
Canada has no system of currency exchange controls. There are no governmental laws, decrees or regulations in Canada that restrict the export or import of capital, including but not limited to, foreign exchange controls, or that affect the remittance of dividends, interest or other payments to non-resident holders of the Company’s securities.
United States Taxation
Certain Material United States Federal Income Tax Considerations
The following discussion is a general summary of certain material United States federal income tax considerations applicable to a U.S. holder arising from and relating to the consequences of the ownership and disposition of our common shares and warrants that are generally applicable to a United States person that holds our common shares as capital assets (a “U.S. Holder”) within the meaning of Section 1221 of the Code. This discussion does not address holders of other securities. This discussion assumes that we are not a “controlled foreign corporation” for U.S. federal income tax purposes. The following discussion does not purport to be a complete analysis of all of the potential United States federal income tax considerations that may be relevant to particular holders of our common shares or warrants in light of their particular circumstances nor does it deal with persons that are subject to special tax rules, such as brokers, dealers in securities or currencies, financial institutions, insurance companies, tax-exempt organizations, persons liable for alternative minimum tax, U.S. expatriates, partnerships or other pass-through entities, U.S. Holders who own (directly, indirectly or by attribution) ten percent or more of the total combined voting power of all classes of stock entitled to vote, persons holding our common shares as part of a straddle, hedge or conversion transaction or as part of a synthetic security or other integrated transaction, traders in securities that elect to use a mark-to-market method of accounting for their securities holdings, holders whose “functional currency” is not the United States dollar, and holders who are not U.S. Holders. In addition, the discussion below does not address the tax consequences of the law of any state, locality or foreign jurisdiction or United States federal tax consequences (e.g., estate or gift tax) other than those pertaining to the income tax. There
can be no assurance that the United States Internal Revenue Service (the “IRS”) will take a similar view as to any of the tax consequences described in this summary.
The following is based on currently existing provisions of the Code, existing and proposed Treasury regulations under the Code and current administrative rulings and court decisions. Everything listed in the previous sentence may change, possibly on a retroactive basis, and any change could affect the continuing validity of this discussion. “Comprehensive tax reform” remains a topic of discussion in the United States Congress. Such legislation could significantly alter the existing Code. We cannot predict whether, when, or to what extent U.S. federal tax laws will be changed, or regulations, interpretations, or rulings will be issued or revoked, nor is the long-term impact of proposed comprehensive tax reformsthe significant changes made to the Code in 2017 known at this time.
Each U.S. Holder and each holder of common shares that is not a U.S. Holder should consult its tax adviser regarding the United States federal income tax consequences of holding our common shares applicable to such holder in light of its particular situation, as well as any tax consequences that may arise under the laws of any other relevant foreign, state, local, or other taxing jurisdiction.
As used in this section, the term “United“United States person”person” means a beneficial owner of our common shares that is:
(i)
a citizen or an individual resident of the United States;
(ii)
a corporation (or an entity taxable as a corporation for United States federal income tax purposes) created or organized in or under the laws of the United States or any political subdivision of the United States;
(iii)
an estate the income of which is subject to United States federal income taxation regardless of its source; or
(iv)
a trust which (A) is subject to the supervision of a court within the United States and the control of a United States person as described in Section 7701(a)(30) of the Code; or (B) is subject to a valid election under applicable Treasury Regulations to be treated as a United States person.
If a partnership (including for this purpose any entity treated as a partnership for U.S. federal income tax purposes) holds our common shares, the United States federal income tax treatment of a partner generally will depend on the status of the partner and the activities of the partnership. A United States person that is a partner of the partnership holding our common shares should consult its own tax adviser.
Passive Foreign Investment Company Considerations
Special, generally unfavorable, U.S. federal income tax rules apply to thea U.S. Holder’s ownership and disposition of the stock or warrants of a passive foreign investment company (“PFIC”). As discussed below, however, a U.S. Holder of our common shares (but not our warrants) may be able to mitigate these consequences by making a timely and effective election to treat the Company as a qualified electing fund (a “QEF Election”) or by making a timely and effective mark-to-market election with respect to its common shares.
For U.S. federal income tax purposes, a foreign corporation is classified as a PFIC for each taxable year in which, applying the relevant look-through rules, either:
●
at least 75% of its gross income for the taxable year consists of specified types of “passive” income (referred to as the “income test”); or
●
at least 50% of the average value of its assets during the taxable year is attributable to certain types of assets that produce passive income or are held for the production of passive income (referred to as the “asset test”).
For purposes of the income and asset tests, if a foreign corporation owns directly or indirectly at least 25% (by value) of the stock of another corporation, that foreign corporation will be treated as if it held its proportionate share of the assets of the other corporation and received its proportionate share of the income of that other
corporation. Also, for purposes of the income and asset tests, passive income does not include any income that is an interest, dividend, rent or royalty payment if it is received or accrued from a related person to the extent that amount is properly allocable to the active income of the related person. Under applicable attribution rules, if the Company is a PFIC, U.S. Holders of common shares will be treated as holding stock of the Company’s subsidiaries that are PFICs in certain circumstances. In these circumstances, certain dispositions of, and distributions on, stock of such subsidiaries may have consequences for U.S. Holders under the PFIC rules.
We believe that we were not a PFIC during our 20162017 taxable year and may notare unlikely to be a PFIC during our 20172018 taxable year. Because PFIC status is based on our income, assets and activities for the entire taxable year, and our market capitalization, it is not possible to determine whether we will be characterized as a PFIC for the 20172018 taxable year until after the close of the taxable year. The tests for determining PFIC status are subject to a number of uncertainties. These tests are applied annually, and it is difficult to accurately predict future income, assets and activities relevant to this determination. In addition, because the market price of our common shares is likely to fluctuate, the market price may affect the determination of whether we will be considered a PFIC. There can be no assurance that we will not be considered a PFIC for any taxable year (including our 20162018 taxable year). Absent one of the elections described below, if we are a PFIC for any taxable year during which a U.S. Holder holds our common shares, we generallysuch U.S. Holder’s share of our income for such year will continue to be treated as a PFIC subject to the regime described below, with respect to such U.S. Holder, regardless of whether we cease to meet the PFIC tests in one or more subsequent years. Accordingly, no assurance can be given that we will not constitute a PFIC in the current (or any future) tax year or that the IRS will not challenge any determination made by us concerning our PFIC status.
If we are a PFIC, the U.S. federal income tax consequences to a U.S. Holder of the ownership and disposition of our shares will depend on whether such U.S. Holder makes a QEF or mark-to-market election. Unless otherwise provided by the IRS, a U.S. Holder of our shares is generally required to file an informational return annually to report its ownership interest in the PFIC during any year in which we are a PFIC.
U.S. HOLDERS SHOULD CONSULT THEIR OWN TAX ADVISERS ABOUT THE PFIC RULES, THE POTENTIAL APPLICABILITY OF THESE RULES TO THE COMPANY CURRENTLY AND IN THE FUTURE, AND THEIR FILING OBLIGATIONS IF THE COMPANY IS A PFIC.
The “No Election” Alternative – Taxation of Excess Distributions
If we are classified as a PFIC for any year during which a U.S. Holder has held common shares or warrants and, in the case of our common shares, that U.S. Holder has not made a QEF Election or a mark-to-market election, special rules may subject that U.S. Holder to increased tax liability, including loss of favorable capital gains rates and the imposition of an interest charge upon the sale or other disposition of the common shares or warrants or upon the receipt of any excess distribution (as defined below). Under these rules:
●
the gain, if any, realized on such disposition will be allocated ratably over the U.S. Holder’s holding period;
●
the amount of gain allocated to the current taxable year and any year prior to the first year in which we are a PFIC will be taxed as ordinary income in the current year;
●
the amount of gain allocated to each of the taxable years other taxablethan the year in which the excess distribution occurs and pre-FIC years will be subject to tax at the highest ordinary income tax rate in effect for that year; and
●
an interest charge for the deemed deferral benefit will be imposed with respect to the resulting tax attributable to each of the other taxable years.
These rules will continue to apply to the U.S. Holder even after we cease to meet the definition of a PFIC, unless the U.S. Holder elects to be treated as having sold our common shares on the last day of the last taxable year in which we qualified as a PFIC.
An “excess distribution,” in general, is any distribution on common shares received in a taxable year by a U.S. Holder that is greater than 125% of the average annual distributions received by that U.S. Holder in the three preceding taxable years or, if shorter, during that U.S. Holder’s holding period for common shares.
Any portion of a distribution paid to a U.S. Holder that does not constitute an excess distribution will be treated as ordinary dividend income to the extent of our current and accumulated earnings and profits (as computed
for U.S. federal income tax purposes). Such dividends generally will not qualify for the dividends-received deduction otherwise available to U.S. corporations. Any amounts treated as dividends paid by a PFIC generally will not constitute “qualified dividend income” within the meaning of Section 1(h)(11) of the Code and will, therefore, not be eligible for the preferential 20% rate for such income generally in effect for individuals under current law. Any such amounts in excess of our current and accumulated earnings and profits will be applied against the U.S. Holder’s tax basis in the common shares and, to the extent in excess of such tax basis, will be treated as gain from a sale or exchange of such shares. It is possible that any such gain may be treated as an excess distribution.
The QEF Election Alternative
A U.S. Holder of common shares (but not warrants) who elects (an “Electing U.S. Holder”) under Section 1295 of the Code, in a timely manner to treat us as a QEF would generally include in gross income (and be subject to current U.S. federal income tax on) its pro rata share of (a) the Company’s ordinary earnings, as ordinary income, and (b) our net capital gains, as long-term capital gain. An Electing U.S. Holder will generally be subject to U.S. federal income tax on such amounts for each taxable year in which we are classified as a PFIC, regardless of whether such amounts are actually distributed to the Electing U.S. Holder. An Electing U.S. Holder may further elect, in any given taxable year, to defer payment of U.S. federal income tax on such amounts to the extent they remain undistributed, subject to certain limitations. However, if payment of such tax is deferred, the taxes will be subject to an interest charge.charge calculated from the due date of the tax return for the relevant year with respect to which the QEF election applies until the date the tax is paid.
A U.S. Holder may not make a QEF election with respect to its warrants to acquire our common shares. As a result, if a U.S. Holder sells or otherwise disposes of such warrants (other than upon exercise of such warrants), any gain recognized generally will be subject to the special tax and interest charge rules treating the gain as an excess distribution, as described above, if we were a PFIC at any time during the period the U.S. Holder held the warrants. If a U.S. Holder that exercises such warrants properly makes a QEF election with respect to the newly acquired common shares (or has previously made a QEF election with respect to our common shares), the QEF election will apply to the newly acquired
common shares, but the adverse tax consequences relatingattributable to PFIC common shares,the period prior to exercise of the warrants, adjusted to take into account the current income inclusions resulting from the QEF election, will continue to apply with respect to such newly acquired common shares (which generally will be deemed to have a holding period for purposes of the PFIC rules that includes the period the U.S. Holder held the warrants), unless the U.S. Holder makes a purging election under the PFIC rules. The purging election creates a deemed sale of such common shares at their fair market value. The gain recognized by the purging election will be subject to the special tax and interest charge rules treating the gain as an excess distribution, as described above. As a result of the purging election, the U.S. Holder will have a new basis and holding period in the common shares acquired upon the exercise of the warrants for purposes of the PFIC rules.
A U.S. Holder may make a QEF Election only if the Company furnishes the U.S. Holder with certain tax information. If the Company should determine that it is a PFIC, it is anticipated that it will attempt to timely and accurately disclose such information to its U.S. Holders and provide U.S. Holders with information reasonably required to make such election.
A U.S. Holder that makes a QEF Election with respect to the Company generally (a) may receive a tax-free distribution from the Company to the extent that such distribution represents “earnings and profits” of the Company that were previously included in income by the U.S. Holder because of such QEF Election and (b) will adjust such U.S. Holder’stakes a tax basis in his, her or its common shares to reflect the amount included in income (resulting in an increase in basis) or allowed as a tax-free distribution (resulting in a decrease in basis) becauseas a result of the QEF Election.
Similarly, if any of our non-U.S. subsidiaries were classified as PFICs, a U.S. Holder that makes a timely QEF Election with respect to any of our subsidiaries would be subject to the QEF rules as described above with respect to the Holder’s pro rata share of the ordinary earnings and net capital gains of any of our subsidiaries. Our earnings (or earnings of any of our subsidiaries) attributable to distributions from any of our subsidiaries that had previously been included in the income of an Electing U.S. Holder under the QEF rules would generally not be taxed to the Electing U.S. Holder again.
Upon the sale or other disposition of common shares, an Electing U.S. Holder who makes a QEF Election for the first taxable year in which heit owns common shares (which election remains in effect throughout such U.S. Holder’s ownership of common shares) will recognize capital gain or loss for U.S. federal income tax purposes in an amount equal to the difference between the net amount realized on the disposition and the U.S. Holder’s adjusted tax basis in the common shares. Such gain or loss will be long-term capital gain or loss if the U.S.
Holder’s holding period in the common shares is more than one year, otherwise it will be short-term capital gain or loss. The deductibility of capital losses is subject to certain limitations. A U.S. Holder’s gain realized upon the disposition of shares generally will be treated as U.S. source income, and losses from the disposition generally will be allocated to reduce U.S. source income.
A QEF Election must be made in a timely manner as specified in applicable Treasury Regulations. Generally, the QEF Election must be made by filing the appropriate QEF election documents at the time such U.S. Holder timely files its U.S. federal income tax return for the first taxable year of the Company during which it was at any time, a PFIC.
Each U.S. Holder should consult its own tax advisor regarding the availability of, procedure for making, and consequences of a QEF Election with respect to the Company.
Mark-to-Market Election Alternative
Assuming that our common shares are treated as marketable stock (as defined for these purposes), a U.S. Holder that does not make a QEF Election may avoid the application of the excess distribution rules, at least in part, by electing, under Section 1296 of the Code, to mark the common shares to market annually. Consequently, the U.S. Holder will generally recognize as ordinary income or loss each year an amount equal to the difference as of the close of the taxable year between the fair market value of its common shares and the U.S. Holder’s adjusted tax basis in the common shares. Any mark-to-market loss is treated as an ordinary deduction, but only to the extent of the net mark-to-market gain that the Holder has included pursuant to the election in prior tax years. Any gain on a disposition of our common shares by an electinga U.S. Holder that has made such a mark-to-market election would be treated as ordinary income. The electingSuch U.S. Holder’s basis in its common shares would be adjusted to reflect any of these income or loss amounts. Currently, a mark-to-market election may not be made with respect to warrants. We do not anticipate that the preference shares will be treated as marketable stock for these purposes.
For purposes of making this election, stock of a foreign corporation is “marketable” if it is “regularly traded” on certain “qualified exchanges”. Under applicable Treasury Regulations, a “qualified exchange” includes a national securities exchange that is registered with the SEC or the national market system established pursuant to Section 11A of the U.S. Exchange Act, and certain foreign securities exchanges. Currently, our common shares are traded on a “qualified exchange.” Under applicable Treasury Regulations, PFIC stock traded on a qualified exchange is “regularly traded” on such exchange for any calendar year during which such stock is traded, other than in de minimis quantities, on at least 15 days during each calendar quarter. Special rules apply if an election is made after the beginning of the taxpayer’s holding period in PFIC stock.
To the extent available, a mark-to-market election applies to the taxable year in which such mark-to-market election is made and to each subsequent taxable year, unless the Company’s common shares cease to be “marketable stock” or the IRS consents to revocation of such election. In addition, a U.S. Holder that has made a mark-to-market election does not include mark-to-market gains, or deduct mark-to-market losses, for years when the Company ceases to be treated as a PFIC.
The mark-to-market rules generally do not appear to prevent the application of the excess distribution rules in respect of stock of any of our subsidiaries in the event that any of our subsidiaries were considered PFICs. Accordingly, if Intellipharmaceutics and any of our subsidiaries were both considered PFICs and a U.S. Holder made a mark-to-market election with respect to its common shares, the U.S. Holder may remain subject to the excess distribution rules described above with respect to its indirectly owned shares of subsidiary stock.
U.S. HOLDERS ARE URGED TO CONSULT THEIR TAX ADVISORS REGARDING THE POSSIBLE APPLICABILITY OF THE PFIC RULES AND THE AVAILABILITY OF, PROCEDURES FOR MAKING, AND CONSEQUENCES OF A QEF ELECTION OR MARK-TO-MARKET ELECTION WITH RESPECT TO THE COMPANY’S COMMON SHARES.
Ownership and Disposition of Common Shares and Warrants to the Extent that the PFIC Rules do not Apply
Distributions on Common Shares
A U.S. Holder that receives a distribution, including a constructive distribution, with respect to a Share will be required to include the amount of such distribution in gross income as a dividend (without reduction for any Canadian income tax withheld from such distribution) to the extent of the current or accumulated “earnings and profits” of the Company, as computed for U.S. federal income tax purposes. Any amount considered to be a dividend received by a U.S. Holder who is an individual should be eligible for the 20% maximum rate of U.S. federal income tax under Section 1(h)(11) of the Code. To the extent that a distribution exceeds the current and accumulated “earnings and profits” of the Company, such distribution will be treated first as a tax-free return of capital to the extent of a U.S. Holder’s tax basis in the common shares and thereafter as gain from the sale or exchange of such common shares. (See “Sale or Other Taxable Disposition of Common Shares” below). However, the Company may not maintain the calculations of earnings and profits in accordance with U.S. federal income tax principles, and each U.S. Holder should (unless advised to the contrary) therefore assume that any distribution by the Company with respect to the common shares will constitute ordinary dividend income. Dividends received on common shares generally will not be eligible for the “dividends received deduction”. The dividend rules are complex, and each U.S. Holder should consult its own tax advisor regarding the application of such rules.
The terms of a warrant may provide for an adjustment to the number of common shares for which the warrant may be exercised or to the exercise price of the warrant in certain events. An adjustment which has the effect of preventing dilution generally is not taxable. However, the U.S. Holders of the warrants would be treated as receiving a constructive distribution from us if, for example, the adjustment increases the warrant holders’ proportionate interest in our assets or earnings and profits (e.g., through an increase in the number of common shares that would be obtained upon exercise) as a result of a distribution of cash to the holders of our common shares which is taxable to the U.S. Holders of such common shares as described under “Distributions on Common Shares” above. Such constructive distribution would be subject to tax as described under that section in the same manner as if the U.S. Holders of the warrants received a cash distribution from us equal to the fair market value of such increased interest.
Sale or Other Taxable Disposition of Common Shares
Upon the sale or other taxable disposition of common shares, a U.S. Holder generally will recognize capital gain or loss in an amount equal to the difference between the U.S. dollar value of cash received plus the fair market value of any property received and such U.S. Holder’s tax basis in such common shares sold or otherwise disposed of. A U.S. Holder’s tax basis in common shares generally will be such Holder’s U.S. dollar cost for such common shares.
Gain or loss recognized on such sale or other disposition generally will be long-term capital gain or loss if, at the time of the sale or other disposition, the common shares have been held for more than one year. The long-term capital gains realized by non-corporate U.S. Holders are generally subject to a lower marginal U.S. federal income tax rate than ordinary income other than qualified dividend income, as defined above. Currently, the maximum rate on long-term capital gains is 20%, although the actual rates may be higher due to the phase out of certain tax deductions, exemptions and credits. However, given the uncertain economic conditions in the United States and the size of the federal deficit, tax rates are subject to change and prospective U.S. Holders should consult their tax advisors. The deductibility of losses may be subject to limitations.
Warrants
Generally, no U.S. federal income tax will be imposed upon the U.S. Holder of a warrant upon exercise of such warrant to acquire our common shares. A U.S. Holder’s tax basis in a warrant will generally be the amount of the purchase price that is allocated to the warrant. Upon exercise of a warrant, the tax basis of the new common shares would be equal to the sum of the tax basis of the warrants in the hands of the U.S. Holder plus the exercise price paid, and the holding period of the new common shares would begin on the date that the warrants are exercised. If a warrant lapses without exercise, the U.S. Holder will generally realize a capital loss equal to its tax basis in the warrant. Prospective U.S. Holders should consult their tax advisors regarding the tax consequences of acquiring, holding and disposing of warrants.
The tax consequences of a cashless exercise of a warrant are not clear under current tax law. A cashless exercise may be tax-free, either because the exercise is not a gain realization event or because the exercise is treated as a recapitalization for U.S. federal income tax purposes. In either tax-free situation, a U.S. Holder’s basis in the common shares received upon exercise would equal the U.S. holder’s basis in the warrant. If the cashless exercise were treated as not being a gain realization event, a U.S. Holder’s holding period in the common shares would be treated as
commencing on the date following the date of exercise of the warrant. If the cashless exercise were treated as a recapitalization, the holding period of the common shares would include the holding period of the warrant. It is also possible that a cashless exercise could be treated as a taxable exchange in which gain or loss would be recognized. In such event, a U.S. Holder could be deemed to have surrendered warrants equal to the number of common shares having a value equal to the exercise price for the total number of warrants to be exercised. The U.S. Holder would recognize capital gain or loss in an amount equal to the difference between the fair market value of the common shares represented by the warrants deemed surrendered and the U.S. Holder’s tax basis in the warrants deemed surrendered. In this case,If taxable exchange treatment applied, a U.S. Holder’s tax basis in the common shares received would equal the sum of the fair market value of the common shares represented by the warrants deemed surrendered and the U.S. Holder’s tax basis in the warrants exercised. A U.S. Holder’s holding period for the common shares would commence on the date following the date of exercise of the warrant. Due to the absence of authority on the U.S. federal income tax treatment of a cashless exercise, there can be no assurance which, if any, of the alternative tax consequences and holding periods described above would be adopted by the IRS or a court of law. Accordingly, U.S. Holders should consult their tax advisors regarding the tax consequences of a cashless exercise.
Additional Considerations
Tax-Exempt Investors
Special considerations apply to U.S. persons that are pension plans and other investors that are subject to tax only on their unrelated business taxable income. Such a tax-exempt investor’s income from an investment in our common shares or warrants generally will not be treated as resulting in unrelated business taxable income under current law, so long as such investor’s acquisition of common shares or warrants is not debt-financed. Tax-exempt investors should consult their own tax advisors regarding an investment in our common shares or warrants.
Additional Tax on Passive Income
Certain individuals, estates and trusts whose income exceeds certain thresholds will generally be required to pay a 3.8% Medicare surtax on the lesser of (1) the U.S. Holder’s “net investment income” for the relevant taxable year and (2) the excess of the U.S. Holder’s modified gross income for the taxable year over a certain threshold (which, in the case of individuals, will generally be between U.S.$125,000 and U.S.$250,000 depending on the individual’s circumstances). A U.S. Holder’s “net investment income” may generally include, among other items, certain interest, dividends, gain, and other types of income from investments, minus the allowable deductions that are properly allocable to that gross income or net gain. U.S. Holders are urged to consult with their own tax advisors regarding the effect, if any, of this tax on their ownership and disposition of common shares or warrants.
Receipt of Foreign Currency
The amount of any distribution paid to a U.S. Holder in foreign currency, or on the sale, exchange or other taxable disposition of common shares or warrants, generally will be equal to the U.S. dollar value of such foreign currency based on the exchange rate applicable on the date of receipt (regardless of whether such foreign currency is converted into U.S. dollars at that time). A U.S. Holder will have a basis in the foreign currency equal to its U.S. dollar value on the date of receipt. Any U.S. Holder who converts or otherwise disposes of the foreign currency after the date of receipt may have a foreign currency exchange gain or loss that would be treated as ordinary income or loss, and generally will be U.S. source income or loss for foreign tax credit purposes. Each U.S. Holder should consult its own U.S. tax advisor regarding the U.S. federal income tax consequences of receiving, owning, and disposing of foreign currency.
Foreign Tax Credit
Subject to the PFIC rules discussed above, a U.S. Holder that pays (whether directly or through withholding) Canadian income tax with respect to dividends paid on the common shares generally will be entitled, at the election of such U.S. Holder, to receive either a deduction or a credit for such Canadian income tax paid. Generally, subject to the limitations described in the next paragraph, a credit will reduce a U.S. Holder’s U.S. federal income tax liability on a dollar-for-dollar basis, whereas a deduction will reduce a U.S. Holder’s income subject to U.S. federal income tax. This election is made on a year-by-year basis and generally applies to all foreign taxes paid (whether directly or through withholding) or accrued by a U.S. Holder during a year.
Complex limitations apply to the foreign tax credit, including the general limitation that the credit cannot exceed the proportionate share of a U.S. Holder’s U.S. federal income tax liability (determined before application of the foreign tax credit) that such U.S. Holder’s “foreign source” taxable income bears to such U.S. Holder’s worldwide taxable income. In applying this limitation, a U.S. Holder’s various items of income and deduction must be classified, under complex rules, as either “foreign source” or “U.S. source.” Generally, dividends paid by a foreign corporation should be treated as foreign source for this purpose, and gains recognized on the sale of stock of a foreign corporation by a U.S. Holder should generally be treated as U.S. source for this purpose, except as otherwise provided in an applicable income tax treaty or if an election is properly made under the Code. However, the amount of a distribution with respect to the common shares that is treated as a “dividend” may be lower for U.S. federal income tax purposes than it is for Canadian federal income tax purposes, resulting in a reduced foreign tax credit allowance to a U.S. Holder. In addition, this limitation is calculated separately with respect to specific categories of income. The foreign tax credit rules are complex, and each U.S. Holder should consult its own U.S. tax advisor regarding the foreign tax credit rules.
State and Local Tax
In addition to the U.S. federal income tax discussed above, U.S. Holders may also be subject to state and local income taxation for amounts received on the disposition of common shares and on dividends received. Amounts paid to U.S. Holders will not have state and local tax amounts withheld from payments and U.S. Holders should consult with a tax advisor regarding the state and local taxation implications of such amounts received.
Information Reporting
In general, U.S. Holders of common shares are subject to certain information reporting under the Code relating to their purchase and/or ownership of stock of a foreign corporation such as the Company. Failure to comply with these information reporting requirements may result in substantial penalties.
For example, recently enacted legislationU.S. federal income tax information reporting rules generally requiresrequire certain individuals who are U.S. Holders to file Form 8938 to report the ownership of specified foreign financial assets if the total value of those assets exceeds an applicable threshold amount (subject to certain exceptions). For these purposes, a specified foreign financial asset includes not only a financial account (as defined for these purposes) maintained by a foreign financial institution, but also any stock or security issued by a non-U.S. person, any financial instrument or contract held for investment that has an issuer or counterparty other than a U.S. person and any interest in a foreign entity, provided that the asset is not held in an account maintained by a financial institution. The minimum applicable threshold amount is generally U.S.$50,000 in the aggregate, but this threshold amount varies depending on whether the individual lives in the U.S., is married, files a joint income tax return with his or her spouse, etc. Certain domestic entities that are U.S. Holders may also be required to file Form 8938 if both (i) such entities are owned at least 80% by an individual who is a U.S. citizen or U.S. tax resident (or, in some cases, by a nonresident alien who meets certain criteria) or are trusts with beneficiaries that are such individuals and (ii) more than 50% of their income consists of certain passive income or more than 50% of their assets is held for the near future.production of such income. U.S. Holders are urged to consult with their tax advisors regarding their reporting obligations, including the requirement to file IRS Form 8938.
In addition, in certain circumstances, a U.S. Holder of common shares who disposes of such common shares in a transaction resulting in the recognition by such Holder of losses in excess of certain significant threshold amounts may be obligated to disclose its participation in such transaction in accordance with the Treasury Regulations governing tax shelters and other potentially tax-motivated transactions or tax shelter regulations. Potential purchasers of common shares should consult their tax advisors concerning any possible disclosure obligation under the tax shelter rules with respect to the disposition of their common shares.
Backup Withholding
Generally, information reporting requirements will apply to distributions on our common shares or proceeds on the disposition of our common shares or warrants paid within the U.S. (and, in certain cases, outside the U.S.) to U.S. Holders. Such payments will generally be subject to backup withholding tax at the rate of 28% if: (a) a U.S. Holder fails to furnish such U.S. Holder’s correct U.S. taxpayer identification number to the payor (generally on Form W-9), as required by the Code and Treasury Regulations, (b) the IRS notifies the payor that the U.S. Holder’s taxpayer identification number is incorrect, (c) a U.S. Holder is notified by the IRS that it has previously failed to properly report interest and dividend income, or (d) a U.S. Holder fails to certify, under penalty of perjury, that such U.S. Holder has furnished its correct U.S. taxpayer identification number. However, certain exempt persons generally are excluded from these information reporting and backup withholding rules.
Backup withholding is not an additional tax. Any amounts withheld under the U.S. backup withholding tax rules will be allowed as a credit against a U.S. Holder’s U.S. federal income tax liability, if any, or will be refunded, if such U.S. Holder furnishes required information to the IRS in a timely manner. Each U.S. Holder should consult its own tax advisor regarding the backup withholding rules.
Canadian Federal Income Tax Considerations
Taxation
The following summary describes the principal Canadian federal income tax considerations generally applicable to a holder of the Company’s common shares who, for purposes of the Income Tax Act (Canada) (the “Canadian Tax Act”) and the Canada – United States Tax Convention (the “Treaty”) and at all relevant times, is resident in the United States and was not and is not resident in Canada nor deemed to be resident in Canada, deals at arm’s length and is not affiliated with the Company, holds the Company’s common shares as capital property, does not use or hold and is not deemed to use or hold the Company’s common shares in or in the course of carrying on business in Canada and who otherwise qualifies for the full benefit of the Treaty (a “United States Holder”). Special rules which are not discussed in this summary may apply to a United States Holder that is a financial institution, as defined in the Canadian Tax Act, or an insurer carrying on business in Canada and elsewhere.
This following summary is based on the current provisions of the Treaty, the Canadian Tax Act and the regulations thereunder, all specific proposals to amend the Canadian Tax Act and the regulations announced by the Minister of Finance (Canada) prior to the date hereof and the Company’s understanding of the administrative practices published in writing by the Canada Revenue Agency prior to the date hereof. This summary does not take into account or anticipate any other changes in the governing law, whether by judicial, governmental or legislative decision or action, nor does it take into account the tax legislation or considerations of any province, territory or non-Canadian (including U.S.) jurisdiction, which legislation or considerations may differ significantly from those described herein.
All amounts relevant in computing a United States Holder’s liability under the Canadian Tax Act are to be computed in Canadian currency based on the relevant exchange rate applicable thereto.
This summary is of a general nature only and is not intended to be, and should not be interpreted as legal or tax advice to any prospective purchaser or holder of the Company’s common shares and no representation with respect to the Canadian federal income tax consequences to any such prospective purchaser is made. Accordingly, prospective purchasers and holders of the Company’s common shares should consult their own tax advisors with respect to their particular circumstances.
Dividends on the Company’s Common Shares
Generally, dividends paid or credited by Canadian corporations to non-resident shareholders are subject to a withholding tax of 25% of the gross amount of such dividends. Pursuant to the Treaty, the withholding tax rate on the gross amount of dividends paid or credited to United States Holders is reduced to 15% or, in the case of a United States Holder that is a U.S. corporation that beneficially owns at least 10% of the voting stock of the Canadian corporation paying the dividends, to 5% of the gross amount of such dividends.
Pursuant to the Treaty, certain tax-exempt entities that are United States Holders may be exempt from Canadian withholding taxes, including any withholding tax levied in respect of dividends received on the Company’s common shares.
Disposition of the Company’s Common Shares
In general, a United States Holder will not be subject to Canadian income tax on capital gains arising on the disposition or deemed disposition of the Company’s common shares, unless such shares are “taxable Canadian property” within the meaning of the Canadian Tax Act. Generally, a share listed on a designated stock exchange for purposes of the shares of a corporation resident in CanadaCanadian Tax Act (which includes the TSX and NASDAQ) will not be taxable“taxable Canadian property ofproperty” to a United States Holder at the time of disposition unless, at any particular time during the 60-month60 month period immediately preceding the disposition (i) 25% or more of the issued shares of any class or series of the particular corporation were owned by: (a) such United States Holder, (b) by persons with whom the United States Holder did not deal at arm’s length, (c) a partnership in which the United States Holder, or persons with whom the United States Holder did not deal at arm’s length, holds a membership interest directly or indirectly through one or more partnerships, or (d) any combination thereof, and (ii) the shares derived more than 50% of thetheir fair market value of the Company’s common shares was derived directly or indirectly from properties that are “realone or immovable properties”any combination of real property situated in Canada, “timber resource property”, “Canadian resource properties”, or “timber resource properties”, within the meaning ofproperty” (each as defined under the Canadian Tax Act. Act), or options in respect of, or interests or rights in any of the foregoing.
F.Dividends and Paying Agents.
The value of the Company’s common shares is not now, and is not expected to be in the future, derived more than 50% from any of these properties. Consequently, any gain realized by a United States Holder upon the disposition of the Company’s common shares should be exempt from tax under the Canadian Tax Act.
Not Applicable
Not Applicable
Copies of the documents referred to in this annual report may be inspected, during normal business hours, at the Company’s headquarters located at 30 Worcester Road, Toronto, Ontario, M9W 5X2, Canada.
We are required to file reports and other information with the SEC under the U.S. Exchange Act. Reports and other information filed by us with the SEC may be inspected and copied at the SEC’s public reference facilities located at 100 F Street, N.E. in Washington D.C. The SEC also maintains a website at http://www.sec.gov that contains certain reports and other information that we file electronically with the SEC. As a foreign private issuer, we are exempt from the rules under the U.S. Exchange Act prescribing the furnishing and content of proxy statements and our officers, directors and principal shareholders are exempt from the reporting and short-swing profit recovery provisions contained in Section 16 of the U.S. Exchange Act. Under the U.S. Exchange Act, as a foreign private issuer, we are not required to publish financial statements as frequently or as promptly as United States companies.
See Item 4.C of this annual report.
We are exposed to interest rate risk, which is affected by changes in the general level of interest rates. Due to the fact that the Company’s cash is deposited with major financial institutions in an interest savings account, we do not believe that the results of operations or cash flows would be affected to any significant degree by a sudden change in market interest rates given their relative short-term nature.
Trade accounts receivable potentially subjects the Company to credit risk. The Company provides an allowance for doubtful accounts equal to the estimated losses expected to be incurred in the collection of accounts receivable.
The following table sets forth details of the aged accounts receivable that are not overdue as well as an analysis of overdue amounts and the related allowance for doubtful accounts:
November 30, | ||||
2017 | 2016 | |||
November 30, 2016 | November 30, 2015 | $ | ||
$ | $ | |||
| Total accounts receivable | 472,474 | 478,674 | 756,468 | 472,474 |
| Less allowance for doubtful accounts | - | - | (66,849) | - |
| Total accounts receivable, net | 472,474 | 478,674 | 689,619 | 472,474 |
| Not past due | 427,519 | 453,662 | 689,619 | 427,519 |
| Past due for more than 31 days but no more than 60 days | 3,319 | 5,003 | ||
| Past due for more than 91 days but no more than 120 days | 41,636 | 20,009 | ||
Total accounts receivable, net | 472,474 | 478,674 | ||
| Past due for more than 31 days | ||||
| but no more than 60 days | 5,176 | 3,319 | ||
| Past due for more than 91 days | ||||
| but no more than 120 days | 61,673 | 41,636 | ||
| Total accounts receivable, gross | 756,468 | 472,474 | ||
Financial instruments that potentially subject the Company to concentration of credit risk consist principally of uncollateralized accounts receivable. The Company’s maximum exposure to credit risk is equal to the potential amount of financial assets. For the yearsyear ended November 30, 20162017, two customers accounted for substantially all the revenue and all the accounts receivable of the Company. For the year ended November 30, 2015,2016, Par accounted for substantially all the revenue and all the accounts receivable of the Company.
The Company is also exposed to credit risk at period end from the carrying value of its cash. The Company manages this risk by maintaining bank accounts with a Canadian Chartered Bank. The Company’s cash is not subject to any external restrictions.
Foreign exchange risk
We are exposed to changes in foreign exchange rates between the Canadian and U.S. dollar which could affect the value of our cash. The Company had no foreign currency hedges or other derivative financial instruments as of November 30, 2016.2017. The Company did not enter into financial instruments for trading or speculative purposes and does not currently utilize derivative financial instruments.
The Company has balances in Canadian dollars that give rise to exposure to foreign exchange (“FX”) risk relating to the impact of translating certain non-U.S. dollar balance sheet accounts as these statements are presented in U.S. dollars. A strengthening U.S. dollar will lead to a FX loss while a weakening U.S. dollar will lead to a FX gain. For each Canadian dollar balance of $1.0 million, a +/- 10% movement in the Canadian currency held by the Company versus the U.S. dollar would affect the Company’s loss and other comprehensive loss by $0.1 million.
Balances denominated in foreign currencies that are considered financial instruments are as follows:
November 30, 2016 | November 30, 2015 | |||
Canadian | U.S. | Canadian | U.S. | |
| FX rates used to translate to U.S. | 1.3429 | 1.3353 | ||
$ | $ | $ | $ | |
| Assets | ||||
| Cash | 182,714 | 136,059 | 116,096 | 86,944 |
116,096 | 86,944 | |||
| Liabilities | ||||
| Accounts payable | 449,900 | 335,021 | 1,372,196 | 1,027,631 |
| Employee cost payable | 1,402,108 | 1,044,151 | 233,906 | 175,171 |
| Capital lease | 19,914 | 14,829 | 48,231 | 36,120 |
1,871,922 | 1,394,001 | 1,654,333 | 1,238,922 | |
Net exposure | (1,689,208) | (1,257,942) | (1,538,237) | (1,151,978) |
November 30, 2017 | November 30, 2016 | |||
Canadian | U.S. | Canadian | U.S. | |
| FX rates used to translate to U.S. | 1.2888 | 1.3429 | ||
$ | $ | $ | $ | |
| Assets | ||||
| Cash | 202,277 | 156,950 | 182,714 | 136,059 |
202,277 | 156,950 | 182,714 | 136,059 | |
| Liabilities | ||||
| Accounts payable and accrued liabilities | 1,704,086 | 1,322,227 | 949,911 | 707,358 |
| Employee cost payable | 277,080 | 214,980 | 1,402,108 | 1,044,151 |
| Capital lease | - | - | 19,912 | 14,828 |
1,981,166 | 1,537,207 | 2,371,933 | 1,766,338 | |
| Net exposure | (1,778,889) | (1,380,257) | (2,189,219) | (1,630,278) |
Liquidity risk
Liquidity risk is the risk that the Company will encounter difficulty raising liquid funds to meet commitments as they fall due. In meeting its liquidity requirements, the Company closely monitors its forecasted cash requirements with expected cash drawdown.
The following are the contractual maturities of the undiscounted cash flows of financial liabilities as at November 30, 2016:
2017:
2017:
November 30, 2016 | ||||||
Less than 3 months | 3 to 6 months | 6 to 9 months | 9 months 1 year | Greater than 1 year | Total | |
| $ | $ | $ | $ | $ | $ | |
| Third parties | ||||||
| Accounts payable | 807,295 | - | - | - | - | 807,295 |
| Accrued liabilities | 384,886 | - | - | - | - | 384,886 |
| Capital lease | 5,437 | 5,585 | 3,807 | - | - | 14,829 |
| Related parties | ||||||
| Employee costs payable | 707,547 | - | - | 336,604 | - | 1,044,151 |
| Convertible debenture | 59,138 | 1,515,770 | - | - | - | 1,574,908 |
1,964,303 | 1,521,355 | 3,807 | 336,604 | - | 3,826,069 | |
November 30, 2017 | ||||||
Less than | 3 to 6 | 6 to 9 | 9 months | Greater than | ||
3 months | months | months | to 1 year | 1 year | Total | |
$ | $ | $ | $ | $ | $ | |
| Third parties | ||||||
| Accounts payable | 2,060,084 | - | - | - | - | 2,060,084 |
| Accrued liabilities | 782,369 | - | - | - | - | 782,369 |
| Related parties | ||||||
| Employee costs payable | 214,980 | - | - | - | - | 214,980 |
| Convertible debenture | 66,973 | 40,805 | 40,805 | 1,363,749 | - | 1,512,332 |
3,124,406 | 40,805 | 40,805 | 1,363,749 | - | 4,569,765 | |
Limitations:
The above discussion includes only those exposures that existed as of November 30, 2016,2017, and, as a result, does not consider exposures or positions that could arise after that date. The Company’s ultimate realized gain or loss with respect to interest rate and exchange rate fluctuations would depend on the exposures that arise during the period and interest and foreign exchange rates.
Item 12.
Not applicable.
Not applicable.
Not applicable.
None.
PART II.
There have been no material defaults in the payment of any principal or interest owing. Neither the Company nor its subsidiaries has any preferred shares outstanding.
There has been no material modification of the instruments defining the rights of holders of any class of registered securities. There has been no withdrawal or substitution of assets securing any class of registered securities.
Item 15.
Internal Control over Financial Reporting
The management of our Company is responsible for establishing and maintaining adequate internal control over financial reporting for the Company. Internal control over financial reporting is a process designed to provide reasonable assurance regarding the reliability of financial reporting and the preparation of financial statements in accordance with generally accepted accounting principles and includes those policies and procedures that (1) pertain to the maintenance of records that, in reasonable detail, accurately and fairly reflect the transactions and dispositions of the Company’s assets, (2) provide reasonable assurance that transactions are recorded as necessary to permit preparation of financial statements in accordance with generally accepted accounting principles, and that the Company’s receipts and expenditures are being made only in accordance with authorizations of the Company’s management and directors, and (3) provide reasonable assurance regarding prevention or timely detection of unauthorized acquisition, use, or disposition of the Company’s assets that could have a material effect on the financial statements.
Management assessed the effectiveness of the Company’s internal control over financial reporting using the 1992 Internal Control-Integrated Framework developed by the Committee of Sponsoring Organizations of the Treadway Commission (“COSO”).
Based on this assessment, management concluded that the Company’s internal control over financial reporting was effective as of November 30, 2016.2017.
In the firstsecond quarter of 2017, we will initiateinitiated the transition from the COSO 1992 Internal Control - Integrated Framework to the COSO 2013 Internal Control - Integrated Framework. Progress thus far has centered on strengthening our risk assessment process as well as our information technology policies and related documentation. We expect this transition to be completed incontinue for the second quarterremainder of fiscal 2017.2018. Although we do not expect to experience significant changes in internal control over financial reporting as a result of our transition, we may identify significant deficiencies or material weaknesses and incur additional costs in the future as a result of our transition.
Disclosure Controls and Procedures
Under the supervision and with the participation of our management, including the Chief Executive Officer and the Chief Financial Officer, we have evaluated the effectiveness of our disclosure controls and procedures as of November 30, 2016.2017. Disclosure controls and procedures are designed to ensure that the information required to be disclosed by the Company in the reports it files or submits under securities legislation is recorded, processed, summarized and reported on a timely basis and that such information is accumulated and communicated to management, including the Company’s Chief Executive Officer and Chief Financial Officer, as appropriate, to allow required disclosures to be made in a timely fashion. Based on that evaluation, management has concluded that these disclosure controls and procedures were effective as of November 30, 2016.2017.
Changes in Internal Control over Financial Reporting
During the year ended November 30, 2016, other than as noted above,2017, there were no changes made to the Company’s internal control over financial reporting that have materially affected, or are reasonably likely to
materially affect, ourthe Company’s internal control over financial reporting, or disclosure controls and procedures, and specifically, there were no changes in accounting functions, board or related committees and charters, or (except as described below) auditors; no functions, controls or financial reporting processes of any constituent entities were adopted as Intellipharmaceutics’the Company’s functions, controls and financial processes; and no other significant business processes were implemented.
Attestation of Internal Control over Financial Reporting
This annual report does not include an attestation report of our independent registered public accounting firm regarding internal control over financial reporting for the Company. As the Company is a non-accelerated filer, management’s report is not subject to attestation by our independent registered public accounting firm pursuant to Section 404(c) of the Sarbanes-Oxley Act of 2002.
Item 16.[Reserved]
Our Audit Committee is comprised of Kenneth Keirstead, Bahadur Madhani and Dr. Eldon Smith, each of whom is considered independent and financially literate (as such terms are defined under National Instrument 52-110 – Audit Committee). The members of the Audit Committee have selected a Chair from amongst themselves, being Mr. Madhani.
Under the SEC rules implementing the Sarbanes-Oxley Act of 2002, Canadian issuers filing reports in the United States must disclose whether their audit committees have at least one “audit committee financial expert”. Additionally, under NASDAQNasdaq Listing Rule 5605(c)(2)(A), NASDAQNasdaq requires that one member of the audit committee have “past employment experience in finance or accounting, requisite professional certification in accounting, or any other comparable experience or background which results in the individual’s financial sophistication, including being or having been a chief executive officer, chief financial officer, or other senior officer with financial oversight responsibilities.” The Board has determined that Mr. Madhani qualifies as an Audit Committee financial expert under the SEC rules and as financially sophisticated under the NASDAQNasdaq rules.
The Code of Business Conduct and Ethics (the “Code of Ethics”) has been implemented and it applies to all directors, officers, employees of the Company and its subsidiaries. It may be viewed on our website at www.intellipharmaceutics.com. During the year ended November 30, 2016,2017, no waivers or requests for exemptions from the Code of Ethics were either requested or granted.
2016 | 2015 | |
Audit Fees(1) | C$124,387 | C$169,850 |
Audit-Related Fees(2) | C$174,738 | C$188,855 |
Tax Fees(3) | C$45,460 | C$38,160 |
All Other Fees(4) | -- | C$2,953 |
Total Fees | C$344,585 | C$399,818 |
Our current auditor is MNP LLP (“MNP”), Independent Registered Public Accounting Firm, 111 Richmond Street West, Suite 300, Toronto, ON M5H 2G4. MNP is independent with respect to the Company within the meaning of the Rules of Professional Conduct of the Chartered Professional Accountants of Ontario, the rules and standards of the Public Company Accounting Oversight Board (United States) and the securities laws and regulations administered by the SEC.
The aggregate amounts billed by MNP to us for the years ended November 30, 20162017 and 20152016 for audit fees, audit-related fees, tax fees and all other fees are set forth below:
2016 | 2015 | 2017 | 2016 | |
Audit Fees(1) | - | - | ||
Audit-Related Fees(2) | C$75,664 | - | ||
Tax Fees(3) | - | - | ||
All Other Fees(4) | C$24,075 | - | ||
| Audit Fees(1) | C$129,342 | - | ||
| Audit-Related Fees(2) | C$210,791 | C$75,664 | ||
| Tax Fees(3) | - | |||
| All Other Fees(4) | - | C$24,075 | ||
Total Fees | C$99,739 | - | C$340,133 | C$99,739 |
(1)
Audit fees consist of fees related to the audit of the Company’s consolidated financial statements.
(2)
Audit-related fees consist of consultation on accounting and disclosure matters and review of quarterly interim financial statements, prospectus and base shelf activities and Form 20-F reviews.
(3)
Tax fees consist of fees for tax consultation, tax advice and tax compliance services for the Company and its subsidiaries.
(4)
All other fees related to internal control reviews.
The Company’s related party pre-approval policies and procedures are described in Item 6.C.
Under applicable Canadian securities regulations, the Company is required to disclose whether its Audit Committee has adopted specific policies and procedures for the engagement of non-audit services and to prepare a summary of these policies and procedures. The Audit Committee’s responsibility is to approve all audit engagement fees and terms as well as reviewing policies for the provision of non-audit services by the external auditors and, when required, the framework for pre-approval of such services. The Audit Committee delegates to its Chairman the pre-approval of such non-audit fees. For each of the years ended November 30, 20162017 and 2015,2016, all of the non-audit services provided by the Company’s external auditor were approved by the Chairman of the Audit Committee.
Not applicable.
Neither the Company nor, to our knowledge, any affiliated purchaser has made any purchases of our registered shares during the last financial year.
The Company is the successor issuer to Vasogen Inc. for reporting purposes under the U.S. Exchange Act. Our common shares are currently listed on the TSX and quoted for trading on NASDAQNasdaq, in each case under the symbols “I” and “IPCI”, respectively.“IPCI.” Our shares began trading on October 22, 2009, when the IPC Arrangement Agreement with Vasogen was completed.
Variations from Certain NASDAQNasdaq Rules
Nasdaq listing rules permit the Company to follow certain home country practices in lieu of compliance with certain NASDAQNasdaq corporate governance rules. Set forth below are the requirements of NASDAQ’sNasdaqs Rule 5600 Series that the Company does not follow and the home country practices that it follows in lieu thereof and other differences from domestic U.S. companies that apply to us under NASDAQ’sNasdaq’s corporate governance rules.
Shareholder Approval in Connection with Certain Transactions: NASDAQ’sNasdaq’s Rule 5635 requires each issuer to obtain shareholder approval prior to certain dilutive events, including: (i) a transaction other than a public offering involving the sale under certain circumstances of 20% or more of the issuer’s common shares outstanding prior to the transaction at a price less than the greater of book value or market value, (ii) the acquisition of the stock or assets of another company; (iii) equity-based compensation of officers, directors, employees or consultants and (iv) a change of control. Under the exemption available to foreign private issuers under NASDAQNasdaq Rule 5615(a)(3),
the Company does not follow NASDAQNasdaq Rule 5635. Instead, and in accordance with the NASDAQNasdaq exemption, the Company complies with applicable TSX rules and applicable Canadian corporate and securities regulatory requirements.
Independence of the Majority of the Board of Directors; Independent Director Oversight of Executive Compensation and Board Nominations: NASDAQ’sNominations: Nasdaq’s Rule 5605(b)(1) requires that the Board of Directors be comprised of a majority of independent directors, as defined in Rule 5605(a)(2). NASDAQ’sNasdaq’s Rule 5605(b)(2) requires the independent members of the Board to regularly hold executive sessions where only those directors are present. Moreover, NASDAQ’sNasdaq’s Rule 5605(d) requires independent director oversight of executive officer compensation arrangements by approval of such compensation by a majority of the independent directors or by a compensation committee comprised solely of independent directors, and Rule 5605(e) requires similar oversight with respect to the process of selecting nominees to the Board. Under the exemption available to foreign private issuers under Rule 5615(a)(3), the Company does not follow NASDAQNasdaq Rules 5605(b)(1), 5605(d) or 5605(e). Instead, and in accordance with the NASDAQNasdaq exemption, the Company complies with the applicable TSX rules and applicable Canadian corporate and securities regulatory requirements.
Disclosure of Waivers of Code of Business Conduct and Ethics: Domestic U.S. NASDAQNasdaq listed companies are required under NASDAQNasdaq Rule 5610 to disclose any waivers of their codes of conduct for directors or executive officers in a Form 8-K within four business days. As a foreign private issuer we are required to disclose any such waivers either in a Form 6-K or in the Company’s next Form 20-F or 40-F.
Not applicable.
PART III.
Item 17.
See Item 18 below.
114
Item 18.
Consolidated financial statements of
Intellipharmaceutics
International Inc.
November 30, 2017, 2016 2015 and 2014
2015
Intellipharmaceutics International Inc.
November 30, 2017, 2016 2015 and 20142015
Table of contents
| Reports of Independent Registered Public Accounting Firms | 1-2 |
| Consolidated balance sheets | 3 |
| Consolidated statements of operations and comprehensive loss | 4 |
| Consolidated statements of shareholders’ equity (deficiency) | 5 |
| Consolidated statements of cash flows | 6 |
| Notes to the consolidated financial statements | 7-31 |
REPORT OF INDEPENDENT REGISTERED PUBLIC ACCOUNTING FIRM
To the Board of Directors and Shareholders of
Intellipharmaceutics International Inc.
We have audited the accompanying consolidated balance sheetsheets of Intellipharmaceutics International Inc. and its subsidiaries (the "Company"“Company”), as of November 30, 2017 and 2016, and the related consolidated statementstatements of operations and comprehensive loss, cash flows and shareholders’ equity (deficiency), and cash flows, for each of the yearyears in the two-year period ended November 30, 2016. These2017. The Company’s management is responsible for these consolidated financial statements are the responsibility of the Company’s management.statements. Our responsibility is to express an opinion on these consolidated financial statements based on our audit.audits.
We conducted our auditaudits in accordance with the standards of the Public Company Accounting Oversight Board (United States) and Canadian generally accepted auditing standards. Those standards require that we plan and perform the audit to obtain reasonable assurance about whether the financial statements are free of material misstatement. The Company is not required to have, nor were we engaged to perform, an audit of its internal control over financial reporting. Our auditaudits included consideration of internal control over financial reporting as a basis for designing audit procedures that are appropriate in the circumstances, but not for the purpose of expressing an opinion on the effectiveness of the Company’s internal control over financial reporting. Accordingly, we express no such opinion. An audit also includes examining, on a test basis, evidence supporting the amounts and disclosures in the financial statements. An audit also includesstatements, assessing the accounting principles used and significant estimates made by management, as well as evaluating the overall financial statement presentation. We believe that our audit providesaudits provide a reasonable basis for our opinion.
In our opinion, the consolidated financial statements referred to above present fairly, in all material respects, the financial position of the Company as of November 30, 2017 and 2016, and the results of its operations and its cash flows for each of the year thenyears in the two-year period ended November 30, 2017, in conformity with accounting principles generally accepted in the United States of America.
The accompanying consolidated financial statements have been prepared with the assumptionassuming that the Company will continue as a going concern. As discussed in Note 1 to the consolidated financial statements, the Company’s recurring losses from operations raise substantial doubt about its ability to continue as a going concern. Management’s plans concerning these matters are also discussed in Note 1 to the consolidated financial statements. The consolidated financial statements do not include any adjustments that might result from the outcome of this uncertainty.
At November 30, 2017, there were 94,131 DSUs issued and outstanding. From November 30, 2017 to February 27, 2018, an additional 8,660 DSUs have been issued. At February 27, 2018, 7,209 additional DSUs are reserved for issuance under our DSU plan.
Restricted Share Units
At November 30, 2017, there were no restricted share units (“RSUs”) issued and outstanding. From November 30, 2017 to the date of this report, no RSUs have been issued. At February 27, 2018, 330,000 RSUs are reserved for issuance under our RSU Plan.
Registration Rights
We conducted a private placement issuance of units comprised of common shares and warrants in February, 2011, which was exempt from registration under the U.S. Securities Act pursuant to Regulation D and Section 4(2) and/or Regulation S thereof and such other available exemptions. As such, the common shares, the warrants, and the common shares underlying the warrants may not be offered or sold in the United States unless they are registered under the U.S. Securities Act, or an exemption from the registration requirements of the U.S. Securities Act is available.
In connection with the private placement, we agreed to file a registration statement on Form F-3 (“Registration Statement”) within 40 days after the closing and use our best efforts to have it declared effective within 150 days after the closing to register (i) 100% of the common shares issued in the private placement; and (ii) 100% of the common shares underlying the investor warrants issued in the private placement (collectively, the private placement or the “Registrable Securities”).
The consolidated financial statementsRegistration Statement was declared effective as of Intellipharmaceutics InternationalMarch 30, 2011. If (i) the Registration Statement ceases to be continuously effective for more than twenty consecutive calendar days or more than an aggregate of thirty calendar days during any consecutive 12-month period, or (ii) at a time in which the Registrable Securities cannot be sold under the Registration Statement, we shall fail for any reason to satisfy the current public information requirement under Rule 144 as to the applicable Registrable Securities, we shall pay to the investors, on a pro rata basis, partial liquidated damages of one percent (1%) of the aggregate purchase price paid by each investor on the occurrence of an event listed above and for each calendar month (pro rata for any period less than a calendar month) from an event, until cured.
The securities shall cease to be Registrable Securities when (i) they have been sold (A) pursuant to a registration statement; or (B) in accordance with Rule 144 or any other rule of similar effect; or (ii) such securities become eligible for resale without volume or manner-of-sale restrictions, and when either we are compliant with any current public information requirements pursuant to Rule 144 or the current public information requirements no longer apply.
Prior Sales
On March 15, 2012, we completed a registered direct common share offering for gross proceeds of $5,000,000. We sold an aggregate of 1,818,182 shares to U.S. institutional investors at a price of $2.75 per share.
In January 2013, we completed a private placement financing of a Debenture in the original principal amount of $1.5 million. The Debenture was originally due to mature on January 1, 2015, but effective October 1, 2014, the maturity date was extended to July 1, 2015; effective June 29, 2015, the maturity date was extended to January 1, 2016; effective as of December 8, 2015, the maturity date was extended to July 1, 2016; and effective May 26, 2016, the maturity date of the Debenture was further extended to December 1, 2016. The Debenture bears interest at a rate of 12% per annum, payable monthly, is pre-payable at any time at our option, and was convertible at any time into 500,000 common shares at a conversion price of $3.00 per common share at the option of the holder. Drs. Isa and Amina Odidi, our principal stockholders, directors and executive officers provided us with the $1.5 million of the proceeds for the Debenture. Effective December 1, 2016, the maturity date for the Debenture was extended to April 1, 2017 and a principal repayment of $150,000 was made at the time of the extension. After giving effect to such partial repayment, the Debenture is convertible at any time into 450,000 common shares at a conversion price of $3.00 per common share at the option of the holder. The maturity date of the Debenture has been further extended to October 1, 2018. The Company currently expects to repay the current net amount of $1,350,000 on or about October 1, 2018, if the Company then has cash available.
In March 2013, we completed a registered direct unit offering for gross proceeds of $3,121,800. We sold an aggregate of 1,815,000 units at a price of $1.72 per unit. The units were comprised of an aggregate of 1,815,000 common shares and warrants to purchase an additional 453,750 common shares. The warrants are exercisable for a term of five years and have an exercise price of $2.10 per common share.
In July 2013, we completed an underwritten public offering of 1,500,000 units of common shares and warrants for gross proceeds of $3,075,000 at a price of $2.05 per unit. The units were comprised of an aggregate of 1,500,000 common shares and warrants to purchase an additional 375,000 common shares. The warrants have a term of five years and an exercise price of $2.55 per common share.
In November 2013, we entered into an equity distribution agreement with Roth, pursuant to which we may from time to time sell up to 5,305,484 of our common shares for up to an aggregate of $16.8 million (or such lesser amount as may then be permitted under applicable exchange rules and securities laws and regulations) through at-the-market issuances on the Nasdaq or otherwise. Under the equity distribution agreement, we may at our discretion, from time to time, offer and sell common shares through Roth or directly to Roth for resale. Sales of common shares through Roth, if any, will be made at such time and at such price as are acceptable to us, from time to time, by means of ordinary brokers’ transactions on the Nasdaq or otherwise at market prices prevailing at the time of sale or as determined by us. We currently plan to use any net proceeds from the at-the-market offering for general corporate purposes, including funding research, product development and other corporate development opportunities and to possibly fund costs and other expenses relating to our current leased facilities to accommodate our anticipated growth requirements, and, although we have no present understanding, commitments or agreements to do so, potential acquisition of, or investment in, companies and technologies that complement our business. We are not required to sell shares under the equity distribution agreement. We pay Roth a commission, or allow a discount, of 2.75% of the gross proceeds we receive from any sales of our common shares under the equity distribution agreement. Any sales of shares under our at-the-market offering program will be made pursuant to an effective shelf registration statement on Form F-3 filed with the SEC. We have also agreed to reimburse Roth for certain expenses relating to the offering. As of February 27, 2018, we have issued and sold 4,740,350 common shares with an aggregate offering price of $13,872,929 under the at-the-market program. Roth received aggregate compensation of $392,827 in connection with such sales. As a result of prior sales of the Company’s common shares under the equity distribution agreement, the Company may in the future offer and sell its common shares with an aggregate purchase price up to $2,927,071, or such lesser amount as may then be permitted under applicable exchange rules and securities laws and regulations, pursuant to the at-the-market program. Under Toronto Stock Exchange rules, the number of common shares that may currently be offered under the at-the-market program is 565,134 common shares. The Company intends to remove or amend this limitation, although no assurance can be given that the limitation will be removed or amended. There can be no assurance that any additional shares will be sold under our at-the-market program. Subsequent
to the year ended November 30, 2017, share issuance costs of Nil were recorded against the cost of the shares issued and recognized in capital stock. As at November 30, 2017, $1,334,873 of the share issuance costs has been recorded against the cost of the shares issued and recognized in capital stock. Pursuant to an Underwriting Agreement between the Company and Dawson James Securities, Inc., dated May 27, 2016 (the “Dawson James Underwriting Agreement”), in June 2016, we completed an underwritten public offering of 3,229,814 units of common shares and warrants, at a price of $1.61 per unit. The warrants are currently exercisable, have a term of five years and an exercise price of $1.93 per common share. We issued at the initial closing of the offering an aggregate of 3,229,814 common shares and warrants to purchase an additional 1,614,907 common shares. The underwriter also purchased at such closing additional warrants to acquire 242,236 common shares pursuant to the over-allotment option exercised in part by the underwriter. We subsequently sold an aggregate of 459,456 additional common shares at the public offering price of $1.61 per share in connection with subsequent partial exercises of the underwriter’s over-allotment option. The closings of these partial exercises brought the total net proceeds from the offering to approximately $5.1 million, after deducting the underwriter’s discount and offering expenses.
On July 17, 2017, the Shelf Registration Statement was declared effective by the SEC. The Shelf Registration Statement allows for, subject to securities regulatory requirements and limitations, the potential offering of up to an aggregate of $100 million of the Company’s common shares, preference shares, warrants, subscription receipts, subscription rights and units, or any combination thereof, from time to time in one or more offerings, and is intended to give the Company the flexibility to take advantage of financing opportunities when, and if, market conditions are favorable to the Company. The specific terms of such future offerings, if any, would be established, subject to the approval of the Company’s board of directors, at the time of such offering and will be described in detail in a prospectus supplement filed at the time of any such offering. To the extent that any securities are issued by the Company under the Shelf Registration Statement, a shareholder’s percentage ownership will be diluted and our stock price could be adversely affected. As of February 27, 2018, the Company has not sold any securities under the Shelf Registration Statement, other than the sale since July 17, 2017 of (i) 485,239 common shares under the Company’s at-the-market program referred to above and (ii) the sale of 3,636,364 common shares under the Wainwright Agreement referred to above, and there can be no assurance that any additional securities will be sold under the Shelf Registration Statement or the shelf prospectus.
Pursuant to a placement agent agreement dated October 10, 2017 between the Company and H.C. Wainwright & Co., LLC (the “Wainwright Agreement”), in October 2017, we completed a registered direct offering consisting of 3,636,364 common shares at a price of $1.10 per share for gross proceeds of approximately $4 million. We also issued to the investors warrants to purchase an aggregate of 1,818,182 common shares at an exercise price of $1.25 per share. The warrants are exercisable six months following the October 13, 2017 closing date and will expire 30 months after the date they become exercisable. The common shares (but not the warrants or the common shares underlying the warrants) were offered by us through a prospectus supplement pursuant to our shelf registration statement on Form F-3 as previously filed and declared effective by the SEC and the base prospectus contained therein (Registration Statement No. 333-218297). The warrants described above were offered in a private placement under Section 4(a)(2) of the U.S. Securities Act, and Regulation D promulgated thereunder and, along with the common shares underlying the warrants, have not been registered under the U.S. Securities Act, or applicable state securities laws. The Company also issued to the placement agents 181,818 warrants to purchase a share of common stock at an exercise price of $1.375 per share. The total net proceeds from the offering were $3.5 million, after deducting offering expenses.
During the 12-month period ended November 30, 2017, warrants to purchase an aggregate of 168,009 common shares were exercised.
During the 12-month period ended November 30, 2017, 496,000 options were granted and 2,000 options were exercised.
Also during the 12-month period ended November 30, 2017, a total of 17,388 deferred share units were granted.
The Company was formed under the Canada Business Corporations Act (the “CBCA”) by articles of arrangement dated October 22, 2009 (the “Articles”) in the IPC Arrangement Transaction discussed in Item 15. The Company is the successor issuer to Vasogen Inc. for reporting purposes under the U.S. Exchange Act. The authorized share capital of the Company consists of an unlimited number of common shares, all without nominal or par value and an unlimited number of preference shares issuable in series.
Provisions as to the modification, amendment or variation of rights and provisions of each class of shares are contained in the CBCA and the regulations promulgated thereunder. Certain fundamental changes to the Articles will require the approval of at least two-thirds of the votes cast on a resolution submitted to a special meeting of the Company’s shareholders called for the purpose of considering the resolution. These items include (i) certain amendments to the provisions relating to the outstanding capital of the Company, (ii) a sale of all or substantially all of the assets of the Company, (iii) an amalgamation of the Company with another company, other than a subsidiary, (iv) a winding-up of the Company, (v) a continuance of the Company into another jurisdiction, (vi) a statutory court approved arrangement under the CBCA (essentially a corporate reorganization such as an amalgamation, sale of assets, winding-up, etc.), or (vii) a change of name.
Under the CBCA, a corporation cannot repurchase its subsidiariesshares or pay or declare dividends if there are reasonable grounds for believing that (a) the corporation is, or after payment would be, unable to pay its liabilities as they become due, or (b) after the payment, the realizable value of the corporation’s assets would be less than the aggregate of (i) its liabilities and (ii) its stated capital of all classes of its securities. Generally, stated capital is the amount paid on the issuance of a share unless the stated capital has been adjusted in accordance with the CBCA.
General
The Articles do not contain any restrictions on the business the Company may carry on.
Directors
The Company’s By-Law No. 1 (a by-law relating generally to the transaction of the business and affairs of the Company) provides for the indemnification of the directors and officers of the Company, former directors and officers of the Company against all costs, charges and expenses, including an amount paid to settle an action or satisfy a judgment, reasonably incurred by the individual in respect of any civil, criminal, administrative, investigative or other proceeding in which the individual is involved because of that association with the Company, subject to certain limitations in By-Law No. 1 and the limitations in the CBCA.
The Company may also indemnify other individuals who act or acted at the Company’s request as a director or officer, or an individual acting in a similar capacity, of another entity.
Annual and Special Meetings
Meetings of shareholders are held at such place, at such time, on such day and in such manner as the Board may, subject to the CBCA and any other applicable laws, determine from time to time. The only persons entitled to attend a meeting of shareholders are those persons entitled to notice thereof, those entitled to vote thereat, the directors, the auditors of the Company and any others who may be entitled or required under the CBCA to be present at the meeting. Under the CBCA, notice of the meeting is required to be given not less than 21 days and not more than 60 days prior to the meeting. Shareholders on the record date are entitled to attend and vote at the meeting. The quorum for the transaction of business at any meeting of shareholders is at least two persons present at the opening of the meeting who are entitled to vote either as shareholders or proxyholders, representing collectively not less than 5% of the outstanding shares of the Company entitled to be voted at the meeting.
Other
There is no by-law provisions governing the ownership threshold above which shareholder ownership must be disclosed. However, there are disclosure requirements pursuant to applicable Canadian law.
There are no provisions in either the Company’s Articles or By-Law No. 1 that would have the effect of delaying, deferring or preventing a change in control of the Company and that would operate only with respect to a merger, acquisition or corporate restructuring involving the Company or its subsidiary.
There are no limitations on the rights to own securities, including the rights of non-resident or foreign shareholders to hold or exercise voting rights on the securities imposed by foreign law or by the charter or other constituent document of the Company.
Except for contracts entered into in the ordinary course of business and not required to be filed under Canadian securities laws, the only contracts which are regarded as material and which were entered into by the Company within the two years immediately preceding the date of this annual report, are:
●
On November 21, 2005, the Company entered into the Par agreement pursuant to which the Company granted Par an exclusive, royalty-free license to make and distribute in the United States all strengths of our generic versions of the branded product Focalin XR® for a period of 10 years from the date of commercial launch (which was November 19, 2013). Under the Par agreement, we filed the Company ANDA with the FDA for approval to market generic Focalin XR® capsules in various strengths in the U.S., and are the owner of that Company ANDA, as approved in part by the FDA. We retain the right to make and distribute all strengths of the generic product outside of the U.S. Calendar quarterly profit-sharing payments for its U.S. sales under the Company ANDA are payable by Par to us as calculated pursuant to the Par agreement. Within the purview of the Par agreement, Par also applied for and owns the Par ANDA pertaining to all marketed strengths of generic Focalin XR®, and is now approved by the FDA, to market generic Focalin XR® capsules in all marketed strengths in the U.S. As with the Company ANDA, calendar quarterly profit-sharing payments are payable by Par to us for its U.S. sales of generic Focalin XR® under the Par ANDA as calculated pursuant to the Par agreement. The Company is responsible under the Par agreement for the development of the product and most related costs which, with the applications to and recent approvals by the FDA, the Company now considers to be completed.
●
In October 2016, the Company entered into the Mallinckrodt agreement, granting Mallinckrodt an exclusive license to market, sell and distribute in the U.S. the following extended release drug product candidates (the “licensed products”) for which the Company has ANDAs filed with the FDA:
●
Quetiapine fumarate extended-release tablets (generic Seroquel XR®)–Approved by FDA and launched.
●
Desvenlafaxine extended-release tablets (generic Pristiq®) – ANDA Under FDA Review
●
Lamotrigine extended-release tablets (generic Lamictal® XR™) – ANDA Under FDA Review
Under the terms of this 10-year agreement, the Company received a non-refundable upfront payment of $3 million in October 2016. In addition, the Mallinckrodt agreement also provides for a long-term profit sharing arrangement with respect to these licensed products (which includes up to $11 million in cost recovery payments to the Company). The Company has agreed to manufacture and supply the licensed products exclusively for Mallinckrodt on a cost plus basis, and Mallinckrodt has agreed that the Company will be its sole supplier of the licensed products marketed in the U.S. The Mallinckrodt agreement contains customary terms and conditions for an agreement of this kind, and is subject to early termination in the event we do not obtain FDA approvals of the Mallinckrodt licensed products by specified dates, or pursuant to any one of several termination rights of each party.
●
The acknowledgement and agreement of the Company dated October 22, 2009 to be bound by the performance based stock option agreement dated September 10, 2004 pursuant to which Drs. Isa and Amina Odidi are entitled to purchase up to 2,763,940 of the Company’s shares upon payment of $3.62 per share, subject to satisfaction of the performance vesting conditions being the acceptance by the FDA of the filing of an application for approval of a drug product or the approval of such an application.
●
The amended and restated promissory note dated October 22, 2009 for up to C$2,300,000 issued by IPC Corp to Isa Odidi and Amina Odidi for advances that may be made by them from time to time to the Company. As at November 30, 2015 and November 30, 2014, no amount was outstanding. No at-the-market offering proceeds were used in payment of the promissory note.
●
The Debenture dated January 10, 2013 for $1.5 million issued by the Company to Isa Odidi and Amina Odidi for the loan of $1.5 million made by them to the Company. The Debenture was originally due to mature on January 1, 2015, but effective October 1, 2014, the maturity date was extended to July 1, 2015; effective June 29, 2015, the maturity date was extended to January 1, 2016; and effective as of December 8, 2015, the maturity date was further extended to July 1, 2016; and effective May 26, 2016, the maturity date of the Debenture was extended to December 1, 2016. Effective December 1, 2016, the maturity date for the Debenture was extended to April 1, 2017 and a principal repayment of $150,000 was made at the time of the extension. After giving effect to such partial repayment, the Debenture is convertible at any time into 450,000 common shares at a conversion price of $3.00 per common share at the option of the holder. The maturity date of the Debenture has been further extended to October 1, 2018. The Company currently expects to repay the current net amount of $1,350,000 on or about October 1, 2018, if the Company then has cash available.
●
Pursuant to the Dawson James Underwriting Agreement, in June 2016, we completed an underwritten public offering of 3,229,814 units of common shares and warrants, at a price of $1.61 per unit. The warrants are currently exercisable, have a term of five years and an exercise price of $1.93 per common share. We issued at the initial closing of the offering an aggregate of 3,229,814 common shares and warrants to purchase an additional 1,614,907 common shares. The underwriter also purchased at such closing additional warrants to acquire 242,236 common shares pursuant to the over-allotment option exercised in part by the underwriter. We subsequently sold an aggregate of 459,456 additional common shares at the public offering price of $1.61 per share in connection with subsequent partial exercises of the underwriter’s over-allotment option. The closings of these partial exercises brought the total net proceeds from the offering to approximately $5.1 million, after deducting the underwriter’s discount and offering expenses.
●
Pursuant to the Wainwright Agreement, in October 2017, we completed a registered direct offering consisting of 3,636,364 common shares at a price of $1.10 per share for gross proceeds of approximately $4 million. We also issued to the investors warrants to purchase an aggregate of 1,818,182 common shares at an exercise price of $1.25 per share. The warrants are exercisable six months following the October 13, 2017 closing date and will expire 30 months after the date they become exercisable. The common shares (but not the warrants or the common shares underlying the warrants) were offered by us through a prospectus supplement pursuant to our shelf registration statement on Form F-3 as previously filed and declared effective by the SEC and the base prospectus contained therein (Registration Statement No. 333-218297). The warrants described above were offered in a private placement under Section 4(a)(2) of the U.S. Securities Act, and Regulation D promulgated thereunder and, along with the common shares underlying the warrants, have not been registered under the U.S. Securities Act, or applicable state securities laws. The Company also issued to the placement agents 181,818 warrants to purchase a share of common stock at an exercise price of $1.375 per share. The total net proceeds from the offering were $3.5 million, after deducting offering expenses.
D.Exchange Controls
Canada has no system of currency exchange controls. There are no governmental laws, decrees or regulations in Canada that restrict the export or import of capital, including but not limited to, foreign exchange controls, or that affect the remittance of dividends, interest or other payments to non-resident holders of the Company’s securities.
United States Taxation
Certain Material United States Federal Income Tax Considerations
The following discussion is a general summary of certain material United States federal income tax considerations applicable to a U.S. holder arising from and relating to the consequences of the ownership and disposition of our common shares and warrants that are generally applicable to a United States person that holds our common shares as capital assets (a “U.S. Holder”) within the meaning of Section 1221 of the Code. This discussion does not address holders of other securities. This discussion assumes that we are not a “controlled foreign corporation” for U.S. federal income tax purposes. The following discussion does not purport to be a complete analysis of all of the potential United States federal income tax considerations that may be relevant to particular holders of our common shares or warrants in light of their particular circumstances nor does it deal with persons that are subject to special tax rules, such as brokers, dealers in securities or currencies, financial institutions, insurance companies, tax-exempt organizations, persons liable for alternative minimum tax, U.S. expatriates, partnerships or other pass-through entities, U.S. Holders who own (directly, indirectly or by attribution) ten percent or more of the total combined voting power of all classes of stock entitled to vote, persons holding our common shares as part of a straddle, hedge or conversion transaction or as part of a synthetic security or other integrated transaction, traders in securities that elect to use a mark-to-market method of accounting for their securities holdings, holders whose “functional currency” is not the United States dollar, and holders who are not U.S. Holders. In addition, the discussion below does not address the tax consequences of the law of any state, locality or foreign jurisdiction or United States federal tax consequences (e.g., estate or gift tax) other than those pertaining to the income tax. There can be no assurance that the United States Internal Revenue Service (the “IRS”) will take a similar view as to any of the tax consequences described in this summary.
The following is based on currently existing provisions of the Code, existing and proposed Treasury regulations under the Code and current administrative rulings and court decisions. Everything listed in the previous sentence may change, possibly on a retroactive basis, and any change could affect the continuing validity of this discussion. We cannot predict whether, when, or to what extent U.S. federal tax laws will be changed, or regulations, interpretations, or rulings will be issued or revoked, nor is the long-term impact of the significant changes made to the Code in 2017 known at this time.
Each U.S. Holder and each holder of common shares that is not a U.S. Holder should consult its tax adviser regarding the United States federal income tax consequences of holding our common shares applicable to such holder in light of its particular situation, as well as any tax consequences that may arise under the laws of any other relevant foreign, state, local, or other taxing jurisdiction.
As used in this section, the term “United States person” means a beneficial owner of our common shares that is:
(i)
a citizen or an individual resident of the United States;
(ii)
a corporation (or an entity taxable as a corporation for United States federal income tax purposes) created or organized in or under the laws of the United States or any political subdivision of the United States;
(iii)
an estate the income of which is subject to United States federal income taxation regardless of its source; or
(iv)
a trust which (A) is subject to the supervision of a court within the United States and the control of a United States person as described in Section 7701(a)(30) of the Code; or (B) is subject to a valid election under applicable Treasury Regulations to be treated as a United States person.
If a partnership (including for this purpose any entity treated as a partnership for U.S. federal income tax purposes) holds our common shares, the United States federal income tax treatment of a partner generally will depend on the status of the partner and the activities of the partnership. A United States person that is a partner of the partnership holding our common shares should consult its own tax adviser.
Passive Foreign Investment Company Considerations
Special, generally unfavorable, U.S. federal income tax rules apply to a U.S. Holder’s ownership and disposition of the stock or warrants of a passive foreign investment company (“PFIC”). As discussed below, however, a U.S. Holder of our common shares (but not our warrants) may be able to mitigate these consequences by making a timely and effective election to treat the Company as a qualified electing fund (a “QEF Election”) or by making a timely and effective mark-to-market election with respect to its common shares.
For U.S. federal income tax purposes, a foreign corporation is classified as a PFIC for each taxable year in which, applying the relevant look-through rules, either:
●
at least 75% of its gross income for the taxable year consists of specified types of “passive” income (referred to as the “income test”); or
●
at least 50% of the average value of its assets during the taxable year is attributable to certain types of assets that produce passive income or are held for the production of passive income (referred to as the “asset test”).
For purposes of the income and asset tests, if a foreign corporation owns directly or indirectly at least 25% (by value) of the stock of another corporation, that foreign corporation will be treated as if it held its proportionate share of the assets of the other corporation and received its proportionate share of the income of that other corporation. Also, for purposes of the income and asset tests, passive income does not include any income that is an interest, dividend, rent or royalty payment if it is received or accrued from a related person to the extent that amount is properly allocable to the active income of the related person. Under applicable attribution rules, if the Company is a PFIC, U.S. Holders of common shares will be treated as holding stock of the Company’s subsidiaries that are PFICs in certain circumstances. In these circumstances, certain dispositions of, and distributions on, stock of such subsidiaries may have consequences for U.S. Holders under the PFIC rules.
We believe that we were not a PFIC during our 2017 taxable year and are unlikely to be a PFIC during our 2018 taxable year. Because PFIC status is based on our income, assets and activities for the entire taxable year, and our market capitalization, it is not possible to determine whether we will be characterized as a PFIC for the 2018 taxable year until after the close of the taxable year. The tests for determining PFIC status are subject to a number of uncertainties. These tests are applied annually, and it is difficult to accurately predict future income, assets and activities relevant to this determination. In addition, because the market price of our common shares is likely to fluctuate, the market price may affect the determination of whether we will be considered a PFIC. There can be no assurance that we will not be considered a PFIC for any taxable year (including our 2018 taxable year). Absent one of the elections described below, if we are a PFIC for any taxable year during which a U.S. Holder holds our common shares, such U.S. Holder’s share of our income for such year will continue to be subject to the regime described below, regardless of whether we cease to meet the PFIC tests in one or more subsequent years. Accordingly, no assurance can be given that we will not constitute a PFIC in the current (or any future) tax year or that the IRS will not challenge any determination made by us concerning our PFIC status.
If we are a PFIC, the U.S. federal income tax consequences to a U.S. Holder of the ownership and disposition of our shares will depend on whether such U.S. Holder makes a QEF or mark-to-market election. Unless otherwise provided by the IRS, a U.S. Holder of our shares is generally required to file an informational return annually to report its ownership interest in the PFIC during any year in which we are a PFIC.
U.S. HOLDERS SHOULD CONSULT THEIR OWN TAX ADVISERS ABOUT THE PFIC RULES, THE POTENTIAL APPLICABILITY OF THESE RULES TO THE COMPANY CURRENTLY AND IN THE FUTURE, AND THEIR FILING OBLIGATIONS IF THE COMPANY IS A PFIC.
The “No Election” Alternative – Taxation of Excess Distributions
If we are classified as a PFIC for any year during which a U.S. Holder has held common shares or warrants and, in the case of our common shares, that U.S. Holder has not made a QEF Election or a mark-to-market election, special rules may subject that U.S. Holder to increased tax liability, including loss of favorable capital gains rates and the imposition of an interest charge upon the sale or other disposition of the common shares or warrants or upon the receipt of any excess distribution (as defined below). Under these rules:
●
the gain, if any, realized on such disposition will be allocated ratably over the U.S. Holder’s holding period;
●
the amount of gain allocated to the current taxable year and any year prior to the first year in which we are a PFIC will be taxed as ordinary income in the current year;
●
the amount of gain allocated to each of the taxable years other than the year in which the excess distribution occurs and pre-FIC years will be subject to tax at the highest ordinary income tax rate in effect for that year; and
●
an interest charge for the deemed deferral benefit will be imposed with respect to the resulting tax attributable to each of the other taxable years.
These rules will continue to apply to the U.S. Holder even after we cease to meet the definition of a PFIC, unless the U.S. Holder elects to be treated as having sold our common shares on the last day of the last taxable year in which we qualified as a PFIC.
An “excess distribution,” in general, is any distribution on common shares received in a taxable year by a U.S. Holder that is greater than 125% of the average annual distributions received by that U.S. Holder in the three preceding taxable years or, if shorter, during that U.S. Holder’s holding period for common shares.
Any portion of a distribution paid to a U.S. Holder that does not constitute an excess distribution will be treated as ordinary dividend income to the extent of our current and accumulated earnings and profits (as computed for U.S. federal income tax purposes). Such dividends generally will not qualify for the dividends-received deduction otherwise available to U.S. corporations. Any amounts treated as dividends paid by a PFIC generally will not constitute “qualified dividend income” within the meaning of Section 1(h)(11) of the Code and will, therefore, not be eligible for the preferential 20% rate for such income generally in effect for individuals under current law. Any such amounts in excess of our current and accumulated earnings and profits will be applied against the U.S. Holder’s tax basis in the common shares and, to the extent in excess of such tax basis, will be treated as gain from a sale or exchange of such shares. It is possible that any such gain may be treated as an excess distribution.
The QEF Election Alternative
A U.S. Holder of common shares (but not warrants) who elects (an “Electing U.S. Holder”) under Section 1295 of the Code, in a timely manner to treat us as a QEF would generally include in gross income (and be subject to current U.S. federal income tax on) its pro rata share of (a) the Company’s ordinary earnings, as ordinary income, and (b) our net capital gains, as long-term capital gain. An Electing U.S. Holder will generally be subject to U.S. federal income tax on such amounts for each taxable year in which we are classified as a PFIC, regardless of whether such amounts are actually distributed to the Electing U.S. Holder. An Electing U.S. Holder may further elect, in any given taxable year, to defer payment of U.S. federal income tax on such amounts to the extent they remain undistributed, subject to certain limitations. However, if payment of such tax is deferred, the taxes will be subject to an interest charge calculated from the due date of the tax return for the relevant year with respect to which the QEF election applies until the date the tax is paid.
A U.S. Holder may not make a QEF election with respect to its warrants to acquire our common shares. As a result, if a U.S. Holder sells or otherwise disposes of such warrants (other than upon exercise of such warrants), any gain recognized generally will be subject to the special tax and interest charge rules treating the gain as an excess distribution, as described above, if we were a PFIC at any time during the period the U.S. Holder held the warrants. If a U.S. Holder that exercises such warrants properly makes a QEF election with respect to the newly acquired common shares (or has previously made a QEF election with respect to our common shares), the QEF election will apply to the newly acquired
common shares, but the adverse tax consequences attributable to the period prior to exercise of the warrants, adjusted to take into account the current income inclusions resulting from the QEF election, will continue to apply with respect to such newly acquired common shares (which generally will be deemed to have a holding period for purposes of the PFIC rules that includes the period the U.S. Holder held the warrants), unless the U.S. Holder makes a purging election under the PFIC rules. The purging election creates a deemed sale of such common shares at their fair market value. The gain recognized by the purging election will be subject to the special tax and interest charge rules treating the gain as an excess distribution, as described above. As a result of the purging election, the U.S. Holder will have a new basis and holding period in the common shares acquired upon the exercise of the warrants for purposes of the PFIC rules.
A U.S. Holder may make a QEF Election only if the Company furnishes the U.S. Holder with certain tax information. If the Company should determine that it is a PFIC, it is anticipated that it will attempt to timely and accurately disclose such information to its U.S. Holders and provide U.S. Holders with information reasonably required to make such election.
A U.S. Holder that makes a QEF Election with respect to the Company generally (a) may receive a tax-free distribution from the Company to the extent that such distribution represents “earnings and profits” of the Company that were previously included in income by the U.S. Holder because of such QEF Election and (b) takes a tax basis in his, her or its common shares to reflect the amount included in income (resulting in an increase in basis) or allowed as a tax-free distribution (resulting in a decrease in basis) as a result of the QEF Election.
Similarly, if any of our non-U.S. subsidiaries were classified as PFICs, a U.S. Holder that makes a timely QEF Election with respect to any of our subsidiaries would be subject to the QEF rules as described above with respect to the Holder’s pro rata share of the ordinary earnings and net capital gains of any of our subsidiaries. Our earnings (or earnings of any of our subsidiaries) attributable to distributions from any of our subsidiaries that had previously been included in the income of an Electing U.S. Holder under the QEF rules would generally not be taxed to the Electing U.S. Holder again.
Upon the sale or other disposition of common shares, an Electing U.S. Holder who makes a QEF Election for the first taxable year in which it owns common shares (which election remains in effect throughout such U.S. Holder’s ownership of common shares) will recognize capital gain or loss for U.S. federal income tax purposes in an amount equal to the difference between the net amount realized on the disposition and the U.S. Holder’s adjusted tax basis in the common shares. Such gain or loss will be long-term capital gain or loss if the U.S. Holder’s holding period in the common shares is more than one year, otherwise it will be short-term capital gain or loss. The deductibility of capital losses is subject to certain limitations. A U.S. Holder’s gain realized upon the disposition of shares generally will be treated as U.S. source income, and losses from the disposition generally will be allocated to reduce U.S. source income.
A QEF Election must be made in a timely manner as specified in applicable Treasury Regulations. Generally, the QEF Election must be made by filing the appropriate QEF election documents at the time such U.S. Holder timely files its U.S. federal income tax return for the first taxable year of the Company during which it was a PFIC.
Each U.S. Holder should consult its own tax advisor regarding the availability of, procedure for making, and consequences of a QEF Election with respect to the Company.
Mark-to-Market Election Alternative
Assuming that our common shares are treated as marketable stock (as defined for these purposes), a U.S. Holder that does not make a QEF Election may avoid the application of the excess distribution rules, at least in part, by electing, under Section 1296 of the Code, to mark the common shares to market annually. Consequently, the U.S. Holder will generally recognize as ordinary income or loss each year an amount equal to the difference as of the close of the taxable year between the fair market value of its common shares and the U.S. Holder’s adjusted tax basis in the common shares. Any mark-to-market loss is treated as an ordinary deduction, but only to the extent of the net mark-to-market gain that the Holder has included pursuant to the election in prior tax years. Any gain on a disposition of our common shares by a U.S. Holder that has made such a mark-to-market election would be treated as ordinary income. Such U.S. Holder’s basis in its common shares would be adjusted to reflect any of these income or loss amounts. Currently, a mark-to-market election may not be made with respect to warrants. We do not anticipate that the preference shares will be treated as marketable stock for these purposes.
For purposes of making this election, stock of a foreign corporation is “marketable” if it is “regularly traded” on certain “qualified exchanges”. Under applicable Treasury Regulations, a “qualified exchange” includes a national securities exchange that is registered with the SEC or the national market system established pursuant to Section 11A of the U.S. Exchange Act, and certain foreign securities exchanges. Currently, our common shares are traded on a “qualified exchange.” Under applicable Treasury Regulations, PFIC stock traded on a qualified exchange is “regularly traded” on such exchange for any calendar year during which such stock is traded, other than in de minimis quantities, on at least 15 days during each calendar quarter. Special rules apply if an election is made after the beginning of the taxpayer’s holding period in PFIC stock.
To the extent available, a mark-to-market election applies to the taxable year in which such mark-to-market election is made and to each subsequent taxable year, unless the Company’s common shares cease to be “marketable stock” or the IRS consents to revocation of such election. In addition, a U.S. Holder that has made a mark-to-market election does not include mark-to-market gains, or deduct mark-to-market losses, for years when the Company ceases to be treated as a PFIC.
The mark-to-market rules generally do not appear to prevent the application of the excess distribution rules in respect of stock of any of our subsidiaries in the event that any of our subsidiaries were considered PFICs. Accordingly, if Intellipharmaceutics and any of our subsidiaries were both considered PFICs and a U.S. Holder made a mark-to-market election with respect to its common shares, the U.S. Holder may remain subject to the excess distribution rules described above with respect to its indirectly owned shares of subsidiary stock.
U.S. HOLDERS ARE URGED TO CONSULT THEIR TAX ADVISORS REGARDING THE POSSIBLE APPLICABILITY OF THE PFIC RULES AND THE AVAILABILITY OF, PROCEDURES FOR MAKING, AND CONSEQUENCES OF A QEF ELECTION OR MARK-TO-MARKET ELECTION WITH RESPECT TO THE COMPANY’S COMMON SHARES.
Ownership and Disposition of Common Shares and Warrants to the Extent that the PFIC Rules do not Apply
Distributions on Common Shares
A U.S. Holder that receives a distribution, including a constructive distribution, with respect to a Share will be required to include the amount of such distribution in gross income as a dividend (without reduction for any Canadian income tax withheld from such distribution) to the extent of the current or accumulated “earnings and profits” of the Company, as computed for U.S. federal income tax purposes. Any amount considered to be a dividend received by a U.S. Holder who is an individual should be eligible for the 20% maximum rate of U.S. federal income tax under Section 1(h)(11) of the Code. To the extent that a distribution exceeds the current and accumulated “earnings and profits” of the Company, such distribution will be treated first as a tax-free return of capital to the extent of a U.S. Holder’s tax basis in the common shares and thereafter as gain from the sale or exchange of such common shares. (See “Sale or Other Taxable Disposition of Common Shares” below). However, the Company may not maintain the calculations of earnings and profits in accordance with U.S. federal income tax principles, and each U.S. Holder should (unless advised to the contrary) therefore assume that any distribution by the Company with respect to the common shares will constitute ordinary dividend income. Dividends received on common shares generally will not be eligible for the “dividends received deduction”. The dividend rules are complex, and each U.S. Holder should consult its own tax advisor regarding the application of such rules.
The terms of a warrant may provide for an adjustment to the number of common shares for which the warrant may be exercised or to the exercise price of the warrant in certain events. An adjustment which has the effect of preventing dilution generally is not taxable. However, the U.S. Holders of the warrants would be treated as receiving a constructive distribution from us if, for example, the adjustment increases the warrant holders’ proportionate interest in our assets or earnings and profits (e.g., through an increase in the number of common shares that would be obtained upon exercise) as a result of a distribution of cash to the holders of our common shares which is taxable to the U.S. Holders of such common shares as described under “Distributions on Common Shares” above. Such constructive distribution would be subject to tax as described under that section in the same manner as if the U.S. Holders of the warrants received a cash distribution from us equal to the fair market value of such increased interest.
Sale or Other Taxable Disposition of Common Shares
Upon the sale or other taxable disposition of common shares, a U.S. Holder generally will recognize capital gain or loss in an amount equal to the difference between the U.S. dollar value of cash received plus the fair market value of any property received and such U.S. Holder’s tax basis in such common shares sold or otherwise disposed of. A U.S. Holder’s tax basis in common shares generally will be such Holder’s U.S. dollar cost for such common shares.
Gain or loss recognized on such sale or other disposition generally will be long-term capital gain or loss if, at the time of the sale or other disposition, the common shares have been held for more than one year. The long-term capital gains realized by non-corporate U.S. Holders are generally subject to a lower marginal U.S. federal income tax rate than ordinary income other than qualified dividend income, as defined above. Currently, the maximum rate on long-term capital gains is 20%, although the actual rates may be higher due to the phase out of certain tax deductions, exemptions and credits. However, given the uncertain economic conditions in the United States and the size of the federal deficit, tax rates are subject to change and prospective U.S. Holders should consult their tax advisors. The deductibility of losses may be subject to limitations.
Warrants
Generally, no U.S. federal income tax will be imposed upon the U.S. Holder of a warrant upon exercise of such warrant to acquire our common shares. A U.S. Holder’s tax basis in a warrant will generally be the amount of the purchase price that is allocated to the warrant. Upon exercise of a warrant, the tax basis of the new common shares would be equal to the sum of the tax basis of the warrants in the hands of the U.S. Holder plus the exercise price paid, and the holding period of the new common shares would begin on the date that the warrants are exercised. If a warrant lapses without exercise, the U.S. Holder will generally realize a capital loss equal to its tax basis in the warrant. Prospective U.S. Holders should consult their tax advisors regarding the tax consequences of acquiring, holding and disposing of warrants.
The tax consequences of a cashless exercise of a warrant are not clear under current tax law. A cashless exercise may be tax-free, either because the exercise is not a gain realization event or because the exercise is treated as a recapitalization for U.S. federal income tax purposes. In either tax-free situation, a U.S. Holder’s basis in the common shares received upon exercise would equal the U.S. holder’s basis in the warrant. If the cashless exercise were treated as not being a gain realization event, a U.S. Holder’s holding period in the common shares would be treated as commencing on the date following the date of exercise of the warrant. If the cashless exercise were treated as a recapitalization, the holding period of the common shares would include the holding period of the warrant. It is also possible that a cashless exercise could be treated as a taxable exchange in which gain or loss would be recognized. In such event, a U.S. Holder could be deemed to have surrendered warrants equal to the number of common shares having a value equal to the exercise price for the total number of warrants to be exercised. The U.S. Holder would recognize capital gain or loss in an amount equal to the difference between the fair market value of the common shares represented by the warrants deemed surrendered and the U.S. Holder’s tax basis in the warrants deemed surrendered. If taxable exchange treatment applied, a U.S. Holder’s tax basis in the common shares received would equal the sum of the fair market value of the common shares represented by the warrants deemed surrendered and the U.S. Holder’s tax basis in the warrants exercised. A U.S. Holder’s holding period for the common shares would commence on the date following the date of exercise of the warrant. Due to the absence of authority on the U.S. federal income tax treatment of a cashless exercise, there can be no assurance which, if any, of the alternative tax consequences and holding periods described above would be adopted by the IRS or a court of law. Accordingly, U.S. Holders should consult their tax advisors regarding the tax consequences of a cashless exercise.
Additional Considerations
Tax-Exempt Investors
Special considerations apply to U.S. persons that are pension plans and other investors that are subject to tax only on their unrelated business taxable income. Such a tax-exempt investor’s income from an investment in our common shares or warrants generally will not be treated as resulting in unrelated business taxable income under current law, so long as such investor’s acquisition of common shares or warrants is not debt-financed. Tax-exempt investors should consult their own tax advisors regarding an investment in our common shares or warrants.
Additional Tax on Passive Income
Certain individuals, estates and trusts whose income exceeds certain thresholds will generally be required to pay a 3.8% Medicare surtax on the lesser of (1) the U.S. Holder’s “net investment income” for the relevant taxable year and (2) the excess of the U.S. Holder’s modified gross income for the taxable year over a certain threshold (which, in the case of individuals, will generally be between U.S.$125,000 and U.S.$250,000 depending on the individual’s circumstances). A U.S. Holder’s “net investment income” may generally include, among other items, certain interest, dividends, gain, and other types of income from investments, minus the allowable deductions that are properly allocable to that gross income or net gain. U.S. Holders are urged to consult with their own tax advisors regarding the effect, if any, of this tax on their ownership and disposition of common shares or warrants.
Receipt of Foreign Currency
The amount of any distribution paid to a U.S. Holder in foreign currency, or on the sale, exchange or other taxable disposition of common shares or warrants, generally will be equal to the U.S. dollar value of such foreign currency based on the exchange rate applicable on the date of receipt (regardless of whether such foreign currency is converted into U.S. dollars at that time). A U.S. Holder will have a basis in the foreign currency equal to its U.S. dollar value on the date of receipt. Any U.S. Holder who converts or otherwise disposes of the foreign currency after the date of receipt may have a foreign currency exchange gain or loss that would be treated as ordinary income or loss, and generally will be U.S. source income or loss for foreign tax credit purposes. Each U.S. Holder should consult its own U.S. tax advisor regarding the U.S. federal income tax consequences of receiving, owning, and disposing of foreign currency.
Foreign Tax Credit
Subject to the PFIC rules discussed above, a U.S. Holder that pays (whether directly or through withholding) Canadian income tax with respect to dividends paid on the common shares generally will be entitled, at the election of such U.S. Holder, to receive either a deduction or a credit for such Canadian income tax paid. Generally, subject to the limitations described in the next paragraph, a credit will reduce a U.S. Holder’s U.S. federal income tax liability on a dollar-for-dollar basis, whereas a deduction will reduce a U.S. Holder’s income subject to U.S. federal income tax. This election is made on a year-by-year basis and generally applies to all foreign taxes paid (whether directly or through withholding) or accrued by a U.S. Holder during a year.
Complex limitations apply to the foreign tax credit, including the general limitation that the credit cannot exceed the proportionate share of a U.S. Holder’s U.S. federal income tax liability (determined before application of the foreign tax credit) that such U.S. Holder’s “foreign source” taxable income bears to such U.S. Holder’s worldwide taxable income. In applying this limitation, a U.S. Holder’s various items of income and deduction must be classified, under complex rules, as either “foreign source” or “U.S. source.” Generally, dividends paid by a foreign corporation should be treated as foreign source for this purpose, and gains recognized on the sale of stock of a foreign corporation by a U.S. Holder should generally be treated as U.S. source for this purpose, except as otherwise provided in an applicable income tax treaty or if an election is properly made under the Code. However, the amount of a distribution with respect to the common shares that is treated as a “dividend” may be lower for U.S. federal income tax purposes than it is for Canadian federal income tax purposes, resulting in a reduced foreign tax credit allowance to a U.S. Holder. In addition, this limitation is calculated separately with respect to specific categories of income. The foreign tax credit rules are complex, and each U.S. Holder should consult its own U.S. tax advisor regarding the foreign tax credit rules.
State and Local Tax
In addition to the U.S. federal income tax discussed above, U.S. Holders may also be subject to state and local income taxation for amounts received on the disposition of common shares and on dividends received. Amounts paid to U.S. Holders will not have state and local tax amounts withheld from payments and U.S. Holders should consult with a tax advisor regarding the state and local taxation implications of such amounts received.
Information Reporting
In general, U.S. Holders of common shares are subject to certain information reporting under the Code relating to their purchase and/or ownership of stock of a foreign corporation such as the Company. Failure to comply with these information reporting requirements may result in substantial penalties.
For example, U.S. federal income tax information reporting rules generally require certain individuals who are U.S. Holders to file Form 8938 to report the ownership of specified foreign financial assets if the total value of those assets exceeds an applicable threshold amount (subject to certain exceptions). For these purposes, a specified foreign financial asset includes not only a financial account (as defined for these purposes) maintained by a foreign financial institution, but also any stock or security issued by a non-U.S. person, any financial instrument or contract held for investment that has an issuer or counterparty other than a U.S. person and any interest in a foreign entity, provided that the asset is not held in an account maintained by a financial institution. The minimum applicable threshold amount is generally U.S.$50,000 in the aggregate, but this threshold amount varies depending on whether the individual lives in the U.S., is married, files a joint income tax return with his or her spouse, etc. Certain domestic entities that are U.S. Holders may also be required to file Form 8938 if both (i) such entities are owned at least 80% by an individual who is a U.S. citizen or U.S. tax resident (or, in some cases, by a nonresident alien who meets certain criteria) or are trusts with beneficiaries that are such individuals and (ii) more than 50% of their income consists of certain passive income or more than 50% of their assets is held for the production of such income. U.S. Holders are urged to consult with their tax advisors regarding their reporting obligations, including the requirement to file IRS Form 8938.
In addition, in certain circumstances, a U.S. Holder of common shares who disposes of such common shares in a transaction resulting in the recognition by such Holder of losses in excess of certain significant threshold amounts may be obligated to disclose its participation in such transaction in accordance with the Treasury Regulations governing tax shelters and other potentially tax-motivated transactions or tax shelter regulations. Potential purchasers of common shares should consult their tax advisors concerning any possible disclosure obligation under the tax shelter rules with respect to the disposition of their common shares.
Backup Withholding
Generally, information reporting requirements will apply to distributions on our common shares or proceeds on the disposition of our common shares or warrants paid within the U.S. (and, in certain cases, outside the U.S.) to U.S. Holders. Such payments will generally be subject to backup withholding tax at the rate of 28% if: (a) a U.S. Holder fails to furnish such U.S. Holder’s correct U.S. taxpayer identification number to the payor (generally on Form W-9), as required by the Code and Treasury Regulations, (b) the IRS notifies the payor that the U.S. Holder’s taxpayer identification number is incorrect, (c) a U.S. Holder is notified by the IRS that it has previously failed to properly report interest and dividend income, or (d) a U.S. Holder fails to certify, under penalty of perjury, that such U.S. Holder has furnished its correct U.S. taxpayer identification number. However, certain exempt persons generally are excluded from these information reporting and backup withholding rules.
Backup withholding is not an additional tax. Any amounts withheld under the U.S. backup withholding tax rules will be allowed as a credit against a U.S. Holder’s U.S. federal income tax liability, if any, or will be refunded, if such U.S. Holder furnishes required information to the IRS in a timely manner. Each U.S. Holder should consult its own tax advisor regarding the backup withholding rules.
Canadian Federal Income Tax Considerations
Taxation
The following summary describes the principal Canadian federal income tax considerations generally applicable to a holder of the Company’s common shares who, for purposes of the Income Tax Act (Canada) (the “Canadian Tax Act”) and the Canada – United States Tax Convention (the “Treaty”) and at all relevant times, is resident in the United States and was not and is not resident in Canada nor deemed to be resident in Canada, deals at arm’s length and is not affiliated with the Company, holds the Company’s common shares as capital property, does not use or hold and is not deemed to use or hold the Company’s common shares in or in the course of carrying on business in Canada and who otherwise qualifies for the full benefit of the Treaty (a “United States Holder”). Special rules which are not discussed in this summary may apply to a United States Holder that is a financial institution, as defined in the Canadian Tax Act, or an insurer carrying on business in Canada and elsewhere.
This following summary is based on the current provisions of the Treaty, the Canadian Tax Act and the regulations thereunder, all specific proposals to amend the Canadian Tax Act and the regulations announced by the Minister of Finance (Canada) prior to the date hereof and the Company’s understanding of the administrative practices published in writing by the Canada Revenue Agency prior to the date hereof. This summary does not take into account or anticipate any other changes in the governing law, whether by judicial, governmental or legislative decision or action, nor does it take into account the tax legislation or considerations of any province, territory or non-Canadian (including U.S.) jurisdiction, which legislation or considerations may differ significantly from those described herein.
All amounts relevant in computing a United States Holder’s liability under the Canadian Tax Act are to be computed in Canadian currency based on the relevant exchange rate applicable thereto.
This summary is of a general nature only and is not intended to be, and should not be interpreted as legal or tax advice to any prospective purchaser or holder of the Company’s common shares and no representation with respect to the Canadian federal income tax consequences to any such prospective purchaser is made. Accordingly, prospective purchasers and holders of the Company’s common shares should consult their own tax advisors with respect to their particular circumstances.
Dividends on the Company’s Common Shares
Generally, dividends paid or credited by Canadian corporations to non-resident shareholders are subject to a withholding tax of 25% of the gross amount of such dividends. Pursuant to the Treaty, the withholding tax rate on the gross amount of dividends paid or credited to United States Holders is reduced to 15% or, in the case of a United States Holder that is a U.S. corporation that beneficially owns at least 10% of the voting stock of the Canadian corporation paying the dividends, to 5% of the gross amount of such dividends.
Pursuant to the Treaty, certain tax-exempt entities that are United States Holders may be exempt from Canadian withholding taxes, including any withholding tax levied in respect of dividends received on the Company’s common shares.
Disposition of the Company’s Common Shares
In general, a United States Holder will not be subject to Canadian income tax on capital gains arising on the disposition or deemed disposition of the Company’s common shares, unless such shares are “taxable Canadian property” within the meaning of the Canadian Tax Act. Generally, a share listed on a designated stock exchange for purposes of the Canadian Tax Act (which includes the TSX and NASDAQ) will not be “taxable Canadian property” to a United States Holder unless, at any particular time during the 60 month period immediately preceding the disposition (i) 25% or more of the issued shares of any class or series of the particular corporation were owned by: (a) such United States Holder, (b) by persons with whom the United States Holder did not deal at arm’s length, (c) a partnership in which the United States Holder, or persons with whom the United States Holder did not deal at arm’s length, holds a membership interest directly or indirectly through one or more partnerships, or (d) any combination thereof, and (ii) the shares derived more than 50% of their fair market value directly or indirectly from one or any combination of real property situated in Canada, “timber resource property”, “Canadian resource property” (each as defined under the Canadian Tax Act), or options in respect of, or interests or rights in any of the foregoing.
F.Dividends and Paying Agents.
The value of the Company’s common shares is not now, and is not expected to be in the future, derived more than 50% from any of these properties. Consequently, any gain realized by a United States Holder upon the disposition of the Company’s common shares should be exempt from tax under the Canadian Tax Act.
Not Applicable
G.Statement by Experts
Not Applicable
Copies of the documents referred to in this annual report may be inspected, during normal business hours, at the Company’s headquarters located at 30 Worcester Road, Toronto, Ontario, M9W 5X2, Canada.
We are required to file reports and other information with the SEC under the U.S. Exchange Act. Reports and other information filed by us with the SEC may be inspected and copied at the SEC’s public reference facilities located at 100 F Street, N.E. in Washington D.C. The SEC also maintains a website at http://www.sec.gov that contains certain reports and other information that we file electronically with the SEC. As a foreign private issuer, we are exempt from the rules under the U.S. Exchange Act prescribing the furnishing and content of proxy statements and our officers, directors and principal shareholders are exempt from the reporting and short-swing profit recovery provisions contained in Section 16 of the U.S. Exchange Act. Under the U.S. Exchange Act, as a foreign private issuer, we are not required to publish financial statements as frequently or as promptly as United States companies.
See Item 4.C of this annual report.
We are exposed to interest rate risk, which is affected by changes in the general level of interest rates. Due to the fact that the Company’s cash is deposited with major financial institutions in an interest savings account, we do not believe that the results of operations or cash flows would be affected to any significant degree by a sudden change in market interest rates given their relative short-term nature.
Trade accounts receivable potentially subjects the Company to credit risk. The Company provides an allowance for doubtful accounts equal to the estimated losses expected to be incurred in the collection of accounts receivable.
The following table sets forth details of the aged accounts receivable that are not overdue as well as an analysis of overdue amounts and the related allowance for doubtful accounts:
November 30, | November 30, | |
2017 | 2016 | |
$ | $ | |
| Total accounts receivable | 756,468 | 472,474 |
| Less allowance for doubtful accounts | (66,849) | - |
| Total accounts receivable, net | 689,619 | 472,474 |
| Not past due | 689,619 | 427,519 |
| Past due for more than 31 days | ||
| but no more than 60 days | 5,176 | 3,319 |
| Past due for more than 91 days | ||
| but no more than 120 days | 61,673 | 41,636 |
| Total accounts receivable, gross | 756,468 | 472,474 |
Financial instruments that potentially subject the Company to concentration of credit risk consist principally of uncollateralized accounts receivable. The Company’s maximum exposure to credit risk is equal to the potential amount of financial assets. For the year ended November 30, 2017, two customers accounted for substantially all the revenue and all the accounts receivable of the Company. For the year ended November 30, 2016, Par accounted for substantially all the revenue and all the accounts receivable of the Company.
The Company is also exposed to credit risk at period end from the carrying value of its cash. The Company manages this risk by maintaining bank accounts with a Canadian Chartered Bank. The Company’s cash is not subject to any external restrictions.
Foreign exchange risk
We are exposed to changes in foreign exchange rates between the Canadian and U.S. dollar which could affect the value of our cash. The Company had no foreign currency hedges or other derivative financial instruments as of November 30, 2017. The Company did not enter into financial instruments for trading or speculative purposes and does not currently utilize derivative financial instruments.
The Company has balances in Canadian dollars that give rise to exposure to foreign exchange (“FX”) risk relating to the impact of translating certain non-U.S. dollar balance sheet accounts as these statements are presented in U.S. dollars. A strengthening U.S. dollar will lead to a FX loss while a weakening U.S. dollar will lead to a FX gain. For each Canadian dollar balance of $1.0 million, a +/- 10% movement in the Canadian currency held by the Company versus the U.S. dollar would affect the Company’s loss and other comprehensive loss by $0.1 million.
Balances denominated in foreign currencies that are considered financial instruments are as follows:
November 30, 2017 | November 30, 2016 | |||
Canadian | U.S. | Canadian | U.S. | |
| FX rates used to translate to U.S. | 1.2888 | 1.3429 | ||
$ | $ | $ | $ | |
| Assets | ||||
| Cash | 202,277 | 156,950 | 182,714 | 136,059 |
202,277 | 156,950 | 182,714 | 136,059 | |
| Liabilities | ||||
| Accounts payable and accrued liabilities | 1,704,086 | 1,322,227 | 949,911 | 707,358 |
| Employee cost payable | 277,080 | 214,980 | 1,402,108 | 1,044,151 |
| Capital lease | - | - | 19,912 | 14,828 |
1,981,166 | 1,537,207 | 2,371,933 | 1,766,338 | |
| Net exposure | (1,778,889) | (1,380,257) | (2,189,219) | (1,630,278) |
Liquidity risk
Liquidity risk is the risk that the Company will encounter difficulty raising liquid funds to meet commitments as they fall due. In meeting its liquidity requirements, the Company closely monitors its forecasted cash requirements with expected cash drawdown.
The following are the contractual maturities of the undiscounted cash flows of financial liabilities as at November 30, 2017:
November 30, 2017 | ||||||
Less than | 3 to 6 | 6 to 9 | 9 months | Greater than | ||
3 months | months | months | to 1 year | 1 year | Total | |
$ | $ | $ | $ | $ | $ | |
| Third parties | ||||||
| Accounts payable | 2,060,084 | - | - | - | - | 2,060,084 |
| Accrued liabilities | 782,369 | - | - | - | - | 782,369 |
| Related parties | ||||||
| Employee costs payable | 214,980 | - | - | - | - | 214,980 |
| Convertible debenture | 66,973 | 40,805 | 40,805 | 1,363,749 | - | 1,512,332 |
3,124,406 | 40,805 | 40,805 | 1,363,749 | - | 4,569,765 | |
Limitations:
The above discussion includes only those exposures that existed as of November 30, 2017, and, as a result, does not consider exposures or positions that could arise after that date. The Company’s ultimate realized gain or loss with respect to interest rate and exchange rate fluctuations would depend on the exposures that arise during the period and interest and foreign exchange rates.
Item 12.Description of Securities Other than Equity Securities.
Not applicable.
Not applicable.
Not applicable.
None.
PART II.
There have been no material defaults in the payment of any principal or interest owing. Neither the Company nor its subsidiaries has any preferred shares outstanding.
There has been no material modification of the instruments defining the rights of holders of any class of registered securities. There has been no withdrawal or substitution of assets securing any class of registered securities.
Item 15.Controls and Procedures
Internal Control over Financial Reporting
The management of our Company is responsible for establishing and maintaining adequate internal control over financial reporting for the Company. Internal control over financial reporting is a process designed to provide reasonable assurance regarding the reliability of financial reporting and the preparation of financial statements in accordance with generally accepted accounting principles and includes those policies and procedures that (1) pertain to the maintenance of records that, in reasonable detail, accurately and fairly reflect the transactions and dispositions of the Company’s assets, (2) provide reasonable assurance that transactions are recorded as necessary to permit preparation of financial statements in accordance with generally accepted accounting principles, and that the Company’s receipts and expenditures are being made only in accordance with authorizations of the Company’s management and directors, and (3) provide reasonable assurance regarding prevention or timely detection of unauthorized acquisition, use, or disposition of the Company’s assets that could have a material effect on the financial statements.
Management assessed the effectiveness of the Company’s internal control over financial reporting using the 1992 Internal Control-Integrated Framework developed by the Committee of Sponsoring Organizations of the Treadway Commission (“COSO”).
Based on this assessment, management concluded that the Company’s internal control over financial reporting was effective as of November 30, 2017.
In the second quarter of 2017, we initiated the transition from the COSO 1992 Internal Control - Integrated Framework to the COSO 2013 Internal Control - Integrated Framework. Progress thus far has centered on strengthening our risk assessment process as well as our information technology policies and related documentation. We expect this transition to continue for the remainder of fiscal 2018. Although we do not expect to experience significant changes in internal control over financial reporting as a result of our transition, we may identify significant deficiencies or material weaknesses and incur additional costs in the future as a result of our transition.
Disclosure Controls and Procedures
Under the supervision and with the participation of our management, including the Chief Executive Officer and the Chief Financial Officer, we have evaluated the effectiveness of our disclosure controls and procedures as of November 30, 2017. Disclosure controls and procedures are designed to ensure that the information required to be disclosed by the Company in the reports it files or submits under securities legislation is recorded, processed, summarized and reported on a timely basis and that such information is accumulated and communicated to management, including the Company’s Chief Executive Officer and Chief Financial Officer, as appropriate, to allow required disclosures to be made in a timely fashion. Based on that evaluation, management has concluded that these disclosure controls and procedures were effective as of November 30, 2017.
Changes in Internal Control over Financial Reporting
During the year ended November 30, 2017, there were no changes made to the Company’s internal control over financial reporting that have materially affected, or are reasonably likely to materially affect, the Company’s internal control over financial reporting, and specifically, there were no changes in accounting functions, board or related committees and charters, or auditors; no functions, controls or financial reporting processes of any constituent entities were adopted as the Company’s functions, controls and financial processes; and no other significant business processes were implemented.
Attestation of Internal Control over Financial Reporting
This annual report does not include an attestation report of our independent registered public accounting firm regarding internal control over financial reporting for the Company. As the Company is a non-accelerated filer, management’s report is not subject to attestation by our independent registered public accounting firm pursuant to Section 404(c) of the Sarbanes-Oxley Act of 2002.
Item 16.[Reserved]
Our Audit Committee is comprised of Kenneth Keirstead, Bahadur Madhani and Dr. Eldon Smith, each of whom is considered independent and financially literate (as such terms are defined under National Instrument 52-110 – Audit Committee). The members of the Audit Committee have selected a Chair from amongst themselves, being Mr. Madhani.
Under the SEC rules implementing the Sarbanes-Oxley Act of 2002, Canadian issuers filing reports in the United States must disclose whether their audit committees have at least one “audit committee financial expert”. Additionally, under Nasdaq Listing Rule 5605(c)(2)(A), Nasdaq requires that one member of the audit committee have “past employment experience in finance or accounting, requisite professional certification in accounting, or any other comparable experience or background which results in the individual’s financial sophistication, including being or having been a chief executive officer, chief financial officer, or other senior officer with financial oversight responsibilities.” The Board has determined that Mr. Madhani qualifies as an Audit Committee financial expert under the SEC rules and as financially sophisticated under the Nasdaq rules.
The Code of Business Conduct and Ethics (the “Code of Ethics”) has been implemented and it applies to all directors, officers, employees of the Company and its subsidiaries. It may be viewed on our website at www.intellipharmaceutics.com. During the year ended November 30, 2017, no waivers or requests for exemptions from the Code of Ethics were either requested or granted.
Our current auditor is MNP LLP (“MNP”), Independent Registered Public Accounting Firm, 111 Richmond Street West, Suite 300, Toronto, ON M5H 2G4. MNP is independent with respect to the Company within the meaning of the Rules of Professional Conduct of the Chartered Professional Accountants of Ontario, the rules and standards of the Public Company Accounting Oversight Board (United States) and the securities laws and regulations administered by the SEC.
The aggregate amounts billed by MNP to us for the years ended November 30, 2017 and 2016 for audit fees, audit-related fees, tax fees and all other fees are set forth below:
2017 | 2016 | |
| Audit Fees(1) | C$129,342 | - |
| Audit-Related Fees(2) | C$210,791 | C$75,664 |
| Tax Fees(3) | - | - |
| All Other Fees(4) | - | C$24,075 |
| Total Fees | C$340,133 | C$99,739 |
Notes:
(1)
Audit fees consist of fees related to the audit of the Company’s consolidated financial statements.
(2)
Audit-related fees consist of consultation on accounting and disclosure matters and review of quarterly interim financial statements, prospectus and base shelf activities and Form 20-F reviews.
(3)
Tax fees consist of fees for tax consultation, tax advice and tax compliance services for the Company and its subsidiaries.
(4)
All other fees related to internal control reviews.
The Company’s related party pre-approval policies and procedures are described in Item 6.C.
Under applicable Canadian securities regulations, the Company is required to disclose whether its Audit Committee has adopted specific policies and procedures for the engagement of non-audit services and to prepare a summary of these policies and procedures. The Audit Committee’s responsibility is to approve all audit engagement fees and terms as well as reviewing policies for the provision of non-audit services by the external auditors and, when required, the framework for pre-approval of such services. The Audit Committee delegates to its Chairman the pre-approval of such non-audit fees. For each of the years in the two-year period ended November 30, 20152017 and 2016, all of the non-audit services provided by the Company’s external auditor were auditedapproved by another firmthe Chairman of Chartered Professional Accountants who expressed an unmodified opinion in their report dated February 26, 2016.the Audit Committee.
Not applicable.
Neither the Company nor, to our knowledge, any affiliated purchaser has made any purchases of our registered shares during the last financial year.
The disclosure related to Item 16-F was previously reported, as that term is defined in Rule 12b-2 under the U.S. Exchange Act, in our Form 20-F filed on February 28, 2017.
The Company is the successor issuer to Vasogen Inc. for reporting purposes under the U.S. Exchange Act. Our common shares are currently listed on the TSX and quoted for trading on Nasdaq, in each case under the symbols “IPCI.” Our shares began trading on October 22, 2009, when the IPC Arrangement Agreement with Vasogen was completed.
Variations from Certain Nasdaq Rules
Nasdaq listing rules permit the Company to follow certain home country practices in lieu of compliance with certain Nasdaq corporate governance rules. Set forth below are the requirements of Nasdaqs Rule 5600 Series that the Company does not follow and the home country practices that it follows in lieu thereof and other differences from domestic U.S. companies that apply to us under Nasdaq’s corporate governance rules.
Shareholder Approval in Connection with Certain Transactions: Nasdaq’s Rule 5635 requires each issuer to obtain shareholder approval prior to certain dilutive events, including: (i) a transaction other than a public offering involving the sale under certain circumstances of 20% or more of the issuer’s common shares outstanding prior to the transaction at a price less than the greater of book value or market value, (ii) the acquisition of the stock or assets of another company; (iii) equity-based compensation of officers, directors, employees or consultants and (iv) a change of control. Under the exemption available to foreign private issuers under Nasdaq Rule 5615(a)(3), the Company does not follow Nasdaq Rule 5635. Instead, and in accordance with the Nasdaq exemption, the Company complies with applicable TSX rules and applicable Canadian corporate and securities regulatory requirements.
Independence of the Majority of the Board of Directors; Independent Director Oversight of Executive Compensation and Board Nominations: Nasdaq’s Rule 5605(b)(1) requires that the Board of Directors be comprised of a majority of independent directors, as defined in Rule 5605(a)(2). Nasdaq’s Rule 5605(b)(2) requires the independent members of the Board to regularly hold executive sessions where only those directors are present. Moreover, Nasdaq’s Rule 5605(d) requires independent director oversight of executive officer compensation arrangements by approval of such compensation by a majority of the independent directors or by a compensation committee comprised solely of independent directors, and Rule 5605(e) requires similar oversight with respect to the process of selecting nominees to the Board. Under the exemption available to foreign private issuers under Rule 5615(a)(3), the Company does not follow Nasdaq Rules 5605(b)(1), 5605(d) or 5605(e). Instead, and in accordance with the Nasdaq exemption, the Company complies with the applicable TSX rules and applicable Canadian corporate and securities regulatory requirements.
Disclosure of Waivers of Code of Business Conduct and Ethics: Domestic U.S. Nasdaq listed companies are required under Nasdaq Rule 5610 to disclose any waivers of their codes of conduct for directors or executive officers in a Form 8-K within four business days. As a foreign private issuer we are required to disclose any such waivers either in a Form 6-K or in the Company’s next Form 20-F or 40-F.
Item 16H. Mine Safety Disclosure.
Not applicable.
PART III.
See Item 18 below.
114
Consolidated financial statements of
Intellipharmaceutics
International Inc.
November 30, 2017, 2016 and 2015
 |  |
Intellipharmaceutics International Inc.
November 30, 2017, 2016 and 2015
Table of contents
| Reports of Independent Registered Public Accounting Firms | 1-2 |
| Consolidated balance sheets | 3 |
| Consolidated statements of operations and comprehensive loss | 4 |
| Consolidated statements of shareholders’ equity (deficiency) | 5 |
| Consolidated statements of cash flows | 6 |
| Notes to the consolidated financial statements | 7-31 |
REPORT OF INDEPENDENT REGISTERED PUBLIC ACCOUNTING FIRM
To the Board of Directors and Shareholders of
Intellipharmaceutics International Inc.
We have audited the accompanying consolidated balance sheetsheets of Intellipharmaceutics International Inc. and its subsidiaries (the “Company”) as of November 30, 2015,2017 and 2016, and the related consolidated statements of operations and comprehensive loss, shareholders’ equity (deficiency) and cash flows, and shareholders’ (deficiency) equity for each of the years in the two-year period ended November 30, 2015. These2017. The Company’s management is responsible for these consolidated financial statements are the responsibility of the Company’s management.statements. Our responsibility is to express an opinion on these consolidated financial statements based on our audits.
We conducted our audits in accordance with the standards of the Public Company Accounting Oversight Board (United States) and Canadian generally accepted auditing standards. Those standards require that we plan and perform the audit to obtain reasonable assurance about whether the financial statements are free of material misstatement. The Company is not required to have, nor were we engaged to perform, an audit of its internal control over financial reporting. Our audits included consideration of internal control over financial reporting as a basis for designing audit procedures that are appropriate in the circumstances, but not for the purpose of expressing an opinion on the effectiveness of the Company'sCompany’s internal control over financial reporting. Accordingly, we express no such opinion. An audit also includes examining, on a test basis, evidence supporting the amounts and disclosures in the financial statements. An audit also includesstatements, assessing the accounting principles used and significant estimates made by management, as well as evaluating the overall financial statement presentation. We believe that our audits provide a reasonable basis for our opinion.
In our opinion, suchthe consolidated financial statements referred to above present fairly, in all material respects, the financial position of the Company as of November 30, 2015,2017 and 2016, and the results of its operations and its cash flows for each of the years in the two-year period ended November 30, 2015,2017, in conformity with accounting principles generally accepted in the United States of America.
The accompanying consolidated financial statements have been prepared assuming that the Company will continue as a going concern. As discussed in Note 1 to the consolidated financial statements, the Company'sCompany’s recurring losses from operations and shareholders' deficiency raise substantial doubt about its ability to continue as a going concern. Management'sManagement’s plans concerning these matters are also discussed in Note 1 to the consolidated financial statements. The consolidated financial statements do not include any adjustments that might result from the outcome of this uncertainty.
| Intellipharmaceutics International Inc. | ||
| Consolidated balance sheets | ||
| As at November 30, 2016 and 2015 | ||
| (Stated in U.S. dollars) | ||
2016 | 2015 | |
$ | $ | |
| Assets | ||
| Current | ||
| Cash | 4,144,424 | 1,755,196 |
| Accounts receivable, net (Note 4) | 472,474 | 478,674 |
| Investment tax credits | 681,136 | 458,021 |
| Prepaid expenses, sundry and other assets | 400,642 | 229,225 |
5,698,676 | 2,921,116 | |
| Deferred offering costs (Note 10) | 386,375 | 543,745 |
| Property and equipment, net (Note 5) | 1,889,638 | 1,759,438 |
7,974,689 | 5,224,299 | |
| Liabilities | ||
| Current | ||
| Accounts payable | 807,295 | 3,027,974 |
| Accrued liabilities (Note 6) | 384,886 | 454,290 |
| Employee costs payable (Note 8) | 1,044,151 | 175,172 |
| Current portion of capital lease obligations (Note 9) | 14,829 | 20,460 |
| Convertible debenture (Note 7) | 1,494,764 | 1,518,429 |
| Deferred revenue (Note 3) | 450,000 | - |
4,195,925 | 5,196,325 | |
| Capital lease obligations (Note 9) | - | 15,660 |
| Deferred revenue (Note 3) | 2,662,500 | 150,000 |
6,858,425 | 5,361,985 | |
| Shareholders' equity (deficiency) | ||
| Capital stock (Notes 10 and 11) | ||
| Authorized | ||
Unlimited common shares without par value | ||
Unlimited preference shares | ||
| Issued and outstanding | ||
29,789,992 common shares | 29,830,791 | 21,481,242 |
| Additional paid-in capital | 34,017,071 | 30,969,093 |
| Accumulated other comprehensive income | 284,421 | 284,421 |
| Accumulated deficit | (63,016,019) | (52,872,442) |
1,116,264 | (137,686) | |
| Contingencies (Note 16) | ||
7,974,689 | 5,224,299 |
| (Stated in U.S. dollars) | |||
2016 | 2015 | 2014 | |
$ | $ | $ | |
| Revenues | |||
| Licensing (Note 3) | 2,209,502 | 4,093,781 | 8,415,540 |
| Milestone (Note 3) | - | - | 354,153 |
| Up-front fees (Note 3) | 37,500 | - | - |
2,247,002 | 4,093,781 | 8,769,693 | |
| Expenses | |||
| Research and development | 8,166,736 | 7,247,473 | 8,020,201 |
| Selling, general and administrative | 3,546,132 | 3,581,913 | 3,900,803 |
| Depreciation (Note 5) | 385,210 | 377,849 | 381,385 |
12,098,078 | 11,207,235 | 12,302,389 | |
| Loss from operations | (9,851,076) | (7,113,454) | (3,532,696) |
| Net foreign exchange gain (loss) | (22,470) | 46,211 | 10,896 |
| Interest income | 207 | 1,507 | 4,898 |
| Interest expense | (270,238) | (256,629) | (339,451) |
| Extinguishment loss (Note 7) | - | (114,023) | - |
| Net loss and comprehensive loss | (10,143,577) | (7,436,388) | (3,856,353) |
| Loss per common share, basic and diluted | (0.38) | (0.31) | (0.17) |
| Weighted average number of common | |||
shares outstanding, basic and diluted | 26,699,579 | 23,767,677 | 23,050,618 |
| See accompanying notes to consolidated financial statements |
| (Stated in U.S. dollars) | ||||||
Accumulated | Total | |||||
Additional | other | shareholders' | ||||
Capital stock | paid-in | comprehensive | Accumulated | equity | ||
Number | amount | capital | income | deficit | (deficiency) | |
$ | $ | $ | $ | $ | ||
| Balance, November 30, 2013 | 21,430,611 | 11,721,152 | 23,619,055 | 284,421 | (41,579,701) | (5,955,073) |
| Reclass of warrant liabilities (Note 14) | - | - | 5,438,022 | - | - | 5,438,022 |
| Reclass of conversion option in convertible debenture (Note 7) | - | - | 728,950 | - | - | 728,950 |
| DSU's to non-management board members (Note 12) | - | - | 20,807 | - | - | 20,807 |
| Stock options to employees (Note 11) | - | - | 1,748,607 | - | - | 1,748,607 |
| Shares issued for options exercised (Note 11) | 48,000 | 168,693 | (51,709) | - | - | 116,984 |
| Proceeds from at-the-market financing (Note 10) | 1,689,500 | 6,571,673 | - | - | - | 6,571,673 |
| Share issuance cost (Note 10) | - | (811,887) | - | - | - | (811,887) |
| Issuance of shares on exercise of warrants (Note 14) | 288,500 | 1,291,436 | (510,216) | - | - | 781,220 |
| Adjustment of conversion option in convertible debenture (Note 7) | - | - | 126,414 | 126,414 | ||
Net loss | - | - | - | - | (3,856,353) | (3,856,353) |
2,026,000 | 7,219,915 | 7,500,875 | - | (3,856,353) | 10,864,437 | |
| Balance, November 30, 2014 | 23,456,611 | 18,941,067 | 31,119,930 | 284,421 | (45,436,054) | 4,909,364 |
| DSU's to non-management board members (Note 12) | - | - | 29,056 | - | - | 29,056 |
| Stock options to employees (Note 11) | - | - | 417,818 | - | - | 417,818 |
| Shares issued for options exercised (Note 11) | 91,000 | 300,869 | (132,907) | - | - | 167,962 |
| Proceeds from at-the-market financing (Note 10) | 471,439 | 1,290,168 | - | - | - | 1,290,168 |
| Share issuance cost (Note 10) | - | (78,166) | - | - | - | (78,166) |
| Issuance of shares on exercise of warrants (Note 14) | 225,000 | 1,027,304 | (464,804) | - | - | 562,500 |
| Net loss | - | - | - | - | (7,436,388) | (7,436,388) |
787,439 | 2,540,175 | (150,837) | - | (7,436,388) | (5,047,050) | |
| Balance, November 30, 2015 | 24,244,050 | 21,481,242 | 30,969,093 | 284,421 | (52,872,442) | (137,686) |
| DSU's to non-management board members (Note 12) | - | - | 31,628 | - | - | 31,628 |
| Stock options to employees (Note 11) | - | - | 2,261,444 | - | - | 2,261,444 |
| Shares issued for options exercised (Note 11) | 27,500 | 87,259 | (34,391) | - | - | 52,868 |
| Proceeds from at-the-market financing (Note 10) | 1,471,260 | 3,469,449 | - | - | - | 3,469,449 |
| Proceeds from issuance of shares and warrants (Note 10 & 14) | 3,689,270 | 4,764,777 | 1,175,190 | - | - | 5,939,967 |
| Share issuance cost (Note 10) | - | (1,002,655) | (158,736) | - | - | (1,161,391) |
| Issuance of shares on exercise of warrants (Note 14) | 357,912 | 1,030,719 | (330,066) | - | - | 700,653 |
| Modification of convertible debt (Note 7) | - | - | 102,909 | - | - | 102,909 |
| Net loss | - | - | - | - | (10,143,577) | (10,143,577) |
5,545,942 | 8,349,549 | 3,047,978 | - | (10,143,577) | 1,253,950 | |
Balance, November 30, 2016 | 29,789,992 | 29,830,791 | 34,017,071 | 284,421 | (63,016,019) | 1,116,264 |
| Intellipharmaceutics International Inc. | |||
| Consolidated statements of cash flows | |||
| for the years ended November 30, 2016, 2015 and 2014 | |||
| (Stated in U.S. dollars) | |||
2016 | 2015 | 2014 | |
$ | $ | $ | |
| Net loss | (10,143,577) | (7,436,388) | (3,856,353) |
| Items not affecting cash | |||
| Depreciation (Note 5) | 385,210 | 377,849 | 381,385 |
| Stock-based compensation (Note 11) | 2,261,444 | 417,818 | 1,748,607 |
| Deferred share units (Note 12) | 31,628 | 29,056 | 20,807 |
| Accreted interest (Note 7) | 79,245 | 27,103 | 127,261 |
| Loss on extinguishment (Note 7) | - | 114,023 | - |
| Unrealized foreign exchange loss (gain) | 22,916 | (81,063) | 3,057 |
| Change in non-cash operating assets & liabilities | |||
| Accounts receivable | 6,200 | 532,459 | 464,611 |
| Investment tax credits | (223,115) | (133,035) | (145,436) |
| Prepaid expenses, sundry and other assets | (171,417) | 185,438 | (102,130) |
| Accounts payable and accrued liabilities | (1,466,019) | 2,034,576 | (356,722) |
| Deferred revenue | 2,962,500 | 150,000 | - |
| Cash flows used in operating activities | (6,254,985) | (3,782,164) | (1,714,913) |
| Financing activities | |||
| Repayment of related party loans | - | - | (739,208) |
| Repayment of capital lease obligations | (21,291) | (27,489) | (53,557) |
| Issuance of shares on exercise of stock options (Note 11) | 52,868 | 167,962 | 116,984 |
| Issuance of common shares on at-the-market financing, gross (Note 10) | 3,469,449 | 1,290,168 | 6,571,673 |
| Proceeds from issuance of shares and warrants (Note 10) | 5,939,967 | - | - |
| Proceeds from issuance of shares on exercise of warrants (Note 14) | 700,653 | 562,500 | 781,220 |
| Offering costs (Note 10) | (982,023) | (259,276) | (719,837) |
| Cash flows provided from financing activities | 9,159,623 | 1,733,865 | 5,957,275 |
| Investing activity | |||
| Purchase of property and equipment | (515,410) | (430,480) | (768,973) |
| Cash flows used in investing activities | (515,410) | (430,480) | (768,973) |
| Increase (decrease) in cash | 2,389,228 | (2,478,779) | 3,473,389 |
Cash, beginning of year | 1,755,196 | 4,233,975 | 760,586 |
Cash, end of year | 4,144,424 | 1,755,196 | 4,233,975 |
| Supplemental cash flow information | |||
| Interest paid | 165,585 | 179,878 | 213,637 |
Taxes paid | - | - | - |
| See accompanying notes to consolidated financial statements |
Deferred Share Units
At November 30, 2017, there were 94,131 DSUs issued and outstanding. From November 30, 2017 to February 27, 2018, an additional 8,660 DSUs have been issued. At February 27, 2018, 7,209 additional DSUs are reserved for issuance under our DSU plan.
Restricted Share Units
At November 30, 2017, there were no restricted share units (“RSUs”) issued and outstanding. From November 30, 2017 to the date of this report, no RSUs have been issued. At February 27, 2018, 330,000 RSUs are reserved for issuance under our RSU Plan.
Registration Rights
We conducted a private placement issuance of units comprised of common shares and warrants in February, 2011, which was exempt from registration under the U.S. Securities Act pursuant to Regulation D and Section 4(2) and/or Regulation S thereof and such other available exemptions. As such, the common shares, the warrants, and the common shares underlying the warrants may not be offered or sold in the United States unless they are registered under the U.S. Securities Act, or an exemption from the registration requirements of the U.S. Securities Act is available.
In connection with the private placement, we agreed to file a registration statement on Form F-3 (“Registration Statement”) within 40 days after the closing and use our best efforts to have it declared effective within 150 days after the closing to register (i) 100% of the common shares issued in the private placement; and (ii) 100% of the common shares underlying the investor warrants issued in the private placement (collectively, the private placement or the “Registrable Securities”).
The Registration Statement was declared effective as of March 30, 2011. If (i) the Registration Statement ceases to be continuously effective for more than twenty consecutive calendar days or more than an aggregate of thirty calendar days during any consecutive 12-month period, or (ii) at a time in which the Registrable Securities cannot be sold under the Registration Statement, we shall fail for any reason to satisfy the current public information requirement under Rule 144 as to the applicable Registrable Securities, we shall pay to the investors, on a pro rata basis, partial liquidated damages of one percent (1%) of the aggregate purchase price paid by each investor on the occurrence of an event listed above and for each calendar month (pro rata for any period less than a calendar month) from an event, until cured.
The securities shall cease to be Registrable Securities when (i) they have been sold (A) pursuant to a registration statement; or (B) in accordance with Rule 144 or any other rule of similar effect; or (ii) such securities become eligible for resale without volume or manner-of-sale restrictions, and when either we are compliant with any current public information requirements pursuant to Rule 144 or the current public information requirements no longer apply.
Prior Sales
On March 15, 2012, we completed a registered direct common share offering for gross proceeds of $5,000,000. We sold an aggregate of 1,818,182 shares to U.S. institutional investors at a price of $2.75 per share.
In January 2013, we completed a private placement financing of a Debenture in the original principal amount of $1.5 million. The Debenture was originally due to mature on January 1, 2015, but effective October 1, 2014, the maturity date was extended to July 1, 2015; effective June 29, 2015, the maturity date was extended to January 1, 2016; effective as of December 8, 2015, the maturity date was extended to July 1, 2016; and effective May 26, 2016, the maturity date of the Debenture was further extended to December 1, 2016. The Debenture bears interest at a rate of 12% per annum, payable monthly, is pre-payable at any time at our option, and was convertible at any time into 500,000 common shares at a conversion price of $3.00 per common share at the option of the holder. Drs. Isa and Amina Odidi, our principal stockholders, directors and executive officers provided us with the $1.5 million of the proceeds for the Debenture. Effective December 1, 2016, the maturity date for the Debenture was extended to April 1, 2017 and a principal repayment of $150,000 was made at the time of the extension. After giving effect to such partial repayment, the Debenture is convertible at any time into 450,000 common shares at a conversion price of $3.00 per common share at the option of the holder. The maturity date of the Debenture has been further extended to October 1, 2018. The Company currently expects to repay the current net amount of $1,350,000 on or about October 1, 2018, if the Company then has cash available.
In March 2013, we completed a registered direct unit offering for gross proceeds of $3,121,800. We sold an aggregate of 1,815,000 units at a price of $1.72 per unit. The units were comprised of an aggregate of 1,815,000 common shares and warrants to purchase an additional 453,750 common shares. The warrants are exercisable for a term of five years and have an exercise price of $2.10 per common share.
In July 2013, we completed an underwritten public offering of 1,500,000 units of common shares and warrants for gross proceeds of $3,075,000 at a price of $2.05 per unit. The units were comprised of an aggregate of 1,500,000 common shares and warrants to purchase an additional 375,000 common shares. The warrants have a term of five years and an exercise price of $2.55 per common share.
In November 2013, we entered into an equity distribution agreement with Roth, pursuant to which we may from time to time sell up to 5,305,484 of our common shares for up to an aggregate of $16.8 million (or such lesser amount as may then be permitted under applicable exchange rules and securities laws and regulations) through at-the-market issuances on the Nasdaq or otherwise. Under the equity distribution agreement, we may at our discretion, from time to time, offer and sell common shares through Roth or directly to Roth for resale. Sales of common shares through Roth, if any, will be made at such time and at such price as are acceptable to us, from time to time, by means of ordinary brokers’ transactions on the Nasdaq or otherwise at market prices prevailing at the time of sale or as determined by us. We currently plan to use any net proceeds from the at-the-market offering for general corporate purposes, including funding research, product development and other corporate development opportunities and to possibly fund costs and other expenses relating to our current leased facilities to accommodate our anticipated growth requirements, and, although we have no present understanding, commitments or agreements to do so, potential acquisition of, or investment in, companies and technologies that complement our business. We are not required to sell shares under the equity distribution agreement. We pay Roth a commission, or allow a discount, of 2.75% of the gross proceeds we receive from any sales of our common shares under the equity distribution agreement. Any sales of shares under our at-the-market offering program will be made pursuant to an effective shelf registration statement on Form F-3 filed with the SEC. We have also agreed to reimburse Roth for certain expenses relating to the offering. As of February 27, 2018, we have issued and sold 4,740,350 common shares with an aggregate offering price of $13,872,929 under the at-the-market program. Roth received aggregate compensation of $392,827 in connection with such sales. As a result of prior sales of the Company’s common shares under the equity distribution agreement, the Company may in the future offer and sell its common shares with an aggregate purchase price up to $2,927,071, or such lesser amount as may then be permitted under applicable exchange rules and securities laws and regulations, pursuant to the at-the-market program. Under Toronto Stock Exchange rules, the number of common shares that may currently be offered under the at-the-market program is 565,134 common shares. The Company intends to remove or amend this limitation, although no assurance can be given that the limitation will be removed or amended. There can be no assurance that any additional shares will be sold under our at-the-market program. Subsequent
to the year ended November 30, 2017, share issuance costs of Nil were recorded against the cost of the shares issued and recognized in capital stock. As at November 30, 2017, $1,334,873 of the share issuance costs has been recorded against the cost of the shares issued and recognized in capital stock. Pursuant to an Underwriting Agreement between the Company and Dawson James Securities, Inc., dated May 27, 2016 (the “Dawson James Underwriting Agreement”), in June 2016, we completed an underwritten public offering of 3,229,814 units of common shares and warrants, at a price of $1.61 per unit. The warrants are currently exercisable, have a term of five years and an exercise price of $1.93 per common share. We issued at the initial closing of the offering an aggregate of 3,229,814 common shares and warrants to purchase an additional 1,614,907 common shares. The underwriter also purchased at such closing additional warrants to acquire 242,236 common shares pursuant to the over-allotment option exercised in part by the underwriter. We subsequently sold an aggregate of 459,456 additional common shares at the public offering price of $1.61 per share in connection with subsequent partial exercises of the underwriter’s over-allotment option. The closings of these partial exercises brought the total net proceeds from the offering to approximately $5.1 million, after deducting the underwriter’s discount and offering expenses.
On July 17, 2017, the Shelf Registration Statement was declared effective by the SEC. The Shelf Registration Statement allows for, subject to securities regulatory requirements and limitations, the potential offering of up to an aggregate of $100 million of the Company’s common shares, preference shares, warrants, subscription receipts, subscription rights and units, or any combination thereof, from time to time in one or more offerings, and is intended to give the Company the flexibility to take advantage of financing opportunities when, and if, market conditions are favorable to the Company. The specific terms of such future offerings, if any, would be established, subject to the approval of the Company’s board of directors, at the time of such offering and will be described in detail in a prospectus supplement filed at the time of any such offering. To the extent that any securities are issued by the Company under the Shelf Registration Statement, a shareholder’s percentage ownership will be diluted and our stock price could be adversely affected. As of February 27, 2018, the Company has not sold any securities under the Shelf Registration Statement, other than the sale since July 17, 2017 of (i) 485,239 common shares under the Company’s at-the-market program referred to above and (ii) the sale of 3,636,364 common shares under the Wainwright Agreement referred to above, and there can be no assurance that any additional securities will be sold under the Shelf Registration Statement or the shelf prospectus.
Pursuant to a placement agent agreement dated October 10, 2017 between the Company and H.C. Wainwright & Co., LLC (the “Wainwright Agreement”), in October 2017, we completed a registered direct offering consisting of 3,636,364 common shares at a price of $1.10 per share for gross proceeds of approximately $4 million. We also issued to the investors warrants to purchase an aggregate of 1,818,182 common shares at an exercise price of $1.25 per share. The warrants are exercisable six months following the October 13, 2017 closing date and will expire 30 months after the date they become exercisable. The common shares (but not the warrants or the common shares underlying the warrants) were offered by us through a prospectus supplement pursuant to our shelf registration statement on Form F-3 as previously filed and declared effective by the SEC and the base prospectus contained therein (Registration Statement No. 333-218297). The warrants described above were offered in a private placement under Section 4(a)(2) of the U.S. Securities Act, and Regulation D promulgated thereunder and, along with the common shares underlying the warrants, have not been registered under the U.S. Securities Act, or applicable state securities laws. The Company also issued to the placement agents 181,818 warrants to purchase a share of common stock at an exercise price of $1.375 per share. The total net proceeds from the offering were $3.5 million, after deducting offering expenses.
During the 12-month period ended November 30, 2017, warrants to purchase an aggregate of 168,009 common shares were exercised.
During the 12-month period ended November 30, 2017, 496,000 options were granted and 2,000 options were exercised.
Also during the 12-month period ended November 30, 2017, a total of 17,388 deferred share units were granted.
The Company was formed under the Canada Business Corporations Act (the “CBCA”) by articles of arrangement dated October 22, 2009 (the “Articles”) in the IPC Arrangement Transaction discussed in Item 15. The Company is the successor issuer to Vasogen Inc. for reporting purposes under the U.S. Exchange Act. The authorized share capital of the Company consists of an unlimited number of common shares, all without nominal or par value and an unlimited number of preference shares issuable in series.
Provisions as to the modification, amendment or variation of rights and provisions of each class of shares are contained in the CBCA and the regulations promulgated thereunder. Certain fundamental changes to the Articles will require the approval of at least two-thirds of the votes cast on a resolution submitted to a special meeting of the Company’s shareholders called for the purpose of considering the resolution. These items include (i) certain amendments to the provisions relating to the outstanding capital of the Company, (ii) a sale of all or substantially all of the assets of the Company, (iii) an amalgamation of the Company with another company, other than a subsidiary, (iv) a winding-up of the Company, (v) a continuance of the Company into another jurisdiction, (vi) a statutory court approved arrangement under the CBCA (essentially a corporate reorganization such as an amalgamation, sale of assets, winding-up, etc.), or (vii) a change of name.
Under the CBCA, a corporation cannot repurchase its shares or pay or declare dividends if there are reasonable grounds for believing that (a) the corporation is, or after payment would be, unable to pay its liabilities as they become due, or (b) after the payment, the realizable value of the corporation’s assets would be less than the aggregate of (i) its liabilities and (ii) its stated capital of all classes of its securities. Generally, stated capital is the amount paid on the issuance of a share unless the stated capital has been adjusted in accordance with the CBCA.
General
The Articles do not contain any restrictions on the business the Company may carry on.
Directors
The Company’s By-Law No. 1 (a by-law relating generally to the transaction of the business and affairs of the Company) provides for the indemnification of the directors and officers of the Company, former directors and officers of the Company against all costs, charges and expenses, including an amount paid to settle an action or satisfy a judgment, reasonably incurred by the individual in respect of any civil, criminal, administrative, investigative or other proceeding in which the individual is involved because of that association with the Company, subject to certain limitations in By-Law No. 1 and the limitations in the CBCA.
The Company may also indemnify other individuals who act or acted at the Company’s request as a director or officer, or an individual acting in a similar capacity, of another entity.
Annual and Special Meetings
Meetings of shareholders are held at such place, at such time, on such day and in such manner as the Board may, subject to the CBCA and any other applicable laws, determine from time to time. The only persons entitled to attend a meeting of shareholders are those persons entitled to notice thereof, those entitled to vote thereat, the directors, the auditors of the Company and any others who may be entitled or required under the CBCA to be present at the meeting. Under the CBCA, notice of the meeting is required to be given not less than 21 days and not more than 60 days prior to the meeting. Shareholders on the record date are entitled to attend and vote at the meeting. The quorum for the transaction of business at any meeting of shareholders is at least two persons present at the opening of the meeting who are entitled to vote either as shareholders or proxyholders, representing collectively not less than 5% of the outstanding shares of the Company entitled to be voted at the meeting.
Other
There is no by-law provisions governing the ownership threshold above which shareholder ownership must be disclosed. However, there are disclosure requirements pursuant to applicable Canadian law.
There are no provisions in either the Company’s Articles or By-Law No. 1 that would have the effect of delaying, deferring or preventing a change in control of the Company and that would operate only with respect to a merger, acquisition or corporate restructuring involving the Company or its subsidiary.
There are no limitations on the rights to own securities, including the rights of non-resident or foreign shareholders to hold or exercise voting rights on the securities imposed by foreign law or by the charter or other constituent document of the Company.
Except for contracts entered into in the ordinary course of business and not required to be filed under Canadian securities laws, the only contracts which are regarded as material and which were entered into by the Company within the two years immediately preceding the date of this annual report, are:
●
On November 21, 2005, the Company entered into the Par agreement pursuant to which the Company granted Par an exclusive, royalty-free license to make and distribute in the United States all strengths of our generic versions of the branded product Focalin XR® for a period of 10 years from the date of commercial launch (which was November 19, 2013). Under the Par agreement, we filed the Company ANDA with the FDA for approval to market generic Focalin XR® capsules in various strengths in the U.S., and are the owner of that Company ANDA, as approved in part by the FDA. We retain the right to make and distribute all strengths of the generic product outside of the U.S. Calendar quarterly profit-sharing payments for its U.S. sales under the Company ANDA are payable by Par to us as calculated pursuant to the Par agreement. Within the purview of the Par agreement, Par also applied for and owns the Par ANDA pertaining to all marketed strengths of generic Focalin XR®, and is now approved by the FDA, to market generic Focalin XR® capsules in all marketed strengths in the U.S. As with the Company ANDA, calendar quarterly profit-sharing payments are payable by Par to us for its U.S. sales of generic Focalin XR® under the Par ANDA as calculated pursuant to the Par agreement. The Company is responsible under the Par agreement for the development of the product and most related costs which, with the applications to and recent approvals by the FDA, the Company now considers to be completed.
●
In October 2016, the Company entered into the Mallinckrodt agreement, granting Mallinckrodt an exclusive license to market, sell and distribute in the U.S. the following extended release drug product candidates (the “licensed products”) for which the Company has ANDAs filed with the FDA:
●
Quetiapine fumarate extended-release tablets (generic Seroquel XR®)–Approved by FDA and launched.
●
Desvenlafaxine extended-release tablets (generic Pristiq®) – ANDA Under FDA Review
●
Lamotrigine extended-release tablets (generic Lamictal® XR™) – ANDA Under FDA Review
Under the terms of this 10-year agreement, the Company received a non-refundable upfront payment of $3 million in October 2016. In addition, the Mallinckrodt agreement also provides for a long-term profit sharing arrangement with respect to these licensed products (which includes up to $11 million in cost recovery payments to the Company). The Company has agreed to manufacture and supply the licensed products exclusively for Mallinckrodt on a cost plus basis, and Mallinckrodt has agreed that the Company will be its sole supplier of the licensed products marketed in the U.S. The Mallinckrodt agreement contains customary terms and conditions for an agreement of this kind, and is subject to early termination in the event we do not obtain FDA approvals of the Mallinckrodt licensed products by specified dates, or pursuant to any one of several termination rights of each party.
●
The acknowledgement and agreement of the Company dated October 22, 2009 to be bound by the performance based stock option agreement dated September 10, 2004 pursuant to which Drs. Isa and Amina Odidi are entitled to purchase up to 2,763,940 of the Company’s shares upon payment of $3.62 per share, subject to satisfaction of the performance vesting conditions being the acceptance by the FDA of the filing of an application for approval of a drug product or the approval of such an application.
●
The amended and restated promissory note dated October 22, 2009 for up to C$2,300,000 issued by IPC Corp to Isa Odidi and Amina Odidi for advances that may be made by them from time to time to the Company. As at November 30, 2015 and November 30, 2014, no amount was outstanding. No at-the-market offering proceeds were used in payment of the promissory note.
●
The Debenture dated January 10, 2013 for $1.5 million issued by the Company to Isa Odidi and Amina Odidi for the loan of $1.5 million made by them to the Company. The Debenture was originally due to mature on January 1, 2015, but effective October 1, 2014, the maturity date was extended to July 1, 2015; effective June 29, 2015, the maturity date was extended to January 1, 2016; and effective as of December 8, 2015, the maturity date was further extended to July 1, 2016; and effective May 26, 2016, the maturity date of the Debenture was extended to December 1, 2016. Effective December 1, 2016, the maturity date for the Debenture was extended to April 1, 2017 and a principal repayment of $150,000 was made at the time of the extension. After giving effect to such partial repayment, the Debenture is convertible at any time into 450,000 common shares at a conversion price of $3.00 per common share at the option of the holder. The maturity date of the Debenture has been further extended to October 1, 2018. The Company currently expects to repay the current net amount of $1,350,000 on or about October 1, 2018, if the Company then has cash available.
●
Pursuant to the Dawson James Underwriting Agreement, in June 2016, we completed an underwritten public offering of 3,229,814 units of common shares and warrants, at a price of $1.61 per unit. The warrants are currently exercisable, have a term of five years and an exercise price of $1.93 per common share. We issued at the initial closing of the offering an aggregate of 3,229,814 common shares and warrants to purchase an additional 1,614,907 common shares. The underwriter also purchased at such closing additional warrants to acquire 242,236 common shares pursuant to the over-allotment option exercised in part by the underwriter. We subsequently sold an aggregate of 459,456 additional common shares at the public offering price of $1.61 per share in connection with subsequent partial exercises of the underwriter’s over-allotment option. The closings of these partial exercises brought the total net proceeds from the offering to approximately $5.1 million, after deducting the underwriter’s discount and offering expenses.
●
Pursuant to the Wainwright Agreement, in October 2017, we completed a registered direct offering consisting of 3,636,364 common shares at a price of $1.10 per share for gross proceeds of approximately $4 million. We also issued to the investors warrants to purchase an aggregate of 1,818,182 common shares at an exercise price of $1.25 per share. The warrants are exercisable six months following the October 13, 2017 closing date and will expire 30 months after the date they become exercisable. The common shares (but not the warrants or the common shares underlying the warrants) were offered by us through a prospectus supplement pursuant to our shelf registration statement on Form F-3 as previously filed and declared effective by the SEC and the base prospectus contained therein (Registration Statement No. 333-218297). The warrants described above were offered in a private placement under Section 4(a)(2) of the U.S. Securities Act, and Regulation D promulgated thereunder and, along with the common shares underlying the warrants, have not been registered under the U.S. Securities Act, or applicable state securities laws. The Company also issued to the placement agents 181,818 warrants to purchase a share of common stock at an exercise price of $1.375 per share. The total net proceeds from the offering were $3.5 million, after deducting offering expenses.
D.Exchange Controls
Canada has no system of currency exchange controls. There are no governmental laws, decrees or regulations in Canada that restrict the export or import of capital, including but not limited to, foreign exchange controls, or that affect the remittance of dividends, interest or other payments to non-resident holders of the Company’s securities.
United States Taxation
Certain Material United States Federal Income Tax Considerations
The following discussion is a general summary of certain material United States federal income tax considerations applicable to a U.S. holder arising from and relating to the consequences of the ownership and disposition of our common shares and warrants that are generally applicable to a United States person that holds our common shares as capital assets (a “U.S. Holder”) within the meaning of Section 1221 of the Code. This discussion does not address holders of other securities. This discussion assumes that we are not a “controlled foreign corporation” for U.S. federal income tax purposes. The following discussion does not purport to be a complete analysis of all of the potential United States federal income tax considerations that may be relevant to particular holders of our common shares or warrants in light of their particular circumstances nor does it deal with persons that are subject to special tax rules, such as brokers, dealers in securities or currencies, financial institutions, insurance companies, tax-exempt organizations, persons liable for alternative minimum tax, U.S. expatriates, partnerships or other pass-through entities, U.S. Holders who own (directly, indirectly or by attribution) ten percent or more of the total combined voting power of all classes of stock entitled to vote, persons holding our common shares as part of a straddle, hedge or conversion transaction or as part of a synthetic security or other integrated transaction, traders in securities that elect to use a mark-to-market method of accounting for their securities holdings, holders whose “functional currency” is not the United States dollar, and holders who are not U.S. Holders. In addition, the discussion below does not address the tax consequences of the law of any state, locality or foreign jurisdiction or United States federal tax consequences (e.g., estate or gift tax) other than those pertaining to the income tax. There can be no assurance that the United States Internal Revenue Service (the “IRS”) will take a similar view as to any of the tax consequences described in this summary.
The following is based on currently existing provisions of the Code, existing and proposed Treasury regulations under the Code and current administrative rulings and court decisions. Everything listed in the previous sentence may change, possibly on a retroactive basis, and any change could affect the continuing validity of this discussion. We cannot predict whether, when, or to what extent U.S. federal tax laws will be changed, or regulations, interpretations, or rulings will be issued or revoked, nor is the long-term impact of the significant changes made to the Code in 2017 known at this time.
Each U.S. Holder and each holder of common shares that is not a U.S. Holder should consult its tax adviser regarding the United States federal income tax consequences of holding our common shares applicable to such holder in light of its particular situation, as well as any tax consequences that may arise under the laws of any other relevant foreign, state, local, or other taxing jurisdiction.
As used in this section, the term “United States person” means a beneficial owner of our common shares that is:
(i)
a citizen or an individual resident of the United States;
(ii)
a corporation (or an entity taxable as a corporation for United States federal income tax purposes) created or organized in or under the laws of the United States or any political subdivision of the United States;
(iii)
an estate the income of which is subject to United States federal income taxation regardless of its source; or
(iv)
a trust which (A) is subject to the supervision of a court within the United States and the control of a United States person as described in Section 7701(a)(30) of the Code; or (B) is subject to a valid election under applicable Treasury Regulations to be treated as a United States person.
If a partnership (including for this purpose any entity treated as a partnership for U.S. federal income tax purposes) holds our common shares, the United States federal income tax treatment of a partner generally will depend on the status of the partner and the activities of the partnership. A United States person that is a partner of the partnership holding our common shares should consult its own tax adviser.
Passive Foreign Investment Company Considerations
Special, generally unfavorable, U.S. federal income tax rules apply to a U.S. Holder’s ownership and disposition of the stock or warrants of a passive foreign investment company (“PFIC”). As discussed below, however, a U.S. Holder of our common shares (but not our warrants) may be able to mitigate these consequences by making a timely and effective election to treat the Company as a qualified electing fund (a “QEF Election”) or by making a timely and effective mark-to-market election with respect to its common shares.
For U.S. federal income tax purposes, a foreign corporation is classified as a PFIC for each taxable year in which, applying the relevant look-through rules, either:
●
at least 75% of its gross income for the taxable year consists of specified types of “passive” income (referred to as the “income test”); or
●
at least 50% of the average value of its assets during the taxable year is attributable to certain types of assets that produce passive income or are held for the production of passive income (referred to as the “asset test”).
For purposes of the income and asset tests, if a foreign corporation owns directly or indirectly at least 25% (by value) of the stock of another corporation, that foreign corporation will be treated as if it held its proportionate share of the assets of the other corporation and received its proportionate share of the income of that other corporation. Also, for purposes of the income and asset tests, passive income does not include any income that is an interest, dividend, rent or royalty payment if it is received or accrued from a related person to the extent that amount is properly allocable to the active income of the related person. Under applicable attribution rules, if the Company is a PFIC, U.S. Holders of common shares will be treated as holding stock of the Company’s subsidiaries that are PFICs in certain circumstances. In these circumstances, certain dispositions of, and distributions on, stock of such subsidiaries may have consequences for U.S. Holders under the PFIC rules.
We believe that we were not a PFIC during our 2017 taxable year and are unlikely to be a PFIC during our 2018 taxable year. Because PFIC status is based on our income, assets and activities for the entire taxable year, and our market capitalization, it is not possible to determine whether we will be characterized as a PFIC for the 2018 taxable year until after the close of the taxable year. The tests for determining PFIC status are subject to a number of uncertainties. These tests are applied annually, and it is difficult to accurately predict future income, assets and activities relevant to this determination. In addition, because the market price of our common shares is likely to fluctuate, the market price may affect the determination of whether we will be considered a PFIC. There can be no assurance that we will not be considered a PFIC for any taxable year (including our 2018 taxable year). Absent one of the elections described below, if we are a PFIC for any taxable year during which a U.S. Holder holds our common shares, such U.S. Holder’s share of our income for such year will continue to be subject to the regime described below, regardless of whether we cease to meet the PFIC tests in one or more subsequent years. Accordingly, no assurance can be given that we will not constitute a PFIC in the current (or any future) tax year or that the IRS will not challenge any determination made by us concerning our PFIC status.
If we are a PFIC, the U.S. federal income tax consequences to a U.S. Holder of the ownership and disposition of our shares will depend on whether such U.S. Holder makes a QEF or mark-to-market election. Unless otherwise provided by the IRS, a U.S. Holder of our shares is generally required to file an informational return annually to report its ownership interest in the PFIC during any year in which we are a PFIC.
U.S. HOLDERS SHOULD CONSULT THEIR OWN TAX ADVISERS ABOUT THE PFIC RULES, THE POTENTIAL APPLICABILITY OF THESE RULES TO THE COMPANY CURRENTLY AND IN THE FUTURE, AND THEIR FILING OBLIGATIONS IF THE COMPANY IS A PFIC.
The “No Election” Alternative – Taxation of Excess Distributions
If we are classified as a PFIC for any year during which a U.S. Holder has held common shares or warrants and, in the case of our common shares, that U.S. Holder has not made a QEF Election or a mark-to-market election, special rules may subject that U.S. Holder to increased tax liability, including loss of favorable capital gains rates and the imposition of an interest charge upon the sale or other disposition of the common shares or warrants or upon the receipt of any excess distribution (as defined below). Under these rules:
●
the gain, if any, realized on such disposition will be allocated ratably over the U.S. Holder’s holding period;
●
the amount of gain allocated to the current taxable year and any year prior to the first year in which we are a PFIC will be taxed as ordinary income in the current year;
●
the amount of gain allocated to each of the taxable years other than the year in which the excess distribution occurs and pre-FIC years will be subject to tax at the highest ordinary income tax rate in effect for that year; and
●
an interest charge for the deemed deferral benefit will be imposed with respect to the resulting tax attributable to each of the other taxable years.
These rules will continue to apply to the U.S. Holder even after we cease to meet the definition of a PFIC, unless the U.S. Holder elects to be treated as having sold our common shares on the last day of the last taxable year in which we qualified as a PFIC.
An “excess distribution,” in general, is any distribution on common shares received in a taxable year by a U.S. Holder that is greater than 125% of the average annual distributions received by that U.S. Holder in the three preceding taxable years or, if shorter, during that U.S. Holder’s holding period for common shares.
Any portion of a distribution paid to a U.S. Holder that does not constitute an excess distribution will be treated as ordinary dividend income to the extent of our current and accumulated earnings and profits (as computed for U.S. federal income tax purposes). Such dividends generally will not qualify for the dividends-received deduction otherwise available to U.S. corporations. Any amounts treated as dividends paid by a PFIC generally will not constitute “qualified dividend income” within the meaning of Section 1(h)(11) of the Code and will, therefore, not be eligible for the preferential 20% rate for such income generally in effect for individuals under current law. Any such amounts in excess of our current and accumulated earnings and profits will be applied against the U.S. Holder’s tax basis in the common shares and, to the extent in excess of such tax basis, will be treated as gain from a sale or exchange of such shares. It is possible that any such gain may be treated as an excess distribution.
The QEF Election Alternative
A U.S. Holder of common shares (but not warrants) who elects (an “Electing U.S. Holder”) under Section 1295 of the Code, in a timely manner to treat us as a QEF would generally include in gross income (and be subject to current U.S. federal income tax on) its pro rata share of (a) the Company’s ordinary earnings, as ordinary income, and (b) our net capital gains, as long-term capital gain. An Electing U.S. Holder will generally be subject to U.S. federal income tax on such amounts for each taxable year in which we are classified as a PFIC, regardless of whether such amounts are actually distributed to the Electing U.S. Holder. An Electing U.S. Holder may further elect, in any given taxable year, to defer payment of U.S. federal income tax on such amounts to the extent they remain undistributed, subject to certain limitations. However, if payment of such tax is deferred, the taxes will be subject to an interest charge calculated from the due date of the tax return for the relevant year with respect to which the QEF election applies until the date the tax is paid.
A U.S. Holder may not make a QEF election with respect to its warrants to acquire our common shares. As a result, if a U.S. Holder sells or otherwise disposes of such warrants (other than upon exercise of such warrants), any gain recognized generally will be subject to the special tax and interest charge rules treating the gain as an excess distribution, as described above, if we were a PFIC at any time during the period the U.S. Holder held the warrants. If a U.S. Holder that exercises such warrants properly makes a QEF election with respect to the newly acquired common shares (or has previously made a QEF election with respect to our common shares), the QEF election will apply to the newly acquired
common shares, but the adverse tax consequences attributable to the period prior to exercise of the warrants, adjusted to take into account the current income inclusions resulting from the QEF election, will continue to apply with respect to such newly acquired common shares (which generally will be deemed to have a holding period for purposes of the PFIC rules that includes the period the U.S. Holder held the warrants), unless the U.S. Holder makes a purging election under the PFIC rules. The purging election creates a deemed sale of such common shares at their fair market value. The gain recognized by the purging election will be subject to the special tax and interest charge rules treating the gain as an excess distribution, as described above. As a result of the purging election, the U.S. Holder will have a new basis and holding period in the common shares acquired upon the exercise of the warrants for purposes of the PFIC rules.
A U.S. Holder may make a QEF Election only if the Company furnishes the U.S. Holder with certain tax information. If the Company should determine that it is a PFIC, it is anticipated that it will attempt to timely and accurately disclose such information to its U.S. Holders and provide U.S. Holders with information reasonably required to make such election.
A U.S. Holder that makes a QEF Election with respect to the Company generally (a) may receive a tax-free distribution from the Company to the extent that such distribution represents “earnings and profits” of the Company that were previously included in income by the U.S. Holder because of such QEF Election and (b) takes a tax basis in his, her or its common shares to reflect the amount included in income (resulting in an increase in basis) or allowed as a tax-free distribution (resulting in a decrease in basis) as a result of the QEF Election.
Similarly, if any of our non-U.S. subsidiaries were classified as PFICs, a U.S. Holder that makes a timely QEF Election with respect to any of our subsidiaries would be subject to the QEF rules as described above with respect to the Holder’s pro rata share of the ordinary earnings and net capital gains of any of our subsidiaries. Our earnings (or earnings of any of our subsidiaries) attributable to distributions from any of our subsidiaries that had previously been included in the income of an Electing U.S. Holder under the QEF rules would generally not be taxed to the Electing U.S. Holder again.
Upon the sale or other disposition of common shares, an Electing U.S. Holder who makes a QEF Election for the first taxable year in which it owns common shares (which election remains in effect throughout such U.S. Holder’s ownership of common shares) will recognize capital gain or loss for U.S. federal income tax purposes in an amount equal to the difference between the net amount realized on the disposition and the U.S. Holder’s adjusted tax basis in the common shares. Such gain or loss will be long-term capital gain or loss if the U.S. Holder’s holding period in the common shares is more than one year, otherwise it will be short-term capital gain or loss. The deductibility of capital losses is subject to certain limitations. A U.S. Holder’s gain realized upon the disposition of shares generally will be treated as U.S. source income, and losses from the disposition generally will be allocated to reduce U.S. source income.
A QEF Election must be made in a timely manner as specified in applicable Treasury Regulations. Generally, the QEF Election must be made by filing the appropriate QEF election documents at the time such U.S. Holder timely files its U.S. federal income tax return for the first taxable year of the Company during which it was a PFIC.
Each U.S. Holder should consult its own tax advisor regarding the availability of, procedure for making, and consequences of a QEF Election with respect to the Company.
Mark-to-Market Election Alternative
Assuming that our common shares are treated as marketable stock (as defined for these purposes), a U.S. Holder that does not make a QEF Election may avoid the application of the excess distribution rules, at least in part, by electing, under Section 1296 of the Code, to mark the common shares to market annually. Consequently, the U.S. Holder will generally recognize as ordinary income or loss each year an amount equal to the difference as of the close of the taxable year between the fair market value of its common shares and the U.S. Holder’s adjusted tax basis in the common shares. Any mark-to-market loss is treated as an ordinary deduction, but only to the extent of the net mark-to-market gain that the Holder has included pursuant to the election in prior tax years. Any gain on a disposition of our common shares by a U.S. Holder that has made such a mark-to-market election would be treated as ordinary income. Such U.S. Holder’s basis in its common shares would be adjusted to reflect any of these income or loss amounts. Currently, a mark-to-market election may not be made with respect to warrants. We do not anticipate that the preference shares will be treated as marketable stock for these purposes.
For purposes of making this election, stock of a foreign corporation is “marketable” if it is “regularly traded” on certain “qualified exchanges”. Under applicable Treasury Regulations, a “qualified exchange” includes a national securities exchange that is registered with the SEC or the national market system established pursuant to Section 11A of the U.S. Exchange Act, and certain foreign securities exchanges. Currently, our common shares are traded on a “qualified exchange.” Under applicable Treasury Regulations, PFIC stock traded on a qualified exchange is “regularly traded” on such exchange for any calendar year during which such stock is traded, other than in de minimis quantities, on at least 15 days during each calendar quarter. Special rules apply if an election is made after the beginning of the taxpayer’s holding period in PFIC stock.
To the extent available, a mark-to-market election applies to the taxable year in which such mark-to-market election is made and to each subsequent taxable year, unless the Company’s common shares cease to be “marketable stock” or the IRS consents to revocation of such election. In addition, a U.S. Holder that has made a mark-to-market election does not include mark-to-market gains, or deduct mark-to-market losses, for years when the Company ceases to be treated as a PFIC.
The mark-to-market rules generally do not appear to prevent the application of the excess distribution rules in respect of stock of any of our subsidiaries in the event that any of our subsidiaries were considered PFICs. Accordingly, if Intellipharmaceutics and any of our subsidiaries were both considered PFICs and a U.S. Holder made a mark-to-market election with respect to its common shares, the U.S. Holder may remain subject to the excess distribution rules described above with respect to its indirectly owned shares of subsidiary stock.
U.S. HOLDERS ARE URGED TO CONSULT THEIR TAX ADVISORS REGARDING THE POSSIBLE APPLICABILITY OF THE PFIC RULES AND THE AVAILABILITY OF, PROCEDURES FOR MAKING, AND CONSEQUENCES OF A QEF ELECTION OR MARK-TO-MARKET ELECTION WITH RESPECT TO THE COMPANY’S COMMON SHARES.
Ownership and Disposition of Common Shares and Warrants to the Extent that the PFIC Rules do not Apply
Distributions on Common Shares
A U.S. Holder that receives a distribution, including a constructive distribution, with respect to a Share will be required to include the amount of such distribution in gross income as a dividend (without reduction for any Canadian income tax withheld from such distribution) to the extent of the current or accumulated “earnings and profits” of the Company, as computed for U.S. federal income tax purposes. Any amount considered to be a dividend received by a U.S. Holder who is an individual should be eligible for the 20% maximum rate of U.S. federal income tax under Section 1(h)(11) of the Code. To the extent that a distribution exceeds the current and accumulated “earnings and profits” of the Company, such distribution will be treated first as a tax-free return of capital to the extent of a U.S. Holder’s tax basis in the common shares and thereafter as gain from the sale or exchange of such common shares. (See “Sale or Other Taxable Disposition of Common Shares” below). However, the Company may not maintain the calculations of earnings and profits in accordance with U.S. federal income tax principles, and each U.S. Holder should (unless advised to the contrary) therefore assume that any distribution by the Company with respect to the common shares will constitute ordinary dividend income. Dividends received on common shares generally will not be eligible for the “dividends received deduction”. The dividend rules are complex, and each U.S. Holder should consult its own tax advisor regarding the application of such rules.
The terms of a warrant may provide for an adjustment to the number of common shares for which the warrant may be exercised or to the exercise price of the warrant in certain events. An adjustment which has the effect of preventing dilution generally is not taxable. However, the U.S. Holders of the warrants would be treated as receiving a constructive distribution from us if, for example, the adjustment increases the warrant holders’ proportionate interest in our assets or earnings and profits (e.g., through an increase in the number of common shares that would be obtained upon exercise) as a result of a distribution of cash to the holders of our common shares which is taxable to the U.S. Holders of such common shares as described under “Distributions on Common Shares” above. Such constructive distribution would be subject to tax as described under that section in the same manner as if the U.S. Holders of the warrants received a cash distribution from us equal to the fair market value of such increased interest.
Sale or Other Taxable Disposition of Common Shares
Upon the sale or other taxable disposition of common shares, a U.S. Holder generally will recognize capital gain or loss in an amount equal to the difference between the U.S. dollar value of cash received plus the fair market value of any property received and such U.S. Holder’s tax basis in such common shares sold or otherwise disposed of. A U.S. Holder’s tax basis in common shares generally will be such Holder’s U.S. dollar cost for such common shares.
Gain or loss recognized on such sale or other disposition generally will be long-term capital gain or loss if, at the time of the sale or other disposition, the common shares have been held for more than one year. The long-term capital gains realized by non-corporate U.S. Holders are generally subject to a lower marginal U.S. federal income tax rate than ordinary income other than qualified dividend income, as defined above. Currently, the maximum rate on long-term capital gains is 20%, although the actual rates may be higher due to the phase out of certain tax deductions, exemptions and credits. However, given the uncertain economic conditions in the United States and the size of the federal deficit, tax rates are subject to change and prospective U.S. Holders should consult their tax advisors. The deductibility of losses may be subject to limitations.
Warrants
Generally, no U.S. federal income tax will be imposed upon the U.S. Holder of a warrant upon exercise of such warrant to acquire our common shares. A U.S. Holder’s tax basis in a warrant will generally be the amount of the purchase price that is allocated to the warrant. Upon exercise of a warrant, the tax basis of the new common shares would be equal to the sum of the tax basis of the warrants in the hands of the U.S. Holder plus the exercise price paid, and the holding period of the new common shares would begin on the date that the warrants are exercised. If a warrant lapses without exercise, the U.S. Holder will generally realize a capital loss equal to its tax basis in the warrant. Prospective U.S. Holders should consult their tax advisors regarding the tax consequences of acquiring, holding and disposing of warrants.
The tax consequences of a cashless exercise of a warrant are not clear under current tax law. A cashless exercise may be tax-free, either because the exercise is not a gain realization event or because the exercise is treated as a recapitalization for U.S. federal income tax purposes. In either tax-free situation, a U.S. Holder’s basis in the common shares received upon exercise would equal the U.S. holder’s basis in the warrant. If the cashless exercise were treated as not being a gain realization event, a U.S. Holder’s holding period in the common shares would be treated as commencing on the date following the date of exercise of the warrant. If the cashless exercise were treated as a recapitalization, the holding period of the common shares would include the holding period of the warrant. It is also possible that a cashless exercise could be treated as a taxable exchange in which gain or loss would be recognized. In such event, a U.S. Holder could be deemed to have surrendered warrants equal to the number of common shares having a value equal to the exercise price for the total number of warrants to be exercised. The U.S. Holder would recognize capital gain or loss in an amount equal to the difference between the fair market value of the common shares represented by the warrants deemed surrendered and the U.S. Holder’s tax basis in the warrants deemed surrendered. If taxable exchange treatment applied, a U.S. Holder’s tax basis in the common shares received would equal the sum of the fair market value of the common shares represented by the warrants deemed surrendered and the U.S. Holder’s tax basis in the warrants exercised. A U.S. Holder’s holding period for the common shares would commence on the date following the date of exercise of the warrant. Due to the absence of authority on the U.S. federal income tax treatment of a cashless exercise, there can be no assurance which, if any, of the alternative tax consequences and holding periods described above would be adopted by the IRS or a court of law. Accordingly, U.S. Holders should consult their tax advisors regarding the tax consequences of a cashless exercise.
Additional Considerations
Tax-Exempt Investors
Special considerations apply to U.S. persons that are pension plans and other investors that are subject to tax only on their unrelated business taxable income. Such a tax-exempt investor’s income from an investment in our common shares or warrants generally will not be treated as resulting in unrelated business taxable income under current law, so long as such investor’s acquisition of common shares or warrants is not debt-financed. Tax-exempt investors should consult their own tax advisors regarding an investment in our common shares or warrants.
Additional Tax on Passive Income
Certain individuals, estates and trusts whose income exceeds certain thresholds will generally be required to pay a 3.8% Medicare surtax on the lesser of (1) the U.S. Holder’s “net investment income” for the relevant taxable year and (2) the excess of the U.S. Holder’s modified gross income for the taxable year over a certain threshold (which, in the case of individuals, will generally be between U.S.$125,000 and U.S.$250,000 depending on the individual’s circumstances). A U.S. Holder’s “net investment income” may generally include, among other items, certain interest, dividends, gain, and other types of income from investments, minus the allowable deductions that are properly allocable to that gross income or net gain. U.S. Holders are urged to consult with their own tax advisors regarding the effect, if any, of this tax on their ownership and disposition of common shares or warrants.
Receipt of Foreign Currency
The amount of any distribution paid to a U.S. Holder in foreign currency, or on the sale, exchange or other taxable disposition of common shares or warrants, generally will be equal to the U.S. dollar value of such foreign currency based on the exchange rate applicable on the date of receipt (regardless of whether such foreign currency is converted into U.S. dollars at that time). A U.S. Holder will have a basis in the foreign currency equal to its U.S. dollar value on the date of receipt. Any U.S. Holder who converts or otherwise disposes of the foreign currency after the date of receipt may have a foreign currency exchange gain or loss that would be treated as ordinary income or loss, and generally will be U.S. source income or loss for foreign tax credit purposes. Each U.S. Holder should consult its own U.S. tax advisor regarding the U.S. federal income tax consequences of receiving, owning, and disposing of foreign currency.
Foreign Tax Credit
Subject to the PFIC rules discussed above, a U.S. Holder that pays (whether directly or through withholding) Canadian income tax with respect to dividends paid on the common shares generally will be entitled, at the election of such U.S. Holder, to receive either a deduction or a credit for such Canadian income tax paid. Generally, subject to the limitations described in the next paragraph, a credit will reduce a U.S. Holder’s U.S. federal income tax liability on a dollar-for-dollar basis, whereas a deduction will reduce a U.S. Holder’s income subject to U.S. federal income tax. This election is made on a year-by-year basis and generally applies to all foreign taxes paid (whether directly or through withholding) or accrued by a U.S. Holder during a year.
Complex limitations apply to the foreign tax credit, including the general limitation that the credit cannot exceed the proportionate share of a U.S. Holder’s U.S. federal income tax liability (determined before application of the foreign tax credit) that such U.S. Holder’s “foreign source” taxable income bears to such U.S. Holder’s worldwide taxable income. In applying this limitation, a U.S. Holder’s various items of income and deduction must be classified, under complex rules, as either “foreign source” or “U.S. source.” Generally, dividends paid by a foreign corporation should be treated as foreign source for this purpose, and gains recognized on the sale of stock of a foreign corporation by a U.S. Holder should generally be treated as U.S. source for this purpose, except as otherwise provided in an applicable income tax treaty or if an election is properly made under the Code. However, the amount of a distribution with respect to the common shares that is treated as a “dividend” may be lower for U.S. federal income tax purposes than it is for Canadian federal income tax purposes, resulting in a reduced foreign tax credit allowance to a U.S. Holder. In addition, this limitation is calculated separately with respect to specific categories of income. The foreign tax credit rules are complex, and each U.S. Holder should consult its own U.S. tax advisor regarding the foreign tax credit rules.
State and Local Tax
In addition to the U.S. federal income tax discussed above, U.S. Holders may also be subject to state and local income taxation for amounts received on the disposition of common shares and on dividends received. Amounts paid to U.S. Holders will not have state and local tax amounts withheld from payments and U.S. Holders should consult with a tax advisor regarding the state and local taxation implications of such amounts received.
Information Reporting
In general, U.S. Holders of common shares are subject to certain information reporting under the Code relating to their purchase and/or ownership of stock of a foreign corporation such as the Company. Failure to comply with these information reporting requirements may result in substantial penalties.
For example, U.S. federal income tax information reporting rules generally require certain individuals who are U.S. Holders to file Form 8938 to report the ownership of specified foreign financial assets if the total value of those assets exceeds an applicable threshold amount (subject to certain exceptions). For these purposes, a specified foreign financial asset includes not only a financial account (as defined for these purposes) maintained by a foreign financial institution, but also any stock or security issued by a non-U.S. person, any financial instrument or contract held for investment that has an issuer or counterparty other than a U.S. person and any interest in a foreign entity, provided that the asset is not held in an account maintained by a financial institution. The minimum applicable threshold amount is generally U.S.$50,000 in the aggregate, but this threshold amount varies depending on whether the individual lives in the U.S., is married, files a joint income tax return with his or her spouse, etc. Certain domestic entities that are U.S. Holders may also be required to file Form 8938 if both (i) such entities are owned at least 80% by an individual who is a U.S. citizen or U.S. tax resident (or, in some cases, by a nonresident alien who meets certain criteria) or are trusts with beneficiaries that are such individuals and (ii) more than 50% of their income consists of certain passive income or more than 50% of their assets is held for the production of such income. U.S. Holders are urged to consult with their tax advisors regarding their reporting obligations, including the requirement to file IRS Form 8938.
In addition, in certain circumstances, a U.S. Holder of common shares who disposes of such common shares in a transaction resulting in the recognition by such Holder of losses in excess of certain significant threshold amounts may be obligated to disclose its participation in such transaction in accordance with the Treasury Regulations governing tax shelters and other potentially tax-motivated transactions or tax shelter regulations. Potential purchasers of common shares should consult their tax advisors concerning any possible disclosure obligation under the tax shelter rules with respect to the disposition of their common shares.
Backup Withholding
Generally, information reporting requirements will apply to distributions on our common shares or proceeds on the disposition of our common shares or warrants paid within the U.S. (and, in certain cases, outside the U.S.) to U.S. Holders. Such payments will generally be subject to backup withholding tax at the rate of 28% if: (a) a U.S. Holder fails to furnish such U.S. Holder’s correct U.S. taxpayer identification number to the payor (generally on Form W-9), as required by the Code and Treasury Regulations, (b) the IRS notifies the payor that the U.S. Holder’s taxpayer identification number is incorrect, (c) a U.S. Holder is notified by the IRS that it has previously failed to properly report interest and dividend income, or (d) a U.S. Holder fails to certify, under penalty of perjury, that such U.S. Holder has furnished its correct U.S. taxpayer identification number. However, certain exempt persons generally are excluded from these information reporting and backup withholding rules.
Backup withholding is not an additional tax. Any amounts withheld under the U.S. backup withholding tax rules will be allowed as a credit against a U.S. Holder’s U.S. federal income tax liability, if any, or will be refunded, if such U.S. Holder furnishes required information to the IRS in a timely manner. Each U.S. Holder should consult its own tax advisor regarding the backup withholding rules.
Canadian Federal Income Tax Considerations
Taxation
The following summary describes the principal Canadian federal income tax considerations generally applicable to a holder of the Company’s common shares who, for purposes of the Income Tax Act (Canada) (the “Canadian Tax Act”) and the Canada – United States Tax Convention (the “Treaty”) and at all relevant times, is resident in the United States and was not and is not resident in Canada nor deemed to be resident in Canada, deals at arm’s length and is not affiliated with the Company, holds the Company’s common shares as capital property, does not use or hold and is not deemed to use or hold the Company’s common shares in or in the course of carrying on business in Canada and who otherwise qualifies for the full benefit of the Treaty (a “United States Holder”). Special rules which are not discussed in this summary may apply to a United States Holder that is a financial institution, as defined in the Canadian Tax Act, or an insurer carrying on business in Canada and elsewhere.
This following summary is based on the current provisions of the Treaty, the Canadian Tax Act and the regulations thereunder, all specific proposals to amend the Canadian Tax Act and the regulations announced by the Minister of Finance (Canada) prior to the date hereof and the Company’s understanding of the administrative practices published in writing by the Canada Revenue Agency prior to the date hereof. This summary does not take into account or anticipate any other changes in the governing law, whether by judicial, governmental or legislative decision or action, nor does it take into account the tax legislation or considerations of any province, territory or non-Canadian (including U.S.) jurisdiction, which legislation or considerations may differ significantly from those described herein.
All amounts relevant in computing a United States Holder’s liability under the Canadian Tax Act are to be computed in Canadian currency based on the relevant exchange rate applicable thereto.
This summary is of a general nature only and is not intended to be, and should not be interpreted as legal or tax advice to any prospective purchaser or holder of the Company’s common shares and no representation with respect to the Canadian federal income tax consequences to any such prospective purchaser is made. Accordingly, prospective purchasers and holders of the Company’s common shares should consult their own tax advisors with respect to their particular circumstances.
Dividends on the Company’s Common Shares
Generally, dividends paid or credited by Canadian corporations to non-resident shareholders are subject to a withholding tax of 25% of the gross amount of such dividends. Pursuant to the Treaty, the withholding tax rate on the gross amount of dividends paid or credited to United States Holders is reduced to 15% or, in the case of a United States Holder that is a U.S. corporation that beneficially owns at least 10% of the voting stock of the Canadian corporation paying the dividends, to 5% of the gross amount of such dividends.
Pursuant to the Treaty, certain tax-exempt entities that are United States Holders may be exempt from Canadian withholding taxes, including any withholding tax levied in respect of dividends received on the Company’s common shares.
Disposition of the Company’s Common Shares
In general, a United States Holder will not be subject to Canadian income tax on capital gains arising on the disposition or deemed disposition of the Company’s common shares, unless such shares are “taxable Canadian property” within the meaning of the Canadian Tax Act. Generally, a share listed on a designated stock exchange for purposes of the Canadian Tax Act (which includes the TSX and NASDAQ) will not be “taxable Canadian property” to a United States Holder unless, at any particular time during the 60 month period immediately preceding the disposition (i) 25% or more of the issued shares of any class or series of the particular corporation were owned by: (a) such United States Holder, (b) by persons with whom the United States Holder did not deal at arm’s length, (c) a partnership in which the United States Holder, or persons with whom the United States Holder did not deal at arm’s length, holds a membership interest directly or indirectly through one or more partnerships, or (d) any combination thereof, and (ii) the shares derived more than 50% of their fair market value directly or indirectly from one or any combination of real property situated in Canada, “timber resource property”, “Canadian resource property” (each as defined under the Canadian Tax Act), or options in respect of, or interests or rights in any of the foregoing.
F.Dividends and Paying Agents.
The value of the Company’s common shares is not now, and is not expected to be in the future, derived more than 50% from any of these properties. Consequently, any gain realized by a United States Holder upon the disposition of the Company’s common shares should be exempt from tax under the Canadian Tax Act.
Not Applicable
G.Statement by Experts
Not Applicable
Copies of the documents referred to in this annual report may be inspected, during normal business hours, at the Company’s headquarters located at 30 Worcester Road, Toronto, Ontario, M9W 5X2, Canada.
We are required to file reports and other information with the SEC under the U.S. Exchange Act. Reports and other information filed by us with the SEC may be inspected and copied at the SEC’s public reference facilities located at 100 F Street, N.E. in Washington D.C. The SEC also maintains a website at http://www.sec.gov that contains certain reports and other information that we file electronically with the SEC. As a foreign private issuer, we are exempt from the rules under the U.S. Exchange Act prescribing the furnishing and content of proxy statements and our officers, directors and principal shareholders are exempt from the reporting and short-swing profit recovery provisions contained in Section 16 of the U.S. Exchange Act. Under the U.S. Exchange Act, as a foreign private issuer, we are not required to publish financial statements as frequently or as promptly as United States companies.
See Item 4.C of this annual report.
We are exposed to interest rate risk, which is affected by changes in the general level of interest rates. Due to the fact that the Company’s cash is deposited with major financial institutions in an interest savings account, we do not believe that the results of operations or cash flows would be affected to any significant degree by a sudden change in market interest rates given their relative short-term nature.
Trade accounts receivable potentially subjects the Company to credit risk. The Company provides an allowance for doubtful accounts equal to the estimated losses expected to be incurred in the collection of accounts receivable.
The following table sets forth details of the aged accounts receivable that are not overdue as well as an analysis of overdue amounts and the related allowance for doubtful accounts:
November 30, | November 30, | |
2017 | 2016 | |
$ | $ | |
| Total accounts receivable | 756,468 | 472,474 |
| Less allowance for doubtful accounts | (66,849) | - |
| Total accounts receivable, net | 689,619 | 472,474 |
| Not past due | 689,619 | 427,519 |
| Past due for more than 31 days | ||
| but no more than 60 days | 5,176 | 3,319 |
| Past due for more than 91 days | ||
| but no more than 120 days | 61,673 | 41,636 |
| Total accounts receivable, gross | 756,468 | 472,474 |
Financial instruments that potentially subject the Company to concentration of credit risk consist principally of uncollateralized accounts receivable. The Company’s maximum exposure to credit risk is equal to the potential amount of financial assets. For the year ended November 30, 2017, two customers accounted for substantially all the revenue and all the accounts receivable of the Company. For the year ended November 30, 2016, Par accounted for substantially all the revenue and all the accounts receivable of the Company.
The Company is also exposed to credit risk at period end from the carrying value of its cash. The Company manages this risk by maintaining bank accounts with a Canadian Chartered Bank. The Company’s cash is not subject to any external restrictions.
Foreign exchange risk
We are exposed to changes in foreign exchange rates between the Canadian and U.S. dollar which could affect the value of our cash. The Company had no foreign currency hedges or other derivative financial instruments as of November 30, 2017. The Company did not enter into financial instruments for trading or speculative purposes and does not currently utilize derivative financial instruments.
The Company has balances in Canadian dollars that give rise to exposure to foreign exchange (“FX”) risk relating to the impact of translating certain non-U.S. dollar balance sheet accounts as these statements are presented in U.S. dollars. A strengthening U.S. dollar will lead to a FX loss while a weakening U.S. dollar will lead to a FX gain. For each Canadian dollar balance of $1.0 million, a +/- 10% movement in the Canadian currency held by the Company versus the U.S. dollar would affect the Company’s loss and other comprehensive loss by $0.1 million.
Balances denominated in foreign currencies that are considered financial instruments are as follows:
November 30, 2017 | November 30, 2016 | |||
Canadian | U.S. | Canadian | U.S. | |
| FX rates used to translate to U.S. | 1.2888 | 1.3429 | ||
$ | $ | $ | $ | |
| Assets | ||||
| Cash | 202,277 | 156,950 | 182,714 | 136,059 |
202,277 | 156,950 | 182,714 | 136,059 | |
| Liabilities | ||||
| Accounts payable and accrued liabilities | 1,704,086 | 1,322,227 | 949,911 | 707,358 |
| Employee cost payable | 277,080 | 214,980 | 1,402,108 | 1,044,151 |
| Capital lease | - | - | 19,912 | 14,828 |
1,981,166 | 1,537,207 | 2,371,933 | 1,766,338 | |
| Net exposure | (1,778,889) | (1,380,257) | (2,189,219) | (1,630,278) |
Liquidity risk
Liquidity risk is the risk that the Company will encounter difficulty raising liquid funds to meet commitments as they fall due. In meeting its liquidity requirements, the Company closely monitors its forecasted cash requirements with expected cash drawdown.
The following are the contractual maturities of the undiscounted cash flows of financial liabilities as at November 30, 2017:
November 30, 2017 | ||||||
Less than | 3 to 6 | 6 to 9 | 9 months | Greater than | ||
3 months | months | months | to 1 year | 1 year | Total | |
$ | $ | $ | $ | $ | $ | |
| Third parties | ||||||
| Accounts payable | 2,060,084 | - | - | - | - | 2,060,084 |
| Accrued liabilities | 782,369 | - | - | - | - | 782,369 |
| Related parties | ||||||
| Employee costs payable | 214,980 | - | - | - | - | 214,980 |
| Convertible debenture | 66,973 | 40,805 | 40,805 | 1,363,749 | - | 1,512,332 |
3,124,406 | 40,805 | 40,805 | 1,363,749 | - | 4,569,765 | |
Limitations:
The above discussion includes only those exposures that existed as of November 30, 2017, and, as a result, does not consider exposures or positions that could arise after that date. The Company’s ultimate realized gain or loss with respect to interest rate and exchange rate fluctuations would depend on the exposures that arise during the period and interest and foreign exchange rates.
Item 12.Description of Securities Other than Equity Securities.
Not applicable.
Not applicable.
Not applicable.
None.
PART II.
There have been no material defaults in the payment of any principal or interest owing. Neither the Company nor its subsidiaries has any preferred shares outstanding.
There has been no material modification of the instruments defining the rights of holders of any class of registered securities. There has been no withdrawal or substitution of assets securing any class of registered securities.
Item 15.Controls and Procedures
Internal Control over Financial Reporting
The management of our Company is responsible for establishing and maintaining adequate internal control over financial reporting for the Company. Internal control over financial reporting is a process designed to provide reasonable assurance regarding the reliability of financial reporting and the preparation of financial statements in accordance with generally accepted accounting principles and includes those policies and procedures that (1) pertain to the maintenance of records that, in reasonable detail, accurately and fairly reflect the transactions and dispositions of the Company’s assets, (2) provide reasonable assurance that transactions are recorded as necessary to permit preparation of financial statements in accordance with generally accepted accounting principles, and that the Company’s receipts and expenditures are being made only in accordance with authorizations of the Company’s management and directors, and (3) provide reasonable assurance regarding prevention or timely detection of unauthorized acquisition, use, or disposition of the Company’s assets that could have a material effect on the financial statements.
Management assessed the effectiveness of the Company’s internal control over financial reporting using the 1992 Internal Control-Integrated Framework developed by the Committee of Sponsoring Organizations of the Treadway Commission (“COSO”).
Based on this assessment, management concluded that the Company’s internal control over financial reporting was effective as of November 30, 2017.
In the second quarter of 2017, we initiated the transition from the COSO 1992 Internal Control - Integrated Framework to the COSO 2013 Internal Control - Integrated Framework. Progress thus far has centered on strengthening our risk assessment process as well as our information technology policies and related documentation. We expect this transition to continue for the remainder of fiscal 2018. Although we do not expect to experience significant changes in internal control over financial reporting as a result of our transition, we may identify significant deficiencies or material weaknesses and incur additional costs in the future as a result of our transition.
Disclosure Controls and Procedures
Under the supervision and with the participation of our management, including the Chief Executive Officer and the Chief Financial Officer, we have evaluated the effectiveness of our disclosure controls and procedures as of November 30, 2017. Disclosure controls and procedures are designed to ensure that the information required to be disclosed by the Company in the reports it files or submits under securities legislation is recorded, processed, summarized and reported on a timely basis and that such information is accumulated and communicated to management, including the Company’s Chief Executive Officer and Chief Financial Officer, as appropriate, to allow required disclosures to be made in a timely fashion. Based on that evaluation, management has concluded that these disclosure controls and procedures were effective as of November 30, 2017.
Changes in Internal Control over Financial Reporting
During the year ended November 30, 2017, there were no changes made to the Company’s internal control over financial reporting that have materially affected, or are reasonably likely to materially affect, the Company’s internal control over financial reporting, and specifically, there were no changes in accounting functions, board or related committees and charters, or auditors; no functions, controls or financial reporting processes of any constituent entities were adopted as the Company’s functions, controls and financial processes; and no other significant business processes were implemented.
Attestation of Internal Control over Financial Reporting
This annual report does not include an attestation report of our independent registered public accounting firm regarding internal control over financial reporting for the Company. As the Company is a non-accelerated filer, management’s report is not subject to attestation by our independent registered public accounting firm pursuant to Section 404(c) of the Sarbanes-Oxley Act of 2002.
Item 16.[Reserved]
Our Audit Committee is comprised of Kenneth Keirstead, Bahadur Madhani and Dr. Eldon Smith, each of whom is considered independent and financially literate (as such terms are defined under National Instrument 52-110 – Audit Committee). The members of the Audit Committee have selected a Chair from amongst themselves, being Mr. Madhani.
Under the SEC rules implementing the Sarbanes-Oxley Act of 2002, Canadian issuers filing reports in the United States must disclose whether their audit committees have at least one “audit committee financial expert”. Additionally, under Nasdaq Listing Rule 5605(c)(2)(A), Nasdaq requires that one member of the audit committee have “past employment experience in finance or accounting, requisite professional certification in accounting, or any other comparable experience or background which results in the individual’s financial sophistication, including being or having been a chief executive officer, chief financial officer, or other senior officer with financial oversight responsibilities.” The Board has determined that Mr. Madhani qualifies as an Audit Committee financial expert under the SEC rules and as financially sophisticated under the Nasdaq rules.
The Code of Business Conduct and Ethics (the “Code of Ethics”) has been implemented and it applies to all directors, officers, employees of the Company and its subsidiaries. It may be viewed on our website at www.intellipharmaceutics.com. During the year ended November 30, 2017, no waivers or requests for exemptions from the Code of Ethics were either requested or granted.
Our current auditor is MNP LLP (“MNP”), Independent Registered Public Accounting Firm, 111 Richmond Street West, Suite 300, Toronto, ON M5H 2G4. MNP is independent with respect to the Company within the meaning of the Rules of Professional Conduct of the Chartered Professional Accountants of Ontario, the rules and standards of the Public Company Accounting Oversight Board (United States) and the securities laws and regulations administered by the SEC.
The aggregate amounts billed by MNP to us for the years ended November 30, 2017 and 2016 for audit fees, audit-related fees, tax fees and all other fees are set forth below:
2017 | 2016 | |
| Audit Fees(1) | C$129,342 | - |
| Audit-Related Fees(2) | C$210,791 | C$75,664 |
| Tax Fees(3) | - | - |
| All Other Fees(4) | - | C$24,075 |
| Total Fees | C$340,133 | C$99,739 |
Notes:
(1)
Audit fees consist of fees related to the audit of the Company’s consolidated financial statements.
(2)
Audit-related fees consist of consultation on accounting and disclosure matters and review of quarterly interim financial statements, prospectus and base shelf activities and Form 20-F reviews.
(3)
Tax fees consist of fees for tax consultation, tax advice and tax compliance services for the Company and its subsidiaries.
(4)
All other fees related to internal control reviews.
The Company’s related party pre-approval policies and procedures are described in Item 6.C.
Under applicable Canadian securities regulations, the Company is required to disclose whether its Audit Committee has adopted specific policies and procedures for the engagement of non-audit services and to prepare a summary of these policies and procedures. The Audit Committee’s responsibility is to approve all audit engagement fees and terms as well as reviewing policies for the provision of non-audit services by the external auditors and, when required, the framework for pre-approval of such services. The Audit Committee delegates to its Chairman the pre-approval of such non-audit fees. For each of the years ended November 30, 2017 and 2016, all of the non-audit services provided by the Company’s external auditor were approved by the Chairman of the Audit Committee.
Item 16D. Exemptions from the Listing Standards for Audit Committees.
Not applicable.
Neither the Company nor, to our knowledge, any affiliated purchaser has made any purchases of our registered shares during the last financial year.
The disclosure related to Item 16-F was previously reported, as that term is defined in Rule 12b-2 under the U.S. Exchange Act, in our Form 20-F filed on February 28, 2017.
The Company is the successor issuer to Vasogen Inc. for reporting purposes under the U.S. Exchange Act. Our common shares are currently listed on the TSX and quoted for trading on Nasdaq, in each case under the symbols “IPCI.” Our shares began trading on October 22, 2009, when the IPC Arrangement Agreement with Vasogen was completed.
Variations from Certain Nasdaq Rules
Nasdaq listing rules permit the Company to follow certain home country practices in lieu of compliance with certain Nasdaq corporate governance rules. Set forth below are the requirements of Nasdaqs Rule 5600 Series that the Company does not follow and the home country practices that it follows in lieu thereof and other differences from domestic U.S. companies that apply to us under Nasdaq’s corporate governance rules.
Shareholder Approval in Connection with Certain Transactions: Nasdaq’s Rule 5635 requires each issuer to obtain shareholder approval prior to certain dilutive events, including: (i) a transaction other than a public offering involving the sale under certain circumstances of 20% or more of the issuer’s common shares outstanding prior to the transaction at a price less than the greater of book value or market value, (ii) the acquisition of the stock or assets of another company; (iii) equity-based compensation of officers, directors, employees or consultants and (iv) a change of control. Under the exemption available to foreign private issuers under Nasdaq Rule 5615(a)(3), the Company does not follow Nasdaq Rule 5635. Instead, and in accordance with the Nasdaq exemption, the Company complies with applicable TSX rules and applicable Canadian corporate and securities regulatory requirements.
Independence of the Majority of the Board of Directors; Independent Director Oversight of Executive Compensation and Board Nominations: Nasdaq’s Rule 5605(b)(1) requires that the Board of Directors be comprised of a majority of independent directors, as defined in Rule 5605(a)(2). Nasdaq’s Rule 5605(b)(2) requires the independent members of the Board to regularly hold executive sessions where only those directors are present. Moreover, Nasdaq’s Rule 5605(d) requires independent director oversight of executive officer compensation arrangements by approval of such compensation by a majority of the independent directors or by a compensation committee comprised solely of independent directors, and Rule 5605(e) requires similar oversight with respect to the process of selecting nominees to the Board. Under the exemption available to foreign private issuers under Rule 5615(a)(3), the Company does not follow Nasdaq Rules 5605(b)(1), 5605(d) or 5605(e). Instead, and in accordance with the Nasdaq exemption, the Company complies with the applicable TSX rules and applicable Canadian corporate and securities regulatory requirements.
Disclosure of Waivers of Code of Business Conduct and Ethics: Domestic U.S. Nasdaq listed companies are required under Nasdaq Rule 5610 to disclose any waivers of their codes of conduct for directors or executive officers in a Form 8-K within four business days. As a foreign private issuer we are required to disclose any such waivers either in a Form 6-K or in the Company’s next Form 20-F or 40-F.
Item 16H. Mine Safety Disclosure.
Not applicable.
PART III.
See Item 18 below.
114
Consolidated financial statements of
Intellipharmaceutics
International Inc.
November 30, 2017, 2016 and 2015
Intellipharmaceutics International Inc.
November 30, 2017, 2016 and 2015
Table of contents
| Reports of Independent Registered Public Accounting Firms | 1-2 |
| Consolidated balance sheets | 3 |
| Consolidated statements of operations and comprehensive loss | 4 |
| Consolidated statements of shareholders’ equity (deficiency) | 5 |
| Consolidated statements of cash flows | 6 |
| Notes to the consolidated financial statements | 7-31 |
REPORT OF INDEPENDENT REGISTERED PUBLIC ACCOUNTING FIRM
To the Board of Directors and Shareholders of
Intellipharmaceutics International Inc.
We have audited the accompanying consolidated balance sheets of Intellipharmaceutics International Inc. and its subsidiaries (the “Company”) as of November 30, 2017 and 2016, and the related consolidated statements of operations and comprehensive loss, shareholders’ equity (deficiency) and cash flows, for each of the years in the two-year period ended November 30, 2017. The Company’s management is responsible for these consolidated financial statements. Our responsibility is to express an opinion on these consolidated financial statements based on our audits.
We conducted our audits in accordance with the standards of the Public Company Accounting Oversight Board (United States) and Canadian generally accepted auditing standards. Those standards require that we plan and perform the audit to obtain reasonable assurance about whether the financial statements are free of material misstatement. The Company is not required to have, nor were we engaged to perform, an audit of its internal control over financial reporting. Our audits included consideration of internal control over financial reporting as a basis for designing audit procedures that are appropriate in the circumstances, but not for the purpose of expressing an opinion on the effectiveness of the Company’s internal control over financial reporting. Accordingly, we express no such opinion. An audit also includes examining, on a test basis, evidence supporting the amounts and disclosures in the financial statements, assessing the accounting principles used and significant estimates made by management, as well as evaluating the overall financial statement presentation. We believe that our audits provide a reasonable basis for our opinion.
In our opinion, the consolidated financial statements referred to above present fairly, in all material respects, the financial position of the Company as of November 30, 2017 and 2016, and the results of its operations and its cash flows for each of the years in the two-year period ended November 30, 2017, in conformity with accounting principles generally accepted in the United States of America.
The accompanying consolidated financial statements have been prepared assuming that the Company will continue as a going concern. As discussed in Note 1 to the consolidated financial statements, the Company’s recurring losses from operations raise substantial doubt about its ability to continue as a going concern. Management’s plans concerning these matters are also discussed in Note 1 to the consolidated financial statements. The consolidated financial statements do not include any adjustments that might result from the outcome of this uncertainty.
Other Matters
The consolidated financial statements of Intellipharmaceutics International Inc. and its subsidiaries as at November 30, 2015 and for the year ended November 30, 2015 were audited by another firm of Chartered Professional Accountants who expressed an unqualified opinion in their report dated February 26, 2016.
/s/ MNP LLP | |
Toronto, Canada | Chartered Professional Accountants |
February 15, 2018 | Licensed Public Accountants |
Report of Independent Registered Public Accounting Firm
To the Board of Directors and Shareholders of Intellipharmaceutics International Inc.
We have audited the accompanying consolidated statements of operations and comprehensive loss, cash flows and shareholders’ (deficiency) equity of Intellipharmaceutics International Inc. and subsidiaries (the “Company”) for the year ended November 30, 2015. These consolidated financial statements are the responsibility of the Company’s management. Our responsibility is to express an opinion on these consolidated financial statements based on our audit.
We conducted our audit in accordance with the standards of the Public Company Accounting Oversight Board (United States) and Canadian generally accepted auditing standards. Those standards require that we plan and perform the audit to obtain reasonable assurance about whether the consolidated financial statements are free of material misstatement. An audit includes examining, on a test basis, evidence supporting the amounts and disclosures in the financial statements. An audit also includes assessing the accounting principles used and significant estimates made by management, as well as evaluating the overall financial statement presentation. We believe that our audit provides a reasonable basis for our opinion.
In our opinion, such consolidated financial statements present fairly, in all material respects, the results of the Company’s operations and its cash flows for the year ended November 30, 2015, in conformity with accounting principles generally accepted in the United States of America.
The accompanying consolidated financial statements have been prepared assuming that the Company will continue as a going concern. As discussed in Note 1 to the consolidated financial statements, the Company's recurring losses from operations and shareholders' deficiency raise substantial doubt about its ability to continue as a going concern. Management's plans concerning these matters are also discussed in Note 1 to the consolidated financial statements. The consolidated financial statements do not include any adjustments that might result from the outcome of this uncertainty.
/s/ Deloitte LLP
Chartered Professional Accountants
Licensed Public Accountants
February 26, 2016
| Intellipharmaceutics International Inc. | ||
| Consolidated balance sheets | ||
| As at November 30, 2017 and 2016 | ||
| (Stated in U.S. dollars) | ||
| 2017 | 2016 | |
| $ | $ | |
| Assets | ||
| Current | ||
| Cash | 1,897,061 | 4,144,424 |
| Accounts receivable, net (Note 4) | 689,619 | 472,474 |
| Investment tax credits | 636,489 | 681,136 |
| Prepaid expenses, sundry and other assets | 225,092 | 400,642 |
| Inventory (Note 3) | 115,667 | - |
| 3,563,928 | 5,698,676 | |
| Deferred offering costs (Note 10) | 565,302 | 386,375 |
| Property and equipment, net (Note 5) | 3,267,551 | 1,889,638 |
| 7,396,781 | 7,974,689 | |
| Liabilities | ||
| Current | ||
| Accounts payable | 2,060,084 | 807,295 |
| Accrued liabilities (Note 6) | 782,369 | 384,886 |
| Employee costs payable (Note 8) | 214,980 | 1,044,151 |
| Capital lease obligations (Note 9) | - | 14,829 |
| Convertible debenture (Note 7) | 1,290,465 | 1,494,764 |
| Deferred revenue (Note 3) | 300,000 | 450,000 |
| 4,647,898 | 4,195,925 | |
| Deferred revenue (Note 3) | 2,362,500 | 2,662,500 |
| 7,010,398 | 6,858,425 | |
| Shareholders' equity | ||
| Capital stock (Note 10) | ||
| Authorized | ||
| Unlimited common shares without par value | ||
| Unlimited preference shares | ||
| Issued and outstanding | ||
| 34,704,515 common shares | 35,290,034 | 29,830,791 |
| (November 30, 2016 - 29,789,992) | ||
| Additional paid-in capital | 36,685,387 | 34,017,071 |
| Accumulated other comprehensive income | 284,421 | 284,421 |
| Accumulated deficit | (71,873,459) | (63,016,019) |
| 386,383 | 1,116,264 | |
| Contingencies (Note 16) | ||
| 7,396,781 | 7,974,689 | |
| On behalf of the Board: | ||
| /s/ Dr. Isa Odidi | /s/ Bahadur Madhani | |
| Dr. Isa Odidi, Chairman of the Board | Bahadur Madhani | |
| See accompanying notes to consolidated financial statements | ||
| Intellipharmaceutics International Inc. | |||
| Consolidated statements of operations and comprehensive loss | |||
| for the years ended November 30, 2017, 2016 and 2015 | |||
| (Stated in U.S. dollars) | |||
| 2017 | 2016 | 2015 | |
$ | $ | $ | |
| Revenues | |||
| Licensing (Note 3) | 5,025,350 | 2,209,502 | 4,093,781 |
| Up-front fees (Note 3) | 479,102 | 37,500 | - |
| 5,504,452 | 2,247,002 | 4,093,781 | |
| Cost of goods sold | 704,006 | - | - |
| Gross Margin | 4,800,446 | 2,247,002 | 4,093,781 |
| Expenses | |||
| Research and development | 9,271,353 | 8,166,736 | 7,247,473 |
| Selling, general and administrative | 3,287,914 | 3,546,132 | 3,581,913 |
| Depreciation (Note 5) | 506,961 | 385,210 | 377,849 |
13,066,228 | 12,098,078 | 11,207,235 | |
| Loss from operations | (8,265,782) | (9,851,076) | (7,113,454) |
| Net foreign exchange (loss) gain | (80,093) | (22,470) | 46,211 |
| Interest income | 15,037 | 207 | 1,507 |
| Interest expense | (389,239) | (270,238) | (256,629) |
| Financing cost (Note 10) | (137,363) | - | - |
| Extinguishment loss (Note 7) | - | - | (114,023) |
| Net loss and comprehensive loss | (8,857,440) | (10,143,577) | (7,436,388) |
| Loss per common share, basic and diluted | (0.29) | (0.38) | (0.31) |
| Weighted average number of common | |||
| shares outstanding, basic and diluted | 31,014,482 | 26,699,579 | 23,767,677 |
| See accompanying notes to consolidated financial statements | |||
Intellipharmaceutics International Inc. | ||||||
Consolidated statements of shareholders' equity (deficiency) | ||||||
for the years ended November 30, 2017, 2016 and 2015 | ||||||
| (Stated in U.S. dollars) | ||||||
| Accumulated | Total | |||||
| Additional | other | shareholders' | ||||
| Capital stock | paid-in | comprehensive | Accumulated | equity | ||
| Number | amount | capital | income | deficit | (deficiency) | |
| $ | $ | $ | $ | $ | ||
| Balance, November 30, 2014 | 23,456,611 | 18,941,067 | 31,119,930 | 284,421 | (45,436,054) | 4,909,364 |
| DSU's to non-management board members (Note 12) | - | - | 29,056 | - | - | 29,056 |
| Stock options to employees (Note 11) | - | - | 417,818 | - | - | 417,818 |
| Shares issued for options exercised (Note 11) | 91,000 | 300,869 | (132,907) | - | - | 167,962 |
| Proceeds from at-the-market financing (Note 10) | 471,439 | 1,290,168 | - | - | - | 1,290,168 |
| Share issuance cost (Note 10) | - | (78,166) | - | - | - | (78,166) |
| Issuance of shares on exercise of warrants (Note 14) | 225,000 | 1,027,304 | (464,804) | - | - | 562,500 |
| Net loss | - | - | - | - | (7,436,388) | (7,436,388) |
| 787,439 | 2,540,175 | (150,837) | - | (7,436,388) | (5,047,050) | |
| Balance, November 30, 2015 | 24,244,050 | 21,481,242 | 30,969,093 | 284,421 | (52,872,442) | (137,686) |
| DSU's to non-management board members (Note 12) | - | - | 31,628 | - | - | 31,628 |
| Stock options to employees (Note 11) | - | - | 2,261,444 | - | - | 2,261,444 |
| Shares issued for options exercised (Note 11) | 27,500 | 87,259 | (34,391) | - | - | 52,868 |
| Proceeds from at-the-market financing (Note 10) | 1,471,260 | 3,469,449 | - | - | - | 3,469,449 |
| Proceeds from issuance of shares and warrants (Note 10 & 14) | 3,689,270 | 4,764,777 | 1,175,190 | - | - | 5,939,967 |
| Share issuance cost (Note 10) | - | (1,002,655) | (158,736) | - | - | (1,161,391) |
| Issuance of shares on exercise of warrants (Note 14) | 357,912 | 1,030,719 | (330,066) | - | - | 700,653 |
| Modification of convertible debt (Note 7) | - | - | 102,909 | - | - | 102,909 |
| Net loss | - | - | - | - | (10,143,577) | (10,143,577) |
| 5,545,942 | 8,349,549 | 3,047,978 | - | (10,143,577) | 1,253,950 | |
| Balance, November 30, 2016 | 29,789,992 | 29,830,791 | 34,017,071 | 284,421 | (63,016,019) | 1,116,264 |
| DSU's to non-management board members (Note 12) | - | - | 30,355 | - | - | 30,355 |
| Stock options to employees (Note 11) | - | - | 1,749,999 | - | - | 1,749,999 |
| Shares issued for options exercised (Note 11) | 2,000 | 1,100 | 642 | - | - | 1,742 |
| Proceeds from at-the-market financing (Note 10) | 1,108,150 | 2,541,640 | - | - | - | 2,541,640 |
Proceeds from issuance of shares and warrants (Note 10 & 14) | 3,636,364 | 3,257,445 | 742,555 | - | - | 4,000,000 |
| Cost of warrants issued to placement agent (Note 14) | - | (86,196) | 86,196 | - | - | - |
| Share issuance cost (Note 10) | - | (685,319) | (108,912) | - | - | (794,231) |
| Issuance of shares on exercise of warrants (Note 14) | 168,009 | 430,573 | (106,315) | - | - | 324,258 |
| Modification of convertible debt (Note 7) | - | - | 273,796 | - | - | 273,796 |
| Net loss | - | - | - | - | (8,857,440) | (8,857,440) |
| 4,914,523 | 5,459,243 | 2,668,316 | - | (8,857,440) | (729,881) | |
| Balance, November 30, 2017 | 34,704,515 | 35,290,034 | 36,685,387 | 284,421 | (71,873,459) | 386,383 |
See accompanying notes to consolidated financial statements | ||||||
| Intellipharmaceutics International Inc. | |||
| Consolidated statements of cash flows | |||
| for the years ended November 30, 2017, 2016 and 2015 | |||
| (Stated in U.S. dollars) | |||
| 2017 | 2016 | 2015 | |
$ | $ | $ | |
| Net loss | (8,857,440) | (10,143,577) | (7,436,388) |
| Items not affecting cash | |||
| Depreciation (Note 5) | 520,838 | 385,210 | 377,849 |
| Stock-based compensation (Note 11) | 1,749,999 | 2,261,444 | 417,818 |
| Deferred share units (Note 12) | 30,355 | 31,628 | 29,056 |
| Accreted interest (Note 7) | 219,497 | 79,245 | 27,103 |
| Loss on extinguishment (Note 7) | - | - | 114,023 |
| Financing cost (Note 10) | 137,363 | - | - |
| Provision for doubtful debts (Note 4) | 66,849 | - | - |
| Unrealized foreign exchange loss (gain) | 56,998 | 22,916 | (81,063) |
| Change in non-cash operating assets & liabilities | |||
| Accounts receivable | (283,994) | 6,200 | 532,459 |
| Investment tax credits | 44,647 | (223,115) | (133,035) |
| Prepaid expenses, sundry and other assets | 175,550 | (171,417) | 185,438 |
| Inventory | (115,667) | - | - |
| Accounts payable, accrued liabilities and employee costs payable | 599,220 | (1,466,019) | 2,034,576 |
| Deferred revenue | (450,000) | 2,962,500 | 150,000 |
| Cash flows used in operating activities | (6,105,785) | (6,254,985) | (3,782,164) |
| Financing activities | |||
| Repayment of convertible debenture (Note 7) | (150,000) | - | - |
| Repayment of capital lease obligations | (14,829) | (21,291) | (27,489) |
| Issuance of shares on exercise of stock options (Note 11) | 1,742 | 52,868 | 167,962 |
| Issuance of common shares on at-the-market financing, gross (Note 10) | 2,541,640 | 3,469,449 | 1,290,168 |
| Proceeds from issuance of shares and warrants (Note 10) | 4,000,000 | 5,939,967 | - |
| Proceeds from issuance of shares on exercise of warrants (Note 14) | 324,258 | 700,653 | 562,500 |
| Offering costs | (1,020,643) | (982,023) | (259,276) |
| Cash flows provided from financing activities | 5,682,168 | 9,159,623 | 1,733,865 |
| Investing activity | |||
| Purchase of property and equipment (Note 5) | (1,823,746) | (515,410) | (430,480) |
| Cash flows used in investing activities | (1,823,746) | (515,410) | (430,480) |
| (Decrease) Increase in cash | (2,247,363) | 2,389,228 | (2,478,779) |
| Cash, beginning of year | 4,144,424 | 1,755,196 | 4,233,975 |
| Cash, end of year | 1,897,061 | 4,144,424 | 1,755,196 |
| Supplemental cash flow information | |||
| Interest paid | 123,204 | 165,585 | 179,878 |
| Taxes paid | - | - | - |
| See accompanying notes to consolidated financial statements |
Intellipharmaceutics International Inc.
Notes to the consolidated financial statements
November 30, 2017, 2016 and 2015
(Stated in U.S. dollars)
1.
Nature of operations
Intellipharmaceutics International Inc. (“IPC” or the “Company”) is a pharmaceutical company specializing in the research, development and manufacture of novel and generic controlled-release and targeted-release oral solid dosage drugs.
On October 22, 2009, IntelliPharmaCeutics Ltd. (“IPC Ltd. “) and Vasogen Inc. (“Vasogen”) completed a court approved plan of arrangement and merger (the “IPC Arrangement Agreement”), resulting in the formation of the Company, which is incorporated under the laws of Canada. The Company’s common shares are traded on the Toronto Stock Exchange and NASDAQ.
The Company earns revenue from non-refundable upfront fees, milestone payments upon achievement of specified research or development, exclusivity milestone payments and licensing and cost plus payments on sales of resulting products and other incidental services. In November 2013, the U.S. Food and Drug Administration (“FDA”) granted the Company final approval to market the Company’s first product, the 15 mg and 30 mg strengths of the Company’s generic Focalin XR® (dexmethylphenidate hydrochloride extended-release) capsules. In 2017, the FDA granted final approval for the remaining 6 (six) strengths, all of which have been launched. In May 2017, the FDA granted the Company final approval for its second commercialized product, the 50, 150, 200, 300 and 400 mg strengths of generic Seroquel XR® (quetiapine fumarate extended release) tablets, and the Company commenced shipment of all strengths that same month.
Going concern
The consolidated financial statements are prepared on a going concern basis, which assumes that the Company will be able to meet its obligations and continue its operations for the next twelve months. The Company has incurred losses from operations since inception and has reported losses of $8,857,440 for the year ended November 30, 2017 (2016 - $10,143,577; 2015 - $7,436,388), and has an accumulated deficit of $71,873,459 as at November 30, 2017 (November 30, 2016 - $63,016,019). The Company also has a working capital deficiency of $1,083,970 as at November 30, 2017. The Company has funded its research and development (“R&D”) activities principally through the issuance of securities, loans from related parties, funds from the IPC Arrangement Agreement, and funds received under development agreements. There is no certainty that such funding will be available going forward. These conditions raise substantial doubt about its ability to continue as a going concern and realize its assets and pay its liabilities as they become due.
In order for the Company to continue as a going concern and fund any significant expansion of its operation or R&D activities, the Company may require significant additional capital. Although there can be no assurances, such funding may come from revenues from the sales of the Company’s generic Focalin XR® (dexmethylphenidate hydrochloride extended-release) capsules, from revenues from the sales of the Company’s generic Seroquel XR® (quetiapine fumarate extended-release) tablets, from proceeds of the Company’s at-the-market offering program and from potential partnering opportunities. Other potential sources of capital may include payments from licensing agreements, cost savings associated with managing operating expense levels, other equity and/or debt financings, and/or new strategic partnership agreements which fund some or all costs of product development. The Company’s ultimate success will depend on whether its product candidates receive the approval of the FDA or Health Canada and whether it is able to successfully market approved products. The Company cannot be certain that it will be able to receive FDA or Health Canada approval for any of its current or future product candidates, or that it will reach the level of sales and revenues necessary to achieve and sustain profitability, or that the Company can secure other capital sources on terms or in amounts sufficient to meet its needs at all.
The availability of equity or debt financing will be affected by, among other things, the results of the Company’s R&D, its ability to obtain regulatory approvals, its success in commercializing approved products with its commercial partners and the market acceptance of its products, the state of the capital markets generally, strategic alliance agreements, and other relevant commercial considerations. In addition, if the Company raises additional funds by issuing equity securities, its then existing security holders will likely experience dilution, and the incurring of indebtedness would result in increased debt service obligations and could require the Company to agree to operating and financial covenants that
Notes to the consolidated financial statements
November 30, 2017, 2016 and 2015
(Stated in U.S. dollars)
1.
Nature of operations (continued)
Going concern (continued)
would restrict its operations. Any failure on its part to successfully commercialize approved products or raise additional funds on terms favorable to the Company or at all, may require the Company to significantly change or curtail its current or planned operations in order to conserve cash until such time, if ever, that sufficient proceeds from operations are generated, and could result in the Company not taking advantage of business opportunities, in the termination or delay of clinical trials or the Company not taking any necessary actions required by the FDA or Health Canada for one or more of the Company’s product candidates, in curtailment of the Company’s product development programs designed to identify new product candidates, in the sale or assignment of rights to its technologies, products or product candidates, and/or its inability to file Abbreviated New Drug Applications (“ANDAs”), Abbreviated New Drug Submissions (“ANDSs”) or New Drug Applications (“NDAs”) at all or in time to competitively market its products or product candidates.
The consolidated financial statements do not include any adjustments that might result from the outcome of uncertainties described above. If the going concern assumption no longer becomes appropriate for these consolidated financial statements, then adjustments would be necessary to the carrying values of assets and liabilities, the reported expenses and the balance sheet classifications used. Such adjustments could be material.
2.
Basis of presentation
(a)
Basis of consolidation
These consolidated financial statements include the accounts of the Company and its wholly owned operating subsidiaries, IPC Ltd., Intellipharmaceutics Corp. (“IPC Corp”), and Vasogen Corp.
All inter-company accounts and transactions have been eliminated on consolidation.
(b)
Use of estimates
The preparation of the consolidated financial statements in conformity with accounting principles generally accepted in the United States of America (“U.S. GAAP”) requires management to make estimates and assumptions that affect the reported amounts of assets and liabilities and disclosure of contingent assets and liabilities at the date of the financial statements and the reported amounts of revenue and expenses during the year. Actual results could differ from those estimates.
Areas where significant judgment is involved in making estimates are: the determination of the functional currency; the fair values of financial assets and liabilities; the determination of units of accounting for revenue recognition; the accrual of licensing and milestone revenue; and forecasting future cash flows for assessing the going concern assumption.
3.
Significant accounting policies
(a)
Cash and cash equivalents
The Company considers all highly liquid securities with an original maturity of three months or less to be cash equivalents. Cash equivalent balances consist of bankers’ acceptances and bank accounts with variable market rates of interest. As at November 30, 2017 and 2016, the Company had no cash equivalents.
The financial risks associated with these instruments are minimal and the Company has not experienced any losses from investments in these securities. The carrying amount of cash approximates its fair value due to its short-term nature.
(b)
Accounts receivable
The Company reviews its sales and accounts receivable aging and determines whether an allowance for doubtful accounts is required.
Notes to the consolidated financial statements
November 30, 2017, 2016 and 2015
(Stated in U.S. dollars)
3.
Significant accounting policies (continued)
(c) Financial instruments
The Company evaluates all of its financial instruments to determine if such instruments are derivatives or contain features that qualify as embedded derivatives. For derivative financial instruments that are classified as liabilities, the derivative instrument is initially recorded at its fair value using the appropriate valuation methodology and is then re-valued at each reporting date, with changes in the fair value reported in the consolidated statements of operations and comprehensive loss.
(d) Investment tax credits
The investment tax credits (“ITC") receivable are amounts considered recoverable from the Canadian federal and provincial governments under the Scientific Research & Experimental Development (“SR&ED”) incentive program. The amounts claimed under the program represent the amounts based on management estimates of eligible research and development costs incurred during the year. Realization is subject to government approval. Any adjustment to the amounts claimed will be recognized in the year in which the adjustment occurs. Refundable ITCs claimed relating to capital expenditures are credited to property and equipment. Refundable ITCs claimed relating to current expenditures are netted against research and development expenditures.
(e) Property and equipment
Property and equipment are recorded at cost. Equipment acquired under capital leases are recorded net of imputed interest, based upon the net present value of future payments. Assets under capital leases are pledged as collateral for the related lease obligation. Repairs and maintenance expenditures are charged to operations; major betterments and replacements are capitalized. Depreciation bases and rates are as follows:
| Assets | Basis | Rate |
| Computer equipment | Declining balance | 30% |
| Computer software | Declining balance | 50% |
| Furniture and fixtures | Declining balance | 20% |
| Laboratory equipment | Declining balance | 20% |
| Leasehold improvements | Straight line | Over term of lease |
Leasehold improvements and assets acquired under capital leases are depreciated over the term of their useful lives or the lease period, whichever is shorter. The charge to operations resulting from depreciation of assets acquired under capital leases is included with depreciation expense.
(f) Impairment of long-lived assets
Long-lived assets are reviewed for impairment when events or circumstances indicate that the carrying value of an asset may not be recoverable. For assets that are to be held and used, impairment is recognized when the sum of estimated undiscounted cash flows associated with the asset or group of assets is less than its carrying value. If impairment exists, an adjustment is made to write the asset down to its fair value, and a loss is recorded as the difference between the carrying value and fair value.
(g) Warrants
The Company previously issued warrants as described in Notes 10 and 14. In fiscal 2013, the outstanding warrants were presented as a liability because they did not meet the criteria of Accounting Standard Codification (“ASC”) topic 480 Distinguishing Liabilities from Equity for equity classification. Subsequent changes in the fair value of the warrants were recorded in the consolidated statements of operations and comprehensive loss. The Company changed its functional currency effective December 1, 2013 such that these warrants met the criteria for prospective equity classification in ASC topic 480, and the U.S. dollar translated amount of the warrant liability at December 1, 2013 became the amount reclassified to equity.
Intellipharmaceutics International Inc.
Notes to the consolidated financial statements
November 30, 2017, 2016 and 2015
(Stated in U.S. dollars)
3.
Significant accounting policies (continued)
(h) Convertible debenture
In fiscal 2013, the Company issued an unsecured convertible debenture in the principal amount of $1.5 million (the “Debenture”) as described in Note 7. At issuance, the conversion option was bifurcated from its host contract and the fair value of the conversion option was characterized as an embedded derivative upon issuance as it met the criteria of ASC topic 815 Derivatives and Hedging. Subsequent changes in the fair value of the embedded derivative were recorded in the consolidated statements of operations and comprehensive loss. The proceeds received from the Debenture less the initial amount allocated to the embedded derivative were allocated to the liability and were accreted over the life of the Debenture using the imputed rate of interest. The Company changed its functional currency effective December 1, 2013 such that the conversion option no longer met the criteria for bifurcation and was prospectively reclassified to shareholders’ equity under ASC Topic 815 at the U.S. dollar translated amount at December 1, 2013.
(i) Revenue recognition
The Company accounts for revenue in accordance with the provisions of ASC topic 605 Revenue Recognition. The Company earns revenue from non-refundable upfront fees, milestone payments upon achievement of specified research or development, exclusivity milestone payments and licensing payments on sales of resulting products and other incidental services. Revenue is realized or realizable and earned when persuasive evidence of an arrangement exists, delivery has occurred or services have been rendered, the price to the customer is fixed or determinable, and collectability is reasonably assured. From time to time, the Company enters into transactions that represent multiple-element arrangements. Management evaluates arrangements with multiple deliverables to determine whether the deliverables represent one or more units of accounting for the purpose of revenue recognition.
A delivered item is considered a separate unit of accounting if the delivered item has stand-alone value to the customer, the fair value of any undelivered items can be reliably determined, and the delivery of undelivered items is probable and substantially in the Company's control.
The relevant revenue recognition accounting policy is applied to each separate unit of accounting.
Licensing
The Company recognizes revenue from the licensing of the Company's drug delivery technologies, products and product candidates. Licensing revenue is recognized as earned in accordance with the contract terms when the amounts can be reasonably estimated and collectability is reasonably assured.
The Company has a license and commercialization agreement with Par Pharmaceutical Inc. (“Par”). Under the exclusive territorial license rights granted to Par, the agreement requires that Par manufacture, promote, market, sell and distribute the product. Licensing revenue amounts receivable by the Company under this agreement are calculated and reported to the Company by Par, with such amounts generally based upon net product sales and net profit which include estimates for chargebacks, rebates, product returns, and other adjustments. Licensing revenue payments received by the Company from Par under this agreement are not subject to further deductions for chargebacks, rebates, product returns, and other pricing adjustments. Based on this arrangement and the guidance per ASC topic 605, the Company records licensing revenue as earned in the consolidated statements of operations and comprehensive loss.
The Company also has a license and commercial supply agreement with Mallinckrodt LLC (“Mallinckrodt”) which provides Mallinckrodt an exclusive license to market sell and distribute in the U.S. three drug product candidates for which the Company has ANDAs filed with the FDA. Under the terms of this agreement, the Company is responsible for the manufacture of approved products for subsequent sale by Mallinckrodt in the U.S. market, one of which (the Company’s generic Seroquel XR®) received final approval from the FDA in 2017. Following receipt of final FDA approval for its generic Seroquel XR®, the Company began shipment of manufactured product to Mallinckrodt.
Intellipharmaceutics International Inc.
Notes to the consolidated financial statements
November 30, 2017, 2016 and 2015
(Stated in U.S. dollars)
3.
Significant accounting policies (continued)
Licensing (continued)
Licensing revenue in respect of manufactured product is reported as revenue in accordance with ASC topic 605. Once product is sold by Mallinckrodt, the Company receives downstream licensing revenue amounts calculated and reported by Mallinckrodt, with such amounts generally based upon net product sales and net profit which includes estimates for chargebacks, rebates, product returns, and other adjustments. Such downstream licensing revenue payments received by the Company under this agreement are not subject to further deductions for chargebacks, rebates, product returns, and other pricing adjustments. Based on this agreement and the guidance per ASC topic 605, the Company records licensing revenue as earned in the consolidated statements of operations and comprehensive loss.
Milestones
The milestone method recognizes revenue on substantive milestone payments in the period the milestone is achieved. Milestones are considered substantive if all of the following conditions are met: (i) the milestone is commensurate with either the vendor’s performance to achieve the milestone or the enhancement of the value of the delivered item or items as a result of a specific outcome resulting from the vendor’s performance to achieve the milestone; (ii) the milestone relates solely to past performance; and (iii) the milestone is reasonable relative to all of the deliverables and payment terms within the arrangement. Non-substantive milestone payments that might be paid to the Company based on the passage of time or as a result of a partner’s performance are allocated to the units of accounting within the arrangement; they are recognized as revenue in a manner similar to those units of accounting.
Research and development
Under arrangements where the license fees and research and development activities can be accounted for as a separate unit of accounting, non-refundable upfront license fees are deferred and recognized as revenue on a straight-line basis over the expected term of the Company's continued involvement in the research and development process.
Deferred revenue
Deferred revenue represents the funds received from clients, for which the revenues have not yet been earned, as the milestones have not been achieved, or in the case of upfront fees for drug development, where the work remains to be completed. During the year ended November 30, 2016, the Company received an up-front payment of $3,000,000 from Mallinckrodt pursuant to the Mallinckrodt license and commercial supply agreement, and initially recorded it as deferred revenue, as it did not meet the criteria for recognition. For the year ended November 30, 2017, the Company recognized $300,000 (2016 - $37,500) of revenue based on a straight-line basis over the expected term of the Mallinckrodt agreement of 10 years. In 2015, the Company received an up-front payment of $150,000 from Teva Pharmaceuticals USA, Inc. which the Company recognized as revenue during the year ended November 30, 2017.
As of November 30, 2017, the Company has recorded a deferred revenue balance of $2,662,500 (November 30, 2016 - $3,112,500) relating to the underlying contracts, of which $300,000 (November 30, 2016 - $450,000) is considered a current portion of deferred revenue.
Other incidental services
Incidental services which the Company may provide from time to time include consulting advice provided to other organizations regarding FDA standards. Revenue is earned and realized when all of the following conditions are met: (i) there is persuasive evidence of an arrangement; (ii) service has been rendered; (iii) the sales price is fixed or determinable; and (iv) collectability is reasonably assured.
Intellipharmaceutics International Inc.
Notes to the consolidated financial statements
November 30, 2017, 2016 and 2015
(Stated in U.S. dollars)
3.
Significant accounting policies (continued)
(j)
Research and development costs
Research and development costs related to continued research and development programs are expensed as incurred in accordance with ASC topic 730. However, materials and equipment are capitalized and amortized over their useful lives if they have alternative future uses.
(k)
Inventory
Inventories comprise raw material, work in process, and finished goods, which are valued at the lower of cost or market, on a first-in, first-out basis. Cost for work in process and finished goods inventories includes materials, direct labor, and an allocation of manufacturing overhead. Market for raw materials is replacement cost, and for work in process and finished goods is net realizable value. The Company evaluates the carrying value of inventories on a regular basis, taking into account such factors as historical and anticipated future sales compared with quantities on hand, the price the Company expects to obtain for products in their respective markets compared with historical cost and the remaining shelf life of goods on hand. As of November 30, 2017, the Company had raw materials inventories of $115,667 relating to the Company’s generic Seroquel XR® product. The recoverability of the cost of any pre-launch inventories with a limited shelf life is evaluated based on the specific facts and circumstances surrounding the timing of the anticipated product launch.
(l)
Income taxes
The Company uses the liability method of accounting for income taxes. Under the liability method, deferred tax assets and liabilities are recognized for the future tax consequences attributable to differences between the financial statement carrying amounts of existing assets and liabilities and their respective tax bases and for losses and tax credit carry forwards. Significant judgment is required in determining whether deferred tax assets will be realized in full or in part. Deferred tax assets and liabilities are measured using enacted tax rates expected to apply to taxable income in the years in which those temporary differences are expected to be recovered or settled. The effect on deferred tax assets and liabilities of a change in tax rates is recognized in income in the year that includes the date of enactments. A valuation allowance is provided for the portion of deferred tax assets that is more likely than not to remain unrealized.
The Company accounts for income taxes in accordance with ASC topic 740-10. This ASC topic requires that uncertain tax positions are evaluated in a two-step process, whereby (i) the Company determines whether it is more likely than not that the tax positions will be sustained based on the technical merits of the position and (ii) those tax positions that meet the more likely than not recognition threshold, the Company would recognize the largest amount of tax benefit that is greater than 50% likely of being realized upon ultimate settlement with the related tax authority. Changes in recognition or measurement are reflected in the period in which the change in judgment occurs. The cumulative effects of the application of the provisions of ASC topic 740-10 are described in Note 15.
The Company records any interest related to income taxes in interest expense and penalties in selling, general and administrative expense.
(m)
Share issue costs
Share issue costs are recorded as a reduction of the proceeds from the issuance of capital stock.
(n)
Translation of foreign currencies
Transactions denominated in currencies other than the Company and its wholly owned operating subsidiaries’ functional currencies, the monetary assets and liabilities are translated at the period end rates. Revenue and expenses are translated at rates of exchange prevailing on the transaction dates. All of the exchange gains or losses resulting from these other transactions are recognized in the consolidated statements of operations and comprehensive loss.
The Company’s functional and reporting currency is the U.S. dollar.
Intellipharmaceutics International Inc.
Notes to the consolidated financial statements
November 30, 2017, 2016 and 2015
(Stated in U.S. dollars)
3.
Significant accounting policies (continued)
(o)
Stock-based compensation
The Company has a stock-based compensation plan which authorizes the granting of various equity-based incentives including stock options and restricted share units (“RSU”s). The Company calculates stock-based compensation using the fair value method, under which the fair value of the options at the grant date is calculated using the Black-Scholes Option Pricing Model, and subsequently expensed over the vesting period of the option. The provisions of the Company's stock-based compensation plans do not require the Company to settle any options by transferring cash or other assets, and therefore the Company classifies the awards as equity. Stock-based compensation expense recognized during the year is based on the value of stock-based payment awards that are ultimately expected to vest.
The Company estimates forfeitures at the time of grant and are revised, if necessary, in subsequent periods if actual forfeitures differ from those estimates. The stock-based compensation expense is recorded in the consolidated statements of operations and comprehensive loss under research and development expense and under selling, general and administration expense. Note 11 provides supplemental disclosure of the Company's stock options.
(p)
Deferred Share Units
Deferred Share Units (“DSU”s) are valued based on the trading price of the Company’s common shares on the Toronto Stock Exchange. The Company records the value of the DSU’s owing to non-management board members in the consolidated statement of shareholders’ equity (deficiency).
Loss per share
Basic loss per share (“EPS”) is computed by dividing the loss attributable to common shareholders by the weighted average number of common shares outstanding. Diluted EPS reflects the potential dilution that could occur from common shares issuable through the exercise or conversion of stock options, restricted stock awards, warrants and convertible securities. In certain circumstances, the conversion of options, warrants and convertible securities are excluded from diluted EPS if the effect of such inclusion would be anti-dilutive.
The dilutive effect of stock options is determined using the treasury stock method. Stock options and warrants to purchase 9,807,909, 7,540,266 7,128,082 and 7,149,2837,128,082 common shares of the Company during fiscal 2017, 2016, 2015, and 2014,2015, respectively, were not included in the computation of diluted EPS because the Company has incurred a loss for the years ended November 30, 2017, 2016 2015 and 20142015 as the effect would be anti-dilutive.
Comprehensive loss
The Company follows ASC topic 220. This statement establishes standards for reporting and display of comprehensive (loss) income and its components. Comprehensive loss is net loss plus certain items that are recorded directly to shareholders' equity. Other than foreign exchange gains and losses arising from cumulative translation adjustments, the Company has no other comprehensive loss items.
Fair value measurement
Under ASC topic 820, fair value is defined as the price that would be received to sell an asset or paid to transfer a liability in an orderly transaction between market participants at the measurement date (i.e., an exit price). ASC topic 820 establishes a hierarchy for inputs to valuation techniques used in measuring fair value that maximizes the use of observable inputs and minimizes the use of unobservable inputs by requiring that the most observable inputs be used when available. Observable inputs are inputs that reflect assumptions market participants would use in pricing the asset or liability developed based on market data obtained from sources independent of the Company. Unobservable inputs are inputs that reflect the Company's own assumptions about the assumptions market participants would use in pricing the asset or liability developed based on the
Intellipharmaceutics International Inc.
Notes to the consolidated financial statements
November 30, 2017, 2016 and 2015
(Stated in U.S. dollars)
3.
Significant accounting policies (continued)
(s)
Fair value measurement (continued)
best information available in the circumstances. There are three levels to the hierarchy based on the reliability of inputs, as follows:
●
Level 1 - Observable inputs that reflect quoted prices (unadjusted) for identical assets or liabilities in active markets.
●
Level 2 - Inputs other than quoted prices included in Level 1 that are observable for the asset or liability, either directly or indirectly. Level 2 inputs include quoted prices for similar assets or liabilities in active markets, or quoted prices for identical or similar assets and liabilities in markets that are not active.
●
Level 3 - Unobservable inputs for the asset or liability.
The degree of judgment exercised by the Company in determining fair value is greatest for instruments categorized in Level 3.
Future Accountingaccounting pronouncements
In May 2014, the Financial Accounting Standards Board ("FASB") issued Accounting Standards Update (“ASU”) No. 2014-09, Revenue from Contracts with Customers, requiring an entity to recognize the amount of revenue to which it expects to be entitled for the transfer of promised goods or services to customers. The updated standard will replace most existing revenue recognition guidance in U.S. GAAP when it becomes effective.
In March 2016, the FASB issued ASU No. 2016-08 to clarify the implementation guidance on considerations of whether an entity is a principal or an agent, impacting whether an entity reports revenue on a gross or net basis. In April 2016, the FASB issued ASU No. 2016-10 to clarify guidance on identifying performance obligations and the implementation guidance on licensing. In May 2016, the FASB issued amendments ASU No. 2016-11 and 2016-12 to amend certain aspects of the new revenue guidance (including transition, collectability, noncash consideration and the presentation of sales and other similar taxes) and provided certain practical expedients. The guidance is effective for annual reporting periods beginning after December 15, 2017 (including interim reporting periods). Early adoption is permitted but not before the annual reporting period (and interim reporting period) beginning January 1, 2017. Entities have the option of using either a full retrospective or a modified approach to adopt the guidance. The Company is in the process of evaluating the amendments to determine if they have a material impact on the Company’s financial position, results of operations, cash flows or disclosures.
In January 2016, the FASB issued ASU No. 2016-01, which makes limited amendments to the guidance in U.S. GAAP on the classification and measurement of financial instruments. The new standard significantly revises an entity’s accounting related to (1) the classification and measurement of investments in equity securities and (2) the presentation of certain fair value changes for financial liabilities measured at fair value. It also amends certain disclosure requirements associated with the fair value of financial instruments. ASU No. 2016-01 is effective for fiscal years beginning after December 15, 2017, and interim periods within those annual periods. The Company is in the process of evaluating the amendments to determine if they have a material impact on the Company’s financial position, results of operations, cash flows or disclosures.
In February 2016, the FASB issued new guidance, ASU No. 2016-02, Leases (Topic 842). The main difference between current U.S. GAAP and the new guidance is the recognition of lease liabilities based on the present value of remaining lease payments and corresponding lease assets for operating leases under current U.S. GAAP with limited exception. Additional qualitative and quantitative disclosures are also required by the new guidance. Topic 842 is effective for annual reporting periods (including interim reporting periods) beginning after December 15, 2018. Early adoption is permitted. The Company is in the process of evaluating the amendments to determine if they have a material impact on the Company’s financial position, results of operations, cash flows or disclosures.
Intellipharmaceutics International Inc.
Notes to the consolidated financial statements
November 30, 2017, 2016 and 2015
(Stated in U.S. dollars)
3.
Significant accounting policies (continued)
(t)
Future accounting pronouncements (continued)
In August 2016, the FASB issued ASU 2016-15, Statement of Cash Flows (Topic 230) Classification of Certain Cash Receipts and Cash Payments, which will make eight targeted changes to how cash receipts and cash payments are presented and classified in the Statement of Cash Flows. ASU 2016-15 will be effective on May 1, 2018 and will require adoption on a retrospective basis unless it is impracticable to apply, in which case the Company would be required to apply the amendments prospectively as of the earliest date practicable. The Company is in the process of evaluating the amendments to determine if they have a material impact on the Company’s financial position, results of operations, cash flows or disclosures.
In August 2016, the FASB issued ASU 2017-01 that changes the definition of a business to assist entities with evaluating when a set of transferred assets and activities is a business. The guidance requires an entity to evaluate if substantially all of the fair value of the gross assets acquired is concentrated in a single identifiable asset or a group of similar identifiable assets; if so, the set of transferred assets and activities is not a business. ASU 2017-01 also requires a business to include at least one substantive process and narrows the definition of outputs by more closely aligning it with how outputs are described in ASC 606.1. ASU 2017-01 is effective for public business entities for fiscal years beginning after December 15, 2017, and interim periods within those years. Early adoption is permitted. The Company is in the process of evaluating the amendments to determine if they have a material impact on the Company’s financial position, results of operations, cash flows or disclosures.
In May 2017, the FASB issued ASU 2017-09 in relation to Compensation —Stock Compensation (Topic 718), Modification Accounting. The amendments provide guidance about which changes to the terms or conditions of a share-based payment award require an entity to apply modification accounting in Topic 718. The amendments are effective for all entities for annual periods, and interim periods within those annual periods, beginning after December 15, 2017. Early adoption is permitted, including adoption in any interim period, for (1) public business entities for reporting periods for which financial statements have not yet been issued and (2) all other entities for reporting periods for which financial statements have not yet been made available for issuance. The amendments should be applied prospectively to an award modified on or after the adoption date. The Company is in the process of evaluating the amendments to determine if they have a material impact on the Company’s financial position, results of operations, cash flows or disclosures.
4.
Accounts receivable
The Company currently has no debt agreements in place whereby any amount of receivables serve as collateral. The Company has no off-balance-sheet credit exposures and has no foreclosed or repossessed assets. The Company has had no impaired loans related to receivables and has identified no loss contingencies related toAccounts receivable are carried on the receivablesconsolidated balance sheet net of allowance for doubtful accounts. This provision is established based on the Company’s best estimates regarding the ultimate recovery of balances for which collection is uncertain. As at November 30, 20162017, the Company has an account receivable balance of $756,468 (2016 - $472,474) and November 30, 2015.an allowance for doubtful accounts of $66,849 (2016 - $Nil). Risks and uncertainties and credit quality information related to accounts receivable have been disclosed in Note 17.
Intellipharmaceutics International Inc.
Notes to the consolidated financial statements
November 30, 2017, 2016 and 2015
(Stated in U.S. dollars)
5.
Property and equipment
November 30, 2016 | |||
Accumulated | Net book | ||
Cost | amortization | value | |
$ | $ | $ | |
| Computer equipment | 295,296 | 238,672 | 56,624 |
| Computer software | 124,151 | 117,506 | 6,645 |
| Furniture and fixtures | 129,860 | 109,243 | 20,617 |
| Laboratory equipment | 3,933,693 | 2,290,074 | 1,643,619 |
| Leasehold improvements | 1,205,810 | 1,143,792 | 62,018 |
| Laboratory equipment under capital lease | 276,300 | 179,422 | 96,878 |
| Computer equipment under capital lease | 76,458 | 73,221 | 3,237 |
6,041,568 | 4,151,930 | 1,889,638 | |
| Computer equipment | Computer software | Furniture and fixtures | Laboratory equipment | Leasehold improvements | Laboratory equipment under capital lease | Computer equipment under capital lease | Total | |
| Cost | ||||||||
| Balance at November 30, 2015 | $293,870 | $124,151 | $129,860 | $3,483,398 | $1,142,122 | $276,300 | $76,458 | $5,526,159 |
| Additions | 1,426 | - | - | 450,295 | 63,689 | - | - | 515,410 |
| Balance at November 30, 2016 | 295,296 | 124,151 | 129,860 | 3,933,693 | 1,205,811 | 276,300 | 76,458 | 6,041,569 |
| Additions | 235,454 | 31,908 | 42,638 | 1,353,110 | 235,641 | - | - | 1,898,751 |
| Balance at November 30, 2017 | 530,750 | 156,059 | 172,498 | 5,286,803 | 1,441,452 | 276,300 | 76,458 | 7,940,320 |
| Accumulated depreciation | ||||||||
| Balance at November 30, 2015 | 214,525 | 110,860 | 104,089 | 1,968,088 | 1,142,122 | 155,203 | 71,834 | 3,766,721 |
| Depreciation | 24,147 | 6,646 | 5,154 | 321,986 | 1,670 | 24,219 | 1,388 | 385,210 |
| Balance at November 30, 2016 | 238,672 | 117,506 | 109,243 | 2,290,074 | 1,143,792 | 179,422 | 73,222 | 4,151,931 |
| Depreciation | 47,811 | 13,622 | 10,747 | 379,158 | 49,154 | 19,376 | 970 | 520,838 |
| Balance at November 30, 2017 | 286,483 | 131,128 | 119,990 | 2,669,232 | 1,192,946 | 198,798 | 74,192 | 4,672,769 |
| Net book value at: | ||||||||
| November 30, 2016 | $56,624 | $6,645 | $20,617 | $1,643,619 | $62,019 | $96,878 | $3,236 | $1,889,638 |
| Balance at November 30, 2017 | $244,267 | $24,931 | $52,508 | $2,617,571 | $248,506 | $77,502 | $2,266 | $3,267,551 |
November 30, 2015 | |||
Accumulated | Net book | ||
Cost | amortization | value | |
$ | $ | $ | |
| Computer equipment | 293,870 | 214,525 | 79,345 |
| Computer software | 124,151 | 110,860 | 13,291 |
| Furniture and fixtures | 129,860 | 104,089 | 25,771 |
| Laboratory equipment | 3,483,398 | 1,968,088 | 1,515,310 |
| Leasehold improvements | 1,142,122 | 1,142,122 | - |
| Laboratory equipment under capital lease | 276,300 | 155,203 | 121,097 |
| Computer equipment under capital lease | 76,458 | 71,834 | 4,624 |
5,526,159 | 3,766,721 | 1,759,438 | |
Property and equipment are reviewed for impairment whenever events or changes in circumstances indicate that the carrying value of an asset may not be recoverable. Impairment is assessed by comparing the carrying amount of an asset with the sum of the undiscounted cash flows expected from its use and disposal, and as such requires the Company to make significant estimates on expected revenues from the commercialization of its products and services and the related expenses. The Company records a write-down for long-lived assets which have been abandoned and do not have any residual value. For the year ended November 30, 2016,2017, the Company recorded a $Nil write-down of long-lived assets (2015(2016 - $Nil; 20142015 – $Nil).
November 30, | November 30, | |
2016 | 2015 | |
$ | $ | |
| Professional fees | 190,485 | 163,552 |
| Other | 194,401 | 290,738 |
384,886 | 454,290 |
Notes to the consolidated financial statements
November 30, 2017, 2016 and 2015
(Stated in U.S. dollars)
6.
Accrued liabilities
| November 30, 2017 | November 30, 2016 | |
$ | $ | |
| Professional fees | 400,796 | 190,485 |
| Property taxes | 111,970 | - |
| Interest | 54,110 | 14,784 |
| Other | 215,493 | 179,617 |
| 782,369 | 384,886 |
7.
Due to related parties
Convertible debenture
Amounts due to the related parties are payable to entities controlled by two shareholders who are also officers and directors of the Company.
November 30, | November 30, | |
2016 | 2015 | |
$ | $ | |
| Convertible debenture payable to two directors and officers | ||
| of the Company, unsecured, 12% annual interest rate, | ||
| payable monthly | 1,494,764 | 1,518,429 |
| November 30, | November 30, | |
| 2017 | 2016 | |
Convertible debenture payable to two directors and officers of the Company, unsecured, 12% annual interest rate, Payable monthly | $1,290,465 | $1,494,764 |
On January 10, 2013, the Company completed a private placement financing of an unsecured convertible debenture in the Debenture,original principal amount of $1.5 million, which had an original maturity date of January 1, 2015. The Debenture bears interest at a rate of 12% per annum, payable monthly, is pre-payable at any time at the option of the Company and is convertible at any time into 500,000 common shares at a conversion price of $3.00 per common share at the option of the holder.
Dr. Isa Odidi and Dr. Amina Odidi, principal shareholders, directors and executive officers of the Company purchased the Debenture and provided the Company with the $1.5 million of the proceeds for the Debenture. The conversion price of the Debenture is in U.S. dollars and at issuance IPC’s functional currency at the time of issuance was Canadian dollars. Under U.S. GAAP where the conversion price of the Debenture is denominated in a currency other than an entity's functional currency, the conversion option meets the definition of an embedded derivative. The conversion option was bifurcated from its host contract and the fair value of the conversion option characterized as an embedded derivative upon issuance. The embedded derivative was presented together on a combined basis with the host contract. The derivative was re-measured at the end of every reporting period with the change in value reported in the consolidated statements of operations and comprehensive loss.
Effective October 1, 2014, the maturity date of the Debenture was extended to July 1, 2015. Under ASC 470-50, the change in the debt instrument was accounted for as a modification of debt. The increase in the fair value of the conversion option at the date of the modification, in the amount of $126,414, was recorded as a reduction in the carrying value of the debt instrument with a corresponding increase to additional paid-in-capital. The carrying amount of the debt instrument is accreted over the remaining life of the Debenture using a 15% imputed rate of interest.
Effective June 29, 2015, the July 1, 2015 maturity date for the Debenture was further extended to January 1, 2016. Under ASC 470-50, the change in the maturity date of the debt instrument resulted in a constructivean extinguishment of the original Debenture as the change in the fair value of the embedded conversion option was greater than 10% of the carrying amount of the debt.Debenture. In accordance with ASC 470-50-40, the Debenture was recorded at fair value. The difference between the fair value of the convertible Debenture after the extension and the net carrying value of the Debenture prior to the extension of $114,023 was recognized as a loss on the statement of operations and comprehensive loss. The carrying amount of the debt instrument will bewas accreted down to the face amount of the Debenture over the remaining life of the Debenture using a 14.6% imputed rate of interest.
Effective December 8, 2015, the January 1, 2016 maturity date of the Debenture was extended to July 1, 2016. Under ASC 470-50, the change in the debt instrument was accounted for as a modification of debt.
Intellipharmaceutics International Inc.
Notes to the consolidated financial statements
November 30, 2017, 2016 and 2015
(Stated in U.S. dollars)
7.
Due to related parties (continued)
Convertible debenture
The increase in the fair value of the conversion option at the date of the modification, in the amount of $83,101, was recorded as a reduction in the carrying value of the debt instrument with a corresponding increase to additional paid-in-capital. The carrying amount of the debt instrument is accreted over the remaining life of the Debenture using a 6.6% imputed rate of interest.
Effective May 26, 2016, the July 1, 2016 maturity date of the Debenture was extended to December 1, 2016. Under ASC 470-50, the change in the debt instrument was accounted for as a modification of debt. The increase in the fair value of the conversion option at the date of the modification, in the amount of $19,808, was recorded as a reduction in the carrying value of the debt instrument with a corresponding increase to additional paid-in-capital. The carrying amount of the debt instrument iswas accreted over the remaining life of the Debenture using a 4.2% imputed rate of interest.
Effective December 1, 2016, the maturity date of the Debenture was extended to April 1, 2017 and a principal repayment of $150,000 was made at the time of the extension. Under ASC 470-50, the change in the debt instrument was accounted for as a modification of debt. The increase in the fair value of the conversion option at the date of the modification, in the amount of $106,962, was recorded as a reduction in the carrying value of the debt instrument with a corresponding increase to additional paid-in-capital. The carrying amount of the debt instrument is accreted over the remaining life of the Debenture using a 26.3% imputed rate of interest.
Effective March 28, 2017, the maturity date of the Debenture was extended to October 1, 2017. Under ASC 470-50, the change in the debt instrument was accounted for as a modification of debt. The increase in the fair value of the conversion option at the date of the modification, in the amount of $113,607, was recorded as a reduction in the carrying value of the debt instrument with a corresponding increase to additional paid-in-capital. The carrying amount of the debt instrument is accreted over the remaining life of the Debenture using a 15.2% imputed rate of interest.
Effective September 28, 2017, the maturity date of the Debenture was extended to October 1, 2018. Under ASC 470-50, the change in the debt instrument was accounted for as a modification of debt. The increase in the fair value of the conversion option at the date of the modification, in the amount of $53,227, was recorded as a reduction in the carrying value of the debt instrument with a corresponding increase to additional paid-in-capital. The carrying amount of the debt instrument is accreted over the remaining life of the Debenture using a 4.9% imputed rate of interest.
Accreted interest expense during the year ended November 30, 20162017 is $79,245 (2015$219,497 (2016 - $27,103; 2014$79,245; 2015 - $127,261)$27,103), and has been included in the consolidated statements of operations and comprehensive loss.
In addition, the coupon interest on the Debenture for the year ended November 30, 20162017 is $180,370 (2015$162,530 (2016 - $179,878; 2014$180,370; 2015 - $179,877)$179,878), and has also been included in the consolidated statements of operations and comprehensive loss.
8.
Employee costs payable
As at November 30, 2016,2017, the Company had $838,905 (2015$214,980 (2016 - $Nil)$205,246) accrued vacation payable to certain employees and had $Nil (2016 - $838,905) accrued bonus payable to executive officers of the Company and had $205,246 (2015 - $175,172) accrued vacation payable to certain employees.Company. These balances are due on demand and therefore presented as current liabilities.
9.
Lease obligations
On December 1, 2015, the Company entered into a new lease agreement for the premises that it currently operates from, as well the adjoining property which is owned by the same landlord, for a 5 year term with a 5 year renewal option. The Company also has an option to purchase the combined properties after March 1, 2017 and up to November 30, 2020 based on a fair value purchase formula. The Company also leases various computers and equipment under capital leases. Future minimum lease payments under leases with terms of one year or more are as follows at November 30, 2016:2017:
Intellipharmaceutics International Inc.
Notes to the consolidated financial statements
November 30, 2017, 2016 2015 and 20142015
(Stated in U.S. dollars)
9.
Lease obligations (continued)
Capital | Operating | Operating | |
| Year ending November 30, | Lease | Lease | |
$ | $ | ||
| 2017 | 15,489 | 179,736 | |
| 2018 | - | 179,736 | 186,220 |
| 2019 | - | 179,736 | 186,220 |
| 2020 | - | 179,736 | 186,220 |
15,489 | 718,944 | 558,660 | |
| Less: amounts representing interest at 14% | 660 | - | |
14,829 | 718,944 | ||
| Less: current portion | 14,829 | 179,736 | 186,220 |
Balance, long-term portion | - | 539,208 | 372,440 |
As at November 30, 2017, capital lease obligation balance is $Nil (2016 - $14,829).
10.
Capital stock
Authorized, issued and outstanding
(a)
The Company is authorized to issue an unlimited number of common shares, all without nominal or par value and an unlimited number of preference shares. As at November 30, 2016,2017, the Company has 29,784,992 (2015had 34,704,515 (2016 - 24,244,050; 201429,789,992; 2015 - 23,456,611)24,244,050) common shares issued and outstanding and 5,000 common shares to be issued subsequent to November 30, 2016, and no preference shares issued and outstanding.
Two officers and directors of IPC owned directly and through their family holding company (“Odidi Holdco”) 5,781,312 (2015(2016 - 5,781,312) common shares or approximately 19% (201517% (2016 - 24%19%; 20142015 - 26%24%) of IPC.
Each common share of the Company entitles the holder thereof to one vote at any meeting of shareholders of the Company, except meetings at which only holders of a specified class of shares are entitled to vote.
Holders of common shares of the Company are entitled to receive, as and when declared by the board of directors of the Company, dividends in such amounts as shall be determined by the board. The holders of common shares of the Company have the right to receive the remaining property of the Company in the event of liquidation, dissolution, or winding-up of the Company, whether voluntary or involuntary.
The preference shares may at any time and from time to time be issued in one or more series. The board of directors will, by resolution, from time to time, before the issue thereof, fix the rights, privileges, restrictions and conditions attaching to the preference shares of each series. Except as required by law, the holders of any series of preference shares will not as such be entitled to receive notice of, attend or vote at any meeting of the shareholders of the Company. Holders of preference shares will be entitled to preference with respect to payment of dividends and the distribution of assets in the event of liquidation, dissolution or winding-up of the Company, whether voluntary or involuntary, or any other distribution of the assets of the Company among its shareholders for the purpose of winding up its affairs, on such shares over the common shares of the Company and over any other shares ranking junior to the preference shares.
(b)
In November 2013, the Company entered into an equity distribution agreement with Roth Capital Partners, LLC (“Roth”), pursuant to which the Company may from time to time sell up to 5,305,484 of the Company’s common shares for up to an aggregate of $16.8 million (or such lesser amount as may be permitted under applicable exchange rules and securities laws and regulations) through at-the-market issuances on the NASDAQ or otherwise. Under the equity distribution agreement, the Company may at its discretion, from time to time, offer and sell common shares through Roth or directly to Roth for resale. The Company will pay Roth a commission, or allow a discount, of 2.75% of the gross proceeds that the Company received from any additional sales of common shares under the equity
distribution agreement. The Company has also agreed to reimburse Roth for certain expenses relating to the offering. For
Intellipharmaceutics International Inc.
Notes to the consolidated financial statements
November 30, 2017, 2016 and 2015
(Stated in U.S. dollars)
10.
Capital stock (continued)
Authorized, issued and outstanding (continued)
During the year ended November 30, 2017, an aggregate of 1,108,150 common shares were sold on Nasdaq for gross proceeds of $2,541,640, with net proceeds to the Company of $2,468,474, respectively, under the at-the-market offering program. During the year ended November 30, 2016, an aggregate of 1,471,260 common shares were sold on NASDAQNasdaq for gross proceeds of $3,469,449, with net proceeds to the Company of $3,368,674, respectively, under the at-the-market offering program. During the year ended November 30, 2015, an aggregate of 471,439 common shares were sold for gross proceeds of $1,290,168, with net proceeds to the Company of $1,254,178. During the year ended November 30, 2014, an aggregate of 1,689,500 common shares were sold for gross proceeds of $6,571,673, with net proceeds to the Company of $6,390,670. As a result of prior sales of the Company’s common shares under the equity distribution agreement, as at November 30, 2016,2017, the Company may in the future offer and sell its common shares with an aggregate purchase price of up to $5,468,711$2,927,071 pursuant to the at-the-market program (or such lesser amount as may then be permitted under applicable exchange rules and securities laws and regulations, such amount the Company currently can offer and sell being limited to approximately $5.4 million) pursuant to our at-the-market program.regulations). There can be no assurance that any additional shares will be sold under the at-the-market program.
(c)
Direct costs related to the Company’s filing of a base shelf prospectus filed in May 2014 and declared effective in June 2014, direct costs related to the base shelf prospectus filed in May 2017 and certain other on-going costs related to the at the-market facility are recorded as deferred offering costs and are being amortized and recorded as share issuance costs against share offerings. For the year ended November 30, 2016,2017, costs directly related to the at the-market facility of $100,775 (2015$73,166 (2016 - $38,889; 2014$100,775; 2015 - $811,887)$38,889) were recorded in share offering costs and an additional $258,287 (2015$220,573 (2016 - $39,277; 2014$258,287; 2015 - $Nil)$39,277) of deferred costs were amortized and recorded in share offering costs related to the at the-market facility.facility and base shelf prospectus. For the year ended November 30, 2017, the Company recorded $137,363 as a financing cost in the statements of operations and comprehensive loss related to the base shelf prospectus filed in May 2014 and expired in July 2017.
(d)
In June 2016, the Company completed an underwritten public offering of 3,229,814 units of common shares and warrants, at a price of $1.61 per unit. The warrants are currently exercisable, have a term of five years and an exercise price of $1.93 per common share. The Company issued at the initial closing of the offering an aggregate of 3,229,814 common shares and warrants to purchase an additional 1,614,907 common shares. The underwriter also purchased at such closing additional warrants at a purchase price of $0.001 per warrant to acquire 242,236 common shares pursuant to the over-allotment option exercised in part by the underwriter. The Company subsequently sold an aggregate of 459,456 additional common shares at the public offering price of $1.61 per share in connection with subsequent partial exercises of the underwriter’s over-allotment option. The closings of these partial exercises brought the total net proceeds from the offering to $5,137,638, after deducting the underwriter’s discount and offering expenses. The warrants are considered to be indexed to the Company’s own stock and are therefore classified as equity under ASC topic 480 Distinguishing Liabilities from Equity for equity classification. The Company recorded $4,764,777 as the value of common shares under Capital stock and $1,175,190 as the value of the warrants under Additional Paid in Capital in the consolidated statements of shareholders’ equity (deficiency). The Company has disclosed the terms used to value the warrants in Note 14.
The direct costs related to the issuance of the unit shares were $802,329 and were recorded as an offset against the statement of shareholders’ equity (deficiency) with $643,593 being recorded under Capital stock and $158,736 being recorded under Additional Paidadditional paid-in-capital.
(e)
In October 2017, the Company completed an underwritten public offering of 3,636,364 common shares at a price of $1.10 per share. The Company also issued to the investors warrants to purchase an aggregate of 1,818,182 common shares. The warrants will be exercisable six months following the closing date and will expire 30 months after the date they become exercisable, have a term of three years and an exercise price of $1.25 per common share. The Company also issued to the placement agents (the “Placement Agent Warrants”) warrants to purchase 181,818 common shares at an exercise price of $1.375 per share.
Intellipharmaceutics International Inc.
Notes to the consolidated financial statements
November 30, 2017, 2016 and 2015
(Stated in Capital.U.S. dollars)
10.
Capital stock (continued)
Authorized, issued and outstanding (continued)
The holders of October 2017 Warrants (as defined below) and Placement Agent Warrants are entitled to a cashless exercise under which the number of shares to be issued will be based on the number of shares for which warrants are exercised times the difference between the market price of the common share and the exercise price divided by the market price. The warrants are considered to be indexed to the Company’s own stock and are therefore classified as equity under ASC topic 480 Distinguishing Liabilities from Equity for equity classification.
The Company recorded $3,257,445 as the value of common shares under Capital stock and $742,555 as the value of the warrants under additional paid-in-capital in the consolidated statements of shareholders’ equity (deficiency). The Company has disclosed the terms used to value the warrants in Note 14.
The direct costs related to the issuance of the common shares and warrants were $500,492 and were recorded as an offset against the statement of shareholders’ equity (deficiency) with $391,580 being recorded under Capital stock and $108,912 being recorded under additional paid-in-capital.
11.
Options
All grants of options to employees after October 22, 2009 are made from the Employee Stock Option Plan (the “Employee Stock Option Plan”). The maximum number of common shares issuable under the Employee Stock Option Plan is limited to 10% of the issued and outstanding common shares of the Company from time to time, or 2,978,9993,470,452 based on the number of issued and outstanding common shares as at November 30, 2016.2017. As at November 30, 2016, 2,628,5202017, 3,064,172 options are outstanding and there were 350,479406,280 options available for grant under the Employee Stock Option Plan. Each option granted allows the holder to purchase one common share at an exercise price not less than the closing price of the Company's common shares on the Toronto Stock Exchange on the last trading day prior to the grant of the option. Options granted under these plans generallytypically have a term of 5 years with a maximum term of 10 years and generally vest over a period of up to three years.
In August 2004, the Board of Directors of IPC Ltd. approved a grant of 2,763,940 performance-based stock options, to two executives who were also the principal shareholders of IPC Ltd. The vesting of these options is contingent upon the achievement of certain performance milestones. A total of 1,934,7582,487,546 performance-based stock options have vested as of November 30, 2016.2017. Under the terms of the original agreement these options were to expire in September 2014. Effective March 27, 2014, the Company’s shareholders approved the two year extension of the performance-based stock option expiry date to September 2016. As a result of the modification of the performance based stock option expiry date, the Company recorded additional compensation costs of $1,066,991 related to vested performance options during the year ended November 30, 2014. Effective April 19, 2016, the Company’s shareholders approved a further two year extension of the performance-based stock option expiry date to September 2018. As a result of the modification of the performance basedperformance-based stock option expiry date, the Company recorded additional compensation costs of $1,177,782 related to vested performance options during the year ended November 30, 2016. These options were outstanding as at November 30, 2016.2017.
In the year ended November 30, 2016, 355,000 (20152017, 376,000 (2016 - 295,000; 2014355,000; 2015 - 254,001)295,000) stock options were granted to management and other employees and 105,000 (2015120,000 (2016 - 60,000; 2014105,000; 2015 - 225,000)60,000) stock options were granted to members of the Board of Directors.
The fair value of each option grant is estimated on the date of grant using the Black-Scholes Option-Pricing Model, consistent with the provisions of ASC topic 718.
Option pricing models require the use of subjective assumptions, changes in these assumptions can materially affect the fair value of the options.
The Company calculates expected volatility based on historical volatility of the Company’s peer group that is publicly traded for options that have an expected life that is more than sixeight years. For options that have an expected life of less than sixeight years the Company uses its own volatility.
The expected term, which represents the period of time that options granted are expected to be outstanding, is estimated based on the historical average of the term and historical exercises of the options.
Intellipharmaceutics International Inc.
Notes to the consolidated financial statements
November 30, 2017, 2016 and 2015
(Stated in U.S. dollars)
11.
Options (continued)
The risk-free rate assumed in valuing the options is based on the U.S. treasury yield curve in effect at the time of grant for the expected term of the option. The expected dividend yield percentage at the date of grant is Nil as the Company is not expected to pay dividends in the foreseeable future.
The weighted average fair value of employee stock options granted was estimated using the following assumptions:
November 30, | November 30, | ||
2016 | 2015 | 2014 | |
| Volatility | 65.2% | 68.6% | 55.0% |
| Risk-free interest rate | 0.620% | 0.580% | 1.45% |
| Expected life (in years) | 5.00 | 5.00 | 5.60 |
| Dividend yield | - | - | - |
| The weighted average grant date | |||
fair value of options granted | $1.20 | $1.66 | $2.10 |
November 30, | November 30, | November 30, | |
2017 | 2016 | 2015 | |
| Volatility | 71.7% | 65.2% | 68.6% |
| Risk-free interest rate | 1.56% | 0.620% | 0.580% |
| Expected life (in years) | 5.49 | 5.00 | 5.00 |
| Dividend yield | - | - | - |
| The weighted average grant date | |||
| fair value of options granted | $0.75 | $1.20 | $1.66 |
Details of stock option transactions in Canadian dollars (“C$”) are as follows:
November 30, 2016 | November 30, 2015 | November 30, 2014 | |||||||
Weighted | Weighted | Weighted | |||||||
average | Weighted | average | Weighted | average | Weighted | ||||
exercise | average | exercise | average | exercise | average | ||||
Number of | price per | grant date | Number of | price per | grant date | Number of | price per | grant date | |
options | share | fair value | options | share | fair value | options | share | fair value | |
$ | $ | $ | $ | $ | $ | ||||
| Outstanding | |||||||||
| beginning of | |||||||||
| period, | 5,062,007 | 3.89 | 2.21 | 4,858,208 | 3.96 | 2.21 | 4,455,072 | 3.97 | 2.21 |
| Granted | 460,000 | 2.42 | 1.20 | 355,000 | 2.52 | 1.66 | 479,001 | 3.86 | 2.10 |
| Exercised | (27,500) | 2.57 | 1.68 | (91,000) | 2.34 | 1.86 | (48,000) | 2.45 | 1.07 |
| Forfeiture | - | - | - | (60,168) | - | - | (27,832) | - | - |
| Expired | (102,047) | 19.24 | 13.29 | (33) | 770.13 | 493.31 | (33) | 709.18 | 709.18 |
| Balance at | ||||||||||||||||||
| end of period | 5,392,460 | 3.48 | 1.88 | 5,062,007 | 3.89 | 2.21 | 4,858,208 | 3.96 | 2.21 | |||||||||
November 30, 2017 | November 30, 2016 | November 30, 2015 | ||||||||||||||||
| Weighted | Weighted | Weighted | ||||||||||||||||
| average | Weighted | average | Weighted | average | Weighted | |||||||||||||
| exercise | average | exercise | average | exercise | average | |||||||||||||
| Number of | price per | grant date | Number of | price per | grant date | Number of | price per | grant date | ||||||||||
| options | share | fair value | options | share | fair value | options | share | fair value | ||||||||||
$ | $ | $ | $ | |||||||||||||||
| Outstanding, | ||||||||||||||||||
| beginning of year | 5,392,460 | 3.48 | 1.88 | 5,062,007 | 3.89 | 2.21 | 4,858,208 | 3.96 | 2.21 | |||||||||
| Granted | 496,000 | 1.17 | 0.75 | 460,000 | 2.42 | 1.20 | 355,000 | 2.52 | 1.66 | |||||||||
| Exercised | (2,000) | 2.32 | 1.20 | (27,500) | 2.57 | 1.68 | (91,000) | 2.34 | 1.86 | |||||||||
| Forfeiture | - | (60,168) | - | |||||||||||||||
| Expired | (58,348) | 12.64 | 9.60 | (102,047) | 19.24 | 13.29 | (33) | 770.13 | 493.31 | |||||||||
| Balance, | ||||||||||||||||||
| end of year | 5,828,112 | 3.20 | 1.72 | 5,392,460 | 3.48 | 1.88 | 5,062,007 | 3.89 | 2.21 | |||||||||
| Options | ||||||||||||||||||
exercisable, | exercisable, | |||||||||||||||||
| end of year | 4,396,610 | 3.49 | 1.96 | 3,812,930 | 4.01 | 2.35 | 3,640,381 | 4.09 | 2.40 | 5,221,059 | 3.30 | 1.79 | 4,396,610 | 3.49 | 1.96 | 3,812,930 | 4.01 | 2.35 |
As of November 30, 2016,2017, the exercise prices, weighted average remaining contractual life of outstanding options and weighted average grant date fair values were as follows:
Options outstanding | Options exercisable | ||||||
| Weighted | Weighted | Weighted | Weighted | Weighted | |||
| average | average | average | average | average | |||
| exercise | remaining | grant | exercise | grant | |||
Exercise | Number | price per | contract | due | Number | price per | date |
price | outstanding | share | life (years) | fair value | exercisable | share | fair value |
$ | $ | $ | $ | ||||
Under 2.50 | 1,251,000 | 1.43 | 3.93 | 0.99 | 920,341 | 1.49 | 1.07 |
| 2.51 - 5.00 | 4,560,835 | 3.50 | 1.81 | 1.84 | 4,284,441 | 3.49 | 1.86 |
| 5.01 - 10.00 | - | - | - | - | - | - | - |
| 10.01 - 100.00 | 16,277 | 29.11 | 0.21 | 22.89 | 16,277 | 29.11 | 22.89 |
| 5,828,112 | 3.20 | 5,221,059 | 3.30 |
Options outstanding | Options exercisable | ||||||
Weighted | Weighted | Weighted | Weighted | Weighted | |||
average | average | average | average | average | |||
exercise | remaining | grant | exercise | grant | |||
Number | price per | contract | due | Number | price per | date | |
price | outstanding | share | life (years) | fair value | exercisable | share | fair value |
$ | $ | $ | $ | ||||
Under 2.50 | - | - | - | - | - | - | - |
2.51 - 5.00 | 5,360,835 | 3.31 | 0.96 | 1.74 | 4,364,985 | 3.27 | 1.78 |
5.01 - 10.00 | - | - | - | - | - | - | - |
10.01 - 100.00 | 31,625 | 33.02 | 0.99 | 25.98 | 31,625 | 33.02 | 25.98 |
5,392,460 | 3.48 | 4,396,610 | 3.49 | ||||
Notes to the consolidated financial statements
November 30, 2017, 2016 and 2015
(Stated in U.S. dollars)
11.
Options (continued)
Total unrecognized compensation cost relating to the unvested performance-based stock options at November 30, 20162017 is approximately $2,366,659 (2015$788,887 (2016 - $2,482,528; 2014$2,366,659; 2015 - $2,482,528). During the year ended November 30, 2016, a2017, specific performance condition wasconditions were met as the FDA approved an ANDAtwo ANDAs for a certain drug,drugs, resulting in the vesting of 276,394552,788 performance-based stock options. As a result, a stock-based compensation expense of $620,632$1,577,772 relating to these stock options was recognized in 2016 in research and development expense (2015(2016 - $Nil; 2014$620,632; 2015 - $Nil).
For the year ended November 30, 2017, 2,000 options were exercised for cash consideration of $1,742. For the year ended November 30, 2016, 27,500 options were exercised for a cash consideration of $52,868. For the year ended November 30, 2015, 91,000 options were exercised for cash consideration of $167,962. For the year ended November 30, 2014, 48,000 options were exercised for cash consideration of $116,984.
The following table summarizes the components of stock-based compensation expense.
November 30, | November 30, | |||||
2016 | 2015 | 2014 | 2017 | 2016 | 2015 | |
$ | $ | $ | ||||
| Research and development | 1,995,805 | 152,231 | 1,270,307 | 1,654,051 | 1,995,805 | 152,231 |
| Selling, general and administrative | 265,639 | 265,587 | 478,300 | 95,948 | 265,639 | 265,587 |
2,261,444 | 417,818 | 1,748,607 | 1,749,999 | 2,261,444 | 417,818 | |
The Company has estimated its stock option forfeitures to be approximately 4% at November 30, 2016 (2015 -2017 (2016 – 4%; 2014 - 3%2015 – 4%).
12.
Deferred share units
Effective May 28, 2010, the Company’s shareholders approved a Deferred Share Unit (“DSU”) Plan to grant DSUs to its non-management directors and reserved a maximum of 110,000 common shares for issuance under the plan. The DSU Plan permits certain non-management directors to defer receipt of all or a portion of their board fees until termination of the board service and to receive such fees in the form of common shares at that time. A DSU is a unit equivalent in value to one common share of the Company based on the trading price of the Company's common shares on the Toronto Stock Exchange.
Upon termination of board service, the director will be able to redeem DSUs based upon the then market price of the Company's common shares on the date of redemption in exchange for any combination of cash or common shares as the Company may determine.
During the year ended November 30, 20162017 and 2015,2016, one non-management board member elected to receive director fees in the form of DSUs under the Company’s DSU Plan. As at November 30, 2016, 76,743 (20152017, 94,131 (2016 - 60,002)76,743) DSUs are outstanding and 33,257 (201515,869 (2016 - 49,998)33,257) DSUs are available for grant under the DSU Plan. The Company recorded the following amounts related to DSUs for each of the three years ended November 30, 2017, 2016 2015 and 20142015 in additional paid in capital and accrued the following amounts as at November 30, 2017, 2016 2015 and 2014:2015:
November 30, 2017 | November 30, 2016 | November 30, 2015 | ||||
$ | shares | $ | shares | $ | shares | |
| Additional paid in capital | 30,355 | 17,388 | 31,628 | 16,741 | 29,056 | 10,993 |
| Accrued liability | 7,562 | 8,660 | 7,261 | 2,356 | 8,051 | 4,272 |
November 30, 2016 | November 30, 2015 | November 30, 2014 | ||||
$ | shares | $ | shares | $ | shares | |
| Additional paid in capital | 31,628 | 16,741 | 29,056 | 10,993 | 20,807 | 5,968 |
Accrued liability | 7,261 | 2,356 | 8,051 | 4,272 | 3,759 | 1,338 |
Intellipharmaceutics International Inc.
Notes to the consolidated financial statements
November 30, 2017, 2016 and 2015
(Stated in U.S. dollars)
13.
Restricted share units
Effective May 28, 2010, the Company’s shareholders approved a Restricted Share Unit (“RSU”) Plan for officers and employees of the Company and reserved a maximum of 330,000 common shares for issuance under the plan. The RSU Plan will form part of the incentive compensation arrangements available to officers and employees of the Company and its designated affiliates. An RSU is a unit equivalent in value to one common share of the Company. Upon vesting of the RSUs and the corresponding issuance of common shares to the participant, or on the forfeiture and cancellation of the RSUs, the RSUs credited to the participant’s account will be cancelled. No RSUs have been issued under the plan.
Warrants
In the registered direct unit offering completed in March 2013, gross proceeds of $3,121,800 were received through the sale of the Company’s units comprised of common stockshare and warrants.
The offering was the sale of 1,815,000 units at a price of $1.72 per unit, with each unit consisting of one share of common stockshare and a five year warrant to purchase 0.25 of a share of common stockshare at an exercise price of $2.10 per share (“March 2013 Warrants”).
The fair value of the March 2013 Warrants of $407,558 were initially estimated at closing using the Black-Scholes Option Pricing Model, using volatilities of 63%, risk free interest rates of 0.40%, expected life of 5 years, and dividend yield of Nil.
In the underwritten public offering completed in July 2013, gross proceeds of $3,075,000 were received through the sale of the Company’s units comprised of common stockshares and warrants. The offering was the sale of 1,500,000 units at a price of $2.05 per unit, each unit consisting of one share of common stockshare and a five year warrant to purchase 0.25 of a share of common stockshare at an exercise price of $2.55 per share (“July 2013 Warrants”).
The fair value of the July 2013 Warrants of $328,350 were initially estimated at closing using the Black-Scholes Option Pricing Model, using volatilities of 62.4%, risk free interest rates of 0.58%, expected life of 5 years, and dividend yield of Nil.
In the underwritten public offering completed in June 2016, gross proceeds of $5,200,000 were received through the sale of the Company’s units comprised of common stockshares and warrants. The Company issued at the initial closing of the offering an aggregate of 3,229,814 common shares and warrants to purchase an additional 1,614,907 common shares, at a price of $1.61 per unit. The warrants are currently exercisable, have a term of five years and an exercise price of $1.93 per common share. The underwriter also purchased at such closing additional warrants (collectively with the warrants issued at the initial closing, the “June 2016 Warrants”) at a purchase price of $0.001 per warrant to acquire 242,236 common shares pursuant to the over-allotment option exercised in part by the underwriter. The fair value of the June 2016 Warrants of $1,175,190 was initially estimated at closing using the Black-Scholes Option Pricing Model, using volatility of 64.1%, risk free interest rates of 0.92%, expected life of 5 years, and dividend yield of Nil.
Intellipharmaceutics International Inc.
Notes to the consolidated financial statements
November 30, 2017, 2016 2015 and 20142015
(Stated in U.S. dollars)
14.
Warrants (continued)
of $742,555 was initially estimated at closing using the Black- Scholes Option Pricing Model, using volatility of 73.67%, risk free interest rates of 1.64%, expected life of 3 years, and dividend yield of Nil.
The fair value of the Placement Agents Warrants were estimated at $86,196 using the Black-Scholes Option Pricing Model, using volatility of 73.67%, a risk free interest rate of 1.64%, an expected life of 3 years, and a dividend yield of Nil.
The following table provides information on the 5,476,4827,140,464 warrants outstanding and exercisable as of November 30, 2016:2017:
Shares issuable | Shares issuable | |||||||
| Warrant | Exercise price | Number outstanding | Expiry | upon exercise | Exercise price | Number outstanding | Expiry | upon exercise |
| March 2013 Warrants | $2.10 | 1,491,742 | March 22, 2018 | 372,936 | $2.10 | 1,491,742 | March 22, 2018 | 372,936 |
| July 2013 Warrants | $2.55 | 870,000 | July 31, 2018 | 217,500 | $2.55 | 870,000 | July 31, 2018 | 217,500 |
| June 2016 Warrants | $1.93 | 3,114,740 | June 02, 2021 | 1,557,370 | $1.93 | 2,778,722 | June 02, 2021 | 1,389,361 |
| October 2017 Warrants | $1.25 | 1,818,182 | October 13, 2020 | 1,818,182 | ||||
| Placement Agent Warrants | $1.375 | 181,818 | October 13, 2020 | 181,818 | ||||
5,476,482 | 2,147,806 | 7,140,464 | 3,979,797 | |||||
During the year ended November 30, 2016,2017, there were cash exercises in respect of 832,104336,018 warrants (2015(2016 – 832,104; 2015 - 450,000; 2014 - 481,000)450,000) and no cashless exercise (2015(2016 - $Nil; 20142015 - $Nil) of warrants, resulting in the issuance of 357,912 (2015168,009 (2016 – 357,912; 2015 - 225,000; 2014 - 288,500)225,000) and $Nil (2015(2016 - $Nil; 20142015 - $Nil) common shares, respectively. For the warrants exercised, the Company recorded a charge to capital stock of $1,030,719 (2015$430,573 (2016 - $1,027,304; 2014$1,030,719; 2015 - $1,291,436)$1,027,304) comprised of proceeds of $700,653 (2015$324,258 (2016 - $562,500; 2014$700,653; 2015 - $781,220)$562,500) and the associated amount of $330,066 (2015$106,315 (2016 - $464,804; 2014$330,066; 2015 - $510,216)$464,804) previously recorded in additional paid in capital.paid-in-capital.
Details of warrant transactions are as follows:
Series A | March 2013 | July 2013 | June 2016 | ||
Warrants | Warrants | Warrants | Warrants | Total | |
| Outstanding, December 1, 2015 | 2,835,000 | 1,724,300 | 870,000 | - | 5,429,300 |
| Issued | - | - | - | 3,714,286 | 3,714,286 |
| Exercised | - | (232,558) | - | (599,546) | (832,104) |
| Expired | (2,835,000) | - | - | - | (2,835,000) |
Outstanding, November 30, 2016 | - | 1,491,742 | 870,000 | 3,114,740 | 5,476,482 |
| March 2013 Warrants | July 2013 Warrants | June 2016 Warrants | October 2017 Warrants | Placement Agent Warrants | Total | |
| Outstanding, December 1, 2016 | 1,491,742 | 870,000 | 3,114,740 | - | - | 5,476,482 |
| Issued | - | - | - | 1,818,182 | 181,818 | 2,000,000 |
| Exercised | - | - | (336,018) | - | - | (336,018) |
| Outstanding, November 30, 2017 | 1,491,742 | 870,000 | 2,778,722 | 1,818,182 | 181,818 | 7,140,464 |
Series A | March 2013 | July 2013 | ||
Warrants | Warrants | Warrants | Total | |
| Outstanding, December 1, 2014 | 3,285,000 | 1,724,300 | 870,000 | 5,879,300 |
| Exercised | (450,000) | - | - | (450,000) |
Outstanding, November 30, 2015 | 2,835,000 | 1,724,300 | 870,000 | 5,429,300 |
| Series A Warrants | March 2013 Warrants | July 2013 Warrants | June 2016 Warrants | Total | |
| Outstanding, December 1, 2015 | 2,835,000 | 1,724,300 | 870,000 | - | 5,429,300 |
| Issued | - | - | - | 3,714,286 | 3,714,286 |
| Exercised | - | (232,558) | - | (599,546) | (832,104) |
| Expired | (2,835,000) | - | - | - | (2,835,000) |
| Outstanding, November 30, 2016 | - | 1,491,742 | 870,000 | 3,114,740 | 5,476,482 |
Intellipharmaceutics International Inc.
Notes to the consolidated financial statements
November 30, 2017, 2016 2015 and 20142015
(Stated in U.S. dollars)
15.
The Company files Canadian income tax returns for its Canadian operations. Separate income tax returns are filed as locally required.
The total provision for income taxes differs from the amount which would be computed by applying the Canadian income tax rate to loss before income taxes. The reasons for these differences are as follows:
November 30, | November 30, | |||||
2016 | 2015 | 2014 | 2017 | 2016 | 2015 | |
% | % | % | ||||
| Statutory income tax rate | 26.5 | 26.5 | ||||
$ | $ | |||||
| Statutory income tax recovery | (2,688,048) | (1,970,643) | (1,021,934) | (2,347,222) | (2,688,048) | (1,970,643) |
| Increase (decrease) in income taxes | ||||||
| Non-deductible expenses/ | ||||||
| non-taxable income | 640,481 | 164,723 | 417,879 | 488,769 | 640,481 | 164,723 |
| Change in valuation allowance | 2,683,775 | 1,804,406 | (995,957) | 2,128,819 | 2,683,775 | 1,804,406 |
| Difference in net income before taxes | ||||||
| between Canadian and U.S dollar | - | 160,316 | ||||
| Investment tax credit | - | (168,591) | (9,114) | - | (168,591) | |
| Financing costs booked to equity | (281,063) | (23,348) | (208,271) | (269,715) | (281,063) | (23,348) |
| FCR Election | - | (253,856) | - | - | (253,856) | |
| Foreign exchange change | - | 985,544 | ||||
| Difference in foreign tax rates | (651) | - | ||||
| True up of tax returns | (356,095) | (15,991) | 82,939 | - | (356,095) | (15,991) |
| Tax loss expired and other | 950 | 463,300 | 588,598 | - | 950 | 463,300 |
- | - | |||||
The Company recognizes deferred tax assets and liabilities for the expected future tax consequences of temporary differences between the carrying amounts and the tax basis of assets and liabilities and certain carry-forward balances. Significant temporary differences and carry-forwards are as follows:
| November 30, | November 30, | November 30, | |
| 2017 | 2016 | 2015 | |
$ | $ | $ | |
| Deferred tax assets | |||
| Non-capital loss carry-forwards | 8,972,285 | 7,427,516 | 6,019,380 |
| Book and tax basis differences | |||
| on assets and liabilities | 863,215 | 3,409,343 | 2,854,916 |
| Other | 2,681,375 | - | - |
| Investment tax credit | 2,865,404 | 2,405,365 | - |
| Undeducted research and | |||
| development expenditures | 4,158,178 | 3,710,274 | 5,394,426 |
| Capital loss carryforwards | 326,064 | - | - |
| Share issuance cost | 436,427 | - | - |
| Net operating loss carryforwards | 14,135 | - | - |
| 20,317,083 | 16,952,498 | 14,268,722 | |
| Valuation allowances for | |||
| deferred tax assets | (20,317,083) | (16,952,498) | (14,268,722) |
| Net deferred tax assets | - | - | - |
November 30, | November 30, | November 30, | |
2016 | 2015 | 2014 | |
$ | $ | $ | |
| Deferred tax assets | |||
| Non-capital loss carry-forwards | 7,427,516 | 6,019,380 | 6,528,099 |
| Book and tax basis differences | |||
| on assets and liabilities | 3,409,343 | 2,854,916 | 1,006,667 |
| Other | - | - | 47,180 |
| Ontario harmonization tax credit | - | - | 371,160 |
| Investment tax credit | 2,405,365 | - | 2,327,722 |
| Undeducted research and | |||
| development expenditures | 3,710,274 | 5,394,426 | 2,183,486 |
16,952,498 | 14,268,722 | 12,464,314 | |
| Valuation allowances for | |||
| deferred tax assets | (16,952,498) | (14,268,722) | (12,464,314) |
Net deferred tax assets | - | - | - |
Intellipharmaceutics International Inc.
Notes to the consolidated financial statements
November 30, 2017, 2016 2015 and 20142015
(Stated in U.S. dollars)
15.
At November 30, 2016,2017, the Company had cumulative operating losses available to reduce future years’ income for income tax purposes:
| Canadian income tax losses expiring | ||
| in the year ended November 30, | Federal | Federal |
$ | $ | |
| 2028 | 182,195 | 182,222 |
| 2029 | 555,539 | 555,539 |
| 2030 | 3,373,079 | 3,373,079 |
| 2031 | 5,532,739 | 5,532,739 |
| 2032 | 5,750,053 | 5,750,053 |
| 2033 | 4,562,538 | 4,562,538 |
| 2034 | 149,927 | 149,927 |
| 2035 | 2,634,823 | 2,634,823 |
| 2036 | 5,195,985 | 5,341,606 |
| 2037 | 5,775,154 | |
27,936,878 | 33,857,680 |
| United States Federal net operating losses expiring | ||
| in the year ended November 30, | ||
$ | $ | |
| 2024 | 18,512 | |
| 2025 | 16,234 | 5,865 |
| 2026 | 34,522 | 34,522 |
69,268 | 40,387 |
At November 30, 2016,2017, the Company had a cumulative carry-forward pool of Federal SR&ED expenditures in the amount of approximately $14,000,000 (2015$15,690,203 (2016 - $12,408,000)$14,000,000) which can be carried forward indefinitely.
At November 30, 2016,2017, the Company had approximately $3,273,000 (2015$2,976,546 (2016 - 2,710,000)$3,273,000) of unclaimed ITCs which expire from 2025 to 2036.2037. These credits are subject to a full valuation allowance as they are not more likely than not to be realized.
The net deferred tax assets have been fully offset by a valuation allowance because it is not more likely than not the Company will realize the benefit of these deferred tax assets. The Company does not have any recognized tax benefits as of November 30, 20162017 or November 30, 2015.2016.
The Company files unconsolidated federal income tax returns domestically and in foreign jurisdictions. The Company has open tax years from 2008 to 20162017 with tax jurisdictions including Canada and the U.S. These open years contain certain matters that could be subject to differing interpretations of applicable tax laws and regulations, as they relate to amount, timing, or inclusion of revenues and expenses.
The Company did not incur any interest expense related to uncertain tax positions in 2017, 2016 2015 and 20142015 or any penalties in those years. The Company had no accrued interest and penalties as of November 30, 2017, 2016 2015 and 2014.2015.
The Company had no unrecognized tax benefits in 2017, 2016 2015 and 2014,2015, and the Company does not expect that the unrecognized tax benefit will increase within the next twelve months.
Intellipharmaceutics International Inc.
Notes to the consolidated financial statements
November 30, 2017, 2016 and 2015
(Stated in U.S. dollars)
16.
Contingencies
From time to time, the Company may be exposed to claims and legal actions in the normal course of business. As at November 30, 2016,2017, and continuing as at February 9, 2017,15, 2018, the Company is not aware of any pending or threatened material litigation claims against the Company.Company, other than as described below.
In November 2016, the Company filed an NDA for its abuse-deterrent oxycodone hydrochloride extended release tablets (formerly referred to as RexistaTM) (“Oxycodone ER”) product candidate, relying on the 505(b)(2) regulatory pathway, which allowed the Company to reference data from Purdue Pharma L.P.'s file for its OxyContin® extended release oxycodone hydrochloride. The Oxycodone ER application was accepted by the FDA for further review in February 2017. The Company certified to the FDA that it believed that its Oxycodone ER product candidate would not infringe any of sixteen (16) patents associated with the branded product Oxycontin® (the “Oxycontin® patents”) listed in the FDA’s Approved Drug Products with Therapeutic Equivalence Evaluations, commonly known as the Orange Book (the “Orange Book”), or that such patents are invalid, and so notified Purdue Pharma L.P. and the other owners of the subject patents listed in the Orange Book of such certification. On April 7, 2017, the Company received notice that Purdue Pharma L.P., Purdue Pharmaceuticals L.P., The P.F. Laboratories, Inc., or collectively the Purdue parties, Rhodes Technologies, and Grünenthal GmbH, or collectively the Purdue litigation plaintiffs or plaintiffs, had commenced patent infringement proceedings against the Company in the U.S. District Court for the District of Delaware in respect of the Company's NDA filing for Oxycodone ER, alleging that Oxycodone ER infringes six (6) out of the sixteen (16) patents. The complaint seeks injunctive relief as well as attorneys' fees and costs and such other and further relief as the Court may deem just and proper. An answer and counterclaim have been filed.
As a result of the commencement of these legal proceedings, the FDA is stayed for 30 months from granting final approval to the Company’s Oxycodone ER product candidate. That time period commenced on February 24, 2017, when the plaintiffs received notice of the Company’s certification concerning the patents, and will expire on August 24, 2019, unless the stay is earlier terminated by a final declaration of the courts that the patents are invalid, or are not infringed, or the matter is otherwise settled among the parties. A trial date for the Purdue litigation has been set for October 22, 2018. The Company is confident that it does not infringe the subject patents, and will vigorously defend against these claims.
In July 2017, three complaints were filed in the U.S. District Court for the Southern District of New York asserting claims under the federal securities laws against the Company and two of its executive officers on behalf of a putative class of purchasers of the Company’s securities. In a subsequent order, the Court consolidated the three actions under the caption Shanawaz v. Intellipharmaceutics Int’l Inc., et al., No. 1:17-cv-05761 (S.D.N.Y.), appointed lead plaintiffs in the consolidated action, and approved lead plaintiffs’ selection of counsel. Lead plaintiffs filed a consolidated amended complaint on January 29, 2018. In the amended complaint, lead plaintiffs purport to assert claims on behalf of a putative class consisting of purchasers of the Company’s securities between May 21, 2015 and July 26, 2017. The amended complaint alleges that the defendants violated Sections 10(b) and 20(a) of the Securities Exchange Act of 1934 and Rule 10b-5 promulgated thereunder by making allegedly false and misleading statements or failing to disclose certain information regarding the Company’s NDA for Oxycodone ER abuse-deterrent oxycodone hydrochloride extended release tablets. The complaint seeks, among other remedies, unspecified damages, attorneys’ fees and other costs, equitable and/or injunctive relief, and such other relief as the court may find just and proper. Under a scheduling order approved by the Court, defendants’ must respond to the amended complaint by March 30, 2018. The Company and the other defendants intend to vigorously defend themselves against the claims asserted in the consolidated action.
Intellipharmaceutics International Inc.
Notes to the consolidated financial statements
November 30, 2017, 2016 2015 and 20142015
(Stated in U.S. dollars)
17.
Financial instruments
(a)
Fair values
The Company follows ASC topic 820, “Fair Value Measurements” which defines fair value, establishes a framework for measuring fair value, and expands disclosures about fair value measurements. The provisions of ASC
topic 820 apply to other accounting pronouncements that require or permit fair value measurements. ASC topic 820 defines fair value as the exchange price that would be received for an asset or paid to transfer a liability (an exit price) in the principal or most advantageous market for the asset or liability in an orderly transaction between market participants at the measurement date; and establishes a three level hierarchy for fair value measurements based upon the transparency of inputs to the valuation of an asset or liability as of the measurement date.
Inputs refers broadly to the assumptions that market participants would use in pricing the asset or liability, including assumptions about risk. To increase consistency and comparability in fair value measurements and related
disclosures, the fair value hierarchy prioritizes the inputs to valuation techniques used to measure fair value into three broad levels. The three levels of the hierarchy are defined as follows:
Level 1 inputs are quoted prices (unadjusted) in active markets for identical assets or liabilities.
Level 2 inputs are inputs other than quoted prices included within Level 1 that are observable for the asset or liability, either directly or indirectly for substantially the full term of the financial instrument.
Level 3 inputs are unobservable inputs for asset or liabilities.
The categorization within the valuation hierarchy is based upon the lowest level of input that is significant to the fair value measurement.
(i)
The Company calculates expected volatility based on historical volatility of the Company’s peer group that is publicly traded for options that have an expected life that is more than six years.eight years (Level 2) while the Company uses its own historical volatility for options that have an expected life of eight years or less (Level 1).
(ii)
The Company calculates the interest rate for the conversion option based on the Company’s estimated cost of raising capital.capital (Level 2).
An increase/decrease in the volatility and/or a decrease/increase in the discount rate would have resulted in an increase/decrease in the fair value of the conversion option and warrant liabilities.
November 30, 2014 | |||
Conversion | Warrant | ||
Option | liability | Total | |
$ | $ | $ | |
| Opening balance | 728,950 | 5,438,022 | 6,166,972 |
Transfer out from level 3(a) | (728,950) | (5,438,022) | (6,166,972) |
Closing balance | - | - | - |
Fair value of financial assets and financial liabilities that are not measured at fair value on a recurring basis are as follows:
November 30, 2016 | November 30, 2015 | November 30, 2017 | November 30, 2016 | |||||
Carrying | Fair | Carrying | Fair | Carrying | Fair | Carrying | Fair | |
amount | value | amount | value | amount | value | amount | value | |
$ | $ | $ | $ | $ | ||||
| Financial Liabilities | ||||||||
Convertible debt(i) | 1,494,764 | 1,500,000 | 1,518,429 | 1,481,663 | ||||
Convertible debenture(i) | 1,290,465 | 1,316,386 | 1,494,764 | 1,500,000 | ||||
(i)
The Company calculates the interest rate for the convertible debtDebenture and due to related parties based on the Company’s estimated cost of raising capital and uses the discounted cash flow model to calculate the fair value of the convertible debtDebenture and the amounts due to related parties.
The carrying values of cash, accounts receivable, accounts payable, accrued liabilities and employee cost payable approximates their fair values because of the short-term nature of these instruments.
Intellipharmaceutics International Inc.
Notes to the consolidated financial statements
November 30, 2017, 2016 and 2015
(Stated in U.S. dollars)
17.
Financial instruments (continued)
(b) Interest rate and credit risk
Interest rate risk is the risk that the value of a financial instrument might be adversely affected by a change in interest rates. The Company does not believe that the results of operations or cash flows would be affected to any significant degree by a sudden change in market interest rates, relative to interest rates on cash, convertible debenture and capital lease obligations due to the short-term nature of these balances.obligations.
Trade accounts receivable potentially subjects the Company to credit risk. The Company provides an allowance for doubtful accounts equal to the estimated losses expected to be incurred in the collection of accounts receivable.
The following table sets forth details of the aged accounts receivable that are not overdue as well as an analysis of overdue amounts and the related allowance for doubtful accounts:
November 30, | November 30, | |||
2016 | 2015 | 2017 | 2016 | |
$ | $ | |||
| Total accounts receivable | 472,474 | 478,674 | 756,468 | 472,474 |
| Less allowance for doubtful accounts | - | (66,849) | - | |
Total accounts receivable, net | 472,474 | 478,674 | 689,619 | 472,474 |
| Not past due | 427,519 | 453,662 | 689,619 | 427,519 |
| Past due for more than 31 days | ||||
| but no more than 60 days | 3,319 | 5,003 | 5,176 | 3,319 |
| Past due for more than 91 days | ||||
| but no more than 120 days | 41,636 | 20,009 | 61,673 | 41,636 |
Total accounts receivable, net | 472,474 | 478,674 | ||
| Total accounts receivable, gross | 756,468 | 472,474 | ||
Financial instruments that potentially subject the Company to concentration of credit risk consist principally of uncollateralized accounts receivable. The Company’s maximum exposure to credit risk is equal to the potential amount of financial assets. For the yearsyear ended November 30, 20162017, two customers accounted for substantially all the revenue and all the accounts receivable of the Company. For the year ended November 30, 2015,2016, Par accounted for substantially all the revenue and all the accounts receivable of the Company.
The Company is also exposed to credit risk at period end from the carrying value of its cash. The Company manages this risk by maintaining bank accounts with a Canadian Chartered Bank. The Company’s cash is not subject to any external restrictions.
(c)
Foreign exchange risk
The Company has balances in Canadian dollars that give rise to exposure to foreign exchange (“FX”) risk relating to the impact of translating certain non-U.S. dollar balance sheet accounts as these statements are presented in U.S. dollars. A strengthening U.S. dollar will lead to a FX loss while a weakening U.S. dollar will lead to a FX gain. For each Canadian dollar balance of $1.0 million, a +/- 10% movement in the Canadian currency held by the Company versus the U.S. dollar would affect the Company’s loss and other comprehensive loss by $0.1 million.
November 30, 2016 | November 30, 2015 | |||
Canadian | U.S. | Canadian | U.S. | |
| FX rates used to translate to U.S. | 1.3,429 | 1.3,353 | ||
$ | $ | $ | $ | |
| Assets | ||||
| Cash | 182,714 | 136,059 | 116,096 | 86,944 |
182,714 | 136,059 | 116,096 | 86,944 | |
| Liabilities | ||||
| Accounts payable | 449,900 | 335,021 | 1,372,196 | 1,027,631 |
| Employee cost payable | 1,402,108 | 1,044,151 | 233,906 | 175,171 |
| Capital lease | 19,914 | 14,829 | 48,231 | 36,120 |
1,871,922 | 1,394,001 | 1,654,333 | 1,238,922 | |
Net exposure | (1,689,208) | (1,257,942) | (1,538,237) | (1,151,978) |
(d)
Liquidity risk
Liquidity risk is the risk that the Company will encounter difficulty raising liquid funds to meet commitments as they fall due. In meeting its liquidity requirements, the Company closely monitors its forecasted cash requirements with expected cash drawdown.
Intellipharmaceutics International Inc.
Notes to the consolidated financial statements
November 30, 2017, 2016 and 2015
(Stated in U.S. dollars)
17.
Financial instruments (continued)
(d) Liquidity risk (continued)
The following are the contractual maturities of the undiscounted cash flows of financial liabilities as at November 30, 2016:2017:
November 30, 2016 | ||||||
Less than | 3 to 6 | 6 to 9 | 9 months | Greater than | ||
3 months | months | months | to 1 year | 1 year | Total | |
$ | $ | $ | $ | $ | $ | |
| Third parties | ||||||
| Accounts payable | 807,295 | - | - | - | - | 807,295 |
| Accrued liabilities | 384,886 | - | - | - | - | 384,886 |
| Capital lease (note 9) | 5,437 | 5,585 | 3,807 | - | - | 14,829 |
| Related parties | ||||||
| Employee costs payable (Note 8) | 707,547 | - | - | 336,604 | - | 1,044,151 |
| Convertible debenture (Note 7) | 59,138 | 1,515,770 | - | - | - | 1,574,908 |
1,964,303 | 1,521,355 | 3,807 | 336,604 | - | 3,826,069 | |
November 30, 2017 | ||||||
| Less than | 3 to 6 | 6 to 9 | 9 months | Greater than | ||
| 3 months | months | months | to 1 year | 1 year | Total | |
$ | $ | $ | $ | $ | $ | |
| Third parties | ||||||
| Accounts payable | 2,060,084 | - | - | - | - | 2,060,084 |
| Accrued liabilities | 782,369 | - | - | - | - | 782,369 |
| Related parties | ||||||
| Employee costs payable | 214,980 | - | - | - | - | 214,980 |
| Convertible debenture (Note 7) | 66,973 | 40,805 | 40,805 | 1,363,749 | - | 1,512,332 |
| 3,124,406 | 40,805 | 40,805 | 1,363,749 | - | 4,569,765 | |
18.
The Company's operations comprise a single reportable segment engaged in the research, development and manufacture of novel and generic controlled-release and targeted-release oral solid dosage drugs. As the operations comprise a single reportable segment, amounts disclosed in the financial statements for revenue, loss for the year,period, depreciation and total assets also represent segmented amounts. In addition, all of the Company's long-lived assets are in Canada. The Company’s license and commercialization agreement with Par accounts for substantially all of the revenue of the Company.
November 30, | November 30, | |||||
2016 | 2015 | 2014 | 2017 | 2016 | 2015 | |
$ | $ | |||||
| Revenue | ||||||
| United States | 2,247,002 | 4,093,781 | 8,769,693 | 5,504,452 | 2,247,002 | 4,093,781 |
2,247,002 | 4,093,781 | 8,769,693 | 5,504,452 | 2,247,002 | 4,093,781 | |
| Total assets | ||||||
Canada | 7,974,689 | 5,224,299 | 7,875,035 | 7,396,781 | 7,974,689 | 5,224,299 |
| Total property and equipment | ||||||
Canada | 1,889,638 | 1,759,438 | 1,618,897 | 3,267,551 | 1,889,638 | 1,759,438 |
EXHIBIT INDEX
| Number | Exhibit | Footnote |
| 1.1 | Articles of Incorporation of the Company and Amendments thereto | (7) |
| 1.2 | By-Laws of the Company | (7) |
| 4.1 | IPC Arrangement Agreement | (7) |
| 4.2 | The acknowledgement and agreement of the Company dated October 22, 2009 to be bound by the performance based stock option agreement dated September 10, 2004 pursuant to which Drs. Isa and Amina Odidi are entitled to purchase up to 2,763,940 of the Company’s shares upon payment of U.S.$3.62 per share, subject to satisfaction of the performance vesting conditions | (7) |
| 4.3 | The amended and restated promissory note dated October 22, 2009 for up to $2,300,000 issued by Intellipharmaceutics Corp. to Isa Odidi and Amina Odidi | (7) |
| 4.51 | Securities purchase agreement for February 1, 2011 private placement | (6) |
| 4.52 | Registration rights agreement for February 1, 2011 private placement | (6) |
| 4.53 | Combined Series A/B common share purchase warrant for February 1, 2011 private placement | (6) |
| 4.54 | Placement Agent Agreement between Intellipharmaceutics International Inc. and Roth Capital Partners, LLC, dated March 9, 2012 | (8) |
| 4.55 | Form of Subscription Agreement (incorporated by reference to Exhibit A attached to Exhibit 4.54 | (8) |
| 4.56 | 12% convertible term debenture dated January 10, 2013 in principal amount of $1,500,000 | (5) |
| 4.57 | Lease as amended between Finley W. McLachlan Ltd. and Intellipharmaceutics Corp. for premises at 30 Worcester Road, Toronto, Ontario, Canada. | (5) |
| 4.58 | Placement Agent Agreement between Intellipharmaceutics International Inc. and Roth Capital Partners, LLC, Brean Capital, LLC and Maxim Group, LLC, dated March 19, 2013 | (9) |
| 4.59 | Form of Subscription Agreement (incorporated by reference to Exhibit A attached to Exhibit 4.58) | (9) |
| 4.60 | Form of Warrants (incorporated by reference to Exhibit B attached to Exhibit 4.58) | (9) |
| 4.61 | Underwriting Agreement between Intellipharmaceutics International Inc. and Maxim Group, LLC, as representative of the underwriters named in Schedule I thereto, dated July 26, 2013 | (10) |
| 4.62 | Form of Warrants | (10) |
| 4.63 | Equity Distribution Agreement between Intellipharmaceutics International Inc. and Roth Capital Partners, LLC, dated November 27, 2013 | (11) |
4.64(†) | License and Commercialization Agreement dated as of November 21, 2005, between Intellipharmaceutics Corp., and Par Pharmaceutical, Inc., as amended by the First Amendment To License and Commercialization Agreement dated as of August 12, 2011, and as further amended by the Second Amendment to License and Commercialization Agreement dated as of September 24, 2013 | (4) |
| 4.65 | Fifth Amendment to Lease Agreement dated November 28, 2014 between Finley W. McLachlan Properties Inc. and Intellipharmaceutics Corp. for premises at 30 Worcester Road, Toronto, Ontario, Canada | (3) |
| 4.66 | Extension of Debenture Maturity Date dated October 1, 2014 to that certain 12% convertible term debenture dated January 10, 2013 in principal amount of $1,500,000 | (3) |
| 4.67 | Indenture of Lease dated as of December 1, 2015 between Finley W. McLachlan Properties Inc. and Dufferin Lumber And Supply Company Limited, and Intellipharmaceutics Corp. for premises at 22 Worcester Road and 30 Worcester Road, Toronto, Ontario, Canada | (2) |
| 4.68 | Extension of Debenture Maturity Date dated as of June 29, 2015 to that certain 12% convertible term debenture dated January 10, 2013 in principal amount of $1,500,000 | (2) |
| 4.69 | Extension of Debenture Maturity Date dated as of December 8, 2015 to that certain 12% convertible term debenture dated January 10, 2013 in principal amount of $1,500,000 | (2) |
| 4.70 | Underwriting Agreement between Intellipharmaceutics International Inc. and Dawson James Securities, Inc., dated May 27, 2016. | (12) |
| 4.71 | Form of Common Share Purchase Warrant | (12) |
| 4.72 | Extension of Debenture Maturity Date dated as of May 26, 2016 to that certain 12% convertible term debenture dated January 10, 2013 | (1) |
| 4.73 | Extension of Debenture Maturity Date dated as of December 1, 2016 to that certain 12% convertible term debenture dated January 10, 2013 | (1) |
| 4.74(††) | License and Commercial Supply Agreement dated effective October 11, 2016, between Mallinckrodt LLC and Intellipharmaceutics Corp. | (1) |
| 8.1 | List of subsidiaries | (1) |
| 11.1 | Code of Business Conduct and Ethics | (7) |
| 12.1 | Certification of the Chief Executive Officer pursuant to Rule 13a-14(a) of the Securities Exchange Act of 1934 | (1) |
| 12.2 | Certification of the Chief Financial Officer pursuant to Rule 13a-14(a) of the Securities Exchange | (1) |
| 13.1 | Certification of the Chief Executive Officer pursuant to Section 906 of the Sarbanes-Oxley Act of 2002 | (1) |
| 13.2 | Certification of the Chief Financial Officer pursuant to Section 906 of the Sarbanes-Oxley Act of 2002 | (1) |
| 15.1 | Consent of Independent Registered Public Accounting Firm (MNP LLP) | (1) |
| 15.2 | Consent of Independent Registered Public Accounting Firm (Deloitte LLP) | (1) |
| 16.1 | Letter dated February 27, 2017 of Deloitte LLP, as required by Item 16F of Form 20-F | (1) |
| 101 | XBRL (Extensible Business Reporting Language). The following materials from Intellipharmaceutics International Inc.’s Annual Report on Form 20-F for the fiscal year-ended November 30, 2016, formatted in XBRL: | (1) (13) |
(i) Consolidated balance sheets as at November 30, 2016 and 2015 | ||
(ii) Consolidated statements of operations and comprehensive loss for the years ended November 30, 2016, 2015 and 2014 | ||
(iii) Consolidated statements of shareholders’ equity (deficiency) for the years ended November 30, 2016, 2015 and 2014 | ||
(iv) Consolidated statements of cash flows for the years ended November 30, 2016, 2015 and 2014 | ||
(v) Notes to the consolidated financial statements | ||
| (1) | Filed as exhibits to this annual report on Form 20-F for the fiscal year ended November 30, 2016. | |
| (2) | Incorporated herein by reference to the Company’s annual report on Form 20-F for the fiscal year ended November 30, 2015 as filed on March 21, 2016. | |
| (3) | Incorporated herein by reference to the Company’s annual report on Form 20-F for the fiscal year ended November 30, 2014 as filed on February 27, 2015. | |
| (4) | Incorporated herein by reference to the Company’s Amendment No. 1 on Form 20-F/A for the fiscal year ended November 30, 2013 as filed on April 14, 2014. | |
| (5) | Incorporated herein by reference to the Company’s annual report on Form 20-F for the fiscal year ended November 30, 2012 as filed on January 31, 2013. | |
| (6) | Incorporated herein by reference to the Company’s annual report on Form 20-F for the fiscal year ended November 30, 2010 as filed on May 31, 2011. | |
| (7) | Incorporated herein by reference to the Company’s annual report on Form 20-F for the fiscal year ended November 30, 2009 as filed on June 1, 2010. | |
| (8) | Incorporated herein by reference to the Company’s report on Form 6-K for the month of March 2012 as filed on March 9, 2012. | |
| (9) | Incorporated herein by reference to the Company’s report on Form 6-K for the month of March 2013 as filed on March 19, 2013. | |
| (10) | Incorporated herein by reference to the Company’s report on Form 6-K for the month of July 2013 as filed on July 26, 2013 (SEC Accession No. 0001171843-13-002968). | |
| (11) | Incorporated herein by reference to the Company’s report on Form 6-K for the month of November 2013 as filed on November 27, 2013. | |
| (12) | Incorporated herein by reference to the Company’s report on Form 6-K for the month of May 2016 as filed on May 27, 2016. | |
| (13) | XBRL information is furnished and not filed or a part of a registration statement or prospectus for purposes of Sections 11 or 12 of the Securities Act of 1933, as amended, is deemed not filed for purposes of Section 18 of the Securities Exchange Act of 1934, as amended, and otherwise is not subject to liability under these sections. |
| Number | Exhibit |
| 1.1 | |
| 1.2 | |
| 4.1 | |
| 4.2 | |
| 4.3 | |
| 4.51 | |
| 4.52 |
115
��
| 4.65 | |
| 4.66 | |
| 4.67 | |
| 4.68 | |
| 4.69 | |
| 4.70 | |
| 4.71 | |
| 4.72 | |
| 4.73 | |
| 4.74(†) | |
| 4.75 | |
| 4.76 |
| 4.77 | |
| 4.78 | |
| 4.79(1) | |
| 4.80(1) | |
| 8.1(1) | |
| 11.1 | |
| 12.1(1) | |
| 12.2(1) | |
| 13.1(1) | |
| 13.2(1) | |
| 15.1(1) | |
| 15.2(1) | |
| 16.1 | |
| 101(1)(2) | XBRL (Extensible Business Reporting Language). The following materials from Intellipharmaceutics International Inc.'s Annual Report on Form 20-F for the fiscal year-ended November 30, 2017, formatted in XBRL: |
| (i) Consolidated balance sheets as at November 30, 2017 and 2016 | |
| (ii) Consolidated statements of operations and comprehensive loss for the years ended November 30, 2017, 2016 and 2015 | |
| (iii) Consolidated statements of shareholders' equity (deficiency) for the years ended November 30, 2017, 2016 and 2015 | |
| (iv) Consolidated statements of cash flows for the years ended November 30, 2017, 2016 and 2015 | |
(v) Notes to the consolidated financial statements | |
| (1) | Filed as exhibits to this annual report on Form 20-F for the fiscal year ended November 30, 2017. |
| (2) | XBRL information is furnished and not filed or a part of a registration statement or prospectus for purposes of Sections 11 or 12 of the Securities Act of 1933, as amended, is deemed not filed for purposes of Section 18 of the Securities Exchange Act of 1934, as amended, and otherwise is not subject to liability under these sections. |
(†) Confidential treatment has been granted for certain portions of this exhibit. Omitted portions have been filed separately with the Securities and Exchange Commission.
SIGNATURES
The registrant hereby certifies that it meets all of the requirements for filing on Form 20-F and that it has duly caused and authorized the undersigned to sign this annual report on its behalf.
Intellipharmaceutics International Inc.
/s/ Domenic Della PennaAndrew Patient
Chief Financial Officer (Principal Financial Officer)
Intellipharmaceutics International Inc.
February 27, 201728, 2018