UNITED STATES
SECURITIES AND EXCHANGE COMMISSION
Washington, D.C. 20549
SECURITIES AND EXCHANGE COMMISSION
Washington, D.C. 20549
SCHEDULE 14A
Proxy Statement Pursuant to Section 14(a) of the
Securities Exchange Act of 1934
Securities Exchange Act of 1934
Filed by the Registrant ☒
Filed by a Party other than the Registrant ☐
Check the appropriate box:
☐
Preliminary Proxy Statement
☐
Confidential, for Use of the Commission Only (as permitted by Rule 14a-6(e)(2))
☒
Definitive Proxy Statement
☐
Definitive Additional Materials
☐
Soliciting Material Pursuant to Rule 14a-12
Global Business Travel Group, Inc.
(Name of Registrant as Specified in its Charter)
(Name of Person(s) Filing Proxy Statement, if other than the Registrant)
Payment of filing fee (Check all boxes that apply):
☒
No fee required
☐
Fee paid previously with preliminary materials
☐
Fee computed on table in exhibit required by Item 25(b) per Exchange Act Rules 14a-6(i)(1) and 0-11

Global Business Travel Group, Inc.
666 3rd Avenue, 4th Floor
New York, NY 10017
666 3rd Avenue, 4th Floor
New York, NY 10017
April 21, 202324, 2024
Dear Stockholder:
You are cordially invited to attend Global Business Travel Group, Inc.’s Annual Meeting of Stockholders on Tuesday,Wednesday, June 6, 2023,5, 2024, at 10:9:00 a.m., Eastern Time, online at http://www.virtualshareholdermeeting.com/GBTG2023.GBTG2024.
The matters to be acted on at the Annual Meeting of Stockholders are described in the enclosed notice and proxy statement.
We realize that you may not be able to attend the Annual Meeting of Stockholders and vote your shares at the meeting. However, regardless of your meeting attendance, we need your vote. We urge you to ensure that your shares are represented by voting in advance of the meeting on the Internet or via a toll-free telephone number, as instructed in the Notice Regarding the Internet Availability of Proxy Materials, or if you have elected to receive a paper or e-mail copy of the proxy materials, by completing, signing and returning the proxy card that is provided. If you decide to attend the Annual Meeting of Stockholders, you may revoke your proxy at that time and vote your shares at such meeting.
We look forward to receiving your proxy and perhaps seeing you at the Annual Meeting of Stockholders.
Sincerely,
/s/ Paul Abbott
Paul Abbott
Chief Executive Officer
Chief Executive Officer
Global Business Travel Group, Inc.
666 3rd Avenue, 4th Floor
New York, NY 10017
666 3rd Avenue, 4th Floor
New York, NY 10017
NOTICE OF ANNUAL MEETING OF STOCKHOLDERS
TO BE HELD ON TUESDAY,WEDNESDAY, JUNE 6, 20235, 2024
You are cordially invited to attend the Annual Meeting of Stockholders (the “Annual Meeting”) of Global Business Travel Group, Inc. (the “Company,” “GBTG,” “we,” “us” or “our”), to be held on Tuesday,Wednesday, June 6, 2023,5, 2024, at 10:9:00 a.m., Eastern Time, online at http://www.virtualshareholdermeeting.com/GBTG2023.GBTG2024.
At the Annual Meeting, stockholders will be invited to consider and vote upon the following matters:
1.
Election of threefour Class III directors to serve for a three-year term of office expiring at the 20262027 annual meeting of stockholders and until his or her successor has been elected and qualified, or until his or her earlier death, resignation or removal;
2.
Ratification of the appointment of KPMG LLP as our independent registered public accounting firm for the fiscal year ending December 31, 2023;
3. Any other matter that properly comes before the Annual Meeting.
The foregoing items of business are more fully described in the proxy statement accompanying this Notice of Annual Meeting of Stockholders.
The boardBoard of directorsDirectors has fixed the close of business on April 12, 202315, 2024 as the record date for the determination of stockholders entitled to notice of, and to vote at, the Annual Meeting and any postponement or adjournment thereof. A list of stockholders entitled to vote at the Annual Meeting will be available for examination during ordinary business hours for 10 days prior to the Annual Meeting at our principal executive office at 666 3rd Avenue, 4th Floor, New York, NY 10017. Your vote is very important to the Company and all proxies are being solicited by the boardBoard of directors.Directors. So, whether or not you plan on attending the Annual Meeting, we encourage you to submit your proxy as soon as possible (i) by accessing the Internet site or by calling the toll-free number described in the proxy materials or (ii) by signing, dating and returning a proxy card or instruction form provided to you. By submitting your proxy promptly, you will save the Company the expense of further proxy solicitation. Please note that all votes cast by telephone or on the Internet must be cast prior to 11:59 p.m., Eastern Time, on June 5, 2023.4, 2024.
By Order of the Board of Directors,
/s/ Eric J. Bock
Eric J. Bock
Chief Legal Officer, Global Head of M&A and Compliance and Corporate Secretary
Chief Legal Officer, Global Head of M&A and Compliance and Corporate Secretary
April 21, 202324, 2024
New York, New York
New York, New York
TABLE OF CONTENTS
| CERTAIN RELATIONSHIPS AND RELATED PERSON TRANSACTIONS | ||||||||||||
i
Global Business Travel Group, Inc.
666 3rd Avenue, 4th Floor
New York, NY 10017
666 3rd Avenue, 4th Floor
New York, NY 10017
PROXY STATEMENT
INFORMATION ABOUT THE ANNUAL MEETING AND PROXY MATERIALS
General
This proxy statement is furnished to stockholders of Global Business Travel Group, Inc., a Delaware corporation (the “Company” or “GBTG”), in connection with the solicitation of proxies for use at the Annual Meeting of Stockholders of the Company (the “Annual Meeting”) to be held on Tuesday,Wednesday, June 6, 2023,5, 2024, at 10:9:00 a.m., Eastern Time, online at http://www.virtualshareholdermeeting.com/GBTG2023.GBTG2024. This solicitation of proxies is made on behalf of our boardthe Board of directors.Directors.
Important Notice Regarding the Availability of Proxy Materials for the
Annual Meeting to be Held onTuesday,Wednesday, June 6, 20235, 2024
Annual Meeting to be Held on
Pursuant to the rules adopted by the U.S. Securities and Exchange Commission (the “SEC”), we have elected to provide access to our proxy materials over the Internet. Accordingly, we are sending a Notice Regarding the Internet Availability of Proxy Materials (the “Internet Notice”) to certain of our stockholders of record. We are also sending a paper copy of the proxy materials and proxy card to other stockholders of record who have indicated they prefer receiving such materials in paper form. Brokers and other nominees who hold shares on behalf of beneficial owners will be sending their own similar Internet Notice. Such Internet Notice, or this proxy statement and proxy card or voting instruction form, as applicable, is being mailed to our stockholders on or about April 21, 2023.24, 2024. This proxy statement and our 20222023 Annual Report on Form 10-K that was filed with the SEC on March 21, 202313, 2024 (the “2022“2023 Annual Report”) are available free of charge at proxyvote.com.
What Are You Voting On?
You will be asked to vote on the following proposals at the Annual Meeting:
1.
Election of threefour Class III directors to serve for a three-year term of office expiring at the 20262027 annual meeting of stockholders and until his or her successor has been elected and qualified, or until his or her earlier death, resignation or removal;
2.
Ratification of the appointment of KPMG LLP as our independent registered public accounting firm for the fiscal year ending December 31, 2023;
3. Any other matter that properly comes before the Annual Meeting.
Who Can Vote?
At the close of business on April 12, 202315, 2024 (the “Record Date”), there were 69,498,992472,617,208 shares of our Class A common stock, par value $0.0001 per share (“Class A Common Stock”), and 394,448,481 shares of our Class B common stock, par value $0.0001 per share (“Class B Common Stock”) outstanding all of which are entitled to vote, together as a single class, with respect to all matters to be acted upon at the Annual Meeting. Our Class A Common Stock and Class B Common Stock are collectivelyis referred to herein as
Only holders of record of shares of our common stock as of the close of business on the Record Date are entitled to receive notice of, and to vote at, the Annual Meeting. Each share of common stock entitles the holder thereof to one vote. Your shares of common stock may be voted at the Annual Meeting, or any adjournment or postponement thereof, only if you are present in person at the virtual meeting or your shares are represented by a valid proxy.
Difference Between a Stockholder of Record and a “Street Name” Holder
If your shares are registered directly in your name, you are considered the stockholder of record with respect to those shares.
1
If your shares are held in a stock brokerage account or by a bank, trust or other nominee, then the broker, bank, trust or other nominee is considered to be the stockholder of record with respect to those shares. However, you are still considered to be the beneficial owner of those shares, and your shares are said to be held in “street name.” Street name holders generally cannot submit a proxy or vote their shares directly and must instead instruct the broker, bank, trust or other nominee how to vote their shares using the methods described below under the heading “Voting Your Shares.”
Quorum
The presence of a majority of the outstanding shares of our common stock entitled to vote constitutes a quorum. A quorum is required in order to hold and conduct business at the Annual Meeting. Your shares are counted as present at the Annual Meeting if you:
•
Are present in person at the virtual Annual Meeting; or
•
Have properly submitted a proxy card by mail or submitted a proxy by telephone or over the Internet.
If you submit your proxy, regardless of whether you abstain from voting on one or more matters, your shares will be counted as present at the Annual Meeting for the purpose of determining a quorum. If your shares are held in “street name,” your shares are counted as present for purposes of determining a quorum if your broker, bank, trust or other nominee submits a proxy covering your shares. Your broker, bank, trust or other nominee is entitled to submit a proxy covering your shares as to certain “routine” matters, even if you have not instructed your broker, bank, trust or other nominee on how to vote on those matters. Please see below under “— “ — Broker Non-Votes.Non-Votes.”
Voting Your Shares
The Annual Meeting will be held entirely online this year. You may vote in person by attending the virtual Annual Meeting or by submitting a proxy. The method of voting by proxy differs (i) depending on whether you are viewing this proxy statement on the Internet or receiving a paper copy and (ii) for shares held as a record holder and shares held in “street name.”
If you are a record holder, you may vote by submitting a proxy over the Internet or by telephone by following the instructions on the website referred to in the proxy card or the Internet Notice mailed to you.
Alternatively, if you received a paper copy of your proxy card, you may vote your shares by submitting a proxy over the Internet or by telephone by following the instructions on the proxy card, or by completing, dating and signing the proxy card that was included with this proxy statement and promptly returning it in the pre-addressed, postage-paid envelope provided to you.
If your shares are held in “street name,” your broker, bank or other street name holder will provide you with instructions that you must follow to have your shares voted.
Deadline for Submitting Your Proxy on the Internet or by Telephone
Internet and telephone voting will close at 11:59 p.m., Eastern Time, on June 5, 2023.4, 2024. Stockholders who submit a proxy through the Internet should be aware that they may incur costs to access the Internet, such as usage charges from telephone companies or Internet service providers and that these costs must be borne by the stockholder. Stockholders who submit a proxy by Internet or telephone need not return a proxy card or the voting instruction form forwarded by your broker, bank, trust or other nominee by mail.
YOUR VOTE IS VERY IMPORTANT. Please submit your vote in advance even if you plan to attend the Annual Meeting.
Voting at the Annual Meeting
If you plan to attend the Annual Meeting, you may vote during the virtual meeting. Please note that if your shares are held in “street name” and you wish to vote during the meeting, you must obtain a proxy issued in your name from your broker, bank or other street name holder. Even if you intend to attend the Annual Meeting, we encourage you to submit your proxy or voting instructions to vote your shares in advance of the Annual Meeting. Please see the important instructions and requirements below under “— “- Attendance at the Annual Meeting.Meeting.”
Changing Your Vote
As a stockholder of record, if you vote by proxy, you may revoke that proxy at any time before it is voted at the Annual Meeting. Stockholders of record may revoke a proxy prior to the Annual Meeting by (i) delivering a written notice of revocation to the attention of the Corporate Secretary, Global Business Travel Group, Inc., at our principal executive office at 666 3rd Avenue, 4th Floor, New York, NY 10017, (ii) duly submitting a later-dated proxy over the
2
Internet, by mail, or if applicable, by telephone, or (iii) attending the virtual Annual Meeting and voting during the meeting. Attendance at the Annual Meeting will not, by itself, revoke a proxy.
If your shares are held in the name of a broker, bank, trust or other nominee, you may change your voting instructions by following the instructions of your broker, bank, trust or other nominee.
If You Receive More Than One Proxy Card or Internet Notice
If you receive more than one proxy card or Internet Notice, it means you hold shares that are registered in more than one account. To ensure that all of your shares are voted, sign and return each proxy card or, if you submit a proxy by telephone or the Internet, submit one proxy for each proxy card or Internet Notice you receive.
How Your Shares Will Be Voted
Shares represented by proxies that are properly executed and returned, and not revoked, will be voted as specified. YOUR VOTE IS VERY IMPORTANT.
If You Do Not Specify How You Want Your Shares Voted
If you are the record holder of your shares and submit your proxy without specifying how your shares are to be voted, your shares will be voted as follows:
•
FOR the election of each of the threefour nominees for Class III directors;
•
FOR the ratification of the appointment of KPMG LLP as our independent registered public accounting firm for the fiscal year ending December 31, 2023;2024.
In addition, the proxy holders named in the proxy are authorized to vote in their discretion on any other matters that may properly come before the Annual Meeting and at any postponement or adjournment thereof. The boardBoard of directorsDirectors knows of no other items of business that will be presented for consideration at the Annual Meeting other than those described in this proxy statement.
Broker Non-Votes
A “broker non-vote” occurs when a nominee holding shares for a beneficial owner has not received voting instructions from the beneficial owner and does not have discretionary authority to vote the shares. If you hold your shares in street name and do not provide voting instructions to your broker or other nominee, your shares will be considered to be broker non-votes and will not be voted on any proposal on which your broker or other nominee does not have discretionary authority to vote. Shares that constitute broker non-votes will be counted as present at the Annual Meeting for the purpose of determining a quorum, but will not be considered entitled to vote on the proposal in question. Brokers generally have discretionary authority to vote on the ratification of the selection of KPMG LLP as our independent registered public accounting firm. Brokers do not have discretionary authority, however, to vote on director elections, the say-on-pay proposal or the say-on-frequency proposal.elections.
Votes Required
The following table summarizes the voting requirements and the effects of broker non-votes or abstentions on each of the proposals to be voted on at the Annual Meeting:
| Proposals | Required Vote | Effect of Broker Non-Votes | Effect of Abstentions | |||||||||||||||||||||||||||||||
| 1. | Election of Directors | Majority of votes cast for each nominee | None | None | ||||||||||||||||||||||||||||||
| 2. | Ratification of the Appointment of Independent Registered Public Accounting Firm | Majority of votes cast | None | None | ||||||||||||||||||||||||||||||
Inspector of Election
All votes will be tabulated by the inspector of election appointed for the Annual Meeting, who will separately tabulate affirmative and negative votes, abstentions and broker non-votes.
3
Solicitation of Proxies
We will bear the cost of soliciting proxies. Copies of solicitation materials will be furnished to banks, brokerage houses, fiduciaries and custodians holding shares of our common stock in their names that are beneficially owned by others to forward to those beneficial owners. We may reimburse persons representing beneficial owners for their costs of forwarding the solicitation materials to the beneficial owners. Original solicitation of proxies may be supplemented by telephone, facsimile, electronic mail or personal solicitation by our directors, officers or other employees. No additional compensation will be paid to our directors, officers or other employees for such services.
Attendance at the Annual Meeting
You may attend the Annual Meeting, as well as vote and submit questions during the Annual Meeting, by visiting http://www.virtualshareholdermeeting.com/GBTG2023.GBTG2024. You will need your unique control number, which appears in the Internet Notice, the proxy card or voting instructions that accompanied the proxy materials. In the event that you do not have a control number, please contact your broker, bank or other nominee as soon as possible so that you can be provided with a control number and gain access to the meeting.
4
PROPOSAL 1 — ELECTION OF DIRECTORS
•
•The Class III directors are Raymond Donald Joabar, Gloria Guevara Manzo, Michael Gregory (Greg) O’Hara and Itai Wallach, and their terms will expire at the 2025 annual meeting of stockholders; and
•The Class I directors are Paul Abbott, Eric Hart and Kathleen Winters, and their terms will expire at the Annual Meeting;
At each annual meeting of stockholders, upon the expiration of the term of a class of directors, each director in the class, or the successor to each such director in the class, is elected to serve from the time of election and qualification until the third annual meeting following his or her election and until his or her successor is duly elected and qualified, in accordance with our certificate of incorporation. Any increase or decrease in the number of directors is distributed among the three classes so that, as nearly as possible, each class will consist of one-third of the directors.
Our Retiring Director
Richard Petrino will not stand for re-election at our Annual Meeting. We thank him for his years of dedicated service and wish him continued success in the future.
Class III Director Nominees for Election — Term Expiring 20262027
The current term of the Class III directors will expire at the Annual Meeting. Our boardAccordingly, the Board of directorsDirectors nominated each of Paul Abbott, Eric HartMohammed Saif S.S. Al-Sowaidi, James Bush and Kathleen WintersSusan Ward for re-election and Alexander Drummond for election at the Annual Meeting as a Class III director to hold office until the annual meeting of stockholders to be held in 20262027 and until his or her successor is duly elected and qualified or until his or her earlier death, resignation or removal. The nominees have consented to serve a term as Class III directors. Should any of the nominees become unable to serve for any reason prior to the Annual Meeting, subject to the terms of the amended and restated shareholders agreement dated May 27, 2022,January 11, 2024, (the “Shareholders Agreement”) by and between GBTG, GBT JerseyCo Limited (“GBT”GBT JerseyCo”), American Express Travel Holdings Netherlands Coöperatief U.A.International, Inc. (“Amex HoldCo.”), Juweel Investors (SPC) Ltd (“Juweel”) and EG Corporate Travel Holdings LLC (“Expedia”), and QH Travel L.P. ("QIA") the boardBoard of directorsDirectors may designate a substitute nominee, in which event the persons named in the enclosed proxy will vote for the election of such substitute nominee, or may reduce the number of directors on the boardBoard of directors.Directors. See “Certain“Certain Relationships and Transactions — Shareholders Agreement”Agreement” for additional information regarding the Shareholders Agreement.
Below is a biography of each of the Class I directorsII director nominee standing for re-electionelection at the Annual Meeting:
Mohammed Saif S.S. Al-Sowaidi
Mohammed Saif S.S. Al-Sowaidi, 42, has served as a member of the Company’s Board of Directors since May 27, 2022. Mr. Al-Sowaidi previously served on the Board of Directors of GBT JerseyCo from June 2014 until the closing of our business combination with Apollo Strategic Growth Capital (the "Business Combination") on May 27, 2022. Since April 2020, Mr. Al-Sowaidi has served as the Chief Investment Officer - North and South Americas, for the Qatar Investment Authority, where he leads QIA’s investments across various asset classes in the Americas region. Mr. Al-Sowaidi is also a member of the QIA executive committee. Mr. Al-Sowaidi was President — Qatar Investment Authority US Office, in New York for the period 2015-2020, where Mr. Al-Sowaidi established QIA’s office in New York to support QIA growth in the United States. Mr. Al-Sowaidi joined QIA in 2010 and has held multiple roles, such as Portfolio Manager for the TMT Portfolio, Industrial Portfolio and Head of the Private Equity Funds Portfolio. Before joining QIA, Mr. Al-Sowaidi was a Director, Corporate Banking at Masraf Al-Rayan covering the Government and Real Estate Sectors from 2006-2010 and Financial Analyst at ExxonMobil Treasury in Qatar from 2004-2006. Mr. Al-Sowaidi became a CFA Charterholder in 2013 and obtained his MBA from the TRIUM Program in 2018. Mr. Al-Sowaidi holds double major Bachelor’s Degrees in Statistics and Finance from the University of Missouri - Columbia. Mr. Al-Sowaidi’s experience in business, investment management and corporate finance led the Board of Directors to conclude that he should serve as a director for the Company.
5
James Bush
James Bush, 66, has served as a member of the Company’s Board of Directors since May 27, 2022. Mr. Bush previously served on the Board of Directors of GBT JerseyCo from January 2020 until the closing of the Business Combination on May 27, 2022. Mr. Bush joined American Express in 1986 and served various marketing, customer service and operations roles before becoming Executive Vice President and General Manager of the new Strategic Alliances Group in 2000. Before retiring from American Express in 2018, Mr. Bush served as a Senior Advisor to the new chief executive officer, with a special focus on growth opportunities in Asia. In his most recent role from 2015 to 2018, Mr. Bush was President, Global Network and International Card Services, responsible for all consumer business outside the United States and all global bank partnerships. As Executive Vice President, World Service from 2009 to 2015 and Executive Vice President, US Service Delivery from 2005 to 2009, Mr. Bush led customer care as well as global operations, card processing and credit and fraud management. From 2001 to 2005, Mr. Bush was the Regional President, Japan/Asia Pacific/Australia. Mr. Bush is a member of the Board of Trustees and the President’s Council at Valley Health System in New Jersey, the Corporate Board of Jupiter Medical Center in Jupiter, Florida and the Board of Trustees of Rider University. Mr. Bush previously served on the Board of Webster Financial Corporation and was a member of the Global Policy Forum at Penn State University. Mr. Bush received his B.S. in Accounting from Rider University. Mr. Bush’s extensive business experience, including as a senior executive officer of American Express, led the Board of Directors to conclude that he should serve as a director for the Company.
Alexander Drummond
Alexander Drummond, 43, has served as the Chief Strategy Officer at American Express since July 2021. Mr. Drummond is responsible for the company’s medium-to-long term enterprise-wide strategy, running the company’s long-range planning process and ensuring alignment between the enterprise, business unit, and mergers and acquisitions strategies. Mr. Drummond also serves as Chairman of the Board of American Express Carte France, American Express’ French legal entity. Prior to joining American Express, Mr. Drummond was a Managing Director and Partner at Boston Consulting Group (BCG) where he led Payments and Transaction Banking for North America and was part of BCG’s global payments management team. During Mr. Drummond's time at BCG, he also led payments projects in growth strategy, large scale cost transformation, customer journey reimagination efforts, cobrand negotiation and turnaround, and strategic due diligence for both North American and European financial institutions. Mr. Drummond received his MBA from INSEAD in Singapore and a master’s degree in electrical engineering from Université Catholique de Louvain. Mr. Drummond was nominated to the Board of Directors by American Express pursuant to the Shareholders Agreement. Mr. Drummond's extensive experience in business, strategy and technology, including as a senior executive officer of American Express, led the Board of Directors to conclude that he should serve as a director for the Company.
Susan Ward
Susan Ward, 63, has served as a member of the Company’s Board of Directors since May 27, 2022. Ms. Ward previously served on the Board of Directors of GBT JerseyCo from September 20, 2021 until the closing of the Business Combination on May 27, 2022. Ms. Ward has served on the Board of Directors of Saia, Inc. (Nasdaq: SAIA) since November 2019 and Ecovyst Inc. (NYSE: ECVT) since June 2020. Ms. Ward is the retired Chief Accounting Officer of UPS, a role in which she served from 2015 to 2019, with her career spanning more than 25 years. At UPS, she held a variety of roles within Finance & Accounting as well as Operations. Her experience includes Corporate Finance, Mergers & Acquisitions, Global Risk Management, Pension Investments, External Reporting, Corporate Accounting, and Internal Audit. Ms. Ward’s experience also includes P&L responsibility for a United States small package operation and the design and execution of a global finance and accounting functional transformation, which was targeted to save annually through technology enabled solutions such as data analytics, artificial intelligence and robotics. Prior to joining UPS, Ms. Ward served as a Senior Manager at Ernst & Young in both New York City and Atlanta where her industry experience included real estate, telecommunications and entrepreneurial businesses. Ms. Ward received her Bachelors in Accounting from St. Bonaventure University and her MBA in Finance from Fordham University. Ms. Ward also attended the Leadership and Strategic Impact Executive Program at the Tuck School of Business at Dartmouth College. Ms. Ward is a Certified Public Accountant. Ms. Ward’s extensive experience in business, corporate finance and accounting led the Board of Directors to conclude that she should serve as a director for the Company.
Required Vote
Each director will be elected by a majority of the votes cast (i.e., the number of shares voted FOR a nominee must exceed the number of shares voted AGAINST that nominee, excluding abstentions).
THE BOARD OF DIRECTORS UNANIMOUSLY RECOMMENDS A VOTE IN FAVOR OF THE ABOVE NOMINEES FOR ELECTION AS CLASS II DIRECTORS TO THE BOARD.
6
Class I and III Directors Continuing in Office
Below are biographies of the directors continuing in office:
Raymond Donald Joabar
Raymond Donald Joabar, 58, has served as a member of the Company’s Board of Directors since May 27, 2022. Mr. Joabar previously served on the Board of Directors of GBT JerseyCo from October 2019 until the closing of the Business Combination on May 27, 2022. Mr. Joabar joined American Express in 1992 and has served in a wide variety of senior roles. Mr. Joabar is Group President of American Express’ Global Merchant & Network Services (“GMNS”) organization. In this position, he leads the team that oversees relationships with the millions of merchants around the world that accept American Express, as well as the team that runs American Express’ payment network and manages bank partnerships globally. Mr. Joabar is a member of the American Express Executive Committee, which is responsible for developing the company’s strategic direction and determining key policies affecting the company overall. Prior to his role as Group President, GMNS, Mr. Joabar served as Chief Risk Officer of American Express and AENB from September 2019 to May 2021. As Chief Risk Officer, Mr. Joabar was responsible for developing American Express’ and the AENB’s risk appetite, ensuring safety and soundness, and strengthening the control and compliance environment. Prior to this, Mr. Joabar served as President of the International Consumer Services and Global Travel and Lifestyle Services group at American Express, where he helped lead the development of the country-by-country strategy that led to accelerated growth in the company’s top strategic international markets. Mr. Joabar received his B.S. in Electrical Engineering from the University of Michigan and his MBA from Manchester Business School. He currently serves on the Board of Directors of the Lincoln Center Theatre and the American Associates of the National Theatre. Mr. Joabar’s extensive experience in business and risk management, including as a senior executive officer of American Express, led the Board of Directors to conclude that he should serve as a director for the Company.
Gloria Guevara Manzo
Gloria Guevara Manzo, 56, has served as a member of the Company’s board since May 27, 2022. Ms. Guevara Manzo has served as Chief Special Advisor for the Ministry of Tourism of Saudi Arabia since May 2021. Prior to joining the Ministry of Tourism of Saudi Arabia, Ms. Guevara Manzo was President and Chief Executive Officer of the World Travel & Tourism Council, the body that represents global private travel and tourism worldwide, from August 2017 to May 2021. Ms. Guevara Manzo began her career at NCR Corp in 1989 and in the travel industry in 1995 working at Sabre Travel Network and Sabre Holdings. Ms. Guevara Manzo later served as Chief Executive Officer of JV Sabre Mexico, reporting to a Board of Directors from Aeromexico, Mexicana, and Sabre Holdings. In March 2010, Ms. Guevara Manzo was appointed by President Felipe Calderon as Secretary of Tourism for Mexico, and in addition, was given the full responsibility of the Mexican Tourism Board. Ms. Guevara Manzo formerly served on the Board of Directors of HSBC Mexico, Playa Hotels & Resorts (Nasdaq: PLYA) and other organizations. Ms. Guevara Manzo was Special Advisor on Government Affairs to Harvard University’s School of Public Health and was part of the Future for Travel, Tourism and Aviation Global Agenda Council of the World Economic Forum. Ms. Guevara Manzo received her B.S. in Computer Science from Anahuac University and MBA from Kellogg School of Business, Northwestern University. Ms. Guevara Manzo’s extensive experience in business and public service led the Board of Directors to conclude that she should serve as a director for the Company.
Michael Gregory (Greg) O’Hara
Michael Gregory (Greg) O’Hara, 58, has served as the Chairman of the Company’s Board of Directors since May 27, 2022. Mr. O'Hara previously served as the Chairman of GBT JerseyCo from June 2014 until the closing of the Business Combination on May 27, 2022. Mr. O’Hara is the Founder and Senior Managing Director of Certares Management LLC (“Certares”), a firm founded in 2012 that invests in the travel, tourism and hospitality sectors. Prior to forming Certares, Mr. O’Hara served as Chief Investment Officer of JPMorgan Chase’s Special Investments Group (“JPM SIG”). Prior to this role at JPM SIG, Mr. O’Hara was a Managing Director of One Equity Partners (“OEP”), the private equity arm of JPMorgan. Before joining OEP in 2005, he served as Executive Vice President of Worldspan and was a member of its Board of Directors. Mr. O’Hara serves on the Boards of Directors of Certares Holdings, CK Opportunities Fund, Certares Real Estate Holdings, Tripadvisor (Nasdaq: TRIP) and Hertz Global Holdings (Nasdaq: HTZ). Mr. O'Hara also serves as chairman of the Board of Directors of the World Travel & Tourism Council. Mr. O’Hara’s extensive experience in business and investment management led the Board of Directors to conclude that he should serve as a director for the Company.
Itai Wallach
Itai Wallach, 36, has served as a member of the Company’s board since May 27, 2022. Mr. Wallach is a partner in the Private Equity group of Apollo, which he joined in 2012. Mr. Wallach also currently serves on the Board of Directors of Arconic and Cengage Group, and previously served on the Board of Directors of Qdoba Restaurant Corporation from January 2022 to September 2022, McGraw-Hill Education from March 2017 to July 2021, Smart & Final from June 2019 to July 2021, Smart Stores Holding Corp. from April 2019 to April 2020, The Fresh Market from January 2017 to December 2020 and Jacuzzi Brands from February 2017 to February 2019. Prior to joining
7
Apollo, Mr. Wallach was a member of the Financial Sponsors Investment Banking group at Barclays Capital. He graduated with distinction as an Ivey scholar from the Richard Ivey School of Business at the University of Western Ontario with a Bachelor of Arts in Honors Business Administration. Mr. Wallach’s experience in investment management led the Board of Directors to conclude that he should serve as a director for the Company.
Paul Abbott
Paul Abbott, 54,55, has served as the Chief Executive Officer of the Company and as a member of the Company's Board of Directors since May 27, 2022 and2022. Mr. Abbott previously served as Chief Executive Officer of GBT JerseyCo from October 2019 until May 27, 2022 and as a memberthe closing of the Company’s board of directors sinceBusiness Combination on May 27, 2022. Prior to joining the Company, Mr. Abbott served in a variety of senior roles for 24 years at American Express Company and its consolidated subsidiaries (“American Express”), most recently as Chief Commercial Officer, Global Commercial Payments at American Express from February 2018 until September 2019. Mr. Abbott led the rapid and successful expansion of the American Express Business-to-Business Payments business around the world and introduced innovative new products and services to four million businesses of all sizes in over 150 countries. In addition, Mr. Abbott led the expansion of American Express’ card-issuing partnerships with some of the world’s largest financial institutions. Mr. Abbott previously worked at British Airways for nine years. Mr. Abbott received his postgraduate degree from Lancaster University. Mr. Abbott was recommended as a nominee to our boardthe Board of directorsDirectors by our Chairman of the boardBoard of directorsDirectors and stockholders. Mr. Abbott’s extensive business experience, including currently as Chief Executive Officer of the Company and previously as a senior executive officer of American Express, led the boardBoard of directorsDirectors to conclude that he should serve as a director for the Company.
Eric Hart
Eric Hart, 47,48, has served as a member of the Company’s boardBoard of directorsDirectors since May 27, 2022. Mr. Hart most recentlyis currently Chief Financial Officer of Plaid and previously served as the Chief Financial Officer of Expedia Group from April 2020 until October 2022, overseeing Expedia Group’s corporate development, accounting, financial reporting and analysis, investor relations, treasury, internal audit, tax and real estate teams. From December 2019 until April 2020, Mr. Hart served as acting Chief Financial Officer of Expedia Group after the departure of the former Chief Financial Officer. Mr. Hart also served as Expedia Group’s Chief Strategy Officer with responsibility for Expedia Group’s strategy and business development as well as global mergers & acquisitions and investments. Prior to assuming the Chief Strategy Officer position, Mr. Hart served as the General Manager of Expedia Group’s CarRentals.com brand for nearly three years. Prior to that, he oversaw corporate strategy for Expedia Group, leading some of Expedia Group’s largest acquisitions. Before joining Expedia Group, Mr. Hart spent time as a Vice President at Lake Capital, as a Project Leader at Boston Consulting Group, and as a Consultant at Accenture. Mr. Hart holds a bachelor’s degree from Georgia State University and a Master’s in Business Administration from University of Chicago Booth School of Business. Mr. Hart was nominated to our boardthe Board of directorsDirectors by Expedia, pursuant to the Shareholders Agreement as described below and the Transition & Services Agreement, dated September 14, 2022, between Mr. Hart and Expedia, Inc. Mr. Hart’s experience in corporate finance, corporate strategy and business development led the boardBoard of directorsDirectors to conclude that he should serve as a director for the Company.
Kathleen Winters
Kathleen Winters, 55,56, has served as a member of the Company’s boardBoard of directorsDirectors since May 27, 2022. Ms. Winters currently serves as a member of the boardBoard of directorsDirectors and Audit Committee of Definitive Healthcare (Nasdaq: DH), an industry leader in healthcare commercial intelligence. Ms. Winters served as Chief Financial Officer of ADP (Nasdaq: ADP), a leading global technology company providing human capital management solutions, from 2019 to 2021. As Chief Financial Officer, Ms. Winters guided ADP through the pandemic, accelerated meaningful digital and operational transformation and implemented a rigorous capital allocation program. Ms. Winters led ADP’s global finance organization and represented the company to stakeholders, communicating the company’s strategy, investments and financial performance. Ms. Winters oversaw Business Finance, Financial Planning and Analysis, Investor Relations, Tax, Treasury (including Client Fund Portfolio Investment), Controllership and Internal Audit. Prior to joining ADP, Ms. Winters served as Managing Director, Chief Financial Officer of MSCI Inc. (NYSE: MSCI), a leading provider of investment decision support tools for institutional investors, including indexes, from 2016 to 2019. Before joining MSCI, Ms. Winters spent fourteen years in various leadership roles at Honeywell International, including CFO of Performance Materials & Technologies, a $10 billion materials and services company, Corporate Controller and Global Leader of Financial Planning & Analysis. Prior to Honeywell, Ms. Winters began her career at PwC, serving clients primarily in the entertainment and media industries. Ms. Winters received her bachelor’s degree from Boston College, is a CPA and a Six Sigma Certified Black Belt. Ms. Winters was recommended as a nominee to our boardthe Board of directorsDirectors by the Chief Executive Officer and Chairman of the boardBoard of directors.Directors. Ms. Winters’s extensive experience in corporate finance led the boardBoard of directorsDirectors to conclude that she should serve as a director for the Company.
Board Diversity Matrix
(as of April21, 2023)24, 2024)
(as of April
| Total Number of Directors | | | 11 | | |||||||||||||||
| | | | Female | | | Male | | | Did Not Disclose | | |||||||||
| Gender Identity | | | | | 3 | | | | | | 6 | | | | | | 2 | | |
| Demographic Background | | ||||||||||||||||||
| Hispanic or Latinx | | | | | 1 | | | | | | — | | | | | | — | | |
| Middle Eastern | | | | | — | | | | | | 1 | | | | | | — | | |
| White | | | | | 2 | | | | | | 5 | | | | | | — | | |
| Did not Disclose Demographic Background | | | | | — | | | | | | — | | | | | | 2 | | |
| Total Number of Directors | 11 | |||||||||||||||||||||||||||||||||||||
| Female | Male | Did Not Disclose | ||||||||||||||||||||||||||||||||||||
| Gender | 3 | 6 | 2 | |||||||||||||||||||||||||||||||||||
Demographic Background | ||||||||||||||||||||||||||||||||||||||
| Hispanic or Latinx | 1 | — | — | |||||||||||||||||||||||||||||||||||
| Middle Eastern | — | 1 | 1 | |||||||||||||||||||||||||||||||||||
| White | 2 | 5 | — | |||||||||||||||||||||||||||||||||||
| Did not Disclose Demographic Background | — | — | 1 | |||||||||||||||||||||||||||||||||||
General Information About the Board of Directors
Director Attendance at Board of Directors, Committee and Annual Meetings
Director Independence
New York Stock Exchange (“NYSE”) listing standards require that a majority of a boardBoard of directorsDirectors be independent, subject to the controlled company exception. An “independent director” is defined generally as a person other than an officer or employee of the company or its subsidiaries or any other individual
having a relationship which in the opinion of the boardBoard of directors,Directors, would interfere with the director’s exercise of independent judgment in carrying out the responsibilities of a director.
We have sixseven “independent directors” as defined in the NYSE listing standards and applicable SEC rules, including James Bush, Gloria Guevara Manzo, Eric Hart, Michael Gregory (Greg) O’Hara, Mohammed Saif S.S. Al-Sowaidi, Susan Ward and Kathleen Winters. In addition, each of them qualifies as an independent director for the purpose of serving on the Audit and Finance Committee of the boardBoard of directorsDirectors under SEC rules.
Leadership Structure of ourthe Board of Directors
Our Corporate Governance Guidelines provide that the roles of chairman and chief executive officer may be either separate or combined. Our boardThe Board of directorsDirectors exercises its discretion in combining or separating these positions as it deems appropriate in the best interests of the Company, subject to the requirements of the Shareholders Agreement.
Currently, our boardthe Board of directorsDirectors is chaired by Mr. O’Hara and our Chief Executive Officer is Mr. Abbott. As a general policy, we believe separation of the positions of chairman and chief executive officer reinforces the independence of the boardBoard of directorsDirectors from management, creates an environment that encourages objective oversight of management’s performance and enhances the effectiveness of the boardBoard of directorsDirectors as a whole.
Board of Directors’ Role in Risk Oversight
Our management is responsible for identifying risks facing our Company, including strategic, financial, operational and regulatory risks, implementing risk management policies and procedures and managing our day-to-day risk exposure.
The Audit and Finance Committee discusses guidelines and policies governing the process by which senior management of the Company and the relevant departments of the Company, including the internal audit function, assess and manage the Company’s exposure to risk, as well as the Company’s major financial risk exposures and the steps management has taken to monitor and control such exposures.
The Compensation Committee reviews the compensation arrangements for the Company’s employees to evaluate whether incentive and other forms of pay encourage unnecessary or excessive risk taking, and reviews and discusses, at least annually, the relationship between risk management policies and practices, corporate strategy and the Company’s compensation arrangements.
9
The Nominating and Corporate Governance Committee recommends that the boardBoard of directorsDirectors establish such special committees as may be desirable or necessary from time to time in order to address ethical, legal or other matters that may arise.
The Risk Management and Compliance Committee reviews and assesses management’s identification of all risks and their relative weights; assesses the adequacy of management’s plan for risk control or mitigation, and, in coordination with the Audit and Finance Committee, disclosure of such risks; reviews and assesses the effectiveness of the Company’s regulatory corporate compliance framework and opportunities proposed by management and selected by the Risk Management and Compliance Committee for further review and assessment; and reviews, assesses and discusses: (i) any risks or other material exposures, (ii) the steps management has taken to minimize such risks or other exposures, (iii) the Company’s underlying policies with respect to risk assessment and risk management and (iv) the overall effectiveness of the Company’s culture of compliance.
In addition, the boardBoard of directorsDirectors is regularly presented with information at its regularly scheduled and special meetings regarding risks facing our Company, and management provides more frequent, informal communications to the boardBoard of directorsDirectors between regularly scheduled meetings which are designed to give the boardBoard of directorsDirectors regular updates about our business. The boardBoard of directorsDirectors considers this information and provides feedback, makes recommendations, and, as appropriate, authorizes or directs management to address particular exposures to risk.
Committees of the Board of Directors
Audit and Finance Committee
The Audit and Finance Committee consists of Susan Ward, who serves as the chair, James Bush and Kathleen Winters. Each of Susan Ward, James Bush and Kathleen Winters qualifies as an independent director under the corporate governance standards of the NYSE and the independence requirements of Rule 10A-3 of the Securities Exchange Act of 1934, as amended (the “Exchange Act”). The boardBoard of directorsDirectors has determined that each of Susan Ward and Kathleen Winters qualifies as an “audit committee financial expert” as such term is defined in Item 407(d)(5) of Regulation S-K. The functionsresponsibilities of the Audit and Finance Committee include, among other things:
•
evaluating the performance, independence and qualifications of our independent auditors and determining whether to retain our existing independent auditors or engage new independent auditors;
•
reviewing and approving the engagement of our independent auditors to perform audit services and any permissible non-audit services;
•
monitoring the rotation of partners of our independent auditors on our engagement team as required by law and considering whether, in order to assure continuing auditor independence, it is appropriate to adopt a policy of rotating the independent auditing firm on a regular basis;
•
reviewing relationships that may reasonably be thought to bear on our auditors’ independence, and assessing and otherwise taking the appropriate action to oversee the independence of our independent auditors;
•
reviewing our annual and quarterly financial statements and reports, including the disclosures contained under the caption “Management’s“Management’s Discussion and Analysis of Financial Conditions and Results of Operations”Operations” and discussing the statements and reports with our independent auditors and management;
•
overseeing the activities of the internal audit function, including its responsibilities, budget and staffing, and reviewing with management the progress and results of all internal audit projects;
•
reviewing with management our internal controls, including any special audit steps adopted in light of the discovery of material control deficiencies;
•
reviewing with our independent auditors and management significant issues that arise regarding accounting principles and financial statement presentation and matters concerning the scope, adequacy and effectiveness of our financial controls;
•
reviewing with management and our auditors any earnings announcements and other public announcements regarding material developments;
10
•
establishing procedures for the receipt, retention and treatment of complaints received by us regarding financial controls, accounting or auditing matters and other matters and the confidential, anonymous submission by our employees of concerns regarding questionable accounting or auditing matters;
•
preparing the report that the SEC requires in our annual proxy statement;
•
reviewing and providing oversight of any related person transactions and reviewing and monitoring compliance with legal and regulatory responsibilities related to financial matters, including our Code of Conduct;
•
reviewing our major financial risk exposures, including the guidelines and policies to govern the process by which risk assessment and risk management is implemented; and
•
reviewing and evaluating on an annual basis the performance of the Audit and Finance Committee, including compliance of the Audit and Finance Committee with its charter.
In addition, the Audit and Finance Committee carries out the functions assigned to the exchange committee (“Exchange Committee”) under the Exchange Agreement (as defined below), subject to our boardthe Board of directors’Directors’ reserved discretion to redelegatere-delegate such functions to a separate exchange committee that meets the requirements set forth in the Exchange Agreement.
Compensation Committee
The Compensation Committee consists of James Bush, who serves as the chair, Gloria Guevara Manzo and Michael Gregory (Greg) O’Hara. Each of James Bush, Gloria Guevara Manzo and Michael Gregory (Greg) O’Hara qualifies as an independent director under the corporate governance standards of the NYSE and as a “non-employee director” within the meaning of Rule 16b-3 of the Exchange Act. The functions of the Compensation Committee include, among other things:
•
reviewing, modifying and approving our overall compensation strategy and policies;
•
reviewing and approving the compensation and other terms of employment of our executive officers;
•
reviewing and approving performance goals and objectives relevant to the compensation of our executive officers and assessing their performance against these goals and objectives;
•
•reviewing, modifying, approving and administering theour equity incentive plans, compensation plans and similar programs, advisable for us, as well as modifying, amending or terminating existing plans and programs;
•
•establishing policies with respect to and considering the results of the most recent votes by our stockholders to approve executive compensation as required by Section 14A of the Exchange Act and determining our recommendations regarding the frequency of advisory votes on executive compensation;
•
retaining or terminating a compensation consultant or firm to be used to assist the Compensation Committee in benchmarking and setting appropriate compensation levels and policies and approving such consultant’s or firm’s fees and other retention terms;
•
establishing policies with respect to equity compensation arrangements;
•
reviewing and approving the terms of any employment agreements, severance arrangements, change in control protections and any other compensatory arrangements for our executive officers;
•
reviewing the adequacy of its charter on a periodic basis;
•
preparing the report that the SEC requires in our annual proxy statement; and
•
reviewing and assessing on an annual basis the performance of the Compensation Committee.
Compensation Consultant Independence. The Compensation Committee continually reviews the Company’s compensation program and meets regularly with Semler Brossy Consulting Group, LLC (“Semler Brossy”), its independent compensation consultant, to conduct a review of the Company’s compensation practices. The Compensation Committee has considered various factors bearing upon Semler Brossy’s independence including, but
11
not limited to, the fees received by Semler Brossy from GBTG as a percentage of Semler Brossy’s total revenue; Semler Brossy’s ownership of any GBTG stock, Semler Brossy’s policies and procedures designed to prevent conflicts of interest; and any business or personal relationships that could impact Semler Brossy’s independence. Upon completion of its review, the Compensation Committee determined that Semler Brossy was independent and that its engagement did not present any conflicts of interest. Semler Brossy reports directly to the Compensation Committee. The Compensation Committee considers input from the compensation consultant as one factor in making decisions with respect to compensation matters.
Compensation Policies and Practices Risk Assessment. The Compensation Committee has assessed compensation policies and practices for Company employees and has concluded that such policies and practices do not create risks that are reasonably likely to have a material adverse effect on the Company or its business. For further discussions of the risk assessment of our executive compensation programs, see the section below “Compensation Discussion & Analysis — Compensation Committee Review of Risk”.
Nominating and Corporate Governance Committee
The Nominating and Corporate Governance Committee consists of Michael Gregory (Greg) O’Hara, who serves as the chair, James Bush and Mohammed Saif S.S. Al-Sowaidi. Each of James Bush, Michael Gregory (Greg) O’Hara, James Bush and Mohammed Saif S.S. Al-Sowaidi qualifies as an independent director under the corporate governance standards of the NYSE. The functions of the Nominating and Corporate Governance Committee include, among other things:
•
identifying, reviewing and evaluating candidates to serve on the boardBoard of directorsDirectors consistent with criteria approved by the board;
•
determining the minimum qualifications for service on the board;
•
evaluating, nominating and recommending individuals for membership on the boardBoard of directors;
•
evaluating nominations by stockholders of candidates for election to the boardBoard of directors;
•
considering and assessing the independence of members of GBTG;
•
developing a set of corporate governance policies and principles, including a code of business conduct and ethics, periodically reviewing and assessing these policies and principles and their application and recommending to the boardBoard of directorsDirectors any changes to such policies and principles;
•
considering questions of possible conflicts of interest of directors as such questions arise;
•
•reviewing the adequacy of its charter on an annual basis; and
•
annually evaluating the performance of the Nominating and Corporate Governance Committee.
Risk Management and Compliance Committee
The Risk Management and Compliance Committee consists of Kathleen Winters, who serves as the chair, Raymond Donald Joabar, Richard Petrino, who will be stepping down and Alexander Drummond will be nominated as his replacement, Mohammed Saif S.S. Al-Sowaidi and Susan Ward. The functions of the Risk Management and Compliance Committee include, among other things:
•
assessing and providing oversight to management relating to the identification and assessment of material risks facing us, including strategic, operational, regulatory, information, cybersecurity, environmental/sustainability and external risks inherent in our business and the control processes with respect to such risks;
•
overseeing our risk management, compliance and control activities, including without limitation the development and execution by management of strategies to mitigate risks; and
•
overseeing the integrity of our systems of operational controls regarding legal and regulatory compliance.
12
Code of Conduct
of the Code of Conduct for executive officers and directors with respect to any element of the code of ethics definition enumerated in Item 406(b) of Regulation S-K. Any amendments or waivers to the Code of Conduct requiring disclosure under SEC rules and NYSE listing standards will be posted on our website.
Stockholder Communications with the Board of Directors
Stockholders of the Company wishing to communicate with the boardBoard of directorsDirectors or an individual director may send a written communication to the boardBoard of directorsDirectors or such director at the following address:
c/o Global Business Travel Group, Inc.
666 3rd Avenue, 4th Floor
New York, NY 10017
Attn: Corporate Secretary
666 3rd Avenue, 4th Floor
New York, NY 10017
Attn: Corporate Secretary
The Corporate Secretary will review each communication, and will forward such communication to the boardBoard of directorsDirectors or to any individual director to whom the communication is addressed unless the communication contains advertisements or solicitations or is unduly hostile, threatening or similarly inappropriate, in which case the Corporate Secretary shall discard the communication or inform the proper authorities, as may be appropriate.
13
PROPOSAL 2 —- RATIFICATION OF THE APPOINTMENT OF INDEPENDENT REGISTERED PUBLIC ACCOUNTING FIRM
The Audit and Finance Committee is responsible for the appointment, compensation, retention and oversight of the Company’s independent auditors. In connection with this responsibility, the Audit and Finance Committee evaluates and monitors the auditors’ qualifications, performance and independence. This responsibility includes a review and evaluation of the independent auditors. The Audit and Finance Committee approves all audit engagement fees and terms associated with the retention of the independent auditors.
As a matter of good corporate governance, the boardBoard of directorsDirectors is requesting our stockholders to ratify the Audit and Finance Committee’s selection of KPMG LLP as our independent registered public accounting firm for the fiscal year ending December 31, 2023.2024. KPMG LLP has served as GBT’sGBT JerseyCo’s independent registered public accounting firm since 2014. The Audit and Finance Committee and the boardBoard of directorsDirectors believe that the continued retention of KPMG LLP as our independent auditors is in the best interests of the Company. The Audit and Finance Committee carefully considered the selection of KPMG LLP as our independent auditors. The Audit and Finance Committee charter requires the Audit and Finance Committee to periodically consider whether the independent audit firm should be rotated. In addition to evaluating rotation of the independent auditors, the Audit and Finance Committee oversees the selection of the new lead audit partner and the Audit and Finance Committee chair participates directly in the selection of the new lead audit partner.
If the stockholders do not ratify the selection, the Audit and Finance Committee will reconsider its selection. Even if the selection is ratified, the Audit and Finance Committee, in its discretion, may direct the appointment of a different independent registered public accounting firm at any time during the year if the Audit and Finance Committee determines that such a change would be in the best interests of the Company and its stockholders.
Representatives from KPMG LLP are expected to be present at the Annual Meeting and will have an opportunity to make a statement at the Annual Meeting if they desire to do so and are expected to be available to respond to appropriate questions at the Annual Meeting.
Required Vote
Approval by the affirmative vote of a majority of votes cast by the holders of all of the shares of common stock that are entitled to vote on the matter is required to ratify the selection of KPMG LLP.
THE BOARD OF DIRECTORS UNANIMOUSLY RECOMMENDS THAT STOCKHOLDERS VOTE IN FAVOR OF THE RATIFICATION OF THE APPOINTMENT OF KPMG LLP AS OUR INDEPENDENT REGISTERED PUBLIC ACCOUNTING FIRM FOR THE FISCAL YEAR ENDING DECEMBER 31, 2023.2024.
Fees Billed by the Principal Accountant
The following table sets forth all fees billed for professional audit services and other services rendered by KPMG LLP for each of the years ended December 31, 20222023 and 2021:2022:
| | | | 2022 ($) | | | 2021 ($) | | ||||||
| | | | (in thousands) | | |||||||||
| Audit Fees(1) | | | | | 6,437 | | | | | | 7,520 | | |
| Audit-Related Fees(2) | | | | | 700 | | | | | | 659 | | |
Tax Fees(3) | | | | | 2,740 | | | | | | 2,679 | | |
Total(4) | | | | | 9,877 | | | | | | 10,858 | | |
| 2023 ($) | 2022 ($) | |||||||||||||||||||||||||
| (in thousands) | ||||||||||||||||||||||||||
Audit Fees(1) | 7,403 | 6,437 | ||||||||||||||||||||||||
Audit-Related Fees(2) | 412 | 700 | ||||||||||||||||||||||||
Tax Fees(3) | 1,893 | 2,740 | ||||||||||||||||||||||||
Total(4) | 9,708 | 9,877 | ||||||||||||||||||||||||
(1)
Audit Fees consist of fees for professional services rendered in connection with the audit of our annual consolidated financial statements, the review of the interim consolidated financial statements included
in quarterly reports, services rendered in connection with SEC registration statements and services that are normally provided by KPMG LLP, such as comfort letters, in connection with statutory and regulatory filings or engagements.
(2)
Audit-Related Fees consist of fees for assurance and related services that are reasonably related to the performance of the audit or review of our consolidated financial statements and are not reported under “Audit Fees.” These services include accounting consultations in connection with attestation services that are not required by statute or regulation, and consultations concerning financial accounting and reporting standards.
(3)
Tax Fees consist of fees for professional services rendered for tax compliance and tax advice.
(4)
The fees for the yearsyear ended December 31, 2022 and 2021 include those incurred for services provided by KPMG LLP to GBT JerseyCo until the closing of the Business Combination on May 27, 2022.
14
Audit and Finance Committee Pre-Approval Policy
Our Audit and Finance Committee is responsible for approving all audit, audit-related and certain other services specified in its charter. The Audit and Finance Committee reviews and, in its sole discretion, approves the independent auditors’ annual engagement letter, including the proposed fees contained therein, as well as all audit and all permitted non-audit engagements and relationships between the Company and the independent auditor (which approval should be made after receiving input from the Company’s management, if desired). Approval of audit and permitted non-audit services will be made by the Audit and Finance Committee or as otherwise provided for in a pre-approval policy approved by the Audit and Finance Committee.
15
AUDIT AND FINANCE COMMITTEE REPORT
The Audit and Finance Committee assists the Board of Directors in fulfilling its oversight responsibilities of the Company’s financial reporting process and the adequacy of the Company’s controls over financial reporting. Specifically, the responsibilities of the Audit and Finance Committee are set forth in its charter and further described above in the section titled “General Information About the Board of Directors – Committees of the Board of Directors – Audit and Finance Committee”. Management has the primary responsibility for the financial statements and the reporting process, while the independent auditors are responsible for performing an independent audit of the Company’s financial statements in accordance with the standards of the Public Company Accounting Oversight Board (United States) (“PCAOB”), expressing an opinion as to the conformity of the financial statements with generally accepted accounting principles in the United States of America (“GAAP”) and auditing the operating effectiveness of internal control over financial reporting.
In performing its oversight function, the Audit and Finance Committee, reviewed and discussed the Company's audited consolidated financial statements for the fiscal year ended December 31, 2022,2023, with our management and with ourKPMG LLP, the Company's independent registered public accounting firm, KPMG LLP.firm. In addition, the Audit and Finance Committee discussed with KPMG LLP the matters required to be discussed by the applicable requirements of the Public Company Accounting Oversight Board (the “PCAOB”)PCAOB and the SEC.Securities and Exchange Commission ("SEC"). The Audit and Finance Committee also discussed with KPMG LLP the written disclosures and the independence lettercommunications from KPMG LLP required by the applicable requirements of the PCAOB.
Based on its review and discussions with management and KPMG LLP described in the preceding paragraph,paragraphs, the Audit and Finance Committee recommended to the boardBoard of directorsDirectors that the Company's audited consolidated financial statements for the fiscal year ended December 31, 2022,2023 be included in the 20222023 Annual Report.Report on Form 10-K for the year ended December 31, 2023 filed with the SEC.
Audit and Finance Committee
Susan Ward (Chair)
James Bush
Kathleen Winters
James Bush
Kathleen Winters
The above Audit and Finance Committee Report is not soliciting material, is not deemed filed with the SEC and is not incorporated by reference in any of our filings under the Securities Act of 1933, as amended (the “Securities Act”), or the Exchange Act whether made before or after the date of this proxy statement and irrespective of any general incorporation language in any such filings.
16
PRINCIPAL STOCKHOLDERS
The following table sets forth information regarding beneficial ownership of our common stock as of the Record Date by:
•
each person, or group of affiliated persons, known by us to beneficially own more than 5% of our common stock;
•
each of our directors;
•
each of our NEOs;named executive officers ("NEOs"); and
•
all of our current executive officers and directors as a group.
The percentage ownership information is based on 69,498,992472,617,208 shares of Class A Common Stock and 394,448,481 shares of Class B Common Stock outstanding as of the Record Date, which for purposes of the table below include any shares of unvested restricted stock units that are held by such individual or entity over which such individual or entity has voting rights.
The number of shares beneficially owned by each stockholder is determined under rules issued by the SEC and includes voting or investment power with respect to securities. Under these rules, beneficial ownership includes any shares as to which the individual or entity has sole or shared voting power or investment power. In computing the number of shares beneficially owned by an individual or entity and the percentage ownership of that person, shares of common stock subject to equity awards or other rights held by such person that are currently exercisable or will become exercisable within 60 days after the Record Date, are considered outstanding, although these shares are not considered outstanding for purposes of computing the percentage ownership of any other person. Each of the stockholders listed has sole voting and investment power with respect to the shares beneficially owned by the stockholder unless noted otherwise, subject to community property laws where applicable.
| | | | Class A Common Stock Beneficially Owned | | | Class B Common Stock Beneficially Owned | | | Combined Total Voting Power | | |||||||||||||||||||||
Name of Beneficial Owner(1)(2) | | | Shares | | | Percent | | | Shares | | | Percent | | | Percent | | |||||||||||||||
| Five Percent Holders | | | | | | | | | | | | | | | | | | | | | | | | | | | | | | | |
Juweel Investors (SPC) Limited(3) | | | | | 162,388,084 | | | | | | 70.0% | | | | | | 162,388,084 | | | | | | 41.2% | | | | | | 35.0% | | |
American Express Company(4) | | | | | 157,786,199 | | | | | | 69.4% | | | | | | 157,786,199 | | | | | | 40.0% | | | | | | 34.0% | | |
Expedia Group, Inc.(5) | | | | | 74,274,198 | | | | | | 51.7% | | | | | | 74,274,198 | | | | | | 18.8% | | | | | | 16.0% | | |
Apollo Principal Holdings III GP, Ltd.(6) | | | | | 25,706,886 | | | | | | 37.0% | | | | | | — | | | | | | — | | | | | | 5.5% | | |
Entities affiliated with or managed by affiliates of Ares Management LLC(7) | | | | | 8,675,568 | | | | | | 12.5% | | | | | | — | | | | | | — | | | | | | 1.9% | | |
HG Vora Capital Management, LLC(8) | | | | | 8,200,000 | | | | | | 11.8% | | | | | | — | | | | | | — | | | | | | 1.8% | | |
Sabre Corporation(9) | | | | | 8,000,000 | | | | | | 11.5% | | | | | | — | | | | | | — | | | | | | 1.7% | | |
Zoom Video Communications, Inc.(10) | | | | | 4,000,000 | | | | | | 5.9% | | | | | | — | | | | | | — | | | | | | * | | |
| Directors and Named Executive Officers | | | | | | | | | | | | | | | | | | | | | | | | | | | | | | | |
| Paul Abbott | | | | | 17,739 | | | | | | * | | | | | | — | | | | | | — | | | | | | * | | |
Martine Gerow(11) | | | | | 1,158,332 | | | | | | 1.6% | | | | | | — | | | | | | — | | | | | | — | | |
| Andrew Crawley | | | | | — | | | | | | * | | | | | | — | | | | | | — | | | | | | * | | |
Michael Qualantone(12) | | | | | 438,117 | | | | | | * | | | | | | — | | | | | | — | | | | | | * | | |
Eric Bock(13) | | | | | 465,805 | | | | | | * | | | | | | — | | | | | | — | | | | | | — | | |
| James Bush | | | | | 17,500 | | | | | | * | | | | | | — | | | | | | — | | | | | | * | | |
| Eric Hart | | | | | — | | | | | | — | | | | | | — | | | | | | — | | | | | | — | | |
| Raymond Donald Joabar | | | | | — | | | | | | — | | | | | | — | | | | | | — | | | | | | — | | |
| Class A Common Stock Beneficially Owned | ||||||||||||||
Name of Beneficial Owner(1) | Shares | Percent | ||||||||||||
Five Percent Holders | ||||||||||||||
American Express International, Inc.(2) | 157,786,199 | 33.4% | ||||||||||||
Qatar Investment Authority(3) | 87,659,000 | 18.5% | ||||||||||||
Expedia Group, Inc.(4) | 74,849,607 | 15.8% | ||||||||||||
| BR Investors Juweel, L.P. | 39,446,374 | 8.3% | ||||||||||||
Apollo Principal Holdings III GP, Ltd.(5) | 25,706,886 | 5.4% | ||||||||||||
| Directors, Director Nominees and Named Executive Officers | ||||||||||||||
| Paul Abbott | 538,915 | * | ||||||||||||
| Andrew Crawley | 237,693 | * | ||||||||||||
Eric J. Bock(6) | 1,224,002 | * | ||||||||||||
| Martine Gerow | 10,000 | * | ||||||||||||
| Patricia Huska | 290,758 | * | ||||||||||||
| Karen Williams | 40,833 | * | ||||||||||||
James Bush(7) | 58,742 | * | ||||||||||||
| Alexander Drummond | — | — | ||||||||||||
Eric Hart(7) | 41,242 | * | ||||||||||||
Raymond Donald Joabar(7) | 41,242 | * | ||||||||||||
Gloria Guevara Manzo(7) | 41,242 | * | ||||||||||||
Michael Gregory O’Hara(7) | 41,242 | * | ||||||||||||
| Richard Petrino | 41,242 | * | ||||||||||||
| Mohammed Saif S.S. Al-Sowaidi | 41,242 | * | ||||||||||||
| Itai Wallach | — | — | ||||||||||||
Susan Ward(7) | 41,242 | * | ||||||||||||
Kathleen Winters(7) | 41,242 | * | ||||||||||||
| Directors and Executive Officers as a Group | ||||||||||||||
(20 Individuals)(8) | 5,034,718 | 1.1% | ||||||||||||
| | | | Class A Common Stock Beneficially Owned | | | Class B Common Stock Beneficially Owned | | | Combined Total Voting Power | | |||||||||||||||||||||
Name of Beneficial Owner(1)(2) | | | Shares | | | Percent | | | Shares | | | Percent | | | Percent | | |||||||||||||||
| Gloria Guevara Manzo | | | | | — | | | | | | — | | | | | | — | | | | | | — | | | | | | — | | |
| Michael Gregory O’Hara | | | | | — | | | | | | — | | | | | | — | | | | | | — | | | | | | — | | |
| Richard Petrino | | | | | — | | | | | | — | | | | | | — | | | | | | — | | | | | | — | | |
| Mohammed Saif S.S. Al-Sowaidi | | | | | — | | | | | | — | | | | | | — | | | | | | — | | | | | | — | | |
| Itai Wallach | | | | | — | | | | | | — | | | | | | — | | | | | | — | | | | | | — | | |
| Susan Ward | | | | | — | | | | | | — | | | | | | — | | | | | | — | | | | | | — | | |
| Kathleen Winters | | | | | — | | | | | | — | | | | | | — | | | | | | — | | | | | | — | | |
| Directors and Executive Officers as a Group | | | | | — | | | | | | — | | | | | | — | | | | | | — | | | | | | — | | |
(20 Individuals)(14) | | | | | 3,626,349 | | | | | | 5.0% | | | | | | — | | | | | | — | | | | | | * | | |
*
Represents beneficial ownership of less than 1%.
(1)
The business address of each director and executive officer of GBTG is c/o Global Business Travel Group, Inc., 666 3rd Avenue, 4th Floor, New York, NY 10017.
17
Based solely upon the Schedule 13D13D/A filed by JuweelAmerican Express Company with the SEC on June 6, 2022. Juweel is managed by its board of directors. The business address of Juweel is 350 Madison Avenue, 8th Floor, New York, NY 10017.
Based solely upon the Schedule 13D filed by Qatar Investment Authority with the SEC on January 17, 2024. Consists of securities held of record by QH Travel LP. The principal business address of this entity is Ooredoo Tower (Building 14), Al Dafna Street (Street 801), Al Dafna (Zone 61), PO Box 23224, Doha, State of Qatar.
(4)Based solely upon the Schedule 13D/A filed by Expedia Group, Inc. with the SEC on June 6, 2022.January 17, 2024. Consists of securities held of record by Expedia.Expedia HoldCo. The business address of such parties is 1111 Expedia Group Way W., Seattle, WA 98119.
Based solely upon the Schedule 13D/A filed by Apollo Principal Holdings III GP, Ltd. (“Principal III GP”) with the SEC on October 13, 2022. APSG Sponsor, L.P. (the “Sponsor”) is managed by affiliates of Apollo. AP Caps II Holdings GP, LLC (“Holdings GP”) is the general partner of Sponsor. Apollo Principal Holdings III, L.P. (“Principal III”) is the sole member of Holdings GP. Principal III GP serves as the general partner of Principal III. Messrs. Marc Rowan, Scott Kleinman and James Zelter are the directors of Principal III GP and as such may be deemed to have voting and dispositive control of the securities held of record by Sponsor. The address of each of the Sponsor and Holdings GP is c/o Walkers Corporate Limited, Cayman Corporate Centre, 27 Hospital Rd., George Town, Cayman Islands, KY1-9008. The address of each of Principal III and Principal III GP is c/o Intertrust Corporate Services, (Cayman) Limited, 190 Elgin Avenue, George Town, Cayman Islands, KY1-9008. The address of each of Messrs. Rowan, Kleinman and Zelter is 9 West 57th Street, 43rd Floor, New York, New York 10019.
Includes 1,148,331663,005 stock options that are exercisable within 60 days of the Record Date.
(8)Includes 371,303(i) 2,535,352 stock options that are exercisable within 60 days of the Record Date.Date and (ii) 183,672 restricted stock units scheduled to vest on June 5, 2024.
Delinquent Section 16(a) Reports
Section 16(a) of the Exchange Act requires the Company’s directors and executive officers and persons who beneficially own more than 10% of a registered class of the Company’s equity securities (“Reporting Persons”) to file with the SEC reports on Forms 3, 4 and 5 concerning their ownership of and transactions in the Class A Common Stock and other equity securities of the Company, generally within two business days of a reportable transaction. As a practical matter, the Company seeks to assist its directors and executives by monitoring transactions and completing and filing reports on their behalf.
To our knowledge, based solely on review of the copies of such reports and any amendments thereto furnished to us during or with respect to our most recent fiscal year, all Section 16(a) filing requirements applicable to the Reporting Persons were satisfied, with the exception of the following reports, which were filed late: (i) a Form 3 for Marlins Acquisition Corp., which became a beneficial owner of more than 10% of Class A Common Stock on May 27, 2022; (ii) a Form 3 for Ares Partners Holdco LLC and its affiliated entities, which became beneficial owners of more than 10% of Class A Common Stock on May 27, 2022; (iii) aMr. Mark Hollyhead's late Form 4 for Ares Partners Holdco LLC and its affiliated entities with respect to shares of Class A Common Stock purchased on May 31, June 1, June 2 and June 3, 2022; (iv) a Form 4 for Mr. Bock with respect to
18
INFORMATION ABOUT OUR EXECUTIVE OFFICERS
Biographical data for each of our current executive officers is set forth below, excluding Mr. Abbott’s biography, which is included in the Section entitled “Proposal 1 — Election of Directors.”
Eric J. Bock
Eric J. Bock, 58,59, has served as the Chief Legal Officer, Global Head of M&A and Corporate Secretary of GBT JerseyCo since October 2014 and has served as our Chief Legal Officer, Global Head of M&A and Compliance & Corporate Secretary since May 27, 2022. Prior to joining the Company, Mr. Bock served as Executive Vice President, Chief Legal Officer and Chief Administrative Officer, as well as Chief Compliance and Ethics Officer of Travelport Worldwide Limited (“Travelport”) and as a member of the boardBoard of directorsDirectors of eNett International, a leading provider of innovative, integrated payment solutions. In addition to playing an integral role in developing and implementing Travelport’s strategic plans, Mr. Bock was also Chairman of the Enterprise Risk Management Committee and a member of the Employee Benefits, Charitable, Disclosure and Investment Committees. Prior to joining Travelport, Mr. Bock served as Executive Vice President, Law and Corporate Secretary for Cendant Corporation, overseeing the company’s legal practice groups in securities and corporate finance, mergers and acquisitions, corporate secretarial and governance matters, executive compensation, travel distribution services and marketing services. Mr. Bock also served on Cendant Corporation’s Business Ethics Committee, Disclosure Committee, Employee Benefits Committee and Business Continuity Planning Committee. Before Cendant Corporation, Mr. Bock was an associate in the corporate group of Skadden, Arps, Slate, Meagher & Flom LLP. Mr. Bock received his B.A. from Lafayette College and his J.D. from Fordham University School of Law.
Andrew George Crawley
Andrew George Crawley, 56,57, has served as the President of the Company since January 2023, previously serving as the Chief Commercial Officer of GBT JerseyCo since April 2020 and has served as our Chief Commercial Officer since May 27, 2022. Mr. Crawley is also a non-executive director of Travelopia, a KKR portfolio company. Previously, Mr. Crawley served as Chief Executive Officer and Chairman of the boardBoard of directorsDirectors of International Airlines Group (“IAG”) Loyalty. In addition, Mr. Crawley was a member of the IAG Management Committee from January 2016 to March 2020. Prior to joining IAG Loyalty, Mr. Crawley served as Chief Executive Officer of IAG Cargo. Prior to joining IAG Cargo, Mr. Crawley served as Chief Commercial Officer and Executive Board Member at British Airways plc (“British Airways”). Mr. Crawley also served as Chairman of British Airways Holidays, Chairman of OpenSkies (British Airways’ wholly-owned French airline subsidiary) and a board member of Avios Group Ltd. Mr. Crawley started his travel career in British Airways in 1992 and worked in a variety of sales, marketing and operational roles in the United Kingdom, Europe and Asia, ultimately serving on the boardBoard of directorsDirectors of British Airways. Prior to joining British Airways, Mr. Crawley spent two years in advertising. Mr. Crawley received his BSc degree from London University (QMC). Mr. Crawley also completed the Advanced Management Program at Harvard Business School.
Mark Hollyhead
Mark Hollyhead, 53,54, has served as the Chief Product Officer & President of Egencia since September 2022. Mr. Hollyhead previously served as the President of Egencia since April 2021. Prior to joining the Company, Mr. Hollyhead served as Egencia’s Global Chief Operating Officer since 2016. Prior to serving as Egencia’s Global Chief Operating Officer, Mr. Hollyhead served as a Senior Vice President for the Americas with Egencia. Mr. Hollyhead has over 30 years of global experience in commercial, operations and product across the travel and telecommunications industries. Prior to joining Egencia, Mr. Hollyhead was the Head of Transformation with Vodafone. Prior to joining Vodafone, Mr. Hollyhead spent 15 years at British Airways in a variety of leadership positions including as Vice President of eCommerce and Customer Contact, and Head of Revenue Management for the long-haul business worldwide. Mr. Hollyhead completed his tenure at British Airways as the Head of London Heathrow Customer Operations where he was responsible for Terminals 1, 3 and 4. Mr. Hollyhead was also the Chair of the Terminal 5 passenger program that was tasked with designing the customer experience and the consolidation of all operations into one terminal. Mr. Hollyhead received his MBA in Strategy and Distribution from the City of London Westminster Business School and received a post graduate Diploma in Applied Economics at Birkbeck University of London.
Patricia Anne Huska
Patricia Anne Huska, 54,55, has served as the Chief People Officer of GBT JerseyCo since December 2018 and has served as our Chief People Officer since May 27, 2022. Prior to becoming Chief People Officer, Ms. Huska served as our Vice President of Global Human Resources, responsible for the development and execution of strategies aimed at attracting talent, while retaining and engaging the existing employee base. Ms. Huska also has significant merger and acquisition experience. Ms. Huska played a key role in the planning and creation of the joint venture established by American Express Company comprising the legacy GBT JerseyCo operations with a predecessor of Juweel and a
19
group of institutional investors led by an affiliate of Certares, as well as spearheading the HR integration of multiple acquisitions. Ms. Huska was previously with American Express from 1994 to 2014. Ms. Huska received her M.A. in Management from Lesley University and her B.A. in Business Administration from the University of Massachusetts at Amherst.
Evan Konwiser
Evan Konwiser, 41,42, has served as the Chief Marketing and Strategy Officer since September 2022. Mr. Konwiser previously served as the Executive Vice President, Product, Strategy and Communications of GBT JerseyCo since February 2020 and our EVP Product, Strategy and Communications since May 27, 2022. Prior to joining the Company, Mr. Konwiser served as co-founder and Chief Operating Officer of Skylark, a luxury leisure travel agency start-up. Mr. Konwiser previously built two other travel products: FlightCaster, which predicts flight delays real-time and was acquired in 2010, and Farely, which analyzes airline cost data for travel buyers. As part of the FlightCaster acquisition, Mr. Konwiser ran the travel business for Next Jump, which includes employee discount programs for Fortune 500 companies. Mr. Konwiser also spent several years consulting in the travel industry for travel management companies, airlines, global distribution systems and travel media companies. Mr. Konwiser has also been an advisor to travel start-ups including Safely, Suiteness, Olset (acquired by Deem), RocketMiles (acquired by Priceline), and GetGoing (acquired by BCD Travel). Prior to that, Mr. Konwiser was a consultant at Bain & Company and also worked at Kayak. Mr. Konwiser is a six-time Dragon / Critic at the Phocuswright Travel Innovation Summit and is the facilitator of the Phocuswright Young Leaders Summit. Mr. Konwiser previously served on The Board of Association of Corporate Travel Executives and was selected as one of the “25 Most Influential Business Travel Executives” of 2016. Mr. Konwiser received his B.A. and MBA degrees from Dartmouth.
Boriana Tchobanova
Boriana Tchobanova, 48,49, has served as the Chief Transformation Officer of GBT JerseyCo since May 2020 and has served as our Chief Transformation Officer since May 27, 2022. In this capacity, Ms. Tchobanova is a member of the Executive Leadership Team and leads business transformation, mergers and acquisitions integration, and strategic projects. Prior to joining GBT JerseyCo, Ms. Tchobanova held various positions at American Express where she led multiple operations and business transformation functions, and championed large
enterprise-wide changing initiatives. Ms. Tchobanova received her B.S. in Management and MBA degrees from the University of New Orleans.
David Thompson 56,
David Thompson, 57, has served as the Chief Information Technology Officer of GBT JerseyCo since November 2017 and has served as our Chief Technology Officer since May 27, 2022. Prior to joining the Company, Mr. Thompson served as Executive Vice President of Global Operations and Chief Technology Officer at The Western Union Company (“Western Union”), where he was responsible for overseeing the IT infrastructure needed to develop and support the next generation of Western Union money transfer and payment capabilities. Mr. Thompson has more than 20 years of experience in the technology industry. Prior to joining Western Union, Mr. Thompson served as Group President, Services and Support and Global CIO of Symantec Corporation. Prior to this role, Mr. Thompson served as Symantec Corporation’s EVP and CIO and, during his six years at the company, led an organization that offered expert solutions and support in information security, technology, availability and storage. Earlier in his career, Mr. Thompson served as SVP and CIO for Oracle Corp. and Vice President of Services and CIO at PeopleSoft, Inc. Mr. Thompson previously served over 10 years on the boardBoard of directorsDirectors for CoreSite Realty Corp. Mr. Thompson received his B.B.A. from Marymount University.
Karen Williams
Karen Williams, 48, has served as Chief Financial Officer of GBTG since July 2023. Ms. Williams previously served as SVP-Deputy Chief Financial Officer of GBTG since May 2022. Prior to joining the Company, Ms. Williams served as Senior Vice President of IHG® Hotels & Resorts, as Global Head of Strategy and Planning, where she led a global team overseeing the group strategy function. Prior to this role, Ms. Williams served as CFO of IAG Loyalty, IAG's centre of excellence for loyalty. Earlier in her career, Ms. Williams held numerous division CFO roles at America Express where she spent 15 years. Ms. Williams received her degree from the University of Leicester and is a qualified accountant (ACCA: Association for Chartered Certified Accountants).
20
COMPENSATION COMMITTEE REPORT
The Compensation Committee has reviewed and discussed the following Compensation Discussion and Analysis (“CD&A”) and, based on such review and discussions, the Compensation Committee recommended to our boardthe Board of directorsDirectors that this CD&A be included in this proxy statement.
Compensation Committee
James Bush (Chair)
Gloria Guevara Manzo
Michael Gregory(Greg) O’Hara
Gloria Guevara Manzo
Michael Gregory
21
COMPENSATION DISCUSSION & ANALYSIS
This CD&A describes the elements of our executive compensation philosophy and provides information about the objectives and components of our executive compensation program and how it operates for our NEOs. It also sets forth how the Compensation Committee arrived at the specific compensation policies and practices involving our NEOs during fiscal year 2022.2023. Our Compensation Committee may choose to implement different compensation programs for our NEOs and directors in the future.
| Name | Positions Held with the Company | ||||||||
| Paul Abbott | Chief Executive Officer | ||||||||
Karen Williams(1) | Chief Financial Officer | ||||||||
| Andrew Crawley | President | ||||||||
| Eric J. Bock | Chief Legal Officer, Global Head of Mergers & Acquisitions and Compliance and Corporate Secretary | ||||||||
| Patricia Huska | |||||||||
Martine Gerow(2) | Former Chief Financial Officer | ||||||||
(1)Ms. Williams has served as our Chief Financial Officer since July 1, 2023.
(2)Ms. Gerow served as our Chief Financial Officer from January 1 through June 30, 2023.
2023 Business Performance
Highlights
2023 was historic for the Company – it was our first full year as a public company and we once again delivered outstanding financial results, driven by continued share gains, and our focus on margin expansion.
| FY 2023 Highlights | Proof Points | ||||
| Outstanding financial performance | •$549M revenue and $80M Adjusted EBITDA in Q4 2023, up 83% or $37M year-over-year ("YOY") •FY 2023 results above initial guidance with revenue up 24% and Adjusted EBITDA +269% to $380M | ||||
| Continued share gains | •Record Total New Wins Value of $3.5B, including $2.2B from small and medium enterprises ("SME") •96% customer retention rate | ||||
| Operating leverage | •24% revenue growth vs. single-digit Adjusted Operating Expense growth in FY 2023 •Operating leverage drove FY 2023 Adjusted EBITDA margin expansion of 11ppts | ||||
| Positive cash flow and rapid deleveraging | •Positive full-year Free Cash Flow of $49M •Significant deleveraging to 2.3x1 at year-end 2023 vs. 8.9x at year-end 2022 | ||||
* Adjusted EBITDA, Adjusted EBITDA margin, Adjusted Operating Expenses and Free Cash Flow are non-GAAP measures and are defined and reconciled to the most comparable GAAP measures, net income/loss, EBITDA, total operating expenses, and net cash from (used in) operating activities, respectively, in our Annual Report on Form 10-K for the year ended December 31, 2023 in Item 7, “Management's Discussion and Analysis of Financial Condition and Results of Operations — EBITDA, Adjusted EBITDA, Adjusted EBITDA Margin and Adjusted Operating Expenses”.
22
Commercial Success in FY 2023 with Strong New Wins, Particularly in SME, and Higher Customer Retention Rate
| Commercial Leadership | Significant New Wins | Technology Leadership | ||||||||||||
 | ||||||||||||||
| $3.5B | 78% of transactions through digital channels in Q4 2023, +1pt vs. Q3 2023 | |||||||||||||
| Total New Wins Value | ||||||||||||||
| 96% |  | >60% of bookings now through our own platforms, Egencia and Neo | ||||||||||||
| Customer Retention Rate, +1ppt YOY | ||||||||||||||
40% Neo transaction growth in FY 2023 | ||||||||||||||
| $2.2B | ||||||||||||||
Record SME New Wins Value, +$100M YOY | 24% Egencia transaction growth in FY 2023 | |||||||||||||
| One of the world’s largest alternative asset managers | ||||||||||||||
| ~30% | Implementing AI-powered solutions to improve automation and productivity | |||||||||||||
| SME New Wins Value From Previously Unmanaged Customers, +5ppt YOY | One of the world’s largest financial services firms | |||||||||||||
Strong Financial Results in FY 2023
We delivered strong results in FY2023.
| FY 2023 Results | YOY % | |||||||
| Total Revenue | $2.29B | 24% | ||||||
Revenue Yield(1) | 8% | 0 ppt | ||||||
| Adjusted Operating Expenses | $1.91B | 9% | ||||||
| Adjusted EBITDA | $380M | 269% | ||||||
| Adjusted EBITDA Margin | 17% | 11 ppt | ||||||
| Net cash provided by operating activities | $162M | NM | ||||||
| Free Cash Flow | $49M | NM | ||||||
NM = Not meaningful.
(1)Revenue Yield is defined as Total Revenue divided by Total Transaction Value (TTV).
Executive Compensation Philosophy and Objectives
Executive compensation is a vital tool to attract and retain top talent and ensure that our corporate goals are met. Our compensation program is designed to be competitive and reward the achievement of our strategic, financial and operational objectives. We have designed our executive compensation program to achieve the following primary objectives:
•
•encourage behaviors that are in the best interests of our customers, stockholders and the goals of the organization;
•provide market competitive compensation and benefits that will attract, retain, motivate, and reward a talented team of executive officers,
•
reinforce our culture, including the welfare and workplace equity of our employees.
The Compensation Committee is responsible for overseeing ourfollowing are key characteristics of the Company’s executive compensation program, and determiningwhich we believe best serve the compensationinterests of our executive officers, including the NEOs. In carrying out its responsibilities, the Compensation Committee evaluates our compensation policiesstockholders and practices and, with the advice and support of Semler Brossy, focuses on the degree to which these policies and practices reflect our executive compensation philosophy and align with best compensation practices.promote good governance.
23
| What we do: | What we don't do: | ||||||||||
 | Compensation at-risk - A significant portion of our executives’ compensation is at-risk based on corporate performance. This includes a large portion of equity-based compensation to align the interests of our executive officers and stockholders. |  | Hedging/Pledging of Company Stock - We prohibit our officers and directors from hedging, pledging, short-selling, or publicly trading options in our stock. | ||||||||
| Diversified Short-Term Incentives - We establish clear, measurable, and appropriately rigorous performance goals and targets that are tied to key financial, customer and colleague goals, and generally have capped the maximum payouts. | | Provide Bonus Guarantees or Uncapped Incentives - We do not provide bonus guarantees and our program guidelines have a recommended range up to 150% of target. | ||||||||
| Executive Compensation Peer Group - We review our executive compensation peer group on an annual basis to evaluate the constituents for appropriate size and business fit. | | Change in Control Excise Tax Gross-ups - We do not pay excise tax gross-ups on change in control payments. | ||||||||
| Independent Compensation Consultant - We retain an independent compensation consultant that regularly meets with the Compensation Committee in executive session without management present. | | Limited perquisites - We provide our named executive officers with only limited perquisites and personal benefits. | ||||||||
| Compensation Risk Assessment - We review our compensation programs annually to ensure they do not pose a material risk to the Company. | | Repricing or Exchange of Out-of-the-Money Options - We prohibit option repricing without stockholder approval. | ||||||||
| Double Trigger Vesting Acceleration - Awards under our current equity incentive plan generally allow vesting in connection with a change in control only if the award recipient is terminated without cause or for good reason following a change in control. | | Single Trigger Vesting Acceleration - No awards granted under our current equity incentive plan will vest solely because of a change in control of the Company. | ||||||||
| Minimum Vesting Requirement - Awards granted under our current equity incentive plan generally are subject to a one-year minimum vesting requirement, with limited exceptions. | ||||||||||
| Stock Ownership Guidelines - We have stock ownership guidelines for executive officers to instill a sense of Company ownership, and to align executives’ interests with the interests of our stockholders. | ||||||||||
| Clawback Policy - We adopted a Dodd-Frank compliant clawback policy that allows the Company to recoup incentive compensation awarded to executive officers or other employees in the event of a material restatement of the Company’s financial statements or misconduct that has caused economic or reputational damage to the Company. | ||||||||||
Primary Components of Executive Compensation
| Component | Overview | Objectives | ||||||
| Annual Base Salary | Fixed compensation that is reviewed annually. | To provide NEOs with predictable fixed compensation at a level that is in line with market practice and similar roles. | ||||||
| Annual Incentive Compensation | Variable compensation that is based on achievement of Company performance goals. | To reward NEOs for achieving short-term critical performance goals. | ||||||
| Equity Compensation | Variable compensation that is tied to the Company's long-term growth. | To align the majority of compensation for NEOs to execute on long-term financial strategic goals that drive stockholder value creation and support the Company's retention strategy. | ||||||
24
Roles in Making Compensation Decisions
| Compensation Committee | •The Compensation Committee is responsible for helping to ensure that the compensation of our executive officers, including our named executive officers, is consistent with our executive compensation philosophy and objectives. •In the first quarter of each fiscal year, with input from its independent compensation consultant, Semler Brossy, the Compensation Committee oversees and approves key aspects of executive compensation, including our Chief Executive Officer’s and other executive officers’ annual base salaries, performance measures and cash awards paid under the annual incentive plan, and the size and structure of long-term equity awards. •In making executive compensation decisions, the Compensation Committee reviews a variety of information for each executive officer, including current total compensation and pay history, equity holdings, individual performance, and competitive market data and practices for comparable positions. Neither our CEO nor our other named executive officers are present when their specific compensation arrangements are approved by the Compensation Committee. | ||||
| Management | •Our Chief Executive Officer and Chief People Officer work closely with the Compensation Committee in managing the executive compensation program and attend meetings of the Compensation Committee. Other key stakeholders include Legal, for compliance and governance purposes, and Finance for goal setting purposes. •Our Chief Executive Officer makes recommendations to the Compensation Committee regarding compensation for executive officers other than himself. | ||||
| Independent Compensation Consultant | •The Compensation Committee’s independent compensation consultant, Semler Brossy, provides research, survey information and analysis, incentive design expertise and other analyses related to compensation levels and design. Semler Brossy also updates the Compensation Committee on trends and developments related to executive compensation practices and provides its views to the Compensation Committee on best practices when evaluating executive pay programs and policies. •In 2023, Semler Brossy’s services to the Compensation Committee included providing perspective on current trends and developments in executive and director compensation, analyzing benchmarking data and evaluating our peer group composition. The Compensation Committee evaluated whether any of the work provided by Semler Brossy during 2023 raised any conflict of interest and determined that it did not. | ||||
Comparative Market Data
To assist the Compensation Committee during its annual review of compensation, Semler Brossy prepared a comparative market data analysis on compensation practices of a peer group of comparable companies. The Compensation Committee reviewed and approved a peer group consisting of the twenty-fivenineteen United States-based publicly traded companies representing a blend of Hotel/Leisure, Commercial Services and IT/B2B companies. These approved peer group companies have revenues approximately between 0.250.33 to 4.03.0 times Company revenue and/or market capitalization between 0.250.20 to 3.010.0 times Company market capitalization. While we acknowledge that our fiscal year 2022 peer group contains a few companies thatThere are much larger in terms of revenue and market valuation than the rest of the group, we include them because they arelimited, public direct business and talent competitors in an industry where there are limited publiccomparators of the Company’s size therefore the emphasis was on selecting companies at our size.within the size range that have a similar scope of operations with a preference for the Professional Services industry. Below is a list of the companies in our peer group for fiscal year 2022:2023:
Fiscal Year 20222023 Peer Group Companies
| Black Knight, Inc. | |||||||||
| Marriott Vacations Worldwide Corporation | |||||||||
| Broadridge Financial Solutions, Inc. | |||||||||
| CBIZ, Inc. | |||||||||
| Choice Hotels International, Inc. | Travel + Leisure Co. | ||||||||
| Tripadvisor, Inc. | |||||||||
| TTEC Holdings, Inc. | |||||||||
| WEX Inc. | |||||||||
| Hyatt Hotels Corporation | |||||||||
25
The Compensation Committee uses the competitive market data as a guide when making decisions about total compensation, as well as individual elements of compensation; however, the Compensation Committee does not formally benchmark our NEOs’ compensation against this data. Instead, the Compensation Committee applies judgment and discretion in establishing targeted pay levels, taking into account not only competitive market data, but also factors such as Company, business and individual performance, scope of responsibility, critical needs and skill sets, leadership potential, experience and succession planning.
2023 Executive Compensation Program ElementsMix
Our executive compensation program is designed to align the interests of our NEOs with those of our stockholders. We believe that a significant portion of NEO compensation should be performance-based. We consider that such compensation should be “at risk” in order to incentivize performance. Our executive compensation program meets the goal of aligning with stockholder interests by delivering compensation in the form of equity and other performance-based awards.
Of the votes cast during our 2023 say-on-pay advisory vote, over 99% approved our executive compensation proposal.The charts below show the 20222023 mix of target compensation opportunity for Mr. Abbott and the average mix for the other active NEOs as a group.group(1).
![[MISSING IMAGE: pc_ceo-4c.jpg]](https://capedge.com/proxy/DEF 14A/0001104659-23-048472/pc_ceo-4c.jpg)
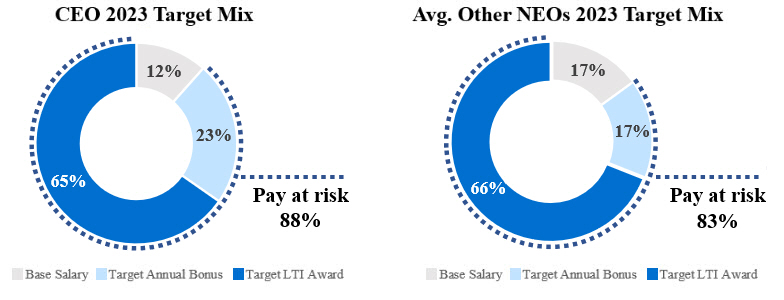
(1) Avg. Other NEOs 2023 Target Mix chart excludes Ms. Gerow.
The following describes each element of our executive compensation program.
Annual Base Salary
We provide base salary as a fixed source of compensation to our executives for their day-to-day responsibilities. As a general practice, our NEOs do not participate in the annual merit increase process. Any increase in base salary is generally tied to increases in scope of responsibility or to better align pay with market practice. In 2022,2023, base salaries established for each of our NEOs reflectedremained unchanged. In deciding to make no change, the Compensation Committee considered each individual’s responsibilities, experience, position, prior performance, competitive positioning frombased on Semler Brossy’s market analysis, and other discretionary factors our Compensation Committee deemsdeemed relevant.
The table below reflects the annual base salaries approved by the Compensation Committee for our NEOs during the fiscal years ended December 31, 2022 and December 31, 2021. Differences in base salary rates for Messrs. Abbott and Crawley are solely a result of changes in exchange rates. Ms. Gerow’s base salary rate also reflects the impact of exchange rate fluctuations, in addition to a ten percent increase. Ms. Gerow and Mr. Bock received base salary increases in 2022. Ms. Gerow’s increase was intended to align with external market analysis and to take into account the elimination, effective February 1, 2022, of her housing allowance. Mr. Bock’s increase reflects an increase in the scope of his responsibilities to include oversight of the compliance function as well as the discontinuation of a $25,000 annual cash perquisite.2023.
| Name | | | 2021 Base Salary Rate ($)(1) | | | 2022 Base Salary Rate ($) | | | Percentage Change (%)(2) | | |||||||||
| Paul Abbott(3) | | | | | 1,374,903 | | | | | | 1,240,000 | | | | | | — | | |
| Martine Gerow(3) | | | | | 597,395 | | | | | | 596,998 | | | | | | 10 | | |
| Andrew Crawley(3) | | | | | 893,687 | | | | | | 806,000 | | | | | | — | | |
| Michael Qualantone | | | | | 650,000 | | | | | | 650,000 | | | | | | — | | |
| Eric J. Bock | | | | | 600,000 | | | | | | 650,000 | | | | | | 8 | | |
26
| Name | 2022 Base Salary Rate ($) | 2023 Base Salary Rate ($) | Percentage Change (%) | |||||||||||||||||||||||||||||
Paul Abbott(1) | 1,240,000 | 1,240,000 | — | |||||||||||||||||||||||||||||
Karen Williams(1)(2) | n/a | 508,400 | — | |||||||||||||||||||||||||||||
Andrew Crawley(1) | 806,000 | 806,000 | — | |||||||||||||||||||||||||||||
| Eric J. Bock | 650,000 | 650,000 | — | |||||||||||||||||||||||||||||
Patricia Huska(2) | n/a | 500,000 | — | |||||||||||||||||||||||||||||
Martine Gerow(1) | 596,998 | 596,998 | — | |||||||||||||||||||||||||||||
(1)
Amounts for Messrs. Abbott and Crawley and Ms. Williams and Gerow have been paid in British pound sterling and converted for purposes of disclosure at an annual average exchange rate (based on monthly averages) equal to $1.24 per £1.00 for 20222023 and $1.37 per £1.00 for 20212022 (in each case, rounded to the nearest cent).
Annual Incentive Compensation
We maintain an annual incentive award plan (the “AIA Plan”) in order to align participants’ incentives with the Company’s financial, customer and colleague and strategic goals. Our employment agreements
with our NEOs provide that they will be eligible to participate in the AIA Plan up to a specified target percentage of their annual base salary. Achievement of these awards is based on the Company’s performance against the goals recommended by management and approved by the Compensation Committee and theCommittee. The Compensation Committee further takes into account an NEO’s individual performance as described below. In 2023, the weighting of our financial goals in the AIA Plan increased to 70% of the plan design, up from 50% in 2022. This is consistent with the compensation practices of our peers and provides greater alignment of NEO incentives to key drivers of stockholder return. For 2021 and 2022,2023, our Chief Executive Officer’s target bonus opportunity was 200% of annual base salary, with a maximum opportunity of 300% of annual base salary. Our other NEOs had a target bonus opportunity of 100% of annual base salary with a maximum opportunity ofand may be increased up to 200% of base salary. The Compensation Committee retains authority under the AIA Plan to award bonuses in excess of these limits.
Performance Metrics:
The Company goals for each fiscal year are proposed by management for the approval of the Compensation Committee. The metrics and targets for the Company goals reflect the short- and long-term business strategic priorities, the annual financial plan as approved by the Board in line with the long-term investor plan, external competitive data and best-in-class benchmarks, internal business aspirations and the compensation consultant's recommendations.
The AIA Plan reflects the Company’s performance goals approved by the Compensation Committee at the beginning of the applicable fiscal year, which include financial, customer &and colleague and strategic goals, in addition to individual performance components. For all of our NEOs, the Compensation Committee uses the same Company goals, in addition to individual performance, to determine annual incentive awards, which aligns our executives directly with our enterprise results.
The Compensation Committee evaluated the Company’s 20222023 performance results against the 20222023 AIA Plan performance goals. The Compensation Committee determined that the Company’s overall 2023 performance across the financial, customer & colleagues and strategiccolleague measures to be generally aboveachieved 146% of the 20222023 AIA Plan performance targetstargets. Management proposed to lower funding of the AIA Plan and took this into account when determining the NEOs combined performance rating factor. Compensation Committee exercised its discretion to reduce the funding, as described in more detail under the section “Fiscal Year 2023 Bonus Decisions”.
27
The Company’s performance outcomes, relative to targets, that the Compensation Committee took into consideration were as follows:
| Goal Weighting | | | 2022 Target Goal | | | 2022 Actual Performance | |
| Financial — 50% | | ||||||
Adjusted EBITDA Growth(1) | | | $470 million | | | $567 million | |
Adjusted EBITDA Fall Through(2) | | | 63% | | | 55% | |
| Customer & Colleagues — 25% | | ||||||
| Client Net Promoter Score | | | Performance met target goal | | |||
| Win/Loss Ratio | | | Record new wins with high customer retention exceeded target goal | | |||
| Employee Engagement Level | | | Colleague engagement survey results exceeded target engagement levels | | |||
| Strategic Initiatives — 25% | | ||||||
| Mergers & Acquisitions Delivery — Synergies | | | Significant progress integrating Egencia, exceeded synergy target goal | | |||
U.S. SME Growth (Win/Loss Ratio)(3) | | | Strong momentum in the growth of U.S. SME, which delivered results ahead of our target goal | | |||
| Digital Interactions Growth | | | Continued to innovate our products and services and exceeded target goal | | |||
Diversity, Equity & Inclusion Employee Sentiment(4) | | | Employee responses were 5% above the best-in-class target goal | | |||
| Sustainability | | | Achieved target of Platinum Accreditation and successful launch of the Sustainable Aviation Fuel program | | |||
| Goal Weighting | Target | 2023 Actual Performance | ||||||||||||
| 70% | Financial | |||||||||||||
| 45% | Adjusted EBITDA(1) | $330M | $380M | |||||||||||
| 25% | Cash from Operations less Capex | $(98)M | $49M | |||||||||||
| 15% | Customer | |||||||||||||
| 5% | Client NPS(2) | Exceeded our maximum performance level by delivering strong customer satisfaction and NPS results | Exceeds Target | |||||||||||
| 5% | Net New Wins(3) | Exceeded our maximum performance level though record new wins with high customer retention | Exceeds Target | |||||||||||
| 5% | Sustainability | Exceeded our sustainability targets by maintaining our EcoVadis Platinum accreditation and successfully growing the SAF(4) program, selling out the 1 million gallons of available SAF. Enhanced our comprehensive program of sustainability solutions. | Exceeds Target | |||||||||||
| 15% | Colleagues | |||||||||||||
| 5% | Employee Engagement Level | Continued strong employee engagement by meeting our objective of best-in-class standard | Meets Target | |||||||||||
| 5% | Diversity, Equity & Inclusion | DE&I exceeded our maximum performance level at 7 points above best-in-class standard | Exceeds Target | |||||||||||
| 5% | High Performing Retention (Manager & Above) | Employee retention exceeded our maximum performance level | Exceeds Target | |||||||||||
(1)
(2)
(3)
(4)
Fiscal Year 20222023 Bonus Decisions:
In addition to the Company performance metrics, our NEOs (other than Ms. Gerow) receive individual performance ratings that impact their respective bonus leverage.annual incentive award payouts. Based on the individual performance of our NEOs, the CEO can recommend an award between 50% to 150% of individual target opportunity, which in 2023 would have resulted in close to full payout based on plan design. As a new public company and in an effort to prioritize accelerating the momentum to the margin and profitability levels management believes the Company can achieve, we determined that reducing the annual incentive award payouts to our NEOs was appropriate. The Compensation Committee reviewed performance ratings for each of our NEOs and approved 20222023 cash bonuses as follows:
| Name | | | Fiscal Year 2022 Bonus Target (% of Base Salary) | | | Combined Performance Rating Factor (%)(1) | | | Fiscal Year 2022 Bonus Paid (% of Base Salary) | | | Fiscal Year 2022 Cash Bonus ($)(2) | | ||||||||||||
| Paul Abbott | | | | | 200 | | | | | | 150 | | | | | | 300 | | | | | | 3,630,900 | | |
| Martine Gerow | | | | | 100 | | | | | | 150 | | | | | | 150 | | | | | | 874,048 | | |
| Andrew Crawley | | | | | 100 | | | | | | 150 | | | | | | 150 | | | | | | 1,180,043 | | |
| Michael Qualantone | | | | | 100 | | | | | | 150 | | | | | | 150 | | | | | | 975,000 | | |
| Eric J. Bock | | | | | 100 | | | | | | 150 | | | | | | 150 | | | | | | 975,000 | | |
| Name | Fiscal Year 2023 Bonus Target (% of Base Salary) | Combined Performance Rating Factor (%)(1) | Fiscal Year 2023 Bonus Paid (% of Base Salary) | Fiscal Year 2023 Cash Bonus ($)(2) | ||||||||||||||||||||||||||||||||||
| Paul Abbott | 200 | 133 | 266 | 3,386,712 | ||||||||||||||||||||||||||||||||||
| Karen Williams | 100 | 130 | 130 | 680,000 | ||||||||||||||||||||||||||||||||||
| Andrew Crawley | 100 | 133 | 133 | 1,100,000 | ||||||||||||||||||||||||||||||||||
| Eric J. Bock | 100 | 138 | 138 | 900,000 | ||||||||||||||||||||||||||||||||||
| Patricia Huska | 100 | 140 | 140 | 700,000 | ||||||||||||||||||||||||||||||||||
(1)
Reflects the results of the combined Company performance metrics and individual performance ratings.
(2)
28
Equity Compensation
We provide long-term equity-based awards to reward our NEOs for sustained multi-year performance, to encourage retention and to provide incentives that align our NEOs’ interests with long-term value creation for our stockholders. Awards are intended to encourage a strong ownership stake in the Company and to drive superior performance in achieving long-term Company strategic goals. In determining the form, size, frequency, and material terms of NEO equity awards, the Compensation Committee considers, among other factors, each executive officer’s role criticality relative to others at the Company and the Company’s major strategic initiatives, Company and individual performance, a market analysis of the equity awards provided to executive officers in similar roles of our peer companies, and any retention needs.
Our long-term equity-based awards are granted under the Global Business Travel Group, Inc. 2022 Equity Incentive Plan (the “2022 Plan”) and. We also maintain the Global Business Travel Group, Inc. Management Incentive
Plan (the “MIP”), which supersedes the predecessor GBT JerseyCo Limited Amended and Restated Management Incentive Plan, effective as of December 2, 2021 (the “JerseyCo MIP”). On May 27, 2022, all outstanding stock options granted under the JerseyCo MIP, including stock options granted to our NEOs, were converted into stock options to purchase shares of Class A Common Stock (“Options”). Following May 27, 2022,which no new awards were or willmay be granted, under the MIP and all new equity awards will be granted under the 2022 Plan. We also maintain the Global Business Travel Group, Inc. Employee Stock Purchase Plan (the “ESPP”); however, which commenced the first offering period in 2022, no offering periods commenced under the ESPP.2023.
Annual Grant of Restricted Stock Unit Awards
Cancellation of the performance-based portionOut-of-the-Money Options in Exchange for One-time Grant of the 2020 and 2021 cash-based awards previously granted under the Company’s Executive Long-Term Cash Incentive Award Plans (the “Executive LTIPs”). In addition, Ms. Gerow and Mr. Qualantone received a supplemental RSU award partially in respect of prior service to the Company and its subsidiaries. These grants represent the first awards granted under the 2022 Plan.
On December 13, 2022, we commenced a tender offer on Schedule TO filed with the SEC, as subsequently amended on January 11, 2023 and January 30, 2023 (the “Exchange Offer”). The Exchange Offer was approved by stockholders on January 6, 2023 and provided eligible participants,employees, including our NEOs, with the opportunity to tender their underwater Optionsout-of-the-money options in exchange for new RSUs with three-year service-based vesting, subject to other terms and conditions set forth in the Exchange Offer and the applicable award agreements. In accordance withUnder the termsMIP, options ("Options") were historically granted to executives from 2015-2021 while the Company was private. At the time of the Exchange Offer, participants who elected the Exchange Offer with respectmajority of Options were out-of-the-money (exercise prices greater than the Company’s then-current market price of our Class A Common Stock) and had provided no value realization since the MIP's inception in 2014 and therefore provided little to underwater Options granted priorno retentive value to December 2, 2021 and also heldemployees, even in the case of Options that were in-the-money atnear expiry. The Compensation Committee determined, with stockholder approval, that the closemost effective approach to motivate and retain employees was to award RSUs in exchange for tendered Options as a one-time action. This form of the Exchange Offerequity provided more stability than Options that held little to no value and were deemed advisable to have automatically exerciseddrive our employees to achieve the Company’s strategic, operational, and financial goals. Upon the granting of RSUs to participants that elected to cancel out-of-the-money Options, any outstanding in-the-money Options held by such in-the-money Options. As a result of his forthcoming separation from the Company and pursuantparticipants were required to his separation agreement with the Company, Mr. Qualantone was eligible to exchange only Options granted prior to December 2, 2021 for new RSUs that would vest 50% on January 26, 2024 and 50% on January 26, 2025.be exercised. The results of the Exchange Offer (i.e., the quantity of Options exercised and RSUs granted) informed 2023 pay decisions and annual equity grant levels. Any participant that did not elect to participate in the one-time Exchange Offer and therefore continued to hold outstanding Options may not exchange them in the future. In addition, the Exchange Offer returned more shares to the Company's share pool than those that were reported on Schedule TO/A filed withissued (i.e., more additive than dilutive).
The following table illustrates the SEC on January 30, 2023.results of the Exchange Offer for our NEOs:
NEO(1) | Options Cancelled | Options Exercised | RSUs Granted | ||||||||
| Paul Abbott | 2,983,535 | - | 632,911 | ||||||||
| Andrew Crawley | 1,243,136 | - | 263,713 | ||||||||
| Eric J. Bock | - | 1,928,496 | 1,265,822 | ||||||||
| Patricia Huska | 1,497,888 | 175,317 | 861,462 | ||||||||
| Martine Gerow | 1,066,555 | - | 210,970 | ||||||||
Grant of Supplemental Restricted Stock Unit Award to Our Chief Financial Officer
On July 18, 2023, in recognition of her promotion to Chief Financial Officer, the Compensation Committee approved a supplemental RSU award for Karen Williams to bring her 2023 equity award to her new long-term incentive target as
29
approved in June 2023. The RSUs vest pro-rata over three years, generally subject to continued vesting through the applicable vesting dates.
Total 2023 Equity Awards
The following table illustrates the number of total equity awards granted to our NEOs in 2023, as described in more detail under the section “Compensation Discussion & Analysis — Grants of Plan Based Awards”.
| Annual RSUs | Exchange Offer RSUs | Supplemental RSUs | Total Equity | |||||||||||||||||||||||
| Paul Abbott | 1,097,178 | 632,911 | - | 1,730,089 | ||||||||||||||||||||||
| Karen Williams | 70,532 | - | 178,082 | 248,614 | ||||||||||||||||||||||
| Andrew Crawley | 470,219 | 263,713 | - | 733,932 | ||||||||||||||||||||||
| Eric J. Bock | 235,109 | 1,265,822 | - | 1,500,931 | ||||||||||||||||||||||
| Patricia Huska | 274,294 | 861,462 | - | 1,135,756 | ||||||||||||||||||||||
| Martine Gerow | - | 210,970 | - | 210,970 | ||||||||||||||||||||||
Perquisites
Our CEO receives a limited perquisite related to an annual health assessment and medical insurance coverage, and our United Kingdom NEOs receive certain perquisites relating to medical and dental coverage, pension-related contributions and certain cashcar allowances as further described in the notes to the Summary Compensation
Compensation Committee Review of Risk
While risk is a necessary part of growing a business, our executive compensation program attempts to mitigate risk and align the Company’s compensation policies with the long-term interests of the Company by utilizing multiple performance measures (both financial and non-financial) that are directly aligned with the Company’s strategic plan and balancingbalance annual and long-term incentives. Other risk mitigation features include the Company’s Stock Ownership Guidelines and the Company’s “clawback” policy both of which are described below.
Although a significant portion of the Company’s executive compensation is performance-based, we believe that our programs do not encourage excessive or unnecessary risk taking. Overall, our compensation mix, including the use of equity, is generally consistent with competitive market practice.
Other Compensation Policies and Programs
Stock Ownership Guidelines for Executive Officers and Directors and Stock Retention Requirement
We maintain a stock ownership policy (the “Stock Ownership Policy”) for our executive officers and the non-employee members of our boardthe Board of directorsDirectors in order to align their financial interests with those of our stockholders. The Compensation Committee is responsible for administration of the policy. Under the Stock Ownership Policy, our executive officers and our non-employee members of the boardBoard of directorsDirectors are required to own a certain number of shares of our common stock with a value equal to a specified multiple of their annual base salary or annual cash retainer, as applicable. As adopted, theseIn 2024, we amended our Stock Ownership Policy to increase the multiple of base salary for our CEO from 5x to 6x and for Other Executive Officers from 2.5x to 3x to better align to our peers. These stock ownership guidelines are as follows:
30
| Covered Person | Applicable Stock Ownership Guideline | |||||||||
| Chief Executive Officer | ||||||||||
| Other Executive Officers | ||||||||||
| Non-Employee Members of the Board of Directors | 5x annual cash retainer | |||||||||
The stock ownership guidelines do not apply to certain of our non-independent directors who do not receive equity compensation for their service on the boardBoard of directors.Directors.
Shares of our common stock that count towards satisfaction of the stock ownership guidelines include shares beneficially owned by the individual or immediate family members, including shares held in a 401(k) plan or other retirement or deferred compensation plan, RSUs and any earned performance-based stock units, even if subject to continued time-vesting conditions. Shares underlying stock options or otherwise subject to a right to acquire will not count toward meeting the stock ownership guidelines.
Under the Stock Ownership Policy, our executive officers and our non-employee members of the boardBoard of directorsDirectors are given five (5) years to achieve the applicable stock ownership requirement. Once the applicable stock ownership requirement has been achieved, the individual will not be required to purchase or retain additional shares in the event of subsequent fluctuations in the market price of our common stock that may
cause the value to drop below the applicable stock ownership requirement; however, the individual will be restricted from selling or transferring shares until the requirement has again been achieved. In addition, until such time as an individual has achieved the applicable stock ownership requirement as described above, he or she is required to retain an amount equal to 50% of the net shares of our common stock (i.e., shares remaining after the payment of the exercise price or the tax withholding obligations with respect to an equity award) received as the result of the exercise, vesting, or payment of any equity awards granted to him or her. The foregoing restrictions do not apply to any stock options held by an individual that were issued on or prior to May 27, 2022. As of the date of this proxy statement, our current NEOs and independent directors have acted in accordance with this policy and continue to accrue stock towards meeting the applicable ownership requirements. As of the Record Date, all of our NEOs met our stock ownership guidelines.
Clawback Policy
Our Compensation Committee adopted, effective October 2, 2023, a Supplemental Executive Officer Recoupment Policy (the “Dodd-Frank Clawback Policy”) to comply with the final rules required by the Dodd-Frank Wall Street Reform and Consumer Protection Act and the SEC, and the corresponding NYSE listing standards. The Company’s boardDodd-Frank Clawback Policy provides for the mandatory recoupment of directors haserroneously awarded incentive-based compensation in the event of certain accounting restatements. In such an event, the Company would seek to recover the amount of erroneously awarded incentive-based compensation paid to applicable executives that was in excess of the amount that would have been awarded based on the restated financial results, subject to and in accordance with the terms of the policy and applicable law.
In May 2022 the Board of Director's adopted athe Clawback and Recoupment Policy (the “Clawback Policy”"Clawback Policy") which is separate from and in orderaddition to ensure the recovery of “Incentive Compensation” (as defined in theDodd-Frank Clawback Policy and below) erroneously awarded to certain “Covered Persons” (as defined in the Clawback Policy) and which includes all executive officers.described above. The Clawback Policy provides that in the event that the Company’s financial statements are restated in whole or in part as the result of an individual’s misconduct, the boardBoard of directorsDirectors may determine to (i) require the Covered Personcovered person to reimburse the Company for the difference between (a) any of such individual’s Incentive Compensationincentive compensation that was paid, granted, settled, earned or vested during the two calendar years prior to the date of the determination by our boardthe Board of directors,Directors, based on the financial results of the Company relating to the period or periods so restated and (b) the Incentive Compensationincentive compensation that would have been paid, granted, settled, earned or vested during the two calendar years prior to the date of the determination by our boardthe Board of directors,Directors, based on the restated financial results of the Company for such period or periods, and (ii) require such individual to reimburse the Company for any profits realized during the two calendar years prior to the date of the determination by our boardthe Board of directors,Directors, on any sale of Company stock by such individual occurring after the public issuance of the financial statements that are subsequently restated.
31
The following table provides information regarding the compensation provided to our NEOs during the fiscal years ended December 31, 2023, December 31, 2022 and December 31, 2021, and December 31, 2020, as applicable. Certain compensation set forth below has not been, and may never be, fully realized such as Earnout Shares which are subject to both performance-based and service-based conditions. Values in the Summary Compensation Table and following tables reflect the impact of exchange rates for cash compensation and all other compensation, and may be rounded to the nearest dollar (including with respect to totals and equity grant date fair values).
| Name and Principal Position | | | Year | | | Salary ($) | | | Bonus ($)(1) | | | Stock Awards ($)(2) | | | Option Awards ($) | | | Non-Equity Incentive Plan Compensation ($)(3) | | | All Other Compensation ($) | | | Total ($) | | ||||||||||||||||||||||||
Paul Abbott, Chief Executive Officer(4) | | | | | 2022 | | | | | | 1,236,667 | | | | | | 2,000,000 | | | | | | 6,000,000 | | | | | | — | | | | | | 3,630,900 | | | | | | 101,632(5) | | | | | | 12,969,199 | | |
| | | | 2021 | | | | | | 1,233,717 | | | | | | 4,000,000 | | | | | | — | | | | | | 9,000,000 | | | | | | 4,050,255 | | | | | | 115,001 | | | | | | 18,398,973 | | | ||
| | | | 2020 | | | | | | 1,072,751 | | | | | | 2,756,540 | | | | | | — | | | | | | — | | | | | | — | | | | | | 1,168,879 | | | | | | 4,998,170 | | | ||
Martine Gerow, Chief Financial Officer(4)(6) | | | | | 2022 | | | | | | 564,970 | | | | | | 1,000,000 | | | | | | 3,366,358 | | | | | | — | | | | | | 874,048 | | | | | | 72,547(7) | | | | | | 5,877,923 | | |
Andrew Crawley, President(4) | | | | | 2022 | | | | | | 806,000 | | | | | | 1,000,000 | | | | | | 2,999,992 | | | | | | — | | | | | | 1,180,043 | | | | | | 69,395(8) | | | | | | 6,055,430 | | |
| | | | 2021 | | | | | | 804,318 | | | | | | 1,250,000 | | | | | | — | | | | | | 3,750,000 | | | | | | 1,140,000 | | | | | | 70,818 | | | | | | 7,015,136 | | | ||
| | | | 2020 | | | | | | 471,122 | | | | | | 447,938 | | | | | | — | | | | | | — | | | | | | — | | | | | | 635,011 | | | | | | 1,554,071 | | | ||
Michael Qualantone, Former Chief Revenue Officer(6)(9) | | | | | 2022 | | | | | | 650,000 | | | | | | 1,000,000 | | | | | | 5,672,920(10) | | | | | | 2,480,246(10) | | | | | | 975,000 | | | | | | 37,200(11) | | | | | | 10,815,366 | | |
| | | | 2021 | | | | | | 578,750 | | | | | | 500,000 | | | | | | — | | | | | | 3,448,920 | | | | | | 1,000,000 | | | | | | 36,400 | | | | | | 5,564,070 | | | ||
Eric J. Bock, Chief Legal Officer, Global Head of Mergers & Acquisitions and Compliance and Corporate Secretary(6) | | | | | 2022 | | | | | | 636,538 | | | | | | 1,000,000 | | | | | | 3,303,156 | | | | | | — | | | | | | 975,000 | | | | | | 37,200(12) | | | | | | 5,951,894 | | |
| Name and Principal Position | Year | Salary ($) | Bonus ($)(1) | Stock Awards ($)(2) | Option Awards ($) | Non-Equity Incentive Plan Compensation ($)(3) | Non-qualified Deferred Compensation Earnings ($) | All other Compensation ($) | Total ($) | ||||||||||||||||||||||||||
Paul Abbott (4) Chief Executive Officer | 2023 | 1,240,000 | 2,000,000 | 11,499,993 | (5) | - | 3,416,052 | - | 103,458 | (6) | 18,259,503 | ||||||||||||||||||||||||
| 2022 | 1,236,667 | 2,000,000 | 6,000,000 | - | 3,630,900 | - | 101,632 | 12,969,199 | |||||||||||||||||||||||||||
| 2021 | 1,233,717 | 4,000,000 | - | 9,000,000 | 4,050,255 | - | 115,001 | 18,398,973 | |||||||||||||||||||||||||||
Karen Williams (4)(7) Chief Financial Officer | 2023 | 477,400 | 199,733 | 1,749,993 | (8) | - | 685,929 | - | 8,928 | (9) | 3,121,983 | ||||||||||||||||||||||||
Andrew Crawley (4) President | 2023 | 806,000 | 1,000,000 | 4,874,996 | (10) | - | 1,109,591 | - | 69,395 | (11) | 7,859,982 | ||||||||||||||||||||||||
| 2022 | 806,000 | 1,000,000 | 2,999,992 | - | 1,180,043 | - | 69,395 | 6,055,430 | |||||||||||||||||||||||||||
| 2021 | 804,318 | 1,250,000 | - | 3,750,000 | 1,140,000 | - | 70,818 | 7,015,136 | |||||||||||||||||||||||||||
Eric J. Bock Chief Legal Officer, Global Head of Mergers & Acquisitions and Compliance and Corporate Secretary | 2023 | 650,000 | 1,000,000 | 10,499,990 | (12) | - | 900,000 | - | 13,200 | (13) | 13,063,190 | ||||||||||||||||||||||||
| 2022 | 636,538 | 1,000,000 | 3,303,156 | - | 975,000 | - | 37,200 | 5,951,894 | |||||||||||||||||||||||||||
| 2021 | 578,750 | 500,000 | - | 3,448,920 | 1,000,000 | - | 36,400 | 5,564,070 | |||||||||||||||||||||||||||
Patrica Huska Chief People Officer | 2023 | 500,000 | 583,333 | 7,874,991 | (14) | - | 700,000 | - | 13,200 | (13) | 9,671,524 | ||||||||||||||||||||||||
Martine Gerow (4)(15) Former Chief Financial Officer | 2023 | 348,249 | - | 1,499,997 | (16) | - | - | - | 7,068 | (17) | 1,855,314 | ||||||||||||||||||||||||
| 2022 | 564,970 | 1,000,000 | 3,366,358 | - | 874,048 | - | 43,424 | 5,848,800 | |||||||||||||||||||||||||||
| 2021 | 506,900 | 500,000 | - | 3,270,900 | 900,000 | - | 132,144 | 5,309,944 | |||||||||||||||||||||||||||
(1)
The amounts in this column for 20222023 reflect the vesting and payment of the secondfinal tranche of the time-vesting portion of the 2020 Executive LTIP awards granted in November 2020, equal to $1,000,000 for Mr. Abbott and $500,000 for each of Ms. Gerow and Messrs. Crawley, Qualantone and Bock.Bock and $291,667 for Ms. Huska. In addition, amounts in this column for 20222023 reflect the vesting and payment of the firstsecond tranche of the time-vestingtime-vested portion of the 2021 Executive LTIP awards granted in September 2021, equal to $1,000,000 for Mr. Abbott and $500,000 for each of Ms. Gerow and Messrs. Crawley Qualantone and Bock.
(2)The amounts reported in these columns constitute the aggregate grant date fair value of each stock award or option award, as applicable, calculated in accordance with Financial Accounting Standards Board (“FASB”), Accounting Standard Codification (“ASC”) Topic 718, “Compensation — Stock Compensation” (“ASC 718”). Assumptions used in the calculation of these amounts are included in the notes to our consolidated financial statements included in our 20222023 Annual Report.
(3)
The amounts in this column reflect the amounts earned in 20222023 as annual cash incentive awards as described in more detail under the section “Compensation“Compensation Discussion & Analysis — Annual Incentive Compensation”Compensation” and paid on March 10, 2023.
11, 2024. Amounts paid in British pounds sterling to Mr. Abbott, Ms. Williams, Ms. Gerow and Mr. Crawley have been converted to United States dollars at an exchange rate equal to $1.28423 per £1.00 for 2023.
(4)Amounts paid in British pounds sterling to Mr. Abbott, Ms. Williams, Ms. Gerow and Mr. Crawley have been converted to United States dollars for purposes of this disclosure. Salary and all other compensation have been converted at an annual average exchange rate (based on monthly averages) equal to $1.24 per £1.00 for 2023 and 2022, $1.37 per £1.00 for 2021 and $1.29 per £1.00 for 2020 (in each case, rounded to the nearest cent) and non-equity incentive plan compensation has been converted at the rate in effect on December 31 of the applicable year of disclosure. Executive LTIP amounts reflected in the bonus column have not been converted as the awards are denominated in United States dollars but paid in British pounds sterling.
(5)
32
(6)Amount includes (i) a United Kingdom supplemental pension cash allowance of $86,676, (ii) a Company-paid car allowance of $14,136, and (iii) a Company contribution of $820$857 for an annual executive-level medical assessment.
Amount includes (i) a United Kingdom supplemental pension cash allowance of $29,123, (ii) a Company-paid car allowance of $14,136, (iii)$8,928.
(10)In connection with the termination of the Options, where there was no value realization since the MIP's inception in 2014, a housing allowanceone-time award, with a grant date fair value of $24,933 and (iv) a utilities allowance$1,874,999, was granted January 26, 2023 in exchange for cancellation of $4,355. Ms. Gerow’s housing and utilities allowances were discontinued1,243,136 Options. For more detail see “Compensation Discussion & Analysis — Equity Compensation - Cancellation of Out-of-the-Money Options in 2022.
Amount includes (i) a United Kingdom supplemental pension cash allowance of $55,259 and (ii) a Company-paid car allowance of $14,136.
Amount includes (i) a Company contribution of $12,200$13,200 to the GBTGBTG 401(k) PlanPlan.
(14)In connection with the termination of the Options, where there was no value realization since the MIP's inception in 2014, a one-time award, with a grant date fair value of $6,124,995, was granted January 26, 2023 in exchange for cancellation of 876,588 and (ii)automatic exercise of 175,317 Options ("Huska Option Exercise"). This award represented the aggregate award for Ms. Huska from 2014 through 2019 and 2021 which would equate to $898,266 per year when aggregated with the Huska Option Exercise. For more detail see “Compensation Discussion & Analysis — Equity Compensation - Cancellation of Out-of-the-Money Options in Exchange for One-time Grant of Restricted Stock Units”. In addition, this amount also reflects the 2023 Annual Long-term Incentive award grant date fair value of $1,749,996 granted March 10, 2023.
(15)Ms. Gerow voluntarily resigned from the Company effective June 30, 2023.
(16)The amount reflects a $25,000 cash perquisiteone-time award, which was discontinuedwith a grant date fair value of $1,499,997, granted January 26, 2023 in 2022.
Amount includes (i) a Company contributionCompany-paid car allowance of $12,200 to the GBT 401(k) Plan and (ii) a $25,000 cash perquisite award which was discontinued in 2022.$7,068.
Employment Agreements with Our NEOs
Each of our NEOs other than Mr. Qualantone, is a party to a written employment agreement or employment letter, as amended or supplemented on December 2, 2021 and November 29, 2021 for Mr. Bock (with such amendments and supplements effective on the first date that our stock became publicly traded). Mr. Qualantone is party, or in the case of Ms. Williams, upon the effective date of her appointment to an Employment Transition and Separation Agreement that superseded his employment agreement on December 9, 2022 (the “Separation Agreement”).CFO, July 1, 2023. The material terms of each of those arrangements is described below and eligibility for severance payments and benefits, including the treatment of outstanding equity awards, is described in the section “Potential Payments Upon a Termination or Change in Control — Employment Agreements; Severance Protection Agreements”. For a description of the compensation actually paid to the NEOs for fiscal year 2022,2023, please refer to the “Summary Compensation Table,” above.
Paul Abbott
Mr. Abbott is party to an employment agreement with GBT Travel Services UK Limited (“GBT UK”), dated June 5, 2020 as amended on December 2, 2021, which provides for customary terms of employment including a minimumstarting annual base salary of £1,000,000 and a target annual bonus opportunity of 200% of
base salary (up to a maximum of 300% base salary). Mr. Abbott is eligible to receive annual long-term incentive awards, participate in employee benefit plans generally applicable to GBT UK employees, receive a monthly car allowance of £950 and receive an additional amount each year equal to (8/(1+x))% (where “x” is the aggregate rate of employer national insurance contributions and other employer levies, expressed as a decimal) of his base salary per annum in lieu of pension contributions. Mr. Abbott’s employment agreement also includes certain restrictive covenants, including one-year post-termination noncompetitionnon-competition and non-solicitation of customers and employees restrictions.
33
Karen Williams
Ms. Williams is party to an employment agreement with GBT UK, dated July 7, 2023 upon her appointment as Chief Financial Officer on July 1, 2023, which provides for customary terms of employment including a starting annual base salary of £410,000 and a target annual bonus opportunity of 100% of base salary. Ms. Williams is eligible to receive annual long-term incentive awards, participate in employee benefit plans generally applicable to GBT UK employees and receive a monthly car allowance of £600. Ms. William’s employment agreement also includes certain restrictive covenants relating to protection of our confidential information and intellectual property.
Martine Gerow
Ms. Gerow iswas party to an employment agreement with GBT UK, dated May 10, 2017 as amended on December 2, 2021, which providesprovided for customary terms of employment including a minimumstarting annual base salary of £295,000 and a target annual bonus opportunity of 100% of base salary (up to a maximum of 200% of base salary). Ms. Gerow iswas eligible to receive annual long-term incentive awards, participate in employee benefit plans generally applicable to GBT UK employees, receive a monthly car allowance of £950, a monthly housing expense, tax assistance payments to cover the tax implications of such housing payments and Company-paid tax advice and preparation services related to income received by Ms. Gerow for her services to us. Ms. Gerow’s employment agreement also includesincluded certain restrictive covenants relating to protection of our confidential information and intellectual property. Ms. Gerow’s housing and utilities allowances were discontinued in 2022. Ms. Gerow voluntarily resigned her employment as Chief Financial Officer effective June 30, 2023.
Andrew Crawley
Mr. Crawley is party to an employment agreement with GBT UK, dated November 26, 2019, as amended on December 2, 2021, which provides for customary terms of employment including a minimumstarting annual base salary of £650,000 and a target annual bonus opportunity of 100% of base salary (up to a maximum of 200% base salary). Mr. Crawley is eligible to receive annual long-term incentive awards, participate in employee benefit plans generally applicable to GBT UK employees, receive an annual car allowance of £11,900 and receive an annual cash allowance equal to 8% of his base salary, net of 14.3% national insurance withholding in lieu of pension contributions. Mr. Crawley’s employment agreement also includes certain restrictive covenants relating to protection of our confidential information and intellectual property.
Eric J. Bock
Patricia Huska
GRANTS OF PLAN-BASED AWARDS TABLE
| | | | | | | | | | | | | | | | Estimated Future Payouts Under Non-Equity Incentive Plan Awards(2) | | | Estimated Future Payouts Under Equity Incentive Plan Awards(3) | | | All Other Stock Awards: Number of Shares of Stock or Units (#) | | | All Other Stock Awards: Number of Securities Underlying Options | | | Exercise or Base Price of Option Awards ($) | | | Grant Date Fair Value of Stock and Option Awards ($) | | ||||||||||||||||||||||||||||||||||||||||||
| Name | | | Grant Date(1) | | | Approval Date | | | Threshold ($) | | | Target ($) | | | Maximum ($) | | | Threshold (#) | | | Target (#) | | | Maximum (#) | | ||||||||||||||||||||||||||||||||||||||||||||||||
| Paul Abbott | | | | | 8/12/2022 | | | | | | 6/21/2022 | | | | | | — | | | | | | — | | | | | | — | | | | | | — | | | | | | — | | | | | | — | | | | | | 390,625(4) | | | | | | — | | | | | | — | | | | | | 3,000,000 | | |
| | | | 8/12/2022 | | | | | | 6/21/2022 | | | | | | — | | | | | | — | | | | | | — | | | | | | — | | | | | | — | | | | | | — | | | | | | 390,625(5) | | | | | | — | | | | | | — | | | | | | 3,000,000 | | | ||
| | | | | | | | | | | | | | | | — | | | | | | 2,480,000 | | | | | | 3,720,000 | | | | | | — | | | | | | — | | | | | | — | | | | | | — | | | | | | — | | | | | | — | | | | | | — | | | ||
| Martine Gerow | | | | | 8/12/2022 | | | | | | 6/21/2022 | | | | | | — | | | | | | — | | | | | | — | | | | | | — | | | | | | — | | | | | | — | | | | | | 195,312(4) | | | | | | — | | | | | | — | | | | | | 1,499,996 | | |
| | | | 8/12/2022 | | | | | | 6/21/2022 | | | | | | — | | | | | | — | | | | | | — | | | | | | — | | | | | | — | | | | | | — | | | | | | 195,312(5) | | | | | | — | | | | | | — | | | | | | 1,499,996 | | | ||
| | | | 8/12/2022 | | | | | | 6/21/2022 | | | | | | — | | | | | | — | | | | | | — | | | | | | — | | | | | | — | | | | | | — | | | | | | 21,686(6) | | | | | | — | | | | | | — | | | | | | 166,548 | | | ||
| | | | 5/27/2022 | | | | | | (7) | | | | | | — | | | | | | — | | | | | | — | | | | | | — | | | | | | 22,706(8) | | | | | | 45,413(8) | | | | | | — | | | | | | — | | | | | | — | | | | | | 199,817 | | | ||
| | | | | | | | | | | | | | | | — | | | | | | 596,998 | | | | | | 1,193,996 | | | | | | — | | | | | | — | | | | | | — | | | | | | — | | | | | | — | | | | | | — | | | | | | — | | | ||
| Andrew Crawley | | | | | 8/12/2022 | | | | | | 6/21/2022 | | | | | | — | | | | | | — | | | | | | — | | | | | | — | | | | | | — | | | | | | — | | | | | | 195,312(4) | | | | | | — | | | | | | — | | | | | | 1,499,996 | | |
| | | | 8/12/2022 | | | | | | 6/21/2022 | | | | | | — | | | | | | — | | | | | | — | | | | | | — | | | | | | — | | | | | | — | | | | | | 195,312(5) | | | | | | — | | | | | | — | | | | | | 1,499,996 | | | ||
| | | | | | | | | | | | | | | | — | | | | | | 806,000 | | | | | | 1,612,000 | | | | | | — | | | | | | — | | | | | | — | | | | | | — | | | | | | — | | | | | | — | | | | | | — | | | ||
| Michael Qualantone | | | | | 8/12/2022 | | | | | | 6/21/2022 | | | | | | — | | | | | | — | | | | | | — | | | | | | — | | | | | | — | | | | | | — | | | | | | 195,312(4) | | | | | | — | | | | | | — | | | | | | 2,546,868(9) | | |
| | | | 8/12/2022 | | | | | | 6/21/2022 | | | | | | — | | | | | | — | | | | | | — | | | | | | — | | | | | | — | | | | | | — | | | | | | 195,312(5) | | | | | | — | | | | | | — | | | | | | 2,546,868(9) | | | ||
| | | | 8/12/2022 | | | | | | 6/21/2022 | | | | | | — | | | | | | — | | | | | | — | | | | | | — | | | | | | — | | | | | | — | | | | | | 35,940(6) | | | | | | — | | | | | | — | | | | | | 276,019 | | | ||
| | | | 5/27/2022 | | | | | | (7) | | | | | | — | | | | | | — | | | | | | — | | | | | | — | | | | | | 34,450(10) | | | | | | 68,901(10) | | | | | | — | | | | | | — | | | | | | — | | | | | | 303,164 | | | ||
| | | | | | | | | | | | | | | | — | | | | | | — | | | | | | — | | | | | | — | | | | | | — | | | | | | — | | | | | | — | | | | | | — | | | | | | — | | | | | | 2,480,246(11) | | | ||
| | | | | | | | | | | | | | | | — | | | | | | 650,000 | | | | | | 1,300,000 | | | | | | — | | | | | | — | | | | | | — | | | | | | — | | | | | | — | | | | | | — | | | | | | — | | | ||
| Eric J. Bock | | | | | 8/12/2022 | | | | | | 6/21/2022 | | | | | | — | | | | | | — | | | | | | — | | | | | | — | | | | | | — | | | | | | — | | | | | | 195,312(4) | | | | | | — | | | | | | — | | | | | | 1,499,996 | | |
| | | | 8/12/2022 | | | | | | 6/21/2022 | | | | | | — | | | | | | — | | | | | | — | | | | | | — | | | | | | — | | | | | | — | | | | | | 195,312(5) | | | | | | — | | | | | | — | | | | | | 1,499,996 | | | ||
| | | | 5/27/2022 | | | | | | (7) | | | | | | — | | | | | | — | | | | | | — | | | | | | — | | | | | | 34,450(12) | | | | | | 68,901(12) | | | | | | — | | | | | | — | | | | | | — | | | | | | 303,164 | | | ||
| | | | | | | | | | | | | | | | — | | | | | | 650,000 | | | | | | 1,300,000 | | | | | | — | | | | | | — | | | | | | — | | | | | | — | | | | | | — | | | | | | — | | | | | | — | | | ||
| All Other Stock Awards: Number of Shares of Stock or Units (#) | Grant Date Fair Value of Stock and Option Awards ($) | ||||||||||||||||||||||
Estimated Future Payouts Under Non-Equity Incentive Plan Awards (1) | |||||||||||||||||||||||
| Name | Grant Date | Award Purpose | Threshold ($) | Target ($) | Maximum ($) | ||||||||||||||||||
| Paul Abbott | 1/26/2023 | Exchange Offer RSUs | 632,911(2) | 4,499,997 | |||||||||||||||||||
| 3/10/2023 | Annual RSUs | 1,097,178(3) | 6,999,996 | ||||||||||||||||||||
| - | 2,480,000 | 3,720,000 | |||||||||||||||||||||
| Karen Williams | 3/10/2023 | Annual RSUs | 70,532(3) | 449,994 | |||||||||||||||||||
| 7/18/2023 | Supplemental RSUs | 178,082(4) | 1,299,999 | ||||||||||||||||||||
| - | 508,400 | 1,016,800 | |||||||||||||||||||||
| Andrew Crawley | 1/26/2023 | Exchange Offer RSUs | 263,713(2) | 1,874,999 | |||||||||||||||||||
| 3/10/2023 | Annual RSUs | 470,219(3) | 2,999,997 | ||||||||||||||||||||
| - | 806,000 | 1,612,000 | |||||||||||||||||||||
| Eric J. Bock | 1/30/2023 | Exchange Offer RSUs | 1,265,822(2) | 8,999,994 | |||||||||||||||||||
| 3/10/2023 | Annual RSUs | 235,109(3) | 1,499,995 | ||||||||||||||||||||
| - | 650,000 | 1,300,000 | |||||||||||||||||||||
| Patricia Huska | 1/26/2023 | Exchange Offer RSUs | 861,462(2) | 6,124,995 | |||||||||||||||||||
| 3/10/2023 | Annual RSUs | 274,294(3) | 1,749,996 | ||||||||||||||||||||
| - | 500,000 | 1,000,000 | |||||||||||||||||||||
| Martine Gerow | 1/26/2023 | Exchange Offer RSUs | 210,970(2) | 1,499,997 | |||||||||||||||||||
| - | 596,998 | 1,193,996 | |||||||||||||||||||||
(1)
Amounts that would be paid in British pounds sterling to Mr. Abbott, Ms. Gerow and Mr. Crawley have been converted to United States dollars for purposes of this disclosure at an annual average exchange rate (based on monthly averages) equal to $1.24 per £1.00 for 20222023 (rounded to the nearest cent).
Represents RSUs that vest September 1, 2023, generally subject to continued service throughawarded in connection with the vesting date. The grant date fair valueone-time Exchange Offer awards as described in more detail under the section “Compensation Discussion & Analysis — Equity Compensation - Cancellation of Out-of-the-Money Options in Exchange for each award was calculated in accordance with ASC 718. Assumptions used in the calculationOne-time Grant of these amounts are included in the notes to our consolidated financial statements included in our 2022 Annual Report.
Restricted Stock Units
(4)Represents RSUs that were modified during fiscal year 2022, as further described in footnote (10) of the Summary Compensation Table.
35
OUTSTANDING EQUITY AWARDS AT DECEMBER 31, 20222023
The following table provides information about the number of outstanding equity awards held by our NEOs as of December 31, 2022.
2023.| | | | Option Awards | | | Stock Awards | | ||||||||||||||||||||||||||||||||||||||||||
| Name | | | Number of Securities Underlying Unexercised Options (#) Exercisable | | | Number of Securities Underlying Unexercised Options (#) Unexercisable | | | Option Exercise Price ($) | | | Option Expiration Date | | | Number of Shares or Units of Stock That Have Not Vested (#) | | | Market Value of Shares or Units of Stock That Have Not Vested ($)(1) | | | Equity Incentive Plan Awards: Number of Unearned Shares, Units or Other Rights That Have Not Vested (#) | | | Equity Incentive Plan Awards: Market or Payout Value of Unearned Shares, Units or Other Rights That Have Not Vested ($)(2) | | ||||||||||||||||||||||||
| Paul Abbott | | | | | 994,512(3) | | | | | | 1,989,023(3) | | | | | | 10.03 | | | | | | 12/2/2031 | | | | | | 390,625(4) | | | | | | 2,636,719 | | | | | | — | | | | | | — | | |
| | | | — | | | | | | — | | | | | | — | | | | | | — | | | | | | 390,625(5) | | | | | | 2,636,719 | | | | | | — | | | | | | — | | | ||
| Martine Gerow | | | | | 355,518(3) | | | | | | 711,037(3) | | | | | | 10.03 | | | | | | 12/2/2031 | | | | | | 195,312(4) | | | | | | 1,318,356 | | | | | | — | | | | | | — | | |
| | | | 184,084(6) | | | | | | 122,722(6) | | | | | | 14.58 | | | | | | 9/25/2029 | | | | | | 195,312(5) | | | | | | 1,318,356 | | | | | | — | | | | | | — | | | ||
| | | | 964,248(7) | | | | | | — | | | | | | 6.72 | | | | | | 5/23/2027 | | | | | | 21,686 | | | | | | 146,381 | | | | | | — | | | | | | — | | | ||
| | | | — | | | | | | — | | | | | | — | | | | | | — | | | | | | — | | | | | | — | | | | | | 45,413(8) | | | | | | 306,538 | | | ||
| Andrew Crawley | | | | | 414,379(3) | | | | | | 828,757(3) | | | | | | 10.03 | | | | | | 12/2/2031 | | | | | | 195,312(4) | | | | | | 1,318,356 | | | | | | — | | | | | | — | | |
| | | | — | | | | | | — | | | | | | — | | | | | | — | | | | | | 195,312(5) | | | | | | 1,318,356 | | | | | | — | | | | | | — | | | ||
Michael Qualantone(9) | | | | | 371,303(3) | | | | | | 742,606(3) | | | | | | 10.03 | | | | | | 12/2/2031 | | | | | | 195,312(4) | | | | | | 1,318,356 | | | | | | — | | | | | | — | | |
| | | | 305,053(6) | | | | | | 203,369(6) | | | | | | 14.58 | | | | | | 9/25/2029 | | | | | | 195,312(5) | | | | | | 1,318,356 | | | | | | — | | | | | | — | | | ||
| | | | 350,635(10) | | | | | | 87,659(10) | | | | | | 7.23 | | | | | | 3/13/2028 | | | | | | 35,940 | | | | | | 242,595 | | | | | | — | | | | | | — | | | ||
| | | | 596,081(11) | | | | | | — | | | | | | 6.37 | | | | | | 9/30/2025 | | | | | | — | | | | | | — | | | | | | — | | | | | | — | | | ||
| | | | 385,699(11) | | | | | | — | | | | | | 5.74 | | | | | | 3/30/2025 | | | | | | — | | | | | | — | | | | | | — | | | | | | — | | | ||
| | | | — | | | | | | — | | | | | | — | | | | | | — | | | | | | — | | | | | | — | | | | | | 68,901(12) | | | | | | 465,082 | | | ||
| Eric J. Bock | | | | | 331,503(3) | | | | | | 663,005(3) | | | | | | 10.03 | | | | | | 12/2/2031 | | | | | | 195,312(4) | | | | | | 1,318,356 | | | | | | — | | | | | | — | | |
| | | | 525,953(13) | | | | | | — | | | | | | 6.69 | | | | | | 5/24/2026 | | | | | | 195,312(5) | | | | | | 1,318,356 | | | | | | — | | | | | | — | | | ||
| | | | 1,402,543(11) | | | | | | — | | | | | | 5.74 | | | | | | 3/30/2025 | | | | | | — | | | | | | — | | | | | | — | | | | | | — | | | ||
| | | | — | | | | | | — | | | | | | — | | | | | | — | | | | | | — | | | | | | — | | | | | | 68,901(14) | | | | | | 465,082 | | | ||
| Option Awards | Stock Awards | |||||||||||||||||||||||||
| Name | Number of Securities Underlying Unexercised Options (#) Exercisable | Number of Securities Underlying Unexercised Options (#) Unexercisable | Option Exercise Price ($) | Option Expiration Date | Number of Shares or Units of Stock That Have Not Vested (#) | Market Value of Shares or Units of Stock That Have Not Vested ($)(1) | Equity Incentive Plan Awards: Number of Unearned Shares, Units or Other Rights That Have Not Vested (#) | Equity Incentive Plan Awards: Market or Payout Value of Unearned Shares, Units or Other Rights That Have Not Vested ($)(2) | ||||||||||||||||||
| Paul Abbott | - | - | - | - | 1,097,178(4) | 7,076,798 | - | - | ||||||||||||||||||
| - | - | - | - | 632,911(5) | 4,082,276 | - | - | |||||||||||||||||||
| - | - | - | - | 390,625(6) | 2,519,531 | - | - | |||||||||||||||||||
| Karen Williams | - | - | - | - | 178,082(7) | 1,148,629 | - | - | ||||||||||||||||||
| - | - | - | - | 70,532(4) | 454,931 | - | - | |||||||||||||||||||
| - | - | - | - | 51,609(8) | 332,878 | - | - | |||||||||||||||||||
| Andrew Crawley | - | - | - | - | 470,219(4) | 3,032,913 | - | - | ||||||||||||||||||
| - | - | - | - | 263,713(5) | 1,700,949 | - | - | |||||||||||||||||||
| - | - | - | - | 195,312(6) | 1,259,762 | - | - | |||||||||||||||||||
| Eric J. Bock | 663,005(3) | 331,503(3) | 10.03 | 12/2/2031 | 235,109(4) | 1,516,453 | - | - | ||||||||||||||||||
| - | - | - | - | 1,265,822(5) | 8,164,552 | - | - | |||||||||||||||||||
| - | - | - | - | 195,312(6) | 1,259,762 | - | - | |||||||||||||||||||
| - | - | - | - | - | - | 68,901(10) | 444,411 | |||||||||||||||||||
| Patricia Huska | - | - | - | - | 274,294(4) | 1,769,196 | - | - | ||||||||||||||||||
| - | - | - | - | 861,462(5) | 5,556,430 | - | - | |||||||||||||||||||
| - | - | - | - | 8,263(9) | 53,296 | - | - | |||||||||||||||||||
| - | - | - | - | 113,932(6) | 734,861 | - | - | |||||||||||||||||||
| - | - | - | - | - | - | 37,583(11) | 242,410 | |||||||||||||||||||
| Martine Gerow | - | - | - | - | - | - | 41,028(10) | 264,631 | ||||||||||||||||||
(1)
The amounts in this column reflect the market value of unvested stock awards, determined by multiplying the number of such awards by $6.45, which was the marketclosing stock price of our Class A Common Stock at the close of theon December 29, 2023 (the last trading day ofin fiscal year 2022, which was $6.75 per share.
(2)
The amounts in this column reflect the numbermarket value of Earnout Shares payable based on achievement of the maximum level of performance multiplied by $6.45, which was the marketclosing stock price of our Class A Common Stock at the close of theon December 29, 2023 (the last trading day ofin fiscal year 2022, which was $6.75 per share.2023).
(3)
Consists of Options that vest approximately one-third on December 2nd of 2022, 2023 and 2024, generally subject to continued service through the applicable vesting dates.
(4)
Consists of RSUs that vest September 1, 2023,approximately one-third on March 1st of each of 2024, 2025 and 2026, generally subject to continued service through the applicable vesting date.
(5)
(6)Consists of RSUs that vest September 1, 2024, generally subject to continued service through the vesting date.
Consists of OptionsRSUs that vest 20%approximately one-third on OctoberJuly 1st of each year from 2020 throughof 2024, 2025 and 2026, generally subject to continued service through the applicable vesting date.
Consists of fully vested Options.
(9)
Consists of OptionsRSUs that vest 20%approximately one-third on April 1stAugust 12th of each year from 2019 throughof 2023, 2024 and 2025, generally subject to continued service through the applicable vesting date.
Consists of Earnout Shares that are subject to the Earnout Criteria, of which all such Earnout Shares are service-vested.
36
OPTION EXERCISES AND STOCK VESTED TABLE
| Option Awards | Stock Awards | |||||||||||||
| Name | Number of Shares Acquire on Exercise (#)(1) | Value Realized on Exercise ($) | Number of Shares Acquire on Vesting (#) | Value Realized on Vesting ($) | ||||||||||
| Paul Abbott | - | - | 390,625 | 2,597,656 | ||||||||||
| Karen Williams | - | - | 25,804 | 188,111 | ||||||||||
| Andrew Crawley | - | - | 195,312 | 1,298,825 | ||||||||||
| Eric J. Bock | 1,928,496 | 2,142,384 | 195,312 | 1,298,825 | ||||||||||
| Patricia Huska | 175,317 | 162,869 | 118,063 | 786,772 | ||||||||||
| Martine Gerow | - | - | - | 1,349,789 | ||||||||||
(1)Options that were in-the-money as of the date of the Exchange Offer were automatically exercised by our NEOs, and no RSUs or other stock-based awards had vested.in connection with the NEO's participation in the Exchange Offer as described in more detail under the section “Compensation Discussion & Analysis — Equity Compensation - Cancellation of Out-of-the-Money Options in Exchange for One-time Grant of Restricted Stock Units”.
POTENTIAL PAYMENTS UPON A TERMINATION OR CHANGE IN CONTROL
The table below reflects the severance and other benefits that may become payable to our NEOs (other than Ms. Gerow) in connection with certain terminations of employment, assuming in each case that the applicable triggering event(s) occurred on December 31, 2022.2023. None of our NEOs areis entitled to receive any payments or benefits automatically triggered by a change in control (i.e., no “single-trigger” payments or benefits). For purposes of this disclosure, “involuntary termination” means a termination of employment of an NEO by the Company or its subsidiary without cause or a resignation by an NEO for good reason. Amounts that would be paid in British pounds sterling to Mr. Abbott, Ms. GerowWilliams and Mr. Crawley in respect of salary, bonuses and the value of health benefits have been converted to United States dollars at an annual average exchange rate (based on monthly averages) equal to $1.24 per £1.00 for 20222023 (in each case, rounded to the nearest cent).
37
| Name | | | Benefit | | | Involuntary Termination Not in Connection with a Change in Control ($) | | | Involuntary Termination in Connection with a Change in Control ($) | | | Death ($) | | | Disability ($) | | ||||||||||||
| Paul Abbott | | | Base Salary | | | | | 1,240,000(1) | | | | | | 2,480,000(2) | | | | | | — | | | | | | 1,240,000(1) | | |
| | | | Bonus | | | | | 6,110,900(3) | | | | | | 8,590,900(4) | | | | | | — | | | | | | 6,110,900(3) | | |
| | | | Equity | | | | | — | | | | | | — | | | | | | — | | | | | | — | | |
| | | | Options(5) | | | | | — | | | | | | — | | | | | | — | | | | | | — | | |
| | | | RSUs(6) | | | | | — | | | | | | — | | | | | | — | | | | | | — | | |
| | | | Health Benefits | | | | | 27,636(7) | | | | | | 55,272(8) | | | | | | — | | | | | | 27,636(8) | | |
| | | | Total | | | | | 7,378,536 | | | | | | 11,126,172 | | | | | | — | | | | | | 7,378,536 | | |
| Martine Gerow(9) | | | Base Salary | | | | | 596,998(1) | | | | | | 1,193,996(2) | | | | | | — | | | | | | 596,998(1) | | |
| | | | Bonus | | | | | 1,193,996(10) | | | | | | 1,790,994(11) | | | | | | — | | | | | | 1,193,996(10) | | |
| | | | Equity | | | | | — | | | | | | — | | | | | | — | | | | | | — | | |
| | | | Options(5) | | | | | — | | | | | | — | | | | | | — | | | | | | — | | |
| | | | RSUs(6) | | | | | 48,796(12) | | | | | | 146,381(13) | | | | | | 146,381(13) | | | | | | 48,796(12) | | |
| | | | Health Benefits | | | | | 8,700(8) | | | | | | 13,050(15) | | | | | | — | | | | | | 8,700(8) | | |
| | | | Total | | | | | 1,848,490 | | | | | | 3,144,421 | | | | | | 146,381 | | | | | | 1,848,490 | | |
| Andrew Crawley | | | Base Salary | | | | | 806,000(1) | | | | | | 1,612,000(2) | | | | | | — | | | | | | 806,000(1) | | |
| | | | Bonus | | | | | 1,612,000(10) | | | | | | 2,418,000(11) | | | | | | — | | | | | | 1,612,000(10) | | |
| | | | Equity | | | | | — | | | | | | — | | | | | | — | | | | | | — | | |
| | | | Options(5) | | | | | — | | | | | | — | | | | | | — | | | | | | — | | |
| | | | RSUs(6) | | | | | — | | | | | | — | | | | | | — | | | | | | — | | |
| | | | Health Benefits | | | | | 8,700(8) | | | | | | 13,050(15) | | | | | | — | | | | | | 8,700(8) | | |
| | | | Total | | | | | 2,426,700 | | | | | | 4,043,050 | | | | | | — | | | | | | 2,426,700 | | |
Michael Qualantone(16) | | | — | | | | | — | | | | | | — | | | | | | — | | | | | | — | | |
| Eric J. Bock | | | Base Salary | | | | | 650,000(1) | | | | | | 1,300,000(2) | | | | | | — | | | | | | 650,000(1) | | |
| | | | Bonus | | | | | 1,625,000(3) | | | | | | 2,275,000(4) | | | | | | — | | | | | | 1,625,000(3) | | |
| | | | Equity | | | | | — | | | | | | — | | | | | | — | | | | | | — | | |
| | | | Options(5) | | | | | — | | | | | | — | | | | | | — | | | | | | — | | |
| | | | RSUs(6) | | | | | — | | | | | | — | | | | | | — | | | | | | — | | |
| | | | Health Benefits | | | | | 23,040(17) | | | | | | 34,560(18) | | | | | | — | | | | | | 23,040(17) | | |
| | | | Total | | | | | 2,298,040 | | | | | | 3,609,560 | | | | | | — | | | | | | 2,298,040 | | |
| Name | Benefit | Involuntary Termination Not in Connection with a Change in Control ($) | Involuntary Termination in Connection with a Change in Control ($) | Death ($) | Disability ($) | ||||||||||||||||||||||||
| Paul Abbott | Base Salary | 1,240,000 | (1) | 2,480,000 | (2) | - | 1,240,000 | (1) | |||||||||||||||||||||
| Bonus | 5,866,712 | (3) | 8,346,712 | (4) | - | 5,866,712 | (3) | ||||||||||||||||||||||
| Equity | - | - | - | - | |||||||||||||||||||||||||
Options(5) | - | - | - | - | |||||||||||||||||||||||||
RSUs(6) | 3,719,690 | (7) | 11,159,074 | (8) | 11,159,074 | (8) | 3,719,690 | (9) | |||||||||||||||||||||
| Health Benefits | 31,332 | (10) | 62,664 | (11) | - | 31,332 | (10) | ||||||||||||||||||||||
| Total | 11,191,022 | 22,381,738 | 11,159,074 | 11,191,022 | |||||||||||||||||||||||||
| Karen Williams | Base Salary | 508,400 | (1) | 1,016,800 | (2) | - | 508,400 | (1) | |||||||||||||||||||||
| Bonus | 1,188,400 | (3) | 1,696,800 | (4) | - | 1,016,800 | (3) | ||||||||||||||||||||||
| Equity | - | - | - | - | |||||||||||||||||||||||||
| Options | - | - | - | - | |||||||||||||||||||||||||
RSUs(6) | 700,948 | (7) | 1,936,438 | (8) | 1,936,438 | (8) | 700,948 | (7) | |||||||||||||||||||||
| Health Benefits | 9,852 | (10) | 14,778 | (12) | - | 9,852 | (10) | ||||||||||||||||||||||
| Total | 2,163,029 | 4,420,245 | 1,936,438 | 2,236,000 | |||||||||||||||||||||||||
| Andrew Crawley | Base Salary | 806,000 | (1) | 1,612,000 | (2) | - | 806,000 | (1) | |||||||||||||||||||||
| Bonus | 1,612,000 | (13) | 2,418,000 | (14) | - | 1,612,000 | (13) | ||||||||||||||||||||||
| Equity | - | - | - | - | |||||||||||||||||||||||||
Options(5) | - | - | - | - | |||||||||||||||||||||||||
RSUs(6) | 1,577,948 | (7) | 4,733,862 | (8) | 4,733,862 | (8) | 1,577,948 | (7) | |||||||||||||||||||||
| Health Benefits | 9,852 | (10) | 14,778 | (12) | - | 9,852 | (10) | ||||||||||||||||||||||
| Total | 4,005,800 | 8,778,640 | 4,733,862 | 4,005,800 | |||||||||||||||||||||||||
| Eric J. Bock | Base Salary | 650,000 | (1) | 1,300,000 | (2) | - | 650,000 | (1) | |||||||||||||||||||||
| Bonus | 1,625,000 | (3) | 2,275,000 | (4) | - | 1,300,000 | (3) | ||||||||||||||||||||||
| Equity | - | - | - | - | |||||||||||||||||||||||||
Options(5)(15) | - | - | - | - | |||||||||||||||||||||||||
RSUs(6) | 3,226,993 | (7) | 9,681,005 | (8) | 9,681,005 | (8) | 3,226,993 | (7) | |||||||||||||||||||||
| Health Benefits | 24,433 | (16) | 36,649 | (17) | - | 24,433 | (16) | ||||||||||||||||||||||
| Total | 5,526,426 | 13,292,654 | 9,681,005 | 5,201,426 | |||||||||||||||||||||||||
Patricia Huska(18) | Base Salary | 500,000 | (1) | 1,000,000 | (2) | - | 500,000 | (1) | |||||||||||||||||||||
| Bonus | 1,250,000 | (3) | 1,750,000 | (4) | - | 1,250,000 | (3) | ||||||||||||||||||||||
| Equity | - | - | - | - | |||||||||||||||||||||||||
Options(5) | - | - | - | - | |||||||||||||||||||||||||
RSUs(6) | 2,468,524 | (7) | 7,378,922 | (8) | 7,378,922 | (8) | 2,468,524 | (7) | |||||||||||||||||||||
| Health Benefits | 24,430 | (16) | 36,645 | (17) | - | 24,430 | (16) | ||||||||||||||||||||||
| Total | 4,242,954 | 10,165,567 | 7,378,922 | 4,242,954 | |||||||||||||||||||||||||
Martine Gerow(19) | - | - | - | - | - | ||||||||||||||||||||||||
(1)
Represents 12 months of continued base salary.
(2)
Represents 12 months of continued base salary plus 12 months of base salary paid in a lump sum.
(3)
Represents an amount equal to the target annual bonus plus a pro-rata annual bonus based on actual performance.
(4)
Represents an amount equal to two times the target annual bonus plus a pro-rata annual bonus based on actual performance.
(5)
(6)
RSUs granted in connection with conversion of the performance-based portion of the 2020 and 2021 Executive LTIP awards do not contain any provisions for the acceleration of vesting upon a termination of employment. Ms. Gerow’s supplementalAll other RSUs granted on August 12, 2022under the Equity Incentive Plan (and that do not relate to the RSUs granted in respect of the conversion of her Executive LTIP awards) contain certain termination protections with the amounts reflected in this table based on the closing stock price of our Class A Common Stock of $6.75$6.45 on December 30, 202229, 2023 (the last trading day in fiscal year 2022)2023).
38
(7)
Represents the value of 12 months of continued vesting following termination of employment for outstanding RSUs based on the closing stock price of our Class A Common Stock of $6.75$6.45 on December 30, 202229, 2023 (the last trading day in fiscal year 2022)2023).
Represents the value of full vesting of all outstanding RSUs based on the closing stock price of our Class A Common Stock of $6.75$6.45 on December 30, 202229, 2023 (the last trading day in fiscal year 2022)2023).
Represents the value of outstanding RSUs that would vest on the first scheduled vesting date following a termination of employment based on the closing stock price of our Class A Common Stock of $6.75$6.45 on December 30, 202229, 2023 (the last trading day in fiscal year 2022)2023).
(11)Represents an amount equal to the cost to the Company of providing private medical expenses insurance for 24 months.
(12)Represents an amount equal to the cost to the Company of providing private medical expenses insurance for 18 months.
(14)Represents an amount equal to two times the target annual bonus plus a pro-rata target annual bonus.
(15)Although portions of outstanding Options would have vested under certain circumstances of termination of employment, all outstanding and benefits in connection with his Separation Agreement,unvested Options held by the NEO were out-of-the-money as described below under “— Separation Agreement with Michael Qualantone”, with the value of RSUsDecember 31, 2023, based on the closing stock price of our Class A Common Stock of $6.75$6.45 on December 30, 202229, 2023 (the last trading day in fiscal year 2022): $1,625,0002023) and therefore the Options are reflected in respect of cash severance, $1,500,000 in respect of continued vesting of cash awards under the Executive LTIPs, $2,879,307 in respect of the value of continued vesting of all outstanding RSUs and $34,560 in respect of continued health care coverage at active employee rates.this table as having zero value.
Represents the cost to the Company of providing health care continuation for 12 months at active employee rates.
Represents the cost to the Company of providing health care continuation for 18 months at active employee rates.
(19)Mr. Gerow voluntarily terminated her employment effective June 30, 2023 and was not entitled to any severance payments, continued vesting or other post-termination benefits in connection with such termination.
Employment Agreements; Severance Protection Agreements
GBT UK has entered into addenda to the employment agreements with Mr. Abbott Ms. Gerow and Mr. Crawley (the “Severance Amendments”) and GBT US has entered into a severance protection agreement with Mr. Bock (the “Severance Protection Agreement”), in each case that became effective on the first date that our stock became publicly traded. Ms. Williams' employment contract with GBT UK (the "Williams Contract") contains the same severance protection provisions as are contained in the Severance Amendments. The Severance Amendments, and the Severance Protection Agreement and the Williams Contract provide that upon a termination of the executive’s employment by GBT UK or GBT US, as applicable, without cause, a resignation by the executive for good reason or due to disability (in each case, other than in connection with a change in control), the executive would receive continued base salary for one year, an amount equal to the target annual bonus for the year of termination, a pro-rated annual bonus for the year of termination based on actual performance for Mr. Abbott and Mr. Bock and based on target performance for Ms. GerowWilliams and Mr. Crawley and health benefits for up to 12 months after termination.
Upon a termination of employment by GBT UK or GBT US, as applicable, without cause or a resignation by the executive for good reason, in each case, occurring during the period beginning 60 days
prior to and ending 18 months after a change in control of GBTG (except for a resignation for good reason by Mr. Bock, which period begins on the date of the change in control), in addition to the benefits above, then the executive would receive an additional amount equal to the sum of one times’ base salary plus the target annual bonus, payable in a lump sum, and health benefits for an additional 6 months (12 months for Mr. Abbott). Severance benefits under the Severance Amendments and the Severance Protection Agreement and the Williams Contract are subject to execution and effectiveness of a separation agreement, including a release of claims.
Treatment of Equity Awards
The following describes the treatment of outstanding Options and RSUs held by our NEOs, (other than Mr. Qualantone), as of December 31, 2022,2023, in connection with a termination of employment or a change in control of the Company or its subsidiaries. Details on the termination treatment of Mr. Qualantone’s equity awards are described in the section above, “— Separation Agreement with Michael Qualantone”.
For purposes of the following disclosure, “severance period” refers to the period in which an NEO is entitled to receive continued base salary under any employment or severance agreement with the Company or its subsidiaries as a result of an involuntary termination of employment (or if the base salary is paid in a lump sum, the number of months of base salary that the lump sum represents). All equity awards held by NEOs as of December 31, 20222023 are subject to
39
continuing compliance by the holder with certain restrictive covenants following any termination of employment, including one-year post-termination noncompetitionnon-competition and non-solicitation of customers, vendors and employees restrictions.
Legacy Options
Certain of our NEOs were granted stock optionsOptions prior to December 2, 2021 (“Legacy Options”). Upon an NEO’s involuntary termination, other than in connection with a change in control, Legacy Options will continue to vest for six months following termination of employment and will be exercisable until the earlier of 90 days after the applicable vesting date and the end of the term.term (i.e. 10 years from grant date). Upon a termination of an NEO’s employment due to death or disability, Legacy Options continue to vest for 12 months following such termination of employment and will be exercisable until the earlier of 12 months after the applicable vesting date and the end of the term. In the event that an NEO experiences an involuntary termination within one year after a change in control, Legacy Options will immediately vest in full and remain exercisable for the remainder of the term.
See "Compensation Discussion & Analysis — Equity Compensation - Cancellation of Out-of-the-Money Options in Exchange for One-time Grant of Restricted Stock Units".BCA Options
Each of our NEOs was granted stock optionsOptions on December 2, 2021 (“BCA Options”). Upon an NEO’s involuntary termination, other than in connection with a change in control, BCA Options that are scheduled to vest during the severance period will continue to vest during that severance period. Upon the termination of an NEO’s employment due to death, BCA Options will immediately vest. Upon a termination of an NEO’s employment due to disability or retirement, the next tranche of BCA Options scheduled to vest following such termination of employment will vest on the scheduled vesting date. In each case, BCA Options will remain exercisable until the earlier of (a) the later of November 27, 2023 or the first anniversary of the termination date and (b) the end of the term of the applicable BCA Option. In the event that an NEO experiences a termination of employment by the Company or any of its subsidiaries without cause during the period beginning 60 days prior to and ending 18 months after a change in control, or a termination due to death or disability or resignation for good reason occurring during the 18 month period after a change in control, then the BCA Options will immediately vest in full and be exercisable until the earlier of the first anniversary of termination or the end of the term. For additional details, see "Compensation Discussion & Analysis — Equity Compensation - Cancellation of Out-of-the-Money Options in Exchange for One-time Grant of Restricted Stock Units".
Restricted Stock Units
Upon an NEO’s involuntary termination, other than in connection with a change in control, RSUs that are scheduled to vest during the severance period will continue to vest in accordance with the original schedule. Upon a termination of an NEO’s employment due to death, RSUs will immediately vest and be settled. Upon a termination of an NEO’s employment due to disability, the next tranche of RSUs scheduled to vest will continue to vest and be settled on the original schedule. Upon a termination of an NEO’s employment due to retirement, the RSUs that are next scheduled to vest on the ordinary schedule will continue to vest pro-rata based on the number of months (rounded up) served during the then-current 12-month vesting cycle and be settled on the original schedule.
In the event that an NEO experiences an involuntary termination within 60 days prior to a change in control, RSUs will continue to vest and be settled on their original schedule. If an NEO experiences an involuntary termination within 18 months after a change in control, RSUs will immediately vest and be settled. If an NEO terminates employment due to disability or retirement following a change in control that satisfies the requirements of Treasury Regulation Section 1.409A-3(i)(5)(v) (a “409A change in control”), RSUs will immediately vest and be settled. RSUs are settled within 30 days following the applicable vesting date, except for RSUs settled in connection with qualifying terminations that occur following a 409A change in control, which are settled within 10 days following the termination date.
CEO PAY RATIO
In accordance with Item 402(u) of Regulation S-K, the Company is required to disclose the estimated ratio of the annual total compensation of our Chief Executive Officer (CEO), Mr. Abbott, to the annual total compensation of our median employee for fiscal year 2023.
We used the following methodology to identify the median employee and to calculate the CEO pay ratio:
1.We identified 18,627 individuals employed by the Company or its subsidiaries as on October 1, 2023 (the determination date).
40
2.917 employees from the following 12 countries, representing 4.92% of our global workforce, were excluded under the 5% de minimis exemption.
| Argentina (68) | Hungary (38) | Poland (356) | ||||||
| China (12) | Ireland (8) | Slovakia (12) | ||||||
| Colombia (53) | Italy (82) | Taiwan (92) | ||||||
| Czechia (54) | Philippines (24) | Thailand (118) | ||||||
3.We used annual base salary as the consistently applied compensation measure to identify our median employee.
4.Leveraging reasonable estimates and statistical sampling, we identified a group of employees that fall within a narrow range of the estimated median base salary.From this group, we selected an employee who was reasonably representative of our workforce.
Using this methodology, our median employee was a full-time employee from our Traveler Care organization located in the U.S. The median employee annual total compensation for 2023 was $44,680(1). Mr. Abbot's annual total compensation for 2023 was $18,259,503(1). The ratio of Mr. Abbott's annual compensation to that of our median employee for 2023 is 409:1. The resulting ratio for Mr. Abbott is impacted by the one-time Exchange Offer award as described in more detail under the section “Compensation Discussion & Analysis — Equity Compensation - Cancellation of Out-of-the-Money Options in Exchange for One-time Grant of Restricted Stock Units”. Without including the one-time Exchange Offer award, the ratio to our median employee for 2023 would have been 308:1.
The ratio provided above (i.e., 409:1) is a reasonable estimate calculated in a manner consistent with SEC rules. Other companies may have different workforce demographics and compensation practices and may utilize different methodologies, estimates and assumptions. Accordingly, it may not be possible to make meaningful comparisons of our CEO pay ratio to that of other companies.
(1)This calculation includes all elements of compensation for the year, consistent with what is disclosed in the Summary Compensation Table, such as salary, bonus, stock awards, option awards, non-equity incentive plan compensation, and all other compensation.
41
PAY VERSUS PERFORMANCE
The following table sets forth a comparison of compensation reported in the Summary Compensation Table (“SCT”) to compensation actually paid to our Principal Executive Officer (“PEO”) and other non-PEO NEOs. The table also sets forth information on Company performance. The calculations and analysis set forth below are in accordance with the requirements of Item 402(v) of Regulation S-K and do not reflect the Company’s approach to aligning pay with performance. For more information on the Company’s pay practices, please see the CD&A, above. Amounts that would be paid in British pound sterling to Mr. Abbott, Ms. Gerow, Ms. Williams and Mr. Crawley have been converted to United States dollars for purposes of this disclosure. Salary and all other compensation have been converted at an annual average exchange rate (based on monthly averages) equal to $1.24 per £1.00 for 2023 and 2022 (in each case, rounded to the nearest cent) and bonuses and non-equity incentive plan compensation have been converted at the rate in effect on the date of payments as set forth in the notes to the Summary Compensation Table.
| Year | | | SCT Total for PEO ($)(1) | | | Compensation Actually Paid to PEO ($)(2) | | | Average SCT Total for non- PEO NEOs ($)(3) | | | Average Compensation Actually Paid to Non-PEO NEOs ($)(4) | | | Value of Initial Fixed $100 Investment Based On: | | | Net Income/ (Loss) ($mm) | | | Adjusted EBITDA Growth ($mm)(6) | | |||||||||||||||||||||||||||
| | Total Shareholder Return ($)(5) | | | Peer Total Shareholder Return ($)(5) | | ||||||||||||||||||||||||||||||||||||||||||||
| 2022 | | | | | 12,969,199 | | | | | | 7,548,541 | | | | | | 7,175,154 | | | | | | 3,946,604 | | | | | | 81 | | | | | | 89 | | | | | | (229) | | | | | | 567 | | |
| Year | SCT Total for PEO ($)(1) | Compensation Actually Paid to PEO ($)(2) | Average SCT Total for non- PEO NEOs ($)(3) | Average Compensation Actually Paid to Non-PEO NEOs ($)(4) | Value of Initial Fixed $100 Investment Based On: | Net Income/ (Loss) ($M) | Adjusted EBITDA ($M)(6) | |||||||||||||||||||||||||||||||||||||||||||||||||||||||||||||||||||||||||||||||||||||||||||
Total Shareholder Return ($)(5) | Peer Total Shareholder Return ($)(5) | |||||||||||||||||||||||||||||||||||||||||||||||||||||||||||||||||||||||||||||||||||||||||||||||||
| 2023 | 18,259,503 | 14,003,080 | 7,114,399 | 5,039,112 | 77 | 123 | -136 | 380 | ||||||||||||||||||||||||||||||||||||||||||||||||||||||||||||||||||||||||||||||||||||||||||
| 2022 | 12,969,199 | 7,548,541 | 7,175,154 | 3,946,604 | 81 | 89 | -229 | 103 | ||||||||||||||||||||||||||||||||||||||||||||||||||||||||||||||||||||||||||||||||||||||||||
(1)
The amount from the “Total” column of the Summary Compensation Table for our PEO.
(2)
The following table sets forth a reconciliation from the SCT to amounts actually paid to our PEO.
| | | | | | | | | | | | | | | | Equity Addition to SCT Total | | | | | | | | |||||||||||||||||||||
| Year | | | SCT Total ($) | | | Less Equity Deduction From SCT Total ($)(7) | | | Value of Current Year Equity Awards at 12/31 ($)(8) | | | Change in Value of Unvested Prior Year Awards at 12/31 ($)(9) | | | Change in Value of Prior Year Awards That Vested In Current Year ($)(10) | | | Total Equity Addition/ Deduction to SCT Total ($) | | | Total Compensation Actually Paid ($)(11) | | |||||||||||||||||||||
| 2022 | | | | | 12,969,199 | | | | | | (6,000,000) | | | | | | 5,273,438 | | | | | | (2,605,620) | | | | | | (2,088,475) | | | | | | 579,342 | | | | | | 7,548,541 | | |
| Equity Addition to SCT Total | ||||||||||||||||||||||||||
| SCT Total | Less Equity Deduction From SCT Total | Value of Current Year Equity Awards at 12/31 | Change in Value of Unvested Prior Year Awards at 12/31 | Change in Value of Prior Year Awards That Vested In Current Year | Less Prior Value of Unvested Equity Awards That Were Canceled or Forfeited in Current Year | Total Equity Addition/ Deduction to SCT Total | Total Compensation Actually Paid | |||||||||||||||||||
| Year | ($) | ($)(7) | ($)(8) | ($) (9) | ($)(10) | ($)(11) | ($) | ($)(12) | ||||||||||||||||||
| 2023 | 18,259,503 | (11,499,993) | 11,159,074 | (117,188) | (39,062) | (3,759,253) | 7,243,571 | 14,003,080 | ||||||||||||||||||
| 2022 | 12,969,199 | (6,000,000) | 5,273,438 | (2,605,620) | (2,088,475) | 0 | 579,343 | 7,548,541 | ||||||||||||||||||
(3)
The average amounts from the “Total” column of the Summary Compensation Table for the Company’s non-PEO NEOs.
(4)
The following table sets forth a reconciliation from the SCT to the average amounts actually paid to our non-PEO NEOs.
| | | | | | | | | | | | | | | | Equity Addition to SCT Total(12) | | | | | | | | |||||||||||||||||||||
| Year | | | SCT Total ($) | | | Less Equity Deduction From SCT Total ($)(13) | | | Value of Current Year Equity Awards at 12/31 ($)(8) | | | Change in Value of Unvested Prior Year Awards at 12/31 ($)(9) | | | Change in Value of Prior Year Awards That Vested In Current Year ($)(10) | | | Total Equity Addition/ Deduction to SCT Total ($) | | | Total Compensation Actually Paid ($)(11) | | |||||||||||||||||||||
| 2022 | | | | | 7,175,154 | | | | | | (4,455,667) | | | | | | 2,914,422 | | | | | | (1,067,523) | | | | | | (619,782) | | | | | | 1,227,117 | | | | | | 3,946,604 | | |
| Equity Addition to SCT Total | ||||||||||||||||||||||||||
| SCT Total | Less Equity Deduction From SCT Total | Value of Current Year Equity Awards at 12/31 | Change in Value of Unvested Prior Year Awards at 12/31 | Change in Value of Prior Year Awards That Vested In Current Year | Less Prior Value of Unvested Equity Awards That Were Canceled or Forfeited in Current Year | Total Equity Addition/ Deduction to SCT Total | Total Compensation Actually Paid | |||||||||||||||||||
| Year | ($) | ($)(7) | ($)(8) | ($) (9) | ($)(10) | ($)(11) | ($) | ($)(12) | ||||||||||||||||||
| 2023 | 7,114,399 | (5,299,993) | 4,668,811 | (46,189) | (3,078) | (1,394,837) | 3,224,707 | 5,039,112 | ||||||||||||||||||
| 2022 | 7,175,154 | (4,455,667) | 2,914,422 | (1,067,523) | (619,782) | 0 | 1,227,117 | 3,946,604 | ||||||||||||||||||
(5)
Shareholder returns reflect $100 invested as of market close on May 31, 2022, the first trading day of GBTG Class A Common Stock. The Peer Total Shareholder Return is based on the S&P Software & Services Select Industry Index.Index, which is used for purposes of the GBTG Form 10-K performance graph.
(6)
Company-selected measure of Adjusted EBITDA Growth as used for our AIA Plan awards in 20222023 and as discussed under the section “Compensation“Compensation Discussion & Analysis — Annual Incentive Compensation”, above. Adjusted EBITDA is a non-GAAP measure and is defined and reconciled to the most comparable GAAP measure (i.e., EBITDA) in our Annual
42
Report on Form 10-K for the year ended December 31, 2023 in Item 7, “Management's Discussion and Analysis of Financial Condition and Results of Operations—EBITDA, Adjusted EBITDA, Adjusted EBITDA Margin and Adjusted Operating Expenses”.
(7)
Represents the grant date fair value of equity-based awards made during the applicable fiscal year.
(8)
Represents the year-end fair value of equity awards that were made during the fiscal year (no grants made during fiscal year 2022have vested during fiscalthe same year 2022)as granted).
(9)
Represents the change in fair value during the fiscal year of equity-based awards granted in prior fiscal years that were still unvested as of year-end.
(10)
Represents the change in fair value during the 2022 fiscalfrom prior year end until vesting date of equity-based awards granted in prior fiscal years that vested during the current fiscal year. All such
(11)Represents the fair value as of prior year end of unvested equity awards consistthat were either cancelled or forfeited during the current fiscal year. As discussed above under the section “Compensation Discussion & Analysis — Cancellation of Out-of-the-Money Options granted during fiscal years 2017, 2018, 2019, and 2021.
| Valuation Purpose for Pay Versus Performance | | | GBTG Stock Price Range | | | GBTG Option Exercise Price Range | | | Expected Term Range (years) | | | Stock Price Volatility Range | | | Risk-free Rate Range | | | Dividend Yield | | | Option Fair Value Range | |
| Year-end 2021 | | | $9.48 | | | $6.72 – $14.58 | | | 2.75 – 5.92 | | | 35% – 45% | | | 0.91% – 1.34% | | | 0% | | | $1.76 – $4.06 | |
| 2022 Vesting | | | $5.28 – $8.19 | | | $6.72 – $14.58 | | | 2.45 – 5.00 | | | 40% – 50% | | | 2.61% – 4.17% | | | 0% | | | $0.70 – $3.11 | |
| Year-end 2022 | | | $6.75 | | | $7.23 – $14.58 | | | 2.63 – 4.94 | | | 40% – 45% | | | 4.00% – 4.29% | | | 0% | | | $1.03 – $2.03 | |
| Date | | | GBTG Stock Price | | | Comment | | |||
| December 31, 2021 | | | | $ | 9.48 | | | | Year-end 2021 appraised value | |
| April 1, 2022 | | | | $ | 8.19 | | | | Vesting date for options with an exercise price of $7.23 | |
| May 27, 2022 | | | | $ | 7.39 | | | | Closing of the Business Combination and grant of Earnout Shares | |
| May 31, 2022 | | | | $ | 8.37 | | | | First day of public trading of GBTG Class A Common Stock | |
| July 1, 2022 | | | | $ | 5.16 | | | | Vesting date for options with an exercise price of $6.72 | |
| August 11, 2022 | | | | $ | 7.68 | | | | Closing price used to determine RSU grants on August 12, 2022 | |
| October 1, 2022 | | | | $ | 5.66 | | | | Vesting date for options with an exercise price of $14.58 | |
| December 2, 2022 | | | | $ | 5.28 | | | | Vesting date for options with an exercise price of $10.03 | |
| December 30, 2022 | | | | $ | 6.75 | | | | Closing price for the final trading day in 2022 | |
SCT total, less SCT equity grant fair value, plus year-end fair value of equity awards made during the year, plus the change in fair value during the year of equity awards that remained unvested as of year-end, plus the change in fair value of equity awards that vested during the year.
List of Most Important Financial Measures
The table below sets forth the financial performance measures that we considered to be the most important in how compensation actually paid was linked to company performance during 2022.2023. As
discussed under the section “Compensation Discussion & Analysis — Annual Incentive Compensation”, above, the AIA Plan uses Adjusted EBITDA as the primary financial metric. As discussed in the Management Discussion & Analysis section of our 20222023 Annual Report, Revenue and Free Cash Flow are among the Key Financial Metrics used in evaluating our overall business performance. Revenue is a primary driver of our Adjusted EBITDA results, and our Adjusted EBITDA results are a primary driver of our Free Cash Flow results.
Key Financial Measures
Adjusted EBITDA
Adjusted EBITDA Margin
Revenue
Free Cash Flow
Revenue
Free Cash Flow
Analysis of the Relationship Between Pay and Performance
Compensation Actually Paid and Cumulative Total Shareholder Return (TSR)Adjusted EBITDA
![[MISSING IMAGE: bc_compensation-4c.jpg]](https://capedge.com/proxy/DEF 14A/0001104659-23-048472/bc_compensation-4c.jpg)

43
Compensation Actually Paid and Net Income (Loss)
![[MISSING IMAGE: bc_netincome-4c.jpg]](https://capedge.com/proxy/DEF 14A/0001104659-23-048472/bc_netincome-4c.jpg)
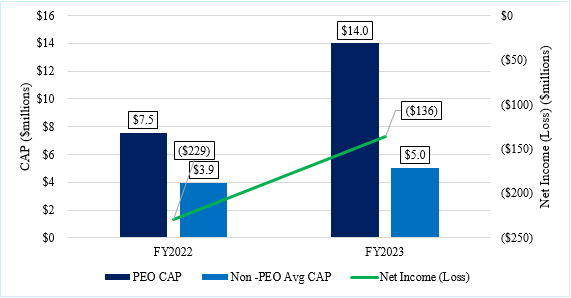
Compensation Actually Paid and Adjusted EBITDA GrowthCumulative Total Shareholder Return (TSR)
![[MISSING IMAGE: bc_growth-4c.jpg]](https://capedge.com/proxy/DEF 14A/0001104659-23-048472/bc_growth-4c.jpg)
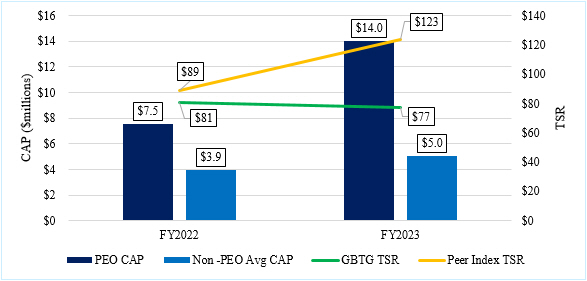
44
NON-EMPLOYEE DIRECTOR COMPENSATION
Our Director Compensation Policy provides for the annual payments and meeting fee premiums to independentnon-employee directors described in the table below:
| | | Cash Retainer ($) | | Meeting Fee Premium ($) | | Restricted Stock Unit Awards ($) | | ||||||||||||||||||||||||||||||||||||||||||||||||||||||||||
| Cash Retainer ($) | Cash Retainer ($) | Meeting Fee Premium ($) | Restricted Stock Unit Awards ($) | ||||||||||||||||||||||||||||||||||||||||||||||||||||||||||||||
| Board | | | | | | | | | | | | | | | | | |||||||||||||||||||||||||||||||||||||||||||||||||
| Chair | | | | 485,000 | | | | | — | | | | | 160,000 | | | |||||||||||||||||||||||||||||||||||||||||||||||||
| Chair | |||||||||||||||||||||||||||||||||||||||||||||||||||||||||||||||||
| Chair | |||||||||||||||||||||||||||||||||||||||||||||||||||||||||||||||||
| Chair | |||||||||||||||||||||||||||||||||||||||||||||||||||||||||||||||||
| Chair | |||||||||||||||||||||||||||||||||||||||||||||||||||||||||||||||||
| Chair | |||||||||||||||||||||||||||||||||||||||||||||||||||||||||||||||||
| Chair | |||||||||||||||||||||||||||||||||||||||||||||||||||||||||||||||||
| Chair | |||||||||||||||||||||||||||||||||||||||||||||||||||||||||||||||||
| Chair | |||||||||||||||||||||||||||||||||||||||||||||||||||||||||||||||||
| Other Directors | |||||||||||||||||||||||||||||||||||||||||||||||||||||||||||||||||
| Other Directors | |||||||||||||||||||||||||||||||||||||||||||||||||||||||||||||||||
| Other Directors | | | | 85,000 | | | | | — | | | | | 160,000 | | | |||||||||||||||||||||||||||||||||||||||||||||||||
| Audit and Finance Committee | | | | | | | | | | | | | | | | | |||||||||||||||||||||||||||||||||||||||||||||||||
Audit and Finance Committee | |||||||||||||||||||||||||||||||||||||||||||||||||||||||||||||||||
Audit and Finance Committee | |||||||||||||||||||||||||||||||||||||||||||||||||||||||||||||||||
| Chair | |||||||||||||||||||||||||||||||||||||||||||||||||||||||||||||||||
| Chair | |||||||||||||||||||||||||||||||||||||||||||||||||||||||||||||||||
| Chair | |||||||||||||||||||||||||||||||||||||||||||||||||||||||||||||||||
| Chair | |||||||||||||||||||||||||||||||||||||||||||||||||||||||||||||||||
| Chair | |||||||||||||||||||||||||||||||||||||||||||||||||||||||||||||||||
| Chair | |||||||||||||||||||||||||||||||||||||||||||||||||||||||||||||||||
| Chair | |||||||||||||||||||||||||||||||||||||||||||||||||||||||||||||||||
| Chair | |||||||||||||||||||||||||||||||||||||||||||||||||||||||||||||||||
| Chair | | | | 15,000 | | | | | 2,000 | | | | | — | | | |||||||||||||||||||||||||||||||||||||||||||||||||
| Other Members | | | | 15,000 | | | | | 2,000 | | | | | — | | | |||||||||||||||||||||||||||||||||||||||||||||||||
| Other Members | |||||||||||||||||||||||||||||||||||||||||||||||||||||||||||||||||
| Other Members | |||||||||||||||||||||||||||||||||||||||||||||||||||||||||||||||||
Compensation Committee | |||||||||||||||||||||||||||||||||||||||||||||||||||||||||||||||||
Compensation Committee | |||||||||||||||||||||||||||||||||||||||||||||||||||||||||||||||||
| Compensation Committee | | | | | | | | | | | | | | | | | |||||||||||||||||||||||||||||||||||||||||||||||||
| Chair | | | | 15,000 | | | | | 2,000 | | | | | — | | | |||||||||||||||||||||||||||||||||||||||||||||||||
| Chair | |||||||||||||||||||||||||||||||||||||||||||||||||||||||||||||||||
| Chair | |||||||||||||||||||||||||||||||||||||||||||||||||||||||||||||||||
| Chair | |||||||||||||||||||||||||||||||||||||||||||||||||||||||||||||||||
| Chair | |||||||||||||||||||||||||||||||||||||||||||||||||||||||||||||||||
| Chair | |||||||||||||||||||||||||||||||||||||||||||||||||||||||||||||||||
| Chair | |||||||||||||||||||||||||||||||||||||||||||||||||||||||||||||||||
| Chair | |||||||||||||||||||||||||||||||||||||||||||||||||||||||||||||||||
| Chair | |||||||||||||||||||||||||||||||||||||||||||||||||||||||||||||||||
| Other Members | |||||||||||||||||||||||||||||||||||||||||||||||||||||||||||||||||
| Other Members | |||||||||||||||||||||||||||||||||||||||||||||||||||||||||||||||||
| Other Members | | | | 10,000 | | | | | 2,000 | | | | | — | | | |||||||||||||||||||||||||||||||||||||||||||||||||
| Nominating and Corporate Governance Committee | | | | | | | | | | | | | | | | | |||||||||||||||||||||||||||||||||||||||||||||||||
Nominating and Corporate Governance Committee | |||||||||||||||||||||||||||||||||||||||||||||||||||||||||||||||||
Nominating and Corporate Governance Committee | |||||||||||||||||||||||||||||||||||||||||||||||||||||||||||||||||
| Chair | |||||||||||||||||||||||||||||||||||||||||||||||||||||||||||||||||
| Chair | |||||||||||||||||||||||||||||||||||||||||||||||||||||||||||||||||
| Chair | |||||||||||||||||||||||||||||||||||||||||||||||||||||||||||||||||
| Chair | |||||||||||||||||||||||||||||||||||||||||||||||||||||||||||||||||
| Chair | |||||||||||||||||||||||||||||||||||||||||||||||||||||||||||||||||
| Chair | |||||||||||||||||||||||||||||||||||||||||||||||||||||||||||||||||
| Chair | |||||||||||||||||||||||||||||||||||||||||||||||||||||||||||||||||
| Chair | |||||||||||||||||||||||||||||||||||||||||||||||||||||||||||||||||
| Chair | | | | 10,000 | | | | | 2,000 | | | | | — | | | |||||||||||||||||||||||||||||||||||||||||||||||||
| Other Members | | | | 10,000 | | | | | 2,000 | | | | | — | | | |||||||||||||||||||||||||||||||||||||||||||||||||
| Other Members | |||||||||||||||||||||||||||||||||||||||||||||||||||||||||||||||||
| Other Members | |||||||||||||||||||||||||||||||||||||||||||||||||||||||||||||||||
Risk Management and Compliance Committee | |||||||||||||||||||||||||||||||||||||||||||||||||||||||||||||||||
Risk Management and Compliance Committee | |||||||||||||||||||||||||||||||||||||||||||||||||||||||||||||||||
| Risk Management and Compliance Committee | | | | | | | | | | | | | | | | | |||||||||||||||||||||||||||||||||||||||||||||||||
| Chair | | | | 10,000 | | | | | 2,000 | | | | | — | | | |||||||||||||||||||||||||||||||||||||||||||||||||
| Chair | |||||||||||||||||||||||||||||||||||||||||||||||||||||||||||||||||
| Chair | |||||||||||||||||||||||||||||||||||||||||||||||||||||||||||||||||
| Chair | |||||||||||||||||||||||||||||||||||||||||||||||||||||||||||||||||
| Chair | |||||||||||||||||||||||||||||||||||||||||||||||||||||||||||||||||
| Chair | |||||||||||||||||||||||||||||||||||||||||||||||||||||||||||||||||
| Chair | |||||||||||||||||||||||||||||||||||||||||||||||||||||||||||||||||
| Chair | |||||||||||||||||||||||||||||||||||||||||||||||||||||||||||||||||
| Chair | |||||||||||||||||||||||||||||||||||||||||||||||||||||||||||||||||
| Other Members | | | | 10,000 | | | | | 2,000 | | | | | — | | | |||||||||||||||||||||||||||||||||||||||||||||||||
| Other Members | |||||||||||||||||||||||||||||||||||||||||||||||||||||||||||||||||
| Other Members | |||||||||||||||||||||||||||||||||||||||||||||||||||||||||||||||||
We only pay retainers to directors who are not employees of the Company or any of its subsidiaries. All members of our boardthe Board of directors,Directors, including directors who are not independent, are reimbursed for their travel costs and expenses incurred in connection with attending board and committee meetings and related Company business.
45
Director Compensation Table
The following table sets forth in summary form information concerning the compensation that we paid or awarded to our non-executivenon-employee directors during the fiscal year ended December 31, 2022. This table includes individuals who, prior to the closing of the Business Combination, were directors of GBT or were directors of GBTG following the closing of the Business Combination.
2023.| Name | | | Fees Earned or Paid in Cash ($) | | | Stock Awards ($) | | | Total ($) | | |||||||||
| Mohammed Saif S.S. Al-Sowaidi | | | | | 146,651 | | | | | | 160,000 | | | | | | 306,651 | | |
| Ugo Arzani(1) | | | | | 81,233 | | | | | | — | | | | | | 81,233 | | |
| James P. Bush(2) | | | | | 169,151 | | | | | | 160,000 | | | | | | 329,151 | | |
| Philippe Chérèque(1) | | | | | 81,233 | | | | | | — | | | | | | 81,233 | | |
| Marc D. Gordon(1)(5) | | | | | 81,233 | | | | | | — | | | | | | 81,233 | | |
| Gloria Guevara(3) | | | | | 63,274 | | | | | | 160,000 | | | | | | 223,274 | | |
| Eric Hart(4) | | | | | 131,651 | | | | | | 160,000 | | | | | | 291,651 | | |
| Raymond Donald Joabar(5) | | | | | 139,151 | | | | | | 160,000 | | | | | | 299,151 | | |
| Glenda McNeal(1)(5) | | | | | 81,233 | | | | | | — | | | | | | 81,233 | | |
| Michael Gregory O’Hara(6) | | | | | 594,493 | | | | | | 160,000 | | | | | | 754,493 | | |
| Richard Petrino(5) | | | | | 139,151 | | | | | | 160,000 | | | | | | 329,151 | | |
| Itai Wallach(7) | | | | | 55,774 | | | | | | — | | | | | | 55,774 | | |
| Susan Ward | | | | | 161,651 | | | | | | 160,000 | | | | | | 321,651 | | |
| Kathleen Winters(8) | | | | | 82,024 | | | | | | 160,000 | | | | | | 242,024 | | |
| Name | Fees Earned or Paid in Cash ($) | Stock Awards ($) | Total ($) | ||||||||||||||
| Mohammed Saif S.S. Al Sowaidi | 105,000 | 160,000 | 265,000 | ||||||||||||||
James P. Bush (1) | 137,000 | 160,000 | 297,000 | ||||||||||||||
Gloria Guevara (2) | 104,000 | 160,000 | 264,000 | ||||||||||||||
| Eric Hart | 85,000 | 160,000 | 245,000 | ||||||||||||||
| Raymond Donald Joabar | 95,000 | 160,000 | 255,000 | ||||||||||||||
Michael Gregory O'Hara (3) | 515,000 | 160,000 | 675,000 | ||||||||||||||
| Richard Petrino | 95,000 | 160,000 | 255,000 | ||||||||||||||
Itai Wallach (4) | 91,000 | — | 91,000 | ||||||||||||||
| Susan Ward | 140,500 | 160,000 | 300,500 | ||||||||||||||
Kathleen Winters(5) | 131,000 | 160,000 | 291,000 | ||||||||||||||
(1)
Mr. Bush’s fees were paid directly to Spyglass Unlimited, LLC, an entity partially owned by Mr. Bush.
Ms. Guevara’s fees were paid directly to Guevara Manzo Corp., an entity controlled by Ms. Guevara.
Mr. O’Hara’s fees were paid directly to Clementine Investments LLC, an entity controlled by Mr. O’Hara.
Mr. Wallach’s fees were paid to Apollo Principal Holdings III L.P. in respect of his service.
Ms. Winters’ fees were paid directly to Winters Advisory Inc., an entity controlled by Ms. Winters.
Compensation Committee Interlocks and Insider Participation
None of our executive officers currently serves as a member of the board of directors or as a member of a compensation committee of any other company that has an executive officer serving as a member of the boardour Board of Directors or the Compensation Committee. None of the individuals who served on the Compensation Committee during fiscal year 20222023 and none of the current members of the Compensation Committee are current or former officers or employees of the Company. Additionally, none of the individuals who currently serve as members of the Compensation Committee or who served as members of the Compensation Committee during fiscal year 20222023 has had any relationship requiring disclosure by the Company under Item 404 of Regulation S-K.
Prohibitions Against Hedging and Pledging
As part of our insider trading policy, all directors, officers and employees of the Company are prohibited from engaging in hedging transactions (such as prepaid variable forward sales contracts, equity swaps, collars and exchange funds) involving our securities, holding our securities in a margin account or pledging our securities as collateral for a loan.
46
EQUITY COMPENSATION PLAN INFORMATION
| Plan Category | | | Number of securities to be issued upon exercise of outstanding options, warrants and rights(1) | | | Weighted-average exercise price of outstanding options, warrants and rights | | | Number of securities remaining available for future issuance under equity compensation plans (excluding securities reflected in column (a))(2) | | |||||||||
| Equity compensation plans approved by security holders: | | | | | 47,686,422 | | | | | $ | 7.66 | | | | | | 47,650,535 | | |
| Equity compensation plans not approved by security holders: | | | | | — | | | | | | — | | | | | | — | | |
| Total | | | | | 47,686,422 | | | | | $ | 7.66 | | | | | | 47,650,535 | | |
| Plan Category | Number of securities to be issued upon exercise of outstanding options, warrants and rights(1) | Weighted-average exercise price of outstanding options, warrants and rights | Number of securities remaining available for future issuance under equity compensation plans (excluding securities reflected in column (a))(2) | |||||||||||||||||||||||||||||
| Equity compensation plans approved by security holders: | 44,025,231 | $ | 6.99 | 45,332,266 | ||||||||||||||||||||||||||||
| Equity compensation plans not approved by security holders: | — | — | — | |||||||||||||||||||||||||||||
Total | 44,025,231 | $ | 6.99 | 45,332,266 | ||||||||||||||||||||||||||||
(1)
The amount set forth in this column consists of 11,288,74524,435,324 shares issuable upon settlement of RSUs granted under the 2022 Plan and 36,397,67719,589,907 shares issuable upon exercise of Options, granted under the MIP, in each case, as of December 31, 2022.2023. RSUs are not reflected in the weighted exercise price in column (b) as these awards do not have an exercise price. These amounts do not include Earnout Shares which were not issued pursuant to an equity compensation plan but are subject to performance-based and service-based vesting conditions and are convertible one-for-one into Class A Common Stock whenin the event the performance-based conditions are satisfied.
(2)
The amount set forth in this column reflects 36,581,54630,605,450 shares available for future issuance under the 2022 Plan and 11,068,98914,726,816 shares available for future issuance under the ESPP, in each case, as of December 31, 2022.2023. On January 1st of each year during which the ESPP is in effect, commencing on January 1, 2023, the number of shares available for purchase under the ESPP will be automatically increased by the lesser of (x) 11,068,989 shares, (y) 1% of the number of shares of all Class A Common Stock outstanding as of the immediately preceding December 31 (calculated on a fully diluted basis, including derivative securities of the Company that may become convertible for equity securities of the Company), and (z) such lesser number of shares as our boardthe Board of directorsDirectors may determine, in each case, subject to equitable adjustment to reflect certain corporate events.
As of December 31, 2022,2023, equity securities have been authorized for issuance to employees, consultants and/or non-employee directors under the 2022 Plan, the MIP and the ESPP. As of December 31, 2022,2023, although no further awards may be granted under the MIP, there remain outstanding Options under the MIP, which are reflected in Column (a) of the table. In 2022, no offering periods commenced under the ESPP.
47
CERTAIN RELATIONSHIPS AND RELATED PERSON TRANSACTIONS
We believe the terms obtained or consideration that we paid or received, as applicable, in connection with the transactions described below, were comparable to terms available or the amounts that we would pay or receive, as applicable, in arm’s-length transactions.
In addition to the director and executive officer compensation arrangements discussed above in the section entitled “Compensation Discussion & Analysis,” this section describes transactions, or series of related transactions, since January 1, 20222023 to which we were a party or will be a party, in which:
•
the amount involved exceeded or will exceed $120,000; and
•
any of our directors, executive officers or beneficial owners of more than 5% of any class of our capital stock (each, a “5% Holder”), or any members of the immediate family of and any entity affiliated with any such person, had or will have a direct or indirect material interest.
Related Party Transactions
Registration Rights Agreement
At the closing of the Business Combination, we entered into an amended and restated registration rights agreement (the “Registration Rights Agreement”) with theAPSG Sponsor, L.P. (the "Sponsor"), members of our boardthe Board of directorsDirectors and management (the “Insiders”) and American Express Travel Holdings Netherlands Coöperatief U.A. (“Amex Coop”), Juweel Investors (SPC) Limited ("Juweel") and Expedia (collectively, the Continuing"Continuing JerseyCo Owners,Owners"), pursuant to which, among other things, we agreed to register for resale, pursuant to Rule 415 under the Securities Act, certain shares of our Class A Common Stock and other equity securities that are held by the holders party to the Registration Rights Agreement from time to time. Pursuant to the Registration Rights Agreement, we filed a registration statement on Form S-1 registering the issuance and resale of certain shares of our Class A Common Stock and warrants.
The Sponsor and the Insiders may collectively demand not more than one underwritten shelf takedown per fiscal quarter and each Continuing JerseyCo Owner may demand not more than one underwritten shelf takedown per fiscal quarter, in each case, subject to certain customary limitations set forth in the Registration Rights Agreement, including the right of the underwriters to limit the number of securities to be included in an underwritten offering and our right to delay or withdraw a registration statement under certain circumstances. The holders party to the Registration Rights Agreement are also entitled to certain piggyback registration rights and indemnification rights.
Exchange Agreement
At the closing of the Business Combination, we entered into an exchange agreement (the “Exchange Agreement”) with GBT JerseyCo and the Continuing JerseyCo Owners, giving the Continuing JerseyCo Owners (or certain permitted transferees thereof) the right, on the terms and subject to the conditions thereof, to exchange their GBT JerseyCo B Ordinary Shares (with automatic surrender for cancellation of an equal number of shares of Class B Common Stock) for shares of Class A Common Stock on a one-for-one basis, subject to customary adjustments for stock splits, dividends, reclassifications and other similar transactions, or, in certain limited circumstances, at the option of the Exchange Committee designated in the Exchange Agreement, for cash (based on the dollar VWAP of Class A Common Stock for the five trading day period ending on the trading day immediately preceding the applicable exchange date).
In addition, to preserve the Up-C structure, the Exchange Agreement provides that we and GBT JerseyCo will take (or, in some cases, forbear from taking) various actions, as necessary to maintain a one-to-one ratio between the number of issued and outstanding (x) Class A Common Stock (and equivalents) and the GBT JerseyCo A Ordinary Shares and (y) Class B Common Stock and the GBT JerseyCo B Ordinary Shares. For example, if we issue or sell additional shares of Class A Common Stock, we will contribute the net proceeds of such issuance or sale to GBT JerseyCo, and GBT JerseyCo will issue to us an equal number of GBT JerseyCo A Ordinary Shares. Similarly, the Exchange Agreement provides neither we nor GBT JerseyCo may effect any subdivision or combination of any of its equity securities unless the other effects an identical subdivision or combination of the corresponding class of its equity securities. As the Continuing JerseyCo Owners (or certain permitted transferees thereof) exchange GBT JerseyCo B Ordinary Shares (with automatic surrender for cancellation of an equal number of shares of Class B Common Stock) for shares of Class A Common Stock or cash, the number of GBT JerseyCo A Ordinary Shares held by us will be correspondingly increased, and a corresponding number of shares of Class B Common Stock will be cancelled.
48
Shareholders Agreement
At the closing of the Business Combination, we, GBT JerseyCo and the Continuing JerseyCo OwnersOwners) entered into a Shareholders Agreement. TheAgreement, dated as of May 27, 2022 (as further clarified by those certain letters dated November 17, 2022, and July 10, 2023, the “Original Shareholders Agreement”). Juweel has since distributed all of its equity interests in the Company and GBT JerseyCo to its equityholders, including QIA, and Amex Coop has since assigned all of its rights and obligations under the Original Shareholders Agreement sets forth various restrictions, limitationsto Amex HoldCo.
On January 11, 2024, GBTG entered into an amended and restated Shareholders Agreement (as amended and restated, the "Shareholders Agreement") with GBT JerseyCo, Juweel, Amex HoldCo., Expedia and QIA, pursuant to which, among other terms concerningthings, Juweel was removed as a party to the transfer of our or GBT’s equity securities by the parties thereto (other than, in
The Shareholders Agreement specifies the initial composition of our board of directors effective immediately upon the closing of the Business Combination. WeCompany agreed with each Continuing JerseyCo Ownerof Amex HoldCo., Expedia and QIA (on a several basis), to take all necessary action within its control to cause the boardBoard of directorsDirectors to have 11 directors, consisting of the Chief Executive Officer, two Amex HoldCo. nominees, two JuweelQIA nominees, one Expedia nominee, one Sponsor nominee, and, for so long as the director designated by the Sponsor is serving on the boardBoard of directors,Directors, four independent nominees, nominated by the boardBoard of directors’Directors’ nominating and governance committee, and, following the conclusion of the Sponsor designee’s service on the boardBoard of directors,Directors, five such independent nominees. If Amex HoldCo. or JuweelQIA ceases to own at least 15% of our issued shares, it will thereafter have the right (on a several basis) to nominate only one director, and if any Continuing JerseyCo Ownerof Amex HoldCo., QIA or Expedia ceases to own at least 5% of our issued shares, it will thereafter have no right to nominate a director, except that Amex HoldCo. will continue to have the right (on a several basis) to nominate a director for so long as we are a “controlled entity” under the Bank Holding Company Act of 1956 (the “BHC Act”).
The Shareholders Agreement also requires (subject to certain specified conditions and exceptions including those described below) the approval of each Continuing JerseyCo OwnerAmex HoldCo., Expedia and QIA for us or its subsidiaries to take certain actions, including:
•
Other than in accordance with the Certificate of Incorporation or pursuant to an issuer tender offer or share repurchase program that, in each case, was approved by the boardBoard of directors,Directors, the redemption, cancellation or repayment of any of our or GBT’sGBT JerseyCo’s equity securities, other than on a pro rata basis from all shareholders;
•
Dividends or distributions, other than on a pro rata basis;
•
Other than in accordance with the Certificate of Incorporation, any share exchanges, splits, combinations and similar actions with respect to one or more, but not all, classes or series of GBTG or GBT JerseyCo shares;
•
Amendments to GBT’sGBT JerseyCo’s organizational documents that relate specifically and solely to rights, priorities and privileges of the GBT B Ordinary Shares or the GBTJerseyCo C Ordinary Shares (non-voting redeemable shares of GBT JerseyCo, designated as “C Ordinary Shares” in the GBT JerseyCo amended and restated memorandum of association with a nominal value of €0.00001), as applicable, or have a disproportionate adverse effect on such shares as compared to any other class or series of shares, and do not require a separate class vote of the holders of such shares; or
•
Any agreement or commitment to do any of the foregoing.
In general, the foregoing approval right of a Continuing JerseyCo OwnerAmex HoldCo., Expedia and QIA will terminate if such Continuing JerseyCo Ownershareholder ceases to own at least 10% of our issued common stock; however, an amendment to GBT’sGBT JerseyCo’s organizational documents of the type described in the fourth bullet in the preceding sentence will require the approval of any Continuing JerseyCo Owner to whichAmex HoldCo., Expedia and QIA if such amendment is materially adverse, regardless of such Continuing JerseyCo Owner’sshareholders percentage interest of common stock. The foregoing approval rights do not apply to actions that we or GBT JerseyCo undertake to effect an exchange pursuant to the Exchange Agreement, actions that they are otherwise authorized to undertake pursuant to the Exchange Agreement.
On January 11, 2024, GBTG also entered into a letter agreement with GBT JerseyCo, Juweel, Amex HoldCo., Expedia, QIA and Juweel's other equityholders (the "Specified Juweel Investors"), pursuant to which the Specified Juweel Investors agreed to be bound by restrictive covenants in the Shareholders Agreement as if they were a party thereto.
In addition, provided Amex HoldCo. continues to own 25% of our issued stock, Amex HoldCo. has approval rights with regard to a certain specified internal corporate transactions and other actions or inactions that would result in consolidation of us or GBT JerseyCo with American Express and/or its affiliates or result in we or GBT JerseyCo becoming a “variable interest entity” under Accounting Standard Codification 810 — Consolidation.
49
Each Continuing JerseyCo Ownerof Amex HoldCo., Expedia and QIA will appoint us as its attorney-in-fact to, among other things, execute (x) written resolutions in their capacities as holders of GBT BJerseyCo C Ordinary Shares, and GBT C Ordinary Shares,
as applicable, and (y) instruments appointing us as their proxy to vote such shares, in each case on all such matters as to which a vote or written resolution of the holders of such shares is required by law, other than matters that relate specifically and solely to the rights, priorities and privileges of the GBT B Ordinary Shares or the GBTJerseyCo C Ordinary Shares, as applicable, or matters that have a disproportionate adverse effect on the GBT B Ordinary Shares or the GBTJerseyCo C Ordinary Shares, as applicable, as compared to any other class or series.
At the closing of the Business Combination, we became a holding company whose principal asset is the GBT JerseyCo A Ordinary Shares. As such, we have no independent means of generating revenue or operating cash flows. GBT JerseyCo is treated as a partnershipflow-through entity for United States federal income tax purposes and, as such, generally will not be subject to United States federal income tax. Instead, taxable income will be allocated to holders of GBT capital stock, including us. Accordingly,a result, we will incur income taxes on its allocable share of any net taxable income of GBT JerseyCo and will also incur taxes and other expenses incidental to itsour functions as a public company.
Pursuant to the Shareholders Agreement, GBT JerseyCo will make pro rata cash distributions to GBT’s shareholders, including us in amounts intended to be sufficient to enable us to satisfy our liabilities for taxes, as reasonably determined by the board. GBT will be required to make tax distributions pro rata in accordance with ownership of GBT capital stock.
In addition to tax expenses, we incur other expenses incidental to GBT’sGBT JerseyCo’s functions as a public company, which could be significant. The Shareholders Agreement requires GBT JerseyCo to pay or reimburse (or to cause one or more of its subsidiaries to pay or reimburse) such non-tax expenses (without making corresponding ratable distributions to GBT’sGBT JerseyCo’s other shareholders). However, GBT’sGBT JerseyCo’s ability to make such distributions and pay or reimburse such expenses may be subject to various limitations and restrictions, including but not limited to, restrictions in debt documents and the applicable provisions of Jersey law including, but not limited to, the obligation of the GBT boardJerseyCo Board of directorsDirectors to declare a 12-month forward-looking cash flow solvency statement in accordance with the Companies (Jersey) Law 1991, prior to the declaration of a distribution. Subsidiaries of GBT JerseyCo are also generally subject to similar or other types of legal limitations on their ability to make distributions that would have the effect of rendering them insolvent.
Under the Shareholders Agreement, for as long as American Express “controls” us under the BHC Act, we must provide prior notice to Amex HoldCo. before it and its subsidiaries may engage in certain new activities, investments and acquisitions, subject to exceptions for certain pre-approved new products and services, and Amex HoldCo. may veto such new activities, investments and acquisitions if, after cooperating with us for a period of time to reach a mutually agreeable solution, Amex HoldCo. reasonably concludes that such new activities, investments and acquisitions would have an adverse effect on Amex HoldCo.’s regulatory status under applicable banking laws.
The Shareholders Agreement permits American Express to take, or require us to take (in American Express’ sole discretion), certain actions to terminate its deemed “control” of us under the BHC Act upon the occurrence of any of the “Amex Exit Conditions” specified in the Shareholders Agreement.
If an Amex Exit Condition occurs, American Express may exercise any of the following remedies to terminate its deemed “control” of us for purposes of the BHC Act:
•
Require us to issue to American Express in exchange for its shares of Class A Common Stock, and/or Class B Common Stock, as the case may be, an equal number of shares of GBTG Class A-1 Preferred Stock, par value $0.00001 per share (“Class A-1 Preferred Stock”) and GBTG Class B-1 Preferred Stock, par value $0.00001 per share (“Class B-1 Preferred Stock”), respectively, which are non-voting;
•
Exercise demand registration rights under the Registration Rights Agreement without regard to certain restrictions and limitations on the exercise of demand registration rights thereunder; or have no obligation to renew such co-brands or support any future co-brands once the A&R Trademark License Agreement is terminated.
•
Transfer some or all of its shares of GBTG or GBT JerseyCo without regard to most transfer restrictions and limitations that would otherwise apply in connection with a transfer of such shares.
If an Amex Exit Condition occurs and American Express is required to or chooses to terminate its deemed “control” of us under the BHC Act, American Express will have the sole right to determine what approach or option to take to achieve a decontrol position, subject to a requirement to use commercially reasonable efforts and consult with us in good faith to minimize costs and maximize tax efficiency for both American Express and us. In addition, if we make a “GBTG Election” (as(as defined in the Shareholders Agreement), Amex HoldCo. may, at its option, terminate the A&R Trademark License Agreement, subject to the two-year transition period set forth therein (including termination of the “Payment Provider Obligations” referred to in A&R Trademark License Agreement and the American Express exclusivity obligations to us and our affiliates, and our and our affiliates’ other exclusivity obligations to American Express under the operating agreements between GBT UK (and its affiliates, where applicable) and American Express; provided, however, that our co-brand obligations with respect to the existing co-brands will continue on their current terms until the existing termination dates of such agreements; provided, further,
50
that we and our affiliates will have no obligation to renew such co-brands or support any future co-brands once the A&R Trademark License Agreement is terminated).
Sponsor Side Letter Amendment
In connection with the Business Combination Agreement, on December 2, 2021, the Sponsor, the Insiders, APSGApollo Strategic Growth Capital ("APSG") and GBT JerseyCo entered into a side letter (the “Sponsor Side Letter”) which, among other things, contains certain restrictions on the transfer by the Sponsor and the Insiders with respect to the Class A Common Stock issued to each of them at the closing of the Business Combination in connection with the conversion of the Founder Shares. The Sponsor and the Insiders are not permitted to transfer their Class A Common Stock, subject to certain permitted exceptions, until the earlier to occur of (a) one year following the closing of the Business Combination and (b) the date which the VWAP of Class A Common Stock exceeds $12.00 per share for any 20 trading days within a period of 30 consecutive trading days. Permitted exceptions include (i) transfers to APSG’s officers or directors, any affiliates or family members of any of APSG’s officers or directors, any partner of the Sponsor, or any affiliates of the Sponsor; (ii) in the case of an individual, transfers by gift to a member of one of the individual’s immediate family, to a trust, the beneficiary of which is a member of the individual’s immediate family or an affiliate of such person, or to a charitable organization; (iii) in the case of an individual, transfers by virtue of laws of descent and distribution upon the death of such person; (iv) in the case of an individual, transfers pursuant to a qualified domestic relations order; (v) transfers by virtue of the laws of Delaware or the Sponsor’s partnership agreement upon dissolution of the Sponsor; (vi) transfers pursuant to APSG’s completion of a liquidation, merger, share exchange, reorganization or other similar transaction which results in all of APSG’s stockholders having the right to exchange their shares of Domesticated Acquiror Class A common stock for cash, securities or other property subsequent to the closing of the Business Combination and (vii) transfers to a nominee or custodian of a person to whom a transfer would be permissible under clauses (i) through (vi) above.
In connection with the Business Combination, APSG, GBT JerseyCo, the Sponsor and certain of its insiders entered into an amendment to the Sponsor Side Letter (the “Sponsor Side Letter Amendment”), to subject an additional approximately 10% of the Sponsor’s Class A Common Stock that would have immediately vested at the closing of the Business Combination to a vesting condition that the VWAP of the Class A Common Stock exceeds $12.50 for any 20 trading days in a period of 30 consecutive trading days within five years of the Business Combination.
After giving effect to the Sponsor Side Letter Amendment, 12,268,186 of the Class A Common Stock issued to the Sponsor at the closing of the Business Combination (such shares, which for the avoidance of doubt do not include any PIPE Securities or any Syndicate Shares (as defined in the Sponsor Side Letter), the “Sponsor Shares”) immediately vested without restrictions and 8,077,064 of the Sponsor Shares were deemed unvested subject to certain triggering events to occur within five years following the Business Combination (the “Sponsor Side Letter Vesting Period”). If, within the Sponsor Side Letter Vesting Period, the VWAP of Class A common stock is greater than or equal to $12.50 for any 20 trading days within a period of 30 consecutive trading days, 4,720,098 of the unvested Sponsor Shares will vest. If, within the Sponsor Side Letter Vesting Period, the VWAP of Class A Common Stock is greater than or equal to $15.00 for any 20 trading days within a period of 30 consecutive trading days the remaining 3,356,966 of the unvested Sponsor Shares will vest. To the extent that either of the aforementioned triggering events do not occur within the Sponsor Side Letter Vesting Period, such Sponsor Shares will be forfeited to and terminated
by us. For the avoidance of doubt, any Class A Common Stock purchased by the Sponsor in connection with the PIPE Investment will not be subject to the vesting or transfer restrictions described above.
The registered holder(s) of the unvested Sponsor Shares continue to be entitled to all of the rights of ownership thereof, including the right to vote and receive dividends and other distributions in respect thereof. The number of shares and the price targets listed above will be equitably adjusted for stock splits, reverse stock splits, dividends (cash or stock), reorganizations, recapitalizations, reclassifications, combinations or other like changes or transactions with respect to the Class A common stock occurring after the Business Combination.
Arrangements with Shareholders
On March 2, 2016, GBT JerseyCo entered into an Advisory Services Agreement with Certares Management Corp. pursuant to which Certares Management Corp. agreed to provide advisory services with respect to any acquisition or disposition of any business, company or material assets of any business or company (whether by merger, consolidation, recapitalization or otherwise) or any other similar transaction in which we or any of our direct or indirect subsidiaries of may be, or may consider becoming, involved. Pursuant to the Advisory Services Agreement, GBT JerseyCo paid Certares Management Corp. an annual fee of $2.5 million plus reimbursement of out-of-pocket expenses not in excess of $400,000 per year. The Advisory Services Agreement terminated upon the
51
consummation of the Business Combination.Combination; however, GBT JerseyCo made a final payment to Certares Management Corp. in the amount of $5 million on November 27, 2023.
Arrangements Relating to GBT’sthe Acquisitions of HRG and Egencia
In February 2018, in connection with the announcement of our planned acquisition of Hogg Robinson Group Limited (“HRG”), a global B2B services company specializing in travel management, GBT III entered into certain arrangements with GBT’sGBT III’s shareholders relating to the consummation of such acquisition. Pursuant to these arrangements, GBT III agreed, among other things: to (i) refrain from taking any actions with respect to the defined benefit scheme for certain associates and retirees of GBT III and its affiliates in the United Kingdom (the “HRG Pension Scheme”) without the approval of the GBT boardIII Board of directorsDirectors and after consultation with GBT’sGBT III’s shareholders; and (ii) indemnify GBT’sGBT III’s shareholders from any losses incurred by GBT’sGBT III’s shareholders in relation to the HRG Pension Scheme or the disposal by HRG of Fraedom Holdings Limited and Fraedom LLC to Visa International Holdings Limited. Except for certain matters, including with respect to information, indemnification and certain other rights and obligations in connection with the HRG Pension Scheme, these arrangements were terminated upon the consummation of the Business Combination.
On November 1, 2021, GBT JerseyCo consummated the acquisition of the Egencia business from Expedia (the “Egencia Acquisition”). In connection with the Egencia Acquisition, on November 1, 2021, an affiliate of GBT JerseyCo and EAN.com LP, an affiliate of Expedia, entered into a ten-year term marketing partner agreement to provide GBT’sGBT JerseyCo’s corporate clients with access to Expedia group hotel content (the “EPS Agreement”). The EPS Agreement requires an affiliate of Expedia to meet certain competitiveness thresholds with respect to the Expedia group hotel content offered to GBT JerseyCo and requires GBT JerseyCo to satisfy a certain share of wallet commitments to the affiliate of Expedia (including the making of cash shortfall payments in the event of share of wallet failure, subject to offset based on outperformance by GBT JerseyCo in subsequent periods). GBT’sGBT JerseyCo’s share of wallet obligations is subject to adjustment for future acquisitions and dispositions and the failure of the affiliate of Expedia to meet agreed competitiveness thresholds. As a result of the above agreement, the Company recognized revenue of $130 million and $8$176 million for the periodsyear ended December 31, 2022 and 2021, respectively.2023. As of December 31, 2022 and 2021,2023, the Company had a $18 million and $4$20 million receivable from the affiliate of Expedia, respectively.Expedia.
On November 1, 2021, also in connection with the Egencia Acquisition, GBT UK, an affiliate of GBT JerseyCo, and Expedia, Inc., an affiliate of Expedia, entered into a Transition Services Agreement (the “Egencia TSA”), pursuant to which Expedia, Inc. and its affiliates provide certain transition services to GBT UK and its affiliates to facilitate an orderly transfer of Egencia from Expedia to GBT.GBT JerseyCo. The initial term of the Egencia TSA is 18 months. The initial term of each service is set forth in the Egencia TSA, and the term of certain services is subject to extension under certain circumstances. GBT UK has the right to terminate services for convenience upon prior written notice to Expedia, Inc. For services provided by Expedia to Egencia prior to the Egencia acquisition, pricing under the Egencia TSA is determined in the same manner as pricing for such services was historically determined by Expedia, Inc. For services that were not provided by Expedia, Inc. to Egencia prior to the Egencia acquisition, in general pricing is equal to the cost of providing such services. For the periodyear ended December 31, 2022 and 2021,2023, the total cost charged to the Company was approximately $34 million and $8 million that was included in the Company’s consolidated statements of operations.$24 million. As of both December 31, 2022 and 2021,2023, the Company had a payable to Expedia Inc. of $8$3 million. Further, as of December 31, 2022 and 2021,2023, Egencia had a net receivable of $4$5 million and a net payable of $16 million tofrom Expedia respectively, on account of net cash settled on behalf of or on Egencia’s behalf by Expedia.
On November 15, 2023, also in connection with the expiration of the Egencia TSA, GBT UK, an affiliate of GBT JerseyCo, and Expedia, duringInc., an affiliate of Expedia, entered into a Services Agreement, pursuant to which Expedia, Inc. and its affiliates provide artificial intelligence-based, fraud prevention services involving the respectiveancillary license of software to GBT JerseyCo and its affiliates for Egencia (the "Services Agreement"). The initial term of the Services Agreement is three years.
During the year ended December 31, 2022, the Company recognized a charge of $19 million in its consolidated statements of operations for a loss contingency as it became probable that the Company will pay the amount to Expedia for a contingent event that existed as of the Egencia Acquisition date. During the year ended December 31, 2023, pursuant to an agreement with Expedia, the Company issued 575,409 shares of Common Stock to Expedia to settle, in part, $4 million of liability for loss contingency accrued in 2022. As of December 31, 2023, the Company had $11 million that remained payable to Expedia in respect of this loss contingency.
Commercial Arrangements with American Express
In May 2022, certain wholly-owned subsidiaries of the Company executed long-term commercial agreements with American Express, including an amended and restated trademark license agreement (the “A&R Trademark License Agreement”), pursuant to which GBT UK, all wholly-owned operating subsidiaries of GBTG and other permitted sublicensees continue to license the American Express trademarks used in the American Express Global Business Travel brand and license the American Express trademarks used in the American Express GBT Meetings &
52
Events brand for business travel, meetings and events, business consulting and other services related to business travel, in each case on an exclusive and worldwide basis. The term of the A&R Trademark License Agreement is for 11 years from May 27, 2022, unless earlier terminated or extended.extended.
The parties amended the terms of certain of these commercial arrangements (such agreements, as amended and collectively with the A&R Trademark License Agreement, the “Amended Amex Commercial Agreements”), which provide, among other things, the following:
•
Subject to certain exceptions, the CompnyCompany is required to: (i) offer, promote and market only American Express payment products to any current or potential client of the Company; (ii) use commercially reasonable efforts to make available American Express products and services the default and/or first payment option when a Company client or its personnel use or otherwise select a payment method on the Company’s platform; (iii) for each applicable country or jurisdiction in which American Express offers payment products, exclusively make American Express payments products available, to our employees; (iv) not directly or indirectly offer, promote, market or provide any scorecard or travel-related benefit to or through certain American Express competitors, third party travel agency or other third party, in each case as a card member benefit; and/or (v) not permit any consumer travel agency (other than American Express’ Travel and Lifestyle Services division) to use GBT’sGBT JerseyCo’s travel volume as a means of obtaining any scorecard or travel-related benefit for purposes of providing such travel-related benefit, in each case as a card member benefit (such obligations in (i) through (v), collectively, the “GBT JerseyCo Exclusivity Obligations”). However, GBT JerseyCo may accept payments from other providers and may develop technical integration of products that support payments made via other payment providers.
•
American Express exclusively uses GBT JerseyCo as its business travel and meetings and events provider, subject to limited exceptions, for so long as the GBT JerseyCo Exclusivity Obligations remain in place.
•
American Express exclusively submits eligible business travel and meetings and events leads to GBT JerseyCo, but will not be foreclosed from receiving leads from any third party, and GBT JerseyCo will exclusively submit eligible payment products leads to American Express.
•
American Express is restricted from entering into any exclusive agreements or otherwise exclusively partnering with specified categories of GBT’sGBT JerseyCo’s competitors for the development and delivery of Business Travel Services.
•
GBT JerseyCo continues to support certain American Express partnerships existing prior to the Business Combination, renewals of those relationships, and certain new partnerships, each on mutually acceptable terms.
•
GBT JerseyCo and American Express collaborate on mutually beneficial growth opportunities on mutually beneficial terms, including the expansion of their global lead generation partnership and joint client value proposition and retention.
•
GBT JerseyCo continues to accept the American Express card as an American Express card merchant as long as the license of the American Express trademarks used in our business is in effect.
Commercial Arrangements with Apollo
In the ordinary course of business, we provide business travel services to Arconic Corporation, which was acquired by Apollo Global Securities, LLC received approximately $1.7 million asin August 2023. A fund managed by affiliates of Apollo beneficially own more than 5% of our common stock, and Itai Wallach, our director, is a placement agent fee paid in connection with the PIPE Investment pursuant to the Placement Agent Engagement Letter. Further, the Sponsor agreed to purchase 2.0 million sharespartner of PIPE SecuritiesApollo and serves on the same terms and conditions asBoard of Directors of Arconic. For the other PIPE Investors atyear ended December 31, 2023, the total revenue we received from Arconic was approximately $122,722.
Loan to Equity Affiliate
During the year ended December 31, 2023, the Company provided a priceloan of $10.00 per share.$5 million to one of its equity affiliates of which $2 million is receivable in the next twelve months.
Policies and Procedures for Related Person Transactions
53
“related person” (as(as defined in paragraph (a) of Item 404 of Regulation S-K) must promptly disclose to our Chief Legal Officer any “related person transaction” (defined(defined as any transaction that is anticipated to be reportable by us under Item 404(a) of Regulation S-K in which we were or are to be a participant and the amount involved exceeds $120,000 and in which any related person had or will have a direct or indirect material interest) and all material facts with respect thereto. The Chief Legal Officer will then promptly communicate that information to our boardthe Board of directors.Directors. No related person transaction will be executed without the approval or ratification of our boardthe Board of directorsDirectors or a duly authorized committee of our boardthe Board of directors.Directors. It is our policy that directors interested in a related person transaction will recuse themselves from any vote on a related person transaction in which they have an interest.
HOUSEHOLDING
Some banks, brokers and other nominee record holders may be participating in the practice of “householding” proxy statements and annual reports. This means that only one copy of our documents, including the proxy statement, may have been sent to multiple stockholders in your household. We will promptly deliver a separate copy to you upon written or oral request to Global Business Travel Group, Inc., 666 3rd Avenue, 4th Floor, New York, New York 10017, Attention: Corporate Secretary, telephone: (480) 909-1740.(646) 344-1290. If you want to receive separate copies of the proxy statement or annual report to stockholders in the future, or if you are receiving multiple copies and would like to receive only one copy per household, you should contact your bank, broker or other nominee record holder, or you may contact us at the above address and phone number.
STOCKHOLDER PROPOSALS FOR 20242025 ANNUAL MEETING
Submission of Stockholder Proposals for Inclusion in Next Year’s Annual Meeting Proxy Statement
Any proposal or proposals by a stockholder intended to be included in the proxy statement and form of proxy relating to the annual meeting of stockholders to be held in 20242025 must comply with the procedures set forth in Rule 14a-8 under the Exchange Act. To be eligible for inclusion, your proposal(s) must be received by the Company no later than December 23, 2023.25, 2024. Proposals should be sent to the Corporate Secretary of the Company at its principal executive offices, 666 3rd Avenue, 4th Floor, New York, NY 10017. Nothing in this paragraph shall be deemed to require the Company to include in its proxy statement and proxy relating to the annual meeting of stockholders to be held in 20242025 any stockholder proposal which may be omitted from the proxy materials according to applicable regulations of the SEC in effect at the time the proposal is received.
Other Stockholder Proposals for Presentation at Next Year’s Annual Meeting
A stockholder who wishes to submit a proposal or nominate a candidate to serve as a director for consideration at the annual meeting of stockholders to be held in 20242025 outside the processes of Rule 14a-8 under the Exchange Act must timely deliver a written notice in accordance with the requirements, including eligibility and information required in such notice, set forth in Sections 2.12(a)(i) and 2.12(a)(ii) of the Company’s Bylaws. To be timely, such written notice must be received by the Corporate Secretary of the Company at its principal executive offices, 666 3rd Avenue, 4th Floor, New York, NY 10017, not earlier than the close of business on February 7, 2024,5, 2025, nor later than the close of business on March 8, 2024.7, 2025. In the event that the annual meeting of stockholders to be held in 20242025 is scheduled for more than 30 days before, or more than 70 days following, June 6, 20245, 2025 (the anniversary of the Annual Meeting), the written notice by the stockholder must be delivered not later than the close of business on the 10th day following the day on which public announcement of the date of the annual meeting for 20242025 is first made.
In addition to satisfying the foregoing requirements, to comply with the SEC’s universal proxy rules, stockholders who intend to solicit proxies in support of director nominees other than our nominees must provide timely notice that sets forth the information required by Rule 14a-19 under the Exchange Act.
EXPENSES AND SOLICITATION
We will bear all costs of solicitation of proxies. Our officers and employees may, without compensation other than their regular compensation, solicit proxies through further mailings, personal conversations, facsimile transmissions, e-mails, or otherwise. We will also reimburse brokerage firms, banks and other agents for the cost of forwarding proxy materials to beneficial owners.
54
OTHER MATTERS
The Company knows of no other matters to be submitted to the stockholders at the Annual Meeting, other than the proposals referred to in this proxy statement. If any other matters properly come before the stockholders at the Annual Meeting, it is the intention of the proxy holders to vote the shares represented thereby on such matters in accordance with their best judgment.
By Order of the Board of Directors,
/s/ Michael Gregory O’Hara
Michael Gregory O’Hara
Chairman of the Board
Chairman of the Board
April 21, 202324, 2024
New York, New York
New York, New York
| | | | Year Ended December 31, | | |||||||||
| ($ in millions except percentages) | | | 2022 | | | 2021 | | ||||||
| Revenue (A) | | | | | 1,851 | | | | | | 763 | | |
| Net loss | | | | | (229) | | | | | | (475) | | |
| Interest income | | | | | — | | | | | | (1) | | |
| Interest expense | | | | | 98 | | | | | | 53 | | |
| Loss on early extinguishment of debt | | | | | — | | | | | | 49 | | |
| Benefit from income taxes | | | | | (61) | | | | | | (186) | | |
| Depreciation and amortization | | | | | 182 | | | | | | 154 | | |
| Restructuring charges(a) | | | | | (3) | | | | | | 14 | | |
| Integration costs(b) | | | | | 34 | | | | | | 22 | | |
| Mergers and acquisitions(c) | | | | | 18 | | | | | | 14 | | |
| Equity-based compensation(d) | | | | | 39 | | | | | | 3 | | |
| Fair value movements on earnouts and warrants derivative liabilities(e) | | | | | (8) | | | | | | — | | |
| Other adjustments, net(f) | | | | | 33 | | | | | | 13 | | |
| Adjusted EBITDA (B) | | | | | 103 | | | | | | (340) | | |
| Baseline Adjusted EBITDA for annual variable compensation (C) | | | | | (464) | | | | | | | | |
| Actual Adjusted EBITDA Growth (D) = (B) – (C) | | | | | 567 | | | | | | | | |
| Target Adjusted EBITDA Growth (E) | | | | | 470 | | | | | | | | |
| % achieved of Target Adjusted EBITDA Growth (D) / (E) | | | | | 121% | | | | | | | | |
| | | | Year Ended December 31, | | |||||||||
| ($ in millions except percentages) | | | 2022 | | | 2021 | | ||||||
| Revenue | | | | | 1,851 | | | | | | 763 | | |
| Egencia and constant currency adjustments | | | | | 47 | | | | | | 117 | | |
| Baseline Revenue for annual variable compensation | | | | | 1,898 | | | | | | 880 | | |
| Increase in baseline Revenue (A) | | | | | 1,018 | | | | | | | | |
| Actual Adjusted EBITDA Growth (B) | | | | | 567 | | | | | | | | |
| Actual Adjusted EBITDA Fall Through (C) = (B) / (A) | | | | | 55% | | | | | | | | |
| Target Adjusted EBITDA Fall Through (D) | | | | | 63% | | | | | | | | |
| % achieved of Target Adjusted EBITDA Fall Through (C) / (D) | | | | | 87% | | | | | | | | |
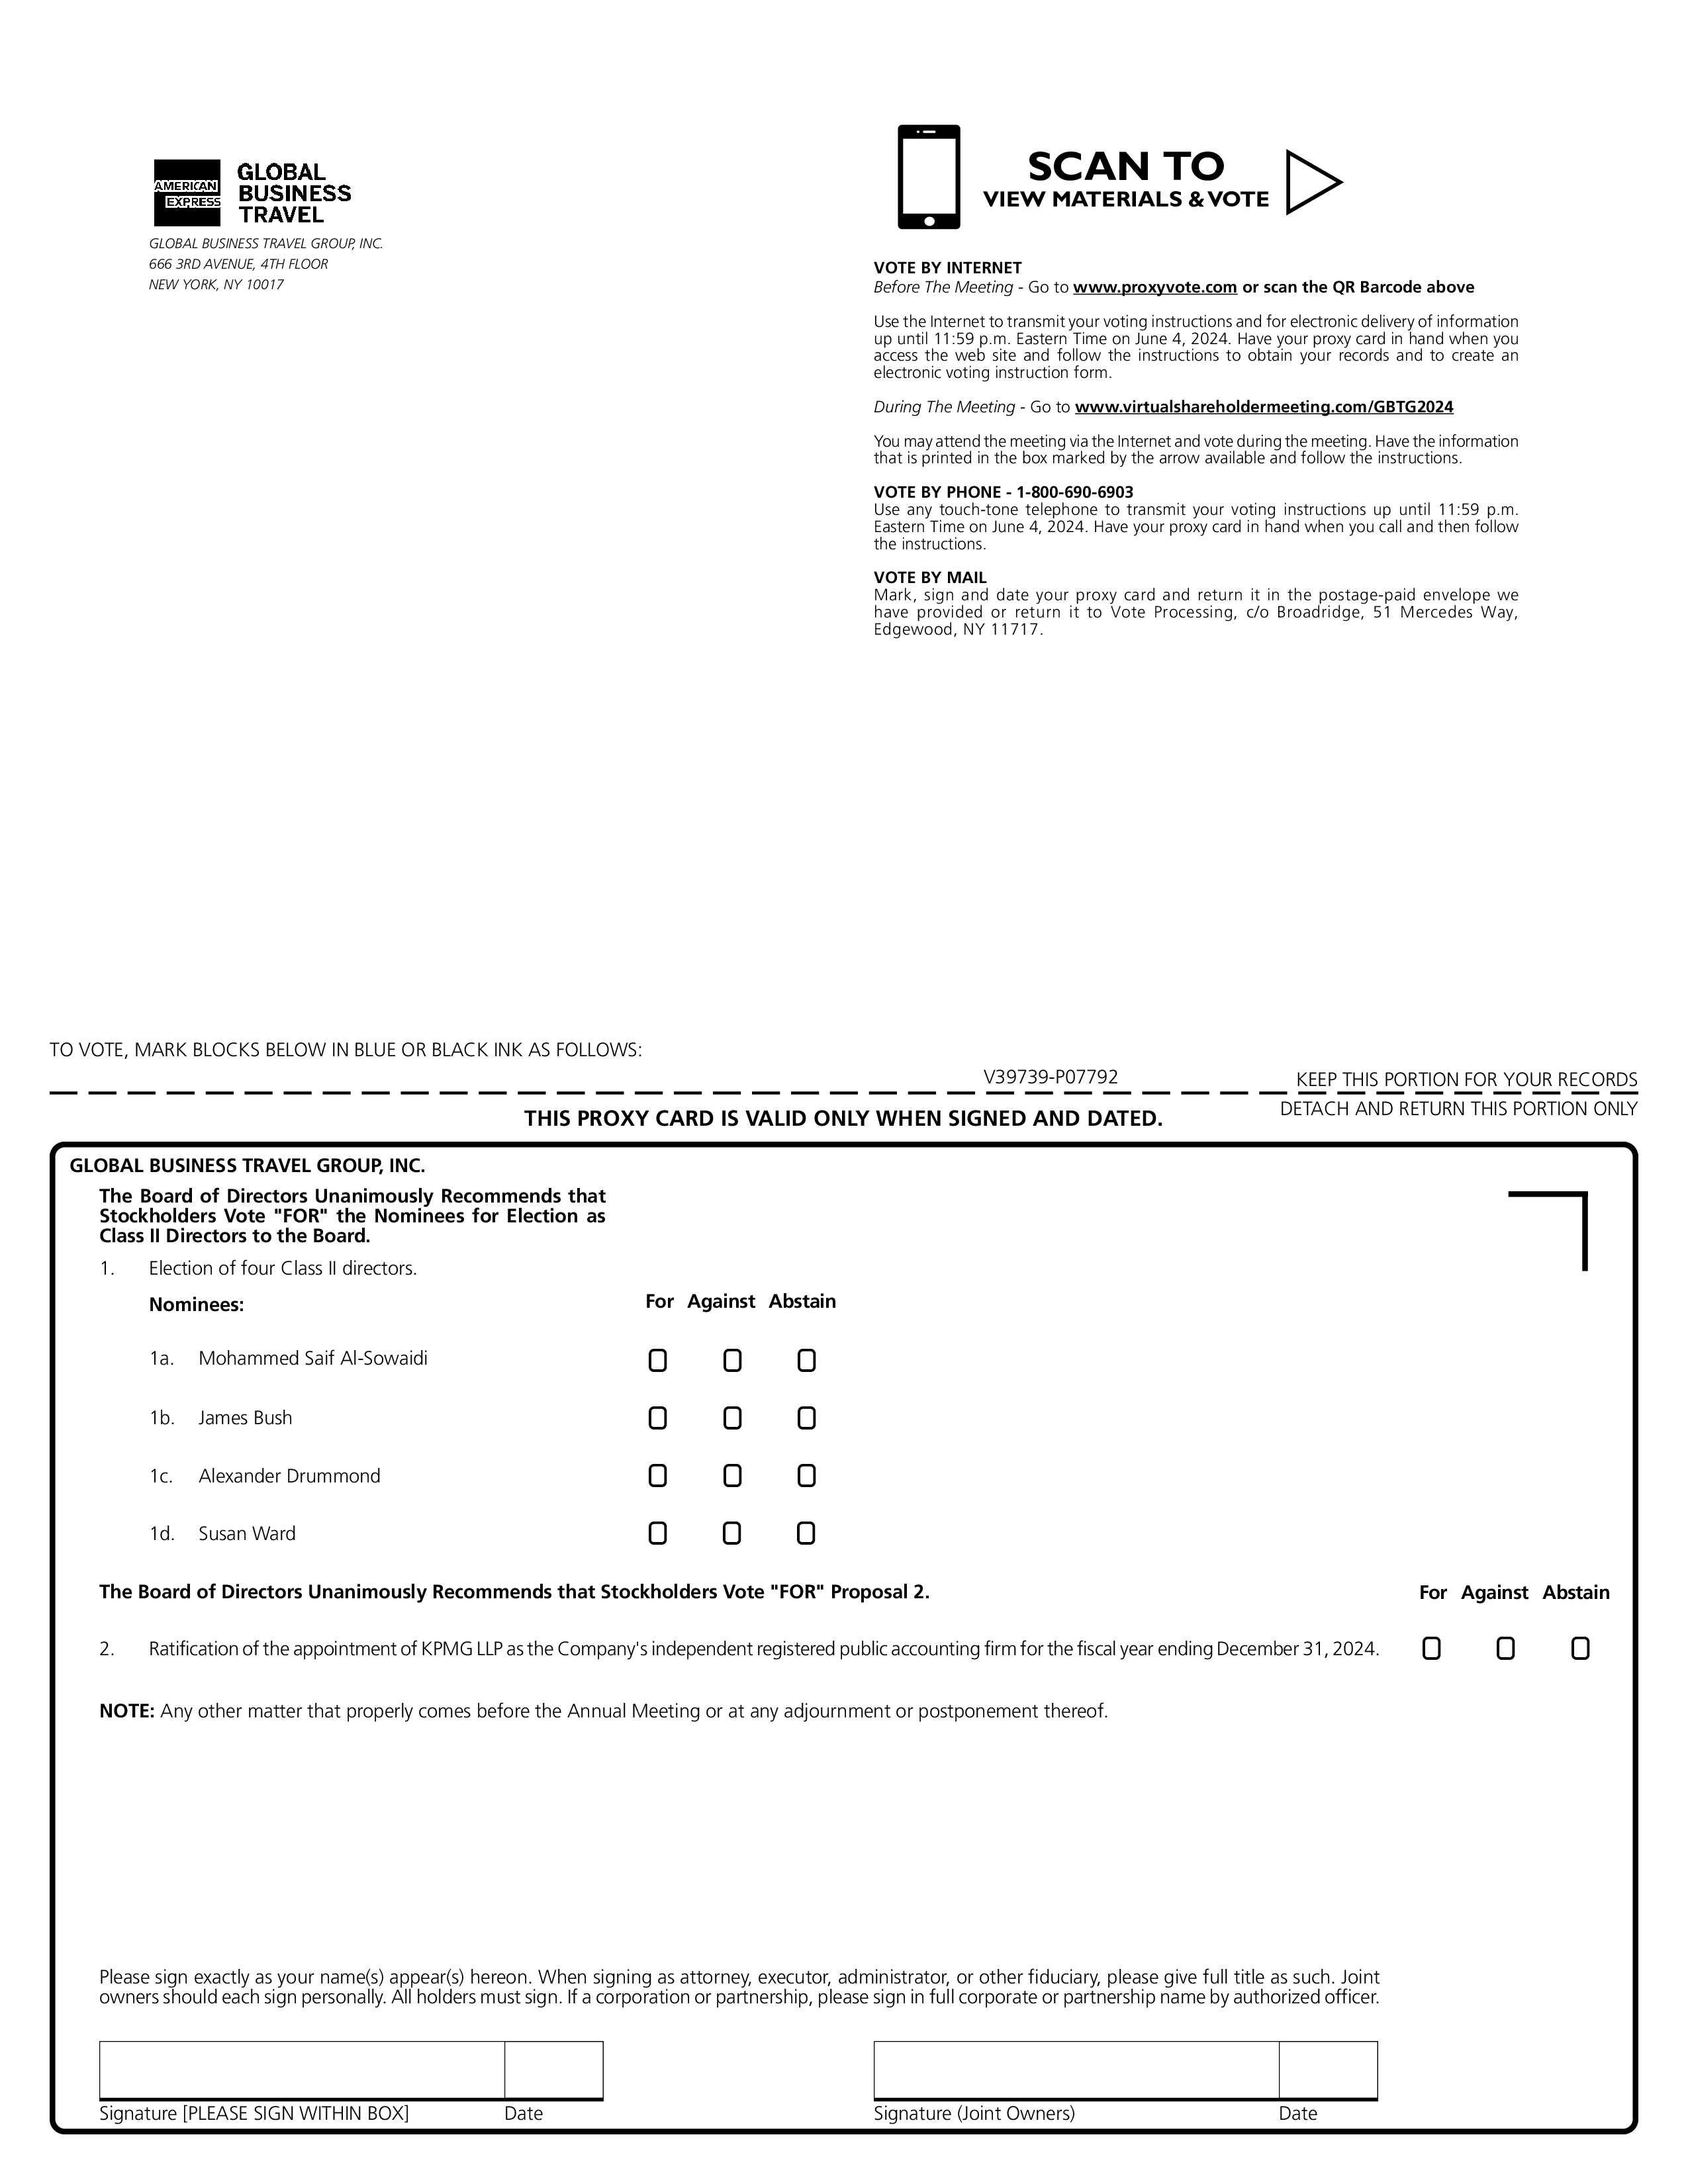

![[MISSING IMAGE: px_proxy01pg01-bw.jpg]](https://capedge.com/proxy/DEF 14A/0001104659-23-048472/px_proxy01pg01-bw.jpg)
![[MISSING IMAGE: px_proxy01pg02-bw.jpg]](https://capedge.com/proxy/DEF 14A/0001104659-23-048472/px_proxy01pg02-bw.jpg)