Our “Proxy Materials” include:
This Proxy Statement;
A Notice of our Annual Meeting (which is attached to this Proxy Statement); and
Our 20222023 Annual Report to Stockholders.
If you received printed versions of these materials by mail (rather than through electronic delivery), these materials also include a Proxy Card or voting instruction form. If you received or accessed these materials through the internet, your Proxy Card or voting instruction form are available to be filled out and executed electronically. You should review thethis entire Proxy Statement and the 20222023 Annual Report to Stockholders before you vote.
Quorum; Shares Held by Brokers
The presence at the Annual Meeting, in person or by proxy, of the holders of at least a majority of the number of shares of common stock issued, and outstanding, and entitled to vote as of the record date,Record Date, is required to constitute a quorum to transact business at the Annual Meeting.
Abstentions are counted as present and entitled to vote for purposes of determining a quorum. Shares represented by broker non-votes (as defined below) also are counted as present and entitled to vote for purposes of determining a quorum.
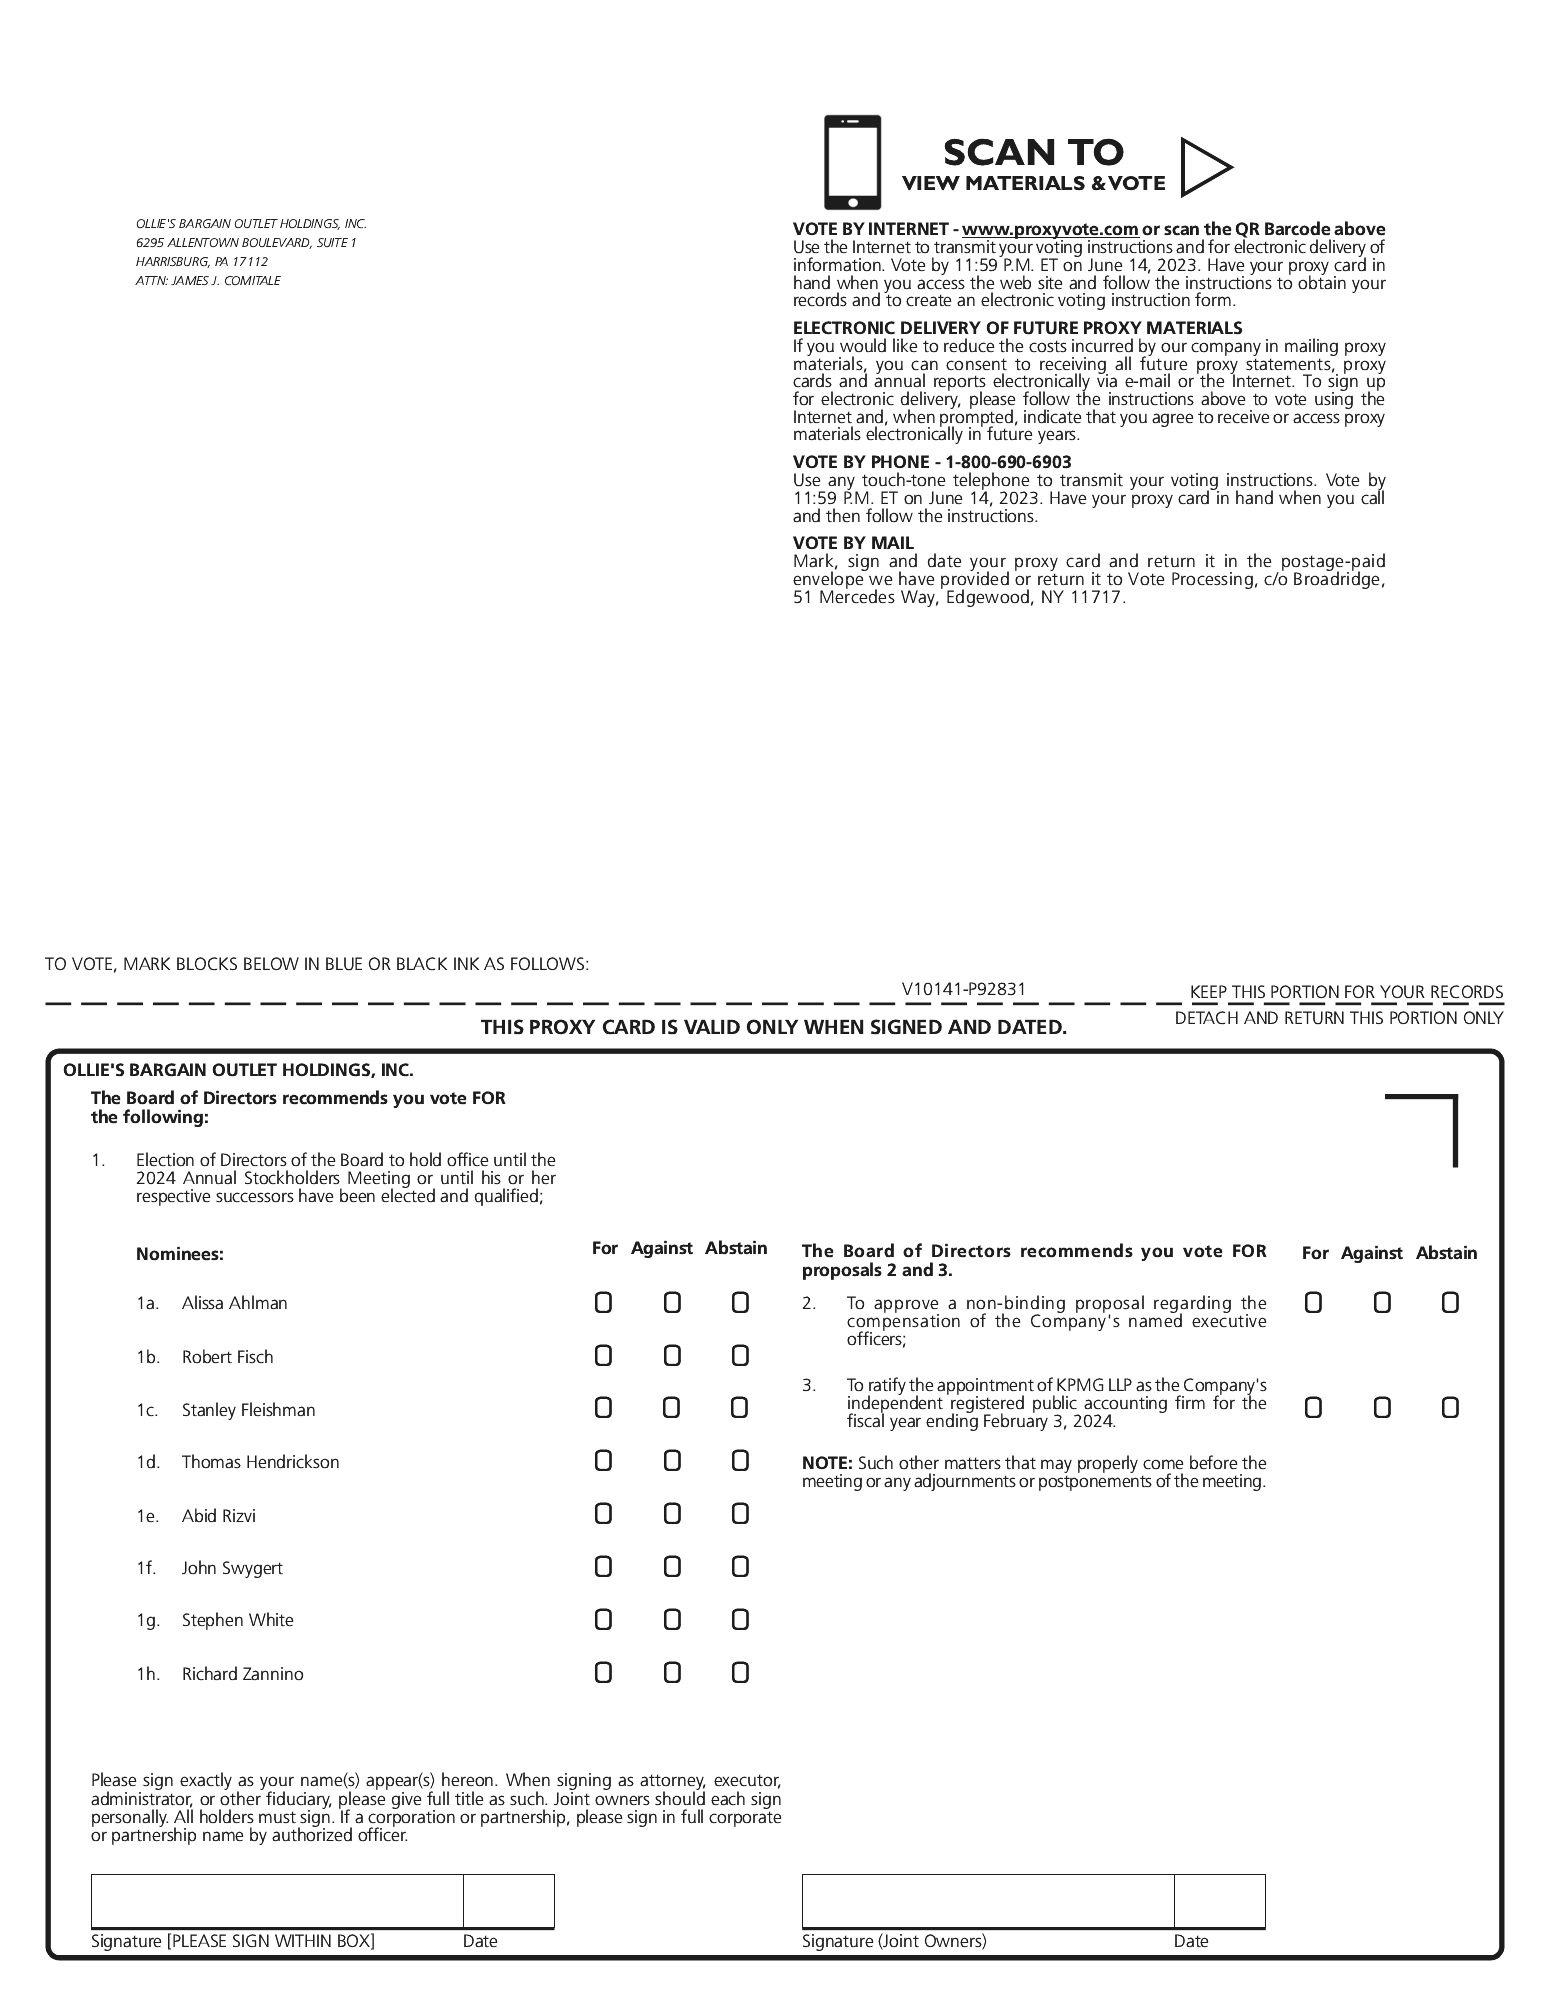
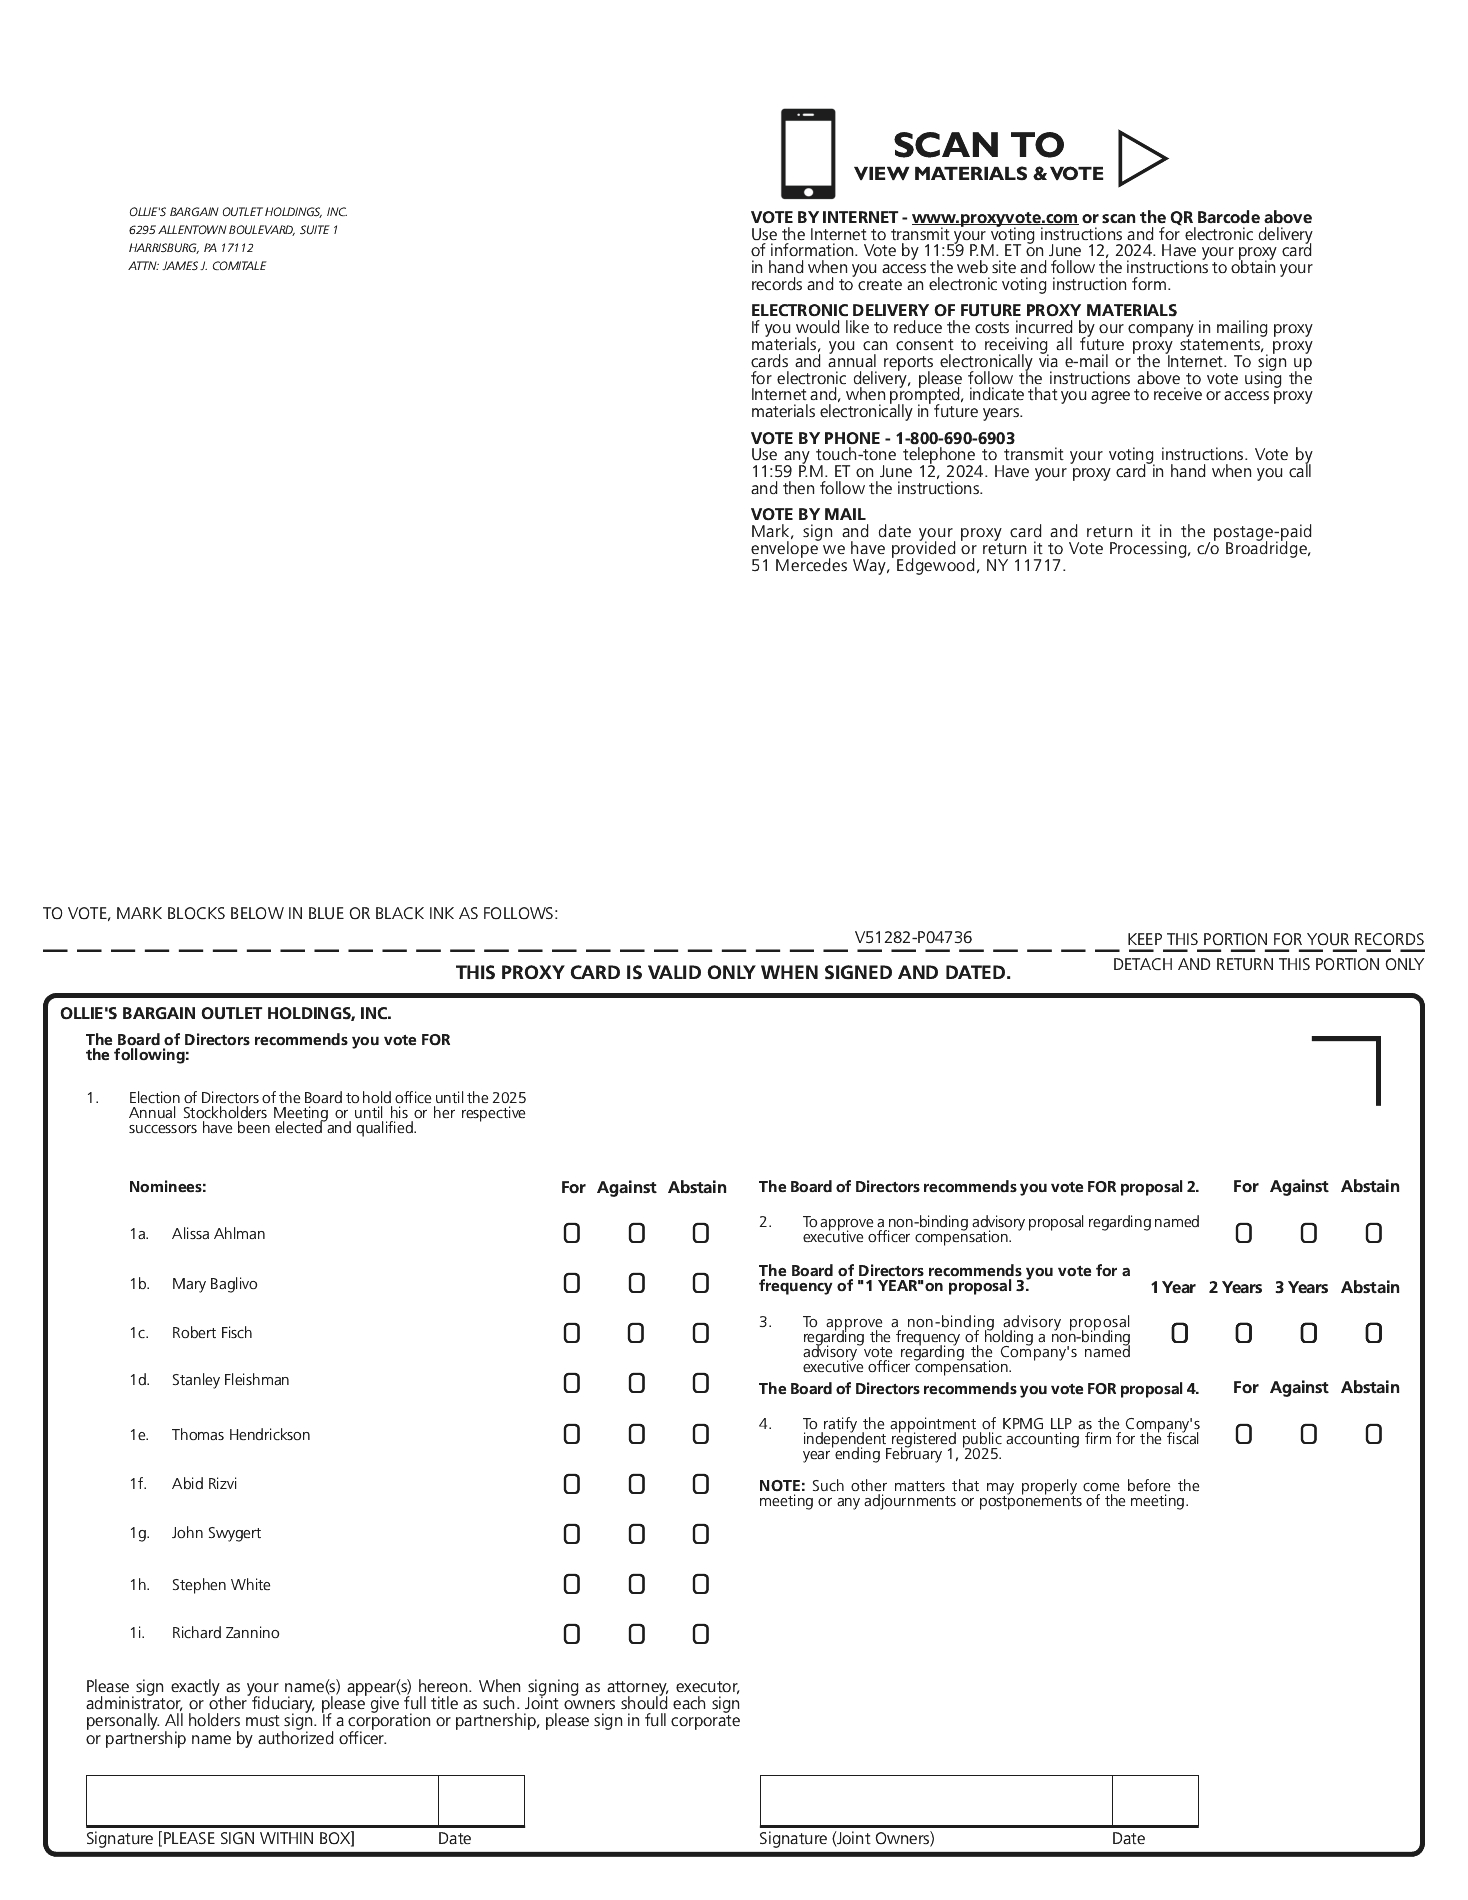
If you are the beneficial owner of shares held for you by a broker, your broker must vote those shares in accordance with your instructions. If you do not give voting instructions to your broker, your broker may vote your shares for you on any discretionary items of business to be voted upon at the Annual Meeting. If your broker does not receive instructions from you on how to vote your shares on aany non-discretionary item of business, then the broker will not be able to vote your shares, which is known as a “broker non-vote.” The appointment of KPMG (Proposal 3)4) is considered a discretionary item, and brokers may vote on behalf of beneficial owners who have not furnished voting instructions on this discretionary item. Brokers cannot vote on any of the other proposals contained in this Proxy Statement, which are considered “non-routine” or non-discretionary proposals,items of business, unless they have received voting instructions from the beneficial owner, and to the extent that they have not received such voting instructions, brokers report such number of shares as “non-votes.”
Required Votes on Proposals
Election of Directors. Proposal 1. The affirmative vote of the holders of a majority of the votes cast with respect to the director at the Annual Meeting is required to elect each nominee named herein as a director. Abstentions and broker non-votes will have no effect on this nondiscretionary proposal.
Non-Binding Advisory Vote to Approve Named Executive Officer Compensation.Proposal 2. The affirmative vote of the majority of shares present in person or represented by proxy and voting on the subject matter at the Annual Meeting is required to approve this item.nondiscretionary proposal. Abstentions count as a vote “against”, and broker non-votes will have no effect on this proposal.
Non-Binding Advisory Vote Regarding the Frequency of Holding an Advisory Vote Regarding the Named Executive Officer Compensation.Proposal 3. At the Annual Meeting, the Company’s stockholders will be asked through an advisory vote whether future votes regarding NEO compensation should occur every year, every two years, or every three years. The frequency option that receives the greatest number of affirmative votes of shares present in person or represented by proxy and voting on the proposal at the Annual Meeting will be approved on