| o | Preliminary Proxy Statement | |||||||
| o | Confidential, for Use of the Commission Only (as permitted by Rule 14a-6(e)(2)) | |||||||
| ý | Definitive Proxy Statement | |||||||
| o | Definitive Additional Materials | |||||||
| o | Soliciting Material Pursuant to §240.14a-12 | |||||||
| CarMax, Inc. | ||||
| (Name of Registrant as Specified In Its Charter) |
| (Name of Person(s) Filing Proxy Statement, if other than the Registrant) | ||
| ý | No fee required. | |||||||
| o | Fee paid previously with preliminary materials. | |||||||
| o | Fee computed on table | |||||||


| When: | ||||||||||||||||
| Tuesday, June | ||||||||||||||||
| Where: | This year’s meeting is a virtual annual shareholders meeting held at: www.virtualshareholdermeeting.com/ | |||||||||||||||
| Items of Business: | (1) | To elect the | ||||||||||||||
| (2) | To ratify the appointment of KPMG LLP as our independent registered public accounting firm. | |||||||||||||||
| (3) | To vote, on an advisory | |||||||||||||||
| (4) | To vote, on an advisory basis, on the frequency of future advisory resolutions to approve the compensation of our named executive officers. | |||||||||||||||
| (5) | To approve the CarMax, Inc. 2002 Stock Incentive Plan, as amended and restated. | |||||||||||||||
| To transact any other business that may properly come before the annual shareholders meeting or any postponements or adjournments thereof. | ||||||||||||||||
| Who May Vote: | You may vote if you owned CarMax common stock at the close of business on April | |||||||||||||||


| TABLE OF CONTENTS | ||
PROXY SUMMARY | ||
| Units | Total used unit sales | ||||
| CarMax Auto Finance | CarMax Auto Finance (“CAF”) finished the year with income of | ||||
“Best Companies” List | We were named by Fortune magazine as one of its 100 Best Companies to Work | ||||

Annual election of all directors | Majority voting for directors | |||||||||
| Proxy access adopted | ||||||||||
| 4 independent director nominees added in the last 5 years | Annual “say on | |||||||||
| Annual Responsibility Reporting | Board oversight of risk management program | |||||||||
| Net Zero 2050 Commitment | Technology and | |||||||||
| Active Shareholder Engagement Practices | ||||||||||
| When | |||||
| Tuesday, June | |||||
| Where | This year’s meeting is a virtual-only annual shareholders meeting. There will be no | ||||
| Who May Attend the Virtual Meeting | All shareholders as of the record date may attend the meeting. | ||||
Record Date | April | ||||
| Virtual Meeting Website | www.virtualshareholdermeeting.com/ | ||||
Agenda Item | Board Recommendation | Page of Proxy Statement | |||||||||
| 1. | Election of Directors | FOR each Director nominee | |||||||||
| 2. | Ratification of Auditors | FOR | |||||||||
| 3. | Advisory Approval of Executive Compensation | FOR | |||||||||
| 4. | Advisory Approval of Frequency of Future Executive Compensation Advisory Approvals | 1 YEAR | |||||||||
| 5. | Approval of Amended and Restated CarMax, Inc. 2002 Stock Incentive Plan | FOR | |||||||||
Agenda Item | Board Recommendation | Page of Proxy Statement | |
| 1. | Election of Twelve Directors | FOR each Director nominee | 7 |
| 2. | Ratification of Auditors | FOR | 23 |
| 3. | Advisory Approval of Executive Compensation | FOR | 26 |
| 4. | Approval of Amended and Restated Stock Incentive Plan | FOR | 60 |
| Nominee | Age | Director Since | Independent | Principal Occupation | Expected Committee Membership | Nominee | Age | Director Since | Independent | Principal Occupation | Committee Membership | |||||||||||||||||||||||||||||||
| Peter J. Bensen | 57 | 2018 | Yes | Retired Chief Administrative Officer and Corporate Executive Vice President and Chief Financial Officer of McDonald's Corporation, a global restaurateur and franchisor | Audit | Peter J. Bensen | 60 | 2018 | Yes | Retired Chief Administrative Officer and Corporate Executive Vice President and Chief Financial Officer of McDonald's Corporation, a global restaurateur and franchisor | Audit | |||||||||||||||||||||||||||||||
| Ronald E. Blaylock | 60 | 2007 | Yes | Founder and Managing Partner of GenNx360 Capital Partners, a private-equity buyout fund | Compensation and Personnel | Ronald E. Blaylock | 63 | 2007 | Yes | Founder and Managing Partner of GenNx360 Capital Partners, a private-equity buyout fund | Compensation and Personnel | |||||||||||||||||||||||||||||||
| Sona Chawla | 52 | 2017 | Yes | Chief Growth and Innovation Officer at CDW Corporation, a leading technology solutions provider | Compensation and Personnel | Sona Chawla | 55 | 2017 | Yes | Chief Growth and Innovation Officer at CDW Corporation, a leading business technology company | Compensation and Personnel; Technology and Innovation | |||||||||||||||||||||||||||||||
| Thomas J. Folliard | 55 | 2006 | No | Non-Executive Chair of the Board, CarMax, Inc. and Retired President and Chief Executive Officer of CarMax, Inc. | N/A | Thomas J. Folliard | 58 | 2006 | No | Non-Executive Chair of the Board, CarMax, Inc. and Retired President and Chief Executive Officer of CarMax, Inc. | N/A | |||||||||||||||||||||||||||||||
| Shira Goodman | 59 | 2007 | Yes | Retired Chief Executive Officer of Staples, Inc., an office supply retailer | Nominating and Governance | Shira Goodman | 62 | 2007 | Yes | Advisory Director, Charlesbank Capital Partners and Retired Chief Executive Officer of Staples, Inc., an office supply retailer | Nominating and Governance | |||||||||||||||||||||||||||||||
| Robert J. Hombach | 54 | 2018 | Yes | Retired Executive Vice President, Chief Financial Officer and Chief Operations Officer of Baxalta Incorporated, a biopharmaceutical company | Audit | |||||||||||||||||||||||||||||||||||||
| David W. McCreight | 57 | 2018 | Yes | Retired President of Urban Outfitters, Inc., an international consumer products retailer and wholesaler, and Chief Executive Officer of its Anthropologie Group | Audit | David W. McCreight | 60 | 2018 | Yes | Executive Chair of Lulu's, an online retail platform for women's apparel and accessories and former President of Urban Outfitters, Inc. | Audit | |||||||||||||||||||||||||||||||
| William D. Nash | 51 | 2016 | No | President and Chief Executive Officer of CarMax, Inc. | N/A | William D. Nash | 54 | 2016 | No | President and Chief Executive Officer of CarMax, Inc. | N/A | |||||||||||||||||||||||||||||||
| Mark F. O'Neil | 61 | 2019 | Yes | Retired Chief Operating Officer of Cox Automotive, Inc., a leading provider of automotive solutions and owner of Manheim, an automobile auction company | Audit | Mark F. O'Neil | 64 | 2019 | Yes | Retired Chief Operating Officer of Cox Automotive, Inc., a global automotive services and software company and owner of Manheim, an automobile auction company | Audit; Technology and Innovation | |||||||||||||||||||||||||||||||
| Pietro Satriano | 57 | 2018 | Yes | Chief Executive Officer of US Foods Holding Corp., a publicly held foodservice distributor | Nominating and Governance | Pietro Satriano | 60 | 2018 | Yes | Retired Chief Executive Officer of US Foods Holding Corp., a publicly held foodservice distributor | Nominating and Governance | |||||||||||||||||||||||||||||||
| Marcella Shinder | 53 | 2015 | Yes | Retired Global Head of Partnerships at WeWork Companies Inc., a technologically driven global provider of shared working spaces | Nominating and Governance | Marcella Shinder | 56 | 2015 | Yes | Advisory Director, Charlesbank Capital Partners and Retired Global Head of Partnerships at WeWork Companies Inc., a technologically driven global provider of shared working spaces | Nominating and Governance; Technology and Innovation | |||||||||||||||||||||||||||||||
| Mitchell D. Steenrod | 53 | 2011 | Yes | Retired Senior Vice President and Chief Financial Officer of Pilot Travel Centers LLC, the nation’s largest operator of travel centers and truck stops | Compensation and Personnel | Mitchell D. Steenrod | 56 | 2011 | Yes | Retired Senior Vice President and Chief Financial Officer of Pilot Travel Centers LLC, the nation’s largest operator of travel centers | Compensation and Personnel | |||||||||||||||||||||||||||||||
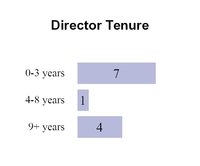


| All Committee Chairs and members and our Lead Director are independent. | The average tenure of our director nominees is 9 years. | ||||


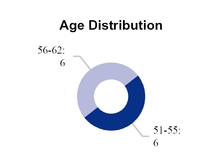
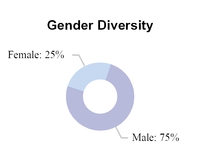
| The average age of our director nominees is 59 years old. | Three of our directors are women and two are racially or ethnically diverse. 50% of our Board committees are chaired by women; 75% of our Board committees are chaired by women or racially/ethnically diverse directors. | ||||
| Audit Fees | Audit-Related Fees | Tax Fees | All Other Fees | Total Fees | ||||||||||||||||||||||||||||
| Fiscal 2023 | $2,395,323 | $595,500 | $113,691 | $513,737 | $3,618,251 | |||||||||||||||||||||||||||
| Fiscal 2022 | $2,768,058 | $570,000 | $110,000 | $— | $3,448,058 | |||||||||||||||||||||||||||
| Audit Fees | Audit-Related Fees | Tax Fees | Total Fees | |||||
| Fiscal 2019 | $2,245,500 | $558,000 | $75,772 | $2,879,272 | ||||
| Fiscal 2020 | $2,428,374 | $563,000 | $107,991 | $3,099,365 | ||||


Expected Date of 2024 Annual Shareholders Meeting | June 25, 2024 | ||||
| Deadline for Shareholder Proposals | January 12, 2024 | ||||
PROPOSAL ONE: ELECTION OF DIRECTORS |
| Peter J. Bensen | Ronald E. Blaylock | Sona Chawla | Thomas J. Folliard | Shira Goodman | David W. McCreight | William D. Nash | Mark F. O’Neil | Pietro Satriano | Marcella Shinder | Mitchell D. Steenrod | |||||||||||||||||||||||||
| Leadership and Industry Experience | |||||||||||||||||||||||||||||||||||
| Other Public Company Board Experience | ü | ü | ü | ü | ü | ü | ü | ü | ü | ||||||||||||||||||||||||||
CEO/COO/ Division President | ü | ü | ü | ü | ü | ü | ü | ü | |||||||||||||||||||||||||||
| CFO | ü | ü | |||||||||||||||||||||||||||||||||
| Relevant Industry Experience | ü | ü | ü | ü | ü | ü | ü | ü | |||||||||||||||||||||||||||
| Functional Expertise | |||||||||||||||||||||||||||||||||||
| Accounting & Finance | ü | ü | ü | ü | |||||||||||||||||||||||||||||||
| Innovation and Disruption | ü | ü | ü | ü | ü | ü | ü | ü | |||||||||||||||||||||||||||
| Data Analytics | ü | ü | ü | ü | ü | ü | ü | ü | ü | ||||||||||||||||||||||||||
| E-commerce | ü | ü | ü | ü | ü | ü | ü | ü | ü | ||||||||||||||||||||||||||
| Technology & Cyber | ü | ü | ü | ü | ü | ü | ü | ||||||||||||||||||||||||||||
| Logistics | ü | ü | ü | ü | |||||||||||||||||||||||||||||||
| Product, Marketing & Media | ü | ü | ü | ü | ü | ü | ü | ü | ü | ||||||||||||||||||||||||||
| Regulatory | ü | ü | ü | ü | |||||||||||||||||||||||||||||||
| Human Capital Management | ü | ü | ü | ü | ü | ü | ü | ü | ü | ||||||||||||||||||||||||||
| Risk Oversight | ü | ü | ü | ü | ü | ü | ü | ||||||||||||||||||||||||||||
| Strategic Planning | ü | ü | ü | ü | ü | ü | ü | ü | ü | ü | ü | ||||||||||||||||||||||||
| Individual Characteristics | |||||||||||||||||||||||||||||||||||
| Age (Nominee Average is 59 years of age) | 60 | 63 | 55 | 58 | 62 | 60 | 54 | 64 | 60 | 56 | 56 | ||||||||||||||||||||||||
| Gender | M | M | F | M | F | M | M | M | M | F | M | ||||||||||||||||||||||||
| Racial/Ethnic Diversity | ü | ü | |||||||||||||||||||||||||||||||||
 | PETER J. BENSEN Director since: 2018 Age: 60 Independent | |||||
Mr. Bensen retired from McDonald’s Corporation, following a 20-year career, in 2016. He served as Chief Administrative Officer of McDonald’s from 2015 to 2016. Before that he served as Corporate Executive Vice President and Chief Financial Officer of McDonald’s from 2008 to 2014, when he was promoted to Corporate Senior Executive Vice President and Chief Financial Officer, a position he held until 2015. During his tenure as Chief Administrative Officer and Chief Financial Officer, Mr. Bensen also had oversight responsibility for information technology, supply chain, and other support departments. Before joining McDonald’s in 1996, Mr. Bensen was a senior manager at Ernst & Young LLP. | ||||||
Qualifications Mr. Bensen’s long-standing service as the chief financial officer, and in other administrative, financial, and accounting roles, at a global, iconic company qualify him to serve on our Board. He brings to our Board extensive management experience and financial expertise, as well as his background as a key executive helping to shape McDonald’s strategic response to a changing market environment. | ||||||
Other Current Directorships Other Directorships within Past 5 Years Lamb Weston Holdings, Inc. None. | ||||||
 | RONALD E. BLAYLOCK Director since: 2007 Age: 63 Independent | |||||
Mr. Blaylock is the founder and Managing Partner of GenNx360 Capital Partners, a private-equity buyout fund focused on industrial business-to-business companies. Prior to founding GenNx360 in 2006, Mr. Blaylock was Chief Executive Officer of Blaylock & Company, a full-service investment banking firm that he founded in 1993. Previously, Mr. Blaylock held senior management positions with PaineWebber and Citigroup. | ||||||
Qualifications Mr. Blaylock’s experience managing two successful investment enterprises, as well as his considerable capital markets and finance experience, qualify him to serve on our Board. Mr. Blaylock’s years of relevant experience growing companies, serving as a strategic advisor and serving on other public company boards enable him to provide additional insight to our Board. | ||||||
Other Current Directorships Other Directorships within Past 5 Years Pfizer Inc. Urban One, Inc. (2002-2019) W. R. Berkley Corporation Advantage Solutions Inc. (2017-2022) | ||||||
 | SONA CHAWLA Director since: 2017 Age: 55 Independent | |||||
Ms. Chawla has served as the Chief Growth and Innovation Officer at CDW Corporation, a leading technology solutions provider to business, government, education and healthcare customers, since January 2020. She is responsible for strategy and corporate development, digital and e-commerce, technology, information security, supply chain, marketing, and product and partner management. Prior to joining CDW, she was President of Cybersecurity Oversight from the Software Engineering Institute of Carnegie Mellon University. | ||||||
Qualifications As Chief Growth and Innovation Officer at a leading business technology company that specializes in providing products, solutions and services, Ms. | ||||||
Other Current Directorships Other Directorships within Past 5 Years None. None. | ||||||
| THOMAS J. FOLLIARD Director since: 2006 Age: 58 Non-Executive Chair of the Board | |||||
Mr. Folliard has been the Non-Executive Chair of the Board of CarMax since August 2016. He joined CarMax in 1993 as senior buyer and became Director of Purchasing in 1994. He was promoted to Vice President of Merchandising in 1996, Senior Vice President of Store Operations in 2000 and Executive Vice President of Store Operations in 2001. Mr. Folliard served as President and Chief Executive Officer of CarMax from 2006 to February 2016 and retired as Chief Executive Officer in August 2016. | ||||||
Qualifications During his ten years as CEO, Mr. Folliard successfully led CarMax through the company’s establishment as a national brand and a time of significant growth, during which its store base and total revenues more than doubled and its net income quadrupled. With his long tenure at CarMax, Mr. Folliard brings to the board significant executive experience and in-depth knowledge of our company, | ||||||
Other Current Directorships Other Directorships within Past 5 Years PulteGroup, Inc. None. | ||||||
 | SHIRA GOODMAN Director since: 2007 Age: 62 Independent | ||||
Ms. Goodman was the Chief Executive Officer of Staples, Inc. Ms. Goodman joined Staples in 1992 and held a variety of positions of increasing responsibility in general management, marketing and human resources, including serving as Executive Vice President, Marketing from 2001 to 2009, Executive Vice President, Human Resources from 2009 to 2012, Executive Vice President, Global Growth from 2012 to 2014, President, North American Commercial from 2014 to 2016, President, North American Operations from February to June 2016, Interim Chief Executive Officer from June to September 2016, and Chief Executive Officer from September 2016 to January 2018. From 1986 to 1992, Ms. Goodman worked at Bain & Company At Charlesbank, Ms. Goodman provides business development and strategic guidance to B2B and B2C companies and is responsible for leading Charlesbank’s ESG efforts across the firm and its portfolio companies. | |||||
Ms. Goodman’s experience as the chief executive and senior executive in other leadership positions in operations, retail marketing, human resources and business growth at an internationally renowned retailer qualify her to serve on our Board. During her years at Staples, the company underwent a robust digital transformation and grew from a mid-sized US retailer into a global multi-channel distributor with a powerful presence in retail, e-commerce and B2B delivery. | |||||
Other Current Directorships | |||||
Other Directorships within Past 5 Years | |||||
 | |
 | DAVID W. MCCREIGHT Director since: 2018 Age: 60 Independent | ||||
Mr. McCreight has served as the Executive Chair of Lulu’s Fashion Lounge Holdings, Inc., an online retail platform for women’s apparel and accessories, since March 2023 and he served as the Chief Executive Officer of Lulu’s from April 2021 until March 2023. Lulu’s is | |||||
Mr. McCreight has executive experience leading high-profile retail brands in highly competitive and fast-evolving marketplaces. For over twenty years, Mr. McCreight led organizations in developing omnichannel strategies and digital competencies to expand the reach for new customers and strengthen relationships with existing customers. His deep experience as an omnichannel brand executive and successful track record qualify him to serve on our Board, particularly as CarMax continues to differentiate and grow its brand and enhance its omnichannel strategy. | |||||
Other Current Directorships | |||||
Other Directorships within Past 5 Years | |||||
Wolverine World Wide, Inc. (2019 - 2023) | |||||
 | WILLIAM D. NASH Director since: 2016 Age: 54 President and Chief Executive Officer | |||||
Mr. Nash has been the President and Chief Executive Officer of CarMax since September 2016. He was promoted to President in February 2016. In 2012, he assumed the role of Executive Vice President, Human Resources and Administrative Services, where he oversaw human resources, information technology, procurement, loss prevention, employee health & safety, and construction & facilities. In 2011, Mr. Nash was promoted to Senior Vice President, Human Resources and Administrative Services. Previously, he served as Vice President and Senior Vice President of Merchandising, after serving as Vice President of Auction Services. Mr. Nash joined CarMax in 1997 as auction manager. Before joining CarMax, Mr. Nash, a former CPA, held a variety of accounting roles at Circuit City. | ||||||
Qualifications As the chief executive officer of CarMax, Mr. Nash leads the Company’s day-to-day operations and is responsible for establishing and executing the Company’s strategic plans. His significant experience in the auto retail industry, his tenure with CarMax and his motivational leadership of more than | ||||||
Other Current Directorships Other Directorships within Past 5 Years None. None. | ||||||
 | MARK F. O’NEIL Director since: 2019 Age: 64 Independent | |||||
Mr. O’Neil retired as Chief Operating Officer of Cox Automotive, a global automotive services and software company, in March 2019 after being named to the position in 2016 following Cox’s acquisition of Dealertrack Technologies, Inc., then a publicly traded provider of software, | ||||||
Qualifications Mr. O’Neil’s extensive experience as a chief executive and a leader at the intersection of auto retail and technology uniquely qualifies him to serve on our Board. During his over 30-year career in auto retail, Mr. O’Neil led several companies through periods of significant retail | ||||||
Other Current Directorships Other Directorships within Past 5 Years None. None. | ||||||
 | PIETRO SATRIANO Director since: 2018 Age: 60 Independent | |||||
Mr. Satriano | ||||||
Qualifications Mr. Satriano’s chief executive experience at US Foods, as well as his extensive executive experience at consumer-facing companies, qualify him to serve on our Board. | ||||||
Other Current Directorships Other Directorships within Past 5 Years Metro Inc. (listed on the Toronto Stock Exchange) US Foods Holding Corp. (2015-2022) | ||||||
 | MARCELLA SHINDER Director since: 2015 Age: 56 Independent | |||||
Ms. Shinder served as Global Head of Partnerships at WeWork Companies, Inc. a technologically driven global provider of shared working spaces, from April 2019 to November 2019. Ms. Shinder joined WeWork in March 2018, serving as Global Head of Marketing until April 2019. At WeWork, Ms. Shinder was responsible for leading a global, integrated, omnichannel marketing agenda. Prior to Software Engineering Institute of Carnegie Mellon University. | ||||||
Qualifications Ms. Shinder’s experiences as the lead marketing officer of innovative | ||||||
Other Current Directorships Other Directorships within Past 5 Years None. None. | ||||||
 | MITCHELL D. STEENROD Director since: 2011 Age: 56 Lead Independent Director | |||||
Mr. Steenrod | ||||||
Qualifications Mr. Steenrod’s extensive retail industry and operational experience as well as his experience implementing successful growth strategies, including | ||||||
Other Current Directorships Other Directorships within Past 5 Years None. Recharge Acquisition Corp. (2020-2022) | ||||||
CORPORATE GOVERNANCE | ||
| Bylaws | Our bylaws regulate the corporate affairs of CarMax. They include provisions relating to shareholder meetings, voting, the nomination of directors and the proxy access right. | ||||
| Corporate Governance Guidelines | Our corporate governance guidelines set forth the Board’s practices with respect to its responsibilities, qualifications, performance, direct access to | ||||
| Code of Business Conduct | Our code of business conduct is the cornerstone of our compliance and ethics program. It applies to all CarMax associates and Board members. It includes provisions relating to honest and ethical conduct, compliance with laws, the handling of confidential information and diversity. It explains how to use our associate help line and related website, both of which allow associates to report misconduct anonymously. It also describes our zero-tolerance policy on retaliation for making such reports. Any amendment to, or waiver from, a provision of this code for our directors or executive officers will be promptly disclosed under the | ||||
| Peter J. Bensen | Shira Goodman | Pietro Satriano | ||||||||||||
| Ronald E. Blaylock | David W. McCreight | Marcella Shinder | ||||||||||||
| Mark F. O’Neil | ||||||||||||||
| Mitchell D. Steenrod | ||||||||||||||
Each committee is composed solely of independent directors. | In addition, all members of the Compensation and Personnel Committee qualify as “outside directors” within the meaning of Section 162(m) of the Internal Revenue Code and “non-employee directors” as defined by Rule 16b-3 under the Securities Exchange Act of 1934. Each committee has a charter that describes the committee’s responsibilities. These charters are available under the | ||||
| Committee | Members | Membership Following the Annual Shareholders Meeting | Responsibilities | ||||||||
| Audit | Peter J. Bensen (Chair) David W. McCreight Mark F. O’Neil | Peter J. Bensen (Chair) Mark F. O’Neil Pietro Satriano | The Audit Committee assists in the Board’s oversight of: The Audit Committee retains and approves all fees paid to the independent auditors, who report directly to the Committee. Each member of the Audit Committee is financially literate, with Mr. Bensen The Audit Committee’s report to shareholders can be found on page | ||||||||
Compensation and Personnel | Ronald E. Blaylock (Chair) Sona Chawla Mitchell D. Steenrod | Ronald E. Blaylock (Chair) Sona Chawla | The Compensation and Personnel Committee assists in the Board’s oversight of: •our strategy, policies and practices related to human capital management, including talent management, associate engagement and diversity and inclusion. The Compensation and Personnel Committee has sole authority to retain and terminate its independent compensation consultant, as well as to approve the consultant’s fees. The Compensation and Personnel Committee’s report to shareholders can be found on page | ||||||||
Nominating and Governance | Shira Goodman (Chair) Pietro Satriano Marcella Shinder | Shira Goodman (Chair) Marcella Shinder Mitchell D. Steenrod | The Nominating and Governance Committee assists in the Board’s oversight of: •corporate and social responsibility, environmental and sustainability matters; •our corporate governance guidelines. | ||||||||
| Technology and Innovation | Sona Chawla (Chair) Mark F. O’Neil Marcella Shinder | Sona Chawla (Chair) Mark F. O’Neil Marcella Shinder | The Technology and Innovation Committee assists in the Board’s oversight of: •our technology, omni-channel, digital, e-commerce, and innovation strategies; •significant emerging technology, omni-channel, e-commerce, digital, and innovation trends; •major technology related project progress, budgets, and effectiveness; •our development and commercial use of data assets, data science, and machine learning; •CarMax’s intellectual property portfolio; and •risks and exposures related to cybersecurity, data privacy, and business continuity matters. | ||||||||
| Director | Board | Audit | Compensation and Personnel | Nominating and Governance | Director | Board | Audit | Compensation and Personnel | Nominating and Governance | Technology and Innovation | ||||||||||||||||||||||||||
Peter J. Bensen(a) | 5 | 11* | — | — | ||||||||||||||||||||||||||||||||
| Peter J. Bensen | Peter J. Bensen | 6 | 9* | — | — | — | ||||||||||||||||||||||||||||||
| Ronald E. Blaylock | 5 | — | 6* | — | Ronald E. Blaylock | 6 | — | 5* | — | — | ||||||||||||||||||||||||||
| Sona Chawla | 5 | — | 6 | — | Sona Chawla | 6 | — | 5 | — | 4* | ||||||||||||||||||||||||||
| Thomas J. Folliard | 4* | — | — | — | Thomas J. Folliard | 6* | — | — | — | — | ||||||||||||||||||||||||||
| Shira Goodman | 4 | — | — | 4* | Shira Goodman | 6 | — | — | 4* | — | ||||||||||||||||||||||||||
| Robert J. Hombach | 5 | 12 | — | — | ||||||||||||||||||||||||||||||||
| Robert J. Hombach*** | Robert J. Hombach*** | — | — | — | — | — | ||||||||||||||||||||||||||||||
| David W. McCreight | 5 | 12 | — | — | David W. McCreight | 6 | 9 | — | — | — | ||||||||||||||||||||||||||
| William D. Nash | 5 | — | — | — | William D. Nash | 6 | — | — | — | — | ||||||||||||||||||||||||||
Mark F. O'Neil(b) | 3 | 4 | — | — | ||||||||||||||||||||||||||||||||
| Mark F. O’Neil | Mark F. O’Neil | 6 | 8 | — | — | 4 | ||||||||||||||||||||||||||||||
| Pietro Satriano | 4 | — | — | 4 | Pietro Satriano | 6 | — | — | 3 | — | ||||||||||||||||||||||||||
| Marcella Shinder | 5 | — | — | 4 | Marcella Shinder | 6 | — | — | 4 | 4 | ||||||||||||||||||||||||||
Mitchell D. Steenrod(c) | 5 | 4* | 3 | — | ||||||||||||||||||||||||||||||||
William R. Tiefel(d) | 1 | — | 2 | — | ||||||||||||||||||||||||||||||||
| Mitchell D. Steenrod | Mitchell D. Steenrod | 6** | — | 5 | — | — | ||||||||||||||||||||||||||||||
| TOTAL MEETINGS | 5 | 12 | 6 | 4 | TOTAL MEETINGS | 6 | 9 | 5 | 4 | 4 | ||||||||||||||||||||||||||
** Lead independent director |
| The Committee takes into account a number of additional factors in assessing director nominees, including the current size of the Board, the particular challenges facing CarMax, the Board’s need for specific skills or perspectives, and the nominee’s character, reputation, experience, independence from management and ability to devote the requisite time. We believe that the diverse backgrounds and experiences of our current directors demonstrate the Committee’s success. | |||||
Assignment of Risk Categories to Board and its Committees | The Board has assigned oversight of certain key risk categories to either the full Board or one of its committees. For each category, management reports regularly to the Board or the assigned committee, as appropriate, describing CarMax’s strategies for monitoring, managing and mitigating risks that fall within that category. Examples of the risk categories assigned to each committee and the full Board are described below. This list is not comprehensive and is subject to change: | |||||||
| § | Audit Committee: oversees risks related to financial reporting, compliance and ethics, | |||||||
| § | Compensation and Personnel Committee: oversees risks related to human resources and compensation practices. | |||||||
| § | Nominating and Governance Committee: oversees risks related to government affairs, CarMax’s reputation, social responsibility, and | |||||||
| § | Technology and Innovation Committee: oversees risks related to information technology, cybersecurity, and business continuity. | |||||||
| § | Board: oversees risks related to the economy, competition, shareholder relations, finance and strategy. | |||||||
| Enterprise Risk Management | Risk Committee: We have a management-level Risk Committee, which is chaired by Enrique Mayor-Mora, our | |||||||
Board Reporting: The Risk Committee delivers biannual reports to the Board identifying the most significant risks facing the Company. | ||||||||
Board Oversight: On an annual basis, Mr. Mayor-Mora, on behalf of the Risk Committee, discusses our procedures for identifying significant risks with the Audit Committee. | ||||||||
| Other Processes that Support Risk Oversight and Management | The Board oversees other processes that are not intended primarily to support enterprise risk management, but that assist the Company in identifying and controlling risk. These processes include our compliance and ethics program, our internal audit function, pre-filing review of SEC filings by our management-level disclosure committee, and the work of our independent auditors. | |||||||
We did not have any related person transactions in fiscal | A copy of our policy is available under the | ||||
PROPOSAL TWO: RATIFICATION OF THE APPOINTMENT OF THE INDEPENDENT REGISTERED PUBLIC ACCOUNTING FIRM | ||
AUDIT COMMITTEE REPORT | ||
AUDITOR FEES AND PRE-APPROVAL POLICY | ||
| Years Ended February 28 | |||||||||||
| Type of Fee | 2023 | 2022 | |||||||||
Audit Fees(a) | $ | 2,395,323 | $ | 2,768,058 | |||||||
Audit-Related Fees(b) | 595,500 | 570,000 | |||||||||
Tax Fees(c) | 113,691 | 110,000 | |||||||||
All Other Fees(d) | 513,737 | — | |||||||||
| TOTAL FEES | $ | 3,618,251 | $ | 3,448,058 | |||||||
| Years Ended February 28 and 29 | |||||||
| Type of Fee | 2019 | 2020 | |||||
Audit Fees(a) | $ | 2,245,500 | $ | 2,428,374 | |||
Audit-Related Fees(b) | 558,000 | 563,000 | |||||
Tax Fees(c) | 75,772 | 107,991 | |||||
| TOTAL FEES | $ | 2,879,272 | $ | 3,099,365 | |||
PROPOSAL THREE: ADVISORY | ||
COMPENSATION DISCUSSION AND ANALYSIS | ||
| William D. Nash | President and Chief Executive Officer. Mr. Nash joined CarMax in 1997 and was promoted to his current position in 2016. Mr. Nash is also a member of our Board. | ||||
| Enrique N. Mayor-Mora | |||||
| James Lyski | Executive Vice President and Chief Marketing Officer. Mr. Lyski joined CarMax in 2014 and was promoted to his current position in 2017. | ||||
| Shamim Mohammad | Executive Vice President and Chief Information and Technology Officer. Mr. Mohammad joined CarMax in 2012 and was promoted to his current role in 2021. | ||||
| Diane L. Cafritz | Executive Vice President, General Counsel, Chief Compliance Officer and Chief Human Resources Officer. Ms. Cafritz joined CarMax in 2003 and was appointed to her current role in 2021. | ||||
Compensation | Determinations | Why We Made These Determinations | |||||||
| Base Salary | Base salary increases ranged from 4% to 5% with the exception of two promotion connected increases of 10% and 18% | Differentiated increases were awarded to our NEOs related to executive promotions, increasing responsibilities and benchmarking data used to inform pay decisions. The Committee approved base salary changes in March 2022, following the close of fiscal 2022, during which we had delivered significant growth in sales, market share and earnings. | |||||||
| 48.7% payout versus a 185.6% payout in fiscal 2022 Increased target percentage for certain NEOs | The Committee reviewed peer group and survey data and determined to increase the target percentage for our CEO by 15%. The Committee also increased Mr. Ms. Cafritz’s target percentage in connection with their promotions. | ||||||||
| Long-Term Equity Awards | |||||||||
Year one of the fiscal 2023 PSUs and year two of the fiscal 2022 PSUs earned 4% of target based on the fiscal 2023 performance goals set by the Committee | |||||||||
pre-tax EPS performance and market share. The Committee | |||||||||
The Committee has retained an independent compensation consultant. | Committee members have direct access to the compensation consultant without going through management. The Committee assesses its compensation consultant’s independence annually. It assessed | ||||
| Advance Auto Parts, Inc. | Kohl’s Corporation | ||||
| AutoNation, Inc. | L Brands, Inc. | ||||
| AutoZone, Inc. | Lowe’s Companies, Inc. | ||||
| Best Buy Co., Inc. | Macy’s, Inc. | ||||
| Dick’s Sporting Goods, Inc. | Ross Stores, Inc. | ||||
| Dollar General Corporation | The Sherwin-Williams Company | ||||
| Dollar Tree, Inc. | |||||
| eBay Inc. | The TJX Companies, Inc. | ||||
| The Gap, Inc. | Tractor Supply Company | ||||
| Genuine Parts Company | |||||
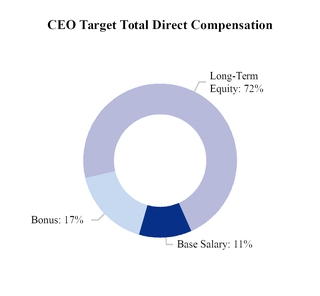
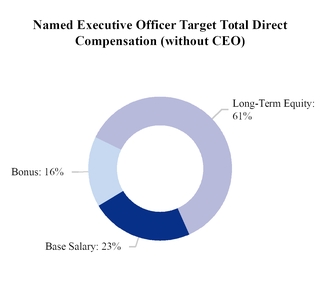
| Base Salary | + | Annual Incentive Bonus | + | Long-Term Equity Awards | = | Total Direct Compensation | ||||||||||||||


| Percentage of Target Total Direct Compensation | Percentage of Target Performance-Based Compensation | ||||||||||||||||||||||
| Performance- Based | Fixed | Annual | Long- Term | ||||||||||||||||||||
| William D. Nash | 91% | 9% | 18% | 82% | |||||||||||||||||||
| Enrique N. Mayor-Mora | 74% | 26% | 30% | 70% | |||||||||||||||||||
| James Lyski | 78% | 22% | 24% | 76% | |||||||||||||||||||
| Shamim Mohammad | 77% | 23% | 26% | 74% | |||||||||||||||||||
| Diane L. Cafritz | 77% | 23% | 26% | 74% | |||||||||||||||||||
| Name | Prior Base Salary ($) | Fiscal 2023 Base Salary ($) | Percentage Increase in Approved Base Salary (%) | ||||||||
| William D. Nash | 1,184,400 | 1,231,776 | 4 | ||||||||
| Enrique N. Mayor-Mora | 665,048 | 731,553 | 10 | ||||||||
| James Lyski | 630,000 | 661,500 | 5 | ||||||||
| Shamim Mohammad | 566,500 | 590,000 | 4 | ||||||||
| Diane L. Cafritz | 500,000 | 590,000 | 18 | ||||||||
| Name | Prior Base Salary ($) | Fiscal 2020 Base Salary ($) | Percentage Increase (%) | |||||
| William D. Nash | 1,063,475 | 1,095,379 | 3.00 | |||||
| Thomas W. Reedy | 744,433 | 766,766 | 3.00 | |||||
| Edwin J. Hill | 700,000 | 735,000 | 5.00 | |||||
| Eric M. Margolin | 611,499 | 629,844 | 3.00 | |||||
| James Lyski | 515,000 | 540,750 | 5.00 | |||||
| Name | Fiscal 2020 Base Salary as Treasurer ($) | Fiscal 2020 Base Salary as CFO ($) | Percentage Increase (%) | |||||
| Enrique N. Mayor-Mora | 377,933 | 500,000 | 32.3 | % | ||||
| Base Salary | x | Target Percentage of Base Salary | x | Performance Adjustment Factor | = | Annual Incentive Bonus | ||||||||||||||
| Goal | Description | Achievement Against Targets | ||||||
30% of performance goal | 25% of this goal would be achieved with EBIT performance of $1,453 million. 100% of this goal would be achieved with EBIT performance of $1,550 million. During the first quarter of fiscal 2023 when the Committee set the fiscal 2023 EBIT goal, the Company was experiencing challenging market conditions, including inflationary pressures and lower consumer confidence. In fiscal 2022, we achieved record earnings and our EBIT performance was $1,584. Note that the Committee determined | |||||||
2023. | For fiscal | |||||||
Market Share 30% of performance goal | For calendar 2022, increase the Company’s market share of nationwide age 0- to 10-year old vehicles sold. 50% of this goal would be achieved with a 100% of this goal would be achieved with a calendar 2022 market share of 4.22%. | We estimate our calendar year 2022 market share was 3.99%. Accordingly, the Committee considered 54% (16.2 percentage points) of this goal to have been achieved. | ||||||
Operational Execution: Online Retail Sales, Online Finance Experience and MaxOffer Expansion 30% of performance goal | One-third of this goal (10 percentage points) would be achieved if online sales averaged 15% of total sales for fiscal 2023, with a sliding scale payout with online sales of 11% (the fiscal 2022 baseline) and 15%, equating to 0% and 100% achievement of this goal, respectively. One-third of this goal (10 percentage points) would be achieved upon the deployment of capabilities enabling over 90% of retail customers to engage in One-third of this goal (10 percentage points) would be achieved upon expanding MaxOffer penetration to 35 markets, with a sliding scale payout with 17 markets (the fiscal 2022 baseline) and 35 markets, equating to 0% and 100% achievement of this goal, respectively. | Online sales averaged 12% for fiscal 2023. Accordingly, the Committee considered 25% (2.5 percentage points) of this goal to have been achieved. Over 90% of retail customers were able to engage in our online finance experience, including the pre-qualification tool. The Committee considered 100% (10 percentage points) of this goal to have been achieved. We expanded MaxOffer penetration to over 35 markets. The Committee considered 100% (10 percentage points) of this goal to be achieved. | ||||||
Environmental and Social Objectives 10% of performance | Half of Half of this goal (5 percentage points) would be achieved if (i) 90% or more of our non-manager and manager associates completed three and four of our D&I training modules, respectively, and (ii) a supplier diversity tier 1 roadmap, including annual milestones and 2025 spending goal, was finalized. | In fiscal 2023, we achieved at least a 10% reduction in greenhouse gas emissions against our 2025 goal and finalized a roadmap with annual milestones to reach our 2025 goal. 90% or more of our associates completed the required training modules and the supplier diversity tier 1 roadmap was finalized. Accordingly, the Committee considered 100% (10 percentage points) of these goals to have been achieved. | ||||||
| Name | Base Salary ($) | Incentive Target Percentage (%) | Target Incentive Amount ($) | Actual Fiscal 2023 Incentive Bonus ($) | Maximum Incentive Amount ($) | ||||||||||||||||||||||||
| William D. Nash | 1,231,776 | 175 | 2,155,608 | 1,049,781 | 4,311,216 | ||||||||||||||||||||||||
| Enrique N. Mayor-Mora | 731,553 | 85 | 621,820 | 302,826 | 1,243,640 | ||||||||||||||||||||||||
| James Lyski | 661,500 | 85 | 562,275 | 273,828 | 1,124,550 | ||||||||||||||||||||||||
| Shamim Mohammad | 590,000 | 85 | 501,500 | 244,231 | 1,003,000 | ||||||||||||||||||||||||
| Diane L. Cafritz | 590,000 | 85 | 501,500 | 244,231 | 1,003,000 | ||||||||||||||||||||||||
| Name | Base Salary ($) | Incentive Target Percentage (%) | Target Incentive Amount ($) | Actual Fiscal 2020 Incentive Bonus | Maximum Incentive Amount ($) | |||||||||
| William D. Nash | 1,095,379 | 150 | 1,643,069 | 2,078,482 | 3,286,137 | |||||||||
Enrique N. Mayor-Mora(a) | 377,933/500,000 | 45/60 | 215,510 | 272,620 | 431,020 | |||||||||
| Thomas W. Reedy | 766,766 | 75 | 575,075 | 727,469 | 1,150,149 | |||||||||
| Edwin J. Hill | 735,000 | 75 | 551,250 | 697,331 | 1,102,500 | |||||||||
| Eric M. Margolin | 629,844 | 75 | 472,383 | 597,564 | 944,766 | |||||||||
| James Lyski | 540,750 | 75 | 405,563 | 513,037 | 811,125 | |||||||||
| Options and MSUs Granted in Fiscal 2019 | Options, PSUs, and MSUs Granted in Fiscal 2020 | ||||||||||||||||
| Name | Grant Date Fair Value of Stock Options ($)(a)(b) | Grant Date Fair Value of MSUs ($)(b) | Total Grant Date Fair Value ($) | Grant Date Fair Value of Stock Options ($)(a)(b) | Grant Date Fair Value of PSUs and MSUs ($)(b) | Total Grant Date Fair Value ($) | |||||||||||
| William D. Nash | 4,499,998 | 1,500,022 | 6,000,020 | 5,250,006 | 1,750,016 | 7,000,022 | |||||||||||
Enrique N. Mayor-Mora(c) | 440,302 | 146,793 | 587,095 | 600,745 | 200,273 | 801,018 | |||||||||||
| Thomas W. Reedy | 1,455,919 | 485,325 | 1,941,244 | 1,605,923 | 535,334 | 2,141,257 | |||||||||||
| Edwin J. Hill | 1,455,919 | 485,325 | 1,941,244 | 1,605,923 | 535,334 | 2,141,257 | |||||||||||
| Eric M. Margolin | 1,305,921 | 435,303 | 1,741,224 | 1,305,922 | 435,342 | 1,741,264 | |||||||||||
| James Lyski | 1,084,918 | 361,620 | 1,446,538 | 1,084,923 | 361,606 | 1,446,529 | |||||||||||
| Options and PSUs Granted in Fiscal 2023 | Options and PSUs Granted in Fiscal 2022 | ||||||||||||||||||||||||||||||||||
| Name | Grant Date Fair Value of Stock Options ($)(a)(b) | Grant Date Fair Value of PSUs ($)(b) | Total Grant Date Fair Value ($) | Grant Date Fair Value of Stock Options ($)(a)(b) | Grant Date Fair Value of PSUs ($)(b) | Total Grant Date Fair Value ($) | |||||||||||||||||||||||||||||
| William D. Nash | 7,499,999 | 2,499,970 | 9,999,969 | 5,999,981 | 2,000,009 | 7,999,990 | |||||||||||||||||||||||||||||
| Enrique N. Mayor-Mora | 1,084,933 | 361,644 | 1,446,577 | 974,987 | 324,959 | 1,299,946 | |||||||||||||||||||||||||||||
| James Lyski | 1,305,911 | 435,285 | 1,741,196 | 1,305,923 | 435,332 | 1,741,255 | |||||||||||||||||||||||||||||
| Shamim Mohammad | 1,084,933 | 361,644 | 1,446,577 | 1,084,918 | 361,659 | 1,446,577 | |||||||||||||||||||||||||||||
| Diane L. Cafritz | 1,084,933 | 361,644 | 1,446,577 | 974,987 | 324,959 | 1,299,946 | |||||||||||||||||||||||||||||
| Threshold | Target | Actual | Maximum | ||||
FY18-FY20 Diluted Earnings Per Share, as Adjusted(a) | $17.11 | $18.66 | $18.97 | $20.30 | |||
| Performance Multiplier | 25 | % | 100 | % | 119 | % | 200% |
| Threshold | Target | Maximum | Actual | ||||||||||||||||||||
FY23 Pre-Tax Earnings Per Share (a) | $ | 8.26 | $ | 8.86 | $ | 10.05 | $ | 3.93 | |||||||||||||||
| Pre-Tax Earnings Per Share Performance Multiplier | 25 | % | 100 | % | 200 | % | — | % | |||||||||||||||
| Threshold | Target | Actual | Maximum | ||||
FY20 Diluted Earnings Per Share, as Adjusted(a) | $6.61 | $6.76 | $6.90 | $7.57 | |||
| Performance Multiplier | 25 | % | 100 | % | 117 | % | 200% |
| Threshold | Target | High End | Maximum | Actual | ||||||||||||||||||||||||||||||||||
Market Share (a) | 3.97 | % | 4.22 | % | 4.35 | % | 4.49 | % | 3.99 | % | ||||||||||||||||||||||||||||
| Performance Multiplier | 0 | % | 100 | % | 150 | % | 200 | % | 8 | % | ||||||||||||||||||||||||||||
| Percentage of Target Total Direct Compensation | Percentage of Target Performance-Based Compensation | ||||||
| Performance- Based | Fixed | Annual | Long- Term | ||||
| William D. Nash | 89% | 11% | 19% | 81% | |||
| Enrique N. Mayor-Mora | 71% | 29% | 21% | 79% | |||
| Thomas W. Reedy | 78% | 22% | 21% | 79% | |||
| Edwin J. Hill | 79% | 21% | 20% | 80% | |||
| Eric M. Margolin | 78% | 22% | 21% | 79% | |||
| James Lyski | 77% | 23% | 22% | 78% | |||
Our severance agreements do not provide for a guaranteed term of employment or tax gross-ups. | The agreements provide for severance payments under certain circumstances, which are discussed in more detail under “Potential Payments Upon Termination or None of the | ||||
| Subject Officers | Required to Own the Lesser of: | ||||
| Chief Executive Officer | 6 x Base Salary or 300,000 shares | ||||
| Executive Vice President | 3 x Base Salary or 100,000 shares | ||||
| Senior Vice President | 2 x Base Salary or 50,000 shares | ||||
COMPENSATION AND PERSONNEL COMMITTEE REPORT | ||
COMPENSATION TABLES | ||
| Name and Principal Position | Fiscal Year | Salary ($) | Stock Awards(a) ($) | Option Awards(a) ($) | Non-Equity Incentive Plan Comp- ensation(b) ($) | Change in Pension Value and Nonqualified Deferred Comp- ensation Earnings(c) ($) | All Other Compen- sation(d) ($) | Total ($) | |||||||||||||||||||||||||||||||||||||||
| William D. Nash | 2023 | 1,232,297 | 1,365,652 | 7,499,999 | 1,049,781 | — | 441,014 | 11,588,743 | |||||||||||||||||||||||||||||||||||||||
| President and Chief Executive Officer | 2022 | 1,180,248 | 2,644,810 | 5,999,981 | 3,517,194 | — | 346,890 | 13,689,123 | |||||||||||||||||||||||||||||||||||||||
| 2021 | 966,823 | 1,750,002 | 5,249,997 | 1,666,837 | 977 | 257,257 | 9,891,893 | ||||||||||||||||||||||||||||||||||||||||
| Enrique N. Mayor-Mora | 2023 | 726,803 | 205,954 | 1,084,933 | 302,826 | — | 120,221 | 2,440,737 | |||||||||||||||||||||||||||||||||||||||
| EVP and Chief Financial Officer | 2022 | 656,979 | 108,320 | 974,987 | 956,605 | — | 70,215 | 2,767,106 | |||||||||||||||||||||||||||||||||||||||
| 2021 | 502,583 | 325,069 | 974,995 | 319,745 | — | 63,314 | 2,185,706 | ||||||||||||||||||||||||||||||||||||||||
| James Lyski | 2023 | 660,981 | 258,490 | 1,305,911 | 273,828 | — | 107,609 | 2,606,819 | |||||||||||||||||||||||||||||||||||||||
| EVP and Chief Marketing Officer | 2022 | 611,682 | 553,798 | 1,305,923 | 968,129 | — | 71,484 | 3,511,016 | |||||||||||||||||||||||||||||||||||||||
| 2021 | 512,643 | 361,639 | 1,084,918 | 411,429 | — | 71,867 | 2,442,496 | ||||||||||||||||||||||||||||||||||||||||
Shamim Mohammad EVP and Chief Information and Technology Officer | 2023 | 590,143 | 214,629 | 1,084,933 | 244,231 | — | 110,185 | 2,244,121 | |||||||||||||||||||||||||||||||||||||||
| 2022 | 561,265 | 457,846 | 1,084,918 | 893,710 | — | 78,281 | 3,076,020 | ||||||||||||||||||||||||||||||||||||||||
Diane L. Cafritz EVP, General Counsel, Chief Compliance Officer and Chief Human Resources Officer | 2023 | 581,374 | 205,954 | 1,084,933 | 244,231 | — | 89,316 | 2,205,808 | |||||||||||||||||||||||||||||||||||||||
| 2022 | 493,165 | 390,880 | 974,987 | 649,600 | — | 56,210 | 2,564,842 | ||||||||||||||||||||||||||||||||||||||||
| Name and Principal Position | Fiscal Year | Salary ($) | Bonus(a) ($) | Stock Awards(b) ($) | Option Awards(b) ($) | Non-Equity Incentive Plan Comp- ensation(c) ($) | Change in Pension Value and Nonqualified Deferred Comp- ensation Earnings(d) ($) | All Other Compen- sation(e) ($) | Total ($) | ||||||||
| William D. Nash | 2020 | 1,095,175 | — | 583,286 | 5,250,006 | 2,078,482 | 131,106 | 262,611 | 9,400,666 | ||||||||
| President and Chief Executive Officer | 2019 | 1,063,157 | — | 1,500,022 | 4,499,998 | 1,595,213 | 5,075 | 288,082 | 8,951,547 | ||||||||
| 2018 | 1,031,721 | 96,239 | 1,249,974 | 3,750,005 | 1,472,448 | 24,797 | 190,068 | 7,815,252 | |||||||||
Enrique N. Mayor-Mora Senior VP and Chief Financial Officer | 2020 | 420,586 | — | 200,273 | 600,745 | 272,620 | — | 56,490 | 1,550,714 | ||||||||
| Thomas W. Reedy | 2020 | 766,622 | — | 178,445 | 1,605,923 | 727,469 | 100,226 | 143,240 | 3,521,925 | ||||||||
| Executive VP, Finance | 2019 | 744,210 | — | 485,325 | 1,455,919 | 558,325 | 6,543 | 147,501 | 3,397,823 | ||||||||
| 2018 | 722,205 | 38,866 | 485,313 | 1,455,925 | 594,643 | 22,219 | 132,390 | 3,451,561 | |||||||||
| Edwin J. Hill | 2020 | 732,981 | — | 178,445 | 1,605,923 | 697,331 | 163,278 | 149,392 | 3,527,350 | ||||||||
| Executive VP and Chief Operating Officer | 2019 | 691,237 | — | 485,325 | 1,455,919 | 525,000 | 17,461 | 124,740 | 3,299,682 | ||||||||
| 2018 | 619,033 | 33,314 | 435,281 | 1,305,925 | 509,694 | 44,019 | 98,719 | 3,045,985 | |||||||||
| Eric M. Margolin | 2020 | 629,726 | — | 145,114 | 1,305,922 | 597,564 | 14,097 | 104,146 | 2,796,569 | ||||||||
| Executive VP, General Counsel and Corporate Secretary | 2019 | 611,316 | — | 435,303 | 1,305,921 | 458,624 | 5,014 | 94,088 | 2,910,266 | ||||||||
| 2018 | 590,240 | 31,926 | 435,281 | 1,305,925 | 488,457 | 3,511 | 77,436 | 2,932,776 | |||||||||
| James Lyski | 2020 | 539,265 | — | 120,509 | 1,084,923 | 513,037 | — | 85,236 | 2,342,970 | ||||||||
| Executive VP, Chief Marketing Officer | 2019 | 514,846 | — | 361,620 | 1,084,918 | 386,250 | — | 68,195 | 2,415,829 | ||||||||
| Name | Personal Use of Company Plane(a) ($) | Personal Use of Company Automobile(b) ($) | Retirement Savings Plan Contribution(c) ($) | Deferred Compensation Account Contributions(d) ($) | Other(e) ($) | Total ($) | |||||||||||||||||||||||||||||
| William D. Nash | 133,686 | — | 18,847 | 265,764 | 22,717 | 441,014 | |||||||||||||||||||||||||||||
| Enrique N. Mayor-Mora | — | 4,381 | 19,067 | 81,762 | 15,011 | 120,221 | |||||||||||||||||||||||||||||
| James Lyski | — | — | 18,663 | 78,896 | 10,050 | 107,609 | |||||||||||||||||||||||||||||
| Shamim Mohammad | — | 11,134 | 17,831 | 70,311 | 10,909 | 110,185 | |||||||||||||||||||||||||||||
| Diane L. Cafritz | — | 347 | 19,338 | 54,414 | 15,217 | 89,316 | |||||||||||||||||||||||||||||
| Name | Personal Use of Company Plane(a) ($) | Personal Use of Company Automobile(b) ($) | Retirement Savings Plan Contribution(c) ($) | Deferred Compensation Account Contributions(d) ($) | Other(e) ($) | Total ($) | |||||
| William D. Nash | 74,123 | — | 19,622 | 143,973 | 24,893 | 262,611 | |||||
| Enrique N. Mayor-Mora | — | — | 19,182 | 16,568 | 20,740 | 56,490 | |||||
| Thomas W. Reedy | 12,160 | — | 23,037 | 82,989 | 25,054 | 143,240 | |||||
| Edwin J. Hill | 24,935 | 7,426 | 24,419 | 77,431 | 15,181 | 149,392 | |||||
| Eric M. Margolin | — | 2,542 | 18,423 | 48,127 | 35,054 | 104,146 | |||||
| James Lyski | — | 29 | 18,286 | 38,285 | 28,636 | 85,236 | |||||
Estimated Possible Payouts Under Non-Equity Incentive Plan Awards (a) | Estimated Future Payouts Under Equity Incentive Plan Awards (b) | All Other Option Awards: Number of Securities Underlying Options(c) (#) | Exercise or Base Price of Option Awards(d) ($/Sh) | Grant Date Fair Value of Stock and Option Awards(e) ($) | |||||||||||||||||||||||||||||||||||||||||||
| Name | Approval Date | Grant Date | Threshold ($) | Target ($) | Maximum ($) | Threshold (#) | Target (#) | Maximum (#) | |||||||||||||||||||||||||||||||||||||||
| William D. Nash | 107,780 | 2,155,608 | 4,311,216 | ||||||||||||||||||||||||||||||||||||||||||||
| 3/25/2021 | 5/3/2021 | 1,217 | 4,868 | 9,736 | 474,484 | ||||||||||||||||||||||||||||||||||||||||||
| 3/28/2022 | 5/2/2022 | 2,286 | 9,143 | 18,286 | 891,168 | ||||||||||||||||||||||||||||||||||||||||||
| 3/28/2022 | 5/2/2022 | 225,090 | 91.14 | 7,499,999 | |||||||||||||||||||||||||||||||||||||||||||
| Enrique N. Mayor-Mora | 31,091 | 621,820 | 1,243,640 | ||||||||||||||||||||||||||||||||||||||||||||
| 3/25/2021 | 5/3/2021 | 198 | 791 | 1,582 | 77,099 | ||||||||||||||||||||||||||||||||||||||||||
| 3/28/2022 | 5/2/2022 | 331 | 1,322 | 2,644 | 128,855 | ||||||||||||||||||||||||||||||||||||||||||
| 3/28/2022 | 5/2/2022 | 32,561 | 91.14 | 1,084,933 | |||||||||||||||||||||||||||||||||||||||||||
| James Lyski | 28,114 | 562,275 | 1,124,550 | ||||||||||||||||||||||||||||||||||||||||||||
| 3/25/2021 | 5/3/2021 | 265 | 1,060 | 2,120 | 103,318 | ||||||||||||||||||||||||||||||||||||||||||
| 3/28/2022 | 5/2/2022 | 398 | 1,592 | 3,184 | 155,172 | ||||||||||||||||||||||||||||||||||||||||||
| 3/28/2022 | 5/2/2022 | 39,193 | 91.14 | 1,305,911 | |||||||||||||||||||||||||||||||||||||||||||
| Shamim Mohammed | 25,075 | 501,500 | 1,003,000 | ||||||||||||||||||||||||||||||||||||||||||||
| 3/25/2021 | 5/3/2021 | 220 | 880 | 1,760 | 85,774 | ||||||||||||||||||||||||||||||||||||||||||
| 3/28/2022 | 5/2/2022 | 331 | 1,322 | 2,644 | 128,855 | ||||||||||||||||||||||||||||||||||||||||||
| 3/28/2022 | 5/2/2022 | 32,561 | 91.14 | 1,084,933 | |||||||||||||||||||||||||||||||||||||||||||
| Diane L. Cafritz | 25,075 | 501,500 | 1,003,000 | ||||||||||||||||||||||||||||||||||||||||||||
| 4/27/2021 | 5/3/2021 | 198 | 791 | 1,582 | 77,099 | ||||||||||||||||||||||||||||||||||||||||||
| 3/28/2022 | 5/2/2022 | 331 | 1,322 | 2,644 | 128,855 | ||||||||||||||||||||||||||||||||||||||||||
| 3/28/2022 | 5/2/2022 | 32,561 | 91.14 | 1,084,933 | |||||||||||||||||||||||||||||||||||||||||||
Estimated Possible Payouts Under Non-Equity Incentive Plan Awards (a) | Estimated Future Payouts Under Equity Incentive Plan Awards (b) | All Other Option Awards: Number of Securities Underlying Options(c) (#) | Exercise or Base Price of Option Awards(d)($/Sh) | Grant Date Closing Price ($/Sh) | Grant Date Fair Value of Stock and Option Awards(e) ($) | |||||||||||
| Name | Approval Date | Grant Date | Threshold ($) | Target ($) | Maximum ($) | Threshold (#) | Target (#) | Maximum (#) | ||||||||
| William D. Nash | 410,767 | 1,643,069 | 3,286,137 | |||||||||||||
| 3/25/2019 | 5/1/2019 | 1,855 | 7,420 | 14,840 | 583,286 | |||||||||||
| 3/25/2019 | 5/1/2019 | 237,772 | 78.61 | 78.35 | 5,250,006 | |||||||||||
| Enrique N. Mayor-Mora | 53,878 | 215,510 | 431,020 | |||||||||||||
| 3/25/2019 | 5/1/2019 | — | 1,536 | 3,072 | 151,188 | |||||||||||
| 3/25/2019 | 5/1/2019 | 20,540 | 78.61 | 78.35 | 453,523 | |||||||||||
| 10/22/2019 | 12/26/2019 | — | 447 | 894 | 49,085 | |||||||||||
| 10/22/2019 | 12/26/2019 | 6,178 | 88.54 | 89.03 | 147,222 | |||||||||||
| Thomas W. Reedy | 143,769 | 575,075 | 1,150,149 | |||||||||||||
| 3/25/2019 | 5/1/2019 | 568 | 2,270 | 4,540 | 178,445 | |||||||||||
| 3/25/2019 | 5/1/2019 | 72,732 | 78.61 | 78.35 | 1,605,923 | |||||||||||
| Edwin J. Hill | 137,813 | 551,250 | 1,102,500 | |||||||||||||
| 3/25/2019 | 5/1/2019 | 568 | 2,270 | 4,540 | 178,445 | |||||||||||
| 3/25/2019 | 5/1/2019 | 72,732 | 78.61 | 78.35 | 1,605,923 | |||||||||||
| Eric M. Margolin | 118,096 | 472,383 | 944,766 | |||||||||||||
| 3/25/2019 | 5/1/2019 | — | 462 | 1,846 | 3,692 | 145,114 | ||||||||||
| 3/25/2019 | 5/1/2019 | 59,145 | 78.61 | 78.35 | 1,305,922 | |||||||||||
| James Lyski | 101,391 | 405,563 | 811,125 | |||||||||||||
| 3/25/2019 | 5/1/2019 | 383 | 1,533 | 3,066 | 120,509 | |||||||||||
| 3/25/2019 | 5/1/2019 | 49,136 | 78.61 | 78.35 | 1,084,923 | |||||||||||
Option Awards (a) | Stock Awards (b)(c) | ||||||||||||||||||||||||||||||||||||||||||||||||||||
| Name | Grant Date | Number of Securities Underlying Unexercised Options (#) Exercisable | Number of Securities Underlying Unexercised Options (#) Unexercisable | Option Exercise Price ($/Sh) | Option Expiration Date | Number of Shares or Units of Stock That Have Not Vested (#) | Market Value of Shares or Units of Stock That Have Not Vested ($) | Equity Incentive Plan Awards: Number of Unearned Shares, Units or Other Rights That Have Not Vested (#) | Equity Incentive Plan Awards: Market or Payout Value of Unearned Shares, Units or Other Rights That Have Not Vested ($) | ||||||||||||||||||||||||||||||||||||||||||||
| William D. | 9/26/2016 | 40,646 | — | 53.62 | 9/26/2023 | ||||||||||||||||||||||||||||||||||||||||||||||||
| Nash | 5/1/2017 | 232,775 | — | 58.38 | 5/1/2024 | ||||||||||||||||||||||||||||||||||||||||||||||||
| 5/1/2018 | 240,513 | — | 63.04 | 5/1/2025 | |||||||||||||||||||||||||||||||||||||||||||||||||
| 5/1/2019 | 178,329 | 59,443 | 78.61 | 5/1/2026 | |||||||||||||||||||||||||||||||||||||||||||||||||
| 5/1/2020 | 116,100 | 116,098 | 71.07 | 5/1/2027 | |||||||||||||||||||||||||||||||||||||||||||||||||
| 5/1/2020 | 18,258 | 1,260,532 | |||||||||||||||||||||||||||||||||||||||||||||||||||
| 5/3/2021 | 35,436 | 106,307 | 136.94 | 5/3/2028 | |||||||||||||||||||||||||||||||||||||||||||||||||
| 5/3/2021 | 9,931 | 685,636 | 4,869 | 336,156 | |||||||||||||||||||||||||||||||||||||||||||||||||
| 5/2/2022 | — | 225,090 | 91.14 | 5/2/2029 | |||||||||||||||||||||||||||||||||||||||||||||||||
| 5/2/2022 | 366 | 25,269 | 18,287 | 1,262,534 | |||||||||||||||||||||||||||||||||||||||||||||||||
| Enrique N. | 5/1/2018 | 16,150 | — | 63.04 | 5/1/2025 | ||||||||||||||||||||||||||||||||||||||||||||||||
| Mayor-Mora | 5/1/2019 | 15,405 | 5,135 | 78.61 | 5/1/2026 | ||||||||||||||||||||||||||||||||||||||||||||||||
| 12/26/2019 | 4,634 | 1,544 | 88.54 | 12/26/2026 | |||||||||||||||||||||||||||||||||||||||||||||||||
| 5/1/2020 | 19,796 | 19,796 | 71.07 | 5/1/2027 | |||||||||||||||||||||||||||||||||||||||||||||||||
| 5/1/2020 | 3,113 | 214,922 | |||||||||||||||||||||||||||||||||||||||||||||||||||
| 12/28/2020 | 1,330 | 1,328 | 91.00 | 12/28/2027 | |||||||||||||||||||||||||||||||||||||||||||||||||
| 12/28/2020 | 219 | 15,120 | |||||||||||||||||||||||||||||||||||||||||||||||||||
| 5/3/2021 | 5,759 | 17,274 | 136.94 | 5/3/2028 | |||||||||||||||||||||||||||||||||||||||||||||||||
| 5/3/2021 | 1,614 | 111,431 | 791 | 54,611 | |||||||||||||||||||||||||||||||||||||||||||||||||
| 5/2/2022 | — | 32,561 | 91.14 | 5/2/2029 | |||||||||||||||||||||||||||||||||||||||||||||||||
| 5/2/2022 | 53 | 3,659 | 2,646 | 182,680 | |||||||||||||||||||||||||||||||||||||||||||||||||
| James Lyski | 5/1/2017 | 67,345 | — | 58.38 | 5/1/2024 | ||||||||||||||||||||||||||||||||||||||||||||||||
| 5/1/2018 | 57,986 | — | 63.04 | 5/1/2025 | |||||||||||||||||||||||||||||||||||||||||||||||||
| 5/1/2019 | 36,852 | 12,284 | 78.61 | 5/1/2026 | |||||||||||||||||||||||||||||||||||||||||||||||||
| 5/1/2020 | 23,992 | 23,992 | 71.07 | 5/1/2027 | |||||||||||||||||||||||||||||||||||||||||||||||||
| 5/1/2020 | 3,773 | 260,488 | |||||||||||||||||||||||||||||||||||||||||||||||||||
| 5/3/2021 | 7,713 | 23,138 | 136.94 | 5/3/2028 | |||||||||||||||||||||||||||||||||||||||||||||||||
| 5/3/2021 | 2,160 | 149,126 | 1,060 | 73,182 | |||||||||||||||||||||||||||||||||||||||||||||||||
| 5/2/2022 | — | 39,193 | 91.14 | 5/2/2029 | |||||||||||||||||||||||||||||||||||||||||||||||||
| 5/2/2022 | 64 | 4,419 | 3,184 | 219,823 | |||||||||||||||||||||||||||||||||||||||||||||||||
| Shamim | 5/1/2017 | 27,782 | — | 58.38 | 5/1/2024 | ||||||||||||||||||||||||||||||||||||||||||||||||
| Mohammad | 5/1/2018 | 47,845 | — | 63.04 | 5/1/2025 | ||||||||||||||||||||||||||||||||||||||||||||||||
Option Awards (a) | Stock Awards (b)(c) | |||||||||||||||||
| Name | Grant Date | Number of Securities Underlying Unexercised Options (#) Exercisable | Number of Securities Underlying Unexercised Options (#) Unexercisable | Option Exercise Price ($/Sh) | Option Expiration Date | Equity Incentive Plan Awards: Number of Unearned Shares, Units or Other Rights That Have Not Vested (#) | Equity Incentive Plan Awards: Market or Payout Value of Unearned Shares, Units or Other Rights That Have Not Vested ($) | |||||||||||
| William D. | 4/12/2016 | 19,006 | 39,668 | 51.63 | 4/12/2023 | |||||||||||||
| Nash | 9/26/2016 | 105,485 | 35,161 | 53.62 | 9/26/2023 | |||||||||||||
| 5/1/2017 | 116,388 | 116,387 | 58.38 | 5/1/2024 | ||||||||||||||
| 5/1/2017 | 21,411 | 3,738,789 | ||||||||||||||||
| 5/1/2018 | 60,129 | 180,384 | 63.04 | 5/1/2025 | ||||||||||||||
| 5/1/2018 | 18,322 | 2,215,566 | ||||||||||||||||
| 5/1/2019 | — | 237,772 | 78.61 | 5/1/2026 | ||||||||||||||
| 5/1/2019 | 22,262 | 2,591,535 | ||||||||||||||||
| Enrique N. | 4/8/2015 | 19,203 | — | 73.76 | 4/8/2022 | |||||||||||||
| Mayor-Mora | 4/12/2016 | 14,598 | 7,299 | 51.63 | 4/12/2023 | |||||||||||||
| 5/1/2017 | 13,268 | 13,267 | 58.38 | 5/1/2024 | ||||||||||||||
| 5/1/2017 | 1,937 | 252,926 | ||||||||||||||||
| 5/1/2018 | 5,884 | 17,649 | 63.04 | 5/1/2025 | ||||||||||||||
| 5/1/2018 | 1,793 | 216,816 | ||||||||||||||||
| 5/1/2019 | — | 20,540 | 78.61 | 5/1/2026 | ||||||||||||||
| 5/1/2019 | 1,536 | 148,950 | ||||||||||||||||
| 12/26/2019 | — | 6,178 | 88.54 | 12/26/2026 | ||||||||||||||
| 12/26/2019 | 447 | 38,485 | ||||||||||||||||
| Thomas W. | 4/8/2015 | 70,641 | — | 73.76 | 4/8/2022 | |||||||||||||
| Reedy | 4/12/2016 | 6 | 25,668 | 51.63 | 4/12/2023 | |||||||||||||
| 5/1/2017 | — | 45,186 | 58.38 | 5/1/2024 | ||||||||||||||
| 5/1/2017 | 8,313 | 1,451,616 | ||||||||||||||||
| 5/1/2018 | 19,454 | 58,361 | 63.04 | 5/1/2025 | ||||||||||||||
| 5/1/2018 | 5,928 | 716,836 | ||||||||||||||||
| 5/1/2019 | — | 72,732 | 78.61 | 5/1/2026 | ||||||||||||||
| 5/1/2019 | 6,810 | 792,775 | ||||||||||||||||
| Edwin J. | 4/8/2015 | 52,532 | — | 73.76 | 4/8/2022 | |||||||||||||
| Hill | 4/12/2016 | 69,072 | 23,024 | 51.63 | 4/12/2023 | |||||||||||||
| 5/1/2017 | 40,532 | 40,531 | 58.38 | 5/1/2024 | ||||||||||||||
| 5/1/2017 | 7,456 | 1,301,967 | ||||||||||||||||
| 5/1/2018 | 19,454 | 58,361 | 63.04 | 5/1/2025 | ||||||||||||||
| 5/1/2019 | 30,407 | 10,135 | 78.61 | 5/1/2026 | |||||||||||||||||||||||||||||||||||||||||||||||||
| 5/1/2020 | 19,796 | 19,796 | 71.07 | 5/1/2027 | |||||||||||||||||||||||||||||||||||||||||||||||||
| 5/1/2020 | 3,113 | 214,922 | |||||||||||||||||||||||||||||||||||||||||||||||||||
| 5/3/2021 | 6,408 | 19,222 | 136.94 | 5/3/2028 | |||||||||||||||||||||||||||||||||||||||||||||||||
| 5/3/2021 | 1,795 | 123,927 | 881 | 60,824 | |||||||||||||||||||||||||||||||||||||||||||||||||
| 5/2/2022 | — | 32,561 | 91.14 | 5/2/2029 | |||||||||||||||||||||||||||||||||||||||||||||||||
| 5/2/2022 | 53 | 3,659 | 2,646 | 182,680 | |||||||||||||||||||||||||||||||||||||||||||||||||
| Diane L. | 5/1/2018 | 40,086 | — | 63.04 | 5/1/2025 | ||||||||||||||||||||||||||||||||||||||||||||||||
| Cafritz | 5/1/2019 | 25,476 | 8,491 | 78.61 | 5/1/2026 | ||||||||||||||||||||||||||||||||||||||||||||||||
| 5/1/2020 | 16,586 | 16,585 | 71.07 | 5/1/2027 | |||||||||||||||||||||||||||||||||||||||||||||||||
| 5/1/2020 | 2,608 | 180,056 | |||||||||||||||||||||||||||||||||||||||||||||||||||
| 5/3/2021 | 5,759 | 17,274 | 136.94 | 5/3/2028 | |||||||||||||||||||||||||||||||||||||||||||||||||
| 5/3/2021 | 1,614 | 111,431 | 791 | 54,611 | |||||||||||||||||||||||||||||||||||||||||||||||||
| 5/2/2022 | — | 32,561 | 91.14 | 5/2/2029 | |||||||||||||||||||||||||||||||||||||||||||||||||
| 5/2/2022 | 53 | 3,659 | 2,646 | 182,680 | |||||||||||||||||||||||||||||||||||||||||||||||||
| 5/1/2018 | 5,928 | 716,836 | ||||||||||||||||
| 5/1/2019 | — | 72,732 | 78.61 | 5/1/2026 | ||||||||||||||
| 5/1/2019 | 6,810 | 792,775 | ||||||||||||||||
| Eric M. | 4/8/2015 | 52,532 | — | 73.76 | 4/8/2022 | |||||||||||||
| Margolin | 4/12/2016 | — | 19,088 | 51.63 | 4/12/2023 | |||||||||||||
| 4/27/2016 | — | 4,899 | 55.19 | 4/27/2023 | ||||||||||||||
| 5/1/2017 | 40,532 | 40,531 | 58.38 | 5/1/2024 | ||||||||||||||
| 5/1/2017 | 7,456 | 1,301,967 | ||||||||||||||||
| 5/1/2018 | 17,450 | 52,348 | 63.04 | 5/1/2025 | ||||||||||||||
| 5/1/2018 | 5,317 | 642,952 | ||||||||||||||||
| 5/1/2019 | — | 59,145 | 78.61 | 5/1/2026 | ||||||||||||||
| 5/1/2019 | 5,538 | 644,697 | ||||||||||||||||
| James | 9/26/2014 | 29,801 | — | 47.47 | 9/26/2021 | |||||||||||||
| Lyski | 4/8/2015 | 43,434 | — | 73.76 | 4/8/2022 | |||||||||||||
| 4/12/2016 | 47,347 | 15,782 | 51.63 | 4/12/2023 | ||||||||||||||
| 5/1/2017 | 33,673 | 33,672 | 58.38 | 5/1/2024 | ||||||||||||||
| 5/1/2017 | 6,195 | 1,081,771 | ||||||||||||||||
| 5/1/2018 | 14,497 | 43,489 | 63.04 | 5/1/2025 | ||||||||||||||
| 5/1/2018 | 4,417 | 534,120 | ||||||||||||||||
| 5/1/2019 | — | 49,136 | 78.61 | 5/1/2026 | ||||||||||||||
| 5/1/2019 | 4,600 | 535,472 | ||||||||||||||||
| Option Awards | Stock Awards | ||||||||||||||||||||||
| Name | Number of Shares Acquired on Exercise(a) (#) | Value Realized on Exercise(b) ($) | Number of Shares Acquired on Vesting(c) (#) | Value Realized on Vesting(d) ($) | |||||||||||||||||||
| William D. Nash | — | — | 30,944 | 2,654,376 | |||||||||||||||||||
| Enrique N. Mayor-Mora | — | — | 2,236 | 183,324 | |||||||||||||||||||
| James Lyski | — | — | 6,395 | 548,563 | |||||||||||||||||||
| Shamim Mohammad | — | — | 5,277 | 452,661 | |||||||||||||||||||
| Diane L. Cafritz | 30,555 | 1,099,685 | 4,420 | 379,148 | |||||||||||||||||||
| Option Awards | Stock Awards | ||||||
| Name | Number of Shares Acquired on Exercise(a) (#) | Value Realized on Exercise(b) ($) | Number of Shares Acquired on Vesting(c) (#) | Value Realized on Vesting(d) ($) | |||
| William D. Nash | 269,499 | 9,644,789 | 5,375 | 400,868 | |||
| Enrique N. Mayor-Mora | 36,245 | 1,382,614 | 2,680 | 199,874 | |||
| Thomas W. Reedy | 122,188 | 4,152,069 | 3,478 | 259,389 | |||
| Edwin J. Hill | 81,959 | 3,211,154 | 3,119 | 232,615 | |||
| Eric M. Margolin | 71,963 | 2,225,381 | 2,586 | 192,864 | |||
| James Lyski | — | — | 2,138 | 159,452 | |||
| Name | Plan Name | Number of Years Credited Service (a) (#) | Present Value of Accumulated Benefit (b) ($) | Payments During Last Fiscal Year ($) | |||||||||||||||||||
| William D. Nash | Pension Plan | 15 | 260,188 | — | |||||||||||||||||||
| Benefit Restoration Plan | 15 | 48,164 | — | ||||||||||||||||||||
| Enrique N. Mayor-Mora | Pension Plan | — | — | — | |||||||||||||||||||
| Benefit Restoration Plan | — | — | — | ||||||||||||||||||||
| James Lyski | Pension Plan | — | — | — | |||||||||||||||||||
| Benefit Restoration Plan | — | — | — | ||||||||||||||||||||
| Shamim Mohammad | Pension Plan | — | — | — | |||||||||||||||||||
| Benefit Restoration Plan | — | — | — | ||||||||||||||||||||
| Diane L. Cafritz | Pension Plan | 6 | 84,877 | — | |||||||||||||||||||
| Benefit Restoration Plan | 6 | 59 | — | ||||||||||||||||||||
| Name | Plan Name | Number of Years Credited Service (a) (#) | Present Value of Accumulated Benefit (b) ($) | Payments During Last Fiscal Year ($) | |||
| William D. Nash | Pension Plan | 15 | 387,459 | — | |||
| Benefit Restoration Plan | 15 | 71,723 | — | ||||
| Enrique N. Mayor-Mora | Pension Plan | — | — | — | |||
| Benefit Restoration Plan | — | — | — | ||||
| Thomas W. Reedy | Pension Plan | 6 | 188,555 | — | |||
| Benefit Restoration Plan | 6 | 235,943 | — | ||||
| Edwin J. Hill | Pension Plan | 14 | 503,298 | — | |||
| Benefit Restoration Plan | 14 | 370,785 | — | ||||
| Eric M. Margolin | Pension Plan | 1 | 51,719 | — | |||
| Benefit Restoration Plan | 1 | 31,670 | — | ||||
| James Lyski | Pension Plan | — | — | — | |||
| Benefit Restoration Plan | — | — | — | ||||
| Name | Plan Name | Executive Contributions in Last Fiscal Year (a)($) | Registrant Contributions in Last Fiscal Year (b)($) | Aggregate Earnings in Last Fiscal Year (c)($) | Aggregate Withdrawals/ Distributions ($) | Aggregate Balance at Last Fiscal Year End (d) ($) | |||||||||||||||||||||||||||||
| William D. Nash | RRP | 265,764 | 265,764 | (80,583) | — | 2,770,455 | |||||||||||||||||||||||||||||
| EDCP | — | — | (57,860) | — | 908,509 | ||||||||||||||||||||||||||||||
| Enrique N. Mayor-Mora | RRP | 81,762 | 81,762 | (44,961) | — | 603,359 | |||||||||||||||||||||||||||||
| EDCP | — | — | — | — | — | ||||||||||||||||||||||||||||||
| James Lyski | RRP | 64,374 | 64,374 | (34,821) | — | 682,406 | |||||||||||||||||||||||||||||
| EDCP | 242,032 | 14,522 | (44,456) | — | 853,177 | ||||||||||||||||||||||||||||||
| Shamim Mohammad | RRP | 46,644 | 39,981 | (46,894) | — | 547,364 | |||||||||||||||||||||||||||||
| EDCP | 505,494 | 30,330 | (24,525) | — | 1,190,766 | ||||||||||||||||||||||||||||||
| Diane L. Cafritz | RRP | 54,414 | 54,414 | (36,472) | — | 489,598 | |||||||||||||||||||||||||||||
| EDCP | — | — | — | — | — | ||||||||||||||||||||||||||||||
| Name | Plan Name | Executive Contributions in Last Fiscal Year (a)($) | Registrant Contributions in Last Fiscal Year (b)($) | Aggregate Earnings in Last Fiscal Year (c)($) | Aggregate Withdrawals/ Distributions ($) | Aggregate Balance at Last Fiscal Year End (d) ($) | |||||
| William D. Nash | RRP | 143,973 | 143,973 | 61,747 | — | 1,218,103 | |||||
| EDCP | — | — | 45,438 | — | 778,346 | ||||||
| Enrique N. Mayor-Mora | RRP | 16,569 | 16,568 | 13,435 | — | 238,918 | |||||
| EDCP | — | — | — | — | — | ||||||
| Thomas W. Reedy | RRP | 62,242 | 82,989 | 74,874 | — | 1,158,561 | |||||
| EDCP | — | — | 13,346 | 71,454 | 183,132 | ||||||
| Edwin J. Hill | RRP | 45,473 | 60,631 | 31,238 | — | 706,877 | |||||
| EDCP | 210,000 | 16,800 | 77,865 | — | 1,097,950 | ||||||
| Eric M. Margolin | RRP | 56,148 | 48,127 | 31,209 | — | 788,507 | |||||
| EDCP | — | — | 84,355 | — | 1,303,957 | ||||||
| James Lyski | RRP | 32,492 | 32,491 | 17,016 | — | 266,609 | |||||
| EDCP | 96,563 | 5,794 | 12,452 | — | 299,462 | ||||||
| Category | Specific Event | Requirements | ||||||
| Retirement | Early Retirement | Termination due to early retirement occurs when | ||||||
| Normal Retirement | Termination due to normal retirement occurs when | |||||||
| Death or Disability | Death | The effective date of termination is the date of death. | ||||||
| Disability | Termination due to disability occurs when we notify the NEO that we have decided to terminate | |||||||
| Involuntary Termination | For Cause | We will not owe any payments to | ||||||
| Without Cause | Termination by us without cause occurs when we terminate the NEO’s employment for any reason other than for cause or disability. The effective date of termination is the date of the notice from us to the NEO. | |||||||
| Voluntary Termination | For Good Reason | Termination by the NEO for good reason occurs when the NEO terminates | ||||||
| Without Good Reason | Termination by the NEO without good reason occurs when the NEO terminates | |||||||
| TYPE OF TERMINATION EVENT | TYPE OF TERMINATION EVENT | ||||||||||||||||||||||||||||||||||||||||||||||||||||||
| Name | Type of Payment | Termination Without Cause ($) | Resignation for Good Reason ($) | Early or Normal Retirement ($) | Death or Disability ($) | CIC Followed by Term. Without Cause or Resignation for Good Reason ($) | Name | Type of Payment | Termination Without Cause ($) | Resignation for Good Reason ($) | Early or Normal Retirement ($) | Death or Disability ($) | CIC Followed by Term. Without Cause or Resignation for Good Reason ($) | ||||||||||||||||||||||||||||||||||||||||||
| William D. Nash | Severance Payment(a) | 5,381,183 | 5,381,183 | — | — | — | William D. Nash | Severance Payment(a) | 9,497,940 | 9,497,940 | — | — | — | ||||||||||||||||||||||||||||||||||||||||||
Annual Incentive Bonus(b) | 2,078,482 | — | — | 1,643,069 | 1,643,069 | Annual Incentive Bonus(b) | 1,049,781 | — | — | 1,895,040 | 2,155,608 | 2,155,608 | |||||||||||||||||||||||||||||||||||||||||||
Long-Term Equity Award(c) | 3,231,048 | 3,231,048 | — | 18,442,196 | 1,984,785 | Long-Term Equity Award(c) | 1,512,528 | 1,512,528 | 4,162,629 | 1,512,528 | |||||||||||||||||||||||||||||||||||||||||||||
| Other Payments: | Good Reason(d) | — | 1,643,069 | — | — | — | Other Payments: | Good Reason(d) | — | 2,155,608 | — | — | — | ||||||||||||||||||||||||||||||||||||||||||
CIC(e) | — | — | — | — | 9,489,843 | CIC(e) | — | — | — | — | 14,199,420 | ||||||||||||||||||||||||||||||||||||||||||||
| Other Benefits: | Health(f) | 17,849 | 17,849 | — | — | 17,849 | Other Benefits: | Health(f) | 21,788 | 21,788 | — | — | 21,788 | ||||||||||||||||||||||||||||||||||||||||||
Financial Services(g) | 14,400 | 14,400 | — | 14,400 | 14,400 | Financial Services(g) | 15,710 | 15,710 | — | 15,710 | 15,710 | ||||||||||||||||||||||||||||||||||||||||||||
Outplacement(h) | 50,000 | 50,000 | — | — | 50,000 | Outplacement(h) | 50,000 | 50,000 | — | — | 50,000 | ||||||||||||||||||||||||||||||||||||||||||||
| TOTAL | 10,772,962 | 10,337,549 | — | 20,099,665 | 13,199,946 | TOTAL | 12,147,747 | 13,253,574 | 6,333,947 | 17,955,054 | |||||||||||||||||||||||||||||||||||||||||||||
| Enrique N. Mayor-Mora | Severance Payment(a) | 750,000 | — | — | — | — | Enrique N. Mayor-Mora | Severance Payment(a) | 1,097,330 | — | — | — | — | ||||||||||||||||||||||||||||||||||||||||||
Annual Incentive Bonus(b) | — | — | — | — | — | Annual Incentive Bonus(b) | — | — | — | — | — | ||||||||||||||||||||||||||||||||||||||||||||
Long-Term Equity Award(c) | 240,889 | 240,889 | — | 1,908,460 | 240,889 | Long-Term Equity Award(c) | 262,582 | 262,582 | — | 667,824 | 262,582 | ||||||||||||||||||||||||||||||||||||||||||||
| Other Payments: | Good Reason(d) | — | — | — | — | — | Other Payments: | Good Reason(d) | — | — | — | — | — | ||||||||||||||||||||||||||||||||||||||||||
CIC(e) | — | — | — | — | 750,000 | CIC(e) | — | — | — | — | 1,097,330 | ||||||||||||||||||||||||||||||||||||||||||||
| Other Benefits: | Health(f) | — | — | — | — | — | Other Benefits: | Health(f) | — | — | — | — | — | ||||||||||||||||||||||||||||||||||||||||||
Financial Services(g) | 14,400 | 14,400 | — | 14,400 | 14,400 | Financial Services(g) | 15,710 | 15,710 | — | 15,710 | 15,710 | ||||||||||||||||||||||||||||||||||||||||||||
Outplacement(h) | — | — | — | — | — | Outplacement(h) | — | — | — | — | — | ||||||||||||||||||||||||||||||||||||||||||||
| TOTAL | 1,005,289 | 255,289 | — | 1,922,860 | 1,005,289 | TOTAL | 1,375,622 | 278,292 | — | 683,534 | 1,375,622 | ||||||||||||||||||||||||||||||||||||||||||||
| Thomas W. Reedy | Severance Payment(a) | 2,650,182 | 2,650,182 | — | — | — | |||||||||||||||||||||||||||||||||||||||||||||||||
Annual Incentive Bonus(b) | 727,469 | — | 727,469 | 575,075 | 575,075 | ||||||||||||||||||||||||||||||||||||||||||||||||||
Long-Term Equity Award(c) | 5,478,945 | 5,478,945 | 7,233,482 | 6,309,480 | 4,995,073 | ||||||||||||||||||||||||||||||||||||||||||||||||||
| Other Payments: | Good Reason(d) | — | 575,075 | — | — | — | |||||||||||||||||||||||||||||||||||||||||||||||||
CIC(e) | — | — | — | — | 4,467,763 | ||||||||||||||||||||||||||||||||||||||||||||||||||
| Other Benefits: | Health(f) | 16,043 | 16,043 | — | — | 16,043 | |||||||||||||||||||||||||||||||||||||||||||||||||
Financial Services(g) | 14,400 | 14,400 | 14,400 | 14,400 | 14,400 | ||||||||||||||||||||||||||||||||||||||||||||||||||
Outplacement(h) | 25,000 | 25,000 | — | — | 25,000 | ||||||||||||||||||||||||||||||||||||||||||||||||||
| TOTAL | 8,912,039 | 8,759,645 | 7,975,351 | 6,898,955 | 10,093,354 | ||||||||||||||||||||||||||||||||||||||||||||||||||
| James Lyski | James Lyski | Severance Payment(a) | 992,250 | — | — | — | — | ||||||||||||||||||||||||||||||||||||||||||||||||
Annual Incentive Bonus(b) | — | — | — | — | — | ||||||||||||||||||||||||||||||||||||||||||||||||||
Long-Term Equity Award(c) | 319,886 | 319,886 | 809,701 | 319,886 | |||||||||||||||||||||||||||||||||||||||||||||||||||
| Other Payments: | Good Reason(d) | — | — | — | — | — | |||||||||||||||||||||||||||||||||||||||||||||||||
CIC(e) | — | — | — | — | 992,250 | ||||||||||||||||||||||||||||||||||||||||||||||||||
| Other Benefits: | Health(f) | — | — | — | — | — | |||||||||||||||||||||||||||||||||||||||||||||||||
Financial Services(g) | 15,710 | 15,710 | — | 15,710 | 15,710 | ||||||||||||||||||||||||||||||||||||||||||||||||||
Outplacement(h) | — | — | — | — | — | ||||||||||||||||||||||||||||||||||||||||||||||||||
| TOTAL | 1,327,846 | 335,596 | 825,411 | 1,327,846 | |||||||||||||||||||||||||||||||||||||||||||||||||||
| TYPE OF TERMINATION EVENT | TYPE OF TERMINATION EVENT | ||||||||||||||||||||||||||||||||||||||||||||||||||||||
Name | Type of Payment | Termination Without Cause ($) | Resignation for Good Reason ($) | Early or Normal Retirement ($) | Death or Disability ($) | CIC Followed by Term. Without Cause or Resignation for Good Reason ($) | Name | Type of Payment | Termination Without Cause ($) | Resignation for Good Reason ($) | Early or Normal Retirement ($) | Death or Disability ($) | CIC Followed by Term. Without Cause or Resignation for Good Reason ($) | ||||||||||||||||||||||||||||||||||||||||||
| Edwin J. Hill | Severance Payment(a) | 2,520,000 | 2,520,000 | — | — | — | |||||||||||||||||||||||||||||||||||||||||||||||||
Annual Incentive Bonus(b) | 697,331 | — | 697,331 | 551,250 | 551,250 | ||||||||||||||||||||||||||||||||||||||||||||||||||
Long-Term Equity Award(c) | 5,150,171 | 5,150,171 | 6,854,826 | 6,005,649 | 4,716,182 | ||||||||||||||||||||||||||||||||||||||||||||||||||
| Other Payments: | Good Reason(d) | — | 551,250 | — | — | — | |||||||||||||||||||||||||||||||||||||||||||||||||
CIC(e) | — | — | — | — | 4,282,670 | ||||||||||||||||||||||||||||||||||||||||||||||||||
| Other Benefits: | Health(f) | 16,049 | 16,049 | — | — | 16,049 | |||||||||||||||||||||||||||||||||||||||||||||||||
Financial Services(g) | 14,400 | 14,400 | 14,400 | 14,400 | 14,400 | ||||||||||||||||||||||||||||||||||||||||||||||||||
Outplacement(h) | 25,000 | 25,000 | — | — | 25,000 | ||||||||||||||||||||||||||||||||||||||||||||||||||
| TOTAL | 8,422,951 | 8,276,870 | 7,566,557 | 6,571,299 | 9,605,551 | ||||||||||||||||||||||||||||||||||||||||||||||||||
| Eric M. Margolin | Severance Payment(a) | 2,176,937 | 2,176,937 | — | — | — | |||||||||||||||||||||||||||||||||||||||||||||||||
Annual Incentive Bonus(b) | 597,564 | — | 597,564 | 472,383 | 472,383 | ||||||||||||||||||||||||||||||||||||||||||||||||||
Long-Term Equity Award(c) | 4,878,320 | 4,878,320 | 6,385,641 | 5,573,483 | 4,444,331 | ||||||||||||||||||||||||||||||||||||||||||||||||||
| Other Payments: | Good Reason(d) | — | 472,383 | — | — | — | |||||||||||||||||||||||||||||||||||||||||||||||||
CIC(e) | — | — | — | — | 3,669,951 | ||||||||||||||||||||||||||||||||||||||||||||||||||
| Other Benefits: | Health(f) | 17,849 | 17,849 | — | — | 17,849 | |||||||||||||||||||||||||||||||||||||||||||||||||
Financial Services(g) | 14,400 | 14,400 | 14,400 | 14,400 | 14,400 | ||||||||||||||||||||||||||||||||||||||||||||||||||
Outplacement(h) | 25,000 | 25,000 | — | — | 25,000 | ||||||||||||||||||||||||||||||||||||||||||||||||||
| TOTAL | 7,710,070 | 7,584,889 | 6,997,605 | 6,060,266 | 8,643,914 | ||||||||||||||||||||||||||||||||||||||||||||||||||
| James Lyski | Severance Payment(a) | 811,125 | — | — | — | — | |||||||||||||||||||||||||||||||||||||||||||||||||
Annual Incentive Bonus(b) | — | — | — | — | — | ||||||||||||||||||||||||||||||||||||||||||||||||||
Long-Term Equity Award(c) | 899,221 | 899,221 | — | 4,496,826 | 538,630 | ||||||||||||||||||||||||||||||||||||||||||||||||||
| Other Payments: | Good Reason(d) | — | — | — | — | — | |||||||||||||||||||||||||||||||||||||||||||||||||
CIC(e) | — | — | — | — | 811,125 | ||||||||||||||||||||||||||||||||||||||||||||||||||
| Other Benefits: | Health(f) | — | — | — | — | — | |||||||||||||||||||||||||||||||||||||||||||||||||
Financial Services(g) | 14,400 | 14,400 | — | 14,400 | 14,400 | ||||||||||||||||||||||||||||||||||||||||||||||||||
Outplacement(h) | — | — | — | — | — | ||||||||||||||||||||||||||||||||||||||||||||||||||
| TOTAL | 1,724,746 | 913,621 | — | 4,511,226 | 1,364,155 | ||||||||||||||||||||||||||||||||||||||||||||||||||
| Shamim Mohammad | Shamim Mohammad | Severance Payment(a) | 885,000 | — | — | — | — | ||||||||||||||||||||||||||||||||||||||||||||||||
Annual Incentive Bonus(b) | — | — | — | — | — | ||||||||||||||||||||||||||||||||||||||||||||||||||
Long-Term Equity Award(c) | 264,791 | 264,791 | 671,207 | 264,791 | |||||||||||||||||||||||||||||||||||||||||||||||||||
| Other Payments: | Good Reason(d) | — | — | — | — | — | |||||||||||||||||||||||||||||||||||||||||||||||||
CIC(e) | — | — | — | — | 885,000 | ||||||||||||||||||||||||||||||||||||||||||||||||||
| Other Benefits: | Health(f) | — | — | — | — | — | |||||||||||||||||||||||||||||||||||||||||||||||||
Financial Services(g) | 15,710 | 15,710 | — | 15,710 | 15,710 | ||||||||||||||||||||||||||||||||||||||||||||||||||
Outplacement(h) | — | — | — | — | — | ||||||||||||||||||||||||||||||||||||||||||||||||||
| TOTAL | 1,165,501 | 280,501 | — | 686,917 | 1,165,501 | ||||||||||||||||||||||||||||||||||||||||||||||||||
| Diane L. Cafritz | Diane L. Cafritz | Severance Payment(a) | 885,000 | — | — | — | — | ||||||||||||||||||||||||||||||||||||||||||||||||
Annual Incentive Bonus(b) | — | — | — | — | — | ||||||||||||||||||||||||||||||||||||||||||||||||||
Long-Term Equity Award(c) | 229,259 | 229,259 | 617,839 | 229,259 | |||||||||||||||||||||||||||||||||||||||||||||||||||
| Other Payments: | Good Reason(d) | — | — | — | — | — | |||||||||||||||||||||||||||||||||||||||||||||||||
CIC(e) | — | — | — | — | 885,000 | ||||||||||||||||||||||||||||||||||||||||||||||||||
| Other Benefits: | Health(f) | — | — | — | — | — | |||||||||||||||||||||||||||||||||||||||||||||||||
Financial Services(g) | 15,710 | 15,710 | — | 15,710 | 15,710 | ||||||||||||||||||||||||||||||||||||||||||||||||||
Outplacement(h) | — | — | — | — | — | ||||||||||||||||||||||||||||||||||||||||||||||||||
| TOTAL | 1,129,969 | 244,969 | 633,549 | 1,129,969 | |||||||||||||||||||||||||||||||||||||||||||||||||||
(a)For Mr. Nash, we calculate his severance payment using the following formula: 2 x (Base Salary + (Last Annual Bonus as determined by the Compensation and Personnel Committee)). This amount is paid in equal monthly installments over the 24-month period following the date of termination. As of February 28, 2023, the last annual bonus as determined by the Compensation and Personnel Committee was the fiscal 2022 bonus, which is set forth in the “Summary Compensation Table.” For the post-2014 group, the severance payment is equal to each NEO’s then-current bi-weekly salary amount, to be paid for and over the course of 39 bi-weekly periods. (b)The Annual Incentive Bonus is the bonus paid pursuant to our Bonus Plan. For Mr. Nash, his severance agreement provides for a bonus payment, calculated in one of two ways, in certain termination scenarios. If Mr. Nash |
| Fiscal Year | Summary Compensation Table Total for PEO(a) ($) | Compensation Actually Paid to PEO (a) (b) (c) ($) | Average Summary Compensation Table Total for Non-PEO NEOs(a) ($) | Average Compensation Actually Paid to Non-PEO NEOs(a) (b) (c) ($) | Value of Initial Fixed $100 Investment Based on: (d) | Net Income ($ Millions) | Adjusted EBIT(e) ($ Millions) | ||||||||||||||||||||||||||||||||||||||||
| Total Shareholder Return ($) | Peer Group Total Shareholder Return ($) | ||||||||||||||||||||||||||||||||||||||||||||||
| 2023 | 11,588,743 | (3,838,775) | 2,374,371 | (266,923) | 79.07 | 124.47 | 485 | 749 | |||||||||||||||||||||||||||||||||||||||
| 2022 | 13,689,123 | 11,139,628 | 3,183,175 | 3,297,303 | 125.22 | 158.40 | 1,151 | 1,584 | |||||||||||||||||||||||||||||||||||||||
| 2021 | 9,891,893 | 31,282,047 | 3,057,748 | 8,306,849 | 136.88 | 147.99 | 747 | 1,050 | |||||||||||||||||||||||||||||||||||||||
| Fiscal 2021 | Fiscal 2022 | Fiscal 2023 | ||||||
| Enrique N. Mayor-Mora | Enrique N. Mayor-Mora | Enrique N. Mayor-Mora | ||||||
| Edwin J. Hill | James Lyski | James Lyski | ||||||
| Eric M. Margolin | Shamim Mohammad | Shamim Mohammad | ||||||
| Thomas W. Reedy | Diane L. Cafritz | Diane L. Cafritz | ||||||
| Edwin J. Hill | ||||||||
| Eric M. Margolin | ||||||||
| Year | Summary Compensation Table Total for William D. Nash ($) | Exclusion of Change in Pension Value for William D. Nash ($) | Exclusion of Stock Awards and Option Awards for William D. Nash ($) | Inclusion of Equity Values for William D. Nash ($) | Compensation Actually Paid to William D. Nash ($) | ||||||||||||
| 2023 | 11,588,743 | — | (8,865,651) | (6,561,867) | (3,838,775) | ||||||||||||
| 2022 | 13,689,123 | — | (8,644,791) | 6,095,296 | 11,139,628 | ||||||||||||
| 2021 | 9,891,893 | (977) | (6,999,999) | 28,391,130 | 31,282,047 | ||||||||||||
| Fiscal Year | Average Summary Compensation Table Total for Non-PEO NEOs ($) | Average Exclusion of Change in Pension Value for Non-PEO NEOs ($) | Average Exclusion of Stock Awards and Option Awards for Non-PEO NEOs ($) | Average Inclusion of Equity Values for Non-PEO NEOs ($) | Average Compensation Actually Paid to Non-PEO NEOs ($) | ||||||||||||
| 2023 | 2,374,371 | — | (1,361,434) | (1,279,860) | (266,923) | ||||||||||||
| 2022 | 3,183,175 | (692) | (1,697,356) | 1,812,176 | 3,297,303 | ||||||||||||
| 2021 | 3,057,748 | (4,870) | (1,830,920) | 7,084,891 | 8,306,849 | ||||||||||||
| Fiscal Year | Year-End Fair Value of Equity Awards Granted During Year That Remained Unvested as of Last Day of Year for William D. Nash ($) | Change in Fair Value from Last Day of Prior Year to Last Day of Year of Unvested Equity Awards Granted in a Prior Year for William D. Nash ($) | Vesting-Date Fair Value of Equity Awards Granted During Year that Vested During Year for William D. Nash ($) | Change in Fair Value from Last Day of Prior Year to Vesting Date of Equity Awards Granted in a Prior Year that Vested During Year for William D. Nash ($) | Fair Value at Last Day of Prior Year of Equity Awards Forfeited During Year for William D. Nash ($) | Total - Inclusion of Equity Values for William D. Nash ($) | ||||||||||||||
| 2023 | 6,188,670 | (8,972,961) | — | (3,777,576) | — | (6,561,867) | ||||||||||||||
| 2022 | 6,285,491 | (3,529,135) | — | 3,338,940 | — | 6,095,296 | ||||||||||||||
| 2021 | 17,423,079 | 12,751,653 | — | (1,783,602) | — | 28,391,130 | ||||||||||||||
| Fiscal Year | Average Year-End Fair Value of Equity Awards Granted During Year That Remained Unvested as of Last Day of Year for Non-PEO NEOs ($) | Average Change in Fair Value from Last Day of Prior Year to Last Day of Year of Unvested Equity Awards Granted in a Prior Year for Non-PEO NEOs ($) | Average Vesting-Date Fair Value of Equity Awards Granted During Year that Vested During Year for Non-PEO NEOs ($) | Average Change in Fair Value from Last Day of Prior Year to Vesting Date of Equity Awards Granted in a Prior Year that Vested During Year for Non-PEO NEOs ($) | Average Fair Value at Last Day of Prior Year of Equity Awards Forfeited During Year for Non-PEO NEOs ($) | Total - Average Inclusion of Equity Values for Non-PEO NEOs ($) | ||||||||||||||
| 2023 | 950,489 | (1,549,074) | — | (681,275) | — | (1,279,860) | ||||||||||||||
| 2022 | 895,895 | (458,627) | 383,234 | 991,674 | — | 1,812,176 | ||||||||||||||
| 2021 | 3,486,985 | 2,438,705 | 1,016,899 | 142,302 | — | 7,084,891 | ||||||||||||||


| Most Important Measures for Determining PEO and Non-PEO NEO Pay | ||
| Adjusted EBIT | ||
| Pre-tax Earnings Per Share | ||
DIRECTOR COMPENSATION | ||
| Compensation Element | Director Compensation Program(a) | ||||
| Annual Cash Retainer | $ | ||||
| Annual Equity Retainer | $ | ||||
| Board Chair Fee | $ | ||||
| Lead Independent Director Fee | $50,000 | ||||
Committee Chair Fee(e) | $ $ $ $20,000 for the Technology and Innovation Committee | ||||
| Audit Committee Fee | $5,000 | ||||
| Board Meeting Fee | None | ||||
| Committee Meeting Fee | $1,500 per in-person meeting and $750 per telephonic meeting | ||||
| Name | Fees Earned or Paid in Cash(a) ($) | Stock Awards(b)(c) ($) | All Other Compensation(d) ($) | Total ($) | |||||||||||||||||||
| Peter J. Bensen | 144,000 | 184,969 | 5,000 | 333,969 | |||||||||||||||||||
| Ronald E. Blaylock | 126,000 | 184,969 | 166 | 311,135 | |||||||||||||||||||
| Sona Chawla | 124,000 | 184,969 | 500 | 309,469 | |||||||||||||||||||
| Thomas J. Folliard | 295,000 | 184,969 | 13,466 | 493,435 | |||||||||||||||||||
| Shira D. Goodman | 120,250 | 184,969 | 180 | 305,399 | |||||||||||||||||||
Robert J. Hombach(e) | 31,667 | — | — | 31,667 | |||||||||||||||||||
| David W. McCreight | 109,000 | 184,969 | — | 293,969 | |||||||||||||||||||
| Mark F. O’Neil | 111,250 | 184,969 | — | 296,219 | |||||||||||||||||||
| Pietro Satriano | 98,750 | 184,969 | — | 283,719 | |||||||||||||||||||
| Marcella Shinder | 103,250 | 184,969 | 50 | 288,269 | |||||||||||||||||||
| Mitchell D. Steenrod | 151,000 | 184,969 | 12,641 | 348,610 | |||||||||||||||||||
| Name | Fees Earned or Paid in Cash(a) ($) | Stock Awards(b)(c) ($) | All Other Compensation(d) ($) | Total ($) | |||||||
| Peter J. Bensen | 123,750 | 174,972 | 10,000 | 308,722 | |||||||
| Ronald E. Blaylock | 106,750 | 174,972 | 10,160 | 291,883 | |||||||
| Sona Chawla | 91,750 | 174,972 | — | 266,722 | |||||||
| Thomas J. Folliard | 245,000 | 174,972 | 16,407 | 436,379 | |||||||
| Shira D. Goodman | 106,000 | 174,972 | — | 280,972 | |||||||
| Robert J. Hombach | 102,000 | 174,972 | 10,000 | 286,972 | |||||||
| David W. McCreight | 102,000 | 174,972 | — | 276,972 | |||||||
Mark F. O’Neil(e) | 41,167 | 87,478 | — | 128,645 | |||||||
| Pietro Satriano | 91,000 | 174,972 | — | 265,972 | |||||||
| Marcella Shinder | 91,000 | 174,972 | — | 265,972 | |||||||
| Mitchell D. Steenrod | 137,833 | 174,972 | 10,000 | 322,806 | |||||||
William R. Tiefel(f) | 63,917 | 199,469 | 10,000 | 273,386 | |||||||
| Peter J. Bensen | 9,735 | |||||||
| Ronald E. Blaylock | 1,996 | |||||||
| Sona Chawla | 9,735 | |||||||
| Thomas J. Folliard | 9,735 | |||||||
| Shira D. Goodman | 4,017 | |||||||
| Robert J. Hombach | — | |||||||
| David W. McCreight | 9,138 | |||||||
| Mark F. O’Neil | 6,313 | |||||||
| Pietro Satriano | 8,754 | |||||||
| Marcella Shinder | 9,735 | |||||||
| Mitchell D. Steenrod | 9,735 | |||||||
| Name | Restricted Stock Units (#) | Outstanding Option Awards (#) | |
| Peter J. Bensen | 4,410 | — | |
| Ronald E. Blaylock | 2,020 | — | |
| Sona Chawla | 4,410 | — | |
| Thomas J. Folliard | 4,410 | 439,851 | |
| Shira D. Goodman | 2,020 | — | |
| Robert J. Hombach | 4,410 | — | |
| David W. McCreight | 3,813 | — | |
| Mark F. O’Neil | 988 | — | |
| Pietro Satriano | 3,429 | — | |
| Marcella Shinder | 4,410 | — | |
| Mitchell D. Steenrod | 4,410 | — | |
| William R. Tiefel | — | 2,870 | |
PROPOSAL |
Shares | ||||||||
| A. | Total shares authorized under the Stock Incentive Plan | |||||||
| B. | Total shares awarded from Stock Incentive Plan through February | |||||||
| C. | Shares added back to share reserve from Stock Incentive Plan through February | |||||||
| D. | Shares available to be granted under the Stock Incentive Plan as of February | |||||||
| E. | New shares available for grant under the Revised Stock Incentive Plan | |||||||
| F. | Total shares available for grant under Revised Stock Incentive Plan if approved (D+E) | |||||||
| G. | Shares Outstanding as of February | |||||||
| Fiscal 2023 (%) | Fiscal 2022 (%) | Fiscal 2021 (%) | Three Year Average (Fiscal 2023-2021) | |||||||||||
| Percentage of Equity-Based Awards Granted to Named Executive Officers | 18.6% | 18.41% | 17.11% | 18.04% | ||||||||||
| Dilution | 0.92% | 0.60% | 1.10% | 0.87% | ||||||||||
| Burn rate | 0.96% | 0.67% | 1.12% | 0.92% | ||||||||||
| Overhang | 8.27% | 8.09% | 8.95% | 8.44% | ||||||||||
Fiscal 2020 (%) | Fiscal 2019 (%) | Fiscal 2018 (%) | Three Year Average (Fiscal 2018-2020) | |
| Percentage of Equity-Based Awards Granted to Named Executive Officers | 23.74% | 21.64% | 21.97% | 22.45% |
| Dilution | 1.07% | 0.95% | 1.18% | 1.07% |
| Burn rate | 1.12% | 1.18% | 1.24% | 1.18% |
| Overhang | 9.58% | 8.42% | 8.63% | 8.88% |
| Name and Position | Number of Options Granted | ||||
| Named Executive Officers | |||||
William D. Nash(a) President and Chief Executive Officer | |||||
Enrique Mayor-Mora | |||||
James Lyski Executive VP and Chief Marketing Officer | |||||
Shamim Mohammad Executive VP and Chief Information and Technology Officer | 470,816 | ||||
Diane L. Cafritz Executive VP, General Counsel, Chief Compliance Officer and Chief Human Resources Officer | 361,786 | ||||
| All current executive officers as a group | |||||
| All non-employee directors as a group | 3,339,849(b) | ||||
| Director Nominees | |||||
| Peter J. Bensen | — | ||||
| Ronald E. Blaylock | — | ||||
| Sona Chawla | — | ||||
| Thomas J. Folliard | 3,339,849(b) | ||||
| Shira Goodman | — | ||||
| David W. McCreight | — | ||||
| Mark F. O’Neil | — | ||||
| Pietro Satriano | — | ||||
| Marcella Shinder | — | ||||
| Mitchell D. Steenrod | — | ||||
| All other employees, including all current officers who are not executive officers, as a group | |||||
| Plan Category | Number of Securities To Be Issued Upon Exercise of Outstanding Options, Warrants and Rights | Weighted Average Exercise Price of Outstanding Options, Warrants and Rights | Number of Securities Remaining Available for Future Issuance Under Equity Compensation Plans (Excluding Securities Reflected in the First Column) | Plan Category | Number of Securities To Be Issued Upon Exercise of Outstanding Options, Warrants and Rights | Weighted Average Exercise Price of Outstanding Options, Warrants and Rights | Number of Securities Remaining Available for Future Issuance Under Equity Compensation Plans (Excluding Securities Reflected in the First Column) | ||||||||||||||||||
| Equity compensation plans approved by security holders: | Equity compensation plans approved by security holders: | ||||||||||||||||||||||||
| Stock Incentive Plan | 6,991,381 | $64.86 | 7,972,743(a) | Stock Incentive Plan | 6,775,641 | $82.28 | 5,769,765(a) | ||||||||||||||||||
| Non-Employee Directors Stock Incentive Plan | 2,870(b) | $46.65 | –(c) | ||||||||||||||||||||||
| Employee Stock Purchase Plan | — | — | 2,628,021(d) | Employee Stock Purchase Plan | — | — | 2,014,192(b) | ||||||||||||||||||
| Equity compensation plans not approved by security holders | — | — | – | Equity compensation plans not approved by security holders | — | — | – | ||||||||||||||||||
| Total | 6,994,251 | $64.85 | 10,600,764 | Total | 6,775,641 | $82.28 | 7,783,957 | ||||||||||||||||||
CARMAX SHARE OWNERSHIP | ||
| Named Executive Officers | CarMax Shares that May Be Acquired Within 60 Days after March 31, 2023 | Shares of CarMax Common Stock Beneficially Owned as of March 31, 2023(a)(b) | Percent of Class | ||||||||||||||
William D. Nash(c) | 1,069,999 | 1,225,391 | * | ||||||||||||||
| Enrique N. Mayor-Mora | 94,904 | 108,638 | * | ||||||||||||||
| James Lyski | 239,192 | 256,289 | * | ||||||||||||||
| Shamim Mohammad | 169,718 | 176,727 | * | ||||||||||||||
| Diane L. Cafritz | 121,018 | 124,424 | * | ||||||||||||||
| Directors/Director Nominees | |||||||||||||||||
| Peter J. Bensen | 2,390 | 7,390 | * | ||||||||||||||
| Ronald E. Blaylock | — | 5,854 | * | ||||||||||||||
| Sona Chawla | 2,020 | 4,426 | * | ||||||||||||||
| Thomas J. Folliard | 9,735 | 205,260 | * | ||||||||||||||
| Shira Goodman | — | 27,747 | * | ||||||||||||||
| David W. McCreight | 1,996 | 1,996 | * | ||||||||||||||
Mark F. O’Neil(d) | 6,313 | 22,208 | * | ||||||||||||||
| Pietro Satriano | 5,325 | 5,325 | * | ||||||||||||||
| Marcella Shinder | 4,410 | 11,533 | * | ||||||||||||||
| Mitchell D. Steenrod | 4,410 | 22,144 | * | ||||||||||||||
| All directors and executive officers as a group (18 persons) | 2,119,383 | 2,619,548 | 1.66% | ||||||||||||||
| Named Executive Officers | CarMax Shares that May Be Acquired Within 60 Days after March 31, 2020 | Shares of CarMax Common Stock Beneficially Owned as of March 31, 2020(a) | Percent of Class | ||
William D. Nash(b) | 543,920 | 641,852 | * | ||
| Enrique Mayor-Mora | 79,690 | 80,022 | * | ||
| Thomas W. Reedy | 301,940 | 333,910 | * | ||
| Edwin J. Hill | 385,111 | 388,889 | * | ||
| Eric M. Margolin | 295,398 | 311,865 | * | ||
| James Lyski | 235,523 | 237,019 | * | ||
| Directors/Director Nominees | |||||
| Peter J. Bensen | 2,390 | 7,390 | * | ||
| Ronald E. Blaylock | — | 23,205 | * | ||
| Sona Chawla | 2,020 | 4,426 | * | ||
| Thomas J. Folliard | 444,261 | 649,786 | * | ||
| Shira Goodman | — | 22,869 | * | ||
| Robert J. Hombach | 4,410 | 4,437 | * | ||
| David W. McCreight | — | — | * | ||
Mark F. O’Neil(c) | 988 | 14,183 | * | ||
| Pietro Satriano | — | — | * | ||
| Marcella Shinder | 4,410 | 11,533 | * | ||
| Mitchell D. Steenrod | 4,410 | 22,144 | * | ||
| All directors and executive officers as a group (22 persons) | 2,777,788 | 3,239,681 | 1.99% | ||
| Name and Address of Beneficial Owner(s) | Number of Shares Owned | Percent of Class | |||||||||
The Vanguard Group, Inc.(a) 100 Vanguard Boulevard Malvern, PA 19355 | 17,821,225 | 11.28% | |||||||||
BlackRock, Inc.(b) 55 East 52nd Street New York, NY 10055 | 10,449,547 | 6.60% | |||||||||
Principal Global Investors, LLC(c) 801 Grand Avenue Des Moines, IA 50392 | 10,022,302 | 6.34% | |||||||||
Capital Research Global Investors(d) 333 South Hope Street 55th Floor Los Angeles, CA 90071 | 7,997,343 | 5.10% | |||||||||
| Name and Address of Beneficial Owner(s) | Number of Shares Owned | Percent of Class | |
The Vanguard Group, Inc.(a) 100 Vanguard Boulevard Malvern, PA 19355 | 18,163,924 | 11.08% | |
PRIMECAP Management Company(b) 177 E. Colorado Blvd., 11th Floor Pasadena, CA 91105 | 10,848,923 | 6.62% | |
BlackRock, Inc.(c) 55 East 52nd Street New York, NY 10055 | 10,726,869 | 6.60% | |
| Attending the Virtual Annual Meeting | |||||
| How to Attend | This year our annual shareholders meeting will be held virtually and there will be no in-person meeting location. The annual shareholders meeting is open to all holders of CarMax common stock as of April Our annual meeting will begin promptly at 1:00 p.m., Eastern Time, on June The virtual meeting is supported across different online browsers and devices (desktops, laptops, tablets and cell phones). Please be certain you have the most updated version of the applicable software and plugins. Also, you should ensure that you have a strong internet connection from wherever you intend to participate in the annual meeting. | ||||
| Submitting Questions at the Meeting | If shareholders attending the annual meeting wish to submit a question during the meeting, click on the “messages” icon in the upper right. Pertinent questions will be answered during the meeting, subject to time constraints. If you are unable to attend our annual meeting, a replay of the annual meeting will be posted to our website at investors.carmax.com after the meeting. | ||||
| Voting Information | |||||
| Shareholders Entitled to Vote | If you owned CarMax common stock at the close of business on April To conduct the annual shareholders meeting, a majority of our outstanding shares of common stock as of April | ||||
| How to Vote (Record Owners) | Shareholders of record (that is, shareholders who hold their shares in their own name) may vote in any of the following ways: ● By Internet Before the Virtual Meeting. You may vote online by accessing www.proxyvote.com and following the on-screen instructions. You will need the Control Number included on the Notice of Internet Availability of Proxy Materials (the “Notice”) or on your proxy card, as applicable. You may vote online 24 hours a day. If you vote online, you do not need to return a proxy card. ● By Telephone. You may vote by calling toll free 1-800-690-6903 and following the instructions. You will need the Control Number included on the Notice or on your proxy card, as applicable. You may vote by telephone 24 hours a day. If you vote by telephone, you do not need to return a proxy card. ● By Mail. If you requested printed copies of the proxy materials, you will receive a proxy card, and you may vote by signing, dating and mailing the proxy card in the envelope provided, or return it to Vote Processing, c/o Broadridge, 51 Mercedes Way, Edgewood, NY 11717. ● At the Virtual Meeting. While we encourage you to vote your shares prior to the annual meeting, you may vote at the virtual annual shareholders meeting by logging into the virtual platform at www.virtualshareholdermeeting.com/ Participants in our ESPP may vote in any of the ways listed above. | ||||
| How to Vote (Beneficial Owners) | If your shares are held in “street name” (that is, in the name of a bank, broker, or other holder of record), you may vote in any of the following ways: ● By Internet Before the Virtual Meeting. You may vote online by accessing www.proxyvote.com and following the on-screen instructions. You will need the Control Number included on the Notice or on your voting instruction form, as applicable. You may vote online 24 hours a day. If you vote online, you do not need to return a voting instruction form. ● By Telephone. You may vote by telephone by following the instructions provided in the Notice. You will need the Control Number included on the Notice or on your voting instruction form, as applicable. You may vote by telephone 24 hours a day. If you vote by telephone, you do not need to return a voting instruction form. ● By Mail. If you requested printed copies of the proxy materials, you will receive a voting instruction form, and you may vote by signing, dating and mailing it in the envelope provided. ● At the Virtual Meeting. While we encourage you to vote your shares prior to the annual meeting, you may vote at the virtual annual shareholders meeting by logging into the virtual platform at www.virtualshareholdermeeting.com/ | ||||
| Deadline for Voting (Before the Virtual Meeting) | For both shareholders of record and beneficial owners of shares held in street name (other than ESPP participants), online and telephone voting is available through 11:59 p.m. ET on Monday, June 26, 2023. For shares held by ESPP participants in an ESPP account, online and telephone voting is available through 11:59 p.m. ET on Thursday, June | ||||
| Changing Your Vote | You may revoke your proxy at any time before it is exercised by submitting a subsequent vote using any of the methods described above. | ||||
| Effect of Not Voting | Shareholders of Record. If you are a shareholder of record and you: ● Do not vote via the internet before the virtual meeting, by telephone or by mail, your shares will not be voted unless you attend the annual meeting to vote your shares. ● Sign and return a proxy card without giving specific voting instructions, then your shares will be voted in the manner recommended by the Board on all matters presented in this proxy statement and as the proxy holders may determine in their discretion on any other matters properly presented for a vote. Beneficial Owners of Shares Held in Street Name or Participants in the ESPP. If you are a beneficial owner of shares held in street name or a participant in the ESPP and you do not provide the organization that holds your shares with specific voting instructions, under the rules of various national and regional securities exchanges, the organization that holds your shares generally may vote your shares on routine matters but cannot vote your shares on non-routine matters. If the organization that holds your shares does not receive instructions from you on how to vote your shares on a non-routine matter, the organization will not have the authority to vote your shares on this matter. This is generally referred to as a “broker non-vote.” | ||||
| Voting Standards | Proposals One (election of directors), Two (ratification of KPMG), Three (advisory | ||||
| Routine and Non-Routine Proposals | Routine Proposals. Proposal Two (ratification of KPMG) is considered a routine matter. A broker or other nominee generally may vote on routine matters, and therefore we expect no broker non-votes in connection with Proposal Two. Non-routine Proposals. Proposals One (election of directors), Three (advisory | ||||
| Counting the Votes | A representative of American Election Services, LLC will tabulate the votes and act as inspector of election at the annual shareholders meeting. | ||||
| Proxy Information | |||||
Electronic Access to Proxy Materials and Annual Report | We are providing access to our proxy materials primarily over the internet rather than mailing paper copies of those materials to each shareholder. On or aboutMay ● View our proxy materials for the annual shareholders meeting on the internet. ● Instruct us to send proxy materials to you by mail or email. Choosing to receive proxy materials by email will save us the cost of printing and mailing documents and will reduce the impact of our annual shareholders meeting on the environment. If you choose to receive future proxy materials by email, you will receive an email message next year with instructions containing a link to those materials and a link to the proxy voting website. Your election to receive proxy materials by email will remain in effect unless and until you rescind it. | ||||
| Proxy Solicitation | CarMax pays the cost of soliciting proxies. We will solicit proxies from our shareholders, and, after the initial solicitation, some of our associates or agents may contact shareholders by telephone, by email or in person. We have retained Georgeson, Inc. to solicit proxies for a fee of | ||||
| Website Addresses in the Proxy Statement | Website addresses in this proxy statement are inactive textual references. The information on, or accessible through, these websites is not incorporated by reference into, and is not a part of, this proxy statement. | ||||
Other Matters | |||||
| Other Matters | We are not aware of any matters that may come before the annual shareholders meeting other than the | ||||
| Next Year’s Meeting | We plan to hold our | ||||
| Shareholder Proposal Information | |||||
Advance Notice of Director Nominations, Universal Proxy Nominations, and Shareholder Proposals and Other Items of Business | Director Nominations. ● Our proxy access right permits an eligible shareholder, or a group of up to 20 shareholders, to nominate and include in CarMax’s proxy materials directors constituting up to 20% of the Board of Directors. To be eligible, the shareholder or shareholder group must have owned 3% or more of our outstanding capital stock continuously for at least three years and satisfy certain notice and other requirements set forth in Sections 2.3 and 2.3A of our bylaws. Notice of proxy access director nominees must be received no earlier than December ● Director nominations that a shareholder intends to present at the Universal Proxy. In addition to satisfying the requirements of our bylaws, including the earlier notice deadlines set out above and therein, to comply with universal proxy rules, shareholders who intend to solicit proxies in support of director nominees other than the Company’s nominees must also provide notice that sets forth the information required by Rule 14a-19 of the Securities Exchange Act of 1934 no later than April 29, 2024. Shareholder Proposals and Other Items of Business. A shareholder proposal will be acted upon at the To be considered for inclusion in our To bring a matter for consideration before the All director nominations and proposals must be submitted in writing to our Corporate Secretary at CarMax, Inc., 12800 Tuckahoe Creek Parkway, Richmond, Virginia 23238. | ||||
APPENDIX A: AMENDED AND RESTATED CARMAX, INC. 2002 STOCK INCENTIVE PLAN | ||
CARMAX, INC. By: ______________________ Enrique N. Mayor-Mora Executive Vice President & Chief Financial Officer | ||