UNITED STATES
SECURITIES AND EXCHANGE COMMISSION
WASHINGTON, DC 20549
SCHEDULE 14A INFORMATION
Proxy Statement Pursuant to Section 14(a) of the
Securities Exchange Act of 1934
(Amendment No. )
Filed by the Registrant x Filed by a Party other than the Registrant ¨
Check the appropriate box:
| Filed by the Registrant x | Filed by a Party other than the Registrant ¨ |
| Check the appropriate box: | ||
| ¨ | Preliminary Proxy Statement | |
| ¨ | Confidential, for Use of the Commission Only (as permitted by Rule 14a-6(e)(2)) | |
| x | Definitive Proxy Statement | |
| ¨ | Definitive Additional Materials | |
| ¨ | Soliciting Material under §240.14a-12 | |
United Technologies Corporation
(Name of Registrant as Specified in Its Charter)
(Name of Person(s) Filing Proxy Statement if other than the Registrant)
Payment of Filing Fee (Check the appropriate box):
| x | No fee required. | |||
| ¨ | Fee computed on table below per Exchange Act Rules 14a-6(i)(1) and 0-11. | |||
| (1) | Title of each class of securities to which transaction applies: | |||
| (2) | Aggregate number of securities to which transaction applies: | |||
| (3) | Per unit price or other underlying value of transaction computed pursuant to Exchange Act Rule 0-11 (set forth the amount on which the filing fee is calculated and state how it was determined): | |||
| (4) | Proposed maximum aggregate value of transaction: | |||
| (5) | Total fee paid: | |||
| ¨ | Fee paid previously with preliminary materials. | |||
| ¨ | Check box if any part of the fee is offset as provided by Exchange Act Rule 0-11(a)(2) and identify the filing for which the offsetting fee was paid previously. Identify the previous filing by registration statement number, or the Form or Schedule and the date of its filing. | |||
| (1) | Amount Previously Paid: | |||
| (2) | Form Schedule or Registration Statement No.: | |||
| ||||
| ||||
| ||||
| ||||
| ||||
| (3) | ||||
| Filing Party: | ||||
| ||||
| (4) | Date Filed: | |||
| ||||
| ||||
 |
| |
March 14, 2014
Dear Shareowners,
It is my pleasure to invite you to attend the 2014 Annual Meeting of Shareowners of United Technologies Corporation. As in prior years, we will meet to consider important matters affecting our Company. Whether or not you plan to attend the meeting, I encourage you to review the enclosed information and vote your shares.
Looking back over the past year, I am proud of what United Technologies has accomplished and excited about the momentum we have created for the future. As we begin 2014, the success of our portfolio transformation and our continued investments in game-changing technologies position us to accelerate growth, as does our ability to leverage our tremendous global scale to provide customers with innovative solutions in our core aerospace and building systems markets.
United Technologies delivered another strong performance in 2013. Solid execution across our business units drove double-digit earnings growth. We increased our dividend per share by 10.3 percent in 2013, marking the 77th consecutive year United Technologies has paid a dividend to shareowners.
Across the Company there were many notable accomplishments in 2013. Among them was the successful integration of both Goodrich and International Aero Engines. These transformational acquisitions are delivering better-than-expected results and have greatly improved our position in the high-growth commercial aerospace market. We also announced a tremendous new growth platform with the creation of UTC Building & Industrial Systems, combining Otis and UTC Climate, Controls & Security. This combination better positions us to capitalize on urbanization in emerging markets, where customers need tailored energy-efficient solutions incorporating multiple building systems and services.
UTC’s Directors have broad leadership experience and superb operating and policy knowledge and I am grateful to our Board of Directors for their guidance, leadership and oversight.
As always, we value your ongoing participation and support of United Technologies Corporation, and we are committed to delivering world-class performance, outperforming our peers and creating long-term value for our shareowners.
Sincerely,

Louis R. Chênevert
Chairman & Chief Executive Officer
|
| |
March 14, 2014
NOTICE OF ANNUAL MEETING OF SHAREOWNERS
Annual Meeting Date: April 28, 2014
Time: 2:00 p.m. Eastern Daylight Time (doors open at 1:30 p.m.)
AGENDA:
If you owned shares of UTC Common Stock (“Common Stock”) at the close of business on March 3, 2014, you are entitled to vote at the meeting either in person or by proxy.
YOUR VOTE IS VERY IMPORTANT. PLEASE SUBMIT YOUR PROXY OR VOTING INSTRUCTIONS AS SOON AS POSSIBLE, WHETHER OR NOT YOU PLAN TO ATTEND THE MEETING. Most shareowners have a choice of voting over the Internet, by telephone or by using a traditional proxy card. Please refer to the enclosed proxy materials or the information forwarded by your bank, broker or other holder of record to see which voting methods are available to you.
This year we will again seek to conserve natural resources and reduce costs by electronically disseminating annual meeting materials, as permitted by the Securities and Exchange Commission. Many shareowners will receive a Notice of Internet Availability of Proxy Materials with instructions for accessing these materials via the Internet. You can also receive, upon request, a copy of the proxy materials by mail if you prefer.
Because seating is limited,please request a ticket in advance by following the instructions on page 70 of the Proxy Statement. For security reasons,please be prepared to show photo identification as well. If you need special assistance because of a disability, please contact our Corporate Secretary’s Office by calling (860) 728-7870, sending an email to: corpsec@corphq.utc.com, or writing to: Corporate Secretary, UTC, One Financial Plaza, Hartford, CT 06103.
By order of the Board of Directors.

Peter J. Graber-Lipperman
Vice President, Secretary & Associate General Counsel
| ||||||
 |
|  |
| |||
 |
|  |
| |||
ELECTION TO RECEIVE ELECTRONIC DELIVERY OF FUTURE ANNUAL MEETING MATERIALS.
You can expedite delivery and avoid costly mailings by confirming in advance your preference for electronic delivery. For further information on how to take advantage of this cost-saving service, please see page 73 of the Proxy Statement.

This summary highlights selected information in this Proxy Statement. Please review the entire Proxy Statement and the 2013 UTC Annual Report before voting.
2013 PERFORMANCE HIGHLIGHTS
2013 was a year of continuing transformation and strong performance for UTC, despite weakness in U.S. defense spending and increased pension expense, primarily due to low discount rates. We delivered excellent results for shareowners and took strategic steps to position the Company for long-term, sustainable growth.
|
|
| ||||
|
|
|
2013 EXECUTIVE COMPENSATION HIGHLIGHTS
Our compensation program is designed to create incentive compensation opportunities for our executives that align with our shareowners’ long-term interests. Some of the program changes approved in 2012 were implemented for 2013. Also in 2013, the following additional program modifications were made to further enhance this alignment, to better conform with current best practices and to respond to input from our investors:
Our Chairman & Chief Executive Officer (“CEO”) received90% of his 2013 compensation in contingent, performance-based incentives. For our other named executive officers (“NEOs”), the percentage of contingent, performance-based compensation was, on average,86% (see Pay Mix charts on page 36).
PROXY STATEMENT SUMMARY
MATTERS FOR SHAREOWNER VOTING
At this year’s Annual Meeting, we are asking our shareowners to vote on the following matters:
Proposal 1: Election of Directors
The Board recommends a voteFOR the election of the director nominees named in this Proxy Statement. See pages 1 through 9 of the Proxy Statement for further information on the nominees.
Proposal 2: Appointment of PricewaterhouseCoopers LLP as Independent Auditor for 2014
The Board recommends a voteFOR this proposal. See pages 60 and 61 for further information.
Proposal 3: Amendment and Restatement of the 2005 Long-Term Incentive Plan, Including Approval of Additional Shares for Future Awards Under the Plan
The Board recommends a voteFOR this proposal. See pages 62 through 67 for further information.
Proposal 4: Advisory Vote to Approve Named Executive Officer Compensation
The Board recommends a voteFOR this proposal. See pages 68 and 69 for further information.
BOARD NOMINEES
You are being asked to cast votes for twelve directors. Directors are elected annually by majority voting. Except for Mr. Chênevert, our Chairman & CEO, all nominees meet the New York Stock Exchange (“NYSE”) governance standards for director independence.
Committee Memberships
| |||||||||||||||||||||||||||||||||
Name
| Age
| Director Since
| Occupation
| Independent
|
Other Public Boards
| A
| N&G
| C&ED
| F
| PIR
| |||||||||||||||||||||||
Louis R. Chênevert
| 56 | 2006 | UTC Chairman & CEO | 0 | M | ||||||||||||||||||||||||||||
John V. Faraci |
64 |
2005 |
Chairman & CEO, International Paper
|
X |
2 |
M |
M |
Ch | |||||||||||||||||||||||||
Jean-Pierre Garnier
| 66 | 1997 | Chairman, Actelion Ltd. | X | 2 | M | Ch | M | |||||||||||||||||||||||||
Jamie S. Gorelick
| 63 | 2000 | Partner, WilmerHale | X | 1 | M | M | M | |||||||||||||||||||||||||
Edward A. Kangas |
69 |
2008 |
Former Chairman & CEO, Deloitte, Touche, Tohmatsu
|
X |
4 |
Ch |
M |
M | |||||||||||||||||||||||||
Ellen J. Kullman
| 58 | 2011 | Chair & CEO, DuPont | X | 1 | M | M | M | |||||||||||||||||||||||||
Marshall O. Larsen |
65 |
2012 |
Former Chairman, President & CEO, Goodrich Corp.
|
X |
2 |
M |
M | ||||||||||||||||||||||||||
Harold McGraw III |
65 |
2003 |
Chairman, McGraw Hill Financial, Inc.
|
X |
2 |
M |
M |
M | |||||||||||||||||||||||||
Richard B. Myers
| 72 | 2006 | Ret. General, U.S. Air Force | X | 3 | M | M | M | |||||||||||||||||||||||||
H. Patrick Swygert |
70 |
2001 |
President Emeritus, Howard University
|
X |
1 |
M |
Ch |
M | |||||||||||||||||||||||||
André Villeneuve |
69 |
1997 |
Chairman, ICE Benchmark Administration Ltd.
|
X |
0 |
M |
M |
M | |||||||||||||||||||||||||
Christine Todd Whitman |
67 |
2003 |
President, Whitman Strategy Group
|
X |
1 |
M |
M |
Ch | |||||||||||||||||||||||||
A Audit N&G Nominations & Governance C&ED Compensation & Executive Development F Finance PIR Public Issues Review
M Member
Ch Chair
PROXY STATEMENT SUMMARY
GOVERNANCE HIGHLIGHTS
As part of UTC’s commitment to high ethical standards, our Board follows sound governance practices. These practices are described in more detail in our Corporate Governance Guidelines, which can be found in the Governance section of our website.
|
| |
|
| |
|
| |
|
| |
|
| |
|
| |
|
|
Important Notice Regarding the Availability of Proxy Materials for the Shareowner Meeting to be held on April 28, 2014.UTC’s Proxy Statement for the 2014 Annual Meeting, and our Annual Report to Shareowners for 2013 are both available free of charge at:www.proxyvote.com. References in this Proxy Statement and accompanying materials to Internet websites are for the convenience of readers. Information available at or through these websites is not incorporated by reference in this Proxy Statement.
Proposal 1 Election of Directors
Proxy Statementand
Notice of 2016 Annual
Meeting of Shareowners
MOVING
THE WORLD
FORWARD

COMPANY AWARDS IN 2015 | ||
Among Most Admired Aerospace & Defense CompaniesFortune Magazine Among Most Respected CompaniesBarron’s Among World’s Greenest CompaniesNewsweek Magazine Best Investor Relations Company in the Aerospace and Defense Electronics SectorInstitutional Investor Magazine Top 5% of Companies Responding to Climate ChangeCarbon Disclosure Project Top 50 Organizations for Multicultural Business OpportunitiesDiversityBusiness.com | 2015 Safe-in-Sound Excellence in Hearing Loss Prevention AwardsThe National Institute for Occupational Safety and Health Outstanding Industry Promotion AwardInternational Science Magazine All-America Executive Team: Most Honored Company in the Aerospace and Defense Electronics SectorInstitutional Investor Magazine Best Places to Work for Latinas Latina Style Magazine | |
Pictured:Hudson Yards development project—New York City, US
Cover:Mingyu Financial Plaza and Yintai Center—Chengdu, China
 | United Technologies Corporation 10 Farm Springs Road |
Notice of Annual Meeting of Shareowners
March 15, 2016
| Meeting Information |
| DATE AND TIME: |
| April 25, 2016 |
| 8:00 a.m. Eastern Daylight Time (doors open at 7:30 a.m.) |
| LOCATION: |
| The Vinoy®Renaissance St. Petersburg, Palm Court Ballroom |
| 501 5th Avenue NE |
| St. Petersburg, Florida 33701 |
| Agenda | |
| 1. | Election of the thirteen director nominees listed in the Proxy Statement. |
| 2. | Appointment of PricewaterhouseCoopers LLP to serve as Independent Auditor for 2016. |
| 3. | Amendment to our Restated Certificate of Incorporation to eliminate cumulative voting for directors. |
| 4. | An advisory vote to approve the compensation of our named executive officers. |
| 5. | Other business, if properly raised. |
Who may vote:
If you owned shares of UTC Common Stock at the close of business on February 29, 2016, you are entitled to receive this notice of the meeting and to vote at the meeting either in person or by proxy. YOUR VOTE IS VERY IMPORTANT. PLEASE SUBMIT YOUR PROXY OR VOTING INSTRUCTIONS AS SOON AS POSSIBLE, WHETHER OR NOT YOU PLAN TO ATTEND THE MEETING.
How to attend:
Please requesta ticket in advance by following the instructions on page 76. For security reasons,please be prepared to show photo identification when presenting your ticket for admission to the meeting. If you need special assistance because of a disability, please contact our Corporate Secretary’s Office by calling: 860-728-7870, sending an email to:
corpsec@corphq.utc.com, or writing to: Corporate Secretary, UTC, 10 Farm Springs Road, Farmington, CT 06032.
Election to receive electronic delivery of future annual meeting materials:
You can expedite delivery, avoid costly mailings and help conserve natural resources by confirming in advance your preference for electronic delivery. For further information on how to take advantage of this convenient and environmentally friendly service, please see page 80. You can always receive a printed copy on request.
By order of the Board of Directors.
Peter J. Graber-Lipperman
Corporate Vice President, Secretary & Associate General Counsel
Review Your Proxy Statement and Vote in One of Four Ways:
 | VIA THE INTERNET Visit the website listed on your proxy card or voting instruction form |
 | BY TELEPHONE Call the telephone number on your proxy card or voting instruction form |
 | BY MAIL Sign, date and return your proxy card or voting instruction form in the enclosed envelope |
 | BY MOBILE DEVICE Scan the QR code included with your proxy card or voting instruction form |
Please refer to the enclosed proxy materials or the information forwarded by your bank, broker or other holder of record to see which voting methods are available to you.
| Proxy Statement and Notice of 2016 Annual Meeting of Shareowners | i |

This summary highlights selected information in this Proxy Statement. Please review the entire Proxy Statement and UTC’s Annual Report for 2015 before voting your shares.
Annual Meeting Agenda
| Proposal | Page Numbers | Required Vote | Board Recommendation | |||
| Proposal 1:Election of Directors | 1–10 | Votes FOR must exceed 50% of the votes cast with respect to the nominee | FOR each director nominee | |||
| Proposal 2:Appointment of PricewaterhouseCoopers LLP to serve as Independent Auditor for 2016 | 70–71 | Approval by a majority of the votes making up the quorum | FOR | |||
| Proposal 3:Amendment to our Restated Certificate of Incorporation to eliminate cumulative voting for directors | 72–73 | Approval by a majority of outstanding shares | FOR | |||
| Proposal 4:An advisory, non-binding approval of Named Executive Officer Compensation | 74–75 | Votes FOR the proposal must exceed votes AGAINST it | FOR |
2015 Performance
| 2015 was a year of significant business transformation for UTC. |
A sharper focus.The sale of our Sikorsky Aircraft business for approximately $9 billion allows us to better focus on our core aerospace and building systems businesses and enables us to deliver strong future growth.
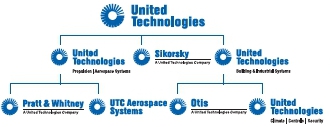
A simpler structure.Under the leadership of our new President and Chief Executive Officer (“CEO”), Mr. Gregory Hayes, UTC has been streamlined into four core business segments. This simpler, flatter organizational structure gives each segment a more direct and transparent relationship to the CEO.
| Old Structure | New Structure | |
 |  |
| ii |  |

A refreshed leadership team.Our revamped senior executive team brings a fresh and reinvigorated operational focus on flawless execution and disciplined capital allocation.
Throughout 2015, UTC has maintained its strategy of long-term, sustainable growth. Some of our strategic and operational accomplishments for the year include:
| • | Certification by both the Federal Aviation Administration (“FAA”) and the European Aviation Safety Agency (“EASA”) of Pratt & Whitney’s PurePower PW1000G engine with Geared Turbofan technology (“GTF”), well ahead of competitors. This revolutionary engine decreases fuel burn by 16%, noise by 75% and emissions by 50%. With approximately 7,000 orders to date (including options), the GTF backlog will provide UTC revenue streams for decades. |
| • | First flight of Boeing’sKC-46A tanker for which UTC Aerospace Systems (“UTAS”) supplies the electric power, air supply, landing and fuel sensing systems, as well as the engine controls, fuel metering unit and other accessories for the tanker’s Pratt & Whitney PW4062 engines. |
| • | Selection of Otis to provide 133 elevators and escalators to the Chengdu Metro Line, as well as 174 elevators and escalators to a new landmark commercial building in Ningbo, East China. |
| • | UTC Climate, Controls & Security’s (“UTC CCS”) largest retrofit contract ever for the CP Tower in Kuala Lumpur, Malaysia. |
While our 2015 strategic accomplishments have been impressive and exciting, this past year also presented challenges that adversely affected our financial performance. Among other factors, we continued to make capital investments in support of our long-term goals, including significant investments in the Pratt & Whitney GTF engine. We also faced external challenges that included slow growth in many of the markets in which we operate (especially China), pension-related headwinds and adverse foreign currency exchange rates which contributed to the decrease in net sales and diluted earnings per share (“EPS”) on an adjusted basis. Nevertheless, and consistent with past practice, UTC increased dividends paid to shareowners by 8.5% which represents the 79thconsecutive year in which UTC has paid dividends. During 2015, UTC also returned $12 billion to shareowners in dividends and share repurchases (including a $6 billion accelerated share buyback program announced in November 2015) and communicated a $1.5 billion long-term structural cost reduction plan—actions intended to respond aggressively to these near-term financial and economic challenges.
| Adjusted Net Sales(1) | Adjusted Diluted EPS(1) | Free Cash Flow(2) | Dividends Paid |
| (in billions) | (in billions) | (Per Common Share) | |
 | |||
| (1) | Reflects continuing operations, adjusted to exclude restructuring, non-recurring and other significant, defined non-operational items. A reconciliation of these non-GAAP financial measures to the most comparable U.S. GAAP financial measure for each of the three years shown is set forth in Appendix B on page 86. |
| (2) | Reflects continuing operations. |
| Proxy Statement and Notice of 2016 Annual Meeting of Shareowners | iii |
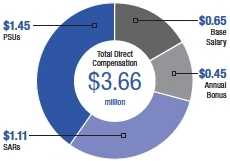
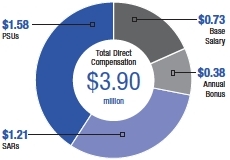
Executive Compensation Overview
Principal Elements of Compensation.Our senior executive compensation program has three primary components: base salary, annual bonus and long-term incentives which are awarded in two forms: performance share units (“PSUs”) and stock appreciation rights (“SARs”). Each component serves a specific purpose in our compensation strategy. Base salary is an essential part of any market-competitive compensation program. Annual bonus awards are intended to motivate the achievement of near-term company and business unit goals. Long-term compensation is the foundation of our program and therefore makes up the greatest portion of our senior management’s compensation. Long-term compensation opportunities drive our executives to focus on strategies that promote sustainable growth.
2015 Compensation Decisions.2015 compensation decisions made by the Committee on Compensation and Executive Development (the “Committee”) recognized both the short-term financial results of the Company and the strategic accomplishments achieved during the year, as discussed on page iii.
The following chart shows the decisions made with respect to the three principal elements of compensation for the three 2015 Named Executive Officers (“NEOs”) who continue to serve as executive officers of the Company as of the date of this Proxy Statement. The other 2015 NEOs (Messrs. Bellemare, Darnis and Adams) retired from UTC effective January 31, 2015, January 31, 2016 and February 29, 2016, respectively.
2015 TOTAL DIRECT COMPENSATION(1)
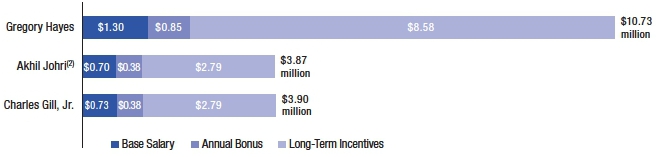
| (1) | Total direct compensation, as discussed in detail on page 47, reflects compensation decisions made by the Committee based on its evaluation of each NEO’s performance during 2015. It includes base salary (including any 2015 changes), annual bonus for 2015 performance and the long-term incentive grant made on January 4, 2016. It is different from compensation shown in the Summary Compensation Table, which includes the long-term incentive grant made on January 2, 2015 and reflects the Committee’s assessment of 2014 performance. |
| (2) | Excludes amounts paid to Mr. Johri to offset compensation forfeited upon leaving his former employer. |
RECENT PROGRAM CHANGES
The Committee made the following changes to UTC’s executive compensation program during or applicable for 2015:
| • | Return on Invested Capital (“ROIC”) has been added as a performance metric to our PSU awards granted in 2016 and beyond. ROIC makes up 35% of the total award payout opportunity, with the existing EPS growth and relative total shareowner return (“TSR”) metrics weighted at 35% and 30%, respectively. |
| • | For the portion of the PSUs that vest contingent upon UTC’s TSR relative to the S&P 500, in the event of a negative TSR, the payout will be capped at 100% of target, even if UTC outperforms the S&P 500. |
| • | Effective January 1, 2016, members of the Executive Leadership Group (“ELG”) are eligible for a financial planning benefit valued at up to $16,000 per year. |
| • | The ELG life insurance benefit was eliminated for ELG members appointed on or after January 31, 2015. |
| • | The threshold payout level of the EPS portion of PSU awards has been increased to 50%. |
| • | The President and CEO’s personal use of the Corporate aircraft is now limited to 50 hours annually. |
| iv | |
Board Highlights
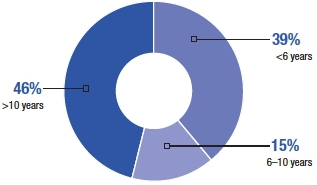
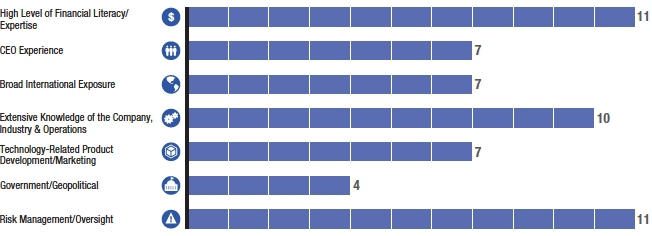
The Board of Directors and its Committee on Nominations and Governance believe that diversity in experience and perspective are of the utmost importance for achieving sound decisions that drive shareowner value. The Board also believes that the varying tenures of our directors provide a constructive blend of institutional knowledge with a fresh external viewpoint. Through their attendance at Board and Committee meetings, UTC’s directors have demonstrated their active engagement and continuing commitment to providing oversight and sound corporate governance. The following charts reflect the broad experience, tenure and active engagement of the members of our Board of Directors:
Total Board Members: 13
| Director Tenure | Director Engagement | |
 | 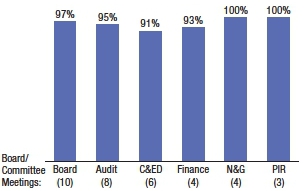 |
Aggregate Percent of Meetings Attended by Directors in 2015
Director Experience
| Board = full Board meeting | Finance = Finance Committee |
| Audit = Audit Committee | N&G = Committee on Nominations and Governance |
| C&ED = Committee on Compensation and Executive Development | PIR = Public Issues Review Committee |
| Proxy Statement and Notice of 2016 Annual Meeting of Shareowners | v |
Board Nominees
You are being asked to cast votes for thirteen directors. Directors are elected annually by majority voting.
All nominees meet the New York Stock Exchange (“NYSE”) governance standards for director independence, except for Mr. Hayes, who is not independent due to his position as a UTC executive officer.
| Nominee | Age | Director Since | Committee Membership | Other Public Company Boards | ||||
| JOHN V. FARACI Retired Chairman & Chief Executive Officer, International Paper | 66 | 2005 | C&ED – Member F – Chair N&G – Member | 2 | ||||
| JEAN-PIERRE GARNIER Chairman, Actelion Ltd. | 68 | 1997 | C&ED – Chair N&G – Member PIR – Member | 3 | ||||
| GREGORY J. HAYES United Technologies Corp., President and Chief Executive Officer | 55 | 2014 | F – Member | 1 | ||||
| EDWARD A. KANGAS Former Chairman & Chief Executive Officer, Deloitte, Touche, Tohmatsu | 71 | 2008 | A – Chair C&ED – Member N&G – Member | 3 | ||||
| ELLEN J. KULLMAN Retired Chair & Chief Executive Officer, DuPont | 60 | 2011 | A – Member F – Member PIR – Member | 0 | ||||
| MARSHALL O. LARSEN Former Chairman, President & Chief Executive Officer, Goodrich Corp. | 67 | 2012 | F – Member PIR – Member | 3 | ||||
| HAROLD MCGRAW III Chairman Emeritus, McGraw Hill Financial, Inc. | 67 | 2003 | C&ED – Member F – Member N&G – Member | 1 | ||||
| RICHARD B. MYERS Ret. General, U.S. Air Force, Former Chairman, U.S. Joint Chiefs of Staff | 74 | 2006 | A – Member C&ED – Member N&G – Member | 2 | ||||
| FREDRIC G. REYNOLDS Retired Executive Vice President and Chief Financial Officer, CBS Corporation | 65 | 2016 | A – Member N&G – Member | 2 | ||||
| BRIAN C. ROGERS Chairman, T. Rowe Price Group | 60 | 2016 | C&ED – Member F – Member | 1 | ||||
| H. PATRICK SWYGERT President Emeritus, Howard University | 72 | 2001 | A – Member C&ED – Member N&G – Chair | 1 | ||||
| ANDRÉ VILLENEUVE Chairman, ICE Benchmark Administration Ltd. | 71 | 1997 | A – Member F – Member PIR – Member | 0 | ||||
| CHRISTINE TODD WHITMAN President, Whitman Strategy Group | 69 | 2003 | F – Member N&G – Member PIR – Chair | 1 |
AAudit N&GNominations & Governance C&EDCompensation & Executive Development FFinance PIRPublic Issues Review
| vi | |
Governance Highlights
As part of UTC’s commitment to the highest ethical standards, the members of our Board are committed to sound governance practices.UTC’s governance practices are described in more detail in our Corporate Governance Guidelines, which can be found in the Corporate Governance section of our website.
| Independence | • | 12 out of our 13 nominees are independent. |
| • | Our CEO is the only management director. | |
| • | All of the Board Committees that meet regularly, other than the Finance Committee, are composed exclusively of independent directors. | |
| Independent Chairman of the Board | • | Our non-executive Chairman of the Board, Edward A. Kangas, is independent under NYSE standards. |
| • | The non-executive Chairman serves as liaison between management and the other non-management directors, presides at all Board meetings and can call special Board meetings. | |
| Independent Director Meetings | • | The independent directors regularly meet in private without management. |
| • | The non-executive Chairman presides at these executive sessions. | |
| Board Oversight of Risk Management | • | The Board monitors UTC’s systematic approach to identifying and assessing risks to the Company and our business units. |
| • | The Audit Committee reviews our overall enterprise risk management policies and practices, financial risk exposures and the delegation of risk oversight responsibilities to other Board Committees. | |
| Stock Ownership Requirements | • | Non-management directors must hold at least $560,000 of Common Stock (or Common Stock equivalents) within five years of joining the Board. |
| • | Our CEO must, within five years of attaining that position, hold Common Stock (or Common Stock equivalents) valued at six times base salary. | |
| • | Members of our Executive Leadership Group must, within five years of appointment to the group, hold Common Stock (or Common Stock equivalents) valued at three times base salary. | |
| Incentive Plans | • | The Board’s Committee on Compensation & Executive Development annually reviews the goal-setting processes for our incentive plans to ensure that the plans use goals that are rigorous, yet attainable. |
| • | We strictly forbid repricing or cash buyouts of underwater stock options. | |
| • | We do not allow pledging or hedging of UTC shares by our executives or our non-employee directors for any reason. | |
| • | We have a robust clawback policy, which allows us to recoup compensation in the case of misconduct or negligence causing significant harm to the Corporation. We have strengthened this policy multiple times over the years. | |
| Board Practices | • | The Board and each of its committees conduct self-evaluations each year, in which they examine and discuss whether they are functioning effectively, receive input on their performance from every member, and identify any areas in which directors believe performance could improve. |
| • | The director candidate criteria are adjusted as needed to ensure that our Board as a whole continues to reflect the appropriate mix of skills and experience. | |
| • | Directors may not stand for election after age 72, absent special circumstances approved by the Board. | |
| Board Accountability | • | All directors stand for election annually. |
| • | In uncontested elections, directors must be elected by a majority of votes cast. | |
| • | In contested elections, directors are elected by a plurality vote. | |
| • | In September 2015, the Board proactively amended UTC’s Bylaws to adopt “proxy access,” affording shareowners a greater role in the director nomination process. In particular, UTC adopted Bylaw provisions that permit a shareowner, or a group of up to 20 shareowners, owning at least three percent of UTC’s outstanding shares of Common Stock continuously for at least three years, to nominate and include in UTC’s annual meeting proxy materials director nominees who, if elected, would constitute up to twenty percent of the Board, provided that the shareowner(s) and nominee(s) satisfy the requirements specified in UTC’s Bylaws, which are available at:http://www.utc.com/Our- Company/Corporate-Governance/Documents/Bylaws.pdf. |
| Proxy Statement and Notice of 2016 Annual Meeting of Shareowners | vii |
Table of Contents
Important Notice Regarding the Availability of Proxy Materials for the Shareowner Meeting to be held onApril 25, 2016.UTC’s Proxy Statement for the 2016 Annual Meeting and our Annual Report to Shareowners for 2015 are both available free of charge at:www.proxyvote.com. References in this Proxy Statement and accompanying materials to Internet websites are for the convenience of readers. Information available at or through these websites is not a part of nor is it incorporated by reference in this Proxy Statement.
| viii | |
Proposal 1: Election of Directors
Proxy Statement.The Board of Directors of United Technologies Corporation (“UTC”, the “Company” or the “Corporation”) is soliciting proxies to be voted at our 20142016 Annual Meeting of Shareowners on April 28, 201425, 2016 and at any adjournmentpostponed or postponement of thereconvened meeting. We expect that this Proxy Statement will be mailed and made available to shareowners beginning on or about March 14, 2014. The15, 2016. At the meeting, votes will address thebe taken on four matters listed in the Notice of Meeting, the first of which is the election of directors.
We are seeking your support for the election of the twelvethirteen candidates that we havethe Board has nominated to serve on our Board.the Board of Directors. We believe that these nominees have qualifications consistent with our position as a large, diversified industrial corporation, with operations throughout the world. We also believe that these nominees have the experience and perspective to guide the Company as we continue toinnovate and develop new products, compete in a broad range of markets around the world, innovate, and adjust to rapidly changing technologies, business cycles and competition.
BOARD MEMBERSHIP CRITERIA AND NOMINATION PROCESS
Board Membership Criteria and Nomination Process
The Board and its Committee on Nominations and Governance believe that it is important that our directors, as a group, have the following attributes:
| Senior business or government leadership experience |
| • |
| Public company board experience |
| • | International business or government experience | ||
| • |
| An objective, independent and informed approach to complex and sensitive business decisions |
| • | Extensive knowledge, experience and judgment |
| • | An appreciation of the role of the corporation in society |
| • | Diversity of perspectives and appreciation for multiple cultures | ||
| • | Loyalty to the interests of UTC and its shareowners | ||
| • | The highest integrity and ethical standards | ||
| Global / international expertise | |||
| EXPERTISE | • | Industry / technical expertise | |
| • | Financial and accounting expertise | ||
| • | Government or public policy expertise | ||
| • | Regulatory compliance expertise | ||
| • | Risk management expertise | ||
PROPOSAL 1 ELECTION OF DIRECTORS
Individuals on our Board also possess other particular skills and qualifications. These include experience in the financial services industry, the military, government and in academia,academia; expertise in sustainability and environmental issues,issues; and knowledge of systems and technology.
| Proxy Statement and Notice of 2016 Annual Meeting of Shareowners | 1 |
Our Board believes it is critical to our success to have directors who represent the interests of shareowners by bringing a diversity of perspectives to Board deliberations and Company oversight. The Committee on Nominations and Governance regularly reviews with the Board the qualifications that are most important in selecting candidates to serve as directors, taking into account UTC’s diverse operations and the mix of capabilities and experience represented on the Board. As part of its annual evaluation of its effectiveness as a group, the Board considers whether its composition as a whole reflects a mix of skills and perspectives that is appropriate to meet the Company’s needs. Based on these considerations, we makethe Board makes adjustments in the priorities we givegiven to differentthe various director qualifications when identifying candidates.
| Diversity | |||||
While we do not have a specific policy on diversity of the Board, our Corporate Governance Guidelines (“Governance Guidelines”) provide that candidates for the Board should have the ability to contribute to | |||||
| • | |||||
| • | Two director nominees serve on the boards of non-U.S. public companies. | ||||
| • | One director nominee is | ||||
| UTC’s Governance Guidelines are available at:http://www.utc.com/Our-Company/Corporate-Governance/Pages/Governance-Documents-and-Policies.aspx. | |||||
The Committee on Nominations and Governance considers candidates who are suggested by directors, management and shareowners and who meet the qualifications UTC seeks in its directors. The Board will consider director candidates recommended by shareowners. A shareowner may recommend a director candidate by submitting a letter addressed to the Corporate Secretary.Secretary at UTC, 10 Farm Springs Road, Farmington, CT 06032. The Company may also engage search firms from time-to-timetime to time to assist in identifying and evaluating qualified candidates.
PROPOSAL 1 ELECTION OF DIRECTORSNominees
NOMINEES
Our entire Board is elected annually by our shareowners. The Board, upon the recommendation of the Committee on Nominations and Governance, has nominated the twelve nomineesthirteen individuals listed in this Proxy Statement, each of whom is a current director. The Board has determinedbelieves that each nominee brings to the Board a range of these nominees brings strong skills and extensive experience, as highlighted in each nominee’s biographical information on pages 3 to the10. The Board givingbelieves that the nominees as a group possess the appropriate skills to exercise the Board’s oversight responsibilities.
UTC’s Governance Guidelines require that
Under the Board’s current policy, directors are required to retire from the Board as ofat the annual meeting after they reach age 72. In October 2013,However, the Board reviewedcan make an exception to this policy in special circumstances. Citing such circumstances, the Board has nominated both General Richard B. Myers and revised UTC’s director retirement policy to allow a director to be nominated for election after age 72 if warranted by special circumstances approved by the Board. In nominating the twelve candidatesH. Patrick Swygert to stand for election at the 20142016 Annual Meeting, theMeeting. The Board exercised this discretion with respectwishes to General Richard B. Myers. Taking into accountretain General Myers’ extensive senior levelleadership experience ininvolving military, nationalglobal security and government relations matters, thegeopolitical issues that are highly relevant to UTC’s global businesses at this time. The Board determined that it isalso wishes to retain Mr. Swygert in the interestview of his role and contributions as a member of the Company to waive the normal retirement policy to allow him to stand for election in 2014.
THE BOARD OF DIRECTORS UNANIMOUSLY RECOMMENDS THAT SHAREOWNERS VOTE FOR EACH OF THE FOLLOWING NOMINEES:Committee on Nominations and Governance, as well as two other key Board committees.
| 2 | |
|
If, prior to the Annual Meeting, any of the Board’s nominees become unavailable to serve, the Board may select a replacement nominee or reduce the number of directors to be elected. The proxy holders will vote the shares for which they serve as proxy for any replacement candidate nominated by the Pratt & Whitney division of UTC from April 1999 through March 2006. Mr. Chênevert is a member of the Executive Committees of both the Business Roundtable, where he chairs the Tax and Fiscal Policy Committee, and the Business Council and he is a member of the US-India CEO Forum. He also serves on the Board of Directors of Cargill, Inc. and the Congressional Medal of Honor Foundation, and is Chairman of the Yale Cancer Center’s Advisory Board. Mr. Chênevert is a founding director and Chairman of the Board of Directors for the Friends of HEC Montréal and Chairman of HEC Montréal’s International Advisory Board. In 2005, Mr. Chênevert was inducted as a Fellow of the American Institute of Aeronautics and Astronautics (AIAA).
 |  |
• Demonstrated leadership skills, with focus on operational excellence and attainment of financial objectives under changing economic and competitive conditions
• Extensive operating executive experience acquired in major aerospace and advanced technology businesses with global activities
• Experienced in driving enterprise transformation, integration of acquired businesses and development of innovative technologies
| |||||
| JOHN V. FARACI | |||||
 Retired Chairman & Chief
Age:
| |||||
| |||||
PROPOSAL 1 ELECTION OF DIRECTORS
Committees: Compensation and |
Mr. Faraci is a director of PPG Industries, Inc. and ConocoPhillips. He also serves on the
| Key Skills and Expertise | |||||||
 |
| ||||||||
 | BROAD INTERNATIONAL EXPOSURE Led large operations. | ||||||||
 | Qualifies as an audit committee financial expert, based on oversight of CFO and | ||||||||
• Experience overseeing extensive strategic changes in business portfolio
• Commitment to responsible stewardship
| Proxy Statement and Notice of | 3 |
| |||||
| |||||
| JEAN-PIERRE GARNIER | |||||
 Chairman, Actelion Ltd.
Age:
Committees: Compensation and Executive Development
| |||||
| |||||
Dr. Garnier served as Chairman of | Key Skills and Expertise | ||||||||
| CEO EXPERIENCE Served as CEO for two large public companies. Oversaw post-merger integration of large public companies. Named to | ||||||||
| BROAD INTERNATIONAL EXPOSURE Acquired extensive knowledge of U.S. | ||||||||
|
| ||||||||
| |||||
| GREGORY J. HAYES | |||||
 President and Chief
Age:
| |||||
Committees: Executive Finance | |||||
MR. HAYESwas elected President and CEO of UTC in November 2014. Before becoming our CEO, he had served as UTC’s Senior Vice President & Chief Financial Officer since 2008. He previously served as Vice President, Accounting and Finance from 2006 to 2008; as Vice President, Accounting and Controls from 2004 to 2006; as Vice President and Controller from 2003 to 2004; and as Vice President, Financial Planning & Analysis for the Hamilton Sundstrand segment of UTC from 1999 to 2003.
Mr. Hayes came to UTC through the 1999 merger with Sundstrand Corporation. Mr. Hayes has been a director of Nucor Corporation since 2014, where he serves on the Audit Committee, the Compensation and Executive Development Committee and the Governance and Nominating Committee. He is a board member of the New England Air Museum. | |||
PROPOSAL 1 ELECTION OF DIRECTORS
| CEO EXPERIENCE President and CEO since November 2014. | |||||
|
| |||||
 | EXTENSIVE KNOWLEDGE OF COMPANY’SBUSINESS, INDUSTRY AND OPERATIONS Through six years as our CFO, and his previous senior financial leadership positions, gained deep understanding of UTC’s operations, complex financial transactions and the operational and financial impact of numerous acquisitions, divestitures and restructuring actions, as well as the integration of major operations. |
| 4 | |
| |||||
| EDWARD A. KANGAS | |||||
 Former Chairman & Chief
Age:
| |||||
| |||||
Committees:
Audit |
Society. | Key Skills and Expertise | |||||||
| Experience as CEO of a major accounting firm and as chair of two other public companies. | ||||||||
| HIGH LEVEL OF FINANCIAL EXPERTISE Qualifies as an audit committee financial expert. Extensive financial and accounting expertise acquired through oversight of audits of public companies in diverse industries. | ||||||||
 | Extensive experience in risk management and oversight as Chairman & CEO of a major global accounting | ||||||||
• Audit committee financial expert

| |||||
| ELLEN J. KULLMAN | |||||
 Retired Chair of the Board
Age:
| |||||
| |||||
PROPOSAL 1 ELECTION OF DIRECTORS
Committees:
Audit |
Mrs. Kullman is | Key Skills and Expertise | |||||||
| Retired CEO of innovative S&P 100 company with global operations. | ||||||||
 | Through career at DuPont and training as an engineer, has acquired extensive experience in the application of market-driven science to new product development. | ||||||||
| Extensive experience implementing business strategies in global | ||||||||
| 5 |
| |||||
| MARSHALL O. LARSEN | |||||
Age:
| |||||
| |||||
Committees:
Finance |
| Key Skills and Expertise | |||||||
| Through service as CEO of Goodrich Corporation, has acquired extensive business and leadership experience in aerospace industry. | ||||||||
| In-depth knowledge of aerospace industry, conditions affecting the industry and key customers. | ||||||||
| Based on oversight of CFO at Goodrich, acquired extensive financial knowledge. Extensive senior management experience | ||||||||
| |||||
| HAROLD MCGRAW III | |||||
 Chairman Emeritus,
Age:
| |||||
| |||||
PROPOSAL 1 ELECTION OF DIRECTORS
Committees:
Compensation and Executive Development Finance Nominations and Governance |
He is Chairman of the Emergency Committee for American Trade, International Chamber of Commerce and the U.S. Trade Representative’s Advisory Committee for Trade Policy & | Key Skills and Expertise | |||||||
| Served as CEO of McGraw Hill Financial from 1998 to 2013 and as Chairman of that large global enterprise from 1999 to 2015. | ||||||||
| Expertise on transformational changes to business portfolios,
| ||||||||
| BROAD INTERNATIONAL EXPOSURE Through experience as CEO, service as a director at several large global companies and leadership roles in other organizations, has acquired broad knowledge of global trade and business activities in diverse and challenging economic | ||||||||
| |
| |||||
| RICHARD B. MYERS | |||||
 Ret. General, U.S. Air Force
Age:
| |||||
| |||||
Committees:
Audit |
Foundation, and a board member at several other non-profit organizations, including Fisher House and MRIGlobal. | Key Skills and Expertise | |||||||
 | Extensive senior leadership experience businesses. | ||||||||
| Based on extensive experience in military and U.S. Government, provides important perspectives on opportunities and challenges for UTC’s government contracting businesses. | ||||||||
| Provides important insights into organizational adjustment to address diverse economic | ||||||||
| 7 |
| |||||
| FREDRIC G. REYNOLDS | |||||
 Retired Executive Vice Age:65 Committees: Audit | MR. REYNOLDSserved as Executive Vice President and Chief Financial Officer of CBS Corporation (media) from 2005 until his retirement in 2009, following a long career with CBS and its predecessor companies. This included serving as President and CEO of Viacom Television Stations Group from 2001 to 2005; as Executive Vice President and Chief Financial Officer of Viacom, Inc. from 2000 to 2001; and as Executive Vice President and Chief Financial Officer of CBS Corporation and its predecessor, Westinghouse Electric Corporation, from 1994 to 2000. Earlier in his career, Mr. Reynolds spent twelve years at PepsiCo, Inc. (food and beverages), where he held a number of senior positions, including serving as Chief Financial Officer or Financial Officer of several of the company’s major businesses. Mr. Reynolds is a director of Mondelēz International (formerly Kraft Foods Inc.), Hess Corporation and Metro Goldwyn Mayer, Inc. (non-public), and is a former director of AOL, Inc. (2009 to 2015). | Key Skills and Expertise | |||
| HIGH LEVEL OF FINANCIAL EXPERTISE Certified public accountant and qualifies as an audit committee financial expert. Served as CFO for public companies operating in diverse and challenging conditions, including transformative changes. | ||||
| TECHNOLOGY-RELATED PRODUCTDEVELOPMENT/MARKETING Extensive experience in evaluating investments in rapidly changing technologies for producing and distributing media products in diverse, highly competitive global markets. | ||||
| RISK MANAGEMENT/OVERSIGHT Significant knowledge of risk management and oversight, gained through extensive experience as a CFO and service on public company audit committees. | ||||
| BRIAN C. ROGERS | |||||
 Chairman, T. Rowe Price Age:60 Committees: Compensation and | MR. ROGERShas been Chairman of T. Rowe Price Group (investment management) since 2007 and has also served as Chief Investment Officer of that company since 2004. He has been a director of the Price Group since 1997. In addition, he was portfolio manager of one of the firm’s largest funds, the T. Rowe Price Equity Income Fund, from its inception until October 2015. Mr. Rogers has held a variety of other senior leadership roles with T. Rowe Price since beginning his career there in 1982 and has been involved in investment management for the company since 1983. Mr. Rogers is a member of the Johns Hopkins University and Johns Hopkins School of Medicine Boards of Trustees, chairman of the finance committee for the Archdiocese of Baltimore and a board member of the Greater Baltimore Committee. He also serves on the investment committee for Vanderbilt University. | Key Skills and Expertise | |||
| HIGH LEVEL OF FINANCIAL EXPERTISE Chartered Financial Analyst and Chartered Investment Counselor. | ||||
| EXTENSIVE KNOWLEDGE OF COMPANY’SBUSINESS, INDUSTRY AND OPERATIONS Based on his extensive experience as an investment manager, provides unique expertise and perspective on large public company performance, opportunities and investor expectations. | ||||
| RISK MANAGEMENT/OVERSIGHT Significant knowledge of risk management and oversight, acquired through his broad experience in investment management, including Chief Investment Officer of a large investment management firm. | ||||
| 8 | |
| H. PATRICK SWYGERT | |||||
 President Emeritus,
Age:72
| |||||
| |||||
PROPOSAL 1 ELECTION OF DIRECTORS
Committees:
Audit Compensation and Executive Development Nominations and Governance |
Howard University School of Law. | Key Skills and Expertise | |||||||
| Experience in leadership roles at major educational institutions, as well as service on board audit and risk committees at two public companies, has given him extensive knowledge of financial and disclosure considerations. | ||||||||
| GOVERNMENT AND GEOPOLITICAL Based upon his experience in senior leadership
issues. | ||||||||
| Through experience in strategic planning, risk management | ||||||||
| 9 |
| |||||
| ANDRÉ VILLENEUVE | |||||
 Chairman, ICE Benchmark
Age:
| |||||
| |||||
Committees:
Audit |
| Key Skills and Expertise | |||||||
|
| ||||||||
| HIGH LEVEL OF FINANCIAL LITERACY Extensive expertise
expert. | ||||||||
| As a participant in several government advisory boards, has acquired significant insights into financial market and economic | ||||||||

| |||||
| CHRISTINE TODD WHITMAN | |||||
 President, The Whitman
Age:69
| |||||
Committees:
| |||||
PROPOSAL 1 ELECTION OF DIRECTORS
| Key Skills and Expertise | ||||||||
| Extensive senior leadership experience in U.S. and state executive functions. Provides important perspectives on environmental, public policy and government relations issues. | ||||||||
| Through her career in
| ||||||||
| matters. | ||||||||
|
| ||||||||
| |||||||||
| |||||||||
| 10 | |
OUR COMMITMENT TO SOUND CORPORATE GOVERNANCEOur Commitment to Sound Corporate Governance
UTC is committed to strong corporate governance practices designed to maintain high standards of oversight, integrity and ethics, while promoting long-term growth in long-term shareowner value.
Our governance structure enables independent, experienced and accomplished directors to provide advice, insight and oversight to advance the interests of the Company and our shareowners. UTC has long maintainedstrived to maintain sound governance standards, as reflected in our Code of Ethics and Governance Guidelines and in our systematic approach to risk management, and ismanagement. We are committed to transparent financial reporting and strong internal controls.
We encourage you to visit the Corporate Governance section of our website (http://www.utc.com/Our-Company/Corporate-Governance/Pages/default.aspx), where you will find detailed information about corporate governance at UTC, including: | ||||
| • | Our Governance Guidelines | |||
| • | Charters for our Board Committees | |||
| • | Our Code of Ethics | |||
| • | Our Certificate of Incorporation and Bylaws | |||
| • | Information about our Ombudsman/DIALOG program, which allows UTC employees to raise questions confidentially and outside the usual management channels | |||
| • |
| |||
Board Leadership Structure
In November 2014, the Board elected Edward A. Kangas, an independent director, to serve as non-executive Chairman of the Board.
POLICY ON CHAIRMAN AND CEO ROLES
The Committee on Nominations and Governance periodically reviews our governance practices and board leadership structure. As provided in UTC’s Governance Guidelines, the Board has no fixed policy on whether or not the Company’s Chief Executive Officer also is permitted simultaneously to serve as Chairman of the Board. Instead, the Board believes this determination should be based on the Company’s best interests in light of the circumstances, which may vary over time. The Board, therefore, reserves the authority to choose the structure that it believes will provide the most effective leadership and oversight for the Company, while also facilitating the effective functioning of both the Board and management. In making this decision, the Board considers a range of factors, including: the Company’s operating and financial performance under the then-existing structure; any recent or anticipated changes in the CEO role; the effectiveness of then-current processes and structures for Board interaction with and oversight of management; and the importance of maintaining a single voice in leadership communications and Board oversight, both internally and with investors.
| Proxy Statement and Notice of 2016 Annual Meeting of Shareowners | 11 |
DIRECTOR INDEPENDENCE
Taking these considerations into account, the Board has concluded that the separation of the roles of Chairman and Chief Executive Officer best serves the interests of shareowners and the Company at this time. However, the Board has combined and separated the Chairman and CEO positions in the past and will continue to exercise its judgment on this matter going forward.
In February 2015, the Board amended UTC’s Bylaws and Governance Guidelines to more fully define the responsibilities of a non-executive Chairman. These responsibilities include:
| • | presiding at meetings of the Board of Directors and shareowners; |
| • | presiding at executive sessions of the non-management directors and providing feedback to the CEO; |
| • | the authority to call meetings of the directors and of shareowners; |
| • | at the request of the Board of Directors, serving as liaison between the Board and the CEO; |
| • | in conjunction with the CEO, planning and organizing the activities of the Board, including agendas and schedules for meetings; and |
| • | communicating annually to the CEO, the Board’s evaluation of his or her performance. |
POLICY ON NON-MANAGEMENT LEADERSHIP ROLE
The Board firmly supports maintaining a non-management director in a leadership role at all times, whether as non-executive Chairman or as Lead Director. In February 2015, the Board amended UTC’s Bylaws and Governance Guidelines to require the election by the Board of a non-management director to serve as Lead Director whenever the role of Chairman is held by the CEO or another UTC executive. In those circumstances, the Lead Director would be charged with, among other duties, coordinating the activities of the independent directors and serving as a liaison between the Board and management. The Board believes that the presence of a Lead Director will enhance the effectiveness of the independent directors and provide a channel for non-management directors to candidly raise issues or concerns for Board consideration.
The Board believes that the existence of an independent, non-executive Chairman or Lead Director, with defined responsibilities that include participation in planning meeting agendas, also enhances oversight of risk management. The Chairman or a Lead Director, and any of the other non-management directors, are free at any time to raise matters at Board and committee meetings.
UTC’s non-management directors meet in regularly scheduled executive sessions without any members of management present and in additional executive sessions as requested by directors. In practice, these executive sessions occur before or after most Board meetings. The purpose of these executive sessions is to promote open and candid discussion among the non-management directors.
Director Independence
The Board has adopted independence standards for directors that satisfy the corporate governance requirements for companies listed on the New York Stock Exchange (“NYSE”). You can find more details about these standards in our Governance Guidelines.
The Board has determined that each of the nominees for election at the Annual Meeting, other than Mr. Chênevert, isHayes, qualifies as independent of UTC under thesethe independence standards. Specifically, none of the nominees, other than Mr. Chênevert,Hayes, has a business, financial, family or other relationship with UTC that is considered to be material under UTC’s independence standards (other than their relationship as a director and shareowner).
| 12 | |
standards. In determining the independence of our directors, the Board considered the relevant facts and circumstances bearing on the independence of each of the nominees, including charitable contributions that UTC made to non-profit organizations with which some nominees are or have been associated. It also considered sales and purchases of products and services, in the ordinary course of business, between UTC (or its subsidiaries) and companies where some nominees are or have been employed as executive officers.
In all cases thateach of 2013, 2014 and 2015, the Board considered for 2011, 2012 and 2013, theannual payments UTC made or received for products and services or the charitable contributions it made by UTC fell well below the thresholds in our independence standards (the greater of $1 million or 2% of total gross revenues of the other organization). NoneIn particular, none of the payments made or received by UTC exceeded the greater of $1 million or 0.5% of the other organization’s totalconsolidated gross revenues. The following table shows the 2015 relationships that existed in 2013 and were considered by the Board in determining the independence of nominees.
CORPORATE GOVERNANCE
DIRECTOR INDEPENDENCE DETERMINATIONS: RELATIONSHIPS CONSIDERED
| Director | Organization and Director’s Relationship | |||||||||
|
|
|
| Type of Transaction, Relationship
of Organization with UTC | Total
| |||||
| International Paper(Corporation) Chairman & CEO (until his retirement from those positions in 2014) | Sales to UTC of paper products; purchases from UTC | $ 5,163,683; | |||||||
| ||||||||||
Non-Executive Chairman (until May 2015) |
| |||||||||
| Purchases from UTC of | $ | ||||||||
| DuPont | (Corporation) Chair & Chief Executive Officer (until her retirement from those positions in October 2015) | Sales to UTC of materials; purchases from UTC | $ 30,772,768; | ||||||
| McGraw Hill Financial, Inc.(Corporation) Chairman (until his retirement from that position in April 2015) | Fees paid by UTC for credit ratings in connection with debt securities issued by UTC and fees for industry statistics and reports. | ||||||||
| ||||||||||
(Non-profit supporting U.S. troops and families) Chairman (through October 2015) | Charitable contributions received from UTC. | (1) | ||||||||
| (support for university) Chairman (through September 2015) |
| (1) | |||||||
| ||||||||||
Chairman & Chief Investment Officer | Purchases from UTC | $177,230 | ||||||||
| H. PATRICK SWYGERT | Howard University(Educational Institution) Professor Emeritus, former President | Purchases from UTC of elevator maintenance services; charitable contributions and recruiting fees received from UTC. |
| |||||||
| $808,416 (1) | |||||||||
| Eisenhower Fellowship Foundation |
Board member | (1) | |||||||
| (1) | The total amount of UTC’s charitable contributions for |
BOARD LEADERSHIP STRUCTURE
CHAIRMAN
The Committee on Nominations and Governance reviews our governance practices and leadership structure. Under UTC’s Governance Guidelines, the decision as to whether the roles of Chairman of the Board and Chief Executive Officer should be separate or combined is made based on the Company’s best interests in light of the circumstances at the time, rather than under a fixed policy. Currently these roles are combined, with Mr. Chênevert serving as both the Chairman of the Board and the Chief Executive Officer. Given UTC’s strong financial performance over extended periods, the Board considers that the Company has been well served by this combined leadership structure over the years. In view of UTC’s complex and diverse operations, the Board believes that the current combined leadership structure enables us to act quickly, efficiently and decisively as we face challenges and opportunities. This structure also fosters consistent internal and external communication of critical strategies and business priorities.
| 13 |
INDEPENDENT LEAD DIRECTOR AND NON-MANAGEMENT DIRECTORS
The Board believes that UTC’s unitary leadership structure is appropriately balanced by the role of the Lead Director and the fact that all members of the Board, other than Mr. Chênevert, are independent. Our non-management directors meet in regularly scheduled executive sessions without any members of management present. The purpose of these executive sessions is to promote open and candid discussion among the non-management directors.
| ||||
| ||||
The Board believes that the existence of an independent Lead Director, with defined responsibilities that include participation in planning meeting agendas, facilitates its oversight of risk management and its communication with members of management. The Lead Director or any of the other non-management directors is free at any time to raise matters at Board and committee meetings.
MAJORITY VOTING FOR DIRECTORS
Under UTC’s Bylaws, in order for a director to be elected at the annual meeting in an uncontested election, a majority of the votes cast with respect to the director’s election must be castvoted “for” the director. Abstentions and broker non-votes are not considered votes cast. In an uncontested election, of directors, any incumbent director who receives a greater number of votes “against” his or her election than votes “for” his or her election must, under UTC’s Governance Guidelines, promptly tender his or her resignation to the Board’s Committee on Nominations and Governance. The Committee must then recommendsrecommend to the Board, within 90 days after the election, whether to accept or reject the resignation, a decision the Board must make within 90 days after the date of the meeting at which the election took place.resignation. The director who tendered his or hera resignation may not participate in this decision. TheRegardless of whether the Board accepts or rejects the resignation, the Company must then promptly file a Report on Form 8-K with the Securities and Exchange Commission (“SEC”) in which it publicly discloses and explains the Board’s decision on the resignation.decision.
If a director’s resignation is accepted, the Committee also will recommend to the Board whether the vacancy should be filled or whether the size of the Board should be reduced.
CORPORATE GOVERNANCE Under the Bylaws, a vacancy arising in these circumstances may be filled, at the discretion of the Board, by a majority vote of the directors or at a special meeting of shareowners called by the Board.
BOARD COMMITTEES
The five standing committees of the Board include:are: the Audit Committee, the Committee on Nominations and Governance, the Committee on Compensation and Executive Development, the Finance Committee and the Public Issues Review Committee. Each of these committees, other than the Finance Committee, is composed exclusively of directors determined by the Board to be independent.independent, and in the case of the Audit Committee, the Committee on Nominations and Governance and the Committee on Compensation and Executive Development, satisfy the corporate governance requirements imposed by the NYSE. The Chairchairperson of each Committeecommittee reports to the Board on actions taken at each meeting.
The charter
Each committee has authority to retain independent advisers to assist in the fulfillment of eachits responsibilities, to approve the fees paid to those advisers and to terminate their engagements. All committee ischarters are available on UTC’s website at:http://www.utc.com/Governance/Board+of+DirectorsOur-Company/Corporate-Governance/Pages/Governance-Documents-and-Policies.aspx.
AUDIT

The Audit Committeeassists the Board in overseeing the reliability and integrity of UTC’s financial statements, the qualifications and independence of the Independent Auditor, and UTC’s policies and practices to assess and manage exposure to risk. Each year the Committee nominates, for appointment by shareowners, an accounting firm to serve as Independent Auditor and is responsible for the compensation, retention and oversight of the Independent Auditor. The Board has determined that Directors Kangas, Kullman, Reynolds and Villeneuve each are “audit committee financial experts”, as that term is defined in SEC rules.
 | Edward A. Kangas (Chair) | |
| Ellen J. Kullman Richard B. Myers Fredric G. Reynolds(1) H. Patrick Swygert André Villeneuve | ||
| 2015 Meetings:8 | ||
NOMINATIONS AND GOVERNANCE
The Committee on Nominations and Governanceidentifies and periodically reviews the qualifications that the Board uses to select director candidates and, when there is a vacancy on the Board, the Committee identifies, evaluates and recommends candidates to be nominated by the Board for election by our shareowners (or to be elected by the Board, if it chooses to fill a vacancy arising between shareowner meetings). The Committee also reviews and assesses the effectiveness of UTC’s nomination policies on an annual basis. For more information about how the Committee identifies candidates, see the discussion of Board membership criteria and the nomination process in Proposal 1—Election of Directors on pages 1 and 2 of this Proxy Statement.
 | H. Patrick Swygert (Chair) | |
John V. Faraci | ||
| (1) | Appointed a member of Committee effective February 8, 2016. |
| 14 | |
COMPENSATION AND EXECUTIVE DEVELOPMENT
The Committee on Compensation and Executive Developmentreviews and oversees executive compensation and development programs, determines what corporate goals and objectives are relevant to CEO compensation and sets the CEO’s compensation based on an evaluation of performance in light of these goals and objectives. In addition, the Committee reviews and oversees the design of the long-term incentive plans and annual incentive compensation, as well as compensation policies and practices and their associated risks.
The Committee makes compensation decisions for UTC’s Executive Leadership Group (“ELG”) members, which include each of the Named Executive Officers (“NEOs”) listed in this Proxy Statement, and also reviews UTC’s programs and policies for management development and succession.
While the President and CEO makes recommendations to the Committee on the type and amount of compensation for each ELG member, the Committee, subject to Board oversight, is the final decision-maker regarding the compensation paid to those executives. However, the President and CEO is not at any time involved in the determination of his own compensation. The President and CEO and the Executive Vice President & Chief Human Resources Officer determine the compensation of other executives and oversee compensation program administration.
While the President and CEO and the Executive Vice President & Chief Human Resources Officer attend Committee meetings regularly by invitation, the Committee considers certain matters in private executive sessions. For additional information as to the functions and processes overseen by the Committee, see the Compensation Discussion and Analysis that begins on page 27 of this Proxy Statement.
 |
| |||
| ||||
| 2015 Meetings: | ||||
FINANCE
The Finance Committeereviews and, as appropriate, makes recommendations to the Board on the management of the Company’s financial resources and strategies. It considers plans for significant acquisitions and divestitures and their potential financial impact, and monitors progress on pending and completed transactions. The Committee also reviews significant financing programs in support of business objectives; policies on investments and uses of cash; significant capital appropriations; dividend policies; share repurchase programs; risks and exposures related to capital structure, liquidity, financing, pension funding and investment performance; insurance programs; and investment of pension assets and other significant transactions.
 | ||||||
John V. Faraci
| ||||||
(Chair) | ||||||
| Gregory J. Hayes Ellen J. Kullman Marshall O. Larsen Harold McGraw III Brian C. Rogers(1) André Villeneuve Christine T. Whitman | ||||||
| 2015 Meetings:4 | ||||||
| (1) | Appointed a member of Committee effective February 8, 2016. |
COMMITTEE ON
NOMINATIONS AND
GOVERNANCE
| Proxy Statement and Notice of 2016 Annual Meeting of Shareowners | 15 |
PUBLIC ISSUES REVIEW
The Public Issues Review Committeereviews and monitors UTC’s positions on and responses to significant public policy issues, including: our policies and objectives with respect to safety and the environment and our compliance with related laws and regulations in the U.S. and other countries; plans and performance related to ensuring equal employment opportunities; significant legislative and regulatory issues that may affect UTC and its operations; actions and objectives to further corporate social responsibility; policies and priorities for contributions to charitable, educational and other tax-exempt organizations involved in the arts, civic and community affairs, education and health and human services; community relations programs; and our conduct of public policy and government relations activities, including the activities of UTC’s political action committee. The Committee also reviews UTC’s annual Corporate Responsibility Report and oversees risk management policies and practices with regard to social responsibility, reputation, safety and the environment.
 |
| |||||
| ||||||
Jean-Pierre Garnier
| ||||||
|
| |||||
| ||||||
|
Ellen J. Kullman Marshall O. Larsen André Villeneuve | ||||
| 2015 Meetings: | ||||
CORPORATE GOVERNANCEMeeting Attendance
|
| |||||
| ||||||
| ||||||
|
| |||||
| ||||||
|
MEETING ATTENDANCE
The Board met seventen times during 2013.2015. Each director attended 75% or more of the aggregate number of meetings of the Board and committees on which he or she served. The Board’s policy is that each director, if standing for re-election, should attend the Annual Meeting of Shareowners if his or her schedule permits.unless there is an unavoidable scheduling conflict. All of the current directors other than Ms. Gorelick (who was unable to attend due to a broken ankle) attended the last2015 Annual Meeting, held in April 2013.except Messrs. Reynolds and Rogers, who were elected to the Board effective January 1, 2016.
DIRECTOR STOCK OWNERSHIP REQUIREMENTS
Director Stock Ownership Requirements
To strengthen alignment with the interests of shareowners, each non-management directors aredirector is required to own shares of Common Stock, deferred stock units or other Common Stock equivalents having a value equal to at least five times the annual base cash retainer. In 2015, the base cash retainer amount.was $112,000, thereby establishing an ownership requirement of at least $560,000. Non-management directors must achieve this ownership level within five years after first becoming a member of the Board. In 2013, the base cash retainer was $104,000, thereby establishing an ownership requirement of at least $520,000. Each of the non-management directors is in compliance with this ownership requirement.requirement or additional time remains available within the five year period.
HOW WE MANAGE RISK
How We Manage Risk
OUR RISK MANAGEMENT FRAMEWORK
During 2014, UTC has adoptedrevised its enterprise risk management (“ERM”) program and policies based onto conform to the Integratedcriteria established in the Internal Control-Integrated Framework ofissued by the Committee of Sponsoring Organizations of the Treadway Commission (“COSO”) issued in 1992.2013. Under our policies, the presidents of major business units are responsible for identifying risks that could affect achievement of business goals and strategies, assessing the likelihood and potential impact of significant risks, and prioritizing thethese risks that are identified and the actions to be taken to address these risks.them. The presidents of major business units report to the CEO on actions to monitor and manage significant risks in order to remain within UTC’s range of risk tolerance.tolerance ranges.
| 16 | |
BOARD RISK OVERSIGHT
The CEO, Chief Financial Officer and General Counsel periodically report on UTC’s risk management policies and practices to relevant Board committees and to the full Board. The Audit Committee annually reviews major financial risk exposures and a number of operational, compliance, reputational and strategic risks, as well as practices to monitor and manage those risks. The Audit Committee also reviews UTC’s overall policies and practices for enterprise risk management, including the delegation of oversight for particular areas of risk to the appropriate Board committees. As a whole, the Board also reviews risk management practices and a number of significant risks in the course of their reviewsits review of corporate strategy, business plans, reports of Board committee meetings and other presentations.
BOARD AND COMMITTEE RISK OVERSIGHT RESPONSIBILITIES
Board and Committee Risk Oversight Responsibilities
Board/Committee | Primary Areas of Risk Oversight | |
| Full Board | Risk management process and structure, strategic risks associated with UTC’s business plan and other significant risks, such as major litigation, business development risks and succession planning. | |
| Audit Committee | Major financial risk exposures; significant operational, compliance, reputational, strategic and | |
Committee on Nominations and Governance | Risks and exposures related to corporate governance, leadership structure, effectiveness of Board and committee oversight; and review of director candidates, conflicts of interest and director independence. | |
| Committee on Compensation and Executive Development | Risks related to executive recruitment, assessment, development, retention and succession policies and programs; and risks associated with compensation policies and practices, including incentive compensation. | |
| Finance Committee | Risks and exposures related to capital structure, liquidity, financing, pension funding and investment performance and significant capital transactions, including acquisitions and divestitures. | |
Public Issues Review Committee | Risks related to the environment and workplace safety, equal employment opportunity, responses to important public issues, government relations and other matters involving reputational risks. | |
COMPENSATION AND RISK MITIGATION
The Committee on Compensation and Executive Development (the “Committee”) believes that executive compensation should be contingent on performance relative to pre-established targets and objectives. Our executives must however, achieve these targets and objectives in a manner consistent with UTC’s ethical standards and internal policies. The Committee alsofirmly believes that executive compensation should not reward accomplishments however impressive in the short-term, that compromise UTC’s standards or long-term shareowner value.
Compensation arrangements, if not properly designed and administered, can encourage excessive risk taking and jeopardize long-term Company performance and shareowner value. Therefore, one of the goals of UTC’s executive compensation program is to motivate executives in a manner that appropriately balances financial opportunity and risk.
Enterprise Risk Management (“ERM”) Program.UTC mitigates compensation-related risksrisk to its long-term performance, ethical standards and reputation in the following ways:
CORPORATE GOVERNANCE
Monitor Risk under our Enterprise Risk Management Program (“ERM”).by monitoring these risks as part of UTC’s ERM program. The Board of Directors annually reviews the ERM program to identify, monitor and manage risk throughout the Company and its business units. The ERM program recognizes executive compensation as a potential risk factor.factor, which UTC seeks to mitigatemitigates in the following ways:
| 17 |
| • |
Prohibition of UTC Common Stock or stock units. Our CEO, Mr. Hayes, has a share ownership requirement equal to six times his base salary. Share holdings of other ELG members must equal at least three times their base salary within five years of appointment to the ELG. Non-employee directors are also required to own shares or stock units equal to five times the cash portion of the annual base retainer.
Clawback Policy. UTC currently has a comprehensive policy on recoupment (“clawback”) of executive compensation. This policy applies to both our annual and long-term compensation programs. Clawbacks can result in significant financial penalties and award forfeitures. In the event of a financial restatement or recalculation of a financial metric applicable to an award, annual bonus payments and gains realized from vested long-term incentive awards can be recouped from any executive (including all NEOs) involved in an action found to have caused the restatement or recalculation. The amount subject to recoupment will, at a minimum, equal the difference between what the executive received and what he or she would have received under the corrected financial metrics over at least the three-year period before the restatement. Clawbacks of bonuses, long-term incentive awards and compensation realized from prior awards also may result from entering into short sales of our securities or similar transactions where potential gains are linked to a decline in the value of our Common Stock. Recipients of equity awards may not enter into any agreement that has the effect of transferring or exchanging any economic interest in an award for any other consideration.
| 18 | |
Corporate Sustainability
We have a strong commitment to setting aggressive targets to minimize adverse environmental impacts of our products, operations and supply chain. Since 1992, UTC has established challenging and aggressive environmental, health and safety standards or exposing the Company(“EH&S”) goals, which we monitor and periodically reset. These goals are essential tools in our efforts to excessive risk, as determined under the ERM program. In Proposal 3 of this Proxy Statement, we are asking shareowners to approve amended language to clarify and further strengthencontinuously reduce our clawback policy. This language clarifies the Company’s right to clawback compensation when an executive’s negligence (including the negligent supervision of a subordinate) causes significant harm to the Company’s interests. The policy also permits public disclosure of the circumstances surrounding the Committee’s decision to seek recoupment where the Committee determines such disclosure is appropriate and would not expose the Company to legal risk.
Post-Employment Covenants. These arrangements prohibit ELG members from engaging in activities after termination or retirement that are detrimental to UTC, such as disclosing proprietary information, soliciting UTC employees and engaging in competitive activities. Violations can result in a clawback of long-term incentive awards.global footprint.
| Our performance surpassed all 2006 to 2015 environmental sustainability goals. |
PERFORMANCE VS. ENVIRONMENTAL SUSTAINABILITY GOALS (2006 vs. 2015)
Goal #1: Absolute greenhouse gas (“GHG”) emissions reduced by 32 percent.Through energy conservation, co-generation and process improvement projects across our enterprise, UTC is reducing both the climate change impacts and cost of our operations. These actions, and a commitment to continued reduction in absolute greenhouse gases, support UTC continuing on a path that is consistent with the United Nation’s Intergovernmental Panel on Climate Change 2050 GHG emissions target.
Goal #2: Absolute water consumption reduced by 37 percent.UTC operates in many parts of the world challenged by extreme water scarcity or limited water supply. By continuously reducing our own water use and implementing water management best practices, we reduce our risk of business disruption while also freeing up water resources that can then be used in surrounding communities. Additionally, by reducing our water use we also reduce the energy, and associated GHG emissions, needed to pump and treat water.
Goal #3: Absolute air emissions (non-greenhouse gases) reduced by 65 percent.UTC aggressively targets the reduction of air toxics or hazardous air pollutants from our manufacturing processes that could potentially impact worker health or contribute to the creation of ground-level ozone or other ambient air pollution.
Goal #4: Absolute total industrial process waste reduced by 43 percent.By continuously reducing our process waste generation, UTC addresses process and cost inefficiencies, and alleviates the burden on land and community resources at the local level.
Goal #5: Absolute non-recycled industrial process waste reduced by 43 percent.UTC targets the elimination of the portion of our industrial process waste that is currently not recycled, as our operations increasingly participate in an evolving circular waste economy. The U.S. EPA estimates that 42% of U.S. GHG emissions are attributable to materials management, so increased recycling contributes to a reduction in GHG emissions associated with our business operations.
| (1) | Reflects performance against initial goals as adjusted for acquisitions and divestitures. Consistent with The Green House Gas Protocol, UTC’s EH&S goals and targets are adjusted to reflect the impacts of acquired companies at the time of acquisition and to remove divested companies from UTC’s measured performance. For example, goals and actual performance were recalibrated beginning in 2013 to account for the impact of the Goodrich acquisition and for 2015 to reflect the sale of Sikorsky. UTC’s goals and targets are not adjusted for the opening of new facilities due to organic growth or for closures of facilities without a divestiture. | |
| Actual levels reflect data reported quarterly by UTC sites under common reporting and quality standards. Reported data are reviewed and consolidated by UTC Corporate staff. UTC annually submits site energy use and GHG emissions data to an independent review based on International Standards Organization 14064, Part 3 criteria for validation of GHG assertions. |

| Proxy Statement and Notice of | 19 |
2015 Recognition for World Class Sustainability Practices
Climate A List
The Carbon Disclosure Project named UTC among the top 5% of nearly 2,000 companies in 2015 for its actions and performance to reduce greenhouse gas emissions and mitigate climate change.
Industry Promotion Award
UTC was recognized byInternational ScienceMagazine for outstanding contributions to the growth of sustainable cities in China through the creation of innovative technologies and energy-efficient products.
2020 ENVIRONMENTAL SUSTAINABILITY GOALS*
Building on our 2015 achievements, our new 2020 environmental sustainability goals are as follows:
| -15% | -25% | -10% | 90% | -100% | |||||
| Greenhouse gas emissions | Water use | Hazardous waste | Waste recycled | Chlorinated and brominated solvent emissions |
| * | Relative to 2015 baseline year. |
UTC SUSTAINABLE TECHNOLOGIES
UTC is a leader in the development of cutting-edge, sustainable aerospace and building technologies. Some of our most groundbreaking, sustainable products include:
| • | Carrier Transicold and Refrigeration Systems’ cold-chain solutions preserve food from field to point of sale, helping reduce global food waste and its resulting environmental impact. |
| • | Carrier’s NaturaLINE uses a natural refrigerant combined with energy-efficient technology to reduce the carbon footprint of marine container refrigeration by 28% compared to conventional synthetic refrigerants. |
| • | Carrier’s CO2OLtec technologies replace HFC refrigerants with naturally occurring CO2 to reduce global warming impacts. |
| • | Carrier’s Infinity Control energy-efficient geothermal solutions can reduce heating and cooling costs by up to 70% compared to ordinary heating systems. |
| • | Otis’ ReGen technology captures energy generated during ascent and decent and recycles this energy back into a building’s power grid, reducing energy consumption by up to 75% compared to conventional drives. |
| • | Pratt & Whitney’s GTF engine decreases fuel burn by almost 16%, noise by 75% and nitric oxide emissions by 50%, as compared to conventional engines. |
Corporate Citizenship
As part of our commitment to corporate responsibility, we take great pride in building a diverse work environment, supporting lifelong learning for our employees and contributing to charitable and social causes in the communities where we do business. In the same way that we set the highest standards for our business operations, we apply the highest corporate responsibility standards and rigorous performance measurements to these efforts.
| 20 | |
DIVERSITY AND INCLUSION
We value the diversity of our people and their ideas. Our success as a global technology leader rests on unlocking the innovative potential of our employees. We are committed to building an inclusive, high-performing environment which allows everyone to contribute to their fullest potential.
2015 Diversity and Inclusion
Employee Inclusion and Engagement
Over 19,000 UTC employees belong to our nine* Employee Resource Groups, which provide employees at all organizational levels networking, development and leadership opportunities.
Best Places to Work for Latinas
In 2015, UTC was ranked as the 10thbest place to work for Latinas byLatina Style Magazine, continuing our improvement from #13 in 2014 and #35 in 2013.
Diversity in Our Suppliers
In 2015,DiversityBusiness.com named UTC the 29thbest organization for multicultural business opportunities; an award that recognizes UTC’s efforts to expand our diversity framework to our suppliers. 2015 marked the 10thconsecutive year in which UTC made the Top 50.
*Includes African-American, Asian-American, Employment Disability, Hispanic, InterGenerational, LGBT, Military/Veterans, Women and Professionals.
COMMUNITY INVOLVEMENT
Our people lead in their communities, volunteering time, talent and expertise everywhere across the globe.
In 2015, UTC continued to support a number of leading nonprofit organizations around the globe. We focused contributions in areas including STEM education (through grants toFIRST Robotics) and sustainable cities (through grants to the U.S. Green Building Council’s Center for Green Schools). From major investments in the United Way and the American Red Cross to significant support for health, artistic and cultural institutions in the communities where we do business, UTC and its employees are committed to making the world a better place.
EMPLOYEE SCHOLAR PROGRAM
We support and pursue lifelong learning to expand our employees’ knowledge and capabilities and to engage with the world outside UTC. We want to have the best-educated workforce on the planet. Our Employee Scholar Program, which has been in place since 1996, is one of the most comprehensive, Company-sponsored employee education programs in the world.
| 37,800+ |  | 7,300+ | ||
| Degrees earned | Employees participated in 2015 | |||
 | $1.2BILLION |  | 50+ | |
| Invested | Countries with participating employees since 1996 |
| Proxy Statement and Notice of 2016 Annual Meeting of Shareowners | 21 |
Annual Retainer
In 2013,2015, the compensation of non-employee directors consisted of an annuala retainer that was paid partially in cash and partially in deferred stock unit retainer. units (“DSUs”). Following termination of a non-employee director’s service on the Board, DSUs are converted into shares of Common Stock, which can be distributed either in a lump-sum payment upon retirement or in ten- or fifteen-year installments.
The following table shows the annual retainer amounts in effect for non-employee directors for service from April 2015 to April 2016:
| Role | Cash | Deferred Stock Units | Total | ||||
| Non-Executive Chairman of the Board | $192,000 | $288,000 | $480,000 | ||||
| Audit Committee Chair | $128,000 | $192,000 | $320,000 | ||||
| Audit Committee Member | $124,000 | $186,000 | $310,000 | ||||
| Committee on Compensation and Executive Development Chair | $122,000 | $183,000 | $305,000 | ||||
| Finance Committee Chair | $122,000 | $183,000 | $305,000 | ||||
| Committee on Nominations and Governance Chair | $120,000 | $180,000 | $300,000 | ||||
| Public Issues Review Committee Chair | $120,000 | $180,000 | $300,000 | ||||
| Non-Employee Director | $112,000 | $168,000 | $280,000 |
If a director served in multiple roles, his or her annual cash retainer and annual deferred stock unit (“DSU”)DSU award was based on the capacity for which the level of compensation was the highest. Non-employee directors received amounts for the following services in 2013:
Element
|
| Base Retainer
|
|
| Lead Director
|
|
| Audit Committee Chair
|
|
|
Committee on
|
|
| Committee Chair
|
|
| Audit Committee Member
|
| ||||||
Annual Cash
| $104,000 | $120,000 | $120,000 | $112,000 | $110,000 | $116,000 | ||||||||||||||||||
Deferred Stock Units
| $156,000 | $180,000 | $180,000 | $168,000 | $165,000 | $174,000 | ||||||||||||||||||
Total
| $260,000 | $300,000 | $300,000 | $280,000 | $275,000 | $290,000 |
Effective April 29, 2013, the total compensation amounts for all positions increased by $20,000, with an additional $5,000 increase for the Chairman of the Committee on Compensation and Executive Development. These increases were made to better align director compensation with the market and are reflected in the table above.
Non-employee directors receive 40% of their totalthe annual retainer in cash and 60% in deferred stock units. Alternatively,DSUs, unless they may elect to receive theirthe entire retainer fee in DSUs. The number of DSUs credited to each director in 2013 was calculated by dividing the cash value of the director’s compensation by $91.62, the NYSE closing price of Common Stock on April 29, 2013, the date of the 2013 Annual Meeting. Directors do not receive additional compensation for attending regularly scheduled Board and Committee meetings. However, non-employee directors do receive an additional $5,000 for each special meeting they attendattended in person. There were no special Board or Committee meetings of the Boardattended by directors in 2013.person during 2015.
Following termination of a non-employee director’s service, DSUs are converted into shares of Common Stock. The distribution of shares of Common Stock can be made in either a lump sum upon retirement or in ten- or fifteen-year installments.
One-Time RSU Awards for New Directors
Non-employee directors receive a one-time $100,000 restricted stock unit award (“RSU”) award when first elected to the Board. This award vests ratablyin equal portions over five years and is distributed to the director in shares of UTC Common Stock upon retirement, termination or death. No director received ana RSU award in 2013.2015.
Treatment of Dividends
When UTC pays a dividend on Common Stock, each director’s DSU and RSU balancedirector is credited with additional DSUs and RSUs respectively, having aequal in value equal to the dividend paid on the corresponding number of shares of Common Stock.
| 22 | |
2015 DIRECTOR COMPENSATION(1)
2013 Director Compensation
| |||||||||||||||||||
Name
|
Fees Earned or Paid in Cash ($) (1)
| Stock Awards ($) (2)
| All Other Compensation ($)
| Total ($)
| Fees Earned or Paid in Cash ($) | (2) | Stock Awards ($) | (3) | All Other Compensation ($) | Total ($) | |||||||||
Louis R. Chênevert
| $0 | $0 | $0 | $0 | |||||||||||||||
| Edward A. Kangas | $192,000 | $288,000 | $1,107 | $481,107 | |||||||||||||||
John V. Faraci
| $0 | $290,000 | $0 | $290,000 | $0 | $305,000 | $1,107 | $306,107 | |||||||||||
Jean-Pierre Garnier
| $0 | $280,000 | $0 | $280,000 | $0 | $305,000 | $1,107 | $306,107 | |||||||||||
Jamie S. Gorelick
| $104,000 | $156,000 | $0 | $260,000 | |||||||||||||||
Edward A. Kangas
| $0 | $300,000 | $223(3) | $300,223 | |||||||||||||||
Ellen J. Kullman
| $116,000 | $174,000 | $1,247(3) | $291,247 | $0 | $310,000 | $1,107 | $311,107 | |||||||||||
Marshall O. Larsen
| $0 | $260,000 | $2,363(3) | $262,363 | $0 | $280,000 | $1,144 | $281,144 | |||||||||||
Harold McGraw III
| $0 | $260,000 | $0 | $260,000 | $112,000 | $168,000 | $1,107 | $281,107 | |||||||||||
Richard B. Myers
| $116,000 | $174,000 | $0 | $290,000 | $124,000 | $186,000 | $1,107 | $311,107 | |||||||||||
H. Patrick Swygert
| $0 | $290,000 | $16,533(4) | $306,533 | $124,000 | $186,000 | $17,640 | (4) | $327,640 | ||||||||||
André Villeneuve
| $0 | $290,000 | $0 | $290,000 | $0 | $310,000 | $1,107 | $311,107 | |||||||||||
Christine T. Whitman
| $110,000 | $165,000 | $0 | $275,000 | $120,000 | $180,000 | $1,107 | $301,107 | |||||||||||
| (1) | Messrs. Reynolds and Rogers were elected to the Board of Directors effective January 1, 2016. No compensation was paid to either director for services performed in 2015. |
| (2) | Consists of the 2015 annual cash retainer |
| (3) | Consists of the grant date fair value of DSU awards credited to the account of the director, including the portion, if any, of the |
| Number of Unvested RSUs from the | Number of DSUs, Restricted | ||||||||||
Name
|
Number of Unvested RSUs Attributable to Initial $100,000 RSU Grant
| Number of Deferred Stock Units, Restricted Stock and Vested RSUs
| Number of Outstanding Stock Options
| One-Time $100,000 RSU Grant | Stock and Vested RSUs | ||||||
| Edward A. Kangas | — | 32,994 | |||||||||
John V. Faraci
| - | 34,719 | - | — | 41,575 | ||||||
Jean-Pierre Garnier
| - | 70,740 | 6,000 | — | 78,877 | ||||||
Jamie S. Gorelick
| - | 41,793 | 13,400 | ||||||||
Edward A. Kangas
| - | 25,991 | - | ||||||||
Ellen J. Kullman
| 506 | 6,495 | - | — | 11,595 | ||||||
Marshall O. Larsen
| 1,015 | 6,306 | - | 254 | 12,170 | ||||||
Harold McGraw III
| - | 42,230 | 13,000 | — | 47,042 | ||||||
Richard B. Myers
| - | 22,070 | - | — | 26,268 | ||||||
H. Patrick Swygert
| - | 49,755 | - | — | 55,231 | ||||||
André Villeneuve
| - | 66,146 | - | — | 74,277 | ||||||
Christine T. Whitman
| - | 26,718 | 13,000 | — | 30,997 | ||||||
| Consists of a premium payment on a life insurance policy used to fund Mr. Swygert’s participation in the Directors’ Charitable Gift Program. Mr. Swygert is the only non-employee director |
| 23 |
This section contains required information about certain “beneficial owners” of our Common Stock as that term is defined under SEC rules.
DIRECTORS, BOARD NOMINEES, AND EXECUTIVE OFFICERS
The following table shows the number of shares of Common Stock beneficially owned, as of March 1, 2014, by each ofFebruary 29, 2016, by: (a) our current directors, each of whom is a nominee for election as a director, by each of(b) the named executive officersNamed Executive Officers listed in the Summary Compensation Table on page 4857 of this Proxy Statement, and by all(c) our directors and current executive officers as a group. Each director and executive officer, and the directors and executive officers as a group, beneficially owned less than 1% of the outstanding shares of Common Stock as of that date. Except as explained in the footnotes to the following table, each person listed, and the members of the group, had sole voting power and sole investment power with respect to the shares shown.
Name | Shares Beneficially Owned | |
| ||
| ||
| ||
| ||
| ||
| ||
| ||
| ||
| ||
Brian C. Rogers | 2,511 | |
| H. Patrick Swygert | ||
André Villeneuve | ||
Christine T. Whitman |
| |
|
| |
|
| |
| ||
|
| |
Akhil Johri | 43,864 | |
| Directors & Executive Officers as a group |
| (1) |
| (2) | Paul Adams retired from the Company effective February 29, 2016. |
| (3) | Alain M. Bellemare retired from the Company effective January 31, 2015. |
| (4) | Geraud Darnis retired from the Company effective January 31, 2016. |
| (5) | Includes 1,546 shares of Common Stock |
| (6) | Consists of holdings of those directors and executive officers who continue to serve in such positions as of February 29, 2016 and, therefore, excludes the holdings of Messrs. Adams, Bellemare and Darnis. This line includes holdings of eight current executive officers in addition to those required to be listed by name in this table. A complete list of UTC’s current executive officers is included in the Company’s Annual Report on Form 10-K for 2015. |
| 24 | |
The preceding table includes shares as to which the listed person or the members of the group had the right to acquire beneficial ownership at any time within 60 days after March 1, 2014February 29, 2016 by exercising stock options or stock appreciation rights (“SARs”) or stock options and, in the case of non-management directors, upon the settlement of restricted stock units (“RSUs”) or deferred stock units (“DSUs”) as a result of their resignation or retirement from the Board, as set forth in the following table. The amounts in the preceding table also include, for all but two of the executive officers, stock units credited to the account of the officer under the Savings Restoration Plan that are attributable to Company contributions to match 60% of the officer’s payroll contributions to his or her account under the Plan, and which are settled in shares of Common Stock following the officer’s retirement or other termination of employment.(1)
| Name | Shares as to which listed person has right to acquire beneficial ownership within 60 days by exercise of stock options or SARs | (2) | Shares as to which listed person has right to acquire ownership within 60 days upon conversion of RSUs | Shares as to which listed person has right to acquire ownership within 60 days upon conversion of DSUs | ||||
| J. Faraci | — | 2,191 | 39,384 | |||||
| J. Garnier | — | — | 72,477 | |||||
| G. Hayes | 135,534 | — | — | |||||
| E. Kangas | — | 2,465 | 30,529 | |||||
| E. Kullman | — | 1,422 | 10,173 | |||||
| M. Larsen | — | 1,365 | 11,059 | |||||
| H. McGraw III | — | 2,926 | 44,116 | |||||
| R. Myers | — | 1,934 | 24,334 | |||||
| F. Reynolds | — | 1,046 | 983 | |||||
| B. Rogers | — | 1,046 | 1,465 | |||||
| H. Swygert | — | 3,665 | 51,566 | |||||
| A. Villeneuve | — | — | 69,477 | |||||
| C. Whitman | — | 2,926 | 28,071 | |||||
| P. Adams | 39,724 | — | — | |||||
| A. Bellemare | 45,246 | — | — | |||||
| G. Darnis | 214,357 | — | — | |||||
| C. Gill, Jr. | 126,275 | — | — | |||||
| A. Johri | 26,813 | — | — | |||||
| Directors & Executive Officers as a group (23 in total)(3) | 453,554 | 20,986 | 383,634 |
| (1) | The following executive officers held as of February 29, 2016 the following amounts of stock units under the Savings Restoration Plan: G. Hayes, 4,496; P. Adams, 1,617; A. Bellemare, 2,626; G. Darnis, 3,173; C. Gill, Jr., 6,783; A. Johri, 654 units, respectively; and the current executive officers as a group held 16,860 units. | |
| (2) | For the executive officers, includes the net number of shares of Common Stock issuable upon exercise of vested SARs. Following vesting, each SAR is exercisable for a number of shares of Common Stock having a value equal to the increase in value of a share of Common Stock from the date the SAR was granted through the date of exercise. For purposes of this table, the net number of shares of Common Stock issuable upon exercise has been calculated using the NYSE closing price for a share of Common Stock on December 31, 2015, which was $96.07. | |
| (3) | Consists of holdings of those directors and executive officers who continue to serve in such positions as of February 29, 2016 and, therefore, excludes holdings of Messrs. Adams, Bellemare and Darnis. This line includes holdings of eight current executive officers in addition to those required to be listed by name in this table. A complete list of UTC’s current executive officers is included in the Company’s Annual Report on Form 10-K for 2015. |
| Proxy Statement and Notice of | 25 |
Name
|
Shares as to which listed person has right to acquire beneficial ownership within 60 days by exercise of stock options or SARs
| Shares as to which listed person has right to acquire ownership within 60 days upon conversion of RSUs | Shares as to which listed person has right to acquire ownership within 60 days upon conversion of DSUs | |||||||||
L. Chênevert
| 2,322,000 | - | - | |||||||||
J. Faraci
| - | 2,095 | 32,624 | |||||||||
J. Garnier
| 6,000 | - | 64,340 | |||||||||
J. Gorelick
| 13,400 | - | 37,793 | |||||||||
E. Kangas
| - | 2,357 | 23,634 | |||||||||
E. Kullman
| - | 1,359 | 5,642 | |||||||||
M. Larsen
| - | 1,305 | 6,016 | |||||||||
H. McGraw III
| 13,000 | 2,797 | 39,433 | |||||||||
R. Myers
| - | 1,848 | 20,222 | |||||||||
H. Swygert
| - | 3,503 | 46,252 | |||||||||
A. Villeneuve
| - | - | 61,346 | |||||||||
C. Whitman
| 6,000 | 2,797 | 23,921 | |||||||||
A. Bellemare
| 305,500 | - | - | |||||||||
G. Darnis
| 985,000 | - | - | |||||||||
G. Hayes
| 389,000 | - | - | |||||||||
D. Hess
| 148,500 | - | - | |||||||||
Directors & Executive Officers as a group (22 in total)
|
|
4,934,250 |
|
|
18,061 |
|
|
361,223 |
| |||
BENEFICIAL OWNERS OF OVER 5% OF UTC COMMON STOCK
The following table shows all holders known to us to be beneficial owners of more than 5% of the outstanding shares of Common Stock as of December 31, 2013.2015.
Name and Address
| Shares | Percent of Class | ||
State Street Corporation* State Street Financial Center One Lincoln Street Boston, MA 02111
|
105,279,543 |
11.5% | ||
BlackRock, Inc. 40 East 52nd Street New York, NY 10022
|
61,594,623 |
6.7% | ||
The Vanguard Group 100 Vanguard Boulevard Malvern, PA 19355
|
49,543,861 |
5.4% |
| Name and Address | Shares | Percent of Class | ||
| State Street Corporation(1) | 99,702,863 | 11.9% | ||
| State Street Financial Center | ||||
| One Lincoln Street | ||||
| Boston, MA 02111 | ||||
| The Vanguard Group(2) | 51,558,180 | 6.2% | ||
| 100 Vanguard Boulevard | ||||
| Malvern, PA 19355 | ||||
| BlackRock, Inc.(3) | 48,153,780 | 5.7% | ||
| 55 East 52nd Street | ||||
| New York, NY 10022 |
| State Street Corporation, acting in various fiduciary capacities, reported in an SEC filing that as of December 31, | |
| (2) | The Vanguard Group, reporting on behalf of various subsidiaries, reported in an SEC filing that as of December 31, 2015 it held sole voting power with respect to 1,548,916 shares of Common Stock, shared voting power with respect to 83,500 shares of Common Stock, sole dispositive power with respect to 49,916,427 shares of Common Stock, and shared dispositive power with respect to 1,641,753 shares of Common Stock. |
| (3) | BlackRock, Inc., reporting on behalf of various subsidiaries, reported in an SEC filing that as of December 31, 2015 it held sole voting power with respect to 40,104,635 shares of Common Stock, shared voting power with respect to zero shares of Common Stock, sole dispositive power with respect to 48,153,780 shares of Common Stock, and shared dispositive power with respect to zero shares of Common Stock. |
| 26 | |
Executive CompensationCompensation:
Compensation Discussion and Analysis
In this section, we discuss our compensation philosophy and describe the compensation program for our Chairman &President and Chief Executive Officer (“CEO”) and our senior leadership team.Executive Leadership Group (“ELG”). We explain how our Board’s Committee on Compensation and Executive Development (“the Committee”(the “Committee”) determines compensation for our senior executives and its rationale for specific 20132015 pay decisions. We also discuss numerous changes the Committee has made toevolution of our program over the past several yearsand how it is structured to advance its fundamental objective: aligning our executiveexecutives’ compensation with the long-term interests of UTC shareowners.
EXECUTIVE SUMMARYExecutive Summary
Our executive compensation
We design our program is designed to reward financial resultsperformance and effective strategic leadership, key elements in building sustainable value for shareowners. We believe that the performance metrics used in our program’s performance measuresincentive plans align the interests of our shareowners and senior executives by correlating the timing and amount of actual pay to our short-, medium- and long-term performance. Our program places significant weight onrequires ethical and responsible conduct in pursuit of these goals.
In addition, we carefully benchmark our executive compensation program against a relevant group of peer companies—all of which are potential competitors for the caliber of executive talent required to manage a complex, global and multi-industrial company like UTC.
Response to 2015 Say-on-Pay Vote
Each year, we consider the voting results of our Say-on-Pay proposal from the preceding year. In 2015, 95% of the votes submitted (excluding abstentions and broker non-votes) supported the Committee’s 2014 executive compensation decisions, a result that exceeded the 93% favorable vote we received in 2014. We interpreted this result, along with our positive four-year voting trend, as an endorsement of our compensation program’s design and direction.
Our 2015 Outreach Program
We actively seek and highly value feedback from shareowners and their advisors concerning our compensation program. Since our last Annual Meeting of Shareowners, senior management has communicated directly with institutional investors holding overapproximately 300 million shares of UTC Common Stock (“Common Stock”).
In addition, we carefully benchmark
Analysis of Shareowner Feedback
As it does each year, the Committee considered shareowner feedback in its ongoing assessment of our compensation decisions against a market-relevant groupprogram. This feedback, along with factors such as external market data and staff compensation recommendations, helps the Committee in its review of peer companies that are potential competitors for the caliber of executive talent required to manage a complex, global, multi-industrial company like UTC.
Following significant changes made to our compensation programs in 2012, 90% of the votes cast (i.e., excluding abstentions and broker non-votes) supported our Say-on-Pay proposal at the 2013 Annual Meeting.program.
|
2013 PERFORMANCE
We experienced strong financial and operating performance in 2013, as evidenced by our earnings growth, cash flow and stock price appreciation. Our 2013 compensation decisions recognize this performance.
We believe that a portion of our executive compensation should reflect and reward current-year performance. However, our program prudently accounts for, and indeed emphasizes, long-term financial performance and actions taken by our senior leadership team to strategically position UTC for future growth. We focus on sustainable performance and, therefore, allocate a significantly greater portion of compensation to longer-term goals and performance.
Our solid operational and financial performance in 2013 reflects senior leadership’s sharp focus on deploying our capital wisely, executing our business strategies effectively and achieving a balanced business mix. This focus enabled us to deliver value to our shareowners in 2013, notwithstanding weak U.S. defense spending and increased pension expense, primarily due to low discount rates.
| 27 |
2015 PERFORMANCE
| FLAWLESS PROGRAM | ||||
| EXECUTION | ||||
| OF CAPITAL | ||||
| ||||
FINANCIAL RESULTS (3 AND 10 YEARS)*
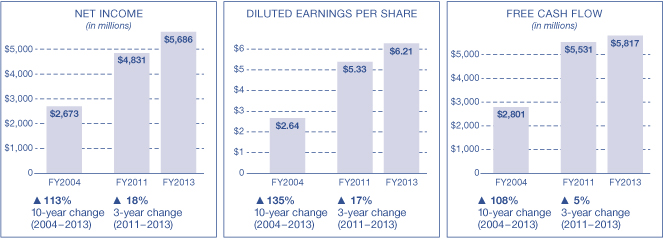
| • | UTC Aerospace Systems supplies the |
| • | Sale of our Sikorsky Aircraft business unit, which we executed on an accelerated basis, allowing greater focus on our core businesses and future growth potential. |
| • | Otis received orders for significant key projects in China–examples include 133 elevators and escalators to be provided to the Chengdu Metro Line and a contract to supply 174 elevators and escalators to a new |
| • | UTC CCS won its largest retrofit contract to date for the CP Tower in Kuala Lumpur, Malaysia. |
| • | Otis was selected to provide elevators and escalators with leading energy-efficient technologies to the |
Notwithstanding these strategic and operational accomplishments, significant investments in the GTF engine, adverse foreign exchange rates and slowed growth in China contributed to a decrease in adjusted net income and diluted EPS for continuing operations, as shown in the charts on the following page.
Despite these near-term pressures, UTC increased dividends paid to shareowners by 8.5% in 2015. This represents the 79thconsecutive year in which UTC has paid dividends. Consistent with our disciplined capital allocation strategy, we also returned $12 billion to shareowners through dividends and share repurchases (including a $6 billion accelerated share buyback program announced in November 2015). In addition, we initiated a $1.5 billion multi-year structural cost reduction plan. These actions are intended to contribute to long-term sustainable growth while responding to near-term economic and financial challenges.
| 28 | |
FINANCIAL RESULTS
| Adjusted Net Sales(1) | Adjusted Diluted EPS(1) | Free Cash Flow(2) | Adjusted Net Income(1) |
| (in billions) | |||
 | |||
| (1) | Reflects continuing operations, adjusted to exclude restructuring, non-recurring and |
| (2) | Reflects continuing operations. |
EXECUTIVE COMPENSATION COMPENSATION DISCUSSION AND ANALYSIS
SHAREOWNER VALUE CREATION
The Committee believes that long-term incentive goalsincentives should correlate directly correlate with the creation of long-term shareowner value; an essentialvalue. This correlation is a fundamental component of our Guiding Principles, as discussed on pages 26 and 27. Ourpage 33. We believe our ability to generate sustainablestrong TSR over long-term periods has been, in part, driven by the design of our executive compensation program. This can be seen in UTC’s 7.9% annualized TSR over the ten-year period ending on December 31, 2013 is noteworthy and, in our view, correlates with our executive compensation program design. UTC’s 11% annualized TSR over this period significantly outpaced2015, which exceeded the Dow Jones Industrial Average (7%(7.7%), the S&P 500 (7%(7.3%) and our Compensation Peer Group (6%(6.9%) (our (“CPG”) is detailed on page 35). Our Board of Directors and senior management are strongly committed to positioning UTC for long-term sustainable growth even while facing near-term earning headwinds, which have adversely affected TSR over shorter time periods relative to peers. The following chart illustrates UTC’s performance relative to differing comparator groups and time periods.
TOTAL SHAREOWNER RETURN: UTC VS. PEER GROUPS*
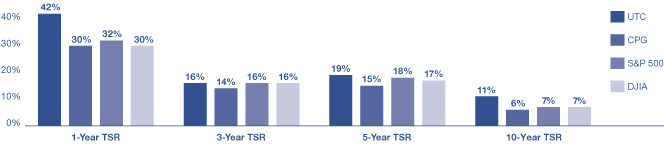
 |
| * | TSR values are provided by S&P Capital IQ and are calculated on an annualized basis as of December 31, |
| ||||
| ||||
| 29 |
CEO PAY HIGHLIGHTSOVERVIEW
Consistent with our core belief that pay for performance creates shareowner value, approximately 90% of
Mr. Chênevert’s 2013 compensation consisted of variable, contingent and performance-based annual and long-term incentives, as shown on page 36 of this Proxy Statement.
As explained on page 43, the Committee assessed Mr. Chênevert’s 2013 performance favorably. The chart below shows that Mr. Chênevert’s 2013Hayes’ 2015 total direct compensation, increasedas defined on page 47, decreased by 1.8% from $17$10.93 million in 2014 to $18.5$10.73 million approximately a 9% increasein 2015. This decrease was primarily driven by the decrease in the Company’s annual bonus financial performance factor from 112% of target in 2014 to 39% in 2015. This performance resulted in the previous year. This compensation increase resulted fromCommittee approving an $850,000 annual bonus for Mr. Hayes, an amount which substantially aligned with this performance factor, but was below the following Committee actions:CPG median.
The Committee favorably assessed Mr. Hayes’ 2015 performance (discussed in detail on page 50). Based on this assessment, the Committee increased Mr. Hayes’ 2016 long-term incentive grant to $8.58 million. While this amount was greater than the $8.03 million grant awarded to Mr. Hayes in 2015, his 2016 grant value was below the CPG median, reflecting Mr. Hayes’ brief tenure as CEO.
The target for Mr. Chênevert’s total direct compensation continues to approximate the median of the market.
CEO TOTAL DIRECT COMPENSATION(1)
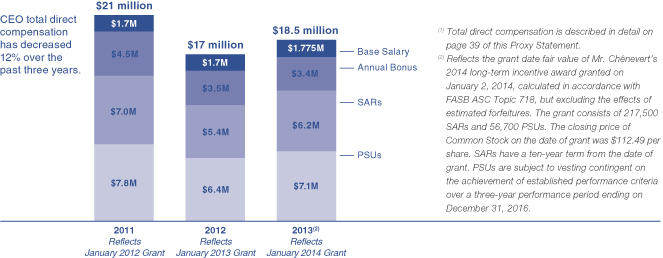
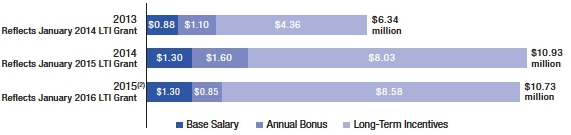
| (1) | The elements of total direct compensation are described in detail on page 47 of this Proxy Statement. 2013 total direct compensation reflects the Committee’s pay decisions with respect to Mr. Hayes’ former role as Senior Vice President & Chief Financial Officer. | |
| Grant date fair value of Mr. Hayes’ January 4, 2016 LTI award, calculated in accordance with the Compensation—Stock Compensation Topic of the FASB ASC, but excluding the effects of estimated forfeitures. This grant consists of 264,000 SARs and |
| 30 | |
EXECUTIVE COMPENSATION PRACTICES
We continually monitor the evolution of best compensation practices.practices and make changes to our programs as necessary to ensure sound corporate governance. Some of the most important practices incorporated into our program include the following:include:
| ||||
| Review of Pay | ||||
| performance, as detailed on pages 46 to 49.
| Median Compensation Targets. | |||
| market.
| Rigorous and Diversified Performance Metrics.The Committee annually reviews performance goals for our annual and long-term incentive awards to | |||
| PSU awards.
| Clawback of Compensation. We | |||
| ||||
| No Pledging of Shares. Our directors and executive officers are not permitted to pledge UTC shares as collateral for loans or for any other purpose. | |||
| No Hedging. UTC does not allow directors and executive officers to enter into short sales of UTC Common Stock or similar transactions where potential gains are linked to a decline in the price of our shares. | |||
| No Repricing. Stock option and SAR exercise prices are set
Use of Double Triggers. Change-in-control severance arrangements, for which only pre-2009 ELG appointees are eligible, as well as the accelerated vesting terms under the UTC Long-Term Incentive Plan, both have a double trigger. This means that a change-in-control will not automatically entitle an executive to severance benefits or equity acceleration; the executive must also lose his or her job or suffer a significant adverse change to employment terms and conditions.
Annual Review of Compensation Consultant Independence. On an annual basis, the Committee reviews the independence of its compensation consultant, as required by SEC and NYSE rules. | |||
| Proxy Statement and Notice of 2016 Annual Meeting of Shareowners | 31 | ||
| No Cash Buyouts of Underwater Stock Options | |||
| Market-Competitive Retirement Programs. We eliminated defined benefit pensions for | |||
| No Perquisite Allowances. | |||
| No Employment Contracts.The Committee
| |||
EXECUTIVE COMPENSATION COMPENSATION DISCUSSION AND ANALYSIS
| Restrictive | ||||
| ||||
| life insurance benefit.
| Limitations on Personal Use of
Elimination of Cash Severance. We eliminated the 2.5x base salary ELG cash severance | |||
| age at separation.
| Review of Compensation Peer Group. Our CPG is reviewed periodically by the Committee and adjusted, when necessary, to | |||
| Review of Committee Charter. The Committee reviews its charter regularly to
| |||
| 32 | |
HOW WE MAKE COMPENSATION DECISIONSHow We Make Compensation Decisions
OUR EXECUTIVE COMPENSATION PHILOSOPHY
The Committee believes that executive compensation opportunities must align with and enhance long-term shareowner value. This core philosophy is embedded in all aspects of our executive compensation program and is reflected in an important set of guiding principles. We believe that the application of these principles enables us to create a meaningful link between compensation outcomes and long-term, sustainable growth for our shareowners.shareowners and compensation outcomes.
EXECUTIVE COMPENSATION COMPENSATION DISCUSSION AND ANALYSIS
GUIDING PRINCIPLES
|
|
| ||
|  | COMPETITIVENESS |  | |
| Compensation should take into account each executive’s responsibility to act in accordance with our ethical, environmental, health and safety objectives at all times. Financial and operating performance must not compromise these values. A complete commitment to ethical and corporate responsibility is a fundamental principle incorporated into all aspects of our compensation program. | Total compensation should be sufficiently competitive to attract, retain and motivate a leadership team capable of maximizing UTC’s performance. Each element should be benchmarked relative to peers. | |||
| PAY-FOR-PERFORMANCE | |
| | |
| A substantial portion of compensation should be variable, contingent and directly linked to individual, Company and business unit performance. | The portion of total compensation contingent on performance should increase with an executive’s level of responsibility. Annual and long-term incentive compensation opportunities should reward the appropriate balance of short- and long-term financial, strategic and | |||
| LONG-TERM FOCUS | |
| | |
| For our most senior executives, long-term, stock-based compensation opportunities should | The financial interests of executives should be aligned with | |||
ROLE OF THE COMMITTEE ON COMPENSATION AND EXECUTIVE DEVELOPMENT
The Committee, which currently consists of sixseven independent directors, is responsible for overseeing the development and administration of our executive compensation program.
In this role, the
Responsibilities.The Committee makes all compensation decisions concerning our CEO and the other members of our Executive Leadership Group (“ELG”)., subject to review by the other independent directors. The ELG is made up of betweenapproximately 25 to 30 of our most senior executives, and includes each ofincluding the Named Executive Officers (“NEOs”) listed in the Summary Compensation Table on page 4857 of this Proxy Statement.
The Committee’s other responsibilities include:
| à |
| à | Considering input from UTC’s shareowners regarding executive compensation decisions and |
| à | Reviewing and approving incentive plan targets and |
| 33 |
| à | Assessing the Company and each ELG member’s performance relative to these targets and |
| à | Evaluating the competitiveness of each ELG member’s total compensation |
| à | Approving changes to |
The SeniorExecutive Vice President & Chief Human Resources & Organization,Officer, along with UTC’s Human Resources staff and an independent compensation consultant, assist the Committee with these tasks.
The Committee’s charter, which sets out the Committee’s responsibilities, can be found on our website at:
http://www.utc.com/StaticFiles/UTC/StaticFiles/compensation_charter.pdfOur-Company/Corporate-Governance/Pages/Governance-Documents-and-Policies.aspx
EXECUTIVE COMPENSATION COMPENSATION DISCUSSION AND ANALYSIS.
THE COMMITTEE’S PROCESS
Performance Evaluation Process.The Committee has established a process for evaluating the performance of the Company, the President and CEO and the other ELG members. At theits first meeting of every year, the Committee setsreviews financial, strategic and financialoperational objectives, for the CEO, both for the upcoming year and for a longer-term period. At this meeting, itthe Committee also evaluates the performance of the CEOCEO’s and other NEOsELG members’ performance for the previous year.
We use
The Committee uses a combination of qualitative and quantitative factors to conduct a broad and balanced assessment of performance relative to both internal and external performance.
PERFORMANCE EVALUATION PROCESSmeasures.
ROLE OF THE CEO
| ||
|
|
Our CEO Mr. Chênevert, does not play anyhas no role in the Committee’s determination of his own compensation. For the other members of the ELG, including the NEOs, hethe CEO presents the Committee with recommendations for each element of compensation. He bases these recommendations upon his assessment of each individual’s performance, the performance of their relevanteach executive’s business unit and/or function, benchmark information and retention risk. The Committee reviews the CEO’s recommendations, makes appropriate adjustments and approves compensation changes at its discretion, subject to the review ofby the other independent directors.
ROLE OF THE COMPENSATION CONSULTANT
The Committee retained Pearl Meyer & Partners (“Pearl Meyer”) to serve as its executive compensation consultant for 2013.2015. While Pearl Meyer may make recommendations on the form and amount of compensation, the Committee continues to makemakes all decisions regarding the compensation of our NEOs subject to the review of theand other independent directors.ELG members.
During 2013,2015, Pearl Meyer advised the Committee on a variety of subjects, such asincluding compensation plan design and trends, pay for performancepay-for-performance analytics, benchmarking norms and other suchsimilar matters. Pearl Meyer reports directly to the Committee, participates in meetings as requested and communicates with the Committee Chair between meetings as necessary. In 2013,A Pearl Meyer representative attended threefour meetings in person.person in 2015.
Prior to engaging Pearl Meyer, the Committee reviewed the firm’s qualifications, as well as its independence and any potential conflicts of interest. Pearl Meyer does not perform other services for or receive other fees from UTC, other than incidental amounts (less than $6,000$9,000 in 2013)2015) related to participation in certain business-related surveys. The Committee, therefore, made the determination that Pearl Meyer qualified as an independent consultant. The Committee has the sole authority to modify or approve Pearl Meyer’s compensation, determine the nature and scope of its services, evaluate its performance, terminate the engagement and hire a replacement or additional consultant at any time.
The Committee also utilizes market data provided by Willis Towers Watson and Aon Hewitt for benchmarking and other purposes. This benchmark data consists of information that is generally available to other Willis Towers Watson and Aon Hewitt clients. Neither Towers Watson nor Aon Hewittfirm made recommendations to the Committee or management on peer group composition or on the form, amount or design of executive compensation in 2013.2015.
| 34 | |
PEER GROUP BENCHMARKING
We compare our executive compensation program to compensationprograms at the 2426 companies that make up our Compensation Peer Group (“CPG”). The Committee believes that these companies provide a relevant comparison based on their similarity to UTC in size and complexity, taking into account factors such as revenue, market capitalization, global scope of operations and diversified product portfolios. Like UTC, 1211 of these 2426 companies are Dow Jones Industrial Average components. The CPG servesis constructed to serve the specific purpose of benchmarking executive compensation. ItsWe do not use the relative financial performance of the CPG as a performance metric in our incentive compensation awards. The CPG’s composition reflects a mix of both industry and non-industry peers that arewe view as realistic competitors for the potential senior executive talent UTC seeks. The CPG has not been constructed or utilized for the purpose of benchmarking financial performance. For 2013, the Committee reviewed the composition of the CPG and determined no adjustments were necessary.talent.
We also look atuse other Fortune 100 companies and data from a broader samplerange of over 400 companies. This information provides usefulcompanies for insight on general compensation trends and supplementsto supplement CPG data when appropriate.
The Compensation Peer Group includes the following companies:
THE COMPENSATION PEER GROUP
INCLUDES THE FOLLOWING COMPANIES:
| AEROSPACE & | CONSUMER | ||||||
| CHEMICALS | PACKAGED GOODS | ||||||
| Northrop |
| |||||
|
| ||||||
| Grumman |
| |||||
|
| ||||||
| Raytheon |
| |||||
|
| ||||||
|
| ||||||
| Lockheed | |||||||
| Martin | |||||||
| |||||||
|
| ||||||
|
| ||||||
|
| ||||||
|
| ||||||
| |||||||
| EQUIPMENT & | |||||||
| INDUSTRIALS | MACHINERY | LOGISTICS | |||||
| Danaher | Honeywell | 3M | Emerson | FedEx | |||
| General | Siemens | Caterpillar | Electric | ||||
| Electric | Deere | Johnson | |||||
| Eaton | Controls | ||||||
| TECHNOLOGY/ | |||||||
| OIL & GAS | PHARMACEUTICALS | COMMUNICATIONS | |||||
| Chevron | Pfizer | AT&T | IBM | ||||
| HP | Verizon | ||||||
Companies inBluerepresent Dow Jones Industrial Average components.
PEER GROUP DATA(1)
Revenue
|
Market
| Employees
| ||||||||||
25th Percentile | $36,994 | $46,935 | 90,792 | |||||||||
50th Percentile | $52,146 | $65,932 | 124,550 | |||||||||
75th Percentile | $84,781 | $151,711 | 193,440 | |||||||||
UTC | $62,626 | $104,319 | 212,400 | |||||||||
UTC Rank | 63% | 66% | 76% | |||||||||
| Market | ||||||||||||
| Revenue | Capitalization | |||||||||||
| (in millions) | (in millions) | Employees | ||||||||||
| 25thPercentile | $26,996 | $34,164 | 71,112 | |||||||||
| 50thPercentile | $38,581 | $58,054 | 107,850 | |||||||||
| 75thPercentile | $59,463 | $133,507 | 155,800 | |||||||||
| UTC | $56,450 | (2) | $80,540 | 197,180 | ||||||||
| UTC Rank | 74% | 63% | 83% | |||||||||
| Peer company data provided by S&P Capital IQ. Revenue and employee data reflect the most recent | |
| (2) | UTC revenue is adjusted for discontinued operations, restructuring and other significant, defined non-operational items. For a reconciliation to U.S. GAAP see Appendix B on page 86. |
| 35 |
COMPENSATION BENCHMARKS
To ensure that our executive compensation program is sufficiently competitive, the Committee believes that the value of each UTC compensation element should generally be targeted to align with market benchmarks.
Historically, we targeted our Therefore, UTC targets base salary, and annual bonus and long-term incentive awards at the median of the CPG. We supplement Fortune 100 and general industry data for benchmarking purposes when CPG while maintaining a 65th percentile CPG target for long-term incentive awards. However, in response to shareowner feedback and to better aligndata is not sufficient or available.
| All compensation targets are aligned with |
The Committee reduced the long-term incentive target from the 65thannually evaluates each element of our executive population’s compensation relative to the 50th percentile of the CPG, effective for grants beginning in January 2013.
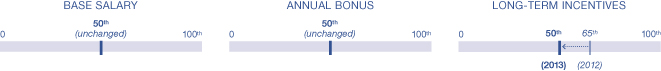
Allmarket. Individual compensation targets now align with our Compensation Peer Group median
Individual awards can fall above or below these targetsvaries from market benchmarks based on the Committee’s discretion. In exercising its discretion, the Committee may considerassessment of Company and individual performance, job scope, retention risk and any other factors that it determines are relevant to be relevant and consistent with program objectives.its evaluation.
HOW WE STRUCTURE OUR COMPENSATIONOur Principal Elements of Compensation
PRINCIPAL ELEMENTS OF COMPENSATION
The following table summarizes the principal elements make upof our executive compensation program:
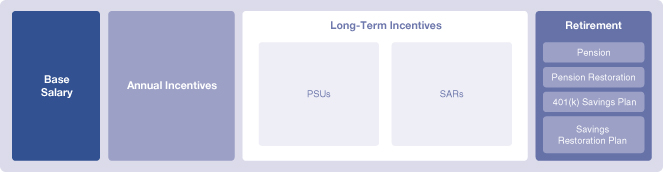
LINKING PAY TO PERFORMANCE
program for 2015. The Committee uses a combination of metrics and time horizonsstructures these elements to promote and reward superior financial performance.
PERFORMANCE METRICS AND TIME HORIZONSperformance through a variety of performance metrics and time horizons.
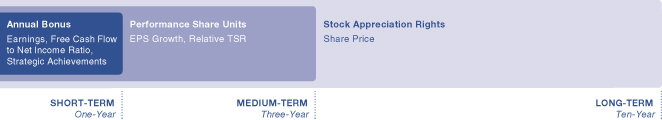
| Time Horizon (in years) | Performance Metrics | Purpose | |||||
| Base Salary | n | None | Attract and | ||||
 | Annual | n | Earnings(1) | Drive near-term performance goals | |||
| Free cash flow to net income ratio(1) | |||||||
| Individual achievement | |||||||
| Performance Share Units(2) | nnn | Earnings per share(1) | Drive medium-term performance goals | ||||
| Total Shareowner Return vs. S&P 500 | |||||||
| Stock Appreciation Rights | nnnnnnnnnn | Share price appreciation | Drive long-term performance goals |
| (1) | Financial performance measures are subject to adjustments by the Committee in certain circumstances. Refer to page 55 for more details on how these metrics are calculated. |
| (2) | Beginning in 2016, PSUs will include a return on invested capital (“ROIC”) metric, as discussed in more detail on page iv. |
EXECUTIVE
EMPHASIS ON “AT RISK” COMPENSATION COMPENSATION DISCUSSION AND ANALYSIS
| 36 | |
The following charts show the basic pay mix for our CEO and other NEOs for 2015 and illustrate the significant portion of compensation that is “at risk.”
PAY MIX
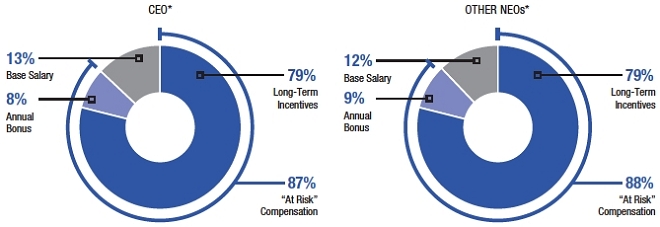
| * | Charts reflect the value for the base salary and annual and long-term incentive awards shown in the Summary Compensation Table on page 57. The Other NEOs chart excludes Mr. Bellemare who retired effective January 31, 2015. |
BASE SALARY
To help UTC attract and retain the mosttalented and qualified executive talent,executives, we provide competitive base salaries to our executives targeted at either the CPG median.median or a blend of the CPG and Fortune 100 medians, as appropriate. Base salary constitutes a significant portion of our NEOs’ fixed compensation (which also includes pension benefits and other benefits such as health, life and disability insurance). Each year the Committee reviews recommendations from the CEO regarding base salary adjustments for ELG members, including the other NEOs.members. The Committee has complete discretion to modify or approve the CEO’s base salary recommendationsthese recommendations. The CEO has no input and the CEO does not participate in the Committee’s determination of his own base salary. Actual salaries will vary from the CPG median targetand market medians based on factors such as job scope and responsibilities, experience, tenure, individual performance, retention risk external market data and internal pay equity.
ANNUAL INCENTIVE COMPENSATIONBONUS
Overview
Our NEOs’ actual2015 annual incentivebonus awards arewere determined based on three distinct elements:
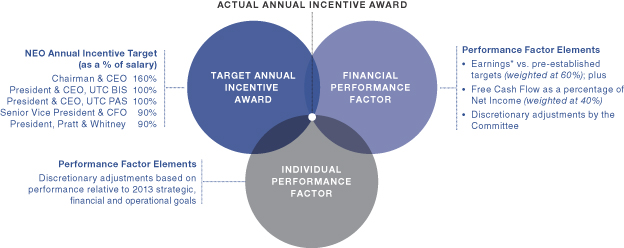
* Earnings underthrough the Annual Incentive Plan is defined for both the Corporate Office and our business units on page 46.
Target Annual Incentive Award
The Committee approves the target annual incentive award for each ELG member’s position, including the positions held by our NEOs. Target annual incentive awards equal a percentage of base salary and vary based on specific roles and responsibilities within the organization. Actual award payouts are determined based on both financial and individual performance factors. Target performance generally results in incentive compensation values that approximate the median of the CPG.following process:
 |  |  |  | |||||
EXECUTIVE COMPENSATION COMPENSATION DISCUSSION AND ANALYSIS
Financial Performance Factor
For purposes of our annual incentive awards, the Committee measures Company and business unit performance relative to two pre-established financial metrics:
| Award Delivery: | ||||||||
| on market benchmarks: | • Earnings* vs. pre-established targets(weighted at 60%); plus • Free Cash Flow* as a percentage of Net Income(weighted at 40%); and • Discretionary adjustments by the Committee. | Discretionary adjustments based on individual performance relative to 2015 strategic, financial and operational goals. | Awards for 2015 performance are delivered in the first quarter of 2016. These amounts are displayed under the “Bonus” column in the Summary Compensation Table. | |||||
| President and CEO | 165 | % | ||||||
| President & CEO, UTC BIS | 110 | % | ||||||
| EVP & CFO | 100 | % | ||||||
| President, Pratt & Whitney | 95 | % | ||||||
| EVP & General Counsel | 85 | % | ||||||
Performance relative to these pre-set metrics generates a financial performance factor for the Corporate Office and for each business unit. Each financial performance factor, which is expressed as a percentage of the target annual incentive award, determines the initial size of the bonus funding pools for the Corporate Office and each business unit. This factor is then reviewed by the Committee, which retains the discretion to make further adjustments, as appropriate (see “Use of Discretion” on page 33).
Based on feedback from shareowners and the Committee’s evaluation of external market trends, the Committee modified the formula used to determine the financial performance factors, beginning with 2013 awards, as follows:
| Proxy Statement and Notice of 2016 Annual Meeting of Shareowners | 37 |
|
How We Determine Target Annual Bonus Levels
The Committee approves the target annual bonus level for each position held by ELG members. These target levels are expressed as a percentage of base salary and vary among executives based on specific roles and responsibilities within the organization. While target award levels generally reflect values that approximate the CPG and Fortune 100 medians, actual award payouts are based on financial and individual performance factors, as assessed by the Committee.
As part of its annual review of executive compensation, the Committee determines if any adjustments to annual bonus target percentages are appropriate.
How We Determine Financial Performance Factors
To determine the financial performance factors for the Company and each of its business units, the Committee measures performance annually relative to two pre-established financial metrics:
| ||||||
| ||||||
• | Free Cash Flow to Net Income | |||||
| ||||||
|
Performance relative to these targets determines the financial performance factors for UTC and each business unit. The Committee reviews these financial performance factors and, if appropriate, makes adjustments to these calculated factors (see “Use of Committee’s Discretion in Annual Bonus Awards” on page 39).
Each executive’s target annual bonus value (base salary x target bonus percentage) is multiplied by his or her applicable financial performance factor. Aggregated, these amounts generate separate award pools for UTC and each business unit that are then allocated among eligible executives based on individual performance. See page 39 for details on the individual performance factor.
The metrics and weightings used to determine the financial performance factors for 2015 are as follows:
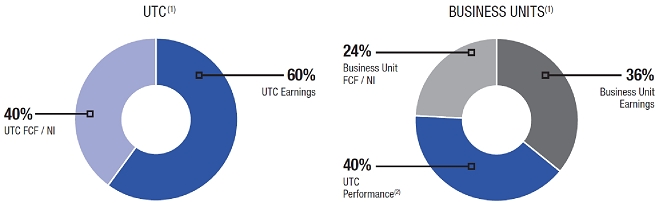
| (1) |
| Refer to page | |
| (2) | The 40% consists of UTC Earnings weighted at 24% and UTC FCF / NI weighted at 16%. |
| 38 | |
The Committee believes this methodology for arriving at the financial performance factors accomplishes the following objectives:
| • | Aligns incentives with our annual |
| • | Establishes challenging but achievable bonus targets for our executives; and |
| • | Sets targets that are consistent with the Committee’s assessment of opportunities and risks for the upcoming year, as communicated to our investors. |
How We Determined the Financial Performance Factors for 2015
| • | Free Cash Flow to Net Income Ratio. For 2015, the Committee approved a FCF / NI goal of 100% for the Company and each |
2015 Results.The Company reported 2015 net income attributable to common shareowners of $7.608 billion. Because this amount included a gain realized from the sale of Sikorsky Aircraft and that gain would have substantially increased annual bonus payouts, the Committee decided to measure net income based on continuing operations, which excluded Sikorsky Aircraft. The Committee also adjusted for the impact of restructuring, non-recurring and other significant, defined non-operational items. After these adjustments, which the Committee believed were necessary to preserve the integrity of the original bonus targets, adjusted net income of $5.563 billion was utilized to determine the annual bonus financial performance factor for the Company. This net income result generated a 0% payout factor for the UTC earnings portion of the annual bonus award. The vesting of the earnings portion of the award for our business units ranged from 0% to 112%. Refer to Appendix B on page 86 for a detailed reconciliation of this adjusted net income measure to U.S. GAAP.
2015 free cash flow from continuing operations was 126% of net income. Adjustments for annual bonus purposes were made for the impact of certain restructuring and non-operational gains, and a non-recurring charge unrelated to operational performance that predated the performance measurement period. This resulted in a 99% FCF / NI ratio vesting factor for the Company. The FCF / NI ratio for our business units ranged from 69% to 106% for the year.
In combination, the Company generated an overall financial performance factor of 39% of target. The blended factors for our business units ranged from 34% to 73% of target.
Individual Performance Factor
Our NEOs also begin the year with a set of individual strategic, andoperational and/or financial performance objectives. Based on Mr. Chênevert’sour CEO’s assessment of the performance of each NEO’s performance against these objectives,NEO, he may recommend that the Committee make a discretionary adjustment to increase or decrease the amount of bonus determined by the financial performance factor. The Committee considers these recommendations and makes adjustments as it deems appropriate. Mr. Chênevert does not at any time play aHayes plays no role in the Committee’s determination of his own annual incentive award.
EXECUTIVE COMPENSATION COMPENSATION DISCUSSION AND ANALYSISbonus.
Financial Performance Goals and Results for 2013
Each year the Committee establishes financial performance goals for our annual incentive awards. Its practice has been to set the target performance levels for both earnings and the ratio of free cash flow to net income to align with the financial performance expectations that UTC publicly communicates to investors in December for the upcoming year.
We believe our methodology for determining financial performance targets for annual incentive awards accomplishes the following objectives:
Earnings. In prior years, we have generally set the Corporate earnings metric to align with the midpoint of the EPS range communicated to investors in December for the upcoming year. Given the change from an EPS to a net income earnings metric, the Committee set the net income goal at the level that corresponded to the midpoint of the EPS range communicated to investors.
In December 2012, UTC announced a projected EPS range of $5.85 to $6.15 for 2013. The midpoint of this range was $6.00 per share. The Committee set the 2013 net income target for the annual incentive awards to correspond with this midpoint. The corresponding net income target for 2013 equaled $5.485 billion. For 2013, actual net income performance equaled $5.686 billion, well in excess of target.
The Committee also approved specific earnings growth goals for each business unit. These goals ranged between 7% and 20% and reflected the Committee’s assessment of each business unit’s end-market conditions and the specific challenges and opportunities anticipated for 2013.
Free Cash Flow to Net Income Ratio. In December 2012 the Committee, consistent with past practice, approved a free cash flow goal equal to 100% of net income for the Corporate Office and each business unit. This goal aligned with the 2013 expectations communicated to investors in December 2012 and represents the Committee’s belief that cash flow performance correlates with the quality and sustainability of earnings performance. For 2013, UTC’s free cash flow equaled 102% of net income.
Use of Committee’s Discretion in Annual Bonus Awards
The Committee sets annual individual bonus targets with the objective of offering payout opportunities that align with Company, business unit and individual performance. However, theThe Committee retains the authority to make upward or downward adjustments if it determines that performance relative to pre-established metricstargets does not accurately reflect the overall quality of actual performance for the year. While the financial metrics remain the primary basis for determining actual bonus amounts, the Committee has made such discretionary adjustments in the past.past to both financial performance factors and individual performance factors. Examples of factorssituations that could result in a positive or negative adjustment include:
| 39 |
| • | Material, unforeseen circumstances beyond management’s control that have a positive or negative effect on financial performance relative to the established targets or certain non-recurring charges or credits unrelated to measured performance; |
| • | Tax or accounting rule adjustments which positively or negatively impact performance; |
| • | Changes to the Company’s capital structure; |
| • | An executive’s performance relative to specific individual annual |
| • | An executive’s |
EXECUTIVE COMPENSATION COMPENSATION DISCUSSION AND ANALYSIS
LONG-TERM INCENTIVE COMPENSATIONAWARDS
Annually, our
Types of Incentives Used
Our NEOs receive two types of annual equity-based long-term incentive awards: Performance Share Units (“PSUs”) and Stock Appreciation Rights (“SARs”). For 2013, PSUs comprisedmade up slightly more than half of ELG members’ total long-term incentive awards. The remaining portion of their2015 annual long-term incentive award wasawards with the remaining portion granted in the form of SARs. The number of PSUs and SARs awarded areis based on an accounting value.a value approved by the Committee. These awards are subject to a three-year vesting period and other terms and conditions, as describedset forth in UTC’s 2005the award statements and as provided under the terms of the UTC Long-Term Incentive Plan (see Appendix A)(“LTIP”). Long-term incentive targets for our ELG members align with the CPG median.
The Committee also, issuesfrom time to time, may approve special equity grants from time-to-time for purposes such as recruitment, retention, recognition or to drive the achievement of certainspecific strategic performance goals. These special grants canmay be issued in different forms, as appropriate, includingthe form of SARs, PSUs, restricted stock, restricted stock units (“RSUs”) or performance-based SARs. No suchIn 2015, special equity grantssign-on RSU and SAR awards were madegranted to our NEOsMr. Johri as an offset to compensation forfeited upon leaving his former employer. Mr. Adams also received a special RSU award in 2013.recognition of achieving 2015 FAA and EASA certification of the GTF engine.
Performance Share Units
PSUs vest at the end of a three-year performance measurement period, if and to the extent, that the Company has met the performance goals establishedpre-established by the Committee. Each vested PSU converts into one share of Common Stock. Unvested PSUs do not earn dividends.dividend equivalents.
Metrics
The Committee believes both absolute and relative metrics provide appropriate goals for our long-term incentive awards.
2015 PSU awards currently use both an absoluteused two equally weighted metrics: earnings per share (“EPS”) growth metric and a relative total shareowner return (“TSR”) metric versus the S&P 500. Each metric receives a 50% weighting500 (see page 4655 for details on how we calculate these metrics). For each metric vesting is calculated separately.
Beginning in 2016, our PSU awards also incorporate a return on invested capital (“ROIC”) metric. The Committee does not make discretionary adjustments to measured performanceROIC metric is weighted at 35%, while the EPS growth metric and the relative to the pre-established targets.TSR metric are now weighted at 35% and 30%, respectively.
Setting Performance Goals
Earnings Per Share.EPS Growth. The Committee approved a three-year EPS compound annual growth rate target of 10% as the target6% for the 20132015 PSU grant. This goal is based on our three-year strategic business plan and represents a challenging yetbut attainable goal that aligns with the expectations we have communicated to investors. Structurally, below-targetshareowners in December 2014, prior to the beginning of the performance period. When setting EPS targets for our PSU awards, the Committee accounts for various long-term, business-related expectations, including planned share buybacks, macroeconomic market trends, pension headwinds, cost reduction plans, etc. The Committee retains discretion to exclude certain items (e.g., unplanned share buybacks, restructuring, non-recurring, non-operational items, etc.) from the EPS growth results in below-median compensationcalculation, as necessary to preserve the integrity of the original performance target.
| 40 | |
In previous years (i.e., 2010, 2011 and 2012), the Committee set EPS growth targets annually over the three-year award period. This annual recalibration of earnings growth targets was driven by the volatile economic and financial market environment created by the recession that began in 2008. With more stable conditions returning following the recession, the Committee determined that three-year EPS growth targets could once again be set.
Relative Total Shareowner Return. For the 20132015 PSU grant, consistent with past practice, the Committee again chose to set a cumulative three-year TSR performance target at the 50thpercentile relative to the S&P 500. 500 for the remaining 50% of the award.
The Committee believes that a median level of performance versus the S&P 500 should equate to a median level of compensation. By design, below-median TSR relative to the S&P 500 results in below-median compensation and above-median relative TSR results in above-median compensation.
We believe that comparing UTC’s TSR to companies within the S&P 500 provides an appropriate benchmark for measuring theour share price performance ofas a large-capitalization company, such as UTC. We dolarge capitalization company. The Committee does not set TSR goals relative to the performance of our Compensation Peer Group,CPG, which servesis constituted for the specific purpose of measuring the competitiveness of our compensation program. We believe theThe S&P 500 provides a more comprehensive and relevant comparison for our share price performance. Also,performance and, unlike the CPG, the S&P 500 is not a self-selected, customized benchmark.
EXECUTIVE COMPENSATION COMPENSATION DISCUSSION AND ANALYSIS
The following table showscharts show the percentage of 2013the 2015 PSUs that will vest based on the levels of performance achieved. No PSUs will vest ifachieved for each metric:
| EPS GROWTH (WEIGHTED 50%) | TSR VS. S&P 500 (WEIGHTED 50%)* | |
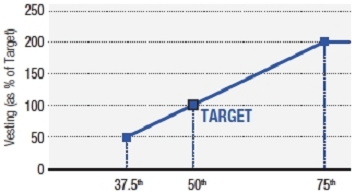 | ||
| EPS Growth Achieved (%) | TSR Rank Achieved (Percentile) |
| * | In the event of negative TSR over the three year performance period, the payout for the TSR portion of the award will be capped at 100% of target, regardless of UTC’s performance relative to the S&P 500. |
PSU Vesting
The 2015 EPS results of $8.61 per share included discontinued operations and the gain realized from the sale of Sikorsky Aircraft. The Committee excluded discontinued operations from EPS, which includes this gain, for PSU vesting measurement purposes. This resulted in an EPS from continuing operations of $4.53. The Committee made additional adjustments to exclude restructuring, non-recurring, and other significant, defined items unrelated to operational performance does not exceed(see Appendix B on page 86 for details), resulting in an adjusted EPS of $6.30 and a vesting factor of 88%.
UTC’s cumulative TSR relative to the S&P 500 for the performance period between 2013 and 2015 was below the threshold performance level and resulted in a 0% vesting is capped at 200% in the case ofabove-target performance:factor.
2013 PERFORMANCE SHARE UNITS
| ||||||||||||||||
EPS Growth (50% of award)
| Relative TSR vs. S&P 500 (50% of award) | |||||||||||||||
Level of Performance
| Percentage of EPS Portion Vesting | Level of Performance Achieved | Percentage of TSR Portion Vesting | |||||||||||||
Threshold
| 7% | 0% | 37.5th percentile | 0%* | ||||||||||||
Target
| 10% | 100% | 50th percentile | 100% | ||||||||||||
Maximum
| 13% | 200% | 75th percentile | 200% | ||||||||||||
* Beginning withThe Committee believes the 2014final PSU grant, for thevesting factor of 44% of target, which is based on an 88% EPS and a 0% relative TSR portion of the award, 50% will vest if threshold performance is achieved.
Vesting of 2011 PSUs
Performance share units granted at the start of 2011 vested at 136% of target. We believe this above-target vesting for the 2011-2013 performance periodresult, fairly aligns with the strong financialoverall performance of the Company over this period andduring the corresponding benefit to our shareowners.2013-2015 performance period.
Stock Appreciation Rights
SARs entitle the award recipient to receive, at the time of exercise, shares of UTC Common Stock with a market value equal to the difference between the exercise price (the closing price of Common Stock on the date of grant) and the market price of Common Stock on the date the SARs are exercised. SARs have a ten-year term, and vest and become exercisable after three years afterand expire ten years from the date of grant (or sooner in the event of a qualifying retirement).grant. If the employment of the executive terminates prior to the vesting date, the award will be forfeited.is forfeited, except in cases of death, disability, qualifying retirement or qualifying separation following a change-in-control.
We believe prior SAR
| Proxy Statement and Notice of 2016 Annual Meeting of Shareowners | 41 |
SAR awards directly link NEO compensation to share price appreciation, reflectingaligning shareowner and executive interests with long-term value creation. The Committee believes the creationten-year term of valuethese awards has been a driving force behind UTC’s 115% ten-year cumulative TSR for both executives and shareowners. UTC’s ten-year TSR has consistently outpaced both the Dow Jones Industrial Average and the S&P 500. For the ten-year period ending on December 31, 2013, UTC’s cumulative TSR equaled 197%, significantly exceeding2015, which exceeded the performance of the Dow Jones Industrial Average at 105%111% and the S&P 500 at 104%102%.
EXECUTIVE COMPENSATION COMPENSATION DISCUSSION AND ANALYSISOther Compensation Elements
EMPHASIS ON “AT RISK” PAY
90% of our CEO’s and 86% of our NEOs’ actual compensation (i.e., base salary, annual bonus and long-term incentives) is “at risk” compensation directly contingent on performance. Actual annual bonuses and long-term incentive awards are subject to the achievement of pre-established performance targets and designed to link directly to shareowner value. Base salary and other fixed elements of compensation are essential to any compensation program and relevant to the recruitment and retention of top talent. However, we believe that “at risk” compensation for our most senior executives should significantly outweigh base salaries.
Our 2013 compensation reflects this philosophy. The following charts illustrate the basic pay mix for our CEO and other NEOs for 2013. Note the significant portion of compensation that is “at risk.”
PAY MIX
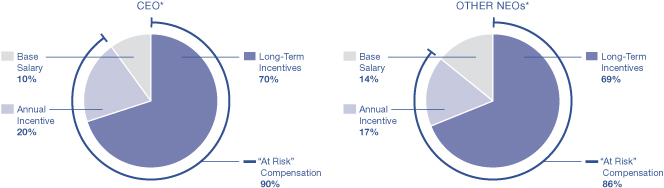
* For both pay mix charts, the base salary and annual and long-term incentive awards shown reflect the values disclosed in the Summary Compensation Table on page 48.
EXECUTIVE COMPENSATION COMPENSATION DISCUSSION AND ANALYSIS
OTHER COMPENSATION ELEMENTS
Retirement and Deferred Compensation Benefits
The Committee maintains retirement and deferred compensation benefits toplans help UTC attract and retain the most highly talented senior executives. Over the years, the Committee has modified these programs to ensuremaintain a competitive alignment withposition within an evolving market. We believe the overall valuedesign of our retirement and deferred compensation programs is consistent with the current marketplace and approximatesapproximate the CPG median.
The Pension Benefits table on page 5363 and the Nonqualified Deferred Compensation table on page 5565 detail the retirement benefits and deferred compensation values for each ofamounts provided to our NEOs. All of the NEOs participate in or are eligible to participate in the following retirement and deferred compensation plans:
| Description | |
UTC Employee Retirement Plan |
| |
UTC Pension Preservation Plan |
| |
UTC 401(k) Savings Plan |
| |
UTC
|
| |
| UTC Savings Restoration Plan | An unfunded, non-qualified plan that | |
UTC Deferred Compensation Plan |
| |
| UTC PSU Deferral Plan | An unfunded, non-qualified, deferred compensation plan that allows executives to defer |
*Detailed descriptions of each of these plans and the benefits they provide can be found on pages 64 to 66.
| 42 | |
PERQUISITES AND OTHER BENEFITS
We provide various forms ofthe following insurance coverage and limited perquisitesother benefits to our senior executives. Theexecutives which the Committee believes that these benefits are consistent with market practice and contribute to recruitment and retention.
Perquisite/Benefits | Description | |
ELG Life Insurance |
| |
ELG Long-Term Disability | The ELG long-term disability program provides an annual benefit equal to 80% of | |
Healthcare | ELG members are | |
Executive Physical | ELG members are eligible for a comprehensive annual executive physical. | |
| UTC provides ELG members | |
|
| |
| Financial Planning | Beginning in 2016, ELG members are eligible to receive an annual | |
Aircraft Usage | In |
EXECUTIVE COMPENSATION COMPENSATION DISCUSSIONSEVERANCE AND ANALYSISRETENTION ARRANGEMENTS
Severance and Retention Arrangements
ELG members participate in severance and retention arrangements consistent with practices in effect at the majority of CPG companies. We believecompanies in our CPG. The Committee believes such arrangements help UTC maintain a competitive compensation program. In addition to the market competitive nature of ourOur severance arrangements this program requires our executives to adhere toincorporate post-employment restrictive covenants designed to protect UTC’s interest,interests, including non-compete, non-solicitation and non-disclosure obligations.
| Proxy Statement and Notice of 2016 Annual Meeting of Shareowners | 43 |
Severance Program
Over the years, the Committee has made a number of modifications to the ELG severance program to both align with market best practices and to serve the evolving needs of the Company. The following chart outlines these modifications:
| ELG Appointment Date | ||||||
| Prior to January 2006 | Between January 2006 and April 2013 | On or after May 2013 | ||||
| Cash Separation Benefit | 2.5x base salary | 2.5x base salary | No cash benefit | |||
| Conditions to Receive CashSeparation Benefit | • Mutually agreeable separation • 3+ years as an ELG member | • Mutually agreeable separation prior to age 62 • 3+ years as an ELG member | N/A | |||
| ELG RSU Award | No award granted | Grant value equal to 2x base salary at time of grant | Grant value up to $2 million, depending on role | |||
| Conditions to Vest in theELG RSU Award | N/A | • Mutually agreeable separation on or after age 62 • 3+ years as an ELG member | • Mutually agreeable separation • 3+ years as an ELG member | |||
| NEO Participation | Gregory Hayes Alain Bellemare Geraud Darnis | Charles Gill, Jr. Paul Adams | Akhil Johri | |||
As originally designed and currently applicable forshown in the table above, ELG members appointed prior to January 2006 the ELG severance program providesmay receive a cash separation payment of 2.5 timesequal to 2.5x base salary in the event of a mutually agreed upon separation following three or more years of ELG participation. For ELG appointments between January 2006 and April 2013, the ELG severance arrangement was modified by eliminating this cash benefit for separations occurring on or after age 62. Instead these individuals are eligible to vest in a retention award of restricted stock units (“RSUs”) upon a mutually agreeable separation occurring on or after age 62, with at least(defined below) following three years ofas an ELG membership. For these individuals, the retentionmember.
Beginning in January 2006, ELG RSU award wasawards have been granted upon ELG appointment with a value equal to two times base salary on the date of grant.ELG. These awards receive dividend equivalents during the vesting period that are reinvested as additional RSUs.
In 2013, as part of its annual review of the ELG program, the Committee evaluated ELG severance arrangements against market standards and determined that further adjustments were appropriate. Based on this review, the Committee eliminated cash severance entirely, effective for members appointed on or after May 2013. These executives are now eligible to vest in the ELG retention RSU award, regardless of age, in the event
| • | ELG Appointments between January 2006 and April 2013: ELG RSU awards are eligible to vest after three years of ELG service followed by a mutually agreeable separation on or after age 62 or following a change-in-control (as defined on page 45). Alternatively, if a mutually agreeable separation occurs prior to age 62 with three years as an ELG member, a cash separation payment equal to 2.5x base salary will be paid in lieu of vesting in the ELG RSU award. |
| • | ELG Appointments on or after May 2013: ELG RSU awards will vest in cases of either mutually agreeable separation after three years of ELG service or following a change-in-control (as defined on page 45). While post-May 2013 appointees have no age requirement for vesting in their ELG RSU awards, they are not eligible for a cash severance payment upon separation. |
A mutually agreeable separation following three years of ELG service. The Committee made this changeoccurs when:
| • | An ELG member’s position with UTC has been eliminated or diminished by a divestiture, restructuring, shift in priorities or similar event; |
| • | An executive retires between age 62 and 65 with the Company’s consent; or |
| • | An executive retires at age 65 or older. |
Voluntary terminations prior to further strengthen the alignment of Company performance with the ELG retention program.age 62 or terminations related to misconduct do not qualify as mutually agreeable.
| 44 | |
Change-in-Control Benefits
We have maintained a senior executive
Our Senior Executive Severance Plan (“SESP”) provides change-in-control severance protection program since 1981. This program is designed to help ensure continuity of management in a potential change-in-control situation. However, insituations. In response to changing market practices, we closed this program to new participants effective June 2009. For those who are still eligible to participate, the program includes a cash severance benefit of 2.99x the sum of base salary and the executive’s target bonus for the year in which termination occurs.
Executives appointed to the ELG on or after June 2009 do not participate in our Change-in-Control program and eliminatedare instead covered by the following for existing participants:standard ELG severance benefit (2.5x base salary and/or the vesting of ELG RSU awards) in the event of a change-in-control.
ELG members may receive the greater of the SESP or ELG cash severance benefits, but not both.
A change-in-control generally occurs upon:
| (i) | the acquisition of 20% of UTC’s outstanding shares by a person or a group; | |
| if incumbent directors no longer constitute a majority of the Board; or | ||
| (iii) | a merger or similar event where UTC shareowners own less than 50% of the voting shares of the new organization. |
The program as currentlyBenefits under both the legacy SESP and the UTC Long-Term Incentive Plan (“LTIP”) are subject to a “double trigger” where benefits are provided only if a change-in-control is followed by an involuntary termination or termination for “good reason” within two years of the change-in-control event. “Good reason” generally includes material adverse changes in effect includesan executive’s compensation, responsibilities, authority, reporting relationship or work location. Under the following elements:LTIP, in a change-in-control event, accelerated vesting of performance-based awards will occur at target levels.
Role of Severance and Retention Benefits in Compensation Program
The Committee believes that with the program modifications previously described, above, the terms and conditions of our severance arrangements and change-in-control agreements for ELG members are market-competitive relative to our CPGCompensation Peer Group and provide participating executives with a reasonable level of financial security. Because severance and change-in-control benefits are contingent on future events, they operate as a form of insurance rather than as a principal component of compensation strategy. The Committee, therefore, does not take these benefits into account when setting other elements of pay or measuring total direct compensation.
The Potential Payments on Termination or Change-in-Control table on page 5767 sets forth the estimated values and details of the termination benefits each NEO would receive under various hypothetical scenarios.
| 45 |
The Summary Compensation Table on page 48 sets forth57 provides annual compensation data presented in accordance with SEC requirements. This uniformSEC-mandated format is helpful for cross-company comparisons. However, the Committee feels that the SEC-mandated formatit does not fully represent all of itsthe Committee’s annual compensation decisions and, in particular, does not provide the basis for a valid CEO pay for performancepay-for-performance assessment. Therefore, when reviewing annual compensation, the Committee uses several alternative calculation methodologies, as described in this section and summarized in the chart below:on page 49.
Summary Compensation
| Total Direct | Realizable Compensation | Realized Compensation | |||||
Basic concept | Uses SEC methodology, which includes a mix of both compensation actually earned during 2015 and some future contingent pay opportunities | Includes only pay that is directly linked to 2015 performance | 3-year average compensation measure which captures how our current share price would affect previously granted equity awards | Includes only pay that was actually earned during 2015 | ||||
| Purpose | SEC-mandated compensation disclosure | Reflects the Committee’s compensation decisions based on | Used to evaluate | Used to evaluate | ||||
|
plus Future pay opportunities that may or may not be realized, such as:
awards (SARs and PSUs) granted in
|
• Base salary
Excludes: Pay elements outside the scope of the Committee’s annual compensation decisions, such as:
• Above market earnings of non-qualified deferred compensation | Three-year average of:
Excludes:
• Above market earnings of non-qualified deferred compensation |
Excludes:
• Above market earnings of non-qualified deferred compensation |
| (1) | For a definition of in-the-money value refer to page 47. |
| (2) | Other direct compensation includes personal use of the Corporate aircraft, |
| Other indirect compensation includes insurance premiums and Company contributions to |
| 46 | |
TOTAL DIRECT COMPENSATION
Unlike the amounts reported in the Summary Compensation Table, total direct compensation includes only pay elements that directly reflect the Committee’s assessment of Company and individual performance for the current year.2015. For example, the Summary Compensation Table values includeshows the grant date fair value of long-term incentive awards granted in January 2013, reflecting2015, which reflects the Committee’s assessment of 20122014 performance. TotalIn contrast, total direct compensation however, reflects 20132015 performance by instead including the grant date fair value of awards granted in January 2014.2016. Other elements included in the Summary Compensation Table — Table–changes in pension values, dividend equivalent payments and other formulaic compensation elements — elements–are outside the scope of the Committee’s annual pay decisions. Therefore, the Committee believes excluding these elements from total direct compensation renders a more accurate and currentup-to-date assessment of executive compensation at UTC.
EXECUTIVE COMPENSATION COMPENSATION DISCUSSION AND ANALYSISthe Committee’s performance evaluation for the year.
CEO 2013MR. HAYES: 2015 SUMMARY COMPENSATION TABLE VS. TOTAL DIRECT COMPENSATION
Compensation Element
|
2013 Summary Compensation Table (in thousands)
| 2013 Total Direct Compensation (in thousands) | ||||||
| Compensation Element (in thousands) | 2015 Summary Compensation Table | 2015 Total Direct Compensation | ||||||
Base Salary
| $1,756 | $1,775 | $1,300 | $1,300 | ||||
Annual Bonus
| $3,400 | $3,400 | $850 | $850 | ||||
Stock Awards |
$6,381 (1/2/13 grant date)
|
$7,111 (1/2/14 grant date)
| $4,752 | $4,869 | ||||
| (1/2/15 grant) | (1/4/16 grant) | |||||||
Option Awards |
$5,387 (1/2/13 grant date)
|
$6,175 (1/2/14 grant date)
| $3,280 | $3,707 | ||||
Non-Equity Incentive Compensation*
| $697 | |||||||
Change in Pension Value
| $2,078 | N/A | ||||||
| (1/2/15 grant) | (1/4/16 grant) | |||||||
| Change in Pension Value + Non-Qualified Deferred Compensation Earnings | $231 | N/A | ||||||
All Other Compensation
| $575 | $355 | N/A | |||||
Total
| $20,274 | $18,461 | $10,768 | $10,726 | ||||
REALIZABLE COMPENSATION
The Committee does not believe that the Summary Compensation Table or total direct compensation values adequately measure CEO compensation for the purpose of assessing the alignment of pay with performance.pay-for-performance alignment. Both methods utilizeestimated accounting conventions to estimate values of long-term incentive awards at the time of grant. As might be expected, however,these estimated values can differ significantly from theactual value paid.that is ultimately earned from these awards.
Therefore,
For this reason, the Committee also takes into consideration realizable compensation,considers “realizable compensation” which measures compensation based on thea three-year average annual amount of salary, annual bonus, long-term incentive awards, non-equity incentive compensation and other direct compensation elements overelements. Realizable compensation plays an important role in helping the preceding three years. Further and most importantly, realizableCommittee assess our compensation program’s alignment with shareowners’ long-term interests. It captures the impact of UTC’s current share price performance on previously granted long-term incentive awards by using the “in-the-money” value for these awards, rather than a grant date fair value. The “in-the-money” value is defined as the difference between the closing price of our Common Stock at the end of the third yearthree-year measurement period and the grantexercise price (if any) multiplied by the number of the award. The use of anshares underlying SAR and PSU awards. By using this end-of-year stock price, realizable compensation directly correlates the executive’s benefit with the return our shareowners receivereceived from investing in our Common Stock over the same period. The Committee, therefore, views realizable compensation as relevant to its assessment of our compensation program’s alignment with shareowners’ long-term interests. An exampleillustration of this alignment is shown in the year-over-year increase in Mr. Chênevert’s realizable compensation between 2012 and 2013 which was primarily driven by the significant appreciation in our Common Stock in 2013.charts on page 49.
Unlike the values reported in
Also, unlike the Summary Compensation Table, the calculation of realizable compensation excludes theany change if any, in the value of thean executive’s pension benefits during the year. InThe change in pension value shown in the Summary Compensation Table the change in pension value is an actuarial valuation that reflects the change from the preceding year’s present value of future potential pension payments, and does not represent theactualpayments to be received upon retirement. This valuation is only anIt merely reflects the change between the current
| Proxy Statement and Notice of 2016 Annual Meeting of Shareowners | 47 |
and prior year’s actuarial estimate of future value and is heavily impacted bypension benefits, based on actuarial assumptions and external economic factors such as the fluctuation offluctuating interest rates. These calculations do not necessarily correlate with the value of actual benefits received. In addition, Mr. ChênevertHayes and some of the other NEOs participate in a broad-based pension plan with the same benefit formula applicablethat applies to all U.S. salaried employees.employees hired prior to January 1, 2010. This pension plan is not related to our executive compensation program and does not measure individual or Company performance as assessed by the Committee and is therefore, in ourthe Committee’s view, irrelevant to the pay for performancepay-for-performance assessment.
Realizable compensation also excludes other indirect compensation elements, such as Company contributions to the UTC 401(k) Savings Plan nonqualifiedand our non-qualified deferred compensation plans, andas well as ELG life insurance premiums. Since these elements are also not based on performance, the Committee does not consider them relevant to the assessment of the CEO’s pay relative to his performance.
EXECUTIVE COMPENSATION COMPENSATION DISCUSSION AND ANALYSIS
MR. HAYES: THREE-YEAR HISTORY OF CEO REALIZABLE COMPENSATION
Pay Elements
| Calculation Methodology | 2011* | 2012* | 2013* | Calculation Methodology | 2013* | 2014* | 2015* | ||||||||||||||
Base Salary |
Average annual base salary for the year shown and the preceding two years.
|
|
$1,569 |
|
|
$1,657 |
|
|
$1,713 |
| Average annual base salary for the year shown and the preceding two years. | $805 | $883 | $1,040 | ||||||||
Annual Bonus |
Average annual bonus for the year shown and the preceding two years.
|
|
$3,400 |
|
|
$4,000 |
|
|
$3,800 |
| Average annual bonus earned for the year shown and the preceding two years. | $1,173 | $1,300 | $1,183 | ||||||||
Stock Awards |
Average annual value of vested and unvested PSU awards granted in the year shown and the preceding two years, calculated based on the share price at the end of the year shown. For the completed three-year performance cycle, the calculation is based on the actual number of shares vested. For each of the two uncompleted three-year performance cycles, the calculation assumes that the target number of shares is earned.
|
|
$6,310 |
|
|
$8,255 |
|
|
$10,894 |
| Average annual value of vested and unvested PSU awards granted in the year shown and the preceding two years, based on UTC’s share price at the end of the year shown. For the completed three-year performance cycles, the calculation is based on the actual number of shares vested. For the two uncompleted three-year performance cycles, the calculation assumes that the target number of shares is earned. | $2,917 | $2,269 | $2,230 | ||||||||
Option Awards |
Average annual in-the-money value of stock option and SAR awards (vested and unvested) granted in the year shown and the preceding two years, calculated based on the share price at the end of the year shown.
|
|
$2,795 |
|
|
$2,266 |
|
|
$11,502 |
| Average annual in-the-money value of SAR awards (vested and unvested) granted in the year shown and the preceding two years, calculated based on UTC’s share price at the end of the year shown. | $3,850 | $2,806 | $430 | ||||||||
Non-Equity Incentive Compensation |
Average annual value of dividend equivalents paid in cash for the year shown and preceding two years for awards granted prior to 2006 under the legacy Continuous Improvement Incentive Program. This legacy program will expire in 2014.
|
|
$1,252 |
|
|
$1,220 |
|
|
$1,012 |
| Average annual value of dividend equivalents paid in cash for the year shown and the preceding two years, under a legacy long-term incentive program that expired at the end of 2014. | $324 | $236 | $121 | ||||||||
Other Direct Compensation |
Average annual value of other direct compensation for the year shown and the preceding two years. Excludes indirect compensation elements such as life insurance premiums, Company contributions to the UTC 401(k) Savings Plan and our nonqualified deferred compensation plans.
|
|
$182 |
|
|
$203 |
|
|
$204 |
| Average annual value of other direct compensation for the year shown and the preceding two years. Includes personal use of the Corporate aircraft, leased vehicle payments, and other miscellaneous compensation items. Excludes other indirect compensation, as defined on page 46. | $49 | $46 | $66 | ||||||||
Total Realizable Compensation
|
|
$15,508 |
|
|
$17,601 |
|
|
$29,125 |
| Total Realizable Compensation | $9,118 | $7,540 | $5,070 | |||||||||
*Compensation values shown in thousands.
The following table shows the actual or assumed vesting levels used for Mr. Chênevert’sHayes’ PSUs in the preceding table:
Grant Date
|
Actual Shares Vested
|
Vesting (as % of target)
| Actual Shares Vested | Vesting (as % of target) | ||||
1/2/2009
| 51,510 | 51% | ||||||
1/4/2010
| 84,390 | 97% | ||||||
1/3/2011
| 123,080 | 136% | 36,312 | 136% | ||||
1/3/2012
| Awards not yet vested; target number of shares reflected | 29,070 | 90% | |||||
1/2/2013
| ||||||||
| 1/3/2013 | 11,528 | 44% | ||||||
| 1/2/2014 | Awards not yet vested; target number of shares assumed | |||||||
| 1/2/2015 | ||||||||
| 48 | |
REALIZED COMPENSATION
When assessing CEO pay for performance alignment, the
The Committee also reviews realized“realized compensation” for purposes of assessing CEO pay-for-performance alignment. Realized compensation which representsincludes the amount of compensationactually paid earned during the year, as opposed tobut excludes amounts that may or may not be paid in the future. Realized compensation also incorporates theany gains actually received earned during the year uponfrom the vesting of PSUs andor the exercise of stock options or SARs. Evaluating realizedRealized compensation provides the Committee with an additional relevant measure to assess the robustness of our pay for performance relationship. Realized compensation demonstratespay-for-performance relationship by focusing on the strength of the correlation between highthe level of cash and equity payouts in years of strong performance and low cash and equity payouts in years of weakUTC’s performance. Although the decision to exercise stock options and SARs resides with the executive and therefore may not always correlate with Company performance, the timing of exercises often aligns with stock price appreciation. Changes in pension values and other indirect compensation elements are excluded from realized compensation for the same reasons noted in the discussion of realizable compensation on page 40.
EXECUTIVE COMPENSATION COMPENSATION DISCUSSION AND ANALYSIS48.
MR. HAYES: THREE-YEAR HISTORY OF CEO REALIZED COMPENSATION
Pay Elements
| Calculation Methodology | 2011* | 2012* | 2013* | Calculation Methodology | 2013* | 2014* | 2015* | ||||||||||||||
Base Salary
| Base salary paid during the year shown. | $1,681 | $1,700 | $1,756 | Base salary paid during the year shown. | $870 | $950 | $1,300 | ||||||||||||||
Annual Bonus
| Annual bonus paid for performance during the year shown. | $4,500 | $3,500 | $3,400 | Annual bonus earned for performance during the year shown. | $1,100 | $1,600 | $850 | ||||||||||||||
Stock Awards
| Realized gains on PSUs which vested during the year shown. | $3,748 | $4,150 | $7,562 | Realized gains on PSUs that vested during the year shown. | $2,156 | $4,052 | $3,469 | ||||||||||||||
Option Awards |
Realized gains on stock options and SARs exercised during the year shown.
|
|
$3,699 |
|
|
$8,423 |
|
|
$10,686 |
| Realized gains on stock options and SARs exercised during the year shown. | $15,387 | $2,990 | $0 | ||||||||
Non-Equity Incentive Compensation |
Value of dividend equivalents paid in cash during the year shown on awards granted prior to 2006 under the legacy Continuous Improvement Incentive Program. This legacy program will expire in 2014.
|
|
$1,154 |
|
|
$1,186 |
|
|
$697 |
| Value of dividend equivalents paid in cash during the year shown, under a legacy long-term incentive program that expired at the end of 2014. | $308 | $54 | $0 | ||||||||
Other Direct Compensation |
Value of other direct compensation for the year shown. Excludes indirect compensation elements such as life insurance premiums, Company contributions to the UTC 401(k) Savings Plan and our nonqualified deferred compensation plans.
|
|
$207 |
|
|
$213 |
|
|
$191 |
| Value of other direct compensation for the year shown. Includes personal use of the Corporate aircraft, leased vehicle payments, and other miscellaneous compensation items. Excludes other indirect compensation, as defined on page 46. | $56 | $34 | $106 | ||||||||
Total Realized Compensation
|
Total Realized Compensation
| $14,989 | $19,172 | $24,292 | Total Realized Compensation | $19,877 | $9,680 | $5,725 | ||||||||||||||
*Compensation values shown in thousands.
SUMMARY COMPENSATION TABLE VS. REALIZABLE AND REALIZED COMPENSATION
The following chart comparescharts compare the Summary Compensation Table values reported for Mr. Hayes for the CEO forpast three years 2011 through 2013, to Mr. Chênevert’shis realizable and realized compensation for the same time period. As shown in the chart shows,charts below, the correlation between TSR and realizable and realized compensation is much stronger than the correlation between TSR and Summary Compensation Table values.
CEO Pay*(in thousands)
| Summary Compensation Table | Realizable Compensation* | Realized Compensation* | Total Shareowner Return | |||
| (thousands) | (thousands) | (thousands) | (1-Year TSR) |

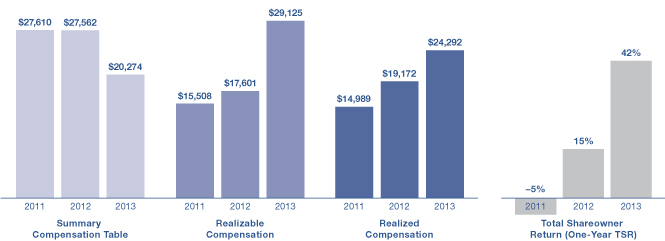
*Refer to the table on page 4148 to see how we calculate realizable compensation and to the chart abovepreceding table for the calculation ofhow realized compensation.compensation is calculated.
| 49 |
Pay Decisions for Named Executive Officers (NEOs)
PAY DECISIONS FOR NAMED EXECUTIVE OFFICERS (NEOs)
In this section, we review and explain the Committee’s 2013The Committee makes compensation decisions for each of our NEOs.
LOUIS CHÊNEVERT, CHAIRMAN & CHIEF EXECUTIVE OFFICER
Mr. Chênevert’s total direct compensation for 2013 equaled $18.5M, approximately a 9% increase from 2012. Under his leadership, UTC exhibited strong financial, operational and strategic performance in 2013. The increase in Mr. Chênevert’s total direct compensation was driven by this high level of performance.
CEO TOTAL DIRECT COMPENSATION DECISIONS, 2011-2013
Year-End Decisions(in millions)
| ||||||
| Compensation Element |
2011
| 2012 | 2013 | |||
Base Salary 4.4% increase from prior year
| $1.7
| $1.7
| $1.775
| |||
Annual Incentive Award 2013 performance generated an annual bonus opportunity equal to 120% of target
| $4.5
| $3.5
| $3.4
| |||
Long-Term Incentive Award Stock Appreciation Rights and Performance Share Units
| Reflects 1/3/12 Grant
$7.0 SARs | Reflects 1/2/13 Grant
$5.4 SARs | Reflects 1/2/14 Grant
$6.2 SARs | |||
+ $7.8 PSUs
| + $6.4 PSUs
| + $7.1 PSUs
| ||||
| $14.8 | $11.8 |
$13.3
| ||||
Total
| $21.0 | $17.0 | $18.5 | |||
In his role as Lead Director, Mr. Kangas led the Board’s assessment of Mr. Chênevert’s performance in 2013. This assessment included a review of UTC’s performance relative to pre-established financial goals (see page 46 for a discussion of these metrics), as well as Mr. Chênevert’s individual performance and leadership.
With respect to annual bonus performance metrics, UTC achieved net income of $5.686 billion in 2013, a 17% increase from 2012 and in excess of the $5.485 billion pre-established target. The ratio of free cash flow (see page 46 for how we compute free cash flow) to net income equaled 102%. In combination, these results generated an annual bonus factor for the Corporation of 120% of target. In addition to our pre-established annual bonus goals, UTC generated a TSR of 42% for 2013.
Several noteworthy strategic accomplishments in 2013 led to the Committee’s very positive evaluation of Mr. Chênevert’s individual performance. Among them was his leadership in the successful integration of Goodrich and International Aero Engines (“IAE”) into UTC Propulsion & Aerospace Systems (“UTC PAS”). These transformational acquisitions are delivering strong results, allowing us to leverage tremendous new capabilities, technologies and talent. The benefits of the combined UTC Propulsion & Aerospace Systems structure were evidenced in 2013 when Embraer selected UTC PAS to provide a fully integrated propulsion system—engine, nacelle and controls—and to serve as the sole supplier of wheels, brakes and electrical systems for its new second generation E-Jet aircraft family.
UTC Climate, Controls & Security (“UTC CCS”) achieved its 2015 earnings target two years ahead of schedule, while continuing to create additional cost and revenue synergies driven by the combination of our Carrier and UTC Fire & Security businesses. Commercial portfolio transformation continued in 2013 with the creation of UTC Building & Industrial Systems (“UTC BIS”) which combined UTC CCS and Otis. The newly-formed organization positions UTC to better capitalize on accelerating urbanization in emerging markets, to provide enhanced support to our global commercial customers, and to serve as a growth engine for UTC.
EXECUTIVE COMPENSATION COMPENSATION DISCUSSION AND ANALYSIS
This continued portfolio transformation, coupled with strong financial performance of 16% EPS growth and 42% total shareowner return, were the primary factors in the Committee’s favorable assessment of CEO performance for 2013. In recognition of these accomplishments, and in combination with UTC’s exceptional performance against pre-established financial goals, the Committee awarded Mr. Chênevert a $3.4 million bonus. This award value aligns directly with the Corporation’s financial performance factor of 120%.
OTHER NAMED EXECUTIVE OFFICERS
The Committee bases compensation decisions for NEOs based on their individual performance and the overall performance of the Company, and business unit performanceand/or function, where applicable. After reviewing these factors, the Committee determines each NEO’s awards under the annual and long-term incentive plans and also sets salaries for the upcoming year.
2013 NEO TOTAL DIRECT COMPENSATION
The following table summarizesAs discussed on page 47, total direct compensation represents the Committee’s 2015 pay decisions for each of the 2013 performance year.principal elements of compensation (i.e., base salary, annual bonus, long-term incentives). Unlike the Summary Compensation Table, which includes the long-term incentive award (PSUs and SARs) granted in January 2015 reflecting 2014 performance, total direct compensation includes the PSU and SAR awards granted in calendar year 2013,January 2016 reflecting the Committee’s assessment of 2015 performance.
The charts shown for each NEO in the following pages display the total direct compensation value delivered in each of the principal elements of compensation. These charts do not include amounts paid to Mr. Johri to offset compensation he forfeited upon leaving his former employer. Additionally, since Mr. Darnis retired on January 31, 2016 and did not receive a 2016 long-term incentive grant, the total direct compensation shown in the following table instead includes long-term incentive awards granted in January 2014, reflecting a more appropriate assessment of 2013 performance.chart on page 52 does not include 2016 PSU and SAR awards.
Compensation Element
| Hayes
| Darnis
| Bellemare
| Hess*
| ||||
Base Salary
| $880 | $1,000 | $825 | $675 | ||||
Annual Incentive Award
| $1,100 | $1,100 | $1,050 | $625 | ||||
Stock Appreciation Rights
| $2,030 | $5,897 | $1,959 | $0 | ||||
Performance Share Units
| $2,333 | $2,257 | $2,257 | $0 | ||||
Total Direct Compensation
| $6,343
| $10,254
| $6,091
| $1,300
|
 | 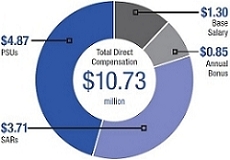 | Age:55 Individual Performance Highlights • Effectively driving UTC’s portfolio transformation, including the accelerated completion of the sale of Sikorsky Aircraft and the acquisition of a number of businesses better aligned with UTC’s core markets and segments • Simplification of UTC’s organizational structure, providing greater transparency and more direct accountability • Rigorous commitment to a disciplined capital allocation strategy, evidenced by the $12 billion we returned to shareowners in 2015 through dividends and share repurchases (including the $6 billion accelerated share buyback program announced in November 2015) • Efficient transition to a new senior leadership team with a strong focus on operational excellence and a renewed emphasis on succession planning • Achievement of aggressive pre-established environmental goals • Listed as one of the 2016 Best CEOs in the aerospace and defense electronics category byInstitutional Investor Magazine for his effective communication with shareowners and analysts | |
President and Chief Executive Officer The Committee assessed Mr. Total direct compensation decreased slightly from $10.93 million in 2014 to $10.73 million in 2015, directly attributable to a decrease in the Company’s 2015 annual bonus financial performance factor compared to the prior year. 2015 adjusted net income of $5.563 billion fell short of the $6.282 billion annual bonus target set for the year, resulting in a vesting factor of 0% for the earnings portion of the annual bonus award. The 2015 ratio of free cash flow to net income used to calculate the annual bonus performance factor equaled 99%, compared to a target of 100%. In combination, these factors resulted in a 39% financial performance factor for purposes of determining 2015 annual bonus awards. The Committee utilized these results, along with the favorable individual performance considerations noted here, and awarded Mr. Hayes an $850,000 annual bonus, an amount that closely aligns with the Company’s 39% financial performance factor. Mr. Hayes’ 2016 long-term incentive award recognizes his 2015 performance. The value of his 2016 award equals $8.58 million, an amount exceeding the $8.03 million award made in 2015 but below the CPG median, reflecting his brief tenure as CEO. | |||
| 50 | |
| AKHIL JOHRI | |||
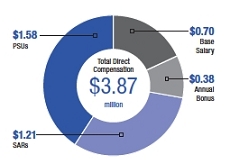 | Age:54 Individual Performance Highlights • His role in the negotiations and transition efforts related to the successful sale of Sikorsky Aircraft, which closed on an expedited timeline • Ranked #1 2016 Best CFO in the aerospace and defense electronics category byInstitutional Investor Magazine • His efforts towards the implementation of the announced multi-year $1.5 billion cost reduction plan, which included $400 million in restructuring in 2015 • Successful execution of UTC’s disciplined capital allocation strategy, including the $12 billion returned to shareowners in 2015 through dividends and share repurchases (including the $6 billion accelerated share buyback program announced in November 2015) • Strategic financial leadership in positioning UTC to maximize future growth opportunities through $538 million in acquisitions and $3.9 billion in Company and customer-funded research and development investments made in 2015 | ||
Executive Vice President & Chief Financial Officer The Committee approved a base salary of $700,000 for Mr. Johri upon his return to UTC on January 1, 2015. For purposes of annual bonus determination, the Committee considered the UTC financial performance factor of 39%, as discussed on the prior page, his effective leadership of the finance organization and the individual performance considerations noted here. Based on these factors, the Committee awarded Mr. Johri a $375,000 annual bonus, an amount above the financial performance factor but below the market median. Reflecting its favorable assessment of Mr. Johri’s 2015 performance, the Committee granted him a 2016 long-term incentive award valued at $2.79 million. The value of this award falls below the market median, reflecting Mr. Johri’s brief tenure as CFO. | |||
| Proxy Statement and Notice of 2016 Annual Meeting of Shareowners | 51 |
| GERAUD DARNIS | |||
 | 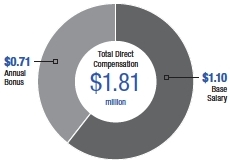 | Age:56 Individual Performance Highlights • Selection of Otis to install elevators and escalators at the landmark New York City Hudson Yards development project • Otis’ contract win valued at more than $100 million to provide 370 elevators and 104 escalators to the world’s largest hotel, the Abraj Kudai in Saudi Arabia • Significant UTC CCS’ contract wins for the Sheikh Jaber Al Ahmad Culture Center in Kuwait and the new Atlanta Braves stadium • Rollout of upgraded North American Residential HVAC products which meet the 2015 Regional Efficiency Standards • Launch of a number of new or upgraded products, including the Advanced Diesel Engine truck trailer and Orion container platforms for transportation refrigeration | |
President & Chief Executive Officer, Mr. Darnis received a salary increase from $1,050,000 to $1,100,000 effective April 1, 2015, reflecting the Committee’s ongoing favorable assessment of his performance leading UTC’s $28.7 billion commercial businesses. For purposes of annual bonus determination, the Committee weighted performance for the Company (39%, as previously discussed) and UTC Building & Industrial Systems (73%), which in combination, generated a financial performance factor of 59% of target. Based on these results, along with the individual performance considerations listed here, the Committee awarded Mr. Darnis an annual bonus of $710,000, an amount that aligns with this blended financial performance factor. Mr. Darnis retired | |||
Gregory Hayes, Senior Vice President & Chief Financial Officer
| 52 | |
For purposes of annual bonus determination, the performance of the Corporation generated a financial performance factor of 120% of target. The Committee considered this factor, along with the individual performance elements listed below,