$35,000 as an annual retainer for their service on the Board. In addition, non-employee directors received additional retainers for the following roles:The Non-Executive Chairman received $125,000 per year;
The Chair of the Audit Committee received $25,000 per yearChair and $15,000 for each other member of the Audit Committee received $15,000 per year;Committee;
The Chair of•$27,000 for the Compensation Committee received $20,000 per yearChair and $12,000 for each other member of the Compensation Committee received $12,000 per year; andCommittee;
The Chair of•$20,000 for the Corporate Governance Committee received $15,000 per yearChair and $10,000 for each other member of the Corporate Governance Committee;
•$20,000 for the Risk Oversight Committee receivedChair and $10,000 per year.
The Chair of the Finance Committee received $15,000 per year andfor each other member of the FinanceRisk Oversight Committee; and
•$20,000 for the Corporate Social Responsibility and Public Policy Committee receivedChair and $10,000 per year.for each other member of the Corporate Social Responsibility and Public Policy Committee.
All directors are also reimbursed for reasonable expenses incurred in connection with service on the Board or any of its Committees.
Under the program, each non-employee director is automatically eligible for an annual equity award grantsgranted in the form of DSUsdeferred stock units (“DSU”) under the Director EquityConduent Incorporated 2021 Performance Incentive Plan. DSUs areA DSU is a bookkeeping entry that represents the right to receive one share of our Common Stock at a future date. DSUs are vested on the date of grant and include the right to receive dividend equivalents, which are credited in the form of additional DSUs, at the same time and in approximately the same amounts that the holder of an equivalent number of shares of our Common Stock would be entitled to receive in dividends. For 2017,2023, our non-employee directors received awere entitled to an annual grant of DSUs with a grant date fair value of $145,000.Changes$190,000. If a director separates from service prior to Director Compensation Program for 2018
On December 8, 2017, our Board adopted changes to the compensation program for our non-employee directors effective January 1, 2018. The program was modified as follows:
The grant date fair value of annualyear-end, DSU grants was increased from $145,000 to $190,000 to bring total pay in line with our peer group and emphasize equity in the mix of compensation.
DSU grants are subject to a mandatory holding period of one year following the grant date (previously one year following separation from service).
DSU agreements now include a clawback provision allowing for recovery of DSUs granted during the year of separation from service on a pro rata basis, if a director separates from service prior to year-end.basis.
Deferral of Retainer Fees
Board members can now elect to receive up to 100% of their $80,000 annual cash retainer, and/committee fees or annual equity grantother fees in the form of DSUs, the payout of which are deferred for a specified number of years following grant, as determined by the director, or until any earlier separation from service.
Director Stock Ownership Guidelines
In 2017, our Board established
The program includes stock ownership guidelines that require directors to own Common Stock in a minimum amount equal to 6 times the annual cash retainer ($80,000 x 6 = $480,000) within 3 years of adoption of the guidelines (or within 3 years of appointment to the Board for directors elected after 2017). Directors are required to holdretain 50% of all net after-tax shares received upon the vesting of Common equity awards (net of shares which may be sold to cover applicable taxes) until the threshold is achieved.
2023 Director Compensation Table
The following table shows the compensation paid by Conduent to its non-employee directors for the fiscal year ended December 31, 2023. Clifford Skelton, Chief Executive Officer, is not included in this table because he was an employee of the Company during 2023 and received no additional compensation for his service as a director. The compensation received by Mr. Skelton as an employee is included in the 2023 Summary Compensation Table below.
| | | | | | | | | | | | | | | | | |
| Name | Fees Earned or Paid in Cash ($) | Stock Awards ($)(1) | All Other Compensation ($) | Total ($) |
| Hunter Gary | 117,000 | | | 190,000 | — | 307,000 |
| Kathy Higgins Victor | 115,000 | | | 190,000 | — | 305,000 |
| Scott Letier | 227,000 | | (2) | 190,000 | — | 417,000 |
| Jesse Lynn | 100,000 | | | 190,000 | — | 290,000 |
| Steven Miller | 115,000 | | | 190,000 | — | 305,000 |
| Michael Montelongo | 135,000 | | | 190,000 | — | 325,000 |
| Margarita Paláu-Hernández | 112,000 | | (2) | 190,000 | — | 302,000 |
(1)This column reflects the aggregate grant date fair value of the annual equity grant made to non-employee directors in the form of DSUs ($190,000) and computed in accordance with Financial Accounting Standards Board Accounting Standards Codification (“FASB ASC”) Topic 718, Compensation—Stock grantedCompensation.
(2)Directors elected to defer all or a portion of their annual cash retainer(s) and committee fees reflected in the Fees Earned or Paid in Cash column in the form of DSUs as follows: Mr. Letier: $227,000; and Margarita Paláu-Hernández: $112,000
The total number of all DSUs held by each director until compliance with the guidelines are met.as of December 31, 2023 is as follows: Mr. Gary: 40,861; Ms. Higgins Victor: 146,972; Mr. Letier: 309,312; Mr. Lynn: 74,490; Mr. Miller: 74,490; Mr. Montelongo: 80,527; and Ms. Paláu-Hernández: 164,468.
Security Ownership of
Company SecuritiesCertain Beneficial Owners (1)
We are not aware of any person who, or group which, owns beneficially more than 5% of any class of the Company’s equity securities
based on shares of Common Stock outstanding as of
December 31, 2017,March 18, 2024, except as set forth below.
| | | | | | | | | | |
| Title of Class | | Name and Address of Beneficial Owner | | Amount and
Nature of
Beneficial
Ownership | | | Percent
of Class | |
Common Stock | | FMR, LLC (2) 245 Summer St. Boston, MA 02210 | | | 23,289,802 | | | | 11.07 | % |
Common Stock | | Mr. Carl C. Icahn (3) c/o Icahn Capital LP 767 Fifth Avenue, 47th Floor New York, NY 10153 | | | 19,806,000 | | | | 9.8 | % |
Common Stock | | The Vanguard Group (4) 100 Vanguard Blvd. Malvern, PA 19355 | | | 17,298,502 | | | | 8.22 | % |
Common Stock | | Mr. Darwin A. Deason (5) 5956 Sherry Ln. Dallas, TX 75225 | | | 12,320,307 | | | | 5.86 | % |
(1) | The words “group” and “beneficial” are as defined in regulations issued by the SEC. Beneficial ownership under such definition means possession of sole voting power, shared voting power, sole dispositive power or shared dispositive power. The information provided in this table is based solely upon the information contained in the most recent Schedule 13G or 13G/A (or in the case of Mr. Icahn, the most recent Schedule 13D/A) filed by the named entity with the SEC. |
(2) | Based on a Schedule 13G filed with the SEC on March 12, 2018 by FMR LLC (“FMR”) to report FMR’s beneficial ownership of Common Stock as of February 28, 2018. FMR has sole voting power for 106,528 shares of Common Stock, sole dispositive power for 23,289,802 shares of Common Stock and has no shared voting power or shared dispositive power for any shares of Common Stock. Based on a Schedule 13G filed with the SEC on February 13, 2018 by FMR, FMR beneficially owned 14,262,330 shares of Common Stock (6.78%) as of December 31, 2017. |
(3) | Based on a Schedule 13D filed with the SEC on January 9, 2017 by Carl C. Icahn. |
| | | | | | | | | | | | | | | | |
| Title of Class | Name and Address of Beneficial Owner | Amount and Nature of Beneficial Ownership | Percent of Class | | | | | |
| Common Stock | Mr. Carl C. Icahn (2)
c/o Icahn Capital LP
767 Fifth Avenue, 47th Floor
New York, NY 10153 | 38,149,336 | | 18.28 | % | | | | | |
| Common Stock | The Vanguard Group (3)
100 Vanguard Blvd.
Malvern, PA 19355 | 17,354,385 | | 8.32 | % | | | | | |
| Common Stock | Neuberger Berman Group LLC/Neuberger Berman Investment Advisers LLC (4)
1290 Avenue of the Americas
New York, NY 10104 | 14,693,141 | | 7.04 | % | | | | | |
| Common Stock | BlackRock, Inc. (5)
50 Hudson Yards
New York, NY 10001 | 14,650,070 | | 7.02 | % | | | | | |
| Common Stock | Mr. Darwin A. Deason (6)
3953 Maple Avenue, Suite 150
Dallas, TX 75219 | 12,320,307 | | 5.90 | % | | | | | |
| Common Stock | T. Rowe Price Investment Management, Inc. (7)
101 E. Pratt Street
Baltimore, MD 21201 | 10,906,621 | | 5.23 | % | | | | | |
____________________
(1)The words “group” and “beneficial” are as defined in regulations issued by the SEC. Beneficial ownership under such definition means possession of sole voting power, shared voting power, sole dispositive power or shared dispositive power. Other than Percent of Class, the information provided in this table is based solely upon the information contained in the most recent Schedule 13G or 13G/A (or in the case of Mr. Icahn and Mr. Deason, the most recent Schedule 13D or 13D/A) filed by the named entity with the SEC.
(2)Based on a Schedule 13D/A filed with the SEC on August 16, 2019 by Carl C. Icahn to report his beneficial ownership as of that date.
Represents shares of Common Stock held by the following group of entities associated with Carl C. Icahn: High River Limited Partnership (“High River”), Hopper Investments LLC (“Hopper”), Barberry Corp. (“Barberry”), Icahn Partners Master Fund LP (“Icahn Master”), Icahn Offshore LP (“Icahn Offshore”), Icahn Partners LP (“Icahn Partners”), Icahn Onshore LP (“Icahn Onshore”), Icahn Capital LP (“Icahn Capital”), IPH GP LLC (“IPH”IPH”), Icahn Enterprises Holdings L.P. (“Icahn Enterprises Holdings”), Icahn Enterprises G.P. Inc. (“Icahn Enterprises GP”) and Beckton Corp. (“Beckton”)(collectively, (collectively, the “Reporting Persons”). The principal business address of (i) each of High River, Hopper, Barberry, Icahn Offshore, Icahn Partners, Icahn Master, Icahn Onshore, Icahn Capital, IPH, Icahn Enterprises Holdings, Icahn Enterprises GP and Becktonthe Reporting Persons is White Plains Plaza, 445 Hamilton Avenue - Suite 1210, White Plains, NY 10601, and (ii) Mr. Icahn is c/o Icahn Associates Holding LLC, 767 Fifth Avenue, 47th Floor, New York, NY 10153. High River has sole voting power and sole dispositive power with regard to 3,961,2007,629,868 shares of Common Stock. Each of Hopper, Barberry and Mr. Icahn has shared voting power and shared dispositive power with regard to such shares of Common Stock. Icahn Master has sole voting power and sole dispositive power with regard to 6,563,01812,672,483 shares of Common Stock. Each of Icahn Offshore, Icahn Capital, IPH, Icahn Enterprises Holdings, Icahn Enterprises GP, Beckton and Mr. Icahn has shared voting power and shared dispositive power with regard to such shares of Common Stock. Icahn Partners has sole voting
power and
sole dispositive power with regard to 9,281,78217,846,985 shares of Common Stock. Each of Icahn Onshore, Icahn Capital, IPH, Icahn Enterprises Holdings, Icahn Enterprises GP, Beckton and Mr. Icahn has shared voting power and shared dispositive power with regard to such shares of Common Stock.
Each of Hopper, Barberry and Mr. Icahn, by virtue of their relationships to High River, may be deemed to indirectly beneficially own the shares of Common Stock which High River directly beneficially owns. Each of Hopper, Barberry and Mr. Icahn disclaims beneficial ownership of such shares of Common Stock for all other purposes. Each of Icahn Offshore, Icahn Capital, IPH, Icahn Enterprises Holdings, Icahn Enterprises GP, Beckton and Mr. Icahn, by virtue of their relationships to Icahn Master, may be deemed to indirectly beneficially own the shares of Common Stock which Icahn Master directly beneficially owns. Each of Icahn Offshore, Icahn Capital, IPH, Icahn Enterprises Holdings, Icahn Enterprises GP, Beckton and Mr. Icahn disclaims beneficial ownership of such shares of Common Stock for all other purposes. Each of Icahn Onshore, Icahn Capital, IPH, Icahn Enterprises Holdings, Icahn Enterprises GP, Beckton and Mr. Icahn, by virtue of their relationships to Icahn Partners, may be deemed to indirectly beneficially own the shares of Common Stock which Icahn Partners directly beneficially owns. Each of Icahn Onshore, Icahn Capital, IPH, Icahn Enterprises Holdings, Icahn Enterprises GP, Beckton and Mr. Icahn disclaims beneficial ownership of such shares of Common Stock for all other purposes.
(4) | Based on a Schedule 13G filed with the SEC on February 8, 2018 by The Vanguard Group (“Vanguard”). Vanguard has sole voting power for 101,325 shares of Common Stock, sole dispositive power for 17,186,965 shares of Common Stock, shared voting power for 23,520 shares of Common Stock and shared dispositive power for 111,537 shares of Common Stock. |
(5) | Based on a Schedule 13G filed with the SEC on February 12, 2018 by Darwin A. Deason. Mr. Deason has sole voting power and sole dispositive power for 12,320,307 shares of Common Stock and has no shared voting power or shared dispositive power for any shares of Common Stock. Mr. Deason’s shares of Common Stock includes 5,393,256 shares of Common Stock issuable upon the conversion of 120,000 shares of Conduent Series A Convertible Perpetual Preferred Stock that he holds. |
(3)Based on a Schedule 13G/A filed with the SEC on February 13, 2024 by The Vanguard Group (“Vanguard”), Vanguard has no sole voting power for any shares of Common Stock, sole dispositive power for 17,020,002 shares of Common Stock, shared voting power for 192,116 shares of Common Stock and shared dispositive power for 334,383 shares of Common Stock.
(4)Based on a Schedule 13G/A filed with the SEC on February 12, 2024 by Neuberger Berman Group LLC and Neuberger Berman Investment Advisers LLC (together “Neuberger”), Neuberger has no sole voting power or sole dispositive power for any shares of Common Stock, shared voting power for 12,290,280 shares of Common Stock and shared dispositive power for 14,693,141 shares of Common Stock.
(5)Based on a Schedule 13G/A filed with the SEC on January 26, 2024 by BlackRock, Inc. (“BlackRock”), BlackRock has sole voting power for 14,061,414 shares of Common Stock, sole dispositive power for 14,650,070 shares of Common Stock and has no shared voting power or shared dispositive power for any shares of Common Stock.
(6)Based on a Schedule 13D/A filed with the SEC on February 16, 2021 by Darwin A. Deason. Mr. Deason has sole voting power and sole dispositive power for 12,320,307 shares of Common Stock and has no shared voting power or shared dispositive power for any shares of Common Stock, which shares include 5,393,256 shares of Common Stock issuable upon the conversion of 120,000 shares of Conduent Series A Convertible Perpetual Preferred Stock held by Mr. Deason.
(7)Based on a Schedule 13G filed with the SEC on February 14, 2024 by T. Rowe Price Investment Management, Inc. (“T. Rowe Price”), T. Rowe Price has sole voting power for 3,961,000 shares of Common Stock, sole dispositive power for 10,906,621 shares of Common Stock and has no shared voting power or shared dispositive power for any shares of Common Stock.
Shares of Common Stock of the Company owned beneficially by the directors and nominees for director, each of the
currentnamed executive officers named in the Summary Compensation Table and all
current directors and
current executive officers as a group, as of
February 28, 2018,March 18, 2024, were as follows.
TheseTo our knowledge, these individuals have sole voting and dispositive power with respect to the reported shares.
| | | | | |
Name of
Beneficial Owner | | Amount
Beneficially
Owned (1)(2)(3) |
Name of
Beneficial OwnerClifford Skelton, President and Chief Executive Officer | 1,788,087 | | Amount
Beneficially
Owned
Ashok Vemuri
Louis Keyes, Executive Vice President, Chief Revenue Officer | 292,931 | | 239,161
David Amoriell
Randall King, Executive Vice President, Commercial Solutions | 144,216 | | 107,798
Jeffrey Friedel
Michael Krawitz, Executive Vice President, General Counsel and Secretary | 562,121 | | 85,112
Paul Galant
Mark Prout, Executive Vice President, Chief Information Officer | 297,038 | | 20,984
Nicholas Graziano
Stephen Wood, Executive Vice President, Chief Financial Officer | 271,436 | | 0
JoieMark King, former Executive Vice President, Government Solutions
| 53,190 | |
| Hunter Gary, Director | 94,407 | |
| Kathy Higgins Victor, Director | 12,708 | |
| Scott Letier, Director | 132,251 | |
Jesse A. GregorLynn, Director | 83,633 | | 20,984
Vincent J. Intrieri
Steven Miller, Director | 34,151 | | 20,984
Courtney Mather
Michael Montelongo, Director | 90,431 | | 23,362
Michael Nevin
Margarita Paláu-Hernández, Director | 45,524 | | 20,984
Michael A. Nutter
| | 20,984
|
William G. Parrett
| | 23,362
|
J. Michael Peffer
| | 98,313
|
Brian Webb-Walsh
| | 102,930
|
Virginia M. Wilson
| | 20,984
|
All current directors and executive officers as a group (15) (13 total) | 3,848,934 | | 813,795
(1)Percent Owned by all Current Directors and Executive Officers: Each current director and executive officer beneficially ownedowns less than 1% of the aggregate number of shares of Common Stock outstanding as of February 28, 2018.March 18, 2024. The amount beneficially owned by all current directors and executive officers as a group also amounted to less than 1%was 1.84%.
(2)Amount Beneficially Owned: The numbers shown above are the shares of Common Stock considered beneficially owned by the directors and executive officers in accordance with SEC rules and includes shares held indirectly, such as shares held in a grantor retained annuity trust or by family members.indirectly.
(3)Shares of Common Stock which executive officers, directors and nominees have a right, within 60 days of February 28, 2018,March 18, 2024, to acquire upon the exercise of options or rights or upon vesting of performance shares, DSUs or restricted stock units are also required to be included for purposes of determining beneficial ownership. None of our executive officers, directors or nominees hold any Company securities which are exercisable or scheduled to vest within 60 days of February 28, 2018 with the exception of DSUs.March 18, 2024.
Section 16(a)
Beneficial Ownership Reporting ComplianceReports
Section 16(a) of the Exchange Act (“Section 16”) requires the Company’s directors, executive officers and persons who own more than ten percent of the Common Stock of the Company, to file with the SEC initial reports of beneficial ownership and reports of changes in beneficial ownership of Common Stock of the Company. Based solely on review of these reports, or written representations from these persons that no other reports were required to be filed with the SEC, the Company believes that all reports for the Company’s directors, and executive officers and ten percent shareholders that were required to be filed under Section 16 during the fiscal year ended December 31, 20172023 were timely filed.
COMPENSATION DISCUSSION AND ANALYSIS
EXECUTIVE SUMMARY
2017 Business Highlights
2017 Financial Achievements
Revenue of $6,022 million, in line with guidance
Net income from continuing operations of $177 million
Adjusted net income of $186 million
Adjusted EBITDA of $672 million, up 6% year-over-year
$302 million of cash flow from operationsIn this Compensation Discussion and $204 million of free cash flow (adjusted for cash payments to deferredAnalysis (“CD&A”), we discuss the compensation plan participants)
2017 Operational Achievements
Overachieved 2017 strategic transformation goals
Established the Conduent brandphilosophy, programs and a clear go-to-market strategy
Expanded our salesforce and client partners to better meet the needs of our clients
Invested in platforms, technology and infrastructure
Summary of 2017 Actions
Linking Pay with Performance
2017 marked our first year of operations as Conduent. As a new Company,practices adopted by the Compensation Committee made several decisions regardingof the compensationBoard of Directors of Conduent (the “
Compensation Committee”) for our named executive officers and review the various objectives and elements of our executive compensation program, its alignment with performance and the 2023 compensation decisions regarding our named executive officers. For purposes of this CD&A and the disclosure that follows, the following are our named executive officers for 2023:
•Clifford Skelton, President and Chief Executive Officer;
•Stephen Wood, Executive Vice President and Chief Financial Officer;
•Michael Krawitz, Executive Vice President, General Counsel and Secretary;
•Mark Prout, Executive Vice President, Chief Information Officer;
•Randall King, Executive Vice President, Commercial Solutions; and
•Mark King(1), Former Executive Vice President, Government Solutions.
(1)Although Mark King is a named executive officer for 2023, on December 15, 2023, Mark King ceased being an Executive Officer of Conduent and on January 2, 2024, Mark King voluntarily terminated his employment with Conduent, and thus is no longer an active associate.
Executive Summary
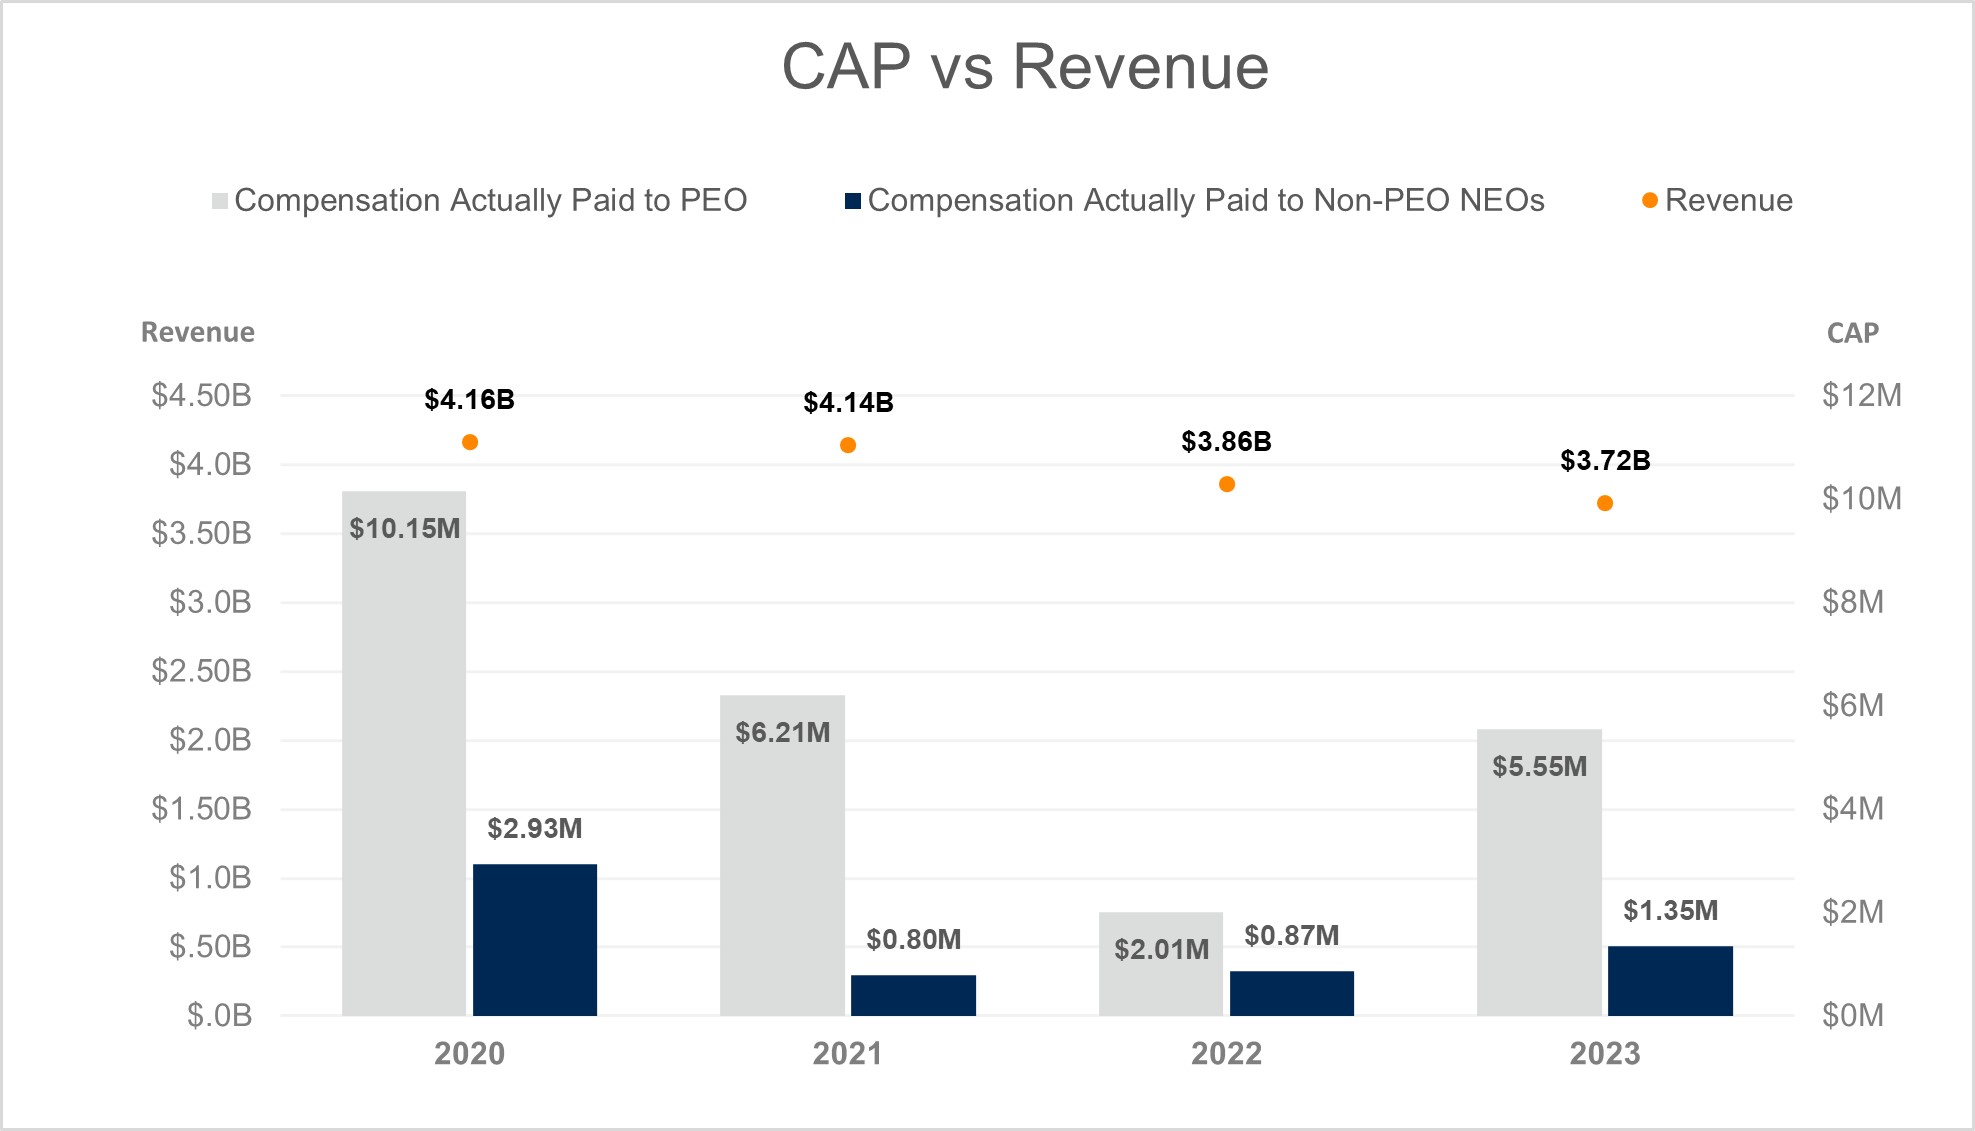
With revenues of approximately $3.7 billion, we deliver digital business solutions and services spanning the commercial, government and transportation spectrum – creating valuable outcomes for our clients and the millions of people who count on them. The Company leverages cloud computing, artificial intelligence ("AI"), machine learning, automation and advanced analytics to deliver mission-critical business process solutions. Through a dedicated global team of associates, process expertise, and advanced technologies, Conduent’s solutions and services digitally transform its clients’ operations to enhance customer experiences, improve performance, increase efficiencies and reduce costs. Our goal is to be the technology-led business solutions partner of choice for businesses and governments globally. To achieve this, we focus on three critical dimensions across our Company: Growth, Efficiency and Quality. Our strategy is designed to deliver shareholder value by driving profitable growth, expanding operating margins, implementing process efficiencies, and employing a disciplined portfolio rationalization and capital allocation strategy.
Our strategic focus on Growth, Efficiency and Quality serves as the foundation for our compensation programs. Key aspects of our compensation program design are directly aligned to our strategic focus, including incentivizing revenue growth and operational efficiency, and creating sustainable shareholder value. To this end, our compensation program links pay to performance, aligns to our shareholder interests, and is reflective of our 2023 operational and financial results.
Growth: Our opportunity for growth comes from understanding our clients’ businesses and driving valuable outcomes for our clients to help them reduce costs, improve efficiency and performance, and elevate customer experiences.
Our annual compensation bonus plan rewards achievement for success in 2017.Growth by including Adjusted Revenue and Net Annual Recurring Revenue (“ARR”) Activity metrics. Our long-term incentive plans also reward Growth, as our performance restricted stock awards have metrics tied to our total shareholder return against our proxy peers and revenue growth.
Efficiency: We continue to identify ways to reduce costs and deliver solutions more efficiently.
Our compensation plans reward success in Efficiency by measuring improvement in adjusted earnings before interest, taxes, depreciation, and amortization (“Adjusted EBITDA”) margin. (Please refer to “Definitions” and “Non-GAAP Financial Measures”.)
Quality: Our clients count on stable, high-quality service delivery. We focus on continuous improvement in system uptime and operational stability. Our focus on Quality has resulted in client confidence and satisfaction.
Delivering with high quality impacts revenue and Adjusted EBITDA margins and thus is an important additional factor when determining annual incentive plan payouts.
2023 Performance
Adjusted Revenue, Adjusted EBITDA and Adjusted EBITDA Margin for 2023 were within our original full-year 2023 guided range. Our Total Contract Value sales were up 20% year over year, and our new business pipeline remains up 10% year over year. However, we experienced some macroeconomic headwinds in our Commercial sales efforts, which contributed to our Net ARR metric ending the year below our expected target. In March 2023, we outlined a game plan for growth, rationalization, and improved cash flow generation with a target 2025 exit plan. We concluded year one of that plan with two portfolio divestiture announcements, expected to close in the first half of 2024. Our 2023 APIP funding results are a reflection of Conduent’s financial and operating results achieved throughout the year.
Annual Performance Incentive Plan (“APIP”) Results
The performance measures and weightings in the 2023 APIP were Adjusted Revenue (weighted 40%), Adjusted EBITDA Margin(1) (weighted 40%) and Net ARR Activity (weighted 20%). Our 2023 financial results led to a 51% of target funding for our APIP.
The 2023 Adjusted Revenue, Adjusted EBITDA Margin and Net ARR Activity metric performance goals were established in March 2023. The Compensation
PhilosophyCommittee did not reset these goals or make upward adjustments in determining overall APIP Funding.
(1)Please see “Non-GAAP Financial Measures” beginning on page 51 of this Proxy Statement for information on our non-GAAP financial measures.
Long-Term Incentive Plan (“LTIP”) Results
2023 LTIP
Our 2023 LTIP grant consisted of time-based restricted stock units (“RSUs”) with respect to 50% of the grant, vesting ratably over a three-year period; and performance-based restricted stock units (“PRSUs”) with respect to 50% of the grant, of which 70% percent are based on revenue growth (“2023 PRSU—Revenue Growth”) and 30% are based on relative Total Shareholder Return (“2023 PRSU—rTSR”) each over a three-year period. The 2023 PRSU—rTSR is based on Conduent’s three-year total shareholder return relative to our August 2022-2023 compensation peers, and the PRSU—Revenue Growth is based on our average annual revenue growth for the three-year period. The 2023 LTIP grant balances the need to increase revenues to drive shareholder value, while fostering participant retention and stock ownership.
2022 LTIP
Our 2022 LTIP grant consisted of time-based RSUs with respect to 50% of the grant, vesting ratably over a three-year period, and PRSUs with respect to 50% of the grant, vesting over a three-year period. The 2022 PRSUs are tied to our share price appreciation (“2022 PRSU—Share Hurdle”) with a relative Total Shareholder Return (“rTSR”) modifier of up to plus or minus 5%, based on Conduent’s total shareholder return relative to our August 2021-2022 compensation peers.
As of December 31, 2023, the 2022 PRSU—Share Hurdle awards have not been earned as none of the share hurdles have been met. These awards, however, remain outstanding and may be earned for active associates if the share price appreciation metrics are met by December 31, 2024. Conduent’s relative total shareholder return from January 1, 2023 through December 31, 2023 resulted in an rTSR modifier of -5% for tranche two. As a result, if the share hurdle for the second tranche of the 2022 PRSU—Share Hurdle award is achieved, the granted shares will be adjusted to 95.00% of the original shares granted. The rTSR modifier for the first tranche of the award is -4.29%. As a result, if the share hurdle for the first tranche of the 2022 PRSU—Share Hurdle award is achieved, the granted shares will be adjusted to 95.71% of the original shares granted.
2021 LTIP
Our 2021 LTIP grant included time-based RSUs, weighted 50%, vesting ratably over a three-year period, and two types of PRSUs, each weighted 25%, and also vesting over a three-year period. The first PRSU type was tied to our share price appreciation (“2021 PRSU—Share Hurdle”). The second PRSU type (“2021 PRSU—Revenue Hurdle”) was tied to annual revenue growth with an Adjusted EBITDA margin threshold.
As of December 31, 2023, none of the 2021 PRSU—Share Hurdle awards had been earned and thus, all tranches were forfeited.
Additionally, the third and final tranche of the 2021 PRSU—Revenue Hurdle awards did not vest on December 31, 2023, as neither our revenue growth target for 2023 nor our Adjusted EBITDA margin threshold were met.
The Compensation Committee certified these results on February 1, 2024, and as a result, the third tranche of the 2021 PRSU—Revenue Hurdle shares was forfeited.
Advisory Say on Pay Vote and Shareholder Engagement
Our executive compensation is subject to an annual advisory vote of shareholders at our Annual Meeting. The Compensation Committee considers the outcome of Say on Pay votes when making compensation decisions for our named executive officers. At the 2023 Annual Meeting of Shareholders, 96.8% of shares voted were in favor of our executive compensation program, demonstrating strong shareholder support. Our Board and the Compensation Committee greatly value the benefits of maintaining a dialogue with our shareholders and understanding their views. Our management team established and participated in various shareholder engagement activities in 2023. Our investor relations function proactively engages with our shareholders to provide updates on the performance of the Company and solicit feedback on various topics.
Executive Compensation Programs areProgram
Compensation Philosophy
Our executive compensation program is designed to attract, motivate, reward and retain
the world classtop talent necessary to drive our business strategy
creatingand create shareholder value. Our programs are designed to follow these principles:
•provide competitive compensation to attract and retain executives critical to our long-term success;
•align executive and shareholder interests through the use ofusing both short-term and long-term financial and strategic objectives that build a sustainable Company;company;
•recognize and reward collective accountability and individual contribution to ensuredrive enterprise results;
•instill high standards of corporate governance and best practices; and
•mitigate excess risk taking and/or behavior that is inconsistent with the Company’s strategic plans and high ethical standards.
Checklist of Compensation Practices
| | | | | | | | | | | |
| |
| What We Do | | What We Don’t Do |
✓ | | Deliver a significant portion of compensation through long-term incentives tied directly to shareholder value creation. | X | X | | Permit re-pricing of underwater stock options.options or springloading of equity grants. |
✓ | | Balance short- and long-term incentives with multiple performance metrics. | X | X | | Provide a defined-benefit pension plan or SERPs to executives (only all-employee 401(k) plan). |
✓ | Impose caps on our annual incentive and PRSU awards for our named executive officers. | X | Provide special executive perquisites or excessive termination payments. |
| ✓ | Maintain pay-recoupmenta recoupment policy that allows claw backclawback of cash and equity compensation earned as a resultbecause of fraudulent or illegal conduct.conduct or in the event of an accounting restatement. | X | X | | Provide excessive perquisitesAllow directors, named executive officers and other senior leaders to hedge or termination payments.pledge Company stock. |
✓ | | Maintain stock ownership requirements for all of our named executive officers. | X | X | | Allow hedgingPermit tax gross-ups on change in control or pledging of Company stock.other severance payments. |
✓ | | Conduct an annual review of programs to ensure they do not encourage risks that have a material adverse effect on the Company. | X | X | | Permit gross-ups on change in control or other severance paymentsMaintain written employment contracts with our executive officers. |
✓ | | Maintain non-competition and non-solicitation agreements with our named executive officers that prohibit competing against Conduent and soliciting our customers or current employeesassociates after termination.termination, to the extent legally permitted. | X | X | | Maintain written contracts with our executive officers (other than the Chief Executive Officer) that provide special benefits.Allow single-trigger change in control arrangements. |
✓ | | EmployEngage an Independent Consultant under the direction of the Compensation Committee. | X | X | | Allow single-trigger vesting change in control arrangements.Provide guaranteed incentive payouts for named executive officers. |
2023 Total Direct Compensation Targets for Named Executive Officers
The Compensation Committee approved the annual target total direct compensation levels for all Executive Officers, focusing on the key elements of compensation—active named executive officers for 2023. The table below illustrates annual base salary, target short-term incentive and target long-term equity-based incentive for each named executive officer as of December 31, 2023.
| | | | | | | | | | | | | | | | | |
| Executive | Title | Annual Base
Salary | Target Short-
Term Incentive
(% of Base
Salary) | Target Long-
Term Incentive | Target Total
Direct
Compensation |
| Clifford Skelton | President and Chief Executive Officer | $835,000 | 150 | % | $5,000,000 | $7,087,500 |
| Stephen Wood | Executive Vice President and Chief Financial Officer | $525,000 | 80 | % | $1,150,000 | $2,095,000 |
| Michael Krawitz | Executive Vice President, General Counsel & Secretary | $500,000 | 75 | % | $1,000,000 | $1,875,000 |
| Mark Prout | Executive Vice President, Chief Information Officer | $450,000 | 75 | % | $750,000 | $1,537,500 |
| Randall King | Executive Vice President, Commercial Solutions | $450,000 | 75 | % | $600,000 | $1,387,500 |
| Mark King | Executive Vice President, Government Solutions (Former) | $450,000 | 75 | % | $800,000 | $1,587,500 |
To adjust target compensation levels to be closer to market levels and to our peers, the table above reflects the following changes made during 2023:
•Mr. Clifford Skelton received a long-term incentive increase from $4,250,000 to $5,000,000
•Mr. Mark King received a base salary increase from $425,000 to $450,000 effective February 2, 2023, and a long-term incentive target increase from $500,000 to $800,000.
•Mr. Randall King received an increase in target long-term incentive from $500,000 to $600,000
The chart below reflects the 2023 annual
performance bonus and long-term equity incentives. To re-inforce the Company’s pay for performance philosophy, 53% of targetedtarget total direct compensation
pay mix for our
Chief Executive OfficerCEO and
on average, 46% for our other named executive officers
is performance-based. | | | | | | | | | | | | | | |
| Executive | | Title | | Base
Salary | | | Target Short-
Term Incentive
(% of Salary) | | | Target Long-
Term Incentive
(Grant Date
Value on 4/1/17) | |
Ashok Vemuri | | Chief Executive Officer (CEO) | | $ | 1,000,000 | | | | 150 | % | | $ | 5,000,000 | |
Brian Webb-Walsh | | Executive Vice President and Chief Financial Officer (CFO) | | $ | 450,000 | | | | 75 | % | | $ | 975,000 | |
Dave Amoriell | | President | | $ | 536,000 | | | | 75 | % | | $ | 800,000 | |
J. Michael Peffer | | Executive Vice President, General Counsel and Secretary | | $ | 500,000 | | | | 75 | % | | $ | 800,000 | |
Jeffrey Friedel | | Executive Vice President, Chief People Officer | | $ | 425,000 | | | | 75 | % | | $ | 500,000 | |
This table does not reflect the Strategic Initiative Grants described below that were awarded to eachas of the named executive officers. Additional information can be found under “Strategic Initiative Grants” on page 31.
The charts below reflect the 2017 pay mix for our named executive officersDecember 31, 2023, and the portion of their targeted total direct compensation that is variable pay. Basing this variable compensation upon financialperformance results, and share priceincluding Conduent’s rTSR performance as compared to our proxy peers, directly aligns our executivesexecutives’ interests with shareholder value creation.
| | |
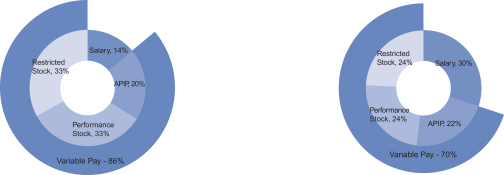 |
| |
CEO - Pay Mix | | All Other Named Executive Officers – Pay Mix |
Performance-based Incentives
Short-Term Incentives
All To reinforce the Company’s pay for performance philosophy, 88% of our CEO’s targeted total direct compensation, and on average 70% for our other named executive officers, participated in the Annual Performance Incentive Program (“APIPis variable and “at risk.”) which focused on the business priorities
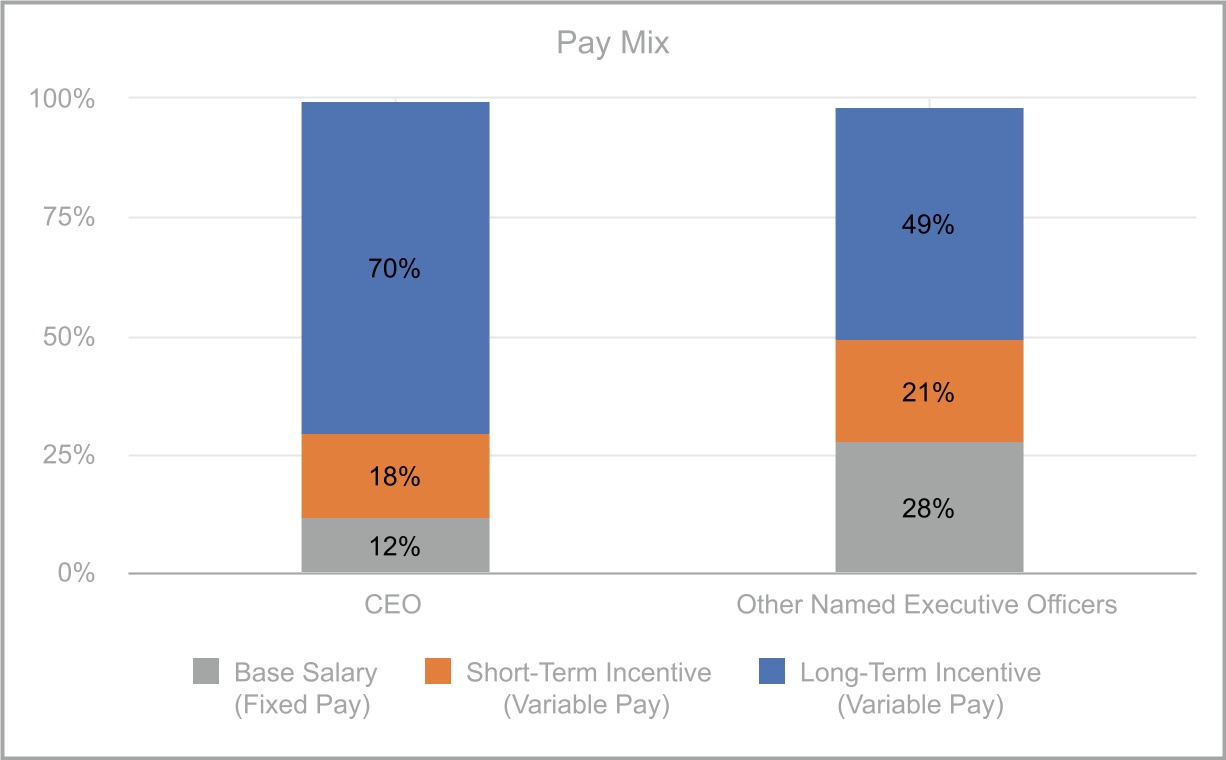
Process for 2017. The 2017 performance measures and weightings for APIP were: Adjusted EBITDA (60%), Revenue Growth (at constant currency) (30%) and Revenue Productivity (per employee) (10%). Adjusted EBITDA represents income (loss) before interest, income taxes, depreciation and amortization adjusted for Restructuring and related costs, Separation costs, Other (income) expenses, net, the NY Medicaid Management Information System (NY MMIS), Health Enterprise charge (HE charge) and (Gain) loss on sale of asset and business. Revenue Growth is measured at constant currency and excludes the impact of changes in the translation of foreign currencies into U.S. Dollars. Revenue Productivity measures how efficiently the Company utilized its employees, supported by the cost reduction initiatives and the move towards automation. Results for the measure were evaluated based on the revenue from all business units, divided by total headcount (excluding corporate and contingent workers), and averaged each quarter.Determining Compensation
Additional information regarding short-term incentives can be found under “2017 Compensation for the Named Executive Officers—Short-Term Incentives.”
Long-Term Incentives
In early 2017, the Compensation Committee reviewed peer group data and approved an Executive Long-Term Incentive Program (“ELTIP”) that aligned with the interests of shareholders and the Company. The 2017 ELTIP includes a mix of 50% performance based awards (performance shares) and 50% time based awards (restricted shares). This approach balances the need to motivate and drive future behavior while being retentive and fostering stock ownership. Performance shares are measured over three years. Performance for each year is measured against pre-established annual goals and the subsequent payout is averaged over the three year performance period (2017 through 2019). Vesting occurs at the end of the three-year performance period. Restricted shares are subject to three-year ratable vesting (one-third on 12/31/17, 12/31/18 and 12/31/19 respectively).
The Compensation Committee approved ELTIP awards with a grant date of April 1, 2017. Officers participated at their individual ELTIP target level. The 2017 performance measures and weightings are as follows: Adjusted Profit Before Tax (PBT) (50%) and Free Cash Flow (50%). Adjusted Profit Before Tax is defined as income or loss before Income Taxes as reported on the Consolidated statement of Income (Loss), less amortization of intangible assets; restructuring and related costs; Separation costs; other expenses net, including losses (gains) on sales of businesses and assets, currency (gains) losses, net, litigation matters and all other expenses, net. Free Cash Flow is defined as cash flow from operating activities as reported on the Consolidated statement of cash flows, less cost of additions to land, buildings and equipment and cost of additions to internal use software plus proceeds from sales of land, building and equipment. Additional information regarding long-term incentives can be found under “2017 Compensation for the Named Executive Officers—Long-Term Incentives.”
Strategic Initiative Grants
In 2017, in light of the significant challenges facing Conduent following its separation from Xerox Corporation (“Separation”), the Compensation Committee approved a special stock award (“Strategic Initiative Grant” or “SIG”) for each of the named executive officers. The key program objectives are to strengthen the alignment of management with shareholders, accelerate the growth of stock ownership levels among the new executive officer team, motivate and promote the successful and expedited business turn around, facilitate cultural change and talent upgrade and retain key executives. The SIG was granted in 50% performance based awards (performance shares) and 50% time based awards (restricted shares). As noted above under “Long-Term Incentives”, this approach balances the need to motivate and drive future behavior while being retentive and fostering stock ownership. The performance shares include two cost transformation and two client outcome metrics, all equally weighted. These measures are: Cost Transformation – Information Technology (25%), Cost Transformation – Real Estate, General & Administrative (25%), Service Line Penetration (25%), and New Business Signing growth (25%). Many of the terms and conditions of the SIG are the same as our ELTIP. For additional information regarding these awards, see the “Long-Term Incentives - Strategic Initiative Grants” section of the CD&A.
PROCESS FOR DETERMINING COMPENSATION
Role of the Compensation Committee
The Compensation Committee administers the executive compensation program for our named executive officers on behalf of our Board
of Directors and shareholders.
The members of the Compensation Committee are Paul Galant, Joie A. Gregor and Courtney Mather. All members of the Compensation Committee are independent directors in accordance with applicable
NYSESEC and Nasdaq standards, including heightened independence requirements for Compensation Committee members. The
biographies of the Compensation Committee members appear beginning on page 7 of this Proxy Statement.The Compensation Committee has the authority to retain, and did retain for 2017, an independent advisor for the purpose of reviewing and providing guidance related to executive compensation programs. The Compensation Committee’s responsibilities are discussed beginning on page 1518 of this Proxy Statement. A complete description of the Compensation Committee’s responsibilities and functions appears in its charter, which can be found on our website atwww.conduent.com/corporate-governance.
The Compensation Committee evaluates many factors when designing and establishing the executive compensation plansprogram and targets.specific goals and pay levels. In determining the appropriate compensation levels, the Compensation Committee considers the scope and impact of the executive’s role within the organization, experience, sustained performance and future potential. The Compensation Committee also reviews the compensation levels of similarly positioned executives at peer companies, general industry compensation data and internal pay considerations.
The Compensation Committee retains an independent consultant for the purpose of providing market data and guidance related to executive compensation programs.
While the Compensation Committee is ultimately responsible for making all compensation decisions affecting compensation of our named executive officers, the CEO participates in the process by:
•Periodically discussing with the Compensation Committee the performance of the Company and each executive officer.officer with the Compensation Committee; and
•Making recommendations on the components of compensation for the other executive officers.
After receiving input from the CEO, the Compensation Committee makes its own assessments and formulates compensation amounts for each of our
executive officers, including our named executive officers, ensuring that the total
target compensation for each is appropriate and competitive.
Role of the Independent Consultant
The Compensation Committee has retained the services of an independent compensation consulting firm, Frederic W. Cook & Co., Inc. (the “Consultant(“FW Cook”), to assist with its responsibilities. The ConsultantFW Cook reports only to the Compensation Committee and has not performed any other work for Conduent since being retained as an independent consultant to the Compensation Committee, except in its capacity as an independent advisor to the Corporate Governance Committee on non-employee director compensation matters. As provided in its charter, the Compensation Committee has the authority to determine the scope of the Consultant’sFW Cook’s services and may terminate the Consultant’sFW Cook’s engagement at any time. The Compensation Committee evaluated the independence of FW Cook and concluded that no conflict of interest existed that would prevent FW Cook from independently advising the Compensation Committee.
During
2017, the Consultant2023, FW Cook provided the following services:
•regularly updated the Compensation Committee on trends in executive compensation, including providing proactive advice on emerging trends and best practices;
•reviewed officer compensation levels and overall performance compared to general industry survey data and a peer group made up of organizations with which Conduent is likely to compete for executive expertise,business, investor capital and/or share with Conduent a similar business model in one or more areas;executive talent;
•reviewed incentive compensation designs for short-term and long-term programs;
•advised the Compensation Committee on executive compensation peer group companies for pay and performance comparisons;group;
•reviewed the Compensation Discussion and Analysis and related compensation tables for the proxy statement on Schedule 14A, filed with the SEC;inclusion in this Proxy Statement;
reviewed Compensation Committee meeting materials with management before distribution;
•attended Compensation Committee meetings, including meetings in executive session, as requested by the Compensation Committee chair;
•offered independent analysis and input on CEO compensation;
•assisted with non-employee director compensation; and
advised on post Separation related•reviewed the compensation actions.risk assessment.
Peer Group
In 2017, the Compensation Committee approved a peer group of companies with whom Conduent competes for business, investor capital and executive talent. The Committee determined that the identified peer group companies are reasonably similar to Conduent in terms of industry profile, size, and market capitalization.
The 2017 peer group consisted of the following companies:
| | | | |
ADP
| | CGI Group Inc.
| | Genpact
|
Aon
| | Cognizant Tech Solutions
| | MAXIMUS
|
CACI International
| | DXC Technology
| | Paychex
|
Cerner Corp | | Convergys | | IQVIA
|
The peer group is reviewed annually and isConduent’s 2022-2023 Peer Group was used to benchmark 2022 compensation and assist in setting 2023 compensation for our named executive officers, as well as forto review general pay practices and trends.
trends at that time. Additionally, this peer group is used to determine Total Shareholder Return performance for our 2023 PRSU—rTSR awards. The Compensation Committee reviewed the 2022-2023 peer group on August 23, 2022, and believes Conduent’s peers focus on key business competitors, as well as companies that align with Conduent’s size, scope, and competitors for executive talent and investor capital. Further, Conduent’s revenue at that time, ranked near the median of the peer group:
| | | | | | | | |
| 2022 / 2023 Peer Group | |
| | |
| Alight (ALIT) | ICF Intl (ICFI) | |
| | |
| CACI International Inc (CACI) | Leidos Holdings, Inc (LDOS) | |
| | |
| CGI Group (GIB) | ManTech Intl* | |
| | |
| Concentrix (CNXC) | Maximus, Inc (MMS) | |
| | |
| CSG Systems Intl (CSGS) | TELUS Intl (TIXT) | |
| | |
| ExlService (EXLS) | TriNet Group (TNET) | |
| | |
| Genpact LTD (G) | Veradigm (MDRX) | |
| | |
|
| |
| *ManTech Intl was acquired in 2022 and thus removed from the group for 2023-2024 | |
The current peer group has remained consistent with the 2022-2023 peer group, with the exception of one company, ManTech Intl. Conduent’s resulting 2023-2024 Peer Group was used to benchmark 2023 compensation and assist in setting 2024 compensation for our named executive officers, as well as to review general pay practices and trends at that time.
Competitive Market Information
In 2017,
At the end of 2022, the Compensation Committee
receivedreviewed a report comparing the compensation of its named executive officers with the compensation of
executives in comparable
positions at our peer group
named executive officerscompanies based on the most recent proxy filings (primarily used for the CEO, CFO and General Counsel) as well as general industry survey data to
recognizesupplement the
limitations ofpeer group proxy
data (Willis Tower’s Watson CDB General Industry Executive Compensation survey).data. This comparison included compensation data for these elements of pay:
•base salary;
•target short-term incentives;
•total target cash compensation (base salary plus target short-term incentives);
•target long-term incentives; and
•total target direct compensation (total target cash compensation plus target long-term incentives).
The competitive market data iswas prepared, analyzed, and presented to the Compensation Committee by the Committee’s Consultant.FW Cook. The market pay range is viewed by the Compensation Committee as a competitive reference point, but that data is not used to match a specific percentile of the market. Emphasis is placed on total target pay. In 2017,direct compensation. For 2023, the Compensation Committee reviewed total target totaldirect compensation (excluding the Strategic Initiative Grants) against the market data using the 50th percentile as a reference point. The Compensation Committee exercises discretionjudgement in setting individual compensation levels to reflect an assessment of the executive’s impactexperience, responsibilities and expected contributions to Conduent, as well as potential for advancement.2017 COMPENSATION FOR THE NAMED EXECUTIVE OFFICERS
2017
2023 Compensation for the Named Executive Officers
2023 Total
TargetDirect Compensation
Total target compensation includes base salary, target annual short-term cash incentive and target annual long-term equity incentive awards, which includes the April 1, 2017 ELTIP grants and excludes the special Strategic Initiative Grant. Targets
The majority of our named executive officer payofficers’ compensation is provided under our variable incentive compensation programs. Variable pay increases with responsibility while long-term incentive compensation represents the greatest component of pay. The 20172023 total targetdirect compensation which includes annual base salary, target short-term incentive compensation as a percentagetargets of base salary and target long-term incentive compensationour named executive officers can be found under the heading “Executive Summary—2017“Our Executive Compensation Program—2023 Total Direct
Compensation Targets for Named Executive
Officers.”Officers” For further information regarding the process the Compensation Committee used to determine compensation for our named executive officers, please see
above under “Process for Determining
Compensation”.Compensation.”
More complete compensation information appears in the “Summary Compensation Table” on page
37.43.
Base salary is the fixed pay element of our compensation program that reflects the level and scope of responsibility within the Company. The Compensation Committee reviews each named executive officer’s base salary annually as well as in connection with a promotion or other change in responsibility. In connection with the promotion of Jeffrey Friedel to Chief People Officer, his base salary was increased from $285,000 to $425,000, effective February 1, 2017. The table below reflects base salaries for our named executive officers as of December 31, 2022 and December 31, 2023.
| | | | | | | | |
| Executive | Annual Base Salary at 12/31/22 | Annual Base Salary at 12/31/23 |
| Clifford Skelton | $835,000 | $835,000 |
| Stephen Wood | $525,000 | $525,000 |
| Michael Krawitz | $500,000 | $500,000 |
| Mark Prout | $450,000 | $450,000 |
| Randall King | $450,000 | $450,000 |
| Mark King | $425,000 | $450,000 |
The base pay increase for Mr. Mark King was made to better align base pay with internal and external peers. No other named executive officers were unchangedreceived a base salary increase from 2016.2022 to 2023.
The Annual Performance Incentive Plan
(“APIP”) provides for short-term incentive awards that reward performance against our annual operating plan, paid in the form of cash to our named executive officers and other eligible
employees.associates. Each year, the Compensation Committee
determinesreviews the target short-term incentive award opportunity, scaled to the executive’s level of responsibility, and stated as a percentage of base salary, and the maximum payout opportunity.
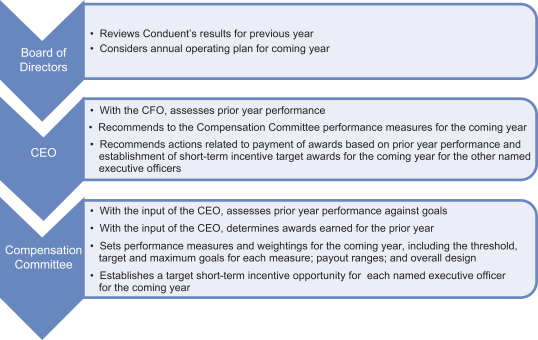
The following chart reflects Conduent’s process for setting short-term incentive awards. This process typically takes place in the first quarter of the year.
Short-Term Incentive Target Award Opportunity for the
Individual Named Executive Officers
The annual short-term incentive target award opportunity for each of our named executive officers takes
into account many factors
into consideration, including scope of responsibility,
past contributions, expected
future contributions, internal pay equity and competitive executive compensation practices. If an executive’s
role or responsibilities change after the terms of the award are approved, the Compensation Committee
is permitted tomay adjust the short-term incentive target award opportunity at that time.
The
2017table below depicts the APIP
target award opportunity was approved by the Compensation Committee at 150% of base salarytargets for
Mr. Vemuri and 75% of base salary for the other named executive officers. Mr. Friedel’s APIP target opportunity was increased to 75% from 50%, effective February 1, 2017, to reflect his promotion to Chief People Officer.Short-Term Incentive Performance Measures
Short-term incentive awards (APIP)2023 for our named executive officersofficers. No increases were intendedmade to qualify as “performance-based compensation” under Section 162(m) of the Internal Revenue Code. short-term incentive target percentages from 2022 to 2023.
| | | | | |
| Executive | Target Short-Term Incentive (% of Base Salary) |
| Clifford Skelton | 150 | % |
| Stephen Wood | 80 | % |
| Michael Krawitz | 75 | % |
| Mark Prout | 75 | % |
| Randall King | 75 | % |
| Mark King | 75 | % |
Short-Term Incentive Performance Measures
The Compensation Committee established maximum payout opportunities under the Short-Term Incentive Pool (“STI Pool”). EachAPIP for 2023 pursuant to which each named executive officer is covered under the STI Pool,eligible to receive an incentive payout, assuming Conduent attains certain pre-established performance goals. In 2017, while2023, the performance goalgoals for the STI Pool wasAPIP were designed to align with Conduent’s overall strategies, goals and objectives. Our 2023 performance measures were based on achievementRevenue (adjusted for currency), Adjusted EBITDAMargin and Net Annual Recurring Revenue (“Net ARR”) Activity. The target for Revenue was lower than our 2022 target and actual results, due to business runoff from prior years and the anticipated reduced impact of positive government stimulus payments in 2023. The defined APIP measures were designed to give a clear line of sight to key business results and to encourage growth in revenue without eroding margin.
Our targets were consistent with our overall budget for the year, as well as guidance to investors. The Compensation Committee did not amend the goals under the APIP for 2023 or exercise discretion to increase or decrease funding under the APIP. The 2023 APIP plan focuses on Conduent’s growth and efficiency goals, while additional consideration was given to our quality goals, and is in alignment with our business strategy. Our defined APIP metrics were measured as follows:
•Adjusted Revenue (40% weight)
•Adjusted EBITDA with achievement of the performance threshold resulting in funding of the STI Pool at maximum, subject to the Compensation Committee’s negative discretion, the amount of each named executive officer’s actual bonus was determined based on the achievement of the applicable performance metrics, which may result in actual payouts less than the named executive officer’s allocation under the STI Pool. For this purpose, Adjusted EBITDA represents income (loss) before interest, income taxes, depreciation andMargin (40% weight)
amortization adjusted for Restructuring and related costs, Separation costs, Other (income) expenses, net, NY MMIS, Health Enterprise charge (HE charge) and (Gain) loss on sale of asset and business. After certifying that Conduent had achieved positive Adjusted EBITDA and that the STI Pool was fully funded, the Compensation Committee exercised its discretion and reduced the short-term incentive award amounts payable and approved the payouts as described•Net ARR Activity (20% weight)
(Please see “Definitions” on page
29.Results51 of financial performance may be adjusted plus or minus 20% on a discretionary basis to recognize individual performance, but in no event would anthis Proxy Statement for full definitions.)
The APIP payout exceed the maximum payout target (200%). Payoutfunding level for achieving threshold performance is 50%, payout25% of target. The APIP funding level for achieving target performance is 100% of target, and payoutthe APIP funding level for achieving maximum performance is 150% of target, while the over-achievement funding for Adjusted Revenue and Adjusted EBITDA Margin is 200%. Performance below threshold results in zero APIP funding. Performance results and payoutsAPIP funding levels are interpolated between these points. There is no required payoutThe following table notes the 2023 Threshold, Target, Maximum and Over-achievement APIP targets for businessour APIP Goals:
| | | | | | | | | | | | | | |
Performance Measure(1) | Threshold
25% Funding | Target
100% Funding | Maximum
150% Funding | Over-Achievement
200% Funding |
Adjusted Revenue(2) | $ | 3,662 | M | $ | 3,775 | M | $ | 3,888 | M | $4,153M |
| Adjusted EBITDA Margin | 9.90 | % | 10.40 | % | 10.90 | % | 11.40 | % |
| Net ARR Activity | $ | 141 | M | $ | 166 | M | $ | 191 | M | NA |
Our overall 2023 APIP performance
below threshold levels.The measures, weightings, goals and target and maximum payout ranges set by the Compensation Committee for 2017 werewas measured as follows:
| | | | | | |
Performance Measure | | Weighting | | Target
(100% payout) | | Maximum
(200% payout) |
Adjusted EBITDA
| | 60% | | $672 million | | $ 690 million |
Revenue Growth (at constant currency)
| | 30% | | $6,152 million | | $6,190 million |
Revenue Productivity (per employee)
| | 10% | | Increase of
$500/employee | | Increase of
$1,000/employee |
These
| | | | | | | | | | | | | | |
Performance Measure(1) | Weighting
(A) | Actual
Results | Performance
Achievement
(B) | Funding
%
(A) x (B) |
Adjusted Revenue(2) | 40% | $ | 3,722 | M | 65 | % | 26 | % |
| Adjusted EBITDA Margin | 40% | 10.20 | % | 63 | % | 25 | % |
| Net ARR Activity ($M) | 20% | $ | 62 | M | Below Threshold | 0 | % |
| Total | | | | 51 | % |
| Actual Funding | | | | 51 | % |
____________________
(1)The performance goals were aligned with Conduent’s 20172023 operating plan at the time they were established and designed to be challenging yet achievable.
(2)Revenue was adjusted for the impact of divestitures and currency movements from the point at which the targets were set.
Total performance achievement was measured at 51% of target, and this 51% funding level determined the size of the overall pool of funds available for bonuses, while actual bonus payouts were determined on an individual-by-individual basis, based on performance and the overall funding.
Determining Short-Term Incentive Award Payouts
After the end of the fiscal year, the CFO confirms the financial results and communicates the results to the Compensation Committee. Subject to the Compensation Committee’s review and approval, any
extraordinary items or material unusual charges or gains are reviewed with the Compensation Committee for possible impact on APIP
plan calculations.
Each
Results for each performance measure isare assessed and calculated independently. The weighted results of each measure are added together to determine overall performance results. PayoutsFunding levels are made proportionately for achievement at levels between the goals. Even ifIf threshold pre-established performance measures are achieved, the Compensation Committee retains discretion to determine a lesser short-term incentive thanan APIP funding level that differs
from the calculated incentive
payout,funding level, or no
short-term incentiveAPIP funding at all, as it deems appropriate. The Compensation Committee also retains its discretion to increase or decrease an
individual APIP award
(plus or minus 20% as described above) based on individual performance, provided that the named executive officer’s award may never exceed their maximum payout
of 200% of target.
2017
2023 Performance for Short-Term Incentive Award Payouts
Performance
Following the certification of the financial results for
2017 against the APIP performance measures (in millions) were: | | | | | | | | | | | | | | | | | | | | | | | | | | | | |
Performance
Measures | | Actual | | | Adjust-
ments | | | Adjusted
Results | | | | | | Calculated Factor | | | Weighting | | | Payout
Percentage | |
Adjusted EBITDA | | $ | 672 | | | $ | 6 | | | $ | 678 | | | | | | | | 133 | % | | | 60 | % | | | 80 | % |
Revenue Growth
(at constant currency) | | $ | 6,022 | | | $ | 101 | | | $ | 6,123 | | | | | | | | 77 | % | | | 30 | % | | | 23 | % |
Revenue Productivity
(per employee) | |
| Below
threshold |
| | | n/a | | |
| Below
threshold |
| | | | | | | 0 | % | | | 10 | % | | | 0 | % |
| | | | | | | | Final Calculated Payout -> | | | | 103 | % |
Adjusted EBITDA: $678M, adjusted for the impact of hurricanes on U.S. and Latin America operations, as well as divestures.
Revenue Growth (at constant currency): $6,123M, adjusted for incremental strategic actions, hurricane impact, and translation currency.
Revenue Productivity (per employee): The Company did not achieve its targets on Revenue Productivity due to decisions impacting labor such as insourcing of IT roles, conversion of subcontractors, and shifting headcount to lower cost locations.
Following the CFO certification of performance results for 2017,2023, the Compensation Committee reviewed the calculated payout onachievement of the performance measures under the 2023 APIP. The Committee supported management’s recommendationMr. Skelton received a short-term incentive equal to apply negative discretionthe corporate funding level, based on the mixedresults stated above. The Compensation Committee granted short-term incentive awards differing from the approved funding level for Messrs. Wood, Krawitz, Prout and Randall King to reflect individual contributions and performance results as well asfor the impactexecutive’s function or business unit. Mr. Mark King was not employed with Conduent at the date of adjustments on the calculated payout and approvedthus did not receive an 80% payout factor.APIP payout. Details of the 2023 Target bonus and actual payouts are below:
| | | | | | | | | | | |
| Executive | 2023 | 2023 | 2023 |
Bonus Target
Amount | Actual Bonus
Amount | Actual Bonus
as a % of Target |
| Clifford Skelton | $ | 1,252,500 | | $ | 638,775 | | 51 | % |
| Stephen Wood | $ | 420,000 | | $ | 224,910 | | 54 | % |
| Michael Krawitz | $ | 375,000 | | $ | 200,813 | | 54 | % |
| Mark Prout | $ | 337,500 | | $ | 180,731 | | 54 | % |
| Randall King | $ | 337,500 | | $ | 137,700 | | 41 | % |
| Mark King | $ | 335,856 | | $ | — | | — | % |
The bonus target amount for Mr.
Peffer’s awardMark King was
increasedprorated for the increase in base salary from $425,000 to
90%, reflecting his achievements in standing up Conduent as a new public company. Mr. Amoriell’s award was increased to 90% reflecting his strong performance leading the Public Sector business. Mr. Walsh’s award was increased to 96% reflecting his outstanding performance in the finance transformation, as well as the completion of five divestitures.In view of 2017 results, the Compensation Committee and our CEO believe that the annual short-term incentive payments resulted in reasonable and appropriate performance-related incentive payments to our named executive officers. The annual incentives paid to$450,000, effective February 2, 2023. All other APIP target bonus levels for our named executive officers in March 2018 for 2017 performance are shown in the “Summary Compensation Table.”remained consistent from 2022 to 2023. Additional information about the short-term incentive opportunities is shown in the “Grants of Plan-Based Awards in 2017”2023” table. Information regarding short-term incentive payouts under certain termination events and the amount of the estimated payouts and benefits payable to the named executive officers assuming a change in control of Conduent and a qualifying termination of employment is presented in the “Potential Payments Upon Termination or Change in Control” table.
We provide long-term incentives to reward our named executive officers for sustained performance, as a retention incentive and to align the executive’s interests with shareholders to drive long-term value creation. Awards are intended to encourage a strong ownership stake in the Company to drive superior performance on long-term Company objectives. TheWhen determining long-term incentive awards, the Compensation Committee considers peermarket data, relative impact of the executive’s position, responsibilities and role toat Conduent and each named executive officer’s performance.
During the first fiscal quarter of 2023, the Compensation Committee approved LTIP grants for our named executive officers. As part of this approval, the Compensation Committee established performance
when determining long-term incentive awards.Executive goals and award values and an April 1, 2023 grant date. Additional information regarding the 2023 LTIP awards can be found in the “Summary Compensation Table” and the “Grants of Plan-Based Awards in 2023” table.
Long-Term Incentive Program
and Performance Measures
Long-term incentive awards aregranted on April 1, 2023 were made pursuant to the Conduent Incorporated 2021 Performance Incentive Plan. 50% of the value of each award was granted in the form of Restricted Stock Units; 35% of the value in the form of Performance Restricted Stock Units with Revenue Growth Targets, 2023 PRSU—Revenue Growth; and 15% in the form of Performance Restricted Stock Units with a relative TSR measure compared with our 2022-2023 Peer group, 2023 PRSU—rTSR. Revenue Growth and rTSR were selected as our long-term metrics to emphasize our continued focus on growing revenues and increasing shareholder value.
Restricted Stock Units vest 1/3 each December 31 of 2023, 2024 and 2025, and the number of RSU shares are calculated for each named executive officer by dividing 50% of the approved target long-term incentive award value by the closing price of Conduent Common Stock on the grant effective date. The RSU shares are then rounded down to the nearest whole share.
Our 2023 PRSUs have service condition that require executives to remain with the Company through December 31, 2025. The target number of 2023 PRSU—Revenue Growth shares for our named executive officers was determined by dividing 35% of the approved target long-term incentive award value by the closing
price of Conduent Common Stock on the grant effective date, and then rounding down to the nearest whole share. The target number of 2023 PRSU—rTSR shares granted to each named executive officer was determined by dividing 15% of the named executive officer’s approved long-term incentive award value by the grant date fair value per share, determined using the Monte Carlo simulation. The calculated 2023 PRSU—rTSR shares are then rounded down to the nearest whole share. Both types of 2023 PRSU awards cliff vest on December 31, 2025, and have performance measures tied to three years.
The 2023 PRSU—Revenue Growth targets were established for each calendar year of 2023, 2024 and 2025. The three annual results will be averaged to determine a final payout. The Revenue Growth targets and payout percentages are as follows:
| | | | | | | | | | | | | | |
| Revenue Growth from Previous Year | 2023 | 2024 | 2025 | Payout % |
| Maximum | 0.0% | 5.7% | 6.2% | 200% |
| Target | (2.0)% | 3.2% | 3.2% | 100% |
| Threshold | (4.0)% | 0.7% | 0.2% | 50% |
For our 2023 PRSU—rTSR awards, we measure Conduent’s stock performance relative to our 2022-2023 proxy peer group, established in August 2022. See “Peer Group” section above.
Conduent’s rTSR percentile rank against the 2022-2023 proxy peer group will be measured over a three-year performance period. Performance for each year is measured against pre-established annual goals and the subsequent payout is averaged over the three-year period. The entire award vests atperiod of April 1, 2023 through December 31, 2025. At the end of the three-year performance period the rTSR results will be based on the following payout matrix:
| | | | | |
| Conduent rTSR | Payout % |
| >=75th Percentile | 150% |
| Median | 100% |
| 25th Percentile | 50% |
Linear interpolation will be used for results between points. Final payout is subject to
Compensation Committee certificationa cap of
performance results. Restricted shares are not tied to performance measures100% if Conduent absolute TSR is negative and
vest ratably overthere is a
three-year period. Once vested, performance shares and restricted shares are paid out intotal value cap of six times the
form of shares of Conduent Common Stock. Any dividends during the vesting period will be accrued and paid on vesting in an amount equal to the dividends the executive would have earned from owning the same amount of Conduent Common Stock throughout the vesting period.target value at vest.
Although equity awards generally are granted on a regular annual cycle, the Compensation Committee may grant off-cycle equity awards for special purposes, such as new hire, promotion,hires, promotions, retention and recognition.
Compensation Committee Actions Relating to ELTIP Awards
The following chart reflects Conduent’s process for setting long-term incentive awards. This process typically takes place in the first quarter of the year.
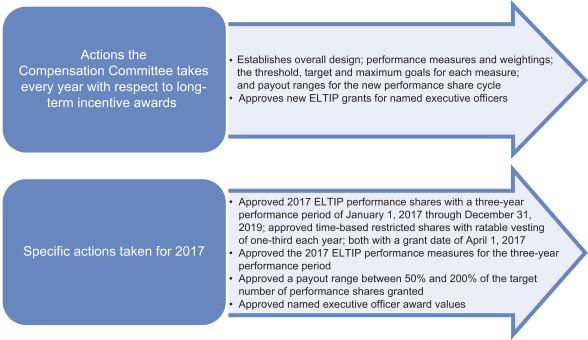
During the first fiscal quarter of 2017, the Compensation Committee approved ELTIP grants for our named executive officers, established performance goals and award values, a payout range of 50% to 200% of target, and an April 1, 2017 grant date. Mr. Vemuri’s 2017 ELTIP award was approved as part of his letter agreement as described under “Named Executive Officers with Unique Compensation Arrangements.” The 2017 ELTIP No off-cycle equity awards approved by the Compensation Committee for the other named executive officers are commensurate with their new roles leading Conduent as a standalone public company. Additional information regarding the 2017 ELTIP awards can be found in the “Summary Compensation Table” and the “Grants of Plan-Based Awards in 2017” table.
The 2017 ELTIP award was granted in 50% performance shares and 50% restricted shares. The target number of performance shares and restricted shareswere granted to our named executive officers in April 2017 was determined by dividing2023.
Once vested, all our long-term incentive awards, including RSUs and PRSUs, are paid out in the approved targetform of shares of Conduent Common Stock. Any dividends paid during the vesting period would be accrued and settled at the same time the underlying award vests.
The 2023 Long-Term Incentives provide direct alignment between shareholder value bycreation and earned compensation, and serve to help the Company attract and retain the talent needed to deliver our business strategies.
Looking forward to 2024, our PRSUs will be based 70% on revenue growth and 30% on Conduent’s stock price performance relative to peers with both metrics measured over a 3-year performance period.
Performance Results and Payouts Under Prior Equity Awards
2022 Performance — Restricted Stock Units
The 2022 PRSU—Share Hurdle awards were granted with three share price hurdles that require the average closing price of Conduent Common Stock
to have increased by 15%, 30% or 50% during a consecutive 20-day trading period from the price of Conduent Common Stock on
April 1, 2022, the
long-term incentive grant
effective date.For 2017 restricted shares, one-third vested on 12/31/17, one-third will vest on 12/31/18date, a date consistent with Conduent’s previous granting practices. Price hurdle appreciation levels were set considering the five-year average annual returns of the S&P Small Cap 600 and one-third will vest on 12/31/19. Russell 2000 company indexes
as references, given their average market capitalization and the forecasted growth rates as compared with Conduent.
| | | | | | | | | | | | | | |
| Grant Date Common Stock Price: $5.19 |
| Tranche | Share Hurdle Description | Share
Hurdles | Share Hurdle Achieved as of 12/31/2023 | Service Condition |
| 1 | +15% stock price appreciation | $5.968 | No | December 31, 2022 |
| 2 | +30% stock price appreciation | $6.747 | No | December 31, 2023 |
| 3 | +50% stock price appreciation | $7.785 | No | December 31, 2024 |
The performance period for the 2017 performance shares is 2017 through 2019. PerformancerTSR modifiers for each year (2017, 2018 and 2019) is measuredtranche are based upon Conduent’s percentile rank against pre-established annual goals and the subsequent payout is averaged over the three-year period. The entire award does not vest until the end of the three-year performance period on2021-2022 proxy peer group, as follows:
| | | | | |
| rTSR Percentile | Modifier |
| 75th percentile or above | 105% |
| Median | 100% |
| 25th Percentile | 95% |
Results in between modifier categories are interpolated. All shares remain eligible for vesting for active associates, if share price hurdles are met by December 31,
2019 with payout in the first quarter of 2020, following Compensation Committee certification of the2024. The individual performance
results.The payout for achieving threshold performance is 50%, the payout for achieving target performance is 100%,periods and the payout for achieving maximum performance is 200%. Payouts are made proportionately for achievement at levels between these goals. There is no payout if performance falls below each of the threshold goals established by the Compensation Committee.
| | | | | | | | |
| | | | | Payout Range |
| Performance Measures | | Weighting | | Threshold | | Target | | Maximum |
Adjusted PBT | | 50% | | 50% | | 100% | | 200% |
Free Cash Flow | | 50% | | 50% | | 100% | | 200% |
The performance goals were aligned with Conduent’s 2017 three-year financial model at the time the goals were established. Target performance levels are challenging but achievable with a level of performance that is in line with the Board-approved operating plan, whereas maximum performance levels represent stretch goals which can only be achieved with exceptional performance.
The performance goals and results for the first year (2017)tranche rTSR modifier at the completion of the 2017-2019 ELTIP Plan (in millions) were:
| | | | | | | | | | | | | | | | | | | | | | | | | | | | | | |
| Performance Measures | | Target | | | Actual | | | Adjust-
ments | | | Adjusted
Results | | | | | Calculated
Factor | | | Weighting | | | Payout
Percentage | |
Adjusted PBT | | $ | 236 | | | $ | 281 | | | | — | | | $ | 281 | | | | | | 200 | % | | | 50 | % | | | 100 | % |
Free Cash Flow | | $ | 150 | | | $ | 187 | | | $ | 17 | | | $ | 204 | | | | | | 200 | % | | | 50 | % | | | 100 | % |
| | | | | | 2017 Results -> | | | | 200 | % |
Free Cash Flow: $17M added back | | | | | | | | | | | |
| Tranche | Performance Period | Percentile Achievement | rTSR Modifier Results |
| 1 | April 1, 2022 - December 31, 2022 | 28.57 percentile | 95.71 | % |
| 2 | January 1, 2023 - December 31, 2023 | 21.43 percentile | 95.00 | % |
| 3 | January 1, 2024 - December 31, 2024 | To be determined | To be determined |
2021 Performance — Restricted Stock Units
2021 PRSU—Share Hurdle Awards
The 2021 PRSU—Share Hurdle Award parameters are documented below:
| | | | | | | | | | | | | | | | | |
| Grant Date Common Stock Price: $6.92 |
| Tranche | Share Hurdle Description | Share
Hurdles | Share Hurdle Achieved as of 12/31/2023 | Service Condition | Vesting |
| 1 | +20% stock price appreciation | $ | 8.304 | | No | December 31, 2021 | Service condition met; Unvested |
| 2 | +40% stock price appreciation | $ | 9.688 | | No | December 31, 2022 | Service condition met; Unvested |
| 3 | +60% stock price appreciation | $ | 11.072 | | No | December 31, 2023 | Service condition met; Unvested |
As of December 31, 2023, none of the share hurdles for deferred compensation payments from terminated deferred compensation plans.the 2021 PRSU—Share Hurdle Awards were achieved and thus the corresponding shares were forfeited.
Information regarding ELTIP payouts under certain termination events
2021 PRSU—Revenue Hurdle Awards
The Threshold, Target, Maximum and Actual PRSU—Revenue Hurdle results for the third tranche of our 2021 PRSU—Revenue Hurdle Awards are noted as follows:
| | | | | | | | | | | | | | |
| ($ in millions) | 2021 LTIP Revenue Targets for year ending 12/31/2023 | 2023 |
| Threshold | Target | Maximum | Actual |
| Revenue | 3,870 | | 3,928 | | 3,986 | | 3,722 | |
| Revenue Growth/(Decrease) | 0.5 | % | 2.0 | % | 3.5 | % | (3.4 | %) |
| Minimum Adjusted EBITDA Qualifier: 11.00% | | | | 10.15 | % |
| Revenue Hurdle Achievement | | | | 0 | % |
The results of our 2023 revenue achievement were below threshold level and the
amountminimum required Adjusted EBITDA Margin of
the estimated payouts and benefits payable to the named executive officers assuming a change in control of Conduent and a qualifying termination of employment is presented in the “Potential Payments Upon Termination or Change in Control” table.Strategic Initiative Grants
In light of the challenges facing Conduent in organizing itself as an independent company and improving operational and financial performance and consistent with the actions of similar companies following a spin,11%. Thus, the Compensation Committee elected to provide a special award program to the named executives to better align the economic interest of our officers with those of our shareholders. The key program objectives are to build team cohesion, motivate and promote the successful and expedited business turn around, facilitate cultural change, upgrade talent and foster retention.
The SIG award was granted in 50% performance based shares and 50% time based (restricted) shares. The performance shares fully vest over three-years and are subject to pre-established performance criteria, detailed below, that are critical to Conduent’s strategic plan to drive profitable growth and build a businesscertified 0% payout for the long-term as communicated to our investors. Although the goals reflect three-year cumulative performance (2017 – 2019), there is an opportunity for up to 50%2023 tranche of the award to be earned and paid at the end of the second year (2018). While the performance targets reflect challenging three-year goals aligned with the Company’s multi-year transformation plan, the Compensation Committee believed it would benefit Conduent and shareholders to further incentivize management to expedite the achievement of these critical milestones. Performance against goals will be measured again at the end of 20192021 PRSU—Revenue Hurdle Awards, and the payout earned will be reduced by any awards that vested at the end of 2018. Payout is subject to Compensation Committee certification of performance results. Restrictedcorresponding shares will vest ratably over a three-year period (one-third of the award vested on December 31, 2017, one-third will vest on December 31, 2018 and one-third on December 1, 2019). The Compensation Committee approved SIG awards for each of the named executive officers with a grant date of April 1, 2017 and target grant date award values as follows: Mr. Vemuri - $4,614,500; Mr. Webb-Walsh - $2,936,500; Mr. Peffer - $2,936,500; Mr. Amoriell - $2,936,500 and Mr. Friedel - $2,936,500.
The performance shares include two cost transformation and two client outcome metrics, all equally weighted. These measures are: Cost Transformation – Information Technology (25%), Cost Transformation – Real Estate, General & Administrative (25%), Service Line Penetration (25%), New Business Signings growth (25%). New Business Signings growth measures the Total Contract Value new business signings based on Compound Annual Growth Rate (CAGR) over the 2016 baseline. Service Line Penetration measures the ability to cross-sell additional service lines to the top commercial clients. Information Technology, Real Estate and General & Administrative represent substantial optimization and savings opportunities.
The measures, weightings and threshold to maximum payout ranges set by the Compensation Committee for the SIG are as follows:
| | | | | | | | |
| | | | | Payout Range |
| Performance Measure | | Weighting | | Threshold | | Target | | Maximum |
Cost Transformation – IT | | 25% | | 50% | | 100% | | 200% |
Cost Transformation – Real Estate and G&A | | 25% | | 50% | | 100% | | 200% |
Service Line Penetration | | 25% | | 50% | | 100% | | 200% |
New Business Signings | | 25% | | 50% | | 100% | | 200% |
The terms and conditions of the SIG are the same as ELTIP noted above.
Additional information regarding the SIG awards can be found in the “Summary Compensation Table” and the “Grant of Plan-Based Awards in 2017” table.’’
SHAREHOLDER SAY ON PAY
Our executive compensation is subject to an advisory vote of shareholders at our Annual Meeting. The Compensation Committee considers the outcome of say on pay votes when making compensation decisions for our named executive officers. At the 2017 Annual Meeting of Shareholders, 98.8% of shares voted were in favor of our executive compensation. In addition, 94.0% of shares voted were in favor of holding an annual say on pay vote. Our Board and the Compensation Committee greatly value the benefits of maintaining a dialogue with our shareholders and understanding their views. The executive management team of Conduent established and participated in various shareholder engagement activities in 2017. Conduent’s investor relations function proactively engages with our shareholders to provide updates on the performance of the Company and solicit feedback on various topics.
NAMED EXECUTIVE OFFICERS WITH UNIQUE COMPENSATION ARRANGEMENTS
Ashok Vemuri
In June 2016, Mr. Vemuri entered into a letter agreement which provided he would become CEO of Conduent following Separation. The terms of his new hire offer letter included a 2017 ELTIP award target value of $5,000,000.
In addition, if, prior to the first anniversary of Mr. Vemuri’s July 1, 2016 start date, he voluntarily terminated employment for “Good Reason” (as defined in the offer letter) or was terminated by Xerox or Conduent other than for “Cause” (as defined in his equity award agreement), then he would have been entitled to salary continuation paid over 12 months equal to his annual base salary. If Mr. Vemuri incurs such a termination after the first anniversary of his start date, he will be entitled to severance equal to six months’ salary or, if greater, the amount he is entitled to under the applicable Conduent severance policy at such time.
In connection with the offer letter, Mr. Vemuri agreed to be bound by non-competition and non-solicitation restrictive covenants during the period of his employment and for 12 months following termination of employment. All compensation under the offer letter is subject to Conduent’s standard clawback provisions (including detrimental activity). The offer letter also provided that Mr. Vemuri would be party to Xerox’s customary form of change in control severance agreement. On December 12, 2016, Mr. Vemuri’s change in control severance agreement was amended to increase the change in control trigger from 20% to 50% of the combined voting power of the Company’s then outstanding shares, to be consistent with the provisions of the change in control severance agreements of his Conduent senior leadership team. In August 2017, Conduent adopted the Conduent Incorporated Executive Change in Control Severance Plan (“CIC Plan”) effective October 1, 2017, as described in the Change-in-Control Benefits section below. The terms of Mr. Vemuri’s change in control severance agreement remained in effect until December 31, 2017, after which he was covered under the CIC Plan.
forfeited.Jeffrey Friedel
Mr. Friedel was initially hired in September 2016 as Chief of Staff for Mr. Vemuri. In order to replace certain equity and annual incentive compensation Mr. Friedel would have received from his prior employer, his new hire package included a cash sign-on award of $150,000 payable in two installments, the first payment of $75,000 after three months following his date of hire and the second installment of $75,000 after his one-year anniversary. The first payment was made in January 2017 and the second was made in October 2017. If Mr. Friedel voluntarily terminates or is terminated for cause by the Company within 12 months following receipt of these payments, he is required to pay back the entire amount upon separation.
SAVINGS PLANS
Savings Plans
Conduent Savings Plan (401(k)(“401(k)”) All of our named executive officers are eligible to participate in the Conduent Savings Plan in the same manner as all U.S. employees.associates. After one year of service, participants are eligible for a 100%employer matches which are discretionary. The maximum match on 3%permitted under the terms of the savings plan is 4% of eligible pay saved, subject to IRS-qualified plan compensation limits and highly compensated threshold limits,limits.
The Company does not maintain any non-qualified deferred compensation plans or other retirement plans.
Benefits and
may not receive 401(k) benefits in excess of these limits. Mr. Vemuri, Mr. Webb-Walsh, Mr. Amoriell, Mr. Peffer and Mr. Friedel elected to save in the Conduent Savings Plan in 2017. All received a Company matching contribution except for Mr. Friedel who was not eligible to receive a Company matching contribution in 2017 since he had not completed one year of service.Supplemental Savings Plan
In 2017, under the Supplemental Savings Plan, “highly compensated employees” (as defined under ERISA) including our named executive officers, were eligible to defer up to 85% of their base salary, bonus and commissions. Conduent may make discretionary employer contributions for plan participants, but no discretionary contributions were made. In 2017, Mr. Amoriell and Mr. Peffer elected to save in the Supplemental Savings Plan.
In September 2017, Conduent terminated the Supplemental Savings Plan. No additional elective deferrals were made after September.
PERQUISITES AND OTHER BENEFITS
General Benefits
Perquisites
We generally
maintainoffer medical and dental coverage, life insurance, accidental death insurance and disability benefits programs or plans for all
of our
employees,full-time associates, as well as customary vacation, leave of absence and other similar policies. Our named executive officers are eligible to participate in these programs and plans on the same basis as all other salaried
employees, except as otherwise disclosed.Perquisites
Following Separation, the Compensation Committee reviewed and approved limitedassociates. We do not provide any perquisites to support the health, safety and productivity of our named executive officers. Conduent does not provide tax gross-ups in connection with perquisites (except in relation to relocation per the U.S. relocation policy).
In 2017, all named executive officers were eligible to receive Company-paid financial
Employment and
tax planning assistance of up to $15,000 per year. Solid financial planning by experts reduces the amount of time and attention that named executive officers devote to their finances and maximizes the value of their compensation. To safeguard their health, all named executive officers were also eligible to receive an annual physical examination through our preferred provider or reimbursement of up to $5000 for the cost of a physical should the named executive officer chose to use their own physician. The total costs to Conduent for providing perquisites and personal benefits to the named executive officers during 2017 are shown in the “Summary Compensation Table.”CHANGE-IN-CONTROL BENEFITS
The Compensation Committee approved the Executive Change in Control Severance Plan (“CIC Plan”), effective October 1, 2017. All named executive officers were covered under the CIC Plan as of January 1, 2018. The CIC Plan is intended to replace prior individual change in control agreements entered into with
Separation Xerox prior to January 1, 2017 (“Prior CIC Agreements”) with a consistent and standardized design. The CIC Plan provides certain enhanced benefits to key management employees who the Company determines are most likely to be impacted by a change in control (primarily the Company’s executive officers), so that they can continue to exercise their judgment and legal responsibilities without the potential for distraction and bias that can arise from concerns regarding their personal circumstances. Eligible employees are selected by the Compensation Committee to participate in the CIC Plan. The CIC Plan provides eligible employees with severance payments and benefits in the event that an eligible employee’s employment with the Company is terminated within 90 days prior to, or within 24-months for the CEO and 12-months for any other participant immediately following, a “change in control” of the Company either (a) by the employer company for any reason other than “cause”, “disability” or death or (b) by the eligible employee for “good reason”. The severance payments and benefits to be provided, subject to the employee’s execution of a release of claims, are as follows:
| (1) | A lump sum payment, in cash, equal to the sum of (a) unpaid salary with respect to any paid time off accrued but not taken as of the date of termination, (b) accrued but unpaid salary through the date of termination and (c) any earned but unpaid annual incentive bonus from the fiscal year immediately preceding the year in which the date of termination occurs; |
| (2) | A lump sum payment, in cash, equal to the product of (a) the participant’s annual rate of base salary in effect on the date that notice of termination is given and the annual target bonus applicable to the participant for the year in which notice of termination is given, multiplied by (b) a “factor” (which in the case of the CEO, CFO, President, General Counsel and Secretary and Chief People Officer is two); |
| (3) | Participant shall continue to be entitled to receive all benefits payable under any other plan or agreement relating to retirement benefits or to compensation previously earned and not yet paid; and |
| (4) | Participant shall continue to be eligible to participate in the medical, dental and health care reimbursement account coverage in effect at the date of termination as if the participant had continued in employment during the lesser of (a) the severance period or (b) twelve months. The severance period is based on the “factor” used for the lump sum payment calculation noted in (2) above. For the CEO, CFO, President, General Counsel and Secretary and Chief People Officer, the severance period is two years. If the severance period exceeds twelve months, the participant will receive a cash lump-sum payment equal to the projected value of the employer portion of the premiums for medical and dental benefits for the time period between the end of the twelve months and the remainder of the severance period. Our named executive officers would be eligible to participate in medical, dental and health care reimbursement coverage for twelve months and would receive a lump sum to cover the employer premiums between the end of the twelve months and the end of their severance period. |
Conduent does not provide excise tax reimbursement on severance payments.
The CIC Plan had a three-month term in 2017 and will automatically renew for successive one-year periods beginning in 2018 unless the Company gives notice that it does not wish to extend the CIC Plan. In addition, the CIC Plan promises each participant payment of his or her legal fees in the event the participant brings suit in good faith to enforce his or her rights under the CIC Plan.
Additional information and the amount of the estimated payments and benefits payable to the named executive officers assuming a change in control of Conduent and a qualifying termination of employment is presented in the “Potential Payments Upon Termination or Change in Control” table.
EMPLOYMENT AND SEPARATION
Named executive officers serve at the will of the Board. This enables the Board to remove a named executive officer whenever it is in the best interests of Conduent, with full discretion of the Compensation Committee to decide on an appropriate severance package (except in the case of the CEO, for benefits that have vested or in the case of a change in control).package. When a named executive officer is removed from his or her position, the Compensation Committee exercises its business judgment in considering whether to approve a severance arrangement in light of all relevant circumstances, including how long the officer was with the Company, past accomplishments and the reasons for separation. If the Compensation Committee does not approve a special
severance arrangement for a named executive officer whose position has been eliminated, that officer will be covered under the Company’s U.S. Executive Severance and Salary Continuance Policy, as applicable.
For separations
Our U.S. Executive Severance Policy, which became effective on May 24, 2022, applies to our most senior executives, including our named executive officers, in the case of a separation due to the elimination of the executive’s position, the U.S. Executive Severance and Salary Continuance Policy entitles executives, including ourposition. Our named executive officers are entitled to 2652 weeks of base pay,salary paid out over the severance period, with continued fullhealth benefits (excluding disability and 401(k) contributions). This payment isparticipation) and continued vesting of our long-term incentives during the severance period. These severance benefits are contingent upon signing a release of claims against Conduent, as may be required. As described
Severance Protection and Change-in-Control Benefits
The Company also provides certain Change In Control Severance benefits, which are enhanced benefits provided to key management associates who the Company determines are most likely to be impacted by a change in control (primarily the section entitled “NamedCompany’s executive officers), as per the Executive OfficersChange in Control Severance Plan (“CIC Plan”), which became effective October 1, 2017. In the event of a qualifying termination in connection with Unique Compensation Arrangements,” Mr. Vemuri wasa change in control, the CEO would be eligible to receive enhanced severance undertwo and a special severance arrangement pursuanthalf times his base salary and target annual incentive, and all named executive officers that report directly to his offer letter through the first anniversaryCEO would be eligible to
receive two times base salary and target annual incentives. The CIC Plan payments and benefits become payable only when both a change-in-control and a qualifying termination take place.
Conduent does not provide excise tax reimbursement on change in control payments. Additional information
seeand the amount of the estimated payments and benefits payable to the named executive officers assuming a change in control of Conduent and a qualifying termination of employment is presented in the “Potential Payments Upon Termination or Change in Control” table.
GOVERNANCE OF THE EXECUTIVE COMPENSATION PROGRAMS
Retirement Provision
On February 2, 2023, the Compensation Committee approved a retirement provision applicable to long-term incentive awards granted in 2023 for named executive officers and certain other executives of Conduent, as determined by level. To qualify for the retirement provision, a named executive officer must have:
•a combined age and service equal to 65;
•a minimum age of 60 years old; and
•a minimum of five years of service to Conduent.
Retirement must be agreed on in advance with the Board of Directors, who can determine the time period in its sole and absolute discretion. If a named executive officer qualifies for retirement, the following retirement provisions will apply to LTIP awards granted in 2023:
•RSUs will continue to vest according to the original schedule; and
•PRSUs will follow the original three-year cliff vesting schedule and payout will be based on actual performance at the end of the performance period and the number of full months in the performance period prior to the retirement date.
Continued vesting of unvested awards is contingent upon completion of a successful transition of responsibilities (as determined by the Board); provided, however, that continued vesting would terminate if the executive were to do any of the following:
•accept full time paid employment at a public or private company (with exceptions for (A) board service, teaching, public service, or consulting, (B) employment at a family business, nonprofit, startup or other materially smaller enterprise, or (C) any other employment specifically approved by the CEO for non-executive officers or by the Board for executive officers);
•violate any applicable non-compete, non-solicit, or confidentiality agreements in effect at the time of the retirement; or
•disparage the Company or fail to reasonably cooperate with the Company based on the executive’s historical knowledge.
None of our named executive officers qualified for these retirement provisions as of December 31, 2023.
Governance of the Executive Compensation Programs
The Compensation Committee believes that its programs encourage positive behavior while balancing risk and reward, consistent with the interests of its shareholders. Conduent management conducts risk assessments each year and presents the findings to the Compensation Committee. Based on the assessment of programs covering its employees and executives for
2017,2023, the Compensation Committee determined that its compensation plans, programs and practices do not motivate behavior that is reasonably likely to have a material adverse impact on Conduent, based on the following factors:
Program weighted towards•Balanced mix of cash and equity, with incentives tied to both short- and long-term incentivesperformance;
•Balanced mix of performance measures (financial, operational and operational)stock price) approved by the Compensation Committee in advanceadvance;
Financial goals tied to the operating•Executive incentive plan approved by the Boardpayouts are capped; and
Payout limitations/caps
•Overlapping performance periods for long-term incentivesincentives.
•Independent Compensation Committee oversightoversight;
•Officer stock ownership guidelinesguidelines;
Pay•Compensation recoupment policypolicy; and
•Anti-hedging practiceand anti-pledging policies.
The
Board approvedCompany maintains a
new stock ownership policy for
our namedthe executive officers in order to ensure they build and maintain a meaningful level of stock ownership. The stock ownership guidelines
reflect market practice and are as follows:
•Ownership requirements of 5x,6x, 3x and 1x base salary, for the CEO, CEO’s officer direct reports and all other officers, respectively.respectively;
Need•Officers are required to satisfy the ownership requirement by the end of the fifth full calendar year after becoming an executive.
If executive fails to reach compliance within five years, there will be a mandatory retention of 50%retain 50 percent of all vested shares received upon the vesting of equity awards (net of taxes) until the thresholdrequirement is achieved.achieved; and
•CEO (or, with respect to the CEO, the Board) has the authority to permit discretionary hardship exceptions from the ownership and holding requirements (the Board has the authority to permit discretionary hardship exceptions for the CEO).requirements.
The following types of awards will count toward the guidelines described above: Common Stock held outright andoutright; unvested Restricted Stock Units net of expected taxes; and Restricted Stock Units.PRSUs to the extent the performance hurdle has been achieved but the service condition has not been met, net of expected taxes. The following types of unvested equity awards willdo not count toward the stock ownership guidelines: unexercised stock options, unearned performance awardsPRSUs and cash settledany cash-settled units. Once stock ownership levels are achieved, named executive officers are required to continue to hold that amount of stock as long as they remain with Conduent.
Trading, Hedging and Pledging
Our named executive
All directors and officers are prohibited from engaging in short-swing trading and trading in puts and calls with respect to our Common
Stock. In addition, our named executive officers are prohibitedStock and from using any strategies or products to hedge against potential changes in the value of our Common Stock.
Under our insider trading policy, our
named executive officers may purchase or sell Conduent securities only during “window” periods, which are generally
10 business daythe periods
that begincommencing on the second business day following the date of each quarterly earnings
announcement.announcement and ending on the penultimate trading day of each fiscal quarter. The only exception to this restriction is for our named executive officers who have entered into trading plans pursuant to SEC Rule 10b5-1.
As a result,of December 31, 2023, none of our named executive officers have entered into a 10b5-1 trading plan.
In addition, our executive officers are effectively precludedprohibited from pledging our Common Stock as collateral, including holding our Common Stock in a margin account, since their stock can only be soldaccount.
Compensation Recoupment Policy (Clawbacks)
In October 2023, our Board adopted an amended and restated Compensation Recoupment Policy that complies with recently enacted SEC rules and Nasdaq listing standards. Conduent’s Compensation Recoupment Policy includes a clawback provision that applies in the event that the Company is required to prepare an accounting restatement. In such event, the Company shall recover any awarded incentive compensation received by an executive officer during
“window” periods and trading plans pursuantthe three completed fiscal years immediately preceding the date of such restatement that exceeds the amount that would have been received if based on the restated amounts. The obligation to
SEC Rule 10b5-1, and thereforerecover such erroneously awarded compensation is not
availabledependent on if or when the Company files restated financial statements with the SEC and does not require any finding of misconduct by an executive officer or such officer being found responsible for the accounting error leading to
be sold at any time.Compensation Recovery Policy (Clawbacks)
Underthe accounting restatement.
Additionally, under the Conduent Performance Incentive Plan and the Conduent Incorporated Compensation Recoupment Policy, if the Compensation Committee deems a named executive officer to have engaged in an activity that is detrimental to Conduent, it may cancel any awards granted to that individual. In addition, ifIf such a determination is made before any change in control of Conduent, the Compensation Committee may rescind any payment or delivery of any equity and annual cash incentive award that occurred fromwithin the six months beforepreceding the detrimental activity. For this purpose, detrimental activity may include a violation of a non-competenon-
compete agreement with Conduent (to the extent permitted by applicable law), disclosing confidential information (except for reporting and other communications protected by “whistleblower” provisions of the Dodd- FrankDodd-Frank Wall Street Reform and Consumer Protection Act)Act and rules and regulations thereunder (the “Dodd-Frank Act”)), soliciting an employee to terminate employment with Conduent or soliciting a customer to reduce its level of business with Conduent. If a payment or award is rescinded, the named executive officer will be expected to pay Conduent the amount of any gain realized or payment received in a manner the Compensation Committee or its delegate requires.Conduent’s stock award agreements include a clawback provision that applies if an accounting restatement is required to correct any material non-compliance with financial reporting requirements. Under this provision, Conduent can recover, for the three prior years, any excess incentive-based compensation (the excess over what would have been paid under the accounting restatement) from executive officers or former executive officers.
In addition, the Compensation Committee implemented a compensation recovery policy that is applicable to our named executive officers. If an accounting restatement is required to correct any material non-compliance with financial reporting requirements under relevant securities laws, Conduent may recover any excess incentive-based compensation from executive officers or former executive officers (in excess of what would have been paid under the accounting restatement), including entitlement to shares of Common Stock, that was based on such erroneous data and paid during the three-year period preceding the date on which Conduent is required to prepare the accounting restatement.
Conduent may implement any policy or take any action with respect to the recovery of excess incentive-based compensation
including entitlement to shares of Common Stock that Conduent determines to be necessary or advisable in order to comply with the requirements of the Dodd-Frank
Act.Compensation recovery arrangements may be included in letter agreements with executives, as disclosed for Mr. Vemuri inAct, including the “Namedrecoupment of shares of Common Stock issued upon the vesting of a long-term incentive award.
Certain Tax Implications of Executive
Officers with Unique Compensation
Arrangements” section of the CD&A.CERTAIN TAX IMPLICATIONS OF EXECUTIVE COMPENSATION
With certain material exceptions,
Section 162(m) of the Internal Revenue Code limits to $1 million per year the federal income tax deduction available to
public corporations for compensation paid
forin any fiscal year to the corporation’s
CEO and certain other named executive officers
at year end (but not the CFO) included in the “Summary Compensation Table” in the corporation’s proxy statement.Pursuant to Section 162(m), as in effect for 2017, compensation in excess of $1 million per year paid to Conduent’s CEO and three other highest paid executive officers (other than the CFO) was not deductible unless it qualified as “performance-based” compensation. In connection with granting incentive compensation to thecertain former named executive officers,officers. While the Compensation Committee has consideredconsiders the implications under Section 162(m) while retainingdeductibility of awards as one factor in determining executive compensation, the Compensation Committee also looks at other factors in making its decisions, as noted above, and retains the flexibility to design programsaward compensation that it believed were in the best interests of
Conduent and its stockholders anddetermines to be consistent with the objectivesgoals of our executive compensation programs, includingprogram even if the flexibility to authorize payments that might not be deductible. The Tax Cuts and Jobs Act, which was signed into law on December 22, 2017, eliminated the exception for “performance-based” compensation with respect to 2018 and future years. As a result, Conduent expects that, except to the extent that compensation is eligible for limited transition relief applicable to binding contracts in effect on November 2, 2017 thatawards are not modified in any material respect after that date, compensation over $1 million per year paid to any named executive officer (and any person who was a named executivedeductible by the Company for any year beginning with 2017) will be nondeductible under Section 162(m).
COMPENSATION COMMITTEE REPORT
tax purposes.
Compensation Committee Report
The Compensation Committee has reviewed and discussed the Compensation Discussion and Analysis with Conduent management. Based upon its review and discussions, the Compensation Committee recommended to the Board of Directors that the Compensation Discussion and Analysis be incorporated by reference in the Company’s Annual Report on Form 10-K for the year ended December 31,
20172023 and be included in the Proxy Statement for the
20182024 Annual Meeting of Shareholders.
Joie A. Gregor,
Hunter Gary, Chair
Paul Galant
Courtney Mather
Scott Letier
Margarita Paláu-Hernández
Summary Compensation Table
The Summary Compensation Table below provides compensation information for
our principal executive officer, our principal financial officerthe Company’s Chief Executive Officer, Chief Financial Officer and the
next three
other most highly compensated executive officers,
who served during the fiscal year endedas of December 31,
2017 (collectively referred to2023, as
namedwell as an additional former associate (Mark King) not serving as an executive
officers). The table includes the dollar value of base salary earned, bonus, stock awards, non-equity incentive plan compensation earnedofficer on December 31, 2023 and
all other compensation, whether paid or deferred. Unless otherwise stated, the compensation tables included in this section reflect amounts paid or payable or awards granted to our named executive officers by Conduent under Conduent’s compensation plans and programs during 2017.For a summary of the Conduent Compensation Committee’s decisionswho resigned on the compensation awarded to our named executive officers for 2017, please refer to the “Compensation Discussion and Analysis.”
| | | | | | | | | | | | | | | | | | | | | | | | | | | | | | | | |
| | | | | | | | | | |
Name & Principal Position | | Year | | | Salary
($) (A) | | | Bonus
($) (B) | | | Stock
Awards
($) (C) | | | Option
Awards
($) (D) | | Non-Equity
Incentive Plan
Compensation
($) (E) | | Change in
Pension
Value
and
NQDC
Earnings
($) (F) | | | All Other
Compensation
($) (G) | | | Total ($) | |
Ashok Vemuri, Chief Executive Officer | | | 2017 2016 | | | | 1,000,000 503,846 | | | | - 1,750,000 | | | | 9,614,470 2,500,004 | | | - - | | 1,200,000 702,865 | | | - - | | | | 15,004 22,192 | | | | 11,829,474 5,478,907 | |
Brian Webb-Walsh, Executive Vice President and Chief Financial Officer | | | 2017 2016 | | | | 450,000 333,750 | | | | - - | | | | 3,911,486 500,000 | | | - - | | 324,000 187,256 | | | - 29,004 | | | | 105,439 34,753 | | | | 4,790,925 1,084,763 | |
David Amoriell, President | | | 2017 2016 2015 | | | | 536,000 532,869 525,000 | | | | - - 553,986 | | | | 3,736,470 800,005 800,007 | | | - - - | | 361,800 359,944 109,295 | | | - - - | | | | 11,852 11,663 22,832 | | | | 4,646,122 1,704,481 2,011,120 | |
J. Michael Peffer, Executive Vice President, General Counsel and Secretary | | | 2017 | | | | 500,000 | | | | - | | | | 3,736,470 | | | - | | 337,500 | | | - | | | | 36,354 | | | | 4,610,324 | |
Jeffrey Friedel, Executive Vice President, Chief People Officer | | | 2017 | | | | 407,769 | | | | 150,000 | | | | 3,436,476 | | | - | | 243,250 | | | - | | | | 8,620 | | | | 4,246,115 | |
| | | | | | | | | | | | | | | | | | | | |
Name &
Principal
Position | Year | Salary
($) | Stock
Awards
($) (A) | Non-Equity
Incentive Plan
Compensation
($) (B) | All Other
Compensation
($) (C) | Total
($) |
| Clifford Skelton | 2023 | 835,000 | | 4,999,996 | | 638,775 | | — | | 6,473,771 | |
| President and | 2022 | 826,808 | | 4,249,995 | | 789,075 | | — | | 5,865,878 | |
| Chief Executive Officer | 2021 | 770,255 | | 3,999,993 | | 1,307,813 | | — | | 6,078,061 | |
| Stephen Wood | 2023 | 525,000 | | 1,149,992 | | 224,910 | | — | | 1,899,902 | |
| Executive Vice President & | 2022 | 514,760 | | 1,149,992 | | 260,000 | | — | | 1,924,752 | |
| Chief Financial Officer | 2021 | 398,241 | | 499,977 | | 450,000 | | — | | 1,348,218 | |
| Michael Krawitz | 2023 | 500,000 | | 999,993 | | 200,813 | | 3,630 | | 1,704,436 | |
| Executive Vice President, | 2022 | 493,173 | | 999,998 | | 242,000 | | 3,050 | | 1,738,221 | |
| General Counsel & Secretary | 2021 | 450,000 | | 734,987 | | 450,000 | | 8,700 | | 1,643,687 | |
| Mark Prout | 2023 | 450,000 | | 749,995 | | 180,731 | | 3,630 | | 1,384,356 | |
| Executive Vice President, | 2022 | 450,000 | | 749,995 | | 236,000 | | 3,050 | | 1,439,045 | |
| Chief Information Officer | 2021 | 446,506 | | 449,993 | | 450,000 | | 8,700 | | 1,355,199 | |
| Randall King | 2023 | 450,000 | | 599,996 | | 137,700 | | 3,630 | | 1,191,326 | |
| Executive Vice President | | | | | | |
| Commercial Solutions | | | | | | |
| Mark King | 2023 | 446,779 | | 799,998 | | — | | 3,630 | | 1,250,407 | |
| Executive Vice President, | | | | | | |
| Government Solutions (Former) | | | | | | |
____________________
Compensation reported in this table is in U.S. dollars and rounded to the nearest dollar.
(A) | Amounts shown represent base salary earned in 2017. Effective February 1, 2017, Mr. Friedel’s annual base salary was increased from $285,000 to $425,000 to reflect his promotion to Chief People Officer. |
(B) | Unless otherwise indicated, the Annual Performance Incentive Plan (APIP) awards appear as “Non-Equity Incentive Plan Compensation” in column (E). For Mr. Friedel, the amount shown in column (B) represents the $150,000 cash sign-on award in accordance with the terms of his offer letter in connection with his hiring effective September 26, 2016. For more information about this payment, see the “Named Executive Officers with Unique Compensation Arrangements” section of the CD&A. |
(C) | (A)Included in this column are the aggregate grant date fair values of equity awards made to our named executive officers in fiscal year 2023 as computed in accordance with FASB ASC Topic 718. For additional information, refer to Note 18 in the Company’s audited financial statements for the fiscal year ended December 31, 2023, included in the 2023 Annual Report on Form 10-K filed with the SEC on February 21, 2024. These amounts reflect an estimate of the grant date fair value and may not be equivalent to the actual value recognized by the named executive officer. The grant date fair value of the 2023 PRSU—rTSR awards is based upon the Monte Carlo method, and both the target fair market value and the maximum fair market value at 150% of target, on the date of grant are shown below. The grant date fair value of the 2023 PRSU—Revenue Growth awards is based on the probable outcome of the performance conditions as of the grant date, or target, and the maximum value of these awards are shown below in the table. | | | | | | | | | | | | | | | | | | | | | | | | | Name | Grant Date | 2023 PRSU—rTSR | 2023 PRSU—Revenue Growth | RSU | Fair Value
Based on
Monte Carlo
Valuation
Method ($) | Value
on Grant Date ($) Based on Stock Price | Maximum Market Value on Grant Date ($) | Fair Value
on Grant Date ($) Based on Stock Price | Maximum Fair Market Value on Grant Date ($) | Fair Market Value on
Grant Date ($) | | Clifford Skelton | 4/1/2023 | 750,000 | | 871,800 | | 915,390 | | 1,750,000 | | 3,500,000 | | 2,499,996 | | | Stephen Wood | 4/1/2023 | 172,497 | | 200,511 | | 210,537 | | 402,497 | | 804,994 | | 574,998 | | | Michael Krawitz | 4/1/2023 | 149,998 | | 174,357 | | 183,075 | | 349,997 | | 699,994 | | 499,998 | | | Mark Prout | 4/1/2023 | 112,499 | | 130,769 | | 137,307 | | 262,498 | | 524,996 | | 374,998 | | | Randall King | 4/1/2023 | 89,999 | | 104,615 | | 156,923 | | 209,999 | | 419,998 | | 299,998 | | | Mark King | 4/1/2023 | 120,000 | | 139,488 | | 261,536 | | 279,998 | | 699,994 | | 400,000 | |
____________________
(B)Included in this column are the payments made to our named executive officers in fiscal year 2017 as computed in accordance with FASB ASC Topic 718 as described in Note 15 in the Company’s 2017 Annual Report on Form 10-K. For ELTIP and SIG performance shares, the amounts are based on the target outcome of the performance conditions as of the grant date. These amounts reflect an estimate of the grant date fair value and may not be equivalent to the actual value recognized by the named executive officer. |
Three-year performance share awards under the 2017 ELTIP2023 APIP based on performance.
(C)“All Other Compensation” noted in this column is comprised of Conduent’s 401(k) match for 2023 for those named executive officers who elected to participate in Conduent’s 401(k) program. Conduent associates, including our named executive officers, are not eligible for the 401(k) Company match until one full year of service is completed. These 401(k) benefits are equal to the benefits afforded to all Conduent associates. There are no perquisites exclusive to our named executive officers.
Grants of Plan-Based Awards in 2023
The following table provides information regarding our named executive officers’ equity grants and annual cash incentive awards in 2023, including additional detail regarding the potential threshold, target and maximum award opportunities payable under the 2023 APIP and 2023 PRSU—rTSR and 2023 PRSU—Revenue Growth awards granted under the 2023 LTIP. No stock options were awarded in fiscal year 2023.
| | | | | | | | | | | | | | | | | | | | | | | | | | | | | | | | | | | | | | |
| Name | Award
(A) | Grant
Date
| Approval
Date
| Estimated Future Payout Under
Non-Equity Incentive Awards
(A) | | Estimated Future Payout Under
Equity Incentive Awards
(B) | All Other
Stock
Awards:
Number
of Shares
or Units
(#)(C) | Grant
Date Fair
Value of
Stock
Awards
($)(D) |
Threshold
($) | Target
($) | Maximum
($) | Threshold
(#) | Target
(#) | Maximum
(#) |
Clifford
Skelton | APIP | | | 313,125 | | 1,252,500 | | 2,505,000 | | | | | | | |
| LTIP RSU | 4/1/2023 | 2/2/2023 | | | | | | | | 728,862 | | 2,499,997 | |
| LTIP PRSU—Revenue Growth | 4/1/2023 | 2/2/2023 | | | | | 255,102 | | 510,204 | | 1,020,408 | | | 1,750,000 | |
| LTIP PRSU—rTSR | 4/1/2023 | 2/2/2023 | | | | | 127,085 | | 254,169 | | 381,254 | | | 750,000 | |
Stephen
Wood | APIP | | | 105,000 | | 420,000 | | 840,000 | | | | | | | |
| LTIP RSU | 4/1/2023 | 2/2/2023 | | | | | | | | 167,638 | | 574,998 | |
| LTIP PRSU—Revenue Growth | 4/1/2023 | 2/2/2023 | | | | | 58,673 | | 117,346 | | 234,692 | | | 402,497 | |
| LTIP PRSU—rTSR | 4/1/2022 | 2/2/2023 | | | | | 29,229 | | 58,458 | | 87,687 | | | 172,497 | |
Michael
Krawitz | APIP | | | 93,750 | | 375,000 | | 750,000 | | | | | | | |
| LTIP RSU | 4/1/2023 | 2/2/2023 | | | | | | | | 145,772 | | 499,998 | |
| LTIP PRSU—Revenue Growth | 4/1/2023 | 2/2/2023 | | | | | 51,020 | | 102,040 | | 204,080 | | | 349,997 | |
| LTIP PRSU—rTSR | 4/1/2023 | 2/2/2023 | | | | | 25,417 | | 50,833 | | 76,250 | | | 149,998 | |
Mark
Prout | APIP | | | 84,375 | | 337,500 | | 675,000 | | | | | | | |
| LTIP RSU | 4/1/2023 | 2/2/2023 | | | | | | | | 109,329 | | 374,998 | |
| LTIP PRSU—Revenue Growth | 4/1/2023 | 2/2/2023 | | | | | 38,265 | | 76,530 | | 153,060 | | | 262,498 | |
| LTIP PRSU—rTSR | 4/1/2022 | 2/2/2023 | | | | | 19,063 | | 38,125 | | 57,188 | | | 112,499 | |
Randall
King | APIP | | | 84,375 | | 337,500 | | 675,000 | | | | | | | |
| LTIP RSU | 4/1/2023 | 2/2/2023 | | | | | | | | 87,463 | | 299,998 | |
| LTIP PRSU—Revenue Growth | 4/1/2023 | 2/2/2023 | | | | | 30,612 | | 61,224 | | 122,448 | | | 209,999 | |
| LTIP PRSU—rTSR | 4/1/2023 | 2/2/2023 | | | | | 15,250 | | 30,500 | | 45,750 | | | 89,999 | |
Mark King | APIP | | | 83,964 | | 335,856 | | 671,712 | | | | | | | |
| LTIP RSU | 4/1/2023 | 2/2/2023 | | | | | | | | 116,618 | | 400,000 | |
| LTIP PRSU—Revenue Growth | 4/1/2023 | 2/2/2023 | | | | | 40,816 | | 81,632 | | 163,264 | | | 279,998 | |
| LTIP PRSU—rTSR | 4/1/2023 | 2/2/2023 | | | | | 20,334 | | 40,667 | | 61,001 | | | 120,000 | |
____________________
(A)These columns reflect the threshold, target and maximum payout opportunities for the performance measures under the 2023 APIP set by the Compensation Committee. The actual APIP payout, which was based on 2023 performance is presented in the “Summary Compensation Table” in column (B).
(B)These columns reflect the threshold, target and maximum payout opportunities for the 2023 LTIP PRSU awards set by the Compensation Committee.
The number of units at target for the 2023 PRSU—rTSR awards was determined by dividing the approved values of the respective awards by the closing stock price on the April 1, 2023 grant date ($3.43) and then applying a factor of 1.1624, as calculated using the Monte Carlo simulation, and rounding the number of shares down to the nearest share. The threshold number of shares is the minimum number of shares that can be earned at threshold performance, or 50%. The maximum number of shares that can be earned is the granted shares adjusted by a positive 100% and 50% or the 2023 PRSU—Revenue Growth shares and 2023 PRSU—rTSR shares, respectively.
(C)This column includes RSUs granted under the LTIP on April 1, 2017 as follows: Mr. Vemuri - $2,499,985; Mr. Webb-Walsh - $487,493; Mr. Amoriell - $399,985; Mr. Peffer - $399,985;2023, which vest ratably on December 31, 2023, December 31, 2024 and Mr. Friedel - $249,988.December 31, 2025. The number of RSUs was determined by dividing the approved values of the respective awards by the closing stock price on the April 1, 2023 grant date ($3.43) and rounding the number of shares down to the nearest share.
(D)The value reported in this column represents the grant date fair value of these awards if paid at maximum performance isdetermined in accordance with FASB ASC Topic 718. These values are recorded over the requisite serviced period as follows: Mr. Vemuri - $4,999,970; Mr. Webb-Walsh - $974,985; Mr. Amoriell - $799,970; Mr. Peffer - $799,970;required by FASB ASC Topic 718. See footnote (C) to the “Summary Compensation Table” and Mr.Friedel - $499,977. Restricted share awards under the 2017 ELTIP were granted on April 1, 2017 as follows: Mr. Vemuri - $2,499,985; Mr. Webb-Walsh - $487,493; Mr. Amoriell - $399,985; Mr. Peffer - $399,985 and Mr. Friedel $249,988. Also included in this column is the grant date fair value of the SIG. The performance share awards under the SIG were granted on April 1, 2017 as follows: Mr. Vemuri - $2,307,250; Mr. Webb-Walsh - $1,468,250; Mr. Amoriell - $1,468,250; Mr. Peffer - $1,468,250; and Mr. Friedel - $1,468,250. The grant date fair value of these awards if paid at maximum performance is as follows: Mr. Vemuri - $4,614,500; Mr. Webb-Walsh - $2,936,500; Mr. Amoriell - $2,936,500; Mr. Peffer - $2,936,500; and Mr.Friedel - $2,936,500. Restricted share awards under the SIG were granted on April 1, 2017 as follows: Mr. Vemuri - $2,307,250; Mr. Webb-Walsh - $1,468,250; Mr. Amoriell - $1,468,250; Mr. Peffer - $1,468,250; and Mr. Friedel - $1,468,250. For more information about these awards, see the “Long-Term Incentives” section of the CD&A.(D) | There were no stock options granted in 2017. |
(E) | The Non-Equity Incentive Plan payment for our named executive officers under the 2017 APIP, based on 2017 performance, was approved by the Conduent Compensation Committee. Effective February 1, 2017, Mr. Friedel’s target was increased from 50% to 75% in connection with his promotion to Chief People Officer. Actual 2017 full-year payments were made at 80% of target for Mr. Vemuri, 96% of target for Mr. Webb-Walsh, 90% of target for Mr. Peffer and Mr. Amoriell and 80% of target for Mr. Friedel. For more information, see the “Determining Short-Term Incentive Award Payouts” section in the CD&A. |
(F) | Conduent does not have a defined benefit pension plan. The pension information shown for Mr. Webb-Walsh in 2016 reflected his Xerox pension benefits prior to Separation. In 2017, Mr. Amoriell and Mr. Peffer participated in the Supplemental Savings Plan prior to its termination in September 2017. No above-market earnings were credited under this plan. |
(G) | The table below provides additional data on the amounts included under the “All Other Compensation” column. |
| | | | | | | | | | | | | | |
Name | | Year | | Life Insurance
Premiums
Paid by
Registrant ($) (1) | | Tax Related
Reimbursements
($) (2) | | 401(k) Match ($) (3) | | Miscellaneous ($) (4) | | | Total All Other
Compensation ($) |
Ashok Vemuri | | 2017 2016 | | 810 371 | | - - | | - - | | | 14,194 21,821 | | | 15,004 22,192 |
Brian Webb-Walsh | | 2017 2016 | | 480 80 | | 26,553 - | | 7,581 9,289 | | | 70,825 25,384 | | | 105,439 34,753 |
David Amoriell | | 2017 2016 2015 | | 3,564 3,564 - | | - - 7,456 | | 8,264 8,099 7,950 | | | 24 - 7,426 | | | 11,852 11,663 22,832 |
J. Michael Peffer | | 2017 | | 2,322 | | 8,125 | | 8,100 | | | 17,807 | | | 36,354 |
Jeffrey Friedel | | 2017 | | 971 | | - | | - | | | 7,649 | | | 8,620 |
(1) | This column includes group life imputed income for each individual for group life insurance for 2017. |
(2) | This column includes tax gross-ups in connection with relocation expenses under the U.S. relocation program. |
(3) | This column includes Company matches paid under the Conduent 401(k) Savings Plan. There were no matches under the Supplemental Savings Plan. |
(4) | Amounts in this column for 2017 include financial and tax planning assistance for Mr. Vemuri ($8,565), Mr. Webb-Walsh ($9,500) and Mr. Friedel ($2,500). Also included is home security for Mr. Vemuri, executive physicals for Messrs. Vemuri, Webb-Walsh and Friedel ($4,825 for each) and identity theft protection for Messrs. Vemuri, Amoriell and Friedel. Amounts in this column also include relocation expense reimbursements for Mr. Webb-Walsh ($56,500) and Mr. Peffer ($17,807) under the U.S. relocation program. |
For further information on the material features of the compensation disclosed in the Summary Compensation Table, see the sections entitled “2017 Compensation for the Named Executive Officers”, “Named Executive Officers with Unique Compensation Arrangements”, “Savings Plans” and “Perquisites and Other Benefits” in the CD&A.
GRANTS OF PLAN-BASED AWARDS IN 2017
The following table provides&A for additional detail for each of the named executive officersinformation on potential amounts payable under APIP, ELTIP and SIG, as presented in the “Summary Compensation Table.” Threshold, target and maximum award opportunities are provided.
| | | | | | | | | | | | | | | | | | | | | | | | | | | | | | | | | | | | | | | | | | | | |
Name | | Award (A) | | Grant
Date (A) | | | Approval
Date (A) | | | Estimated Future Payout Under Non-Equity Incentive Awards
(B) | | | | | Estimated Future Payout Under Equity Incentive Awards
(C) | | | All Other
Stock
Awards:
Number
of Shares
or Units
(#)(D) | | | Grant Date Fair
Value of
Stock
Awards
($)(E) | |
| | | | | Threshold ($) | | | Target ($) | | | Maximum ($) | | | | | Threshold (#) | | | Target (#) | | | Maximum (#) | | | |
Ashok Vemuri | | | | | | | | | | | | | 75,000 | | | | 1,500,000 | | | | 3,000,000 | | | | | | - | | | | - | | | | - | | |
| -
|
| |
| -
|
|
| | | ELTIP RS | | | 4/1/17 | | | | 3/8/17 | | | | - | | | | - | | | | - | | | | | | - | | | | - | | | | - | | | | 148,986 | | | | 2,499,985 | |
| | | ELTIP PS | | | 4/1/17 | | | | 3/8/17 | | | | - | | | | - | | | | - | | | | | | 37,347 | | | | 148,986 | | | | 297,972 | | | | - | | | | 2,499,985 | |
| | | SIG RS | | | 4/1/17 | | | | 3/8/17 | | | | - | | | | - | | | | - | | | | | | - | | | | - | | | | - | | | | 137,500 | | | | 2,307,250 | |
| | | SIG PS | | | 4/1/17 | | | | 3/8/17 | | | | - | | | | - | | | | - | | | | | | 17,188 | | | | 137,500 | | | | 275,000 | | | | - | | | | 2,307,250 | |
Brian Webb-Walsh | | | | | | | | | | | | | 16,875 | | | | 337,500 | | | | 675,000 | | | | | | - | | | | - | | | | - | | | | - | | | | - | |
| | | ELTIP RS | | | 4/1/17 | | | | 3/6/17 | | | | - | | | | - | | | | - | | | | | | - | | | | - | | | | - | | | | 29,052 | | | | 487,493 | |
| | | ELTIP PS | | | 4/1/17 | | | | 3/6/17 | | | | - | | | | - | | | | - | | | | | | 7,263 | | | | 29,052 | | | | 58,104 | | | | - | | | | 487,493 | |
| | | SIG RS | | | 4/1/17 | | | | 3/6/17 | | | | - | | | | - | | | | - | | | | | | - | | | | - | | | | - | | | | 87,500 | | | | 1,468,250 | |
| | | SIG PS | | | 4/1/17 | | | | 3/6/17 | | | | - | | | | - | | | | - | | | | | | 10,938 | | | | 87,500 | | | | 175,000 | | | | - | | | | 1,468,250 | |
David Amoriell | | | | | | | | | | | | | 20,100 | | | | 402,000 | | | | 804,000 | | | | | | - | | | | - | | | | - | | | | - | | | | - | |
| | | ELTIP RS | | | 4/1/17 | | | | 3/6/17 | | | | - | | | | - | | | | - | | | | | | - | | | | - | | | | - | | | | 23,837 | | | | 399,985 | |
| | | ELTIP PS | | | 4/1/17 | | | | 3/6/17 | | | | - | | | | - | | | | - | | | | | | 5,959 | | | | 23,837 | | | | 47,674 | | | | - | | | | 399,985 | |
| | | SIG RS | | | 4/1/17 | | | | 3/6/17 | | | | - | | | | - | | | | - | | | | | | - | | | | - | | | | - | | | | 87,500 | | | | 1,468,250 | |
| | | SIG PS | | | 4/1/17 | | | | 3/6/17 | | | | - | | | | - | | | | - | | | | | | 10,938 | | | | 87,500 | | | | 175,000 | | | | - | | | | 1,468,250 | |
J. Michael Peffer | | | | | | | | | | | | | 18,750 | | | | 375,000 | | | | 750,000 | | | | | | - | | | | - | | | | - | | | | - | | | | - | |
| | | ELTIP RS | | | 4/1/17 | | | | 3/6/17 | | | | - | | | | - | | | | - | | | | | | - | | | | - | | | | - | | | | 23,837 | | | | 399,985 | |
| | | ELTIP PS | | | 4/1/17 | | | | 3/6/17 | | | | - | | | | - | | | | - | | | | | | 5,959 | | | | 23,837 | | | | 47,674 | | | | - | | | | 399,985 | |
| | | SIG RS | | | 4/1/17 | | | | 3/6/17 | | | | - | | | | - | | | | - | | | | | | - | | | | - | | | | - | | | | 87,500 | | | | 1,468,250 | |
| | | SIG PS | | | 4/1/17 | | | | 3/6/17 | | | | - | | | | - | | | | - | | | | | | 10,938 | | | | 87,500 | | | | 175,000 | | | | - | | | | 1,468,250 | |
Jeffrey Friedel | | | | | | | | | | | | | 15,203 | | | | 304,063 | | | | 608,126 | | | | | | - | | | | - | | | | - | | | | - | | | | - | |
| | | ELTIP RS | | | 4/1/17 | | | | 3/8/17 | | | | - | | | | - | | | | - | | | | | | - | | | | - | | | | - | | | | 14,898 | | | | 249,988 | |
| | | ELTIP PS | | | 4/1/17 | | | | 3/8/17 | | | | - | | | | - | | | | - | | | | | | 3,725 | | | | 14,898 | | | | 29,796 | | | | - | | | | 249,988 | |
| | | SIG RS | | | 4/1/17 | | | | 3/8/17 | | | | - | | | | - | | | | - | | | | | | - | | | | - | | | | - | | | | 87,500 | | | | 1,468,250 | |
| | | SIG PS | | | 4/1/17 | | | | 3/8/17 | | | | - | | | | - | | | | - | | | | | | 10,938 | | | | 87,500 | | | | 175,000 | | | | - | | | | 1,468,250 | |
(A) | RS refers to shares of restricted stock subject to service-based vesting conditions and PS refers to shares of restricted stock subject to service-based and performance-based vesting conditions. The “Grant Date” is the effective date of the ELTIP and SIG awards. The “Approval Date” is the date on which the Compensation Committee took action to approve these awards. |
(B) | These columns reflect the threshold, target and maximum payout opportunities for Conduent performance measures under the 2017 APIP set by the Compensation Committee. The actual APIP payout, which was based on 2017 performance and paid in March 2018, is presented in the “Summary Compensation Table” in column (E). The Conduent Corporate APIP measures and weightings for 2017 were Adjusted EBITDA (60%), Revenue Growth (30%) and Revenue Productivity (10%). Please refer to the section entitled “Short-Term Incentives” in the CD&A for additional information on the 2017 APIP payout opportunity, measures and weightings that applied to each of our named executive officers. The target value reflects payout if target performance was achieved on all performance measures. The maximum value reflects payout if maximum or higher performance was achieved on all performance measures. Threshold payout was determined based on achieving Conduent’s Revenue Productivity performance measure at the minimum performance level with no other performance measures being achieved. There would be no APIP payout if threshold performance was not achieved on any of the performance measures. See the “Summary Compensation Table,” footnote (E), for additional information regarding the actual payout of these awards. |
these equity awards.(C) | The threshold, target and maximum payout opportunities for the 2017 ELTIP and the SIG awards were set by the Compensation Committee. The number of shares at target for these awards was determined by dividing the approved values of the respective awards by the closing stock price on the grant date and rounding the number of shares down to the nearest share. The closing stock price for this award was $16.78. |
Performance shares under ELTIP can be earned by achieving three-year cumulative performance goals between threshold and maximum. The performance measures and weightings for ELTIP are Adjusted Profit before Tax (50%) and Free Cash Flow (50%). The performance period for the 2017 ELTIP is January 1, 2017 through December 31, 2019. Performance shares that are earned will vest at the end of the three-year performance period, following Compensation Committee certification of performance results. Performance shares under SIG can be earned as follows: up to 50% of performance shares will vest on December 31, 2018 based on cumulative performance results for 2017 and 2018, following Compensation Committee certification of results. The performance measures and weightings for the SIG performance shares are Cost Transformation – Information Technology (25%), Cost Transformation – Real Estate, General & Administrative (25%), Service Line Penetration (25%), New Business Signings growth (25%). Performance against the same goals will be measured again at the end of 2019 and the payout earned will be reduced by any awards that vested at the end of 2018. Vesting will occur following Compensation Committee certification of performance results.
The target column reflects the number of performance shares that can be earned if target performance is achieved on all performance measures. The maximum column reflects the greatest number of performance shares that can be earned if maximum or higher performance is achieved on all performance measures. The threshold column reflects the lowest number of performance shares that can be earned assuming that performance is achieved at the minimum level for only one of the performance measures. The number of performance shares earned will be interpolated in the event that Conduent’s performance varies between threshold and maximum, as determined by the Compensation Committee. If threshold performance is not achieved, no performance shares will be earned.
(D) | This column includes restricted shares granted under our ELTIP and SIG, which vest ratably on December 31, 2017, December 31, 2018 and December 31, 2019. The number of restricted shares was determined by dividing the approved values of the respective awards by the closing stock price on the grant date and rounding the number of shares down to the nearest share. The closing stock price for this award was $16.78. |
(E) | The value reported in this column with respect to the stock awards reported in column (C) is based on the target award and the grant date closing market price noted above in footnote (C). The value reported in this column with respect to the stock awards reported in column (D) is based on the grant date closing market price noted above in footnote (D). This value is recorded over the requisite serviced period as required by FASB ASC Topic 718. See footnote (C) to the “Summary Compensation Table” and the “Long-Term Incentives” section in the CD&A for additional information on these equity awards. |
For a description of the material features of the compensation disclosed in the 2017 Grants of Plan-Based Awards in 2023 table see the “Short-Term Incentives” and the “Long-Term Incentives” section of the CD&A.
Outstanding Equity Awards at 2023 Fiscal Year-End
The following table summarizes the unvested stock awards held by the named executive officers at the end of fiscal year
2017.2023. There are no outstanding stock option awards.
| | | | | | | | | | | | | | | | | | | | |
| Name | | Grant
Date | | | Number of
Shares or
Units of Stock
That Have Not
Vested
(#)(1) | | | Market Value
of Shares or
Units of Stock
That Have Not
Vested
($) (2) | | | Equity
Incentive
Plan Awards:
Number of
Unearned
Shares, Units
or Other Rights
That Have Not
Vested
(#) (3) | | | Equity
Incentive Plan
Awards: Market
or Payout Value
of Unearned
Shares, Units
or Other Rights
That Have Not
Vested
($) (2) | |
Ashok Vemuri | |
| 7/1/16
4/1/17 |
| |
| 163,614
191,945 | (4)
(5) | | $
$ | 2,644,002
3,101,831 |
| | | 286,486 | | | $ | 4,629,614 | |
Brian Webb-Walsh | |
| 7/1/15
7/1/16 10/1/16 4/1/17 |
| |
| 7,061
16,361 15,402 78,089 | (4)
(4) (6) (5) | | $
$ $ $ | 114,106
264,394 248,896 1,261,918 |
| | | 116,552 | | | $ | 1,883,480 | |
David Amoriell | |
| 7/1/15
7/1/16 4/1/17 |
| |
| 15,586
52,357 74,595 | (4)
(4) (5) | | $
$ $ | 251,870
846,089 1,205,455 |
| | | 111,337 | | | $ | 1,799,206 | |
J. Michael Peffer | |
| 7/1/15
1/1/16 7/1/16 8/1/16 4/1/17 |
| |
| 5,552
18,098 24,704 18,464 74,595 | (4)
(7) (4) (8) (5) | | $
$ $ $ $ | 89,720
292,464 399,217 298,378 1,205,455 |
| | | 111,337 | | | $ | 1,799,206 | |
Jeffrey Friedel | |
| 10/1/16
4/1/17 |
| |
| 21,563
68,606 | (6)
(5) | | $
$ | 348,458
1,108,673 |
| | | 102,398 | | | $ | 1,654,752 | |
(1) | The awards presented in these columns include earned unvested performance units and shares and unvested restricted stock units and shares (as of December 31, 2017). |
(2) | The market value is based on the December 31, 2017 closing price of our Common Stock of $16.16 per share. |
(3) | The awards presented in this column consist of unearned performance share awards (as of December 31, 2017) at target granted under the ELTIP and SIG on April 1, 2017. The performance period is January 1, 2017 through December 31, 2019. The ELTIP award vests at the end of the performance period following Compensation Committee certification of results. Up to 50% of the SIG award will vest on December 31, 2018 based on cumulative performance results for 2017 and 2018. Performance results will be measured again at the end of 2019 and the payout earned will be reduced by any awards that vested at the end of 2018, following Compensation Committee certification of performance results. |
(4) | These awards consist of earned unvested performance units and unvested restricted stock units reflecting equity awards granted prior to the spin-off (made with respect to shares of Xerox common stock), that were adjusted and converted into Conduent equity awards in shares of our Common Stock following Separation. In general, the adjusted and converted equity awards are subject to substantially the same terms and conditions as the original equity awards, including the original vesting schedule and pro-ration eligibility. Awards granted on July 1, 2015 vest on July 1 2018 and awards granted on July 1, 2016 vest on July 1, 2019. |
(5) | These awards represent restricted shares granted on April 1, 2017. On December 31, 2017, one-third of the April 1, 2017 restricted shares vested and are not reflected in the numbers above for our named executive offices as follows: Vemuri - 94,541, Webb-Walsh - 38,463, Amoriell - 36,742, Peffer - 36,742 and Friedel - 33,792. Half of the restricted shares reflected above will vest on December 31, 2018 and half on December 31, 2019. |
(6) | Represents restricted stock units which fully vest on October 1, 2019. |
(7) | Represents restricted stock units which fully vest on January 1, 2019. |
(8) | Represents restricted stock units which fully vest on August 1, 2019 |
| | | | | | | | | | | | | | | | | | | | |
| Name | Grant
Date | Grant
Type | Number of
Shares or
Units of Stock
That Have Not
Vested
(#) (1) | Market Value
of Shares or
Units of Stock
That Have Not
Vested
($) (2) | Equity
Incentive
Plan Awards:
Number of
Unearned
Shares, Units
or Other Rights
That Have Not
Vested
(#) (3) | Equity
Incentive Plan
Awards: Market
or Payout Value
of Unearned
Shares, Units
or Other Rights
That Have Not
Vested
($) (2) |
| Clifford Skelton | 4/1/2022 | PRSU— Share Hurdle | | | 433,264 | 1,581,414 |
| 4/1/2022 | RSU | 136,481 | 498,156 | | |
| 4/1/2023 | PRSU— Revenue Growth | | | 510,204 | 1,862,245 |
| 4/1/2023 | PRSU— rTSR | | | 254,169 | 927,717 |
| 4/1/2023 | RSU | 485,908 | 1,773,564 | | |
| Stephen Wood | 6/30/2021 | PRSU—Revenue Hurdle | | | 0 | 0 |
| 6/30/2021 | PRSU—Share Hurdle | | | 10,276 | 37,507 |
| 6/30/2021 | RSU | 6,111 | 22,305 | | |
| 4/1/2022 | PRSU—Share Hurdle | | | 117,236 | 427,911 |
| 4/1/2022 | RSU | 36,930 | 134,795 | | |
| 4/1/2023 | PRSU— Revenue Growth | | | 117,346 | 428,313 |
| 4/1/2023 | PRSU— rTSR | | | 58,458 | 213,372 |
| 4/1/2023 | RSU | 111,759 | 407,920 | | |
| Michael Krawitz | 4/1/2022 | PRSU— Share Hurdle | | | 101,944 | 372,096 |
| 4/1/2022 | RSU | 32,113 | 117,212 | | |
| 4/1/2023 | PRSU— Revenue Growth | | | 102,040 | 372,446 |
| 4/1/2023 | PRSU— rTSR | | | 50,833 | 185,540 |
| 4/1/2023 | RSU | 97,182 | 354,714 | | |
| Mark Prout | 4/1/2022 | PRSU—Share Hurdle | | | 76,458 | 279,072 |
| 4/1/2022 | RSU | 24,085 | 87,910 | | |
| 4/1/2023 | PRSU— Revenue Growth | | | 76,530 | 279,335 |
| 4/1/2023 | PRSU— rTSR | | | 38,125 | 139,156 |
| 4/1/2023 | RSU | 72,886 | 266,034 | | |
| Randall King | 4/1/2022 | PRSU— Share Hurdle | | | 40,777 | 148,836 |
| 4/1/2022 | RSU | 12,845 | 46,884 | | |
| 4/1/2023 | PRSU— Revenue Growth | | | 61,224 | 223,468 |
| 4/1/2023 | PRSU— rTSR | | | 30,500 | 111,325 |
| 4/1/2023 | RSU | 58,309 | 212,828 | | |
Mark King(4) | 4/1/2022 | PRSU— Share Hurdle | | | 30,583 | 111,628 |
| 4/1/2022 | RSU | 9,634 | 35,164 | | |
| 4/1/2023 | PRSU— Revenue Growth | | | 81,632 | 297,957 |
| 4/1/2023 | PRSU— rTSR | | | 40,667 | 148,435 |
| 4/1/2023 | RSU | 77,746 | 283,773 | | |
____________________
(1)The awards presented in this column include unvested RSUs and are scheduled to vest provided the service requirements are fulfilled, the April 1, 2022 RSUs vest as to their remaining shares on December 31, 2024; and the June 30, 2021 RSUs vest their remaining shares on June 30, 2023. (There are no earned unvested PRSU—Share Hurdle awards that have met the share price hurdle, as of December 31, 2023.)
(2)The market value is based on the December 29, 2023 closing price of our Common Stock of $3.65 per share.
(3)The awards presented in this column consist of unearned Performance Restricted Stock Unit awards (as of December 31, 2023) granted under the LTIP.
The April 1, 2023 PRSU—Revenue Hurdle and 2023 PRSU—rTSR awards included in this column are shown at the target performance level, and, are scheduled for vesting on December 31, 2025, after the conclusion of the measurement period.
The April 1, 2022 PRSU—Share Hurdle awards included in this column are all shares that have not met the share price hurdles as of December 31, 2023, and include 95.71% and 95.00% adjustments for the first and second tranches of the award, respectively, which both have met the time-based component and have been adjusted as a result of the rTSR performance for the period from April 1, 2022 through December 31, 2022 for the first tranche, and January 1, 2023 through December 31, 2023 for the second tranche, while the third tranche is recorded at 100% of granted shares, and will meet its time-based vesting component on December 31, 2024. Provided the share price hurdles and service conditions are met, the 2022 PRSU—Share Hurdles will vest by December 31, 2024.
The June 30, 2021 PRSU—Share Hurdle award included in this column had not met the share price hurdle as of December 31, 2023. The first and second tranches met the time-based component as of June 30, 2022 and June 30, 2023, respectively, and will vest upon achievement of the share price hurdle if achieved prior to June 30, 2024. The remaining third will vest on June 30, 2024, provided both the share price hurdle and time-based vesting components are met. The June 30, 2021 PRSU—Revenue Hurdle award is valued at zero in this column, as threshold Revenue performance for 2023 was not achieved.
(4)All outstanding equity awards were forfeited on Mr. Mark King’s termination of employment on January 2, 2024.
Option Exercises and Stock Vested in 2023
The following table shows the amount realized by named executive officers upon the vesting of stock awards during
2017. | | | | | | | | | | | | | | | | |
| | | Stock Awards | | | Option Awards | |
| Name | | Number of Shares
Acquired on Vesting (#) (A) | | | Value Realized
on Vesting ($) (B) | | | Number of Shares
Acquired on Exercise (#) (C) | | | Value Realized
on Exercise ($) (D) | |
Ashok Vemuri | | | 94,541 | | | $ | 1,527,783 | | | | - | | | | - | |
Brian Webb-Walsh | | | 48,306 | | | $ | 768,023 | | | | - | | | | - | |
David Amoriell | | | 54,829 | | | $ | 853,462 | | | | 103,172 | | | $ | 707,950 | |
J. Michael Peffer | | | 42,395 | | | $ | 674,922 | | | | - | | | | - | |
Jeffrey Friedel | | | 33,792 | | | $ | 546,079 | | | | - | | | | - | |
(A) | The shares shown in this column include performance shares that vested on January 1 and July 1, 2017 from awards granted by Xerox prior to Separation and converted to Conduent awards. This column also includes restricted shares that vested on December 31, 2017. |
(B) | 2023. | | | | | | | | | | Name | Number of
Shares
(#) (A) | Value Realized
on Vesting
($) (B) | | Clifford Skelton | 475,773 | 1,736,571 | | | Stephen Wood | 122,682 | 443,143 | | | Michael Krawitz | 98,405 | 359,178 | | | Mark Prout | 71,366 | 260,486 | | | Randall King | 94,748 | 334,299 | | | Mark King | 54,527 | 199,024 | |
____________________ (A)The shares shown in this column include: (i) RSUs that vested on June 30, 2023, September 30, 2023, and December 31, 2023; and (ii) PRSUs granted on June 30, 2020 of which 1/3 vested on June 30, 2023, based on achievement of share price hurdle. (B)Amounts shown are based on the number of shares that vested and the fair market value of our Common Stock on the applicable vesting date. The aggregate dollar value realized upon vesting includes the value of shares withheld to pay taxes. |
(C) | This column reflects the total number of shares acquired upon the exercise of vested stock options that were granted to Mr. Amoriell on August 20, 2009. |
(D) | The amount reflects the difference between the exercise price of the options and the market price at the time of exercise. |
NON-QUALIFIED DEFERRED COMPENSATION FOR THE 2017 FISCAL YEAR
The Non-Qualified Deferred Compensation table discloses executive and employer contributions, as applicable, named executive officer withdrawals and earnings, if any, and fiscal year-end balances under the Supplemental Savings Plan (“SSP”).
| | | | | | | | | | | | | | | | | | | | |
Name | | Plan Name | | Executive
Contributions
in Last FY
($) | | | Registrant
Contributions
in Last FY
($) | | Aggregate
Earnings in
Last FY
($) (A) | | | Aggregate
Withdrawals/
Distributions
($) | | | Aggregate
Balance
at Last FY
($) | |
Ashok Vemuri | | SSP | | | - | | | - | | | - | | | | - | | | | - | |
Brian Webb-Walsh | | SSP | | | - | | | - | | | - | | | | - | | | | - | |
David Amoriell | | SSP | | $ | 96,171 | | | - | | $ | 61,360 | | | | - | | | $ | 1,319,509 | |
J. Michael Peffer | | SSP | | $ | 7,308 | | | - | | $ | 8,121 | | | | - | | | $ | 69,974 | |
Jeffrey Friedel | | SSP | | | - | | | - | | | - | | | | - | | | | - | |
(A) | No portion of the amounts shown in this column for the SPP is reported in the “Summary Compensation Table” as above market interest. |
Supplemental Savings Plan
In 2017, Mr. Amoriell and Mr. Peffer elected to save in the SSP. Under the SSP, “highly compensated employees” (as defined under ERISA) were eligible to defer up to 85% of their base salary, bonus and
commissions. To participate, employees must elect to defer by December of the year preceding the year of the employee deferral. Notional earnings on participant contributions are credited to each participant’s account based on the number of shares that vested and the fair market ratevalue of returnour Common Stock on the applicable vesting dates. The aggregate dollar value realized upon vesting includes the value of the available investment alternatives offered under the SSP. Participants may change the asset allocationshares withheld to pay taxes.
Potential Payments Upon Termination or make changes to the allocation for future contributions at any time. Conduent may make discretionary employer contributions for plan participants; there were no Conduent contributions under this planChange in 2017. All balances are fully vested. In September 2017, Control
Conduent
terminated the Supplemental Savings Plan. As required under the plan, these balances will be paid in the fourth quarter of 2018.POTENTIAL PAYMENTS UPON TERMINATION OR CHANGE IN CONTROL
Conduent has entered into certain agreements and maintains certain plans that provide compensation to named executive officers in the event of a termination of employment or a change in control. The amount of compensation payable to each named executive officer, assuming that each hypothetical termination or change-in-control situation occurred on December 31, 2017,2023, is listed in the table below. The values for equity incentive awards presented in this table reflect the acceleration of grants not vested and settled as of December 31, 20172023 and are based on the closing market price of Conduent Common Stock of $16.16$3.65 as of December 29, 2017.
| | | | | | | | | | | | | | | | | | | | |
| | | Cash
Severance
($) | | | Non-
Equity
Incentive
Awards
($) | | | Equity
Incentive
Awards
($) | | | Healthcare/
Life
Insurance
Benefits
($) | | | Total
Termination
Benefits
($) | |
Ashok Vemuri | | | | | | | | | | | | | | | | | | | | |
• Voluntary Termination for Good Reason (A) | | | 500,000 | | | | 1,200,000 | | | | 3,899,133 | | | | - | | | | 5,599,133 | |
• Involuntary Termination not for Cause (B) | | | 500,000 | | | | 1,200,000 | | | | 3,899,133 | | | | 6,961 | | | | 5,606,094 | |
• Involuntary or Good Reason Termination after Change in Control (CIC) (C) | | | 5,000,000 | | | | 1,200,000 | | | | 10,375,447 | | | | 27,842 | | | | 16,603,289 | |
• Death (D) | | | - | | | | 1,200,000 | | | | 7,289,033 | | | | 500,000 | | | | 8,989,033 | |
| Brian Webb-Walsh | | | | | | | | | | | | | | | | | | | | |
• Voluntary Termination/ Retirement (A) | | | - | | | | - | | | | - | | | | - | | | | - | |
• Involuntary Termination not for Cause (B) | | | 225,000 | | | | 324,000 | | | | 958,837 | | | | 4,556 | | | | 1,512,393 | |
• Involuntary or Good Reason Termination after Change in Control (CIC) (C) | | | 1,575,000 | | | | 324,000 | | | | 3,772,794 | | | | 18,225 | | | | 5,690,019 | |
• Death (D) | | | - | | | | 324,000 | | | | 2,517,146 | | | | 450,000 | | | | 3,291,146 | |
| David Amoriell | | | | | | | | | | | | | | | | | | | | |
• Voluntary Termination/ Retirement (A) | | | - | | | | 361,800 | | | | 1,232,685 | | | | - | | | | 1,594,485 | |
• Involuntary Termination not for Cause (B) | | | 268,000 | | | | 361,800 | | | | 1,232,685 | | | | 4,991 | | | | 1,867,476 | |
• Involuntary or Good Reason Termination after Change in Control (CIC) (C) | | | 1,876,000 | | | | 361,800 | | | | 4,102,620 | | | | 18,594 | | | | 6,359,014 | |
• Death (D) | | | - | | | | 361,800 | | | | 2,903,160 | | | | 500,000 | | | | 3,764,960 | |
| J. Michael Peffer | | | | | | | | | | | | | | | | | | | | |
• Voluntary Termination/ Retirement (A) | | | - | | | | - | | | | - | | | | - | | | | - | |
• Involuntary Termination not for Cause (B) | | | 250,000 | | | | 337,500 | | | | 1,210,012 | | | | 4,607 | | | | 1,802,119 | |
• Involuntary or Good Reason Termination after Change in Control (CIC) (C) | | | 1,750,000 | | | | 337,500 | | | | 4,084,440 | | | | 18,428 | | | | 6,190,368 | |
• Death (D) | | | - | | | | 337,500 | | | | 2,884,980 | | | | 500,000 | | | | 3,722,480 | |
| Jeffrey Friedel | | | | | | | | | | | | | | | | | | | | |
• Voluntary Termination/ Retirement (A) | | | - | | | | | | | | - | | | | - | | | | - | |
• Involuntary Termination not for Cause (B) | | | 212,500 | | | | 243,250 | | | | 696,787 | | | | 6,893 | | | | 1,159,430 | |
• Involuntary or Good Reason Termination after Change in Control (CIC) (C) | | | 1,487,500 | | | | 243,250 | | | | 3,111,883 | | | | 26,474 | | | | 4,869,107 | |
• Death (D) | | | - | | | | 243,250 | | | | 2,008,720 | | | | 425,000 | | | | 2,676,970 | |
(A) | None of these individuals would receive any payments if they left voluntarily, other than Mr. Vemuri and Mr. Amoriell. Per his offer letter, if Mr. Vemuri voluntarily terminated his employment for Good Reason, he would be entitled to salary continuation paid over 6 months equal to his annual base salary. In addition, Mr. Vemuri would receive a short-term incentive payment (Non-Equity Incentive Award) for 2017 performance, reflected above at actual achievement against performance goals, and pro-rated restricted stock and performance shares (based on the number of full months of service as an employee during the vesting period per the terms of the applicable award agreements) shown at target but subject to actual performance achievement for unearned performance based awards. If Mr. Vemuri left voluntarily not for Good Reason, he would not receive any payments. Mr. Amoriell is retirement eligible under our short-term and long-term incentive award programs and would receive a short-term incentive payment (Non-Equity Incentive Award) for 2017 performance, reflected above at actual achievement against performance goals, and pro-rated restricted stock and performance shares (based on the number of full months of service as an employee during the vesting period per the applicable award agreements), shown at target but subject to actual performance achievement. |
Long-term | | | | | | | | | | | |
| Named Executive Officer | Involuntary
Termination Not
for Cause
(A) | Involuntary Termination Not for Cause or Termination for Good Reason, after Change in Control (B) | Death &
Disability
(C) |
| Clifford Skelton | | | |
| • Cash Severance ($) | 835,000 | | 5,218,750 | | - | |
| • Non-Equity Incentive Awards ($) | 638,775 | | 638,775 | | 638,775 | |
| • Equity Incentive Awards ($) | 4,826,324 | | 6,693,629 | | 6,643,094 | |
| • Healthcare Benefits ($) | - | | - | | - | |
| Clifford Skelton Total Termination Benefits ($) | 6,300,099 | | 12,551,154 | | 7,281,869 | |
| Stephen Wood | | | |
| • Cash Severance ($) | 525,000 | | 1,890,000 | | - | |
| • Non-Equity Incentive Awards ($) | 224,910 | | 224,910 | | 224,910 | |
| • Equity Incentive Awards ($) | 1,254,265 | | 1,696,951 | | 1,672,122 | |
| • Healthcare Benefits ($) | 32,438 | | 32,438 | | - | |
| Stephen Wood Total Termination Benefits ($) | 2,036,613 | | 3,844,299 | | 1,897,032 | |
| Michael Krawitz | | | |
| • Cash Severance ($) | 500,000 | | 1,750,000 | | - | |
| • Non-Equity Incentive Awards ($) | 200,813 | | 200,813 | | 200,813 | |
| • Equity Incentive Awards ($) | 1,038,657 | | 1,413,901 | | 1,402,009 | |
| • Healthcare Benefits ($) | 12,021 | | 12,021 | | - | |
| Michael Krawitz Total Termination Benefits ($) | 1,751,491 | | 3,376,735 | | 1,602,822 | |
| Mark Prout | | | |
| • Cash Severance ($) | 450,000 | | 1,575,000 | | - | |
| • Non-Equity Incentive Awards ($) | 180,731 | | 180,731 | | 180,731 | |
| • Equity Incentive Awards ($) | 778,992 | | 1,060,424 | | 1,051,506 | |
| • Healthcare Benefits ($) | 31,522 | | 31,522 | | - | |
| Mark Prout Total Termination Benefits ($) | 1,441,245 | | 2,847,677 | | 1,232,237 | |
| Randall King | | | |
| • Cash Severance ($) | 450,000 | | 1,575,000 | | - | |
| • Non-Equity Incentive Awards ($) | 137,700 | | 137,700 | | 137,700 | |
| • Equity Incentive Awards ($) | 525,327 | | 748,097 | | 743,341 | |
| • Healthcare Benefits $) | 33,434 | | 33,434 | | - | |
| Randall King Total Termination Benefits ($) | 1,146,461 | | 2,494,231 | | 881,041 | |
____________________
(A)Each of our named executive officers, under the terms of the Conduent U.S. Executive Severance Policy, would receive salary continuation payments, continued benefits coverage (excluding disability and 401(k) contributions) and continued long-term incentive vesting for 52 weeks. The amounts reported in the table assume salary continuation is paid as a lump sum, although such payments are generally paid in installments consistent with the normal payroll cycle.
In addition, all named executive officers would receive a short-term incentive payment (Non-Equity Incentive Award) for 2023 performance, reflected above at actual achievement against performance goals, inclusive of adjustments for individual contributions and performance results for the executive’s function or business unit.
For the equity incentive awards, pursuant to the terms of the grant agreements and short-term incentivethe U.S. Executive Severance Policy approved on May 24, 2022, the NEOs would be entitled to receive continued vesting through a 52-week severance period, including corresponding vesting of restricted stock units, and performance based restricted stock units (based on the number of full months included during the severance period), with the number of performance stock units earned based on actual performance achievement. The number of 2022 PRSU—Share Hurdle awards reflect 100 percent achievement of share hurdles, with rTSR adjustments of 95.71% and 95% for the first and second tranches based on actual achievement, respectively, with the third tranche at 100%. The 2023 PRSU—Revenue Growth and 2023 PRSU—rTSR awards are subject to clawback provisions as describedestimated in the “Governancetable at 100% of the Executive Compensation Programs—Compensation Recovery Policy (Clawbacks)” sectiontarget.
(B)If there was a change in the CD&A.(B) | Under the terms of the Conduent severance policy, all the NEOs would receive salary continuance payments and continued benefits coverage (excluding disability and 401(k) contributions) for 26 weeks. The amounts reported in the table assume salary continuance is paid as a lump sum, although such payments are generally paid periodically consistent with the normal payroll cycle during active employment. In addition, allcontrol on December 31, 2023, our named executive officers would receive a short-term incentive payment (Non-Equity Incentive Award) for 2017 performance, reflected above at actual achievement against performance goals, and pro-rated restricted stock and performance shares (based on the number of full months of service as an employee and full months of salary continuance payments during the vesting period per the applicable award agreements), shown at target but subject to actual performance achievement. |
(C) | If there was a change in control on December 31, 2017, Mr. Amoriell and Mr. Friedel would have been covered under the new Change-in-Control (“CIC”) Plan as described in the CD&A, which provides them specified severance benefits if, within 90 days prior to, or within 12 months following a change in control of Conduent, employment was terminated either involuntarily other than for cause, death or disability, or voluntarily for good reason. These benefits under the CIC Plan include a lump sum cash payment equal to two times the then-current annual base salary and short-term incentive award target, as well as continuation of specified welfare benefits at active employee rates for a period of 24 months. |
Mr. Vemuri, Mr. Webb-Walsh and Mr. Peffer would have been covered under the prior change in controlChange-in-Control Plan (“
CIC Plan”) with severance agreementperiod multiples as described below, which providedprovides them specified severance benefits if, within two years90 days prior to, or within 12 months (or, for our CEO, 24 months) following a change in control of Conduent, their employment was terminated either involuntarily other than for cause, death or disability, or voluntarily for good reason. These benefits under the priorThis arrangement whereby change in control severance agreements includedbenefits are provided only upon a qualifying termination event following a change in control is commonly described as “double-trigger.” Change in control severance benefits for these named executive officers include:
•A lump sum cash payment equal to two and one-half times the then-current annual base salary and short-term incentive award target for Mr. Skelton;
•A lump sum cash payment equal to two times the then-current annual base salary and short-term incentive award target as well as continuationfor Messrs. Wood, Krawitz, Prout, and Randall King;
•Continuation of specified welfare benefits at active employee rates for a period of 24 months.Change in control severance benefitsmonths for all named executive officers include:
Payment of reasonable legal feesMessrs. Skelton, Wood, Krawitz, Prout and expenses incurred when the named executive officer, in good faith, is involved in a dispute while seeking to enforce the benefitsRandall King; and rights provided by the severance agreement.
•Pursuant to the terms of the applicable agreements, upon involuntary or good reason termination, these executives would also be entitled to: (i) accelerated vesting of stock awards, including performance sharesrestricted stock units at target which will occur following a change in control only upon an involuntary termination of employment (other than a termination for cause) or a voluntary termination for good reason (commonly described as “double-trigger”); and (ii) a short-term incentive (Non-Equity Incentive Award) payment for the 20172023 performance, reflected above at actual achievement against performance goals.
If excise tax is payable by any of the named executives, Conduent will reduce the named executive officer’s payments under the CIC paymentPlan to a level that will not trigger an excise tax payment if it is determined that doing so will result in a greater net after-tax amount for the executive.
All named executive officers fall under the CIC Plan as of January 1, 2018.
(D) | Following death, the estates or, with respect to certain types of payments and elections made, the spouses of all named executive officers would receive payment of a 2017 short-term incentive payment shown at actual achievement against performance goals; performance shares at target for awards prior to January 1, 2017 and pro-rated performance shares for awards on or after January 1, 2017 (based on the number of full months of service as an employee during the vesting period per the applicable award agreement, subject to actual performance achievement); accelerated vesting of restricted stock; their deferred compensation balance, if any; and a life insurance benefit. |
(C)Termination Following DisabilityAssuming termination following disability or death on December 31, 2017, all2023 would entitle the named executive officers would be eligible for pro-ratedofficer or his estate or, with respect to certain types of payments and elections made, his designated beneficiaries to receive a 2023 short-term incentive payment shown at actual achievement against performance shares (based on the numbergoals; full vesting of full months of service as an employee during the vesting period)PRSUs, estimated here at 100%, subject to actual performance achievement; including full 2023 PRSU—Revenue Growth and 2023 PRSU—rTSR awards shown at target, subject to performance conditions, scheduled to vest on December 31, 2025; 2022 —Share Hurdle awards subject to achievement prorated restricted stock for awardsof the share price hurdles prior to January 1, 2017December 31, 2024 and accelerated vestingas modified for results of restricted stockrTSR modifiers; for awards on or after January 1, 2017, per the terms of the applicable awards agreements. Mr. Vemuri would also be entitled to a $500,000 cash severance payment as shown under “Involuntary Termination Not for Cause.”
tranche one and tranche two at 95.71% and 95%, respectively.
Involuntary Termination for Cause
Assuming involuntary termination for cause due to
certain conditions, including engagement in detrimental activity against Conduent, there would be no payments to the named executive
officers other than their deferred compensation balance, if any.officers. All unvested shares would be immediately cancelled upon termination for cause. See the “Governance of the Executive Compensation Programs—Compensation
RecoveryRecoupment Policy (Clawbacks)” section of the CD&A for additional information.
Change-in-Control Severance Agreement
Definitions Under the CIC Plan
Generally, for purposes of
change-in-control severance agreements and the CIC Plan, a change in control is deemed to have occurred, subject to specific exceptions, if:
•Any person becomes a beneficial owner representing 50 percent or more of the combined voting power of the outstanding securities of Conduent.Conduent;
•A majority of the Conduent Board is replaced under specific circumstances.circumstances;
•There is a merger or consolidation involving Conduent unless (i) the directors of Conduent who were members of the Board immediately before the merger/consolidation continue to constitute a majority of the Conduent Board of Directors or (ii) the merger/consolidation is effectedaffected to implement a recapitalization and no person becomes the beneficial owner representing 50 percent or more of the combined voting power of Conduent’s then outstanding voting securities.securities; or
•All or substantially all of Conduent’s assets are sold, or Conduent’s shareholders approve a plan of complete liquidation or dissolution.
A
Under the CIC Plan, a voluntary termination for good reason in the event of a change in control includes:
•The material diminution of authority, duties or responsibilities, including being an executive officer of Conduent before a change in control and ceasing to be an executive officer of the surviving company. The change-in-control benefits for this provision will only be triggered if the executive officer has not voluntarily terminated his/her employment and the “material diminution of authority, duties, or responsibilities” has occurred and not been remedied.remedied;
•A material reduction in annual base salary, annual target short-term incentive or employee benefits in the aggregate, except to the extent such reduction is consistent with an across-the-board reduction for employees.employees;
•A material change in the geographic location where the executive is required to be based.based; or
•Failure of Conduent to obtain a satisfactory agreement from any successor to assume and agree to perform in a manner consistent with the change in control agreement.
EQUITY COMPENSATION PLAN INFORMATION
Equity Compensation Plan Information
The following table summarizes information with respect to equity awards under Conduent’s equity compensation plans as of December 31,
2017: | | | | | | | | | | | | |
Plan Category | | (A) Number of Securities to be Issued Upon
Exercise of
Outstanding
Options, Warrants
and Rights(1) | | | (B) Weighted Average Exercise Price of Outstanding
Options, Warrants
and Rights(1) | | | (C) Number of Securities
Available for Future
Issuance Under Equity Compensation Plans
(Excluding Securities
Reflected in Column (A))(2) | |
Equity compensation plans approved by security holders | | | 3,693,025 | | | $ | 10.35 | | | | 15,302,004 | |
Equity compensation plans not approved by security holders | | | - | | | $ | - | | | | - | |
Total | | | 3,693,025 | | | $ | 10.35 | | | | 15,302,004 | |
(1) | Column (A) includes: (i) 1,356,444 shares underlying outstanding RSUs and 1,911,138 shares underlying outstanding performance shares under the Conduent Performance Incentive Plan (of which 1,306,154 RSUs and 1,859,854 performance shares represent outstanding awards granted by Xerox and converted to Conduent awards following Separation); (ii) 77,496 deferred stock units (“DSUs”) outstanding under the Conduent Director Equity Plan; and (iii) 347,947 shares underlying options under the 2007 ACS Plan. Because there is no exercise price associated with performance shares, RSUs or DSUs, these stock awards are not included in the weighted-average exercise price calculation presented in column (B). |
(2) | The 2007 ACS Plan was discontinued as of February 5, 2010. No further grants can be made under this plan. Any shares that are cancelled, forfeited or lapse under the Conduent Performance Incentive Plan become available again for issuance under this plan. Any shares that are cancelled, forfeited or lapse under the Conduent Director Equity Plan become available again for issuance under this Director plan. |
2023:
| | | | | | | | | | | |
| Plan Category | (A)
Number of Securities
to be Issued Upon
Exercise of
Outstanding
Options, Warrants
and Rights(1) | (B)
Weighted Average
Exercise Price of
Outstanding
Options, Warrants
and Rights(1) | (C)
Number of Securities
Available for Future
Issuance Under Equity
Compensation Plans
(Excluding Securities
Reflected in Column (A))(2) |
| Equity compensation plans approved by security holders | 12,673,184 | - | 14,284,266 |
| Equity compensation plans not approved by security holders | - | - | - |
| Total | 12,673,184 | - | 14,284,266 |
____________________
(1)Column (A) includes (i) 4,140,056 shares underlying outstanding restricted stock units; 5,013,214 shares of outstanding performance restricted stock units, and the following shares earmarked for maximum performance: 82,882 shares related to 2021 PRSU—Revenue Hurdle share performance, 93,287 shares related to 2022 PRSU—Share Hurdle awards, 1,963,547 shares for 2023 PRSU—Revenue Growth awards and 489,079 shares for 2023 PRSU—rTSR awards, all granted under the Conduent Performance Incentive Plan and awarded under the Conduent Inc. 2021 Performance Incentive Plan; and (ii) 891,119 shares underlying outstanding DSUs awarded under the Conduent Director Equity Plan and the Conduent Inc. 2021 Performance Incentive Plan. There is no exercise price associated with performance stock units, restricted stock units, performance restricted stock units or DSUs, and because we do not have any options outstanding, there is no weighted-average exercise price calculation in column (B).
(2)Any shares that are cancelled, forfeited, withheld for taxes, or lapse under the Conduent Performance Incentive Plan, Conduent Director Equity Plan or the Conduent Inc. 2021 Performance Incentive Plan become available again for issuance under the Conduent Inc. 2021 Performance Incentive Plan. Shares earmarked for maximum performance on December 31, 2023 are excluded from the total available.
CEO Pay Ratio Disclosure
For 2017,
To determine the
median of2023 CEO Pay Ratio, we used the
annualamount reported in the Total column in the 2023 Summary Compensation Table for our CEO total compensation of
all employees$6,473,771 and the 2023 compensation for our median associate of
our company (other than our CEO), was $33,040. The 2017 annual$32,396, as calculated using 2023 payroll data in a similar manner. Based on these total compensation
of our CEO was $11,829,474, as reported in the “Total” column of the “Summary Compensation Table” included above in this Proxy Statement. Based on this information,numbers, we estimate the ratio of the annual total compensation of our CEO to the median of the annual total compensation of all
employeesof our associates for
20172023 was
358:200:1. This represents a reasonable estimate, calculated in a manner consistent with SEC regulations.
We ascertained that,
Our median associate was identified in 2022, and as our associate population from 2022 to 2023 has remained relatively consistent, we have used the same median associate for 2023.
The methodology to determine our median associate in 2022 included examining our total associate population, as of
ourthe December 31,
20172022 determination
date, ourdate. The total
employeeassociate population
in 2022 consisted of
90,511 employees.approximately 62,000 associates. As is permitted under the SEC rules, we excluded
employeesassociates from
the following countries: Germany
(2,079 employees)(1,118 associates) and Turkey
(1,521 employees)(481 associates), which
representrepresented less than 5% of our total
employee population.associate population as of the determination date. We then determined our “median
employee”associate” using the remaining
employee population of 86,911.associate population.
We chose to use annual base compensation as our consistently applied compensation measure to determine our “median employee”.associate.” We determined annual base compensation for our salaried employeesassociates using base salary paid for 2017.paid. We determined annual base compensation for our hourly paid employeesassociates by multiplying the hourly rate by the scheduled hours for the year. We annualized the compensation of all permanent employeesassociates in our population who were hired in 2017 but did not work for us the entire year. Once we identified our median employee,associate, we determined that person’s annual total compensation in accordance with the requirements of the Summary Compensation Table.
Additional Information
Our CEO received a one-time special stock award (the Strategic Initiative Grant,
Definitions
Net ARR Activity: Projected Annual Recurring Revenue for contracts signed in the prior 12 months, less the annualized impact of any client losses, contractual volume and price changes, and other known impacts for which the company was notified in that same time period, which could positively or “SIG”) as partnegatively impact results. The metric annualizes the net impact to revenue. Timing of revenue impact varies and may not be realized within the Separation.forward 12-month timeframe. The metric is for indicative purposes only. This one-time awardmetric excludes COVID-related volume impacts and non-recurring revenue signings. This metric is not partindicative of the CEO’s ongoing compensation program and is likely not reflective of our pay ratio for subsequent years.If we exclude the SIG award, the ratio of the annual total compensation of our CEO to the median of the annual total compensation of all employees for 2017 would be 213:1. We believe that this ratio is a useful way to better understand how our Compensation Committee and our Board of Directors view the compensation of our CEO and should be viewed as a supplement to, and not as a replacement of, the required pay ratio disclosure included in this section.
OTHER INFORMATION
Indemnification Actions
The Company’s by-laws provide for indemnification of officers and directors to the fullest extent permitted by New York law. The Company has not advanced any counsel fees or other reasonable fees and expenses to any officer or director under our by-laws. In accordance with the requirements of the Business Corporation Law of the State of New York (the “BCL”), in the event the Company advances counsel fees or other reasonable fees and expenses, the individuals on whose behalf any such expenditures are made are required to execute an undertaking to repay such expenses if they are finally found not to be entitled to indemnification under the Company’s by-laws or the BCL.
Directors and Officers Liability Insurance and Indemnity
On January 1, 2018, the Company renewed its policies for directors and officers liability insurance. The policies are issued by Federal Insurance Company, XL Specialty Insurance Company, Travelers Casualty and Surety Company of America, Twin City Fire Insurance Company, U.S. Specialty Insurance Company, Arch Insurance Company, ACE American Insurance Company, Marsh Alpha (Lloyd’s of London), Allied World Assurance Company Ltd, Axis Insurance Company and Illinois National Insurance Company. The policies expire June 18, 2018, and the total annual premium is approximately $1,288,060.
NON-GAAP FINANCIAL MEASURES
specific 12-month timeframe.
Non-GAAP Financial Measures
We have reported our financial results in accordance with U.S. GAAP. In addition, we have discussed our results using non-GAAP measures.
We believe these non-GAAP measures allow investors to better understand the trends in our business and to better understand and compare our results. Accordingly, we believe it is necessary to adjust several reported amounts, determined in accordance with
U.S. GAAP, to exclude the effects of certain items as well as their related tax effects. Management believes that these non-GAAP financial measures provide an additional means of analyzing the
results of the current
periods’ resultsperiod against the corresponding prior
periods’ results.period. However, these non-GAAP financial measures should be viewed in addition to, and not as a substitute for, the Company’s reported results prepared in accordance with U.S. GAAP. Our non-GAAP financial measures are not meant to be considered in isolation or as a substitute for comparable U.S. GAAP measures and should be read only in conjunction with our Consolidated Financial Statements prepared in accordance with U.S. GAAP. Our management regularly uses our
supplemental non-GAAP financial measures internally to understand, manage and evaluate our business and make operating decisions, and providing such non-GAAP financial measures to investors allows for a further level of transparency as to how management reviews and evaluates our business results and trends. These non-GAAP measures are among the primary factors management uses in planning for and forecasting future periods. Compensation of our executives is based in part on the performance of our business based on
thesecertain non-GAAP measures.
A reconciliation of the non-GAAP financial measures to the most directly comparable financial measures calculated and presented in accordance with GAAP
isare provided below.
These reconciliations also include the income tax effects for our non-GAAP performance measures in total, to the extent applicable. The income tax effects are calculated under the same accounting principles as applied to our reported pre-tax performance measures under ASCAccounting Standards Codification 740, which employs an
annual effective tax rate method. The noted income tax effect for our non-GAAP performance measures is effectively the difference in
income taxes for reported and adjusted pre-tax income calculated under the annual effective tax rate method. The tax effect of the non-GAAP adjustments was calculated based upon evaluation of the statutory tax treatment and the applicable statutory tax rate in the jurisdictions in which such charges were incurred.
Adjusted
Net Income (Loss)Revenue
We make adjustments to
Income (Loss) before Income Taxesrevenue for the following items,
for the purpose of calculating Adjusted Net Income (Loss):Amortization of intangible assets. The amortization of intangible assets is driven by acquisition activity, which can vary in size, nature and timing as compared to other companies within our industry from period to period.
Restructuring and related costs. Restructuring and related costs include restructuring and asset impairment charges as well as costs associated with our strategic transformation program.
Separation costs. Separation costs are expenses incurred in connection with the separation from Xerox Corporation into a separate, independent, publicly traded company. These costs primarily relate to third-party investment banking, accounting, legal, consulting and other similar types of services related to the separation transaction as well as costs associated with the operational separation of the two companies.
Other (income) expenses, net. Other (income) expenses, net includes currency (gains) losses, net, litigation matters and all other (income) expenses, net.
NY Medicaid Management Information System (NY MMIS). Costs associated with the company not fully completing the State of New York Health Enterprise platform project.
Health Enterprise (HE charge). Cost associated with not fully completing the Health Enterprise Medical platform implementation projects in California and Montana.
(Gain) loss on sale of asset and businesses.
The Company provides adjusted net income and adjusted EPS financial measures to assist our investors in evaluating our ongoing operating performance for the current reporting period and, where provided, over different reporting periods, by adjusting for certain items which may be recurring or non-recurring and which in our view do not necessarily reflect ongoing performance. We also internally use these measures to assess our operating performance, both absolutely and in comparison to other companies, and in evaluating or making selected compensation decisions.
Adjusted EBITDA
We use Adjusted EBITDA as an additional way of assessing certain aspects of our operations that, when viewed with the U.S. GAAP results and the accompanying reconciliations to corresponding GAAP financial measures, provide a more complete understanding of our on-going business:
•Divestitures. Revenue from divestitures, of which there were none in 2023.
•Effect of currency changes. To better understand trends in our business, we believe that it is helpful to adjust revenue to exclude the impact of changes in the translation of foreign currencies into U.S. Dollars.
We provide our investors with adjusted revenue as supplemental information because we believe it offers added insight, by itself and for comparability between periods, by adjusting for certain non-cash items as well as certain other identified items which we do not believe are indicative of our ongoing business, and may also provide added insight on trends in our ongoing business.
We provide adjusted revenues as supplemental information to our presentation of reported GAAP revenue in order to facilitate additional information to our investors concerning period-to-period comparisons reflecting the impact of our divestitures.
Adjusted EBITDA and EBITDA Margin
We use Adjusted EBITDA and Adjusted EBITDA Margin as an additional way of assessing certain aspects of our operations that, when viewed with the U.S. GAAP results and the accompanying reconciliations to corresponding U.S. GAAP financial measures, provide a more complete understanding of our on-going business. Adjusted EBITDA represents income (loss) before interest, income taxes, depreciation and amortization
and contract inducement amortization adjusted for the following
items:items. Adjusted EBITDA margin is Adjusted EBITDA divided by revenue or adjusted revenue, as applicable. •Restructuring and related costs. Restructuring and related costs include restructuring and asset impairment charges as well as costs associated with our strategic transformation program.
Separation•Goodwill impairment. This represents goodwill impairment charges related to entering into the agreement to transfer the BenefitWallet portfolio.
•(Gain) loss on divestitures and transaction costs. Represents (gain) loss on divested businesses and transaction costs.
•Litigation settlements (recoveries), net. Represents settlements or recoveries for various matters subject to litigation.
•Other charges (credits). This includes Other (income) expenses, net.
NY MMIS.
HE charge.
(Gain) lossnet on salethe Consolidated Statements of assetIncome (Loss) and businesses.other insignificant (income) expenses and other adjustments.
•Divestitures.
Adjusted EBITDA is not intended to represent cash flows from operations, operating income (loss) or net income (loss) as defined by U.S. GAAP as indicators of operating performances. Management cautions that amounts presented in accordance with Conduent’s definition of Adjusted EBITDA and Adjusted EBITDA margin may not be comparable to similar measures disclosed by other companies because not all companies calculate Adjusted EBITDA and Adjusted EBITDA margin in the same manner.
Free Cash Flow
Free Cash Flow
Non-GAAP Reconciliations
Adjusted Revenue and Adjusted EBITDA Reconciliations:
| | | | | |
| (in millions) | December 31, 2023 |
| Reconciliation to Adjusted Revenue | |
| Revenue | $ | 3,722 | |
| Divestitures | 0 | |
| Adjusted Revenue | $ | 3,722 | |
Effect of currency changes(1) | (11) | |
| Adjusted Revenue at Constant Currency | $ | 3,711 | |
| |
| Reconciliation to Adjusted EBITDA | |
| Net Income (Loss) from Continuing Operations | $ | (296) | |
| Interest Expense | 111 | |
| Income tax expense (benefit) | (36) | |
| Depreciation and amortization | 264 | |
| Contract inducement amortization | 3 | |
| EBITDA - Before Adjustment for Divestitures | 46 | |
| Divestitures | — | |
| EBITDA | $ | 46 | |
| EBITDA Margin | 1.2 | % |
| EBITDA | $ | 46 | |
| Adjustments: | |
| Restructuring | 62 | |
| Goodwill impairment | 287 | |
| (Gain) loss on divestitures and transaction costs | 10 | |
| Litigation settlements (recoveries), net | (30) | |
| |
| |
| Other charges (credits) | 3 | |
| Adjusted EBITDA | $ | 378 | |
| Adjusted EBITDA Margin | 10.2 | % |
____________________
(1)Reflects effect of currency changes.
PAY VERSUS PERFORMANCE DISCLOSURE
Provided below is definedthe Company’s “pay versus performance” disclosure as cash flowsrequired pursuant to Item 402(v) of Regulation S-K promulgated under the Exchange Act.As required by Item 402(v), we have included:
a.A list of the most important measures that our Compensation Committee used in 2023 to link compensation calculated in accordance with Item 402(v) (referred to as “compensation actually paid,” or “CAP”) to Company performance;
b.A table that compares the total compensation of our named executive officers (“NEOs”) as presented in the Summary Compensation Table (“SCT”) to CAP and that compares CAP to specified performance measures; and
c.Graphs that describe:
i.the relationship between our total shareholder return (“TSR”) and the TSR of the S&P 500 Data Processing & Outsource Services Index (“Peer Group TSR”); and
ii.the relationships between CAP and our cumulative TSR, GAAP Net Income, and our Company- Selected measure (“CSM”), Revenue
This disclosure has been prepared in accordance with Item 402(v) and does not necessarily reflect value actually realized by the executives or how our Committee evaluates compensation decisions in light of Company or individual performance. In particular, our Committee has not used CAP as a basis for making compensation decisions, nor does it use GAAP Net Income for purposes of determining incentive compensation. Please refer to our Compensation Discussion and Analysis beginning on page 26 for a discussion of our executive compensation program objectives and the ways in which we align executive compensation pay with performance.
Performance Measures Used for Linking Pay versus Performance
The following is a list of performance measures, which, in our assessment, represent the most important performance measures used by the Company to link compensation actually paid to the NEOs to Company performance. Each metric below is used for purposes of determining payouts under either our APIP or PRSUs. Please see the CD&A for a further description of these metrics and how they are used in the Company’s executive compensation program.Relative TSR and Revenue Growth are measures in our 2023 PRSU awards, and Revenue, Adjusted EBITDA Margin, and Net ARR Activity are used as metrics in our 2023 APIP. (Please see “Definitions” on page 51 of this Proxy Statement for full definitions.)
| | | | | |
| Performance Measures Linking Pay versus Performance |
| Adjusted EBITDA Margin | Relative TSR |
| Net ARR Activity | Revenue |
| |
Pay Versus Performance Table
Below is the tabular disclosure for the Company’s Chief Executive Officer, our Principal Executive Officer (“PEO”), and the average of our NEOs other than the PEO for 2023, 2022, 2021 and 2020.
| | | | | | | | | | | | | | | | | | | | | | | | | | |
| (a) | (b) | (c) | (d) | (e) | (f) | (g) | (h) | (i) |
| Year | SCT Total Compensation for PEO ($) | Compensation Actually Paid to PEO ($) | Average SCT Total Compensation for Non-PEO NEOs ($) | Average Compensation Actually Paid to Non-PEO NEOs ($) | Value of Initial Fixed $100 Investment Based On: | GAAP Net Income (in Millions) | CSM: Revenue
(in Millions) |
| Total Shareholder Return ($) | Peer Group Total Shareholder Return(1)($) |
| 2023 | 6,473,771 | 5,550,137 | 1,486,085 | 1,345,749 | 59 | | 155 | | (296) | | 3,722 | |
| 2022 | 5,865,878 | 2,009,495 | 1,560,266 | 871,985 | 65 | | 100 | | (182) | | 3,858 | |
| 2021 | 6,078,061 | 6,206,311 | 1,379,302 | 795,496 | 86 | | 120 | | (28) | | 4,140 | |
| 2020 | 4,973,649 | 10,153,839 | 1,632,025 | 2,934,397 | 77 | | 125 | | (118) | | 4,163 | |
a. Performance year
b.Reflects the compensation amounts reported in the Summary Compensation Table for our CEO, Mr. Skelton, for each of the respective years shown.
c.CAP to our CEO is computed in accordance with SEC rules. The dollar amounts do not reflect the actual amount of compensation earned by or paid during the applicable year. In accordance with SEC rules, a reconciliation from operating activitiesSCT total compensation to CAP for Mr. Skelton is set forth following the footnotes to this table.
d.For 2023, other NEOs are Messrs. Wood, Krawitz, Prout, Randall King and Mark King. For 2022, other NEOs are Messrs. Wood, Krawitz, Prout, and Louis Keyes; for 2021, other NEOs are Messrs. Wood, Krawitz, Prout, Louis Keyes, and Brian Webb-Walsh; for 2020, other NEOs are Messrs. Brian Webb-Walsh, Krawitz, Prout, and Louis Keyes
e.Average CAP to our other NEOs is computed in accordance with SEC rules. The dollar amounts do not reflect the actual amount of compensation earned by or paid during the applicable year. In accordance with SEC rules, a reconciliation from SCT total compensation to CAP for the average of the other NEOs is set forth following the footnotes to this table.
f.Represents the cumulative total shareholder return (TSR) of Conduent for an initial investment of $100 on December 31, 2019 through and including the end of the fiscal year for each row in the table.
g.Represents the cumulative total shareholder return (TSR) of the S&P 500 Data Processing & Outsource Services Index, which is an industry line peer group reported in the performance graph included in the Company’s 2023 Annual Report on Form 10-K, for an initial investment of $100 on December 31, 2019 through and including the end of the fiscal year for each row in the table.
h.Conduent’s GAAP Net Income as reported in the Company’s Consolidated Statements of Income on Form 10-K for each fiscal year in the consolidated statementtable
i.Conduent’s Revenue, which is the Company-Selected Measure.
Reconciliation from SCT Total Compensation to CAP
| | | | | | | | | | | | | | | | | | | | | | | | | | |
| Year | SCT Total Compensation | Less SCT Equity | Plus (minus) Year End Fair Value of Equity Awards Granted During Fiscal Year that are Outstanding and Unvested at End of the Year | Plus (minus) Year over Year Change in Fair Value of Outstanding Unvested Equity Awards Granted in Prior Years | Plus (minus) Fair Value as of Vesting Date of Equity Awards Granted and Vested in the Year | Plus (minus) Change in Fair Value as of the Vesting Date of Equity Awards Granted in Prior Fiscal Years that Vested in the Fiscal Year | Plus (minus) Fair Value at the End of the Prior Year of Equity Awards that were Forfeited in the Year | Compensation Actually Paid (CAP) |
| PEO |
| 2023 | 6,473,771 | | (4,999,996) | | 3,956,560 | | (446,558) | | 886,782 | | (93,128) | | (227,294) | | 5,550,137 | |
| 2022 | 5,865,878 | | (4,249,995) | | 1,896,875 | | (750,008) | | 552,744 | | (1,305,999) | | — | | 2,009,495 | |
| 2021 | 6,078,061 | | (3,999,993) | | 2,139,147 | | 512,747 | | 838,551 | | 637,798 | | — | | 6,206,311 | |
| 2020 | 4,973,649 | | (2,999,999) | | 5,926,239 | | (316,315) | | 3,018,696 | | (448,431) | | — | | 10,153,839 | |
| Average for non-PEO NEOs |
| 2023 | 1,486,085 | | (859,995) | | 698,403 | | (84,548) | | 152,525 | | (21,859) | | (24,863) | | 1,345,749 | |
| 2022 | 1,560,266 | | (849,995) | | 379,375 | | (135,079) | | 110,547 | | (193,129) | | — | | 871,985 | |
| 2021 | 1,379,302 | | (631,987) | | 242,190 | | 63,611 | | 80,082 | | 58,662 | | (396,364) | | 795,496 | |
| 2020 | 1,632,025 | | (677,498) | | 1,338,334 | | (16,283) | | 681,725 | | (23,906) | | — | | 2,934,397 | |
The unvested equity values in the above table are computed in accordance with the methodology used for financial reporting purposes. The fair value of additionstime-based restricted stock units and PRSU—Revenue Hurdle awards used to land, buildingscalculate CAP was based on Conduent’s closing stock price on each valuation date and, equipment, costfor PRSU—Revenue Hurdle awards, assumes estimated performance results as of additionsthe end of each reporting year. The fair value of PRSU—Share Hurdle awards used to internal use software, vendor financed capital lease additionscalculate CAP was based on Conduent’s fair value per share on each valuation date and proceedsassumes estimated performance results as of the end of each reporting year.
Columns for dividends and pensions are excluded from salesthe above, as they are not provided by Conduent.
Relationship between Company TSR and equipment. We usePeer Group TSR and CAP and Company TSR
The graph below illustrates the non-GAAP measurerelationship between our TSR and the Peer Group TSR, as well as the relationship between CAP and our TSR for our PEO and other NEOs.
Relationship between CAP and GAAP Net Income
GAAP Net Income is not a main factor in determining the CAP for our PEO and average other NEOs, as GAAP Net Income is not a metric in our annual or long-term incentive plans, and thus there is not a strong relationship between CAP and Net Income.
Relationship between Revenue (our Company-Selected Measure) and CAP
The graph below reflects the relationship between our PEO and Average Other NEO CAP versus revenue for each fiscal year.
OTHER INFORMATION
Indemnification Actions
The Company’s by-laws provide for indemnification of officers and directors to the fullest extent permitted by New York law. Additionally, on October 31, 2023, the Board adopted a form of indemnification agreement (the “Indemnification Agreement”) to be entered into between the Company and certain of its officers and each member of its board of directors (each, an “Indemnitee”). The Indemnification Agreement provides that, subject to certain exceptions (including an Indemnitee’s fraud, bad faith or criminal conduct), the Company will, including through advancement of expenses, indemnify each Indemnitee from and against all losses actually and reasonably incurred by or on behalf of the Indemnitee, to the fullest extent permitted by law, in connection with any threatened, pending, or completed action, suit, or proceeding, including any appeals by reason of the Indemnitee’s status as a criteriondirector, officer, employee, or agent of liquiditythe Company or any other entity the Indemnitee serves at the request of the Company. The Company has not advanced any counsel fees or other reasonable fees and performance-based componentsexpenses to any officer or director under our by-laws. In accordance with the requirements of employee compensation. We use Free Cash Flow as a measurethe Business Corporation Law of liquiditythe State of New York (the “BCL”), in the event the Company advances counsel fees or other reasonable fees and expenses, the individuals on whose behalf any such expenditures are made are required to determine amounts we can reinvest in our core businesses,execute an undertaking to repay such as amounts available to make acquisitions, invest in land, buildings and equipment and internal use software and make principal payments on debt. In order to provide a meaningful basis for comparison, weexpenses if they are providing information with respect to our Free Cash Flow reconciled to cash flow provided by operating activities, which we believefinally found not to be entitled to indemnification under the most directly comparable measure underCompany’s by-laws or the BCL.
Directors and Officers Liability Insurance and Indemnity
On June 1, 2023, the Company renewed its policies for directors’ and officers’ liability insurance. The policies are issued by Chubb insurance Company of New Jersey, XL Specialty Insurance Company, Berkshire Hathaway Specialty Insurance Company, Twin City Fire Insurance Company, Continental Insurance Company of New Jersey, Ascot Insurance Company, Travelers Casualty and Surety Company of America, Zurich American Insurance Company, Arch Insurance Company, Berkshire Hathaway Specialty Insurance Company, Beazley Insurance Company, Inc., Zurich American Insurance Company, Endurance American Insurance Company, AXIS Insurance Company, U.S.
GAAP. Adjusted free cash flowSpecialty Insurance Company, Old Republic Professional Liability, Inc. and Marsh Alpha (Lloyd’s of London). The policies expire June 1, 2024, and the total annual premium is
defined as free cash flow from above plus deferred compensation payments.approximately $4,200,000.
Table of ContentsNon-GAAP ReconciliationsAdjusted Net Income Reconciliation:
| | | | |
| (in millions) | | Year Ended
December 31, 2017 | |
| | | | |
GAAP as Reported from Continuing Operations | | $ | 177 | |
Adjustments: | | | | |
Amortization of intangible assets | | | 243 | |
NY MMIS | | | 9 | |
Restructuring and related costs | | | 101 | |
HE charge | | | (8 | ) |
Separation costs | | | 12 | |
(Gain) loss on sale of asset and businesses | | | (42 | ) |
Other (income) expenses, net | | | (18 | ) |
Less: Income tax adjustments(1) | | | (288 | ) |
| | | | |
Adjusted Net Income | | $ | 186 | |
| | | | |
(1) | Income Tax Adjustments |
| | | | |
| (in millions) | | Year Ended
December 31,
2017 | |
| | | | |
GAAP Income Tax Benefit as Reported | | $ | (193 | ) |
Non-GAAP adjustments | | | | |
Benefit from tax law changes | | | 198 | |
Termination of COLI plan | | | (19 | ) |
Other non-GAAP adjustments | | | 109 | |
| | | | |
Income tax adjustments | | $ | 288 | |
| | | | |
Adjusted EBITDA Reconciliations:
| | | | |
| (in millions) | | Year Ended December 31, 2017 | |
Revenue | | $ | 6,022 | |
Reconciliation to Adjusted EBITDA | | | | |
Net Income (Loss) from Continuing Operations | | $ | 177 | |
Interest Expense | | | 137 | |
Income tax benefits | | | (193 | ) |
Depreciation | | | 125 | |
Amortization | | | 372 | |
| | | | |
EBITDA | | $ | 618 | |
| | | | |
| | | | |
EBITDA | | $ | 618 | |
Adjustments: | | | | |
Restructuring and related costs | | | 101 | |
Separation costs | | | 12 | |
NY MMIS | | | 9 | |
HE charge | | | (8 | ) |
(Gain) Loss on sale of assets and business | | | (42 | ) |
Other (income) expenses, net | | | (18 | ) |
| | | | |
Adjusted EBITDA | | $ | 672 | |
| | | | |
Free Cash Flow/Adjusted Free Cash Flow Reconciliation:
| | | | |
| (in millions) | | Year Ended
December 31,
2017 | |
| | | | |
Operating Cash Flow | | $ | 302 | |
Cost of additions to land, buildings and equipment | | | (96 | ) |
Proceeds from sales of land, buildings and equipment | | | 33 | |
Cost of additions to internal use software | | | (36 | ) |
Vendor financed capital leases | | | (16 | ) |
| | | | |
Free Cash Flow | | $ | 187 | |
| | | | |
Free Cash Flow | | $ | 187 | |
Deferred compensation payments | | | 17 | |
| | | | |
Adjusted Free Cash Flow | | $ | 204 | |
| | | | |
PROPOSAL 2 — RATIFICATION OF APPOINTMENT OF INDEPENDENT REGISTERED PUBLIC ACCOUNTING FIRM
The Audit Committee has appointed PricewaterhouseCoopers LLP (“PWCPwC”), an independent registered public accounting firm, to act as independent auditors of the Company for 2018.2024. PwC has served as the Company’s independent auditors since 2016. Representatives of the firm are expected to be at the Annual Meeting to respond to appropriate questions and to make a statement, if they wish.
Principal Auditor Fees and Services
Aggregate fees for professional services rendered for the Company by PwC were ($ in millions):
| | | | | | | | |
| | | 2017 | | | 2016(1) | |
Audit Fees(2) | | $ | 7.0 | | | $ | 5.8 | |
Audit Related Fees(3) | | $ | 4.6 | | | $ | 0.7 | |
Tax Fees(4) | | $ | 0.7 | | | $ | 0.2 | |
All Other Fees(5) | | $ | 0.2 | | | $ | 0 | |
Total Fees | | $ | 12.5 | | | $ | 6.7 | |
(1) | The Company paid $1,621,000 to PwC for services rendered for 2016. The remainder of the $6.7 million paid to PwC for services rendered for 2016 was paid directly by Xerox because the Company’s results were included in Xerox’s consolidated financial statements. |
(2) | These audit fees were for professional services rendered for the audits of consolidated financial statements, reviews of interim financial statements included in periodic reports, audits related to internal control over financial reporting and statutory audits. |
(3) | These audit-related fees were for assurance and related services that are reasonably related to the performance of the audit or review of the financial statements and are not reported under the “audit fees” category above. These services include carve-out audits, SSAE 16 engagements and other service organization reports, implementation of new accounting standards and regulations, technical accounting advice and agreed-upon procedures. |
(4) | Tax fees were for tax compliance, tax advice and tax planning. These services included the preparation and review of required tax return compliance filings, assistance with tax audits and transfer pricing matters, advisory services relating to federal, state, provincial and international tax compliance, customs and duties, and restructurings, mergers and acquisitions. |
(5) | Fees disclosed in the tables above under the item “all other fees” were for services other than the audit fees, audit-related fees and tax fees described above. |
| | | | | | | | |
| 2023 | 2022 |
Audit Fees(1) | $5.0 | $5.3 |
Audit Related Fees(2) | $— | $0.1 |
Tax Fees(3) | $— | $— |
| All Other Fees | $— | $— |
| Total Fees | $5.0 | $5.4 |
____________________
(1)These audit fees consisted of fees billed and/or accrued for professional services rendered for the audits of consolidated financial statements, reviews of interim financial statements included in periodic reports, audits related to internal control over financial reporting, statutory audits, comfort letters, consents and other services related to statutory audits.
(2)These audit-related fees were for assurance and related services that are reasonably related to the performance of the audit or review of the financial statements and are not reported under the “audit fees” category above. These services include other service organization reports and agreed-upon procedures.
(3)Tax fees were for tax compliance, tax advice and tax planning. These include advisory services relating to federal, state, provincial and international tax compliance, customs and duties, and restructurings, mergers and acquisitions.
Pursuant to its charter, the Audit Committee is directly responsible for the appointment, retention, compensation and oversight of the Company’s independent auditors. In addition to assuring the regular rotation of the lead audit partner as required by
law,applicable rules, the Audit Committee is involved in the evaluation and selection of the lead audit partner and considers whether there should be regular rotation of the independent auditors.
The Audit Committee is also required to review and pre-approve all of the audit and non-audit services to be performed by the Company’s independent auditors, including the firm’s engagement letter for the annual audit of the Company, the proposed fees in connection with such audit services, and any additional services that management chooses to hire the independent auditors to perform. The authority for such pre-approval may be delegated to one or more members of the Audit Committee, provided that the decisions of any member to whom pre-approval authority is delegated must be presented to the full Audit Committee at its next meeting. Additionally, the Audit Committee can establish pre-approval policies and procedures with respect to the engagement of the Company’s independent auditors for permitted non-audit services. In accordance with the Audit Committee Charter, all of the foregoing audit and non-audit fees paid to, and the related service provided by PwC, were pre-approved by the Audit Committee.
At least annually, the Audit Committee reviews the Company’s independent registered public accounting firm to decide whether to retain such firm on behalf of the Company. PwC has been the Company’s independent registered public accounting firm since 2016.
When conducting its latest review of PwC, the Audit Committee considered the following factors:
•The professional qualifications of PwC, the lead audit partner and other key engagement partners on the engagement;
•The appropriateness of PwC’s fees relative to both efficiency and audit quality;
•PwC’s independence policies and processes for maintaining its independence;
•PwC’s capability, expertise and efficiency in handling the breadth and complexity of the Company’s operations across the globe; and
•PwC’s demonstrated professional integrity and objectivity.
The Audit Committee and the Board believe that the continued retention of PwC to serve as our independent auditors is in the best interests of the Company and its shareholders.
The responsibilities of the Audit Committee are discussed under “Committee Functions, Membership and Meetings” beginning on page 1417 and can also be found on our website atwww.conduent.com/corporate-governance. in our Audit Committee Charter. Management is responsible for the Company’s internal controls and the financial reporting process. The independent registered public accounting firm is responsible for performing an audit of the Company’s consolidated financial statements and the effectiveness of internal control over financial reporting in accordance with the standards of the Public Company Accounting Oversight Board (PCAOB) and to issue a report thereon. The Audit Committee’s responsibility is to monitor and oversee these processes. Consistent with the foregoing, the Audit Committee has:
•Reviewed and discussed with the management of the Company and PwC the audited consolidated financial statements of the Company for the year ended December 31, 2017, including the specific disclosure under “Management’s Discussion and Analysis of Financial Condition and Results of Operations” and the Company’s key accounting policies and use of estimates;2023;
•Discussed with PwC the matters required to be communicated indiscussed by the applicable requirements of the PCAOB Auditing Standards Nos. 1301 (Communication with Audit Committees) and 2410 (Related Parties);the SEC; and
•Received the written disclosures and the letter from PwC required by the applicable requirements of the PCAOB regarding PwC’s communications with the Audit Committee concerning independence, rules and New York Stock Exchange Rule 303A.07 (Auditor Quality Control Procedures) and has discussed with PwC that firm’s independence and quality control procedures.its independence.
Based upon the foregoing review and discussions, the Audit Committee recommended to the Board that the audited consolidated financial statements be included in the Company’s
20172023 Annual Report to Shareholders and in the Company’s Annual Report on Form 10-K for the year ended December 31,
20172023 for filing by the Company with the SEC.
Virginia M. Wilson,
Michael Montelongo, Chair
Joie A. Gregor
Michael Nevin
Kathy Higgins Victor
Steven Miller
The Board recommends a vote
the ratification of the appointment of PricewaterhouseCoopers LLP as the Company’s independent registered public accounting firm for the year 20182024
PROPOSAL 3 — PROPOSAL TO APPROVE, ON AN ADVISORY BASIS, THE
20172023 COMPENSATION OF OUR NAMED EXECUTIVE OFFICERS
As required by the Dodd-Frank Act, under Section 14A of the Exchange Act, we are seeking your vote, on a non-binding advisory basis, on the compensation of our named executive officers as described in the Compensation Discussion and Analysis, compensation tables and narrative disclosure, as provided in this proxy statement.Proxy Statement. Specifically, shareholders are being asked to vote upon, and the Board has approved and unanimously recommends approval of, the following non-binding advisory resolution: “RESOLVED, that the compensation paid to the Company’s named executive officers, as disclosed in the Company’s Proxy Statement for the 20182024 Annual Meeting of Shareholders pursuant to Item 402 of Regulation S-K, including the Compensation Discussion and Analysis, compensation tables and narrative discussion, is hereby APPROVED. “”
The Board believes that our executive compensation program is well designed, appropriately aligns executive pay with Company performance and incentivizes desirable executive performance. This proposal gives you an opportunity to express your own view of our
20172023 executive compensation practices. We provide shareholders with the opportunity to cast their advisory vote on our executive compensation practices on an annual basis, in accordance with the preference expressed by our shareholders at the
20172023 annual meeting regarding the frequency of our advisory vote on executive compensation.
While this vote does not address any specific item of compensation and is not binding on the Board, the Board and its Compensation Committee value the opinions of our shareholders and will consider the outcome of the vote when making future compensation decisions.
Unless the Board modifies its policies on the frequency of future say-on-pay advisory votes, the next say-on-pay advisory vote will be held at the 2025 Annual Meeting of Shareholders.
The Board recommends a vote
the proposal to approve the compensation of the named executive officers as disclosed in this Proxy
Statement
| | | | | | |
| | 
|
| Electronic Voting Instructions |
| Available 24 hours a day, 7 days a week!
|
| Instead of mailing your proxy, you may choose one of the voting methods outlined below to vote your proxy.
|
| VALIDATION DETAILS ARE LOCATED BELOW IN THE TITLE BAR.
|
| Proxies submitted by the Internet or telephone must be received by 9:00 a.m., Eastern Time, on May 25, 2018.
|
| 
| | Vote by Internet
• Go towww.envisionreports.com/CNDT
• Or scan the QR code with your smartphone
• Follow the steps outlined on the secure website
|
| Vote by telephone
|
| • Call toll free1-800-652-VOTE (8683) within the USA, US territories & Canada on a touch tone telephone
• Follow the instructions provided by the recorded message
|
Using a black inkpen, mark your votes with an X as shown in
this example. Please do not write outside the designated areas.
| | ☒
| |

qIF YOU HAVE NOT VOTED VIA THE INTERNETOR TELEPHONE, FOLD ALONG THE PERFORATION, DETACH AND RETURN THE BOTTOM PORTION IN THE ENCLOSED ENVELOPE.q
| | |
A | | Proposals — The Board of Directors recommends a voteFOR all the nominees listed. |
| | | | | | | | | | | | | | | | | | | | | | | | |
1. Election of Directors:
01 - Paul S. Galant
04 - Courtney Mather
07 - William G. Parrett
| | For
☐
☐
☐
| | Against
☐
☐
☐
| | Abstain
☐
☐
☐
| | 02 - Nicholas Graziano
05 - Michael Nevin
08 - Ashok Vemuri
| | For
☐
☐
☐
| | Against
☐
☐
☐
| | Abstain
☐
☐
☐
| | 03 - Joie Gregor
06 - Michael A. Nutter
09 - Virginia M. Wilson
| | For
☐
☐
☐
| | Against
☐
☐
☐
| | Abstain
☐
☐
☐
| | +
|
| | | | | | | | | | | |
| | | | | | | | | | | |
| | | | | | | | | | | |
| | |
B | | The Board of Directors recommends a voteFOR Proposals 2 and 3. |
| | | | | | | | | | | | | | | | | | |
| | | | For | | Against | | Abstain | | | | | | For | | Against | | Abstain |
2. Ratify the appointment of PricewaterhouseCoopers LLP as our independent registered public accounting firm.
| | | | ☐ | | ☐ | | ☐ | | | | 3. Approve, on an advisory basis, the 2017 compensation of our named executive officers.
| | ☐ | | ☐ | | ☐ |
| | | | | | | | |
Change of Address— Please print your new address below. | | | | Comments— Please print your comments below. | | Meeting Attendance | | |
| | | | | | Mark the box to the right
if you plan to attend the
Annual Meeting.
| | ☐
|
| | |
D | | Authorized Signatures — This section must be completed for your vote to be counted. — Date and Sign Below |
Please sign exactly as name(s) appears hereon. Joint owners should each sign. When signing as attorney, executor, administrator, corporate officer, trustee, guardian, or custodian, please give full title.
| | | | | | | | |
Date (mm/dd/yyyy) — Please print date below. | | | | Signature 1 — Please keep signature within the box. | | | | Signature 2 — Please keep signature within the box. |
/ / | | | | | | | | |

02S2SB
2018 Annual Meeting Admission Ticket
2018 Annual Meeting of
Conduent Incorporated Shareholders
May 25, 2018 at 9:00 a.m. Eastern Time
The Madison Hotel
1 Convent Road
Morristown, New Jersey 07960
Upon arrival, please present this admission ticket
and photo identification at the registration desk.
q IF YOU HAVE NOT VOTED VIA THE INTERNETOR TELEPHONE, FOLD ALONG THE PERFORATION, DETACH AND RETURN THE BOTTOM PORTION IN THE ENCLOSED ENVELOPE.q

Proxy — Conduent Incorporated
Notice
Table of ShareholdersProxy Solicited by Board of Directors for Annual Meeting — May 25, 2018
Ashok Vemuri and William G. Parrett, or either of them, each with the power of substitution, are hereby authorized to represent and vote the shares of the undersigned, with all the powers which the undersigned would possess if personally present, at the Annual Meeting of Stockholders of Conduent Incorporated to be held at The Madison Hotel, 1 Convent Road, Morristown, New Jersey 07960 on May 25, 2018 at 9:00 a.m. (ET) or at any postponement or adjournment thereof.
Shares represented by this proxy will be voted by the shareholder. If no such directions are indicated, the Proxies will have authority to voteFOR all Nominees andFOR Proposals 2 and 3.
In their discretion, the Proxies are authorized to vote upon such other business as may properly come before the meeting.
(Items to be voted appear on reverse side.)
Contents