UNITED STATES
SECURITIES AND EXCHANGE COMMISSION
Washington, D.C. 20549
SCHEDULE 14A
Proxy Statement Pursuant to Section 14(a) of
the Securities Exchange Act of 1934 (Amendment No. )
the Securities Exchange Act of 1934 (Amendment No. )
Filed by the Registrant ☒
Filed by a Party other than the Registrant ☐
Check the appropriate box:
☐
Preliminary Proxy Statement
☐
Confidential, for Use of the Commission Only (as permitted by Rule 14a-6(e)(2))
☒
Definitive Proxy Statement
☐
Definitive Additional Materials
☐
Soliciting Material under §240.14a-12
Summit Hotel Properties, Inc.
(Name of Registrant as Specified in Its Charter)
(Name of Person(s) Filing Proxy Statement, if other than the Registrant)
Payment of Filing Fee (Check the appropriate box):
☒
No fee required.
☐
Fee paid previously with preliminary materials.
☐
Fee computed on table in exhibit required by Item 25(b) per Exchange Act Rules 14a6(i)(1) and 0-11.

![[MISSING IMAGE: lg_summithotel-4c.jpg]](https://capedge.com/proxy/DEF 14A/0001104659-22-040182/lg_summithotel-4c.jpg)
Dear Fellow Stockholder:
You are cordially invited to attend the 20202022 annual meeting of stockholders of Summit Hotel Properties, Inc., a Maryland corporation, to be held on Thursday, May 14, 2020,12, 2022, at 8:00 a.m. MountainCentral Time, at the Boulder Marriott HotelHampton Inn & Spa, 2660 CanyonSuites located at 200 San Jacinto Boulevard, Boulder, Colorado 80302.
Austin, Texas 78701.
The attached proxy statement, accompanied by the notice of annual meeting, describes the matters expected to be acted upon at the meeting. We urge you to review these materials carefully and to use this opportunity to take part in the affairs of Summit Hotel Properties, Inc. by voting on the matters described in this proxy statement. We hope that you will be able to attend the meeting.
Your vote is important. Whether or not you plan to attend the meeting, please complete the enclosed proxy card and return it as promptly as possible or authorize a proxy to vote your shares by calling the toll-free telephone number, or via the Internet.internet. The enclosed proxy card contains instructions regarding all three methods of voting. If you attend the meeting, you may continue to have your shares voted as you have previously instructed, or you may withdraw your proxy at the meeting and vote your shares in person. We look forward to seeing you at the meeting.
Our Commitment to Corporate Responsibility and Sustainability
Despite the challenges caused by the COVID-19 pandemic, we have maintained our focus on both creating long-term value and continuing to address the growing importance of environmental, social and governance issues to our investors, customers, employees and other stakeholders. We continue to collaborate with our associates, brand partners, property managers, guests, suppliers and other stakeholders to implement programs and initiatives that will have a positive effect on our business, the environment and communities. While we are proud of the progress we have made on our sustainability efforts broadly, we recognize this is an ever-evolving journey and remain committed to raising our standards of excellence on important initiatives. We recognize our connectedness to all our stakeholders continues to grow, and we are enthusiastically committed to furthering our mission around environmental stewardship, social responsibility and governance and resiliency.
Sincerely,
Jonathan P. Stanner
Director, President & Chief Executive Officer
Director, President & Chief Executive Officer
 | |
SUMMIT HOTEL PROPERTIES, INC.
13215 BEE CAVE PARKWAY, SUITE B-300
AUSTIN, TEXAS 78738
NOTICE OF ANNUAL MEETING OF STOCKHOLDERS
TO BE HELD ON MAY
The 20202022 annual meeting of stockholders of Summit Hotel Properties, Inc., a Maryland corporation, will be held on Thursday, May 14, 2020,12, 2022, at 8:00 a.m., MountainCentral Time, at the Boulder Marriott HotelHampton Inn & Spa, 2660 CanyonSuites located at 200 San Jacinto Boulevard, Boulder, Colorado 80302*Austin, Texas 78701 for the following purposes:
1.
2.
To consider and vote upon the ratification of the appointment of Ernst & Young, LLP as the Company’s independent registered public accounting firm for 2020;2022;
3.
To consider and vote upon an advisory (non-binding) resolution on executive compensation; and
4.
To transact such other business as may be properly brought before the annual meeting and at any adjournments or postponements thereof.
You may vote if you were a holder of record of our common stock at the close of business on March 6, 2020,11, 2022, the record date.
Whether or not you plan to attend the annual meeting your vote is very important, and the Company encourages you to promptly authorize a proxy to vote your shares.
| | |||
Austin, Texas March 30, 2022 | | | BY ORDER OF THE BOARD OF DIRECTORS |
 ![[MISSING IMAGE: sg_christopher-eng.jpg]](https://capedge.com/proxy/DEF 14A/0001104659-22-040182/sg_christopher-eng.jpg) | |||
Christopher Eng Executive Vice President, General Counsel, Chief Risk Officer and Secretary | |
Contents
| | | | | | 1 | | | |
| QUESTIONS AND ANSWERS ABOUT THE ANNUAL MEETING | | | | | 2 | | | |
| | ||||||||
| PROPOSAL 1: ELECTION OF DIRECTORS | | | | | 5 | | | |
| | ||||||||
| PROPOSAL 2: RATIFICATION OF APPOINTMENT OF ERNST & YOUNG, LLP AS INDEPENDENT REGISTERED PUBLIC ACCOUNTING FIRM OF THE COMPANY FOR | | | | | | | ||
| | ||||||||
| PROPOSAL 3: ADVISORY (NON-BINDING) VOTE ON EXECUTIVE COMPENSATION | | | | | 11 | | | |
| | ||||||||
| CORPORATE GOVERNANCE PRINCIPLES AND BOARD MATTERS | | | | | 12 | | | |
| | ||||||||
| Corporate Responsibility Program | | | | | 12 | | | |
| | | | | | 12 | | | |
| | | | | | 12 | | | |
| | ||||||||
| Board of Directors Structure & Practices | | | | | 13 | | | |
| | ||||||||
| Stockholders Engagement and Investor Outreach Program | | | | | 14 | | | |
| | ||||||||
| Anti-Hedging and Anti-Pledging Policies | | | | | 14 | | | |
| | ||||||||
| Compensation Clawback Policy | | | | | 14 | | | |
| | | | | | 14 | | | |
| Opt-out of Certain Provisions of | | | | | 15 | | | |
| | ||||||||
| THE BOARD OF DIRECTORS AND ITS COMMITTEES | | | | | 16 | | | |
| | | | | | 16 | | | |
| | | | | | 16 | | | |
| | | | | | 16 | | | |
| | | | | 16 | | | ||
| | | | | 17 | | | ||
| Nominating and Corporate Governance Committee | | | | | 17 | | | |
| | ||||||||
| Compensation Committee Interlocks and Insider Participation | | | | | 17 | | | |
| | ||||||||
| Board Leadership Structure | | | | | 17 | | | |
| | ||||||||
| Risk Management Oversight | | | | | 18 | | | |
| | ||||||||
| Meetings and Attendance | | | | | 18 | | | |
| | ||||||||
| Executive Sessions of Our Independent Directors | | | | | 18 | | | |
| | | | | | 18 | | | |
| Policy on Voting Regarding Directors | | | | | 19 | | | |
| | ||||||||
| Communication with the Board | | | | | 20 | | | |
| | ||||||||
| Policy Governing Director Attendance at Annual Meetings of Stockholders | | | | | 20 | | | |
| | | | | | 21 | | | |
| COMPENSATION DISCUSSION AND ANALYSIS | | | | | 23 | | | |
| | | | | | 23 | | | |
| | | | | 25 | | | ||
| Compensation Best Practice Policies | | | | | 26 | | | |
| | ||||||||
| Results of Stockholder Say-on-Pay Votes | | | | | 26 | | | |
| | ||||||||
| Objectives of Our Executive Compensation Program | | | | | 26 | | | |
| | ||||||||
| Role of the Compensation Committee and Management | | | | | 27 | | | |
| | ||||||||
| Role of the Compensation Consultant | | | | | 27 | | | |
| | ||||||||
| Peer Group Information | | | | | 27 | | |
i
| | | | | 28 | | | ||
| | | | | | 29 | | | |
| Long-Term Incentive Compensation | | | | | 31 | | | |
| | ||||||||
| Other Benefits; 401(k) Plan | | | | | 33 | | | |
| | | | | | 34 | | | |
| Tax Deductibility of Executive Compensation | | | | | 34 | | | |
| | | | | | 34 | | | |
| | | | | 36 | | | ||
| Summary Compensation Table | | | | | 36 | | | |
| | ||||||||
| Grants of Plan-Based Awards | | | | | 37 | | | |
| | ||||||||
| Discussion of Summary Compensation and Grants of Plan-Based Awards Tables | | | | | 38 | | | |
| | ||||||||
| Outstanding Equity Awards at Fiscal Year-End | | | | | 38 | | | |
| | ||||||||
| Option Exercises and Stock Vested | | | | | 39 | | | |
| | | | | | 39 | | | |
| Potential Payments Upon Termination or Change in Control | | | | | 40 | | | |
| | | | | | 43 | | | |
| | | | | | 43 | | | |
| | | | | | 44 | | | |
| | | | | | 45 | | | |
| | | | | 45 | | | ||
| | | | | 45 | | | ||
| | | | | 45 | | | ||
| All Other Fees | | | | | 45 | | | |
| | | | | | 45 | | | |
| SECURITY OWNERSHIP OF CERTAIN BENEFICIAL OWNERS AND MANAGEMENT | | | | | 46 | | | |
| | ||||||||
| Security Ownership of Certain Beneficial Owners | | | | | 46 | | | |
| | ||||||||
| Security Ownership of Management | | | | | 47 | | | |
| | ||||||||
| RELATED PERSON TRANSACTIONS | | | | | 48 | | | |
| | ||||||||
| Related Person Transaction Policy | | | | | 48 | | | |
| | ||||||||
| Related Person Transactions | | | | | 48 | | | |
| | | | | | 50 | | | |
| Discretionary Voting Authority | | | | | 50 | | | |
| | ||||||||
| Stockholder Proposals and Director Nominations for the | | | | | 50 | | | |
| | ||||||||
| Requirements for Proposals to be Considered for Inclusion in Proxy Materials | | | | | 50 | | | |
| | ||||||||
| Requirements for Proposals Not Intended for Inclusion in Proxy Materials; Director Nominations | | | | | 50 | | | |
| | | | | | 50 | | | |
| | | | | | | |
ii
PROXY STATEMENT
2022 ANNUAL MEETING OF STOCKHOLDERS
GENERAL INFORMATION
Proxy Solicitation
The Board of Directors (the “Board”) of Summit Hotel Properties, Inc., a Maryland corporation, has made these materials available to you on the Internetinternet or, upon your request, has delivered printed versions of these materials to you by mail, in connection with its solicitation of proxies for its 20202022 annual meeting of stockholders to be held on May 14, 2020,12, 2022, at 8:00 a.m., MountainCentral Time, at the Boulder Marriott HotelHampton Inn & Spa, 2660 CanyonSuites located at 200 San Jacinto Boulevard, Boulder, Colorado 80302,Austin, Texas 78701, and at any adjournments or postponements thereof. These materials were first made available to stockholders on April 1, 2020.March 30, 2022. Unless the context requires otherwise, references in this proxy statement to “Summit,” “we,” “our,” “us” and the “Company” refer to Summit Hotel Properties, Inc., and its consolidated subsidiaries.
Pursuant to rules adopted by the Securities and Exchange Commission (the “SEC”), we have elected to provide access to our proxy materials on the Internet.internet. Accordingly, we are sending a Notice of Internet Availability of Proxy Materials (the “Notice of Internet Availability”) to our stockholders. All stockholders will have the ability to access the proxy materials at www.proxyvote.com or request to receive a printed set of the proxy materials by mail or an electronic set of materials by email. Instructions on how to access the proxy materials on the Internetinternet or to request a printed copy may be found in the Notice of Internet Availability. Stockholders also may request to receive proxy materials in printed form by mail or electronically by email on an ongoing basis.
In addition to solicitation by mail, certain of our directors, officers and employees may solicit proxies by telephone, personal contact or other means of communication. They will not receive any additional compensation for these activities. Also, brokers, banks and other persons holding common stock on behalf of beneficial owners will be requested to solicit proxies or authorizations from beneficial owners. We will bear all costs incurred in connection with the preparation, assembly and mailing of the proxy materials and the solicitation of proxies and will reimburse brokers, banks and other nominees, fiduciaries and custodians for reasonable expenses incurred by them in forwarding proxy materials to beneficial owners of our common stock. Although no proxy solicitor has been engaged at this time, we may determine it is necessary to employ an outside firm to assist in the solicitation process. If so, we will pay the proxy solicitor reasonable and customary fees.
No person is authorized to give any information or to make any representation not contained in this proxy statement and, if given or made, you should not rely on that information or representation as having been authorized by us. The delivery of this proxy statement does not imply that the information herein has remained unchanged since the date of this proxy statement.
Summit Contact Information
The mailing address of our principal executive office is 13215 Bee Cave Parkway, Suite B-300, Austin, Texas 78738, and our main telephone number is (512) 538-2300. We maintain an Internetinternet website at www.shpreit.com. Information at or connected to our website is not and should not be considered part of this proxy statement.
1
QUESTIONS AND ANSWERS ABOUT THE ANNUAL MEETING
On what am I voting?
You are being asked to consider and vote on the following proposals:
•
Election of the sixeight director nominees named in this proxy statement (Proposal 1);
•
Ratification of Ernst & Young, LLP (“EY”), as our independent registered public accounting firm for 20202022 (Proposal 2); and
•
An advisory (non-binding) resolution to approve executive compensation (Proposal 3).
Who can vote?
Holders of our common stock as of the close of business on the record date, March 6, 2020,11, 2022, are entitled to vote, either in person or by proxy, at the annual meeting. Each share of our common stock is entitled to one vote. Cumulative voting is not permitted in the election of directors.
How do I vote or authorize a proxy to vote my shares?
By Proxy. Before the annual meeting, you may authorize a proxy to vote your shares in one of the following ways:
•
By telephone;
•
By Internet;internet; or
•
By completing and signing your proxy card and mailing it in time to be received prior to the annual meeting.
The telephone and Internetinternet voting procedures are designed to confirm your identity, to allow you to give your voting instructions and to verify that your instructions have been properly recorded. If you wish to vote by telephone or Internet,internet, please follow the instructions that are included in the Notice of Internet Availability and the proxy card. If you mail us your properly completed and signed proxy card, or vote by telephone or Internet,internet, your shares will be voted according to the choices that you specify.
If you sign and mail your proxy card without marking any choices, your proxy will be voted:
FORthe election of all director nominees named in this proxy statement (Proposal 1);
FOR the ratification of EY as our independent registered public accounting firm for 20202022 (Proposal 2); and
FOR the approval of an advisory (non-binding) resolution on executive compensation (Proposal 3).
We do not expect that any other matters will be brought before the annual meeting. If an issue should arise for vote at the annual meeting that is not included in the proxy material, the proxy holders will vote your shares in accordance with their discretion.
In Person. If your shares are registered directly in your name with our transfer agent, you are considered the stockholder of record with respect to those shares and you may attend the annual meeting and vote in person. If your shares are held in the name of your broker, bank or other nominee and you wish to attend the annual meeting, you must bring an account statement or letter from the nominee indicating that you were the owner of the shares on March 6, 2020.11, 2022. If your shares are held in the name of your broker, bank or other nominee and you wish to vote at the annual meeting, you must obtain a legal proxy from your broker, bank or other nominee that holds your shares giving you the right to those shares.
May I change or revoke my vote?
Yes. You may change your vote or revoke your proxy at any time prior to the annual meeting by:
•
Notifying our Secretary in writing that you are revoking your proxy;
2
•
Providing another signed proxy that is dated after the proxy you wish to revoke;
•
Using the telephone or Internetinternet voting procedures; or
•
Attending the annual meeting and voting in person. Attendance at the annual meeting will not, by itself, revoke a duly executed proxy.
Will my shares be voted if I do not provide my proxy?
It depends on whether you hold your shares in your own name or in the name of a bank or brokerage firm. If you hold your shares directly in your own name, they will not be voted unless you provide a proxy or vote in person at the annual meeting.
Brokerage firms generally have the authority to vote customers’ un-voted shares on certain “routine” matters. If your shares are held in the name of a brokerage firm, the brokerage firm can vote your shares for the ratification of EY as our independent registered public accounting firm for 20202022 (Proposal 2) if you do not provide your voting instructions timely, because this matter is considered “routine” under the applicable rules. The other items (Proposals Nos. 1 and 3) are not considered “routine” and therefore may not be voted by your broker without instruction.
What constitutes a quorum?
As of the record date, a total of 105,174,471106,337,785 shares of our common stock were issued and outstanding and entitled to vote at the annual meeting. To conduct the annual meeting, a majority of the shares entitled to vote must be present in person or by proxy. This is referred to as a “quorum.” If you submit a properly executed proxy card or authorize a proxy to vote by telephone or on the Internet,internet, your shares will be counted for purposes of determining the presence of a quorum. Abstentions and broker “non-votes” will be counted as present and entitled to vote for purposes of determining a quorum. A broker “non-vote” occurs when a bank, broker or other nominee who holds shares for another person has not received voting instructions from the owner of the shares and, under the applicable rules, does not have discretionary authority to vote on a matter.
What vote is needed to approve the matters submitted?
Election of Directors (Proposal 1). The affirmative vote of a majority of all the votes cast at a meeting at which a quorum is present is necessary for the election of a director in an uncontested election. For purposes of this vote, abstentions and broker non-votes will not be counted as votes cast and will have no effect on the result of the vote for this proposal. The Board has adopted a policy on voting regarding directors. Under the policy, at any meeting of stockholders at which members of the Board are to be elected by the stockholders in an uncontested election, any nominee for director who receives a greater number of votes “against” his or her election than votes “for” his or her election will submit to the Board a written offer to resign from the Board no later than two weeks after the certification of the voting results. For additional information regarding this policy, please see “The Board of Directors and Its Committees — Policy on Voting Regarding Directors.”
Ratification of Appointment of EY (Proposal 2). The affirmative vote of a majority of the votes cast at the annual meeting is required to approve this proposal. For purposes of this vote, abstentions will not be counted as votes cast and will have no effect on the result of the vote for this proposal.
Approval on an Advisory (Non-Binding) Resolution on Executive Compensation (Proposal 3). The affirmative vote of a majority of the votes cast at the annual meeting is required to approve this proposal. For purposes of this advisory vote, abstentions and broker non-votes will not be counted as votes cast and will have no effect on the result of the vote for this proposal.
Householding. We are sending only a single Notice of Internet Availability to any household at which two or more stockholders reside if they share the same last name or we reasonably believe they are members of the same family unless we have received instructions to the contrary from any stockholder at that address. This practice is known as “householding” and is permitted by rules adopted by the SEC. This practice reduces the volume of duplicate information received at your household and helps us to reduce
3
costs. We will deliver promptly, upon written request or oral request, a separate copy of the Notice of Internet Availability to a stockholder at a shared address to which a single copy of the document was previously delivered. If you received a single copy of this document for your household for this year, but you would prefer to receive your own copy, you may direct requests for separate copies in the future to the following address: Summit Hotel Properties, Inc., Attention: Secretary, 13215 Bee Cave Parkway, Suite B-300, Austin, Texas 78738. If you are a stockholder who receives multiple copies of our proxy materials, you may request householding by contacting us in the same manner and requesting a householding consent form.
4
PROPOSAL 1:
ELECTION OF DIRECTORS
Introduction
As of April 1, 2020,March 30, 2022, the Board has sixnine members. As previously reported on Form 8-K filed by the Company on December 7, 2021, Mr. Daniel P. Hansen’s tenure as a director will end as of the date of our 2022 annual meeting. In connection with Mr. Hansen’s departure, the Board will be decreased from nine to eight directors. The sixeight people named below, each of whom currently serves on the Board, have been recommended by the Nominating and Corporate Governance Committee and nominated by our Board to serve on the Board until our 20212023 annual meeting of stockholders and until their respective successors are duly elected and qualify. The Board has no reason to believe that any of the nominees will be unable, or will decline, to serve if elected. The Board has determined that each director nominee named below except Mr. Hansen,Stanner is independent under applicable SEC and New York Stock Exchange (the “NYSE”) rules.
Recommendation:
OUR BOARD OF DIRECTORS UNANIMOUSLY RECOMMENDS A VOTE FOR EACH OF THE NOMINEES.
The following table sets forth the name, position with the Company and age (as of the annual meeting) of each nominee for election to the Board at the annual meeting:
Board of Directors Nominees
| | | Name, Age | | |||||||||||||
| | Director Since | | | | Position | | | Service on Other U.S. Public Company Boards | | | ||||||
| | Amina Belouizdad, 38 | | | | 2021 | | | | Independent Director | | | | N/A | | | |
| | | Bjorn R. L. Hanson, 70 | | | | 2011 | | | | Independent Director | | | | N/A | | |
| | | Jeffrey W. Jones, 60 | | | | 2014 | | | | Chairman of the Board and Chair of Audit Committee | | | | Noodles & Company (NASDAQ: NDLS) | | |
| | | Kenneth J. Kay, 67 | | | | 2014 | | | | Independent Director and Chair of Compensation Committee | | | | N/A | | |
| | | Mehul Patel, 46 | | | | 2022 | | | | Independent Director | | | | N/A | | |
| | | Jonathan P. | | �� | 2021 | | | | Director, President and Chief Executive Officer | | | N/A | | | ||
| | Thomas W. Storey, 65 | | | | 2011 | | | | Independent Director | | | | N/A | | | |
| | | Hope S. Taitz, 58 | | | | 2017 | | | | Independent Director and Chair of Nominating and Corporate Governance Committee | | |||||
| | Aequi Acquisition Corp (NASDAQ: ARBG) | | ||||||||||||||
We believe that all of the nominees are intelligent, experienced, collegial, insightful and proactive with respect to management and risk oversight and that they exercise good judgment. The biographical descriptions below set forth certain information with respect to each nominee, including the experience, qualifications, diversity, attributes or skills of each nominee that led us to conclude that he or she should serve as a director, if elected.
Nominees
5
six years with Merrill Lynch, Pierce, Fenner & Smith Incorporated, or Merrill Lynch,living and working in various leadership positions culminating as a Vice PresidentChina where she was Director at China’s first boutique hotel brand, overseeing its development and Regional Sales Managergrowth.
Ms. Belouizdad is originally from Algeria and has lived in the Texas Mid-South Region, which included Texas, Louisiana, ArkansasUAE, Canada, China and Oklahoma. Mr. Hansenthe United States. She speaks five languages and graduated from South Dakota StateMcGill University (Montreal, QC) with a B.A.Bachelor of Commerce, Major in Economics.
Finance and received her M.B.A., Major in Finance and Real Estate from The Wharton School of the University of Pennsylvania.
The Board, upon the recommendation of the Nominating and Corporate Governance Committee, has determined that Mr. HansenMs. Belouizdad should serve as a director, if elected, because he currently serves as our Chairman, Presidentof her professional and Chief Executive Officereducational experiences and provides a critical link between the executive management team, which is responsible for the day-to-day management of the Company,her diverse background. Her diverse background and the Board. We believe his service as a director enablesexperiences offer unique perspective to the Board and makes Ms. Belouizdad well suited to perform its oversight function withserve on the benefits of management’s perspectives on our business. Mr. Hansen also provides us with extensive experience in the hospitality industry as well as a capital markets background that assists the Board in analyzing capital raising opportunities and issues.
Board.
Bjorn R. L. Hanson. Dr. Hanson has been a member of the Board since the completion of our initial public offering, or IPO, in February 2011. Dr. Hanson served as our Lead Independent Director from June 2015 to January 2017, Chairedchaired the Audit Committee from December 2013 to June 2015 and currently chairschaired the NominationsNominating and Corporate Governance Committee.Committee from May 2016 to May 2020. Dr. Hanson’s career has been in the hospitality industry. He founded the hospitality, sports, convention and leisure practices and held various positions at PricewaterhouseCoopers and Coopers & Lybrand, including National Industry Chairman for the Hospitality Industries, National Service Line Director for Hospitality Consulting, National Industry Chairman for Real Estate, Real Estate Service Line Director and National Director of Appraisal Services. Additionally, he served on PricewaterhouseCooper’s U.S. leadership committee and global financial advisory services management committee. Dr. Hanson was also managing director with two Wall Street firms, Kidder, Peabody & Co. and PaineWebber Inc., for which he led banking and research departments for lodging and gaming. He joined the New York University in 2008 as a clinical professor teaching in the Tisch Center for graduate and undergraduate hospitality and tourism programs. In 2010, he was appointed as the NYU divisional dean of that program and in 2012 was appointed co-interim dean of one of NYU’s 18 schools and colleges. He is now Adjunct Clinical Professor. Dr. Hanson is an active lodging consultant, including as an expert witness and researcher, and is the Executive Vice President of 795 Fifth Avenue Corporation, the entity that owns The Pierre, A Taj Hotel, New York. Dr. Hanson received a B.S. from Cornell University School of Hotel Administration, an M.B.A. from Fordham University and a Ph.D. from New York University.
The Board, upon the recommendation of the Nominating and Corporate Governance Committee, has determined that Dr. Hanson should serve as a director, if elected, because he brings a wide range of experience in consulting and investment banking in the hospitality industry to the Board. He also brings research and quantitative analysis perspectives on the hospitality and tourism industries, which enhances the ability of the Board to analyze macroeconomic issues and trends relevant to our business. Finally, Dr. Hanson’s leadership roles in market trend analysis, economic analysis and financial analysis specific to our industry provide the Board with additional depth in analyzing financial reporting issues faced by companies similar to ours.
Jeffrey W. Jones. Mr. Jones has been a member of the Board since July 2014.2014 and currently serves as Chairman of the Board and chair of the Audit Committee. Prior to being appointed Chairman of the Board on January 1, 2022, Mr. Jones served as the Company’s Lead Independent Director. From 2003 to 2012, Mr. Jones served as the Chief Financial Officer for Vail Resorts, Inc. (NYSE: MTN), a publicly held resort management company, and also served as a member of the Board of Directors of Vail Resorts, Inc. from 2008 through 2012. In addition, later in his tenure at Vail Resorts, Inc., Mr. Jones also served as President -— Lodging, Retail and Real Estate. Mr. Jones is also currently Chairman of the Board of Directors, chairs the audit committee and is a member of the compensation committee and the nominating and corporate governance committee for Noodles & Company (NASDAQ: NDLS), a publicly held fast-casual restaurant chain. Mr. Jones also serves on the Board of Directors, is the Lead Independent Director, chairs the audit and finance committee and is a member of the compensation committee of Hershey Entertainment and Resorts, a privately held entertainment and hospitality company. Mr. Jones also serves on the Board of Directors of ClubCorp, a privately held hospitality company. He is also a member of the US Bank Advisory Board and is a member of the Board of the Leeds School of Business, University of Colorado Boulder.Board. Prior to joining Vail Resorts, Inc., Mr. Jones held chief financial officer positions with Clark Retail Enterprises and Lids Corporation. Mr. Jones received a BAB.A. in Accounting and American Studies from Mercyhurst College n/k/a Mercyhurst University and is a member of the American Institute of Certified Public Accountants (AICPA).
6
The Board, upon the recommendation of the Nominating and Corporate Governance Committee, has determined that Mr. Jones should serve as a director, if elected, because of his significant management, financial, hospitality industry and mergers and acquisition experience and expertise, which he has acquired through his fifteen years as a chief financial officer, including ten years as chief financial officer and four years as a director, as well as president of lodging, retail and real estate, of a publicly held resort management company. In addition, Mr. Jones’s other experience in leadership roles as a corporate board director and audit committee member and chair provides the Board with perspective into corporate governance best practices.
Kenneth J. Kay. Mr. Kay has been a member of the Board since July 2014.2014 and currently serves as chair of the Compensation Committee. Mr. Kay is currently the Chief Financial Officer and a member of the Office of the CEO of MGM Holdings, Inc. (the parent company of Metro-Goldwyn-Mayer, Inc.), a leading entertainment companystudio focused on the production and global distribution of film and television content.content, and a wholly owned subsidiary of Amazon.com, Inc. Mr. Kay is also a Managing Director of Raven LLC, an investment and advisory services firm located in Las Vegas, Nevada, a position he has held since co-founding the firm in 2012. Raven LLC provides debt and equity capital and management consulting and advisory services to small and medium sized businesses. Previously, Mr. Kay held the position of Chief Financial Officer of Las Vegas Sands Corp. (“Las Vegas Sands”) (NYSE: LVS) from December 2008 to July 2013, where he was responsible for all worldwide financial, planning, procurement, technology and risk aspects of the company. Prior to working for Las Vegas Sands, Mr. Kay was Senior Executive Vice President and Chief Financial Officer of CB Richard Ellis Group, Inc. (“CBRE”) (NYSE: CBG), a global commercial real estate services firm, from June 2002 to December 2008. Mr. Kay began his career with PricewaterhouseCoopers, primarily focusing his efforts on large, publicly owned multinational companies. After leaving public accounting, his career included senior financial and operational roles at Ameron International, Systemed Inc., Universal
Studios and, just prior to CBRE, as Chief Financial Officer of Dole Food Company, Inc. (formerly NYSE: DOLE). Mr. Kay is a member of the Board of Governors of Cedars Sinai Medical Center and The Board of Advisors of the USC Leventhal School of Accounting. Mr. Kay received a B.S. degree in accounting and an M.B.A. degree from the University of Southern California. Mr. Kay is a Chartered Global Management Accountant, a Certified Public Accountant and a member of the American Institute of Certified Public Accountants.
The Board, upon the recommendation of the Nominating and Corporate Governance Committee, has determined that Mr. Kay should serve as a director, if elected, because of his professional background and experience, education, Fortune 500 senior-executive level positions in real estate and hospitality and his extensive finance, accounting, operational and mergers and acquisitions experience and expertise.
Mehul B. Patel. Mr. Patel joined the Board in January 2022 upon the substantial completion of the Company’s acquisition of a 27-property portfolio from NewcrestImage. He has been Chairman and CEO of privately owned NewcrestImage since the Dallas-based firm was formed in early 2013 to harness the unique skills and synergies of Newcrest Management and Image Hospitality. From 2013 to 2014, Mr. Patel served as the youngest chairman in the history of the Asian American Hotel Owners Association (AAHOA). He continues to be actively involved in hotel industry leadership roles, serving on the brand councils of AC Hotels for Marriott International, Hyatt Place and Hyatt House for Hyatt Hotels Corporation, and Hampton Inn & Suites for Hilton Worldwide. Currently, he is an owner and serves on the Board of Directors of American Bank, a community bank located in North Dallas, and on the CEO Advisory Board of Aimbridge Hospitality, a global third-party hotel management company. Mr. Patel has previously served on the La Quinta Brand Council and the IHG Owners Association. Born in India, he immigrated to the United States at age 14 and went on to earn a degree in computer information systems at the University of Texas at Arlington.
The Board, upon the recommendation of the Nominating and Corporate Governance Committee, has determined that Mr. Patel should serve as a director, if elected, because of his professional background and experience in the real estate and hospitality industries. His diverse background and upbringing offer unique perspective to the Board and makes Mr. Patel well suited to serve on the Board.
Jonathan P. Stanner. Mr. Stanner serves as our President and Chief Executive Officer. He was appointed President, Chief Executive Officer and to the Board effective January 15, 2021. Mr. Stanner’s service as President and Chief Executive Officer provides a critical link between management and the Board, enabling the Board to perform its oversight function with the benefits of management’s perspectives on the business. Mr. Stanner served as our Executive Vice President, Chief Financial Officer and Treasurer from
7
March 2018 to January 2021. Mr. Stanner served as Executive Vice President and Chief Investment Officer from April 2017 to March 2018. He serves on the Board of the American Hotel & Lodging Association and on the Hyatt Owners’ Advisory Council. Prior to joining the Company, Mr. Stanner served as Chief Executive Officer of Strategic Hotels & Resorts, Inc. (“Strategic Hotels”), which was publicly traded until being sold to an affiliate of The Blackstone Group L.P. in December 2015. Mr. Stanner held increasingly senior positions with Strategic Hotels during his tenure, including Director of Corporate Finance, Senior Vice President — Capital Markets, Acquisitions, Treasurer and Chief Financial Officer. Prior to joining Strategic Hotels, Mr. Stanner worked in investment banking with Bank of America. Mr. Stanner earned a Bachelor of Science in Management and a Master of Business Administration, both from the Krannert School of Management at Purdue University.
The Board, upon the recommendation of the Nominating and Corporate Governance Committee, has determined that Mr. Stanner should serve as a director, if elected, because he currently serves as our President and Chief Executive Officer and provides a critical link between the executive management team, which is responsible for the day-to-day management of the Company and the Board. We believe his service as a director enables the Board to perform its oversight function with the benefits of management’s perspectives on our business.
Thomas W. Storey. Mr. Storey has been a member of the Board since the completion of our IPO in February 2011. Mr. Storey served as our Non-Executive Chairman of the Board from July 2015 until January 2017.2017 and chaired the Nominating and Corporate Governance Committee from December 2013 to May 2016. Mr. Storey has worked in the hospitality industry for more than 30 years. From 1999 to 2013 he was employed by Fairmont Raffles Hotels International (“FRHI”), a leading global hotel company with over 125 hotels worldwide under the Fairmont, Raffles and Swissôtel brands, in various roles including; President Fairmont Hotels and Resorts, Executive Vice President, Business Strategy and Executive Vice President, Global Development. From 1984 to 1999, Mr. Storey worked for multiple hospitality companies in an executive capacity including Marriott Hotels and Resorts, Doubletree Hotels, Promus Hotels and Radisson Hotels, International. Mr. Storey has been a member of various hospitality industry organizations, including the American Hotel & Lodging Association, the Travel Industry Association of America, and Professional Conference and Meeting Planners. He previously served on multiple public and private boards including Candlewood Hotels, Legacy Hotels Real Estate Investment Trust, Travelclick, LLC and the Wall Street Institute. Mr. Storey received a B.A. in economics from Bates College and an M.B.A. from the Johnson School at Cornell University.
The Board, upon the recommendation of the Nominating and Corporate Governance Committee, has determined that Mr. Storey should serve as a director, if elected, because he provides the Board with strategic vision specific to the hospitality industry. In addition, Mr. Storey has substantial leadership experience in the hospitality industry, including as Executive Vice President, Business Strategy of FRHI, where Mr. Storey was instrumental in helping lead that company through various lodging cycles. The Board expects Mr. Storey’s experience in analyzing and reacting to changing conditions in the hospitality industry will serve the Board. The Board also expects Mr. Storey’s operations experience with FRHI will help him provide valuable insights to the Board. Mr. Storey also possesses particular expertise in business travel, an important aspect of our business.
Hope S. Taitz. Ms. Taitz has been a member of the Board since July 2017.2017 and currently serves as chair of the Nominating and Corporate Governance Committee. Ms. Taitz is currently the CEO of ELY Capital (“ELY”) and CEO of Aequi Acquisition Corp (NASDAQ: ARBG) and invests in and advises innovative companies in media, technology and the consumer industries. Prior to ELY, Ms. Taitz was the founder of Catalyst Partners, an investment management firm. After graduating with honors from the University of Pennsylvania majoring in economics and concentrating in marketing, Ms. Taitz began her investment banking career as a mergers and acquisitions analyst at Drexel Burnham Lambert, first as an analyst and then as an associate. Ms. Taitz continued as a Vice President at The Argosy Group (now part of CIBC) and a Managing Director at Crystal Asset Management. Ms. Taitz currentlyis the Chair of Aequi Acquisition Corp and sits on the Boards of Athene Holding Ltd. (“ATH”), Greenlight Capital RE, Ltd. (“GLRE”), and MidCap Finco Holdings Limited, andwhich are private companies. She previously served on the Boards of Apollo Residential Mortgage, Inc. (“AMTG”), Diamond Resorts, International Inc. (“DRII”), Greenlight Capital RE, Ltd. (“GLRE”) as well as Lumenis Ltd. (“LMNS”). On the not for profitnot-for-profit side, Ms. Taitz focuses on education and is an advocate for STEM.
8
Originally sitting on the Board of Girls Who Code, she now is a board member on The New York City Foundation for Computer Science working on CS4All and the 2025 STEM Initiative. Ms. Taitz is also a founding board member of YRFDarca, a member of the Wharton School Undergraduate Executive Board as well as a member of the Center for Social Innovation, and an emeritus board member of Pencils of Promise.
The Board, upon the recommendation of the Nominating and Corporate Governance Committee, has determined that Ms. Taitz should serve as a director, if elected, because of her professional background, experience, education and insight into public markets. Her breadth of experience in the investment banking marketplace and board service at both the public and private levels bringsbring unique perspective to ourthe Board and makes Ms. Taitz well suited to serve on the Board.
Mr. Stanner held increasingly senior positions with Strategic Hotels during his tenure, including Director of Corporate Finance, Senior Vice President—Capital Markets, Acquisitions, Treasurer and Chief Financial Officer. Prior to joining Strategic Hotels & Resorts, Mr. Stanner was an investment banking analyst with Banc of America Securities. Mr. StannerConkling earned a Bachelor of Science in ManagementHotel and Restaurant Administration from the School of Hotel Administration at Cornell University and a Master of Business Administration both from the KrannertJohnson Graduate School of Management at PurdueCornell University.
Christopher R. Eng, 50. Mr. Eng has served as an officer since our initial public offering in 2011. He currently serves as our Executive Vice President, General Counsel, Chief Risk Officer and Secretary. Mr. Eng was previously Vice President, General Counsel and Secretary of our predecessor, The Summit Group from 2004 until our initial public offering. Prior to joining The Summit Group, Mr. Eng was an Assistant Vice President and Trust Officer for The First National Bank in Sioux Falls. Mr. Eng received B.A. degrees in History and English from Augustana College n/k/a Augustana University (S.D.) and a J.D. degree from the University of Denver College of Law.
Paul Ruiz, 54. 56.Mr. Ruiz has served as Summit’s Senior Vice President and Chief Accounting Officer since April 2014. Mr. Ruiz also served as the Company’s interim Chief Financial Officer from May 2014 to October 2014. Prior to joining the Company, Mr. Ruiz served in senior executive roles for companies in a variety of industries, including real estate and technology. From April 2013 to April 2014, he served as a consulting chief financial officer for Bridgepoint Consulting, a financial consulting firm in Austin, Texas. From February 2011 to April 2013, Mr. Ruiz was the Senior Director of Global Corporate Accounting for Freescale Semiconductor, Inc. n/k/a NXP Semiconductors N.V (NASDAQ: NXPI), a global semiconductor manufacturer. From April 2008 to January 2011, Mr. Ruiz was the Chief Financial Officer at Sensortran, Inc. (now part of Halliburton, Inc. -— NYSE: HAL), a fiber-optics based technology company in Austin, Texas. He began his career with Pricewaterhouse CoopersPricewaterhouseCoopers where he was an audit manager, providing audit and business advisory services to entrepreneurial, rapidly growing and Fortune 500 companies. Mr. Ruiz graduated with highest honors from the University of Texas at Austin with a Bachelor of Business Administration in Accounting and earned his MBAM.B.A. from Baylor University. He is a Certified Public Accountant.
9
PROPOSAL 2:
RATIFICATION OF APPOINTMENT OF ERNST & YOUNG, LLP
AS INDEPENDENT REGISTERED PUBLIC ACCOUNTING FIRM OF
THE COMPANY FOR
Our Audit Committee selected the accounting firm of EY to serve as the Company’s independent registered public accounting firm for 2020.2022. Although current laws, rules and regulations, as well as the Audit Committee charter, require the Company’s independent registered public accounting firm to be engaged, retained and supervised by the Audit Committee, the Board considers the appointment of the independent registered public accounting firm to be an important matter of stockholder concern and is submitting the appointment of EY for ratification by stockholders as a matter of good corporate practice. Even if the selection is ratified, the Audit Committee in its discretion may select a different independent registered public accounting firm at any time if it determines that such a change would be in the best interests of the Company. If our stockholders do not ratify the Audit Committee’s selection, the Audit Committee will take that fact into consideration, together with such other factors it deems relevant, in determining its next selection of our independent registered public accounting firm. EY has served as the Company’s independent registered public accounting firm since March 2013. An EY representative will be present at the annual meeting and will be given the opportunity to make a statement if he or she so desires and will be available to respond to appropriate questions.
Recommendation:
OUR BOARD OF DIRECTORS UNANIMOUSLY RECOMMENDS A VOTE FOR RATIFICATION OF THE APPOINTMENT OF EY AS INDEPENDENT REGISTERED PUBLIC ACCOUNTING FIRM OF THE COMPANY FOR 2020.2022.
10
PROPOSAL 3:
ADVISORY (NON-BINDING) VOTE ON EXECUTIVE COMPENSATION
In accordance with the requirements of Section 14A of the Securities Exchange Act of 1934, as amended (the “Exchange Act”), we are providing stockholders with the opportunity to vote on an advisory (non-binding) resolution to approve the compensation of our named executive officers as disclosed in this proxy statement in accordance with the SEC’s rules. This is commonly known as, and is referred to in this proxy statement as, a “say-on-pay” proposal or resolution. The Board intends to hold an advisory (non-binding) vote on the compensation of our named executive officers each year.
This say-on-pay proposal gives our stockholders the opportunity to express their views on our named executive officers’ compensation. We are asking our stockholders to indicate their support for our named executive officers’ compensation as described in this proxy statement. This vote is not limited to any specific item of compensation, but rather addresses the overall compensation of our named executive officers and our philosophy, policies and practices relating to their compensation as described in this proxy statement in accordance with SEC rules.
As described in detail under the heading “Compensation Discussion and Analysis” our executive compensation programs are designed to attract, retain and motivate our named executive officers, who are critical to our success. Our compensation program is designed to create incentives for our named executive officers to maximize long-term stockholder value. Under these programs, our named executive officers are rewarded for the achievement of our annual objectives, long-term and strategic objectives and the realization of increased stockholder value. Please refer to the “Compensation Discussion and Analysis” in this proxy statement for additional details about our executive compensation programs.
Accordingly, we are asking our stockholders to approve, in an advisory (non-binding) vote, the following resolution in respect of this Proposal 3:
“RESOLVED, that the stockholders of the Company approve, on an advisory (non-binding) basis, the compensation of the Company’s named executive officers as disclosed in this proxy statement pursuant to Item 402 of Regulation S-K, including the Compensation Discussion and Analysis, compensation tables and narrative disclosure.”
Recommendation:
OUR BOARD OF DIRECTORS UNANIMOUSLY RECOMMENDS A VOTE FOR ADOPTION OF THIS RESOLUTION ON THE ADVISORY (NON-BINDING) VOTE ON EXECUTIVE COMPENSATION.
11
CORPORATE GOVERNANCE PRINCIPLES AND BOARD MATTERS
The Board has also adopted a Code of Business Conduct and Ethics (“Code of Ethics”) that applies to all of our directors, officers and employees. The purpose of the Code of Ethics is to promote honest and ethical conduct and to promote compliance with all applicable rules and regulations that apply to our Company and our directors, officers and employees. A current copy of the Code of Ethics can be found under “Investors — Corporate Overview — Governance Documents” on our website at www.shpreit.com. Any waiver of the Code of Ethics with respect to our executive officers or directors may be made only by the Board or one of our Board’s committees and will be posted timely on our website.
Our Company was built on relationships with investors, lenders, investment banks, franchise brand companies and with our third partythird-party management companies. Management strives to operate our Company with passion, integrity and excellence. We are committed to being open and transparent about our business practices and performance and remaining accountable for our conduct. We are also committed to our stockholders to create long-term value. We follow through on our commitment to stockholders by implementing what we believe are sound corporate governance practices.
Corporate Responsibility Program
significant progress that we now have a majority-voting standard in uncontested electionsmade with our CRP and look forward to continuing to build on our accomplishments. A current copy of directors; and stockholdersour Corporate Responsibility Report can be found under “Responsibility — About — Download Corporate Responsibility Report” on our website at www.shpreit.com. Neither our Corporate Responsibility Report nor any of the disclosures otherwise included on our website are incorporated by reference into this proxy statement or any other Company nowfiling under the Securities Act of 1933, as amended, or the Securities Exchange Act of 1934, as amended.
Stockholder Right to Amend Bylaws
Stockholders of the Company have the right to amend certain Articles of the Bylaws by the affirmative vote of the holders of a majority of the outstanding shares of common stock pursuant to a binding proposal properly submitted to the stockholders for approval at a duly called annual or special meetingmeetings of stockholders by any stockholder that satisfies the ownership requirements specified in Rule 14(a)-8 under the Exchange Act of 1934, as amended.
Stock Ownership Guidelines
Based on current corporate governance standards, the Board believes all non-employee directors and certain key executive officers should own a meaningful equity interest in our Company to more closely align the interests
12
of directors and executive officers more closely with those of stockholders. Accordingly, the Board has adopted stock ownership guidelines for key executive officers and all non-employee directors.
For purposes of these guidelines, the term “Company common stock” includes, in addition to shares of our common stock, (a) any class of equity securities issued by our operating partnership, Summit Hotel OP, LP (the “Operating Partnership”), that are redeemable for shares of our common stock, whether held directly or indirectly, or by or for the benefit of, immediate family members, and (b) vested and unvested restricted shares of common stock, but excludes (x) stock options, whether exercisable or un-exercisable, (y) unearned performance-based restricted stock and (z) warrants and all other forms of derivative securities.
The Board reviews the minimum equity holdings guidelines for key executive officers on a periodic basis to ensure the guidelines remain consistent with corporate governance best practices and continue to promote the alignment of executive and stockholder interests.
Over time, certain key executive officers are required to hold Company common stock with a value equal to a multiple of their then-current base salary. The equity ownership value for each of these executive officers will be calculated by multiplying the number of shares of Company common stock owned by the ten tradingtrailing ten-trading day trailing volume weighted average price (“VWAP”) of our common stock prior to the date of computation, typically at the end of the fiscal year. The executive officers named in the table below, except Mr. Stanner because he was appointed President and Chief Executive Officer effective January 15, 2021, currently complyhold stock with values at or in excess of the required level. Mr. Stanner has until January 15, 2026 to achieve stock ownership guidelines.at the required level. The equity ownership requirements for our key executive officers are as follows:
| Name | | | Multiple of Base Salary | | |||
| | | | | 6x | | | |
| | | | | 2x | |||
| Christopher R. Eng, EVP, General Counsel & Chief Risk Officer | | | | | 1x | | |
| Paul Ruiz, SVP & Chief Accounting Officer | | | | | 1x | | |
Each non-employee director will beis required to hold a number of shares of Company common stock equal to five times his or her annual cash retainer. The equity ownership value for each non-employee director will be calculated by multiplying the number of shares of Company common stock owned by the trailing ten trading day trailing VWAP of our common stock prior to the date of computation, typically at the end of the fiscal year. Until such time as the required ownership level is achieved, each non-employee director is required to retain at least fifty percent (50%) of the net after-tax profit shares from vesting of equity awards. The Board reviews the minimum equity holdings guidelines for non-employee directors on a periodic basis to ensure the guidelines remain consistent with corporate governance best practices.
Board of Directors Structure & Practices
•
Our Chairman of the Board is independent.
•
Twenty-five percent (25%) of our director nominees are female.
•
Eighty-eight percent (88%) of our director nominees are independent.
•
Thirty-eight percent (38%) of our director nominees are from gender/racially/ethnically underrepresented groups.
•
Our CEO is the only management director.
•
Thoughtful Board refreshment led by the Nominating and Corporate Governance Committee, with three independent directors from gender/racially/ethnically underrepresented groups added since 2017.
•
Three fully independent Board committees — Audit, Compensation and Nominating and Corporate Governance.
•
All Audit Committee members are “audit committee financial experts”.
13
•
All of our directors must be elected annually by majority vote.vote standard.
•
Our directors are subject to a director resignation policy as part of our policy on voting procedures with respect to the electionuncontested elections (see “The Board of directors in uncontested elections.Directors and Its Committees — Policy on Voting Regarding Directors” below).
•
Annual self-evaluations of the three standing committeesperformance of each individual director, each Committee and the Board are independent.as a whole.
•
Our independent directors meet regularly without the presence of any of our officers or employees.
Stockholders Engagement and Investor Outreach Program
The Board is highly engaged in the Company'sCompany’s strategic planning and performance. To that end, building and maintaining long-term relationships with our stockholders is a core goal of the Company. Both management and the Board believe that stockholdersstockholder engagement is a year-round priority and are committed to both proactive and reactive engagement. Management frequently conducts calls, holds meetings or conducts property tours with our large stockholders. In doing so, we provide a forum for discussions and feedback regarding the long-term value creation strategy of the Company. In 2019,2021, management reached out to, met with or engaged directly with a majority of our 50 largest institutional stockholders. These and other meetingsengagements prove invaluable as a way to promote two-way communication with our stockholders regarding the Company'sCompany’s strategic vision for value creation, confirming the value of our stockholder-friendly governance structures and our approach to corporate responsibility.
Anti-Hedging and Anti-Pledging Policies
The Board has adopted an insider trading policy that contains restrictions on hedging and pledging securities issued by us or our Operating Partnership. With respect to hedging, directors and executive officers are prohibited from engaging in any hedging or monetization transactions involving securities issued by us or our Operating Partnership. With respect to pledging, directors and executive officers are prohibited from holding securities issued by us or our Operating Partnership in a margin account or pledging these securities as collateral for a loan. An exception to this anti-pledging policy may be granted if a director or executive officer desires to pledge securities issued by us or our Operating Partnership as collateral for a loan other than margin debt and clearly demonstrates the financial capacity to repay the loan without resort to the pledged securities. Any permitted pledge of securities must be pre-approved by our Chief Executive Officer and our General Counsel. No director or executive officer has pledged securities as collateral for a loan.
Compensation Clawback Policy
The Board has adopted a compensation clawback policy that contains terms to ensure that executives are not unduly enriched by payment of incentives based on financial achievements that are later required to be restated. If our Company is required to restate its audited, consolidated financial results due to material non-compliance with financial requirements under securities laws as a result of misconduct, fraud or negligence as determined in the Board'sBoard’s sole discretion, each executive that is deemed responsible, as determined in the Board'sBoard’s sole discretion while taking into consideration all facts and circumstances shall reimburse the Company up to the full amount of the after-tax value of the incentive compensation that would not have been earned if the restated financial information had been accurately reported initially. In addition, the Board may withhold from those executives deemed non-responsible for a restatement, future awards with equivalent value to that of the after-tax value of the awards initially made to such executive on the basis of the restated financial results, but only to the extent such awards were made within the preceding 24 months.
Succession Planning
The Board, with input from the Nominating and Corporate Governance Committee, regularly reviews our succession plan for the Chief Executive Officer, other executive officers and key employees, to ensure that an appropriate plan is in place for those occurrences that might result in a vacancy in the position of Chief Executive Officer or other management positions.
14
Opt-out of Certain Provisions of Maryland'sMaryland’s Unsolicited Takeovers Act ("MUTA"(“MUTA”)
•
Section 3-803 -— requiring classification of the board of directors into three classes;
•
Section 3-804(a) -— requiring that stockholders may remove any director by the affirmative vote of two-thirds of all the votes entitled to be cast by the stockholders generally in the election of directors;
•
Section 3-804(b) -— requiring that the number of directors be fixed only by vote of the board of directors;
•
Section 3-804(c) -— requiring any vacancy on the board of directors be filled only by the majority vote of the remaining directors and for the remainder of the full term in which the vacancy occurred and until a successor is elected and qualifies; and
•
Section 3-805 -— requiring that a special meeting may only be called upon stockholder request only on the written request of stockholders entitled to cast at least a majority of all the votes entitled to be cast at the meeting.
15
THE BOARD OF DIRECTORS AND ITS COMMITTEES
We are managed under the direction of our Board. OurAs of March 30, 2022, our directors are: Amina Belouizdad, Daniel P. Hansen, Dr. Bjorn R. L. Hanson, Jeffrey W. Jones, Kenneth J. Kay, Mehul Patel, Jonathan P. Stanner, Thomas W. Storey and Hope S. Taitz. Mr. HansenJones is the Chairman of the Board andBoard. As previously reported on Form 8-K filed by the Company on December 7, 2021, Mr. Jones isHansen’s tenure as a director will end in conjunction with our lead independent director (“Lead Independent Director”).2022 annual meeting. Each of our directors stands for election annually.
Board Refreshment
The Board and the Nominating and Corporate Governance Committee believe it is important for the Board to be refreshed by adding new directors from time to time. In 2021, the Board actively explored adding a new director. The Nominating and Corporate Governance Committee conducted a broad search that went beyond traditional candidate pools and purposely considered candidates that possessed key characteristics, including diversity traits, unique skills and new perspectives that could best perpetuate the success of the Company and contribute to the overall effectiveness of the Board. Effective May 13, 2021, Ms. Amina Belouizdad was appointed to the Board as an independent director and currently sits on our Nominating and Corporate Governance Committee and our Compensation Committee. In addition, on January 13, 2022, upon substantial completion of the Company’s acquisition of a 27-property portfolio from NewcrestImage Holdings, LLC, Mr. Mehul Patel was appointed to the Board as an independent director.
Independence of Directors
Our Corporate Governance Guidelines require that a majority of our directors be “independent,” with independence determined in accordance with the applicable standards of the NYSE. The Board may determine a director to be independent if the Board has affirmatively determined that the director has no material relationship with us or our subsidiaries, either directly, or as a stockholder, director, officer or employee of an organization that has a relationship with us or our subsidiaries. The Board has determined that Ms. Belouizdad, Dr. Hanson, Mr. Jones, Mr. Kay, Mr. Patel, Mr. Storey and Ms. Taitz have no material relationship with us or our subsidiaries and therefore, are independent under the applicable standards of the NYSE. As a result, a majority of our directors are independent. Mr. HansenStanner serves as an executive officer and is not considered independent under the applicable standards of the NYSE.
Committees
The Board has established an Audit Committee, Compensation Committee and Nominating and Corporate Governance Committee, and has adopted a written charter for each committee. A copy of each committee charter is available on our website at www.shpreit.com under the heading “Investors –— Corporate Overview –— Governance Documents.”
Audit Committee
The members of the Audit Committee are Mr. Jones (Chair), Dr. Hanson, Mr. Kay and Ms. Taitz. Each member has been determined to be “independent” within the meaning of the applicable standards of the NYSE and Rule 10A-3 of the Exchange Act. In addition, each member meets the financial literacy requirements for audit committee membership under the NYSE’s rules and the rules and regulations of the SEC. The Board has determined that Mr. Jones, Dr. Hanson, Mr. Jones, Mr. Kay and Ms. Taitz each is an “audit committee financial expert” as such term is defined in Item 407(d)(5)(ii) of Regulation S-K.
The Audit Committee is responsible for reviewing and discussing with management and our independent public accountants our annual and quarterly financial statements, engaging independent public accountants, reviewing with the independent public accountants the plans and results of the audit engagement, approving professional services provided by the independent public accountants, reviewing the performance and independence of the independent public accountants, pre-approving audit and non-audit fees and reviewing the adequacy of our internal accounting controls, our internal audit functions and Sarbanes-Oxley Act compliance. The Audit Committee has the power to investigate any matter brought to its attention within the scope of its duties and to retain counsel or outside advisors for this purpose where appropriate. Additionally, theThe Audit
16
Committee is responsible for monitoring our procedures for compliance with the rules for taxation as a real estate investment trust (“REIT”) under Sections 856-860 of the Internal Revenue Code of 1986, as amended.amended (“Internal Revenue Code”). Additionally, the Audit Committee is responsible for monitoring information security risk and information security risk policies and procedures.
Compensation Committee
The members of the Compensation Committee are Mr. Kay (Chair), Ms. Belouizdad, Mr. Jones and Mr. Storey. Each member has been determined to be “independent” within the meaning of the applicable standards of the NYSE. Each member of the Compensation Committee qualifies as an “outside director” as such term is defined under Section 162(m) of the Code and as a “non-employee director” for purposes of Rule 16b-3 of the Exchange Act.
The Compensation Committee exercises all powers delegated to it by the Board in connection with compensation matters. The Compensation Committee is responsible for the review and approval of the compensation and benefits of our executive officers and directors, administration and recommendations to the Board regarding our compensation and long-term incentive plans, and production of the annual reports on executive compensation for inclusion in our proxy statements. In connection with those responsibilities, the Compensation Committee has the sole authority to retain and terminate compensation consultants employed by it to help evaluate our compensation programs. The Compensation Committee also has authority to grant awards under the Company’s 2011 Equity Incentive Plan as Amended and Restated (“Equity Incentive Plan”).
Nominating and Corporate Governance Committee
The members of the Nominating and Corporate Governance Committee are Ms. Taitz (Chair), Ms. Belouizdad, Dr. Hanson (Chair),and Mr. Storey and Ms. Taitz.Storey. Each member has been determined to be “independent” within the meaning of the applicable standards of the NYSE.
The Nominating and Corporate Governance Committee is responsible for monitoring our compliance with corporate governance requirements of state and federal law, and the rules and regulations of the NYSE; developing and recommending to the Board criteria for prospective members of the Board; conducting Board candidate searches and interviews; overseeing and evaluating the Board and management; monitoring compliance with our Code of Ethics and policies with respect to conflicts of interest; reviewing and approving interested transactions pursuant to our related party transaction policy; periodically evaluating the appropriate size and composition of the Board, recommending, as appropriate, increases, decreases and changes in the composition of the Board; and formally proposing the slate of nominees for election as directors at each annual meeting of our stockholders.stockholders; and providing oversight and guidance for the Company’s Corporate Responsibility Program. In addition, this committee annually facilitates the evaluation of the performance of each individual director, each Committee and the Board as a whole, and each individual director.whole.
Compensation Committee Interlocks and Insider Participation
The Compensation Committee consists of Ms. Belouizdad, Mr. Jones, Mr. Kay and Mr. Storey. No member is or has been an employee or officer of the Company. None of our executive officers currently serves, or during the past fiscal year has served, as a member of the board of directors or compensation committee of another entity that has one or more executive officers serving on our Board or Compensation Committee.
Board Leadership Structure
The Board believes it is important to retain the flexibility to allocate the responsibilities of the positions of the Chairman of the Board and the Chief Executive Officer in the way it believes is in ourthe Company’s best interest. Currently, the Board believes that it is in ourthe Company’s best interest not to separate these positions. Mr. Hansen,Jones, an independent director, currently serves as our Chairman of the Board and was appointed to the position effective January 1, 2022. Prior to serving as our non-executive Chairman of the Board, Mr. Jones was our Lead Independent Director. Mr. Stanner is currently our President and Chief Executive Officer and was appointed Chairman of the Board and assumed the roleto those positions effective January 2017.15, 2021.
17
Risk Management Oversight
One of the key functions of our Board is informed oversight of our risk management process as well as strategic risks of the Company. On a regular basis,At least annually, the Company'sCompany’s executive officers or employees responsible for the Company'sCompany’s day-to-day risk management practices present to the Board a comprehensive report on the material risks to the Company.Company, including information security matters. At such times the management team also reviews with the Board the Company'sCompany’s risk mitigation policies and strategies specific to each risk identified. Throughout the year, management monitors the Company'sCompany’s risk profile and updates the Board as new material risks are identified or the aspects of a risk previously identified materially change. The Board recognizes that it is neither possible nor prudent to eliminate all risk and believes that assumption of certain risk is inherent for the Company to be competitive and to achieve its business objectives. Our Board administers this oversight primarily through the Audit Committee but also through the other committees of the Board, as appropriate.
Meetings and Attendance
In 2019,2021, as a result of travel and other restrictions stemming from the COVID-19 pandemic, the Board met five timestwice in person and sixeight times telephonically, the Audit Committee met four timestwice in person and threefive times telephonically, the Compensation Committee met four timestwice in person and twice telephonically, and the Nominating and Corporate Governance Committee met four timestwice in person.person and twice telephonically. Each of our currently serving directors attended at least 75% of the aggregate meetings of the Board and the committees of the Board on which he or she served during 2019.2021.
Executive Sessions of Our Independent Directors
As required by the NYSE rules, the non-employee directors, all of whom are independent under the applicable standards of the NYSE, regularly meet in executive session, without management present. Generally, these executive sessions follow regularly scheduled meetings of the Board and the three standing committees. The independent, non-employee directors met in executive session following regularly scheduled meetings in 2019.2021. Mr. Jones presided over the executive sessions of the Board, and the respective Chair of each committee presided over each such committee’s executive sessions.
Director Nominations
Before each annual meeting of stockholders, the Nominating and Corporate Governance Committee considers the nomination of all directors who are up for election at the next annual meeting of stockholders and also considers new candidates whenever there is a vacancy on the Board, or whenever a vacancy is anticipated due to a change in the size or composition of the Board, a retirement of a director or for any other reason. In addition to considering incumbent directors, the Nominating and Corporate Governance Committee may identify director candidates based on recommendations from directors, stockholders, management and others.
The Nominating and Corporate Governance Committee works with the Board to determine the appropriate characteristics, skills and experience for the Board as a whole and its individual members. In evaluating the suitability of individuals for Board membership, the Nominating and Corporate Governance Committee takes into accountconsiders many factors, including, but not limited to:
•
whether the individual meets the requirements for independence;
•
the individual’s general understanding of the various disciplines relevant to the success of a publicly-tradedpublicly traded company in today’s business environment;
•
the individual’s understanding of the Company’s business;
•
the individual’s professional expertise and educational background; and
•
other factors that promote diversity.diversity, equity and inclusion.
The Nominating and Corporate Governance Committee evaluates each individual in the context of the Board as a whole, with the objective of recommending a group of directors that can best perpetuate the
18
success of our business and represent stockholder interests through the exercise of sound judgment, using its diversity of experience. In determining whether to recommend a director for re-election, the Nominating and Corporate Governance Committee also considers the director’s past attendance at meetings and participation in and contributions to the activities of the Board.
We do not have a formal policy about diversity of Board membership, but the Nominating and Corporate Governance Committee considers a broad range of factors when considering and nominating director candidates to the Board, including differences of viewpoint, professional experience, education, skill, other personal qualities and attributes, race, gender and national origin. The Nominating and Corporate Governance Committee neither includes nor excludes any candidate from consideration solely based on the candidate’s diversity traits.
For purposes of the 20212023 annual meeting of stockholders, the Nominating and Corporate Governance Committee will consider appropriate nominees for directors whose names are submitted in writing by a stockholder. Refer to “Requirements for Proposals Not Intended for Inclusion in Proxy Materials; Director Nominations”, in this proxy statement for more detail. Subject to the discretion of the Nominating and Corporate Governance Committee, we anticipate that any director candidates submitted to us by our stockholders will be evaluated by the Nominating and Corporate Governance Committee on the same basis as any other director.
Policy on Voting Regarding Directors
The Board has adopted a policy on voting regarding directors. Under the policy, at any meeting of stockholders at which members of the Board are to be elected by the stockholders in an uncontested election, any nominee for director who receives a greater number of votes “against” his or her election than votes “for” his or her election will submit to the Board a written offer to resign from the Board no later than two weeks after the certification of the voting results. An uncontested election is one in which the number of individuals who have been nominated for election as a director is equal to, or less than, the number of directors to be elected.
The Nominating and Corporate Governance Committee will consider the resignation offer and, within 60 days after the certification of the voting results, recommend to the Board whether to accept or reject the resignation offer. In determining its recommendation to the Board, the Nominating and Corporate Governance Committee will consider all factors it deems relevant, which may include, (i) any stated reason or reasons why stockholders cast votes “against” for the director, (ii) the qualifications of the director, and (iii) whether the director’s resignation from the Board would be in our best interests and the best interests of our stockholders. The Nominating and Corporate Governance Committee may also consider alternatives to
acceptance or rejection of the resignation offer as the Nominating and Corporate Governance Committee members deem appropriate.
The Board will act on the Nominating and Corporate Governance Committee’s recommendation no later than 90 days after the certification of the voting results. The Board will consider the information, factors and alternatives considered by the Nominating and Corporate Governance Committee and additional information, factors and alternatives the Board deems relevant. The recommendation of the Nominating and Corporate Governance Committee will not be binding on the Board.
Any director who offers to resign as provided above will not participate in the Nominating and Corporate Governance Committee’s or the Board’s consideration of whether to accept his or her resignation offer.
If a director’s resignation offer is accepted by the Board, the Nominating and Corporate Governance Committee will recommend to the Board whether to fill the vacancy created by such resignation or to reduce the number of directors constituting the Board.
If a majority of the members of the Nominating and Corporate Governance Committee were required to offer their resignations, the remaining independent directors will appoint a special committee of the Board to consider the resignation offers and whether to accept the resignation offers.
19
We will publicly disclose the Board’s decision in a Current Report on Form 8-K filed with the SEC, including an explanation of the process by which the decision was made and, if applicable, the reasons for rejecting the resignation offer(s).
Communication with the Board
Stockholders and other interested parties who wish to communicate with the Board, including any non-employee director, or the non-employee directors as a group, or any individual director or directors, may do so by writing to the Chair of the Nominating and Corporate Governance Committee, Board of Directors of Summit Hotel Properties, Inc., 13215 Bee Cave Parkway, Suite B-300, Austin, Texas 78738. The independent, non-employee directors have procedures for the handling of communications from stockholders and other interested parties and have directed our Secretary to act as their agent in processing any communications received. All communications that relate to matters within the scope of the responsibilities of the Board and its standing committees are to be forwarded to the Chair of the Nominating and Corporate Governance Committee. Communications that relate to matters that are within the scope of the responsibilities of one of the Board’s standing committees are also to be forwarded to the chair of the appropriate committee. Communications that relate to ordinary business matters that are not within the scope of the responsibilities of the Board are to be sent to the appropriate member of management. Solicitations, junk mail and obviously frivolous or inappropriate communications will not be forwarded but will be made available to any non-employee director who wishes to review them.
Policy Governing Director Attendance at Annual Meetings of Stockholders
We expect each of our directors to attend the annual meeting unless doing so would be impracticable due to unavoidable conflicts.conflicts or doing so would violate state or local rules and regulations. In 2019,2021, as a result of travel and other restrictions stemming from the COVID-19 pandemic, all of our independent directors attended our annual meeting.meeting telephonically.
20
DIRECTOR COMPENSATION
Our philosophy is to pay non-executive directors competitively and fairly for the work performed. The Compensation Committee annually reviews our director compensation with the assistance of its independent consultant, Frederic W. Cook & Co, Inc. (“FW Cook”), who annually conducts a competitive analysis of our non-employee director pay levels and program design versus the same peer group used in comparisons of executive compensation (see Compensation“Compensation Discussion & Analysis—Analysis — Peer Group Information)Information”). The design of our non-executive director compensation program reflects recognized best practices and incorporates the following provisions: retainer-only cash compensation with no fees for attending meetings, which is an expected part of board service; significant portion of total compensation in full-value equity awards, for alignment with shareholderstockholder interests, with annual grants made based on a fixed-value formula with immediate vesting, to avoid entrenchment; additional retainers for non-executive Chairman of the Board or Lead Independent Director, as applicable, Committee Chairs and committee memberships to recognize additional responsibilities and time commitment; and meaningful share ownership requirements of five times the annual cash retainer.
Directors who are our employees (Mr. Hansen) do not receive compensation for their services as directors. For 2019,2021, our non-employee director compensation program consisted of the following, which remains unchanged for 2020, unless otherwise noted:items noted below.
•
Annual Cash Retainer. We paid anThe annual cash retainer ofwas $50,000 tofor each non-employee director.
•
Additional Annual Committee Membership Fee. We paid anThe additional annual fee for membership on each of our standing committees was as follows: $12,500 for each member of the Audit Committee, was paid $12,500,$10,000 for each member of the Compensation Committee was paid $10,000 and $7,500 for each member of the Nominating and Corporate Governance Committee was paid $7,500. The chair of each respective committee is not paid a committee membership fee.Committee.
•
Additional Annual Committee Chairperson Fee. In lieu of the applicable committee membership fee, we paid the Chairs of each of our standing committeesAdditional annual Committee Chairperson fees were as follows: $12,500 for the Chair of the Audit Committee, was paid $25,000,$10,000 for the Chair of the Compensation Committee was paid $20,000 and $7,500 for the Chair of the Nominating and Corporate Governance Committee was paid $15,000.Committee.
•
Annual Lead Independent Director Fee. We paid ourThe additional annual retainer fee for the Lead Independent Director a $20,000 Lead Independent Director Fee.was $20,000.
•
Annual Non-Executive Chairman Fee. Because in 2019 our Chairman was an executive officer, a Non-Executive Chairman Fee was not paid in 2019.paid.
•
Annual Equity Award. Following the 20192021 annual meeting of stockholders, we granted each non-employee director an equity award consisting of 8,09110,091 shares of our common stock with an aggregate value of approximately $100,000 (the number of shares awarded to each non-employee director was determined by dividing $100,000 by the VWAP of our common stock on the NYSE for the ten trading days preceding the grant date). These shares were granted on May 16, 2019,13, 2021, pursuant to our Equity Incentive Plan and were fully vested on the grant date.
•
Election to Receive Stock in Lieu of Cash Fees. Non-employee directors have the option to elect to receive all or any part of the cash fees we are required to pay them in fully vested shares of our common stock issued under our Equity Incentive Plan based upon the VWAP of our common stock on the NYSE for the ten trading days preceding the grant date. In 2019,2021, no director elected to receive his or her fees in shares of our common stock in lieu of cash.
We reimburse our non-employee directors for reasonable out-of-pocket expenses incurred in connection with the performance of their duties as directors, including without limitation, travel expenses in connection with their attendance at in-person board and committee meetings. Non-employee directors do not receive any meeting fees for attending meetings of the Board or its committees.
21
The table below summarizes the compensation paid by us to our non-employee directors for 2019.2021.
| Name | | | Fees Earned or Paid in Cash ($) | | | Stock Awards ($)(1) | | | Total ($) | | |||||||||
| Amina Belouizdad* | | | | | 50,625 | | | | | | 97,176 | | | | | | 147,801 | | |
| Bjorn R. L. Hanson | | | | | 70,000 | | | | | | 97,176 | | | | | | 167,176 | | |
| Jeffrey W. Jones | | | | | 105,000 | | | | | | 97,176 | | | | | | 202,176 | | |
| Kenneth J. Kay | | | | | 82,500 | | | | | | 97,176 | | | | | | 179,676 | | |
| Thomas W. Storey | | | | | 67,500 | | | | | | 97,176 | | | | | | 164,676 | | |
| Hope S. Taitz | | | | | 77,500 | | | | | | 97,176 | | | | | | 174,676 | | |
| Name | Fees Earned or Paid in Cash ($) | Stock Awards ($)(1) | Total ($) | |||||
| Bjorn R. L. Hanson | 77,500 | 99,115 | 176,615 | |||||
| Jeffrey W. Jones | 105,000 | 99,115 | 204,115 | |||||
| Kenneth J. Kay | 82,500 | 99,115 | 181,615 | |||||
| Thomas W. Storey | 67,500 | 99,115 | 166,615 | |||||
| Hope S. Taitz | 70,000 | 99,115 | 169,115 | |||||
*
Ms. Belouizdad was appointed to the Board effective May 13, 2021.
(1) Amounts reflect the aggregate grant date fair value, calculated in accordance with Accounting Standards Codification (“ASC”) 718, of the stock awards |
| Grant Date | Grantee | Number of Shares (#) | Aggregate Grant Date Fair Value ($) | Reason for Grant | ||||||
| May 16, 2019 | Bjorn R. L. Hanson | 8,091 | 99,115 | Annual equity award | ||||||
| May 16, 2019 | Jeffrey W. Jones | 8,091 | 99,115 | Annual equity award | ||||||
| May 16, 2019 | Kenneth J. Kay | 8,091 | 99,115 | Annual equity award | ||||||
| May 16, 2019 | Thomas W. Storey | 8,091 | 99,115 | Annual equity award | ||||||
| May 16, 2019 | Hope S. Taitz | 8,091 | 99,115 | Annual equity award | ||||||
22
COMPENSATION DISCUSSION AND ANALYSIS
This Compensation Discussion and Analysis (“CD&A”) provides you with information on the Company’s executive compensation programs and practices, and the decisions that the Compensation Committee has made under the program. This CD&A focuses on compensation of our named executive officers for 2019,2021, which were:
| Name | | | Title | |
| Daniel P. Hansen(1) | | | Executive Chairman (prior Chairman, President and Chief Executive | |
| Jonathan P. Stanner(1) | | | President and Chief Executive Officer (prior Executive Vice President, Chief Financial Officer and Treasurer) | |
| William H. Conkling(2) | | | Executive Vice President and Chief Financial Officer | |
| Craig J. Aniszewski(3) | | | Executive Vice President and Chief Operating Officer | |
| Christopher R. Eng | | | Executive Vice President, General Counsel, Chief Risk Officer and Secretary | |
| Paul Ruiz | | | Senior Vice President and Chief Accounting Officer | |
(1)
Effective January 15, 2021, Mr. Hansen transitioned to the role of Executive Chairman and Mr. Stanner transitioned to the role of President and Chief Executive Officer. Mr. Hansen’s term as Executive Chairman ended on January 1, 2022.
(2)
Mr. Conkling was appointed Executive Vice President and Chief Financial Officer effective May 17, 2021.
(3)
Mr. Aniszewski’s employment with the Company ended on March 1, 2022.
Executive Summary
Company’s Continued Response to COVID-19 Pandemic and 2021 Highlights
In 2021, the hospitality industry continued to be negatively affected by the COVID-19 pandemic. The Company, led by the management team, continued to adapt and navigate through a challenging operating environment to achieve significant accomplishments as highlighted below.
Transaction Activity
In January 2022, after extensive negotiations, planning and preparation that began in July 2021, the Company acquired hotels from affiliates of NewcrestImage Holdings, LLC through its joint venture with GIC, Singapore’s sovereign wealth fund (“Joint Venture”). The initial closing included 26 of 27 hotels totaling 3,533 guestrooms, two parking structures, and various financial incentives. The remaining hotel, the newly constructed 176-guestroom Canopy by Hilton New Orleans, was acquired upon its opening in March 2022. The total consideration for the transaction was comprised of $776.5 million, or $209,000 per key, for the 27-hotel portfolio, $24.8 million for the two parking structures, and $20.7 million for the various financial incentives. The transaction was structured to preserve nearly all of the Company’s existing liquidity and is expected to be immediately accretive to earnings, leverage neutral to our balance sheet while preserving ample investment capacity. The Company funded its 51% equity contribution through the issuance of common operating partnership units valued at $160 million and preferred operating partnership units with an annual coupon of 5.25% valued at $50 million. The Joint Venture secured a $410 million term loan and GIC’s equity contribution of $208 million was funded in cash.
In July 2021, the Company acquired through the Joint Venture the 110-guestroom Residence Inn, Steamboat Springs, Colorado for $33 million and in December 2021, the 120-guestroom Embassy Suites by Hilton Tucson / Paloma Village for $25.5 million through the Joint Venture.
In May 2021, the Company contributed a portfolio of six hotels containing 846 guestrooms into the Joint Venture. Total consideration for the portfolio was $172.0 million with GIC contributing $84.3 million in cash to complete the acquisition of their 49% interest. Net proceeds from the transaction were used to repay $62.5 million of the Company’s senior debt, and $20.9 million was retained in cash.
23
Capital Markets & Balance Sheet
Management enhanced the Company’s balance sheet throughout 2021 and subsequent to year-end with the following significant transactions:
•
•
In August, the Company completed an offering of 4,000,000 shares of 5.875% Series F Cumulative Redeemable Preferred Stock for gross proceeds of $100 million. Net proceeds from the transaction were used to invest 51%redeem all 3,000,000 shares of its 6.45% Series D Cumulative Redeemable Preferred Stock, while the remainder was used to partially repay the Company’s existing term loan maturing in 2022 by $22 million.
•
In November, the Company was repaid in full on two mezzanine loans that had a total outstanding balance of $25.8 million and elected to forego the exercise of the equity capitalization of the limited partnership, with GIC investing the remaining 49%. The Company earns fees for providing services to the joint venture and will have the potential to earn incentive fees basedpurchase options on the joint venture achieving certaintwo development projects. The cash proceeds were retained for general corporate purposes and the Company earned an internal rate of return thresholds. of 8% on the debt investment.
Full-Year 2021 Financial Summary*
•
•
Pro Forma RevPAR: Pro forma revenue per available room ("RevPAR"(“RevPAR”) of $159.00 in 2019, which is 25% greater than the Company'sincreased 54.7 percent from 2020 to $81.13. Pro forma average daily rate (“ADR”) increased 7.8 percent from 2020 to $129.98, and pro forma portfolio average RevPARoccupancy increased 43.5 percent to 62.4 percent.
•
Pro Forma Hotel EBITDA: Pro forma hotel EBITDA increased to $109.4 million from $28.8 million in 2020. Pro forma hotel EBITDA margin expanded to 29.6 percent from 12.1 percent in 2020.
•
Adjusted EBITDAre: Adjusted EBITDAre increased to $90.5 million from $14.4 million for 2019.the year ended 2020.
Adjusted FFO:88-guestroom Hampton Inn & Suites, Silverthorne, Colorado Adjusted FFO was $36.8 million, or $0.35 per diluted share, compared to ($38.6) million, or ($0.37) per diluted share, for the year ended 2020.
*
Adjusted EBITDAre and Adjusted FFO are non-GAAP financial measures. For a discussion of Adjusted EBITDAre and Adjusted FFO and a reconciliation of net loss to Adjusted EBITDAre and Adjusted FFO, see “Management’s Discussion and Analysis of Financial Condition and Results of Operations-Non-GAAP Financial Measures” included in our Annual Report on Form 10-K for the fiscal year ended December 31, 2021.
Company’s Commitment to Diversity, Equity and Inclusion
Company Workforce Highlights:
•
•
Race & Ethnicity 18% of Company employees are from racially/ethnically underrepresented groups.
•
Upward Mobility Company promotions in March 2022 comprised of 54% females.
2021 Compensation Highlights
Program
Our executive compensation program consists of base salary, annual cash incentive compensation opportunities and annual long-term equity incentive grants. Our program is designed to be straightforward, transparent and market-based and to comply with sound corporate governance practices.
The chart below contains the key components of our executive compensation program, the purpose of each component and the process for determining each component.
| | | |||||||||||
| Compensation Component | | | | Description and Objectives | | | 2021 Program | | | |||
| | | Base Salary | | | | Fixed cash compensation set at a level reflective of each executive’s performance, market conditions, and competitive rates. | | | | The Compensation Committee considered competitive salary information for the Company’s peer group when establishing | | |
| | | Annual Cash Incentive Compensation | | | | Performance-based cash incentive that rewards achievement of annual company-specific and individual performance objectives. | | | In 2021, the Compensation Committee revised the design of our annual cash incentive program to incorporate performance measures that strongly support our business strategies, with a particular focus on the challenges to our business from the ongoing pandemic. 2021 annual cash incentives were tied to | | |
25
| | | Compensation Component | | | | Description and Objectives | | | | 2021 Program | | |
| | Long-Term Equity Incentives | | | | Equity incentives that align executive compensation with total stockholder return over multi-year performance and vesting periods that encourage the retention of key talent. | | | | In Based on our 3-year TSR beginning on March | | |
Compensation Best Practice Policies
We maintain several stockholder-friendly compensation policies, including stock ownership guidelines, a compensation clawback policy, and anti-hedging and anti-pledging policies (refer to “Corporate Governance Principles and Board Matters” for more detail on these policies). In addition, our employment agreements with executive officers have non-compete provisions, require a double trigger for any severance payouts in connection with a change-in-control and do not provide excise tax gross-up payments.
Results of Stockholder Say-on-Pay Votes
Each year, the Compensation Committee considers the outcome of the stockholder advisory (non-binding) vote on executive compensation when making decisions relating to the compensation of our named executive officers and our executive compensation program design, structure and policies.
Stockholders continued their significant support for our executive compensation program with more than 98% of the votes cast in favor of the “say-on-pay” proposal at our 20192021 annual meeting of stockholders. The Compensation Committee believes that the voting results, together with the over 97% average approval received over the last three years, conveyed our stockholders’
strong support of the philosophy, design and structure of our executive compensation program. The Compensation Committee will continue to consider the results of the stockholders’ say-on-pay votes when making decisions about our executive compensation program.
Objectives of Our Executive Compensation Program
Our executive compensation philosophy is designed to promote the following objectives:
•
Assist in attracting and retaining talented and well-qualified executives by offering compensation opportunities competitive with other lodging REITs;
•
Motivate our executives to manage our business to meet our near-, medium- and long-term objectives and reward them for meeting these objectives;
•
Align the interestinterests of our executives and stockholders by motivating executives to increase stockholder value and rewarding executives when stockholder value increases; and
26
•
Maintain high standards of corporate governance.
Role of the Compensation Committee and Management
The Compensation Committee is responsible for determining the amount and composition of compensation paid to our Chief Executive Officer and all other executive officers. The Compensation Committee exercises its independent judgment in reviewing and approving the executive compensation program as a whole, as well as specific compensation levels for each executive officer. Additionally, the Compensation Committee reviews and considers the recommendations of Mr. HansenStanner with respect to compensation decisions of our named executive officers other than himself. The Compensation Committee believes it is valuable to consider the recommendations of Mr. HansenStanner with respect to these matters because, given his knowledge of our operations and the day-to-day responsibilities of our executive officers, he is in a unique position to provide the Compensation Committee perspective into the performance of our executive officers in light of our business at a given point in time.
Role of the Compensation Consultant
The Compensation Committee has retained FW Cook as its independent compensation consultant. The Compensation Committee has determined that FW Cook meets the criteria for an independent consultant in accordance with SEC guidelines for such service. FW Cook reports directly to the Compensation Committee and works with management only at the request and under the direction of the Compensation Committee. To assist the Compensation Committee in the development of our 20192021 executive compensation program, FW Cook conducted a comprehensive review of our executive compensation program in terms of the competitiveness of our target compensation opportunities and the appropriateness of our incentive programs in supporting our business strategy. On March 7, 2019, the Compensation Committee, based on the recommendations of FW Cook, established the terms of our 2019 executive compensation program.
Peer Group Information
In general, the Compensation Committee uses comparative data from various companies in certain peer groups as a guide in its review and determination of base salaries, annual cash bonuses and annual equity awards.
For our 2019the compensation program review that informed decisions on target pay opportunities and program structure for 2021, the Compensation Committee, with the help of FW Cook, established the peer group used to evaluate the competitiveness of our existing executive compensation program. The peer group consisted of the following 10 public REITs that primarily invest in hotels and four other public REITs outside of the hotel sector whichthat were comparable in terms of market capitalization size and executive team members that the Compensation Committee and FW Cook considered to be the most relevant peers. To inform executive decisions on target pay opportunities and program structure for 2019, our peer group consisted of the following companies:
| | Apple Hospitality REIT, Inc. | | | LTC Properties, Inc. | |
| | CareTrust REIT, Inc. | | | New Senior Investment Group, Inc. | |
| Chatham Lodging Trust | | | Pebblebrook Hotel Trust | ||
| Community Healthcare Trust Inc. | | | RLJ Lodging Trust | | |
| | Core Point Lodging, Inc. | | RPT Realty | | |
| | DiamondRock Hospitality Company | | Sunstone Hotel Investors, Inc. | | |
| | Hersha Hospitality Trust | | |||
| | Xenia Hotels & Resorts | |
Elements of 20192021 Executive Compensation
Target TDC for 2019 is described below and consists2021 consisted of salary, target annual cash incentives and target long-term equity incentives. The Compensation Committee considered the mix of the three components of TDC and significantly weighted the long-term equity incentive component the highest for most named executive officers to align compensation with long-term stockholder value. The Company’s targetTarget TDC for each executive generally approximates the market median, and the mix between compensation elements is generally consistent with the mix used by companies in our peer group.
| Name | Salary ($) | Annual Cash Incentive ($)(1) | Long-Term Incentives ($)(2) | Target TDC ($) | Comparison to Peer Group | ||||||||
| Daniel P. Hansen | 700,000 | 1,050,000 | 2,800,000 | 4,550,000 | Approximates median | ||||||||
| Craig J. Aniszewski | 450,000 | 450,000 | 1,100,000 | 2,000,000 | Approximates median | ||||||||
| Jonathan P. Stanner | 450,000 | 450,000 | 1,100,000 | 2,000,000 | Approximates median | ||||||||
| Christopher R. Eng | 375,000 | 375,000 | 450,000 | 1,200,000 | Approximates median | ||||||||
| Paul Ruiz | 300,000 | 210,000 | 400,000 | 910,000 | Approximates median | ||||||||
27
| Name | | | Salary ($) | | | Annual Cash Incentive ($)(1) | | | Long-Term Incentives ($)(2) | | | Target TDC ($) | | ||||||||||||
| Daniel P. Hansen | | | | | 500,000 | | | | | | — | | | | | | 1,500,000 | | | | | | 2,000,000 | | |
| Jonathan P. Stanner | | | | | 600,000 | | | | | | 900,000 | | | | | | 2,500,000 | | | | | | 4,000,000 | | |
William H. Conkling(3) | | | | | 450,000 | | | | | | 450,000 | | | | | | 1,100,000(4) | | | | | | 2,000,000 | | |
| Craig J. Aniszewski | | | | | 450,000 | | | | | | 450,000 | | | | | | 1,100,000 | | | | | | 2,000,000 | | |
| Christopher R. Eng | | | | | 375,000 | | | | | | 375,000 | | | | | | 450,000 | | | | | | 1,200,000 | | |
| Paul Ruiz | | | | | 300,000 | | | | | | 210,000 | | | | | | 400,000 | | | | | | 910,000 | | |
(1)
Reflects the “target” level payout of our annual cash incentive award program. Given Mr. Hansen’s transition to the role of Executive Chairman in January 2021, the Compensation Committee did not include an annual cash incentive award as part of his TDC as Mr. Hansen did not participate in the Company’s day-to-day operations.
(2)
Reflects the “target” level value of long-term incentive awards consisting 60% of performance share awards and 40% of time-based awards, other than for Mr. Hansen whose award was made 100% in time-based awards as Mr. Hansen did not participate in the Company’s day-to-day operations. The Compensation Committee determines the intended target dollar value. The number of shares issued to each executive is determined by dividing the intended value of the award by the average of the trailing 10-day VWAP of our common stock prior to the date of grant. The grant-date fair value of long-term incentive awards as disclosed in the Summary Compensation Table and Grants of Plan-Based Awards Table may be different.
(3)
Mr. Conkling was appointed Executive Vice President and Chief Financial Officer effective May 17, 2021. These values reflect his annualized salary, target bonus and target long-term incentive award.
(4)
Represents Mr. Conkling’s target long-term incentive award, which was granted in May 2021 when he was appointed, and which may be earned under the same terms and conditions as the long-term incentive awards granted to Company executives in 2021. In addition, and not reflected in the table above, Mr. Conkling received a one-time, sign-on award of $750,000 in restricted shares of common stock that will vest over a three-year period, which was intended to replace compensation forfeited from his prior employer.
Base Salary
Base salaries are designed to provide a fixed level of compensation that serves as a retention tool. Base salaries are reviewed annually by the Compensation Committee and are subject to annual increasesadjustments at the discretion of the Compensation Committee. In determiningFor executives who remained in the same position in 2021 as they held in 2020, salaries were not adjusted. Mr. Hansen’s base salary increases for 2019, thewas reduced in connection with his transition from Chairman, President and Chief Executive Officer to Executive Chairman, effective January 15, 2021. Mr. Stanner’s base salary was increased in connection with his promotion from Executive Vice President and Chief Financial Officer to President and Chief Executive Officer, effective January 15, 2021. The Compensation Committee considered each executive officer’s individual performance and corporate performance, as well as our Company’s overall performance,determined these salary adjustments based on market conditions and competitive salarycompensation information for the peer group described above. Based on the competitive review as well as the factors outlined above, the Compensation Committee set basesimilar positions at other companies. Base salaries for 20192021 for our named executive officers were as follows:
| Name | | | 2021 ($) | | | 2020 ($) | | | Percentage Increase/(Decrease) | | |||||||||
| Daniel P. Hansen | | | | | 500,000 | | | | | | 700,000 | | | | | | (29)% | | |
| Jonathan P. Stanner | | | | | 600,000 | | | | | | 450,000 | | | | | | 33% | | |
| William H. Conkling | | | | | 450,000 | | | | | | — | | | | N/A | | |||
| Craig J. Aniszewski | | | | | 450,000 | | | | | | 450,000 | | | | | | —% | | |
| Christopher R. Eng | | | | | 375,000 | | | | | | 375,000 | | | | | | —% | | |
| Paul Ruiz | | | | | 300,000 | | | | | | 300,000 | | | | | | —% | | |
| Name | 2019 ($) | 2018 ($) | Percentage Increase | ||||||
| Daniel P. Hansen | 700,000 | 700,000 | — | % | |||||
| Craig J. Aniszewski | 450,000 | 450,000 | — | % | |||||
| Jonathan P. Stanner | 450,000 | 425,000 | 6 | % | |||||
| Christopher R. Eng | 375,000 | 350,000 | 7 | % | |||||
| Paul Ruiz | 300,000 | 300,000 | — | % | |||||
28
Annual Cash Incentive Compensation Program
Our 20192021 annual cash incentive program was designed to provide the named executive officers an opportunity to earn compensation based on the achievement of challenging company-specific performance goals and the executive’s achievement of individual performance goals.goals set against the continuing pandemic.
In 2021, the Compensation Committee revised the design of our annual cash incentive program to incorporate performance measures that strongly support our business strategies, with a particular focus on the challenges to our business from the ongoing pandemic. The performance measures and weightings established by our Compensation Committee for 20192021 under our annual cash incentive compensation program are set forth below. When determining the AFFO metric the Compensation Committee took into consideration the challenging operating environment, including escalating labor costs, property tax increases and disruptions from hotel renovations along with difficult year-over-year comparisons in certain markets and the Company's transaction activity during the year which reduced the number of hotel rooms in the portfolio. The Company's AFFO targets for 2019 were lower than for 2018, reflecting the the Company's strategy of selling non-core hotels and redeploying proceeds, which has a near-term dilutive effect on AFFO per share, but is expected to drive long-term stockholder value. When determining the RevPAR Growth metric the Compensation Committee took into consideration a challenging operating environment, including disruption from hotel renovations, continued competition from new supply and difficult year-over-year comparisons in certain markets.
| Corporate Performance Measure | Weight | Threshold | Target | Maximum | Actual Company/Individual Results | |||||
| 2019 AFFO per share | 60% | $1.15 | $1.23 | $1.27 | $1.25 | |||||
| 2019 RevPAR Growth (same store) | 20% | —% | 1.25% | 3.00% | 1.10% | |||||
| Individual Performance | 20% | Specific for each individual | Specific for each individual | Specific for each individual | * | |||||
| Corporate Performance Measure | | | Total Weight | | |||
| | | | 25% | | | ||
| Balance Sheet Objective | | | | | 25% | | |
| Transactions Objective | | | | | 15% | | |
| ESG Objective | | | | | 15% | | |
| Individual Performance | | | | | 20% | | |
| Total | | | | | 100% | | |
The Operating Objective of the 20192021 annual incentive program AFFO per share was calculated as our net income or loss as set forthSame Store Hotel EBITDA, measured on a consolidated basis and adjusted for any sold hotels during 2021. Hotel EBITDA contribution from hotels acquired during 2021 were excluded. Same Store Hotel EBITDA goals at the Threshold, Target and Maximum levels were:
•
Threshold:
$65 million
•
Target:
$80 million
•
Maximum:
$95 million
Actual 2021 Same Store Hotel EBITDA was $106 million, resulting in our audited consolidated financial statementspayout at the Maximum level for this measure.
2021 Balance Sheet Objective
The Balance Sheet Objective was established to gauge management’s ability to enhance the year ending December 31, 2019, less preferred dividendsCompany’s balance sheet and excluding gains (or losses) from salesliquidity, manage the uncertainty surrounding the return of propertylodging demand and impairment losses, plus depreciationto position the Company to take advantage of opportunistic transactions to grow the Company’s business. Achievement toward this objective included the following:
•
Amendment of the Company’s and amortization (including amortizationJoint Venture’s revolving credit and term loan facilities;
•
Issuance of $287.5 million of convertible notes to repay nearly $260 million of bank debt, including reducing the Company’s revolving credit facility balance to zero;
•
Completed a $100 million Series F Preferred Stock offering priced at 5.875% to redeem entire outstanding $75 million Series D Preferred stock and repay term loan; and
•
Renegotiation of mezzanine loan agreement to receive $2.6 million of deferred financing costsinterest paid current.
The Compensation Committee holistically evaluated the management team’s performance against the aforementioned factors and amortizationdetermined performance warranted payout at the Target level for this measure.
2021 Transactions Objective
The Transactions Objective was intended to reward the team’s sourcing and execution of franchise application fees), as further adjusted to exclude hotel transaction and pursuit costs, equity based compensation, debt transaction costs, gain (or loss) on derivative instruments and such other items, including nonrecurring expenses as set forth in our Annual Report on Form 10-K filed on February 25, 2020, with the SEC ("Annual Report") and confirmedhigh-quality acquisitions governed by the Compensation Committee. A reconciliation of AFFO to our GAAP net incomeCompany’s risk adjusted return driven investment discipline. The Threshold, Target and Maximum goals for thethis measure were:
29
•
Threshold:
•
Target:
$250 million of hotel acquisitions
•
Maximum:
$400 million of hotel acquisitions
Actual acquisition volume in 2021 (including the acquisitions announced in 2021 that substantially closed within the first two weeks of 2022) exceeded $1 billion, resulting in payout at the Maximum level for this measure.
ESG Objective
The ESG Objective was established to advance the Company’s ESG program with the following areas of focus:
•
Establish a formal internal ESG management committee to guide ESG initiatives;
•
Conduct Company-wide employee educational sessions on the purpose and importance of ESG, including how the program aligns with the Company’s overall corporate mission of creating value for all stakeholders, including customers, suppliers, employees, vendors and our Annual Report. communities;
•
Developing a schedule for Company hotels to identify opportunities to enhance energy and water efficiency during renovations or targeted investments;
•
Establish key performance measurements and goals for long-term reductions in greenhouse gas emissions, water consumption and waste (including recycling/upcycling); and
•
Increase the number of green certified hotels or number of hotels with green management systems to include 10% of the portfolio by year-end 2021.
The 2019 RevPAR component was calculated as a year-over-year comparison of RevPARCompensation Committee holistically evaluated the management team’s performance against the aforementioned factors and determined performance warranted payout at the Target level for our same store hotels (hotels owned for the entire years ended December 31, 2018 and December 31, 2019, excluding assets held for sale).this measure.
2021 Individual Performance
For the 20192021 Individual Performance component of the annual incentive program, the Compensation Committee established individual performance metricsobjectives for the named executive officers in the first quarter of 2019.officers. Objectives were personal todesigned for each executive and varied based upon the executive’s position and responsibilities as they related to the Company’s overall business plan. The objectives of each executive are summarized below. Each executive exceeded expectations for individual performance and contributed significantly to advancing our strategic plans in 2019.below:
•
Mr. Hansen’sStanner’s objectives primarily involved successfully transitioning to the role of Chief Executive Officer, enhancing the strategic review process, evolving the Company’s succession plans for key senior positions, and leading and managing the Company’s recovery from the ongoing effect of the COVID-19 pandemic;
•
Mr. Conkling’s objectives primarily involved successfully transitioning to the role of Chief Financial Officer, engaging in the strategic planningreview process, succession planning and organizational development programs;leading and managing the Company’s recovery from the ongoing effect of the COVID-19 pandemic;
•
Mr. Aniszewski’s objectives primarily involved maintainingthe continued development of the Company’s asset management team, preparation of a RevPAR indexmulti-year renovation and construction plan, certain operational goals, and leading and managing the Company’s recovery from the ongoing effect of 113%, integrating new project management software to create efficiencies and leveraging available data platforms to develop a corporate data analytics plan to improve future operating results;the COVID-19 pandemic;
•
Mr. Eng’s objectives primarily involved reviewingensuring the Company continues to operate in an appropriate risk profile, contributing to the evaluation and prioritizing risks withinexecution of growth opportunities, working with outside counsel on pursuit of COVID-19 business interruption insurance claim litigation, and leading and managing the corporate enterprise risk management programCompany’s recovery from the ongoing effect of the COVID-19 pandemic; and implementing risk mitigation strategies on high-priority items and analyzing legal constraints of strategic growth initiatives; and
•
Mr. Ruiz'sRuiz’s objectives primarily involved reviewing the Company’s internal audit function and prioritizing risks withinengaging a third-party firm to perform the corporate enterprise risk managementwork, enhancing the Company’s ESG program and implementing risk mitigation strategies on high-priority items, overseeing the transitionincluding timely filing of the Company's internal audit departmentCompany’s Corporate Responsibility Report, and developingleading and managing the Company’s recovery from the ongoing effect of the COVID-19 pandemic.
30
The rigorous individual performance metrics were designed to challenge our named executive officers during trying times. The Compensation Committee determined that each named executive officer performed at a high level and exhibited strong leadership in directing the Company and its employees during the unprecedented times defined by the pandemic. No executive was guaranteed an approachaward under the Individual Performance component. Payouts under the Individual Performance component could be zero or range from 15% of base salary to eliminate unremediated deficiencies, significant deficiencies or risk60% of material weakness in financial controls, if any.base salary for Mr. Stanner; 10% of base salary to 40% of base salary for Messrs. Aniszewski, Conkling and Eng; and 7% of base salary to 28% of base salary for Mr. Ruiz. Based on the Compensation Committee’s evaluation of each executive’s individual performance, payouts ranged from 100% to 130% of Target for the Individual Performance component for the named executive officers.
The total annual cash incentive opportunity ranges for 2019,2021, and the actual total cash incentive compensation earned and paid for 20192021 performance as a percentage of base salary, were as follows:
2019 Cash Incentive Opportunity (% of Base Salary) | 2019 Cash Incentive Earned | 2019 Cash Incentive Earned | |||||||||||||||||||||||||||||||||||||||
| | | 2021 Annual Cash Incentive Opportunity (% of Base Salary) | | 2021 Annual Cash Incentive Earned | | 2021 Annual Cash Incentive Earned | | ||||||||||||||||||||||||||||||||||
| Name | Threshold | Target | Maximum | % of Base Salary | $ | | Threshold | | Target | | Maximum | | % of Target | | $ | | |||||||||||||||||||||||||
| Daniel P. Hansen | 75% | 150% | 300% | 193% | 1,352,400 | ||||||||||||||||||||||||||||||||||||
| Jonathan P. Stanner | | | | 75% | | | | | 150% | | | | | 300% | | | | | 140% | | | | | 1,260,000 | | | |||||||||||||||
| William H. Conkling | | | | 50% | | | | | 100% | | | | | 200% | | | | | 146% | | | | | 657,000 | | | |||||||||||||||
| Craig J. Aniszewski | 50% | 100% | 200% | 127% | 570,600 | | | | 50% | | | | | 100% | | | | | 200% | | | | | 142% | | | | | 639,000 | | | ||||||||||
| Jonathan P. Stanner | 50% | 100% | 200% | 133% | 597,600 | ||||||||||||||||||||||||||||||||||||
| Christopher R. Eng | 50% | 100% | 200% | 131% | 490,500 | | | | 50% | | | | | 100% | | | | | 200% | | | | | 140% | | | | | 525,000 | | | ||||||||||
| Paul Ruiz | 35% | 70% | 140% | 89% | 266,280 | | | | 35% | | | | | 70% | | | | | 140% | | | | | 146% | | | | | 306,600 | | | ||||||||||
The following table sets forth the payouts under the AFFO per share component,Operating Objective, the RevPAR Growth componentBalance Sheet Objective, the Transactions Objective, the ESG Objective and the Individual Performance componentObjective that each executive earned in 2019:2021:
| Name | | | Operating Objective Payout ($) | | | Balance Sheet Objective Payout ($) | | | Transactions Objective Payout ($) | | | ESG Objective Payout ($) | | | Individual Performance Objective Payout ($) | | | Total 2021 Annual Cash Incentive Payout ($) | | ||||||||||||||||||
| Jonathan P. Stanner | | | | | 450,000 | | | | | | 225,000 | | | | | | 270,000 | | | | | | 135,000 | | | | | | 180,000 | | | | | | 1,260,000 | | |
| William H. Conkling | | | | | 225,000 | | | | | | 112,500 | | | | | | 135,000 | | | | | | 67,500 | | | | | | 117,000 | | | | | | 657,000 | | |
| Craig J. Aniszewski | | | | | 225,000 | | | | | | 112,500 | | | | | | 135,000 | | | | | | 67,500 | | | | | | 99,000 | | | | | | 639,000 | | |
| Christopher R. Eng | | | | | 187,500 | | | | | | 93,750 | | | | | | 112,500 | | | | | | 56,250 | | | | | | 75,000 | | | | | | 525,000 | | |
| Paul Ruiz | | | | | 105,000 | | | | | | 52,500 | | | | | | 63,000 | | | | | | 31,500 | | | | | | 54,600 | | | | | | 306,600 | | |
| Name | AFFO per share Payout ($) | RevPAR Growth Payout ($) | Individual Performance Payout ($)(1) | Total 2019 Cash Incentive Payout ($) | ||||
| Daniel P. Hansen | 945,000 | 197,400 | 210,000 | 1,352,400 | ||||
| Craig J. Aniszewski | 405,000 | 84,600 | 81,000 | 570,600 | ||||
| Jonathan P. Stanner | 405,000 | 84,600 | 108,000 | 597,600 | ||||
| Christopher R. Eng | 337,500 | 70,500 | 82,500 | 490,500 | ||||
| Paul Ruiz | 189,000 | 39,480 | 37,800 | 266,280 | ||||
Long-Term Incentive Compensation
Long-term equity incentives granted in 20192021 consisted of a combination of performance-based and time-based stock awards. The Compensation Committee determined a target total long-term incentive grant value for each named executive officer. Mr. Hansen’s 2021 long-term incentive grant value was substantially lower than his 2020 grant value and awarded 100% in time-based restricted shares of common stock to reflect his new role as Executive Chairman. Mr. Stanner’s long-term incentive grant value was higher than his 2020 grant value to reflect his promotion to President and Chief Executive Officer. For all executives,Messrs. Stanner, Conkling, Aniszewski, Eng and Ruiz, the ongoing annual long-term incentive awards were granted 60% in the form of performance-based stock (at target) and 40% in the form of time-based stock. In addition, Mr. Conkling received a one-time, sign-on award of $750,000 in restricted shares of common stock that will vest over a three-year period, which was intended to replace compensation forfeited from his prior employer.
| Name | Performance-Based Stock Target Value ($) | Time-Based Stock Value ($) | Total LTI Grant Value at Target ($) | ||||||
| Daniel P. Hansen | 1,680,000 | 1,120,000 | 2,800,000 | ||||||
| Craig J. Aniszewski | 660,000 | 440,000 | 1,100,000 | ||||||
| Jonathan P. Stanner | 660,000 | 440,000 | 1,100,000 | ||||||
| Christopher R. Eng | 270,000 | 180,000 | 450,000 | ||||||
| Paul Ruiz | 240,000 | 160,000 | 400,000 | ||||||
31
| Name | | | Performance-Based Stock Target Value ($) | | | Time-Based Stock Value ($) | | | Total LTI Grant Value at Target ($) | | |||||||||
Daniel P. Hansen(1) | | | | | — | | | | | | 1,500,000 | | | | | | 1,500,000 | | |
| Jonathan P. Stanner | | | | | 1,500,000 | | | | | | 1,000,000 | | | | | | 2,500,000 | | |
William H. Conkling(2) | | | | | 660,000 | | | | | | 1,190,000 | | | | | | 1,850,000 | | |
| Craig J. Aniszewski | | | | | 660,000 | | | | | | 440,000 | | | | | | 1,100,000 | | |
| Christopher R. Eng | | | | | 270,000 | | | | | | 180,000 | | | | | | 450,000 | | |
| Paul Ruiz | | | | | 240,000 | | | | | | 160,000 | | | | | | 400,000 | | |
(1)
Mr. Hansen was not awarded a performance-based stock award in 2021.
(2)
In connection with Mr. Conkling’s appointment he received a) $1.1 million in target value of “ongoing” long-term incentive awards, with 60% in the form of performance-based stock awards and 40% in the form of time-based stock awards with the same terms and conditions as the ongoing long-term incentive awards granted to Company executives in 2021, and b) a one-time, sign-on award of $750,000 in restricted shares of common stock that will vest over a three- year period, which was intended to replace compensation forfeited from his prior employer.
The Compensation Committee granted these stock awards under the Company’s Equity Incentive Plan. The number of shares granted was based on the VWAP of our common stock for the ten trading days preceding the grant date. Note that the grant-date fair values, as reported in the Summary Compensation Table and the Grants of Plan-Based Awards table, differ from the values shown in the table above because the grant-date fair value of each performance-based award is based on a Monte Carlo value and the grant-date fair value of each time-based award is based on the closing share price on the grant date.
Performance-Based Stock Awards
| Company 3-Year TSR Percentile Rank vs. | | | Percent of Target Shares Earned | | |||
< 30th Percentile | | | | 0% | | | |
30th Percentile | | | | | 25% | | |
55th Percentile | | | | | 100% | | |
≥ 80th Percentile | | | | | 200% | | |
The number of shares earned will be linearly interpolated for performance between the 30th and 55th percentile and for performance between the 55th and 80th percentile. In addition, if the Company’s absolute TSR is equal to or greater than 8.5% per year (or 25.5% cumulative over the Performance Period), at least 25% of the performance-based shares will be earned.
The Company entered into stock award agreements with the above-named executive officers, effective as of March 7, 2019,8, 2021, setting forth the terms and conditions of the performance-based stock awards. Except as described below, no performance-based shares will vest unless the executive remains in the continuous employ of the Company from the date of grant until March 7, 2022.8, 2024. On and after the date of the grant and prior to forfeiture of any of the performance-based shares, the executives will have the right to vote the shares that have been issued (i.e., the target number). Cash dividends on the performance-based shares will be accumulated and will only be paid to the executives to the extent the underlying performance-based share is earned.
If a “change in control” (as(as defined in the Company’s Equity Incentive Plan), occurs prior to the conclusion of the Performance Period, the performance-based shares will be earned based on the Company’s
32
relative or absolute TSR performance as described above up to the date of the change in control, and any earned shares will be fully vested on the third anniversary of the grant date (the end of the original performance period), subject to acceleration if either (a) the successor entity does not assume or replace the award, or (b) the participant is terminated without cause or is voluntarily terminated for good reason. Under these circumstances, the executives will be entitled to receive any dividend equivalent payments to which they are entitled under the terms of the stock award agreements.
If an executive’s employment is terminated on account of death or disability, termination without cause or voluntary termination for good reason, the performance-based shares may be earned contingent upon the attainment of the relative or absolute TSR performance hurdles at the end of the Performance Period. However, the number of performance-based shares earned by the executive, and the amount of any dividend equivalent payments to which the executive is entitled pursuant to the terms of the stock award agreement, will be adjusted pro rata based on the amount of time the executive was employed by the Company during the Performance Period.
For purposes of the performance-based stock awards, the Company’s TSR will be calculated as the total percentage return per share of the Company’s common stock calculated in accordance with the methods used by SNL Financial to calculate TSR. The TSR for the Index Companies will be calculated in the same manner.
Performance-Based Stock Awards Vesting
Based on our 3-year TSR beginning on March 6, 20177, 2019 and ending March 6, 2020, all the7, 2022, certain previously granted performance-based restricted stock awards granted to executives on March 6, 2017 were forfeited as a resultearned at 137% of performance metrics not being met.target. See Footnote (3)(4) under “Outstanding Equity Awards at Fiscal Year-End”.
Time-Based Stock Awards
2024.
Except as described below, no time-based shares will vest unless the executive remains in the continuous employ of the Company from the date of grant until the applicable vesting date. If a “change in control” (as(as defined in the Company’s Equity Incentive Plan) occurs prior to vesting and if the successor entity does not assume or replace the time-based shares, theyall unvested time-based shares will vest on a “control change date”, as defined in the Equity Incentive Plan, if the executive remains in the continuous employ of the Company from the date of grant until the control change date. In addition, all of the time-based shares (if not sooner vested), will vest on the date that the executive’s employment with the Company ends on account of the executive’s death or disability,“disability”, or if the executive’s employment is terminated without cause,“cause”, or if the executive resigns for good reason.
“good reason” (each as defined in the employment agreement between the Company and the executive).
Any time-based shares that have not vested as described above may not be transferred and will be forfeited on the date the executive’s employment with the Company terminates. On and after the date of grant and prior to forfeiture of any time-based shares, the executive will have the right to vote the time-based shares and to receive, free of all restrictions, all dividends declared and paid on the Company’s common stock, whether or not vested.
Other Benefits; 401(k) Plan
We provide benefits such as medical, dental and life insurance and disability coverage for all of our employees, including our named executive officers. We also provide personal paid time off and other paid holidays to all employees, including the named executive officers. We believe that our employee benefit plans are an appropriate element of compensation and are necessary to attract and retain employees.
We maintain a retirement savings plan under section 401(k) of the Internal Revenue Code to cover our eligible employees. We currently match 100% of each eligible participant’s contributions, within prescribed
33
limits, up to 3% of such participant’s base salary and 50% of each eligible participant’s contributions up to an additional 2% of the participant’s base salary. In 2019, Messrs. Hansen, Aniszewski, Stanner, Eng and Ruiz each received $11,200 in matching contributions.
Employment Agreements
To specify our expectations with regard to our executive officers’ duties and responsibilities, and to provide greater certainty with regard to the amounts payable to our executive officers in connection with certain terminations or change in control events, the Board has approved, and we have entered into employment agreements with each of our executive officers. We believe that the terms of the employment agreements provide these executives with day-to-day employment stability and enable them to properly focus their attention on their duties and responsibilities with the company, thereby promoting productivity.
Tax Deductibility of Executive Compensation
The Compensation Committee considers the anticipated tax treatment to the Company and the executive officers in its review and establishment of compensation programs and payments. The deductibility of some types of incentive compensation payments can depend upon the timing of the executive’s vesting or exercise of previously granted rights. Interpretations of and changes in applicable tax laws and regulations, as well as other factors beyond the committee’s control, also can affect deductibility of compensation. The Compensation Committee’s general policy is to maintain flexibility in compensating executive officers in a manner designed to promote varying corporate goals. Accordingly, the Compensation Committee has not adopted a policy that all compensation must be deductible.
Accounting Standards
ASC 718 requires us to recognize an expense for the fair value of equity-based compensation awards. Grants of equity awards under our Equity Incentive Plan will be accounted for under ASC 718. The Compensation Committee will regularly consider the accounting implications of significant compensation decisions, especially in connection with decisions that relate to our equity plans and programs. As accounting standards change, we may revise certain programs to appropriately align accounting expenses of our equity awards with our overall executive compensation philosophy and objectives.
34
COMPENSATION COMMITTEE REPORT
The Compensation Committee of the Board of Summit Hotel Properties, Inc. has reviewed and discussed the Compensation Discussion and Analysis appearing in this proxy statement with management of the Company. Based on the Compensation Committee’s review of the CD&A and the Compensation Committee’s discussions of the CD&A with management, the Compensation Committee recommended to the Board (and the Board has approved) that the CD&A be included in the Company’s proxy statement on Schedule 14A prepared in connection with the annual meeting.
Compensation Committee of the Board:
Kenneth J. Kay (Chair)
Amina Belouizdad
Jeffrey W. Jones
Thomas W. Storey
Kenneth J. Kay (Chair)
Amina Belouizdad
Jeffrey W. Jones
Thomas W. Storey
March 30, 2022
35
EXECUTIVE COMPENSATION
Summary Compensation Table
The table below summarizes the total compensation paid or earned by each of our named executive officers for the fiscal year ended December 31, 2021.
| Name and Principal Position | | | Year | | | Base Salary ($) | | | Stock Awards ($)(1) | | | Non-Equity Incentive Plan Compensation ($)(2) | | | All Other Compensation ($)(3) | | | Total ($) | | ||||||||||||||||||
| Daniel P. Hansen | | | | | 2021 | | | | | | 510,769 | | | | | | 3,055,440 | | | | | | — | | | | | | 11,600 | | | | | | 3,577,809 | | |
| Executive Chairman (prior President & CEO)* | | | | | 2020 | | | | | | 673,078 | | | | | | 2,707,920 | | | | | | 798,000 | | | | | | 11,400 | | | | | | 4,190,398 | | |
| | | | | | 2019 | | | | | | 700,000 | | | | | | 2,946,123 | | | | | | 1,352,400 | | | | | | 11,200 | | | | | | 5,009,723 | | |
| Jonathan P. Stanner | | | | | 2021 | | | | | | 591,923 | | | | | | 3,068,586 | | | | | | 1,260,000 | | | | | | 11,600 | | | | | | 4,932,109 | | |
President & CEO (prior EVP & CFO)* | | | | | 2020 | | | | | | 432,692 | | | | | | 1,063,816 | | | | | | 351,000 | | | | | | 11,400 | | | | | | 1,858,908 | | |
| | | | | | 2019 | | | | | | 450,000 | | | | | | 1,157,404 | | | | | | 597,600 | | | | | | 11,200 | | | | | | 2,216,204 | | |
| William H. Conkling | | | | | 2021 | | | | | | 276,923 | | | | | | 2,076,275 | | | | | | 657,000 | | | | | | 57 | | | | | | 3,010,255 | | |
| EVP, CFO** | | | | | 2020 | | | | | | — | | | | | | — | | | | | | — | | | | | | — | | | | | | — | | |
| | | | | | 2019 | | | | | | — | | | | | | — | | | | | | — | | | | | | — | | | | | | — | | |
| Craig J. Aniszewski | | | | | 2021 | | | | | | 450,000 | | | | | | 1,350,175 | | | | | | 639,000 | | | | | | 11,600 | | | | | | 2,450,775 | | |
| EVP, COO | | | | | 2020 | | | | | | 432,692 | | | | | | 1,063,816 | | | | | | 324,000 | | | | | | 11,400 | | | | | | 1,831,908 | | |
| | | | | | 2019 | | | | | | 450,000 | | | | | | 1,157,404 | | | | | | 570,600 | | | | | | 11,200 | | | | | | 2,189,204 | | |
| Christopher R. Eng | | | | | 2021 | | | | | | 375,000 | | | | | | 552,339 | | | | | | 525,000 | | | | | | 11,600 | | | | | | 1,463,939 | | |
| EVP, CRO, GC | | | | | 2020 | | | | | | 360,578 | | | | | | 435,198 | | | | | | 277,500 | | | | | | 11,400 | | | | | | 1,084,676 | | |
| | | | | | 2019 | | | | | | 375,000 | | | | | | 473,487 | | | | | | 490,500 | | | | | | 11,200 | | | | | | 1,350,187 | | |
| Paul Ruiz | | | | | 2021 | | | | | | 300,000 | | | | | | 490,980 | | | | | | 306,600 | | | | | | 11,600 | | | | | | 1,109,180 | | |
| SVP, CAO | | | | | 2020 | | | | | | 288,461 | | | | | | 386,840 | | | | | | 155,400 | | | | | | 11,400 | | | | | | 842,101 | | |
| | | | | | 2019 | | | | | | 300,000 | | | | | | 420,873 | | | | | | 266,280 | | | | | | 11,200 | | | | | | 998,353 | | |
*
The titles above for our named executive officers represent their current position with the Company as of December 31, 2021. Prior to implementation of our leadership transition plan effective January 15, 2021, Mr. Hansen served as Chairman, President and Chief Executive Officer and Mr. Stanner served as Executive Vice President, Chief Financial Officer and Treasurer.
**
Mr. Conkling was appointed Executive Vice President and Chief Financial Officer effective May 17, 2021 and received a one-time, sign-on award of $750,000 of restricted shares vesting over a three-year period.
(1)
Amounts in this column represent the aggregate grant date fair value, based on the probable outcome of the performance conditions to which such shares are subject, computed in accordance with ASC 718, of time-based and performance-based stock awards granted under our Equity Incentive Plan. The assumptions used in calculating these amounts are discussed in Note 2 (“Basis of Presentation and Significant Accounting Policies — Equity-Based Compensation”) and Note 12 (“Equity-Based Compensation”) to our audited consolidated financial statements included in our Annual Report. The amount for Mr. Hansen includes $2.9 million of additional stock-based compensation expense related to the modification of certain stock awards upon his separation from his role as Executive Chairman.
(2)
Amounts in this column represent aggregate cash payouts pursuant to the Annual Cash Incentive Program as described in “Compensation Discussion and Analysis — Compensation Elements — Annual Cash Incentive Program.”
36
(3)
The amounts in the “All Other Compensation” column for Messrs. Hansen, Stanner, Conkling, Aniszewski, Eng and Ruiz reflect contributions made by us to each of our named executive officers’ 401(k) accounts.
Grants of Plan-Based Awards
The table below sets forth information with respect to plan-based awards granted in 2021 to our named executive officers:
| Name | | | Grant Date | | | Estimated Future Payouts Under Non-Equity Incentive Plan Awards | | | Estimated Future Payouts Under Equity Incentive Plan Awards | | | All Other Stock Awards: Number of Shares of Stock (#) | | | All Other Option Awards: Number of Securities Underlying Options (#) | | | Exercise or Base Price of Option Awards ($/Share) | | | | | | | | | Grant Date Fair Value of Awards ($)(4) | | |||||||||||||||||||||||||||||||||||||||||||||
| | Threshold ($) | | | Target ($) | | | Maximum ($) | | | Threshold (#) | | | Target (#) | | | Maximum (#) | | ||||||||||||||||||||||||||||||||||||||||||||||||||||||||
| Daniel P. Hansen | | | | | 3/8/21(3) | | | | | | — | | | | | | — | | | | | | — | | | | | | — | | | | | | — | | | | | | — | | | | | | 145,914 | | | | | | — | | | | | | — | | | | | | | | | | | | 1,527,720 | | |
| | | | 3/7/19(5) | | | | | | — | | | | | | — | | | | | | — | | | | | | — | | | | | | — | | | | | | — | | | | | | 144,703 | | | | | | — | | | | | | — | | | | | | | | | | | | 2,137,408 | | | ||
| | | | 3/7/19(5) | | | | | | — | | | | | | — | | | | | | — | | | | | | — | | | | | | — | | | | | | — | | | | | | 96,469 | | | | | | — | | | | | | — | | | | | | | | | | | | 470,774 | | | ||
| | | | 3/7/20(5) | | | | | | — | | | | | | — | | | | | | — | | | | | | — | | | | | | — | | | | | | — | | | | | | 180,258 | | | | | | — | | | | | | — | | | | | | | | | | | | 2,080,898 | | | ||
| | | | 3/7/20(5) | | | | | | — | | | | | | — | | | | | | — | | | | | | — | | | | | | — | | | | | | — | | | | | | 120,172 | | | | | | — | | | | | | — | | | | | | | | | | | | 879,659 | | | ||
| | | | 3/8/21(5) | | | | | | — | | | | | | — | | | | | | — | | | | | | — | | | | | | — | | | | | | — | | | | | | 145,914 | | | | | | — | | | | | | — | | | | | | | | | | | | 1,068,086 | | | ||
| Jonathan P. Stanner | | | | | 3/8/21(1) | | | | | | 450,000 | | | | | | 900,000 | | | | | | 1,800,000 | | | | | | — | | | | | | — | | | | | | — | | | | | | — | | | | | | — | | | | | | — | | | | | | | | | | | | — | | |
| | | | 3/8/21(2) | | | | | | — | | | | | | — | | | | | | — | | | | | | 36,479 | | | | | | 145,915 | | | | | | 291,830 | | | | | | — | | | | | | — | | | | | | — | | | | | | | | | | | | 2,050,106 | | | ||
| | | | 3/8/21(3) | | | | | | — | | | | | | — | | | | | | — | | | | | | — | | | | | | — | | | | | | — | | | | | | 97,276 | | | | | | — | | | | | | — | | | | | | | | | | | | 1,018,480 | | | ||
| William H. Conkling | | | | | 5/17/21(1) | | | | | | 225,000 | | | | | | 450,000 | | | | | | 900,000 | | | | | | — | | | | | | — | | | | | | — | | | | | | — | | | | | | — | | | | | | — | | | | | | — | | | | | | — | | |
| | | | 5/17/21(2) | | | | | | — | | | | | | — | | | | | | — | | | | | | 16,051 | | | | | | 64,202 | | | | | | 128,404 | | | | | | — | | | | | | — | | | | | | — | | | | | | — | | | | | | 902,038 | | | ||
| | | | 5/17/21(3) | | | | | | — | | | | | | — | | | | | | — | | | | | | — | | | | | | — | | | | | | — | | | | | | 119,333 | | | | | | — | | | | | | — | | | | | | — | | | | | | 1,174,237 | | | ||
| Craig J. Aniszewski | | | | | 3/8/21(1) | | | | | | 225,000 | | | | | | 450,000 | | | | | | 900,000 | | | | | | — | | | | | | — | | | | | | — | | | | | | — | | | | | | — | | | | | | — | | | | | | | | | | | | — | | |
| | | | 3/8/21(2) | | | | | | — | | | | | | — | | | | | | — | | | | | | 16,051 | | | | | | 64,202 | | | | | | 128,404 | | | | | | — | | | | | | — | | | | | | — | | | | | | | | | | | | 902,038 | | | ||
| | | | 3/8/21(3) | | | | | | — | | | | | | — | | | | | | — | | | | | | — | | | | | | — | | | | | | — | | | | | | 42,802 | | | | | | — | | | | | | — | | | | | | | | | | | | 448,137 | | | ||
| Christopher R. Eng | | | | | 3/8/21(1) | | | | | | 187,500 | | | | | | 375,000 | | | | | | 750,000 | | | | | | — | | | | | | — | | | | | | — | | | | | | — | | | | | | — | | | | | | — | | | | | | | | | | | | — | | |
| | | | 3/8/21(2) | | | | | | — | | | | | | — | | | | | | — | | | | | | 6,566 | | | | | | 26,264 | | | | | | 52,528 | | | | | | — | | | | | | — | | | | | | — | | | | | | | | | | | | 369,009 | | | ||
| | | | 3/8/21(3) | | | | | | — | | | | | | — | | | | | | — | | | | | | — | | | | | | — | | | | | | — | | | | | | 17,510 | | | | | | — | | | | | | — | | | | | | | | | | | | 183,330 | | | ||
| Paul Ruiz | | | | | 3/8/21(1) | | | | | | 105,000 | | | | | | 210,000 | | | | | | 420,000 | | | | | | — | | | | | | — | | | | | | — | | | | | | — | | | | | | — | | | | | | — | | | | | | | | | | | | — | | |
| | | | 3/8/21(2) | | | | | | — | | | | | | — | | | | | | — | | | | | | 5,837 | | | | | | 23,347 | | | | | | 46,694 | | | | | | — | | | | | | — | | | | | | — | | | | | | | | | | | | 328,025 | | | ||
| | | | 3/8/21(3) | | | | | | — | | | | | | — | | | | | | — | | | | | | — | | | | | | — | | | | | | — | | | | | | 15,564 | | | | | | — | | | | | | — | | | | | | | | | | | | 162,955 | | | ||
(1)
Represents the threshold, target and maximum potential payouts for the annual cash incentive awards granted in 2021 to each named executive officer under our Equity Incentive Plan. For each executive, the incentive award earned was paid out in cash in March 2022, except as otherwise detailed below. For more information, see “Compensation Discussion and Analysis — Compensation Elements — Annual Cash Incentive Program.”
(2)
Represents performance-based restricted stock awards granted to our named executive officers under our Equity Incentive Plan, which vest following the end of the performance period on March 8, 2024, based on the Company’s relative TSR achievement.
(3)
Represents time-based restricted stock awards granted to our named executive officers under our Equity Incentive Plan. The time-based restricted stock awards vest annually on a 25%, 25%, 50% schedule over a three-year period.
(4)
Represents the aggregate grant date fair value of the performance-based stock awards and the time-based stock awards granted to our named executive officers under our Equity Incentive Plan. The amounts have been computed in accordance with ASC 718. For more information regarding our assumptions
37
made in the valuation of these stock awards, see Note 2 and Note 12 to our audited consolidated financial statements included in our Annual Report.
(5)
In connection with Mr. Hansen’s separation from his role of Executive Chairman, the Company modified certain of his outstanding service-based restricted shares to provide for accelerated vesting and certain of his outstanding performance-based restricted shares to remove the requirement that Mr. Hansen remain employed by the Company to remain eligible to receive any shares that may vest, resulting in additional stock-based compensation charges as a modification of the awards which are reflected in the table.
Discussion of Summary Compensation and Grants of Plan-Based Awards Tables
Our executive compensation policies and practices, pursuant to which the compensation set forth in the Summary Compensation Table and the Grants of Plan-Based Awards table was paid or awarded to our named executive officers, are described above under “Compensation Discussion and Analysis.”
Outstanding Equity Awards at Fiscal Year-End
The table below sets forth information with respect to outstanding equity awards held by the named executive officers as of December 31, 2021.
| Name | | | Number of Shares or Units of Stock That Have Not Vested (#)(2) | | | Market Value of Shares or Units of Stock That Have Not Vested ($)(1) | | | Equity Incentive Plan Awards: Number of Unearned Shares, Units or Other Rights That Have Not Vested (#)(3) | | | Equity Incentive Plan Awards: Market or Payout Value of Unearned Shares, Units or Other Rights That Have Not Vested ($)(1) | | ||||||||||||
Daniel P. Hansen | | | | | — | | | | | | — | | | | | | 378,708 | | | | | | 3,696,190 | | |
Jonathan P. Stanner | | | | | 151,631 | | | | | | 1,479,919 | | | | | | 440,608 | | | | | | 4,300,334 | | |
William H. Conkling | | | | | 119,333 | | | | | | 1,164,690 | | | | | | 128,404 | | | | | | 1,253,223 | | |
Craig J. Aniszewski | | | | | 97,157 | | | | | | 948,252 | | | | | | 277,182 | | | | | | 2,705,296 | | |
Christopher R. Eng | | | | | 39,747 | | | | | | 387,931 | | | | | | 113,392 | | | | | | 1,106,706 | | |
| Paul Ruiz | | | | | 35,330 | | | | | | 344,821 | | | | | | 100,795 | | | | | | 983,759 | | |
(1)
The closing sale price of our common stock on the NYSE on December 31, 2021, was $9.76.
(2)
Time-Based Shares. Vesting dates for unvested time-based shares listed in the above table are as follows:
| Vesting Date | | | Hansen | | | Stanner | | | Conkling | | | Aniszewski | | | Eng | | | Ruiz | | ||||||||||||||||||
| March 9, 2022 | | | | | — | | | | | | 55,070 | | | | | | 10,701 | | | | | | 41,452 | | | | | | 16,958 | | | | | | 15,074 | | |
| May 17, 2022 | | | | | — | | | | | | — | | | | | | 19,133 | | | | | | — | | | | | | — | | | | | | — | | |
| March 9, 2023 | | | | | — | | | | | | 47,923 | | | | | | 10,701 | | | | | | 34,305 | | | | | | 14,035 | | | | | | 12,474 | | |
| May 17, 2023 | | | | | — | | | | | | — | | | | | | 19,133 | | | | | | — | | | | | | — | | | | | | — | | |
| March 9, 2024 | | | | | — | | | | | | 48,638 | | | | | | 21,400 | | | | | | 21,400 | | | | | | 8,754 | | | | | | 7,782 | | |
| May 17, 2024 | | | | | — | | | | | | — | | | | | | 38,265 | | | | | | — | | | | | | — | | | | | | — | | |
38
(3)
Performance-Based Shares. Potential vesting dates for unvested performance-based shares listed in the above table are as follows:
| Vesting Date | | | Hansen | | | Stanner | | | Conkling | | | Aniszewski | | | Eng | | | Ruiz | | ||||||||||||||||||
March 7, 2022(4) | | | | | 198,450 | | | | | | 77,963 | | | | | | — | | | | | | 77,963 | | | | | | 31,894 | | | | | | 28,350 | | |
March 7, 2023(5) | | | | | 180,258 | | | | | | 70,815 | | | | | | — | | | | | | 70,815 | | | | | | 28,970 | | | | | | 25,751 | | |
March 8, 2024(6) | | | | | — | | | | | | 291,830 | | | | | | 128,404 | | | | | | 128,404 | | | | | | 52,528 | | | | | | 46,694 | | |
(4)
Based on the Company’s relative TSR for the three-year period starting March 7, 2019, and ending March 7, 2022 as compared to certain constituents of the REIT Index, the shares listed were earned by the executives, which equates to 137% of target.
(5)
The relative TSR performance goal would have been achieved for the period commencing on March 7, 2020 and ending on December 31, 2021 (rather than the end of the actual performance period) at below target. In accordance with SEC rules, amounts shown are based on target level of achievement of the relative TSR performance goal.
(6)
The relative TSR performance goals would have been achieved for the period commencing on March 8, 2021 and ending on December 31, 2021 (rather than the end of the actual performance period), at above target. In accordance with SEC rules, amounts shown are based on maximum level of achievement of the relative TSR performance goal.
Option Exercises and Stock Vested
The following tables set forth information regarding option award exercising and stock vesting during 2021.
| | | | Option Awards | | | Stock Awards | | ||||||||||||||||||
| Name | | | Number of Shares Acquired on Exercise (#) | | | Value Realized on Exercise ($) | | | Number of Shares Acquired on Vesting (#) | | | Value Realized on Vesting ($)(1) | | ||||||||||||
| Daniel P. Hansen | | | | | — | | | | | | — | | | | | | 469,019 | | | | | | 4,674,949 | | |
| Jonathan P. Stanner | | | | | — | | | | | | — | | | | | | 64,804 | | | | | | 666,895 | | |
| William H. Conkling | | | | | — | | | | | | — | | | | | | — | | | | | | — | | |
| Craig J. Aniszewski | | | | | — | | | | | | — | | | | | | 74,477 | | | | | | 766,065 | | |
| Christopher R. Eng | | | | | — | | | | | | — | | | | | | 30,469 | | | | | | 313,402 | | |
| Paul Ruiz | | | | | — | | | | | | — | | | | | | 22,246 | | | | | | 228,983 | | |
(1)
Amounts represent the number of shares that vested multiplied by the per share closing price of our common stock on the applicable vesting date.
Employment Agreements and Executive Officer Separations
To specify our expectations with regard to our executive officers’ duties and responsibilities, and to provide greater certainty with regard to the amounts payable to our executive officers in connection with certain terminations or change in control events, the Board approved, and we entered into employment agreements with each of our executive officers. We believe that the terms of the employment agreements provide these executives with day-to-day employment stability and enable them to properly focus their attention on their duties and responsibilities with the company, thereby promoting productivity.
We entered into employment agreements, effective as of May 28, 2014, with Mr. Aniszewski and Mr. Eng. We entered into an employment agreement, effective as of January 1, 2015, with Mr. Ruiz, and we entered into an employment agreement, effective May 17, 2021, with Mr. Conkling. In connection with the transition of Mr. Hansen to Executive Chairman and Mr. Stanner to President and Chief Executive Officer, we entered into new employment agreements, effective January 15, 2021 with Mr. Hansen and Mr. Stanner. Mr. Hansen’s agreement terminated on January 1, 2022.
39
The Stanner Agreement has an initial term that commenced on January 15, 2021 and will expire on January 14, 2024 and provides for automatic one-year extensions unless either party provides at least 30 days’ notice of non-renewal. The Stanner Agreement provides for: (i) an annual base salary of $600,000, which is subject to increases approved by the Board or its Compensation Committee; (ii) an annual bonus opportunity with a target amount equal to 150% of Mr. Stanner’s then current base salary, with the actual bonus amount based upon achievement of Company and individual performance targets; and (iii) eligibility to participate in the Equity Incentive Plan. Mr. Stanner is further entitled to the standard benefits available to the Company’s executives generally, including health insurance, life and disability coverage and the option to participate in the Company’s 401(k) Savings Plan. The Stanner Agreement also (i) sets forth Mr. Stanner’s right to severance payments and/or benefits upon his termination of employment as described below in “Potential Payments Upon Termination or Change in Control” and (ii) contains non-competition and non-solicitation covenants that apply during the term and for 12 months following the expiration or termination of Mr. Stanner’s employment.
The Hansen Agreement had an initial term that commenced on January 15, 2021 and expired on December 31, 2021. The term could be extended until December 31, 2022 by the Company by providing written notice to Mr. Hansen no later than December 1, 2021. The Hansen Agreement provides for: (i) an annual base salary of $500,000; and (ii) a time-based equity award with a grant date value of $1,500,000 to be made at the same time equity grants are made to Company senior executives in 2021. If the Hansen Agreement were extended, Mr. Hansen would receive a time-based equity award with a grant date value of $500,000 to be made at the same time equity grants are made to Company senior executives in 2022. Mr. Hansen will not receive any additional compensation during the term of the Hansen Agreement for serving as a member of the Board. Mr. Hansen is further entitled to the standard benefits available to the Company’s executives generally, including health insurance, life and disability coverage and the option to participate in the Company’s 401(k) Savings Plan. The Hansen Agreement also (i) sets forth Mr. Hansen’s right to severance payments and/or benefits upon his termination of employment as described below in “Potential Payments Upon Termination or Change in Control” and (ii) contains non-competition and non-solicitation covenants that apply during the term and for 12 months following the expiration or termination of Mr. Hansen’s employment. Mr. Hansen’s agreement terminated with his retirement as Executive Chairman on January 1, 2022.
Daniel Hansen Separation and Release
On January 1, 2022, in connection with Mr. Hansen’s separation and exit from his position as Executive Chairman, the Company entered a mutual release of claims with Mr. Hansen (the “Agreement”). The Agreement provided for the following: (i) accelerated vesting of all unvested service-based restricted shares of common stock previously awarded to Mr. Hansen; (ii) the opportunity to earn unvested performance-based restricted shares of common stock in 2022 and 2023 based on the Company’s total shareholder return in accordance with the previously reported performance awards; (iii) One Million and No/100 dollars ($1,000,000.00) paid in twelve (12) equal or nearly equal monthly installments starting in January 2022; (iv) reimbursement for COBRA premiums paid by Mr. Hansen for twelve (12) months starting in January 2022; and (v) a release by each party of all claims against the other party.
Craig Aniszewski Separation and Release
On February 28, 2022, in connection with Mr. Aniszewski’ s separation and exit from his position as Executive Vice President and Chief Operating Officer, the Company entered into a separation agreement and general release with Mr. Aniszewski (the “Agreement”). The Agreement provided for the following: (i) accelerated vesting of all unvested service-based restricted shares of common stock previously awarded to Mr. Aniszewski; (ii) the opportunity to earn unvested performance-based restricted shares of common stock in 2022, 2023 and 2024 based on the Company’s total shareholder return in accordance with the previously reported performance awards; (iii) reimbursement for COBRA premiums paid by Mr. Aniszewski through December 31, 2022; (iv) a cash payment of $6,125 for accrued but unused 2022 vacation time; and (v) a general release by Mr. Aniszewski of all claims against the Company.
Potential Payments Upon Termination or Change in Control
The table below reflects the amount of compensation that our named executive officers would be entitled to receive under their employment agreements. The amounts shown assume that such termination
40
was effective as of December 31, 2021 and are only estimates of the amounts that would be paid out to such executives upon termination of their employment. The actual amounts to be paid out can only be determined at the time of such executive’s separation from the company. In the event of a termination by the company for cause, or by the executive without good reason, including in connection with a change in control, such executive would not be entitled to any of the amounts reflected in the table and would only be entitled to the standard termination benefits provided under their employment agreement.
| | | | Termination Without Cause or Voluntary Termination for Good Reason (No Change in Control) ($) | | | Termination Without Cause or Voluntary Termination for Good Reason (Change in Control) ($) | | | Death or Disability(1) ($) | | |||||||||
| Daniel P. Hansen | | | | | | | | | | | | | | | | | | | |
Cash Severance Payment(2) | | | | | 1,000,000 | | | | | | — | | | | | | — | | |
Medical/Welfare Benefits(3) | | | | | 23,280 | | | | | | — | | | | | | — | | |
Acceleration of Equity Awards(4) | | | | | 3,171,619 | | | | | | — | | | | | | 3,171,619 | | |
| Total(5) | | | | | 4,194,899 | | | | | | | | | | | | 3,171,619 | | |
| Jonathan P. Stanner | | | | | | | | | | | | | | | | | | | |
Cash Severance Payment(2) | | | | | 3,351,000 | | | | | | 4,851,000 | | | | | | — | | |
Medical/Welfare Benefits(3) | | | | | 20,000 | | | | | | 20,000 | | | | | | — | | |
Acceleration of Equity Awards(4) | | | | | 4,150,040 | | | | | | 4,150,040 | | | | | | 4,150,040 | | |
Total(5) | | | | | 7,521,040 | | | | | | 9,021,040 | | | | | | 4,150,040 | | |
| William H. Conkling | | | | | | | | | | | | | | | | | | | |
Cash Severance Payment(2) | | | | | 1,350,000 | | | | | | 1,800,000 | | | | | | | | |
Medical/Welfare Benefits(3) | | | | | 18,000 | | | | | | 18,000 | | | | | | | | |
Acceleration of Equity Awards(4) | | | | | 1,791,302 | | | | | | 1,791,302 | | | | | | 1,791,302 | | |
| Total(5) | | | | | 3,159,302 | | | | | | 3,615,302 | | | | | | 1,791,302 | | |
| Craig J. Aniszewski | | | | | | | | | | | | | | | | | | | |
Cash Severance Payment(2) | | | | | 1,674,000 | | | | | | 2,124,000 | | | | | | — | | |
Medical/Welfare Benefits(3) | | | | | 16,956 | | | | | | 16,956 | | | | | | — | | |
Acceleration of Equity Awards(4) | | | | | 2,820,854 | | | | | | 2,820,854 | | | | | | 2,820,854 | | |
| Total(5) | | | | | 4,511,810 | | | | | | 4,961,810 | | | | | | 2,820,854 | | |
| Christopher R. Eng | | | | | | | | | | | | | | | | | | | |
Cash Severance Payment(2) | | | | | 1,402,500 | | | | | | 1,777,500 | | | | | | — | | |
Medical/Welfare Benefits(3) | | | | | 22,000 | | | | | | 22,000 | | | | | | — | | |
Acceleration of Equity Awards(4) | | | | | 1,153,993 | | | | | | 1,153,993 | | | | | | 1,153,993 | | |
Total(5) | | | | | 2,578,493 | | | | | | 2,953,493 | | | | | | 1,153,993 | | |
| Paul Ruiz | | | | | | | | | | | | | | | | | | | |
Cash Severance Payment(2) | | | | | 920,400 | | | | | | 1,175,400 | | | | | | — | | |
Medical/Welfare Benefits(3) | | | | | 20,000 | | | | | | 20,000 | | | | | | — | | |
Acceleration of Equity Awards(4) | | | | | 1,025,776 | | | | | | 1,025,776 | | | | | | 1,025,776 | | |
Total(5) | | | | | 1,966,176 | | | | | | 2,221,176 | | | | | | 1,025,776 | | |
(1)
A termination of the executive officer’s employment due to death or disability entitles the executive officer to benefits under our life insurance and disability insurance plans. In addition, outstanding stock awards that have not yet vested, immediately vest upon the executive officer’s termination of employment due to death or disability. The unvested stock award figure in the table reflects 324,961,
41
425,209, 289,022, 118,237 and 105,100 restricted shares for Messrs. Hansen, Stanner, Conkling, Eng and Ruiz, respectively, based on the closing common stock price of $9.76 on the NYSE as of December 31, 2021.
(2)
Pursuant to the terms of each executive officer’s employment agreement, if the executive’s employment with the Company is terminated by the Company without cause or by the executive for good reason, the severance payment is the sum of the following: (A)(1) earned but unpaid base salary, (2) accrued by unpaid vacation pay through the date of termination, and (3) any vested amounts due under any plan, program or policy of the Company, to the extent not previously paid (if any) (together, the “Accrued Obligations”); and (B) a severance amount equal to: (i) one and one-half (two for Mr. Stanner) times the executive’s base salary in effect on the date of termination ($600,000, $450,000, $375,000 and $300,000 for Messrs. Stanner, Conkling, Eng and Ruiz, respectively), plus (ii) one and one-half (two for Mr. Stanner) times the executive’s target annual cash bonus for the year of termination ($900,000, $450,000, $375,000 and $210,000 for Messrs. Stanner, Conkling, Eng and Ruiz, respectively), plus (iii) a pro rata portion of the annual cash bonus for the partial fiscal year in which the date of termination occurs equal to the product of the annual cash bonus earned by the executive for the fiscal year of the Company ended immediately before the date of termination ($351,000, $277,500 and $155,400 for Messrs. Stanner, Eng and Ruiz, respectively) and a fraction, the numerator of which is the number of days the executive was employed by the Company during the fiscal year that includes the date of termination and the denominator of which is 365. Pursuant to Mr. Hansen’s employment agreement, if his employment with the Company is terminated by the Company without cause or by the executive for good reason, the severance payment is $1,000,000. The calculations contemplate a December 31, 2021 termination date. The cash severance payment amounts in the table do not include any Accrued Obligations.
Pursuant to the terms of each executive officer’s employment agreement, if the executive’s employment with the Company is terminated by the Company without cause or by the executive for good reason with change of control, the severance payment is the sum of the following: (A)(1) earned but unpaid base salary, (2) accrued by unpaid vacation pay through the date of termination, and (3) any vested amounts due under any plan, program or policy of the Company, to the extent not previously paid (if any) (together, the “Accrued Obligations”); and (B) a severance amount equal to: (i) two (three for Mr. Stanner) times the executive’s base salary in effect on the date of termination ($600,000, $450,000, $375,000 and $300,000 for Messrs. Stanner, Conkling, Eng and Ruiz, respectively), plus (ii) two (three for Mr. Stanner) times the executive’s target annual cash bonus for the year of termination ($900,000, $450,000, $375,000 and $210,000 for Messrs. Stanner, Conkling, Eng and Ruiz, respectively), plus (iii) a pro rata portion of the annual cash bonus for the partial fiscal year in which the date of termination occurs equal to the product of the annual cash bonus earned by the executive for the fiscal year of the Company ended immediately before the date of termination ($351,000, $277,500 and $155,400 for Messrs. Stanner, Eng and Ruiz, respectively) and a fraction, the numerator of which is the number of days the executive was employed by the Company during the fiscal year that includes the date of termination and the denominator of which is 365. The calculations contemplate a December 31, 2021 termination date. The severance figure in the table does not include any Accrued Obligations.
(3)
The amounts shown in this row are estimates of cash payments for twelve months of COBRA premiums for the executive and eligible dependents to be paid by us pursuant to each executive officer’s employment agreement.
(4)
Assumes outstanding stock awards that have not yet vested will immediately vest in the event the executive’s employment with the Company is terminated by the Company without cause or by the executive for good reason. The unvested stock award figure in the table reflects 425,209, 289,022, 118,237, and 105,100 restricted shares for Messrs. Stanner, Conkling, Eng and Ruiz, respectively, based on the closing common stock price of $9.76 on the NYSE as of December 31, 2021.
(5)
The employment agreements with our named executive officers do not provide an indemnification or gross-up payment for the parachute payment excise tax under Sections 280G and 4999 of the Code. The employment agreements instead provide that the severance and any other payments or benefits that are treated as parachute payments under the Code will be reduced to the maximum amount that can be paid without an excise tax liability. The parachute payments will not be reduced, however, if the executive will receive greater after-tax benefits by receiving the total or unreduced benefits (after
42
considering any excise tax liability payable by the executive). The amounts shown in the table assume that the executive officer will receive the total or unreduced benefits.
CEO Pay Ratio Summary
Pursuant to the Dodd-Frank Wall Street Reform and Consumer Protection Act, the SEC requires calculation of total compensation paid to the median paid employee, as well as the ratio of the total compensation paid to the CEO as compared to the median paid employee.
We identified the median employee by examining the sum of annual base salary, target annual bonus, and the grant-date fair value of equity awards granted during 2021 for all employees other than our CEO (Mr. Stanner) who were employed by us on December 31, 2021. We did not make any adjustments or estimates.
After identifying the median paid employee, we then calculated total compensation for such employee using the same methodology we use for our named executive officers as set forth in the 2021 Summary Compensation Table in this proxy statement. The total compensation of our median paid employee for 2021 was $119,761. The annual total compensation for our CEO for 2021 was $4,332,555. As a result, our 2021 CEO to median employee pay ratio is, therefore, approximately 36:1.
In accordance with SEC rules, we elected to use the annualized annual total compensation paid or provided Mr. Stanner who was serving as our principal executive officer on December 31, 2021, the date selected to identify our median employee. To calculate the annual total compensation paid or provided to Mr. Stanner in the position of principal executive officer, we annualized Mr. Stanner’s annual base salary following his appointment as Chief Executive Officer and otherwise used the amounts reported in our 2021 Summary Compensation Table included in this proxy statement.
This information involves reasonable estimates based on employee payroll records and other relevant company information. In addition, SEC rules for identifying the median employee and determining the CEO pay ratio permit companies to employ a wide range of methodologies, estimates and assumptions. As a result, the CEO pay ratios reported by other companies, which may have employed other permitted methodologies or assumptions and which may have a significantly different work force structure from ours, are likely not comparable to our CEO pay ratio.
Risk Considerations in our Executive Compensation Program
The Compensation Committee has assessed our compensation program for the purpose of reviewing and considering any risks presented by our compensation policies and practices that are likely to have a material adverse effect on us. As part of that assessment, management reviewed the primary elements of our compensation program, including base salary, annual bonus opportunities, equity compensation and severance arrangements. Management’s risk assessment included a review of the overall design of each primary element of our compensation program, and an analysis of the various design features, controls and approval rights in place with respect to compensation paid to management, and other employees, thatwhich mitigate potential risks to us that could arise from our compensation program. Following the assessment, the Compensation Committee determined that our compensation policies and practices did not create risks that were reasonably likely to have a material adverse effect on the Company.
| Name and Principal Position | Year | Base Salary ($) | Bonus ($) | Stock Awards ($)(1) | Non-Equity Incentive Plan Compensation ($)(2) | All Other Compensation ($)(3) | Total ($) | |||||||||||||
| Daniel P. Hansen; | 2019 | 700,000 | — | 2,946,123 | 1,352,400 | 11,200 | 5,009,723 | |||||||||||||
| President, CEO | 2018 | 700,000 | — | 2,711,051 | 973,875 | 11,000 | 4,395,926 | |||||||||||||
| 2017 | 700,000 | — | 2,491,530 | 420,000 | 10,800 | 3,622,330 | ||||||||||||||
| Craig J. Aniszewski; | 2019 | 450,000 | — | 1,157,404 | 570,600 | 11,200 | 2,189,204 | |||||||||||||
| EVP, COO | 2018 | 450,000 | — | 1,104,498 | 417,375 | 11,000 | 1,982,873 | |||||||||||||
| 2017 | 430,000 | — | 1,038,134 | 172,000 | 10,800 | 1,650,934 | ||||||||||||||
| Jonathan P. Stanner; | 2019 | 450,000 | — | 1,157,404 | 597,600 | 11,200 | 2,216,204 | |||||||||||||
| EVP, CFO | 2018 | 425,000 | — | 903,679 | 428,188 | 11,000 | 1,767,867 | |||||||||||||
| 2017 | 283,835 | 113,333 | 850,118 | — | 106,556 | 1,353,842 | ||||||||||||||
| Christopher R. Eng; | 2019 | 375,000 | — | 473,487 | 490,500 | 11,200 | 1,350,187 | |||||||||||||
| EVP, CRO, GC | 2018 | 350,000 | — | 451,839 | 345,625 | 11,000 | 1,158,464 | |||||||||||||
| 2017 | 325,000 | — | 415,247 | 130,000 | 10,800 | 881,047 | ||||||||||||||
| Paul Ruiz; | 2019 | 300,000 | — | 420,873 | 266,280 | 11,200 | 998,353 | |||||||||||||
| SVP, CAO | 2018 | 300,000 | — | 301,222 | 194,775 | 11,000 | 806,997 | |||||||||||||
| 2017 | 275,000 | — | 207,640 | 77,000 | 10,800 | 570,440 | ||||||||||||||
| Name | Grant Date | Estimated Future Payouts Under Non-Equity Incentive Plan Awards | Estimated Future Payouts Under Equity Incentive Plan Awards | All Other Stock Awards: Number of Shares of Stock (#) | All Other Option Awards: Number of Securities Underlying Options (#) | Exercise or Base Price of Option Awards ($/Share) | Grant Date Fair Value of Awards ($)(4) | |||||||||||||||||||||||||
Threshold ($) | Target ($) | Maximum ($) | Threshold (#) | Target (#) | Maximum (#) | |||||||||||||||||||||||||||
| Daniel P. Hansen | 3/7/19(1) | 525,000 | 1,050,000 | 2,100,000 | — | — | — | — | — | — | — | |||||||||||||||||||||
3/7/19(2) | — | — | — | 36,176 | 144,703 | 289,406 | — | — | — | 1,854,094 | ||||||||||||||||||||||
3/7/19(3) | — | — | — | — | — | — | 96,469 | — | — | 1,092,029 | ||||||||||||||||||||||
| Craig J. Aniszewski | 3/7/19(1) | 225,000 | 450,000 | 900,000 | — | — | — | — | — | — | — | |||||||||||||||||||||
3/7/19(2) | — | — | — | 14,212 | 56,848 | 113,696 | — | — | — | 728,399 | ||||||||||||||||||||||
3/7/19(3) | — | — | — | — | — | — | 37,898 | — | — | 429,005 | ||||||||||||||||||||||
| Jonathan P. Stanner | 3/7/19(1) | 225,000 | 450,000 | 900,000 | — | — | — | — | — | — | — | |||||||||||||||||||||
3/7/19(2) | — | — | — | 14,212 | 56,848 | 113,696 | — | — | — | 728,399 | ||||||||||||||||||||||
3/7/19(3) | — | — | — | — | — | — | 37,898 | — | — | 429,005 | ||||||||||||||||||||||
| Christopher R. Eng | 3/7/19(1) | 187,500 | 375,000 | 750,000 | — | — | — | — | — | — | — | |||||||||||||||||||||
3/7/19(2) | — | — | — | 5,814 | 23,256 | 46,512 | — | — | — | 297,981 | ||||||||||||||||||||||
3/7/19(3) | — | — | — | — | — | — | 15,504 | — | — | 175,506 | ||||||||||||||||||||||
| Paul Ruiz | 3/7/19(1) | 105,000 | 210,000 | 420,000 | — | — | — | — | — | — | — | |||||||||||||||||||||
3/7/19(2) | — | — | — | 5,168 | 20,672 | 41,344 | — | — | — | 264,872 | ||||||||||||||||||||||
3/7/19(3) | — | — | — | — | — | — | 13,781 | — | — | 156,001 | ||||||||||||||||||||||
| Name | Number of Securities Underlying Unexercised Options (#) Exercisable | Number of Securities Underlying Unexercised Options (#) Unexercisable | Option Exercise Price ($) | Option Expiration Date | Number of Shares or Units of Stock That Have Not Vested (#)(2) | Market Value of Shares or Units of Stock That Have Not Vested ($)(1) | Equity Incentive Plan Awards: Number of Unearned Shares, Units or Other Rights That Have Not Vested (#)(3) | Equity Incentive Plan Awards: Market or Payout Value of Unearned Shares, Units or Other Rights That Have Not Vested ($)(1) | ||||||||||||||||
| Daniel P. Hansen | 235,000 | — | 9.75 | 2/13/21 | 187,059 | 2,308,308 | 356,206 | 4,395,582 | ||||||||||||||||
| Craig J. Aniszewski | — | — | — | — | 75,085 | 926,549 | 143,858 | 1,775,208 | ||||||||||||||||
| Jonathan P. Stanner | — | — | — | — | 68,094 | 840,280 | 127,348 | 1,571,474 | ||||||||||||||||
| Christopher R. Eng | — | — | — | — | 30,602 | 377,629 | 58,506 | 721,964 | ||||||||||||||||
| Paul Ruiz | — | — | — | — | 23,003 | 283,857 | 41,646 | 513,912 | ||||||||||||||||
| Name | Hansen | Aniszewski | Stanner | Eng | Ruiz | |||||
| March 9, 2020 | 74,528 | 30,294 | 26,279 | 12,277 | 8,203 | |||||
| March 9, 2021 | 64,296 | 25,843 | 22,867 | 10,573 | 7,909 | |||||
| March 9, 2022 | 48,235 | 18,948 | 18,948 | 7,752 | 6,891 | |||||
| Name | Hansen | Aniszewski | Stanner | Eng | Ruiz | ||||||
March 6, 2020(4) | 90,967 | 37,903 | 30,322 | 15,161 | 7,581 | ||||||
| March 7, 2021 | 120,536 | 49,107 | 40,178 | 20,089 | 13,393 | ||||||
| March 7, 2022 | 144,703 | 56,848 | 56,848 | 23,256 | 20,672 | ||||||
| Option Awards | Stock Awards | |||||||||||
| Name | Number of Shares Acquired on Exercise (#) | Value Realized on Exercise ($) | Number of Shares Acquired on Vesting (#) | Value Realized on Vesting ($) | ||||||||
| Daniel P. Hansen | — | — | 125,030 | 1,411,589 | ||||||||
| Craig J. Aniszewski | — | — | 51,911 | 586,075 | ||||||||
| Jonathan P. Stanner | — | — | 11,751 | 132,669 | ||||||||
| Christopher R. Eng | — | — | 17,098 | 193,036 | ||||||||
| Paul Ruiz | — | — | 10,977 | 123,930 | ||||||||
| Termination Without Cause or Voluntary Termination for Good Reason (No Change in Control) ($) | Termination Without Cause or Voluntary Termination for Good Reason (Change in Control) ($) | Death or Disability(1) ($) | |||||||
| Daniel P. Hansen | |||||||||
Cash Severance Payment(2) | 6,223,875 | 6,223,875 | — | ||||||
Medical/Welfare Benefits(3) | 20,642 | 20,642 | — | ||||||
Acceleration of Equity Awards(4) | 6,703,890 | 6,703,890 | 6,703,890 | ||||||
Total(5) | 12,948,407 | 12,948,407 | 6,703,890 | ||||||
| Craig J. Aniszewski | |||||||||
Cash Severance Payment(2) | 1,767,375 | 2,217,375 | — | ||||||
Medical/Welfare Benefits(3) | 14,739 | 14,739 | — | ||||||
Acceleration of Equity Awards(4) | 2,701,757 | 2,701,757 | 2,701,757 | ||||||
Total(5) | 4,483,871 | 4,933,871 | 2,701,757 | ||||||
| Jonathan P. Stanner | |||||||||
Cash Severance Payment(2) | 1,778,188 | 2,228,188 | — | ||||||
Medical/Welfare Benefits(3) | 19,654 | 19,654 | — | ||||||
Acceleration of Equity Awards(4) | 2,411,754 | 2,411,754 | 2,411,754 | ||||||
Total(5) | 4,209,596 | 4,659,596 | 2,411,754 | ||||||
| Christopher R. Eng | |||||||||
Cash Severance Payment(2) | 1,470,625 | 1,845,625 | — | ||||||
Medical/Welfare Benefits(3) | 20,642 | 20,642 | — | ||||||
Acceleration of Equity Awards(4) | 1,099,593 | 1,099,593 | 1,099,593 | ||||||
Total(5) | 2,590,860 | 2,965,860 | 1,099,593 | ||||||
| Paul Ruiz | |||||||||
Cash Severance Payment(2) | 959,775 | 1,214,775 | — | ||||||
Medical/Welfare Benefits(3) | 15,511 | 15,511 | — | ||||||
Acceleration of Equity Awards(4) | 797,769 | 797,769 | 797,769 | ||||||
Total(5) | 1,773,055 | 2,028,055 | 797,769 | ||||||
AUDIT COMMITTEE REPORT
The Audit Committee (“Audit Committee”) of the Board of Directors (“Board”) of Summit Hotel Properties, Inc. (“Company”) oversees the Company’s financial reporting process on behalf of the Board, in accordance with the Audit Committee charter. Management has the primary responsibility for the financial statements and the reporting process, including the system of internal controls. In fulfilling its oversight responsibilities, the Audit Committee reviewed with management the audited consolidated financial statements included in the Company’s Annual Report on Form 10-K for the year ended December 31, 20192021 (“Annual Report”), and discussed with management the quality, not just the acceptability, of the Company’s accounting principles, the reasonableness of significant judgments and the clarity of disclosures in the financial statements. The Audit Committee also reviewed and discussed with management the Company’s year-end earnings release.
The Audit Committee reviewed with the independent registered public accountants, who are responsible for expressing an opinion on the conformity of the Company’s audited consolidated financial statements with generally accepted accounting principles, their judgments as to the quality, not just the acceptability, of the Company’s accounting principles and such other matters as are required to be discussed with the Audit Committee under generally accepted auditing standards. In addition, the Audit Committee has discussed with the independent registered public accountants the auditors’ independence, the matters required to be discussed by Statement on Auditing Standards No. 61, as adopted bythe applicable requirements of the Public Company Accounting Oversight Board in Rule 3200T,and the Securities and Exchange Commission (“SEC”), and discussed and received the written disclosures and the letter from the independent registered public accountants required by the applicable requirements of the Public Company Accounting Oversight Board regarding the independent auditors’ communications with the Audit Committee concerning independence.
The Audit Committee discussed with the Company’s independent registered public accountants the overall scope and plans for their audit. TheAs a result of travel and other restrictions stemming from the COVID-19 pandemic, the Audit Committee met four timestwice in person and threefive times telephonically in 2019,2021, with the independent registered public accountants, with and without management present, to discuss the results of their examinations, their evaluations of the Company’s internal controls and the overall quality of the Company’s financial reporting. The Audit Committee held meetings with management prior to the filing of each of the Company’s Quarterly Reports on Form 10-Q with
the Securities and Exchange Commission (“SEC”)SEC and the release to the public of its quarterly earnings and reviewed and discussed with management the Company’s Quarterly Reports on Form 10-Q and its quarterly earnings releases.
In reliance on the reviews and discussions referred to above, the Audit Committee recommended to the Board (and the Board approved) that the audited consolidated financial statements be included in the Company’s Annual Report.
The Audit Committee is also responsible for monitoring the Company’s procedures for compliance with the rules for taxation as a real estate investment trust under Sections 856-860 of the Internal Revenue Code of 1986 as amended (“Code”). The Audit Committee determined that the Company was in compliance with the Code for 2019.
2021.
The members of the Audit Committee are not professionally engaged in the practice of auditing or accounting. Members of the Audit Committee rely, without independent verification, on the information provided to them and on the representations made by management and the independent registered public accountants. Accordingly, the Audit Committee’s oversight does not provide an independent basis to determine that management has maintained appropriate accounting and financial reporting principles, or appropriate internal controls and procedures designed to assure compliance with accounting standards and applicable laws and regulations. Furthermore, the Audit Committee’s considerations and discussions referred to above do not assure that the audit of the Company’s financial statements has been carried out in accordance with generally accepted auditing standards, that the financial statements are presented in accordance with generally accepted accounting principles or that Ernst & Young, LLP, the Company’s independent registered public accounting firm for the year ended December 31, 2019,2021, was in fact “independent.”
The Audit Committee has adopted a written charter that outlines certain specified responsibilities of the Audit Committee and complies with the rules of the SEC and the New York Stock Exchange (“NYSE”).
44
Each of the Audit Committee members is independent as defined by the NYSE listing standards and each member is financially literate. The Board has identified Bjorn R. L. Hanson, Jeffrey W. Jones, Kenneth J. Kay and Hope S. Taitz as “audit committee financial experts” within the meaning of the SEC rules.
Audit Committee of the Board:
Jeffrey W. Jones (Chair)
Bjorn R. L. Hanson
Kenneth J. Kay
Hope S. Taitz
March 30, 2022
The following is a summary of the fees billed to the Company by EY, the Company’s current independent registered public accounting firms for professional services rendered for the years ended December 31, 20192021 and 2018:2020:
| | | | Year Ended December 31, 2021 | | | Year Ended December 31, 2020 | | ||||||
| Audit Fees | | | | $ | 1,033,650* | | | | | $ | 921,250 | | |
| Audit-Related Fees | | | | | 5,000 | | | | | | 4,421 | | |
| Tax Fees | | | | | — | | | | | | 38,625 | | |
| All Other Fees | | | | | — | | | | | | — | | |
| Total | | | | $ | 1,038,650* | | | | | $ | 964,296 | | |
*
Includes fees totaling $61,250 paid by the Company’s Joint Venture partner pursuant to joint venture partnership agreement.
| Year Ended December 31, 2019 | Year Ended December 31, 2018 | |||||||
| Audit Fees | $ | 954,250 | $ | 850,000 | ||||
| Audit-Related Fees | 6,600 | 9,100 | ||||||
| Tax Fees | 34,505 | 44,290 | ||||||
| All Other Fees | — | — | ||||||
| Total | $ | 995,355 | $ | 903,390 | ||||
Audit Fees
“Audit Fees” consist of fees and expenses billed for professional services rendered for the audit of the annual consolidated financial statements, review of the interim consolidated financial statements, review of registration statements, and the preparation of comfort letters and services that are normally provided by accountants in connection with statutory and regulatory filings or engagements.
Audit-Related Fees
“Audit-Related Fees” consist of fees and expenses for assurance and related services that are reasonably related to the performance of the audit or review of our financial statements that are not “Audit Fees.”
Tax Fees
“Tax Fees” consist of fees and related expenses billed for professional services for tax compliance, tax advice and tax planning. These services include assistance regarding federal and state tax compliance and tax planning and structuring.
All Other Fees
“All Other Fees” consist of fees and expenses for products and services that are not “Audit Fees,” “Audit-Related Fees” or “Tax Fees”.
Pre-Approval Policy
All fees for audit, tax and other services provided to us are reviewed and pre-approved by the Audit Committee. The Audit Committee concluded that the provision of such services by EY in 20192021 were compatible with the maintenance of EY'sEY’s independence in the conduct of its auditing functions. All of the fees paid to EY in 20182020 and 20192021 that are described above were pre-approved by the Audit Committee.
45
SECURITY OWNERSHIP OF CERTAIN BENEFICIAL OWNERS AND MANAGEMENT
Security Ownership of Certain Beneficial Owners
The following table sets forth the beneficial ownership of our common stock and common units of limited partnership in the Operating Partnership (“OP Units”), as of March 25, 2020,11, 2022, for each stockholder and unitholder that is known by us to be the beneficial owner of more than five percent of our common stock or OP Units based upon filings made with the SEC by such stockholders. The percentages shown in this table have been calculated by us basedstockholders and unitholders. OP Units may be redeemed for cash or, at our election, shares of common stock on 105,174,471a one-for-one basis.
| Name of Beneficial Owner | | | Number of Shares of Common Stock and OP Units Beneficially Owned | | | Percentage of All Shares(1) | | | Percentage of All Shares and OP Units(2) | | |||||||||
BlackRock, Inc.(3) | | | | | 18,890,040 | | | | | | 17.66% | | | | | | 15.43% | | |
The Vanguard Group, Inc.(4) | | | | | 15,085,524 | | | | | | 14.10% | | | | | | 12.32% | | |
Bright Force Investment, LLC(5) | | | | | 13,990,697 | | | | | | 13.08% | | | | | | 11.43% | | |
Barclays PLC(6) | | | | | 8,346,570 | | | | | | 7.80% | | | | | | 6.82% | | |
State Street Corporation(7) | | | | | 6,191,987 | | | | | | 5.79% | | | | | | 5.06% | | |
(1)
Based on 106,337,785 shares of our common stock issued and outstanding as of March 25, 2020.11, 2022. The total number of shares of our common stock used in calculating each percentage shown includes all shares of our common stock that each beneficial owner has the right to acquire within 60 days of March 11, 2022 (pursuant to the exercise of stock options or upon the redemption of OP units), but such shares are not deemed to be outstanding for the purpose of computing the ownership percentage of any other beneficial owner.
(2)
Based on 121,777,076 shares of our common stock and OP units issued and outstanding as of March 11, 2022. The total number of shares of our common stock and OP units outstanding used in calculating each percentage shown includes all shares and units that each person has the right to acquire within 60 days of March 11, 2022 (pursuant to the exercise of stock options or upon the redemption of OP units) are outstanding, but such shares and units are not deemed to be outstanding for the purpose of computing the ownership percentage of any other beneficial owner.
(3)
Based on a Schedule 13G/A filed by BlackRock, Inc. (“BlackRock”), with the SEC on January 27, 2022. BlackRock had sole voting power over 18,890,040 shares and sole dispositive power over 19,764,677 shares. BlackRock has its principal business office at 55 East 52nd Street, New York, NY 10055.
(4)
Based on a Schedule 13G/A filed by The Vanguard Group, Inc. (“Vanguard Group”), with the SEC on February 10, 2022. Vanguard Group has shared voting power over 188,841 shares, sole dispositive power over 14,896,683 shares and shared dispositive power over 282,006 shares. Vanguard Group has its principal business office at 100 Vanguard Blvd., Malvern, PA 19355.
(5)
The number of OP units and the information in this footnote are based on the Form 3 filed with the SEC on January 19, 2022 by Bright Force Investment, LLC (“Bright Force”). The units are held directly by Bright Force, which is a wholly owned subsidiary of NewcrestImage Holdings, LLC. The address of Bright Force is 1785 State Highway 26, Suite 400, Grapevine, TX 76051.
(6)
Based on Schedule 13G filed by Barclays PLC (“Barclays”), with the SEC on February 11, 2022. Barclays has sole voting power and sole dispositive power over 8,346,570 shares. Barclays has its principal business office at 1 Churchill Place, London, E14 5HP, England.
(7)
Based on a Schedule 13G/A filed by State Street Corporation (“State Street”), with the SEC on February 14, 2022.State Street has shared voting power over 5,286,309 shares and shared dispositive power over 6,191,987 shares. State Street has its principal business office at One Lincoln Street, Boston, MA 02111.
| Name of Beneficial Owner | Number of Shares of Common Stock Beneficially Owned(1) | Percentage of Common Stock Beneficially Owned(2) | ||
BlackRock, Inc.(3) | 19,459,449 | 18.50% | ||
The Vanguard Group, Inc.(4) | 14,187,559 | 13.49% | ||
State Street Corporation(5) | 5,585,516 | 5.31% | ||
46
Security Ownership of Management
The following table sets forth the beneficial ownership of our common stock as of March 25, 2020,2022, for each of our named executive officers, each of our directors and all of our executive officers and directors as a group.
Name of Beneficial Owner(1) | | | Number of Shares Beneficially Owned | | | Percentage of All Shares(2) | | ||||||
Jonathan P. Stanner(4) | | | | | 799,607 | | | | | | * | | |
Daniel P. Hansen(3) | | | | | 681,966 | | | | | | * | | |
William H. Conkling(4) | | | | | 295,895 | | | | | | * | | |
Christopher R. Eng(4) | | | | | 239,633 | | | | | | * | | |
Paul Ruiz(4) | | | | | 209,710 | | | | | | * | | |
| Thomas W. Storey | | | | | 141,908 | | | | | | * | | |
| Bjorn R. L. Hanson | | | | | 84,811 | | | | | | * | | |
| Jeffrey W. Jones | | | | | 71,383 | | | | | | * | | |
| Kenneth J. Kay | | | | | 71,383 | | | | | | * | | |
| Hope S. Taitz | | | | | 48,300 | | | | | | * | | |
| Amina Belouizdad | | | | | 10,091 | | | | | | * | | |
Mehul Patel(5) | | | | | 485,529 | | | | | | * | | |
| All directors and executive officers as a group (12 persons) | | | | | 3,140,216 | | | | | | 2.94% | | |
Name of Beneficial Owner(1) | Number of Shares Beneficially Owned | Percentage of All Shares(2) | ||||
Daniel P. Hansen(3) | 1,535,744 | 1.45 | % | |||
Craig J. Aniszewski(4) | 348,090 | * | ||||
Jonathan P. Stanner(4) | 285,524 | * | ||||
Christopher R. Eng(4) | 166,904 | * | ||||
Paul Ruiz(4) | 136,935 | * | ||||
| Thomas W. Storey | 113,055 | * | ||||
| Bjorn R. L. Hanson | 55,958 | * | ||||
| Jeffrey W. Jones | 42,530 | * | ||||
| Kenneth J. Kay | 42,530 | * | ||||
| Hope S. Taitz | 19,447 | * | ||||
| All directors and executive officers as a group (10 persons) | 2,746,717 | 2.60 | % | |||
Represents less than one percent of the outstanding shares of common stock.
(1)
Unless otherwise indicated in the following footnotes, each person has sole voting and investment power with respect to all the shares of common stock shown as beneficially owned by such person. The address of each named person is Summit Hotel Properties, Inc., 13215 Bee Cave Parkway, Suite B-300, Austin, Texas 78738.
(2)
Based on shares of our common stock issued and outstanding as of March 25, 2022. The total number of shares of our common stock outstanding used in calculating this percentage assumes that all shares of our common stock that each person has the right to acquire within 60 days of March 25, 2022, (pursuant to the exercise of stock options or upon the redemption of common units) are deemed to be outstanding but are not deemed to be outstanding for the purpose of computing the ownership percentage of any other person.
(3)
Includes unvested restricted shares of our common stock issued under our Equity Incentive Plan. Includes 153,590 shares held through family company.
(4)
Includes unvested restricted shares of our common stock issued under our Equity Incentive Plan.
(5)
Includes 479,295 shares of common stock issuable upon redemption of OP Units in the Operating Partnership after July 13, 2022 on a one-for-one basis. The OP Units are held through a family company.
47
RELATED PERSON TRANSACTIONS
Related Person Transaction Policy
We have adopted a written policy for the review and approval of related person transactions requiring disclosure under Item 404(a) of Regulation S-K. This policy provides that the Nominating and Corporate Governance Committee is responsible for reviewing and approving or disapproving all related person transactions, meaning any transaction, arrangement or relationship in which (i) the amount involved may be expected to exceed $120,000 in any fiscal year, (ii) our Company or one of our subsidiaries will be a participant and (iii) a related person has a direct or indirect material interest. A related person is defined as an executive officer, director or nominee for election as director, or a greater than 5% beneficial owner of our common stock, or an immediate family member of the foregoing. The Nominating and Corporate Governance Committee may deem certain related person transactions to be pre-approved.
Related Person Transactions
In January 2022, the Company acquired hotels from affiliates of NewcrestImage Holdings, LLC (“NewcrestImage”) through its joint venture with GIC, Singapore’s sovereign wealth fund (“Joint Venture”). The initial closing included 26 of 27 hotels totaling 3,533 guestrooms, two parking structures, and various financial incentives. The remaining hotel, the newly constructed 176-guestroom Canopy by Hilton New Orleans, was acquired upon its opening in March 2022. The total consideration for the transaction was comprised of $776.5 million, or $209,000 per key, for the 27-hotel portfolio, $24.8 million for the two parking structures, and $20.7 million for the various financial incentives. The transaction was creatively structured to preserve nearly all the Company’s existing liquidity and is expected to be immediately accretive to earnings, leverage neutral to our balance sheet and preserve ample investment capacity. The Company funded its 51% equity contribution through the issuance of common operating partnership units valued at $160 million and preferred operating partnership units with an annual coupon of 5.25% valued at $50 million. The Joint Venture secured a $410 million term loan and GIC’s equity contribution of $208 million was funded in cash.
Director Nomination Agreement
In connection with the acquisition of hotels from affiliates of NewcrestImage, in January 2022, the Company entered into a Director Nomination Agreement with Bright Force Investment, LLC (“Bright Force”), Sagestar Family, LLC (“Sagestar Family”) and C&D Family Holdings, LLC (“C & D Family Holdings”), each of which is an affiliate of NewcrestImage. Pursuant to the Director Nomination Agreement, for so long as the total number of shares of the Company’s common stock and the Operating Partnership’s common units owned of record by Bright Force, Sagestar Family and C&D Family Holdings or their affiliates is equal to at least 10% of the sum of (X) the number of the Company’s common stock outstanding plus (Y) the number of the Operating Partnership’s common units outstanding that are not owned directly or indirectly by the Company, Bright Force, Sagestar Family and C&D Family Holdings and such affiliates will have the collective right to designate one individual as a nominee for election to the Company’s Board at each annual meeting of the stockholders of the Company (or special meeting of the stockholders in lieu of an annual meeting at which Directors are to be elected).
Registration Rights Agreement
In connection with the acquisition of hotels from affiliates of NewcrestImage, in January 2022, the Company entered into a Registration Rights Agreement with Bright Force, Sagestar Family and C&D Family Holdings. Pursuant to the Registration Rights Agreement, the Company has agreed to file with the SEC, on or before July 13, 2022, a registration statement on Form S-3 to register the issuance or resale, as applicable, of the Company’s common stock issuable upon redemption of, or in exchange for, the Operating Partnership’s common units received upon closing of the acquisitions from NewcrestImage and to use its reasonable best efforts to have such registration statement declared effective by the SEC as soon as practicable after filing such registration statement.
Tax Protection Agreement
In connection with the acquisition of hotels from affiliates of NewcrestImage, in January 2022, the Company entered into a Tax Protection Agreement with NewcrestImage. Pursuant to the Tax Protection Agreement, the Company has agreed to indemnify NewcrestImage for certain tax liabilities resulting from the sale, exchange, transfer or other disposition of a property contributed by NewcrestImage.
49
OTHER INFORMATION
Discretionary Voting Authority
We do not anticipate that any matter other than the proposals set out in this proxy statement will be raised at the annual meeting. If any other matters are properly presented at the annual meeting, the persons named as proxies will have discretion to vote on those matters according to their discretion.
Stockholder Proposals and Director Nominations for the 20212023 Annual Meeting of Stockholders
Requirements for Proposals to be Considered for Inclusion in Proxy Materials
Stockholders interested in submitting a proposal for inclusion in the proxy materials for our 20212023 annual meeting of stockholders may do so by following the procedures prescribed in Rule 14a-8 under the Exchange Act. To be eligible for inclusion in our proxy statement, stockholder proposals must be received no later than November 30, 2020,2022, the date 120 calendar days before the first anniversary of the date of this proxy statement and must comply with Rule 14a-8 under the Exchange Act regarding the inclusion of stockholder proposals in company-sponsored proxy materials. If we change the date of the 20212023 annual meeting of stockholders by more than 30 days from the anniversary of this year’s meeting, stockholder proposals must be received a reasonable time before we begin to print and mail our proxy materials for the 20212023 annual meeting of stockholders. Proposals should be mailed to our Secretary at the following address:
Summit Hotel Properties, Inc.
13215 Bee Cave Parkway, Suite B-300
Austin, Texas 78738
Attention: Secretary
Requirements for Proposals Not Intended for Inclusion in Proxy Materials; Director Nominations
Stockholders who wish to nominate persons for election to the Board at the 20212023 annual meeting of stockholders or who wish to present a proposal at the 20212023 annual meeting of stockholders, but whose stockholder proposal will not be included in the proxy materials we distribute for such meeting, must deliver written notice of the nomination or proposal to our Secretary no earlier than October 31, 20202022 and no later than November 30 2020, 2022 (provided, however, that if the 20212023 annual meeting of stockholders is advanced or delayed by more than 30 days from the first anniversary of this year’s meeting, nominations and proposals must be received no earlier than the 150th day prior to the date of the 20212023 annual meeting of stockholders and no later than the later of the 120th day prior to the date of the 20212023 annual meeting of stockholders or the 10th day following the day on which public announcement of the date of the 20212023 annual meeting of stockholders is first made). The stockholder’s written notice must include certain information concerning the stockholder and each nominee as specified in our Bylaws. If a stockholder’s written notice is not received between the dates specified above and does not satisfy these additional informational requirements, the notice will not be considered properly submitted and will not be acted upon at the 20212023 annual meeting of stockholders. A stockholder’s written notice should be sent to our Secretary at the following address:
Summit Hotel Properties, Inc.
13215 Bee Cave Parkway, Suite B-300
Austin, Texas 78738
Attention: Secretary
Solicitation of Proxies for 2023 Annual Meeting of Stockholders
We intend to file a proxy statement and WHITE proxy card with the SEC in connection with our solicitation of proxies for our 2023 annual meeting of stockholders. Stockholders may obtain our proxy statement (and any amendments and supplements thereto) and other documents as and when filed by the Company with the SEC without charge from the SEC’s website at: www.sec.gov.
50
To comply with the universal proxy rules, stockholders who intend to solicit proxies in support of director nominees other than the Company’s nominees must provide notice that sets forth the information required by Rule 14a-19 under the Exchange Act no later than March 13, 2023 (provided, however, that if the 2023 annual meeting of stockholders is advanced or delayed by more than 30 days from the first anniversary of this year’s meeting, notice must be received no later than the later of the 60th day prior to the date of the 2023 annual meeting of stockholders or the 10th day following the day on which public announcement of the date of the 2023 annual meeting of stockholders is first made).
Requests for Annual Report
A copy of our Annual Report, including the consolidated financial statements and the financial statement schedules, may be obtained at our website at www.shpreit.com. If you would like to receive a complimentary copy of our Annual Report, please submit a written request to:
Summit Hotel Properties, Inc.
13215 Bee Cave Parkway, Suite B-300
Austin, Texas 78738
Attention: Investor Relations
BY ORDER OF THE BOARD OF DIRECTORS
Christopher Eng
Executive Vice President, General Counsel,
Chief Risk Officer and Secretary
Austin, Texas
March 30, 2022
Executive Vice President, General Counsel,
Chief Risk Officer and Secretary
Austin, Texas
March 30, 2022
|
51
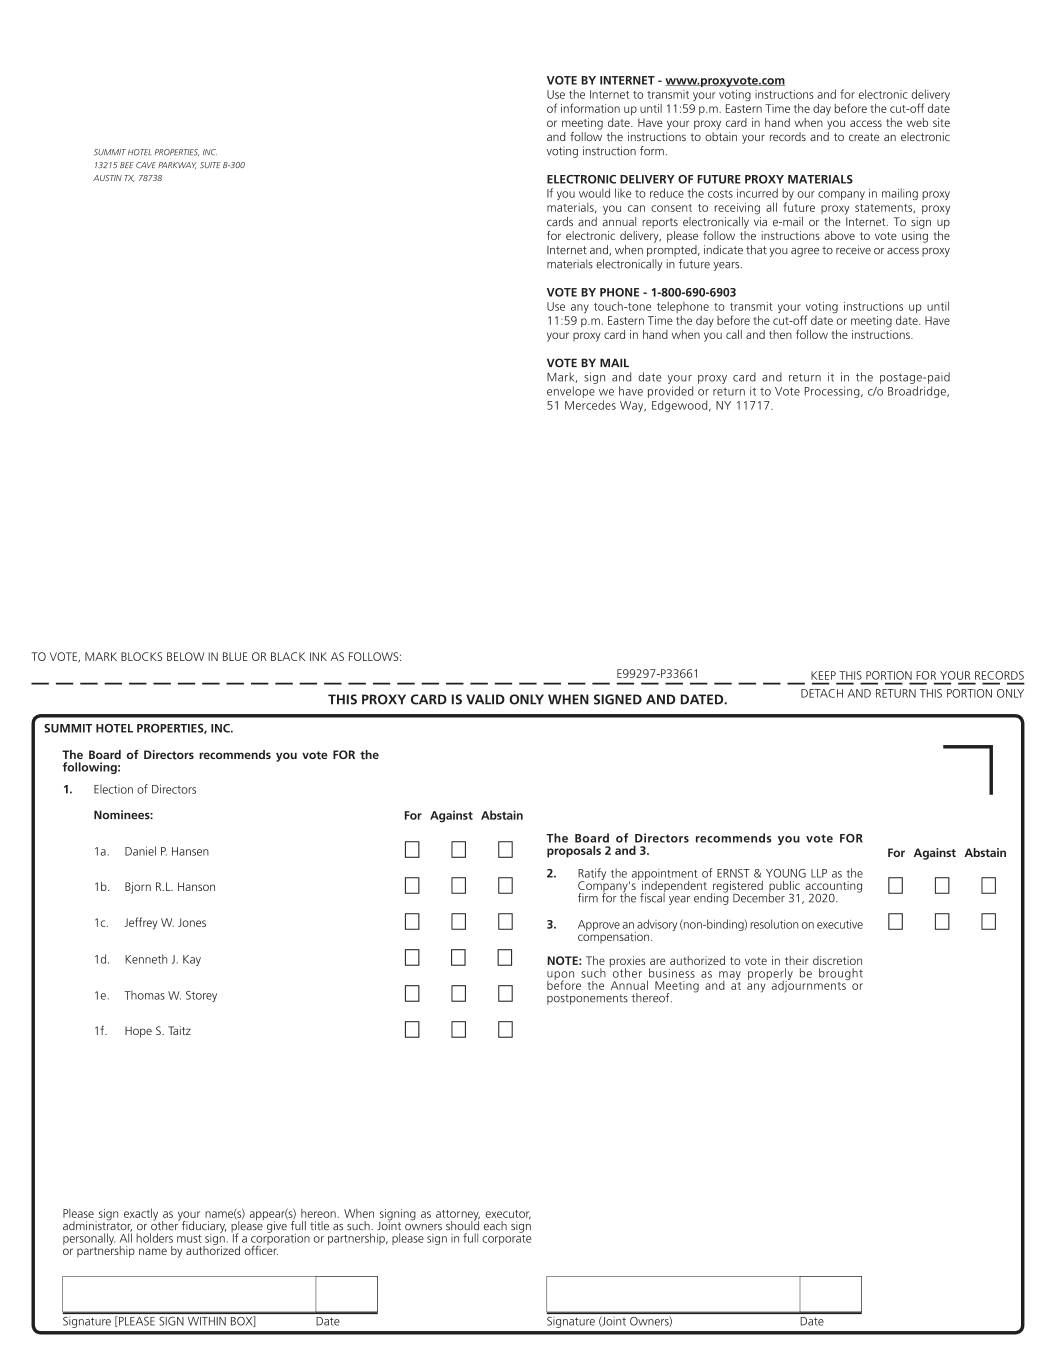
![[MISSING IMAGE: tm2210311d1-px_01scanbw.jpg]](https://capedge.com/proxy/DEF 14A/0001104659-22-040182/tm2210311d1-px_01scanbw.jpg)
SUMMIT HOTEL PROPERTIES, INC.13215 BEE CAVE PARKWAY, SUITE B-300 AUSTIN, TX 78738 SCAN TOVIEW MATERIALS & VOTEVOTE Y I TER ET - R se the Internet to transmit your voting instructions and for electronic delivery of information. Vote by 11 5 P.M. ET on 5/11/ave your proxy card in hand whenyou access the web site and follow the instructions to obtain your records and to create an electronic voting instruction form.ELECTRO IC DELIVERY OF FUTURE PROXY MATERIALSIf you would like to reduce the costs incurred by our company in mailing proxy materials, you can consent to receiving all future proxy statements, proxy cards and annual reports electronically via e-mail or the Internet. To sign up for electronic delivery, please follow the instructions above to vote using the Internet and, when prompted, indicate that you agree to receive or access proxy materials electronically in future years.VOTE Y PHO E - 1-800-690-6903 se any touch-tone telephone to transmit your voting instructions. Vote by 11 5 P.M. ET on 5/11/ . ave your proxy card in hand when you call and then follow the instructions.VOTE Y MAILMark, sign and date your proxy card and return it in the postage-paid envelope we have provided or return it to Vote Processing, c/o Broadridge, 51 Mercedes Way, Edgewood, NY 11717. TO VOTE, MARK BLOCKS BELOW IN BLUE OR BLACK INK AS FOLLOWS:THIS PROXY CARD IS VALID ONLY WHEN SIGNED AND DATED. KEEP THIS PORTION FOR YOUR RECORDS DETACH AND RETURN THIS PORTION ONLY The Board of Directors recommends you vote FOR the following:1.Election of DirectorsNomineesForAgainst Abstain 1a. Amina Belouizdad 000 The Board of Directors recommends you vote FORproposals 2 and 3.ForAgainst Abstain 1b. Bjorn R. L. Hanson 000 2.Ratify the appointment of ERNST & YOUNG LLP as the Company's independent registered publicDecember 31, 2022. 000 executive compensation.1f. Jonathan P. Stanner000be brought before the Annual Meeting and at anyadjournments or postponements thereof.1g. Thomas W. Storey0001h. Hope S. Taitz000Please sign exactly as your name(s) appear(s) hereon. When signing as attorney, executor,administrator, or other fiduciary, please give full title as such. Joint owners should each sign0personally. All holders must sign. If a corporation or partnership, please sign in full corporate or partnership name by authorized officer.
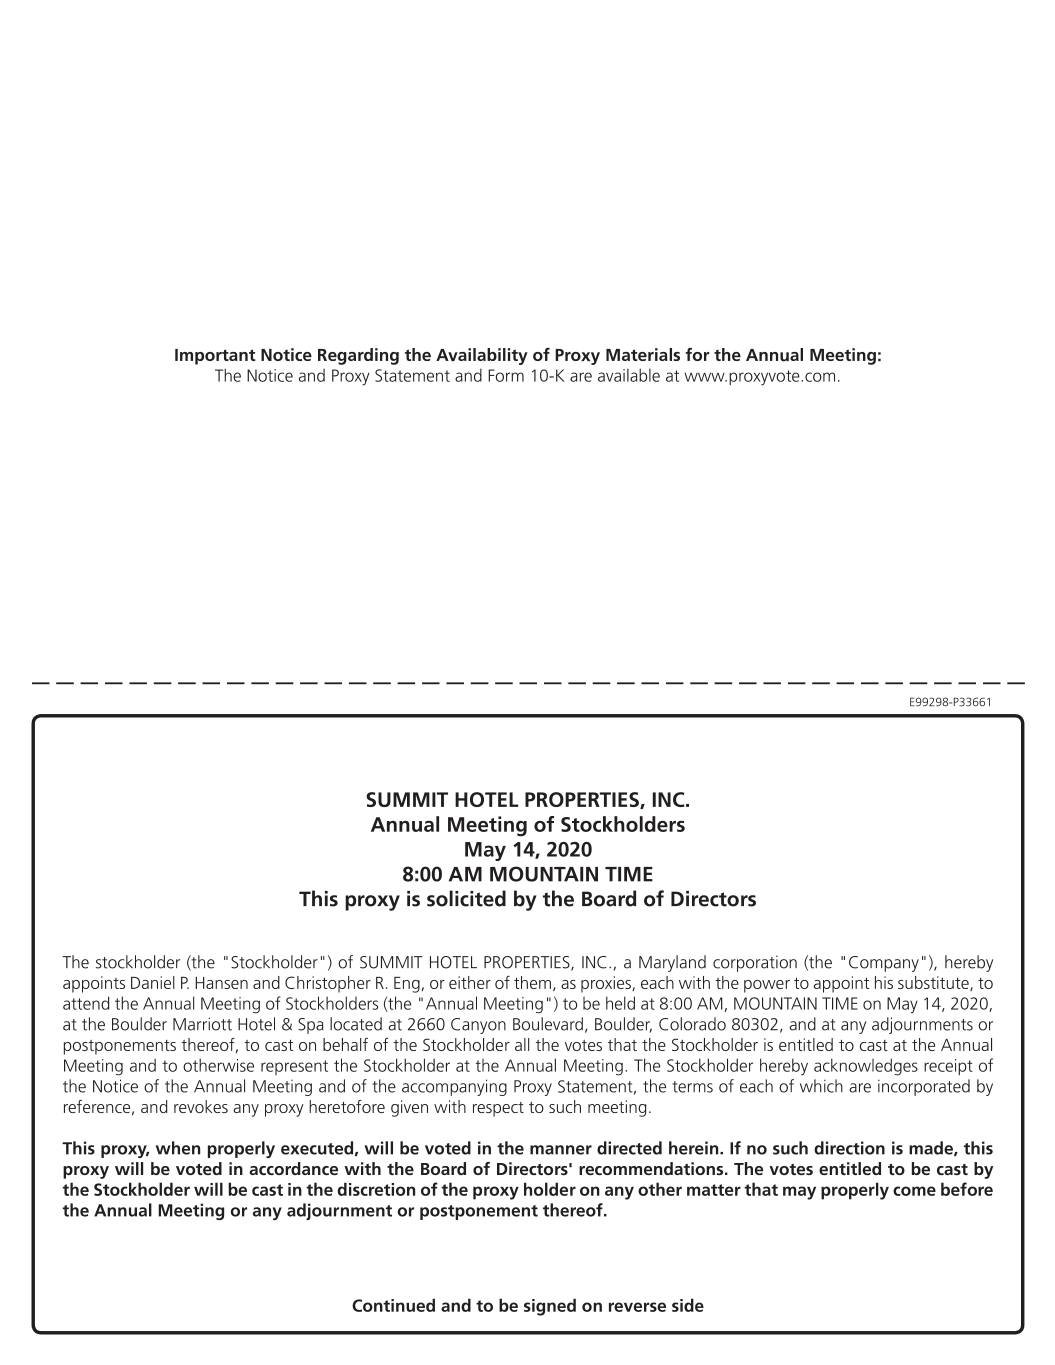
![[MISSING IMAGE: tm2210311d1-px_02scanbw.jpg]](https://capedge.com/proxy/DEF 14A/0001104659-22-040182/tm2210311d1-px_02scanbw.jpg)
Important Notice Regarding the Availability of Proxy Materials for the Annual Meeting:The Notice and Proxy Statement and Form 10-K are available at www.proxyvote.comSUMMIT HOTEL PROPERTIES, INC.Annual Meeting of Stockholders May 12, 20228:00 AM CENTRAL TIME The stockholder (the "Stockholder") of SUMMIT HOTEL PROPERTIES, INC., a Maryland corporation (the "Company"), hereby appoints Jonathan P. Stanner and Christopher R. Eng, or either of them, as proxies, each with the power to appoint his substitute, to attend the Annual Meeting of Stockholders (the "Annual Meeting") to be held at 8:00 AM, CENTRAL TIME on May 12, 2022, at the Hampton Inn & Suites located at 200 San Jacinto Boulevard, Austin, Texas 78701, and at any adjournments or postponements thereof, to cast on behalf of the Stockholder all the votes that the Stockholder is entitled to cast at the Annual Meeting and to otherwise represent the Stockholder at the Annual Meeting. The Stockholder hereby acknowledges receipt of the Notice of the Annual Meeting and of the accompanying Proxy Statement, the terms of each of which are incorporated by reference, and revokes any proxy heretofore given with respect to such meeting. This proxy, when properly executed, will be voted in the manner directed herein. If no such direction is made, this proxy will be voted in accordancewith the Board of Directors' recommendations. The votes entitled to be cast by the Stockholder will be cast in the discretion of the proxy holder on any other matter that may properly come before the Annual Meeting or any adjournment or postponement thereof.Continued and to be signed on reverse side 0000532417_2 R1.0.0.24