UNITED STATES
SECURITIES AND EXCHANGE COMMISSION
Washington, D.C. 20549
SCHEDULE 14A
Proxy Statement Pursuant to Section 14(a) of the Securities
Exchange Act of 1934 (Amendment No. )
Filed by the Registrant ☒
Filed by a Party other than the Registrant ☐
Check the appropriate box:
|
|
|
|
|
|
|
|
|
|
☐ Preliminary Proxy Statement
☐Confidential, for Use of the Commission Only (as permitted by Rule 14a-6(e)(2))
☒ Definitive Proxy Statement
☐ Definitive Additional Materials
☐ Soliciting Material under §240.14a-12
Bank of Hawaii Corporation
(Name of Registrant as Specified In Its Charter)
(Name of Person(s) Filing Proxy Statement, if other than the Registrant)
Payment of Filing Fee (Check the appropriate box):
☒ No fee required
☐ Fee paid previously with preliminary materials
☐ Fee computed on table in exhibit required by Item 25(b) per Exchange Act Rules 14a-6(i)(1) and 0-11
|
|
|
|
|
|

Your VOTE is important!
Notice of 20222024
Annual Meeting of Shareholders
and Proxy Statement
Meeting Date: April 29, 202226, 2024
Bank of HawaiiHawai‘i Corporation
130 Merchant Street
Honolulu, HawaiiHawai‘i 96813
LETTER FROM OUR CHAIRMAN, CEO, AND PRESIDENT


March 18, 202215, 2024
Dear Shareholder:
The 20222024 Annual Meeting of Shareholders of Bank of HawaiiHawai‘i Corporation will be held via live webcast on Friday, April 29, 2022,26, 2024, at 8:30 a.m. Hawaii Standard Time. Each shareholder will be asked to provide their control number when logging in to attend the virtual Annual Meeting. Shareholders who hold shares through an intermediary, such as a bank or broker, will also be able to use the control number provided by their bank or broker to attend and participate at the virtual Annual Meeting. More detailed instructions on how to attend and vote at the virtual Annual Meeting are found on pages 3 and 4.
The Notice of Meeting and Proxy Statement accompanying this letter describe the business we will consider and vote upon at the meeting. A report to shareholders on the affairs of Bank of HawaiiHawai‘i Corporation also will be given and shareholders will have the opportunity to ask about matters of interest concerning the Company through the virtual meeting platform during the virtual Annual Meeting.
For reasons explained in the accompanying Proxy Statement, the Board of Directors recommends that you vote FOR Proposal 1: Election of Directors, FOR Proposal 2: Advisory Vote on Executive Compensation, FOR Proposal 3: Approval of Bank of Hawai'i Corporation 2024 Stock and Incentive Plan, and FOR Proposal 3:4: Ratification of the Re-appointment of Ernst & Young LLP as the Company’s independent registered public accounting firm for the 20222024 fiscal year.
Your vote is very important. Please complete, sign, date and return the enclosed proxy card and mail it promptly in the enclosed postage-paid return envelope, even if you plan to virtually attend the Annual Meeting. If you wish to do so, your proxy may be revoked at any time before voting occurs at the virtual Annual Meeting. You may also vote and change your vote at the virtual Annual Meeting.
On behalf of the Board of Directors, thank you for your cooperation and support.
Sincerely, | |
| |
Peter S. Ho Chairman of the Board, Chief Executive Officer, and President |
NOTICE OF 2022 2024ANNUAL MEETING OF SHAREHOLDERS
To be held April 29, 202226, 2024
To Our Shareholders:
The 20222024 Annual Meeting of Shareholders of Bank of HawaiiHawai‘i Corporation will be held via live webcast at www.meetnow.global/MFQZ9X7M5HMPQG on Friday, April 29, 2022,26, 2024, at 8:30 a.m. Hawaii Standard Time for the following purposes:
|
|
|
|
|
|
|
|
These items of business are more fully described in the proxy statement accompanying this Notice, which is being mailed to shareholders on or about March 18, 2022.15, 2024. Shareholders of record of Bank of HawaiiHawai‘i Corporation common stock (NYSE: BOH) at the close of business on February 28, 2022,29, 2024 are entitled to attend the meeting and vote on the business brought before it. A list of such shareholders shall be open to the examination of any shareholders upon request following the 20222024 Annual Meeting of Shareholders.
We look forward to connecting with you at the meeting. However, if you cannot attend the meeting, your shares may still be voted by telephone or via the Internet, or you may complete, sign, date, and return the enclosed proxy card in the enclosed postage-paid return envelope.
By Order of the Board of Directors, | |
| |
Patrick M. McGuirk | |
| |
Bank of |
Honolulu, HawaiiHawai‘i
March 18, 202215, 2024
Your Vote is Important! |
Please promptly sign and return the enclosed proxy card, or vote by telephone or on the Internet. Submitting your proxy by one of these methods will ensure your representation at the annual meeting regardless of whether you attend the meeting. |
Thank you for your participation! |
Important Notice Regarding the Availability of Proxy Materials
for the 20222024 Annual Meeting of Shareholders to be Held on April 29, 2022.26, 2024.
The Proxy Statement and the Bank of HawaiiHawai‘i Corporation 20212023 Annual Report
on Form 10-K to Shareholders for the year ended December 31, 2021,2023, are available at www.edocumentview.com/boh.
We encourage you to access and review all of the information in the proxy materials before voting.
BANK OF HAWAIIHAWAI‘I CORPORATION
PROXY STATEMENT
TABLE OF CONTENTS
Page | |
1 | |
3 | |
Questions and Answers About the Proxy Materials and the Annual Meeting | 3 |
6 | |
6 | |
16 | |
18 | |
| |
| |
34 | |
35 | |
35 | |
36 | |
| |
| |
| |
| |
| |
| |
| |
| |
| |
| |
66 | |
69 | |
| |
Proposal 3: Approval of Bank of Hawai‘i Corporation 2024 Stock and Incentive Plan | 71 |
| |
| |
| |
| |
| |
Appendix A: Bank of Hawai‘i Corporation 2024 Stock and Incentive Plan | 79 |
This summary contains highlights of information contained elsewhere in our proxy statement and does not contain all information to be considered. We encourage you to read the entire proxy statement before voting.
PROPOSALS FOR THE ANNUAL MEETING OF SHAREHOLDERS
Proposal | Proposal | Board Recommendation | Page | Proposal | Board Recommendation | Page |
1 | Election of Directors You are being asked to elect 14 directors. Each of the nominees standing for election will hold office until the 2023 Annual Meeting of Shareholders. The number of directors to be elected was fixed by the Board on October 22, 2021. | “FOR” | 6 | Election of Directors You are being asked to elect 12 directors. Each of the nominees standing for election will hold office until the 2025 Annual Meeting of Shareholders. The number of directors to be elected was fixed by the Board to be effective as of the date of the 2024 Annual Meeting of Shareholders. | “FOR” | 6 |
|
|
|
|
|
| |
2 | Advisory Vote on Executive Compensation You are being asked to vote, on an advisory (non-binding) basis, to approve the Company's executive compensation as disclosed in this proxy statement. | “FOR” | 35 | Advisory Vote on Executive Compensation You are being asked to vote, on an advisory (non-binding) basis, to approve the Company’s executive compensation as disclosed in this proxy statement. | “FOR” | 35 |
|
|
|
|
|
| |
3 | Ratification of the Re-Appointment of Ernst & Young LLP You are being asked to ratify, on an advisory (non-binding) basis, the re-appointment of Ernst & Young LLP as the Company's independent registered public accounting firm for fiscal year 2022. | “FOR” | 67 | Approval of Bank of Hawai‘i Corporation 2024 Stock and Incentive Plan You are being asked to vote to approve the Company’s 2024 Stock and Incentive Plan | “FOR” | 71 |
|
|
|
|
|
| |
4 | Ratification of the Re-Appointment of Ernst & Young LLP You are being asked to ratify, on an advisory (non-binding) basis, the re-appointment of Ernst & Young LLP as the Company’s independent registered public accounting firm for fiscal year 2024. | “FOR” | 76 | |||
|
|
| ||||
VOTING YOUR SHARES
You may vote if you are a shareholder of record as of the close of business on February 28, 2022.29, 2024. Each share of common stock is entitled to one vote. Shares of Series A Preferred Stock generally isare not entitled to vote. On the Record Date,February 29, 2024 (the “Record Date”), there were 40,391,18339,771,110 shares of common stock issued and outstanding. All votes are confidential.
| Online Registered holders can go to www.envisionreports.com/boh and follow the instructions. For shares held in street name, please see the instruction card included by your broker or nominee. |
| By Telephone If you live in the United States, you may submit your proxy by following the “Vote by Telephone” instruction on the proxy card. For shares held in street name, please see the instruction card included by your broker or nominee. |
| By Mail Complete, sign, and date the proxy card and return it in the envelope that was provided in the proxy statement package. For shares held in street name, please see the instruction card included by your broker or nominee. |
| Virtual Attendance via Webcast Register with your control number found on your proxy card, notice, or voting instruction form provided by your bank or broker and attend our virtual annual meeting. More detailed instructions on how to attend and vote are found on pages 3 and 4. |
Even if you plan to attend the Annual Meeting of Shareholders, we encourage all shareholders to vote in advance of the meeting.
1
HIGHLIGHTS
Bank of Hawaii Corporation (the(“Bank of Hawai‘i Corporation” or the “Company”) is an independent regional financial services company. The Company’s principal subsidiary, Bank of Hawaii (the(“Bank of Hawai‘i” or the “Bank”), was founded in 1897 and provides a broad range of financial products and services to businesses, consumers and governments in HawaiiHawai‘i and the West Pacific.
Bank of HawaiiHawai‘i Corporation is committed to meeting high standards of ethical behavior, corporate governance, and business conduct. The first two columns in the table below summarize the Company'sCompany’s governance and compensation practices, demonstrating what we do to drive performance and manage risk and is current through March 1, 2022.2024. The third column highlights the Company'sCompany’s business performance during 2021.2023.
Corporate Governance | Compensation Program Best Practices | Business Performance | |||
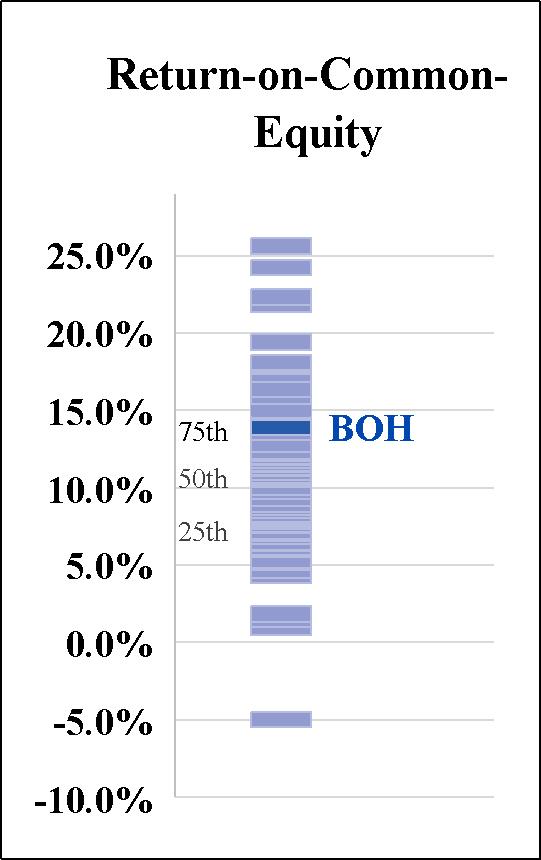
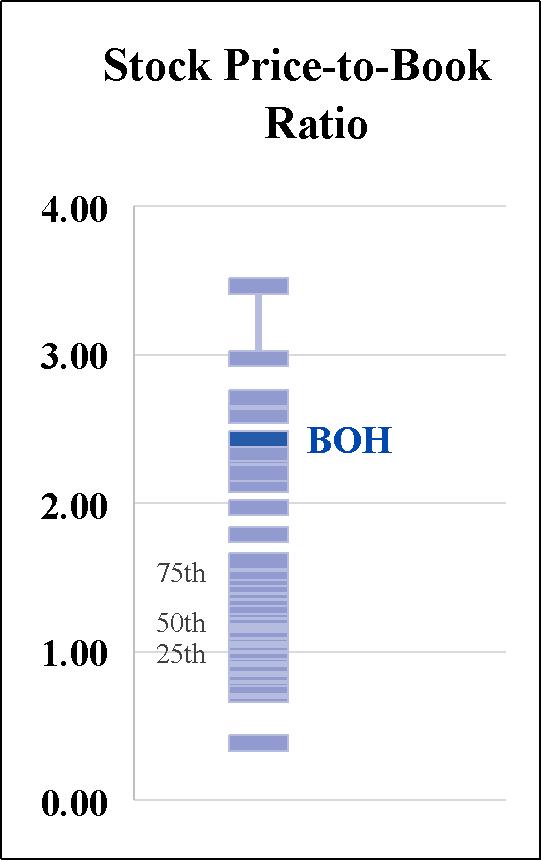
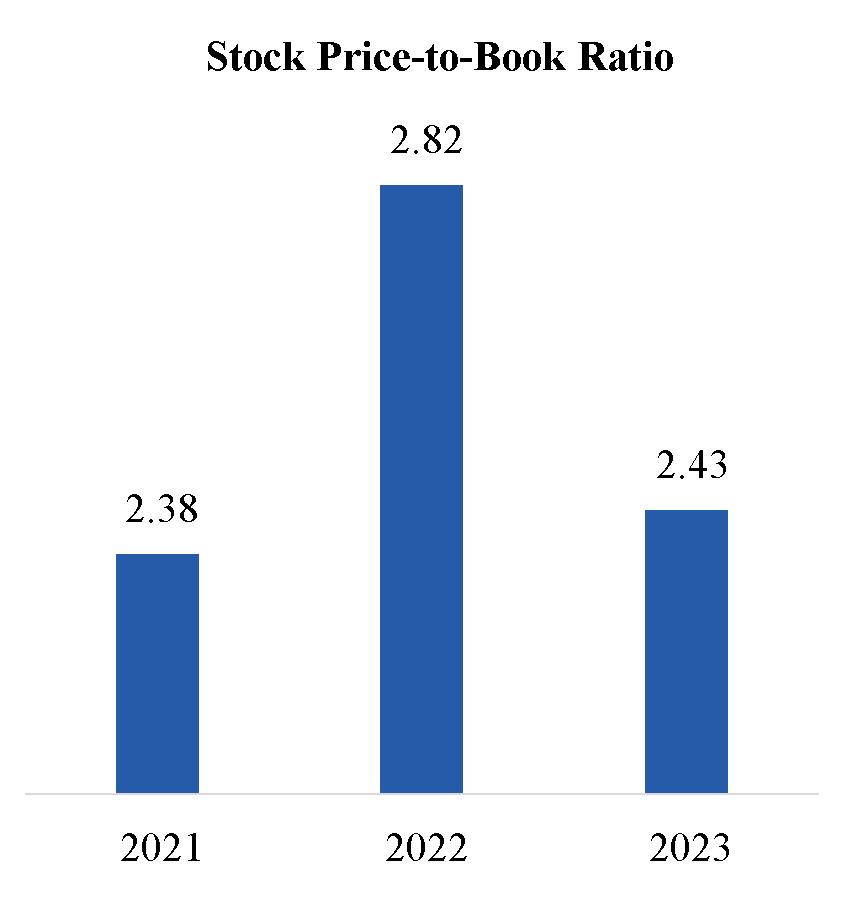
• Annual election of directors • Majority voting in director elections with a plurality carve-out in the case of contested elections and a director resignation policy • Independent directors comprise • 40% of directors are women and • Ongoing director refreshment with 6 new directors added in the past 5 years • Regular executive sessions of the Board without management present • Directors actively participate in continuing education programs • All directors attended at least 75% of the • Annual Say-on-Pay vote • Robust shareholder engagement process • Effective whistleblower policy and program • Annual Board and Committee self-evaluations • No poison pill | • Pay for performance by tying a substantial portion of executive compensation to performance goals • Significant portion of compensation is variable and performance-based • Significant stock ownership requirements (5x base salary for CEO, 2x for other NEOs) • No employment or severance agreements with NEOs • Anti-hedging and anti-pledging stock policies • Regularly conduct assessments to identify and mitigate risk in compensation programs • Evaluate executive compensation data and practices of our peer group companies as selected annually by the committee with guidance from the independent compensation consultant • Double-trigger change-in-control provisions • Independent compensation consultant • Formalized clawback policy • No tax gross-ups • No excessive perquisites • No repricing of equity incentive awards | • Diluted earnings per common share for the full year of $4.14 • Loans increased 2.1% •
Asset quality, liquidity, and capital all remain strong • Rated • Ranked Number 4
• Ranked Number 24 among the “World’s Most Trustworthy Companies” in the
only Hawai‘i bank listed. • Named Hawai‘i’s Best Bank by the readers of the Honolulu Star-Advertiser (13th consecutive year), Hawaii Tribune-Herald (8th consecutive year), West Hawaii Today • Named a top 3 finalist in the inaugural National Customer Obsessed Enterprise Award from global research firm Forrester. |
See “Corporate Governance”“Sound Environmental, Social, and Governance Leadership” starting on page 18, “Compensation Discussion and Analysis” starting on page 36, and “Business and Performance Overview” starting on page 40.41.
2
PROXY STATEMENTSTATEMENT
The Board of Directors (the “Board”) of Bank of HawaiiHawai‘i Corporation is soliciting the enclosed proxy for the Company's 2022Company’s 2024 Annual Meeting of Shareholders (the “Annual Meeting”). The proxy statement, proxy card, and the Company'sCompany’s Annual Report to Shareholders and Annual Report on Form 10-K are being distributed to the Company'sCompany’s shareholders on or about March 18, 2022.15, 2024.
QUESTIONS AND ANSWERS ABOUT THE PROXY MATERIALS AND THE ANNUAL MEETING
Q: | What is a proxy? |
| ||
A: | A proxy is your legal designation of another person to vote the shares you own. That other person that you designate is called a proxy and is required to vote your shares in the manner you instruct. If you designate someone as your proxy in a written document, that document also is called a proxy or a proxy card. If you vote by phone or via the Internet, you will have designated Patrick M. McGuirk and/or Russell Lum to act as your proxy to vote your shares at the Annual Meeting in the manner you direct. The Company is paying the costs of the solicitation of proxies. The Company has retained Georgeson LLC to assist in the distribution of proxy materials and the solicitation of proxies from individual shareholders as well as brokerage firms, fiduciaries, custodians, and other similar organizations representing beneficial owners of shares for the Annual Meeting. We have agreed to pay Georgeson a fee of approximately $12,750 plus variable amounts for additional proxy solicitation services and out-of-pocket expenses. In addition to solicitations by mail, the proxy solicitor and the Company’s nominees, officers, and employees, without additional compensation, may solicit proxies on the Company’s behalf in person, by phone, or by electronic communication. |
| ||
Q: | How many shares must be present to hold the |
| ||
A: | The holders of at least one-third of the Company’s outstanding common stock on the Record Date entitled to vote at the |
| ||
Q: | Why did I receive a one-page notice (the “Notice”) in the mail regarding the Internet availability of proxy materials instead of a full set of proxy materials? |
| ||
A: | The rules and regulations of the Securities and Exchange Commission (the “SEC”) allow companies to furnish proxy materials by providing access to such documents on the Internet instead of mailing a printed copy of proxy materials to each shareholder of record. Shareholders who previously requested to receive printed copies of proxy materials by mail will continue to receive them by mail. Shareholders who have not previously indicated a preference for printed copies of proxy materials are receiving the Notice. The Notice provides instructions on how to access and review all of the proxy materials and how to submit your proxy via the Internet. If you would like to receive a printed or e-mail copy of the proxy materials, please follow the instructions for requesting such materials in the Notice. |
| ||
Q: | What are the voting procedures? |
| ||
A: | Under our Certificate of Incorporation, Directors are elected annually by majority of votes cast (Proposal 1). This means that a director is elected if the number of votes cast for the nominee exceeds the number of votes cast against the nominee. In the event of a contested election, the election is determined by plurality vote. This means that the nominees who receive the highest number of affirmative votes are elected. Abstentions and broker non-votes do not affect the outcome of a plurality vote. | |
The advisory vote on executive compensation (Proposal 2), the approval of the Company’s 2024 Stock and Incentive Plan (Proposal 3) and the advisory vote on the ratification of the reappointment of our independent registered public accounting firm (Proposal 4) are also decided by a majority of votes cast. For Proposals 1, 2 and 3, broker non-votes will be treated as not entitled to vote and will not affect the outcome. For Proposal 4, your broker, bank, trustee, or other nominee may exercise its discretion and vote. Abstentions will have the same effect as votes cast against the proposal. | ||
Holders of our common stock are entitled to one vote per share of common stock held on the Record Date. The outstanding shares of Series A Preferred Stock are not entitled to any voting rights for any current proposal. |
3
The advisory vote on executive compensation (Proposal 2) and the advisory vote on the ratification
Holders of our common stock are entitled to one vote per share of common stock held on the Record Date. The outstanding shares of Series A Preferred Stock are not entitled to any voting rights for any current proposal.
Q: | May I change my vote? | ||
| |||
A: | Yes. You may change your proxy instructions any time before the vote at the Annual Meeting. Attendance at the virtual Annual Meeting will not cause your previously granted proxy to be revoked unless you also vote at the meeting. | ||
3
| |||
Q: | What is a broker non-vote? | ||
| |||
A: | The New York Stock Exchange (“NYSE”) allows its member-brokers to vote shares held by them for their customers on matters the NYSE determines are routine, even though the brokers have not received voting instructions from their customers. Of the proposals anticipated to be brought at the | ||
| |||
Q: | Why are we holding a virtual Annual Meeting? | ||
|
| ||
A: | The Annual Meeting | ||
| |||
Q: | How can I attend the Annual | ||
The online meeting will begin promptly at 8:30 a.m. Hawaii Standard Time. We encourage you to access the virtual meeting website prior to the start time to leave ample time for check-in. Please follow the instructions as outlined in this proxy statement.
If you hold your shares through a bank or broker as a beneficial shareholder, and want to attend the Annual Meeting online by webcast (with the ability to ask a question and/or vote, if you choose to do so) you have two options:
| |||
The online meeting will begin promptly at 8:30 a.m. Hawaii Standard Time. We encourage you to access the virtual meeting website prior to the start time to leave ample time for check-in. Please follow the instructions as outlined in this proxy statement. | |||
If you hold your shares through a bank or broker as a beneficial shareholder, and want to attend the Annual Meeting online by webcast (with the ability to ask a question and/or vote, if you choose to do so) you have two options: | |||
1) Registration in Advance of the Annual Meeting | |||
Submit proof of your proxy power (“Legal Proxy”) from your broker or bank reflecting your Bank of Hawaii Corporation holdings along with your name and email address to Computershare. Requests for registration must be labeled “Legal Proxy” and be received no later than 5:00 p.m. Eastern Time, on April 26, 2022. You will receive a confirmation of your registration by email after Computershare receives your registration materials. Requests for registration should be directed to Computershare at the following:
| |||
Submit proof of your proxy power (“Legal Proxy”) from your broker or bank reflecting your Bank of Hawai‘i Corporation holdings along with your name and email address to Computershare. Requests for registration must be labeled “Legal Proxy” and be received no later than 5:00 p.m. Eastern Time, on April 23, 2024. You will receive a confirmation of your registration by email after Computershare receives your registration materials. Requests for registration should be directed to Computershare at the following: | |||
By email: | Forward the email from your broker granting you a Legal Proxy, or attach an image of your Legal Proxy, to | ||
legalproxy@computershare.com | |||
| By mail: | Computershare | |
Bank of | |||
P.O. Box 43001 | |||
Providence, RI 02940-3001 | |||
4
4
For the 2022 proxy season, an industry solution has been agreed upon to allow beneficial shareholders to register online at the Annual Meeting to attend, ask questions and vote. We expect that the vast majority of beneficial shareholders will be able to fully participate using the control number received with their voting instruction form. Please note, however, that this option is intended to be provided as a convenience to beneficial shareholders only, and there is no guarantee this option will be available for every type of beneficial shareholder voting control number. The inability to provide this option to any or all beneficial shareholders shall in no way impact the validity of the Annual Meeting. Beneficial shareholders may choose the Register in Advance of the Annual Meeting option above, if they prefer to use this traditional, paper-based option. You may vote your shares as usual via ProxyVote.com.
In any event, please go to www.meetnow.global/MFQZ9X7 for more information on the available options and registration instructions.
| ||
For the 2024 proxy season, an industry solution has been agreed upon to allow beneficial shareholders to register online at the Annual Meeting to attend, ask questions and vote. We expect that the vast majority of beneficial shareholders will be able to fully participate using the control number received with their voting instruction form. Please note, however, that this option is intended to be provided as a convenience to beneficial shareholders only, and there is no guarantee this option will be available for every type of beneficial shareholder voting control number. The inability to provide this option to any or all beneficial shareholders shall in no way impact the validity of the Annual Meeting. Beneficial shareholders may choose the Register in Advance of the Annual Meeting option above, if they prefer to use this traditional, paper-based option. You may vote your shares as usual via ProxyVote.com. | ||
In any event, please go to www.meetnow.global/M5HMPQG for more information on the available options and registration instructions. | ||
Q: | What if I have trouble accessing the Annual Meeting virtually? |
| ||
A: | The virtual meeting platform is fully supported across browsers |
Computershare
1-888-724-2416
1-781-575-2748
Hours: 8:30 a.m. - 6:00 p.m. Eastern Time
| ||
Computershare | ||
1-888-724-2416 | ||
1-781-575-2748 | ||
Hours: 8:30 a.m. - 6:00 p.m. Eastern Time | ||
Q: | May I propose actions for consideration at next |
| ||
A: | Yes. You may submit proposals for consideration at the |
Proposals To Be Included In The Proxy Statement and Voted On At The Meeting. Proposals that shareholders wish to have included in the proxy statement for the 2023 Annual Meeting of Shareholders must be made in accordance with SEC Rule 14a-8. Proposals must be received by the Company's Corporate Secretary on or before November 18, 2022, at the above address.
Proposals To Be Voted On At The Meeting Only. Under Section 1.12 of the Company's Bylaws, for a shareholder to bring a proposal before the 2023 Annual Meeting, the Company must receive the written proposal not later than 80 days nor earlier than 90 days before the first anniversary of the 2022 annual meeting; in other words, not earlier than January 29, 2023, and no later than February 8, 2023. The proposal also must contain the information required in the Bylaws. If you wish to make one or more nominations for election to the Board, the required information includes, among other things, the written consent of such individual to serve as director and (i) the name, age, business address and, if known, residence address of each nominee, (ii) the principal occupation or employment of each nominee, and (iii) the number of shares of Bank of Hawaii Corporation common stock each nominee beneficially owns. These advance notice provisions are separate from the requirements a shareholder must meet to have a proposal included in the proxy statement under SEC rules. By complying with these provisions, a shareholder may present a proposal in person at the meeting, but will not be entitled to have the proposal included in the Company's proxy statement unless they comply with the requirements described in the preceding paragraph. Persons holding proxies solicited by the Board may exercise discretionary authority to vote against such proposals.
| ||
Proposals To Be Included In The Proxy Statement and Voted On At The Meeting. Proposals that shareholders wish to have included in the proxy statement for the 2025 Annual Meeting of Shareholders must be made in accordance with SEC Rule 14a-8. Proposals must be received by the Company’s Corporate Secretary on or before November 17, 2024, at the above address. | ||
Proposals To Be Voted On At The Meeting Only. Under Section 1.12 of the Company’s Bylaws, for a shareholder to bring a proposal before the 2025 Annual Meeting, the Company must receive the written proposal not later than 80 days nor earlier than 90 days before the first anniversary of the 2024 annual meeting; in other words, not earlier than January 26, 2025, and no later than February 5, 2025. The proposal also must contain the information required in the Bylaws. If you wish to make one or more nominations for election to the Board, the required information includes, among other things, the written consent of such individual to serve as director and (i) the name, age, business address and, if known, residence address of each nominee, (ii) the principal occupation or employment of each nominee, and (iii) the number of shares of Bank of Hawai‘i Corporation common stock each nominee beneficially owns. These advance notice provisions are separate from the requirements a shareholder must meet to have a proposal included in the proxy statement under SEC rules. By complying with these provisions, a shareholder may present a proposal in person at the meeting, but will not be entitled to have the proposal included in the Company’s proxy statement unless they comply with the requirements described in the preceding paragraph. Persons holding proxies solicited by the Board may exercise discretionary authority to vote against such proposals. In addition to satisfying the foregoing requirements under the Company’s Bylaws, to comply with the “universal proxy rules”, shareholders who intend to solicit proxies in support of director nominees at the 2025 Annual Meeting must include the additional information required by SEC Rule 14a-19(b) including a statement that they intend to solicit 67% of outstanding voting shares. | ||
Q: | Where can I find the voting results of the Annual Meeting? |
| ||
A: | We plan to announce preliminary voting results at the Annual Meeting. We will publish final voting results in a report on Form 8-K within four business days of the Annual Meeting. |
| ||
Q: | What happens if the meeting is postponed or adjourned? |
| ||
A: | Your proxy will remain valid and may be voted at the postponed or adjourned meeting. You will still be able to change or revoke your proxy until it is voted. |
5
PROPOSAL 1: ELECTION OF DIRECTORS
The Company’s Certificate of Incorporation requires that the Company’s Board consist of not fewer than three directors and not more than 15 directors, with the exact number to be determined by the Board. On October 22, 2021, theThe Board fixed the number of directors for election at the annual meeting at 14.to be 12. Each of the 1412 directors listed below has been nominated for a one-year term to serve until the 20232025 Annual Meeting of Shareholders and until his or her successor is elected and qualifiedor until the director’s earlier resignation, removal, death or disqualification. In the event that any or all of the director nominees are unable to stand for election as director, the Board, upon the recommendation of the Nominating & Corporate Governance Committee, may select different nominees for election as directors.
Certain information with respect to each of the nominees is set forth below, including his or her principal occupation, qualifications, and directorships during the past five years. Each nominee has consented to serve and all nominees are currently serving on the Company’s Board. The nominees were each recommended to the Board by the Company’s Nominating & Corporate Governance Committee whose goal is to assemble a board that operates cohesively, encourages candid communication and discussion, and focuses on activities that help the Company create sustainable long-term growth and maximize shareholder value. The Nominating & Corporate Governance Committee also looks at the individual strengths of directors, their ability to contribute to the Board, and whether their skills and experience complement those of the other directors. A more detailed discussion on the nomination process and the criteria the Nominating & Corporate Governance Committee considers in their evaluation of director candidates is found in the Commitment to Effective Corporate Governance section which begins on page 18.
The Board of Directors recommends a vote “FOR” each of the nominees.
Name | Age |
|
| Year First Elected as Director |
| Independent |
| Other Public Directorships Held in Last 5 Years |
| Committee Membership | Age |
| Year First |
| Independent |
| Other Public |
| Committee Membership | |
S. Haunani Apoliona |
| 72 |
|
| 2004 |
| Yes |
| None |
| BPC, FIMC, NCGC | |||||||||
Mark A. Burak |
| 73 |
|
| 2009 |
| Yes |
| None |
| ARC, NCGC | |||||||||
John C. Erickson |
| 60 |
|
| 2019 |
| Yes |
| 2 |
| ARC, NCGC | 62 |
| 2019 |
| Yes |
| 2 |
| ARC, BSC, NCGC |
Joshua D. Feldman |
| 49 |
|
| 2019 |
| Yes |
| None |
| BPC, DAC, HRC, NCGC | 51 |
| 2019 |
| Yes |
| None |
| DAC, HRC, NCGC |
Peter S. Ho |
| 56 |
|
| 2009 |
| No |
| None |
| None | 58 |
| 2009 |
| No |
| None |
| None |
Michelle E. Hulst |
| 48 |
|
| 2019 |
| Yes |
| 1 |
| DAC, HRC, NCGC | 50 |
| 2019 |
| Yes |
| None |
| DAC, HRC, NCGC |
Kent T. Lucien |
| 68 |
|
| 2006 |
| No |
| 1 |
| BPC, DAC, FIMC | 70 |
| 2006 |
| Yes |
| None |
| ARC, BSC, DAC, FIMC, NCGC |
Elliot K. Mills |
| 52 |
|
| 2021 |
| Yes |
| None |
| DAC, HRC, NCGC | 54 |
| 2021 |
| Yes |
| None |
| DAC, HRC, NCGC |
Alicia E. Moy |
| 44 |
|
| 2017 |
| Yes |
| 1 |
| ARC, FIMC, NCGC | 46 |
| 2017 |
| Yes |
| 1 |
| ARC, BSC, FIMC, NCGC |
Victor K. Nichols |
| 65 |
|
| 2014 |
| Yes |
| 2 |
| ARC, DAC, NCGC | 67 |
| 2014 |
| Yes |
| 2 |
| ARC, BSC, DAC, NCGC |
Barbara J. Tanabe |
| 72 |
|
| 2004 |
| Yes |
| None |
| ARC, FIMC, HRC, NCGC | |||||||||
Dana M. Tokioka |
| 51 |
|
| 2020 |
| Yes |
| None |
| DAC, FIMC | 53 |
| 2020 |
| Yes |
| None |
| DAC, FIMC |
Raymond P. Vara, Jr. |
| 52 |
|
| 2013 |
| Yes |
| None |
| ARC, HRC, NCGC | 54 |
| 2013 |
| Yes |
| None |
| ARC, BSC, HRC, NCGC |
Suzanne P. Vares-Lum | 56 |
| 2023 |
| Yes |
| None |
| FIMC, NCGC | |||||||||||
Robert W. Wo |
| 69 |
|
| 2002 |
| Yes |
| None |
| FIMC, HRC, NCGC | 71 |
| 2002 |
| Yes |
| None |
| FIMC, HRC, NCGC |
ARC - Audit & Risk Committee
BPCBSC - Benefit PlansBalance Sheet Committee
DAC - Digital Advisory Committee
FIMC - Fiduciary & Investment Management Committee
HRC - Human Resources & Compensation Committee
NCGC - Nominating & Corporate Governance Committee
6
As one of the largest financial institutions in Hawaii,Hawai‘i, finding director candidates with a deep knowledge of the focused market in which we operate is critical. The nominees'nominees’ breadth and diversity of experience, mix of qualifications, attributes, and skills strengthen our Board of Director'sDirector’s effective oversight of the Company'sCompany’s business. While our longer tenured directors bring a wealth of experience and deep understanding of the business, we recognize the need for fresh perspectives, have consistently added new directors, and are committed to continued board and committee diversity and refreshment.
6
ATTRIBUTES AND SKILLS OF THE NOMINEES
Nominees for directors are selected based on, among other criteria, their integrity, informed judgment, financial literacy, high performance standards, accomplishments and reputation in the community, experience, skill sets, ability to commit adequate time to Board and committee matters, and to act on behalf of shareholders. The criteria also includes a determination of the needs of the Board and of the individual’s personal qualities and characteristics with those of the other directors and potential directors in building a Board that is effective, collegial and responsive to the needs of the Company and its shareholders. The composition of the Board should encompass a broad range of skills, expertise, industry knowledge, diversity of background and viewpoint, and professional and community contacts relevant to the Company’s business.
12 Director Nominees: | Erickson | Feldman | Ho | Hulst | Lucien | Mills | Moy | Nichols | Tokioka | Vara | Vares-Lum | Wo |
Experience and Skills | ||||||||||||
Finance | ü |
| ü |
| ü | ü | ü | ü | ü | ü |
|
|
Banking | ü |
| ü |
| ü |
|
| ü |
|
|
|
|
Technology |
|
|
| ü |
|
|
| ü | ü |
|
|
|
Retail |
| ü |
|
|
| ü |
| ü |
|
| ü | |
Tourism |
|
|
|
|
| ü |
|
|
|
|
|
|
Marketing/Communications |
|
|
| ü |
|
|
| ü |
|
| ü |
|
International Experience | ü | ü | ü | ü |
|
| ü | ü |
|
| ü | ü |
Health |
|
|
|
|
|
|
|
|
| ü |
|
|
Education |
|
|
|
|
| ü |
| ü |
|
| ü |
|
Community | ü | ü |
| ü | ü | ü | ü | ü | ü | ü | ü | |
Hawai'i Market |
| ü | ü |
| ü | ü | ü |
| ü | ü | ü | ü |
Human Resources |
|
|
|
|
|
|
| ü |
|
|
|
|
Government Experience |
|
|
|
|
|
|
|
|
| ü | ü |
|
Energy |
|
|
|
|
| ü |
|
|
|
|
| |
Risk Management | ü |
|
|
|
| ü |
| ü | ü | ü | ü |
|
CEO Experience | ü | ü |
| ü |
| ü | ü |
| ü | ü | ü | |
Background | ||||||||||||
Gender |
|
|
|
| ||||||||
Male | ü | ü | ü |
| ü | ü |
| ü |
| ü |
| ü |
Female |
|
|
| ü |
|
| ü |
| ü |
| ü |
|
Non-binary |
|
|
|
|
|
|
|
|
|
|
|
|
Race |
|
|
|
| ||||||||
American Indian or Alaskan Native |
|
|
|
|
|
|
|
|
|
|
|
|
Asian |
|
| ü |
|
|
| ü |
| ü |
| ü | ü |
Black or African American |
|
|
|
|
|
|
|
|
|
|
|
|
Hispanic or Latinx |
|
|
|
|
|
|
|
|
|
|
|
|
Native Hawaiian or Pacific Islander |
|
|
|
|
| ü |
|
|
|
| ü |
|
White | ü | ü |
| ü | ü |
| ü | ü | ü | ü | ü |
|
Age/Tenure |
|
|
|
| ||||||||
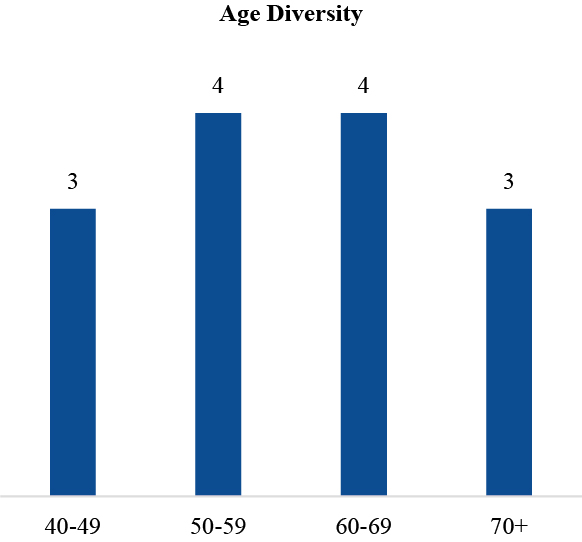
Age | 62 | 51 | 58 | 50 | 70 | 54 | 46 | 67 | 53 | 54 | 56 | 71 |
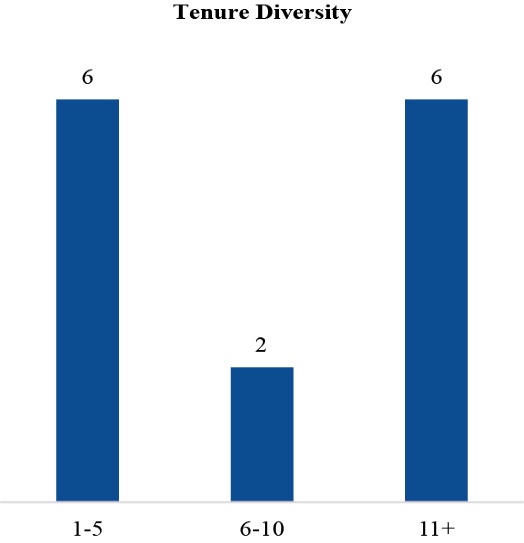
Years on the Board | 4 | 4 | 14 | 4 | 17 | 2 | 6 | 9 | 3 | 10 | <1 | 21 |
Board Diversity & Skills | ||||
11 | 6 | 4 | 6 | 4 |
Experience with unique Hawaii marketplace | Independent directors with financial expertise | Significant international experience | Banking experience | Other public company board experience |
2 | 1 | 3 | 5 | 7 |
Media expertise | Background in public policy | Technology experience | Female directors | Native Hawaiian and/or Asian ancestry |
7
QUALIFICATIONS AND EXPERIENCE
|
| Qualifications |
John C. Erickson |
|
7
QUALIFICATIONS AND EXPERIENCE
|
| |
| Key Experience and Qualifications | |
• | ||
| ||
| ||
| ||
| ||
| ||
| ||
|
| |
| ||
| ||
| ||
| ||
| ||
| ||
|
8
|
| |
|
| |
| ||
Career Highlights | ||
| ||
• Mr. Erickson began his career at Union Bank in 1983 and served in various leadership roles including Vice Chairman, Chief Corporate Banking Officer responsible for Commercial Banking, Real Estate Industries, Global Treasury Management, Global Capital Markets, and Wealth Management, and as Vice Chairman and Chief Risk Officer responsible for enterprise-wide risk management and regulatory relations. | ||
Other Professional Experience and Community Involvement | ||
• Mr. Erickson served on the boards of the California Bankers Association, The Living Desert as a member of the Finance and Long Range Planning Committees, and The Music Center as its Treasurer and • Mr. Erickson was a member of the Audit Committee Roundtable of Orange County, the Financial Services Board Roundtable, and the American Bankers Association Bankers Council. | ||
Education | ||
| ||
• Mr. Erickson received his bachelor’s degree with an emphasis in economics, and his M.B.A. with an emphasis in finance from the University of Southern California. | ||
Joshua D. Feldman | Key Experience and Qualifications | |
• Mr. Feldman is President and CEO of Tori Richard, Ltd., founded in 1956. Tori Richard, Ltd. is a Honolulu-based manufacturer, wholesaler and retailer of branded resort apparel, licensed apparel products, private label clothing and uniforms. He began his career in 1994 and was appointed President and CEO in 2004. Mr. Feldman has a solid understanding of the | ||
Career Highlights | ||
| ||
• Under his leadership, Mr. Feldman created Tori Richard’s retail division, TR Retail LLC, relaunched the • Tori Richard, Ltd. and subsidiary branded and private label products are sold in over 1,500 specialty and department store locations throughout the world. The company operates 21 company-owned stores in the state of Hawai‘i. | ||
Other Professional Experience and Community Involvement | ||
• Mr. Feldman is committed to the community, having served on the boards of • He currently serves | ||
Education | ||
| ||
• Mr. Feldman graduated magna cum laude with a bachelor’s degree from the University of California, San Diego. |
8
9
Name | Qualifications | |
Peter S. Ho | Key Experience and Qualifications | |
• As Chairman and CEO, Mr. Ho remains focused on the Bank’s longstanding strategy • Under Mr. Ho’s leadership, Bank of | ||
Career Highlights | ||
| ||
• Mr. Ho has served as Chairman and CEO of the Company since July 2010; President since April 2008; Vice Chair and Chief Banking Officer from January 2006-April 2008; Vice Chair, Investment Services Group from April 2004-December 2005; and Executive Vice President, • In 2018, Mr. Ho completed his second three-year term on the board of the Federal Reserve Bank of San Francisco. | ||
Other Professional Experience and Community Involvement | ||
• Mr. Ho served as Chairman of the 2011 Asia Pacific Economic Cooperation • Mr. Ho currently serves as vice chairman of the State of • Mr. Ho is active in the | ||
Education | ||
| ||
• Mr. Ho holds a bachelor of science degree in business administration and an M.B.A. from the University of Southern California. He is also a 2008 graduate of Harvard Business School’s Advanced Management Program. |
9
10
Name | Qualifications | |
Michelle E. Hulst | Key Experience and Qualifications | |
• Ms. Hulst • Ms. Hulst served as Executive Vice President, Global Data & Strategy, Chief Operating Officer and Chief Data Officer at The Trade Desk, company’s rapid geographic expansion. • Ms. Hulst | ||
Career Highlights | ||
| ||
• Prior to Oracle Data Cloud, Ms. Hulst worked at Datalogix Inc., from 2006 to 2015, where she served as Senior Vice President of Strategic Partnerships and Business Development. During her tenure at Datalogix, Inc., she led the global deal team’s execution of pivotal partnerships with companies such as Facebook, Twitter, and Google, which were instrumental in the transformation of the business. She also was a member of the executive team that led the sale of Datalogix to Oracle. | ||
Other Professional Experience and Community Involvement | ||
• Ms. Hulst also worked at Entertainment Publications, an operating business of IAC/InterActiveCorp, where she held several positions, including Vice | ||
Education | ||
| ||
• Ms. Hulst earned a bachelor’s degree in organizational psychology from the University of Michigan and her M.B.A., with an emphasis in strategy, marketing and entrepreneurship, from Northwestern University’s Kellogg School of Management. | ||
Kent T. Lucien | Key Experience and Qualifications | |
• Mr. Lucien’s senior executive experience in major • Mr. Lucien was elected to the Board in 2006 and served as Chair of the Audit & Risk Committee prior to becoming the Company’s Chief Financial Officer in 2008. | ||
Career Highlights | ||
| ||
• Mr. Lucien served as Vice Chair and Chief Strategy Officer from March 2017 to April 2020 and executed the Bank’s key strategic initiatives, including the “Branch of Tomorrow” modernization project and leveraging information and technology to reshape the delivery of banking services, products and experiences with a customer focus. • Mr. Lucien served as Vice Chair and Chief Financial Officer of the Company from April 2008 to February 2017. | ||
Other Professional Experience and Community Involvement | ||
• Prior to his employment with the Company, Mr. Lucien served as a Trustee for C. Brewer & Co. Ltd., (a • He also worked for Pricewaterhouse Coopers and is a Certified Public Accountant (inactive). • He served on the board of Wailuku Water Company LLC. | ||
Education | ||
| ||
• Mr. Lucien received his bachelor’s degree from Occidental College and his M.B.A. from Stanford University. |
10
11
Name | Qualifications | |
Elliot K. Mills | Key Experience and Qualifications | |
• Mr. Mills brings an abundance of expertise and insight of | ||
Career Highlights | ||
| ||
• Mr. Millsserves as Vice President of Hotel Operations for Disneyland Resort and Aulani, A Disney Resort and Spa. Mr. Mills is responsible for overseeing all operations for the Disneyland Hotel, Disney’s Paradise Pier Hotel and Disney’s Grand Californian Hotel & Spa in Anaheim, California, and Aulani, A Disney Resort & Spa, in Ko Olina on O‘ahu. • Mr. Mills had a special focus on advancing Hawaiian culture and values as the focal point for Aulani’s unique hospitality and service experience. | ||
Other Professional Experience and Community Involvement | ||
• Mr. Mills has held various executive and resort management positions on the islands of • Mr. Mills serves on a variety of boards, including | ||
Education | ||
| ||
• Mr. Mills holds a degree in business administration with an emphasis in travel industry management from the University of Hawai‘i at Mānoa, and has completed the Cornell Hospitality Management General Managers Program. | ||
Alicia E. Moy | Key Experience and Qualifications | |
• Ms. Moy’s expertise in utilities and energy has given her a unique and holistic perspective on the integrated nature of | ||
Career Highlights | ||
| ||
• Ms. Moy has been President and Chief Executive Officer of Hawai‘i Gas since May 2013, which is the state’s only government-franchised, full-service gas company. Hawai‘i. • From 2001 to 2013, Ms. Moy was Senior Vice President with Macquarie Infrastructure and Real Assets (“MIRA”), where she oversaw corporate strategy, strategic planning, funding and management of several MIRA-managed utility companies, including Hawai‘i Gas. | ||
Other Professional Experience and Community Involvement | ||
• Ms. Moy has served as a member of Hawai‘i Gas’s board of directors since 2011. From 1999-2001, Ms. Moy worked for Morgan Stanley in the Investment Banking division, where she was involved in corporate finance and mergers and acquisitions for private equity clients. •
Ms. Moy is a member of the Hawaii Business Roundtable and the Military Affairs Council. She serves on the boards of the | ||
Education | ||
| ||
• Ms. Moy holds a bachelor’s degree in finance and marketing from the University of Miami and a master’s degree in finance from INSEAD. |
11
12
Name | Qualifications | |
Victor K. Nichols | Key Experience and Qualifications | |
• Mr. Nichols’s over 40 years of executive leadership experience and knowledge in both information technology and the financial services industry, as well as his background and expertise in marketing, data analytics and strategic planning, add a valuable global perspective to the Board in understanding the increasingly important role information technology has in the financial services industry. Mr. Nichols’s background, | ||
Career Highlights | ||
| ||
• Mr. Nichols is the Chairman of Make-A-Wish, International, a not-for-profit foundation providing life changing wishes to ill children in 50 countries outside of the U.S., and has held that position since November 2022. • Mr. Nichols served as an independent advisor to Harland Clarke • Mr. Nichols previously served as Chief Executive Officer of North America, Managing Director of EMEA, and President of Global Consumer Services for Experian, the leading global information services company providing data and analytical tools to clients around the world. • Prior to joining Experian, • Mr. Nichols • Mr. Nichols was past President and founding partner of VICOR, Inc., an advanced technology engineering firm leading business transformation with a concentration in the financial services | ||
Other Professional Experience and Community Involvement | ||
• Mr. Nichols • In addition, | ||
Education | ||
| ||
• Mr. Nichols holds a bachelor of science degree in economics from the University of California, San Diego, and an M.B.A. in finance from the University of California, Berkeley. |
13
12
Name | Qualifications | |
| Key Experience and Qualifications | |
• | ||
| ||
| ||
| ||
| ||
| ||
| ||
|
| |
| ||
Career Highlights | ||
| ||
• Ms. Tokioka serves as Vice President of Special • Prior to Atlas Insurance, Ms. Tokioka practiced both real estate and corporate law in California, representing numerous technology companies and performing due diligence for financings and M&A transactions. She negotiated terms and conditions for software, hardware, and consulting agreements and for strategic alliances with U.S. and international corporations. Ms. Tokioka also worked for Booz Allen Hamilton as an Economic Business Analyst to perform economic and cost analysis for IT systems as well as strategize financial and programmatic assessments for the U.S. Army. | ||
Other Professional Experience and Community Involvement | ||
• Ms. Tokioka was a member of the Board of Directors of Tradewind Capital Group, a • Ms. Tokioka is a dedicated supporter of the | ||
Education | ||
| ||
• Ms. Tokioka is a graduate of Tufts University with a bachelor of arts degree, cum laude, in history. She received her M.B.A. from the McDonough School of Business at Georgetown University and her Juris Doctor from the Georgetown University Law Center. |
13
14
Name | Qualifications | |
Raymond P. Vara, Jr. | Key Experience and Qualifications | |
• Mr. Vara’s financial and operational background coupled with his senior executive and audit committee experience make him qualified to serve on the Company’s Board. His community involvement and leadership of | ||
Career Highlights | ||
| ||
• Mr. Vara was named Hawaii Business Magazine CEO of the Year 2021. • As President and CEO of • Prior to his appointment to CEO in 2012, • Mr. Vara also served as Chief Financial Officer and Chief Executive Officer for Los Alamos Medical Center in New Mexico, an integrated health care service provider. | ||
Other Professional Experience and Community Involvement | ||
• Prior to joining the private sector, Mr. Vara held various positions in the United States Army, including Controller for the Army’s Northwestern Healthcare Network, Deputy Chief Financial Officer of the Madigan Army Medical Center in Tacoma, Washington, and Assistant Administrator and Chief Financial Officer of Bassett Army Community Hospital in Fairbanks, Alaska. • Mr. Vara is active in the | ||
Education | ||
| ||
• Mr. Vara holds a bachelor’s degree in business administration from |
14
Name | Qualifications | |
| Key Experience and Qualifications | |
• Ms. Vares-Lum is a retired Major General in the U.S. Army. She joined the Board in 2023, and her decades of executive leadership and planning experience qualify her to serve on our Board. | ||
Career Highlights | ||
• Ms. Vares-Lum has served as President of the East-West Center since January 2022. She is the first woman and Native Hawaiian to be chosen for this role since the Center’s establishment in 1960. In 2022, she launched a new strategic plan that advances the Center’s mission to promote understanding and relationships among people and nations of the U.S., Asia and Pacific through cooperative study, research and dialogue. • Ms. Vares-Lum formed Vares-Lum Indo-Pacific Consulting, LLC to provide consulting and advising on regional issues. She is an advocate for education and building bridges across the Indo-Pacific, and has led collaborative initiatives in the region. • As a retired Major General with 34 years of service, Ms. Vares-Lum has held key roles addressing priority national security challenges in the region, with over five years serving with and advising the most senior officials at U.S. Indo-Pacific Command, where she cultivated and maintained key relationships with nations throughout the Indo-Pacific region. | ||
Other Professional Experience and Community Involvement | ||
• As a community leader, Ms. Vares-Lum serves on a variety of nonprofit boards, including the American Red Cross Pacific Islands Region, Pacific and Asian Affairs Council, and the Pacific International Center for High Technology Research. • Ms. Vares-Lum is a current member of the U.S.-Japan Council and has also served on committees that promote Hawai‘i’s economic diversification, workforce development, and community dialogue on issues regarding land and water. • In addition to her military and community awards, she is the recipient of the 2023 Girl Scouts of Hawai‘i Women of Distinction Award, and a 2017 Ellis Island Medal of Honor Awardee. | ||
Education | ||
• Ms. Vares-Lum received her Bachelor of Arts degree in Journalism in 1989 and her Master of Education in Teaching in 1996 from the University of Hawai‘i at Mānoa. As a graduate of the U.S. Army War College, she earned a Master of Strategic Studies degree in 2011. In 2019, she became a National Security Fellow of the Maxwell School of Citizenship and Public Affairs at Syracuse University. She is also an alumna of the Daniel K. Inouye Asia-Pacific Center for Security Studies. | ||
Robert W. Wo | Key Experience and Qualifications | |
• As Owner and Director of C.S. Wo & Sons, Ltd. | ||
Career Highlights | ||
| ||
• Mr. Wo has been the Owner and Director of C.S. Wo & Sons, Ltd. since 1984. | ||
Other Professional Experience and Community Involvement | ||
• Mr. Wo is active in the community, having served on the boards of Aloha United Way, Junior Achievement of Hawaii, • Mr. Wo is a past member of the Hawaii Business Roundtable whose mission is to promote the overall economic vitality and social health of | ||
Education | ||
| ||
• Mr. Wo received his bachelor’s degree in economics from Stanford University and earned his M.B.A. from Harvard Business School. |
15
15
At the close of business on January 31, 2022,2024, Bank of HawaiiHawai‘i Corporation had 40,378,16539,821,950 shares of its common stock outstanding. As of January 31, 2022,2024, the following table shows the amount of Bank of HawaiiHawai‘i Corporation common stock owned by (i) each person or entity who is known by us to beneficially own more than five percent of Bank of HawaiiHawai‘i Corporation’s common stock; (ii) each current director and director nominee, (iii) each of the executive officers named in the Summary Compensation Table (the “named executive officers”), and (iv) all of our directors and executive officers as a group. Unless otherwise indicated and subject to applicable community property and similar statutes, all persons listed below have sole voting and investment power over all shares of common stock beneficially owned. Share ownership has been computed in accordance with SEC rules and does not necessarily indicate beneficial ownership for any other purpose.
Name | Number of |
| Right to |
| Total |
| Percent of |
| |
More than Five Percent Beneficial Ownership |
|
|
|
|
|
|
|
|
|
BlackRock, Inc. | 5,742,226 | (1) |
| — |
| 5,742,226 |
| 14.40% |
|
The Vanguard Group | 4,650,102 | (2) |
| — |
| 4,650,102 |
| 11.70% |
|
State Street Corporation | 2,363,909 | (3) |
| — |
| 2,363,909 |
| 5.95% |
|
Kayne Anderson Rudnick Investment Management LLC | 2,056,495 | (4) |
| — |
| 2,056,495 |
| 5.17% |
|
|
|
|
|
|
|
|
|
|
|
Current Directors and Director Nominees |
|
|
|
|
|
|
|
|
|
S. Haunani Apoliona | 38,572 | (5) |
| — |
| 38,572 |
| * |
|
Mark A. Burak | 13,701 | (5) |
| — |
| 13,701 |
| * |
|
John C. Erickson | 8,382 | (5)(6) |
| — |
| 8,382 |
| * |
|
Joshua D. Feldman | 5,987 | (5) |
| — |
| 5,987 |
| * |
|
Michelle E. Hulst | 4,586 | (5) |
| — |
| 4,586 |
| * |
|
Kent T. Lucien | 42,030 | (5)(6)(7) |
| — |
| 42,030 |
| * |
|
Elliot K. Mills | 3,180 | (5) |
| — |
| 3,180 |
| * |
|
Alicia E. Moy | 10,482 | (5) |
| — |
| 10,482 |
| * |
|
Victor K. Nichols | 28,124 | (5) |
| — |
| 28,124 |
| * |
|
Barbara J. Tanabe | 34,088 | (5) |
| — |
| 34,088 |
| * |
|
Dana M. Tokioka | 4,410 | (5) |
| — |
| 4,410 |
| * |
|
Raymond P. Vara, Jr. | 9,878 | (5) |
| — |
| 9,878 |
| * |
|
Suzanne P. Vares-Lum | 1,525 | (5) |
|
|
| 1,525 |
| * |
|
Robert W. Wo | 82,890 | (5)(6) |
| — |
| 82,890 |
| * |
|
|
|
|
|
|
|
|
|
|
|
Named Executive Officers |
|
|
|
|
|
|
|
|
|
Peter S. Ho (also Director Nominee) | 290,994 |
|
| — |
| 290,994 |
| * |
|
Dean Y. Shigemura | 70,945 | (6) |
| — |
| 70,945 |
| * |
|
Marco A. Abbruzzese | 13,735 |
|
| — |
| 13,735 |
| * |
|
Matthew K.M. Emerson | 23,572 |
|
| — |
| 23,572 |
| * |
|
S. Bradley Shairson | 29,291 |
|
| — |
| 29,291 |
| * |
|
All current directors, director nominees, and executive officers as a group (24 persons) | 983,032 |
|
| — |
| 983,032 |
| 2.47% |
|
* Each of the current directors, director nominees, and named executive officers beneficially owned less than one percent of Bank of | |||||||||
Name |
| Number of Shares Beneficially Owned |
| Right to Acquire Within 60 Days |
|
| Total |
|
| Percent of Outstanding Shares as of January 31, 2022 |
|
| ||||||
More than Five Percent Beneficial Ownership |
|
|
|
|
|
|
|
|
|
|
|
|
|
|
|
|
|
|
The Vanguard Group 100 Vanguard Blvd. Malvern, Pennsylvania 19355 |
|
| 3,841,480 |
| (1) |
|
| — |
|
|
| 3,841,480 |
|
|
| 9.55 | % |
|
BlackRock, Inc. 55 East 52nd Street New York, New York 10055 |
|
| 3,801,808 |
| (2) |
|
| — |
|
|
| 3,801,808 |
|
|
| 9.40 | % |
|
Kayne Anderson Rudnick Investment Management LLC 1800 Avenue of the Stars, 2nd Floor, Los Angeles, California 90067 |
|
| 2,714,193 |
| (3) |
|
|
|
|
|
| 2,714,193 |
|
|
| 6.71 | % |
|
Neuberger Berman Group LLC 1290 Avenue of the Americas New York, New York 10104 |
|
| 2,602,515 |
| (4) |
|
| — |
|
|
| 2,602,515 |
|
|
| 6.47 | % |
|
|
|
|
|
|
|
|
|
|
|
|
|
|
|
|
|
|
|
|
Current Directors and Director Nominees |
|
|
|
|
|
|
|
|
|
|
|
|
|
|
|
|
|
|
S. Haunani Apoliona |
|
| 32,889 |
| (5) |
|
| — |
|
|
| 32,889 |
|
| * |
|
| |
Mark A. Burak |
|
| 11,484 |
| (5) |
|
| — |
|
|
| 11,484 |
|
| * |
|
| |
John C. Erickson |
|
| 6,165 |
| (5)(6) |
|
| — |
|
|
| 6,165 |
|
| * |
|
| |
Joshua D. Feldman |
|
| 3,770 |
| (5) |
|
| — |
|
|
| 3,770 |
|
| * |
|
| |
Michelle E. Hulst |
|
| 2,369 |
| (5) |
|
| — |
|
|
| 2,369 |
|
| * |
|
| |
Kent T. Lucien |
|
| 38,813 |
| (6)(7) |
|
| — |
|
|
| 38,813 |
|
| * |
|
| |
Elliot K. Mills |
|
| 376 |
| (5) |
|
| — |
|
|
| 376 |
|
| * |
|
| |
Alicia E. Moy |
|
| 4,065 |
| (5) |
|
| — |
|
|
| 4,065 |
|
| * |
|
| |
Victor K. Nichols |
|
| 19,465 |
| (5) |
|
| — |
|
|
| 19,465 |
|
| * |
|
| |
Barbara J. Tanabe |
|
| 28,186 |
| (5) |
|
| — |
|
|
| 28,186 |
|
| * |
|
| |
Dana M. Tokioka |
|
| 2,193 |
| (5) |
|
| — |
|
|
| 2,193 |
|
| * |
|
| |
Raymond P. Vara, Jr. |
|
| 7,661 |
| (5) |
|
| — |
|
|
| 7,661 |
|
| * |
|
| |
Robert W. Wo |
|
| 68,386 |
| (5)(6) |
|
| — |
|
|
| 68,386 |
|
| * |
|
| |
|
|
|
|
|
|
|
|
|
|
|
|
|
|
|
|
|
|
|
Named Executive Officers |
|
|
|
|
|
|
|
|
|
|
|
|
|
|
|
|
|
|
Peter S. Ho (also Director Nominee) |
|
| 242,452 |
|
|
|
| — |
|
|
| 242,452 |
|
| * |
|
| |
Dean Y. Shigemura |
|
| 62,977 |
| (6) |
|
| — |
|
|
| 62,977 |
|
| * |
|
| |
Sharon M. Crofts |
|
| 69,666 |
|
|
|
| — |
|
|
| 69,666 |
|
| * |
|
| |
James C. Polk |
|
| 103,442 |
| (6) |
|
| — |
|
|
| 103,442 |
|
| * |
|
| |
Mary E. Sellers |
|
| 97,206 |
| (6) |
|
| — |
|
|
| 97,206 |
|
| * |
|
| |
All current directors, director nominees, and executive officers as a group (21 persons) |
|
| 833,541 |
|
|
|
| — |
|
|
| 833,541 |
|
|
| 2.06 | % |
|
* Each of the current directors, director nominees, and named executive officers beneficially owned less than one percent of Bank of Hawaii Corporation's outstanding common stock as of January 31, 2022. | ||||||||||||||||||
16
|
|
16
|
|
|
|
|
|
17 |
|
|
|
|
|
17
SOUND ENVIRONMENTAL, SOCIAL, AND GOVERNANCE LEADERSHIP
The Company is dedicated to making corporate social responsibility a part of everything we do in the communities we serve—serve, including how we manage and develop our people, the products and services we offer, and the investments we make in creating a sustainable and resilient economy in our communities. The Bank’s commitment to integrity and ethical excellence drives itsCompany’s Environmental, Social and Governance (“ESG”) strategy. The Company’s senior management team develops the Company’s ESG strategic direction andCommittee is driving progress through an internal ESG working group led by a cross-functional team of senior executives representing Corporate Communications, Community & Employee Engagement, Philanthropy, Real Estate & Facilities, Human Resources,Banking, People Services, Investor Relations, Legal, Risk and Legal. Our Board is charged with providing guidance, insightVendor Management, and oversight asall aspects of our revenue generating businesses. The ESG Committee reports to the strategy, initiativesNominating and management’s performance in achieving ESG goals.Corporate Governance Committee of the Board. Senior management and the Board remain committed to being a leader among Hawaii’sHawai‘i’s corporate citizens by fostering an effective and efficient risk and control environment that includes an emphasis on an ethically driven culture, sustainable growth, and an ongoing investment in our employees and our community. The Company publishes an annual ESG Report, which adheres to the Sustainability Accounting Standards Board (“SASB”) framework.
The Company’s Code of Business Conduct and Ethics drives a workplace and workforce that embraces the highest ethical and moral standards. We maintain strong and confidential reporting processes and procedures that support an open and honest environment in an effort to ensure that the highest principles of integrity and inclusion are maintained.
The Company believes that a diverse and inclusive workforce fosters an environment where everyone can thrive and be successful. As of December 31, 2021,2023, approximately 87% of the Company’s workforce are minoritiesethnically diverse (non-Caucasian) and approximately 63% are female, including 45%43% and 56%60% of our senior leaders and managers, respectively. In addition, we conduct an external pay equity study periodically to ensure that a gender pay gap does not exist.
COMMITMENT TO EFFECTIVE CORPORATE GOVERNANCE
The Company is committed to effective corporate governance practices that enhance and protect shareholder rights including:rights. As of December 31, 2023, the following corporate governance practices were in place:
Annually elected directors
Majority voting in director elections with a plurality carve out in the case of contested elections and a director resignation policy
Independent directors comprise 86% (12)93% (14) of the Board and 100% of key committees
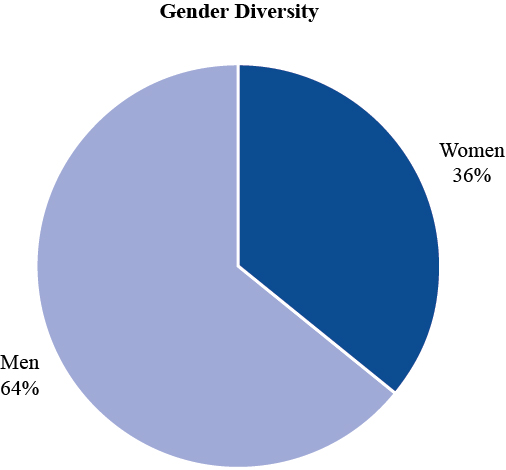
36%40% of directors are women (5)
50%53% of directors are ethnically diverse (7)
Ongoing director refreshment with 6 new directors added in the past 5 years
The directors are subject to Company stock ownership guidelines equal to 5 times the director annual cash retainer
Directors actively participate in continuing education programs on corporate governance and related issues
Each director attended at least 75% of the Board and the director’s assigned committee meetings
The Company has adopted an annual frequency for the Say-on-Pay vote
The Company participates in robust shareholder outreach activities
The Company supports a whistleblower policy and program
The Company maintains a clawback policy
No poison pill has been adopted
18
Corporate Governance Guidelines
The Company and the Board have adopted Corporate Governance Guidelines (“Governance Guidelines”). The Governance Guidelines are posted on the Investor Relations page of the Company’s website at www.boh.com. The Governance Guidelines address director qualification and independence standards, responsibilities of the Board, access to management and access to independent advisors, compensation, orientation and continuing education, Board committees, Chief Executive Officer (“CEO”) evaluation, management succession, Code of Business Conduct and Ethics, shareholder communications to the Board and the Board’s annual performance evaluation.
The Company’s leadership structure includes both a combined Chairman and CEO and a separate Lead Independent Director. At this time, the Board believes that it is in the best interests of the Company to have a single individual serve as Chairman and CEO to control and implement the short- and long-term strategies of the Company. The Board believes that this joint position provides it with the ability to perform its oversight role over management with the benefit of a management perspective as to the Company’s business strategy and all other aspects of the business. With its Lead Independent Director, this governance structure also provides a form of leadership that allows the Board to function distinct from management, capable of objective judgment regarding management’s performance, and enables
18
the Board to fulfill its duties effectively and efficiently. The Company’s leadership structure promotes the objectivity of the Board’s decisions and its role in reviewing the performance of management. Through its leadership and governance processes the Company seeks to establish a governance structure that provides both oversight and guidance by the Board to management regarding strategic planning, risk assessment and management, and corporate performance.
The Company’s Lead Independent Director is appointed by the Board and the current Lead Independent Director, Mr. Raymond P. Vara, Jr., was appointed in April 2020. The Company’s Governance Guidelines clearly define the Lead Independent Director’s role and duties which include, but are not limited to, serving as ChairmanChair of the Company’s Nominating & Corporate Governance Committee, presiding over regularly scheduled executive sessions of the non-management directors, serving as a liaison between the non-management directors and executive management, and assisting the Board and executive management to ensure compliance with the Governance Guidelines.
The Company’s Nominating & Corporate Governance CommitteeBoard has determined that 1211 of the 13 current11 non-management directors,director nominees for the 2024 Annual Meeting of Shareholders, including the Lead Independent Director, are “independent” as defined by the NYSE rules. The non-management directors meet in executive session without management in attendance for regularly scheduled meetings. The non-management directors may also meet in executive session each time the full Board convenes for a meeting. In 2021,2023, the non-management directors met threefive times in executive session. The Lead Independent Director also meets regularly on an individual basis with members of the Company’s executive management team.
Director Qualifications and Nomination Process
The Nominating & Corporate Governance Committee is responsible for identifying and assessing all director candidates and recommending nominees to the Board. Potential nominees are evaluated based on their independence, within the meaning of the Governance Guidelines and the rules of the NYSE. Candidates to be nominated as a director, including those submitted by shareholders, are selected based on, among other criteria, their integrity, informed judgment, financial literacy, high performance standards, accomplishments and reputation in the community, experience, skill sets, and ability to commit adequate time to Board and committee matters and to act on behalf of shareholders. The criteria also include a determination of the needs of the Board and of the interplay between each individual’s personal qualities and characteristics and those of the other directors and potential directors in building a Board that is effective, collegial and responsive to the needs of the Company and its shareholders. In addition, Board members are expected to participate in continuing education and training opportunities to stay current on corporate governance, industry trends and issues and to enhance their understanding of the Company’s business.
The objective of the Nominating & Corporate Governance Committee is to present a combination of candidates that will result in a Board with a wide range of skills, expertise, industry knowledge, viewpoints, and backgrounds, with business and community contacts relevant to the Company’s business. To accomplish this, the Nominating & Corporate Governance Committee seeks candidates from different age groups, ethnicities, genders, industries, and experiences, in addition to the criteria described above. The Board includes directors with experience in public corporations, nonprofit organizations, and entrepreneurial individuals who have successfully run their own private enterprises. The Board also has the broad set of skills necessary for providing oversight to a financial institution, which includes proven leadership and expertise in finance, accounting, information technology, risk management, lending, investment management, digital marketing, data analytics and communications. A shareholder may submit a candidate for consideration by the Board to be included in the Board’s slate of director nominees. Candidates proposed by shareholders will be evaluated by the Nominating & Corporate Governance Committee under the same criteria that are applied to other candidates. The criteria are set forth above and in the Company’s Bylaws and Governance Guidelines. Candidates to be considered for nomination by the Nominating & Corporate Governance Committee at the 20232024 Annual Meeting of Shareholders must behave been presented in writing to the Corporate Secretary on or before November 18, 2022,2023, at 130 Merchant Street, Honolulu, HawaiiHawai‘i 96813.
19
Director Experience, Tenure, Diversity and Refreshment
The Board maintains a unique balance of experience, tenure, diversity, cultural and local market knowledge and broad subject matter expertise. While our longer-tenured directors carry a wealth of experience and deep understanding of the Company and our industry, the Board embraces the need for fresh perspectives and is committed to continued director refreshment.
Since 2017,2019, the Board has added six new directors. In anticipationThree of the current directors will retire at the 2024 Annual Meeting due to reaching the mandatory retirement of three directors in 2024, on October 22, 2021 the Board increased the number of directors on the Board to 14 and elected new director Elliot K. Mills to serve until the 2022 Annual Meeting. On February 18, 2022, Mr. Millsage, and the otherremaining 12 current directors were nominated to stand for re-election at the 20222024 Annual Meeting.
The Board employs a balanced approach to populating Board Committees. This refreshment strategy results in a membership that maintains new and contemporary perspectives, ideas and approaches, with the appointment of Mmes. Moy and Tanabe to the Audit & Risk Committee in 2020.approaches.
19
Board and Committee Evaluations
The Nominating & Corporate Governance Committee leads and oversees the annual evaluation of the Board and Board committees. The annual evaluation includes an individual director self-assessment and an independent third party hosted survey to determine whether the Board and its committees are functioning effectively. The Nominating & Corporate Governance Committee establishes the evaluation criteria, oversees the evaluation process, discusses the results with the Board, and implements any changes that emerge from the evaluations that the Board deems appropriate to enhance Board effectiveness.
An independent consultant provides assistance with the design of the online survey instrument and administers the survey on behalf of the Nominating & Corporate Governance Committee, thereby assuring anonymity of participant responses through a secure, encrypted website. A written report of total sample data, as well as data for the Board committees, is prepared by the consultant, analyzing the closed-end questions and including the verbatim comments offered by directors at the close of each section of the survey that may provide recommendations for improvement. The report also tracks current data against results from previous surveys, where comparable. The Nominating & Corporate Governance Committee, through the same third party, distributes a survey to executive management for feedback concerning how the Board and its committees can enhance their effectiveness.
Majority Voting
The Company’s Bylaws and Governance Guidelines provide for majority voting in uncontested elections and a resignation process in the event a director nominee does not obtain a majority of votes cast. The resignation process provides the Board with discretion to accept or reject a tendered resignation if a majority vote is not obtained. If the tendered resignation is not accepted by the Board, the Board shall not nominate such director to stand for re-election at the next annual meeting of shareholders.
Communication with Directors
Shareholders and any interested parties may communicate with the Board, non-management directors, or the Lead Independent Director by sending correspondence c/o the Company’s Corporate Secretary, 130 Merchant Street, Honolulu, HawaiiHawai‘i 96813. All appropriate communications received will be forwarded to the Board, non-management directors or the Lead Independent Director as addressed.
Code of Business Conduct and Ethics
The Company has earned its reputation as a respected leader in the communities it serves and in the financial services industry by conducting business in an ethical, responsible and professional manner. The Company is proud of the high standards of quality and service that have been its hallmark through the years. These qualities represent fundamental business practices and apply to all directors, officers and employees.
The Company and the Board have adopted a Code of Business Conduct and Ethics (the “Code”) for directors, executive officers (including the Company’s Chief Executive Officer, Chief Financial Officer, Principal Accounting Officer and Controller) and employees that are posted on the Investor Relations page of the Company’s website at www.boh.com. The Code addresses the professional, honest and ethical conduct required of each director, officer and employee, conflicts of interest, disclosure process, compliance with laws, rules and regulations (including securities trading), corporate opportunities, confidentiality, fair dealing, protection and proper use of Company assets, and encourages the reporting of any illegal or unethical behavior through robust reporting protocols and whistleblower protections. The Company also maintains a whistleblower and anti-retaliation policy and encourages conduct reporting through several designated channels, including the Chair of the Audit & Risk Committee, Chief Ethics Officer, General Counsel and a third party hosted anonymous alert line. A waiver of any provision of the Code may be made only by the Audit & Risk Committee of the Board and must be promptly disclosed as required by SEC and NYSE rules. The Company will disclose any such waivers, as well as any amendments to the Code, on the Company’s website at www.boh.com.
20
Policy Prohibiting Hedging and Pledging of Company Stock
The Company’s Securities Trading Policy (the “Policy”) specifically prohibits directors and employees from hedging the risk associated with the ownership of Bank of HawaiiHawai‘i Corporation’s common stock. The Policy also prohibits directors and employees from pledging transactions involving Bank of HawaiiHawai‘i Corporation common stock as collateral, including the use of a traditional margin account with a broker-dealer.
20
Director Independence
The Board is comprised of a majority of independent directors as defined by the NYSE listing standards. In affirmatively determining that a director is independent of the Company’s management and has no material relationship with the Company, either directly or indirectly as a partner, shareholder, or officer of an organization that has a relationship with the Company, the Board applies the following categorical standards, in addition to such other factors as the Board deems appropriate:
|
|
|
|
|
|
|
|
|
|
|
|
|
|
|
|
|
|
For purposes of these independence standards, an “immediate family member” includes the director’s spouse, parents, children, siblings, mothersmothers- and fathers-in-law, sonssons- and daughters-in-law, brothersbrothers- and sisters-in-law, and anyone (other than a domestic employee) who shares the director’s home.
21
The following 1211 director nominees standing for election have been determined by the Board to be independent: Messrs. Burak, Erickson, Feldman, Lucien, Mills, Nichols, Vara, and Wo, and Mmes. Apoliona, Hulst, Moy, Tanabe,Tokioka, and Tokioka,Vares-Lum, and accordingly, the Board has a majority of independent directors as defined by the listing standards of the NYSE and the Governance Guidelines. The Audit & Risk, Human Resources & Compensation, and Nominating & Corporate Governance Committees are each composed entirely of independent directors who also meet applicable committee independence standards. Mr. Ho is the Chairman, CEO and President of the Company and is therefore not independent. Mr. Lucien, who retired as an employee of the Company in April 2020, was formerly the Vice Chair and Chief Strategy Officer of the Company and is therefore not independent under the NYSE listing standards.
21
Human Resources & Compensation Committee Interlocks and Insider Participation
No member of the Human Resources & Compensation Committee during fiscal year 20212023 served as an officer, former officer, or employee of the Company or had a relationship that was required to be disclosed under “Certain Relationships and Related Transactions.” Further, during 2021,2023, no executive officer of the Company served as:
A member of the Human Resources & Compensation Committee (or equivalent) of any other entity, one of whose executive officers served as one of our directors or was an immediate family member of a director, or served on our Human Resources & Compensation Committee; or
A director of any other entity, one of whose executive officers or their immediate family member served on our Human Resources & Compensation Committee.
Oversight of Risk
The Company’s governance, including policies, standards and procedures, has been developed with the goal of ensuring that business decisions and the execution of business processes are in compliance with legal and regulatory requirements.
Authority for accepting risk exposures with appropriate limits on behalf of the Company originates from the Board. In turn, that authority is delegated through the Board-appointed Executive Committee, chaired by the CEO and comprised of executive management, and its subcommittees, including the Risk Council. The Risk Council, chaired by the Chief Risk Officer, provides the Executive Committee with a forum for the review and communication of both specific and company-wide risk issues, and serves to enhance collaboration among all areas of the Company that create and manage risk, while reinforcing executive management’s responsibility for ensuring risk is managed within established tolerances. The Asset and Liability Management Committee, a subcommittee of the Executive Committee, has responsibility for Company's balance sheet management.
Risk management at the Company is the process for identifying, measuring, controlling and monitoring risk across the enterprise given its business as a financial institution and financial intermediary. Risk Management crosses all functions and employees and is embedded in all aspects of planning and performance measurement. The Company’s systems, information and timely reporting are designed to enable the Company to quickly adapt toidentify early warning signs.signs to allow management to proactively address potential issues.
The Board is responsible for oversight of the Company’s enterprise risk framework. The Board implements its risk oversight function both as a whole and through delegation to various committees. The Board has delegated to the Audit & Risk Committee primary responsibility for overseeing financial, credit, investment and operational risk exposures including regulatory and legal risk; to the Fiduciary & Investment Management Committee primary responsibility for oversight of fiduciary and investment risk of client accounts; and to the Human Resources & Compensation Committee primary responsibility for oversight of risk related to management and staff. These committees report to the full Board to ensure the Company’s overall risk exposures are understood, including risk interrelationships. The Board also oversees reputational risk.
Effective April 2023, the Balance Sheet Committee was established to assist the Board by ensuring the highest possible Board and management focus on the Company's Asset/Liability Management function during times of emergent stress or crisis affecting the Company and/or the broader banking system. The Balance Sheet Committee’s primary responsibility is to monitor crisis response, receive operational impact updates and action plans from management related to emergent issues, and provide focused oversight of liquidity and capital planning process, policy and mindset; stress testing scenarios and assumptions; risk appetite, framework and profile; potential crisis early warning signs; among other responsibilities.
Risk reports are provided and discussed at every committee and Board meeting. In addition to detailed reports, the Board reviews an Enterprise Risk Position report that reflects key risk measures and trends, including reputational risk, across the Company. Key managers responsible for risk management (Chief Risk Officer, Treasurer, Chief Compliance Officer, General Counsel, and Chief Fiduciary Officer)Officer, along with a variety of other risk specialists) regularly provide updates at the respective committee and Board meetings. In support of the Board’s risk oversight role and to ensure that potential problems are surfaced, the Audit & Risk Committee directly oversees the Company’s Internal Audit and Credit Review functions.
22
Cybersecurity and Information Security Risk Oversight
Management of cybersecurity risks is the responsibility of the full Board. In 2021,2023, the Company, the Board, and the Audit & Risk Committee continued to strengthen the management and oversight of cybersecurity risks through new security system enhancements, policies, testing, identification and reporting. The Company continued its program of third party penetration testing and ongoing analysis to identify potential vulnerabilities and need for additional enhancements. The company also continued to support remote work in response tothat has been more prevalent as a result of the COVID-19 pandemic, which included ensuring the necessary provisions for managing the cybersecurity and information security risks associated with remote work.
The Board devotes significant time and attention to the oversight of cybersecurity and information security risk, and benefits from the technical expertise of certain of its members. In particular, the Board and Audit & Risk Committee each receive regular reporting on cybersecurity and information security risk. At least quarterly, the Audit & Risk Committee receives an operational risk update that includes a review of cybersecurity and information security risk. Our Board reviews and approves our Information Security Policy annually and frequently receives presentations on and discusses cybersecurity and information security risks, industry trends and best practices.
22
Compensation Policies and Risk
The Board’s risk oversight responsibility includes the implementation of compensation programs that do not encourage or incentivize excessive risk taking or inappropriate conduct and promote,promotes, among other things, gender pay equality. The Human Resources & Compensation Committee is responsible for establishing and reviewing the Company’s executive compensation programs, as well as the compensation programs for employees generally, and ensuring that the programs do not encourage unnecessary or excessive risk taking or create risks that are reasonably likely to have a material adverse effect on the Company and its customers.
The Company, inIn addition to its annual comprehensive review, receives ongoing reporting relating to the Company’s incentive plans’ design, performance, payouts and customer impact, with oversight by and reporting to the Board, Audit & Risk Committee and Human Resources & Compensation Committee. This reporting includesCommittee's annual comprehensive review, the Company's People Services Department provides the Audit & Risk Committee an analysis of potential “red flag” indicators including the existence, nature and extent of any customer complaints, regulatory complaints, legal actions, and employee feedback and payout results to determine if the incentive plan design or implementation resulted in employee wrongdoing or customer abuse.
COMMITMENT TO MEANINGFUL SOCIAL INITIATIVES
Detailed and Carefully Designed COVID-19 Response
At Bank of Hawaii, the health and safety of our employees, our customers and our community are our top priority. We put strict safety protocols in place at the beginning of the COVID-19 pandemic and have continued to follow government regulations throughout our branch network and facilities.
In addition, through our ongoing investment in digital enhancements, we enable our office employees to work remotely while continuing to provide our customers with safe and secure ways to bank. Through remote access, approximately 70% of our employees were working remotely at the height of the pandemic, with nearly half of our employees continuing to work from home at the end of 2021, greatly minimizing the impact of the COVID-19 pandemic on our operations. This was made possible by the implementation of a digital workspace platform that was designed from the ground up to be mobile and secure.
We continued to support our customers through our communications by keeping them informed about our numerous digital banking options, allowing them to bank safely from home. From online banking to Direct Deposit to the many capabilities offered through our mobile banking app, we helped our customers as they embraced the various innovative alternatives available to banking in-person.
Throughout the COVID-19 pandemic, we implemented programs to support individuals, families and businesses, and made donations to organizations supporting those in our communities who need it most.
Addressing the Impacts of COVID-19 in Hawaii
In early April 2020, Bank of Hawaii Foundation (the “Foundation”) made an unprecedented $3 million donation to Hawai‘i Community Foundation’s (“HCF”) Hawaiʻi Resilience Fund, which was established by HCF and the Omidyar ‘Ohana Fund to address the growing social and economic impacts of COVID-19 pandemic in Hawaii. Our community continues to benefit from the grant. From businesses to nonprofits to consumers, Bank of Hawaii is addressing a wide spectrum of needs to assist those hit hardest during the pandemic. Our CEO serves as vice chairman of the State of Hawaii’s House Select Committee on COVID-19 Economic and Financial Preparedness.
SBA’s Paycheck Protection Program (“PPP”)
In order to expedite PPP loans and help local business owners, we created a dedicated PPP team of more than 400 employees from every major area of the Company. At the peak of the program, these employees went above and beyond, working countless hours to process applications. Their efforts continued as they worked through loan forgiveness.
In 2021, the Bank participated in the second round of the PPP. The expertise and diligence of our PPP team enabled us to process more than 3,400 PPP loans totaling over $287 million in 2021. In 2020 and 2021 combined Bank of Hawaii processed almost 8,000 PPP loans totaling over $830 million. In addition, the Bank processed more than 7,500 PPP loan forgiveness applications totaling more than $700 million in federal funding to assist Hawaii businesses through this special program.
Support for Small Businesses
During the COVID-19 pandemic, Bank of HawaiiHawai‘i continued to support small businesses with the SBA 504 Program, a commercial real estate financing program for owner-occupied properties that allows small business borrowers to preserve working capital by requiring only a 10% down payment on purchase transactions.
23
Emergency Relief and Financial Assistance
To help lessen the financial impact of the COVID-19 pandemic on the communities we serve, Bank of Hawaii offered a number of programs to help affected individual and business customers. The Company deferred loan payments far beyond the requirements of the CARES Act and also waived ATM surcharge fees and early withdrawal penalty fees on tax-deferred annuities. Rather than the 90 days typically offered, Bank of Hawaii offered six months of forbearance and loan extensions. We reached out proactively to inform people that help was available to clients with loans of all sizes, from large commercial clients to consumers with small installment loans. In lieu of in-person visits, the Company made it possible for customers to complete their necessary documentation online. In addition, we offered loan deferrals to our commercial clients, which helped these customers for up to 18 months, compared to the usual six months in our market. These programs supported a variety of local business owners, including landlords who were able to support their tenants.
In Saipan, 20212023 marked the 10th12th year of the I Kinometi Para I Kumunidåt I Islå-ta Grants, Bank of HawaiiHawai‘i’s small business and revitalization and development grants. Five grants of up to $5,000 each are awarded annually to support new and existing small businesses and to thrive and give back to the community. Since its inception in 2012, $250,000$300,000 has been awarded to 5060 small businesses. This year with help from the grant monies, oneOne of the five2023 grant recipients Benjamin Babauta, owner of Tyler’s Gelatte Stone, added an additional employee; organized Small Business Sunday, an event held at Sugar King Park, which gave 13 other small businesses a venue to display productswas STEMify CNMI Robotics & Automation, the first and gain market share;only robotics and donatedautomation training center for youth and the $1,500 Small Business Sunday proceeds and donations to the Autism Society ofonly automation service provider in the Commonwealth of the Northern Mariana Islands.Islands ("CNMI"). They are committed to empowering middle and high school students by equipping them with the skills and knowledge to excel in science, technology, engineering and mathematics ("STEM"). They plan to use their grant to fund scholarships for the first 100 students enrolled in their after-school STEM Robotics-On-Wheels program.
Philanthropy and Volunteering to Sustain Our Community
The Company, and its exceptional people, demonstrate their generosity and respect throughout the year by supporting many different causes. Bank of Hawaii,Hawai‘i, its employees, and the Foundation contributed nearly $2.2more than $3 million to community and philanthropic causes in 2021. In addition, Bank of Hawaii employees volunteered safely while adhering to COVID-19 pandemic protocols at numerous events throughout the year to help distribute food and necessary supplies to our community in need, support small businesses and help care for our ‘āina.2023.
Kōkua for Community through the COVID-19 Pandemic
To help address expanding food insecurity, the Foundation donated $50,000 to The Pantry by Feeding Hawaii Together, the only “e-commerce” food pantry in America. The donation helped with food and staffing costs. The Pantry serves an average of 13,000 individuals each month.
The Foundation donated $50,000 over a two-year period to Maui Health Foundation’s Patient Resource Assistance Fund, which provides financial support to lower-income patients in need of non-acute medical care so that they may be discharged in a safe and healthy way.
Bank of Hawaii providedHawai‘i’s Live Kōkua Giving Campaign is the use of its former Kalihi Branch, in-kind support valued at over $30,000, to Kōkua Kalihi Valley (“KKV”) Comprehensive Family Services to administer 1,359 vaccinations to vulnerable membersCompany’s biggest annual employee-giving event. During the 2023 campaign, employees raised more than $600,000 in partnership with Aloha United Way, which serves more than 300 nonprofits. Themed #ComeTogetherForCommunity, 90% of the Company’s employees participated during the campaign, which ran from September 12 to October 20, 2023, in an effort to make a difference for some of the most vulnerable in our communities.
Bank of Hawai‘i Foundation also supports hundreds of nonprofits in our local community. In addition, employee-volunteers (known as our Bankoh Blue Crew) participate in our Live Kōkua Volunteer Program for hands-on community in March through Juneservice activities.
23
A Foundation donation of $30,000 to Project Vision Hawaii helped the nonprofit operate its mobile clinics, which provide hot showers and health resources (including eye exams for children) to those who have a low income or are experiencing homelessness. In 2021, Project Vision Hawaii pivoted to also administer COVID-19 testing and vaccines to various communities.
YWCA’s Dress for Success received a $25,000 Foundation donation to help empower women, including those transitioning out of prison or shelters, or who are new or returning to the workforce, to achieve economic independence. The program provides networking support, training and professional attire to help women gain skills, confidence and jobs.
Palama Settlement received a $25,000 Foundation donation to support its newly established Digital Arts Academy, a formal digital arts programHighlights from Bankoh Blue Crew in the Kalihi-Palama neighborhood. Community:
Bank of Innovation, createdHawai‘i Foundation
Bank of Hawai‘i Foundation supports the vision and services of hundreds of nonprofits in our community each year. These are some of the organizations that received funding in 2023:
A $20,000 donation was made to Mental Health America of HawaiiPacific Region.
Hawaii Community Lending received a Foundation grant of $10,000provide expanded services to keiki and kūpuna in West O‘ahu.
Responding to Natural Disasters
Our communities encountered extraordinary challenges from natural disasters in 2023. In May, one of the strongest tropical cyclones on record in the Northern Hemisphere made direct impact on Guam. Typhoon Mawar downed trees and flooded thousands of homes and businesses across the island. The destruction from Mawar disrupted basic services for several weeks.
The devastating wildfires that ravaged Lahaina on August 8, 2023 resulted in the worst natural disaster Hawai‘i has ever experienced and the deadliest wildfire in U.S. history. The catastrophic events of that day led to tragic loss of lives, homes, livelihoods and historic places.
24
In order to provide immediate relief to our employees and customers, Bank of Hawai‘i offered special financial assistance programs to help in their recovery from the wildfires in Hawai‘i and typhoon on Guam. In addition to loan forbearances, loan extensions and waiving of ATM surcharges, Bank of Hawai‘i and Bank of Hawai‘i Foundation made donations to aid in recovery efforts and continue to provide long-term support to people and nonprofit organizations in our local communities, totaling $158,500 which include:
Continued Support for ALICE in Hawai‘i
Bank of Hawai‘i Foundation has been sponsoring the ALICE (Asset Limited, Income Constrained, Employed) Report on behalf of the Aloha United Way since 2018. In response to the first 2018 ALICE Report, the ALICE Initiative was designed to find solutions toward a more equitable Hawai‘i. Bank of Hawai‘i Foundation, among other partners, has pledged support for the next three years. Since 2018, more than $21 million14,000 households have received access to services, and it’s our honor to continue this important work.
The 2022-2024 ALICE Fund invests in rent reliefthe ALICE Cohort Initiative, which includes 17 nonprofits collectively working to develop and assistance with utilities. Manyimplement impactful and scalable programs to help O‘ahu's ALICE households. It is overseen by Aloha United Way and Hawai‘i Community Foundation. This Initiative raises awareness about a huge, but sometimes hidden, segment of the applicants live at 80% below the average median income for the area.
24
Table of Contentsour community who are struggling to afford basic necessities.
Employees Celebrating Diversity and Cultural Awareness and Giving Back to Community
Bank of Hawaii is committed to supporting, educating and bringing awareness to the community on issues of diversity, equity and inclusion. Bank of Hawaii partnered with the Japanese American Citizens League – Honolulu, the National Asian Pacific American Bar Association – Hawaii, and the American Civil Liberties Union to host “A Conversation on Race in Hawai‘i”, a two-part panel featuring leaders from all sectors of the community.
The Company is a long-time sponsor of the Honolulu Rainbow Film Festival, and in 2021 renewed a four-year sponsorship of the HawaiiHawai‘i LGBT Legacy Foundation to support the Honolulu Pride FestivalParade & Parade.Festival. The donation supports not only the festival and parade, but helps to fund other program initiatives of the HawaiiHawai‘i LGBT Legacy Foundation. In previousFor several years, our employees have turned out in big numbers to show their support by walking in the parade.
For the 2023 Honolulu Pride Parade Festival, over 150 employees with family and friends came out in support and celebration of Pride. In an effort to contribute to the progress and advancement of ensuring an inclusive, collaborative and respectful workplace, Bank of Hawaii’sHawai‘i’s Diversity, Equity and Inclusion Program supports employee-led Employee Resource Groups (“ERG”s)ERGs”). Our Women Inspired ERG works to empower, support and educate on issues important to women at work, home and in the greater community. Our RainBOH ERG celebrates coming to work with pride, encourages allies to become visible, and educates on issues related to the LGBTQA+LGBTQIA+ community. And ourOur Blue Brigade Military ERG engages in service and networking opportunities that serve the needs of services member,service members, veterans and military families. Nā ‘Ōiwi Aloha (our Native Hawaiian ERG) was launched in 2022 to create opportunities for Native Hawaiians and allies to connect in dialogue and culture. These four ERGs sponsored over 17 community and employee engagement programs, and brought together nearly 800 employees, family and friends to join in fellowship, advancement and support of each other and the community. All of the ERG-sponsored programs aim to foster a sense of belonging among Bank of Hawai‘i’s employees and further the Company’s diversity, equity and inclusion goals.
Women Inspired ERG ("WIG"):
25
Blue Brigade Military ERG:
With intentionality and a safety first mindset, our Bankoh two sixth-grade classes at Pearl Harbor Elementary.
RainBOH LGBTQ+ ERG:
Our summer 2021 interns got out from behind the screens of their virtual internships and worked together to improve landscaping at Hawai‘i Nature Centeremployee stories were spotlighted in Makiki on July 24, 2021.both the Company’s social media and internal communications. The nonprofit organization seeksstories acknowledged every person’s unique experiences and social identities, and the multi-faceted connection between race, gender and other systems.
Nā ‘Ōiwi Aloha (Native Hawaiian ERG):
Susannah Wesley Community Center, a social service agency in Kalihi, askedpromote commonly used words at Bank of Hawaii to provide volunteers to assist families with applications to enterHawai‘i and in Hawai‘i.
panel discussion titled “We are Bank of Hawaii employee volunteers have been advising young entrepreneurs and improving financial literacy through decades of partnership with Junior Achievement (“JA”). In 2021, 18Hawai‘i” featuring Bank employees in Guam volunteeredsharing their experiences as advisors, from product development to sales. Guam Economic Development Authority was so supportive, it funded a space for JA students to sell their products in Chamoru Village. Nearly 150Native Hawaiians today, and at Bank of Hawaii employee volunteers made financial education possible.
Bank of Hawaii continues to build long-term relationships throughoutHawai‘i. The panel was moderated by Michelle Ka‘uhane, Senior Vice President and Chief Impact Officer at the communities we serve through education. ForHawai‘i Community Foundation. More than 100 employees attended the past 11 years, the Company has been offering our SmartMoney financial education seminars, which cover a variety of financial topics, such as how to save and invest and purchase a first home. In 2021, Bank of Hawaii volunteers in Guam and Saipan led event.
26 Smart Money Seminars with 158 participants on subjects ranging from Business of Banking, ABCs of Credit, Pathways to Homeownership and Budgeting.
In 2021, four Bank of Hawaii employees completed the Internal Revenue Service Volunteer Income Tax Assistance certification program and volunteered at Goodwill Hawaii; providing free tax preparation to eligible taxpayers. Aside from time spent to prepare for the certification, Bank of Hawaii employee volunteers donated 58 hours at Goodwill Hawaii and completed 43 tax returns with refunds totaling $46,624.
Employee Learning
Bank of Hawaii strives to attract, develop and retain exceptional people. Exceptional people are what allows Bank of Hawaii to be the best corporate citizen possible. Bank of Hawaii implemented a comprehensive internal training program and supported initiatives to foster diversity and inclusion in the workplace. Bank of Hawaii recognizes that a diverse and inclusive workforce fosters an environment where everyone can thrive and be successful.
In 2021, Bank of Hawaii provided more opportunities for employees to engage with our Leading Women employee resource group. Bank of Hawaii hosted popular discussions on “Leadership: Career Success Tips” and “How an Entrepreneurial Spirit Can Help Advance Your Career,” with women executives and business leaders in the community.
Employee Learning
Bank of Hawaii’sHawai‘i’s substantial training and career advancement programs target professional development and personal growth, which include our Fostering Workplace Excellence and other employee development programs. Bank of Hawai‘i continued to invest in people development in 2023. Employees attended a total of 36,791 hours in formal learning events on core employee or leadership skills development. In 2021, even duringaddition, select employees completed 8,853 development hours under the COVID-19 pandemic when a significant number of our employees were working remotely,various professional development programs the Company held over 24,000 training or career advancement program hours. Our commitment to our employees’ growth is integral to developing exceptional people.company provides.
Investing in Our PeopleEmployees
In 2016, Bank of HawaiiHawai‘i launched its College Assistance Program (“CAP”) to give employees striving to obtain their first four-year bachelor’s degree access to a college education and tuition reimbursement. CAP gives employees the convenience and flexibility to study where, when, and what they desire by allowing them to choose from a variety of select majors at Chaminade University of Honolulu. Their choice of majors need not relate to their current position. CAP also gives employees the option to pursue an accelerated online Associate of Arts degree through the University of Hawai‘i’s Community Colleges. When the program began in 2016, there were three participants. The program has been very successful and popular, now boastingwith five employees who have earned their associate’s degree fourand 16 employees who have earned their bachelor’s degree and 67since the program's inception. In 2023, we had 56 unique participants with more than $355,000$282,688 reimbursed to employees for the cost of their education. The Company’s Tuition Assistance Program (“TAP”) is aimed at assisting employees in completing job-related courses at any accredited school. TheOur TAP program had 2319 unique participants and more than $66,000with $80,044 reimbursed to student employees in 2021.2023. Another educational assistance program offered is the Professional Certification Program.Program managed by each department for their employee certification needs.
Bank of HawaiiHawai‘i also offers a Student Loan Assistance Program for employees. Student loan debt is a significant impediment to a key demographic sector of our national community. This program provides $100 per month, up to a lifetime maximum of $10,000, for an individual employee’s student debt. At year-end 2021,2023, we had more thanapproximately 150 employees enrolled in this program.
Our employee savings product, known as the GROW Account encourages our employees to build an emergency savings nest egg. Through these special accounts, we offer a $50 bonus to our employees when they reach $500 in savings in their GROW Account. We offer an additional $100 bonus to those employees who save an additional $500.
Our Employee Mortgage Program provides our employees with a discount of up to 1% off of prevailing market rates for their primary residences. This is an attractive retention tool for Bank of HawaiiHawai‘i given the high cost of housing on our islands.
The Bankoh Meals-To-Go program, which launched in May 2020, took the idea of sharing meals to a new level by offering employees free family-style meals once a week. With our Café Blue cafeterias temporarily closed, we utilized those facilities to provide meals for 98 weeks, officially ending in June 2021. Employees not in need were encouraged to donate their meals to family members, kūpuna or those experiencing food insecurity. Any food not utilized was donated to Aloha Harvest. Our Café Blue cafeterias at the downtown Tower and Hale O Kapolei later reopened, serving contactless food-to-go, which employees can order online through their laptop or mobile device. The Bankoh Meals-To-Go program distributed 418,364 meals on Oahu and 116,424 meals on neighbor islands and the West Pacific region with the help of 51 Bank volunteers. In addition, 12,843 pounds of food were donated to Aloha Harvest and 113 neighbor island and West Pacific region restaurants received support through participation in the program.
Investing in Our FutureFuture
For the 20212023 through 20222024 academic year, theBank of Hawai‘i Foundation supported 2624 college scholarships totaling $91,000$84,000 for children and grandchildren of Bank of HawaiiHawai‘i employees. Since 2014, the Foundation has provided $791,000$960,750 to fund 226275 college scholarships. These scholarships reflect our commitment to help our employees and their families reduce the financial burdens of post-high school education. We believe this investment will enable a better future and the next generation of our world’s and Hawaii’sHawai‘i’s leaders.
26
Supporting the Military
Bank of Hawaii is proud of its longstanding commitment to supporting our military service members and their families. In April, the Company introduced its military resource group to recognize, honor and support our active duty military, our veterans and their families.
In honor of Veterans Day, our Military ERG, planned a special lunch for veterans at the Barber’s Point location of U.S. VETS, an organization dedicated to ending veteran homelessness. Our Military ERG provided more than 70 bentos and had the opportunity to talk story and thank veterans in a safe, socially distanced way. The Barber’s Point location of U.S. VETS offers on-site long-term and permanent housing to help veterans gain housing stability, increase their skill levels and income, and reach greater self-determination through employment.
Bank of Hawaii is also a founding and leading sponsor of Sounds of Freedom, a division of the Great Aloha Run for active-duty men and women in all branches of service who run in formation. In addition to our Bankoh Blue Crew volunteering each year at the community event, the Company also presents the Sound of Freedom awards at the conclusion of the race to the top male and female military race finishers.
Outreach to the Unbanked and Underbanked
Bank of HawaiiHawai‘i was the first local bank to offer an alternative to traditional checking accounts in the State of Hawaii,Hawai‘i, beginning in April 2015. EASE by Bank of HawaiiHawai‘i combines convenience and access, is FDIC-insured and is among the lowest-fee bank accounts in the U.S.
EASE by Bank of Hawai‘i recently received national certification from the Cities for Financial Empowerment Fund (“CFE Fund”). The CFE Fund is dedicated to providing consumers with safe and affordable accounts that meet the Bank On National Account Standards (2021-2022). CFE Fund is dedicated to providing consumers with safe and affordable accounts, and the Bank On standards were created by consumer advocates, national nonprofits, civic leaders and others to designate account features that ensure low cost, high functionality and consumer safety. Bank On’s goal is to ensure that everyone has access to a safe and affordable bank or credit union account, and EASE by Bank of Hawai‘i is one of only two deposit account products in Hawai‘i to receive this national certification.
With no checks to return, customers do not incur overdraft fees. Customers are also given a free Visa debit card and free access to 307over 300 Bank of HawaiiHawai‘i and partner ATMs, do not have direct deposit requirements or monthly service fees if they elect to receive online statements, and are allowed to open an account with a deposit of just $25. They also receive free 24/7 Bankoh by Phone, mobile banking and e-Bankoh online banking services. We continue to see strong demand for our EASE product, and are pleased to meet the needs of the unbanked and underbanked people in the communities we serve.
27
Assisting Communities with Their Financial Needs
Bank of Hawai‘i continues to build long-term relationships in the communities we serve through education. For the past 13 years, the Company has been offering our SmartMoney financial education seminars, which cover a variety of financial topics, such as how to save and invest and purchase a first home. In 2023, 338 Company employees contributed over 150 service hours to teach financial education classes on critical topics including identity protection, budgeting, financing college, and credit. Our volunteers taught at 28 schools, where greater than 50% of students were from families qualifying for a free or reduced price lunch. Every year since 2010, Bank of Hawai‘i employees have partnered with Goodwill Hawaii’s Volunteer Income Tax Assistance Program. In 2023, eight employees became IRS-certified for the 2023 season and accepted in the Consumer Financial Protection Bureau Tax Time Initiative Cohort. Company volunteers prepared 65 tax filings that resulted in over $101,000 in refunds back to the community.
Empowering Youth
TheBank of Hawai‘i Foundation continued its ongoing sponsorship of PBS Hawai‘i’s HIKI NŌ, the groundbreaking student news program and statewide digital media learning initiative to support its programming, which transformed its practices to meet social distancing guidelines.programming. The Foundation’s investment dates back to the launch of HIKI NŌ in 2011. Since then, Hawaii’sHawai‘i’s HIKI NŌ schools have gained the reputation of being formidable competitors at rigorous national journalism contests, including the prestigious Student Television Network Convention in Seattle, Washington.contests.
As a partner with ClimbHI Hawaii, Bank of Hawaii is a member of the ClimbHI Bridge that seeks to provide Hawaii’s students with career exploration opportunities and connect them with companies and organizations to serve as resources and points of insight into those explorations, including financial education and career advice. In 2019, as part of the founding group of supporters, the Foundation helped fund the effort, which aided the organization’s launch in 2020 amidst the COVID-19 pandemic. Whether contributing financially, participating in virtual career fairs with local middle schools, mentoring high school students or assisting with business class projects, the Foundation is proud to support our students in their academic pursuits.
For the past 1113 years, Bank of HawaiiHawai‘i has been partneringpartnered with nonprofit EPIC ‘Ohana’s HawaiiHawai‘i Youth Opportunities Initiative to offer financial education and services to foster teens. Foster youth have a high propensity for pregnancy, incarceration, homelessness and low college graduation rates due primarily to a lack of social network. Through the Opportunity Passport Program, teens from foster families are able to open matched Individual Development Account (“IDA”) savings accounts, where every dollar saved is matched by donors up to $1,000 annually (up to a maximum of $3,000). The funds may be withdrawn between the ages of 14 to 26 and have enabled young people to help pay for college education, housing and transportation. Since 2010, under the Hi Hopes ProgramHI H.O.P.E.S Initiative (f/k/a Opportunity Passport), Bank of HawaiiHawai‘i has opened 9171,069 IDAs as well as EASE accounts. A donation of $1.4$1.55 million has enabled former foster youth to pay for necessary expenses such as housing or education on OahuO‘ahu or transportation on the neighbor islands.
Bank of Hawai‘i volunteers have been advising young entrepreneurs and improving financial literacy through decades of partnership with Junior Achievement. In 2023, 153 Company employees, from Guam to Hilo, volunteered in 16 schools to facilitate lessons or serve as advisors for the company program.
Housing
Housing for Our Community
Honolulu continues to be one of the most expensive cities in the U.S., and with a shortage of affordable rental homes across Hawaii, the adverse impacts of the COVID-19 pandemic makeHawai‘i, the availability of affordable and workforce housing is more important than ever.
In 2021, almost 8002023, 1,360 affordable housing units (490(989 on Oahu, 201O‘ahu, 90 on Maui, 148 on Hawai‘i Island, and 101133 on Hawaii Island)Kaua‘i) started construction or rehabilitation thanks in part to Bank of Hawaii,Hawai‘i, and almostover 800 more units are in the pipeline.
27
Additionally,several housing developments supported by Bank of Hawaii is leadingHawai‘i that broke ground in 2023:
Kaloko Heights, Kailua-Kona, Hawai‘i Island
Kaloko Heights will provide 42 two-bedroom and 58 three-bedroom affordable units in garden-style buildings with solar water heating. Sponsored by the fundingHawai‘i Island Community Development Corporation and designed for families earning 30-60% of the construction loan for Hale Kalele, as well as providing the permanent loan to support the project’s operations. As a new development in urban Honolulu, Hale Kalele is leased from the state and sponsored by the Kobayashi Group. The first two floorsarea median income (AMI), this project will serve as juvenile facility operated by the State Judiciary, and the other floors will include 200 low-income rental housingalso set aside five units for families experiencing homelessness, at risk of becoming homeless, or transitioning out of an emergency shelter or a transitional housing program. Bank of Hawai‘i is supporting the project with incomesa $27 million construction loan, nearly $4 million permanent loan and over $9.7 million in equity. Construction is expected to be completed by the end of 2024.
Parkway Village, Kapolei, O‘ahu
Parkway Village is a two-phase, first-of-its-kind mixed-use project that will feature a total of 405 affordable rental units and two on-site preschools. The project is an innovative effort to address both housing and early education needs in Kapolei and is a result of a partnership between 30%the Kobayashi Group and 60%the Āhē Group. Bank of Hawai‘i is supporting the project through $42 million in construction lending and over $36 million in permanent lending. Rental units from studios to four-bedroom apartments will be available for people earning 30-60% percent of the area’s median income. Construction beganAMI. The development spans 10 acres of land owned by the City & County of Honolulu. The first residents are expected to move in October 2020by the end of 2024.
28
Hālawa View II, Hālawa, O‘ahu
Hālawa View II is an 18-story affordable housing project with 302 units for families earning 30-60% percent of the AMI. Five units will be set aside for the chronically homeless or those referred by U.S. VETS. The high-rise is being developed by Pacific Development Group along with the Hunt Companies. Bank of Hawai‘i is supporting the project through over $40 million in construction lending and over $24 million in permanent lending. The new building is being constructed within walking distance to the new Skyline rail transit system, and will feature a mix of studios, one-, two-, and four-bedroom units. The building will include energy-efficient fixtures in each unit, along with electric vehicle charging stations, low-flow plumbing and low-water landscaping. Hālawa View II is scheduled for completionto be completed in 2022.2025.
Furthermore, the Company is committed to equity investment as an investor in Low-Income Housing Tax Credits projects across the state as well as in the Commonwealth of the Northern Mariana Islands/Saipan.
BRINGINGCOMMITMENT TO ENVIRONMENTAL CONSCIOUSNESS TOSUSTAINABILITY IN THE WAY WE DO BUSINESS
Bank of HawaiiHawai‘i seeks out projects that advance our overall environmental strategy, such as those that support renewable energy projects.energy. Building sound environmentally minded investments into our portfolio reduces risk, increases our value to investors and allows us to pursue our own initiatives to reduce our impact on the environment through internal or employee initiatives.
Bank of HawaiiHawai‘i is constantly improving its operations to proactively find more efficient and effective ways to ensure both the long-term success of the Company and the continued vitality of the communities it serves.we serve. Through its modernization efforts, the Company is helping to do its part in offsetting the negative impacts of climate change. The impacts of climate change, such as extreme weather conditions, natural disasters and rising sea levels, which are of significant concern to the Bank,Company, its operations, as well as those of its customers and third party vendors upon which it relies.
Financing the Future
The Company actively participates in the financing of photovoltaicphotovoltaic/energy savings projects. The Company currently is a lender in a variety of renewable energy projects with over $100$159 million committed to these initiatives.initiatives as of December 31, 2023, including $126 million in photovoltaic loans, $8.9 million in photovoltaic leases and $24 million in an energy savings project. Bank of HawaiiHawai‘i continues to seek out other opportunities in this sector and is a leader in these financing initiatives.
Comprehensive SolutionsEnvironmental Highlights
As we continue renovations to our facilities and branches,In 2023, Bank of Hawaii focusesHawai‘i continued to focus its efforts on Building Management Systems (“BMS”) as part of renovations or scheduled infrastructure upgrades. Through these upgrades, we are able to implement customized solutions that maximize energy conservation. In 2021, we focused on BMS optimization at our corporate headquarters and new installations at our Kahala and Mililani Branches. Our energy initiatives to date have resulted in 71%74% of our building area approximately 733,000 square feet, with management systems in place. Reducing and offsetting energy consumption remains one of our top priorities and is a key to meeting our goal of year-over-year demand reductions.
Bank of Hawaii also participatesHawai‘i continues to participate in Hawaiian Electric Company’s Demand Response Program at our two largest facilities. Through this participation, the Company receives incentives to reduce its usage during periods of island-wide peak demand, helping to preserve the reliability of the electrical grid and reduce the need for more electrical generation equipment.
Reducing energy consumption remains one of our top priorities. ThroughAlong with its conservation and energy efficiency efforts, such as BMS and infrastructure modernization, we have already cut our energy use in half since 2012. In recent years, we have completed many impactful conservation initiatives throughout the Bank of Hawaii network. As we strive to align with the Hawaii’s 2045 Energy Goals and create continued savings, we are enhancing our building design, modernizing our properties with data acquisition controls and planning future projects. We areHawai‘i is committed to pursuing additional opportunities to achieve our ambitious sustainability goals.renewable energy resources, and has made this an integral part of the modernization project at its branches and other facilities. The Company now has photovoltaic installation on over 60% of owned branches and buildings. This includes three large photovoltaic systems (561kW, 350kW and 100kW) at its main facilities and a 150kW tenant-installed system.
In 2021,late 2023, the Company completed renovations ofa multi-phase energy project at our Kahului Branch – project Kahului Net Zero. The final phase included a carport-mounted 40kW photovoltaic installation. This work, in combination with in-service rooftop PV array, battery storage, full-building LED retrofit and BMS, is intended to annually offset our energy consumption at Kahului Branch. In 2023, the corporate headquarters, including high performance window tinting, LED lighting with occupancy and daylight sensing controls, and high efficiency air conditioning systems with direct digital controls. Company provided surplus energy to the grid.
Our “Branch of Tomorrow” design makesprinciples continue to be used in our renovations. These focus on more efficient use of space, with increased customer support through innovative cash recycling machines at the tellers, portable computing platforms to allow the tellers to reach out directly with customers and reduce long waiting lines,queue times, and upgraded ATMs that allow direct deposit of cash and checks along with simplified transaction handling. Staff lunchrooms have been outfitted with point-of-use hot water dispensers to replace water heaters, microwave ovens to replace stoves and cook-tops, as well as large-screen LED monitors that allow for remote, online meetings and training sessions, which reduce energy usage and staff travel and downtime. These innovations allow us to work more efficiently and effectively every single day.
28
Table of Contentsrequirements.
Progressing Towards Environmental Sustainability
Along with its conservation efforts, Bank of Hawaii is committed to renewable energy resources, and has made this an integral part of the modernization project at its branches and other facilities. An additional 58 Kilowatts of photovoltaic systems were installed in 2021. The Company now has photovoltaic installation on over 60% of owned branches and buildings. This includes three large photovoltaic systems (561kW, 350kW and 100kW) at its main facilities. Combined, our PV networks have the capacity to create 3.4 Megawatt hours of energy annually.
Bank of HawaiiHawai‘i greatly improved its ability to respond to in-area natural disasters by relocating our disaster recovery data center to the continental U.S., enabling greater data protection while reducing our carbon footprint. Our partner on the continent has been running on 100% renewable energy since January 2016, and is the only major data center provider to receive an ‘A’ grade by Greenpeace in all five of their data center grading categories.
29
Reducing Waste
Reducing the amount of paper used in the workplace is part of Bank of Hawaii’sHawai‘i’s office transformation initiative. The Company strives for optimum performance in our digital environment and we anticipate this sustainability effort will have environmental, efficiency and cost-reduction benefits. We are currently imaging old paper records, which reduces costly storage expenses, and we are moving towardcontinue to contemporaneously imagingimage many current records, reducing the amount of paper required. Bank of HawaiiHawai‘i has also implemented several enterprise-wide digital and cloud-based solutions to help facilitate this initiative. In addition, remote work has enabled less paper consumption, and in 2021, paper acquisition and destruction activity decreased by 10%.
Encouraging Public Transportation and Bicycle Use
Bank of HawaiiHawai‘i offers a Bus Pass Benefit Program for its employees on Oahu,O‘ahu, reducing the cost of a monthly bus pass from $70$80 to $30$35 (on a pre-tax basis) for participating employees 64 years and younger. Employees 65 and older receive $30$45 towards the purchase of a $35$45 senior annual Bus Pass.bus pass. All active full-time and part-time employees who ride the bus as a primary source of transportation to and from work are eligible for the benefit. During 2021, more2023, more than 240290 employees took advantage of this benefit, resulting in an annual commitment by the Company of close to $100,000$150,000 towards reducing greenhouse gas emissions.
Bank of HawaiiHawai‘i also offers employees up to $20 per month as reimbursement for reasonable expenses if an employee uses a bicycle regularly for commuting to work. Reasonable expenses include the purchase of a bicycle as well as continuing maintenance, repair and storage.
30
BOARD COMMITTEESCOMMITTEES AND MEETINGS
The Board met 1114 times during 2021.2023. The Board’s policy is that directors should make every effort to regularly attend meetings of the Board and committees on which they serve and the Company’s Annual Meeting of Shareholders. Each director attended at least 75% of the meetings of the Board and 75% of the committee meetings on which he or she served in 2021.2023. All of the Company’s then sitting directors attended the 20212023 Annual Meeting of Shareholders.
Board Committees
The Board has three standing committees: the Audit & Risk Committee, the Human Resources & Compensation Committee, and the Nominating & Corporate Governance Committee. The charters for the respective Board committees are posted in the Investor Relations page of the Company’s website at www.boh.com.
The Board has affirmatively determined that all of the members of the Audit & Risk, Human Resources & Compensation, and Nominating & Corporate Governance Committees (collectively the “Board Committees”) meet the independence standards of the NYSE and the Company’s Governance Guidelines. The Board Committees’ charters require that each committee perform an annual evaluation of its performance and assess the adequacy of its charter. Each committee has the authority to retain consultants and advisors to assist it in its duties, including the sole authority for the retention, termination and negotiation of the terms and conditions of the engagement.
Below are the members of each current standing committee.committee as of December 31, 2023.
Audit & Risk | Human Resources & Compensation | Nominating & Corporate Governance | |
S. Haunani Apoliona |
| ||
Mark A. Burak | Chair |
| |
John C. Erickson | Vice Chair |
| |
Joshua D. Feldman |
|
| |
Michelle E. Hulst |
|
| |
| |
|
|
|
| |
|
|
|
| |
|
|
|
|
Barbara J. Tanabe | | | |
Raymond P. Vara, Jr. |
|
| Chair |
Suzanne P. Vares-Lum | | ||
Robert W. Wo | Chair |
|
31
30
Audit & Risk Committee: 1415 Meetings in 20212023
The Audit & Risk Committee operates under and annually reviews a charter that has been adopted by the Board. The Audit & Risk Committee’s duties include assisting the Board in its oversight of the following areas of the Company: regulatory and financial accounting, reporting and credit risk management; compliance with legal and regulatory requirements; the independent registered public accounting firm’s qualifications and independence; and the performance of the Company’s internal audit and credit review functions and independent registered public accounting firm. The Audit & Risk Committee also provides oversight of management’s activities with respect to capital management and liquidity planning, including dividends and share repurchases, and overall interest rate risk management. In addition, the Audit & Risk Committee meets in private session at the conclusion of every regularly scheduled meeting to provide a confidential forum for identification and discussion of issues of importance to the Company. The Audit & Risk Committee also meets with non-member directors on a regularly scheduled basis to brief them on the content and issues discussed at the previous meeting.
The Board has determined that Messrs. Burak, Erickson, Lucien, Nichols, Vara, and Ms. Moy meet the definition of “financial expert” within the meaning of the SEC regulations adopted under the Sarbanes-Oxley Act of 2002. The Board has determined that all Audit & Risk Committee members meet the NYSE standard of financial literacy and have accounting or related financial management expertise. In addition, the Board has determined that Messrs. Burak, Erickson, Lucien, and Nichols meet the definition of “risk expert” under the Federal Reserve Bank rules implementing Section 16 of the Dodd-Frank Wall Street Reform and Consumer Protection Act (the “Dodd-Frank Act”) and 12 CFR 252.22(d)(1).
The Audit & Risk Committee has adopted policies and procedures governing the following: pre-approval of audit and non-audit services; the receipt and treatment of complaints regarding accounting, internal controls, or auditing matters and the confidential, anonymous submission of information by employees of the Company regarding questionable accounting or audit matters; and restrictions on the Company’s hiring of certain employees of the independent registered public accounting firm. The Audit & Risk Committee is also responsible for reviewing Company transactions involving a director or executive officer. The Audit & Risk Committee Report is located on page 68.77.
Human Resources & Compensation Committee: 1110 Meetings in 20212023
The Human Resources & Compensation Committee’s duties are set forth in its charter, and include responsibility for compensation levels of directors and members of executive management and reviewing the performance of executive management. The Human Resources & Compensation Committee reviews and approves goals and objectives relevant to CEO compensation, and evaluates performance against those goals. It is also their responsibility to review the Company’s long-term and short-term incentive compensation plans, equity-based plans, and deferred compensation programs. The Human Resources & Compensation Committee also reviews management development and training programs as well as succession planning for senior and executive management. The Human Resources & Compensation Committee charter allows for the delegation of its duties to its own subcommittee as long as such delegation is in compliance with all applicable laws, rules, and listing standards. The CEO makes recommendations with respect to non-CEO executive officer compensation. The Human Resources & Compensation Committee Report is located on page 35.
Nominating & Corporate Governance Committee: 78 Meetings in 20212023
The Nominating & Corporate Governance Committee’s duties are set forth in its charter and include reviewing the qualifications of all Board candidates and recommending qualified candidates for membership on the Board and the oversight of director continuing education opportunities. The Nominating & Corporate Governance Committee reviews the Board’s organization, procedures and committees and makes recommendations concerning the size and composition of the Board and its committees. The Nominating & Corporate Governance Committee makes recommendations to the Board regarding standards for determining non-management director independence and reviews the qualifications and independence of the members of the Board and its committees. The Nominating & Corporate Governance Committee also reviews and evaluates the Company’s compliance with corporate governance requirements and leads and oversees the Board and its committees’ annual performance evaluations. Further information regarding the responsibilities performed by the Nominating & Corporate Governance Committee and the Company’s corporate governance is provided in the committee charter and the Governance Guidelines.
32
DIRECTOR COMPENSATIONCOMPENSATION
Retainer Fees
In 2021, based on a comparative peer analysis completed by Veritas Executive Compensation Consultants, LLC (“Veritas”), the Board’s independent executive compensation consultant, it was determined that theThe Board, Nominating & Corporate Governance Committee, Audit & Risk Committee (“ARC”) retainers be increased. The annual retainer for ARC members increased from $17,000 to $22,100, the annual retainer for the Chairman of the ARC increased from $30,000 to $39,000, and the annual retainer for the Vice Chairman of the ARC increased from $25,000 to $32,500. Veritas recommended the above changes to the Board to account for the increased workload of the ARC due to the fact that the ARC has a dual role, handling typical responsibilities of the Bank’s peer group separate audit and risk committees. All otherHuman Resources & Compensation Committee fees remainwere unchanged from last year.2022. The Board concurred with Veritas’ recommendation and approval ofapproved the following retainer fees effective April 20, 2021:28, 2023:
An annual retainer for service on the Board of $55,000;
An annual retainer for the Lead Independent Director in the amount of $35,000;
An annual retainer for the Nominating & Corporate Governance Committee members in the amount of $10,000 and annual retainer for the ChairmanChair of the Nominating & Corporate Governance Committee in the amount of $20,000;
An annual retainer for Audit & Risk Committee members in the amount of $22,100,$17,000, an annual retainer for the ChairmanChair of the Audit & Risk Committee in the amount of $39,000,$30,000, and an annual retainer for the Vice ChairmanChair of the Audit & Risk Committee in the amount of $32,500;$25,000; and
An annual retainer for Human Resources & Compensation Committee members in the amount of $12,000 and an annual retainer for the ChairmanChair of the Human Resources & Compensation Committee in the amount of $21,000.
In addition to these standing committees, the Board has other committees for which directors received fees in 2021.2023. Messrs. Feldman, Lucien, Mills and Nichols and Mmes. Hulst and Tokioka are members of the Digital Advisory Committee (“DAC”). Ms. Apoliona and Messrs. Feldman and Lucien are members of the Board-appointed Benefit Plans Committee (“BPC”), and Mmes. Apoliona, Moy, Tanabe, Tokioka and TokiokaVares-Lum, and Messrs. Lucien and Wo are members of the Fiduciary Investment Management Committee (“FIMC”). Effective April 24, 2020,28, 2023, Messrs. Burak, Erickson, Lucien, Nichols and Vara, and Ms. Moy were appointed to a newly formed Balance Sheet Committee ("BSC"). BSC members receive a $500 meeting fee and the Chair of the BSC receives a $750 meeting fee. The annual retainer for DAC members remained unchanged at $10,000 and the annual retainer for the Chair of the DAC also remained unchanged at $20,000. The annual retainer is $7,500for FIMC members remained unchanged at $10,000 and the annual retainer for its chairman (Mr. Nichols) is $12,500. The FIMC chairman’s (Ms. Tanabe) annual retainer remains unchanged from 2019 at $15,500 and annual retainer fees forthe Chair of the FIMC and BPC members remainremained unchanged at $9,500 and $6,500, respectively. $20,000.
The Directors are reimbursed for Board-related travel expenses, and directors who reside principally on the continental U.S. mainland receive an additional $5,000 annually to compensate them for travel time, which remains unchanged from last year.
Director Stock Plan
The shareholders approved the 2015 Director Stock Compensation Plan (the “Director Stock Plan”) at the 2015 annual meeting. The purpose of the Director Stock Plan is to advance the interests of the Company by encouraging and enabling eligible non-employee members of the Board to acquire and retain throughout each member’s tenure as director a proprietary interest in the Company by owning shares of Bank of HawaiiHawai‘i Corporation common stock. The Director Stock Plan allows for the granting of stock options, restricted common stock, and restricted stock units. Under the Director Stock Plan, the Board has the flexibility to set the form and terms of awards. The Board receives an annual equity compensation value of $65,000. Based on the fair market value on the date of grant in April 2021,2023, each of the non-employee Board members was given a stock award of 7151,342 shares of restricted common stock (“Restricted Shares”) with a vesting date of April 22, 2022. Mr. Mills19, 2024. Ms. Vares-Lum was electedappointed to the Board in October 2021May 2023 and received equity compensation of 3761,525 shares of Company restricted common stock with a vesting date of April 22, 2022,19, 2024, in alignment with the remainder of the unexpired term. In 2021,2023, no stock options or restricted stock units were granted under the Director Stock Plan.
32
Directors’ Deferred Compensation Plan
The Company maintains the Directors’ Deferred Compensation Plan (the “Directors’ Deferred Plan”), under which each non-employee director may participate and elect to defer the payment of all of his or her annual Board and committee retainer fees, or all of his or her annual Board retainer fees, or all of his or her annual committee retainer fees. At the director’s choice, deferred amounts under the Directors’ Deferred Plan may be payable: 1) beginning on the first day of the first month after the participating director ceases to be a director of the Company; or 2) on an anniversary date of the director’s choosing after the director ceases to be a director; or 3) a date specified by the director (which may include a date prior to the date a director ceases to be a director). Deferred amounts are paid to the participant in a lump sum or in equal annual installments over such period of years (not exceeding 10 years) as the participant elects at the time of deferral. If a participant dies, all deferred and previously unpaid amounts will be paid in a lump sum to the participant’s beneficiary on the second day of the calendar year following the year of death. A participant’s deferred amounts are adjusted for appreciation or depreciation in value based on hypothetical investments in one or more mutual funds or in shares of Bank of HawaiiHawai‘i Corporation common stock, as may be directed by the participant. The Company’s obligations under the Directors’ Deferred Plan are payable from its general assets, although the Company has established a rabbi trust to assist it in meeting its liabilities under the plan. The assets of the trust are at all times subject to the claims of the Company’s general creditors.
33
Director Stock Ownership Guidelines
The Board believes it is important to support an ownership culture for the Company’s directors, employees and shareholders. To ensure that linkage to shareholders occurs among the fiduciaries of the Company each non-management director is required to own a minimum amount of five times his or her annual cash retainer in Bank of HawaiiHawai‘i Corporation common stock. Directors are given five years from first joining the Board to achieve guideline levels of ownership. As of January 31, 2022, nine2024, 9 of the 1311 non-management directors standing for re-election have satisfied the ownership guidelines. The fourtwo remaining directors are expected to satisfy the ownership guidelines within the required five-year period.
33
Director Compensation
The following table presents, for the year ended December 31, 2021,2023, information on compensation earned by or awarded to each non-employee director who served on the Board of Directors during 2021.2023. Mr. Ho did not receive any additional compensation for services provided as a director.
Name |
| Fees |
|
| Stock |
|
| Option |
|
| Non-Equity |
|
| Change in |
|
| All Other |
|
| Total |
| |||||||
S. Haunani Apoliona |
|
| 81,500 |
|
|
| 64,993 |
|
|
| — |
|
|
| — |
|
|
| — |
|
|
| — |
|
|
| 146,493 |
|
Mark A. Burak |
|
| 99,500 |
|
|
| 64,993 |
|
|
| — |
|
|
| — |
|
|
| — |
|
|
| — |
|
|
| 164,493 |
|
John C. Erickson |
|
| 102,500 |
|
|
| 64,993 |
|
|
| — |
|
|
| — |
|
|
| — |
|
|
| — |
|
|
| 167,493 |
|
Joshua D. Feldman |
|
| 93,500 |
|
|
| 64,993 |
|
|
| — |
|
|
| — |
|
|
| — |
|
|
| — |
|
|
| 158,493 |
|
Michelle E. Hulst |
|
| 92,000 |
|
|
| 64,993 |
|
|
| — |
|
|
| — |
|
|
| — |
|
|
| — |
|
|
| 156,993 |
|
Kent T. Lucien |
|
| 102,250 |
|
|
| 64,993 |
|
|
| — |
|
|
| — |
|
|
| — |
|
|
| — |
|
|
| 167,243 |
|
Elliot K. Mills |
|
| 87,000 |
|
|
| 64,993 |
|
|
| — |
|
|
| — |
|
|
| — |
|
|
| — |
|
|
| 151,993 |
|
Alicia E. Moy |
|
| 97,000 |
|
|
| 64,993 |
|
|
| — |
|
|
| — |
|
|
| — |
|
|
| — |
|
|
| 161,993 |
|
Victor K. Nichols |
|
| 112,000 |
|
|
| 64,993 |
|
|
| — |
|
|
| — |
|
|
| — |
|
|
| — |
|
|
| 176,993 |
|
Barbara J. Tanabe |
|
| 114,000 |
|
|
| 64,993 |
|
|
| — |
|
|
| — |
|
|
| — |
|
|
| — |
|
|
| 178,993 |
|
Dana M. Tokioka |
|
| 75,000 |
|
|
| 64,993 |
|
|
| — |
|
|
| — |
|
|
| — |
|
|
| — |
|
|
| 139,993 |
|
Raymond P. Vara, Jr. |
|
| 144,000 |
|
|
| 64,993 |
|
|
| — |
|
|
| — |
|
|
| — |
|
|
| — |
|
|
| 208,993 |
|
Suzanne P. Vares-Lum |
|
| 50,250 |
|
|
| 59,810 |
|
|
|
|
|
|
|
|
|
|
|
|
|
|
| 110,060 |
| ||||
Robert W. Wo |
|
| 99,000 |
|
|
| 64,993 |
|
|
| — |
|
|
| — |
|
|
| — |
|
|
| — |
|
|
| 169,993 |
|
|
|
|
|
|
|
|
|
|
|
|
|
|
|
|
|
|
|
|
|
|
| |||||||
Name |
| Fees Earned or Paid in Cash ($)(1) |
|
| Stock Awards ($)(2) |
|
| Option Awards ($)(3) |
|
| Non-Equity Incentive Plan Compensation ($) |
|
| Change in Pension Value and Non- qualified Deferred Compensation Earnings ($) |
|
| All Other Compensation ($) |
|
| Total ($) |
| |||||||
S. Haunani Apoliona |
|
| 81,000 |
|
|
| 64,986 |
|
|
| — |
|
|
| — |
|
|
| — |
|
|
| — |
|
|
| 145,986 |
|
Mark A. Burak |
|
| 101,750 |
|
|
| 64,986 |
|
|
| — |
|
|
| — |
|
|
| — |
|
|
| — |
|
|
| 166,736 |
|
John C. Erickson |
|
| 100,625 |
|
|
| 64,986 |
|
|
| — |
|
|
| — |
|
|
| — |
|
|
| — |
|
|
| 165,611 |
|
Joshua D. Feldman |
|
| 91,000 |
|
|
| 64,986 |
|
|
| — |
|
|
| — |
|
|
| — |
|
|
| — |
|
|
| 155,986 |
|
Michelle E. Hulst |
|
| 89,500 |
|
|
| 64,986 |
|
|
| — |
|
|
| — |
|
|
| — |
|
|
| — |
|
|
| 154,486 |
|
Kent T. Lucien |
|
| 78,500 |
|
|
| 64,986 |
|
|
| — |
|
|
| — |
|
|
| — |
|
|
| — |
|
|
| 143,486 |
|
Elliot K. Mills |
|
| 21,125 |
|
|
| 32,509 |
|
|
| — |
|
|
| — |
|
|
| — |
|
|
| — |
|
|
| 53,634 |
|
Alicia E. Moy |
|
| 95,325 |
|
|
| 64,986 |
|
|
| — |
|
|
| — |
|
|
| — |
|
|
| — |
|
|
| 160,311 |
|
Victor K. Nichols |
|
| 103,325 |
|
|
| 64,986 |
|
|
| — |
|
|
| — |
|
|
| — |
|
|
| — |
|
|
| 168,311 |
|
Barbara J. Tanabe |
|
| 55,000 |
|
|
| 64,986 |
|
|
| — |
|
|
| — |
|
|
| — |
|
|
| — |
|
|
| 119,986 |
|
Dana M. Tokioka |
|
| 72,000 |
|
|
| 64,986 |
|
|
| — |
|
|
| — |
|
|
| — |
|
|
| — |
|
|
| 136,986 |
|
Raymond P. Vara, Jr. |
|
| 142,825 |
|
|
| 64,986 |
|
|
| — |
|
|
| — |
|
|
| — |
|
|
| — |
|
|
| 207,811 |
|
Robert W. Wo |
|
| 95,500 |
|
|
| 64,986 |
|
|
| — |
|
|
| — |
|
|
| — |
|
|
| — |
|
|
| 160,486 |
|
|
|
|
|
|
|
|
|
|
|
|
|
|
|
|
|
|
|
|
|
|
|
|
|
|
|
|
|
|
|
|
|
|
|
|
34
34
PROPOSAL 2: ADVISORY VOTE ON EXECUTIVE COMPENSATION
The Dodd-Frank Act provides shareholders the opportunity to vote, on an advisory (non-binding) basis, to approve the compensation of our named executive officers as disclosed in this proxy statement in accordance with the SEC���sSEC’s compensation disclosure rules.
As an advisory vote, this proposal is not binding upon the Company. However, the Human Resources & Compensation Committee, which is responsible for designing and administering the Company’s executive compensation program, values the opinions expressed by shareholders and considers the outcome of the vote when making future compensation decisions for its executive officers. The Company currently conducts annual advisory votes on executive compensation. The Company’s shareholders approved its executive compensation at the 20212023 Annual Meeting of Shareholders.
As described in the Compensation Discussion and Analysis, the primary focus of the Company'sCompany’s executive compensation programs is to encourage and reward behavior that the Board believes will promote sustainable growth in shareholder value, and to promote gender pay equity.discourage excessive risk-taking. Our executive compensation programs are intended to balance risk and reward in relation to the Company’s overall business strategy and further align management’s interests with shareholders’ interests. The Company’s commitment to a performance culture is reflected in its strong financial performance in recent years. Accordingly, the Board of Directors recommends that shareholders approve the executive compensation programs by approving the following advisory resolution:
RESOLVED, that the shareholders of Bank of HawaiiHawai‘i Corporation approve, on an advisory basis, the compensation of the individuals identified in the Summary Compensation Table, as disclosed in the Company’s 20222024 proxy statement pursuant to the compensation disclosure rules of the SEC, which disclosure includes the Compensation Discussion and Analysis section, the compensation tables, and the accompanying footnotes in this proxy statement.
The Board of Directors recommends a vote “FOR” the foregoing proposal.
HUMAN RESOURCES & COMPENSATION COMMITTEE REPORT
The Human Resources & Compensation Committee, composed entirely of independent directors in accordance with applicable laws, regulations, NYSE listing requirements and the Governance Guidelines, sets and administers policies that govern the Company’s executive compensation programs, and various incentive and stock programs. As members of the Human Resources & Compensation Committee, we have reviewed and discussed the Compensation Discussion and Analysis to be included in the Company’s 20222024 Proxy Statement with management and, based on these discussions, recommended to the Company’s Board (and the Board subsequently approved the recommendation) that the Compensation Discussion and Analysis be included in such Proxy Statement.
As submitted by the members of the Human Resources & Compensation Committee,
Robert W. Wo, ChairmanChair
Joshua D. Feldman
Michelle E. Hulst
Elliot K. Mills
Barbara J. Tanabe
Raymond P. Vara, Jr.
35
COMPENSATION DISCUSSIONDISCUSSION AND ANALYSIS
This Compensation Discussion and Analysis (“CD&A”) describes the compensation structure, process and implementation in 20212023 for our Named Executive Officers (“NEOs”). The NEOs in 20212023 were:
Peter S. Ho | Chairman of the Board of Directors, Chief Executive Officer, and President |
Dean Y. Shigemura | Vice Chair and Chief Financial Officer |
| Vice Chair |
| Vice Chair and Chief |
| Vice Chair and Deputy Chief Risk Officer |
CD&A TABLE OF CONTENTS
The CD&A is organized as follows:
Page | |||||
37 | |||||
| |||||
| 39 | ||||
Succession Update |
| ||||
39 | |||||
41 | |||||
| |||||
43 | |||||
| |||||
| |||||
| |||||
| |||||
| |||||
| |||||
| |||||
| |||||
| |||||
| |||||
| |||||
| |||||
| |||||
| |||||
54 | |||||
54 | |||||
| |||||
Vesting of Equity Incentive Compensation on Change-in-Control (Double-Trigger) |
| ||||
| |||||
| |||||
| |||||
| |||||
| |||||
| |||||
| |||||
| |||||
36
Compensation-Related Highlights
2021 Compensation Program
|
|
|
|
|
|
|
|
Strong Operational Performance
|
|
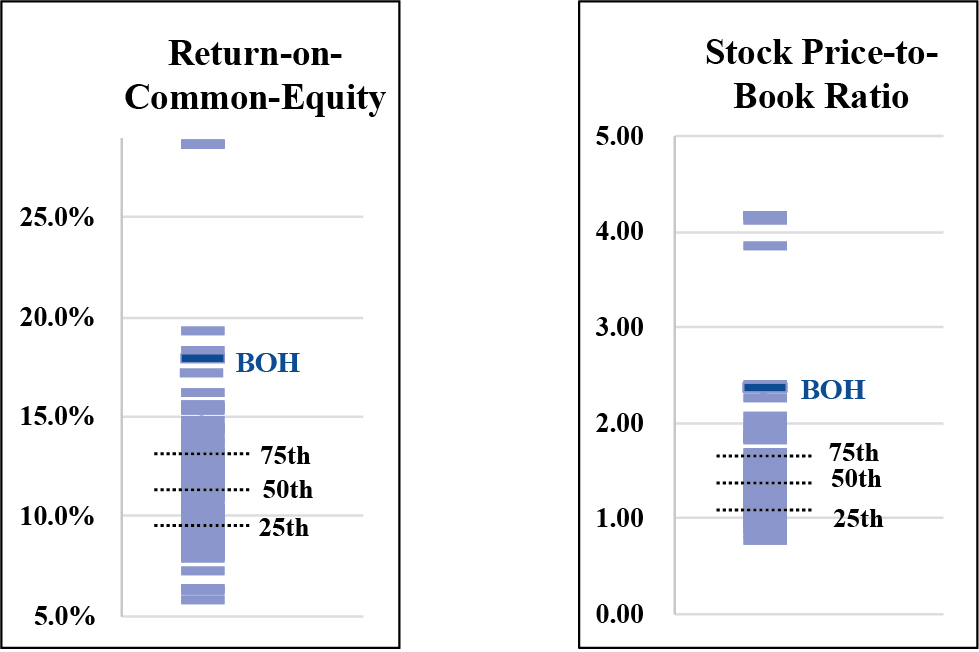
|
|
|
|
|
|
|
|
37
Continued Alignment of Executive Pay with Company Performance
|
|
|
|
|
|
Consistent Shareholder Engagement
|
|
Say-on-Pay Results
|
|
|
38
2021 Executive Compensation Program Design
|
| ||
|
| ||
|
| ||
69 | |||
36
Peer Group | Percentage of Total CEO Compensation That Is Performance-Based | ||
| |||
25th Percentile | 50% | ||
Median | 57% | ||
75th Percentile | 65% | ||
BOH | 78% |
Weighting
37
In 2023 and into 2024, the Company continued its ongoing effort to communicate with shareholders and solicit feedback on matters of importance, including our compensation philosophy and plan. Because we noticed a modest decline in support for our annual Say-on-Pay proposal in 2023, we enhanced our outreach efforts to make sure we fully understood shareholders’ views of our pay program.
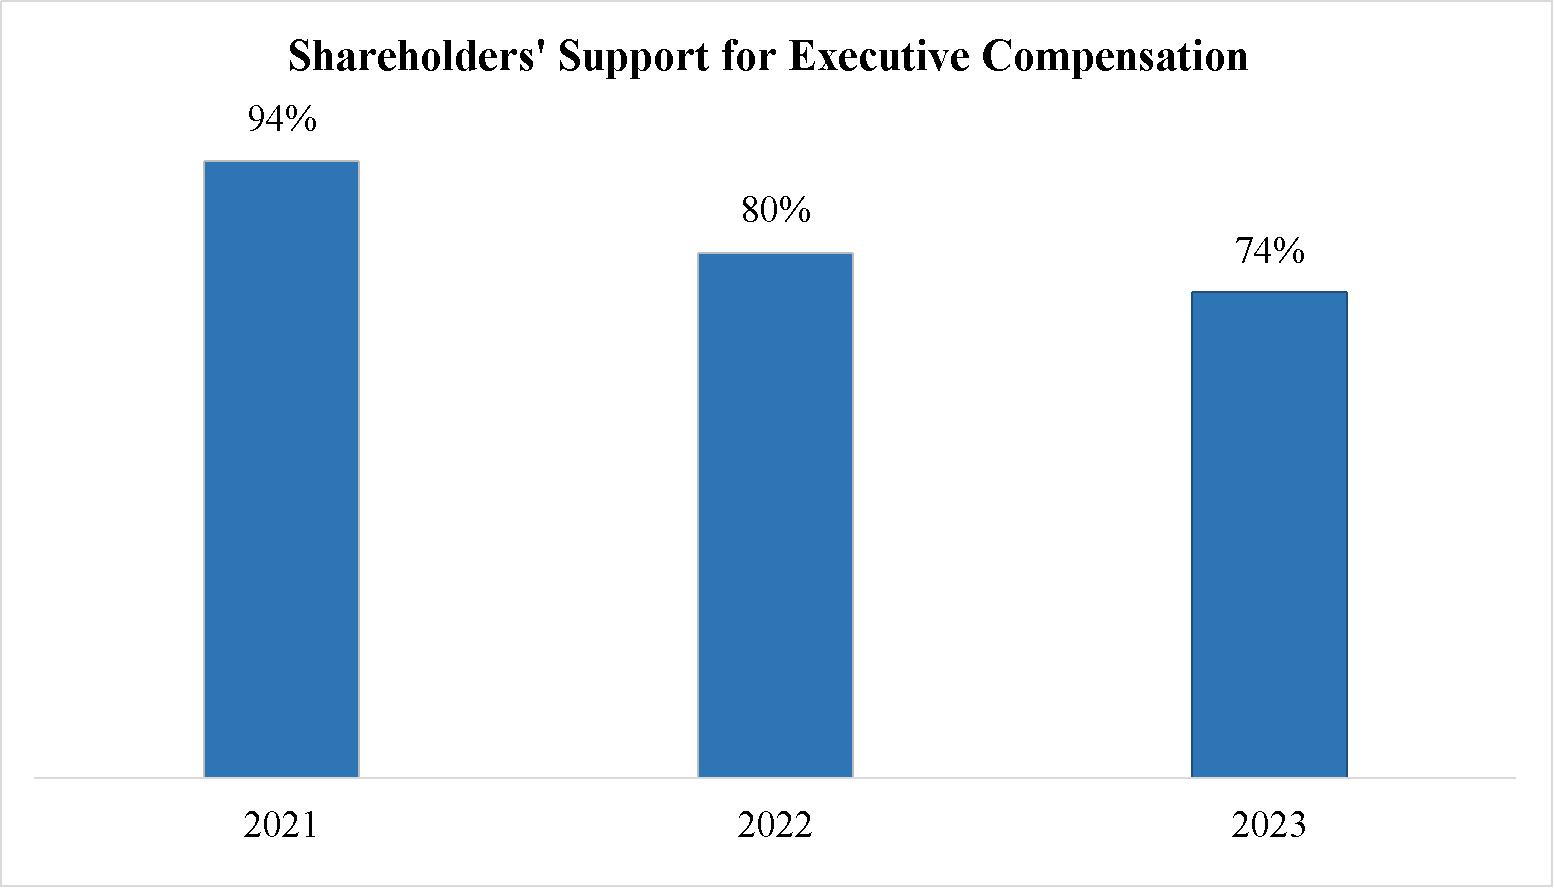
As part of this effort, we solicited feedback from our thirty largest shareholders, representing voting authority for approximately 74% of shares outstanding, including all of the top shareholders who voted no on our Say-on-Pay proposal last year. We conducted virtual meetings with six shareholders representing voting authority for approximately 37% of shares outstanding, including three of our top five shareholders. These meetings were led by the Chair of our Human Resources & Compensation Committee and included the Company’s Chief Administrative Officer and Investor Relations team.
Shareholder Engagement
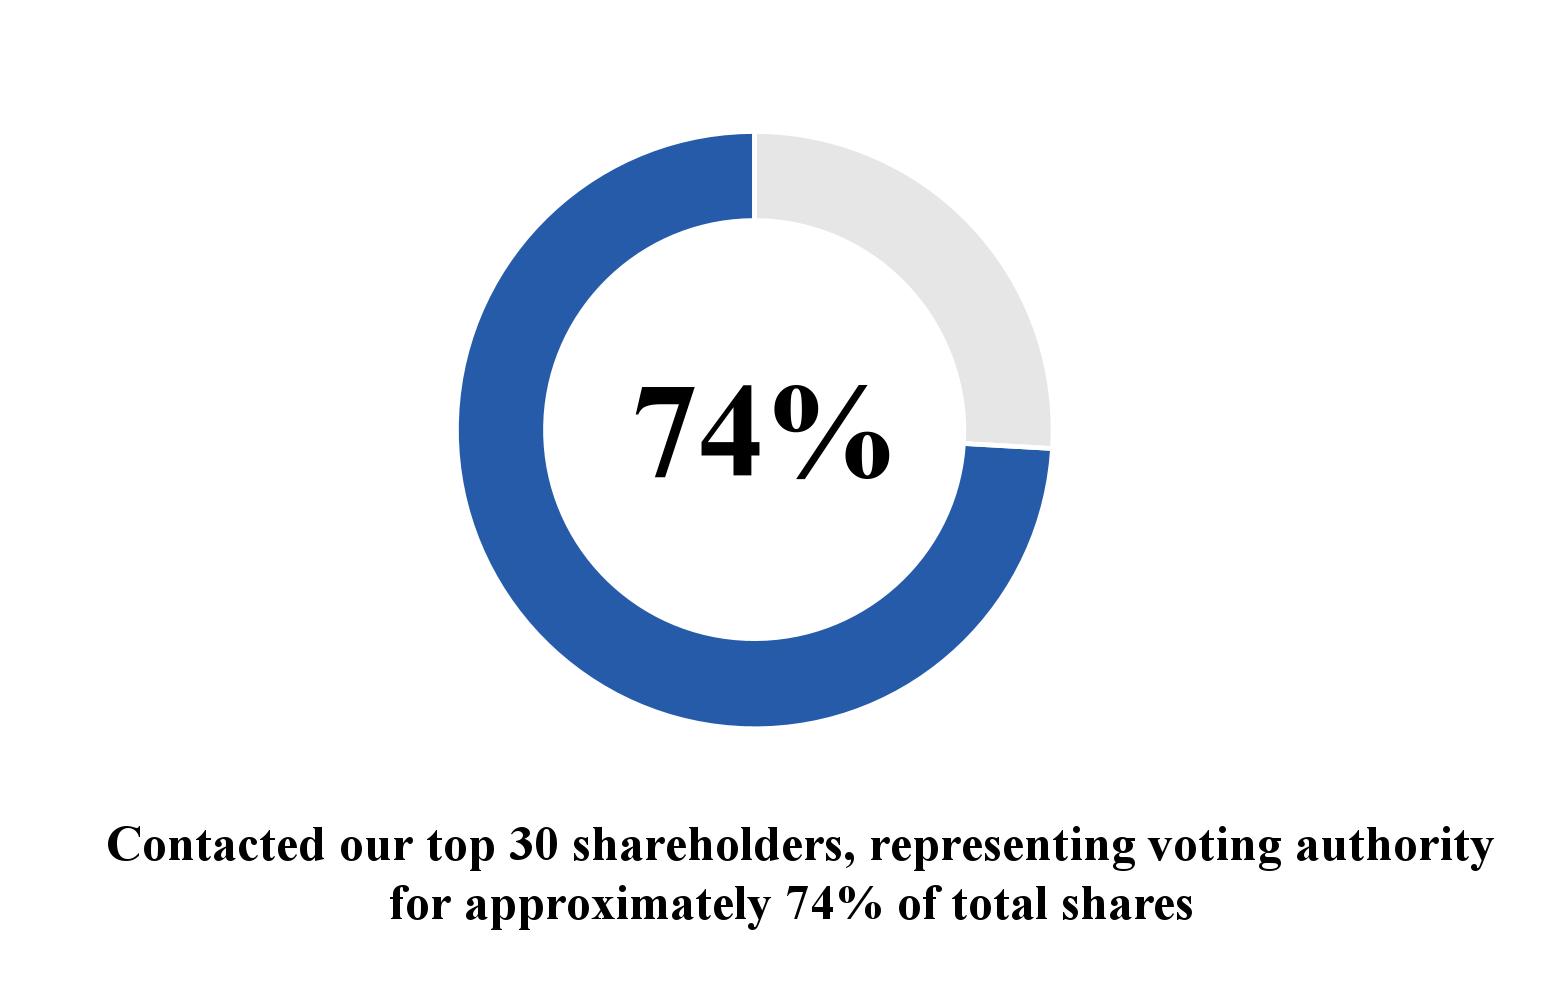
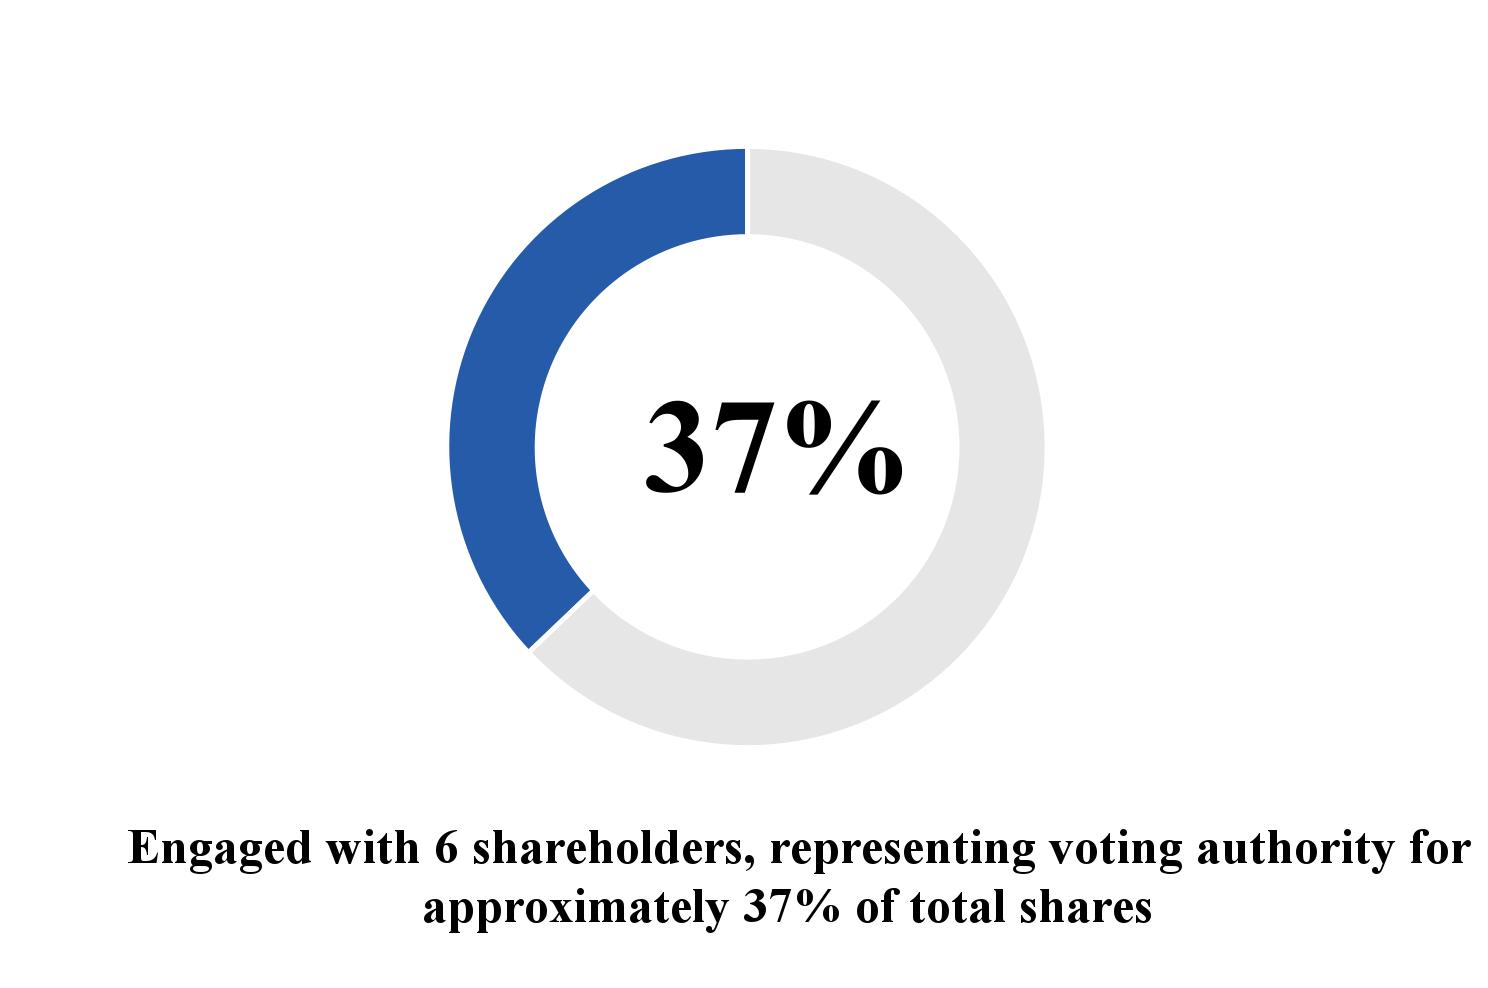
As in years past, a large majority of the shareholders we contacted indicated they had no concerns with our executive pay program and were complimentary of the Company’s business strategies, management and performance. That said, below is what we learned through our engagement process and what we plan to do about it:
o Shareholders were interested in learning more about the decision-making process and design of the signing bonus and make-whole payments utilized to successfully attract Marco Abbruzzese to join the Company, but which made his compensation appear outsized for the year
o The CEO’s target equity value appeared to be higher than bank peers
o Questions about pay versus performance alignment remain, but are mitigated by the fact that 100% of STI and LTI compensation is performance-based
38
o The metrics used for STI and LTI appear to be overlapping
Attracting Qualified Executives as Part of BOH’s Succession Plan
Enticing qualified executives to leave established careers at other institutions has long been a challenge in the banking industry generally, and even more so in the Hawaiian market, due mainly to its small size, remote location and high cost of living. In January of 2022 the Company hired Marco A. Abbruzzese as Vice Chair and Senior Executive Director of Wealth Management to lead a renewed strategic focus into this important area of our diversified business portfolio. To convince Mr. Abbruzzese to join the Company and forgo compensation he expected to receive from his long-time former employer Wells Fargo, the Committee awarded him a signing bonus, relocation allowance, and make whole awards totaling $1.75 million – of which $450,000 was a signing bonus, $100,000 was relocation allowance, and $1.20 million represented a make-whole award for the compensation opportunity he forfeited at his former employer. These one-time payments made Mr. Abbruzzese’s compensation for 2022 appear outsized in last year’s proxy statement. On a normalized basis, his compensation has returned to a much lower level in 2023.
Similarly, as part of the well-defined succession plan to replace our retiring Chief Risk Officer, in May of 2023 the Company hired S. Bradley Shairson away from his employer Regions Bank, where he served as Chief Operating Officer and Chief Risk Officer of Regions Bank Capital Markets, and appointed him Vice Chair and Deputy Chief Risk Officer. To help land Mr. Shairson, the Committee awarded him a signing bonus, relocation allowance and make-whole equity totaling $1.62 million – of which $150,000 was a signing bonus, $65,000 was relocation allowance, and $1.40 million represented make-whole compensation, in a mixture of time and performance-based equity, for the compensation opportunity he forfeited at his former employer. If Mr. Shairson voluntarily terminates his employment prior to completing one year of service with the Company, he must reimburse one-half of all bonuses received. As was the case with Mr. Abbruzzese, none of the one-time payments to Mr. Shairson will be repeated in the future, and his compensation is expected to return to a more normalized level relative to peers next year.
Succession Update
In last year’s proxy statement, the Company described certain retention payments made in 2021 and 2022 pursuant to a plan developed together with our independent compensation consultant that was designed to closely link paykeep top executive talent planning to retire in place long enough to allow for an orderly leadership transition. That plan, which the Company has been executing for the last three years, has been demonstrably successful. Two of the executives who received retention awards, Vice Chair and Senior Executive Director Operations & Technology Sharon M. Crofts and Vice Chair and Chief Risk Officer Mary E. Sellers have reached the end of their retention periods and chose to retire from lengthy and productive careers with operationalthe Company, effective March 29 and 31, respectively. The retention awards granted to Ms. Crofts and Ms. Sellers provided the time necessary for them to transition their responsibilities to the next generation of leadership – namely, Mr. Shairson, who will become Chief Risk Officer upon Ms. Sellers’ retirement, and current Senior Executive Vice President and Chief Information Officer Taryn L. Salmon, who will assume Ms. Crofts’ duties upon her retirement.
The Company made no retention or other extraordinary long-term incentive grants during 2023.
A New Compensation Plan for 2024 and Beyond
Short-Term Incentive
For 2024, the Company will determine the CEO’s STI award based upon a balanced scorecard that equally measures profitability, asset quality, financial returns, a strategic measure, and individual performance. Each of these measures will be given equal weighting in determining the CEO’s cash bonus. Accordingly, Pre-Provision Net Revenue (“PPNR”) will be measured against a target set at the beginning of the year, and is designed to encourage budget discipline among executives throughout the year. Making sure that a conservative credit culture drives behavior, the level of non-performing assets will be measured relative to peers. ROCE remains a key measure of the Company’s financial health, and will continue to be measured against peers, although weighted less than in prior years. Inasmuch as the Company’s brand is a differentiator in our marketplace, a focus on customer experience has been a key strategic initiative for several years, and for 2024 the strategic metric will be our Customer Experience score, as measured by the proprietary framework developed by Forrester, a global research company. As in years past, the CEO’s individual contribution will be determined based on an assessment of strategic initiatives, community presence and reputation, and leadership development and succession. NEO personal contributions will be measured against strategic goals that have been refreshed for 2024. Finally, the overall incentive pool will continue to be determined by EPS growth.
39
2024 Long-Term Incentive
For 2024 and going forward, the Company has also significantly changed how it plans to measure long-term performance by removing Price to Book ratio and increasesintroducing a TSR metric. Accordingly, beginning with grants to NEOs in 2024, ROCE and TSR, weighted at 70% and 30%, respectively, measured over a three-year performance period, will determine whether and to what extent awards vest. In addition, the Committee has determined that the number of awards granted NEOs should be reduced, with an opportunity to earn up to two times the grant amount if superior performance is achieved.
The below chart shows graphically the year over year changes to the Company’s short- and long-term shareholder value while minimizing excessive risk taking. To help us accomplish these important objectives,incentive programs:
Performance | 2023 | 2024 |
| Weighting | ||
Category | (STI and LTI) | STI | LTI | Measurement | STI | LTI |
Profitability |
| Pre-Provision Net Revenue |
| Absolute | 20% |
|
Asset Quality |
| Non-Performing Assets |
| Relative | 20% |
|
Financial Returns | ROCE | ROCE | ROCE | Relative | 20% | 70% |
Shareholder Returns | Price to Book |
| Total Shareholder Return | Relative |
| 30% |
Strategic Measure |
| Customer |
| Absolute | 20% |
|
Individual | Individual | Individual |
| Absolute | 20% |
|
2024 Long-term Incentive Award Grant Level
Through 2023, the Company granted NEO long-term incentive recipients the number of shares that would vest if the Company performed at the target level, which was set at the top-quartile relative to peers, and there was no opportunity to earn more than the target level. In 2024 and going forward, we have adoptedreduced the following policiesnumber of shares granted while providing the opportunity to earn additional shares by over-performing relative to peers. This results in a reduction in LTI grant values and lowers target total direct compensation by 20% for the CEO and an average of 13% year-over-year for other NEOs, is more consistent with market practices over time:and our peer group, and is designed to establish our CEO’s target equity value at the 50th percentile relative to peers.
| LTI Grants | Total Direct Compensation | ||||
| 2023 | 2024 | 2023 vs. 2024 | 2023 | 2024 | 2023 vs. 2024 |
CEO | $3,000,067 | $1,800,000 | -40% | $4,485,867 | $3,571,600 | -20% |
NEO Average | $750,079 | $401,250 | -47% | $1,380,779 | $1,199,010 | -13% |
2024 LTI grants reflect the actual amount granted in February 2024 to the CEO, and the average of the actual amounts granted to the other NEOs. 2024 Total Direct Compensation is an estimate that includes current salary, 2024 LTI grants, and a target STI amount (1x salary for the CEO; .8x salary for the other NEOs).
40
Compensation Program Governance Summary
What we do | What we don’t do |
• Maintain a robust shareholder engagement process •Demonstrate responsiveness to shareholder concerns and general feedback • Pay for performance by tying a substantial portion of executive compensation to performance goals, with 100% of incentives being performance-based • Evaluate executive compensation data and practices of our peer group companies as selected annually by the Committee with guidance from the independent compensation consultant • Regularly conduct assessments to identify and mitigate risk in compensation programs •Maintain significant stock ownership requirements (5x base salary for CEO, 2x for other NEOs) •Maintain a clawback policy •Engage an •Maintain an | |
| |
• No employment agreements with NEOs •No single-trigger change-in-control provisions • No tax gross-ups • No excessive perquisites • No hedging and pledging stock transactions by executives and directors • No repricing of equity incentive awards |
Business and Performance Overview
We are organized into three business segments for management reporting purposes: Consumer Banking, Commercial Banking, and Treasury and Other.
Consumer Banking offers a broad range of financial products and services, including loan, deposit and insurance products; private banking and international client banking services; trust services; investment management; and institutional investment advisory services. Consumer Banking also provides a full servicefull-service brokerage offering equities, mutual funds, life insurance, and annuity products. Loan and lease products include residential mortgage loans, home equity lines of credit, automobile loans and leases, personal lines of credit, installment loans, and small business loans and leases. Deposit products include checking, savings, and time deposit accounts. Private banking and personal trust groups assist individuals and families in building and preserving their wealth by providing investment, credit, and trust services to high-net-worth individuals. The investment management group manages portfolios utilizing a variety of investment products. Also within Consumer Banking, institutional client services offeroffers investment advice to corporations, government entities, and foundations. Products and services from Consumer Banking are delivered to customers through 5451 branch locations and 307318 ATMs throughout HawaiiHawai‘i and the Pacific Islands, e-Bankoh (online banking service), a customer service center, and a mobile banking service.
Commercial Banking offers products including corporate banking, commercial real estate loans, commercial lease financing, auto dealer financing, and deposit products. Commercial lending and deposit products are offered to middle-market and large companies in HawaiiHawai‘i and the Pacific Islands. In addition, Commercial Banking offers deposit products to government entities in Hawaii.Hawai‘i. Commercial real estate mortgages focus on customers that include investors, developers, and builders predominantly domiciled in Hawaii.Hawai‘i. Commercial Banking also includes international banking and provides merchant services to its customers.
41
Treasury consists of corporate asset and liability management activities, including interest rate risk management and a foreign currency exchange business. This segment’s assets and liabilities (and related interest income and expense) consist of interest-bearing deposits, investment securities, federal funds sold and purchased, and short and long-term borrowings. The primary sources of noninterest income are from bank-owned life insurance, net gains from the sale of investment securities, and foreign exchange income related to
40
customer-driven currency requests from merchants and island visitors. The net residual effect of the transfer pricing of assets and liabilities is included in Treasury, along with the elimination of intercompany transactions.
We concluded 20212023 with solid financial performance.performance, with the Company continuing to execute on its strategy of delivering consistent, superior risk-adjusted returns over time. Over the year our loan balances grew to $12.3$14.0 billion, an increase of 2.7%2.33% from 2020.2022. Our deposit balances reached another record high, growingalso increased to $20.4$21.1 billion, up 11.8%2.13% from 2020, driven by increases in both consumer and commercial deposits. Our asset2022. Asset quality and capital and liquidity ratios remain strong. The Return-on-Common-Equity for the year increased to 17.92% from 2020, ourwas 13.89%, Return-on-Assets increased to 1.14% from 2020,was 0.71%, and our efficiency ratio was 58.86%64.95%.
Company Performance Highlights
The following briefly summarizes the Company’s recent stock price and financial performance:
Total Shareholder Return (“TSR”) and Other Key Performance Indicators
The Company delivered solid financial performance in 2021 despite the continued impacts of the COVID-19 pandemic. Earnings Diluted earnings per common share was $6.25 and net income was $253.4 million$4.14 for the full year of 2021. 2023, compared with $5.48 in 2022. Net income for the year was $171.2 million, compared with $225.8 million in the previous year.
The performance of the Company in 2023 must be viewed through the lens of the significant market disruption that took place following the Spring failures of Silicon Valley Bank, Signature Bank, and First Republic Bank. Despite the unique nature of each of those institutions’ business models, many investors and commenters questioned the continued viability of the mid-size bank sector as a whole, and many speculative short sellers sought to take advantage of that uncertainty. Indeed, some mid-size peers of the Company saw substantial deposit outflow, and share prices suffered across the sector.
While the Company’s market capitalization was negatively affected more than most during the year, we saw no appreciable change in our business. To the contrary, the strength of our brand, the loyalty of our long-tenured, granular deposit base, and the hard work of our dedicated bankers shone through. The Company grew deposits by 2.1% year over year, without having to tap the brokered deposit market, while the broader commercial bank sector saw deposits decline by 1.9%. The Company kept deposit cost low, with an average cost of total deposits of 1.67% as compared to a KRX median of 2.11% in the fourth quarter of 2023. As a result, when the market disruption subsided and the sector rebounded, the Company significantly out-paced its peers in recovering value.
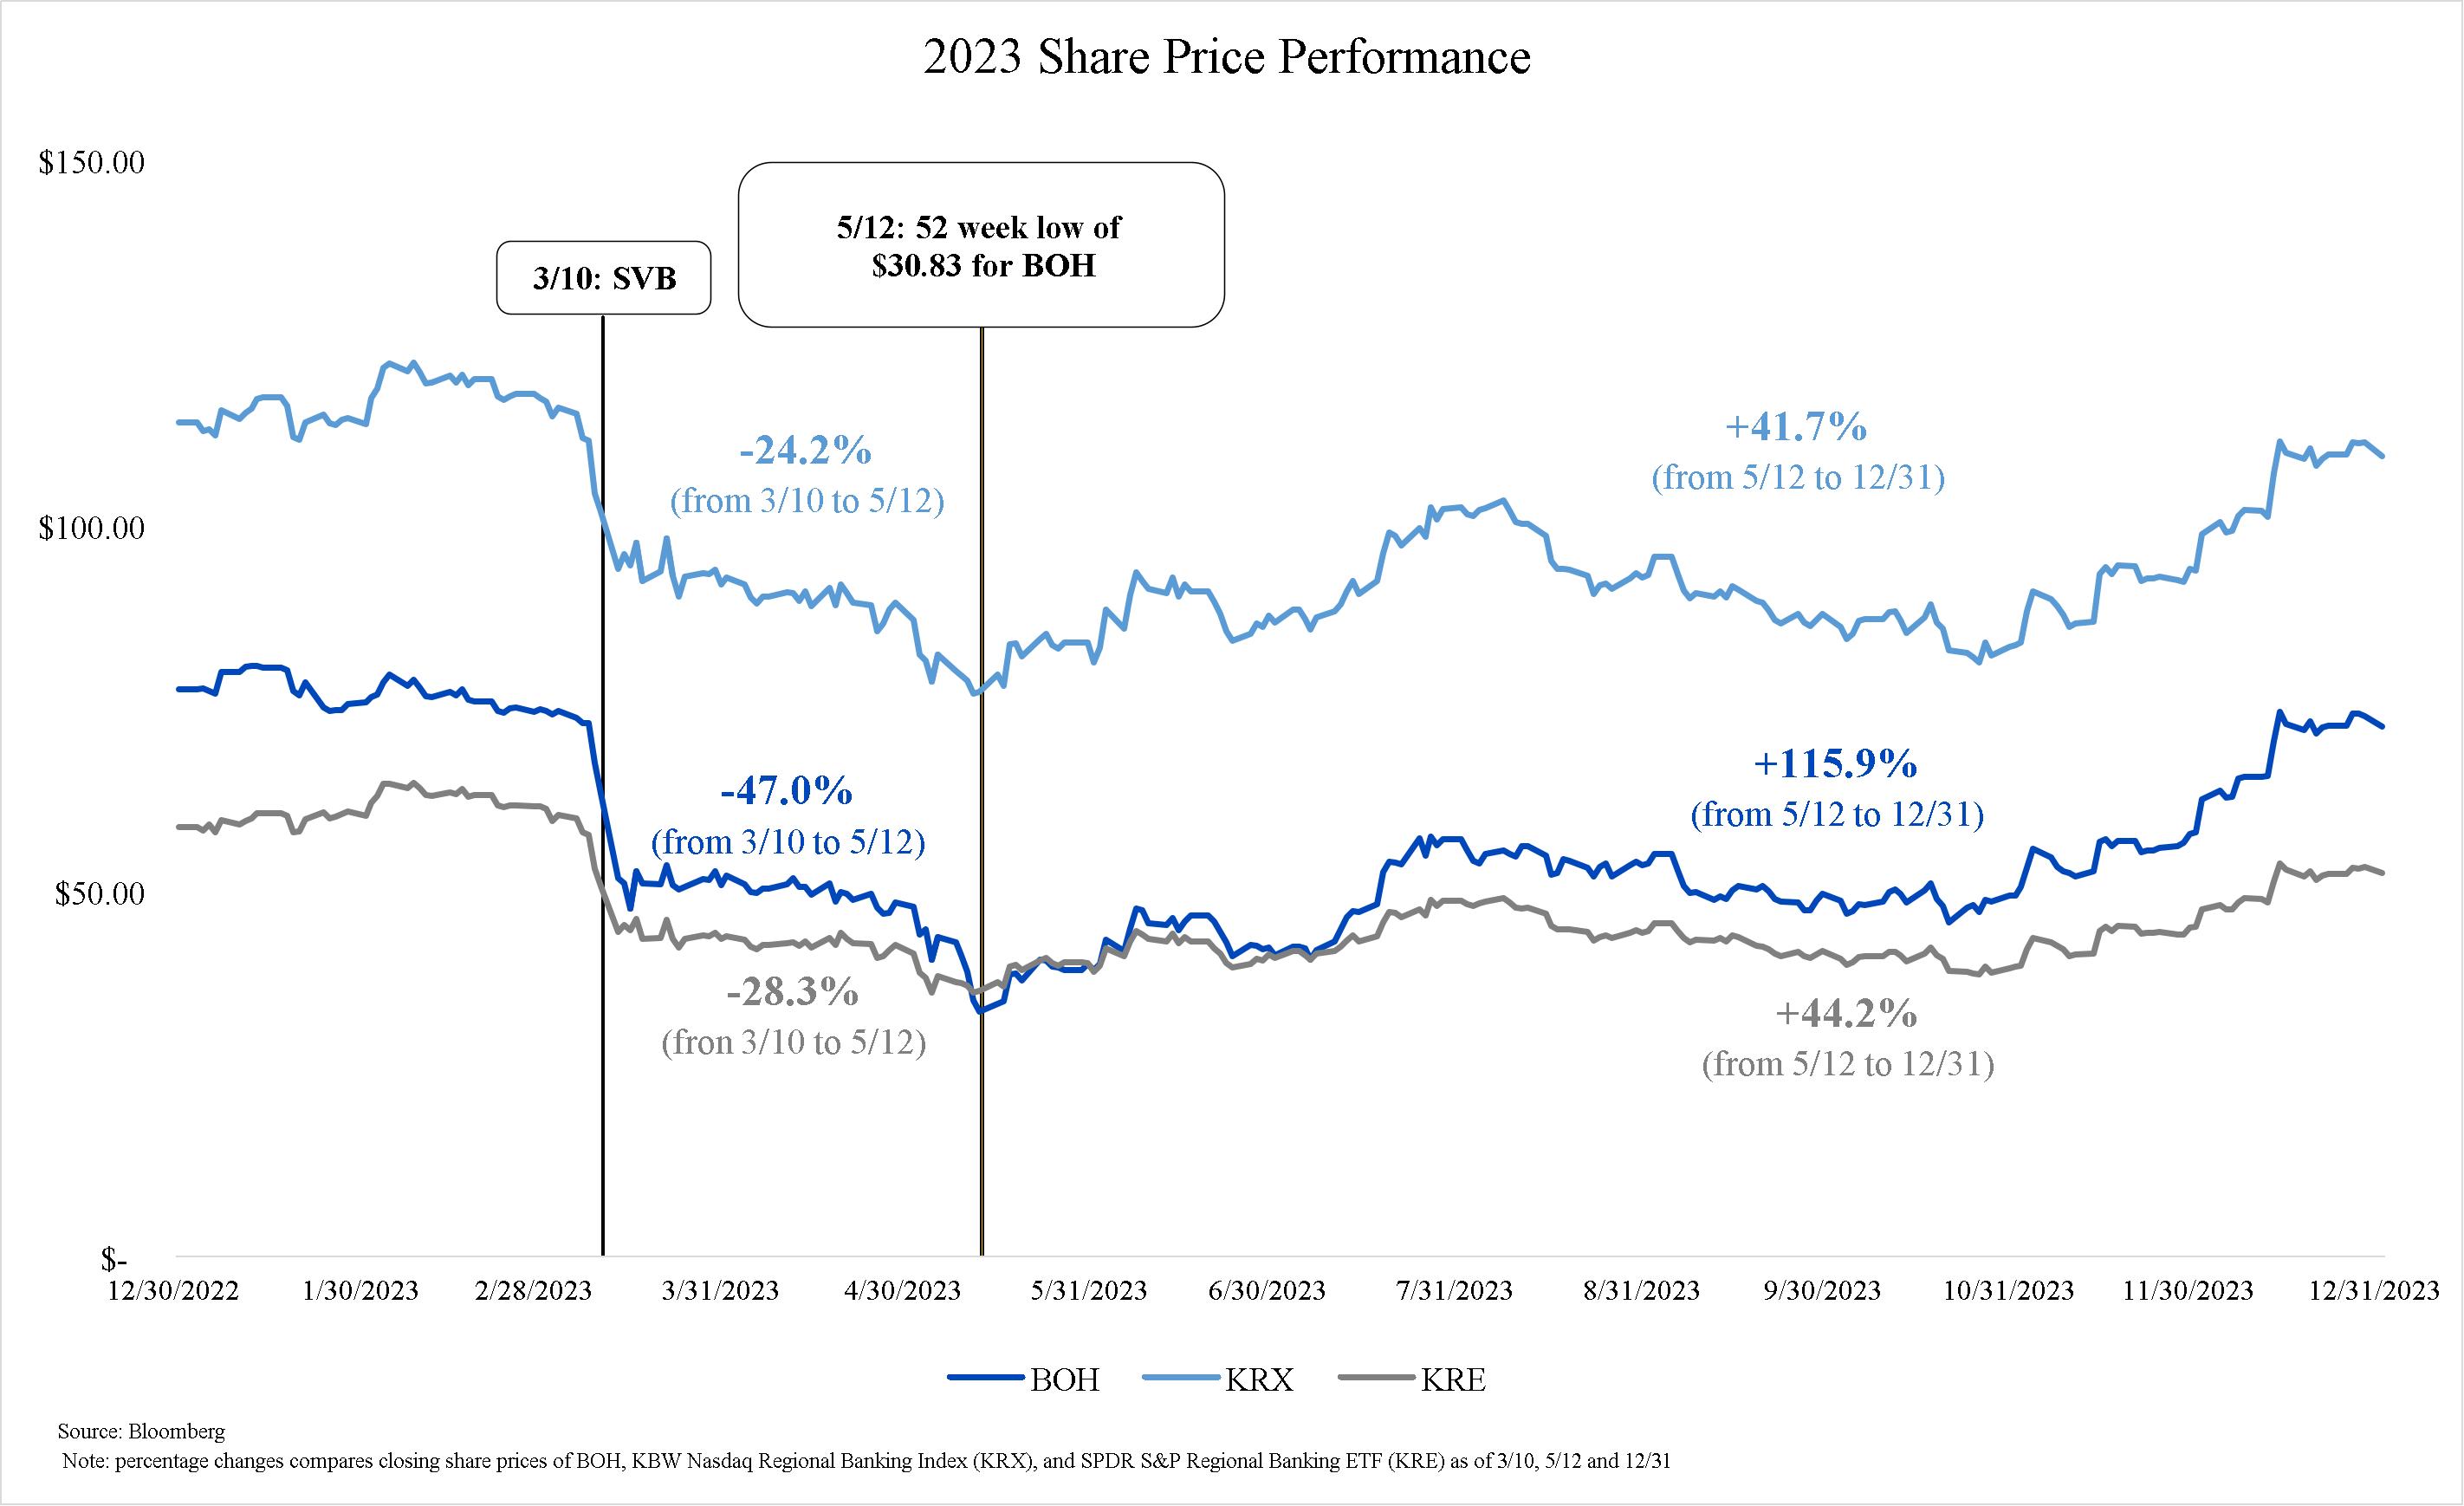
As mentioned, the hallmark of the Company is to strive to produce superior, risk-adjusted returns, over time. To do this, we run a conservative business, apply strict credit underwriting standards, and do business only with customers we know in geographies we understand. We believe this level of prudence is apparent in the quality of our assets – for the fourth quarter of 2023 our non-performing assets level was 0.08% and our net charge-off rate was 0.05%. The steady nature of our business is also apparent in our performance over time, with our ROCE and P/B ratio consistently landing in the top-quartile relative to peers, and our TSR over the last sixteen years outpacing the market, all proving the Company’s long-term value proposition.
42
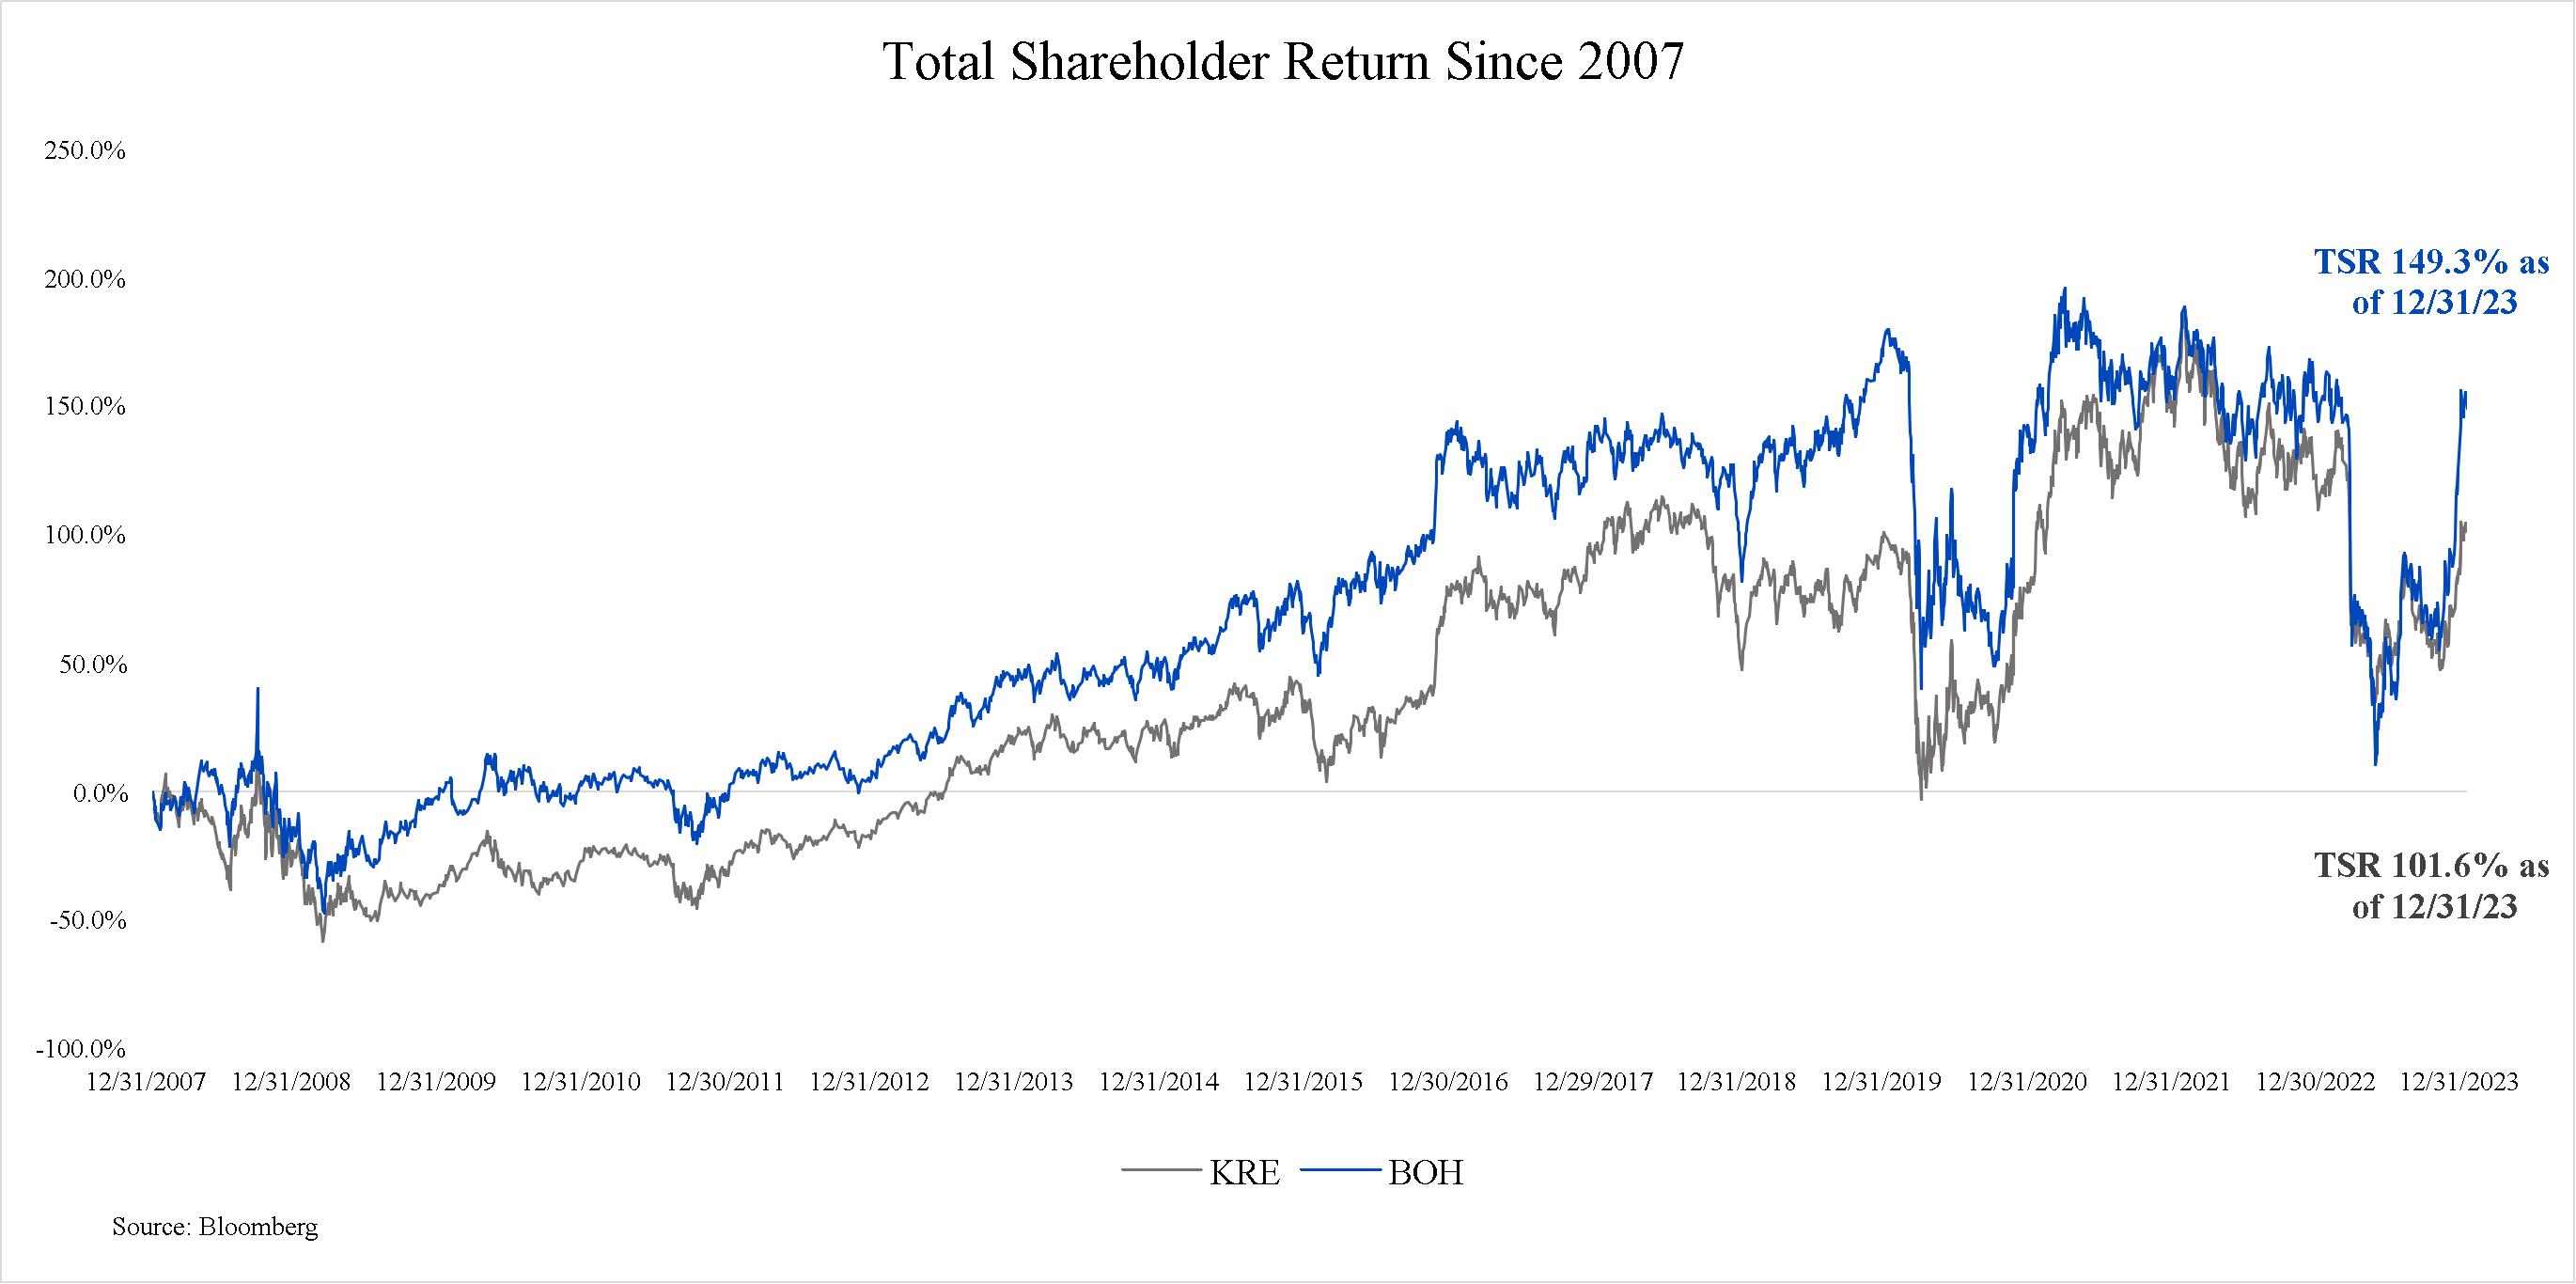
In 2023, the Company continued to return value to its shareholders through dividends and share repurchases. The Company maintained the quarterly dividend to common shareholders was increased toof $0.70 per share throughout 2023 and purchased 150,000 shares in 2023 through its share repurchase program. From the third quarter; overall dividendsbeginning of the share repurchase program initiated during July 2001 through December 31, 2023, the Company has repurchased 58.2 million shares of common stock and returned a total of nearly $2.4 billion to our common shareholders increased 2.2% compared with 2020.at an average cost of $41.24 per share. Total shareholders’ equity was $1.4 billion at December 31, 2023.
Our one-year TSR was 12.9%2023 Incentive Plan Metrics
The LTI program measures ROCE and P/B ratio over a three-year sustained performance period and both measures are equally weighted (50% P/B, 50% ROCE). To achieve full payout, top-quartile performance relative to peers* is required. The Board believes that these metrics are strong measures of management’s ability to drive profitability (ROCE) and enhance shareholder equity (P/B), which reflectsresulting in both short- and long-term shareholder value.
For the impactCEO STI program, annual measurement of ROCE and P/B each receive a 40% weighting. In addition, 20% of STI depends on a qualitative assessment of disciplined other metrics relating to Strategic Initiatives, Community Presence/Reputation, and Leadership Development/Succession. Finally, the Company determines the amount of the ongoing COVID-19 pandemicoverall STI bonus pool by assessing annual growth in earnings per common share (EPS), effectively making EPS a fourth metric upon which to determine STI payouts. In 2023, the Company saw a significant decline in EPS, and its particular impact onNEO short-term incentives were substantially reduced as a result. As mentioned, the Hawaii economy. The average performance of the incentive plan metrics have been revamped beginning in 2024.
*S&P Supercomposite Regional Bank Index and the S&P Supercomposite Bank Index in 2021 were 40.1% and 35.7%, respectively, and the average performance(excluding banks with assets > $50.0 billion) as of the KBW Regional Bank Index was 36.7%.January 3, 2023.
The Company’s three-year TSR of 37.8% was also heavily impacted by the challenges of the ongoing COVID-19 pandemic and its particular impact on the Hawaii economy. The Company’s three-year TSR was below the average performance of the S&P Supercomposite Regional Bank of 70.3%, the average performance of the S&P Supercomposite Bank Index of 63.0%, and the average performance of the KBW Regional Bank Index of 54.6%.
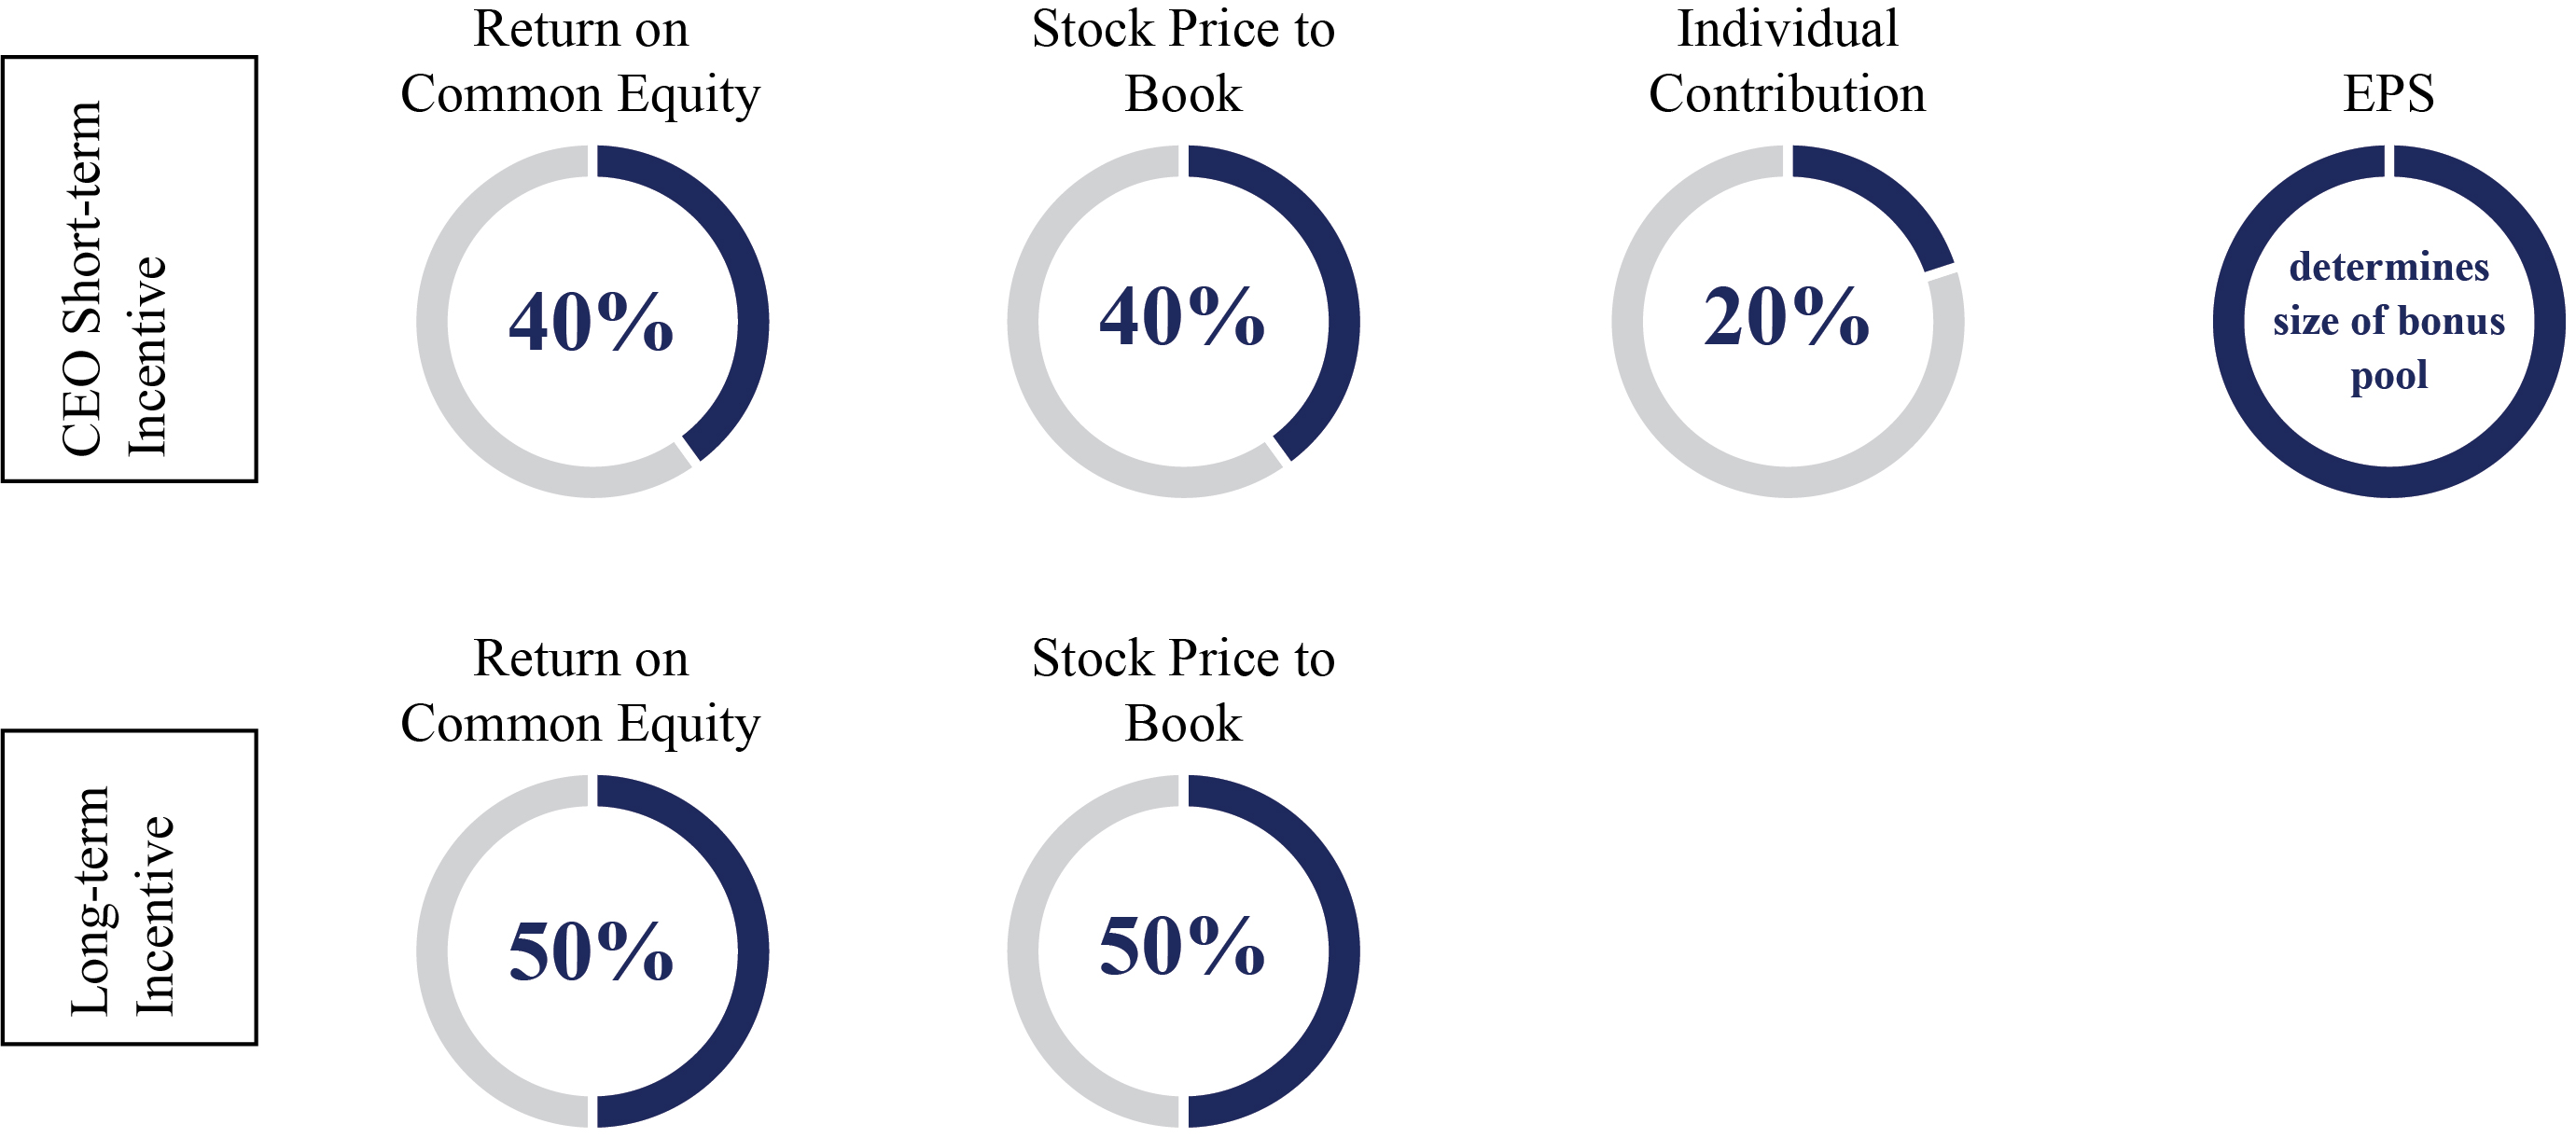
43
|
|
"Return-on-Common-Equity" shall be measured as of December 31 of such year | "Stock Price-to-Book Ratio" shall be measured based on stock price as of December 31 and book value as of September 30 of such year |
Key Performance Metrics
|
|
44
Deposit and Loan Growth
|
|
42
Strong Credit Risk Profile
|
|
A Balanced Approach to Capital Return
|
|
Dividends: In 2021,2023, the Company raisedmaintained its quarterly dividend to common shareholders toof $0.70 per share in the third quarter.
Returning Value to Shareholders: The Company returned $27.3$9.9 million in capital to shareholders through share repurchases in 2021. The Company resumed the share repurchase program in the third quarter of 2021 after temporarily suspending it in March 2020 due to the COVID-19 pandemic.2023.
45
Detailed Discussion and Analysis
Executive Compensation Philosophy
At Bank of Hawaii,Hawai‘i, we believe that executive compensation should reflect strong alignment between pay, performance and shareholders'shareholders’ interests while maintaining a balanced approach to risk and reward. Compensation programs should reinforce support for our vision and bestrategy, and remain consistent with market compensation trends after taking into account the unique circumstances facing Bank of HawaiiHawai‘i in light of geographic, demographic, and economic conditions in the markets served by the Company.Company, including the challenge of attracting and retaining top-notch executives. The Human Resources & Compensation Committee (“the Committee”) believes that compensation should recognize short- and long-term performance by including both cash and equity components, and reflect inclusiveness and gender equality and recognizerewarding individual performance.
The primary focus of the Company'sCompany’s executive compensation program is to encourage and reward performance that supports the Company'sCompany’s long-term business strategies and promotes sustainable growth in shareholder value. The Company believes that its goals are best supported by rewarding its NEOs for outstanding contributions to the Company'sCompany’s success, compensating those officers competitively with similarly situated executive officers, and providing its NEOs with equity to encourage and motivate them to focus on the Company'sCompany’s long-term growth and success.
The Committee is responsible for developing and implementing the executive compensation program. With the support of its independent compensation consultant, Willis Towers Watson, the Committee has designed and implemented an executive compensation program that is structured to:
|
|
|
|
|
|
|
|
COVID-19 Impact on 2021 Compensation Expense
In 2020, due to the effect of the COVID-19 pandemic on the performance of the Company and continued uncertainty surrounding the recovery of the Hawaii economy, the Committee determined that it was prudent to reduce compensation expense for 2020. The reduced 2020 Executive Incentive Plan payments were made half in cash and half in restricted stock equivalents granted on February 19, 2021, which will vest in thirds upon each of the first three anniversaries of the grant date. Accordingly, the restricted stock equivalents were not reported in last year’s proxy under 2020 compensation and are reported as a stock award, in addition to the annual performance-based restricted stock grant, in this year’s proxy as part of 2021 compensation. The timing and reporting of the restricted stock equivalents creates the appearance of an increase to compensation in 2021. In 2021, the Company returned compensation expense to 2019 payout levels.
Executive Compensation Philosophy Drives PerformanceProcess
We believe that the Company’s performance on key measures is evidence that the Company’s pay for performance approach to compensation facilitates consistent strong performance and growth. The Company achieved solid financial results, despite the many challenges faced during 2021 due to the continuing COVID-19 pandemic. Diluted earnings per common share was $6.25 for the full year of 2021, compared with $3.86 in 2020. Net income for the year was $253.4 million, an increase of 64.7% from $153.8 million in the previous year. The return on average assets for the full year of 2021 was 1.14%, an increase compared with 0.79 % in 2020. The Return-on-Common-Equity for the full year of 2021 was 17.92%, an increase compared with 11.38% in 2020. The efficiency ratio for the full year of 2021 was 58.86% compared with 54.91% during the full year of 2020.
During 2021, loan balances continued to grow and reached $12.3 billion at December 31, 2021, up 2.7% from $11.9 billion at December 31, 2020. Total assets reached a new record high and finished 2021 at $22.8 billion, up 10.6% from $20.6 billion at December 31, 2020. Total deposits also reached new record high and finished 2021 at $20.4 billion, up 11.8% from $18.2 billion at December 31, 2020. The Company’s strong overall asset quality continued to remain stable during 2021. Total non-performing assets were $19.0 million at December 31, 2021, compared with $18.5 million at December 31, 2020.
The Company continued to return value to its shareholders through dividends and resumed share repurchases. The Company increased the quarterly dividend to $0.70 per share in the third quarter of 2021. The Company purchased 328,832 shares in 2021 through its share repurchase program when it resumed in the third quarter of 2021 after temporarily suspending the program in March 2020 due to the COVID-19 pandemic. From the beginning of the share repurchase program initiated during July 2001 through December 31, 2021, the Company has repurchased 57.4 million shares and returned over $2.3 billion to shareholders at an average cost of $40.76 per share. Total shareholders’ equity was $1.6 billion at December 31, 2021, up from $1.4 billion at December 31, 2020.
44
Executive Compensation Process
The Committee’s annual process for setting NEOs’ compensation begins in the fourth quarter of each year when the Company’s senior management team sets operating and financial goals for the coming year. Using data and analysis provided by an independent compensation consultant and considering senior management’s operating and financial goals, as well as the market environment, the Committee establishes compensation levels and challenging performance goals for the year.
The compensation program is designed and implemented as follows:
|
|
Commencing in February of each year, the Committee reviews the annual results of the Company compared to the business plan, and uses this review as the basis for the annual evaluation of the CEO. The Committee reviews the relative performance for the quantitative performance metrics. The CEO does not attend executive sessions of the Committee when his own compensation is being reviewed or determined. The Committee'sCommittee’s evaluation is discussed with the full Board, excluding the CEO, and communicated to the CEO by the Lead Independent Director.
Based on similar factors and individual objectives, including an assessment of effective risk management, the CEO annually reviews the performance of each of the other NEOs. The conclusions and recommendations based on those reviews, including any recommendations for salary adjustments, annual awards and equity components, are presented to the Committee for consideration.
The Committee believes that retaining discretion to assess the qualitative performance of the CEO and other NEOs gives the Committee members the ability to more accurately reflect individual contributions that cannot be quantified.
46 |
|
|
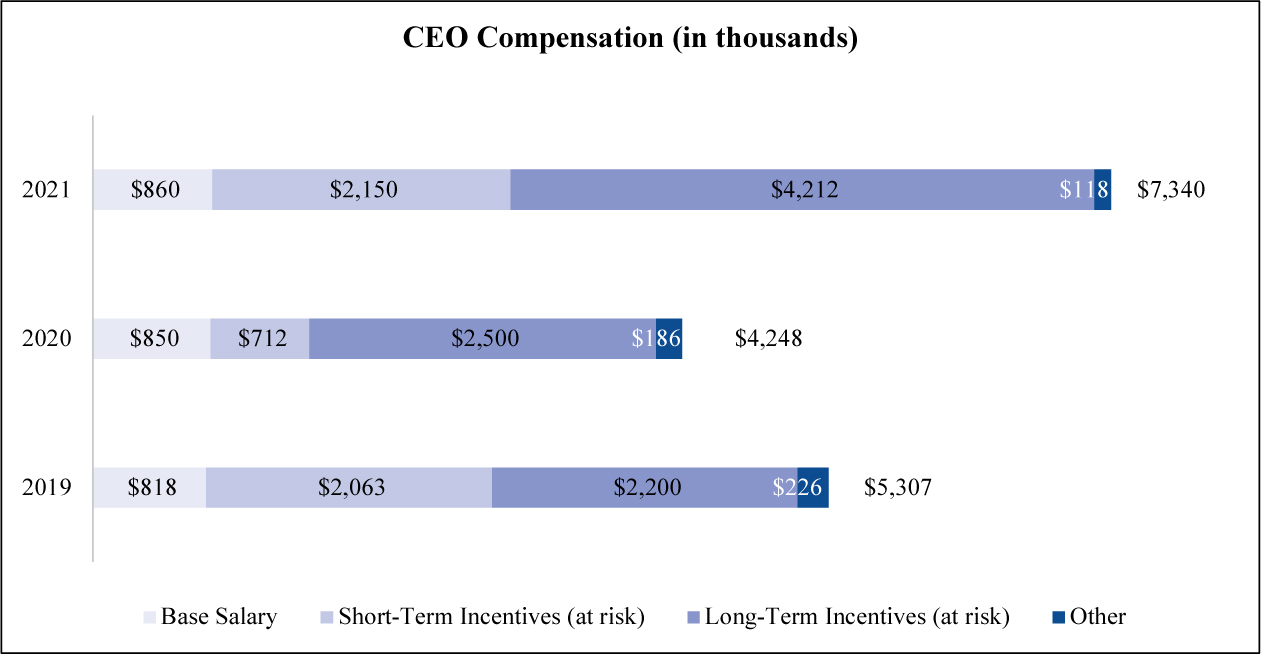
|
|
45
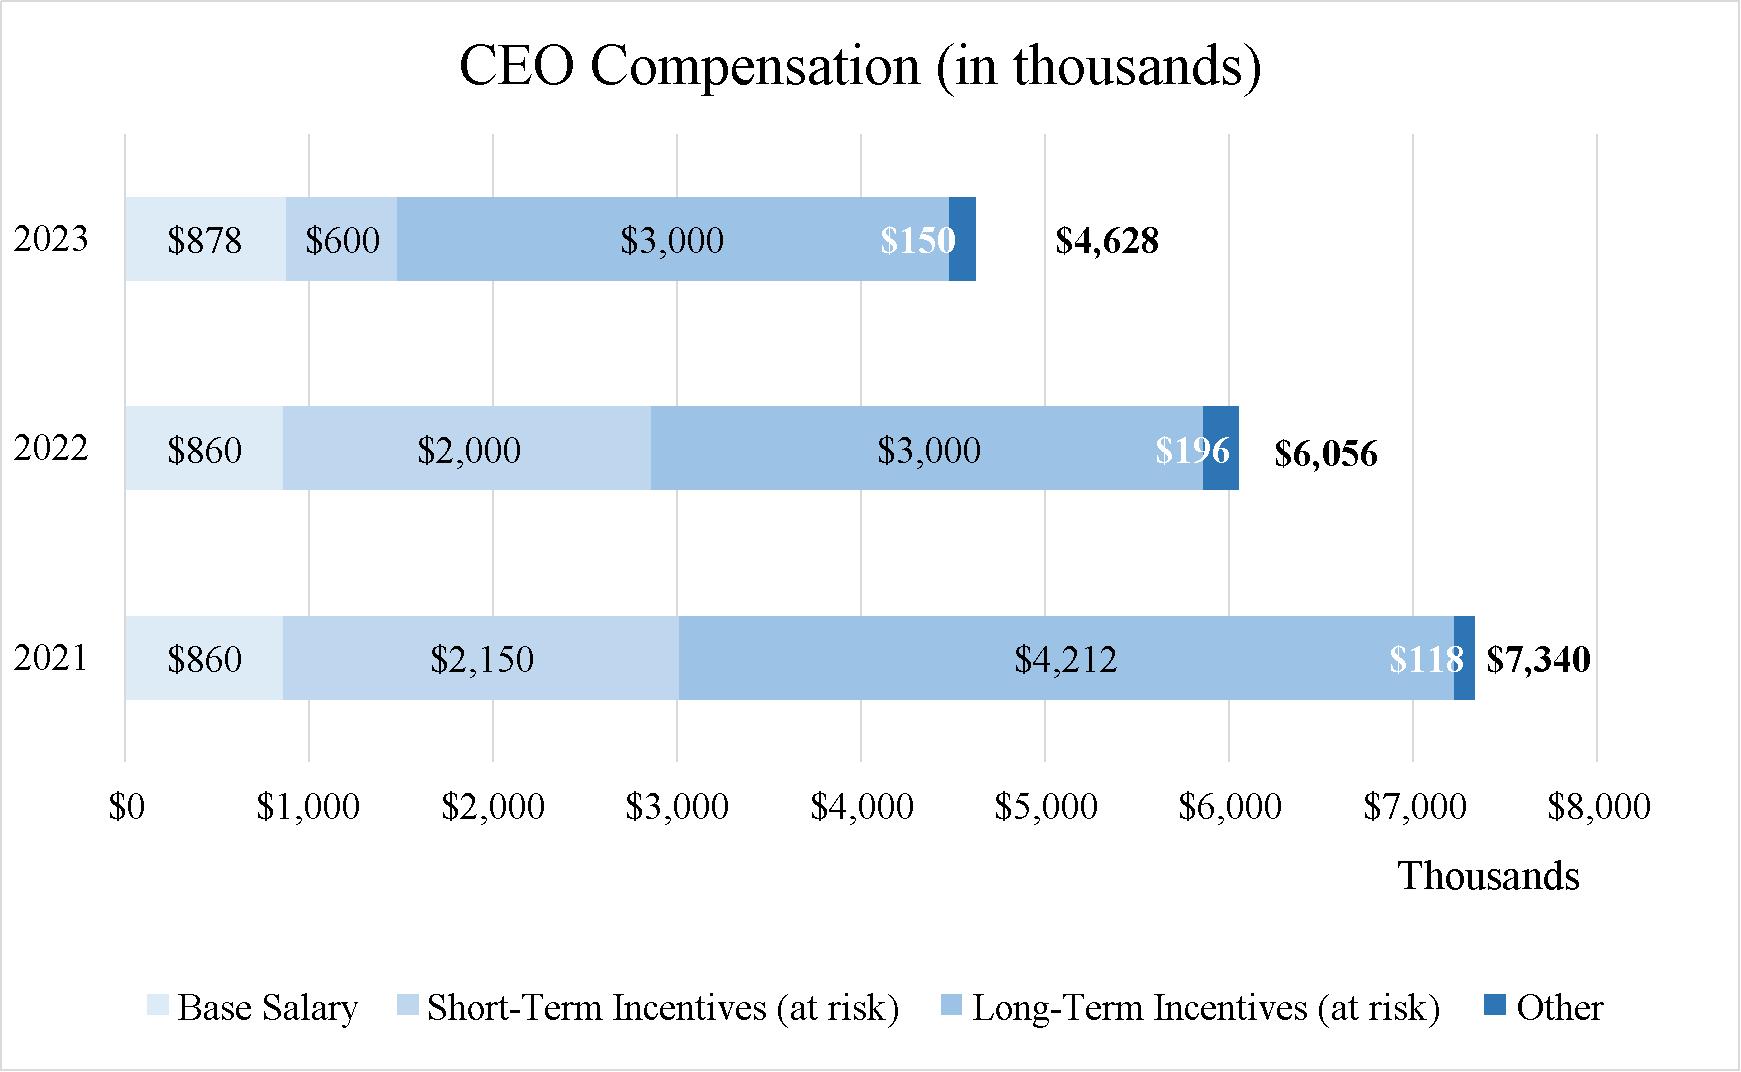
(3) Alignment with shareholders: Each NEO is subject to robust stock ownership guidelines that require them to hold a significant number of company shares as long as they remain employed at the Company, with the CEO’s requirement at 5x base salary and other NEOs at 2x base salary.
47
Peer Group and the Market Check
Each year, the Committee identifies companies to include in a peer group for purposes of benchmarking executive compensation levels and practices. The Committee selects peer companies with the support of Willis Towers Watson, an independent compensation consultant.Watson. For 2021,2023, the Committee selected a bank peer group, consisting of regional banks that the Company competes against for capital and talent. Companies selected for the peer groups are:
|
|
|
|
|
|
|
|
|
|
|
|
Peer Group Companies* | Peer Group Companies* | Peer Group Companies* | ||||||||||||||||||||||||||||||
|
| Market Capitalization |
|
| Revenue |
|
| Total Assets |
|
| Employee Population (FTE)** |
|
| Market |
|
| Revenue |
|
| Total Assets |
|
| Employee |
|
| |||||||
|
|
|
|
|
|
|
|
|
|
|
|
|
|
|
|
|
|
|
|
|
|
|
|
|
| |||||||
Bank Peers (dollars in millions) | Bank Peers (dollars in millions) | Bank Peers (dollars in millions) | ||||||||||||||||||||||||||||||
Associated Banc-Corp |
| $3,330.2 |
|
| $1,130.0 |
|
| $35,104.3 |
|
| 4,000 |
|
| $ | 3,070.0 |
|
|
| $ | 1,019.7 |
|
|
| $ | 41,015.9 |
|
|
|
| 4,100 |
|
|
Banner Corporation |
| $2,078.1 |
|
| $626.7 |
|
| $16,804.9 |
|
| 1,891 |
|
| $ | 1,505.1 |
|
|
| $ | 609.6 |
|
|
| $ | 15,670.4 |
|
|
|
| 1,966 |
|
|
BOK Financial Corporation |
| $7,236.3 |
|
| $1,973.8 |
|
| $50,249.4 |
|
| 4,711 |
|
| $ | 5,465.4 |
|
|
| $ | 2,016.1 |
|
|
| $ | 49,824.8 |
|
|
|
| 4,966 |
|
|
Cadence Bank |
| $5,736.0 |
|
| $1,045.8 |
|
| $47,669.8 |
|
| 6,595 |
| ||||||||||||||||||||
Cathay General Bancorp |
| $3,319.8 |
|
| $668.4 |
|
| $20,886.7 |
|
| 1,205 |
|
| $ | 2,802.8 |
|
|
| $ | 784.1 |
|
|
| $ | 23,081.5 |
|
|
|
| 1,178 |
|
|
Columbia Banking System, Inc. |
| $2,545.7 |
|
| $616.8 |
|
| $20,945.3 |
|
| 2,260 |
| ||||||||||||||||||||
Commerce Bancshares, Inc. |
| $8,384.9 |
|
| $1,492.2 |
|
| $36,689.1 |
|
| 4,462 |
|
| $ | 6,725.0 |
|
|
| $ | 1,550.7 |
|
|
| $ | 31,701.1 |
|
|
|
| 4,660 |
|
|
Community Bank System, Inc. |
| $4,016.8 |
|
| $629.5 |
|
| $15,552.7 |
|
| 2,927 |
|
| $ | 2,362.4 |
|
|
| $ | 640.7 |
|
|
| $ | 15,554.5 |
|
|
|
| 2,933 |
|
|
East West Bancorp, Inc. |
| $11,165.3 |
|
| $1,730.0 |
|
| $60,870.7 |
|
| 3,000 |
| ||||||||||||||||||||
First Financial Bancorp. |
| $2,295.5 |
|
| $641.7 |
|
| $16,329.1 |
|
| 1,994 |
|
| $ | 2,060.3 |
|
|
| $ | 796.7 |
|
|
| $ | 17,532.9 |
|
|
|
| 2,165 |
|
|
First Hawaiian, Inc. |
| $3,520.6 |
|
| $754.5 |
|
| $24,992.4 |
|
| 2,000 |
|
| $ | 2,654.5 |
|
|
| $ | 810.3 |
|
|
| $ | 24,926.5 |
|
|
|
| 2,089 |
|
|
First Midwest Bancorp, Inc. |
| $2,338.0 |
|
| $747.9 |
|
| $21,778.2 |
|
| 2,000 |
| ||||||||||||||||||||
Fulton Financial Corporation |
| $2,742.2 |
|
| $945.9 |
|
| $25,796.4 |
|
| 3,300 |
|
| $ | 2,457.0 |
|
|
| $ | 1,027.9 |
|
|
| $ | 27,560.7 |
|
|
|
| 3,300 |
|
|
Glacier Bancorp, Inc. |
| $6,293.7 |
|
| $778.9 |
|
| $25,940.6 |
|
| 3,415 |
|
| $ | 4,081.3 |
|
|
| $ | 787.5 |
|
|
| $ | 27,742.6 |
|
|
|
| 3,227 |
|
|
Hancock Whitney Corporation |
| $4,343.1 |
|
| $1,371.5 |
|
| $36,531.2 |
|
| 3,486 |
|
| $ | 3,665.3 |
|
|
| $ | 1,327.0 |
|
|
| $ | 35,578.6 |
|
|
|
| 3,591 |
|
|
Home Bancshares, Inc. (Conway, AR) |
| $3,984.3 |
|
| $715.3 |
|
| $18,052.1 |
|
| 1,992 |
|
| $ | 4,670.4 |
|
|
| $ | 981.6 |
|
|
| $ | 22,656.7 |
|
|
|
| 2,774 |
|
|
International Bancshares Corporation |
| $2,686.1 |
|
| $585.6 |
|
| $16,046.2 |
|
| 2,181 |
|
| $ | 3,175.6 |
|
|
| $ | 798.9 |
|
|
| $ | 15,066.2 |
|
|
|
| 2,177 |
|
|
Old National Bancorp |
| $3,004.5 |
|
| $832.7 |
|
| $24,453.6 |
|
| 2,374 |
|
| $ | 4,736.0 |
|
|
| $ | 1,762.2 |
|
|
| $ | 49,089.8 |
|
|
|
| 3,940 |
|
|
Pacific Premier Bancorp, Inc. |
| $ | 2,170.3 |
|
|
| $ | 440.2 |
|
|
| $ | 19,026.6 |
|
|
|
| 1,345 |
|
| ||||||||||||
PacWest Bancorp (1) |
| $ | — |
|
|
| $ | 837.2 |
|
|
| $ | 36,877.8 |
|
|
|
| 2,438 |
|
| ||||||||||||
Prosperity Bancshares, Inc. |
| $6,663.5 |
|
| $1,133.3 |
|
| $37,834.0 |
|
| 3,704 |
|
| $ | 5,778.0 |
|
|
| $ | 1,091.2 |
|
|
| $ | 38,547.9 |
|
|
|
| 3,850 |
|
|
Renasant Corporation |
| $2,115.6 |
|
| $652.7 |
|
| $16,810.3 |
|
| 2,524 |
|
| $ | 1,742.7 |
|
|
| $ | 616.8 |
|
|
| $ | 17,360.5 |
|
|
|
| 2,300 |
|
|
Synovus Financial Corp. |
| $6,965.6 |
|
| $2,089.3 |
|
| $57,317.2 |
|
| 4,953 |
| ||||||||||||||||||||
Texas Capital Bancshares, Inc. |
| $3,049.1 |
|
| $937.1 |
|
| $34,731.7 |
|
| 1,751 |
|
| $ | 2,731.7 |
|
|
| $ | 1,003.5 |
|
|
| $ | 28,356.3 |
|
|
|
| 1,987 |
|
|
Trustmark Corporation |
| $2,027.1 |
|
| $676.4 |
|
| $17,595.6 |
|
| 2,692 |
|
| $ | 1,624.2 |
|
|
| $ | 735.3 |
|
|
| $ | 18,722.2 |
|
|
|
| 2,757 |
|
|
UMB Financial Corporation |
| $5,131.4 |
|
| $1,262.7 |
|
| $42,693.5 |
|
| 3,529 |
|
| $ | 3,882.8 |
|
|
| $ | 1,420.7 |
|
|
| $ | 44,011.7 |
|
|
|
| 3,599 |
|
|
Umpqua Holdings Corporation |
| $4,167.9 |
|
| $1,318.6 |
|
| $30,640.9 |
|
| 4,000 |
| ||||||||||||||||||||
United Bankshares, Inc. |
| $4,931.9 |
|
| $1,057.1 |
|
| $29,328.9 |
|
| 3,143 |
|
| $ | 4,586.3 |
|
|
| $ | 1,024.0 |
|
|
| $ | 29,926.5 |
|
|
|
| 2,736 |
|
|
Valley National Bancorp |
| $5,811.5 |
|
| $1,321.4 |
|
| $43,446.4 |
|
| 3,155 |
| ||||||||||||||||||||
Webster Financial Corporation |
| $5,058.5 |
|
| $1,279.0 |
|
| $34,915.6 |
|
| 2,650 |
| ||||||||||||||||||||
Western Alliance Bancorporation |
| $11,114.0 |
|
| $1,974.4 |
|
| $55,982.6 |
|
| 3,139 |
| ||||||||||||||||||||
Wintrust Financial Corporation |
| $5,177.4 |
|
| $1,763.9 |
|
| $50,142.1 |
|
| 5,239 |
| ||||||||||||||||||||
Average for Bank Peer Group |
| $4,707.8 |
|
| $1,091.8 |
|
| $32,204.4 |
|
| 3,142 |
|
| $ | 3,426.1 |
|
|
| $ | 1,003.7 |
|
|
| $ | 28,628.7 |
|
|
|
| 2,913 |
|
|
Bank of Hawaii Corporation |
| $3,371.6 |
|
| $668.6 |
|
| $22,784.9 |
|
| 2,056 |
| ||||||||||||||||||||
Bank of Hawai‘i Corporation |
| $ | 2,880.5 |
|
|
| $ | 673.6 |
|
|
| $ | 23,733.3 |
|
|
|
| 1,899 |
|
| ||||||||||||
|
|
|
|
(1) PacWest Bancorp is no longer traded as of November 30, 2023 following its merger with Banc of California. The financials presented reflects the last twelve months as of Q3 2023 before its merger.
* Peer data provided by Willis Towers Watson Executive Compensation Consultants as of December 31, 2023, or earlier, based on available data as of February 28, 2024.
** FTE represents Full-Time Equivalent Employees
After selecting the peer companies, the Committee does not target a specific relative level of compensation but considers the median levels (the 50th percentile) of the following when determining target pay: (1) base salaries, (2) total cash compensation, including annual incentives on both an actual and target basis, and (3) total direct compensation including long-term incentives at both actual and target levels. If NEO base salaries, total cash compensation, or target or actual incentive compensation result in above-median compensation, it is directly because of measurable Company and/or individual executive performance.
4648
S&P Supercomposite RegionalRegional Bank Index
In addition to the bank peer group, the Company benchmarks key performance metrics and the compensation program against the companies included in the S&P Supercomposite Regional Bank Index, excluding those companies with assets in excess of $50.0 billion. The Committee believes that the S&P Supercomposite Regional Bank Index provides an appropriate group for comparison purposes because these are the companies with which the Company competes for capital and talent. The Committee concluded that the Company’s business mix and source of executive talent for the Company are well represented in the S&P Supercomposite Regional Bank Index.
Role of the Compensation Consultant
The Committee is responsible for retaining its compensation consultant, Willis Towers Watson, and for determining the terms and conditions of that engagement, including fees to be paid to the consultant. The Committee determines whether the consultant's services are performed objectively. The Committee's current independent compensation consultant is Willis Towers Watson. The compensation consultant reports directly to the Committee, takes instructions solely from the Committee, and performs no other services for the Company. The Committee ChairmanChair pre-approves all compensation consulting engagements, including the nature, scope and fees of assignments. In 2021,2023, the Committee considered the factors delineated by the SEC in Rule 10C-1 and determined that Willis Towers Watson was an independent compensation consultant and that the firm’s work did not raise a conflict of interest with the Company.
Veritas was the Committee’s compensation consultant for a portion of the year andWillis Towers Watson helped to ensure that the Company'sCompany’s executive compensation practices were competitive, appropriately designed, and were aimed at linking executive compensation to the business and strategic objectives of the Company. VeritasWillis Towers Watson also provided the Committee with market data and an analysis of competitive compensation for the NEOs. During the fall of 2021, the Committee engaged Willis Towers Watson to be its executive compensation consultant.
Compensation and Risk Management
Compensation risks are assessed and managed in the context of the Company'sCompany’s business strategies. The Committee monitors the Company'sCompany’s financial and non-financial performance throughout the year as well as the Company'sCompany’s risk profile and risk management processes to ensure that the Company'sCompany’s compensation policies do not promote inappropriate conduct, or unnecessary or excessive risks that may threaten the value of the Company (see page 2223 for greater detail). Several areas are reviewed by the Committee including, but not limited to, how risk management is built into incentive compensation for the Company'sCompany’s executive management, the specific risk profile for a community bank as it relates to loans and investment securities, the controlled and disciplined approach in the compensation structure of the Company, the implementation of new processes with regard to qualitative versus quantitative measures of management performance, and the refinement of best practices.
The Committee also believes that compensation should recognize short- and long-term performance and may include both cash and equity components. The composition of components may vary from year to year based on individual, market and other factors. The Committee does not adhere to a specific formula when determining the mix of pay elements, or the allocation between cash and non-cash compensation or among non-cash forms of pay.
Referring to the table infollowing Elements of the followingCompensation Program section, neither total compensation nor any element of cash and non-cash compensation is formally benchmarked against a peer group of companies, although the Committee uses the peer group data as a reference. In making compensation decisions, the Committee considers individual performance, experience in the position, breadth of duties, and pay parity among positions of comparable responsibility. The Committee also reviews market data to verify that compensation is competitive and within market ranges.
Elements of the Compensation Program
In order to ensure compensation is tightly linked to long-term shareholder value creation, the Board and the Committee have implemented an executive compensation program that seeks to balance short-term financial results with long-term value through sustainable business growth in our market. To that end, the compensation program uses a number of short- and long-term forms of executive compensation, each specifically structured to incentivize one or more aspects of Company performance the Committee believes are critical to driving long-term shareholder value.
Each NEO receives a balance of variable and fixed compensation. The following describes the various forms of compensation:
Base salary is driven by each NEO'sNEO’s responsibilities. The Committee also considered competitive compensation data provided by Veritas.Willis Towers Watson. Base salaries are generally established in connection with recruiting or retaining qualified executive officers. The Committee reviews salary levels as part of the Company'sCompany’s annual performance review process, as well as upon promotion or other changes in job responsibility. Merit-based increases to salaries for executive officers other than the CEO are determined by the Committee and include the CEO'sCEO’s assessment of individual performance and his recommendation.
4749
In recommending base salaries, the CEO considers, among other factors, the needs of the Company, internal pay parity among positions of comparable responsibility, and individual performance and contribution to the Company. The Committee also looks at market survey data to verify that salaries are competitive and within market ranges.
Based upon the foregoing, including peer group analysis, market data and recommendations by Veritas,Willis Towers Watson, the Committee approved, effective April 1, 2021,2023, the following NEO base salaries:
Name | Base Salary Effective
| |||
Peter S. Ho |
| |||
Dean Y. Shigemura |
| |||
|
| |||
|
| |||
|
| |||
1 Base salary effective May 1, 2023. | ||||
20212023 Short-Term Incentive Compensation
The CEO and other NEOs participate in the Executive Incentive Plan (the “EIP”), the Company'sCompany’s short-term incentive plan for executives. The EIP is a 100% performance-based short-term incentive plan.
The EIP provides for a maximum incentive pool of 3% of the Company'sCompany’s net income before taxes for the fiscal year. At the beginning of the performance period, each participating executive is allocated a maximum percentage of the incentive pool. For 2021,2023, the Committee allocated a maximum percentage of 35% to Mr. Ho and 11% to Mmes. Crofts and Sellers and Messrs. Polk and Shigemura.the other NEOs. The Company has set a target award of 100% of base salary for the CEO, with a threshold or minimum payout of 50% and maximum payout of 250% of target. To achieve any payout, top two quartile performance must occur with actual payout determined by performance and quantitative metric weighting. Company performance below the third quartile of the quantitative measuresmedian results in forfeiture of the entire weighted opportunity for each of the quantitative measures. Mmes. Crofts and Sellers and Messrs. Polk, and ShigemuraAll the other NEOs have a target award of 80% of base salary. Their threshold or minimum payout is 50% of target and maximum payout is 200% of target. Similar to the CEO, to achieve any payout, top two quartile performance must occur with actual payout determined by performance and metric weighting.
The following chart compares the targeted goals of each quantitative performance metric with actual results:
Return-on-Common-Equity Relative to Peers (40% Weighting) | Stock Price-to-Book Ratio Relative to Peers (40% Weighting) |
|
|
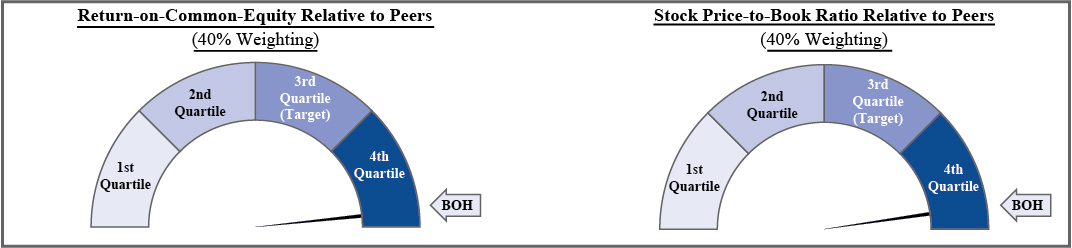
50
48
The following table describes the Short-Term Incentive Plan'sPlan’s disciplined other short-term metrics and achievements of the CEO and NEOs for 2021:2023:
| ||
Strategic Initiatives | Community Presence/Reputation | Leadership Development/Succession |
•Total loan balances grew •
•Efficiency ratio was •
◦ Improved CX score ◦ Activated and measured impact of CX Pillars and continued CX Panel ◦ Identified AI Pilot ◦ Completed CX Advocate Program ◦ Launched and continued delivery of Operational Empowerment •Employee Experience (EX) ◦ Launched an employee podcast, co-hosted by CEO and Culture + EX; completed 4 episodes centered around company direction and employee stories ◦ Enhanced Employee Journeys ◦ Accelerated Talent Planning practices ◦ Activated Culture/EX Framework ◦ Enriched Talent & Leadership Development •Operational Excellence (OX) ◦ CX reimagined and broadened focus of OX across the Company • Digital Experience ◦ Continued
◦ •Segmentation Solutions ◦ ◦ Developed segment sales strategy • Contact Center Modernization ◦ Improved CX and
◦ Expanded ◦ Delivered operational efficiencies • Data Analytics ◦ Completed additional analytics governance use ◦ Deepened and expanded analytics support
• Branch Modernization ◦ ◦ Continued operational and physical optimization
| •CEO continues to be active in the community serving, on •High levels of industry and press recognition: ◦ ◦ “World’s Most Trustworthy Companies” in the banking industry worldwide by Newsweek. Among a list of 1,000 companies in 21 countries and 23 industries, Bank of ◦
◦ Named a top 3 finalist (amongst the ~400 submissions) in the inaugural National Customer Obsessed Enterprise Award from global research firm Forrester ◦ Received multiple recognitions from Forbes magazine including to rank as one of the “America’s Best Banks” (14th consecutive year), “The World’s Best Banks” (5th consecutive year) and •Strong commitment to ESG in the communities we serve ◦ Supports our communities with the use of investment, philanthropic and human capital to expand access to economic opportunity within such communities ◦ Advances sustainable development through integration of environmental and social issues into financing solutions that generate positive environmental and social impacts •Significant charitable/community activity:
◦ Bank of ◦ ◦ ◦ $100,000 to ◦
◦ $50,000 to American Heart Association- Hawai‘i ◦ $30,000 to Goodwill Goes GLAM! As part of the Company’s visionary sponsorship and ongoing commitment to help people with employment barriers find jobs ◦ $25,000 to Teach for America Hawai‘i to support programming that provides educational excellence for Hawaii‘s children ◦ $15,000 to Prince Lot Hula Festival for its ◦
| •Executive
•Strong commitment to ESG in the Committed to attracting, retaining and developing diverse talent and invests in employees through education, learning development, compensation and benefits, • Laid the groundwork for •Leadership Conference Two-day onsite conference for the Company’s senior leaders. Focused on understanding the current business environment, work for the future and building a shared purpose. Learning Partner Groups continued focus discussions to • Provides an • Keeps the growth mindset with continuous investment on personal and professional growth for leaders •Mentorship Programs Allows leaders to
|
* 20% represents CEO weighting and performance. |
49
In evaluating the CEO performance and resulting EIP payment, the Committee employed a weighted scoring system based upon achievement of the performance metrics referenced above. Eighty percent of the performance metrics are quantitative and were selected by the Committee as strong measures of management's ability to drive profitability (Return-on-Common-Equity), and enhance shareholder equity (Stock Price-to-Book Ratio), resulting in both short- and long-term shareholder value. The Committee reviewed and discussed the CEO'sCEO’s performance against the EIP metrics and objectives, then determined the final EIP award based upon the results of the pre-determined quantitative metrics and the disciplined other short-term metrics.results. The Committee certified fourth (top) quartile performance for the Return-on-Common-Equity (96.2(79.5 percentile), and Stock Price-to-Book Ratio (94.9(91.8 percentile) metrics. Assessing performance of the qualitative measures, theThe Committee reviewed and discussed in detail the CEO'sCEO’s individual contributions and rated his performance “OUTSTANDING” in the pre-determined areas of community presence, reputation, leadership development, succession planning and strategic initiatives. Nevertheless, the Committee determined that a substantial reduction in the CEO’s EIP payment was appropriate because EPS determines the overall funding of the EIP program and EPS was 25% lower year over year. In addition, the Committee exercised further downward discretion to align the CEO’s STI payout with year-end financial results.
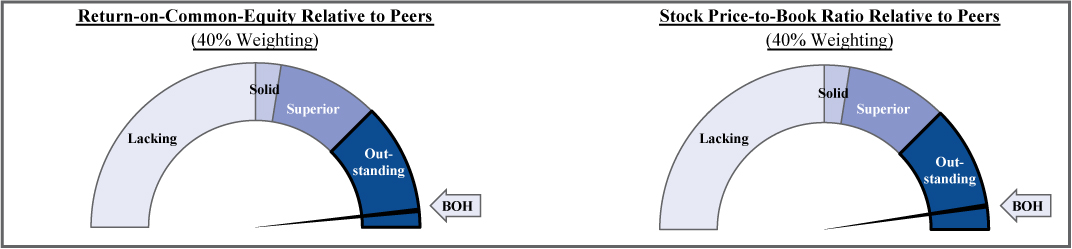
In evaluating the other NEOs, the Committee considered the recommendations of the CEO, and reviewed and discussed the other NEOsNEOs’ performance against the EIP metrics and objectives, the other NEOs performanceas well as their individual contributions and achievements in their respective managerial spheres of influence, the individual contributions and achievementsinfluence.
51
Dean Y. Shigemura
Mr. Shigemura is Vice Chair and Chief Financial Officer. He is a member of the Company’s Executive Committee and has overall responsibility for the Finance group. The Finance group includes Financial and Regulatory Reporting, Tax Reporting, Accounting, Accounts Payable, Corporate Sourcing and Procurement, Financial Planning and Analytics,Analysis, Treasury, and Investor Relations.
The Committee discussed Mr. Shigemura'sShigemura’s contributions in his area of responsibilities in 2021.2023. Mr. Shigemura demonstrated disciplined financial management within established corporate goals and expectations, while leading his team through transformational organizational changesthe regional banking crisis and volatile interest rates while maintaining top quartile financial performance metrics for the Company. The Committee noted his significant contribution within the area of financial management including the continued improvements of the company-wide Pricing Committeegrowth in loans and leading the annual budget process.deposits, maintaining strong liquidity and increasing capital levels. In addition, Mr. Shigemura chaired the Asset/Liability Committee (“ALCO”), which oversees the balance sheet, capital and liquidity for the Company, helped lead the ALCO Pricing Committee, which is responsible for loan, deposit, and fee pricing, oversaw the Company’s stress testing activities, and participated in a number of corporate committees and regulatory exams.
Marco A. Abbruzzese
Mr. Abbruzzese joined the Company as Vice Chair and Senior Executive Director of Wealth Management in January 2022. He is responsible for overseeing the wealth management areas of Trust Services Group, Bankoh Investment Services, and The Private Bank. In 2021, Mr. Shigemura led the issuanceaddition, he is a member of the Company’s preferred stock offering which bolsteredBank’s Executive Committee.
The Committee discussed Mr. Abbruzzese’s contributions to the Company’s capital position,Company in 2023 including his role leading the newly unified Wealth Management organization and leadership team and beginning to execute a five-year strategic plan designed to grow and deepen the wealth organization. Under his leadership, significant progress has been made to build capacity within the Wealth Business to better serve and attract High Net worth/Ultra High Net worth clients, leverage the organization’s deep and specialized expertise to help clients achieve their financial goals, and develop a clear value proposition for, and awareness of, the Wealth Management business. The Wealth Management organization made several investments in technology upgrades and process improvements, introduced new products and services, and continued to lead several initiatives that reduced non-interest expensesrecruit and maintained financial discipline that helpedretain top talent. Mr. Abbruzzese has also prioritized strong partnerships with the Company increaseCommercial Banking, Consumer, and Mortgage divisions in service of clients, which was an important element of the dividendsgroup’s successes in 2023. Effective risk management remained a priority across the Wealth Management organization with enhancements made to shareholdersthe governance and maintained sound levelsoversight of capital and liquidity during the disruptive COVID-19 pandemic.
Sharon M. Crofts
Ms. CroftsTrust business. Mr. Abbruzzese is the Executive Sponsor of the Bank of Hawai‘i Blue Brigades Employee Resource Group for military veterans and allies and serves as Trustee of the McInerny Foundation which supports non-profits around the state of Hawai‘i.
Matthew K.M. Emerson
Mr. Emerson is Vice Chair of the Client Solutions Group. Ms. Crofts isand Chief Strategy Officer, a role he assumed in Q4 2023. He has been a member of the Company’s Executive Committee has responsibilities for Information Technology, Enterprise Operations, Digital Channels including online, mobilesince 2018. In his role, he works across the Company to refine and implement the ATM network, the Contact Center, Business Continuity and the Transformation Office. Company’s strategic plan.
The Committee discussed Ms. Crofts’Mr. Emerson’s contributions in his areas of responsibilities in 2023. As Chief Strategy Officer, he worked closely with the Deputy Chief Risk Officer to develop the Business Risk Executive program, an integral part of the Company’s risk management infrastructure. Prior to becoming the Chief Strategy Officer, Mr. Emerson oversaw Retail Lending and Deposits, which consists of Mortgage Banking, Consumer Direct and Indirect Lending, Consumer Deposits and Digital Banking. Under Mr. Emerson’s leadership, the Company for 2021. These included successfully managingexperienced stable Consumer Loan and Deposit balances despite the transitionchallenging environment of 2023. Mr. Emerson oversaw Consumer Deposit product and pricing strategy and partnered closely with The Private Bank and Branch Banking to a new Chief Information Officer in technology that will take the technology organization to the next level with a much stronger business partnership focus, and leading operational excellence efforts that have included process redesign and centralization, digitization and robotics process automation.deliver solid results. In addition, under Ms. Crofts’ leadership,Mr. Emerson is actively engaged with the digital team embarkedBank of Hawai‘i Foundation, and serves on transformational efforts for the online and mobile platform. Under newly hired leadership, the Contact Center beganboard of a dramatic transformational improvement which is critical in the current and future environment. The Business Continuity area also improved greatly and is better positioned to support the Companynumber of community organizations.
S. Bradley Shairson
Mr. Shairson serves as events occur. And lastly, the newly created Transformation Office undertook on supporting several enterprise-wide efforts that will reap many benefits for the Company in the future.
The Committee also discussed that much of the foundational efforts that were undertaken in 2021 by Ms. Crofts and her team have positioned us well for future success in 2022 and beyond.
50
James C. Polk
Mr. Polk is Vice Chair and Deputy Chief CommercialRisk Officer and is a member of the Company’sCompany's Executive Committee. Mr. Polk has responsibility forShairson joined the Company’s Commercial BankingCompany in May 2023.
Under Mr. Shairson’s leadership, the Company established a dynamic hedging program to create an effective and Wealth Management businesses,consistent approach to managing interest rate risk while balancing expected return with potential earnings and price volatility. Mr. Shairson also led initiatives to further build on the existing foundation in the areas of financial risk management including market, liquidity and capital risk, as well as its Corporate Real Estate Division, which managescorporate governance and maintains all of the Bank’s owned and leased real estate facilities.model risk management. Additionally, Mr. Polk was instrumental in co-leading the Company’s COVID-19 Planning and COVID-19 Re-emergence teams.
The Committee discussed Mr. Polk’s contributions to the Company in 2021 including his role in stepping into and leading the trust and investment businesses through a challenging and transitionary period. In addition to ensuring the Company met its key business and performance goals, Mr. Polk initiated multiple efforts to further enhance the risk management and sales disciplines within the business. Mr. Polk also led theShairson kicked off an effort to conduct a nationwide search, which culminateddrive greater automation and streamline processes to improve risk reporting and reach greater operational efficiency. During the year, he successfully recruited several key new staff members to assist in the hiring of new senior executive leadership to oversee Wealth Management.
In connection with his responsibilities for Corporate Real Estate, Mr. Polk led the team’s continued efforts to further enhance the Company’s ability to manage to the unique challenges presented by the ongoing pandemic environment with a priority focus on the safety and well-being of the Company’s employees and customers. This included a number of key initiatives including upgrading air filtration and fresh air circulation throughout the network. This was accomplished while completing the construction of the new Mililani and Kahala Branches, ensuring the timely closure of a number of in-store branches, completing the successful sale of the former Kalihi Branch and the sale and leaseback of the Hagatna Branch.
Mary E. Sellers
Ms. Sellers serves as the Vice Chair and Chief Risk Officer. In her role, she is responsible for the strategy to manage risk across the Company and is a member of the Company’s Executive Committee, as well as the Chair of the Risk Council, the Commercial and Retail Credit Policy Committees, the Capital and Liquidity Planning Committee, the Operational Risk Committee, the Employee Relations Committee, the Model Risk Committee and the Social Media Governance Committee. Areas reporting to her include Commercial and Retail Credit Administration and Approval, Special Assets, Credit Policy and Training, Enterprise Credit Analytics, Collections and Recovery, Enterprise Risk Management, Model Risk Management, Fiduciary Risk Management and Corporate Compliance.
The Committee noted Ms. Sellers’ diverse and complex areas of responsibilities in critical areas that touch virtually all performance segments of the Company. Specifically, the Committee discussed Ms. Sellers’ performance and accomplishments in 2021 and responsibilities which include ensuring the Company has the appropriate integrated enterprise risk framework and infrastructure to support its strategy and business operations while ensuring risk is managed in accordance with the Risk Appetite established by the Board of Directors. Ms. Sellers successfully led a number of initiatives in 2021. This included continued work with customers that received some form of payment relief or support due to the COVID-19 pandemic. Portfolio management efforts remained focused on managing for the potential impact or outcomes from the COVID-19 pandemic and associated capital planning. Asset quality metrics remained strong; net charge offs for the full year were 0.05% of total average loans and leases outstanding and non-performing assets as a percentage of total loans and leases and foreclosed real estate were 0.15% as of December 31, 2021. As the Company continued to support its customers, Ms. Sellers oversaw risk guidance on lending activities that resulted in quality loan growth of 6.3% in 2021, while also enhancing risk management routines across all lending areas to provide more timely decisions to customers.
The Committee further discussed Ms. Sellers’ success in continuing to refinestrengthening the Company’s risk management infrastructure to support the Company’s strategic objectives while concurrently addressingand provide sound oversight on emerging areas of risk focus. This included supporting expanded digital banking programs, new application platforms, dynamic product
52
Despite the strong individual performance of each NEO, and process enhancements,top quartile performance for both ROCE, equaling 79.5th percentile and new products. Ms. Sellers also continuedP/B ratio, equaling 91.8th percentile, market factors drove down the Company’s EPS year over year, resulting in a smaller overall bonus pool. In addition, further downward discretion was exercised to display strong leadership inalign the continued development of key staff members inother NEOs’ EIP payments with year-end financial results.
Accordingly, the Risk group and the successful recruitment of additional staffCommittee determined that it was appropriate to substantially reduce bonus payments from their 2022 levels to a level at or below target, except for leadership rolesMr. Shairson whose award was agreed to as part of ongoing succession planning. In addition, Ms. Sellers serves as the executive sponsor for the Company’s Women Inspired Employee Resource Group.his new hire arrangement.
The Committee approved the CEO and the other NEO EIP awards as follows:
Name |
| Annual Base |
| Target Annual |
| Final Incentive |
| Final Incentive |
|
Peter S. Ho |
| 885,800 |
| 100% |
| 68% |
| 600,000 |
|
Dean Y. Shigemura |
| 448,050 |
| 80% |
| 80% |
| 360,000 |
|
Marco A. Abbruzzese |
| 412,000 |
| 80% |
| 64% |
| 265,000 |
|
Matthew K.M. Emerson |
| 437,750 |
| 80% |
| 69% |
| 300,000 |
|
S. Bradley Shairson |
| 300,000 |
| 80% |
| 133% |
| 400,000 | 1 |
1 This amount was promised to Mr. Shairson as part of his new hire package. |
| ||||||||
Name |
| Annual Base Salary as of December 31, 2021 ($) |
|
| Target Annual Incentive |
|
| Final Incentive Payout (% of Annual Base Salary) |
|
| Final Incentive Award ($) |
| ||
Peter S. Ho |
|
| 860,000 |
|
| 100% |
|
| 250% |
|
|
| 2,150,000 |
|
Dean Y. Shigemura |
|
| 435,000 |
|
| 80% |
|
| 149% |
|
|
| 650,000 |
|
Sharon M. Crofts |
|
| 435,000 |
|
| 80% |
|
| 149% |
|
|
| 650,000 |
|
James C. Polk |
|
| 435,000 |
|
| 80% |
|
| 149% |
|
|
| 650,000 |
|
Mary E. Sellers |
|
| 436,000 |
|
| 80% |
|
| 149% |
|
|
| 650,000 |
|
51
20212023 Long-Term Incentive Compensation - Threshold, Target and Maximum Performance Levels
In setting the CEO'sCEO’s and other NEOs'NEOs’ long-term incentive compensation in 2023, the Committee considered, among other factors, Company performance, shareholder value creation, the competitive marketplace, the awards given in past years, peer group analysis and other market factors. In applying these factors, the Committee determined the number of performance sharesunits to be awarded under the 2021- 2023 long-term incentive plan to the CEO and other NEOs, as described in the Grants of Plan-Based Awards table on page 60.NEOs. The Company’s 2021- 2023 long-term incentive plan is 100% performance-based and awarded in the form of performance sharesunits with a three-year cliff vesting schedule. Separately, Mr. Shairson was granted a mixture of time- and performance-based equity awards as part of his new-hire package. All of these equity awards are further detailed in the Grants of Plan-Based Awards table on page 61.
The plan requires achievement of a three-year sustained performance period with performance metrics and hurdles as follows:
|
• Three-year plan • Three-year sustained performance period • Three-year cliff vesting • 100% quantitative performance metrics ◦ Two performance metrics set at challenging levels relative to peers* weighted as follows: ▪ Return-on-Common-Equity (50%); and ▪ Stock Price-to-Book Ratio (50%). • To achieve full payout, top quartile performance in Return-on-Common-Equity and Stock Price-to-Book Ratio must occur • To achieve any payout, top two quartile performance must occur with the actual payout determined by performance and metric weighting |
|
|
* S&P Supercomposite Regional Bank Index (excluding banks with assets > $50.0 billion) as of January 3, 2023
As indicated above, performance sharesunits awarded to the NEOs pursuant to the 20212023 long-term incentive plan require a three-year (2021-2023)(2023-2025) sustained performance period, with the three-year cliff vesting determined at the conclusion of the three-year performance period. The total vesting award is determined by the quartile performance achievement over the three-year performance period.
The Company has set a target award of 100% of the performance sharesunits to be awarded under the 2021- 2023 long-term incentive plan with a threshold or minimum award of 50% of target and maximum award of 100% of target. There is no opportunity to achieve more than 100%. To achieve any performance shareunit award, top two quartile performance must occur with the actual award determined by performance and metric weighting. Company performance below the third quartile of the quantitative performance measuresmedian results in forfeiture of the entire weighted opportunity for each of the performance measures. The period of restriction terminates based upon the level of achievement of the specified financial performance criteria, where the First Category SharesUnits are conditioned upon “Return-on-Common-Equity”, and the Second Category SharesUnits are conditioned upon “Stock Price-to-Book Ratio” (“Financial Performance Criteria”). In this regard, the Period of Restriction terminates with respect to the “Applicable Vesting Percentage” of the First Category Shares and Second Category Shares, as the case may be, based upon the Company’s achievement of the respective Financial Performance Criteria in accordance with the following schedule:
53
Return-on-Common-Equity and Stock Price-to-Book Ratio | |||||
Financial Performance Criteria --
| Applicable Vesting
| ||||
75th and Above (Maximum) | 100% | ||||
62.5th - 74.9th | 75% | ||||
50th - 62.49th | 50% | ||||
Below 50th | 0% | ||||
The terms “Return-on-Common-Equity” (generally defined as the net income available to common shareholders as a percent of average common equity, but as determined by the Committee) shall be measured as of December 31 of such year and “Stock Price-to-Book Ratio” shall be measured based on stock price as of December 31 and book value as of September 30 of such year, shall mean such terms as determined formeasured against the banks that comprise the S&P Supercomposite Regional Bank Index. With respect to the given Financial Performance Criteria, the “Three Year Average Percentile” shall mean the Company’s percentile level on the S&P Supercomposite Regional Bank Index for the average of the numerical measures over the three years 2021, 2022,2023, 2024, and 2023. The Financial Performance Criteria shall be determined based on references to measures and percentiles for the peer group banks2025 that comprise the January 4, 2021,3, 2023, S&P Supercomposite Regional Bank Index (with peer group banks determined by excluding banks with assets >$50B).
For 2021,2023, the Committee certified fourth (top) quartile performance for the Return-on-Common-Equity (ROCE 13.89, equaling 79.5th percentile) and Stock Price-to-Book Ratio metrics.
52
Compensatory Retention Arrangements of Certain Officers
The Company’s success largely depends on maintaining stability among its senior executives, both in terms of continuing the Company’s levels of high performance, as well as properly executing the Company’s well-defined succession planning objectives overseen by its Board. The Board’s governance of the process that creates an overlap of experience between the current executive team and the next generation of leadership provides the Company with the highest probability of maintaining long-term sustainable success.
Competition for bank executive expertise in the local marketplace is increasing, causing the Board to conclude in 2021 that additional efforts are necessary to retain the Company’s top talent. Accordingly, on March 26, 2021, the Human Resources & Compensation Committee of the Board approved a Select Executive Retention Program (the “Retention Program”) for the following named executive officers:
•Mary E. Sellers, Vice Chair and Chief Risk Officer;
•Sharon M. Crofts, Vice Chair and Client Solutions Group;
•James C. Polk, Vice Chair and Chief Commercial Officer; and
•Dean Y. Shigemura, Vice Chair and Chief Financial Officer.
The Retention Program consists of two plans: 1) a Special Retention Incentive Plan (“SRIP”) for Mmes. Sellers and Crofts; and 2) a Supplemental Restricted Stock Grant Program (“SRSGP”) for Messrs. Polk and Shigemura.
Ms. Sellers was granted a $4,500,000 performance-based award and Ms. Crofts was granted a $3,000,000 performance-based award. These awards will payout 50% in the form of cash and 50% in the form of restricted stock with vesting following a three-year performance period, pursuant to the Bank of Hawaii Corporation 2014 Stock and Incentive Plan (“2014 Stock and Incentive Plan”)(P/B ratio 2.43, equaling 91.8th percentile). For the award to vest, Mmes. Sellersthree-year period ending December 31, 2022, the Company’s average ROCE was 15.71 or the 95.9th percentile, and Crofts must remain employed withaverage P/B ratio was 2.48, also at the Company through March 29, 2024, and perform at “Meets Expectations” or better level.95.9th percentile, resulting in a 100% percent payout of LTI awards granted in 2020.
The final award amount will depend upon the Company's performance relative to regional bank comparators, as measured by the above described performance metrics over the three-year performance period of 2021-2023. Going forward, Mmes. Sellers and Crofts will not be eligible for future equity incentive awards.
Messrs. Polk and Shigemura were each granted a $1,000,000 performance-based award in the form of restricted stock with vesting following a five-year performance period, pursuant to the 2014 Stock and Incentive Plan. For the award to vest, Messrs. Polk and Shigemura must remain employed with the Company through March 31, 2026, and perform at “Meets Expectations” or better level.
The final award amounts will also depend upon the Company's performance relative to regional bank comparators, as measured by the above described performance metrics, over the five-year performance period of 2021-2026. Messrs. Polk and Shigemura will remain eligible for annual equity incentive awards as well as EIP payouts.
The Company believes that these awards will keep the named key executives in place for the foreseeable future and ensure a smooth transition to the next generation of leadership, all of which is critical to the continued success of the organization.
Benefits and Retirement Plans Sponsored by the Company
Executive officers are eligible to participate in health and insurance plans, retirement plans, and other benefits generally available to full-time employees. This is consistent with the Company’s belief in offering employees comprehensive health and retirement benefits that are competitive in our markets. The retirement programs assist employees in planning for their retirement income needs. Benefits under the qualified health and retirement plans are not directly tied to specific Company performance. Employees who meet service requirements are eligible to participate in the Company-sponsored Retirement Savings Plan (“RSP”), a tax-qualified defined contribution pension plan. Benefits are reviewed on a regular basis, and appropriate changes are made to ensure our program continues to be effective and competitive.
The Committee has adopted the Bank of HawaiiHawai‘i Corporation Executive Deferred Compensation Program (the “Deferred Compensation Program”), a program that offers senior management (including the NEOs) the ability to defer up to 80% of base salary and 100% of incentive amounts under the Executive Incentive Plan in order to allow executives to defer, along with the receipt of the compensation, the income tax liability on such payments (including any appreciation in value as a result of the deemed investment of such amounts) until receipt. This program allows participants to manage their cash flow and estate planning needs.
The Company also maintains the Bank of Hawaii Retirement Savings Excess Benefit Plan (the “Excess Benefit Plan”), a nonqualified supplemental retirement benefit plan that compensates participants for benefits that would otherwise be payable under the Company'sCompany’s Retirement Savings Plan but for certain Internal Revenue Code (“IRC”) limitations. The Committee believes that this plan is important to ensure equitability in retirement funding amounts between those that fall below and above the IRC limitations.
Gains from long-term incentive compensation are not included in the determination of nonqualified deferred compensation benefits.
53
Table of ContentsPerquisites
The Company offers and provides perquisites to NEOs that the Committee believes are competitive, yet reasonable in attracting and retaining a strong executive team. The Committee believes perquisites should be limited in scope and value.
Change-in-Control and Severance Arrangements
The Committee believes that an essential component to protecting and enhancing the best interests of the Company and its shareholders is to provide for the protection of its executive team in the event of a change-in-control of the Company. Change-in-control benefits play an important role in attracting and retaining key executives. The payment of such benefits ensures a smooth transition in management following a change-in-control by giving an executive the incentive to remain with the Company through the transition period, and, in the event the executive'sexecutive’s employment is terminated as part of the transition, by compensating the executive with a degree of financial and personal security during a period in which he or she is likely to be unemployed.
54
The Change-in-Control Retention Plan (the “Retention Plan”), provides benefits only in the event that a participant'sparticipant’s employment is terminated by the Company without cause or by the participant for “good reason” within 24 months following a change-in-control. The Committee believes that this encourages executives to remain with the Company upon a change-in-control. The key provisions of the Retention Plan for NEOs, including the CEO and vice chairs, are:
Severance benefit - a “two times base salary and bonus” payment which is payable in the month following termination of employment.
Payment for non-competition - an additional “one times base salary and bonus” payment that is payable only if the executive complies with the 12-month non-competition restrictions specified under the Retention Plan.
In addition to non-competition restrictions, the Retention Plan imposes non-disclosure, non-solicitation and non-disparagement restrictions on participants.
Each of the NEOs participates in the Retention Plan. See the discussion under “Change-in-Control, Termination, and Other Arrangements” on page 6364 for additional information.
The Retention Plan does not permit the Company to pay any tax gross up payments to executives in connection with any payment or benefit under the Plan. In addition, the Retention Plan limits any payment or benefit under the plan to an amount that would not be subject to Excise Tax even if the benefits would be substantially eliminated as a result of this limit.
Vesting of Equity Incentive Compensation on Change-in-Control (Double-Trigger)
The terms of the Company'sCompany’s 2014 Stock and Incentive Compensation Plan (as well as the 2024 Stock and Incentive Plan proposed herein) provide for full acceleration of vesting of restricted stock, restricted stock units, and stock options upon the occurrence of a change-in-control of the Company (as defined in the Retention Plan, which requires, among other things, a double-trigger termination for vesting to occur). The Committee believes that it is generally appropriate to fully vest equity and incentive-based awards to employees in a change-in-control transaction because such a transaction may often cut short or reduce the employee'semployee’s ability to realize value with respect to such awards. Similarly, the Executive Incentive Plan provides that incentive awards will, upon a change-in-control of the Company, be prorated as though the applicable performance period ended on the change-in-control date and will be calculated as an amount equal to two times a participant'sparticipant’s incentive allocation for the prorated performance period.
55
Other MattersMatters
The Committee believes that significant ownership of our common stock by our executives directly aligns their interest with those of our shareholders and also helps balance the incentives for risk-taking inherent in equity-based awards. Under the Company'sCompany’s executive stock ownership guidelines, the CEO must own Company common stock having a market value equal to at least five times base salary and vice chairs must own Company stock having a market value equal to at least two times base salary. Stock ownership includes the value of vested stock options, restricted stock, restricted stock units from qualified plans, and other stock held by the executive. The guidelines require the CEO to comply with the stock ownership levels within five years of the date hired or promoted to such position within the Company; for all other NEOs the attainment period is three years. As of December 31, 2021,2023, all of the NEOs satisfied the stock ownership guidelines.
Officer | Stockholding Guideline
| ||
Chairman and CEO | 5x | ||
Vice Chairs | 2x |
To the extent permitted by law, this policy requires the Company to reasonably promptly recover incentive-based compensation if the Human Resources & Compensation Committee determines that any bonus, incentive payment or equity-based compensation has beenit was erroneously awarded or received by an executive officer and that such compensation was based on any financial results or operating metrics that were satisfied as a result of such officer’s fraudulent or intentional illegal conduct, as defined by applicable law, then the Committee shall recover from the officer such compensation (in whole orAccounting Restatement. If this policy is triggered, in part) as it deems appropriate under the circumstances. In determining whether to recover such payment, the Committee shallwill take into account such considerations aswhatever it deemsconsiders appropriate, including whether the expense of recovering the recoverable amount would exceed the amount to be recovered after making a reasonable attempt of recovery or the assertion of a claim may violate applicable law or prejudicelaw. If the interestsHuman Resources & Compensation Committee determines either of these situations is present documentation must be provided to the Bank in any related proceeding or investigation. New York Stock Exchange.
Further, following a restatement of the Bank’sbank’s financial statements, on the recommendation of the AuditHuman Resources & Risk Committee, theCompensation Committee shall cause the Bank to recoverinstigate recovery of any compensation that is required to be recovered by Section 30410D-1 of the Sarbanes-OxleySecurities Exchange Act of 2002.1934.
Anti-Hedging and PledgingPledging Policies
The Company's Securities Trading Policy specifically prohibits directors and employees from hedging the risk associated with the ownership of Bank of Hawaii Corporation'sHawai‘i Corporation’s common stock. The Policy also prohibits directors and employees from pledging transactions involving Bank of HawaiiHawai‘i Corporation common stock as collateral, including the use of a traditional margin account with a broker-dealer. No officers or directors are parties to transactions involving the hedging or pledging of Company stock.
Tax ConsiderationsConsiderations
Section 162(m) of the Internal Revenue Code (“Section 162(m)”) generally disallows a tax deduction to a public corporation for compensation over $1,000,000 paid in any year to a company’s chief executive officer or other named executive officers. However, in the case of tax years commencing before 2018, the statute exempted qualifying performance-based compensation from the deduction limit if certain requirements were met. Section 162(m) was amended in December 2017 to eliminate the exemption for performance-based compensation (other than with respect to payments made pursuant to certain “grandfathered” arrangements entered into prior to November 2, 2017, that have not since been materially modified) and to expand the group of current and former executive officers who may be covered by the deduction limit under Section 162(m). To maintain flexibility in compensating executive officers, the Committee does not require all compensation to be awarded in a tax deductible manner and compensation payable to our executive officers may exceed the Section 162(m) deductible limit at times. However, it is the intent of the Committee that executive compensation be deductible under the provisions of Section 162(m) to the fullest extent possible and consistent with overall corporate goals. Approximately $11.9$8.7 million of compensation paid in 20212023 was not deductible by the Company pursuant to Section 162(m).
5556
The following table summarizes the total compensation paid to or earned by our named executive officers for each of the fiscal years indicated.
Name and Principal Position |
| Year |
| Salary |
| Bonus |
| Stock |
| Option |
| Non-Equity |
| Change in |
| All Other |
| Total |
Peter S. Ho |
| 2023 |
| 878,258 |
| — |
| 3,000,067 |
| — |
| 600,000 |
| 365 |
| 149,228 |
| 4,627,918 |
Chairman of the Board, |
| 2022 |
| 860,000 |
| — |
| 3,000,075 |
| — |
| 2,000,000 |
| — |
| 196,449 |
| 6,056,524 |
Chief Executive Officer |
| 2021 |
| 860,000 |
| — |
| 4,211,668 |
| — |
| 2,150,000 |
| — |
| 117,566 |
| 7,339,234 |
& President |
|
|
|
|
|
|
|
|
|
|
|
|
|
|
|
|
|
|
|
|
|
|
|
|
|
|
|
|
|
|
|
|
|
|
|
|
|
Dean Y. Shigemura |
| 2023 |
| 444,235 |
| — |
| 600,059 |
| — |
| 360,000 |
| — |
| 55,587 |
| 1,459,881 |
Vice Chair, |
| 2022 |
| 435,000 |
| — |
| 700,073 |
| — |
| 600,000 |
| — |
| 74,443 |
| 1,809,516 |
Chief Financial Officer |
| 2021 |
| 435,000 |
| — |
| 1,924,368 |
| — |
| 650,000 |
| — |
| 51,155 |
| 3,060,523 |
|
|
|
|
|
|
|
|
|
|
|
|
|
|
|
|
|
|
|
Marco A. Abbruzzese(5) |
| 2023 |
| 408,492 |
| — |
| 500,074 |
| — |
| 265,000 |
| — |
| 44,769 |
| 1,218,335 |
Vice Chair, |
| 2022 |
| 375,385 |
| 950,000 |
| 700,133 |
| — |
| 400,000 |
| — |
| 100,190 |
| 2,525,708 |
Senior Executive Director, |
| 2021 |
| — |
| — |
| — |
| — |
| — |
| — |
| — |
| — |
Wealth Management |
|
|
|
|
|
|
|
|
|
|
|
|
|
|
|
|
|
|
|
|
|
|
|
|
|
|
|
|
|
|
|
|
|
|
|
|
|
Matthew K.M. Emerson |
| 2023 |
| 434,023 |
| — |
| 500,074 |
| — |
| 300,000 |
| — |
| 47,054 |
| 1,281,151 |
Vice Chair, |
| 2022 |
| 405,271 |
| — |
| 300,069 |
| — |
| 400,000 |
| — |
| 52,659 |
| 1,157,999 |
Chief Strategy Officer |
| 2021 |
| 325,000 |
| — |
| 936,360 |
| — |
| 300,000 |
| — |
| 36,276 |
| 1,597,636 |
|
|
|
|
|
|
|
|
|
|
|
|
|
|
|
|
|
|
|
S. Bradley Shairson(6) |
| 2023 |
| 189,231 |
| 150,000 |
| 1,400,110 |
| — |
| 400,000 |
| — |
| 65,000 |
| 2,204,341 |
Vice Chair, |
| 2022 |
| — |
| — |
| — |
| — |
| — |
| — |
| — |
| — |
Deputy Chief Risk Officer |
| 2021 |
| — |
| — |
| — |
| — |
| — |
| — |
| — |
| — |
|
|
|
|
|
|
|
|
|
|
|
|
|
|
|
|
|
|
|
Name and Principal Position |
| Year |
| Salary ($)(1) |
|
| Bonus ($) |
|
| Stock Awards ($)(2) |
|
| Option Awards ($) |
|
| Non-Equity Incentive Plan Compensation ($)(3) |
|
| Change in Pension Value and Nonqualified Deferred Compensation Earnings ($)(4) |
|
| All Other Compensation ($)(5) |
|
| Total ($) |
| ||||||||
Peter S. Ho |
| 2021 |
|
| 860,000 |
|
|
| — |
|
|
| 4,211,668 |
|
|
| — |
|
|
| 2,150,000 |
|
|
| — |
|
|
| 117,566 |
|
|
| 7,339,234 |
|
Chairman of the Board, |
| 2020 |
|
| 850,173 |
|
|
| — |
|
|
| 2,500,060 |
|
|
| — |
|
|
| 711,563 |
|
|
| 2,855 |
|
|
| 183,841 |
|
|
| 4,248,492 |
|
Chief Executive Officer & |
| 2019 |
|
| 818,173 |
|
|
| — |
|
|
| 2,200,066 |
|
|
| — |
|
|
| 2,062,500 |
|
|
| 3,607 |
|
|
| 222,826 |
|
|
| 5,307,172 |
|
President |
|
|
|
|
|
|
|
|
|
|
|
|
|
|
|
|
|
|
|
|
|
|
|
|
|
|
|
|
|
|
|
|
|
|
|
|
|
|
|
|
|
|
|
|
|
|
|
|
|
|
|
|
|
|
|
|
|
|
|
|
|
|
|
|
|
|
|
|
|
Dean Y. Shigemura |
| 2021 |
|
| 435,000 |
|
|
| — |
|
|
| 1,924,368 |
|
|
| — |
|
|
| 650,000 |
|
|
| — |
|
|
| 51,155 |
|
|
| 3,060,523 |
|
Vice Chair, |
| 2020 |
|
| 425,173 |
|
|
| — |
|
|
| 700,013 |
|
|
| — |
|
|
| 224,250 |
|
|
| — |
|
|
| 70,376 |
|
|
| 1,419,812 |
|
Chief Financial Officer |
| 2019 |
|
| 393,173 |
|
|
| — |
|
|
| 500,075 |
|
|
| — |
|
|
| 650,000 |
|
|
| — |
|
|
| 75,329 |
|
|
| 1,618,577 |
|
|
|
|
|
|
|
|
|
|
|
|
|
|
|
|
|
|
|
|
|
|
|
|
|
|
|
|
|
|
|
|
|
|
|
|
Sharon M. Crofts |
| 2021 |
|
| 435,000 |
|
|
| — |
|
|
| 1,707,088 |
|
|
| — |
|
|
| 650,000 |
|
|
| — |
|
|
| 50,120 |
|
|
| 2,842,208 |
|
Vice Chair, |
| 2020 |
|
| 425,173 |
|
|
| — |
|
|
| 600,075 |
|
|
| — |
|
|
| 207,000 |
|
|
| — |
|
|
| 67,633 |
|
|
| 1,299,881 |
|
Client Solutions Group |
| 2019 |
|
| 393,173 |
|
|
| — |
|
|
| 475,043 |
|
|
| — |
|
|
| 600,000 |
|
|
| — |
|
|
| 71,842 |
|
|
| 1,540,058 |
|
|
|
|
|
|
|
|
|
|
|
|
|
|
|
|
|
|
|
|
|
|
|
|
|
|
|
|
|
|
|
|
|
|
|
|
James C. Polk |
| 2021 |
|
| 435,000 |
|
|
| — |
|
|
| 1,907,171 |
|
|
| — |
|
|
| 650,000 |
|
|
| — |
|
|
| 67,977 |
|
|
| 3,060,148 |
|
Vice Chair, |
| 2020 |
|
| 425,173 |
|
|
| — |
|
|
| 700,013 |
|
|
| — |
|
|
| 207,000 |
|
|
| — |
|
|
| 84,621 |
|
|
| 1,416,807 |
|
Chief Commercial Officer |
| 2019 |
|
| 388,258 |
|
|
| — |
|
|
| 500,075 |
|
|
| — |
|
|
| 600,000 |
|
|
| — |
|
|
| 89,635 |
|
|
| 1,577,968 |
|
|
|
|
|
|
|
|
|
|
|
|
|
|
|
|
|
|
|
|
|
|
|
|
|
|
|
|
|
|
|
|
|
|
|
|
Mary E. Sellers |
| 2021 |
|
| 436,000 |
|
|
| — |
|
|
| 2,474,341 |
|
|
| — |
|
|
| 650,000 |
|
|
| — |
|
|
| 51,216 |
|
|
| 3,611,557 |
|
Vice Chair, |
| 2020 |
|
| 436,000 |
|
|
| — |
|
|
| 700,013 |
|
|
| — |
|
|
| 224,250 |
|
|
| 7,021 |
|
|
| 70,970 |
|
|
| 1,438,254 |
|
Chief Risk Officer |
| 2019 |
|
| 436,000 |
|
|
| — |
|
|
| 500,075 |
|
|
| — |
|
|
| 650,000 |
|
|
| 8,231 |
|
|
| 81,824 |
|
|
| 1,676,130 |
|
|
|
|
|
|
|
|
|
|
|
|
|
|
|
|
|
|
|
|
|
|
|
|
|
|
|
|
|
|
|
|
|
|
|
|
|
|
|
|
|
|
|
|
The Company has not provided above-market or preferential earnings on any nonqualified deferred compensation and, accordingly, no such amounts are reflected in this column.
| (4) |
5657
The following table sets forth a breakdown of All Other Compensation paid to or earned by our NEOs for each of the fiscal years indicated.
Name |
| Year |
| Retirement |
| Value |
| Excess |
| Retirement |
| Excess Plan |
| Executive |
| Other |
| Total All |
Peter S. Ho |
| 2023 |
| 13,200 |
| 3,495 |
| 26,992 |
| — |
| — |
| 86,348 |
| 19,193 |
| 149,228 |
|
| 2022 |
| 12,200 |
| 8,347 |
| 74,028 |
| — |
| — |
| 90,300 |
| 11,574 |
| 196,449 |
|
| 2021 |
| 11,600 |
| 8,700 |
| 38,447 |
| 8,700 |
| 38,447 |
| — |
| 11,672 |
| 117,566 |
|
|
|
|
|
|
|
|
|
|
|
|
|
|
|
|
|
|
|
Dean Y. Shigemura |
| 2023 |
| 13,200 |
| 3,495 |
| 1,940 |
| — |
| — |
| 36,952 |
| — |
| 55,587 |
|
| 2022 |
| 12,200 |
| 8,347 |
| 3,238 |
| — |
| — |
| 50,658 |
| — |
| 74,443 |
|
| 2021 |
| 11,600 |
| 8,700 |
| 2,864 |
| 8,700 |
| 2,864 |
| 16,427 |
| — |
| 51,155 |
|
|
|
|
|
|
|
|
|
|
|
|
|
|
|
|
|
|
|
Marco A. Abbruzzese |
| 2023 |
| 13,200 |
| 3,495 |
| 4,742 |
| — |
| — |
| 23,332 |
| — |
| 44,769 |
|
| 2022 |
| — |
| — |
| — |
| — |
| — |
| — |
| 100,190 |
| 100,190 |
|
| 2021 |
| — |
| — |
| — |
| — |
| — |
| — |
| — |
| — |
|
|
|
|
|
|
|
|
|
|
|
|
|
|
|
|
|
|
|
Matthew K.M. Emerson |
| 2023 |
| 13,200 |
| 3,495 |
| 4,915 |
| — |
| — |
| 25,444 |
| — |
| 47,054 |
|
| 2022 |
| 12,200 |
| 8,347 |
| 10,133 |
| — |
| — |
| 21,979 |
| — |
| 52,659 |
|
| 2021 |
| 11,600 |
| 8,700 |
| 3,638 |
| 8,700 |
| 3,638 |
| — |
| — |
| 36,276 |
|
|
|
|
|
|
|
|
|
|
|
|
|
|
|
|
|
|
|
S. Bradley Shairson |
| 2023 |
| — |
| — |
| — |
| — |
| — |
| — |
| 65,000 |
| 65,000 |
|
| 2022 |
| — |
| — |
| — |
| — |
| — |
| — |
| — |
| — |
|
| 2021 |
| — |
| — |
| — |
| — |
| — |
| — |
| — |
| — |
|
|
|
|
|
|
|
|
|
|
|
|
|
|
|
|
|
|
|
Name |
| Year |
| Retirement Savings Plan 401(k) Matching Contribution ($)(1) |
|
| Value Sharing Funding ($)(2) |
|
| Excess Plan Value Sharing Funding ($)(3) |
|
| Retirement Savings Plan Company Fixed Contribution ($)(4) |
|
| Excess Plan Company Fixed Contribution ($)(5) |
|
| Executive Deferred Compensation Restoration Contribution ($) (6) |
|
| Other Compensation ($)(7) |
|
| Total All Other Compensation ($) |
| ||||||||
Peter S. Ho |
| 2021 |
|
| 11,600 |
|
|
| 8,700 |
|
|
| 38,447 |
|
|
| 8,700 |
|
|
| 38,447 |
|
|
| — |
|
|
| 11,672 |
|
|
| 117,566 |
|
|
| 2020 |
|
| 11,400 |
|
|
| 7,083 |
|
|
| 39,676 |
|
|
| 8,550 |
|
|
| 47,893 |
|
|
| 56,567 |
|
|
| 12,672 |
|
|
| 183,841 |
|
|
| 2019 |
|
| 11,200 |
|
|
| 10,580 |
|
|
| 95,907 |
|
|
| 8,400 |
|
|
| 76,145 |
|
|
| — |
|
|
| 20,594 |
|
|
| 222,826 |
|
|
|
|
|
|
|
|
|
|
|
|
|
|
|
|
|
|
|
|
|
|
|
|
|
|
|
|
|
|
|
|
|
|
|
|
Dean Y. Shigemura |
| 2021 |
|
| 11,600 |
|
|
| 8,700 |
|
|
| 2,864 |
|
|
| 8,700 |
|
|
| 2,864 |
|
|
| 16,427 |
|
|
| — |
|
|
| 51,155 |
|
|
| 2020 |
|
| 11,400 |
|
|
| 7,083 |
|
|
| 5,705 |
|
|
| 8,550 |
|
|
| 6,886 |
|
|
| 30,752 |
|
|
| — |
|
|
| 70,376 |
|
|
| 2019 |
|
| 11,200 |
|
|
| 10,580 |
|
|
| 8,579 |
|
|
| 8,400 |
|
|
| 6,811 |
|
|
| 29,759 |
|
|
| — |
|
|
| 75,329 |
|
|
|
|
|
|
|
|
|
|
|
|
|
|
|
|
|
|
|
|
|
|
|
|
|
|
|
|
|
|
|
|
|
|
|
|
Sharon M. Crofts |
| 2021 |
|
| 11,600 |
|
|
| 8,700 |
|
|
| 6,834 |
|
|
| 8,700 |
|
|
| 6,834 |
|
|
| 7,452 |
|
|
| — |
|
|
| 50,120 |
|
|
| 2020 |
|
| 11,400 |
|
|
| 7,083 |
|
|
| 9,402 |
|
|
| 8,550 |
|
|
| 11,350 |
|
|
| 19,848 |
|
|
| — |
|
|
| 67,633 |
|
|
| 2019 |
|
| 11,200 |
|
|
| 10,580 |
|
|
| 13,840 |
|
|
| 8,400 |
|
|
| 10,988 |
|
|
| 16,834 |
|
|
| — |
|
|
| 71,842 |
|
|
|
|
|
|
|
|
|
|
|
|
|
|
|
|
|
|
|
|
|
|
|
|
|
|
|
|
|
|
|
|
|
|
|
|
James C. Polk |
| 2021 |
|
| 11,600 |
|
|
| 8,700 |
|
|
| 3,599 |
|
|
| 8,700 |
|
|
| 3,599 |
|
|
| 13,922 |
|
|
| 17,857 |
|
|
| 67,977 |
|
|
| 2020 |
|
| 11,400 |
|
|
| 7,083 |
|
|
| 13,367 |
|
|
| 8,550 |
|
|
| 16,136 |
|
|
| 11,097 |
|
|
| 16,988 |
|
|
| 84,621 |
|
|
| 2019 |
|
| 11,200 |
|
|
| 10,580 |
|
|
| 18,876 |
|
|
| 8,400 |
|
|
| 14,986 |
|
|
| 7,630 |
|
|
| 17,963 |
|
|
| 89,635 |
|
|
|
|
|
|
|
|
|
|
|
|
|
|
|
|
|
|
|
|
|
|
|
|
|
|
|
|
|
|
|
|
|
|
|
|
Mary E. Sellers |
| 2021 |
|
| 11,600 |
|
|
| 8,700 |
|
|
| 11,108 |
|
|
| 8,700 |
|
|
| 11,108 |
|
|
| — |
|
|
| — |
|
|
| 51,216 |
|
|
| 2020 |
|
| 11,400 |
|
|
| 7,083 |
|
|
| 19,782 |
|
|
| 8,550 |
|
|
| 23,879 |
|
|
| 276 |
|
|
| — |
|
|
| 70,970 |
|
|
| 2019 |
|
| 11,200 |
|
|
| 10,580 |
|
|
| 23,592 |
|
|
| 8,400 |
|
|
| 18,731 |
|
|
| 9,321 |
|
|
| — |
|
|
| 81,824 |
|
|
|
|
|
|
|
|
|
|
|
|
|
|
|
|
|
|
|
|
|
|
|
|
|
|
|
|
|
|
|
|
|
|
|
|
|
|
|
|
|
|
|
|
|
|
|
|
|
|
5758
NONQUALIFIED DEFERRED COMPENSATION
Executive Deferred Compensation Program
The Company’s Executive Deferred Compensation Program (the “Deferred Compensation Program”) is a nonqualified deferred compensation plan that allows senior management (including the named executive officers) to defer up to 80% of their base salary earned for a specified year through the Executive Base Salary Deferral Plan (the “Salary Deferral Plan”), and to defer up to 100% of incentive payments under the Executive Incentive Plan. Messrs. Polk,Emerson and Shigemura and Ms. Crofts deferred part of their 20212023 base salary and/or 20212023 Executive Incentive Plan payout under the Deferred Compensation Program.
For each Plan Year beginning in 2012, with respect to the deferred amount, a Deferred Compensation Program participant who is eligible for the Company Fixed Contribution and discretionary Value Sharing Contribution under the Company’s qualified retirement plan, the Bank of Hawaii Retirement Savings Plan (“Retirement Savings Plan”), will receive an amount, referred to as “Restoration Contribution,” equal to the sum of: (a) the “Fixed Contribution Percentage” as described in the Retirement Savings Plan for the immediately preceding Plan Year multiplied by the Elective Deferral Amount; plus (b) the “Value Sharing Allocation Percentage” as determined by the Company for purposes of the Retirement Savings Plan for the immediately preceding Plan Year multiplied by the Elective Deferral Amount. For plan years 2022 and 2023, a Special Fixed Bonus was paid in lieu of the Company Fixed Contribution to the RSP and the Excess Benefit Plan. The Special Fixed Bonus was contributed to the participant’s Executive Base Salary Deferral Plan account.
A participant is always 100% vested in his or her deferred amounts. Deferred amounts under the Deferred Compensation Program are subject to adjustment for appreciation or depreciation in value based on hypothetical investments in one or more investment funds or vehicles permitted by the Committee and chosen by the participant. A participant’s deferred amounts are generally payable beginning on the earliest to occur of the following: (a) a specified time chosen by the participant, or if none, the date that is six months following a separation from service, (b) the participant’s death, (c) the participant’s disability or (d) an “unforeseeable emergency” (generally, a severe financial hardship resulting from the illness of the participant or his or her spouse or dependent, or other extraordinary and unforeseeable circumstances arising from events beyond the control of the participant). Distributions in the event of an unforeseeable emergency are subject to restrictions and are limited to an amount that is reasonably necessary to satisfy the emergency need. For distributions upon a separation from service or at a specified time chosen by a participant, the participant may choose to receive deferred amounts as a lump sum cash payment or in annual installments over a period not to exceed five years. The amount of each installment will be calculated using the “declining balance method,” under which each installment payment is determined by dividing a participant’s aggregate unpaid balance by the remaining years in the payment period. For distributions resulting from all other events, payment will be made as a lump sum cash payment.
The Company'sCompany’s obligations with respect to deferred amounts under the Salary Deferral Plan and the Executive Incentive Plan are payable from its general assets, although the Company has established a rabbi trust to assist it in meeting its liabilities under the plans. The assets of the trust are at all times subject to the claims of the Company’s general creditors.
Retirement Savings Excess Benefit Plan
The Retirement Savings Excess Benefit Plan (the “Excess Benefit Plan”) is a nonqualified supplemental retirement benefits plan that compensates participants for the amount of benefits that would otherwise be payable under the Company’s Retirement Savings Plan but for limitations under Internal Revenue Code Sections 415 and 401(a)(17) as to the amount of annual contributions to, and annual benefits payable under, the Retirement Savings Plan. A participant’s accrued benefits under the Excess Benefit Plan are hypothetically invested in one or more funds permitted by the Plan and chosen by the participant, and are adjusted for appreciation or depreciation in value attributable to such hypothetical investments.
For an individual who became a participant in the Excess Benefit Plan after May 19, 2006, the plan provides that benefits are payable upon a separation from service according to a distribution schedule that is determined by reference to the total amount accrued for the individual under the plan. A participant with:
$100,000 or less in deferred amounts will receive a lump sum payment six months after separation from service;
more than $100,000 but no more than $300,000 in deferred amounts will receive distributions in two installments;
more than $300,000 but no more than $500,000 in deferred amounts will receive distributions in three installments; and
more than $500,000 in deferred amounts will receive distributions in five installments.
59
In each case, the first installment will be paid on the first day of the seventh month following separation from service and subsequent installments will be paid in each subsequent January. An individual who first became a participant in the Excess Benefit Plan on or prior to May 19, 2006 will receive benefits upon the participant’s separation from service and may have elected to be paid as follows: (a) according to the distribution schedule applicable to individuals who become participants after May 19, 2006, (b) in a lump sum on the first day of the seventh month following separation from service, or (c) in annual installments (not to exceed five) commencing on the first day of the seventh month following separation from service or commencing on an anniversary of the participant’s separation from service (not later than the fifth anniversary). The amount of each installment will be calculated using the declining balance method. If a participant dies prior to the full distribution of his or her deferred amounts, any unpaid amounts remaining will be distributed in a lump sum to the participant's beneficiary.
58
The Company’s obligations under the Excess Benefit Plan are payable from its general assets, although the Company has established a rabbi trust to assist it in meeting its liabilities under the plan. The assets of the trust are at all times subject to the claims of the Company’s general creditors.
Set forth below is information regarding the amounts deferred by or for the benefit of the named executive officers in 2021.2023.
NONQUALIFIED DEFERRED COMPENSATION TABLE
Name |
| Executive |
|
| Registrant |
|
| Aggregate |
|
| Aggregate |
|
| Aggregate |
| |||||
Peter S. Ho |
|
| — |
|
|
| 113,340 |
|
|
| 260,610 |
|
|
| — |
|
|
| 2,996,001 |
|
Dean Y. Shigemura |
|
| 531,059 |
|
|
| 38,892 |
|
|
| 607,948 |
|
|
| — |
|
|
| 5,343,131 |
|
Marco A. Abbruzzese |
|
| — |
|
|
| 28,074 |
|
|
| — |
|
|
| — |
|
|
| — |
|
Matthew K.M. Emerson |
|
| 40,000 |
|
|
| 30,359 |
|
|
| 10,079 |
|
|
| — |
|
|
| 159,597 |
|
S. Bradley Shairson |
|
| — |
|
|
| — |
|
|
| — |
|
|
| — |
|
|
| — |
|
Name |
| Executive Contributions in 2021 ($)(1) |
|
| Registrant Contributions in 2021 ($)(2) |
|
| Aggregate Earnings in 2021 ($) |
|
| Aggregate Withdrawals or Distributions in 2021 ($) |
|
| Aggregate Balance at December 31, 2021 ($)(3) |
| |||||
Peter S. Ho |
|
| — |
|
|
| 76,894 |
|
|
| 25,588 |
|
|
| — |
|
|
| 2,655,334 |
|
Dean Y. Shigemura |
|
| 273,785 |
|
|
| 22,155 |
|
|
| 366,593 |
|
|
| — |
|
|
| 4,171,928 |
|
Sharon M. Crofts |
|
| 124,200 |
|
|
| 21,120 |
|
|
| 278,622 |
|
|
| — |
|
|
| 2,497,822 |
|
James C. Polk |
|
| 232,026 |
|
|
| 21,120 |
|
|
| 1,525 |
|
|
| 102,986 |
|
|
| 999,737 |
|
Mary E. Sellers |
|
| — |
|
|
| 22,215 |
|
|
| 165,375 |
|
|
| — |
|
|
| 1,798,091 |
|
Name of Fund | Rate of Return |
|
| Name of Fund | Rate of Return |
|
| ||
Vanguard 500 Index Inv |
| 26.11 | % |
| Vanguard Target Retirement 2035 Fund |
| 17.14 | % |
|
Vanguard Emerging Markets Stock Index |
| 9.03 | % |
| Vanguard Target Retirement 2040 Fund |
| 18.33 | % |
|
Vanguard Explorer Inv |
| 19.78 | % |
| Vanguard Target Retirement 2045 Fund |
| 19.48 | % |
|
Vanguard Federal Money Market Investor |
| 5.09 | % |
| Vanguard Target Retirement 2050 Fund |
| 20.16 | % |
|
Vanguard High-Yield Corporate Inv |
| 11.62 | % |
| Vanguard Target Retirement 2055 Fund |
| 20.15 | % |
|
Vanguard International Growth Inv |
| 14.66 | % |
| Vanguard Target Retirement 2060 Fund |
| 20.18 | % |
|
Vanguard Mid Cap Growth Inv |
| 24.07 | % |
| Vanguard Target Retirement 2065 Fund |
| 20.14 | % |
|
Vanguard Mid Cap Index Inv |
| 15.83 | % |
| Vanguard Target Retirement 2070 Fund |
| 20.24 | % |
|
Vanguard Selected Value Inv |
| 25.33 | % |
| Vanguard Target Retirement Income Fund |
| 10.65 | % |
|
Vanguard Short-Term Federal Fund Investor Shares |
| 3.80 | % |
| Vanguard Total Bond Market Index Inv |
| 5.59 | % |
|
Vanguard Small Cap Index Inv |
| 18.05 | % |
| Vanguard US Growth Inv |
| 45.16 | % |
|
Vanguard Target Retirement 2020 Fund |
| 12.51 | % |
| Vanguard Wellington Inv |
| 14.30 | % |
|
Vanguard Target Retirement 2025 Fund |
| 14.54 | % |
| Vanguard Windsor Fund Investor Shares |
| 14.92 | % |
|
Vanguard Target Retirement 2030 Fund |
| 15.60 | % |
|
|
|
|
| |
|
|
Name of Fund |
| Rate of Return |
|
|
| Name of Fund |
| Rate of Return |
|
| ||
Vanguard 500 Index Inv |
|
| 28.54 | % |
|
| Vanguard Target Retirement 2030 Fund |
|
| 11.38 | % |
|
Vanguard Emerging Markets Stock Index |
|
| 0.73 | % |
|
| Vanguard Target Retirement 2035 Fund |
|
| 12.96 | % |
|
Vanguard Explorer Inv |
|
| 16.26 | % |
|
| Vanguard Target Retirement 2040 Fund |
|
| 14.56 | % |
|
Vanguard Federal Money Market Investor |
|
| 0.01 | % |
|
| Vanguard Target Retirement 2045 Fund |
|
| 16.16 | % |
|
Vanguard High-Yield Corporate Inv |
|
| 3.68 | % |
|
| Vanguard Target Retirement 2050 Fund |
|
| 16.41 | % |
|
Vanguard International Growth Inv |
|
| (0.85 | )% |
|
| Vanguard Target Retirement 2055 Fund |
|
| 16.44 | % |
|
Vanguard Mid Cap Growth Inv |
|
| 9.77 | % |
|
| Vanguard Target Retirement 2060 Fund |
|
| 16.44 | % |
|
Vanguard Mid Cap Index Inv |
|
| 24.36 | % |
|
| Vanguard Target Retirement 2065 Fund |
|
| 16.46 | % |
|
Vanguard Selected Value Inv |
|
| 27.75 | % |
|
| Vanguard Target Retirement Income Fund |
|
| 5.25 | % |
|
Vanguard Short-Term Federal Fund Investor Shares |
|
| (0.58 | )% |
|
| Vanguard Total Bond Market Index Inv |
|
| (1.77 | )% |
|
Vanguard Small Cap Index Inv |
|
| 17.59 | % |
|
| Vanguard US Growth Inv |
|
| 12.34 | % |
|
Vanguard Target Retirement 2015 Fund |
|
| 5.78 | % |
|
| Vanguard Wellington Inv |
|
| 19.01 | % |
|
Vanguard Target Retirement 2020 Fund |
|
| 8.17 | % |
|
| Vanguard Windsor Fund Investor Shares |
|
| 27.98 | % |
|
Vanguard Target Retirement 2025 Fund |
|
| 9.80 | % |
|
|
|
|
|
|
|
|
|
|
|
|
60
GRANTS OF PLAN-BASEDPLAN-BASED AWARDS
The following table summarizes the equity-based awards granted in 20212023 to the named executive officers in the Summary Compensation Table.
|
|
|
| Estimated Future Payouts |
| Estimated Future Payouts |
| All Other |
| All Other |
| Exercise |
| Grant |
| ||||||||||||||||||
Name |
| Type of | Grant | Threshold |
| Target |
| Maximum |
| Threshold |
| Target |
| Maximum |
| Stock or |
| Securities |
| Option |
| Option |
| ||||||||||
Peter S. Ho | (5) | PSU | 2/24/2023 |
| — |
|
| — |
|
| — |
|
| — |
|
| 39,937 |
|
| 39,937 |
|
| — |
|
| — |
|
| — |
|
| 3,000,067 |
|
|
|
|
|
|
|
|
|
|
|
|
|
|
|
|
|
|
|
|
|
|
|
|
| ||||||||||
Dean Y. Shigemura | (5) | PSU | 2/24/2023 |
| — |
|
| — |
|
| — |
|
| — |
|
| 7,988 |
|
| 7,988 |
|
| — |
|
| — |
|
| — |
|
| 600,059 |
|
|
|
|
|
|
|
|
|
|
|
|
|
|
|
|
|
|
|
|
|
|
|
|
| ||||||||||
Marco A. Abbruzzese | (5) | PSU | 2/24/2023 |
| — |
|
| — |
|
| — |
|
| — |
|
| 6,657 |
|
| 6,657 |
|
| — |
|
| — |
|
| — |
|
| 500,074 |
|
|
|
|
|
|
|
|
|
|
|
|
|
|
|
|
|
|
|
|
|
|
|
|
| ||||||||||
Matthew K.M. Emerson | (5) | PSU | 2/24/2023 |
| — |
|
| — |
|
| — |
|
| — |
|
| 6,657 |
|
| 6,657 |
|
| — |
|
| — |
|
| — |
|
| 500,074 |
|
|
|
|
|
|
|
|
|
|
|
|
|
|
|
|
|
|
|
|
|
|
|
|
| ||||||||||
S. Bradley Shairson | (2) | PSG | 5/1/2023 |
| — |
|
| — |
|
| — |
|
| — |
|
| 10,461 |
|
| 10,461 |
|
| — |
|
| — |
|
| — |
|
| 500,036 |
|
| (3) | RSG | 5/1/2023 |
| — |
|
| — |
|
| — |
|
| — |
|
| — |
|
| — |
|
| 10,461 |
|
| — |
|
| — |
|
| 500,036 |
|
| (4) | RSG | 5/1/2023 |
| — |
|
| — |
|
| — |
|
| — |
|
| — |
|
| — |
|
| 8,369 |
|
| — |
|
| — |
|
| 400,038 |
|
|
|
|
|
|
|
| Estimated Future Payouts Under Non-Equity Incentive Plan Awards |
|
| Estimated Future Payouts Under Equity Incentive Plan Awards |
|
| All Other Stock Awards; Number of Shares of |
|
| All Other Option Awards: Number of |
|
| Exercise or Base Price of |
|
| Grant Date Fair Value of Stock and |
| |||||||||||||||||||||||
Name |
|
|
| Type of Award (1) |
| Grant Date |
| Threshold ($) |
|
| Target ($) |
|
| Maximum ($) |
|
| Threshold (#) |
|
| Target (#) |
|
| Maximum (#) |
|
| Stock or Units (#) |
|
| Securities Underlying Options(#) |
|
| Option Awards ($/Share) |
|
| Option Awards ($) |
| ||||||||||
Peter S. Ho |
| (2) |
| PSG |
| 2/19/2021 |
|
| — |
|
|
| — |
|
|
| — |
|
|
| — |
|
|
| 39,282 |
|
|
| 39,282 |
|
|
| — |
|
|
| — |
|
|
| — |
|
|
| 3,500,026 |
|
|
| (3) |
| RSG |
| 2/19/2021 |
|
| — |
|
|
| — |
|
|
| — |
|
|
| — |
|
|
| — |
|
|
| — |
|
|
| 7,987 |
|
|
| — |
|
|
| — |
|
|
| 711,642 |
|
|
|
|
|
|
|
|
|
|
|
|
|
|
|
|
|
|
|
|
|
|
|
|
|
|
|
|
|
|
|
|
|
|
|
|
|
|
|
|
|
|
|
|
|
|
|
|
Dean Y. Shigemura |
| (2) |
| PSG |
| 2/19/2021 |
|
| — |
|
|
| — |
|
|
| — |
|
|
| — |
|
|
| 7,857 |
|
|
| 7,857 |
|
|
| — |
|
|
| — |
|
|
| — |
|
|
| 700,059 |
|
|
| (3) |
| RSG |
| 2/19/2021 |
|
| — |
|
|
| — |
|
|
| — |
|
|
| — |
|
|
| — |
|
|
| — |
|
|
| 2,517 |
|
|
| — |
|
|
| — |
|
|
| 224,265 |
|
|
| (4) |
| SRSG |
| 3/26/2021 |
|
| — |
|
|
| — |
|
|
| — |
|
|
| — |
|
|
| 10,737 |
|
|
| 10,737 |
|
|
| — |
|
|
| — |
|
|
| — |
|
|
| 1,000,044 |
|
|
|
|
|
|
|
|
|
|
|
|
|
|
|
|
|
|
|
|
|
|
|
|
|
|
|
|
|
|
|
|
|
|
|
|
|
|
|
|
|
|
|
|
|
|
|
|
James C. Polk |
| (2) |
| RSG |
| 2/19/2021 |
|
| — |
|
|
| — |
|
|
| — |
|
|
| — |
|
|
| 7,857 |
|
|
| 7,857 |
|
|
| — |
|
|
| — |
|
|
| — |
|
|
| 700,059 |
|
|
| (3) |
| RSG |
| 2/19/2021 |
|
| — |
|
|
| — |
|
|
| — |
|
|
| — |
|
|
| — |
|
|
| — |
|
|
| 2,324 |
|
|
| — |
|
|
| — |
|
|
| 207,068 |
|
|
| (4) |
| SRSG |
| 3/26/2021 |
|
| — |
|
|
| — |
|
|
| — |
|
|
| — |
|
|
| 10,737 |
|
|
| 10,737 |
|
|
| — |
|
|
| — |
|
|
| — |
|
|
| 1,000,044 |
|
|
|
|
|
|
|
|
|
|
|
|
|
|
|
|
|
|
|
|
|
|
|
|
|
|
|
|
|
|
|
|
|
|
|
|
|
|
|
|
|
|
|
|
|
|
|
|
Sharon M. Crofts |
| (2) |
| RSG |
| 2/19/2021 |
|
| — |
|
|
| — |
|
|
| — |
|
|
| — |
|
|
| — |
|
|
| — |
|
|
| 2,324 |
|
|
| — |
|
|
| — |
|
|
| 207,068 |
|
|
| (5) |
| SRIG |
| 3/26/2021 |
|
| — |
|
|
| 1,500,000 |
|
|
| — |
|
|
| — |
|
|
| 16,105 |
|
|
| 16,105 |
|
|
| — |
|
|
| — |
|
|
| — |
|
|
| 1,500,020 |
|
|
|
|
|
|
|
|
|
|
|
|
|
|
|
|
|
|
|
|
|
|
|
|
|
|
|
|
|
|
|
|
|
|
|
|
|
|
|
|
|
|
|
|
|
|
|
|
Mary E. Sellers |
| (2) |
| RSG |
| 2/19/2021 |
|
| — |
|
|
| — |
|
|
| — |
|
|
| — |
|
|
| — |
|
|
| — |
|
|
| 2,517 |
|
|
| — |
|
|
| — |
|
|
| 224,265 |
|
|
| (5) |
| SRIG |
| 3/26/2021 |
|
| — |
|
|
| 2,250,000 |
|
|
| — |
|
|
| — |
|
|
| 24,158 |
|
|
| 24,158 |
|
|
| — |
|
|
| — |
|
|
| — |
|
|
| 2,250,076 |
|
PSG - Performance-Based Restricted Stock Grant
|
|
RSG - Service-Based Restricted Stock Grant
SRSGPSU - Performance-Based Supplemental Restricted Stock Unit Grant
SRIG - Performance-Based Special Retention Incentive Plan Grant
61 |
|
|
|
|
|
|
|
60
The following table presents a summary of unexercised stock options and restricted stock and unit awards held as of December 31, 2021,2023, by the named executive officers in the Summary Compensation Table.
|
| Option Awards |
| Stock Awards | ||||||||||||||
Name |
| Number of |
| Number of |
| Equity |
| Option |
| Option |
| Number of |
| Market |
| Equity |
| Equity |
Peter S. Ho |
| — |
| — |
| — |
| — |
| — |
| — |
| — |
| 39,282 | (1) | 2,846,374 |
|
| — |
| — |
| — |
| — |
| — |
| 2,663 | (2) | 192,961 |
| — |
| — |
|
| — |
| — |
| — |
| — |
| — |
| — |
| — |
| 34,373 | (3) | 2,490,668 |
|
| — |
| — |
| — |
| — |
| — |
| — |
| — |
| 39,937 | (4) | 2,893,835 |
Dean Y. Shigemura |
| — |
| — |
| — |
| — |
| — |
| — |
| — |
| 7,857 | (1) | 569,318 |
|
| — |
| — |
| — |
| — |
| — |
| 839 | (2) | 60,794 |
| — |
| — |
|
| — |
| — |
| — |
| — |
| — |
| — |
| — |
| 8,021 | (3) | 581,202 |
|
| — |
| — |
| — |
| — |
| — |
| — |
| — |
| 7,988 | (4) | 578,810 |
|
| — |
| — |
| — |
| — |
| — |
| — |
| — |
| 10,737 | (5) | 778,003 |
Marco A. Abbruzzese |
| — |
| — |
| — |
| — |
| — |
| 1,650 | (10) | 119,559 |
| — |
| — |
|
| — |
| — |
| — |
| — |
| — |
| 4,399 | (11) | 318,752 |
| — |
| — |
|
| — |
| — |
| — |
| — |
| — |
| — |
| — |
| 6,657 | (4) | 482,366 |
Matthew K.M. Emerson |
| — |
| — |
| — |
| — |
| — |
| — |
| — |
| 2,806 | (1) | 203,323 |
|
| — |
| — |
| — |
| — |
| — |
| 323 | (2) | 23,405 |
|
|
| — |
|
| — |
| — |
| — |
| — |
| — |
| 402 | (6) | 29,129 |
|
|
| — |
|
| — |
| — |
| — |
| — |
| — |
| — |
| — |
| 3,438 | (3) | 249,117 |
|
| — |
| — |
| — |
| — |
| — |
| — |
| — |
| 6,657 | (4) | 482,366 |
|
| — |
| — |
| — |
| — |
| — |
| — |
| — |
| 6,442 | (5) | 466,787 |
S. Bradley Shairson |
| — |
| — |
| — |
| — |
| — |
| 8,369 | (7) | 606,418 |
| — |
| — |
|
| — |
| — |
| — |
| — |
| — |
| 10,461 | (8) | 758,004 |
| — |
| — |
|
| — |
| — |
| — |
| — |
| — |
| — |
| — |
| 10,461 | (9) | 758,004 |
|
| Option Awards |
|
| Stock Awards |
| ||||||||||||||||||||||||||||||||
Name |
| Number of Securities Underlying Unexercised Options Exercisable (#) |
|
| Number of Securities Underlying Unexercised Options Unexercisable (#) |
|
| Equity Incentive Plan Awards: Number of Securities Underlying Unexercised Unearned Options (#) |
|
| Option Exercise Price ($) |
|
| Option Expiration Date |
|
| Number of Shares or Units of Stock That Have Not Vested (#) |
|
| Market Value of Shares or Units of Stock That Have Not Vested ($) |
|
| Equity Incentive Plan Awards: Number of Unearned Shares, Units or Other Rights That Have Not Vested (#) |
|
|
|
| Equity Incentive Plan Awards: Market or Payout Value of Unearned Shares, Units or Other Rights That Have Not Vested ($)(4) |
| |||||||||
Peter S. Ho |
|
| — |
|
|
| — |
|
|
| — |
|
|
| — |
|
|
| — |
|
|
| — |
|
|
| — |
|
|
| 26,542 |
|
| (1) |
|
| 2,223,158 |
|
|
|
| — |
|
|
| — |
|
|
| — |
|
|
| — |
|
|
| — |
|
|
| — |
|
|
| — |
|
|
| 27,943 |
|
| (2) |
|
| 2,340,506 |
|
|
|
| — |
|
|
| — |
|
|
| — |
|
|
| — |
|
|
| — |
|
|
| — |
|
|
| — |
|
|
| 39,282 |
|
| (3) |
|
| 3,290,260 |
|
|
|
| — |
|
|
| — |
|
|
| — |
|
|
| — |
|
|
| — |
|
|
| 7,987 |
| (4) |
| 668,991 |
|
|
| — |
|
|
|
|
| — |
|
Dean Y. Shigemura |
|
| — |
|
|
| — |
|
|
| — |
|
|
| — |
|
|
| — |
|
|
| — |
|
|
| — |
|
|
| 6,033 |
|
| (1) |
|
| 505,324 |
|
|
|
| — |
|
|
| — |
|
|
| — |
|
|
| — |
|
|
| — |
|
|
| — |
|
|
| — |
|
|
| 7,824 |
|
| (2) |
|
| 655,338 |
|
|
|
| — |
|
|
| — |
|
|
| — |
|
|
| — |
|
|
| — |
|
|
| — |
|
|
| — |
|
|
| 7,857 |
|
| (3) |
|
| 658,102 |
|
|
|
| — |
|
|
| — |
|
|
| — |
|
|
| — |
|
|
| — |
|
|
| 2,517 |
| (4) |
| 210,824 |
|
|
| — |
|
|
|
|
| — |
|
|
|
| — |
|
|
| — |
|
|
| — |
|
|
| — |
|
|
| — |
|
|
| — |
|
|
| — |
|
|
| 10,737 |
|
| (6) |
|
| 899,331 |
|
James C. Polk |
|
| — |
|
|
| — |
|
|
| — |
|
|
| — |
|
|
| — |
|
|
| — |
|
|
| — |
|
|
| 6,033 |
|
| (1) |
|
| 505,324 |
|
|
|
| — |
|
|
| — |
|
|
| — |
|
|
| — |
|
|
| — |
|
|
| — |
|
|
| — |
|
|
| 7,824 |
|
| (2) |
|
| 655,338 |
|
|
|
| — |
|
|
| — |
|
|
| — |
|
|
| — |
|
|
| — |
|
|
| — |
|
|
| — |
|
|
| 7,857 |
|
| (3) |
|
| 658,102 |
|
|
|
| — |
|
|
| — |
|
|
| — |
|
|
| — |
|
|
| — |
|
|
| 2,324 |
| (4) |
| 194,658 |
|
|
| — |
|
|
|
|
| — |
|
|
|
| — |
|
|
| — |
|
|
| — |
|
|
| — |
|
|
| — |
|
|
| — |
|
|
| — |
|
|
| 10,737 |
|
| (6) |
|
| 899,331 |
|
Sharon M. Crofts |
|
| — |
|
|
| — |
|
|
| — |
|
|
| — |
|
|
| — |
|
|
| — |
|
|
| — |
|
|
| 5,731 |
|
| (1) |
|
| 480,029 |
|
|
|
| — |
|
|
| — |
|
|
| — |
|
|
| — |
|
|
| — |
|
|
| — |
|
|
| — |
|
|
| 6,707 |
|
| (2) |
|
| 561,778 |
|
|
|
| — |
|
|
| — |
|
|
| — |
|
|
| — |
|
|
| — |
|
|
| — |
|
|
| — |
|
|
| 16,105 |
|
| (5) |
|
| 1,348,955 |
|
|
|
| — |
|
|
| — |
|
|
| — |
|
|
| — |
|
|
| — |
|
|
| 2,324 |
| (4) |
| 194,658 |
|
|
| — |
|
|
|
|
| — |
|
Mary E. Sellers |
|
| — |
|
|
| — |
|
|
| — |
|
|
| — |
|
|
| — |
|
|
| — |
|
|
| — |
|
|
| 6,033 |
|
| (1) |
|
| 505,324 |
|
|
|
| — |
|
|
| — |
|
|
| — |
|
|
| — |
|
|
| — |
|
|
| — |
|
|
| — |
|
|
| 7,824 |
|
| (2) |
|
| 655,338 |
|
|
|
| — |
|
|
| — |
|
|
| — |
|
|
| — |
|
|
| — |
|
|
| — |
|
|
| — |
|
|
| 24,158 |
|
| (5) |
|
| 2,023,474 |
|
|
|
| — |
|
|
| — |
|
|
| — |
|
|
| — |
|
|
| — |
|
|
| 2,517 |
| (4) |
| 210,824 |
|
|
| — |
|
|
|
|
| — |
|
|
|
|
|
|
|
|
|
|
|
|
|
|
|
6162
OPTION EXERCISES AND STOCK VESTED
The following table includes values realized for stock options exercised, the vesting of restricted stock, and the payouts on performance-based restricted stock units in 2021.2023. For further information on the vesting criteria for these restricted stock awards see the table “Outstanding Equity Awards.”
|
| Option Awards |
|
| Stock Awards |
| ||||||||||
Name |
| Number of |
|
| Value |
|
| Number of |
|
| Value |
| ||||
Peter S. Ho |
|
| — |
|
|
| — |
|
|
| 30,605 |
|
|
| 2,297,796 |
|
Dean Y. Shigemura |
|
| — |
|
|
| — |
|
|
| 8,663 |
|
|
| 650,370 |
|
Marco A. Abbruzzese |
|
| — |
|
|
| — |
|
|
| 1,649 |
|
|
| 133,091 |
|
Matthew K.M. Emerson |
|
| — |
|
|
| — |
|
|
| 3,520 |
|
|
| 253,280 |
|
|
| Option Awards |
|
| Stock Awards |
| ||||||||||
Name |
| Number of Shares Acquired on Exercise (#) |
|
| Value Realized on Exercise ($)(1) |
|
| Number of Shares Acquired on Vesting (#) |
|
| Value Realized on Vesting ($)(2) |
| ||||
Peter S. Ho |
|
| 46,666 |
|
|
| 1,801,366 |
|
|
| 26,272 |
|
|
| 2,340,835 |
|
Dean Y. Shigemura |
|
| 23,333 |
|
|
| 916,225 |
|
|
| 5,971 |
|
|
| 532,016 |
|
Sharon M. Crofts |
|
| 5,834 |
|
|
| 251,854 |
|
|
| 5,374 |
|
|
| 478,823 |
|
James C. Polk |
|
| — |
|
|
| — |
|
|
| 5,971 |
|
|
| 532,016 |
|
Mary E. Sellers |
|
| 30,000 |
|
|
| 1,170,550 |
|
|
| 6,568 |
|
|
| 585,209 |
|
|
|
|
|
EQUITY COMPENSATION PLAN INFORMATION
The following table contains information with respect to all of the Company’s compensation plans (including individual compensation arrangements) under which securities are authorized for issuance as of December 31, 2021.2023.
Plan Category |
| Number of Securities to be issued upon exercise of outstanding options, warrants and rights (#)(A) |
|
| Weighted average exercise price of outstanding options, warrants and rights ($)(B) |
|
| Number of securities remaining available for future issuance under equity compensation plans (excluding securities reflected in column(A)) (#)(C) |
| |||
Equity compensation plans approved by security holders |
|
| 17,301 |
|
|
| 47.72 |
|
|
| 1,287,913 |
|
Plan Category | Number of Securities | Weighted average | Number of securities | |||
Equity compensation plans approved by security holders | — | — | 942,377 |
The Employees’ Retirement Plan of Bank of Hawaii (the “Retirement Plan”) provides retirement benefits for eligible employees based on the employee’s years of service and average annual salary during the 60 consecutive months resulting in the highest average salary (excluding overtime, incentive plan payouts, and discretionary cash awards). The Retirement Plan was frozen as of December 31, 1995, except that for the five-year period commencing January 1, 1996, benefits for certain eligible participants were increased in proportion to the increase in the participant’s average annual salary. As of December 31, 2000, the benefits under the Retirement Plan were completely frozen and not subject to increase for any additional years of service or increase in average annual salary. Mr. Ho and Ms. Sellers areis the only named executive officersofficer who are participantsis a participant in the Retirement Plan. A summary of theirhis benefits areis listed below:
Name |
| Plan Name |
| Number of |
|
| Present |
|
| Payments |
| |||
Peter S. Ho |
| Employees’ Retirement Plan of Bank of Hawaii |
|
| 2 |
|
|
| 14,204 |
|
|
| — |
|
Name |
| Plan Name |
| Number of Years of Credited Service (#) |
|
| Present Value of Accumulated Benefits ($) |
|
| Payments During Last Fiscal Year ($) |
| |||
Peter S. Ho |
| Employees’ Retirement Plan of Bank of Hawaii |
|
| 2 |
|
|
| 19,459 |
|
|
| — |
|
Mary E. Sellers |
| Employees’ Retirement Plan of Bank of Hawaii |
|
| 7 |
|
|
| 101,370 |
|
|
| — |
|
63
62
CHANGE-IN-CONTROL, TERMINATION, AND OTHER ARRANGEMENTS
Bank of Hawaii’sHawai‘i’s Change-in-Control Retention Plan (the “Retention Plan”) provides a participant with benefits in the event of a change-in-control of the Company. The Retention Plan includes a “Double-Trigger” payout requirement; there must be a change-in-control of the Company, and a termination of the participant’s employment with the Company either by the Company without cause or by the participant for “good reason” in each case within 24 months following the change-in-control. All of the current named executive officers are participants in the Retention Plan. Two levels of benefits are payable to participants in the Retention Plan, with executives holding the position of Vice Chair or above being eligible for the higher tier of benefits. Messrs. Ho, Shigemura, and Polk, and Mmes. Crofts and SellersAll NEOs are eligible for the higher tier of benefits (described in the table below). In consideration of the benefits payable under the Retention Plan, participants are, for 12 months following termination of employment, subject to non-disclosure, non-competition (generally with respect to any other financial institution doing business in Hawaii)Hawai‘i), non-solicitation of business and employees, and non-disparagement restrictions.
The Retention Plan limits any payment or benefit under the Plan to an amount that would not be subject to Excise Tax even if the benefits would be substantially eliminated as a result of this limit, and prohibits the payment under the Plan of any tax gross up payments to executives in connection with any payment or benefit under the Plan.
Under the Retention Plan, a “change-in-control” will be deemed to have occurred if:
any person or group becomes the beneficial owner of 25% or more of the combined voting power of the Company’s securities that are entitled to vote for the election of directors;
a reorganization, merger or consolidation of the Company or the sale of substantially all of its assets occurs (excluding a transaction in which beneficial owners of the Company immediately prior to the transaction continue to own more than 60% of the total outstanding stock of the resulting entity and of the combined voting power of the entity’s securities that are entitled to vote for the election of directors); or
individuals who constituted the Board of Directors as of April 30, 2004, cease to constitute a majority of the Board, including as a result of actual or threatened election contests or through consents by or on behalf of a party other than the Board (but disregarding directors whose nomination or election was approved by at least a majority of the directors as of April 30, 2004, or other directors approved by them).
A participant is deemed to have “good reason” if one or more of the following occur after a change-in-control without the participant’s written consent:
a material reduction in the participant’s base salary, authority, duties or responsibilities, or in the budget over which the participant has authority;
a material reduction in the authority, duties or responsibilities of the participant’s supervisor;
the participant is required to relocate to a different Hawaiian Island for employment or to a place more than 50 miles from the participant’s base of employment immediately prior to the change-in-control; or
any other action or inaction that constitutes a material breach by the Company of the Retention Plan or the participant’s employment agreement.
The terms of the Company'sCompany’s 2014 Stock and Incentive Compensation Plan (as well as the 2024 Stock and Incentive Compensation Plan proposed herein) provide for full acceleration of vesting of restricted stock, restricted stock units, and stock options upon the occurrence of a change-in-control of the Company. We believe that it is generally appropriate to fully vest equity and incentive-based awards to employees in a change-in-control transaction because such a transaction may often cut short or reduce the employee'semployee’s ability to realize value with respect to such awards. All restricted stock, restricted stock units and stock option agreements which, by their terms, provide for acceleration of vesting in the event of a change-in-control, require a “Double-Trigger” for acceleration to occur, as provided in the Retention Plan. The Executive Incentive Plan provides that incentive awards will, upon a change-in-control of the Company, be prorated as though the applicable performance period ended on the change-in-control date, and will be calculated as an amount equal to two times a participant’s incentive allocation for the prorated performance period.
6364
The table below sets forth the benefits that would have been payable to each of the named executive officers had a qualifying termination occurred under the terms of the Retention Plan or plans with change-in-control provisions on December 31, 2021.2023.
Name |
| Base Salary |
|
| Executive |
|
| Health |
|
| Outplacement |
|
| Relocation |
|
| Acceleration |
|
| Non- |
|
| Total ($) |
| ||||||||
Peter S. Ho |
|
| 3,543,200 |
|
|
| 1,771,600 |
|
|
| 69,603 |
|
|
| 29,584 |
|
|
| 150,000 |
|
|
| 8,423,837 |
|
|
| 1,771,600 |
|
|
| 15,759,424 |
|
Dean Y. Shigemura |
|
| 1,612,980 |
|
|
| 716,880 |
|
|
| 53,304 |
|
|
| 29,584 |
|
|
| 150,000 |
|
|
| 2,568,127 |
|
|
| 806,490 |
|
|
| 5,937,365 |
|
Marco A. Abbruzzese |
|
| 623,596 |
|
|
| 659,200 |
|
|
| 68,295 |
|
|
| 29,584 |
|
|
| 150,000 |
|
|
| — |
|
|
| 741,600 |
|
|
| 2,272,275 |
|
Matthew K.M. Emerson |
|
| 1,575,900 |
|
|
| 700,400 |
|
|
| 68,295 |
|
|
| 29,584 |
|
|
| 150,000 |
|
|
| 389,942 |
|
|
| 787,950 |
|
|
| 3,702,071 |
|
S. Bradley Shairson |
|
| 883,837 |
|
|
| 480,000 |
|
|
| 68,730 |
|
|
| 29,584 |
|
|
| 150,000 |
|
|
| — |
|
|
| 540,000 |
|
|
| 2,152,151 |
|
(1) Under the Retention Plan, participants who hold the position of Vice Chair or above would be entitled to the sum of (a) two times the participant’s highest annual base salary in the three fiscal years preceding termination of employment (the “Highest Base Salary”), and (b) two times the product of the participant’s annual bonus target percentage under the Executive Incentive Plan in the year of termination and the participant’s Highest Base Salary. Amounts would be payable in a lump sum in the month following termination unless the participant is a “key employee” as defined in Treasury Regulation Section 416(i)(1)(A)(i), (ii) or (iii), in which case amounts would be payable in a lump sum on the first day of the seventh month following termination.
(2) The Executive Incentive Plan provides that upon a change-in-control of the Company, a participant who would otherwise be entitled to a final award for a performance period ending after the date of the change-in-control will be entitled to an amount equal to two times the participant’s annual bonus target percentage under the plan (calculated based on the participant’s annualized salary), prorated to the number of months elapsed in the applicable performance period. The final award would be paid within ten days after the end of the shortened performance period.
(3) In lieu of Company-paid health benefits, Retention Plan participants who hold the position of Vice Chair or above would be entitled to an amount equal to three times the cost of annual COBRA premiums for the medical, dental and vision plan coverage that was provided to the participant immediately prior to termination (or coverage provided to employees generally if the participant was not covered by the Company’s health plans prior to termination). Amounts would be payable in a lump sum as described in (1) above.
(4) Under the Retention Plan, participants who hold the position of Vice Chair or above would be entitled to reimbursement for outplacement expenses not to exceed $20,000 (adjusted for inflation after 2007).
(5) For participants who hold the position of Vice Chair or above, the Retention Plan provides for reimbursement of reasonable moving expenses incurred by the participant within 24 months following a qualifying termination (to the extent not reimbursed by another employer). The maximum reimbursement for real estate transaction expenses shall not exceed $100,000 and the maximum reimbursement for all other reasonable moving expenses shall not exceed $50,000.
(6) Under the 2014 Stock and Incentive Plan, a change-in-control would accelerate the lapsing of restrictions applicable to any restricted stock, restricted stock units, and stock options granted under such plan. All restricted stock, restricted stock units and stock option agreements which, by their terms, provide for acceleration of vesting in the event of a change-in-control, require a “Double-Trigger” for acceleration to occur, as provided in the Retention Plan.
(7) Under the Retention Plan, a participant who holds the position of Vice Chair or above is eligible to receive an amount equal to the sum of (a) one times the participant’s Highest Base Salary, and (b) the product of the participant’s annual bonus target percentage under the Executive Incentive Plan in the year of termination and the participant’s Highest Base Salary, provided that the participant refrains from competing against the Company (generally with respect to any other financial institution doing business in Hawai‘i) and also complies with the non-solicitation, non-disclosures and non-disparagement provisions of the plan for twelve months following the date of termination. The payment described in this section would be paid in a lump sum in the thirteenth month following termination.
(8) In 2009, the Company amended the Retention Plan to limit any payment or benefit under the plan to an amount that would not be subject to Excise Tax even if the benefits would be substantially eliminated as a result of this limit. Under the terms of the Retention Plan, if it is determined that any payment or benefit would be subject to Excise Tax, then the benefit payments will be reduced first from equity compensation and then from salary and bonus to the extent that the value of the reduced benefit payments will not be subject to any Excise Tax.
Name |
| Base Salary and Bonus Payment ($)(1)(8) |
|
| Executive Incentive Plan Payment ($)(2)(8) |
|
| Health Benefits ($)(3) |
|
| Outplacement ($)(4) |
|
| Relocation Payment ($)(5) |
|
| Acceleration of Restricted Stock ($)(6)(8) |
|
| Non- competition Payment ($)(7) |
|
| Total ($) |
| ||||||||
Peter S. Ho |
|
| 3,440,000 |
|
|
| 1,720,000 |
|
|
| 80,679 |
|
|
| 27,100 |
|
|
| 150,000 |
|
|
| 8,522,915 |
|
|
| 1,720,000 |
|
|
| 15,660,694 |
|
Dean Y. Shigemura |
|
| 1,566,000 |
|
|
| 696,000 |
|
|
| 63,437 |
|
|
| 27,100 |
|
|
| 150,000 |
|
|
| 2,060,667 |
|
|
| 783,000 |
|
|
| 5,346,204 |
|
Sharon M. Crofts |
|
| 1,566,000 |
|
|
| 696,000 |
|
|
| 53,766 |
|
|
| 27,100 |
|
|
| 150,000 |
|
|
| 2,585,420 |
|
|
| 783,000 |
|
|
| 5,861,286 |
|
James C. Polk |
|
| 1,566,000 |
|
|
| 696,000 |
|
|
| 52,890 |
|
|
| 27,100 |
|
|
| 150,000 |
|
|
| 2,912,754 |
|
|
| 783,000 |
|
|
| 6,187,744 |
|
Mary E. Sellers |
|
| 1,569,600 |
|
|
| 697,600 |
|
|
| 26,874 |
|
|
| 27,100 |
|
|
| 150,000 |
|
|
| 3,394,960 |
|
|
| 784,800 |
|
|
| 6,650,934 |
|
65
|
|
|
|
|
|
|
|
|
|
|
|
|
|
|
|
64
PAY VERSUS PERFORMANCE
In accordance with the SEC’s disclosure requirements regarding pay versus performance, or PVP, this section presents the SEC-defined “Compensation Actually Paid,” or CAP. Also required by the SEC, this section compares CAP to various measures used to gauge performance.
|
|
|
|
|
|
|
|
| Value of Initial Fixed $100 Investment Based On: |
|
|
|
|
| ||||||||||
Year | Summary Compensation Table Total for PEO |
| Compensation Actually Paid to PEO |
| Average Summary Compensation Table Total for Non-PEO Named Executive Officers |
| Average Compensation Actually Paid to Non-PEO Named Executive Officers |
| Total Shareholder Return |
| Peer Group Total Shareholder Return |
| Net Income |
| Return-on-Common Equity |
| ||||||||
2023 |
| 4,627,918 |
|
| 4,381,686 |
|
| 1,540,927 |
|
| 1,701,848 |
|
| 89 |
|
| 94 |
|
| 171,202,000 |
|
| 13.89 | % |
2022 |
| 6,056,524 |
|
| 5,674,791 |
|
| 2,661,358 |
|
| 2,487,102 |
|
| 91 |
|
| 107 |
|
| 225,804,000 |
|
| 17.83 | % |
2021 |
| 7,339,234 |
|
| 8,082,521 |
|
| 3,143,609 |
|
| 3,227,437 |
|
| 95 |
|
| 131 |
|
| 253,372,000 |
|
| 17.92 | % |
2020 |
| 4,248,492 |
|
| 3,003,245 |
|
| 1,463,462 |
|
| 1,166,693 |
|
| 84 |
|
| 93 |
|
| 153,804,000 |
|
| 11.56 | % |
(1) Reflects compensation for our Chairman, Chief Executive Officer & President, Peter S. Ho, who served as our Principal Executive Officer (PEO) in 2020, 2021, 2022 and 2023.
(2) CAP values for fiscal years 2020, 2021, and 2022 differ from those published in our March 17, 2023 proxy. These differences are a result of changes in our understanding of the assumptions and methodologies required under the SEC rule.
(3) Reflects compensation for Dean Y. Shigemura, Sharon M. Crofts, James C. Polk, Mary E. Sellers, and Mark A. Rossi in 2020; Dean Y. Shigemura, Sharon M. Crofts, James C. Polk, and Mary E. Sellers in 2021; and Dean Y. Shigemura, Marco A. Abbruzzese, James C. Polk, and Mary E. Sellers in 2022; and Dean Y. Shigemura, Marco A. Abbruzzese, Matthew K.M. Emerson, and S. Bradley Shairson in 2023, as shown in the Summary Compensation Table for each respective year.
(4) Peer Group used for TSR comparisons reflects the S&P Supercomposite Regional Bank Index.
(5) Return-on-Common-Equity is generally defined as the net income available to common shareholders as a percent of average common equity.
To calculate “compensation actually paid” for our CEO and other NEOs, the following adjustments were made to the Summary Compensation Table total pay.
| PEO |
| Other NEO Average |
| ||||||||||||||||||||
Adjustments | 2023 |
| 2022 |
| 2021 |
| 2020 |
| 2023 |
| 2022 |
| 2021 |
| 2020 |
| ||||||||
Summary Compensation Table Total |
| 4,627,918 |
|
| 6,056,524 |
|
| 7,339,234 |
|
| 4,248,492 |
|
| 1,540,927 |
|
| 2,661,358 |
|
| 3,143,609 |
|
| 1,463,462 |
|
Deduction for amount reported in “Stock Awards” column of the Summary Compensation Table |
| (3,000,067 | ) |
| (3,000,075 | ) |
| (4,211,668 | ) |
| (2,500,060 | ) |
| (750,079 | ) |
| (1,350,055 | ) |
| (2,003,242 | ) |
| (540,023 | ) |
Addition of fair value at fiscal year (FY) end, of equity awards granted during the FY that remained outstanding |
| 2,893,835 |
|
| 2,665,970 |
|
| 3,959,251 |
|
| 2,140,993 |
|
| 916,492 |
|
| 1,190,982 |
|
| 1,824,565 |
|
| 462,463 |
|
Addition of change in fair value at FY end versus prior FY end for awards granted in prior FY that remained outstanding |
| (389,222 | ) |
| (449,810 | ) |
| 389,023 |
|
| (979,172 | ) |
| (59,815 | ) |
| (139,071 | ) |
| 96,406 |
|
| (217,007 | ) |
Addition of change in fair value at vesting date versus prior FY end for awards granted in prior FY that vested during the FY |
| (75,927 | ) |
| 102,798 |
|
| 327,875 |
|
| (120,582 | ) |
| (9,017 | ) |
| 18,085 |
|
| 79,758 |
|
| (45,446 | ) |
Addition in respect of any dividends or other earnings paid during applicable FY prior to vesting date of underlying award |
| 325,514 |
|
| 299,384 |
|
| 278,806 |
|
| 216,429 |
|
| 63,340 |
|
| 105,803 |
|
| 86,341 |
|
| 44,648 |
|
Deduction for values reported in the “Change in Pension Value and Nonqualified Deferred Compensation Earnings” column of the Summary Compensation Table |
| (365 | ) |
| - |
|
| - |
|
| (2,855 | ) |
| - |
|
| - |
|
| - |
|
| (1,404 | ) |
Compensation Actually Paid |
| 4,381,686 |
|
| 5,674,791 |
|
| 8,082,521 |
|
| 3,003,245 |
|
| 1,701,848 |
|
| 2,487,102 |
|
| 3,227,437 |
|
| 1,166,693 |
|
(1) Measurement date equity fair values are calculated with assumptions derived on a basis consistent with those used for grant date fair value purposes.
66
Compensation Actually Paid Versus Company Performance:
The graphs below reflect the relationship between the PEO and Average Non-PEO NEO CAP with 1) the Company’s and the peer group’s total shareholder return (assuming an initial fixed investment of $100), 2) the Company’s Net Income, and 3) the Company’s return on common equity for the fiscal years 2020, 2021, 2022, and 2023.
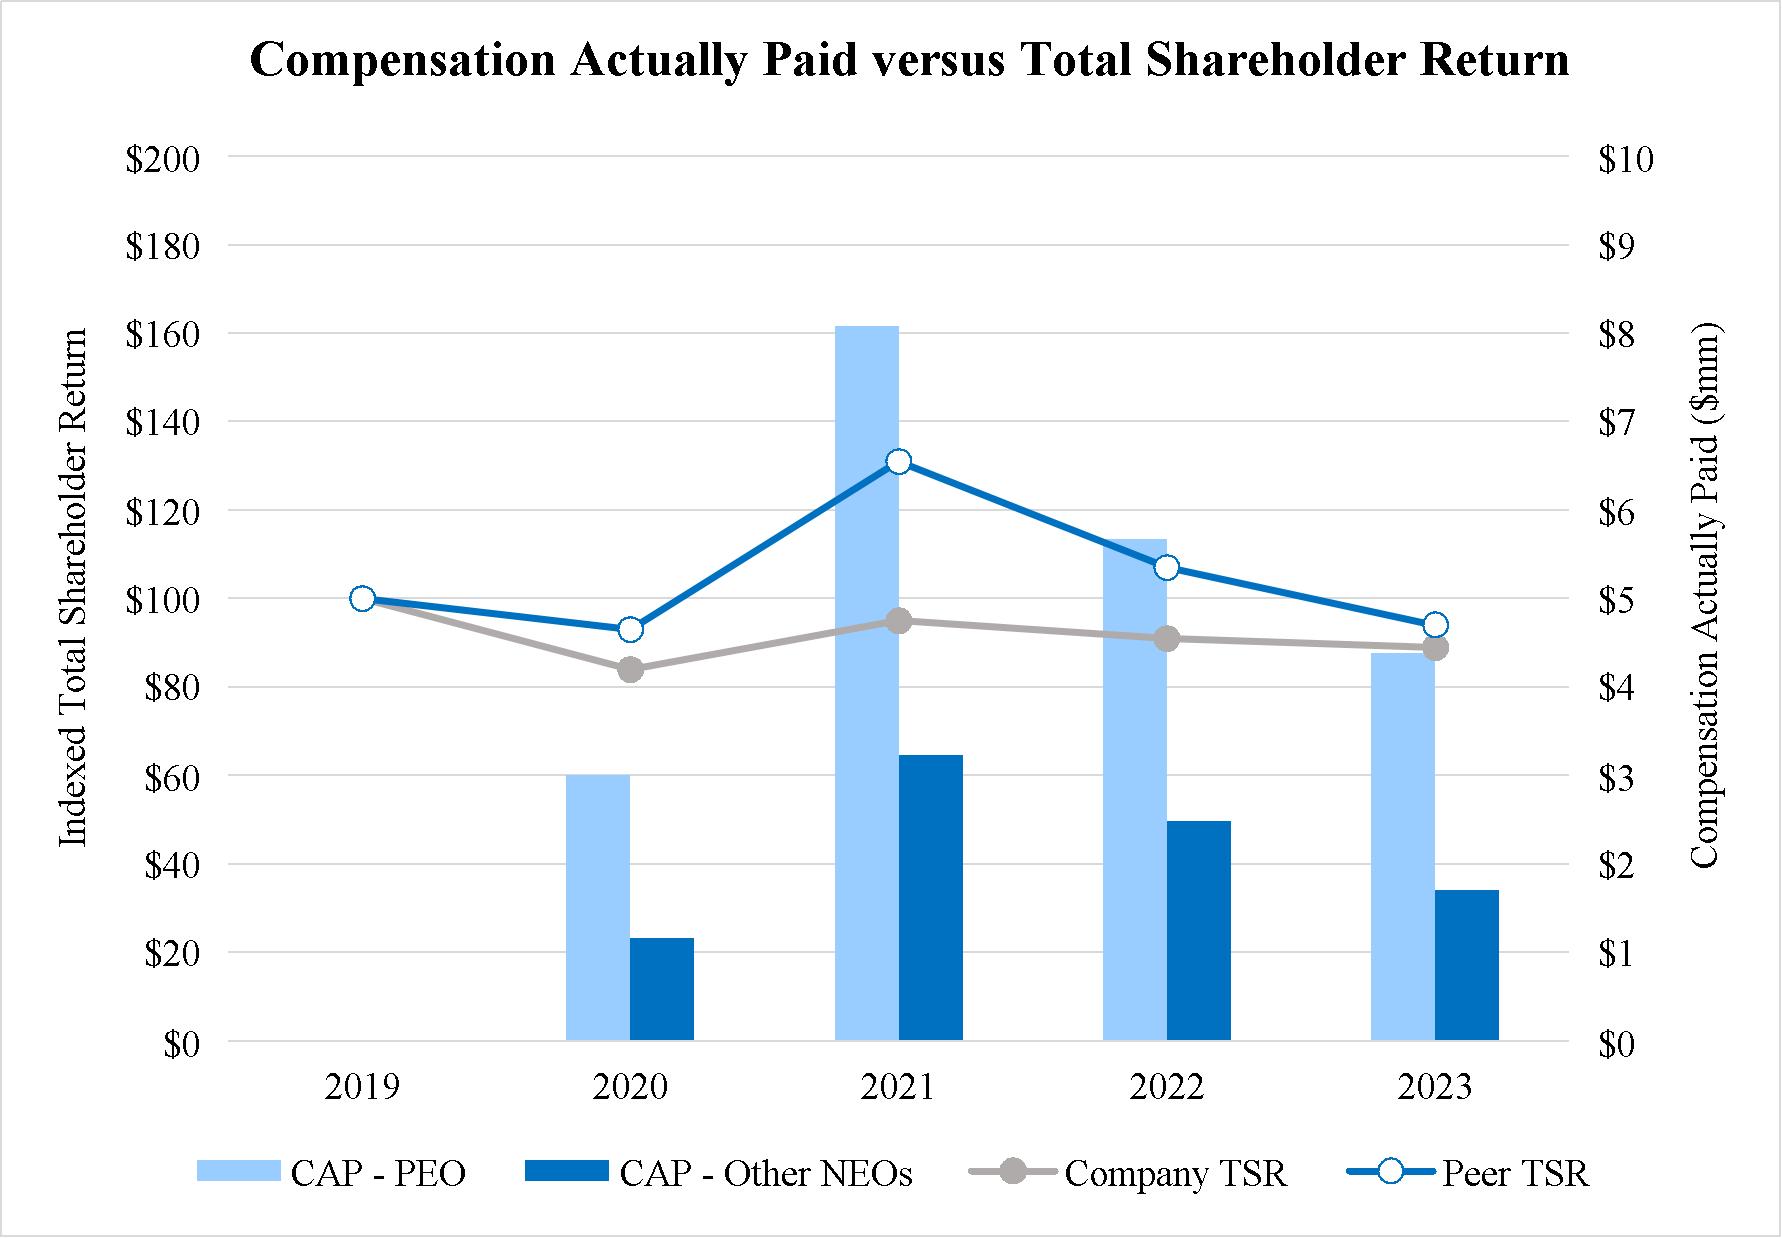
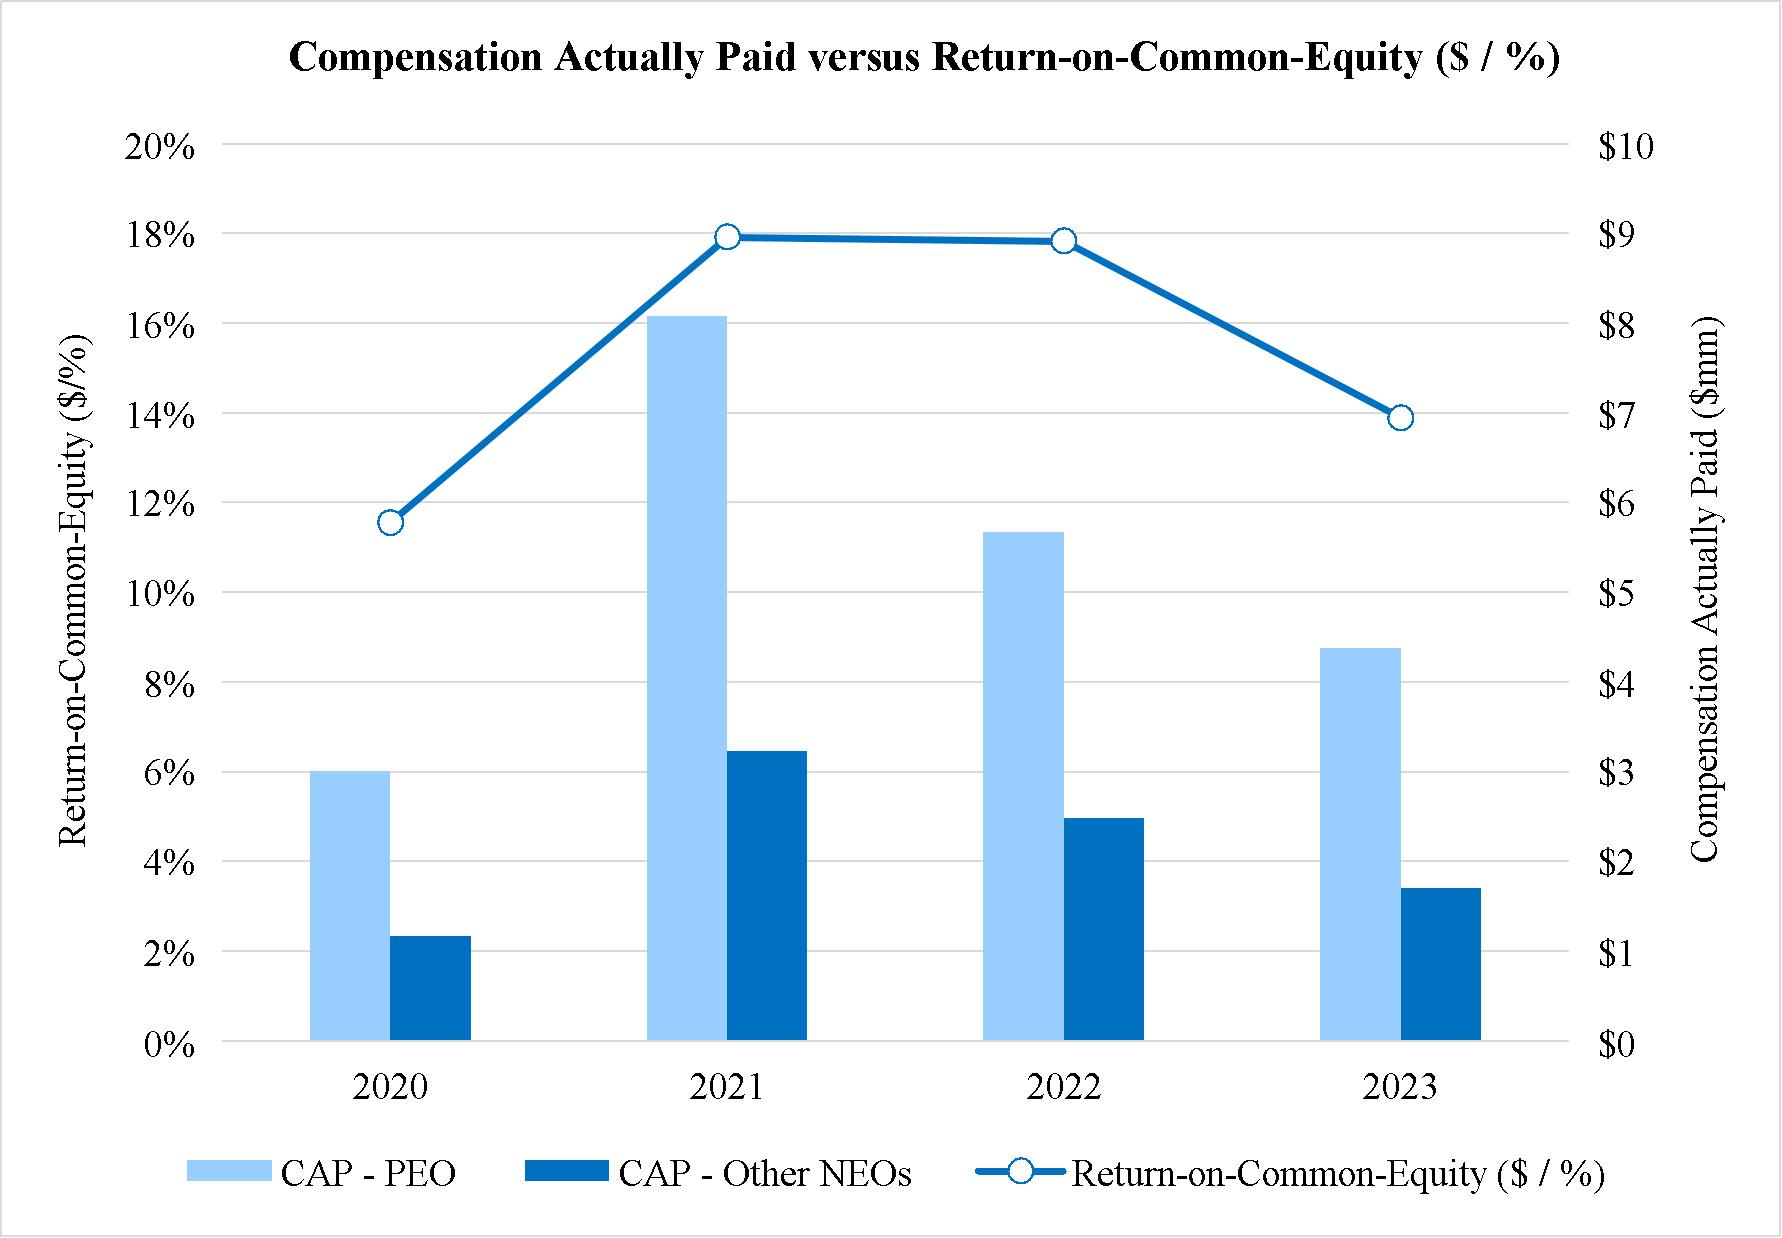
TSR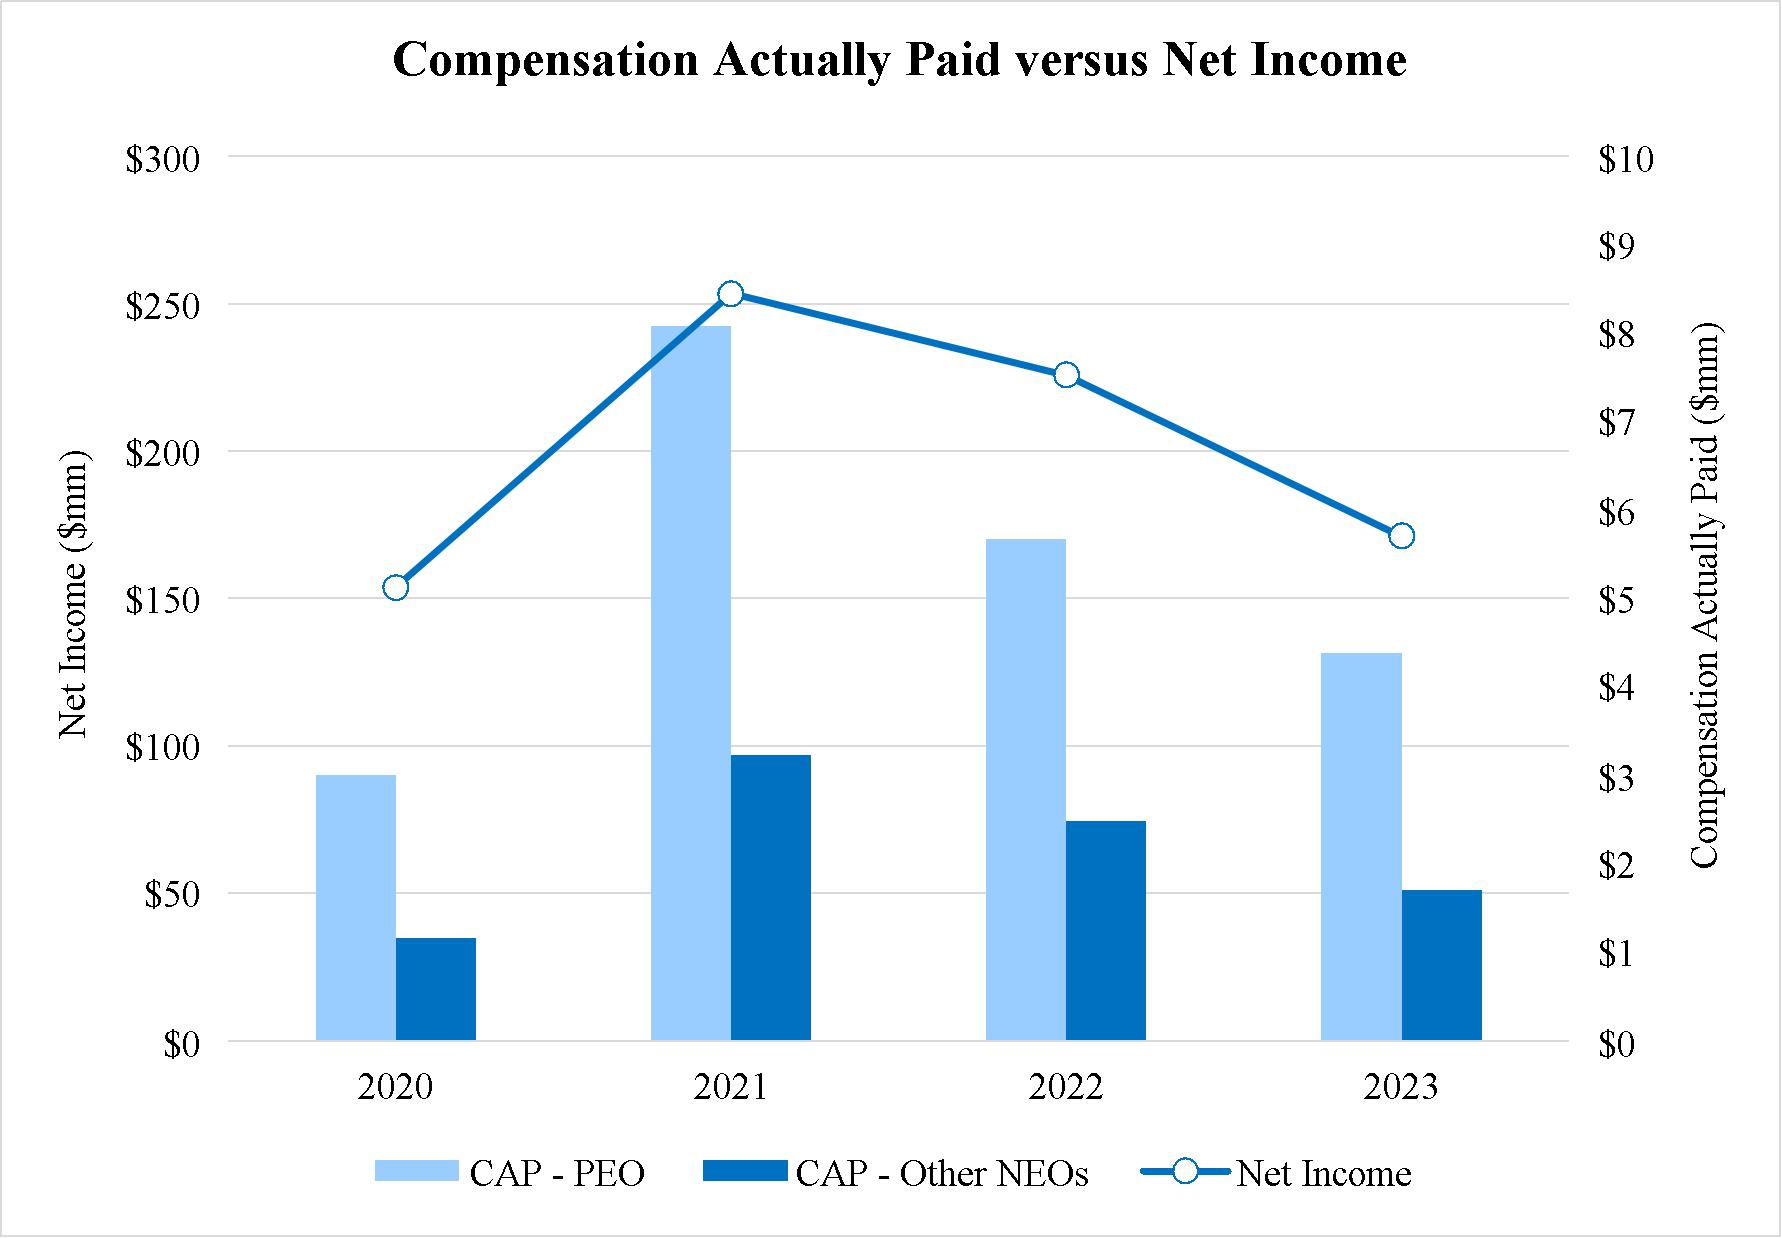
Compensation Actually Paid : Net Income
67
Compensation Actually Paid : ROCE
Tabular List of Company Performance Measures
The following table alphabetically lists the measures we believe are most important in linking compensation actually paid to company performance during 2023.
68
CEO PAY RATIO
As required by Section 953(b) of the Dodd-Frank Wall Street Reform and Consumer Protection Act, and Item 402(u) of Regulation S-K, we are providing the following information:
For 2021:2023:
The median of the annual total compensation of all employees of our Company (other than our CEO), was $66,230;$69,145; and
The annual total compensation of Mr. Ho, our Chairman, Chief Executive Officer, and President was $7,339,234.
Based on this information, the ratio for 20212023 of the annual total compensation of our Chairman, Chief Executive Officer, and President to the median of the annual total compensation of all employees is 11167 to 1.
We completed the following steps to identify the median of the annual total compensation of all our employees and to determine the annual total compensation of our median employee and CEO:
As of October 8, 2021,13, 2023, our U.S. employee population consisted of 2,0841,919 employees, including any full-time, part-time, temporary, or seasonal employees employed on that date. This date was selected because it aligned with a payroll cycle and allowed us to identify employees in a reasonably efficient manner. As permitted by SEC rules, we excluded approximately 14 employees located in Palau, which accounted for less than 1% of our total U.S. and non-U.S. employee population of 2,098.
To find the median of the annual total compensation of our employees (other than our CEO), we used total earnings as reported to the Internal Revenue Service on Form W-2 plus nontaxable earnings from our payroll records for fiscal year 2021.2023. In making this determination, we annualized compensation for full-time and part-time permanent employees who were employed on October 8, 2021,13, 2023, but did not work for us the entire year. No full-time equivalent adjustments were made for part-time employees.
We identified our median employee using this compensation measure and methodology, which was consistently applied to all our employees included in the calculation.
After identifying the median employee, we added together all of the elements of such employee’s compensation for 20212023 in accordance with the requirements of Item 402(c)(2)(x) of Regulation S-K, resulting in the annual total compensation of $66,230.
With respect to the annual total compensation of our CEO, we used the amount reported in the “Total” column of our 20212023 Summary Compensation Table, prepared in accordance with the requirements of Item 402(c)(2)(x) of Regulation S-K.
69
The Company has written ethics and business conduct policies and procedures to monitor and approve related party transactions, including procedures related to any loans the Company makes to executive officers and directors. The Company also conducts ethics training for its officers and directors. In accordance with applicable NYSE listing standards, each related party transaction is reviewed and evaluated by an appropriate group, generally the Audit & Risk Committee, to determine whether a particular relationship serves the best interest of the Company and its shareholders and whether the relationship should be continued. The Company also has adopted a written Code of Business Conduct and Ethics (the “Code”) for all directors, officers and employees to address, among other topics, possible conflicts of interest, corporate opportunities, compliance responsibilities, and reporting and accountability. The Code stresses personal accountability. Directors, officers, or employees who become aware of conflicts of interest or are concerned that a conflict might develop are required to disclose the matter promptly.
In accordance with the applicable NYSE listing standards and the Code, any material transactions or relationships involving a director or executive officer that could reasonably be expected to give rise to a conflict of interest must be approved or ratified by the Audit & Risk Committee and a list of those approvals and ratifications must be submitted semi-annually to the Board of Directors. The Audit & Risk Committee approves or ratifies material transactions or relationships involving a director or executive officer based on the facts and circumstances of each case. In addition to self-reporting, information about potential conflicts of interest is obtained as part of the annual questionnaire process. In response to the annual Directors’ and Officers’ Questionnaire, each director and executive officer submits to the Corporate Secretary a description of any current or proposed related party transactions. These transactions are presented to the Audit & Risk Committee for review and approval or ratification.
The Company and its subsidiaries are also subject to extensive federal regulations regarding certain transactions, including banking regulations relating to the extension of credit by subsidiary banks to insiders, such as executive officers and directors, as well as entities in which these individuals have specified control positions.
During 2021,2023, the Company and its banking and investment subsidiaries engaged in transactions in the ordinary course of business with one or more of the Company’s directors and executive officers, members of their immediate families, corporations and organizations of which one or more of them was a beneficial owner of 10% or more of a class of equity securities, certain of their associates and affiliates, and certain trusts and estates of which one or more of them was a trustee or beneficiary. All loans to such persons were made in the ordinary course of business, were made on substantially the same terms, including interest rates and collateral, as those prevailing at the time for comparable loans with persons not related to the Company, and did not involve more than the normal risk of collectability or present of other unfavorable features.
Ms. Dana M. Tokioka, a current director and director nominee, serves as a vice president of Atlas Insurance Agency, Inc. (“Atlas”), a Honolulu-based insurance agency which has provided insurance brokerage services to the Company since July 2009, predating Ms. Tokioka’s appointment to the Board. In 2021,2023, the Company paid Atlas insurance brokerage fees in the amount of $454,799,$493,996, relating to professional liability, property, casualty and other insurance related products and services. The above-mentioned transactions were made in the ordinary course of business and on terms and conditions comparable to contracts with other vendors not related to the Company.
70
PROPOSAL 3: APPROVAL OF BANK OF HAWAI‘I CORPORATION 2024 STOCK AND INCENTIVE PLAN
We are requesting shareholders to approve the Bank of Hawai‘i Corporation 2024 Stock and Incentive Plan (the “2024 Plan”), the material terms of which are described below. The Board of Directors approved the 2024 Plan on February 23, 2024, subject to the shareholder approval solicited by this proxy statement. The purpose of the 2024 Plan is to assist us in attracting and retaining employees, directors, consultants and independent contractors of outstanding ability and to promote the alignment of their interests with those of our shareholders.
The 2024 Plan provides for the grant of stock-based awards and stock options, as well as cash-based performance awards. If approved by the Company’s shareholders, the 2024 Plan would become effective as of April 26, 2024 ("Effective Date") and would replace the Bank of Hawai‘i Corporation 2014 Stock and Incentive Compensation Plan (the “2014 Plan”), which expires on April 30, 2024. The remaining shares available for issuance under the 2014 Plan plus the number of shares covered by outstanding awards under the 2014 Plan that are forfeited or expire will carry over to the new 2024 Plan, and 625,000 new shares are being requested as part of this proposal.
The 2024 Plan serves as the successor to the 2014 Plan, and no further awards shall be made under the 2014 Plan on or after the 2024 Plan’s Effective Date. All awards outstanding under the 2014 Plan as of the 2024 Plan’s Effective Date shall remain outstanding under the 2014 Plan and shall continue to be governed solely by the terms of the documents evidencing such award, and no provision of the 2024 Plan shall be deemed to affect or otherwise modify the rights or obligations of the holders of such awards.
As a NYSE listed company, we are required to seek the approval of our shareholders before implementing an equity compensation plan. Shareholder approval will also preserve our ability to grant incentive stock options and to deduct the expense of certain awards for federal income tax purposes. If our shareholders do not approve the 2024 Plan, it will not be implemented. In this event, we expect that our Board of Directors may consider substituting other forms of compensation to assure that our compensation packages for employees and directors are appropriate to recruit, retain, compensate and provide appropriate incentives for these individuals.
Description of the 2024 Plan
The 2024 Plan permits the grant of Options, Restricted Stock, Restricted Stock Units (“RSUs”), Performance Awards, and Other Stock-Based Awards (each, an “Award”). The following summary of the material features of the 2024 Plan is entirely qualified by reference to the full text of the 2024 Plan, a copy of which is attached hereto as Appendix A. Unless otherwise specified, capitalized terms used in this summary have the meanings assigned to them in the 2024 Plan.
2024 Plan Change Highlights
2024 Plan Highlights
The 2024 Plan contains a number of provisions that we believe are consistent with best practices in equity compensation and which protect the shareholders’ interests, as described below.
71
Eligibility and Administration
All employees, non-employee directors, consultants and independent contractors of the Company and its Affiliates (“Eligible Persons”) are eligible to receive grants of Awards under the 2024 Plan.
The 2024 Plan is administered by the Human Resources & Compensation Committee ("HRC") of the Board of Directors (unless the Board of Directors appoints another committee or person(s) for such purpose), except with respect to Awards granted to non-employee directors. With respect to Awards granted to non-employee directors, the Board of Directors serves as the “committee,” unless the Board appoints another committee or person(s) for such purpose. The HRC has plenary authority and discretion to determine the Eligible Persons to whom Awards are granted and the terms of all Awards under the 2024 Plan. Subject to the provisions of the 2024 Plan, the HRC has authority to interpret the 2024 Plan and agreements under the 2024 Plan and to make all other determinations relating to the administration of the 2024 Plan.
Stock Subject to the 2024 Plan
The number of Shares initially reserved for issuance over the term of the 2024 Plan is 1,710,438 Shares, which is comprised of (a) the Share reserve available for issuance under the 2014 Plan as of February 29, 2024, and (b) the Share increase in the amount of 625,000 Shares, subject to approval at the 2024 Annual Shareholders’ Meeting. However, such Share reserve shall be decreased by the number of Shares covered by awards providing for the issuance of Shares that are granted under the 2014 Plan after February 29, 2024, and prior to the Effective Date. Such Share reserve shall also be increased by the number of Shares covered by awards providing for the issuance of Shares granted under the 2014 Plan that cease to be covered by such awards by reason of termination, expiration or forfeiture of the awards after February 29, 2024. If an option expires or terminates unexercised, if Shares of Restricted Stock are forfeited, or if Shares covered by an award are not issued or are forfeited, the unissued or forfeited Shares that had been subject to the award are available for the grant of additional Awards (except for Shares withheld to pay the exercise price of an option or withholding taxes) under the 2024 Plan. Further, no Shares repurchased by the Company with the proceeds collected in connection with the exercise of outstanding Options, or Shares under stock-settled Stock Appreciation Rights that were not issued upon the net settlement of such Stock Appreciation Rights, shall be available for the grant of Awards hereunder.
72
Options
The 2024 Plan authorizes the grant of Nonqualified Stock Options and Incentive Stock Options. Incentive Stock Options are stock options that satisfy the requirements of Section 422 of the Internal Revenue Code of 1986, as amended (the “Code”). Nonqualified Stock Options are stock options that do not satisfy the requirements of Section 422 of the Code. The HRC may in its discretion condition the grant or vesting of an Option upon the achievement of one or more Performance Goals (described below). The exercise of an Option permits the participant to purchase Shares of Common Stock from the Company at a specified exercise price per share. The terms of an Option grant may provide for the payment of cash in lieu of the issuance of Shares upon exercise of the option. Options granted under the 2024 Plan are exercisable upon such terms and conditions as the HRC shall determine. The exercise price per share and manner of payment for Shares purchased pursuant to Options are determined by the HRC, subject to the terms of the 2024 Plan. The per share exercise price of Options granted under the 2024 Plan may not be less than 100% of the fair market value per share on the date of grant. The 2024 Plan provides that the term during which Options may be exercised is determined by the HRC, except that no Option may be exercised more than ten years after its date of grant.
Restricted Stock Awards
The 2024 Plan authorizes the HRC to grant Restricted Stock Awards. Shares of Common Stock covered by a Restricted Stock Award are restricted against transfer and subject to forfeiture and such other terms and conditions as the HRC determines. Such terms and conditions may provide, in the discretion of the HRC, for the vesting of awards of Restricted Stock to be contingent upon the achievement of one or more Performance Goals as described below.
Restricted Stock Units
RSUs granted under the 2024 Plan are contingent awards of Common Stock or the cash equivalent thereof. Pursuant to such Awards, Shares of Common Stock are issued, or the cash value of the Shares is paid, subject to such terms and conditions as the HRC deems appropriate. Unlike in the case of Awards of Restricted Stock, Shares of Common Stock are not issued immediately upon the award of RSUs, but instead Shares of Common Stock are issued or the cash value of the Shares is paid upon the satisfaction of such terms and conditions as the HRC may specify, including the achievement of one or more Performance Goals.
Performance Awards
The 2024 Plan authorizes the grant of Performance Awards. Performance Awards provide for payments in cash, Shares of Common Stock or a combination thereof contingent upon the attainment of one or more Performance Goals established by the HRC. For purposes of the limit on the number of Shares of Common Stock with respect to which an employee may be granted Awards during any calendar year, a Performance Award is deemed to cover the number of Shares of Common Stock equal to the maximum number of Shares that may be issued upon payment of the Award. The maximum cash amount that may be paid to any participant pursuant to all Performance Awards granted to such participant during a calendar year may not exceed $10,000,000.
Other Stock-Based Awards
The 2024 Plan authorizes the grant of Other Stock-Based Awards (including the issuance or offer for sale of unrestricted Shares of Common Stock) covering such number of Shares and having such terms and conditions as the HRC may determine, including terms that condition the payment or vesting of Other Stock-Based Awards upon the achievement of one or more Performance Goals.
Dividends and Dividend Equivalents
The terms of an Award (other than an Option) may, at the HRC’s discretion, provide a Participant with the right to receive dividend payments or dividend equivalent payments with respect to Shares or Units covered by the Award. The payments may be either made currently or credited to an account established for the Participant, and may be settled in cash or Shares, as determined by the HRC. Payment of dividends and dividend equivalents may be contingent upon the achievement of one or more Performance Goals.
73
Performance Goals
As described above, the terms and conditions of an Award may provide for the grant, vesting or payment of Awards to be contingent upon the achievement of one or more specified Performance Goals established by the HRC. For this purpose, “Performance Goals” means performance goals that the HRC establishes, which may be based on satisfactory internal or external audits, achievement of balance sheet or income statement objectives, cash flow, customer satisfaction metrics, achievement of customer satisfaction goals, dividend payments, earnings (including before or after taxes, interest, depreciation, and amortization), earnings growth, earnings per share, economic value added, expenses (including sales, general and administrative expenses), capital and capital measures, efficiency ratio, improvement of financial ratings, internal rate of return, market share, geographic expansion, net asset value, net income, net operating gross margin, net operating profit after taxes, net sales growth, operating income, operating margin, comparisons to the performance of other companies, pro forma income, regulatory compliance, return measures (including return on assets, designated assets, capital, capital employed, equity, or shareholders' equity, and return versus the Company’s cost of capital), revenues, sales, stock price (including growth measures and total shareholder return), comparison to stock market indices, implementation or completion of one or more projects or transactions (including mergers, acquisitions, dispositions, and restructurings), working capital, or any other objective goals that the HRC establishes. Performance Goals may be absolute in their terms or measured against or in relationship to other companies comparably, similarly or otherwise situated. Performance Goals may be particular to an Eligible Person or the department, branch, Affiliate, or division in which the Eligible Person works, or may be based on the performance of the Company, one or more Affiliates, or the Company and one or more Affiliates and may cover such period as the HRC may specify.
Adjustments to Reflect Certain Events and Transactions
If the outstanding Common Stock of the Company changes as a result of a stock dividend, stock split, reverse stock split, spin-off, split-off, recapitalization, reclassification, combination or exchange of shares, merger, consolidation or liquidation, or the like, the 2024 Plan provides for the HRC to substitute or adjust: (a) the number and class of securities subject to outstanding Awards, (b) the consideration to be received upon exercise or payment of an Award, (c) the exercise price of Options, (d) the aggregate number and class of securities for which Awards may be granted under the 2024 Plan, and/or (e) the maximum number of securities with respect to which an employee may be granted Awards during any calendar year. In the event of a merger or consolidation to which the Company is a party or other specified transactions, the 2024 Plan authorizes the HRC to make such changes and adjustments to outstanding awards as it deems equitable including causing any Award to become vested in whole or in part, be assumed by a successor or acquirer, or be cancelled in consideration of a cash payment equal to the fair value of the cancelled Award.
Withholding
The Company is generally required to withhold tax on the amount of income recognized by a participant with respect to an Award. Withholding requirements may be satisfied, as provided in the agreement evidencing the Award, by (a) tender of a cash payment to the Company, (b) withholding of Shares of Common Stock otherwise issuable, or (c) delivery to the Company by the participant of unencumbered Shares of Common Stock.
Termination and Amendment; Term of 2024 Plan
The Board of Directors may amend or terminate the 2024 Plan at any time. However, after the 2024 Plan has been approved by the shareholders of the Company, the Board of Directors may not amend or terminate the 2024 Plan without the approval of (a) the Company’s shareholders if shareholder approval of the amendment is required by applicable law, rules or regulations or the exchange or interdealer quotation system on which the common stock is listed or quoted, and (b) each affected participant if such amendment or termination would adversely affect such participant’s rights or obligations under any Awards granted prior to the date of the amendment or termination.
Unless sooner terminated by the Board of Directors, the 2024 Plan will terminate ten years after it becomes effective. Once the 2024 Plan is terminated, no further Awards may be granted or awarded under the 2024 Plan. Termination of the 2024 Plan will not affect the validity of any Awards outstanding on the date of termination.
New Plan Benefits
Awards under the 2024 Plan are discretionary and the HRC has not yet determined to whom Awards will be made and the terms and conditions of such awards. Therefore, the benefits and amounts that will be received by each of the named executive officers, the executive officers as a group and all other employees under the 2024 Plan are not presently determinable.
Summary of Certain Federal Income Tax Consequences
The following discussion briefly summarizes certain United States federal income tax aspects of Options, Restricted Stock, RSUs, and Performance Awards granted pursuant to the 2024 Plan. State, local and foreign tax consequences may differ.
74
Incentive Stock Options. A participant who is granted an Incentive Stock Option will not recognize income on the grant or exercise of the Option. However, the difference between the exercise price and the fair market value of the stock on the date of exercise is an adjustment item for purposes of the alternative minimum tax. If a participant does not exercise an Incentive Stock Option within certain specified periods after termination of employment, the participant will recognize ordinary income on the exercise of the Incentive Stock Option in the same manner as on the exercise of a Nonstatutory Stock Option, as described below.
Nonstatutory Stock Options, RSUs, Performance Awards and Other Stock-Based Awards. A participant generally is not required to recognize income on the grant date of a Nonstatutory Stock Option, RSU, Performance Award or Other Stock-Based Award. Instead, ordinary income generally is required to be recognized on the date the Nonstatutory Stock Option is exercised, or in the case of an RSU, Performance Award, or Other Stock Based Award on the date of payment of such Award in cash and/or shares of common stock. In general, the amount of ordinary income required to be recognized is: (a) in the case of a Nonstatutory Stock Option, an amount equal to the excess, if any, of the fair market value of the Shares of Common Stock on the date of exercise over the exercise price; and (b) in the case of an RSU, Performance Award, or Other Stock-Based Award, the amount of cash and/or the fair market value of any shares of common stock received.
Restricted Stock. A participant who is granted Restricted Stock under the 2024 Plan is not required to recognize income with respect to the shares until the shares vest, unless the participant makes a special tax election to recognize income upon award of the shares. In either case, the amount of income the participant recognizes equals the fair market value of the Shares of Common Stock at the time income is recognized.
Gain or Loss on Sale or Exchange of Shares. In general, gain or loss from the sale or exchange of Shares of Common Stock granted or awarded under the 2024 Plan will be treated as capital gain or loss, provided that the Shares are held as capital assets at the time of the sale or exchange. However, if certain holding period requirements are not satisfied at the time of a sale or exchange of Shares of Common Stock acquired upon exercise of an Incentive Stock Option (a “disqualifying disposition”), a participant generally will be required to recognize ordinary income upon such disposition.
Deductibility by Company. The Company generally is not allowed a deduction in connection with the grant or exercise of an Incentive Stock Option. However, if a participant is required to recognize ordinary income as a result of a disqualifying disposition, the Company generally will be entitled to a deduction equal to the amount of ordinary income so recognized. In general, in the case of a Nonstatutory Stock Option (including an Incentive Stock Option that is treated as a Nonstatutory Stock Option, as described above), a Performance Award, a Restricted Stock Award, an RSU, or an Other Stock-Based Award, the Company will be allowed a deduction in an amount equal to the amount of ordinary income recognized by the participant.
Parachute Payments. Where payments to certain persons that are contingent on a change in control exceed limits specified in the Code, the person generally is liable for a 20% excise tax on, and the corporation or other entity making the payment generally is not entitled to any deduction for, a specified portion of such payments. Under the 2024 Plan, the HRC has plenary authority and discretion to determine the vesting schedule of Awards. Any Award under which vesting is accelerated by a change in control of the Company would be relevant in determining whether the excise tax and deduction disallowance rules would be triggered.
Tax Rules Affecting Nonqualified Deferred Compensation Plans. Section 409A of the Code imposes tax rules that apply to “nonqualified deferred compensation plans.” Failure to comply with, or to qualify for an exemption from, the new rules with respect to an Award could result in significant adverse tax results to the Award recipient, including immediate taxation upon vesting, and an additional income tax of 20% of the amount of income so recognized. The 2024 Plan is intended to allow the granting of Awards that comply with, or qualify for an exemption from, Section 409A of the Code.
Vote Required and Board of Directors Recommendation
The affirmative vote of a majority of the votes cast by the shareholders present in person or represented by proxy is required for approval of the adoption of the 2024 Plan. Any shares not voted (whether by abstention, broker non-vote or otherwise) will not be counted as votes cast. Accordingly, beneficial owners of shares should instruct their brokers or nominees how to vote with respect to this proposal.
The Board of Directors recommends a vote “FOR” the approval of the 2024 Plan.
75
PROPOSAL 4: RATIFICATION OF THE RE-APPOINTMENT OF ERNST & YOUNG LLP AS THE COMPANY’SCOMPANY’S INDEPENDENT REGISTERED PUBLIC ACCOUNTING FIRM FOR THE 20222024 FISCAL YEAR
The Audit & Risk Committee has appointed Ernst & Young LLP as the Company’s independent registered public accounting firm for the 20222024 fiscal year. The Board recommends that the shareholders ratify this appointment. Ernst & Young LLP has been the Company’s independent registered public accounting firm since its incorporation in 1971. We expect representatives of Ernst & Young LLP to attend the annual meeting. Ernst & Young LLP has indicated that they will have no statement to make but will be available to respond to questions. If this Proposal does not pass, the appointment of the independent registered public accounting firm will be reconsidered by the Audit & Risk Committee.
The Board of Directors recommends a vote “FOR” the foregoing proposal.
Ernst & Young LLP’s fees for professional services rendered for 20212023 and 20202022 were as follows:
Service |
| 2021 |
|
| 2020 |
|
| 2023 |
|
| 2022 |
| ||||
Audit Fees |
| $ | 1,706,000 |
|
| $ | 1,799,500 |
|
| $ | 2,195,000 |
|
| $ | 1,782,000 |
|
Audit-Related Fees |
|
| 379,000 |
|
|
| 237,500 |
|
|
| 311,000 |
|
|
| 297,500 |
|
Tax Fees |
|
| 81,588 |
|
|
| 54,125 |
|
|
| 191,694 |
|
|
| 223,417 |
|
All Other Fees |
|
| — |
|
|
| — |
|
|
| — |
|
|
| — |
|
Total |
| $ | 2,166,588 |
|
| $ | 2,091,125 |
|
| $ | 2,697,694 |
|
| $ | 2,302,917 |
|
Audit Fees
The audit fees represent audit fees and administrative expenses for professional services rendered for the audit of the Company’s annual consolidated financial statements, the review of our quarterly financial statements included in our Quarterly Reports on Form 10-Q, and the audit of our internal control over financial reporting. Audit fees also represent fees for professional services rendered for statutory and subsidiary audits.audits, attestation services required by statute or regulation, and accounting and financial reporting consultations and research work necessary to comply with U.S. generally accepted accounting principles. Audit fees also include professional services related to consents and assistance with review of documents filed with the SEC.
Audit-Related Fees
The audit-related fees represent fees for employee benefit plan audits, services with respect to Statement on Standards for Attestation Engagements No. 18 related to the Company’s trust operations and mortgage compliance, and other attestation reports.
Tax Fees
The tax fees represent fees for tax advisory and compliance services.
All Other Fees
The all other fees represent fees for non-tax related advisory and consulting services.
76
67
As members of the Audit & Risk Committee, we review the Company’s financial reporting process on behalf of the Board of Directors. The Audit & Risk Committee Charter, which outlines the Committee’s responsibilities, is available on the Company’s website at www.boh.com. Management has the primary responsibility for the financial statements and the reporting process, including the systems of internal controls and disclosure controls. In this context, we have met and held discussions with management and the independent registered public accounting firm. Management represented to us that the Company’s consolidated financial statements were prepared in accordance with U.S. generally accepted accounting principles, and we have reviewed and discussed the audited financial statements and related disclosures with management and the independent registered public accounting firm, including a review of the significant management judgments underlying the financial statements and disclosures.
The independent registered public accounting firm reports to us. We have sole authority to appoint and to terminate the engagement of the independent registered public accounting firm. As a matter of best practice, we submit the appointment of the independent registered public accounting firm to shareholders for ratification.
We have discussed with the independent registered public accounting firm the matters required to be discussed by the Public Company Accounting Oversight Board’s (“PCAOB”) Accounting Standard No. 1301, “Communications with Audit Committees,” including the quality, not just the acceptability, of the accounting principles, the reasonableness of significant judgments, and the clarity of the disclosures in the financial statements. In addition, we have received the written disclosures and the letter from the independent registered public accounting firm required by applicable requirements of the PCAOB regarding communications with the audit committee concerning independence, and have discussed with the independent registered public accounting firm its independence from the Company and its management. In concluding that the independent registered public accounting firm is independent, we determined, among other things, that the audit and non-audit services provided by Ernst & Young LLP were compatible with its independence. Consistent with the requirements of the Sarbanes-Oxley Act of 2002, the Audit & Risk Committee has adopted policies to avoid compromising the independence of the independent registered public accounting firm, such as prior committee approval of audit, non-audit, tax, and all other services, and required audit partner rotation.
We discussed with the Company’s internal auditors and independent registered public accounting firm the overall scope and plans for their respective audits, including internal control testing under Section 404 of the Sarbanes-Oxley Act of 2002. We met with our internal auditors and independent registered public accounting firm, with and without management present, and in private sessions with members of senior management to discuss the results of their examinations, their evaluations of the Company’s internal controls, and the overall quality of the Company’s financial reporting. We also periodically met in executive session.
In reliance on the reviews and discussions referred to above, as members of the Audit & Risk Committee, we recommended to the Board of Directors (and the Board of Directors subsequently approved the recommendation) that the audited consolidated financial statements be included in the Company’s annual report on Form 10-K for the year ended December 31, 2021,2023, for filing with the Securities and Exchange Commission. We have also appointed the Company’s independent registered public accounting firm subject to shareholder ratification, for the 20222024 fiscal year.
As submitted by the members of the Audit & Risk Committee,
Mark A. Burak, ChairmanChair
John C. Erickson, Vice ChairmanChair
Kent T. Lucien
Alicia E. Moy
Victor K. Nichols
Barbara J. Tanabe
Raymond P. Vara, Jr.
77
AUDIT & RISK COMMITTEE PRE-APPROVALPRE-APPROVAL POLICIES AND PROCEDURES
On an annual basis, the Audit & Risk Committee pre-approves all auditing and permitted non-audit services to be provided by Ernst & Young LLP, except that the Audit & Risk Committee need not pre-approve any permitted non-audit services that meet the requirements of any de minimis exception established by SEC rules. The pre-approved list of services consists of audit services, audit-related services, and tax services. The Audit & Risk Committee or its designee, the Committee Chairman,Chair, must specifically approve any type of service that is not included on the pre-approved list of services, provided that any such pre-approval by the Committee ChairmanChair is presented to the full Audit & Risk Committee at its next meeting. Any proposed service that is included on the list of pre-approved services but will cause the pre-approved fee level to be exceeded also requires specific pre-approval by the Audit & Risk Committee or its designee, the Committee Chairman,Chair, provided that any such pre-approval by the Committee ChairmanChair is presented to the full Audit & Risk Committee at its next meeting.
All of the services provided by, and fees paid to, Ernst & Young LLP in 20212023 were pre-approved by the Audit & Risk Committee, and there were no services for which the de minimis exception permitted in certain circumstances under SEC rules was utilized.
OTHER BUSINESS
The Board of Directors knows of no other business for consideration at the annual meeting. However, if other matters properly come before the meeting or any adjournment, the person or persons voting your shares pursuant to instructions by proxy card, telephone, or the Internet will vote as they deem in the best interests of Bank of HawaiiHawai‘i Corporation.
A copy of the Company’s Annual Report on Form 10-K, including the related consolidated financial statements and schedules filed with the SEC, is available without charge to any shareholder who requests a copy in writing. Any exhibit to Form 10-K is also available upon written request at a reasonable charge for copying and mailing. Written requests should be made to the Corporate Secretary at 130 Merchant Street, Honolulu, HawaiiHawai‘i 96813.
78
APPENDIX A
BANK OF HAWAI‘I CORPORATION
2024 STOCK AND INCENTIVE PLAN
The Plan serves as the successor to the 2014 Plan, and no further awards shall be made under the 2014 Plan on or after the Plan’s Effective Date. All awards outstanding under the 2014 Plan as of the Plan’s Effective Date shall remain outstanding under the 2014 Plan and shall continue to be governed solely by the terms of the documents evidencing such award, and no provision of the Plan shall be deemed to affect or otherwise modify the rights or obligations of the holders of such awards.
79
Unless the context expressly requires the contrary, references in the Plan to (a) the term “Section” refers to the sections of the Plan, and (b) the word “including” means “including (without limitation)”.
Notwithstanding the foregoing, all Awards granted under the Plan are subject to a minimum vesting requirement of one year, and no portion of any Award shall vest earlier than the first anniversary of the Date of Grant of such Award, provided however that, up to 5% of Shares subject to the Plan, as set forth in Section 5, shall not be subject to this minimum vesting requirement. This minimum vesting requirement shall also not be construed to prevent the earlier vesting of an Award upon the occurrence of a non-voluntary vesting event specified in the Agreement establishing such Award (including death, disability, occurrence of a change in control, and involuntary termination of service without cause).
80
81
82
83
84
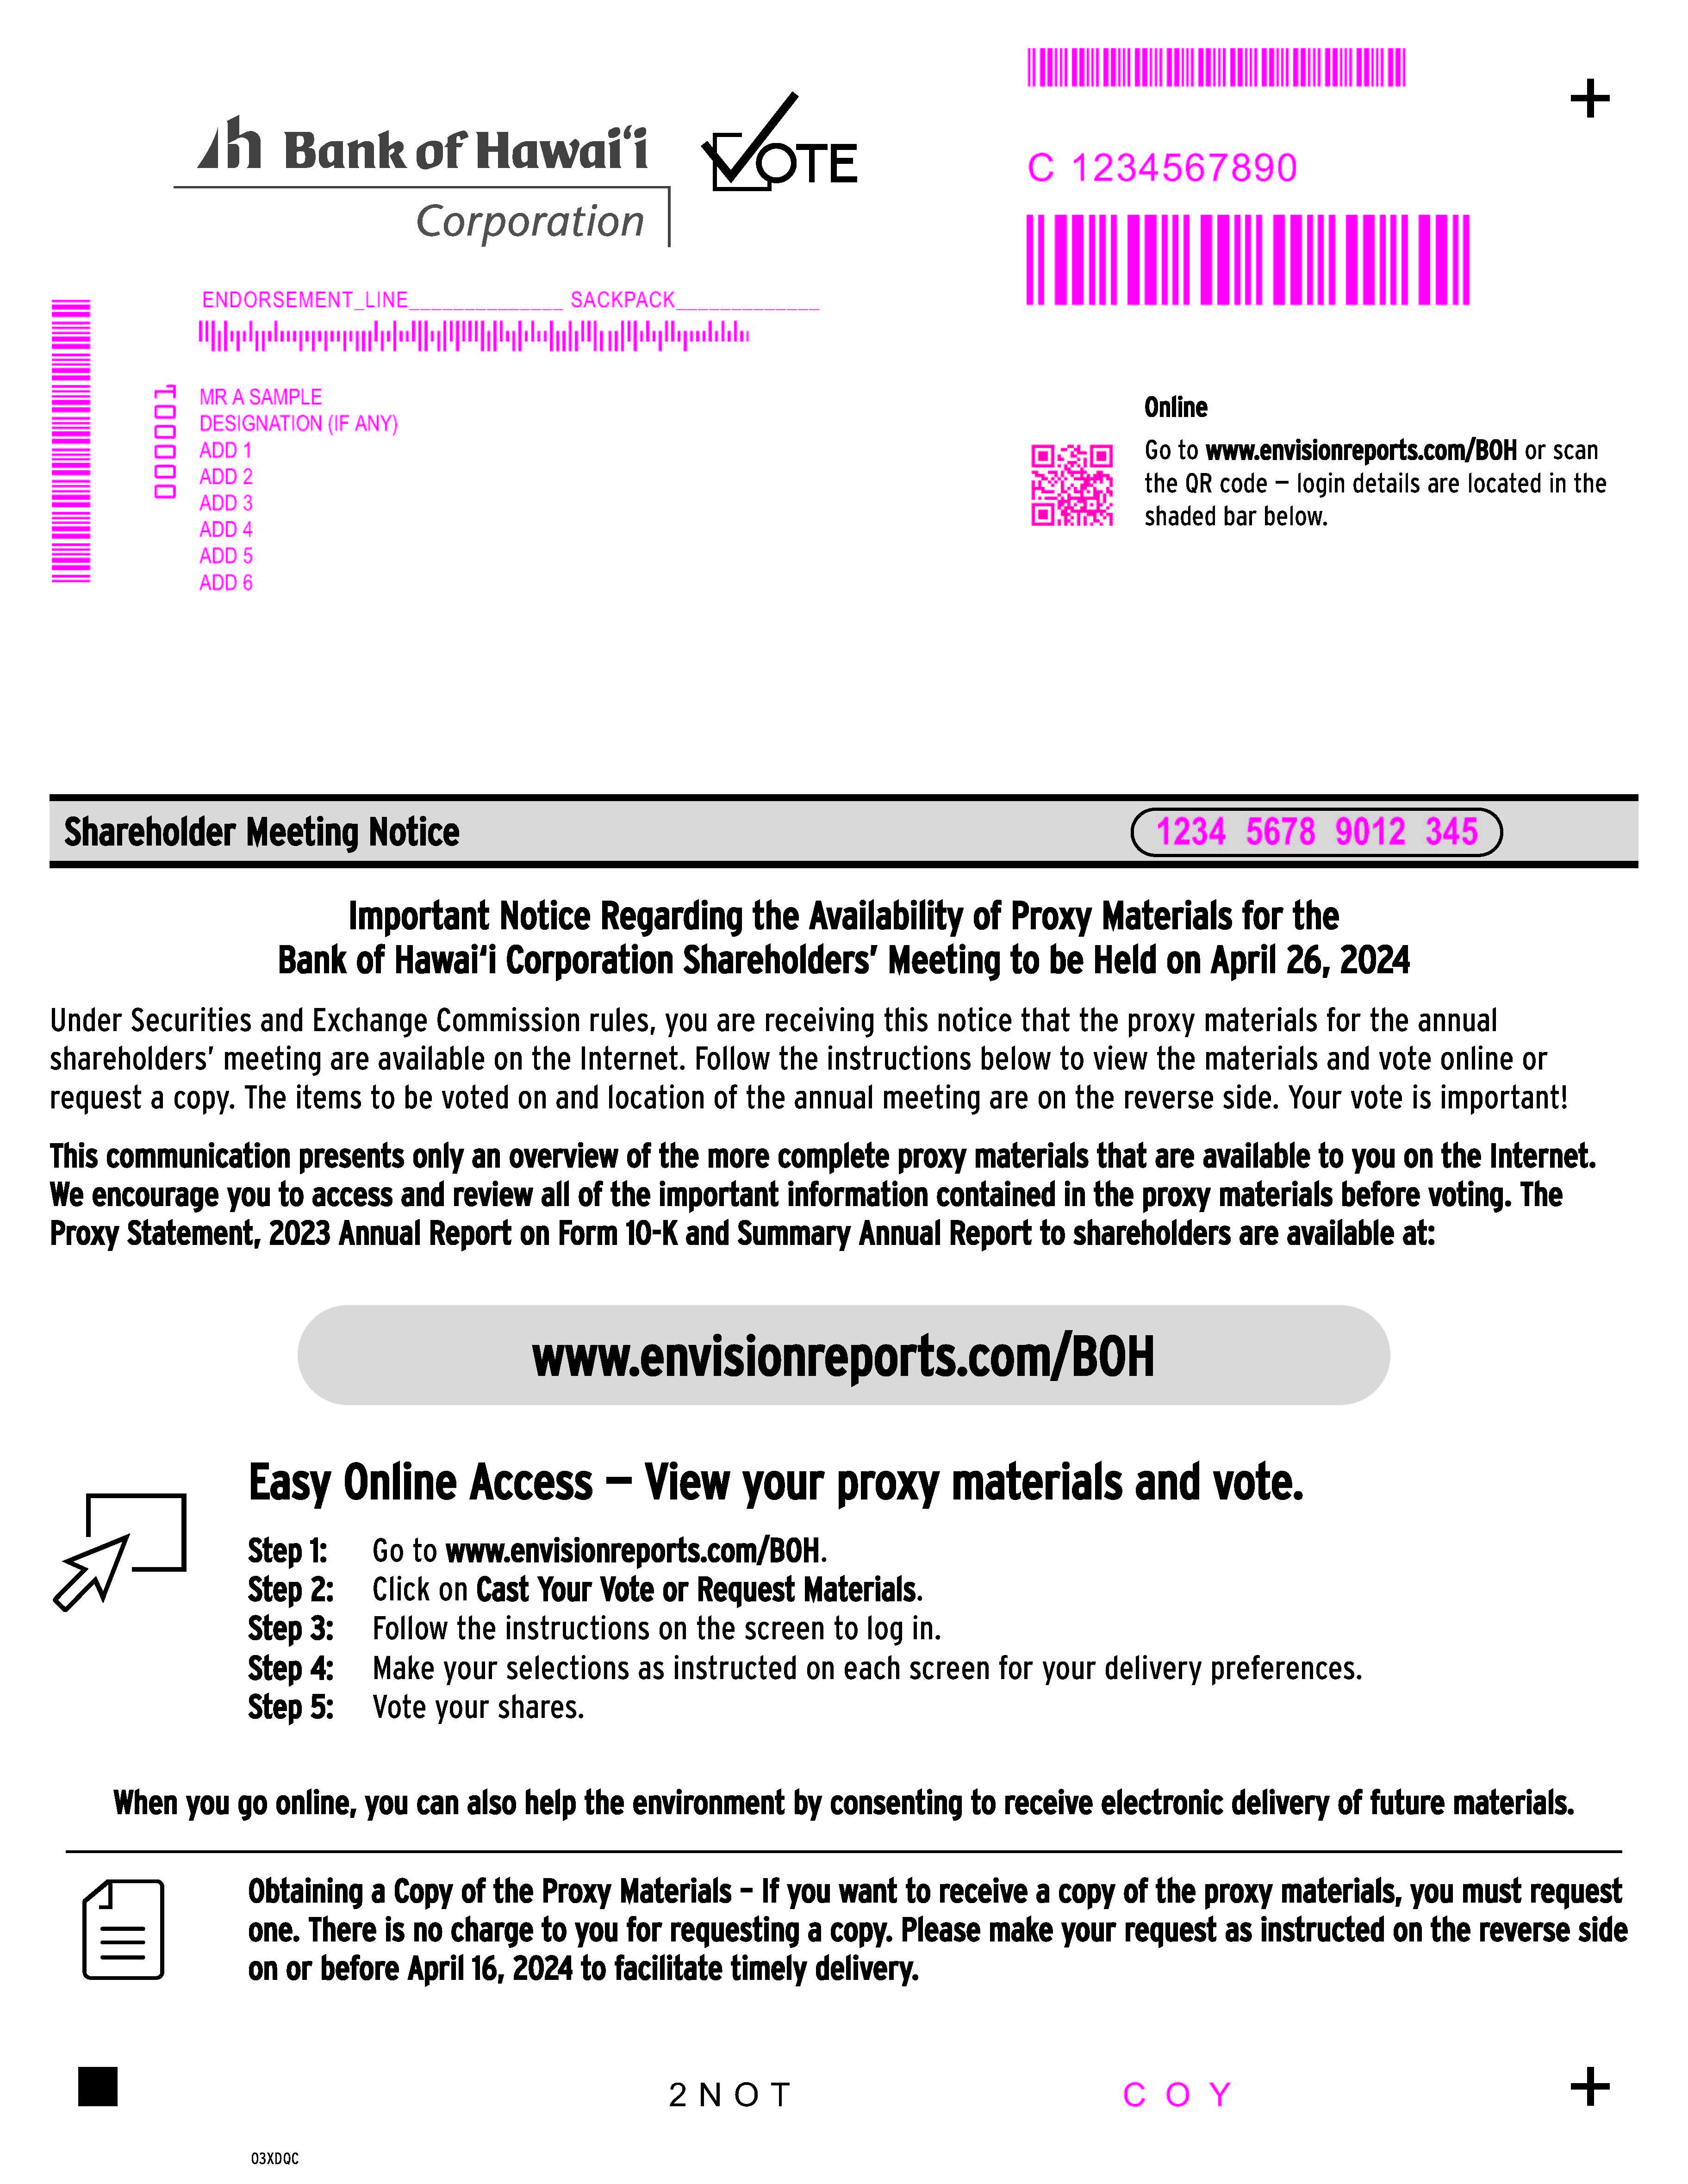
85
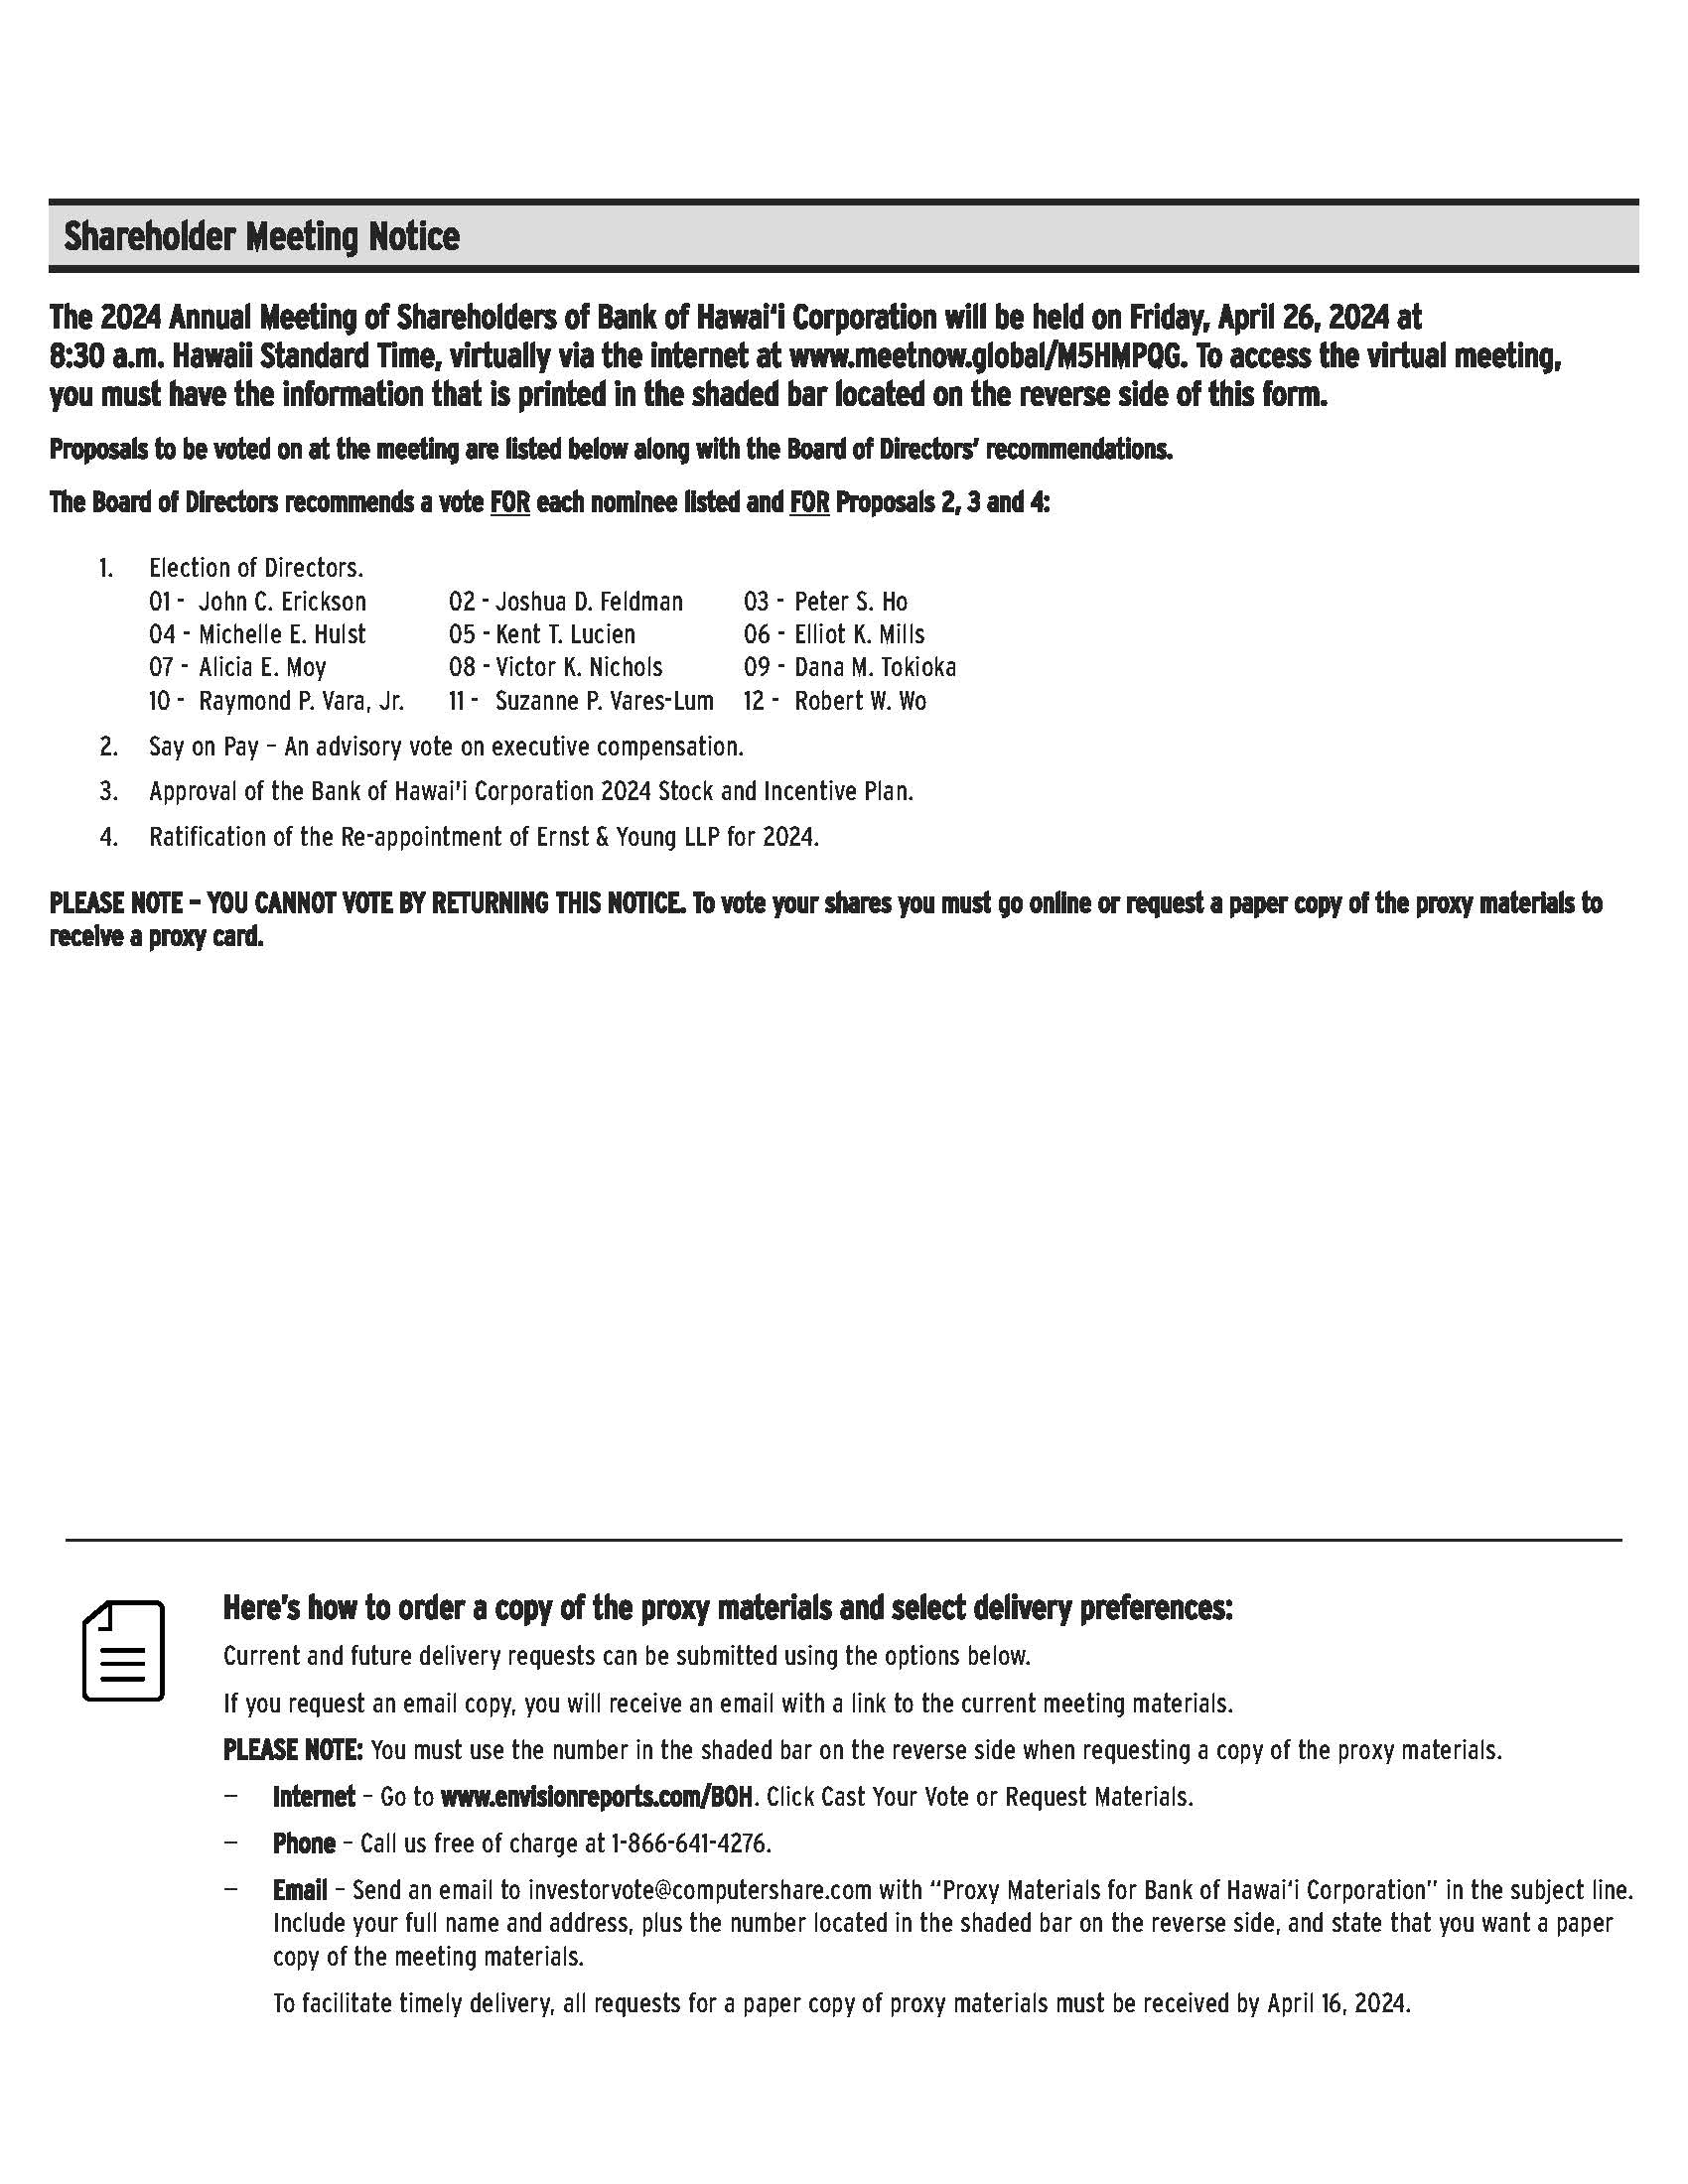
86
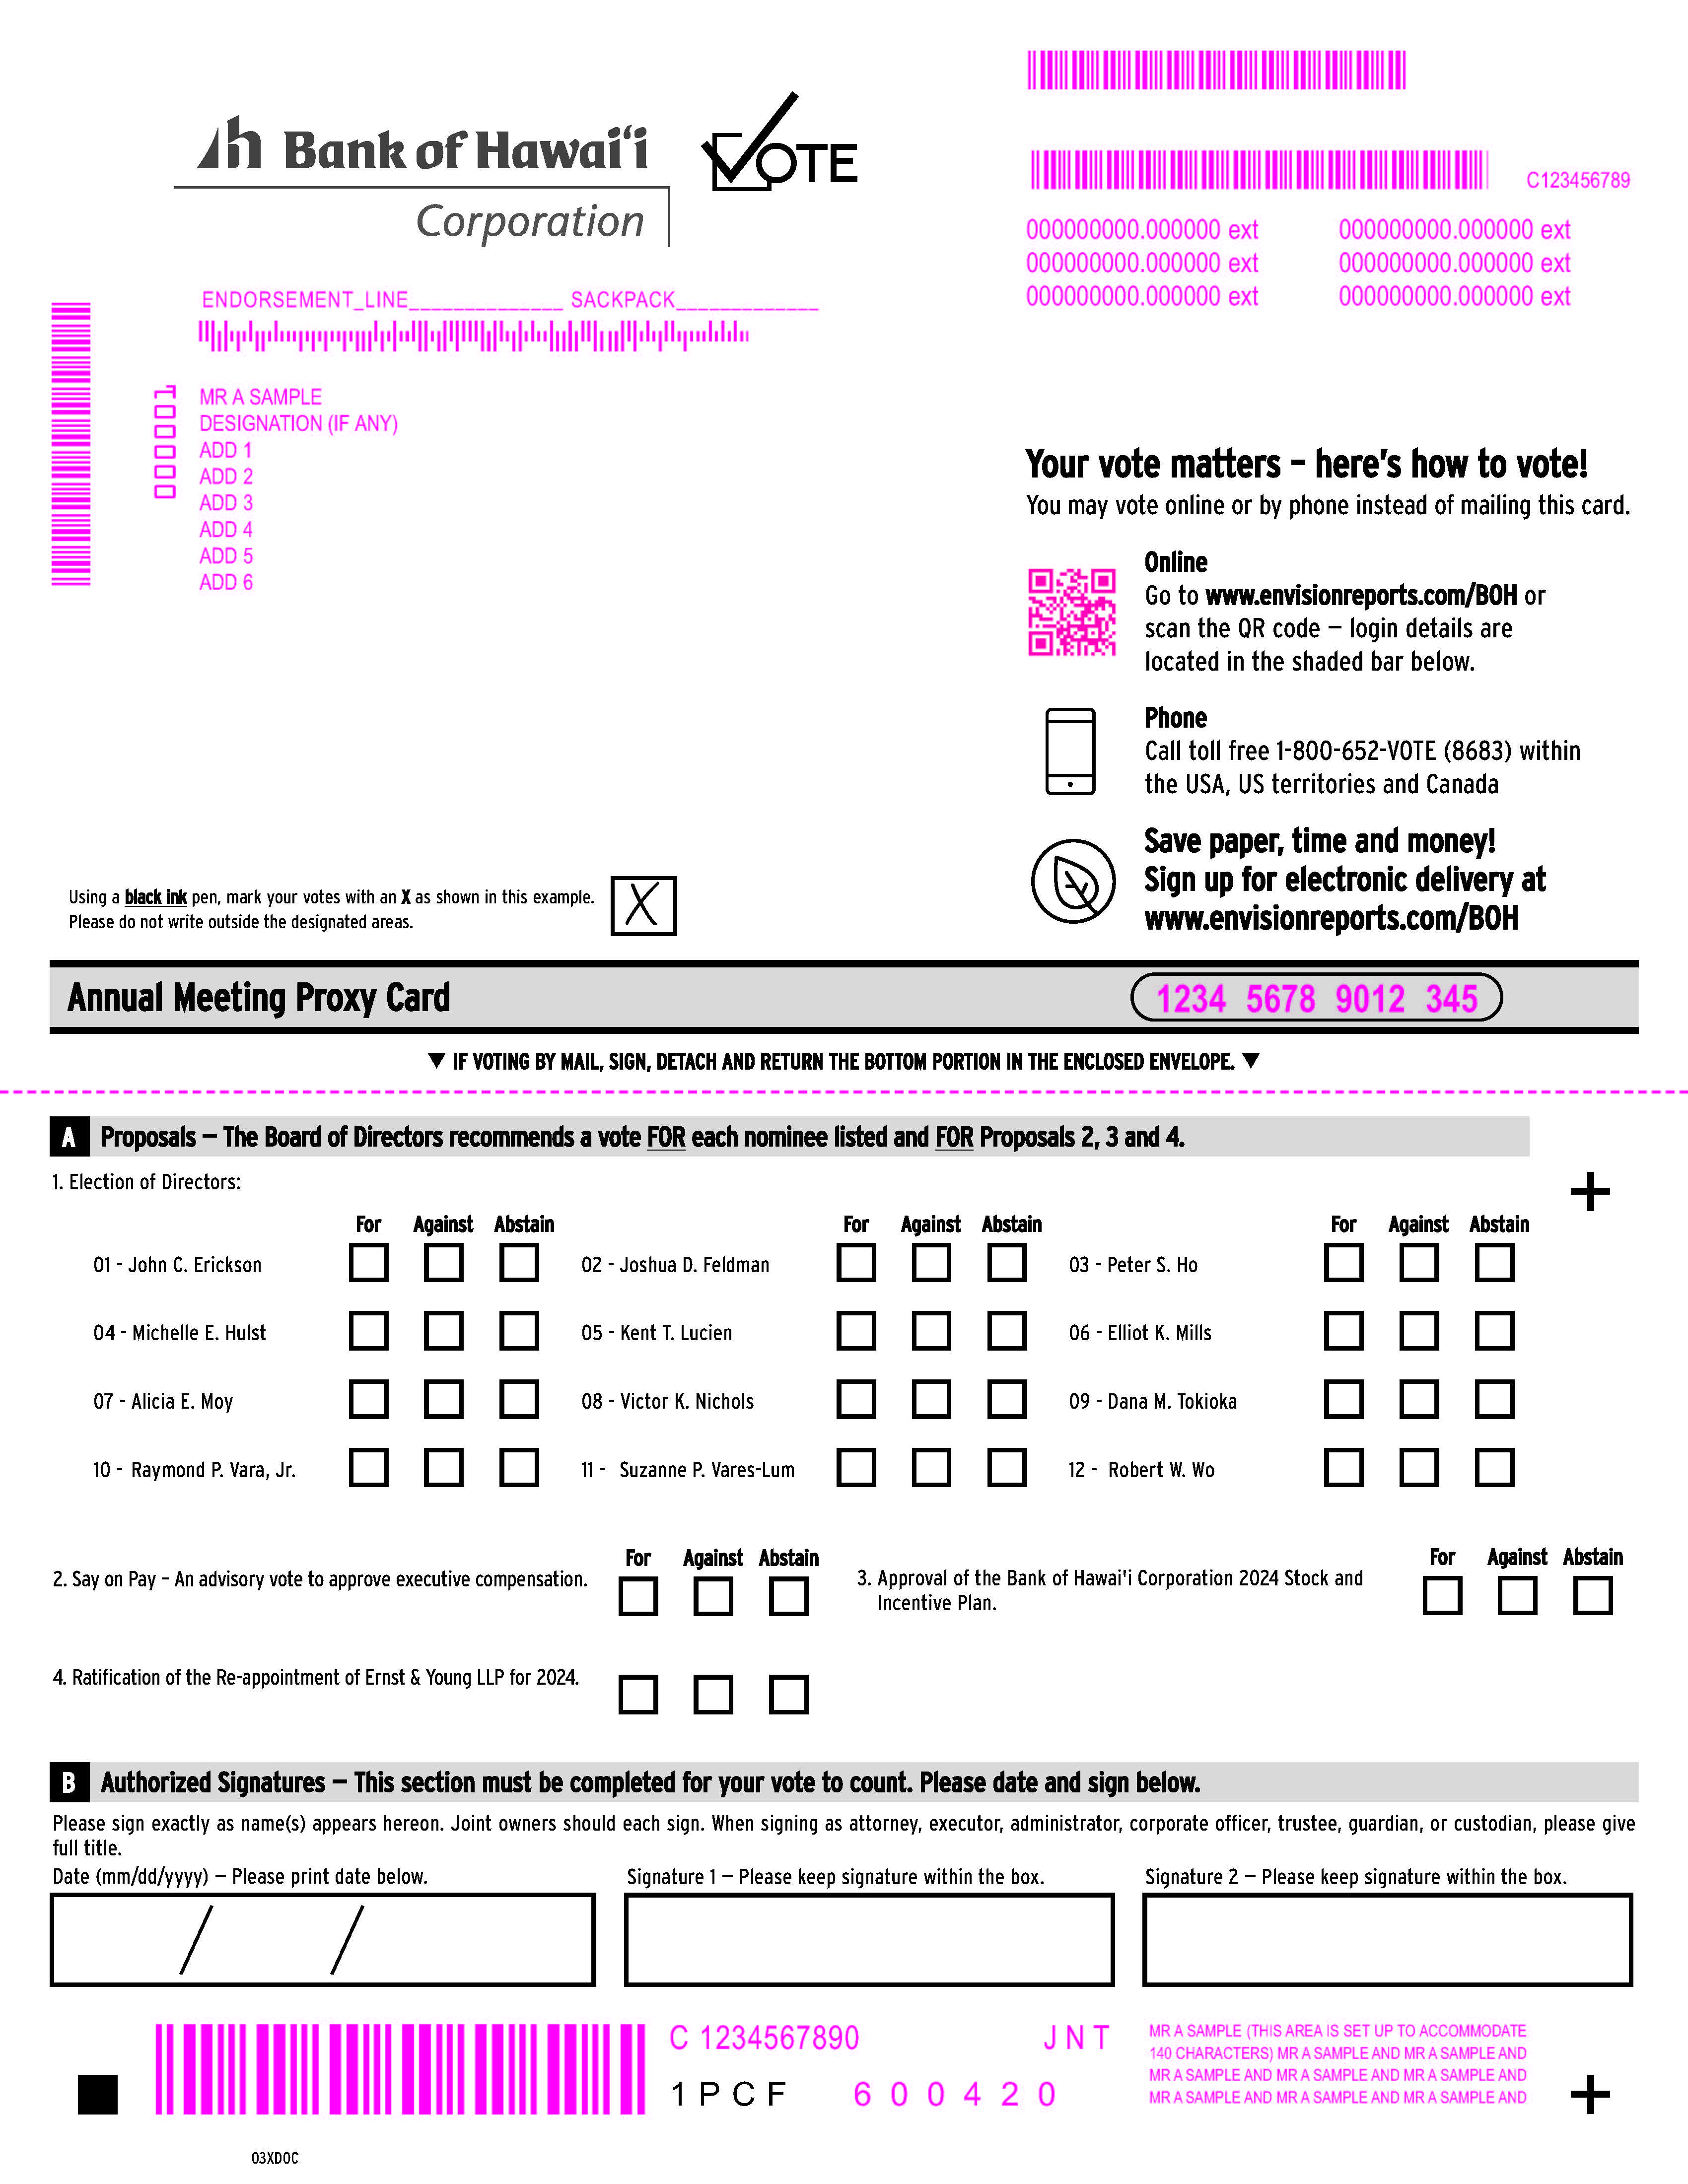
87
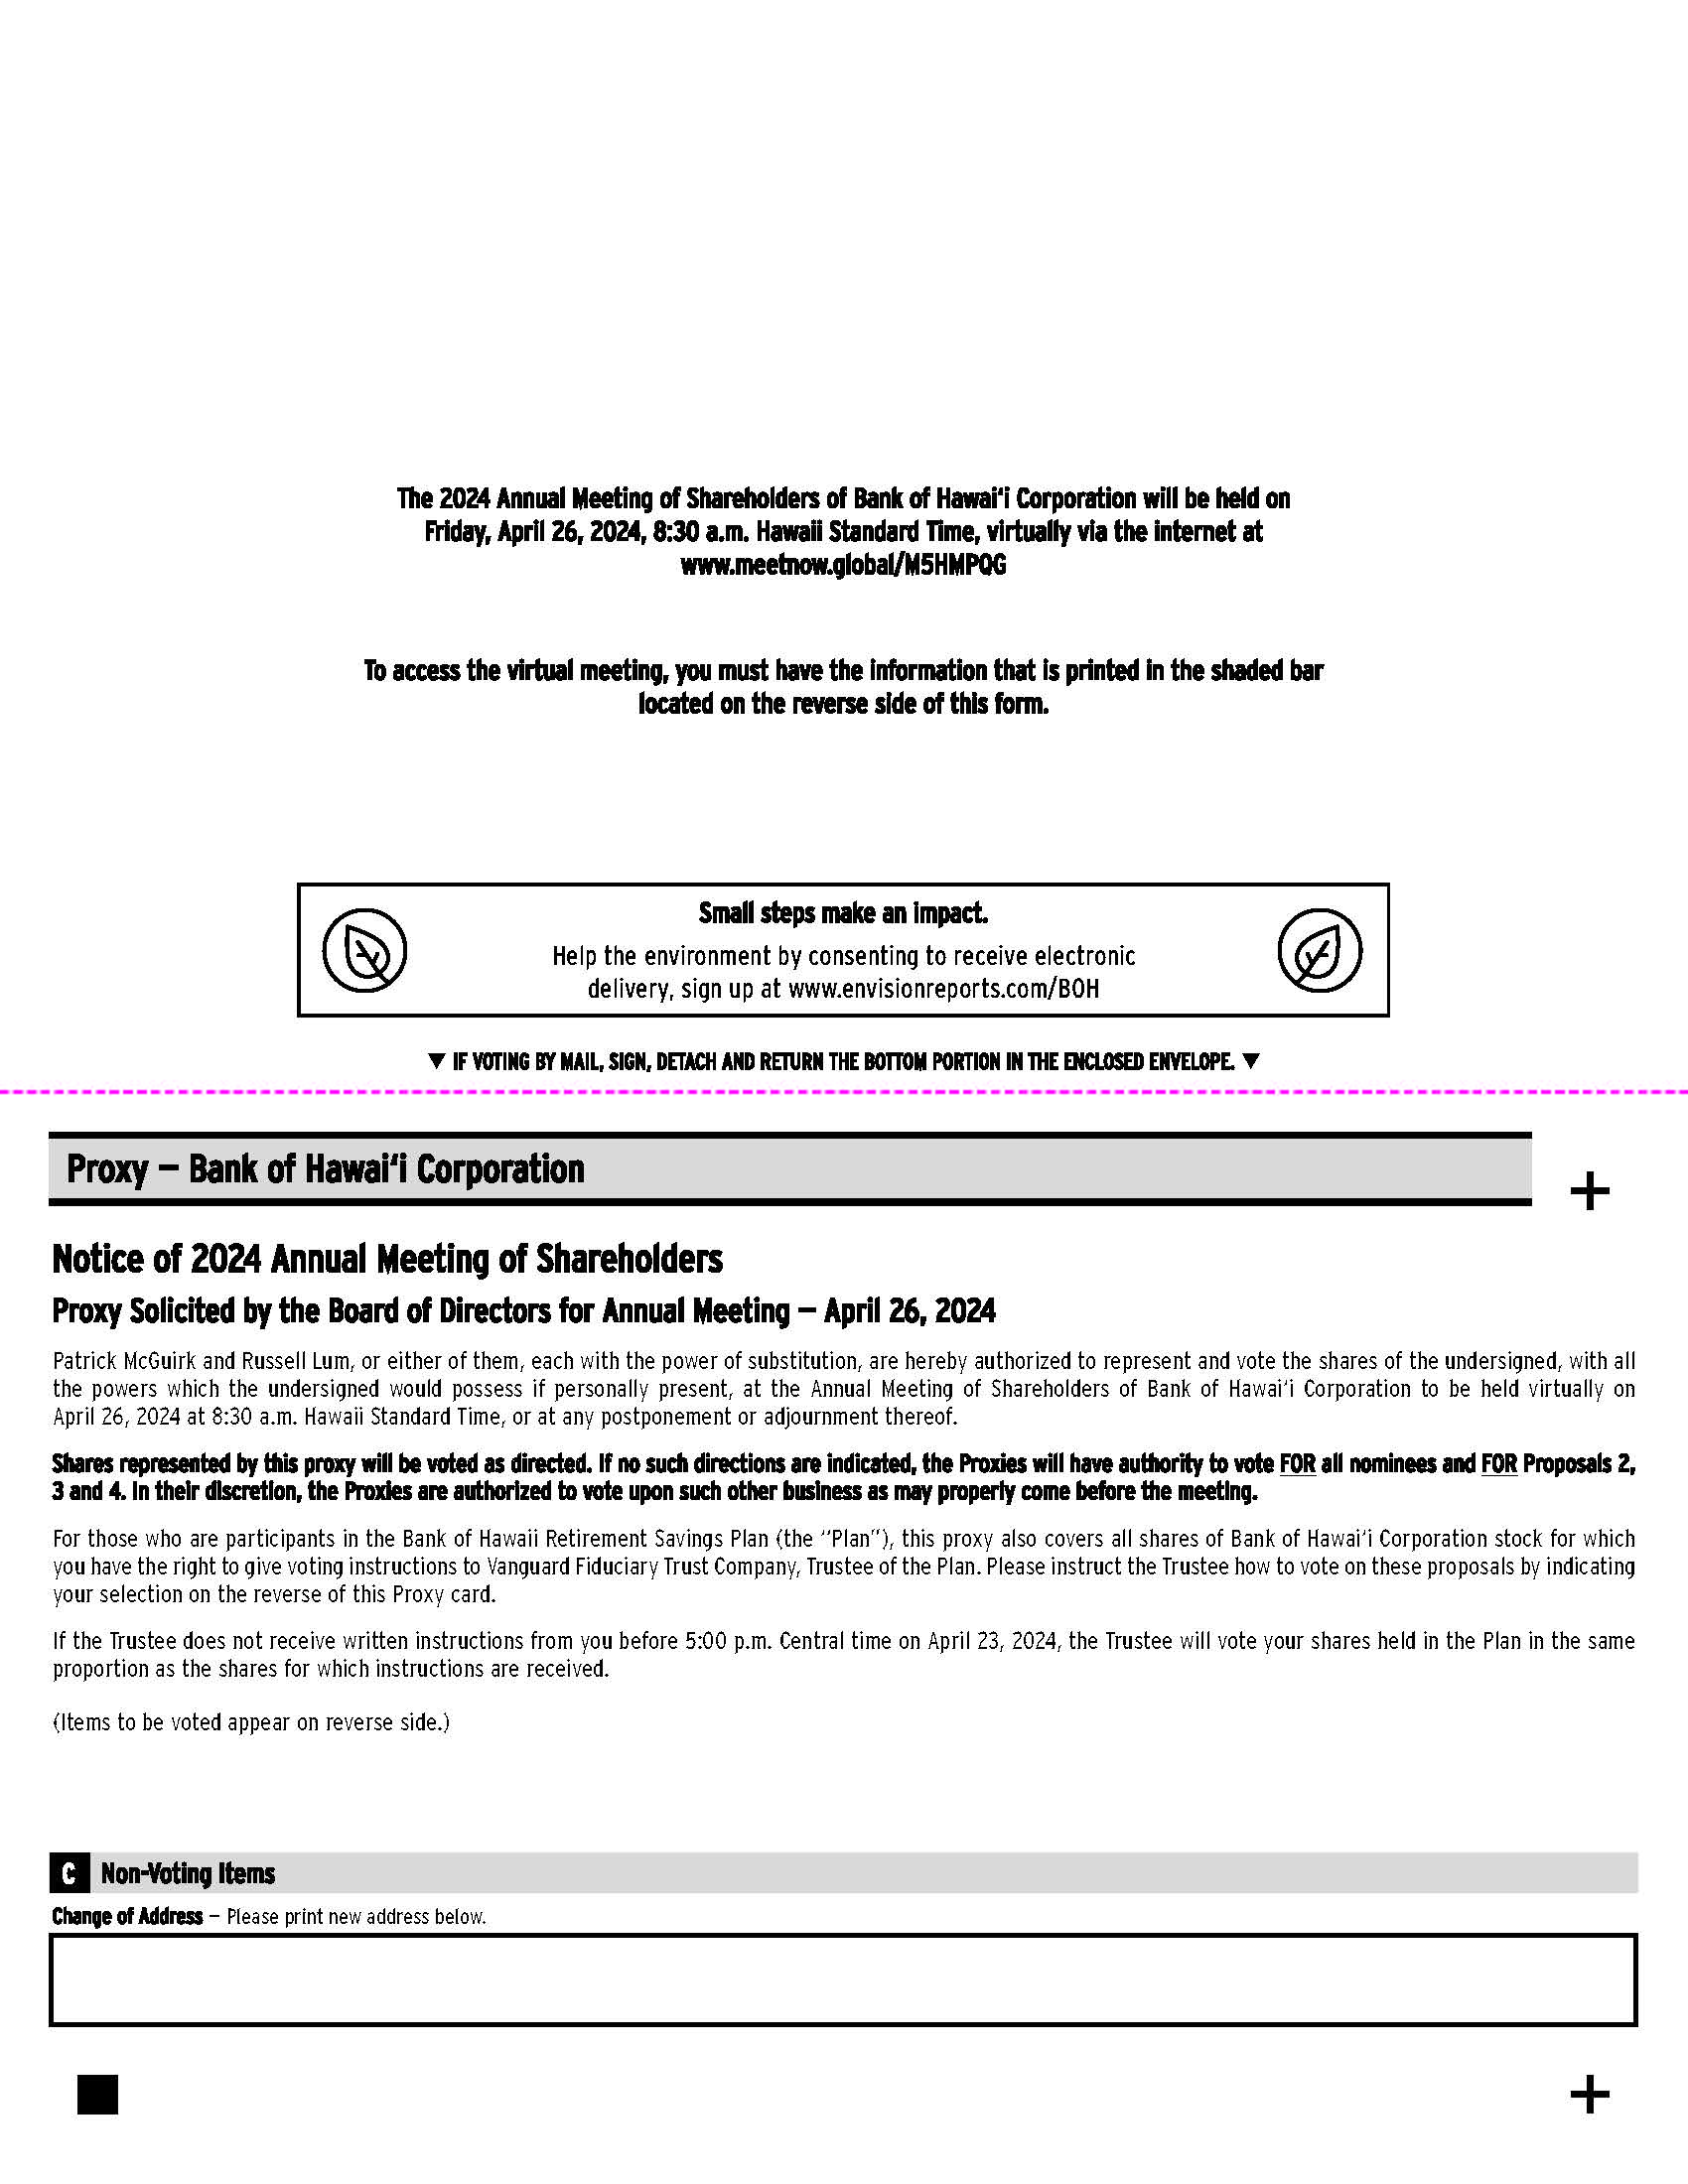
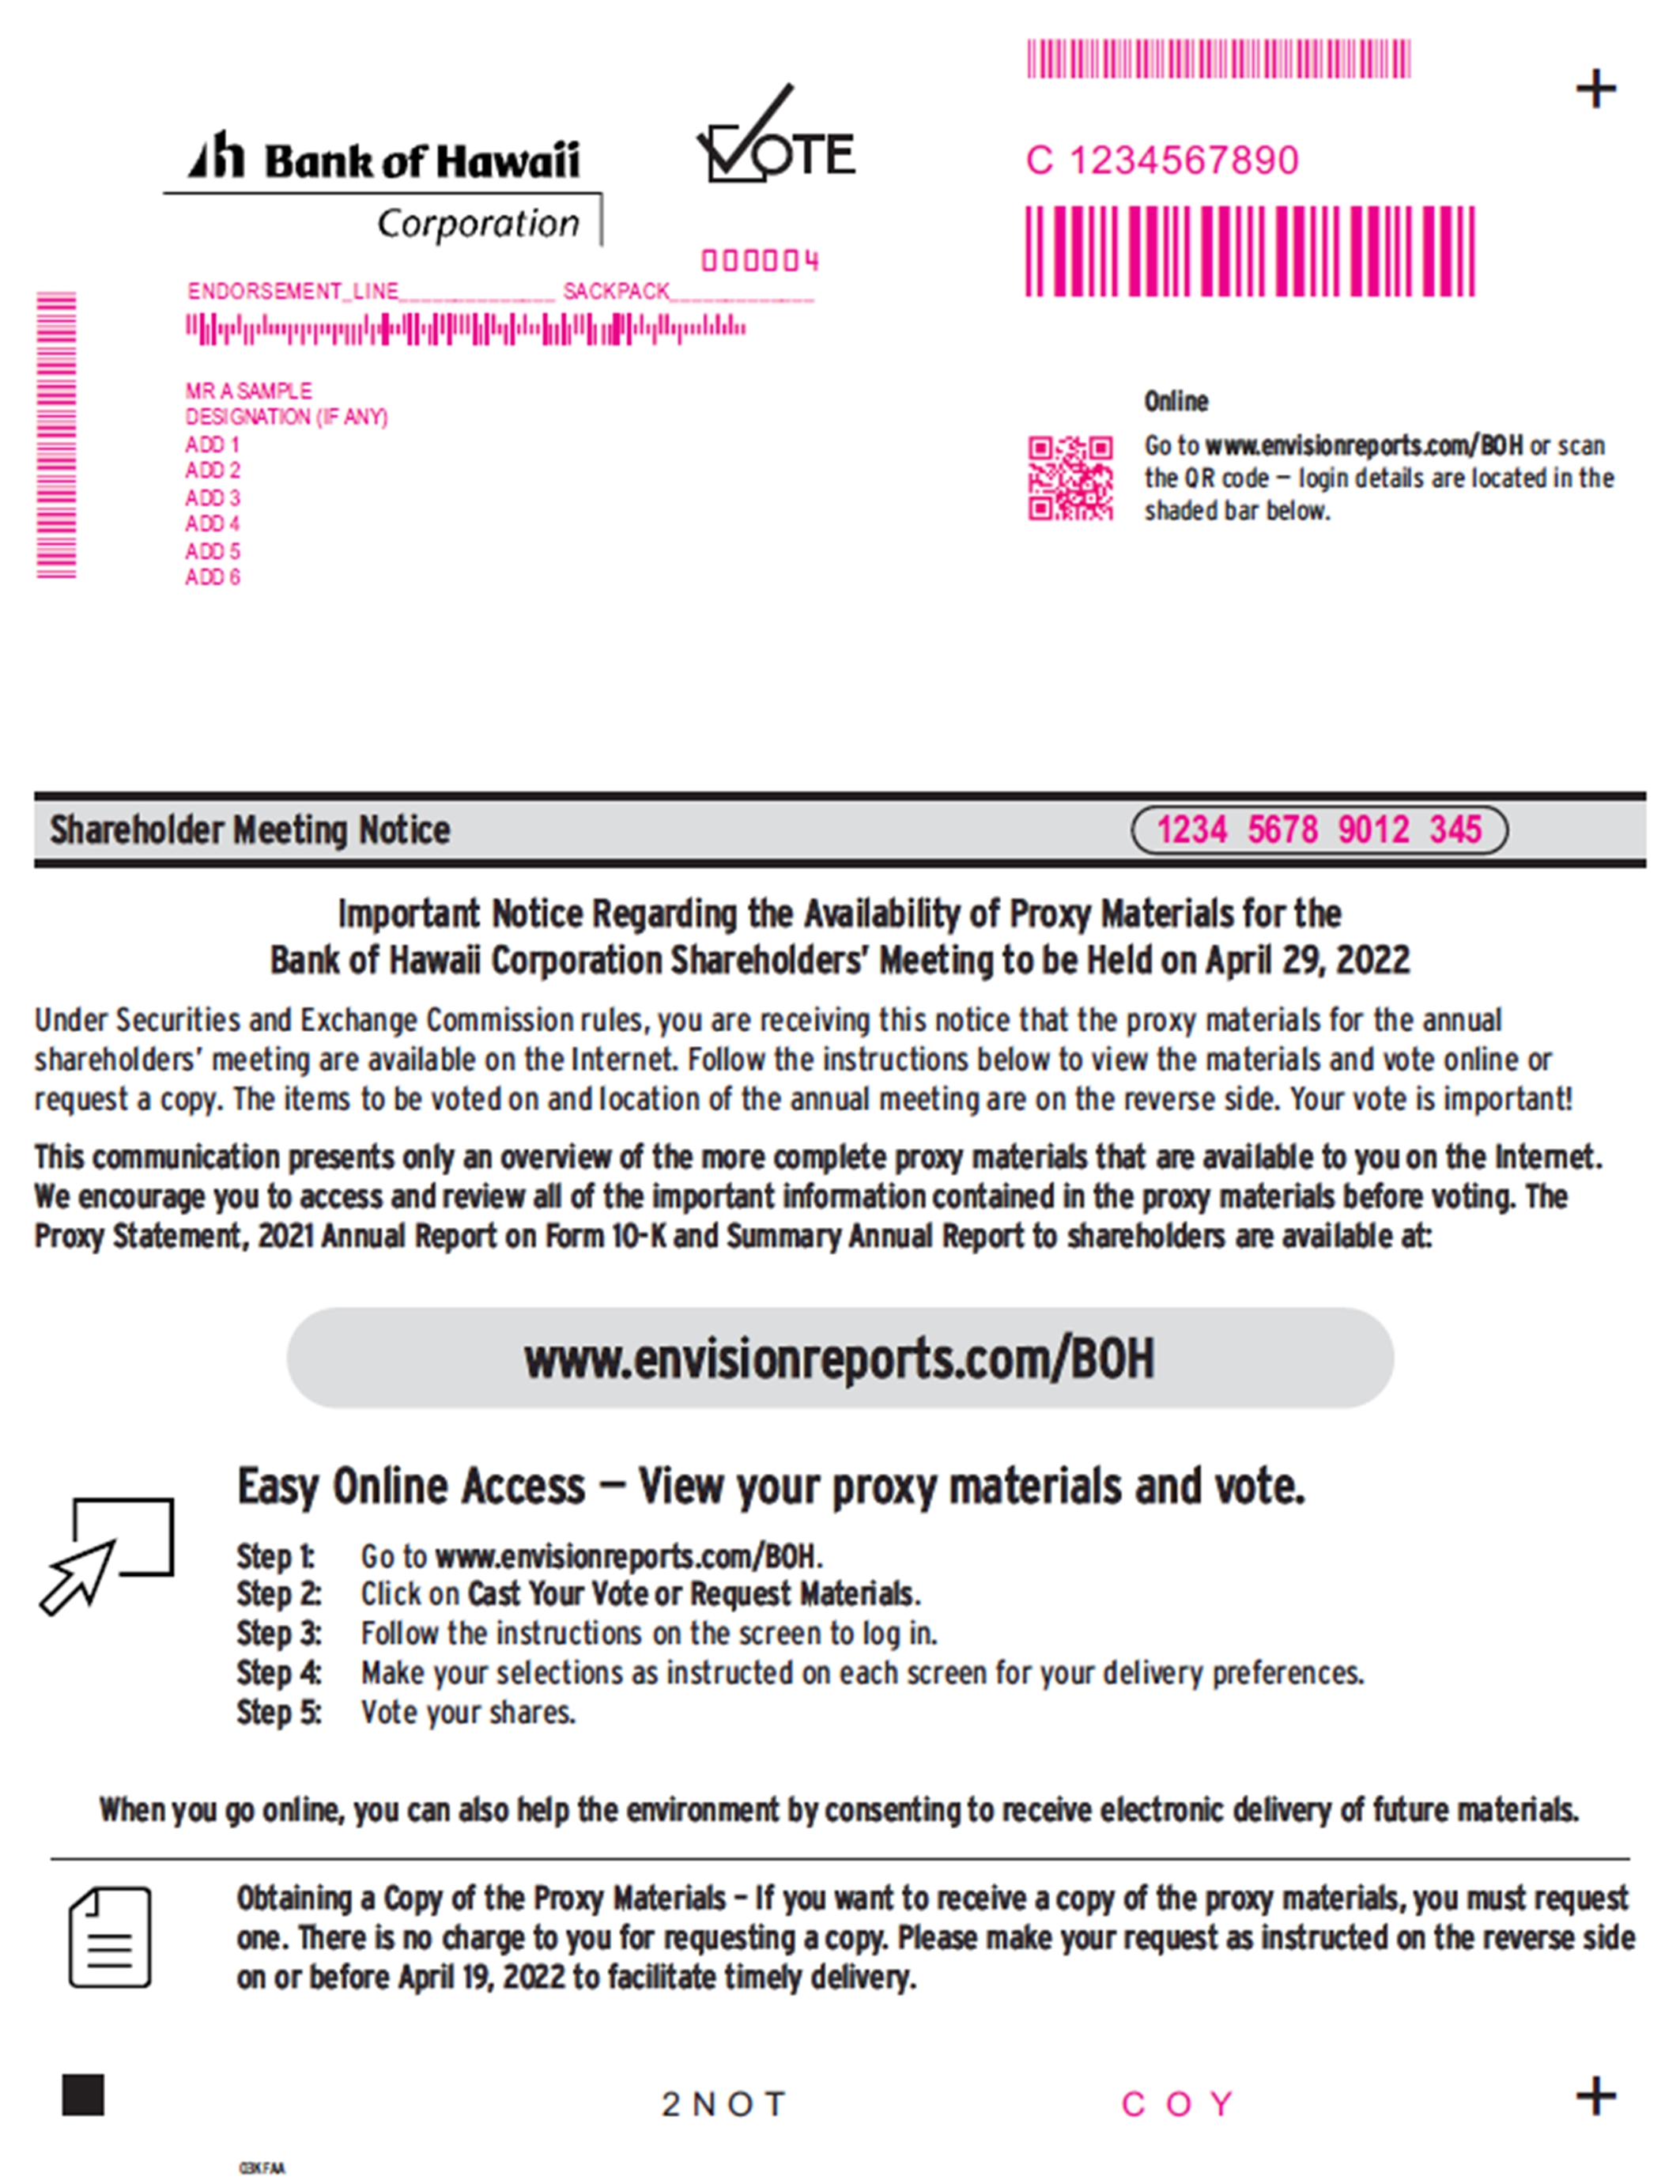
88
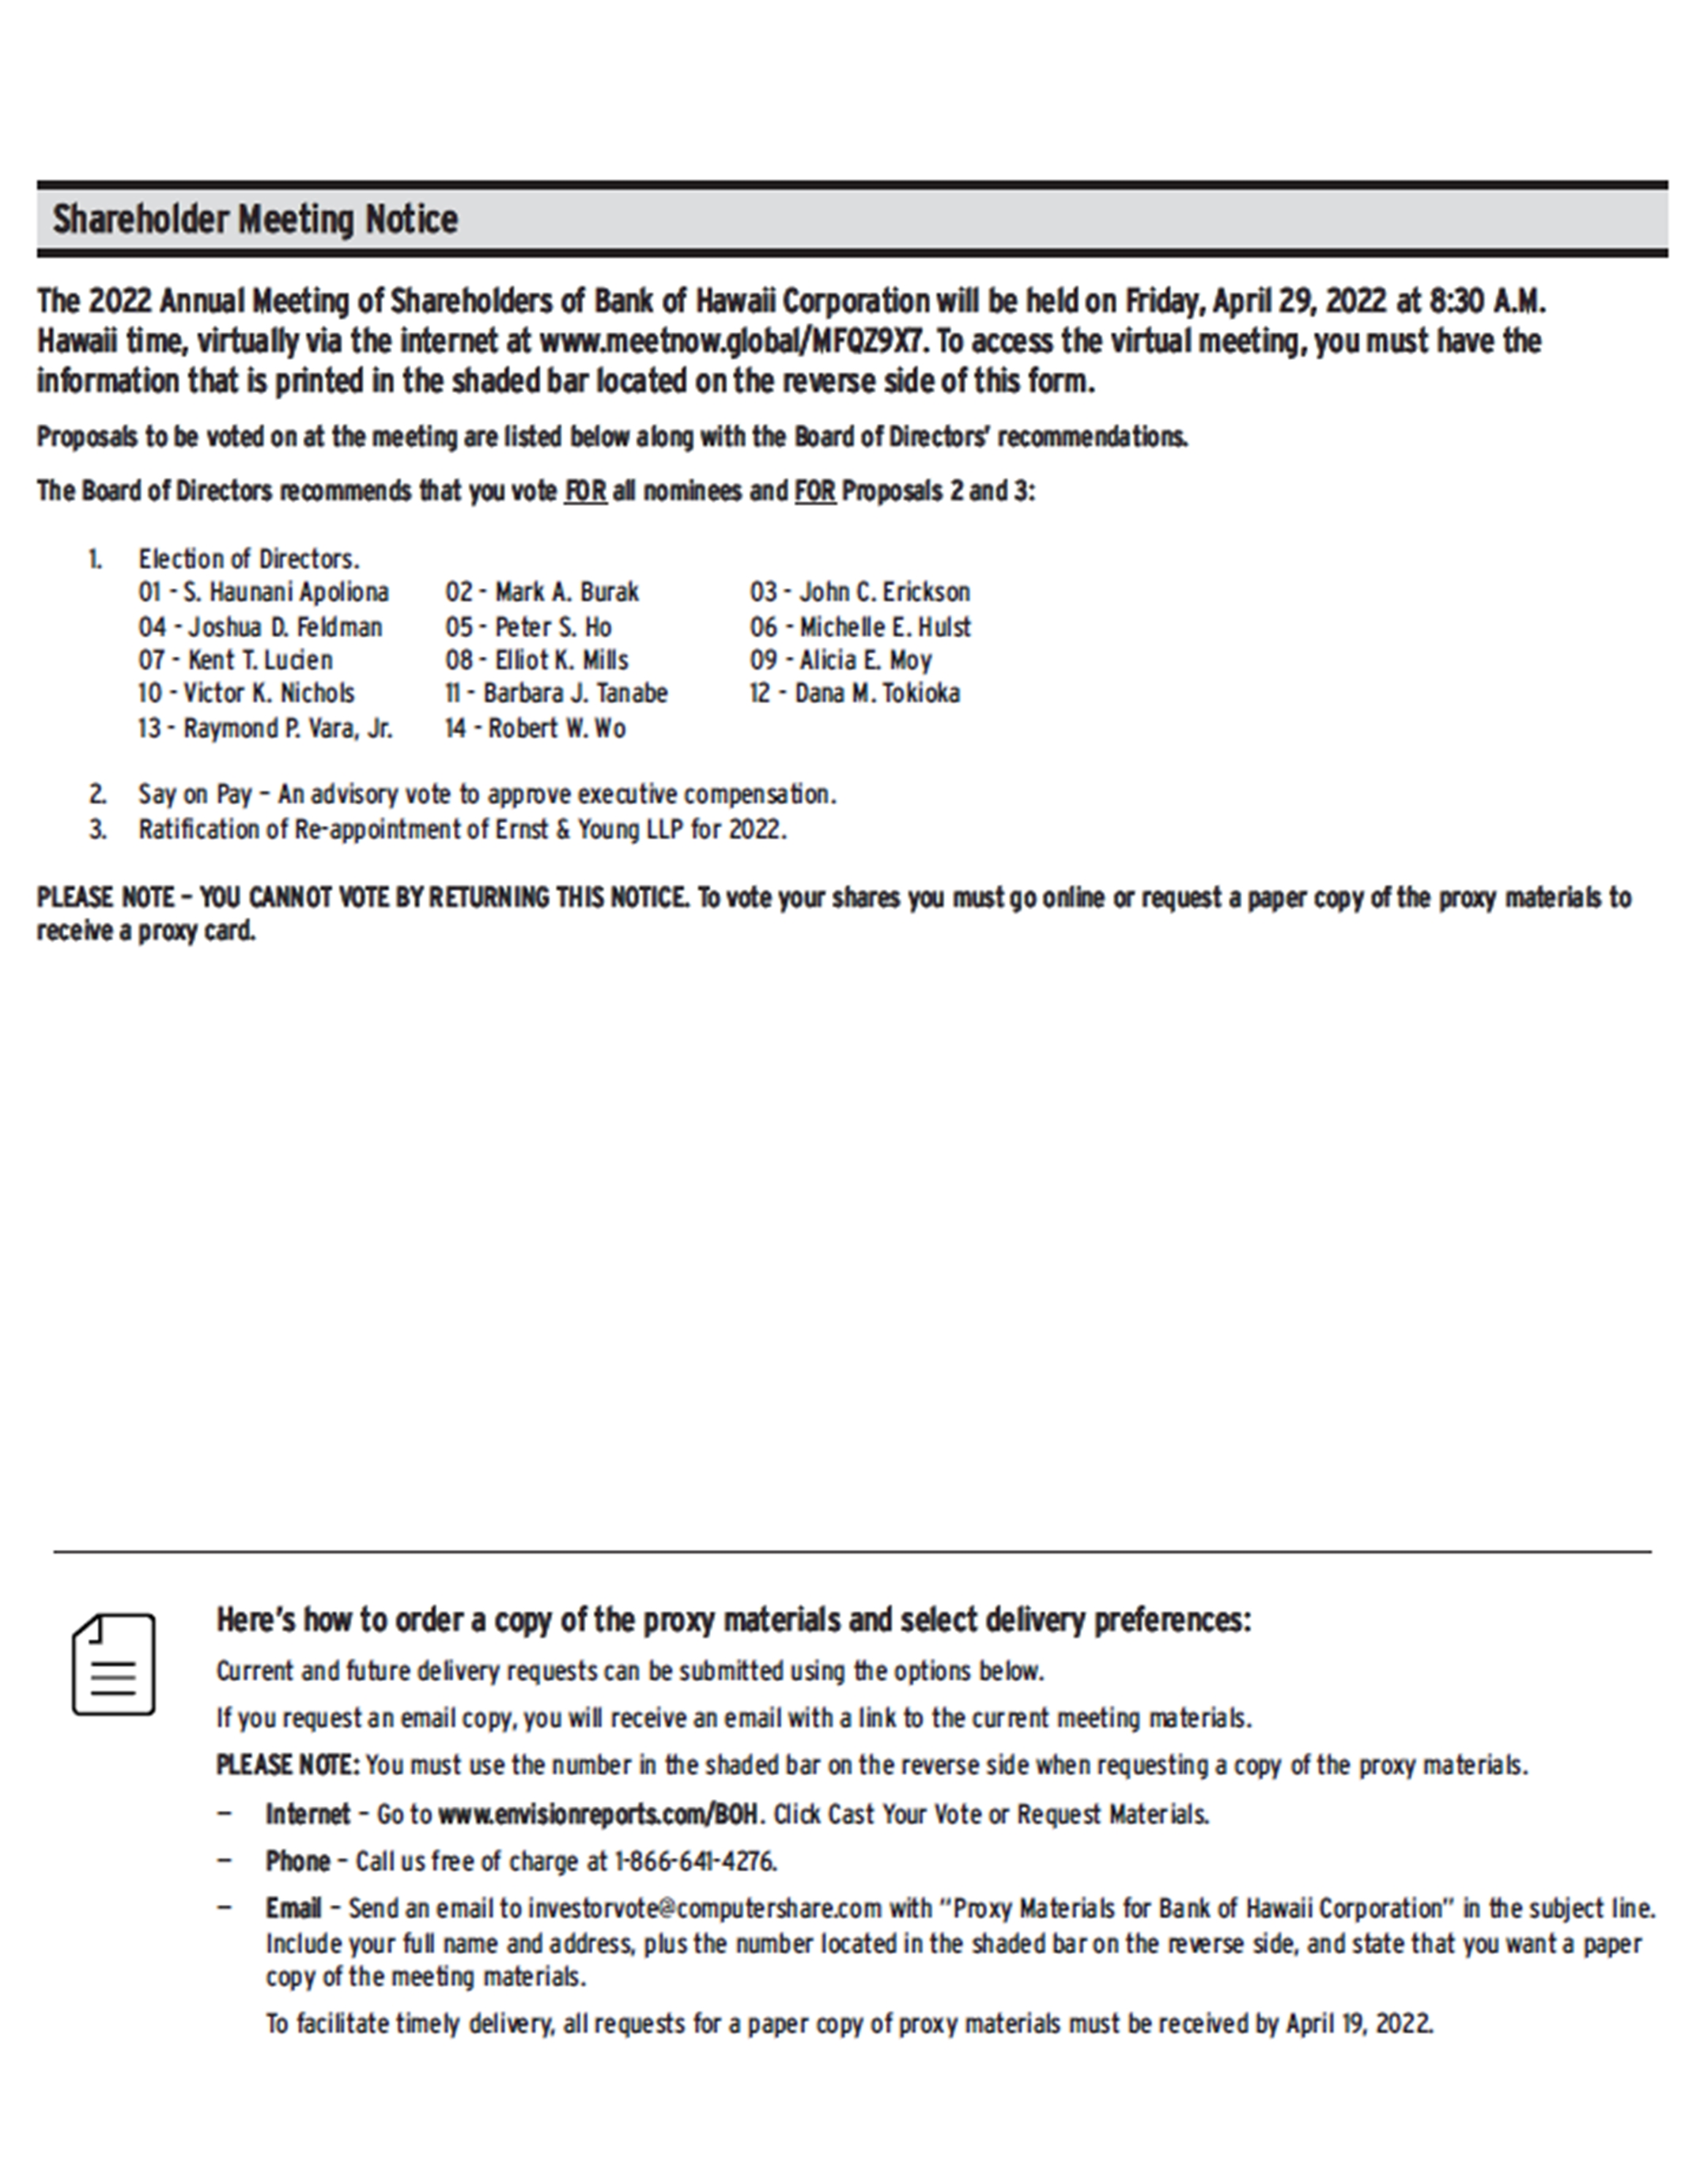
0