UNITED STATES
SECURITIES AND EXCHANGE COMMISSION
Washington, D.C. 20549
SCHEDULE 14A
Proxy Statement Pursuant to Section 14(a) of
the Securities Exchange Act of 1934 (Amendment No. )
Filed by the Registrant ☒
Filed by a Party other than the Registrant ☐
Check the appropriate box:
☐
Preliminary Proxy Statement
☐
Confidential, for Use of the Commission Only (as permitted by Rule 14a-6(e)(2))
☒
Definitive Proxy Statement
☐
Definitive Additional Materials
☐
Soliciting Material under §240.14a-12
HERTZ GLOBAL HOLDINGS, INC.
(Name of Registrant as Specified In Its Charter)
(Name of Person(s) Filing Proxy Statement, if other than the Registrant)
Payment of Filing Fee (Check all boxes that apply):
☒
No fee required
☐
Fee paid previously with preliminary materials
☐
Fee computed on table in exhibit required by Item 25(b) per Exchange Act Rules 14a-6(i)(1) and 0-11
| | |||||
Notice of 2024 Annual Meeting and Proxy Statement | |||||
| | |||||
![[MISSING IMAGE: lg_hertz-4c.jpg]](https://capedge.com/proxy/DEF 14A/0001104659-24-044996/lg_hertz-4c.jpg) | |||||

Hertz Global Holdings, Inc.
8501 Williams Road
Estero, FL 33928
April 9, 2024
You can attend and participate in the Internet at www.proxyvote.com, instead of providing2024 Annual Meeting, vote your shares electronically, and submit your questions during the proxy materialsmeeting by mail. On or about April 6, 2018, we will mail to our stockholders a Notice of Internet Availability of Proxy Materials (the “Notice”) containing instructions on how to access our proxy statement and annual report to stockholders for 2017 and how to vote. The Notice also contains instructions on how to receive a paper copy of your proxy materials.visiting www.virtualshareholdermeeting.com/HTZ2024.
Your vote is important, and we encourage you to vote as promptly as possible. Whether or not
On behalf of our entire team, I thank you plan to attendfor continued investment in Hertz and ongoing support of our company.
Sincerely,
![[MISSING IMAGE: sg_waynegilwest-bw.jpg]](https://capedge.com/proxy/DEF 14A/0001104659-24-044996/sg_waynegilwest-bw.jpg)
Wayne “Gil” West
Chief Executive Officer
Chief Executive Officer
| | | We are pleased to provide access to our proxy materials via the internet. Our Notice of 2024 Annual Meeting, Proxy Statement and Annual Report for the fiscal year ended December 31, 2023, are available at www.proxyvote.com We began making our proxy materials available on or about April 9, 2024. If you receive a Notice of Internet Availability of Proxy Materials by mail, you will not receive a paper copy of our Notice of 2024 Annual Meeting, Proxy Statement and Annual Report unless you specifically request a copy. You may request a copy by following the instructions on the Notice of Internet Availability of Proxy Materials. | | |
Notice of 2024 Annual Meeting
Time and Date: 1:00 PM (Eastern Time), Wednesday, May 22, 2024
Place: Via the 2018 Annual Meeting via the Internet, you may vote by following the instructions set forth in the Notice, this proxy statement or as set forth in the proxy card. If you attend the 2018 Annual Meeting via the Internet, you may vote your shares online. Log-in for the 2018 Annual Meeting will be available beginninginternet at 10:15 a.m. (Eastern Time). In order to vote and participatewww.virtualshareholdermeeting.com/HTZ2024
Who May Vote: Stockholders of record at the 2018 Annual Meeting, a stockholder must be a stockholder as of the close of business on Monday, March 25, 2024
| Items of Business: | | |||
| 1. | | | Election of three director nominees to our Board of Directors; | |
| 2. | | | Ratification of the appointment of Ernst & Young LLP as our independent auditor for the fiscal year ending December 31, 2024; | |
| 3. | | | Approval, on an advisory basis, of the compensation of our named executive officers; and | |
| 4. | | | Transaction of any other business properly brought before the 2024 Annual Meeting. | |
Even if you plan to virtually attend the record date, March 27, 2018. Thank you for considering the matters presented in the proxy statement.

![[MISSING IMAGE: sg_colleenbatcheler-bw.jpg]](https://capedge.com/proxy/DEF 14A/0001104659-24-044996/sg_colleenbatcheler-bw.jpg)
Colleen Batcheler
Executive Vice President, General Counsel and Secretary
Estero, Florida
April 9, 2024
Executive Vice President, General Counsel and Secretary
Estero, Florida
April 9, 2024
Table of StockholdersContents
| | | | | | | | ||
| | | | | | | | ||
| | | | | | | | ||
| | Director Nominees for Election at the 2024 Annual Meeting (Class III) | | | | | 3 | | |
| | Incumbent Directors | | | | | 5 | | |
| | Corporate Governance | | | | | 8 | | |
| | Board Committees and Membership | | | | | 10 | | |
| | Risk Oversight | | | | | 17 | | |
| | | | | | | | ||
| | | | | | | | ||
| | | | | | | | ||
| | Audit Committee Report | | | | | 24 | | |
| | | | | | | | ||
| | | | | | | | ||
| | Compensation Discussion and Analysis | | | | | 28 | | |
| | Compensation Committee Report | | | | | 49 | | |
| | 2023 Summary Compensation Table | | | | | 50 | | |
| | 2023 Grants of Plan-Based Awards | | | | | 52 | | |
| | Outstanding Equity Awards at 2023 Fiscal Year-End | | | | | 54 | | |
| | 2023 Option Exercises and Stock Vested | | | | | 56 | | |
| | Potential Payments Upon Termination or Change in Control | | | | | 57 | | |
| | CEO Pay Ratio | | | | | 61 | | |
| | Pay Versus Performance Disclosure | | | | | 62 | | |
| | | | | | | | ||
| | | | | | | | ||
| | | | | | | | ||
| | | | | | | |
| | ![[MISSING IMAGE: lg_hertzyellow-4clr.jpg]](https://capedge.com/proxy/DEF 14A/0001104659-24-044996/lg_hertzyellow-4clr.jpg) | | | i | | | | |
| | PROXY STATEMENT | | | | |
We are providing the enclosed proxy materials in connection with the solicitation by the Board of Directors of Hertz Global Holdings, Inc. is soliciting(“Hertz” or the “company”) of proxies to be usedvoted at the annual meeting2024 Annual Meeting of stockholders to be held on May 22, 2018Stockholders (the "2018“2024 Annual Meeting"Meeting”).
OUR COMPANY
Hertz Global Holdings, Inc. (Nasdaq: HTZ), beginning at 10:30 a.m. (Eastern Time) via the Internet as described below. This proxy statementthrough its subsidiaries and accompanying materials were filed with the Securitiesbenefit of the work of its franchisees, operates the Hertz, Dollar, Thrifty and Exchange Commission (the “SEC”) on April 3, 2018,Firefly vehicle rental brands throughout North America, Europe, the Caribbean, Latin America, Africa, the Middle East, Asia, Australia and New Zealand. We are one of the largest worldwide vehicle rental companies, and the Hertz brand is one of the most recognized rental car brands globally.
For more than a century, we expecthave been committed to first send the Notice of Internet Availability of Proxy Materials (the “Notice”) to stockholders on or about April 6, 2018.

seamless travel experience for the Annual Meetingmillions of customers we serve. As we continue to be held May 22, 2018
At the heart of our company is our people. We believe that to continue to evolve as a business, and Proxy Statementachieve our strategic goals, we must attract and retain the right talent. We therefore strive to have a constant focus on, and remain attentive to, matters concerning our employees. Our employees help drive our progress, innovation and success. We strive to empower our employees to build trust with our customers and the 2017 Annual Report to Stockholders are available at www.proxyvote.comcommunities we serve around the world.
Key Statistics — Full Year 2023
![[MISSING IMAGE: tb_keystatis-pn.jpg]](https://capedge.com/proxy/DEF 14A/0001104659-24-044996/tb_keystatis-pn.jpg)
| | |
| | |
 | 1 | | | | |
BOARD OF DIRECTORS & CORPORATE GOVERNANCE
Proposal 1: Election of Directors (Proposal 1)Three Director Nominees
| ||
| ||
| ||
| ||
| ||
Our business is managed under the direction of the Board of Directors (the “Board”) of Hertz Global Holdings, Inc. Currently, our Board is comprised of nine directors.
Our directors are divided into three classes, with one class of directors elected each year and each class serving a three-year term. The terms of our Class III directors expire at the 2024 Annual Meeting. Each of our Class I directors has a term that expires at the 2025 annual meeting of stockholders, and each of our Class II directors has a term that expires at the 2026 annual meeting of stockholders.
The structure of our Board was implemented in connection with our successful emergence, on June 30, 2021, from a voluntary Chapter 11 restructuring plan (the “Emergence”) that we undertook in the wake of the COVID-19 pandemic. Our Chapter 11 plan of reorganization was sponsored by a group (the “Sponsors”) comprised of, among others, funds associated with Knighthead Capital Management, LLC (“Knighthead”), Certares Management LLC (“Certares Management”) and Certares Opportunities LLC (“Certares Opportunities” and together with Certares Management and their affiliates, “Certares”). As part of the transactions undertaken pursuant to our plan of reorganization, CK Amarillo LP, which is an entity for which Knighthead and Certares Opportunities serve as investment managers, received approximately 41% of Hertz’s newly issued shares of common stock as of the Emergence date. In addition, as of June 30, 2021, four Sponsor affiliated individuals became directors on our Board: two directors identified by Knighthead (Thomas Wagner and Andrew Shannahan) and two directors identified by Certares Opportunities (M. Gregory O’Hara and Colin Farmer). Directors Wagner and O’Hara were subsequently nominated and elected by our stockholders to serve as Class I directors at the 2022 annual meeting of stockholders, and directors Shannahan and Farmer are being nominated for election by our stockholders to serve as Class III directors at the 2024 Annual Meeting.
In January 2023, Mr. O’Hara resigned from the Board due to competing professional responsibilities. The Board filled the vacancy created by Mr. O’Hara’s resignation by appointing Mr. Jeffrey Nedelman (who at the time was Senior Managing Director of Certares Management). Mr. Nedelman served on our Board until January 2024, at which time he resigned from the Board in connection with a change in his professional affiliation. Mr. O’Hara was re-appointed to the Board in January 2024 to fill the ensuing vacancy.
According to filings made with the Securities and Exchange Commission, or SEC, based on shares issued and outstanding as of March 25, 2024, and excluding the dilutive impact of our outstanding publicly traded warrants (Nasdaq: HTZWW), which are exercisable for shares of our common stock, CK Amarillo’s ownership percentage was approximately 59% of the company’s common stock.
Nothing in the company’s constituent documents provides Knighthead, Certares or their affiliates, including CK Amarillo, with the right to appoint or nominate individuals to the Board.
Upon the recommendation of its Governance Committee, the Board has considered and nominated the following slate of Class III director nominees for a three-year term expiring at our 2027 annual meeting of stockholders: Colin Farmer, Wayne “Gil” West and Andrew Shannahan.
The following biographies detail the age and principal occupations during at least the past five years for each director nominee, as well as for each other individual serving on our Board as of the date of this Proxy Statement. We have no reason to believe that any of the director nominees will be unable to serve if elected.
| | | | | 2 | | | | |
Director Nominees for Election at the 2024 Annual Meeting (Class III)
Colin Farmer
Mr. Farmer (50) has served as a director of the company since June 2021. He served as the Board’s Lead Director from August 2022 to April 2024 and has served as the Board’s Chair since April 2024.
Mr. Farmer has served as Senior Managing Director and Head of the Management Committee of Certares Management, an investment services firm, since 2014, and also serves on its Investment Committees. Mr. Farmer also serves on the boards of several private companies, including Internova Travel Group, AmaWaterways, Guardian Alarm, Mystic Invest, Avoya Travel and Certares Holdings. Prior to joining Certares, Mr. Farmer was Managing Director of One Equity Partners and, prior to that, a Principal at Harvest Partners. Mr. Farmer began his career as an analyst at Robertson Stephens & Company.
We believe that Mr. Farmer is qualified to serve on our Board in light of his expertise in capital markets and financial matters, as well as his governance experience achieved through service on other company boards.
Mr. Farmer is Chair of Hertz’s Compensation Committee and a member of its Governance Committee.
Andrew Shannahan
Mr. Shannahan (43) has served as a director of the company since June 2021.
Mr. Shannahan is Head of Research and a Partner at Knighthead, an event-driven and deep value focused SEC registered investment advisor founded in 2008 that specializes in investing in companies that need financial and operational restructuring since 2008, and serves as a member of the Investment Committee of certain funds managed by Knighthead. Prior to joining Knighthead, Mr. Shannahan served as a research analyst at Litespeed Partners, an event-driven hedge fund. Mr. Shannahan has served as a director of ATI Physical Therapy, Inc. since 2023. In addition to this public company directorship, Mr. Shannahan also has served on the board of private companies Homer City Generating since 2019, Bowhunter Holdings, LLC since 2022, Knighthead Holdings Ltd. and its subsidiaries since 2023, and Birmingham City Football Club since 2023.
We believe that Mr. Shannahan is qualified to serve on our Board because of his expertise in complex investment opportunities, finance and capital markets matters, as well as his governance experience achieved through service on other company boards.
Mr. Shannahan is Chair of Hertz’s Governance Committee and a member of its Compensation Committee.
Wayne “Gil” West
Mr. West (63) has served as Chief Executive Officer and a director of the company since April 1, 2024.
Mr. West served as Chief Operating Officer of Cruise LLC (“Cruise”), a self-driving car company, from January 2021 to December 2023. Prior to that, Mr. West served as Senior Executive Vice President and Chief Operating Officer of Delta Air Lines, Inc. (“Delta Air Lines”), a global airline company, from March 2014 until October 2020 and as Senior Vice President from March 2008 until March 2014. Prior to joining Delta Air Lines, Mr. West served as President and Chief Executive Officer of Laidlaw Transit Services, Inc., a provider of transportation services, from 2006 to 2007.
Mr. West has served as a member of the board of directors of Forward Air Corporation since February 2024, and previously from October 2018 until May 2021, and Virgin Galactic Holdings, Inc. since February 2021.
| | | | | 3 | | | | |
Mr. West previously served as a member of the board of directors of Genesis Park Acquisition Corporation from October 2020 until September 2021.
We believe that Mr. West is qualified to serve on our Board because of his extensive leadership, management and operations experience gained from his service with Delta Air Lines and Cruise and his governance experience achieved through service on other company boards.
| | | ![[MISSING IMAGE: ic_yellowtick-4c.jpg]](https://capedge.com/proxy/DEF 14A/0001104659-24-044996/ic_yellowtick-4c.jpg) | | | The Board of Directors recommends that stockholders vote FOR the election of each Class III director nominee to our Board of Directors. | | |
| | | | | 4 | | | | |
Incumbent Directors — Terms Expiring at the 2025 Annual Meeting (Class I)
Michael Gregory O’Hara
Mr. O’Hara (58) has served as a director of the company since January 2024 after previously serving on the Board from June 2021 to January 2023. Mr. O’Hara was originally appointed to the Board in connection with the Emergence, resigned from the Board due to his professional obligations, and rejoined the Board to fill a vacancy created upon the resignation of another director in January 2024.
Mr. O’Hara is Founder and Senior Managing Director of Certares Management, a firm that invests in the travel, tourism and hospitality sectors founded in 2012, and also serves as a member of its Management Committee. Mr. O’Hara co-founded GO Acquisition Corp., a special purpose acquisition company, and served as its Co-Chief Executive Officer and a member of its board of directors from 2020 to 2022. Prior to forming Certares, Mr. O’Hara served as Chief Investment Officer of JPMorgan Chase’s Special Investments Group and Managing Director of One Equity Partners, the private equity arm of JPMorgan. Before that, he served as an executive and a director at Worldspan Corporation, a privately held provider of travel technology and content.
Mr. O’Hara has served as a director of TripAdvisor, Inc. since March 2020 and served as its Vice Chairman from 2020 to 2023. He has also served as the Chairman of American Express Global Business Travel since 2014. In addition to his public company directorships, Mr. O’Hara has served as director of the World Travel & Tourism Council since 2019 and has been its Chair since 2023. He also serves on the board of Certares Holdings, where he is the Head of its Investment Committee and a member of its Management Committee. He is also a member of the Investment Committee and Management Committee of CK Opportunities Fund and Certares Real Estate Holdings.
We believe that Mr. O’Hara is qualified to serve on our Board because of his in-depth knowledge of the travel industry, his extensive background in investment analysis and management and his governance experience achieved through service with other companies.
Vincent J. Intrieri
Mr. Intrieri (67) has served as a director of the company since June 2016.
Mr. Intrieri is Chief Executive Officer and founder of VDA Capital Management LLC, a private investment fund founded in 2017. Mr. Intrieri was previously employed by entities associated with Carl Icahn from 1998 to 2016 in various investment-related capacities, including most recently as Senior Managing Director of Icahn Capital LP from 2008 to 2016, and as Senior Managing Director of Icahn Offshore LP from 2004 to 2016. Prior to that, Mr. Intrieri was a partner at Arthur Andersen LLP.
Mr. Intrieri has served as a director of Transocean Ltd. since 2014. Mr. Intrieri also served as a director of Navistar International Corporation from 2012 to 2021. Mr. Intrieri served as a director of numerous other publicly traded companies prior to 2019, including Energen Corporation, Conduent Incorporated, Chesapeake Energy Corporation, CVR Refining, LP, Forest Laboratories, Inc., CVR Energy, Inc. and Federal-Mogul Corporation, among others.
We believe that Mr. Intrieri is qualified to serve on our Board because of his expertise in finance and accounting matters, as well as international operations, strategy and public company governance.
Mr. Intrieri is Chair of Hertz’s Audit Committee.
| | | | | 5 | | | | |
Thomas Wagner
Mr. Wagner (54) has served as a director of the company and Vice Chair of the Board since June 2021.
Mr. Wagner is co-founder and Managing Member of Knighthead. Prior to forming Knighthead in 2008, Mr. Wagner served as Managing Director at Goldman Sachs and held roles at Credit Suisse First Boston and Ernst & Young, LLP.
Mr. Wagner serves on the boards of several private entities, including Knighthead Annuity & Life Assurance Company since 2014, serving as its Co-Chairman since 2014, Trinity Cyber, Inc. (“Trinity Cyber”) since 2016, serving as its Chairman since 2018 and Singer Vehicle Design since 2021. He also serves on the Board of Trustees of Villanova University, the National Advisory Board for Youth Inc. and the National Leadership Council for the Navy SEAL Foundation.
We believe that Mr. Wagner is qualified to serve on our Board because of his knowledge of business restructurings and his significant financial and strategic expertise.
Incumbent Directors — Terms Expiring at the 2026 Annual Meeting (Class II)
Jennifer Feikin
Ms. Feikin (56) has served as a director of the company since July 2021.
Ms. Feikin was an independent business advisor, focusing on advising non-profits, start-up companies and large media companies, from 2007 until 2020. Prior to that, Ms. Feikin served as Director of Google Video at Google, Inc. (now Alphabet, Inc.), and previously held various roles at AOL Time Warner, 20th Century Fox and Fox Searchlight, Morgan Creek Productions and McKinsey & Company.
Ms. Feikin has been a mutual fund board member, serving on the boards of directors of American Funds Insurance Funds, American Funds Fund of Funds, and American Funds Fixed Income Funds since 2023 and Capital Group Exchange Traded Funds since their inception in 2021. Ms. Feikin also served on the board of directors of Capital Group Private Client Services Funds, Capital Group U.S. Equity Fund, American Funds International Vantage Fund, American Funds Global Insight Fund, and Emerging Markets Growth Fund from 2019 through 2022. Ms. Feikin currently serves on the Board of Trustees of The Nature Conservancy of Utah.
We believe that Ms. Feikin is qualified to serve on our Board because of her expertise in digital technology, innovation and consumer development, her experience in strategic development, and her corporate governance experience achieved through service as an independent mutual fund director.
Ms. Feikin is a member of Hertz’s Audit Committee and Governance Committee.
Mark Fields
Mr. Fields (63) has served as a director of the company since June 2021. He served as our Interim Chief Executive Officer from October 2021 to February 2022.
Mr. Fields is a Senior Advisor at TPG Capital LP, a private equity firm, a role he has held since 2017. He previously served as President and Chief Executive Officer of Ford Motor Company from 2014 to 2017. Mr. Fields joined Ford in 1989 and held various senior leadership roles throughout his tenure, including Chief Operating Officer, Executive Vice President & President of the Americas, Executive Vice President and
| | | | | 6 | | | | |
Chief Executive Officer of the Premier Automotive Group and Ford Europe, Chairman and Chief Executive Officer of the Premier Automotive Group, and President and Chief Executive Officer of Mazda Motor Corporation, where he also served as a director.
Mr. Fields serves as a director of QUALCOMM, Incorporated, since 2018. Previously, Mr. Fields served as a director of TPG Pace Beneficial II Corp. from 2021 to 2023, TPG Pace Solutions Corp. in 2021, Ford Motor Company from 2014 to 2017, and IBM Corp. from 2016 to 2018. In addition to his public company directorships, Mr. Fields serves as Lead Independent Director of Tanium, a privately held cybersecurity and systems management company, a board he joined in 2020, and has served on the boards of Planview and Boomi, both of which are privately held software companies, since 2022.
We believe that Mr. Fields is qualified to serve on our Board because of his expertise in the automotive industry on a global scale, his extensive experience as a senior executive at a large, multinational company, and his corporate governance experience achieved through service as an independent director on a variety of public company boards.
Evangeline Vougessis
Ms. Vougessis (53) has served as a director of the company since September 2021.
Ms. Vougessis is the co-founder and Chief Executive Officer of Moneikos Global Asset Management (Monaco) (“Moneikos”), an independent asset management company. She has held this role since April 2014. In addition to her role as co-founder and CEO of Moneikos, Ms. Vougessis is the co-founder of MaxInvest Holdings, a single-family office that invests in startups and early-stage companies. Prior to founding Moneikos, Ms. Vougessis served in various roles in the European and UK financial sectors. Among them, Ms. Vougessis served as Country Analyst for the Greek Equities Market at ABN AMRO UK and as Investor Relations & Strategy Director at Marfin Investment Group and subsequently at Marfin Popular Bank Group.
We believe that Ms. Vougessis is qualified to serve on our Board because of her significant capital markets expertise, including within the European financial markets.
Ms. Vougessis is a member of Hertz’s Audit Committee and Governance Committee.
| | | | | 7 | | | | |
Corporate Governance
Our Board is committed to good corporate governance and promoting the long-term interests of our stockholders by adopting structures, policies and practices that we believe promote responsible oversight of management. To this end, our ownership structure may qualify us as a “controlled company” under the applicable rules of The Nasdaq Stock Market, which we refer to as the Nasdaq Rules. Controlled companies are not required to comply with various corporate governance requirements. These requirements include having a majority of independent directors and having independent Compensation and Governance Committees. Although we may qualify as a controlled company, our Board regularly evaluates its governance practices and has elected not to make use of any of the exceptions to the Nasdaq Rules. Notably, features of our corporate governance structure include:
•
Fully Independent Standing Committees
•
Regularly Scheduled Executive Sessions of the Board
•
Board and Committee Evaluation Processes
•
Board Retirement Age
•
Orientation and Continuing Education for Directors
•
Stockholder Rights to Call Special Meetings
Corporate Governance Guidelines
The Board has adopted Corporate Governance Guidelines that provide a framework for its governance. The Corporate Governance Guidelines contain, among other matters, criteria for the Governance Committee to determine director qualifications, as well as policies regarding director independence, the generally applicable retirement age for directors, simultaneous service on other boards and the impact of substantial changes relating to a director’s affiliation or position of principal employment. Several of the items contained in the Corporate Governance Guidelines are summarized here. Copies of our Corporate Governance Guidelines are available without charge on the “Investor Relations” portion of our website at ir.hertz.com/about/corporate-governance.
Board Independence
Our Corporate Governance Guidelines require that the Board be composed of a majority of “independent” directors, as defined under the Nasdaq Rules. The independence definition under the Nasdaq Rules includes a series of objective tests. In addition to meeting these tests, our Corporate Governance Guidelines and the Nasdaq Rules provide that no director will be deemed independent unless the Board affirmatively determines that the director has no relationship which, in the opinion of the Board, would interfere with the exercise of independent judgment in carrying out his or her responsibilities as a director.
In determining Mr. Fields’ independence, the Board considered his prior service as Interim CEO from October 5, 2021 until February 27, 2022 (which was less than one year) and his compensation for that service (which vested or was earned not later than the date his employment ended). The Board determined
| | | | | 8 | | | | |
that Mr. Fields’ service and compensation would not interfere with his exercise of independent judgment in carrying out his responsibilities as a director. In determining Mr. O’Hara’s independence, the Board considered the fact that he is no longer affiliated with GT Racing, Ltd. (“GT Racing”), which owns a race car sponsored by the company.
The Board has affirmatively determined that Carolyn Everson, Ms. Mukherjeeeach member of the Audit Committee meets the heightened independence requirements for audit committee membership under applicable Nasdaq Rules and Messrs. Barnes, Cho, Intrieri, KeizerRule 10A-3(b)(1) under the Securities Exchange Act of 1934, as amended (the “Exchange Act”), and Ninivaggi are “independent” as definedthat each member of the Compensation Committee meets the heightened independence requirements for compensation committee membership under applicable Nasdaq Rules and Rule 10C-1(b)(1) under the Exchange Act.
Board Leadership
As indicated in the federal securities laws and applicable NYSE rules for service on our Board. The standards for determining director independence are specified in Annex A to our Corporate Governance Guidelines.Guidelines, the Board believes it is important to retain flexibility to allocate the responsibilities of the offices of the Chair and CEO in a manner that is in the best interests of the company. Accordingly, the Board evaluates its structure from time to time. During 2023, our Board combined the roles of the Chair and CEO. In making this leadership structure determination, the Board considered many factors, including the specific needs of the business and methods for conducting efficient Board meetings during a period of significant change at the company. The Board believed that Mr. Scherr, the company’s CEO during 2023, was the most appropriate person to serve as Chair because he possessed an in-depth understanding of the issues, opportunities and challenges facing our business.
•
Presided at all meetings of the Board at which the Board Chair or any Vice Chair was not present, including the executive sessions of independent directors;
•
Acted as a liaison between the independent directors and the Board Chair as the Lead Director deemed appropriate, including by providing the Board Chair with feedback from executive sessions of independent directors and with respect to meeting schedules, agendas and information to be classified as independent,provided to the NominatingBoard; and Governance Committee also considered whether there were any facts or circumstances that might impair the independence of each of those directors. In particular, the Nominating and Governance Committee considered
•
If requested by major stockholders, ensured that the Company,Lead Director was available for consultation and direct communication.
In April 2024, the Board’s leadership structure was changed. Mr. Farmer, an independent director, was appointed Chair of the Board. With the CEO and Board Chair roles separated, the Lead Director role was eliminated. Mr. Wagner remains Vice Chair of the Board.
The Board believes that its leadership structure allows the Board to effectively provide oversight, evaluate the performance of management, engage on strategy and succession planning, and uphold strong governance standards.
Board Refreshment
The Board believes in the ordinary courseimportance of business, provides productsbalancing tenure and servicesrefreshment in its membership. The Board does not have a limit on the number of years that a director may serve. However, the Board maintains a policy that absent a waiver, no director should be nominated to and purchases products and services from, companies at which someserve after that person has reached the
| | | | | 9 | | | | |
age of 76. The average tenure as of the date of this Proxy Statement of our directors serve, are affiliated with or are otherwise employed. In each case: (i) the relevant products and services were provided on terms and conditions determined on an arm’s-length basis and consistent with those provided by or to similarly situated customers and suppliers and (ii) the aggregate amounts of such purchases and sales wereis less than 2% of the consolidated gross revenues of (a) each of the Companythree years and the other company in 2017 and 2016 and (b) eachaverage age of former Hertz Holdings and the other company in 2015.our directors is 56.
Director Attendance
Our Board held twelvenine (9) meetings in 2017.2023. Each of our incumbent directors who served on our Board during 2023 attended 75% or more of the totalaggregate number of Board meetings and meetings of their respective Board committees.
Directors are encouraged and expected, but not required, to attend our annual meeting of stockholders. All directors serving as of the date of the 2023 annual meeting attended.
Other Governance Practices
Annual Evaluations. The Board held duringconducts an annual self-evaluation, as does each of its standing committees. Each committee reports to the period in which he or she wasBoard on its evaluation.
Regular Executive Sessions of the Board. The Board meets on a directorregularly scheduled basis and the number of meetings held byholds an independent executive session at every regularly scheduled meeting. The Board Chair presides at all Board committees on which hemeetings. During 2023, the Lead Director presided at all Board executive sessions of independent directors.
Changes in Principal Occupation or she served. We do not have a policy regarding directors’ attendance at our annual meeting. All of our directors standing for re-election attended the 2017 Annual Meeting.
| ||
| ||
Orientation and Director Education. We provide new directors with management our guidelines and policies and the commitment of internal audit resources as they relateorientation materials to risk management. The Technology Committee oversees cybersecurity risk and other technology risks. As described below, the Compensation Committee strives to create compensation incentives that encourage a level of risk-taking behavior consistentfamiliarize them with the Company’s business strategy.
Stockholder Communications with the Board
Stockholders and other interested parties who wish to contact our directors may send written correspondence to:
Hertz Global Holdings, Inc.,
Attention: Corporate Secretary
8501 Williams Road
Estero, Florida 33928 Attention: Corporate Secretary.
Attention: Corporate Secretary
8501 Williams Road
Estero, Florida 33928
Communications addressed to directors that discuss business or other matters relevant to the activities of our Board will be preliminarily reviewed by the office of the Corporate Secretary and, thenif appropriate for the Board, distributed either in summary form or by delivering a copy of the communication to the director, or group of directors, to whom they are addressed. Items that are unrelated to the duties and responsibilities of the Board will not be forwarded.
Board Committees and Membership
Our Board’s standing committees are the Audit Committee, Compensation Committee and Governance Committee. Each committee has a written charter, and each charter is available on our website at https://ir.hertz.com/about/Board%20Committees.
| | |||||||
| 10 | | | | |
The following table sets forth the biographical information contained in "Election of Directors (Proposal 1)."
| | Director | | | | Audit | | | | Compensation | | | | Governance | |
| | Colin Farmer | | | | | | | | Chair | | | | X | |
| | Jennifer Feikin | | | | X | | | | | | | | X | |
| | Mark Fields | | | | | | | | | | | | | |
| | Vincent J. Intrieri | | | | Chair | | | | | | | | | |
| | M. Gregory O’Hara | | | | | | | | | | | | | |
| | Andrew Shannahan | | | | | | | | X | | | | Chair | |
| | Evangeline Vougessis | | | | X | | | | | | | | X | |
| | Thomas Wagner | | | | | | | | | | | | | |
| | Wayne “Gil” West | | | | | | | | | | | | | |
Additional information about each of our standing Board committees follows.
| | Audit Committee | |
Members: Jennifer Feikin, Vincent J. Intrieri (Chair), Evangeline Vougessis
Total Meetings in 2023: 9
Primary Responsibilities:
•
Oversees our accounting, financial and external reporting policies and practices, as well as the integrity of our financial statements and the effectiveness of our systems of internal controls.
•
Prepares the Audit Committee Report included in our proxy statement.
•
Monitors the independence, qualifications and performance of our independent registered public accounting firm.
•
Oversees the performance of our internal audit function, management information systems and operational policies and practices that affect our internal controls.
•
Monitors our compliance with legal and regulatory requirements.
•
Oversees treasury and finance matters.
| | | | | 11 | | | | |
•
Oversees our enterprise-wide risk management process, including cybersecurity risks and other technology risks.
Financial Expertise and Financial Literacy of Audit Committee Members
The Board has determined that Mr. Intrieri satisfies the SEC’s criteria for “audit committee financial expert” and the Nasdaq financial sophistication requirement. Additionally, the Board has determined that each member of the Audit Committee has the financial literacy required by the Company. The nomination must contain Nasdaq Rules.
Related Person Transaction Policy and Procedures
In the ordinary course of our business, we engage in millions of rental transactions with customers and procure goods and services from a wide variety of vendors. Some of our customers and vendors may be associated with members of our Board or the Sponsors. We also have relationships and agreements with travel industry participants that may have one or more of our Sponsors or their affiliates as investors, directors or officers.
We maintain a Related Person Transaction Policy and Procedures (the “RPT Policy”) approach that assists the Board in reviewing and approving (or ratifying, if advance approval is not feasible) transactions involving directors, executive officers, director nominees, persons known to the company to be the beneficial owner of more than 5% of our voting securities, and immediate family members of the foregoing (each, a “related person”). Application of the RPT Policy is managed by the Audit Committee.
For purposes of the RPT Policy, a “related person transaction” has the same meaning given to such term under the Securities Exchange Act of 1934 (the “Exchange Act”), which generally is a transaction, arrangement, or relationship since the beginning of the company’s last fiscal year in which:
•
the company was or is to be a participant;
•
the amount involved exceeds $120,000; and
•
any applicable information set forth inrelated person had or will have a direct or indirect material interest.
In reviewing a proposed related person transaction, the Company’s By-laws. The NominatingAudit Committee (or such other disinterested members of a Board committee or the Board, as applicable) will consider the relevant facts and Governancecircumstances it deems appropriate or necessary, including the material terms, relationships involved and rationale for the company to enter into such transaction. If the related person transaction involves a non-employee director or nominee, the Audit Committee will consider and evaluate persons nominated by stockholderswhether the transaction would compromise such director’s status as (i) an independent director under applicable Nasdaq Rules; (ii) a “non-employee director” under Rule 16b-3 of the Exchange Act; or (iii) an independent director under Rule 10A-3 or Rule 10C-1 of the Exchange Act. In addition, under the RPT Policy, a related person transaction should not be approved or ratified unless, after considering all relevant information, it is determined in good faith that the same mannertransaction is in, or is not inconsistent with, the best interests of the company.
The Audit Committee has approved each of the following transactions under the RPT Policy. None of the transactions involve organizations for which any of our independent directors serves as it considers and evaluates other potential directors. The Nominating and Governance Committee also takes into consideration any written arrangements for director nominations the Company is a party to, including the Confidentiality Agreementan officer, partner or controlling stockholder.
•
During 2022, we entered into a sponsorship agreement with Carl Icahn, described under “Certain RelationshipsGT Racing, which owns a race car competing in the FIA World Endurance Championship circuit. The sponsorship agreement grants Hertz commercial, partnership and Related Party Transactions — branding opportunities for three years. GT Racing is owned by Mr. Wagner. During 2023, Hertz paid GT Racing $7.9 million in connection with the sponsorship.
| | | | | 12 | | | | |
•
During 2023, we entered into an agreement with Trinity Cyber for the provision of hardware, software, and professional services associated with network penetration prevention solutions. Mr. Wagner is the Chair of, and an investor in Trinity Cyber, together with, among others, various funds and other individuals associated with Knighthead. During fiscal 2023, Hertz paid Trinity Cyber $1.05 million for its cybersecurity services.
•
We are party to various ordinary-course commercial agreements with entities associated with Certares, given Certares’ position as an investor in travel, tourism and hospitality businesses.
○
Agreements with GBT Travel Services UK Limited (d/b/a American Express Global Business Travel) or its affiliates (collectively, “Amex GBT”): Under the Icahn Group.”agreements, Amex GBT offers our vehicle rentals through its travel service platform, and in return, we pay Amex GBT fees based on the resulting revenue. Amex GBT is partially owned by Certares. Mr. O’Hara serves as its Chairperson. 2023 revenue generated pursuant to the agreements was less than 3% of our consolidated gross revenues.
Travel Leaders Group Holdings, LLC (d/b/a Internova Travel Group) (“Internova”): Under our agreement, Internova provides us with rental referrals through associated entities throughout North America. In exchange for these referrals, Hertz pays commissions and fees based on rental volume delivered. Internova is partially owned by Certares and Internova’s chief executive officer is the brother of Mr. O’Hara. In addition, Mr. Farmer serves on Internova’s board of directors. During fiscal year 2023, the revenue generated pursuant to this agreement was less than 1% of our consolidated gross revenues.
Other Relationships. In connection with our bankruptcy proceedings and the Emergence, we entered into a Registration Rights Agreement with various stockholders, including CK Amarillo. The Registration Rights Agreement entitles CK Amarillo to certain demand and “piggyback” registration rights with respect to the shares of our common stock that it holds. In addition, we are required to file and maintain a registration statement covering the shares beneficially owned by CK Amarillo and will be responsible for all registration fees and expenses relating to any qualifying registration.
Executive Sessions
The Audit Committee meets regularly in executive session with specific members of management (e.g., internal audit, the Chief Financial Officer), the independent auditors, and as a committee. The Audit Committee chair presides at all executive sessions.
| | Compensation Committee | |
Members: Colin Farmer (Chair), Andrew Shannahan
Total Meetings in 2023: 7
Primary Responsibilities:
•
Develops and oversees our management compensation and benefit policies and programs, generally.
•
Evaluates the performance of the CEO as related to all elements of the CEO’s compensation, as well as the performance of our senior management group.
| | | | | 13 | | | | |
•
Reviews and approves (or recommends to our Board) the annual salary, bonus, short-term compensation, equity award grants under our incentive plan, benefits and other compensation components for our CEO and senior management group.
•
Prepares a Compensation Committee Report on executive compensation required for inclusion in our proxy statement.
•
Reviews our management succession plans.
•
Reviews and recommends to our Board the compensation paid to our directors.
•
Reviews compliance with our Stock Ownership Guidelines applicable to senior management and non-employee directors.
Compensation Process and Procedures
The Compensation Committee engages a compensation consultant to assist in the design of the company’s executive and director compensation programs. The Compensation Committee may also delegate any of its responsibilities to certain subcommittees or to members of management, subject to applicable law and the terms of our incentive plans. For more information about the work of the compensation consultant, plus the Compensation Committee’s processes and procedures for the consideration and determination of executive and director compensation, please see the “Director Compensation” and “Compensation Discussion and Analysis” sections of this Proxy Statement.
Compensation Committee Interlocks and Insider Participation
Directors Farmer and Shannahan served as independent directors and members of the Compensation Committee for 2023. No member of the Compensation Committee was an employee, officer, or former employee or officer of the company. During 2023, none of our executive officers served on the board of directors or compensation committee (or other committee serving an equivalent function) of any entity that had an executive officer serving as a member of our Board or the Compensation Committee.
Equity Grant Practices
In accordance with the terms of our 2021 Omnibus Incentive Plan, directors Farmer and Shannahan have delegated authority to the Chief Executive Officer and Chief Human Resources Officer, together, to grant certain equity awards to employees below the senior management group level. The delegation assists in the timely awarding of sign-on equity grants to new hires. The Compensation Committee reviews the grants made pursuant to the delegation at each of its regularly scheduled meetings. The full Board has retained authority to approve equity grants to directors and individuals who are “officers” under Section 16 of the Exchange Act.
Executive Sessions
The Compensation Committee meets regularly in executive session with its independent compensation consultant and as a committee. The Compensation Committee chair presides at all executive sessions.
| | | | | 14 | | | | |
| | Governance Committee | |
Members: Colin Farmer, Jennifer Feikin, Andrew Shannahan (Chair), Evangeline Vougessis
Total Meetings in 2023: 4
Primary Responsibilities:
•
Reviews the size, structure, composition and functioning of our Board has adopted Corporate Governance Guidelines containing standards for the Nominating and Governance Committee to determine director qualifications. The Corporate Governance Guidelines provide that the Nominating and Governance Committee,its committees.
•
Assists our Board in making recommendations about nominees to the Board, will:
•
Reviews and taking into account the enhanced independence, financial literacy and financial expertise standards that may be required under law or NYSE rules for committee membership purposes;
•
Reviews and assesses the performance and independence of such directors; and
•
Reviews and oversees director orientation and continuing education.
•
Reviews and oversees corporate responsibility strategy and performance.
Corporate Responsibility Matters
We are committed to ensuring appropriate oversight and accountability of Conduct”) applicablecorporate responsibility. Management sets our corporate responsibility strategy, establishes key performance indicators for corporate responsibility matters and drives execution of initiatives throughout our business. The Governance Committee receives regular reports on our corporate responsibility strategy and performance.
Executive Sessions
The Governance Committee meets regularly in executive session. The Governance Committee chair presides at all executive sessions.
Director Nomination Process
The Governance Committee is responsible for recommending candidates for the Board. When re-nominating incumbent Board members or nominating new Board members, the Governance Committee reviews whether the individual has the appropriate experience, skills and other qualifications to support our Board are available without charge on the “Investor Relations — About Hertz—Governance Documents” portion of our website, www.hertz.com.
| ||
In its assessment of director candidates, the Board should not be constrained by a rigid policy mandating the structure of such positions. The Board currently believes that the most effective and efficient leadership structure for our Company is for Ms. Marinello to serve as CEO while Mr. Keizer serves as our Independent Non-Executive Chair of the Board (“Independent Non-Executive Chair”).
| | | | | 15 | | | | |
and gender.minority candidates, as well as candidates with diverse backgrounds, experiences and skills when conducting a director search.
| | | Board Diversity Matrix | | | ||||||||||||||||
| | | Total Number of Directors | | | | 9 | | | ||||||||||||
| | | | | | | Female | | | | Male | | | | Non-Binary | | | | Did Not Disclose Gender | | |
| | | Part I: Gender Identity | | | ||||||||||||||||
| | | Directors | | | | 2 | | | | 7 | | | | 0 | | | | 0 | | |
| | | Part II: Demographic Background | | | ||||||||||||||||
| | | African American or Black | | | | 0 | | | | 0 | | | | 0 | | | | 0 | | |
| | | Alaskan Native or Native American | | | | 0 | | | | 0 | | | | 0 | | | | 0 | | |
| | | Asian | | | | 0 | | | | 0 | | | | 0 | | | | 0 | | |
| | | Hispanic or Latinx | | | | 0 | | | | 0 | | | | 0 | | | | 0 | | |
| | | Native Hawaiian or Pacific Islander | | | | 0 | | | | 0 | | | | 0 | | | | 0 | | |
| | | White | | | | 2 | | | | 7 | | | | 0 | | | | 0 | | |
| | | Two or More Races or Ethnicities | | | | 0 | | | | 0 | | | | 0 | | | | 0 | | |
| | | LGBTQ+ | | | | 0 | | | ||||||||||||
| | | Did Not Disclose Demographic | | | | 0 | | | ||||||||||||
The Governance Committee will consider director candidates recommended by stockholders, and its process and criteria for analyzing such a candidate do not differ from that applied when a candidate is recommended by another source. Recommendations should be in writing and include supporting material the stockholder considers appropriate in support of that recommendation. In all events, recommendations of candidates by stockholders must include information that would be required under the rules of the SEC to be included in a proxy statement soliciting proxies for the election of such candidate. Stockholders wishing to propose a candidate for consideration may do so by submitting the above information to the attention of the Corporate Secretary, 8501 Williams Road, Estero, Florida 33928. Stockholders also must satisfy the notification, timeliness, consent, and information requirements set forth in our Bylaws, as described under “Information about the 2024 Annual Meeting — Proposals for 2025 Annual Meeting of
| | | | | 16 | | | | |
Stockholders.” All recommendations for nomination received by the Corporate Secretary that fully satisfy our Bylaws’ requirements relating to director nominations will be presented to the Governance Committee for its consideration.
Risk Oversight
Our senior leadership is responsible for identifying, assessing, and managing our exposure to risk. The Board hasand its committees play an active role in overseeing management’s activities and evaluating whether management’s operating and financial plans are balanced from a risk/reward perspective. The Board and its committees perform this oversight through a variety of mechanisms. For example, at the full Board level, the Board receives a strategic plan presentation from management each year, and this presentation generally covers management’s expectations for the upcoming three-year period. The Board also adoptedreviews management’s proposed annual operating plan each year. By engaging with management on both strategic and annual planning, the written Directors’ CodeBoard can evaluate risk across multiple time-horizons, including long-term (e.g., risks and opportunities related to the future of Business Conductmobility generally), medium term (e.g., risks and Ethics applicableopportunities across the rolling three-year periods generally aligned with our strategic planning cycle), and shorter periods (e.g., risks and opportunities more relevant to our current year plans).
Presentations from and discussions with management are the primary means by which the Board oversees risk. However, the Board also engages in discussions with outside advisors from time-to-time. The Board also relies on the work of its various committees, where more focused risk oversight can occur. Additional detail on the role of the Board’s committees in risk oversight follows.
Audit Committee Oversight
The Audit Committee reviews reports from management and discusses policies with respect to significant enterprise-wide risks facing the company, including, but not limited to financial risks such as treasury risks, cybersecurity and information technology risks, and how such risks are being identified, assessed and managed by the company and management. In addition, the Audit Committee is responsible for overseeing risks related to the company’s financial condition (including matters such as liquidity, debt levels, credit ratings and interest rate risk exposure), capital structure (including sources and uses of capital), and long-term financing strategy. The Audit Committee oversees our management of financial risks by, among other things, reviewing our significant accounting policies, maintaining oversight of our internal audit function, holding regular executive sessions with our Chief Financial Officer and Chief Audit Executive, and engaging in regular discussion with representatives of our independent auditors. The Audit Committee oversees our management of compliance risk by receiving regular legal, compliance and regulatory updates from legal counsel, including, from time-to-time, outside counsel. Our management provides an enterprise risk management report to the Audit Committee on a regular basis, and this report catalogues the top risks that management believes to be facing the company. The Chair of the Audit Committee reports to the Board on the Committee’s activities.
Compensation Committee Oversight
The Compensation Committee reviews the relationship between our compensation programs and risk and maintains a series of policies and practices to reduce risk in our compensation programs. These policies and practices include, without limitation, those described under “Compensation Discussion and Analysis — Stock Ownership Guidelines and Hedging and Pledging Policy” and “Compensation Discussion and Analysis — Clawback Policy.” In addition, consistent with our stockholders’ preference, last indicated at the Company has adopted the written Standards2023 annual meeting of Business Conduct, which require all employees, officers and directorsstockholders, our stockholders are given an opportunity to avoid conflicts of interests.
vote, on an advisory basis, at each annual meeting to approve our named executive officer compensation.
The Directors’ CodeCompensation Committee also oversees aspects of Business Conduct and Ethics is applicabletalent risk. For example, the Compensation Committee receives an annual succession planning presentation from management during which potential
| | | | | 17 | | | | |
successors to all Board members and provides guidance for handling unforeseen situations that may arise, including conflictssenior leadership roles are discussed. The Chair of interest. Pursuantthe Compensation Committee reports to the Directors’ CodeBoard on the Compensation Committee’s activities.
Governance Committee Oversight
The Governance Committee assists the Board in managing risks associated with Board organization, membership, and structure. The Governance Committee also assists management in the oversight of Business Conductsustainability and Ethics, a conflict of interest may arise when a Board member’s private interest interferes in any way — or even appearscorporate responsibility-related risks. The Committee reviews the company’s policies and programs related to interfere — with the interestsmaterial corporate responsibility issues. The Chair of the Company as a whole. The Directors’ Code of Business Conduct and Ethics specifies that a conflict of interest may include, among other things,Governance Committee reports to the following:Board on the Governance Committee’s activities.
| | |||||||
| 18 | | | | |
DIRECTOR COMPENSATION
2023 Program Summary
For 2023, each eligible non-employee director received an organization that deals with the Companyannual retainer of $275,000 for serving as a supplier, contractor, purchaser or distributor of the Company’s products or services, or is a competitor; and
Additionally, eligible non-employee directors serving as promptlycommittee chairs were entitled to the following annual fees for 2023, paid in cash:
| | | Audit Committee Chair | | | | $50,000 | | |
| | | Compensation Committee Chair | | | | $25,000 | | |
| | | Governance Committee Chair | | | | $15,000 | | |
There was no change to the committee chair fees in 2023 from those paid in 2022.
As was the case in 2022, directors associated with Knighthead or Certares received $1 during 2023 for serving as practicable. Thata member should not participate in any decision byof our Board or anyas chair of a committee, in lieu of the cash and equity compensation described above.
During 2023, each of our Board, thatnon-employee directors (including directors associated with Knighthead or Certares) was also entitled to free worldwide car rentals through our Director Car Rental Program. For all non-employee directors who served at any time during 2023, this benefit continues for 15 years following the director’s retirement from the Board. In retirement, the benefit provides the former director with free rentals for up to 90 days in any way relatescalendar year. This benefit was eliminated for any non-employee director whose service on the Board first begins on or after April 1, 2023.
Also during 2023, non-employee directors were entitled to participate in the matter that gives risecompany’s vehicle purchase programs for limited edition vehicles, pursuant to which individuals are provided the conflict or potential conflict of interestopportunity to purchase a Special Edition vehicle from the company, approximately at cost, so long as the individual agrees not to
| | | | | 19 | | | | |
sell such vehicle until the issue has been resolvedexpiration of a mandatory holding period. The company may also engage, from time to the satisfaction of the Chair of the Nominating and Governance Committee or the Board.time, in ordinary course automobile sales transactions with non-employee directors through our car sales channel.
Cash fees for Board and committee service are payable quarterly in arrears. Amounts are prorated for directors who do not serve for the previous two fiscal years, as well as certain other transactions.
Eligible directors are granted the equity portion of the annual retainer following each year’s annual meeting of stockholders and the award vests on the earlier of the business day immediately preceding the company’s next annual meeting and the date on which the director ceases to serve on our Board (other than following a removal for cause, in which case the shares are forfeited). In the normal course of business, the Company purchases goods and services from entities controlled by Carl Icahn and his affiliates, including The Pep Boys - Manny, Moe & Jack. During the year ended December 31, 2017, the Company purchased approximately $13 million worth of goods and services from these related parties.
| ||
Director Stock Ownership Guidelines
| ||
The current non-employee and non-affiliated directors serving as such at the time the Director Stock Ownership Guidelines were first approved are required to achieve the target ownership level within five years of November 9, 2021. Other current non-employee directors are required to achieve the target ownership level within five years of the date of their election or initial appointment. Until the ownership requirements are met, non-employee directors are generally restricted from selling more than 50% of their equity holdings in the company.
| | | | | 20 | | | | |
2023 Director Compensation Table
The table below summarizes the compensation paid to our non-employee directors for fiscal year 2023.
| | Name | | | | Fees Earned or Paid in Cash(1) ($) | | | | Stock Awards(2)(3) ($) | | | | All Other Compensation(4) ($) | | | | Total ($) | |
| | Fran Bermanzohn(5) | | | | 95,556 | | | | 227,899 | | | | — | | | | 323,455 | |
| | Colin Farmer | | | | 1 | | | | — | | | | 7,883 | | | | 7,884 | |
| | Jennifer Feikin | | | | 100,000 | | | | 174,994 | | | | 1,885 | | | | 276,879 | |
| | Mark Fields | | | | 100,000 | | | | 174,994 | | | | 6,526 | | | | 281,520 | |
| | Vincent J. Intrieri | | | | 150,000 | | | | 174,994 | | | | 3,456 | | | | 328,450 | |
| | Jeffrey Nedelman(5) | | | | 1 | | | | — | | | | 4,417 | | | | 4,418 | |
| | M. Gregory O’Hara | | | | 1 | | | | — | | | | 27,657 | | | | 27,658 | |
| | Andrew Shannahan | | | | 1 | | | | — | | | | 272 | | | | 273 | |
| | Evangeline Vougessis | | | | 100,000 | | | | 174,994 | | | | 4,711 | | | | 279,705 | |
| | Thomas Wagner | | | | 1 | | | | — | | | | 3,689 | | | | 3,690 | |
(1)
All compensation is for services rendered as directors for service on our Board, including annual retainer fees and committee service arechair fees (whether payable quarterly in arrears. A director may elect, annuallycash or in advance,shares of common stock) as set forth above. Ms. Bermanzohn, Mr. Fields and Mr. Intrieri received 100% of fees payable in cash. Ms. Feikin and Ms. Vougessis elected to receive shares100% of our common stock having the same fair market value
| ||
fees that would otherwise be payable in lieu of such cash fees. A director may elect to receive shares of phantom stock rather than receiving cash fees if the requirements for such deferral are satisfied under applicable tax law. A director may elect to defer settlement and payout of the portion of the annual retainer provided in the form of stock or stock-based awards ifphantom shares. For the requirements for such deferral are satisfied under applicable tax law. Any director electing to receiveyear ended December 31, 2023, Ms. Feikin and Ms. Vougessis were each issued 7,343 phantom shares would receive actual sharesshares.
(2)
For Ms. Feikin, Mr. Fields, Mr. Intrieri and Ms. Vougessis, reflects the aggregate grant date fair value of 10,703 RSUs granted on May 17, 2023. The number of RSUs granted was determined by dividing $175,000 by the closing market price of our common stock on the earlierdate of separationgrant. For Ms. Bermanzohn, reflects the aggregate grant date fair value of 10,703 RSUs granted on May 17, 2023, as well as 3,151 RSUs granted on January 17, 2023, for her service from service and a changesuch date until May 16, 2023. The number of RSUs granted to Ms. Bermanzohn on January 17, 2023, was determined by dividing $52,893 by the closing market price of our common stock on the date of grant. For each grant included in controlthis column, the grant date fair value was computed pursuant to FASB ASC Topic 718 as of the Company, and deferreddate of grant. Assumptions used in the calculation of these amounts are included in Note 8 entitled “Stock-Based Compensation” in the notes to our consolidated financial statements included in the Annual Report on Form 10-K filed with the SEC on February 12, 2024 (the “2023 Annual Report”). The RSUs (or deferred shares of common stock) would be settled within 30 days following such date.
(3)
The following table provides a summary, as of December 31, 2023, of the aggregate number of unvested RSUs outstanding and Hedging Policy–Stock Ownership Guidelines” below.vested deferred awards for each of our non-employee directors.
| | | | | 21 | | | | |
| | Name | | | | Unvested RSUs Outstanding (#) | | | | Vested Deferred Awards (#) | |
| | Fran Bermanzohn | | | | 10,703 | | | | — | |
| | Colin Farmer | | | | — | | | | — | |
| | Jennifer Feikin | | | | 10,703 | | | | 27,918 | |
| | Mark Fields | | | | 10,703 | | | | 10,031 | |
| | Vincent J. Intrieri | | | | 10,703 | | | | 18,684 | |
| | Jeffrey Nedelman | | | | — | | | | — | |
| | M. Gregory O’Hara | | | | — | | | | — | |
| | Andrew Shannahan | | | | — | | | | — | |
| | Evangeline Vougessis | | | | 10,703 | | | | 31,050 | |
| | Thomas Wagner | | | | — | | | | — | |
(4)
Each amount reflects the value of free worldwide car rentals through Hertz. Any non-employee director who servesunder the company’s Director Car Rental Program.
(5)
Ms. Bermanzohn resigned from the Board effective March 19, 2024 and Mr. Nedelman resigned from the Board effective January 19, 2024.
| | | | | 22 | | | | |
AUDIT MATTERS
Proposal 2: Ratification of the Appointment of Ernst & Young LLP as Our Independent Auditor for at least five years will, after retirement from such service as a director, be eligible for Hertz #1 Club Platinum Card status and free worldwide car rentals up to a maximum of 90 days each year for fifteen years after his or her retirement. For services rendered during the year endedFiscal Year Ending December 31, 2017, our non-employee directors received2024
The Audit Committee is directly responsible for the following compensation:
| 2017 Non-Employee Director Compensation Table | ||||||
| Name | Fees Earned or Paid in Cash(1) ($) | Stock Awards(2) ($) | Total ($) | |||
| David Barnes | 151,637 | 125,000 | 276,637 | |||
| SungHwan Cho | 51,374 | 125,000 | 176,374 | |||
Carolyn Everson(3)(4) | 135,971 | 125,000 | 260,971 | |||
Vincent Intrieri(3)(4) | 136,943 | 125,000 | 261,943 | |||
| Henry Keizer | 393,472 | 125,000 | 518,472 | |||
Linda Fayne Levinson(5) | 42,797 | — | 42,797 | |||
Samuel Merksamer(5) | 55,000 | — | 55,000 | |||
| Daniel Ninivaggi | 136,637 | 125,000 | 261,637 | |||
| ||
While stockholders are not required to have our stockholders ratify the appointment of PricewaterhouseCoopers LLPEY as our independent registered certified public accounting firm, but we are doing sorequesting stockholders to ratify such appointment because we believe it is a good corporate practice. Thevalue our stockholders’ views. If the stockholders do not ratify the appointment, the Audit Committee will consider, butreconsider the appointment. Even if the appointment of EY is not obligated to abideratified by stockholders, the outcome of this vote in determining whether to engage PricewaterhouseCoopers LLP in 2019 or another independent registered certified public accounting firm without submitting the matter to our stockholders. The Audit Committee in its discretion may direct the appointment ofstill select a different independent registered certified public accounting firm at any time during the year if the Audit Committeeit determines that such a change would be in ourthe best interests of the company and our stockholders' best interests. A representativestockholders.
Representatives of PricewaterhouseCoopers LLP willEY are expected to be present and available to answer appropriate questions at the 20182024 Annual Meeting with theand will have an opportunity to make a statementstatements during the meeting if he or she so desires and to respond to appropriate questions which are submitted in advance.they desire.
| ||
Audit and Other Fees
| | Audit and Other Fees (in millions) | | | | 2023 | | | | 2022 | |
| | Audit Fees(1) | | | | $12 | | | | $10 | |
| | Audit-Related Fees(2) | | | | $2 | | | | $1 | |
| | Tax Fees | | | | — | | | | — | |
| | All Other Fees | | | | — | | | | — | |
| | Total | | | | $14 | | | | $11 | |
(1)
| Audit and Other Fees (in millions) | 2017 | 2016 | ||||
Audit fees(1) | $ | 14 | $ | 14 | ||
Audit-related fees(2) | 2 | 1 | ||||
Tax fees(3) | 1 | 1 | ||||
| Total | $ | 17 | $ | 16 | ||
(2)
Audit-related fees were for services rendered in connection with due diligence and assurance services and employee benefit plan audits.
Pre-Approval Policy
Our Audit Committee’s charter requires the Audit Committeeit to pre-approve all audit and permitted non-audit services to be performed by our independent registered certified public accounting firm; however,firm, and the Audit Committee annually adopts
| | | | | 23 | | | | |
a pre-approval policy setting forth the types of services and amounts subject to pre-approval for the fiscal year. The Audit Committee is also permitted to delegate pre-approval authority to the Chair of the Audit Committee, who must then provide a report to the full Audit Committee at its next scheduled meeting. All audit and non-audit fees were pre-approved by the Audit Committee in 2017. In February2023.
| | | | | | The Board of Directors recommends that stockholders vote FOR the ratification of the appointment of Ernst & Young LLP as our independent auditor for the fiscal year ending December 31, 2024. | | |
AUDIT COMMITTEE REPORT
The Audit Committee’s purpose and responsibilities are set forth in its charter, which is approved and adopted by the Board and is available on the “Investor Relations” portion of 2017,our website at ir.hertz.com, through the Governance link. The Audit Committee’s Charter is reviewed at least annually and updated, as appropriate, to address changes in regulatory requirements, authoritative guidance and evolving oversight practices.
Our Audit Committee reports to, and acts on behalf of, the Board. The Audit Committee is comprised solely of directors who satisfy applicable independence and other requirements of Nasdaq and applicable securities laws. During 2023, a member of the Audit Committee adopted a pre-approval policy setting forthwas an “audit committee financial expert” as defined by SEC rules and regulations.
Primary Responsibilities and 2023 Actions. The primary function of the types of services and amounts subject to pre-approval for the 2017 fiscal year.
| ||
Audit Committee Report
In 2023, the Audit Committee met 9 times. During 2023, among other things, the Audit Committee:
•
Selected EY as the company’s independent registered certified public accounting firm for the Company,fiscal year ending December 31, 2023;
•
Met with our CEO, CFO and other senior members of the company’s financial management team at each regularly scheduled meeting;
•
Held separate private sessions, during its regularly scheduled meetings, with each of the company’s Chief Financial Officer, the Chief Audit Executive and the independent auditors, at which candid discussions regarding financial management, legal, accounting, auditing and internal control issues took place;
•
Met with the Chief Compliance Officer to discuss the effectiveness of the company’s compliance program and regularly received status reports of compliance issues;
| | | | | 24 | | | | |
•
Received periodic updates on management’s process to assess the adequacy of the company’s system of internal control over financial reporting, the framework used to make the assessment and management’s conclusions on the effectiveness of the company’s internal control over financial reporting;
•
Discussed with the independent auditors the company’s internal control assessment process, management’s assessment with respect thereto and the independent auditors’ evaluation of the company’s system of internal control over financial reporting;
•
Reviewed and discussed with management and the independent auditors the company’s earnings releases and quarterly and annual reports on Form 10-Q and Form 10-K, respectively, prior to filing with the SEC;
•
Reviewed the company’s internal audit plan and the performance of the company’s internal audit function; and
•
Discussed with management the company’s major financial risk exposures and the steps taken to monitor and control such exposures, including the company’s risk assessment and risk management policies.
Selection and Oversight of the Independent Registered Public Accounting Firm. The Audit Committee assists the Board with its oversight of the company’s independent registered public accounting firm’s qualifications and independence. The Audit Committee is solely responsible for the appointment, retention, compensation and oversight of the company’s independent registered public accounting firm, including the review and evaluation of the performance of the lead audit partner. The Audit Committee annually reviews the independence and qualifications of the company’s independent registered public accounting firm. In support of these reviews, the Audit Committee considers, among other things:
•
The firm’s performance in preparing or issuing an audit report or performing other audit, review or attest services for the company;
•
The firm’s independence and objectivity;
•
The firm’s proposed audit scope for adequacy of coverage; and
•
The firm’s internal quality-control procedures and other data on audit quality and performance.
Review and Recommendation Regarding Financial Statements. The company’s management is responsible for preparing the company’s financial statements, for maintaining effective internal control over financial reporting and for assessing the effectiveness of internal control over financial reporting. EY is responsible for expressing an opinion on the company’s financial statements and an opinion on the company’s internal control over financial reporting based on its audits. The Audit Committee does not itself prepare financial statements or perform audits and its members are not auditors or certifiers of the company’s financial statements.
In the performance of its oversight function, the Audit Committee met with management and EY to review and discuss the company’s audited financial statements of the Company contained in our 2017 Annual Report on Form 10-K for the fiscal year ended December 31, 2017 (the “Audited Financial Statements”).
| | | | | 25 | | | | |
In addition, the Audit Committee has:has (i) considered whether non-audit services provided by PricewaterhouseCoopers LLPEY are compatible with its independence;independence, (ii) received the written disclosures and the letter from PricewaterhouseCoopers LLPEY required by the applicable requirements of the PCAOB regarding PricewaterhouseCoopers LLP’sEY’s communications with the Audit Committee concerning independence;independence and (iii) discussed with PricewaterhouseCoopers LLPEY its independence.
Based on the reviews and discussions described above, the Audit Committee recommended to the Board that the Audited Financial Statements be includedaudited financial statements of the company contained in the 2017our 2023 Annual Report on Form 10-K for the fiscal year ended December 31, 2017 for filing2023 be filed with the SEC.
The Audit Committee,
Vincent J. Intrieri, Chair
Fran Bermanzohn
Jennifer Feikin
Evangeline Vougessis
| | |||||||
| 26 | | | | |
EXECUTIVE COMPENSATION MATTERS
Proposal 3: Approval, on an Advisory ApprovalBasis, of Named Executive Officer Compensation (Proposal 3)
Our executive compensation program is designed to reward performance that supports our business strategies, encourage appropriate levels of risk-taking, make us competitive in the broader talent marketplace, and align the interests of our executive officers with those of our stockholders.
As detailed in the Compensation Discussion and Analysis, we have designed our compensation programs among other things,in 2023 in a manner that we believe is reasonable, competitive and appropriately balanced with respect to (i) properly incentivizethe goals of motivating, rewarding and retaining our executive officers to accomplish our short- and long-term objectives, (ii) be competitive with similar pay practices and overall compensation levels at other, similarly-situated companies, (iii) reward our executive officers for not only their individual performance, but the performance of their business unit and the Company overall and (iv) hire and retain our executive officers.executives. In addition, as further detailed in the Compensation Discussion and Analysis, we continually revise our pay practices to be competitive with market practices and compensation norms.
“RESOLVED, that the compensation awarded toof the company’s named executive officers as disclosed inpursuant to the Compensationcompensation disclosure rules of the Securities and Exchange Commission, including the “Compensation Discussion and Analysis, Summary Compensation Table” the compensation tables and any related tabular and narrative disclosures in this proxy statementdiscussion, is hereby APPROVED.”
Effect of ProposalVote
The effect of the Say on PaySay-on-Pay vote is advisory only and non-binding. However, the Board and the Compensation Committee willexpect to consider the results of the vote in determining the compensation of our NEOs and our compensation programs generally. The Board values the opinions of our stockholders and is committed to considering their opinions in making decisions in connection with the Company's regular evaluations of our executive compensation program.
If any stockholder wishes to communicate with the Board regarding executive compensation, the Board can be contacted using the procedures outlined in “Stockholder“Board of Directors & Corporate Governance — Corporate Governance — Stockholder Communications with the Board” set forth in this proxy statement. As the Board has currently determined to hold thisProxy Statement. The next “Say-on-Pay” vote, each year, the next "Say on Pay" votewhich is conducted annually, will be held at the 20192025 annual meeting of stockholders.
| | | ||||
| | The Board of Directors recommends that stockholders vote | | |
| | |||||||
| 27 | | | | |
COMPENSATION DISCUSSION AND ANALYSIS
Our executive compensation programs are designed to create long-term shareholderstockholder value by aligning the interests of our executive officers with those of our stockholders. In order to accomplish this objective, weWe provide competitive executive compensation programs that enable us to attract and retain highly talented individuals, and we link their pay directly to the achievement of performance goals designed tothat our Board believes foster the creation of sustainable long-term stockholder value.
| | Name | | | | Title | |
| | Stephen Scherr | | | | Former Chief Executive Officer (CEO)(1) | |
| | Alexandra Brooks | | | | Executive Vice President and Chief Financial Officer (“CFO”)(2) | |
| | Colleen Batcheler | | | | Executive Vice President, General Counsel and Secretary | |
| | Justin Keppy | | | | Executive Vice President and Chief Operating Officer(2) | |
| | Eric Leef | | | | Executive Vice President and Chief Human Resources Officer | |
| | Kenny Cheung | | | | Former CFO(3) | |
| | Paul Stone | | | | Former President and Chief Operating Officer(3) | |
(1)
Mr. Scherr served in this role until March 31, 2024; Mr. Scherr voluntarily resigned his position with the company.
(2)
Ms. Brooks commenced her role effective July 25, 2023, prior to which she served as Interim CFO, effective April 14, 2023. Mr. Keppy commenced his role effective November 15, 2023.
(3)
Mr. Cheung served in this role until April 14, 2023 and Mr. Stone served in his role until October 31, 2023. According to SEC rules, Mr. Cheung and Mr. Stone must be included in our Summary Compensation Table and this analysis because they otherwise would have been an NEO for 2023 but for the fact that they were not serving as an executive officer at December 31, 2023. Both individuals voluntarily resigned their positions with the company during the year.
| | | | | 28 | | | | |
2023 Program Summary
Our executive compensation program in 2023 consisted of a changing market for car rental services. During 2017, we made significant progress in several operational areas, but did not meet mostthe following key fixed and variable components.
| | | Element | | | | Description | | | | Objective | | | | Factors Influencing Amount | | | ||||
| | | Base Salary | | | | Fixed compensation delivered in cash; reviewed annually and adjusted if appropriate | | | | Provides base amount of market competitive pay | | | | Experience, market data, individual role and responsibilities, retention considerations and individual performance | | | ||||
| | | Annual Incentive Award | | | | Variable cash compensation based on company, business unit and/or individual performance | | | | Motivates and rewards achievement of key strategic initiatives and financial results, and encourages individual performance | | | | Intended target value is set based on market data, individual role and responsibilities; payout based on company and individual performance | | | ||||
| | | Long-Term Incentive Awards | | | | Performance Stock Units (PSUs) | | | | Variable compensation with payout in shares of common stock based on company performance and continued employment | | | | Aligns NEO interests with those of stockholders by linking payouts to performance against financial metrics that are of importance to investors; promotes retention | | | | Intended target value is set based on market data, individual role and responsibilities; payout based on company performance and time worked | | |
| | Restricted Stock Units (RSUs) | | | | Variable compensation with payout in shares of common stock based on continued employment | | | | Aligns interests of executives with long-term stockholder value creation and promotes retention | | | |||||||||
The components of our financial goals.core NEO compensation program are described in more detail below in this CD&A under “— Program Components.” Other elements of our 2023 executive compensation program included retirement benefits, modest perquisites, health and welfare benefits, and post-employment compensation arrangements, as described in more detail below under “— Other Compensation Elements.”
| | | | | 29 | | | | |
| | What We Do | |
| | ![[MISSING IMAGE: ic_tick-bw.jpg]](https://capedge.com/proxy/DEF 14A/0001104659-24-044996/ic_tick-bw.jpg) We evaluate risk in light of our overall compensation program We use metrics in our incentive compensation plans that are aligned to the metrics management uses to assess the business day-to-day We cap payouts in our incentive programs We use double-trigger vesting provisions in change of control scenarios We believe a substantial portion of our NEOs’ compensation should be subject to satisfaction of performance objectives We use a variety of equity award structures to incent both performance and retention We have a robust stock ownership policy for executives and the Board We maintain a robust compensation recovery policy beyond that which is required by law We use an independent compensation consultant We utilize a representative and relevant peer group | |
| | What We Don’t Do | |
| | ![[MISSING IMAGE: ic_cross-bw.jpg]](https://capedge.com/proxy/DEF 14A/0001104659-24-044996/ic_cross-bw.jpg) We don’t use financial or operational metrics that promote undue risk We don’t provide preferential payments or above market returns in deferred compensation plans We don’t provide excessive perquisites to our senior management We don’t allow our NEOs or directors to hedge or pledge our stock We don’t re-price underwater options without stockholder approval We don’t provide for automatic salary increases or guaranteed annual incentives to NEOs We don’t use excise tax gross ups We don’t award dividends or dividend equivalents on unvested equity awards | |
| | | | | 30 | | | | |
2023 Performance
2023 was a mixed year for the company. A solid demand and rate environment resulted in the delivery of approximately $9.4 billion in revenue, representing growth of 8% versus 2022. Our NEOs’ 2017 performance-based stock awards basedtop line performance reflected continued demand for our product, consistent with 2023 travel trends more broadly. Our revenue performance also reflected the ongoing work we are undertaking related to growth initiatives. We advanced several of these growth initiatives during 2023, including the investment in our Dollar brand, to better service the value-oriented customer, improvement in our European business, and a focus on our rideshare business, in which we partner with transportation network companies to enable their drivers to access quality fleet.
However, we also faced significant cost headwinds throughout the year, which negatively impacted our profitability. Our direct operating expenses per transaction day (“DOE per Transaction Day”) were higher than we planned during 2023. Of note, we experienced elevated net collision and damage expense during the year, largely driven by our fleet of electric vehicles (“EVs”). We continued to execute our strategy related to EV mobility during 2023, offering customers a wide selection of vehicles and providing the largest EV rental fleet globally. We also continued to implement initiatives that we believe will improve the profitability of our EV fleet in the future, including the expansion of EV charging infrastructure, growing our relationships with EV manufacturers and implementing additional policies and educational tools to help enhance the EV experience for customers. However, the cost burdens on our business during 2023, coupled with the impact of EV-related challenges on our operational efficiency more generally, led to underperformance on our Adjusted Corporate EBITDA were not earned,goals. Fiscal 2023 Net Income was approximately $616 million and our NEOs' 2017 performance stock option and stock option grants were underwater and had no in-the-money value as of fiscal year-end. In addition, no incentive bonuses were earned by our NEOs under our annual incentive bonus plan. However, we met certain of our revenue goals, and as a result, our NEOs earned their 2017 restricted stock awards. Additional successes and challenges in 2017 included:
| ||
approximately $561 million.
Adjusted Corporate EBITDA is a non-GAAP measure. For theSee Annex A — Non-GAAP Measures to this Proxy Statement for its definition of “Adjusted Corporate EBITDA” and its reconciliation to itsthe most comparable non-GAAPGAAP measure see Annex A to.
Impact on 2023 Compensation Decisions
As more fully described in this proxy statement.
•
•
Our Adjusted Corporate EBITDA performance resulted in no earned amounts for approval, which consisted of an annual base salaryour NEOs for 2017 of $1,450,000, a target annual bonus of 150% of base salaryPSUs associated with fiscal year 2023 and granted under the long-term incentive plan for the 2022 – 2024 performance period or the long-term incentive plan for the 2023 – 2025 performance period.
•
Mr. Scherr received sign-on equity awards with a grant date fair valuein 2022 in lieu of $5,175,000. Theparticipation in our long-term incentive plan for both the 2022 – 2024 performance period and the 2023 – 2025 performance period. During 2023, 1,121,036 shares underlying his sign-on equity awards were allocated 60% asvested due to his tenure and our stock price performance during 2022. Our stock options ("Performance Options"), 30% as sharesprice performance in 2023 failed to reach milestones necessary for incremental vesting of performance stock ("Performance Shares") and 10% as sharesthese awards.
•
Our NEOs other than Mr. Scherr experienced vesting, in the ordinary course, of performance-based restricted stock ("Restricted Shares"). The Compensation Committee and Ms. Marinello agreed on equity awards that were more heavily weighted on performance objectives, and therefore more at-risk, as comparedRSUs with 2023 vesting dates, to the other NEOs. The equity awards are scheduled to vestextent that they were employed with the company on December 31, 2019 subject to Ms. Marinello's continued service through such date and, in the casevesting dates.
A more detailed analysis of the Performance Options and Performance Shares, subject to the satisfaction of performance goals related to Adjusted Corporate EBITDA. In addition, in order to induce Ms. Marinello to accept the position of President and CEO, she was guaranteed an annual bonus of not less than 60% of target ($1,305,000)2023 compensation program for 2017. Future annual bonuses, if any, will be determined based on our performance under our executive bonus plans, consistent with other senior executives. Ms. Marinello will also be eligible to participate in the employee benefit plans offered to other senior executives of the Company, and was entitled to minimal relocation related reimbursements, as further described below under "Severance Plan and Employment, Separation and Change in Control Agreements - Employment Agreements".
| | |||||||
| 31 | | | | |
Compensation Philosophy in 2023
We have structuredstructure our compensation programs to provide our NEOs and other senior executives with levels of compensation that we believe are necessary to motivate, incentivize and retain their services, and to avoid the disruption and expense associated with unintended departures, while also motivating and rewarding leadership for our success in a dynamic and competitive markets.
market. Our short-Compensation Committee and long-term incentive programs are also intended to reward our senior executives for performance measured against established goals that are relevant to our business and the creation of shareholder value and to align our senior executives' interests with those of our stockholders.
•
Is adaptable, to flex with the currentdynamic economic and strategic environment;environment in which we operate;
•
Is competitive, to help ensure that we attract, retain and motivate top talent; and
Rewards positive operational and financial performance that we believe enhances stockholder value over time.
| | Name | | | | Annualized Base Salary | | | | Target Annual Incentive | | | | Target Long-Term Incentive | | | | Target Pay | |
| | Stephen Scherr | | | | $1,500,000 | | | | $2,400,000 | | | | See Discussion of CEO Sign-On Compensation(1) | | ||||
| | Alexandra Brooks(2) | | | | $600,000 | | | | $480,000 | | | | $1,000,000 | | | | $2,080,000 | |
| | Colleen Batcheler | | | | $600,000 | | | | $600,000 | | | | $1,800,000 | | | | $3,000,000 | |
| | Justin Keppy(3) | | | | $1,250,000 | | | | $1,250,000 | | | | $2,500,000 | | | | $5,000,000 | |
| | Eric Leef | | | | $500,000 | | | | $400,000 | | | | $850,000 | | | | $1,750,000 | |
| | Others Required to Be Discussed | | ||||||||||||||||
| | Kenny Cheung(4) | | | | $700,000 | | | | $700,000 | | | | $1,600,000 | | | | $3,000,000 | |
| | Paul Stone(4) | | | | $1,000,000 | | | | $1,400,000 | | | | $2,500,000 | | | | $4,900,000 | |
(1)
As discussed below, Mr. Scherr received sign-on equity grants in 2022 when he joined the company. These equity grants were designed to considering their opinions in making compensation decisions. In 2017, we engaged with stockholders and discussed relevant aspects ofincentivize his performance over the period that would otherwise be covered by our compensationlong-term incentive programs. As partsuch, he was not a participant in the company’s long-term equity program in 2022 or 2023, nor was he made a participant in the 2024 program. Mr. Scherr resigned from the company effective March 31, 2024.
(2)
Ms. Brooks commenced her role as CFO effective July 25, 2023 in connection with an internal promotion. Amounts shown reflect her total target direct compensation for 2023 assuming she was promoted January 1, 2023. Prior to her promotion, her annualized base salary was $450,000, her target annual incentive was $360,000 and her target long-term incentive was $500,000.
(3)
Mr. Keppy commenced his role effective November 15, 2023. Amounts shown reflect Mr. Keppy’s total target direct compensation opportunity for 2023 assuming he commenced employment on January 1, 2023.
(4)
Mr. Cheung served in his role until April 14, 2023 and Mr. Stone served in his role until October 31, 2023. Mr. Cheung and Mr. Stone did not earn bonuses for 2023 and forfeited their 2023 equity awards as a result of these discussions, we considered their views onresignations during the structure and form of our compensation programs to improveyear.
| | | | | 32 | | | | |
Component Weighting: Pay for Performance
The Compensation Committee designed the alignment of stockholder interests with our management’s interests.
The Compensation Committee evaluated the results of the say-on-pay vote and,previously determined in 2022 that in light of the substantial supportenterprise-wide scope of the CEO’s role, his individual compensation opportunities should be greatest among the NEOs and should be the most heavily weighted toward variable compensation. In lieu of participating in the annual long-term incentive program, Mr. Scherr received significant sign-on equity grants in February 2022. These grants had the potential to vest over a longer timeline than our executive compensationcore long-term incentive program decided to maintainand were, in large part, conditioned on our achievement of stock price milestones. Mr. Scherr’s long-term incentives are described later in this CD&A. See “— Agreements with NEOs — Agreement with Mr. Scherr.”
Market Competitive Compensation
Each NEO’s 2023 Target Pay was set at a level that the core design of our compensation program. The Compensation Committee will continueand the Board believe to consider the outcomebe appropriate based on a variety of future say-on-pay votes, in addition to various other factors, when making futureincluding compensation decisions.
| ||
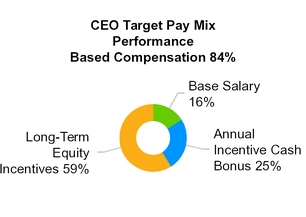

| ||
•
Scope of responsibility;
•
Tenure in the role at Hertz;
•
Internal pay comparisons;
•
Requirements of any employment arrangements;
•
Each NEO’s individual performance in 2022; and
•
The NEO’s expected future impact on our organization.
Program Components
Additional details on each element of the 2023 executive compensation program follow.
2023 Annual Base Salary
The Compensation Committee has the authority to retain outside advisors as it deems appropriate. Since November 2014, the former Hertz Holdings Compensation Committee and current Compensation Committee have directly engaged FW Cook as their independent compensation consultant. FW Cook’s responsibilities include:
| ||
The base salary rates of our NEOs for 2023 and takes into consideration any contractual obligations we have with such senior executives. We review salaries upon promotion or other changes2022 (in each case as of the end of the fiscal year) are set forth in job responsibility. There were no changes to the NEOs'table below.
| | | | | 33 | | | | |
| | Name | | | | 2023 Base Salary Rate | | | | 2022 Base Salary Rate | |
| | Stephen Scherr | | | | $1,500,000 | | | | $1,500,000 | |
| | Alexandra Brooks | | | | $600,000 | | | | $450,000 | |
| | Colleen Batcheler | | | | $600,000 | | | | $600,000 | |
| | Justin Keppy | | | | $1,250,000 | | | | N/A | |
| | Eric Leef | | | | $500,000 | | | | $500,000 | |
| | Others Required to Be Discussed | | ||||||||
| | Kenny Cheung | | | | $700,000 | | | | $600,000 | |
| | Paul Stone | | | | $1,000,000 | | | | $1,000,000 | |
Ms. Brooks’ annual base salaries for 2017.salary increased to $600,000 effective as of her promotion to Executive Vice President, Chief Financial Officer, on July 25, 2023. The Compensation Committee determined that the increased level of base salary was appropriate in light of her increased level of responsibilities and duties at the company. Mr. Cheung’s annual base salary was increased to $700,000 during 2023, prior to his departure from the company, in light of his growth in the role of CFO, considerations of internal equity and peer group data.
| Name | 2016 Base Salary ($) | 2017 Base Salary ($) |
| Ms. Marinello | N/A | 1,450,000 |
| Mr. Kennedy | 775,000 | 775,000 |
| Mr. Best | 600,000 | 600,000 |
Mr. Taride(1) | 537,636 | 517,556 |
| Mr. Frecker | 455,000 | 455,000 |
| Mr. Tague | 1,450,000 | 1,450,000 |
| Mr. Foland | 850,000 | 850,000 |
| Ms. Marren | 600,000 | 600,000 |
2023 Annual Incentive Awards
•
Adjusted Corporate EBITDA (weighted 40%) — a measure of profitability
•
Revenue Per Unit (“RPU”) (weighted at 15%) — a measure of fleet productivity
•
Net Promoter Score for the Hertz Brand (“NPS”) (weighted at 20%) — a measure of customer satisfaction whereby the percentage of survey-responding customers who view their experience favorably (“promoters”) is compared to the percentage of survey-responding customers who view their experience negatively (“detractors”). (NPS = % of promoters less % of detractors)
•
Board Discretion (weighted at 25%) — to enable consideration of the CEO,qualitative and strategic aspects of our business results
Plan funding was not dependent on achievement of the goals associated with any specific metric; achievement of goals under any of the four metrics could fund awards.
See Annex A — Non-GAAP Measures to this Proxy Statement for definitions of Adjusted Corporate EBITDA and RPU. Adjusted Corporate EBITDA, RPU and NPS were core elements of our program in 2023 as well as 2022, given their importance in measuring our financial performance, asset efficiency and ability to serve our customers.
| | | | | 34 | | | | |
After the conclusion of 2023, our Compensation Committee and Board determined that we performed at a level that resulted in plan funding of 50% of target award amounts. The 2023 EICP goals and actual results that led to this funding were as follows:
| | 2023 EICP for Continuing NEOs(1) | | ||||||||||||||||||||||||||||
| | | | | | Adjusted Corporate EBITDA (in millions) | | | | Adjusted Corporate EBITDA Payout (% of Target) | | | | RPU | | | | RPU Payout (% of Target) | | | | NPS | | | | NPS Payout (% of Target) | | | | Board Discretion (% of Target) | |
| | Threshold | | | | $1,367.71 | | | | 80% | | | | $1,502.50 | | | | 25% | | | | 39 | | | | 25% | | | | 0% | |
| | Target | | | | $1,709.63 | | | | 100% | | | | $1,581.57 | | | | 100% | | | | 42 | | | | 100% | | | | 100% | |
| | Maximum | | | | $2,051.56 | | | | 250% | | | | $1,660.65 | | | | 200% | | | | 47 | | | | 200% | | | | 200% | |
| | EICP Results | | | | $560.53 | | | | 0% | | | | $1,479.03 | | | | 0% | | | | 34 | | | | 0% | | | | 200% | |
(1)
Straight-line interpolation between points determines payout levels once threshold is reached.
In determining the salariespayout under the Board Discretion metric, the Compensation Committee and the Board considered, on a subjective, qualitative basis, management’s performance against key strategic initiatives in a complex operating environment, as well as the importance of our NEOsretention. Specifically, the material factors considered were the significant work being undertaken to return the company to profitable growth, management’s work during the year to mitigate the headwinds created by the company’s strategic investment in electric vehicles and the desire to drive employee engagement and retention at a critical time for 2018 would remain the samebusiness.
The earned payout percentage for each metric was weighted as their salaries for 2017.set forth in the EICP and then added together to determine the final funding level.
| | Adjusted Corporate EBITDA | | | | RPU | | | | NPS | | | | Board Discretion | |
| | 0% of Target x Weighting of 40% = No Funding | | | | 0% of Target x Weighting of 15% = No Funding | | | | 0% of Target x Weighting of 20% = No Funding | | | | 200% of Target x Weighting of 25% = 50 Points of Funding | |
| ||||||||||||||

The Compensation Committee and Messrs. Taridethe Board determined each NEO’s target EICP opportunity based on the same factors described above in relation to base salaries. The Compensation Committee and Freckerthe Board chose not to further differentiate performance among the NEOs, and instead chose to compensate the cohort as a team. No portion of any EICP award was guaranteed for any NEO. There were paidno increases from 2022 in the individual bonuses settled in shares of common stock noted above and described in greater detail below.
| | | | | 35 | | | | |
| | Name | | | | Column (A) | | | | Column (B) | | | | Column (C) | |
| | 2023 Target EICP Opportunity as a % of Salary | | | | 2023 Target Award (Column A x Base Salary Received) | | | | 2023 Actual Award (Column B x 50%)(1) | | ||||
| | Stephen Scherr | | | | 160% | | | | $2,400,000 | | | | $1,200,000 | |
| | Alexandra Brooks | | | | 80% | | | | $412,603 | | | | $206,301 | |
| | Colleen Batcheler | | | | 100% | | | | $600,000 | | | | $300,000 | |
| | Justin Keppy | | | | 100% | | | | $160,959 | | | | $80,479 | |
| | Eric Leef | | | | 80% | | | | $400,000 | | | | $200,000 | |
| | | | | | | | | | | | | | | |
(1)
Ms. Brooks commenced her role effective July 25, 2023. Her 2023 Actual Award reflects proration based on performance versusher length of service in each role held with the Adjusted Corporate EBITDA and MBO goals and individual performance. company during the year. Mr. Keppy commenced his role effective November 15, 2023. His 2023 Actual Award reflects proration based on his length of service as our COO during the year.
2023 Long-Term Incentive Awards
The Compensation Committee generally considersand the experience, responsibilitiesBoard believe in aligning the interests of our senior leaders with those of our stockholders. The significant extent to which equity is included in our NEOs’ compensation opportunity evidences this belief.
As discussed above, Mr. Scherr received sign-on equity grants when he joined the company. These grants were in lieu of his participation in our 2022 and historical performance2023 long-term incentive programs. Similarly, Mr. Scherr was not provided participation in the company’s 2024 long-term incentive program. See “— Agreements with NEOs — Agreement with Mr. Scherr” below for further discussion of each particular NEO when determining target awards. In determining 2017 target awards,Mr. Scherr’s prior equity grants.
For our other NEOs, the Compensation Committee also considered the provisionschose to use a mix of each NEO's employment agreement or term sheet, if any.
| Name | 2017 Base Salary ($) | Target Award as a % of Salary (%) | 2017 Target Award ($) | 2017 Payout ($) |
| Ms. Marinello | 1,450,000 | 150 | 2,175,000 | 1,305,000(1) |
| Mr. Kennedy | 775,000 | 135 | 1,046,250 | — |
| Mr. Best | 600,000 | 100 | 600,000 | — |
Mr. Taride(2) | 517,556 | 120 | 621,067 | 250,000(3) |
| Mr. Frecker | 455,000 | 60 | 273,000 | 125,000(3) |
| Mr. Tague | 1,450,000 | 150 | 2,175,000 | — |
| Mr. Foland | 850,000 | 135 | 1,147,500 | — |
| Ms. Marren | 600,000 | 100 | 600,000 | — |
| ||
| 2017 EICP Adjusted Corporate EBITDA Payout Criteria | ||
| Performance | 2017 Adjusted Corporate EBITDA ($) | Payout Percentage (%) |
| Threshold | 530 | 50 |
| Target | 625 | 100 |
| Maximum | 750 | 160 |
| Actual Results | 267 | 0 |
To determine the amount of the target award to 150%, but the annual incentive bonus paymentgrant to each NEO mayparticipating in the 2023 LTIP, the Compensation Committee considered the factors discussed above for base salaries and set target award opportunities for each eligible NEO. The Committee uses a value-based approach to setting target opportunities and expresses the target opportunity in dollar terms. The target opportunities for our NEOs under the 2023 LTIP were as follows:
| | | | | 36 | | | | |
| | Name | | | | 2023 Total Target Award Values | |
| | Stephen Scherr | | | | See Discussion of CEO Sign-On Compensation | |
| | Alexandra Brooks(1) | | | | $1,000,000 | |
| | Colleen Batcheler | | | | $1,800,000 | |
| | Justin Keppy(2) | | | | — | |
| | Eric Leef | | | | $850,000 | |
| | Others Required to Be Discussed(3) | | ||||
| | Kenny Cheung | | | | $1,600,000 | |
| | Paul Stone | | | | $2,500,000 | |
(1)
Ms. Brooks commenced her role as CFO effective July 25, 2023. She received a grant with a total target value equal to $500,000 when grants under the 2023 LTIP were originally made. She received an incremental grant under the 2023 LTIP, with a target value of $219,178, after her promotion. The incremental grant was prorated to reflect the actual time she was expected to serve as CFO for 2023.
(2)
Mr. Keppy commenced his role effective November 15, 2023. The Compensation Committee provided Mr. Keppy participation in the 2023 LTIP with a target total value of $2.5 million, prorated for time worked. However, in accordance with the company’s equity grant practices, the grants of RSUs and PSUs to Mr. Keppy under the 2023 LTIP were not exceed 160%made until the first trading day of the quarter after his orcommencement of employment (i.e., January 2, 2024).
(3)
Mr. Cheung and Mr. Stone forfeited their 2023 LTIP awards upon their separations from the company.
Considering its pay for performance philosophy, the Compensation Committee set the award mix for NEOs in the 2023 LTIP at 60% PSUs and 40% RSUs, which is the same mix as that used in 2022. Target PSU and RSU values are translated to grant numbers by dividing the dollar value of the target award by the closing price of our common stock on the Nasdaq on the date of grant.
| | | | | 37 | | | | |
The following table summarizes the mix of equity awards granted to our NEOs under the 2023 LTIP.
| | Name | | | | 2023 PSUs Granted (#) | | | | 2023 RSUs Granted (#) | |
| | Stephen Scherr | | | | N/A | | | | N/A | |
| | Alexandra Brooks(1) | | | | 27,233 | | | | 18,155 | |
| | Colleen Batcheler | | | | 57,539 | | | | 38,359 | |
| | Justin Keppy(2) | | | | — | | | | — | |
| | Eric Leef | | | | 27,171 | | | | 18,114 | |
| | Others Required to Be Discussed(3) | | ||||||||
| | Kenny Cheung | | | | 51,145 | | | | 34,097 | |
| | Paul Stone | | | | 79,915 | | | | 53,277 | |
(1)
Ms. Brooks commenced her role effective July 25, 2023. Her 2023 LTIP award reflects proration based on her service in different roles during the year.
(2)
Mr. Keppy commenced his role effective November 15, 2023. The Compensation Committee provided Mr. Keppy participation in the 2023 LTIP with a target award. There istotal value of $2.5 million, prorated for time worked during the performance period. However, in accordance with the company’s equity grant practices, the grants of RSUs and PSUs to Mr. Keppy under the 2023 LTIP were not made until the first trading day of the quarter after his commencement of employment (i.e., January 2, 2024).
(3)
Mr. Cheung and Mr. Stone forfeited their 2023 LTIP awards upon their separations from the company.
Mr. Keppy also received sign-on equity grants in 2023 in connection with his hiring. See “— Agreements with NEOs — Agreement with Mr. Keppy” for further discussion of Mr. Keppy’s sign-on equity grants.
2023 RSUs
RSUs represent the right to receive a thorough performance review process in place that evaluates senior executives on adefined number of quantitative and qualitative objectives, as well as a review of competencies and behaviors. Our CEO conducts the performance review of the other NEOs and determines their individual performance multipliers. Our Board conducts the performance reviewshares of our CEOcommon stock after completing a period of service established at the grant date. RSUs encourage retention and determines her individual performance multiplier.
| ||
2022 and 2023 PSUs
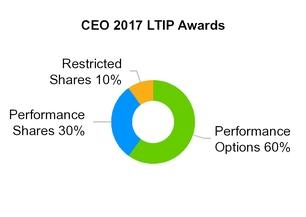
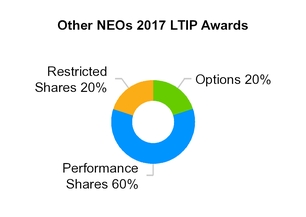
| | | | | 38 | | | | |
Goal Setting in the PSU Program. Considering the amount of change underway at the company following Emergence, the Compensation Committee has, to date, used a staged approach to goal setting in the PSU program. This approach means that PSUs granted under the 2022 long-term incentive plan (the “2022 LTIP”) and 2023 LTIP are conditionally earned, if at all, based on 2017our performance upagainst a series of three one-year goals. Any PSUs earned with respect to 50%achievement of the target award based on combined 2017a one-year performance goal are “banked” and 2018 performance and up to 150% of the target award based on combined 2017, 2018 and 2019 performance. Performance Shares, if earned, are paid on the later ofgenerally require continued employment through the third anniversary of the date of grant to fully vest. In addition, the program caps payouts at 100% of the targeted amount if our absolute total shareholder return (“TSR”) is negative over the three-year grant cycle. The TSR cap applies even if the performance goals are otherwise exceeded and would have resulted in more than 100% of the date on whichtarget grant amount of shares being earned. The Compensation Committee determined that this cap was an appropriate mechanism to ensure that our executives do not receive an above target payout if our stockholders have not experienced positive TSR over the corresponding performance period. The Compensation Committee intends to continue to review the appropriate time to move the PSU program to cumulative, multi-year goals.
At the start of 2023, the Compensation Committee certifies our financial performance for the applicable period, in each case, subject to continued employment with the Company on the third anniversary date.
| ||
| 2017 Performance Shares Performance Criteria | ||
2017 Adjusted Corporate EBITDA | Earned Percentage | |
| Threshold | $530 | 12.5% |
| Target | $625 | 25% |
| Actual Results | $267 | 0% |
Based on the company’s performance in 2023, no PSUs were earned in 2023 for 2017.the one-third of the 2022 LTIP PSUs attributable to 2023 performance, or for the one-third of the 2023 LTIP PSUs attributable to 2023 performance.
| | 2023 Tranche of 2022 – 2024 PSUs | | ||||||||
| | Performance | | | | Adjusted Corporate EBITDA (millions) | | | | Percentage Earned | |
| | Threshold | | | | $1,367.71 | | | | 80% | |
| | Target | | | | $1,709.63 | | | | 100% | |
| | Maximum | | | | $1,966.08 | | | | 200% | |
| | 2023 Results | | | | $560.53 | | | | 0% | |
| | | | | 39 | | | | |
| | 2023 Tranche of 2023 – 2025 PSUs | | ||||||||
| | Performance | | | | Adjusted Corporate EBITDA (millions) | | | | Percentage Earned | |
| | Threshold | | | | $1,367.71 | | | | 80% | |
| | Target | | | | $1,709.63 | | | | 100% | |
| | Maximum | | | | $1,966.08 | | | | 200% | |
| | 2023 Results | | | | $560.53 | | | | 0% | |
As noted above, Mr. Scherr did not participate in the 2022 LTIP or 2023 LTIP. However, during 2023, a portion of his sign-on equity awards vested due to our stock price performance and his tenure. The NEOs retainfollowing table sets forth the ability to earnnumber of shares of underlying the sign-on equity awards subject to performance over the combined 2017 and 2018 and the combined 2017, 2018 and 2019 performance periods. No Performance Shares were granted to Mr. Tague in 2017. Mr. Foland and Ms. Marren forfeited their 2017 Performance Share awards in connection with their separation from the Company. The maximum and target numbers of Performance Shares granted to each NEO in 2017 andScherr, the number of 2017 Performance Shares earned basedshares underlying the awards that vested as of December 31, 2023, and the value of those shares that vested as of December 31, 2023.
| | CEO Sign-On Equity Awards That Vested During 2023 | | ||||||||||||
| | Type of Equity | | | | Shares Underlying Awards Granted (#) | | | | Number Vested as of December 31, 2023 (#) | | | | Value Vested as of December 31, 2023(1) | |
| | Time-based RSUs | | | | 2,802,590 | | | | 560,518 | | | | $5,823,782 | |
| | Performance-Based RSUs – Stock Price | | | | 6,539,378 | | | | 560,518 | | | | $5,823,782 | |
| | Performance-Based RSUs – Stock Price and Transaction | | | | 3,113,989 | | | | None | | | | None | |
(1)
Based on 2017 financial performance are set forth below:
| Name | 2017 Maximum Performance Shares Granted | 2017 Target Performance Shares Granted | 2017 Performance Shares Earned |
| Ms. Marinello | 104,946 | 69,964 | 0 |
| Mr. Kennedy | 81,117 | 54,078 | 0 |
| Mr. Best | 64,895 | 43,263 | 0 |
| Mr. Taride | 64,895 | 43,263 | 0 |
| Mr. Frecker | 24,336 | 16,224 | 0 |
| ||
| Name | 2017 Restricted Shares Granted | 2017 Restricted Shares Earned |
| Ms. Marinello | 23,321 | 23,321 |
| Mr. Kennedy | 18,026 | 18,026 |
| Mr. Best | 14,421 | 14,421 |
| Mr. Taride | 14,421 | 14,421 |
| Mr. Frecker | 5,408 | 5,408 |
| | | |||
| | |
| 2016 PSU Performance Elements | |||
Adjusted Corporate EBITDA | Relative EBITDA Margin | Customer Satisfaction | |
Threshold(1) | $1,828 | –50 bp | +1.00 |
Target(2) | $2,151 | +100 bp | +1.50 |
| Actual Results | $820 | -433 | >+1.50 |
| Payout Factor | 0% | 0% | 100% |
| ||
| 2016 PSUs | |||||||
| Name | Target Adjusted Corporate EBITDA PSUs Remain Subject to Vesting | Target Relative EBITDA Margin PSUs Remain Subject to Vesting | Target Customer Satisfaction PSUs Remain Subject to Vesting | Adjusted Corporate EBITDA and Relative EBITDA Margin PSUs Earned | Customer Satisfaction PSUs Earned | Total PSUs at Target | PSUs Earned as a % of Target |
| Mr. Kennedy | 13,163 | 13,162 | 6,581 | — | 3,291 | 32,906 | 10% |
| Mr. Best | 9,605 | 9,605 | 4,802 | — | 2,401 | 24,012 | 10% |
| Mr. Taride | 9,148 | 9,147 | 6,098 | — | 3,049 | 24,393 | 12.5% |
| Mr. Frecker | 1,086 | 1,086 | 724 | — | 362 | 2,896 | 12.5% |
| 2015 PSUs | |||||||
| Name | Target Adjusted Corporate EBITDA PSUs | Target Relative EBITDA Margin PSUs | Target Customer Satisfaction PSUs | Adjusted Corporate EBITDA and Relative EBITDA Margin PSUs Earned | Customer Satisfaction PSUs Earned | Total PSUs at Target | PSUs Earned and Vested as a % of Target |
| Mr. Kennedy | 6,254 | 6,253 | 3,127 | — | 3,127 | 15,634 | 20% |
| Mr. Best | 4,927 | 4,927 | 2,464 | — | 2,464 | 12,318 | 20% |
| Mr. Taride | 2,394 | 2,394 | 1,596 | — | 1,596 | 6,384 | 25% |
| Mr. Frecker | 449 | 449 | 299 | — | 299 | 1,197 | 25% |
| ||
Other Compensation Elements
Benefit Programs
We maintain a qualified defined contribution plan (inin which substantially all of our U.S.-based employees can participate) and a non-qualified deferred compensation program, in which our NEOs (other than Mr. Taride),participate (the “401(k) Plan”). The 401(k) Plan provides that participants are eligible to participate, as described under “Pension Benefits” below. We maintainreceive a matching company contribution equal to (i) 100% of their contributions for up to 3% of compensation (up to IRS limits), and (ii) 50% of their contributions for up to the non-qualified deferrednext 2% of compensation plan for select executives(up to provide for retirement benefits that cannot be provided under the qualified defined contribution plan due to limitations under the Code.IRS limits).
Perquisites
We provide perquisites and other personal benefits to our NEOs that we and ourthe Compensation Committee believe are reasonable and consistent with our overall compensation program toprogram. These benefits better enable us to attract and retain superior employees for key positions. Our perquisites generally consist of access to benefits that are available to individuals in leadership roles across the company, including personal use of a company owned vehicle, relocation assistance, and group excess liability umbrella insurance. The NEOs were also entitled to participate in an executive physical program during 2023. Furthermore, during 2023, the Compensation Committee also approved the provision of a financial counseling and tax preparation benefit to the company’s most senior leaders, including the NEOs. The Compensation Committee approved the program to help ensure that senior management fully understands and maximizes the opportunity presented by their compensation and benefits package.
In limited circumstances, NEOs may also have access to travel on private aircraft. We use corporateprivate aircraft primarily for the purpose of encouraging and facilitating business travel by our senior executives (primarily our CEO) and directors, generally for travel inwithin the United States and, less frequently, internationally. In addition, our CEO uses corporatePursuant to his employment agreement, Mr. Scherr had access to private aircraft for limited personal air travel.
The Compensation Committee periodically reviews our perquisite policies to help ensure that they are reasonable.reasonable and competitive.
Severance Plan for Senior Executives
In August 2021, the Board adopted the 2021 Hertz Global Holdings, Inc. Severance Plan for Senior Executives, as may be amended from time to time (the “Severance Plan”). The Severance Plan provides for senior executives to be eligible to receive severance benefits if the participant’s employment is terminated for a reason other than “cause,” death or disability. Mr. Stone forfeited his right to participate in the Severance Plan in connection with his receipt of a transition retention bonus discussed below under “— Agreements with NEOs — Agreement with Mr. Stone.”
The Severance Plan provides that in the event of a qualifying termination, the participant will be eligible for severance equal to (a) 1.5 times their base salary and target annual cash incentive, (b) payment of a pro-rata annual cash incentive for the year of termination based on actual achievement of performance metrics, (c) continued medical and continued health benefits for 18 months following termination, and (d) executive outplacement services of up to $25,000. The participants must execute (and not revoke) a release of claims within 60 days following termination to be eligible for these benefits. The plan requires compliance with customary covenants regarding confidential information, non-competition, non-solicitation and non-disparagement.
For Mr. Scherr, in addition to eligibility for benefits under the Severance Plan, his Employment Agreement provided rights to severance if he terminated his employment for “good reason,” as defined in the agreement.
| | | | | 41 | | | | |
See “— Agreements with NEOs — Agreement with Mr. Scherr” below. Mr. Keppy’s offer letter provides a similar severance benefit if he terminates his employment for “good reason,” as defined in the agreement, during the first three years of his employment. See “— Agreements with NEOs — Agreement with Mr. Keppy” below. Mr. Scherr’s Employment Agreement also requires compliance with post-employment restrictive covenant provisions that are more extensive and generally longer in duration than those applicable under the Severance Plan.
Agreements with NEOs
Agreement with Mr. Scherr
Mr. Scherr’s Employment Agreement, entered into on February 3, 2022 (the “Employment Agreement”), provided for an initial term ending on December 31, 2026, unless earlier terminated by Mr. Scherr or the company. On March 12, 2024, Mr. Scherr provided the company with notice of his intent to voluntarily resign from the company and his resignation became effective on March 31, 2024.
During his tenure with the company, the Employment Agreement provided Mr. Scherr with an annual base salary of $1.5 million and the right to participate in the company’s annual incentive program in effect from time to time, with a target annual incentive amount equal to 160% of his base salary.
In lieu of participation in the company’s long-term incentive program, Mr. Scherr received three equity grants upon his hiring that, in aggregate, provided him with the opportunity to earn a total number of shares representing 2% of the company’s fully diluted shares as of the Emergence. These awards were designed by the Compensation Committee with the support of its independent compensation consultant, FW Cook, to closely align Mr. Scherr’s compensation with the value that management creates for stockholders, particularly for the performance-based awards that directly linked earning of the awards with stock price improvement. In making these awards, our Compensation Committee was focused on successfully recruiting a leader who the Board believed had the requisite experience and leadership qualities to successfully grow our business and position the company to succeed in the context of the future of mobility. Specifically, our Board sought leadership to undertake a transformation of the company. In that pursuit, our Compensation Committee created what it believed to be an appropriate compensation structure to incentivize Mr. Scherr in a manner aligned with the interests of our stockholders while inducing Mr. Scherr to join the company relative to other opportunities available to him at the time. The awards can be summarized as follows:
1.
Time-Based RSUs: In order to provide for retention of Mr. Scherr and to allow him to earn compensation based on our stock price over a four-year period, our Compensation Committee awarded 2,802,590 time-based RSUs (representing 0.45% of fully diluted shares of company common stock as of Emergence) that vested with respect to 40% of the time-based RSUs on December 31, 2022 and 20% on December 31, 2023. Had Mr. Scherr’s employment with the company continued (except as set forth below), an additional 20% of the time-based RSUs would have vested on each of December 31, 2024 and 2025.
2.
Performance-Based RSUs — Stock Price: At the heart of Mr. Scherr’s sign on package and representing more than 50% of Mr. Scherr’s total sign-on awards, were 6,539,378 performance-based restricted stock units (representing 1.05% of fully diluted shares of the company’s common stock as of Emergence) (the “Stock Price RSUs”). The Stock Price RSUs were designed to be earned solely based on the company’s achievement of the following share price targets, and, if earned based on stock price, would vest annually in 20% increments from December 31, 2022 through December 31, 2026, and in any case no later than December 31, 2026.
| | | | | 42 | | | | |
| | Performance-Based RSUs – Stock Price (#) | | | | Required 90-Day VWAP | |
| | 1,401,295 | | | | $15.00 | |
| | 1,401,295 | | | | $20.00 | |
| | 1,401,295 | | | | $25.00 | |
| | 1,401,296 | | | | $30.00 | |
| | 934,197 | | | | $35.00 | |
Our Compensation Committee determined these awards should comprise the largest portion of Mr. Scherr’s sign-on equity grants to align his compensation with sustained levels of share price performance. Importantly, the share price performance metrics referenced in the table above would be achieved only when the 90-day weighted average closing price (“VWAP”) of our common stock equaled or exceeded the applicable price. Sustained share price performance was thus required, further aligning Mr. Scherr’s compensation to stockholder interests. Once earned based on the stock price, the award would be paid out subject to a time-based vesting schedule that approximated 20% increments over five years, recognizing that “catch-up” vesting might have been needed to ensure all earned shares were paid by December 31, 2026.
Based on our stock price performance during 2022, Mr. Scherr earned the shares associated with the $15.00 and $20.00 VWAPs during 2022. 20% of those shares vested on each of December 31, 2022 and December 31, 2023. The balance of those earned shares would have vested ratably across December 31, 2024, 2025 and 2026 had Mr. Scherr remained employed through each such date.
No additional Stock Price RSUs were earned in 2023 as we did not achieve a 90-day VWAP at the $25, $30 or $35 level during 2023. Upon Mr. Scherr’s departure from the company on March 31, 2024, he ceased to be eligible to earn any further RSUs.
3.
Performance-Based RSUs — Stock Price and Transaction: As the final part of Mr. Scherr’s sign-on equity award, he was granted 3,113,989 performance-based RSUs (representing 0.50% of fully diluted shares of the company’s common stock as of Emergence) (the “Transaction RSUs”) that would be earned if specified share price targets were satisfied and there was (a) a change in control of the company or (b) a transaction following which the shareholdings of Certares, Knighthead and their affiliates were together reduced below one-third of their levels as of February 3, 2022 (the “Transaction Condition”). If a share price trigger for this award was timely attained, the earned shares would pay out upon the 12-month anniversary of the date of the Transaction Condition (except as set forth below). Our Compensation Committee tied the vesting of this award to the achievement of share price performance and the occurrence of such a transaction to provide Mr. Scherr with protection in the event of such a transaction, but only if such a transaction occurred after there had been significant share price appreciation. The stock price metrics were as follows:
| | Portion of Award | | | | Required Stock Price | |
| | 50% | | | | $35.00 | |
| | 100% | | | | $40.00 | |
| | | | | 43 | | | | |
If Mr. Scherr’s employment had terminated without “cause” or if he had resigned for “good reason” (in each case as defined in his Employment Agreement) outside of the context of a change in control, his sign-on equity awards would have been treated as follows (subject to his execution and non-revocation of a release):
| | Time-Based RSUs | | | | Vesting through December 31st of the year in which the termination occurred | |
| | Performance-Based RSUs – Stock Price | | | | Vesting through December 31st of the year in which the termination occurred, to the extent that a required 90-day VWAP had been achieved prior to the date of his separation | |
| | Performance-Based RSUs – Stock Price and Transaction | | | | Accelerated vesting of any fully earned portion of the award with payment at termination rather than 12 months after the change in control | |
Because Mr. Scherr terminated his employment with the company without “good reason,” as defined in his Employment Agreement, all of Mr. Scherr’s unvested sign-on equity awards were forfeited in full as of March 31, 2024.
During his employment, Mr. Scherr was also entitled to participate in all employee and senior executive benefits in accordance with the programs then available to the company’s senior executives. Similarly, during his employment, Mr. Scherr was entitled to participate in any retirement, deferred compensation or similar plan available to senior executives and in effect from time to time.
Mr. Scherr was entitled to receive perquisites under the Employment Agreement, including any such perquisites available from time to time to senior executives of the company. Mr. Scherr was entitled to an annual physical at the company’s expense and access to private aircraft for limited personal use, including between our headquarters in Florida and his home in New York.
Mr. Scherr received company-paid housing for six months as he began his employment with us, and up to $30,000 in reimbursement for legal expenses incurred in negotiating the Employment Agreement.
Mr. Scherr was entitled to severance and change in control benefits, which are summarized under “Potential Payments Upon Termination or Change in Control” below, but these terminated upon his separation from the company on March 31, 2024, without having had effect. The Employment Agreement prohibits Mr. Scherr from competing with the company or soliciting our employees or clients for two years following the termination of his employment for any reason.
Agreement with Mr. Keppy
Mr. Keppy and the company entered into an offer letter in connection with his hiring in November 2023. He also entered into a standard Employee Confidentiality and Non-Competition Agreement as of the same date. The offer letter provides for Mr. Keppy to receive the following:
•
An annual base salary of $1.25 million;
•
A target opportunity under the company’s annual incentive plan at 100% of his annual base salary (pro-rated for 2023); and
| | | | | 44 | | | | |
•
Participation in the company’s annual long-term incentive plan with a target equity award of $2.5 million (pro-rated for 2023).
Also under the offer letter, Mr. Keppy was eligible to receive a cash sign-on bonus in the amount of $750,000, payable on the earlier of his first payroll date in January 2024 and a termination of his employment by the company without “cause” (as defined in the agreement) or by Mr. Keppy for “good reason” (as defined in the agreement, and which includes Mr. Keppy ceasing to be a direct report of Mr. Scherr’s specifically or, in the alternative, a direct report of the Board). Mr. Keppy must repay a pro-rata portion of the sign-on bonus to the company if his employment is terminated for “cause,” or he voluntarily terminates his employment within 24-months of his hiring date without “good reason.” For “good reason” to exist, Mr. Keppy must deliver written notice to the company of the existence of the action that could constitute good reason within 30 days of his knowledge of the action, the company must fail to cure the action within 30 days of such notice and, if the company fails to cure the action, Mr. Keppy terminates his employment within 30 days after the end of the cure period.
The offer letter also provided Mr. Keppy with two sign-on equity awards as of his start date, to compensate Mr. Keppy for the value of foregone equity grants with his prior employer and otherwise incent him to join the company:
•
An RSU grant, with a grant date value of $10.0 million, that will vest ratably on the first three anniversaries of the date of grant,assuming his continued employment through each vesting date, and that will vest immediately in the event Mr. Keppy voluntarily leaves his employment for “good reason” (as defined above) or is terminated without “cause” by the company; and
•
An RSU grant with a grant date value of $5.0 million that will cliff vest on the fourth anniversary of the grant date, assuming his continued employment with the company, and that is subject to the terms and conditions of the company’s standard RSU agreement, including its early vesting terms (i.e., this grant does not provide Mr. Keppy with any accelerated vesting if he voluntarily leaves his employment for any reason, including a situation that would result in “good reason”).
Under the offer letter, Mr. Keppy is also entitled to receive benefits generally available to other relocating executives, including relocation assistance in the form of a net cash payment of $100,000 plus expenses related to the movement of his household goods, subject to repayment to the company of (a) 100% of such amounts if Mr. Keppy terminates his employment without “good reason” within 12 months of his start date or (b) 50% of such amounts if Mr. Keppy terminates his employment without “good reason” between 12 and 24 months of his start date.
The offer letter also provides that Mr. Keppy will be eligible for use of a Hertz service vehicle for personal and professional use, and participation in other benefit programs available to executive officers of the company, as well as reimbursement of legal fees up to $10,000 for the completion of his offer letter.
Furthermore, pursuant to the offer letter, Mr. Keppy is a participant in the Severance Plan from the first day of his employment. Until the third anniversary of Mr. Keppy’s start date, upon a termination without “cause,” he will be entitled to no less than the benefits set forth under the Severance Plan as in effect on the date of his offer letter, or, if the Severance Plan is subsequently amended or replaced and provides for more favorable benefits, in the aggregate, than those provided in the offer letter, those enhanced benefits. In addition, during this three-year period, Mr. Keppy will be entitled to benefits no less favorable than those set forth in the Severance Plan in the event he voluntarily leaves his employment for “good reason.”
Agreement with Ms. Brooks
Ms. Brooks, previously our Chief Accounting Officer, was promoted to the role of Executive Vice President, Chief Financial Officer, effective July 25, 2023. In connection with her promotion, her annual base salary
| | | | | 45 | | | | |
was increased from $450,000 to $600,000, and her target opportunity under the company’s annual incentive plan remained at 80% of her annual base salary. Ms. Brooks’ long-term incentive plan participation amount was also increased in connection with her promotion, resulting in her total target equity award amount being increased from $500,000 to $1,000,000. She received incremental grants under the 2023 LTIP of 7,500 RSUs and 11,250 PSUs on October 2, 2023, to reflect this increase. Ms. Brooks’ promotion and these new compensation opportunities were memorialized in a standard offer letter dated July 25, 2023.
Agreement with Mr. Stone
Mr. Stone served as our Chief Executive Officer from May 16, 2020 to October 5, 2021, and accepted a role as our President and Chief Operating Officer in October 2021, following our Emergence. In connection with this change in role, in October 2021, Mr. Stone and the company entered into a Second Amended and Restated Offer Letter, Confidentiality and Non-Competition Agreement. The Compensation Committee provided certain benefits to Mr. Stone to retain his leadership of our global operations during the search for a new CEO.
The agreement provided for Mr. Stone to receive a base salary of $1.0 million and targeted opportunity under the annual incentive plan at 140% of base salary. Also under the agreement, Mr. Stone waived all rights to future severance benefits from the company in exchange for a transition retention bonus with a value equal to $2 million plus the value of 24 months of employer paid group health insurance premiums (i.e., what his severance benefit would otherwise have been worth under the Severance Plan in effect upon Emergence). The transition retention bonus was paid on March 1, 2022 in accordance with its terms. The agreement prohibits Mr. Stone from competing with the company or soliciting our employees for 18 months following the termination of his employment for any reason.
Also, in February 2022, when the company hired Mr. Scherr as CEO, stock options and RSUs granted to Mr. Stone in November 2021 in connection with Emergence (the “Emergence Awards”) were amended such that (x) subject to his continued employment through December 31, 2022, any then-unvested Emergence Awards would accelerate and become fully vested as of such date, and (y) if, prior to December 31, 2022, Mr. Stone was terminated by the company without “cause” (as defined in the Severance Plan), any then unvested Emergence Awards would accelerate and become fully vested as of his termination date, subject to execution of a release. These awards vested on December 31, 2022 in accordance with their terms.
Mr. Stone terminated his employment with the company effective October 31, 2023.
Clawback Policy
During 2023, in light of new rules promulgated by Nasdaq and SEC requirements, we adopted the Hertz Global Holdings, Inc. Clawback Policy (the “Nasdaq Clawback Policy”). The Nasdaq Clawback Policy provides for the reasonably prompt recovery (or “clawback”) of certain excess incentive-based compensation received during an applicable three-year recovery period by current or former executive officers (including the NEOs) in the event the company is required to prepare an accounting restatement due to material noncompliance with any financial reporting requirement under the securities laws.
Excess incentive-based compensation for these purposes generally means the amount of incentive-based compensation received (on or after October 2, 2023) by such executive officer that exceeds the amount of incentive-based compensation that would have been received by such executive officer had it been determined based on the restated amounts, without regard to any taxes paid.
Incentive-based compensation potentially subject to recovery under the mandatory accounting restatement provisions of the Nasdaq Clawback Policy is generally limited to any compensation granted, earned or
| | | | | 46 | | | | |
vested based wholly or in part on the attainment of one or more financial reporting measures. The Company maintainsNasdaq Clawback Policy includes limited exceptions to the requirement to clawback amounts in the event of an accounting restatement in accordance with Nasdaq rules and SEC requirements.
Prior to the promulgation of rules by Nasdaq, the company had voluntarily adopted a clawback policy to promote responsible risk managementmanagement. This policy applied to a broader group of employees than is required by the Nasdaq rules. The Compensation Committee chose to maintain this policy (the “Supplemental Clawback Policy”) to serve as a primary source of compensation recovery opportunity related to senior employees other than executive officers (generally employees at or above the Vice President level), and, as a supplement to help ensure that the incentives of our management are alignedNasdaq Clawback Policy for executive officers.
For executive officers, the Supplemental Clawback Policy will only operate with those ofrespect to amounts subject to the Company’s stockholders. The policy applies to all employees who are at the director level and above, including our NEOs, and covers:
| ||
Stock Ownership Guidelines and Hedging and Pledging Policy
Stock Ownership Guidelines
| | Position | | | | ||
| | ||||||
| | | | 5x | | ||
| | | | 3x | | ||
Until the target ownership levels are met, executives generally are restricted from selling more than 50% of phantom shares).the net shares received upon vesting or exercise of equity awards after the payment of exercise prices and withholding taxes, as applicable.
As of the date this Proxy Statement, all continuing NEOs have either met their retention guideline or are currently in the transition period for compliance with the Stock Ownership Guidelines.
Our Insider Trading Windows
| | | | | 47 | | | | |
Summary of the Company’s stock the day before the date of such grant. We generally grant equity awards to our senior executives in the first quarter of the fiscal year following the release of earnings.Compensation Decision-Making Process
| ||
The Compensation Committee is responsible for reviewing and establishing the compensation program for our NEOs, subject to approval by the Board. To help design the program, the Compensation Committee uses a variety of inputs, including the following.
Annual Say-on-Pay Vote
We provide stockholders with an annual “say-on-pay” advisory vote on our executive compensation program. At our 2023 annual meeting of stockholders, approximately 85% of the votes cast for the say-on-pay proposal were in favor of our named executive officer compensation program and policies. Our Compensation Committee evaluated the results of the 2023 say-on-pay vote and, in light of the majority support for our executive compensation program, decided to maintain the core design of our compensation program. The Compensation Committee expects to continue to consider the outcome of future say-on-pay votes, in addition to various other factors, when making future compensation decisions.
Compensation Consultant and Market Data
The Compensation Committee has the authority to retain outside advisors as it deems appropriate. For 2023, the Compensation Committee retained FW Cook as its independent compensation consultant with respect to the 2023 executive compensation program. FW Cook does not perform any services for the company other than in its role as independent advisor to the Compensation Committee and the Compensation Committee has assessed FW Cook’s independence. The Compensation Committee has also considered and assessed all relevant factors that could give rise to a potential conflict of interest with respect to FW Cook in 2023. Based on this review, the Compensation Committee did not identify any conflict of interest.
The responsibilities of our compensation consultant include:
•
Reviewing and advising on total executive compensation, including salaries, short-term and long-term incentive programs and relevant performance goals;
•
Advising on industry trends and best practices in executive compensation;
•
Advising on effectively aligning pay with performance and with our business needs; and
•
Assisting the Compensation Committee with any other matters related to executive compensation arrangements, including executive employment and award arrangements.
The compensation consultant also provides internal and external pay comparison data to the Compensation Committee. The Compensation Committee uses this data as one element in its compensation decisions and does not mandate target ranges for our NEO salaries, annual incentive opportunities or long-term incentives as compared to the market data.
To determine the appropriate market data for use in its compensation decisions, the Compensation Committee selected our Peer Group for 2017 in late 2016 in consultation witha peer group based on the recommendations of FW Cook. FW Cook prepared a list of potential peer companies (with a particular focus on travel companies). Because the number of our direct industry competitors in the global market is limited, we diddo not limit the Survey Grouppeer group to our direct competitors, but also included similarly-sizedcompetitors. FW Cook proposed companies that bearhave substantial similarities to our business model, are comparable to us based on revenues and market capitalization, and with which we compete with for talent, including traveltalent.
We prefer to have a consistent peer group year-to-year, and travel-related companies. The companies in the Peer Group had annual revenuesCompensation Committee chose to keep the peer group used for 2016 of approximately $2.9 billion to $21.3 billion and median 2016 annual revenues of approximately $8.8 billion,2022 as compared to our 2016 revenue of $8.8 billion. Twenty-one companies are included in the Peer Group. Ofpeer group for 2023. At the twenty-one companies intime the Peer Group, 12 were in our 2016 Peer Group.
peer group
| | | | | 48 | | | | |
for 2023, we were at the 36th percentile in revenue and the 60th percentile in market capitalization within the group. In the fourth quarter of 2023 the Compensation Committee again reviewed our peer group for use in setting 2024 compensation and determined no changes were necessary for 2024.
The following companies comprised our peer group for purposes of evaluating our executive compensation for 2023:
| | | |||||||
| Alaska Air Group, Inc. | | | Lithia Motors, Inc. | | | |||
| | | AutoNation, Inc. | ||||||
| | Norwegian Cruise Line Holdings Ltd. | | | |||||
| | Avis Budget Group, Inc. | | | | Penske Automotive Group, Inc. | |||
| | CarMax, Inc. | | | | Royal Caribbean Cruises Ltd. | | | |
| | Carvana Co. | | | | Ryder Systems, Inc. | | ||
| | Element Fleet Management Corp. | | | | Sonic Automotive, Inc. | | | |
| | | Group 1 Automotive, Inc. | | | | Southwest Airlines Co. | | |
| | | Hilton Worldwide Holdings, Inc. | | | United Rentals, Inc. | | | |
| | | JetBlue Airways | ||||||
| | | Travel + Leisure Co. | | |
Role of the CEO
Compensation Risk
Our compensation policies and practices, including the NEO compensation programs, have been designed to pay bonuses for 2017include features intended to reduce the likelihood of upexcessive risk-taking. The Compensation Committee annually reviews our compensation policies and programs to (i) 1%identify and address any potential risks that could be created by the programs. In October 2023, with the assistance of Human Resources and Legal department personnel, the Committee undertook a risk review of our Gross EBITDA2023 compensation programs for 2017 for our CEO and (ii) 0.5% of our Gross EBITDA for 2017 for each ofall employees. Based on this review, the other NEOs. Gross EBITDA is a Non-GAAP measure. Our Gross EBITDA for 2017, the definition of “Gross EBITDA” and its reconciliation to its most comparable non-GAAP measure are set forth below under “Non-GAAP Measures” in Annex A to this proxy statement.
| ||
COMPENSATION COMMITTEE REPORT
| ||
| ||
| ||
| ||
| ||
The Compensation Committee has reviewed and discussed the Compensation Discussion and Analysis included in this proxy statementProxy Statement for the year ended December 31, 2023 with members of management. Based on that review and discussion, the Compensation Committee recommended to the Board that the Compensation Discussion and Analysis be included in this proxy statement.Proxy Statement and incorporated by reference into our Annual Report on Form 10-K.
The Compensation Committee,
Colin Farmer, Chair
Andrew Shannahan
Colin Farmer, Chair
Andrew Shannahan
| | |||||||
| 49 | | | | |
2023 SUMMARY COMPENSATION TABLE
The following table orpresents compensation information for the “Summary Compensation Table”, summarizes the compensation earned inindividuals who served as our Chief Executive Officer and Chief Financial Officer during 2023, for each of the other three most highly compensated individuals who were serving as executive officers at the end of 2023, and for one individual who would have been a named executive officer had he been in his role at fiscal years noted byyear-end. See “Compensation Discussion and Analysis — Agreements with NEOs” for additional information.
| | | Name and Principal Position | | | | Year | | | | Salary(1) ($) | | | | Bonus(2) ($) | | | | Stock Awards(3) ($) | | | | Option Awards ($) | | | | Non-Equity Incentive Plan Compen- sation(4) ($) | | | | All Other Compen- sation(5) ($) | | | | Total ($) | | |
| | | Stephen Scherr Former Chair and CEO | | | | 2023 | | | | 1,500,000 | | | | — | | | | — | | | | — | | | | 1,200,000 | | | | 200,417 | | | | 2,900,417 | | |
| | 2022 | | | | 1,269,231 | | | | — | | | | 178,319,484 | | | | — | | | | 2,119,562 | | | | 427,860 | | | | 182,136,137(6) | | | |||||
| | | | | | | | | | | | | | | | | | | | | | | | | | | | | | | | | |||||
| | | Alexandra Brooks EVP and Chief Financial Officer | | | | 2023 | | | | 515,769 | | | | — | | | | 505,485 | | | | — | | | | 206,301 | | | | 43,662 | | | | 1,271,218 | | |
| | | | | | | | | | | | | | | | | | | | | | | | | | | | | | | | | |||||
| | | | | | | | | | | | | | | | | | | | | | | | | | | | | | | | | |||||
| | | Colleen Batcheler EVP, General Counsel and Secretary | | | | 2023 | | | | 600,000 | | | | — | | | | 1,416,096 | | | | — | | | | 300,000 | | | | 20,379 | | | | 2,336,475 | | |
| | 2022 | | | | 371,539 | | | | 1,075,000 | | | | 4,528,717 | | | | — | | | | 390,082 | | | | 187,196 | | | | 6,552,534 | | | |||||
| | | | | | | | | | | | | | | | | | | | | | | | | | | | | | | | | |||||
| | | Justin Keppy EVP and Chief Operating Officer | | | | 2023 | | | | 158,654 | | | | 750,000 | | | | 15,000,003 | | | | — | | | | 80,479 | | | | 172,512 | | | | 16,161,648 | | |
| | | | | | | | | | | | | | | | | | | | | | | | | | | | | | | | | |||||
| | | | | | | | | | | | | | | | | | | | | | | | | | | | | | | | | |||||
| | | Eric Leef EVP and Chief Human Resources Officer | | | | 2023 | | | | 500,000 | | | | — | | | | 635,764 | | | | — | | | | 200,000 | | | | 44,482 | | | | 1,382,793 | | |
| | 2022 | | | | 492,500 | | | | — | | | | 510,013 | | | | — | | | | 315,000 | | | | 26,394 | | | | 1,343,907 | | | |||||
| | | | | | | | | | | | | | | | | | | | | | | | | | | | | | | | | |||||
| | | Others | | | ||||||||||||||||||||||||||||||||
| | | Kenny Cheung Former EVP and Chief Financial Officer | | | | 2023 | | | | 201,923 | | | | — | | | | 1,181,933 | | | | — | | | | — | | | | 15,408 | | | | 1,403,760 | | |
| | 2022 | | | | 600,000 | | | | — | | | | 900,001 | | | | — | | | | 504,000 | | | | 24,606 | | | | 2,028,607 | | | |||||
| | 2021 | | | | 600,000 | | | | 660,000 | | | | 1,570,200 | | | | 3,081,600 | | | | 846,891 | | | | 27,537 | | | | 6,786,228 | | | |||||
| | | Paul Stone Former President and Chief Operating Officer | | | | 2023 | | | | 846,154 | | | | — | | | | 1,869,902 | | | | — | | | | — | | | | 49,104 | | | | 2,772,653 | | |
| | 2022 | | | | 1,000,000 | | | | 2,031,638 | | | | 1,499,995 | | | | — | | | | 1,470,000 | | | | 37,198 | | | | 6,038,831 | | | |||||
| | 2021 | | | | 1,000,000 | | | | 1,400,000 | | | | 2,617,000 | | | | 5,136,000 | | | | 2,470,099 | | | | 30,070 | | | | 12,653,169 | | | |||||
(1)
Mr. Keppy joined the company on November 15, 2023. Mr. Scherr’s employment with the company concluded on March 31, 2024, Mr. Cheung’s employment with the company concluded on April 14, 2023, and Mr. Stone’s employment with the company concluded on October 31, 2023.
(2)
For 2023, for Mr. Keppy, includes a sign-on cash bonus paid to him in connection with his hiring.
(3)
The amounts reported represent the aggregate grant date fair value of applicable equity awards and were computed in accordance with FASB Topic 718. Assumptions used in the calculations of these amounts are included in “Note 8 — Stock-Based Compensation” in the notes to our NEOs. Compensation consolidated financial statements in our 2023 Annual Report. For fiscal 2023, the “Stock Awards” column reflects the grant date fair values of the following:
(a)
for 2015 was paid by former Hertz Holdings, while compensation in 2016 was paid by former Hertz Holdings orall NEOs other than Mr. Scherr, one-third of the Company.2022 PSUs granted under the 2022 LTIP, which are as described under “Compensation Discussion and Analysis — Long-Term Incentives.” For the 2022 PSUs, because we have used a staged approach to goal setting, with one-third of the total 2022 PSU grant conditionally earned based on performance against a series of three one-year goals, and the goals for each tranche set at the beginning of each performance
| Name and Principal Position | Year | Salary ($) | Bonus(1) ($) | Stock Awards(2) ($) | Option Awards(2) ($) | Non-Equity Incentive Plan Compensation ($) | Change in Pension Value and Nonqualified Deferred Compensation Earnings(3) ($) | All Other Compensation(4) ($) | Total ($) |
Katheryn Marinello President and CEO | 2017 | 1,416,539 | 1,305,000 | 2,069,994 | 3,105,001 | — | — | 116,265 | 8,012,799 |
Thomas Kennedy Senior Executive Vice President and Chief Financial Officer | 2017 | 775,000 | — | 1,599,988 | 400,001 | — | — | 19,379 | 2,794,368 |
| 2016 | 754,808 | — | 1,637,934 | 555,000 | — | — | 18,114 | 2,965,856 | |
| 2015 | 697,539 | 945,000 | 1,959,112 | 2,000,001 | — | — | 16,505 | 5,618,157 | |
Tyler Best Executive Vice President and Chief Information Officer | 2017 | 600,000 | — | 1,280,008 | 319,999 | — | — | 50,541 | 2,250,548 |
| 2016 | 600,000 | — | 1,215,193 | 404,999 | — | — | 82,529 | 2,302,721 | |
| 2015 | 553,846 | 2,780,000 | 1,543,625 | 1,600,002 | — | — | 78,648 | 6,556,121 | |
Michael Taride(5) Group President, Rent A Car International | 2017 | 517,556 | 250,000 | 1,280,008 | 319,999 | — | 93,160 | 112,467 | 2,573,190 |
| 2016 | 533,341 | — | 1,740,023 | — | — | 693,550 | 92,263 | 3,059,177 | |
| 2015 | 591,710 | — | 800,007 | 800,007 | 319,819 | — | 104,764 | 2,616,307 | |
Richard Frecker Executive Vice President, General Counsel and Secretary | 2017 | 455,000 | 125,000 | 480,014 | 120,003 | — | 5,200 | 34,333 | 1,219,550 |
John Tague(6) Former President and CEO | 2017 | 33,462 | — | — | — | — | — | 3,786,620 | 3,820,082 |
| 2016 | 1,450,000 | — | 2,099,996 | 1,256,278 | — | — | 271,077 | 5,077,351 | |
| 2015 | 1,450,000 | 1,305,000 | 7,294,000 | 3,160,500 | — | — | 134,915 | 13,344,415 | |
Jeffrey Foland(6) Former Senior Executive Vice President and Chief Revenue Officer | 2017 | 153,654 | — | — | — | — | — | 2,176,840 | 2,330,494 |
| 2016 | 850,000 | — | 1,728,481 | 555,000 | — | — | 32,221 | 3,165,702 | |
| 2015 | 800,962 | 2,647,500 | 9,906,040 | 2,500,004 | — | — | 171,768 | 16,026,274 | |
Alexandria Marren(7) Former Executive Vice President, North American Rental Car Operations | 2017 | 512,308 | — | 799,994 | 199,996 | — | — | 956,820 | 2,469,118 |
| | |||||||
| 50 | | | | |
| Name | Personal Use of Aircraft(a) | Personal Use of Car(b) | Travel(c) | Financial Assistance and Legal Fees(d) | Perquisites Subtotal | Life Insurance Premiums | Company Match on Plans(e) | Relocation(f) | Severance and Other(g) | Total Perquisites and Other Compensation |
| Ms. Marinello | 29,685 | 14,994 | 25,000 | 35,250 | 104,929 | 1,336 | — | 10,000 | — | 116,265 |
| Mr. Kennedy | — | 18,258 | — | — | 18,258 | 1,121 | — | — | — | 19,379 |
| Mr. Best | — | 19,604 | 12,869 | 4,000 | 36,473 | 868 | 13,200 | — | — | 50,541 |
| Mr. Taride | — | 4,248 | — | 15,035 | 19,283 | 4,899 | — | — | 88,285(5) | 24,182 |
| Mr. Frecker | — | 15,250 | — | — | 15,250 | 483 | 18,600 | — | — | 34,333 |
| Mr. Tague | — | 4,807 | — | — | 4,807 | 2 | 1,338 | — | 3,780,473 | 3,786,620 |
| Mr. Foland | — | 3,952 | — | — | 3,952 | 139 | 6,146 | — | 2,166,603 | 2,176,840 |
| Ms. Marren | — | 10,750 | — | 4,000 | 14,750 | 1,139 | 7,269 | — | 933,662 | 956,820 |
year, only the second tranche of the 2022 PSUs is considered granted in 2023 under FASB Topic 718 and included in this table. The following is the aggregate grant date fair value of the 2022 PSUs if we had assumed the maximum amount (200%) of the second tranche would have been earned: Ms. Brooks, $147,957; Ms. Batcheler, $672,191; Mr. Leef, $251,528; Mr. Cheung, $443,870; Mr. Stone, $739,783. No awards were actually earned. Mr. Keppy is not a participant in the 2022 LTIP. Mr. Cheung’s and Mr. Stone’s 2022 PSUs granted under the 2022 LTIP were forfeited in connection with their separations from the company.
(b)
for all NEOs other than Mr. Scherr, one-third of the 2023 PSUs and all the 2023 RSUs granted under the 2023 LTIP, which are as described under “Compensation Discussion and Analysis — Long-Term Incentives.” For the 2023 PSUs, because we have used a staged approach to goal setting, with one-third of the total 2023 PSU grant conditionally earned based on performance against a series of three one-year goals, and the goals for each tranche set at the beginning of each performance year, only the first tranche of the 2023 PSUs is considered granted in 2023 under FASB Topic 718 and included in this table. The following is the aggregate grant date fair value of the 2023 PSUs if we had assumed the maximum amount (200%) of the first tranche would have been earned: Ms. Brooks, $287,676; Ms. Batcheler, $720,005; Mr. Leef, $340,000; Mr. Cheung, $639,994; Mr. Stone, $1,000,003. No awards were actually earned. Mr. Keppy’s 2023 LTIP awards were not granted until January 2024. Mr. Cheung’s and Mr. Stone’s 2023 PSUs and 2023 RSUs granted under the 2023 LTIP were forfeited in connection with their separations from the company.
(4)
Reflects amounts paid under the 2023 EICP, as described in the “Compensation Discussion and Analysis — Annual Incentive Awards.”
(5)
Includes the following for 2023:
| | | Name | | | | Perquisites and Personal Benefits(a) | | | | Tax Gross Ups ($) | | | | Company Contributions to Qualified 401(k) Plan(b) ($) | | | ||||||||||||||||||||||||
| | Personal Use of Aircraft ($) | | | | Personal Use of Vehicle ($) | | | | Financial Planning Assistance ($) | | | | Reimburse- ment of Legal Fees ($) | | | | Relocation Related Benefits ($) | | | | Executive Physical ($) | | | | Life Insurance Premiums ($) | | | |||||||||||||
| | | Mr. Scherr | | | | 167,016 | | | | 17,587 | | | | 13,888 | | | | — | | | | — | | | | — | | | | 1,926 | | | | — | | | | — | | |
| | | Ms. Brooks | | | | — | | | | 17,925 | | | | 11,767 | | | | — | | | | — | | | | — | | | | 770 | | | | — | | | | 13,200 | | |
| | | Ms. Batcheler | | | | — | | | | 6,408 | | | | — | | | | — | | | | — | | | | — | | | | 770 | | | | — | | | | 13,200 | | |
| | | Mr. Keppy | | | | — | | | | — | | | | — | | | | 7,364 | | | | 100,000 | | | | — | | | | 268 | | | | 64,880 | | | | — | | |
| | | Mr. Leef | | | | — | | | | 19,782 | | | | 10,858 | | | | — | | | | — | | | | — | | | | 642 | | | | — | | | | 13,200 | | |
| | | Others | | | ||||||||||||||||||||||||||||||||||||
| | | Mr. Cheung | | | | — | | | | 1,951 | | | | — | | | | — | | | | — | | | | — | | | | 257 | | | | — | | | | 13,200 | | |
| | | Mr. Stone | | | | — | | | | 23,076 | | | | 9,545 | | | | — | | | | — | | | | 2,227 | | | | 1,056 | | | | — | | | | 13,200 | | |
(a)
Amounts shown are valued at the incremental cost to us of providing the benefit or, for Personal Use of Vehicle, the annual lease value of company-provided vehicles. For Personal Use of Aircraft, incremental cost includes our cost of the actual fuel burned per flight (at the per gallon cost of the immediately preceding fuel purchase(s)), together with costs such as landing fees, parking/hangar fees, catering expense, lavatory cleaning, garbage removal and similar variable expenses associated with a flight, as well as crew travel expenses incurred because of the personal use. Incremental cost of personal flights also includes the incremental cost of any repositioning flights necessary to accommodate the personal use. We exclude fixed costs such as hangar rent, insurance, maintenance and crew salaries.
(b)
Reflects company matching contributions to the 401(k) Plan.
(6)
This amount reflects Mr. Scherr’s total compensation calculated in accordance with SEC rules and does not reflect the actual taxable compensation he received for 2022. For reference, Mr. Scherr’s wages for 2022, calculated for purposes of his Form W-2 issued by the company, were $27,181,395.
| | |||||||
| 51 | | | | |
2023 GRANTS OF PLAN-BASED AWARDS
The following table sets forth, for each NEO, possible payouts under all non-equity incentive plan awards granted in 2017, allinformation about grants of Performance Shares, Performance Options, Optionsplan-based awards during 2023 (equity and Restricted Sharesnon-equity). All equity grants were made under the Hertz Global Holdings, Inc. 2021 Omnibus Incentive Plan.
| | | Name | | | | Type of Award | | | | Grant Date | | | | Estimated Possible Payouts Under Non-Equity Incentive Plan Awards(1) | | | | Estimated Future Payouts Under Equity Incentive Plan Awards(2) | | | | All Other Stock Awards: Number of Shares of Stock or Units(3) (#) | | | | Grant Date Fair Value of Stock and Option Awards(4) ($) | | | ||||||||||||||||
| | Threshold ($) | | | | Target ($) | | | | Maximum ($) | | | | Threshold (#) | | | | Target (#) | | | | Maximum (#) | | | |||||||||||||||||||||
| | | Stephen Scherr | | | ||||||||||||||||||||||||||||||||||||||||
| | | Annual Cash Incentive | | | | | | | | 90,000 | | | | 2,400,000 | | | | 5,280,000 | | | | — | | | | — | | | | — | | | | — | | | | — | | | ||||
| | | Alexandra Brooks | | | ||||||||||||||||||||||||||||||||||||||||
| | | Annual Cash Incentive | | | | | | | | 15,473 | | | | 412,603 | | | | 907,726 | | | | — | | | | — | | | | — | | | | — | | | | — | | | ||||
| | | 2023 Tranche of 2022 PSUs | | | | 3/31/2023 | | | | — | | | | — | | | | — | | | | 3,633 | | | | 4,541 | | | | 9,083 | | | | — | | | | 73,978 | | | ||||
| | | 2023 Tranche of 2023 PSUs | | | | 3/3/2023 | | | | — | | | | — | | | | — | | | | 4,262 | | | | 5,328 | | | | 10,655 | | | | — | | | | 100,000 | | | ||||
| | | 2023 Tranche of 2023 PSUs | | | | 10/2/23 | | | | — | | | | — | | | | — | | | | 3,000 | | | | 3,750 | | | | 7,500 | | | | — | | | | 43,838 | | | ||||
| | | RSUs | | | | 3/3/2023 | | | | — | | | | — | | | | — | | | | — | | | | — | | | | — | | | | 10,655 | | | | 199,994 | | | ||||
| | | RSUs | | | | 10/2/23 | | | | — | | | | — | | | | — | | | | — | | | | — | | | | — | | | | 7,500 | | | | 87,675 | | | ||||
| | | Colleen Batcheler | | | ||||||||||||||||||||||||||||||||||||||||
| | | Annual Cash Incentive | | | | | | | | 22,500 | | | | 600,000 | | | | 1,320,000 | | | | — | | | | — | | | | — | | | | — | | | | — | | | ||||
| | | 2023 Tranche of 2022 PSUs | | | | 3/31/2023 | | | | — | | | | — | | | | — | | | | 16,506 | | | | 20,632 | | | | 41,264 | | | | — | | | | 336,095 | | | ||||
| | | 2023 Tranche of 2023 PSUs | | | | 3/3/2023 | | | | — | | | | — | | | | — | | | | 15,344 | | | | 19,180 | | | | 38,359 | | | | — | | | | 360,002 | | | ||||
| | | RSUs | | | | 3/3/2023 | | | | — | | | | — | | | | — | | | | — | | | | — | | | | — | | | | 38,359 | | | | 719,998 | | | ||||
| | | Justin Keppy | | | ||||||||||||||||||||||||||||||||||||||||
| | | Annual Cash Incentive | | | | | | | | 6,036 | | | | 160,959 | | | | 354,110 | | | | — | | | | — | | | | — | | | | — | | | | — | | | ||||
| | | RSUs | | | | 11/15/2023 | | | | — | | | | — | | | | — | | | | — | | | | — | | | | — | | | | 1,137,657 | | | | 10,000,005 | | | ||||
| | | RSUs | | | | 11/15/2023 | | | | — | | | | — | | | | — | | | | — | | | | — | | | | — | | | | 568,828 | | | | 4,999,998 | | | ||||
| | | Eric Leef | | | ||||||||||||||||||||||||||||||||||||||||
| | | Annual Cash Incentive | | | | | | | | 15,000 | | | | 400,000 | | | | 880,000 | | | | — | | | | — | | | | — | | | | — | | | | — | | | ||||
| | | 2023 Tranche of 2022 PSUs | | | | 3/31/2023 | | | | — | | | | — | | | | — | | | | 6,176 | | | | 7,720 | | | | 15,441 | | | | — | | | | 125,764 | | | ||||
| | | 2023 Tranche of 2023 PSUs | | | | 3/3/2023 | | | | — | | | | — | | | | — | | | | 7,246 | | | | 9,057 | | | | 18,114 | | | | — | | | | 170,000 | | | ||||
| | | RSUs | | | | 3/3/2023 | | | | — | | | | — | | | | — | | | | — | | | | — | | | | — | | | | 18,114 | | | | 340,000 | | | ||||
| | | Others | | | ||||||||||||||||||||||||||||||||||||||||
| | | Kenny Cheung | | | ||||||||||||||||||||||||||||||||||||||||
| | | Annual Cash Incentive | | | | | | | | 7,479 | | | | 199,452 | | | | 438,795 | | | | — | | | | — | | | | — | | | | — | | | | — | | | ||||
| | | 2023 Tranche of 2022 PSUs | | | | 3/31/2023 | | | | — | | | | — | | | | — | | | | 10,899 | | | | 13,624 | | | | 27,248 | | | | — | | | | 221,935 | | | ||||
| | | | | 52 | | | | |
| | | Name | | | | Type of Award | | | | Grant Date | | | | Estimated Possible Payouts Under Non-Equity Incentive Plan Awards(1) | | | | Estimated Future Payouts Under Equity Incentive Plan Awards(2) | | | | All Other Stock Awards: Number of Shares of Stock or Units(3) (#) | | | | Grant Date Fair Value of Stock and Option Awards(4) ($) | | | ||||||||||||||||
| | Threshold ($) | | | | Target ($) | | | | Maximum ($) | | | | Threshold (#) | | | | Target (#) | | | | Maximum (#) | | | |||||||||||||||||||||
| | | 2023 Tranche of 2023 PSUs | | | | 3/3/2023 | | | | — | | | | — | | | | — | | | | 13,639 | | | | 17,048 | | | | 34,097 | | | | — | | | | 319,997 | | | ||||
| | | RSUs | | | | 3/3/2023 | | | | — | | | | — | | | | — | | | | — | | | | — | | | | — | | | | 34,097 | | | | 640,001 | | | ||||
| | | Paul Stone | | | ||||||||||||||||||||||||||||||||||||||||
| | | Annual Cash Incentive | | | | | | | | 43,726 | | | | 1,166,027 | | | | 2,565,260 | | | | — | | | | — | | | | — | | | | — | | | | — | | | ||||
| | | 2023 Tranche of 2022 PSUs | | | | 3/31/2023 | | | | — | | | | — | | | | — | | | | 18,165 | | | | 22,707 | | | | 45,413 | | | | — | | | | 369,892 | | | ||||
| | | 2023 Tranche of 2023 PSUs | | | | 3/3/2023 | | | | — | | | | — | | | | — | | | | 21,311 | | | | 26,638 | | | | 53,277 | | | | — | | | | 500,002 | | | ||||
| | | RSUs | | | | 3/3/2023 | | | | — | | | | — | | | | — | | | | — | | | | — | | | | — | | | | 53,277 | | | | 1,000,009 | | | ||||
(1)
The amounts in 2017these columns include the “Target” amount for each NEO eligible to receive an award under the EICP at 100% of the target award, the “Threshold” amount for each eligible NEO at 3.75% of the “Target” amount (which assumes only the RPU metric funded, and did so at a threshold level of performance) and the “Maximum” amount for the maximum amount payable to each NEO at 220% of the “Target,” in each case prorated for their time in the indicated role during 2023. The EICP is discussed in our “Compensation Discussion and Analysis — Program Components — Annual Incentive Awards.” Actual payouts earned under the program for 2023 for Mr. Scherr, Ms. Brooks, Ms. Batcheler, Mr. Keppy and Mr. Leef were 50% of “Target,” prorated for time worked, and can be found under the “Non-Equity Incentive Plan Compensation” column of the Summary Compensation Table. Mr. Cheung and Mr. Stone forfeited their awards in connection with their separation of employment.
(2)
For Ms. Brooks, Ms. Batcheler, Mr. Leef, Mr. Cheung and Mr. Stone, represents the second tranche of PSUs granted under the 2022 LTIP with respect to 2023 performance and the first tranche of PSUs granted under the 2023 LTIP with respect to 2023 performance. For Ms. Brooks, the PSU grant on October 2, 2023 was made in connection with her promotion to CFO. We discuss Ms. Brooks’ promotion grant under the heading “Compensation Discussion and Analysis — Agreements with NEOs — Ms. Brooks”. All PSUs will be earned based on our financial performance. We discuss these awards under the heading “Compensation Discussion and Analysis — Program Components — Long-Term Incentives.” The amounts disclosed in the “Estimated Future Payouts Under Equity Incentive Plan Awards” columns represent the number of shares issuable assuming achievement of the specific Threshold, Target or Maximum levels of performance established by the Compensation Committee for these PSUs over the 2023 performance period. As disclosed in the Compensation Discussion and Analysis, based on our Adjusted Corporate EBITDA for 2023, no PSUs were earned for 2023. Mr. Keppy’s 2023 LTIP awards were not granted until January 2024. Mr. Cheung’s and Mr. Stone’s 2023 PSUs and 2023 RSUs granted under the 2023 LTIP were forfeited in connection with their separations from the company.
(3)
For Ms. Brooks, Ms. Batcheler, Mr. Leef, Mr. Cheung and Mr. Stone, the RSUs granted on March 3, 2023 vest ratably over three years, subject to each NEO’s continued employment. We discuss these awards under the heading “Compensation Discussion and Analysis — Program Components — Long-Term Incentives.” Mr. Cheung and Mr. Stone forfeited these RSUs in connection with their subsequent resignations from the company and as a result these RSUs do not appear in the table “Outstanding Equity Awards at Fiscal-Year End 2023.” For Ms. Brooks, the RSU grant on October 2, 2023 was made in connection with her promotion to CFO. We discuss Ms. Brooks’ promotion grant under the heading “Compensation Discussion and Analysis — Agreements with NEOs — Ms. Brooks”. For Mr. Keppy, the grants are special one-time sign-on equity awards of 1,137,657 and 568,828 RSUs, respectively. We discuss Mr. Keppy’s sign-on grants under the heading “Compensation Discussion and Analysis — Agreements with NEOs — Mr. Keppy”. Mr. Keppy’s RSUs under the 2023 LTIP were not granted until January 2024.
(4)
Represents the aggregate grant date fair value, computed pursuant to FASB Topic 718. The fair market value of all such awards. AllRSUs and PSUs is the closing price of our common shares on the date of grant multiplied by the number of shares granted (or, for PSUs, the “target” number of shares granted, which represents the probable outcome of the equity awards grantedapplicable performance conditions as of the grant date). These amounts are included in 2017 were granted under the 2016 Omnibus Plan.“Stock Awards” column of the Summary Compensation Table.
Estimated future payouts under non-equity incentive plan awards(1) | Estimated future payouts under equity incentive plan awards | All Other Stock Awards (#) | All Other Option Awards (#) | Exercise Price of Option Awards ($/Sh.) | Grant Date Fair Value of Stock Awards(2) ($) | |||||||
| Name | Grant Date | Threshold ($) | Target ($) | Max ($) | Threshold (#) | Target (#) | Max (#) | |||||
| Kathryn Marinello | ||||||||||||
| Annual Cash Incentive | 1,305,000 | 2,175,000 | 3,480,000 | |||||||||
| Performance Options(3) | 3/2/2017 | 163,251 | 326,502 | 326,502 | 22.19 | 3,105,001 | ||||||
| Performance Shares(4) | 3/2/2017 | 34,982 | 69,964 | 104,946 | 1,552,501 | |||||||
| Restricted Shares(5) | 3/2/2017 | 23,321 | 517,493 | |||||||||
| Thomas Kennedy | ||||||||||||
| Annual Cash Incentive | 1,046,250 | 1,674,000 | ||||||||||
| Options(6) | 3/2/2017 | 42,769 | 22.19 | 400,001 | ||||||||
| Performance Shares(4) | 3/2/2017 | 27,039 | 54,078 | 81,117 | 1,199,991 | |||||||
| Restricted Shares(5) | 3/2/2017 | 18,026 | 399,997 | |||||||||
| Tyler Best | ||||||||||||
| Annual Cash Incentive | 600,000 | 900,000 | ||||||||||
| Options(6) | 3/2/2017 | 34,215 | 22.19 | 319,999 | ||||||||
| Performance Shares(4) | 3/2/2017 | 21,632 | 43,263 | 64,895 | 960,006 | |||||||
| Restricted Shares(5) | 3/2/2017 | 14,421 | 320,002 | |||||||||
| Michel Taride | ||||||||||||
| Annual Cash Incentive | 621,067 | 993,708 | ||||||||||
| Options(6) | 3/2/2017 | 34,215 | 22.19 | 319,999 | ||||||||
| Performance Shares(4) | 3/2/2017 | 21,632 | 43,263 | 64,895 | 960,006 | |||||||
| Restricted Shares(5) | 3/2/2017 | 14,421 | 320,002 | |||||||||
| Richard Frecker | ||||||||||||
| Annual Cash Incentive | 273,000 | 436,800 | ||||||||||
| Options(6) | 3/2/2017 | 12,831 | 22.19 | 120,003 | ||||||||
| Performance Shares(4) | 3/2/2017 | 8,112 | 16,224 | 24,336 | 360,011 | |||||||
| Restricted Shares(5) | 3/2/2017 | 5,408 | 120,004 | |||||||||
John Tague(7) | ||||||||||||
Jeffrey Foland(8) | ||||||||||||
| Annual Cash Incentive | 185,486 | 296,778 | ||||||||||
Alexandria Marren(9) | ||||||||||||
| Annual Cash Incentive | 499,726 | 799,562 | ||||||||||
| Options(6) | 3/2/2017 | 21,384 | 22.19 | 199,996 | ||||||||
| Performance Shares(4) | 3/2/2017 | 13,520 | 27,039 | 40,559 | 599,995 | |||||||
| Restricted Shares(5) | 3/2/2017 | 9,013 | 199,998 | |||||||||
| | |||||||
| 53 | | | | |
| ||
OUTSTANDING EQUITY AWARDS AT 2023 FISCAL YEAR-END
The following table sets forth, for each NEO, details of all equity awards outstanding on December 31, 2017.2023.
| Option Awards | Stock Awards | ||||||||
| Name | Number of securities underlying unexercised options Exercisable (#) | Number of securities underlying unexercised options Unexercisable (#) | Number of securities underlying unexercised unearned options (#) | Option exercise price ($) | Option expiration date | Number of shares or units of stock that have not vested (#) | Market value of shares or units of stock that have not vested(1) ($) | Number of unearned shares, units or other rights that have not vested (#) | Market or payout value of unearned shares, units or other rights that have not vested(1) ($) |
Kathryn Marinello | — | — | 163,251(2) | $22.19 | 3/2/2024 | 23,321(3) | 515,394 | ||
| 34,982(4) | 773,102 | ||||||||
| Thomas Kennedy | 35,272(5) | 35,272(5) | $85.29 | 1/20/2020 | 18,026(3) | 398,375 | |||
| 35,015(6) | $39.36 | 3/3/2023 | 9,381(8) | 207,320 | |||||
| 42,769(7) | $22.19 | 3/2/2024 | 19,744(9) | 436,342 | |||||
| 27,039(4) | 597,562 | ||||||||
| Tyler Best | 37,941(4) | 18,971(5) | $86.60 | 2/25/2020 | 14,421(3) | 318,704 | |||
| 25,551(6) | $39.36 | 3/3/2023 | 7,392(8) | 163,363 | |||||
| 34,215(7) | $22.19 | 3/2/2024 | 14,408(9) | 318,417 | |||||
| 21,632(4) | 478,067 | ||||||||
| Michel Taride | 8,015 | $38.45 | 3/4/2020 | 16,263(10) | 359,412 | ||||
| 10,879 | $57.86 | 3/1/2021 | 14,421(3) | 318,704 | |||||
| 12,844(5) | 12,845(5) | $93.09 | 2/17/2020 | 3,990(8) | 88,179 | ||||
| 34,215(7) | $22.19 | 3/2/2024 | 15,246(9) | 336,937 | |||||
| 21,632(4) | 478,067 | ||||||||
| Richard Frecker | 898 | $57.86 | 3/1/2021 | 1,931(11) | 42,675 | ||||
| 802(5) | 803(5) | $93.09 | 2/17/2020 | 5,208(11) | 115,097 | ||||
| 12,831(7) | $22.19 | 3/2/2024 | 5,408(3) | 119,517 | |||||
| 749(8) | 16,553 | ||||||||
| 1,810(9) | 40,001 | ||||||||
| 8,112(4) | 179,275 | ||||||||
| John Tague(12) | — | — | — | — | — | — | — | — | — |
| Jeffrey Foland(12) | — | — | — | — | — | — | — | — | — |
Alexandria Marren(12) | — | — | — | — | — | — | — | — | — |
| | | Name | | | | Grant Date | | | | Option Awards | | | | Stock Awards | | | ||||||||||||||||||||||||
| | Number of Securities Underlying Unexercised Options Exercisable (#) | | | | Number of Securities Underlying Unexercised Options Unexercisable(2) (#) | | | | Option Exercise Price ($) | | | | Option Expiration Date | | | | Number of Shares or Units of Stock That Have Not Vested(3) (#) | | | | Market Value of Shares or Units of Stock That Have Not Vested(4) ($) | | | | Equity Incentive Plan Awards: Number of Unearned Shares, Units or Other Rights That Have Not Vested(5) (#) | | | | Equity Incentive Plan Awards: Market or Payout Value of Unearned Shares, Units or Other Rights That Have Not Vested(4) ($) | | | |||||||||
| | | Stephen Scherr(1) | | | ||||||||||||||||||||||||||||||||||||
| | | | | | | 2/28/2022 | | | | — | | | | — | | | | — | | | | — | | | | 1,121,036 | | | | 11,647,564 | | | | — | | | | — | | |
| | 2/28/2022 | | | | — | | | | — | | | | — | | | | — | | | | 1,681,554 | | | | 17,471,346 | | | | — | | | | — | | | |||||
| | 2/28/2022 | | | | — | | | | — | | | | — | | | | — | | | | — | | | | — | | | | 3,736,788 | | | | 38,825,227 | | | |||||
| | 2/28/2022 | | | | — | | | | — | | | | — | | | | — | | | | — | | | | — | | | | 3,113,989 | | | | 32,354,346 | | | |||||
| | | Alexandra Brooks | | | ||||||||||||||||||||||||||||||||||||
| | | | | | | 11/9/2021 | | | | | | | | | | | | | | | | | | | | 6,667 | | | | 69,270 | | | | — | | | | — | | |
| | 11/9/2021 | | | | 40,000 | | | | 20,000 | | | | 26.17 | | | | 11/9/2031 | | | | — | | | | — | | | | — | | | | — | | | |||||
| | 3/30/2022 | | | | — | | | | — | | | | — | | | | — | | | | 6,056 | | | | 62,922 | | | | — | | | | — | | | |||||
| | 3/30/2022 | | | | — | | | | — | | | | — | | | | — | | | | — | | | | — | | | | 4,541 | | | | 47,184 | | | |||||
| | 3/3/2023 | | | | — | | | | — | | | | — | | | | — | | | | 10,655 | | | | 110,705 | | | | — | | | | — | | | |||||
| | 3/3/2023 | | | | — | | | | — | | | | — | | | | — | | | | — | | | | — | | | | 5,328 | | | | 55,354 | | | |||||
| | 3/31/2023 | | | | — | | | | — | | | | — | | | | — | | | | — | | | | — | | | | 4,541 | | | | 47,184 | | | |||||
| | 10/2/2023 | | | | — | | | | — | | | | — | | | | — | | | | 7,500 | | | | 77,925 | | | | — | | | | — | | | |||||
| | 10/2/2023 | | | | — | | | | — | | | | — | | | | — | | | | — | | | | — | | | | 3,750 | | | | 38,963 | | | |||||
| | | Colleen Batcheler | | | ||||||||||||||||||||||||||||||||||||
| | | | | | | 7/1/2022 | | | | — | | | | — | | | | — | | | | — | | | | 27,510 | | | | 285,829 | | | | — | | | | — | | |
| | 7/1/2022 | | | | — | | | | — | | | | — | | | | — | | | | 63,177 | | | | 656,409 | | | | — | | | | — | | | |||||
| | 7/1/2022 | | | | — | | | | — | | | | — | | | | — | | | | — | | | | — | | | | 20,632 | | | | 214,366 | | | |||||
| | 3/3/2023 | | | | — | | | | — | | | | — | | | | — | | | | 38,359 | | | | 398,550 | | | | — | | | | — | | | |||||
| | 3/3/2023 | | | | — | | | | — | | | | — | | | | — | | | | — | | | | — | | | | 19,180 | | | | 199,277 | | | |||||
| | 3/31/2023 | | | | — | | | | — | | | | — | | | | — | | | | — | | | | — | | | | 20,632 | | | | 214,366 | | | |||||
| | | Justin Keppy | | | ||||||||||||||||||||||||||||||||||||
| | | | | | | 11/15/2023 | | | | — | | | | — | | | | — | | | | — | | | | 1,137,657 | | | | 11,820,256 | | | | — | | | | — | | |
| | 11/15/2023 | | | | — | | | | — | | | | — | | | | — | | | | 568,828 | | | | 5,910,123 | | | | — | | | | — | | | |||||
| | |||||||
| 54 | | | | |
| | | Name | | | | Grant Date | | | | Option Awards | | | | Stock Awards | | | ||||||||||||||||||||||||
| | Number of Securities Underlying Unexercised Options Exercisable (#) | | | | Number of Securities Underlying Unexercised Options Unexercisable(2) (#) | | | | Option Exercise Price ($) | | | | Option Expiration Date | | | | Number of Shares or Units of Stock That Have Not Vested(3) (#) | | | | Market Value of Shares or Units of Stock That Have Not Vested(4) ($) | | | | Equity Incentive Plan Awards: Number of Unearned Shares, Units or Other Rights That Have Not Vested(5) (#) | | | | Equity Incentive Plan Awards: Market or Payout Value of Unearned Shares, Units or Other Rights That Have Not Vested(4) ($) | | | |||||||||
| | | Eric Leef | | | ||||||||||||||||||||||||||||||||||||
| | | | | | | 11/9/2021 | | | | — | | | | — | | | | — | | | | — | | | | 10,667 | | | | 110,830 | | | | — | | | | — | | |
| | 11/9/2021 | | | | 64,000 | | | | 32,000 | | | | 26.17 | | | | 11/9/2031 | | | | — | | | | — | | | | — | | | | — | | | |||||
| | 3/30/2022 | | | | — | | | | — | | | | — | | | | — | | | | 10,295 | | | | 106,965 | | | | — | | | | — | | | |||||
| | 3/30/2022 | | | | — | | | | — | | | | — | | | | — | | | | — | | | | — | | | | 7,720 | | | | 80,214 | | | |||||
| | 3/3/2023 | | | | — | | | | — | | | | — | | | | — | | | | 18,114 | | | | 188,204 | | | | — | | | | — | | | |||||
| | 3/3/2023 | | | | — | | | | — | | | | — | | | | — | | | | — | | | | — | | | | 9,057 | | | | 94,102 | | | |||||
| | 3/31/2023 | | | | — | | | | — | | | | — | | | | — | | | | — | | | | — | | | | 7,720 | | | | 80,214 | | | |||||
| | | Others(1) | | | ||||||||||||||||||||||||||||||||||||
| | | Kenny Cheung | | | ||||||||||||||||||||||||||||||||||||
| | | | | | | — | | | | — | | | | — | | | | — | | | | — | | | | — | | | | — | | | | — | | | | — | | |
| | | Paul Stone | | | ||||||||||||||||||||||||||||||||||||
| | | | | | | — | | | | — | | | | — | | | | — | | | | — | | | | — | | | | — | | | | — | | | | — | | |
(1)
(2)
The following table sets forth, for each NEO, details of any awarded stock options that were exercisedgranted on November 9, 2021 to Ms. Brooks and any stock awards that vested in 2017.
| Option Awards | Stock Awards | |||
| Name | Number of shares acquired on exercise (#) | Value realized on exercise ($) | Number of shares acquired on vesting (#) | Value realized on vesting ($) |
| Kathryn Marinello | — | — | — | — |
| Thomas Kennedy | — | — | — | — |
| Tyler Best | — | — | — | — |
| Michel Taride | — | — | — | — |
| Richard Frecker | — | — | — | — |
| John Tague | — | — | 60,174 | 1,297,351 |
| Jeffrey Foland | — | — | 44,467 | 1,010,290 |
| Alexandria Marren | — | — | — | — |
| ||
(3)
For Mr. Taride), the opportunity to defer part of their compensation. The Savings Plan is a deferred compensation plan that provides benefits that cannot be provided in the 401(k) Plan due to Code limitations on compensation. For any deferral elections, the Company will match an amount generally equal to (i) 100% of employee contributions (up to 3% of the compensation that cannot be taken into account under the 401(k) Plan) made by such participant and (ii) 50% of employee contributions (up to the next 2% of compensation that cannot be taken into account under the 401(k) Plan). For a transition period, certain eligible participants under the Savings Plan received additional employer contribution amounts to their Savings Plan account depending on their years ofScherr, (a) 1,121,036 unvested service and age. The match under the Savings Plan is in addition to the match under the 401(k) Plan. The total match that any participant may receive under the 401(k) Plan and the Savings Plan (other than with respect to transition credits) may not exceed the maximum 4% match.
| Name | Plan name | Number of years credited service (#) | Present value of accumulated benefit(1) ($) | Payments during last fiscal year ($) |
Michel Taride(2) | Hertz UK Pension Plan | 11 | 2,074,106 | 0 |
| Michel Taride | Hertz UK Supplemental Plan | 11 | 1,757,103 | 0 |
Richard Frecker(3) | Hertz US Pension Plan | 6 | 67,700 | 0 |
| ||
| ||
| Name | Executive Contributions in 2017 ($)(1) | Registrant Contributions in 2017 ($)(2) | Aggregate Earnings in 2017 ($) | Aggregate Withdrawals/ Distributions in 2017 ($) | Aggregate Balance as of December 31, 2017(3) ($) |
| Tyler Best | 16,500 | 13,200 | 20,739 | — | 156,119 |
| Richard Frecker | 27,750 | 11,100 | 1,938 | — | 67,016 |
John Tague(4) | — | — | 26,217 | — | 136,141 |
| Alexandria Marren | 7,269 | 7,269 | 891 | — | 15,429 |
| ||
(4)
The market value is calculated using $10.39, which was the closing price of our common stock on the Nasdaq on the last trading day of 2023.
(5)
For Mr. Scherr, reflects (a) 3,736,788 performance-based RSUs that are earned upon the achievement of share price targets that had not been achieved as of December 31, 2017, (iii)2023, and (b) 3,113,989 Transaction RSUs that are earned upon the achievement of share price targets and occurrence of a specified transaction, and vesting one year after the transaction
| | | | | 55 | | | | |
condition is met. For Ms. Brooks (on March 30, 2022), Ms. Batcheler (on July 1, 2022) and Mr. Leef (on March 30, 2022), the amounts reflect the first tranche of the PSUs granted under the 2022 LTIP that vest once earned on the third anniversary of the grant date, subject to the named executive officer’s continued employment and a cap if the company’s TSR is negative over the three-year performance period. As discussed in the company’s proxy statement last year, 64.4% of the first tranche of these awards were banked based on our 2022 Adjusted Corporate EBITDA. We have treated the first tranche as unearned for purposes of the table because the final number of shares that may be issued will not be determined until the end of the three-year performance period given the TSR cap. As discussed under “Compensation Discussion and Analysis — Long-Term Incentive,” no shares were banked for 2023 based on our 2023 Adjusted Corporate EBITDA. Neither Mr. Scherr nor Mr. Keppy is a participant in the 2022 LTIP. For Ms. Brooks, Ms. Batcheler and Mr. Leef, the amounts granted on March 3, 2023 and, for Ms. Brooks, subsequent to her promotion, on October 2, 2023, reflect the first tranche of the PSUs granted under the 2023 LTIP and the amounts granted to Ms. Brooks, Ms. Batcheler and Mr. Leef on March 31, 2023 reflect the second tranche of the PSUs granted under the 2022 LTIP. In each case, these PSUs vest once earned on the third anniversary of the grant date, subject to the named executive officer’s continued employment and a cap if the company’s TSR is negative over the three-year performance period. As discussed under “Compensation Discussion and Analysis — Long-Term Incentive,” no shares were banked for 2023 under either the 2023 LTIP or 2022 LTIP based on our 2023 Adjusted Corporate EBITDA. Mr. Scherr is not a participant in the 2023 LTIP. Mr. Keppy’s grants under the 2023 LTIP were not made until 2024.
2023 OPTION EXERCISES AND STOCK VESTED
The following table summarizes the stock awards that vested for the NEOs in 2023. No stock options were exercised by any NEO in 2023.
| | | Name | | | | Stock Awards | | | ||||
| | Number of Shares Acquired on Vesting (#) | | | | Value Realized on Vesting ($) | | | |||||
| | | Stephen Scherr | | | | 1,121,036 | | | | $11,647,564 | | |
| | | Alexandra Brooks | | | | 9,694 | | | | $108,769 | | |
| | | Colleen Batcheler | | | | 161,167 | | | | $2,927,963 | | |
| | | Justin Keppy | | | | — | | | | — | | |
| | | Eric Leef | | | | 15,813 | | | | $178,807 | | |
| | | Others | | | ||||||||
| | | Kenny Cheung | | | | 9,082 | | | | $143,314 | | |
| | | Paul Stone | | | | 15,137 | | | | $238,862 | | |
| | | | | 56 | | | | |
POTENTIAL PAYMENTS UPON TERMINATION OR CHANGE IN CONTROL
Our NEOs’ employment may end under several possible scenarios. In some of these scenarios, our plans and agreements would provide severance benefits in varying amounts to the executive. Severance and other benefits that are payable upon a termination of employment whether or not in connection with a change of control are described below. In the event of an actual triggering event under any of the applicable plans or agreements, all benefits would be paid to the continuing executive officer in accordance with, and at times permitted by, Section 409A of the Internal Revenue Code. Mr. Cheung and Mr. Stone departed the company during 2023, and Mr. Scherr departed the company on March 31, 2024, and therefore the following scenarios and descriptions of potentially payable severance or other benefits no longer apply to them.
Summaries — Plans and Agreements
Severance Plan
In August 2021, the Board adopted the 2021 Hertz Global Holdings, Inc. Severance Plan for Senior Executives (the “Severance Plan”). The Severance Plan provides for senior executives, including each of Ms. Brooks, Ms. Batcheler, Mr. Keppy and Mr. Leef, to be eligible to receive severance if the participant’s employment is terminated by the company or a subsidiary for a reason other than “cause,” death or disability. The Severance Plan provides that in the event of a qualifying termination, the participant will be eligible for severance equal to (a) 1.5 times the sum of (i) their annualized rate of base salary, at the highest annual base salary rate in effect at any time within the 12-month period preceding the termination date and (ii) target annual bonus, (b) payment of a pro-rata bonus for the year of termination based on actual achievement of performance metrics and time worked during such year, (c) continued medical and health benefits for 18 months following termination and (d) executive outplacement services of up to $25,000. The participants must execute a release of claims within 60 days following termination to be eligible for benefits. The plan contains certain covenants regarding confidential information, non-competition, non-solicitation and non-disparagement.
Agreement with Mr. Scherr
Mr. Scherr’s Employment Agreement provided for enhanced cash severance equal to two (2) times his base salary and target annual bonus (in lieu of 1.5 times such amounts as provided under the Severance Plan) in the event Mr. Scherr’s employment was terminated by the company without cause or by Mr. Scherr for good reason within six months prior or until 24 months following a change in control, in addition to the other payments and benefits he would have otherwise been entitled to under the Severance Plan.
For additional information regarding the Employment Agreement with Mr. Scherr, see “Compensation Discussion and Analysis — Agreement with Mr. Scherr” above.
Agreement with Mr. Keppy
Mr. Keppy’s offer letter provides that until the third anniversary of his start date, upon a termination occurredwithout “cause,” or a termination by him with “good reason,” he will be entitled to no less than the benefits currently set forth under the Severance Plan as in effect on the date of his offer letter, and if the Severance Plan is subsequently amended or replaced and provides for more favorable benefits, in the aggregate, than those provided in the offer letter, Mr. Keppy will be eligible to receive those more favorable benefits.
| | | | | 57 | | | | |
Annual Incentive Plan — EICP
Our 2023 EICP provided that if a participant’s employment was terminated without cause, ended due to retirement, or was due to death or disability, the participant would be entitled to a prorated award based on actual achievement of performance metrics and the number of full weeks worked within the weeks available to work during the plan year. The participant must execute a release of claims in favor of the company to receive such an award.
Long-Term Incentive Plan — RSUs, PSUs and Stock Options
Our RSUs, PSUs and stock options outstanding in 2023 provide for accelerated vesting upon certain terminations of employment, as summarized below:
•
Emergence Awards: Upon a termination without cause or due to death or disability, a number of shares subject to the RSUs and stock options will vest immediately upon such termination that is equal to the number of shares that would have vested on the next vesting date following termination.
•
PSUs and RSUs granted to NEOs (other than Mr. Scherr): In the event of death or disability, a prorated portion of the award will vest, with any performance conditions determined based upon actual performance.
•
Effect of a Change in Control: For stock options, RSUs and PSUs outstanding in 2023 and granted to NEOs other than Mr. Scherr, no awards will be accelerated in connection with a change in control if the Compensation Committee or the Board, in its discretion, determines that all awards will be honored or assumed in the transaction. The Compensation Committee also has the discretion to determine whether the terms of the awards so assumed will provide that in the event of a termination without cause within two years following the change in control, (“double trigger”)all conditions or restrictions with respect to such awards will be waived or otherwise lapse. If the awards are not assumed, vesting will accelerate upon a change in control so that all unvested options will become exercisable, all shares underlying RSUs will be issued, and (iv)a pro-rata portion of the Compensation Committee took no further actionsPSUs will be issued based on the actual level of achievement of the relevant performance goals as of the date of the change in control and the number of full months that have elapsed as of the date of the change in control, unless the awards are instead cancelled in exchange for any given award except as set forth undera cash payment.
•
Mr. Scherr’s Equity Awards: Upon a termination without cause, or due to death or disability, or by Mr. Scherr for good reason, subject to Mr. Scherr signing a release of claims in all instances:
○
If the applicable plan. In addition, the participant’s 401(k) Plantermination did not occur in connection with a change in control, then a number of shares subject to each of his Time-Based RSUs and Savings Plan amounts (if any) are excluded from the below tables, exceptStock Price RSUs would vest immediately upon such termination that is equal to the extentnumber of shares that there are any enhancements aswould have vested on the next vesting date following his termination.
○
If the termination occurred following a resultchange in control, then all of Mr. Scherr’s unvested Time-Based RSUs and Stock Price RSUs and the portion of his Transaction RSUs that became eligible to vest due to achievement of the applicable termination event. Stock options are not listed below because the strike price of each outstanding option is above $22.10.
| Benefit | Termination For Cause ($) | Termination Without Cause/with Good Reason ($) | Termination by Reason of Retirement ($) | Termination by Reason of Death/ Disability ($) | Termination Following a Change in Control ($) |
| Severance payment | — | 4,132,500 | — | — | 9,062,500 |
| Bonus | — | 1,305,000(1) | — | — | 2,175,000 |
| Continued Benefits | — | 17,874 | — | — | 34,015(2) |
| Outplacement | — | 25,000 | — | — | 25,000 |
| Life Insurance Payment | — | — | — | 1,450,000(3) | — |
| Payment for Awarded Performance Shares | — | 513,516 | — | 513,516(4) | 1,546,204 |
| Payment for Awarded Restricted Shares | — | 171,165 | — | 171,165 | 515,394 |
| Total | — | 6,165,055 | — | 2,134,681 | 13,358,113 |
| Benefit | Termination For Cause ($) | Termination Without Cause/with Good Reason ($) | Termination by Reason of Retirement ($) | Termination by Reason of Death/ Disability ($) | Termination Following a Change in Control ($) |
| Severance payment | — | 1,635,000 | — | — | 2,180,000 |
| Bonus | — | 0(1) | — | 1,046,250 | |
| Continued benefits | — | 18,024 | — | — | 25,838(2) |
| Outplacement | — | 25,000 | — | — | 25,000 |
| Life Insurance Payment | — | — | — | 775,000(3) | — |
| Payment for Awarded Performance Shares/PSUs | — | — | — | 1,059,519(4) | 2,267,857 |
| Payment for Awarded Restricted Shares | — | — | — | 398,375(4) | 398,375 |
| Total | — | 1,678,024 | — | 2,232,894 | 5,943,320 |
| ||
| Benefit | Termination For Cause ($) | Termination Without Cause/with Good Reason ($) | Termination by Reason of Retirement ($) | Termination by Reason of Death/ Disability ($) | Termination Following a Change in Control ($) |
| Severance payment | — | 1,290,000 | — | — | 1,290,000 |
| Bonus | — | 0(1) | — | 600,000 | |
| Continued Benefits | — | 19,449 | — | — | 20,391(2) |
| Outplacement | — | 25,000 | — | — | 25,000 |
| Life Insurance Payment | — | — | — | 600,000(3) | — |
Payment for Awarded Performance Shares/PSUs | — | — | — | 811,490(4) | 1,759,006 |
| Payment for Awarded Restricted Shares | — | — | — | 318,704(4) | 318,704 |
| Total | — | 1,334,449 | — | 1,730,194 | 4,013,101 |
| Benefit | Termination For Cause ($) | Termination Without Cause/with Good Reason ($) | Termination by Reason of Retirement ($) | Termination by Reason of Death/ Disability ($) | Termination Following a Change in Control ($) |
| Severance Payment | — | 1,258,967 | — | — | 1,573,708 |
| Bonus | — | 0(1) | — | — | 643,200 |
| Continued Benefits | — | 71,974 | — | — | 102,650(2) |
| Outplacement | — | 25,000 | — | — | 25,000 |
| Life Insurance Payment | — | — | — | 2,144,000(3) | — |
| Payment for Awarded Performance Shares/PSUs | — | — | 553,496 | 671,776(4) | 1,636,284 |
| Payment for Awarded Restricted Shares/RSUs | — | — | 289,334 | 678,116(4) | 678,116 |
| Retiree Car Benefit | — | 301,000 | 301,000 | 301,000(5) | 301,000 |
| Total | — | 1,656,941 | 1,143,830 | 3,794,892 | 4,959,958 |
| ||
| Benefit | Termination For Cause ($) | Termination Without Cause/with Good Reason ($) | Termination by Reason of Retirement ($) | Termination by Reason of Death/ Disability ($) | Termination Following a Change in Control ($) |
| Severance Payment | — | 710,354 | — | — | 710,354 |
| Bonus | — | 0(1) | — | — | 0(1) |
| Continued Benefits | — | 19,037 | — | — | 19,037(2) |
| Outplacement | — | 25,000 | — | — | 25,000 |
| Life Insurance Payment | — | — | — | 455,000(3) | — |
| Payment for Awarded Performance Shares/PSUs | — | — | — | 149,153(4) | 449,006 |
| Payment for Awarded Restricted Shares/RSUs | — | — | — | 277,289(4) | 277,289 |
| Total | — | 754,391 | — | 881,442 | 1,480,686 |
| ||
Potential Payments
The following table sets forthassumes that the named NEO’s termination of employment occurred on December 29, 2023, that the per share price of our common stock was $10.39 (the closing price of our common stock on the Nasdaq on the last business day of fiscal 2023), that awards under the EICP for fiscal 2023 were earned at 50% of target, that no PSUs were earned for awards with performance tied to 2023 results, and
| | | | | 58 | | | | |
that, for purposes of Mr. Scherr’s Stock Price RSUs and Transaction RSUs, the company’s stock price did not achieve the levels required for additional awards to be earned. For the change in control scenarios, the table assumes that both a change in control and the NEO’s termination of employment occurred on December 29, 2023. Although the EICP provides for the payment of a prorate award upon an NEO’s “retirement” no NEO would have been eligible for such treatment as of December 29, 2023 and therefore a separate column for a retirement scenario is omitted.
| | | Name | | | | Involuntary Termination Without “Cause”(1) ($) | | | | Death or Disability(2) ($) | | | | Voluntary Termination for “Good Reason”(3) ($) | | | | Involuntary Termination Without “Cause” in Connection with a Change in Control(4) ($) | | | | Voluntary Termination for “Good Reason” in Connection with a Change in Control(4)(5) ($) | | |
| | | Stephen Scherr | | | | | | | | | | | | | | | | | | | | | | |
| | | Cash Severance | | | | 5,850,000 | | | | — | | | | 5,850,000 | | | | 7,800,000 | | | | 7,800,000 | | |
| | | Annual Incentive Award | | | | 1,200,000 | | | | 1,200,000 | | | | 1,200,000 | | | | 1,200,000 | | | | 1,200,000 | | |
| | | Acceleration of Equity Awards | | | | 11,647,564 | | | | 11,647,564 | | | | 11,647,564 | | | | 17,741,346 | | | | 23,295,128 | | |
| | | Value of Continuing Benefits | | | | 32,697 | | | | — | | | | 32,697 | | | | 32,697 | | | | 32,697 | | |
| | | Outplacement Services | | | | 25,000 | | | | — | | | | 25,000 | | | | 25,000 | | | | 25,000 | | |
| | | Alexandra Brooks | | | | | | | | | | | | | | | | | | | | | | |
| | | Cash Severance | | | | 1,620,000 | | | | — | | | | — | | | | 1,620,000 | | | | — | | |
| | | Annual Incentive Award | | | | 206,301 | | | | 206,301 | | | | — | | | | 206,301 | | | | — | | |
| | | Acceleration of Equity Awards | | | | 69,270 | | | | 175,009 | | | | — | | | | 351,213 | | | | — | | |
| | | Value of Continuing Benefits | | | | 31,496 | | | | — | | | | — | | | | 31,496 | | | | — | | |
| | | Outplacement Services | | | | 25,000 | | | | — | | | | — | | | | 25,000 | | | | — | | |
| | | Colleen Batcheler | | | | | | | | | | | | | | | | | | | | | | |
| | | Cash Severance | | | | 1,800,000 | | | | — | | | | — | | | | 1,800,000 | | | | — | | |
| | | Annual Incentive Award | | | | 300,000 | | | | 300,000 | | | | — | | | | 300,000 | | | | — | | |
| | | Acceleration of Equity Awards | | | | — | | | | 896,480 | | | | — | | | | 1,478,840 | | | | — | | |
| | | Value of Continuing Benefits | | | | 31,496 | | | | — | | | | — | | | | 31,496 | | | | — | | |
| | | Outplacement Services | | | | 25,000 | | | | — | | | | — | | | | 25,000 | | | | — | | |
| | | Justin Keppy | | | | | | | | | | | | | | | | | | | | | | |
| | | Cash Severance | | | | 3,750,000 | | | | — | | | | 3,750,000 | | | | 3,750,000 | | | | 3,750,000 | | |
| | | Annual Incentive Award | | | | 80,479 | | | | 80,479 | | | | 80,479 | | | | 80,479 | | | | 80,479 | | |
| | | Acceleration of Equity Awards | | | | 11,820,256 | | | | 682,187 | | | | 11,820,256 | | | | 17,730,379 | | | | 11,820,256 | | |
| | | Value of Continuing Benefits | | | | — | | | | — | | | | — | | | | — | | | | — | | |
| | | Outplacement Services | | | | 25,000 | | | | — | | | | 25,000 | | | | 25,000 | | | | 25,000 | | |
| | | Eric Leef | | | | | | | | | | | | | | | | | | | | | | |
| | | Cash Severance | | | | 1,350,000 | | | | — | | | | — | | | | 1,350,000 | | | | — | | |
| | | Annual Incentive Award | | | | 200,000 | | | | 200,000 | | | | — | | | | 200,000 | | | | — | | |
| | | Acceleration of Equity Awards | | | | 110,830 | | | | 277,079 | | | | — | | | | 457,659 | | | | — | | |
| | | Value of Continuing Benefits | | | | 32,697 | | | | — | | | | — | | | | 32,697 | | | | — | | |
| | | Outplacement Services | | | | 25,000 | | | | — | | | | — | | | | 25,000 | | | | — | | |
| | | | | 59 | | | | |
(1)
For all NEOs, Cash Severance, Annual Incentive Award, Value of Continuing Benefits and Outplacement Services amounts included in these columns represent amounts payable upon a termination by the company without cause pursuant to the Severance Plan. Acceleration of Equity Awards represents the value of the following equity awards, at $10.39 per share: (a) for Mr. Scherr, 560,518 Time-Based RSUs that would have vested on December 31, 2023 and 560,518 Performance-Based RSUs (Stock Price) that were previously earned for the company’s achievement of certain VWAP milestones; (b) for Ms. Brooks and Mr. Leef, RSUs granted in connection with the Emergence that would have vested on November 2, 2024; and (c) for Mr. Keppy, the RSUs granted to him as sign-on compensation that included protection in the event of an involuntary termination without cause.
(2)
No Severance Plan benefits are payable to any NEO in connection with a termination due to death or disability. The amounts shown in this column for Annual Incentive Award represent amounts payable upon a termination due to death or disability under the 2023 EICP. Acceleration of Equity Awards represents the value of the following equity awards at $10.39 per share: (a) for Mr. Scherr, 560,518 Time-Based RSUs that would have vested on December 31, 2023 and 560,518 Performance-Based RSUs (Stock Price) that were previously earned for the company’s achievement of certain VWAP milestones; (b) for Ms. Brooks and Mr. Leef, RSUs granted in connection with the Emergence that would have vested on November 2, 2024; (c) for Ms. Brooks, Ms. Batcheler and Mr. Leef, a prorata portion of unvested RSUs granted under the 2022 LTIP, 2023 LTIP and, for Ms. Batcheler, as sign-on compensation; (d) for Ms. Brooks, Ms. Batcheler and Mr. Leef, the earned but unvested PSUs banked for the 2022 tranche of the 2022 LTIP; and (e) for Mr. Keppy, a prorata portion of unvested RSUs granted to him as sign-on compensation. No amounts are included for stock options granted in connection with the Emergence, which would also vest, as the exercise price for all stock options exceeded the market price of the company’s common stock on December 29, 2023.
(3)
Benefits payable to Mr. Scherr and Mr. Keppy upon their termination for good reason are provided pursuant to their specific agreements with the company, which entitle them to Severance Plan benefits and accelerated vesting of certain equity awards upon such a termination. Acceleration of Equity Awards represents the value of the following equity awards at $10.39 per share: (a) for Mr. Scherr, 560,518 Time-Based RSUs that would have vested on December 31, 2023 and 560,518 Performance-Based RSUs (Stock Price) that were previously earned for the company’s achievement of certain VWAP milestones; and (b) for Mr. Keppy, the RSUs granted to him as sign-on compensation that included protection in the event of a voluntary termination with good reason.
(4)
NEO severance benefits generally do not change with the occurrence of change in control. For all NEOs other than Mr. Scherr, Cash Severance, Annual Incentive Award, Value of Continuing Benefits and Outplacement Services amounts included in these columns represent amounts payable upon a termination by the company without cause pursuant to the Severance Plan. Cash Severance for Mr. Scherr, however, reflects enhanced amounts payable upon a termination by the company without cause or by Mr. Scherr for good reason within six months prior to and until 24 months following a change in control, which amounts would be paid in a lump sum. This enhanced Cash Severance is provided for in Mr. Scherr’s employment agreement. Acceleration of Equity Awards represents the value of the following equity awards, at $10.39 per share: (a) for Mr. Scherr, the remaining unvested Time-Based RSUs and the remaining unvested Performance-Based RSUs (Stock Price) that were previously earned for the company’s achievement of certain VWAP milestones; (b) for Ms. Brooks and Mr. Leef, RSUs granted in connection with the Emergence that would have vested on November 2, 2024; (c) for Ms. Brooks, Ms. Batcheler and Mr. Leef, all unvested RSUs granted under the 2022 LTIP, 2023 LTIP and, for Ms. Batcheler, as sign-on compensation; (d) for Ms. Brooks, Ms. Batcheler and Mr. Leef, the earned but unvested PSUs banked for the 2022 tranche of the 2022 LTIP; and (e) for Mr. Keppy, the RSUs granted to him as sign-on compensation that included protection in the event of an involuntary termination without cause. No amounts are included for stock options granted in connection with the Emergence, which would also vest, as the exercise price for all stock options exceeded the market price of the company’s common stock on December 29, 2023.
(5)
Benefits to Mr. Scherr and Mr. Keppy upon their termination for good reason are pursuant to their specific agreements with the company, which entitle them to Severance Plan benefits and accelerated vesting of certain equity awards upon such a termination. Acceleration of Equity Awards represents the value of the following equity awards at $10.39 per share: (a) for Mr. Scherr, the remaining unvested Time-Based RSUs and the remaining unvested Performance-Based RSUs (Stock Price) that were previously earned for the company’s achievement of certain VWAP milestones; and (b) for Mr. Keppy, the RSUs granted to him as sign-on compensation that included protection in the event of a voluntary termination with good reason.
| | | | | 60 | | | | |
CEO PAY RATIO
To determine the median of the 20172023 annual total compensation of all of our employees other than our CEO ("Median 2017(the “Median 2023 Employee Compensation"Compensation”), we used a median employee with substantially similar compensation as the 2017 annual total compensationmedian employee used for purposes of our 2021 pay ratio, as we believe there was no change in our employee population or employee compensation arrangements that we believe would significantly impact our pay ratio disclosure. To identify our median employee, we had used our global employee population as of December 31, 2021, and annual base salary as our consistently applied compensation measure and identified those employees at the same median compensation level. We then calculated the annual taxable income for those employees and identified the median employee from this group (the “Median Employee”).
Mr. Scherr served as our CEO ("2017on December 31, 2023, the anniversary of the determination date of the Median Employee. Because Mr. Scherr served as our CEO Compensation")for the entirety of 2023, we used his total 2023 compensation as set forth in the “Summary Compensation Table” above to determine 2023 CEO Compensation. Accordingly, the 2023 CEO Compensation was $2,900,417. We calculated the Median 2023 Employee Compensation on the same basis as the 2023 CEO Compensation. Based on these calculations, the Median 2023 Employee Compensation was $37,442 and the ratio of 20172023 CEO Compensation to Median 20172023 Employee Compensation. ThisCompensation is 77 to 1.
The pay ratio disclosure presented above is a reasonable estimate calculated in a manner consistent with Item 402(u) of Regulation S-K. As a result of our methodology used to determineSEC rules. Because the SEC rules for identifying the median employee and calculating the pay ratio which is described below, ourallow companies to use different methodologies, exclusions, estimates and assumptions that reflect their employee populations and compensation practices, the pay ratio disclosure of other companies may not be comparable to the pay ratios of other companies because other companies may rely on different methodologies, estimates or assumptions, or may make adjustments that we do not make.
ratio reported by us.
| | |||||
| |||||
| | | | | ||
PAY VERSUS PERFORMANCE DISCLOSURE
The following table sets forth information regarding our performance and the “compensation actually paid” to our CEO (referred in the table below as the PEO, or principal executive officer) and our determination date to set our employee populationother NEOs for purposes of this disclosure. To determineeach year, as calculated in accordance with SEC disclosure rules. The Compensation Committee did not consider the Median 2017 Employee Compensation, we then prepared a reportpay versus performance disclosure below in making its pay decisions for any of the annual taxable incomeyears shown. For discussion of how the Compensation Committee seeks to align pay and performance when making compensation decisions, please review our “Compensation Discussion and Analysis,” beginning on page 28.
| | | Year | | | | Summary Compensation Table Total for PEO(1) | | | | Compensation Actually Paid To PEO(2)(3) | | | | Average Summary Compensation Table Total for Non-PEO NEOs(1) $ | | | | Average Compensation Actually Paid for Non-PEO NEOs(2)(3) $ | | | | Value of Initial $100 Investment Based On:(4) | | | | GAAP Net Income (Millions) $ | | | | Adjusted Corporate EBITDA(5) (Millions) $ | | | ||||||||||||
| | PEO-1 $ | | | | PEO-2 $ | | | | PEO-1 $ | | | | PEO-2 $ | | | | Company TSR $ | | | | Peer Group TSR(4) $ | | | |||||||||||||||||||||
| | | 2023 | | | | 2,900,417 | | | | — | | | | (41,754,186) | | | | — | | | | 4,118,654 | | | | 3,728,824 | | | | 32 | | | | 103 | | | | 616 | | | | 561 | | |
| | | 2022 | | | | 182,136,137 | | | | 886,581 | | | | 132,128,569 | | | | (809,312) | | | | 3,609,798 | | | | 1,477,433 | | | | 47 | | | | 79 | | | | 2,059 | | | | 2,305 | | |
| | | 2021 | | | | 14,216,577 | | | | 12,653,169 | | | | 13,614,741 | | | | 11,923,378 | | | | 5,327,918 | | | | 4,998,545 | | | | 77 | | | | 91 | | | | 365 | | | | 2,130 | | |
| | | 2020 | | | | 2,580,049 | | | | 5,675,222 | | | | 749,676 | | | | (6,831,215) | | | | 1,693,188 | | | | (155,528) | | | | n/a | | | | n/a | | | | (1,723) | | | | (995) | | |
(1)
For 2023, PEO-1 is Mr. Scherr and there is no PEO-2; and non-PEO NEOs are Ms. Brooks, Ms. Batcheler, Mr. Keppy, Mr. Leef, Mr. Cheung and Mr. Stone. For 2022, PEO-1 is Mr. Scherr and PEO-2 is Mr. Mark Fields; and non-PEO NEOs are Mr. Cheung, Ms. Batcheler, Mr. Leef, Mr. Stone, Ms. Angela Brav and Mr. M. David Galainena. For 2021, PEO-1 is Mr. Mark Fields and PEO-2 is Mr. Stone; and non-PEO NEOs are Mr. Cheung, Mr. Darren Arrington, Ms. Brav and Mr. Galainena. For 2020, PEO-1 is Paul Stone and PEO-2 is Ms. Kathryn Marinello; and non-PEO NEOs are Mr. Cheung, Ms. Brav, Mr. Galainena, Ms. Opal Perry, Mr. Jamere Jackson and Mr. Richard Eric Esper.
(2)
The amounts shown for allCompensation Actually Paid have been calculated in accordance with Item 402(v) of our employees as of December 31, 2017, excluding any employee that didRegulation S-K and do not have regularly scheduled hours andreflect compensation actually earned, realized, or received no income in 2017. We identified our median employee using this compensation measure (i.e. annual taxable income), which we consistently applied to all of our employees included inby the calculation.
(3)
Compensation Actually Paid reflects the 2017exclusions and inclusions of certain amounts for the PEO and the Non-PEO NEOs (including, for 2023, as set forth below). Amounts in the Deductions from Summary Compensation Table however, as she began employment on January 3, 2017, we have used her annual salary of $1,450,000 insteadTotal column are the total from the Stock Awards column set forth in the Summary Compensation Table. While similar adjustment information was provided in our 2023 Proxy Statement for years 2020, 2021 and 2022, under applicable SEC guidance, repeating such adjustment information is not required in this Proxy Statement because it is not material to our stockholders’ understanding of the amount showninformation reported in the table above for 2023 or the relationships disclosures provided below.
| | | Fiscal Year | | | | Summary Compensation Table Total $ | | | | Deductions from Summary Compensation Table Total(a) $ | | | | Additions to Summary Compensation Table Total(b) $ | | | | Compensation Actually Paid $ | | |
| | | PEO-1 | | | ||||||||||||||||
| | | 2023 | | | | 2,900,417 | | | | 0 | | | | (44,654,603) | | | | (41,754,186) | | |
| | | Avg. Non-PEO NEOs | | | ||||||||||||||||
| | | 2023 | | | | 4,118,654 | | | | (3,246,920) | | | | 2,857,090 | | | | 3,728,824 | | |
(a)
Represents the grant date fair value of equity awards reported in the “Stock Awards” and “Option Awards” columns in the Summary Compensation Table of $1,416,539 for purposes of this calculation.2023.
| | |||||||
| 62 | | | | |
(b)
Reflects the value of equity calculated in accordance with the SEC methodology for determining compensation actually paid under Item 402(v) of Regulation S-K for each year shown. The amounts deducted or added in calculating the equity values included in Compensation Actually Paid are as follows:
| | | Year | | | | Covered Year End Fair Value of Outstanding Equity Awards Granted in the Covered Year $ | | | | Change in Fair Value (Prior Year End to Covered Year End) of Outstanding Equity Awards Granted Prior to Covered Year $ | | | | Fair Value as of Vesting Date of Equity Awards Granted and Vested in the Covered Year $ | | | | Change in Fair Value (Prior Year End to Covered Year End) of Equity Awards Granted in Prior Years that Vested in the Covered Year $ | | | | Fair Value at the End of the Prior Year of Equity Awards that Failed to Meet Vesting Conditions in the Covered Year $ | | | | Equity Value Included in Compensation Actually Paid $ | | |
| | | | | | | (a) | | | | (b) | | | | (c) | | | | (d) | | | | (e) | | | | (f) = (a) + (b) + (c) + (d) + (e) | | |
| | | PEO-1 | | | ||||||||||||||||||||||||
| | | 2023 | | | | 0 | | | | (39,049,423) | | | | 0 | | | | (5,605,180) | | | | 0 | | | | (44,654,603) | | |
| | | Avg. Non-PEO NEOs | | | ||||||||||||||||||||||||
| | | 2023 | | | | 3,102,119 | | | | (154,699) | | | | 0 | | | | 45,572 | | | | (135,901) | | | | 2,857,090 | | |
(4)
The Peer Group TSR set forth in this table utilizes the Morningstar Rental & Leasing Services Industry Group (“Peer Index”) which we also utilize in the stock performance graph required by Item 201(e) of Regulation S-K included in our Annual Report for the year ended December 31, 2023. The comparison assumes $100 was invested for the period starting November 9, 2021 (the first day of trading on Nasdaq following our Emergence and re-listing on the Nasdaq), through the end of the listed year in the company and Peer Index, respectively. Historical stock price performance is not necessarily indicative of future stock price performance.
(5)
We determined Adjusted Corporate EBITDA (a non-GAAP financial metric) to be the most important financial performance measure used to link company performance to Compensation Actually Paid to our PEO and Non-PEO NEOs for 2023 because this is a key primary financial performance metric in our annual incentive program and long-term incentive program. We may determine a different financial performance measure to be the most important financial performance measure in future years. Adjusted Corporate EBITDA is defined in Annex A to this Proxy Statement.
Relationship Between Compensation Actually Paid and Our Performance
The relationships between (a) Compensation Actually Paid to our PEO and other NEOs to (i) GAAP Net Income, (ii) Adjusted Corporate EBITDA and (iii) company TSR and (b) the TSR of the company to our Peer Index TSR are as follows:
•
GAAP Net Income: We did not use GAAP Net Income as a performance measure in our compensation program in the periods presented, nor was it directly considered when making compensation decisions for our PEO or other NEOs. As a result, there has not been a direct relationship between GAAP Net Income and compensation actually paid to these individuals for the periods presented. However, to the extent our GAAP Net Income is correlated with our Adjusted Corporate EBITDA, which is a key measure in our compensation program, there has been a directional relationship.
•
Adjusted Corporate EBITDA: We have used Adjusted Corporate EBITDA in our annual and long-term incentive programs during the periods presented and, as a result, it has had a direct impact on the compensation actually paid to our NEOs.
•
Company and Peer Index TSR: The majority of our NEOs’ target compensation for the periods presented was delivered as equity compensation, and for our NEOs other than Mr. Scherr, the PSUs in the program are capped at 100% of target if our TSR is negative during the performance period. As a result, compensation actually paid in connection with the PSUs will be directly related to our TSR. Peer
| | | | | 63 | | | | |
Index TSR has not been a direct component of our compensation program and therefore has not had a direct relationship with compensation actually paid to our NEOs.
Tabular List
The following is a list of the financial performance measures that we believe are the most important financial performance measures used to link NEO Compensation Actually Paid for 2023 to company performance. For more information, see “Compensation Discussion & Analysis.” Although we do not in practice use any performance measures to link Compensation “Actually Paid” (as calculated herein) to company performance, we are providing this list in accordance with Item 402(v) of Regulation S-K to provide information on performance measures used by the Compensation Committee to determine NEO compensation:
•
Adjusted Corporate EBITDA (Company-Selected Measure);
•
Revenue Per Unit;
•
Total Shareholder Return; and
•
Volume Weighted Average Closing Price of our Common Stock
| | | | | 64 | | | | |
BENEFICIAL OWNERSHIP OF OUR COMMON STOCK
The following table sets forth information as of March 27, 2018,25, 2024, unless another date is specified below, with respect to the ownership of our common stock by:
•
Each of the directors or director nominees of the Company;company;
Each of the executive officers named in the Summary Compensation Table; and
All of the Company’scompany’s executive officers and directors as a group.
The amounts and percentages of shares beneficially owned are reported on the basis of SEC regulations governing the determination of beneficial ownership of securities. Under SEC rules, a person is deemed to be a “beneficial owner” of a security if that person has or shares voting power or investment power, which includes the power to dispose of or to direct the disposition of such security. A person is also deemed to be a beneficial owner of any securities of which that such person has a right to acquire beneficial ownership within 60 days.days of the date of this table. Securities that can be so acquired are deemed to be outstanding for purposes of computing such person’s ownership percentage, but not for purposes of computing any other person’s percentage. Under these rules, more than one person may be deemed to be a beneficial owner of the same securities and a person may be deemed to be a beneficial owner of securities as to which such person has no economic interest. As of March 27, 2018, we had 84,055,186 shares of our common stock outstanding.
Except as otherwise indicated in the footnotes to this table, each of the beneficial owners listed has, to the knowledge of the Company,company, sole voting and investment power with respect to the indicated shares of common stock. Unless otherwise indicated, the address for each individual listed below is c/o Hertz Global Holdings, Inc., 8501 Williams Road, Estero, FLFlorida 33928.
| Shares Beneficially Owned | ||||
| Name and Address of Beneficial Owner | Number | Percent % | ||
Carl Icahn(1) | 29,263,869 | 34.82 | % | |
PAR Investment Partners, L.P.(2) | 5,888,576 | 7.01 | % | |
The Vanguard Group(3) | 4,913,647 | 5.85 | % | |
Dimensional Fund Advisors LP(4) | 4,843,235 | 5.76 | % | |
Gamco Investors, Inc.(5) | 4,814,084 | 5.73 | % | |
BlackRock, Inc.(6) | 4,357,336 | 5.18 | % | |
Glenview Capital Management, LLC(7) | 4,307,353 | 5.12 | % | |
| David Barnes | 17,038 | ** | ||
| SungHwan Cho | 13,270 | ** | ||
Carolyn Everson(9) | 37,764 | ** | ||
Vincent Intrieri(9) | 34,863 | ** | ||
Henry Keizer(10) | 37,277 | ** | ||
| Daniel Ninivaggi | 19,421 | ** | ||
| Kathryn Marinello | 50,391 | ** | ||
| Anindita Mukherjee | — | ** | ||
Thomas Kennedy(12) | 73,283 | ** | ||
Tyler Best(12) | 66,751 | ** | ||
Michel Taride(12) | 85,325 | ** | ||
| Richard Frecker | 12,911 | ** | ||
John Tague(11)(12) | 293,591 | ** | ||
| ||
| | | Name and Address of Beneficial Owner | | | | Shares Beneficially Owned | | | ||||
| | Number | | | | Percentage | | | |||||
| | | CK Amarillo LP(1) | | | | 181,455,469 | | | | 59.38% | | |
| | | Colin Farmer | | | | — | | | | ** | | |
| | | Jennifer Feikin(2) | | | | 38,621 | | | | ** | | |
| | | Mark Fields(3) | | | | 340,923 | | | | ** | | |
| | | Vincent J. Intrieri(4) | | | | 71,753 | | | | ** | | |
| | | M. Gregory O’Hara | | | | — | | | | ** | | |
| | | Andrew Shannahan | | | | — | | | | ** | | |
| | | Evangeline Vougessis(5) | | | | 41,753 | | | | ** | | |
| | | Thomas Wagner | | | | — | | | | ** | | |
| | | Wayne “Gil” West | | | | — | | | | ** | | |
| | | Stephen M. Scherr | | | | 1,335,431 | | | | ** | | |
| | | Alexandra Brooks(6) | | | | 59,978 | | | | ** | | |
| | | Colleen Batcheler(7) | | | | 113,309 | | | | ** | | |
| | | Justin Keppy | | | | 17,584 | | | | ** | | |
| | | Eric Leef(8) | | | | 87,762 | | | | ** | | |
| | | Kenny Cheung(9) | | | | 82,001 | | | | ** | | |
| | | Paul Stone(10) | | | | 373,841 | | | | ** | | |
| | | All directors and executive officers as a group (17 persons)(11) | | | | 2,604,142 | | | | ** | | |
| | ||||
| | |||
| ||||
|
**
Less than 1%.
(1)
| ||
Includes 9,234 phantom shares that will settle promptly following the year 2017: (i) none of our executive officers served as a member of a compensation committee (or other body performing a similar role) of another entity, any of whose executive officers serveddate Ms. Feikin ceases to serve on our Compensation Committee; (ii) noneBoard (other than for a removal for cause) and 10,703 shares of common stock underlying RSUs that vest in full on the earlier of the business day immediately preceding the 2024 Annual Meeting or Ms. Feikin’s departure from the Board for any reason other than a removal for cause.
(3)
Includes 10,703 shares of common stock underlying RSUs that vest in full on the earlier of the business day immediately preceding the 2024 Annual Meeting or Mr. Field’s departure from the Board for any reason other than a removal for cause.
(4)
Includes 10,703 shares of common stock underlying RSUs that vest in full on the earlier of the business day immediately preceding the 2024 Annual Meeting or Mr. Intrieri’s departure from the Board for any reason other than a removal for cause. Also includes 37,158 shares issuable pursuant to currently exercisable warrants to purchase our executive officers served as a director of another entity, any of whose executive officers servedcommon stock.
(5)
Includes 14,213 phantom shares that will settle promptly following the date Ms. Vougessis ceases to serve on our Compensation Committee;Board (other than for a removal for cause) and (iii) none10,703 shares of our executive officers served as a membercommon stock underlying RSUs that vest in full on the earlier of the compensation committee (orbusiness day immediately preceding the 2024 Annual Meeting or Ms. Vougessis’ departure from the Board for any reason other body performingthan a similar role)removal for cause.
(6)
Includes 40,000 shares of another entity, anycommon stock underlying currently exercisable stock options and 3,028 shares of whose executive officers servedcommon stock underlying RSUs that vest within 60 days.
(7)
Includes 13,755 shares of common stock underlying RSUs that vest within 60 days.
(8)
Includes 64,000 shares of common stock underlying currently exercisable stock options and 5,147 shares of common stock underlying RSUs that vest within 60 days.
(9)
The amount reported for Mr. Cheung is based on information available to the company as one of our directors.April 14, 2023, the effective date of his resignation from the company.
(10)
The amount reported for Mr. Stone is based on information available to the company as of October 31, 2023, the effective date of his resignation from the company.
(11)
Includes shares of common stock underlying stock options held directly by the beneficial owners that are currently exercisable or that will become exercisable within sixty (60) days, shares of common stock underlying RSUs that will vest within sixty (60) days, and phantom shares issued as non-employee director compensation.
Delinquent Section 16(a) Beneficial Ownership Reporting ComplianceReports
Under Section 16(a) of the Exchange Act, requiresthe company’s directors, certain of its officers, and any person holding more than 10% of the company’s common stock are required to file with the SEC initial reports of ownership and reports of changes in ownership of common stock of the company. Based solely on our review of the reports filed with the SEC, we believe that all of our directors, executive officers and persons who own more than 10% of our common stock file reports of ownership and changes in ownershiptimely complied with the SEC. These persons are requiredall Section 16(a) filing requirements applicable to provide usthem with copies of all such filed forms. Based on a review of reports filed by the Company’s directors, executive officers and beneficial holders of 10% or more of our outstanding shares, and upon representations from those persons, the Company believes that all reports requiredrespect to be filed by the Company’s reporting personstransactions during fiscal year 2017 were timely filed, with2023.
| | | | | 66 | | | | |
EQUITY COMPENSATION PLAN INFORMATION
The following table summarizes the exceptionsecurities authorized for issuance pursuant to our equity compensation plans as of one late Form 4 filingDecember 31, 2023. When originally authorized by the Plan of Reorganization in our Emergence, the 2021 Omnibus Incentive Plan provided for the granting of an aggregate of 62,250,055 shares of our common stock. The Plan of Reorganization also authorized, beginning on June 30, 2022 and ending on June 30, 2031, that the total authorized shares under the 2021 Omnibus Incentive Plan will automatically be increased on June 30 of each year, unless determined otherwise by the Board. The rate of Jodi Allen, Tyler Best, Carolyn Everson, Richard Frecker, Vincent Intrieri, Thomas Kennedy, Robin Kramer, Alexandria Marren, Michel Tarideincrease is calculated annually and Eliana Zem. equals 2% of the total number of our shares of common stock outstanding on the June 29th immediately preceding the applicable increase date (or a lesser number as determined by the Compensation Committee). In 2023, the Compensation Committee permitted the increase feature to be applied. No awards may be granted under the 2021 Omnibus Incentive Plan after June 30, 2031.
The late filings wereplan is categorized as “not approved by securityholders” because its adoption by our Board was authorized by the Plan of Reorganization, which occurred prior to our relisting on the Nasdaq in November 2021.
| | Plan Category | | | | Number of Securities to be Issued Upon Exercise of Outstanding Options, Warrants and Rights(1) (a) | | | | Weighted-Average Exercise Price of Outstanding Options, Warrants and Rights(2) (b) | | | | Number of Securities Remaining Available for Future Issuance Under Equity Compensation Plans(3) (c) | |
| | Equity compensation plans approved by securityholders | | | | — | | | | — | | | | — | |
| | Equity compensation plans not approved by stockholders | | | | 24,562,396 | | | | $26.17 | | | | 51,394,974 | |
(1)
The number of shares reported may overstate dilution due to inadvertent administrative errors by the Company.inclusion of performance-based awards.
(2)
Includes the weighted-average exercise price of outstanding stock options. Does not include other awards that do not have exercise prices associated with them.
(3)
As of December 31, 2023, includes shares available for future issuance under the 2021 Omnibus Incentive Plan, including for awards other than options and rights.
| | |||||||
| 67 | | | | |
INFORMATION ABOUT THE 2024 ANNUAL MEETING
Stockholders Entitled to Vote at the 2024 Annual Meeting
Our Board has established the record date for the 20182024 Annual Meeting as March 27, 2018.25, 2024. Only holders of record of the Company’scompany’s common stock at the close of business on the record date are entitled to receive the Notice of Internet Availability of Proxy Materials, or the Notice, and vote at the 20182024 Annual Meeting. Each share of common stock is entitled to one vote on each proposal at the 2024 Annual Meeting. On March 27, 2018,25, 2024, the Companycompany had 84,055,186305,606,809 shares of common stock outstanding.
Voting Procedures
If you are a stockholder of record, you may vote as set forth in the Notice, or as follows:
•
Voting by Internet: Follow the instructions on www.proxyvote.com or at www.virtualshareholdermeeting.com/HTZ2024.
•
Voting by Telephone: Call 1-800-690-6903 and follow the instructions provided by the recorded message.
•
Voting by Mail: If you receive a paper copy of the proxy materials, you may vote your shares by completing, signing, dating and returning the proxy card included in the printed proxy materials.
Your vote will be cast in accordance with the instructions authorized by internet or telephone or included on a properly signed and dated proxy card, as applicable. If you decide to vote before the 2024 Annual Meeting, we must receive your vote, either by internet, telephone or proxy card, by 11:59 PM (Eastern Time) on Tuesday, May 21, 2024, the day before the 2024 Annual Meeting, for your vote to be counted.
If you are a beneficial stockholder and received a voting instruction form, please follow the instructions provided by your bank, broker or other nominee to vote your shares; your ability to vote by telephone or over the internet depends on your broker’s voting process.
If you wish to vote at the 2024 Annual Meeting, you may do so by attending the meeting via the internet as provided below.
Attending and Participating in the 2024 Annual Meeting
The 2024 Annual Meeting will begin promptly at 1:00 PM (Eastern Time) and online check-in will begin at 12:45 PM (Eastern Time). Please allow ample time for the online check-in procedures. Interested persons who were not stockholders as of the close of business on March 25, 2024 may listen, but not participate, in the 2024 Annual Meeting by visiting www.virtualshareholdermeeting.com/HTZ2024 and registering as a guest. If you encounter technical difficulties with the virtual meeting website on the meeting day, please call the technical support number that will be posted on the virtual meeting log-in page.
To attend and participate in the 2024 Annual Meeting, stockholders of record will need to use their control number to log into www.virtualshareholdermeeting.com/HTZ2024 and follow the provided instructions.
Beneficial stockholders who do not have a control number may gain access to the meeting by logging into their brokerage firm’s web site.
Stockholders of record may submit questions during the 2024 Annual Meeting through the virtual meeting website at www.virtualshareholdermeeting.com/HTZ2024. Questions pertinent to meeting matters will
| |||||
| | | | |
be answered during the designated portion of the 2024 Annual Meeting, subject to time limitations and in accordance with the meeting rules of conduct that will be available on the virtual meeting website.
Notice of Internet Availability of Proxy Materials
We are permitted to furnish proxy materials, including this proxy statementProxy Statement and our annual report to stockholders for 2017,2024 Annual Report, to our stockholders by providing access to such documents on the Internetinternet at www.proxyvote.com instead of mailing printed copies. Our stockholders will not receive printed copies of the proxy materials unless they are requested.
Instead, the Notice will instruct you as to how you may access and review all of the proxy materials on the Internet.internet. It will also instruct you as to how you may submit your proxy on the Internet.internet. If you would like to receive a paper or e-mail copy of our proxy materials, you should follow the instructions for requesting such materials in the Notice. If you receive more than one Notice, it generally means that some of your shares are registered differently or are in more than one account. Please provide voting instructions for each Notice you receive.
Quorum
The presence, in person or by proxy, of the holders of a majority of the voting power of all outstanding shares entitled to vote at the 20182024 Annual Meeting constitutes a quorum. Abstentions and broker non-votesnon- votes are counted as present and entitled to vote for purposes of determining a quorum. A broker non-vote occurs when a nominee, such as a broker holding shares in “street name”street name for a beneficial owner, does not vote on a proposal because that nominee does not have discretionary voting power with respect to a proposal and has not received voting instructions from the beneficial owner.
Voting Standard
The Board recommends a vote “FOR” each of the director nominees in Proposal 1 and a vote “FOR” each of Proposals 2 and 3.
•
| ||
•
With respect to the contrary,ratification of the selection of Ernst & Young LLP as our independent auditor for the fiscal year ending December 31, 2024 (Proposal No. 2) and the approval, on an advisory basis, of the compensation of our named executive officers (Proposal No. 3), you may vote “FOR,” “AGAINST” or “ABSTAIN.”
Below is a summary of the vote required for each proposal and any effect of abstentions (or withhold votes) and broker non-votes. Although our Board does not anticipate that any of the nominees will be unable to stand for election as a director at our 2024 Annual Meeting, if this occurs, proxies will be voted in accordance with the Board’s recommendations.favor of such other person or persons as may be designated by our Governance Committee and our Board. Directors are elected by a plurality of all votes cast.
| | | | | 69 | | | | |
| | Proposals | | | | Vote Required for Adoption | | | | Effect of Abstention (or Withhold) | | | | Broker Discretionary Voting Allowed | | | | Effect of Broker Non- Votes | | ||||
| | 1 | | | | Election of Three Director Nominees | | | | Plurality of votes cast | | | | No effect | | | | No | | | | No effect | |
| | 2 | | | | Ratification of the Appointment of Ernst & Young LLP | | | | Majority of votes cast | | | | No effect | | | | Yes | | | | N/A | |
| | 3 | | | | Approval, on an Advisory Basis, of NEO Compensation | | | | Majority of votes cast | | | | No effect | | | | No | | | | No effect | |
Revocation of Proxies
Even if you were a stockholder as ofvoted by telephone or on the close of business on March 27, 2018internet, or if you hold a validrequested paper proxy formaterials and signed the 2018 Annual Meeting. Ifproxy card, you plan to attendmay revoke your proxy before it is voted at the 2018 Annual Meeting online, please be aware of the procedures described below. If you do not comply with the procedures described for attending the 2018 Annual Meeting online, you will not be able to access the 2018 Annual Meeting held via the Internet.
Solicitation of Proxies
Important Notice Regarding the Availability of Proxy Materials for the 2024 Annual Meeting
The 20172023 Annual Report is filed with the SEC and may also be obtained via a link posted on the “Investor Relations” portion of our website, www.hertz.com.ir.hertz.com. Copies of the 20172023 Annual Report, or any exhibits thereto, will be sent within
| ||
a reasonable time without charge upon written request to Hertz Global Holdings, Inc., 8501 Williams Road, Estero, Florida 33928, Attention: Corporate Secretary.
Other Business
Our Board is not aware of any other matters to be presented at the 20182024 Annual Meeting. If any other matter proper for action at the meeting is properly presented, the holders of the accompanying proxy will have discretion to vote the shares represented by the proxy on such matter in accordance with their best
| | | | | 70 | | | | |
judgment. If any matter not proper for action at the meeting should be presented, the holders of the proxy will vote against consideration of the matter or the proposed action.
Proposals for 20192025 Annual Meeting of Stockholders
The Companycompany will review for inclusion in next year’s proxy statement stockholder proposals received by December 7, 2018.10, 2024. Such stockholder proposals must satisfy all applicable requirements of Rule 14a-8 of the Securities Exchange Act and should be sent to Richard Frecker,the company’s Executive Vice President, General Counsel and Secretary of the Company at 8501 Williams Road, Estero, Florida 33928.
Stockholder proposals, including nominations for directors, not includedsubmitted for inclusion in next year’s proxy statement may be brought before the 20192025 annual meeting by a stockholder of the Companycompany who is entitled to vote at the meeting, who has given a written notice to the company’s Executive Vice President, General Counsel and Secretary ofcontaining the Company containing certain information specified in the By-lawsBylaws and who was a stockholder of record at the time such notice was given. To be timely for our 20192025 annual meeting, such notice must be delivered to or mailed and received by the Secretary at the address in the preceding paragraph no earlier than January 22, 2019,2025, and no later than the close of business on February 21, 2019,2025, except that if the 20192025 annual meeting is heldcalled for a date that is not within 30 days before April 22, 2019 or after July 31, 2019,the anniversary of the 2024 Annual Meeting, such notice must be delivered at the address in the preceding paragraph no earlier than 120 days prior to the date of such annual meeting and not later than the close of business on the later of (i) the ninetieth day prior to the date of such annual meeting or (ii) the tenth day following the day on which a public announcement of the date of such annual meeting is first made. In addition to complying with the advance notice provisions in our Bylaws, including providing the information required by our Bylaws, a stockholder nominating a director must provide any additional information required by Rule 14a-19 of the Exchange Act by March 24, 2025 (given that March 23, 2025 is a Sunday), including that such stockholder intends to solicit the holders of common stock representing at least 67% of the voting power of the company’s shares entitled to vote on the election of directors in support of director nominees other than the company’s nominees.
Our By-lawsBylaws require that stockholder recommendations for nominees to the Board must include, among other things, the name of the nominee or nominees, information regarding the nominee or nominees that would be required to be included in a proxy statement for the election of directors and a consent signed by the nominee or nominees evidencing consent to be named in the proxy statement and willingness to serve on the Board, if elected. Stockholders who intend to submit nominations to the Board must comply with all provisions of our By-lawsBylaws and provide timely written notice thereof.
Householding of Proxy Materials
| | | | | 71 | | | | |
If your Notice of Internet Availability of Proxy Materials or your annual report and proxy statement, as applicable, have been househeld and you wish to receive separate copies of these documents, or if your household is receiving multiple copies of these documents and you wish to request that future deliveries be limited to a single copy, you may notify your broker. You can also request, and the solicitation of proxies.
Investor Relations Department
Hertz Global Holdings, Inc.
8501 Williams Road
Estero, Florida 33928
Telephone Number (239) 301-7000
investorrelations@hertz.com
Hertz Global Holdings, Inc.
8501 Williams Road
Estero, Florida 33928
Telephone Number (239) 301-7000
investorrelations@hertz.com
| | |||||||
| 72 | | | | |
ANNEX A - Non-GAAP Measures— NON-GAAP MEASURES
The term “GAAP” refersdiscussion of our financial results in this Proxy Statement includes references to accounting principles generally accepted incertain measures that are not recognized measures under GAAP and may not be defined and calculated by other companies using the United States of America.same or similar terminology. Definitions of non-GAAP measures used in this proxy statementProxy Statement are set forth below. Also set forth below is a summary of the reasons why management of the Companycompany believes that usethe presentation of the non-GAAP financial measures included in this proxy statementProxy Statement provide useful information regarding the Company'scompany’s financial condition and results of operations and additional purposes for which management of the Companycompany utilizes the non-GAAP measures. Non-GAAP measures should not be considered in isolation and should not be considered superior to, or a substitute for, financial measures calculated in accordance with GAAP.
items. Management uses Gross EBITDA, Corporate EBITDA and Adjusted Corporate EBITDA as an operating performance metricsmetric for internal monitoring and planning purposes, including the preparation of ourthe company’s annual operating budget and monthly operating reviews, as well as to facilitateand analysis of investment decisions, profitability and performance trends. Further, Gross EBITDAThe measure enables management and investors to isolate the effects on profitability of operating metrics such as revenue, direct vehiclemost meaningful to the business of renting and operating expensesleasing vehicles, and selling, general and administrative expenses, which enablesallows management and investors to evaluate ourassess the performance of the entire business segments that are financed differently and have different depreciation characteristics and compare our performance against companies with different capital structures and depreciation policies. We also presenton the same basis as its reportable segments. Adjusted Corporate EBITDA as a supplemental measure because such information is also utilized in the determination of certain executive compensation as set forth in this proxy statement.
| | | (In millions) | | | | Twelve Months Ended December 31, 2023 | | |
| | | Adjusted Corporate EBITDA: | | | | | | |
|
| (In millions) | Year Ended December 31, 2017 | Year Ended December 31, 2016 | Year Ended December 31, 2015 | |||||||||
| Income (loss) from continuing operations before income taxes | $ | (575 | ) | $ | (470 | ) | $ | 132 | ||||
| Depreciation and amortization | 3,038 | 2,866 | 2,707 | |||||||||
| Interest, net of interest income | 637 | 624 | 599 | |||||||||
| Gross EBITDA | $ | 3,100 | $ | 3,020 | $ | 3,438 | ||||||
| Revenue earning vehicle depreciation and lease charges, net | (2,798 | ) | (2,601 | ) | (2,433 | ) | ||||||
| Vehicle debt interest | (331 | ) | (280 | ) | (253 | ) | ||||||
Vehicle debt-related charges(a) | 32 | 28 | 42 | |||||||||
Loss on extinguishment of vehicle-related debt(b) | — | 6 | — | |||||||||
| Corporate EBITDA | $ | 3 | $ | 173 | $ | 794 | ||||||
Non-cash stock-based employee compensation charges(d) | 19 | 13 | 16 | |||||||||
Restructuring and restructuring related charges(c)(d) | 20 | 53 | 84 | |||||||||
Sale of CAR, Inc. common stock(e) | (3 | ) | (84 | ) | (133 | ) | ||||||
Impairment charges and asset write-downs(f) | 118 | 340 | 57 | |||||||||
Information technology and finance transformation costs(g) | 68 | 53 | — | |||||||||
Other items(h) | 42 | 5 | 40 | |||||||||
| Adjusted Corporate EBITDA | $ | 267 | $ | 553 | $ | 858 | ||||||
| Net income (loss) | | | | $616 | | | ||
| Adjustments: | | | | | | | ||
| | | Income tax provision (benefit) | | | | (330) | | |
| | | Non-vehicle depreciation and amortization(a) | | | | 149 | | |
| | | Non-vehicle debt interest, net of interest income | | | | 238 | | |
| | | Vehicle debt-related charges |
| (b)(c) | | | | 42 | | |
| | | | 17 | | |
| | Unrealized (gains) losses on financial instruments | | | | 117 | | |
(Gain) on |
| non-vehicle capital assets(e) | | | | (162) | | |
| Change in fair value of |
| Public Warrants | | | | (163) | | |
| | Other items(f) | | | | 37 | | | |
| Adjusted Corporate EBITDA | | | | $561 | | |
(a)
Non-vehicle depreciation and amortization for Americas RAC, International RAC and Corporate for the twelve months ended December 31, 2023 were $125 million, $13 million and $11 million, respectively.
| | |||||||
| 73 | | | | |
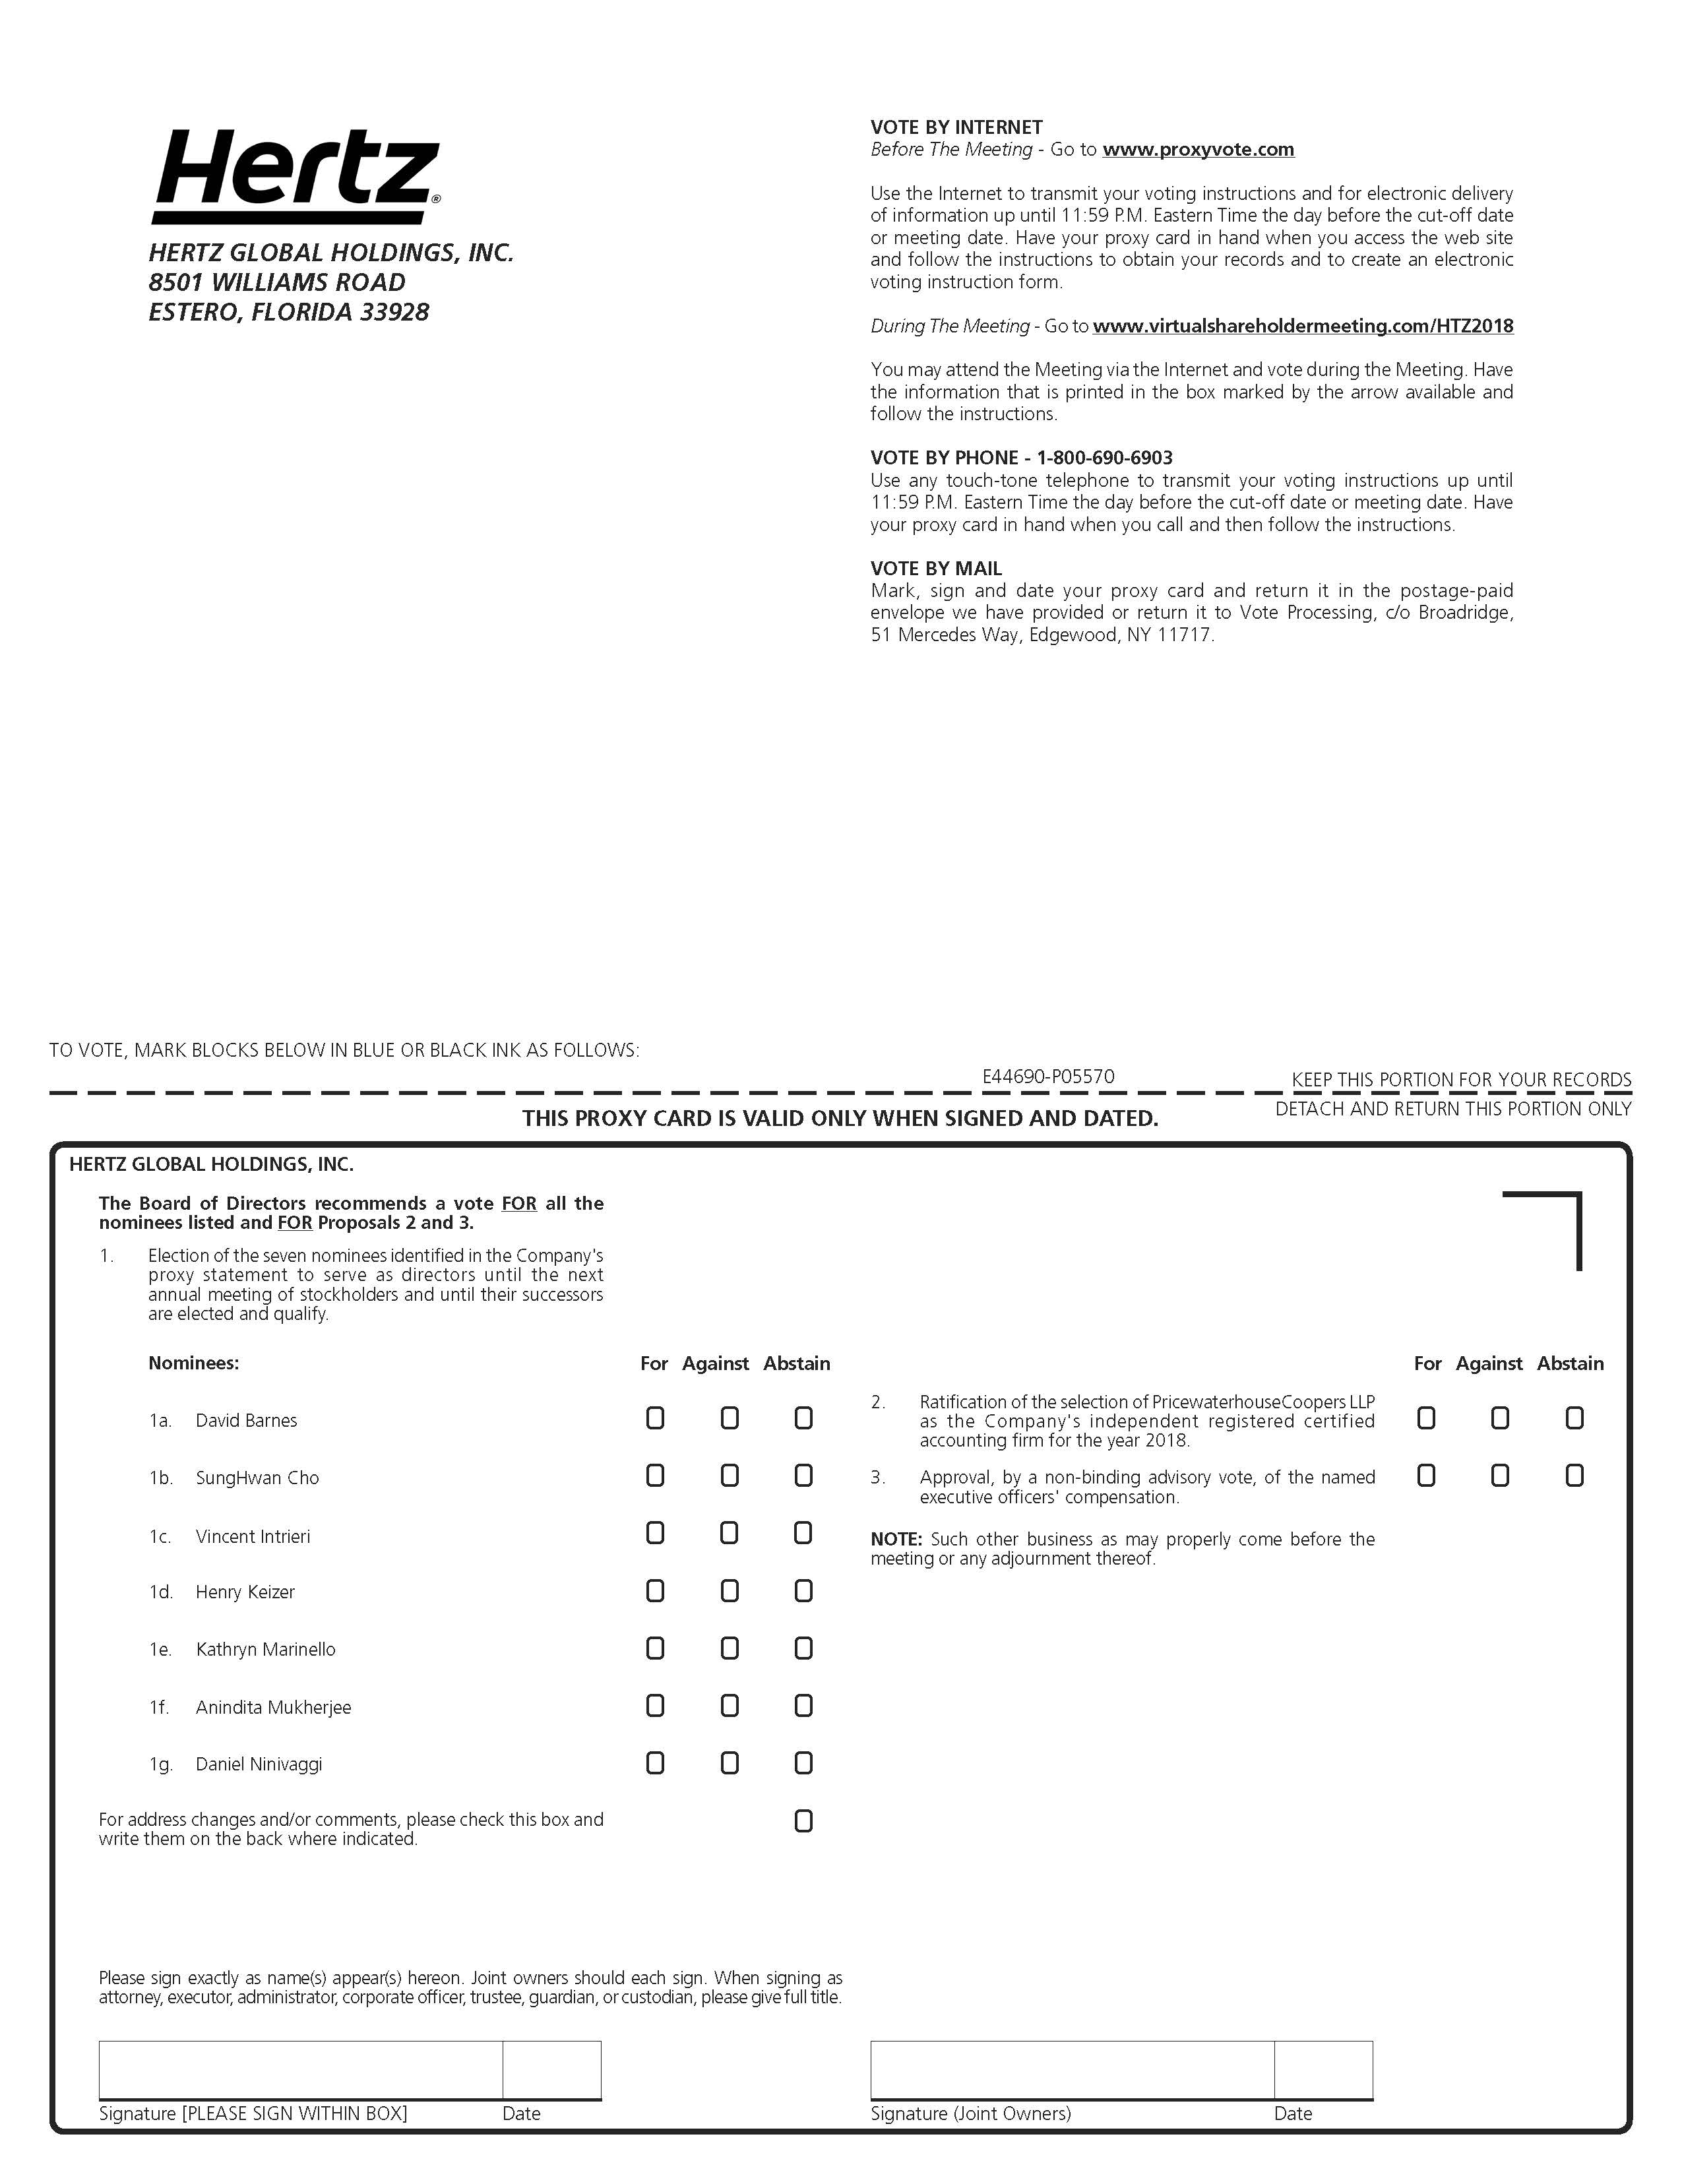
(b)
Represents debt-related charges relating to the amortization of deferred financing costs and debt discounts and premiums.
(c)
Vehicle debt-related charges for Americas RAC and International RAC for the twelve months ended December 31, 2023 were $36 million and $7 million, respectively.
(d)
Represents charges incurred under restructuring actions as defined in U.S. GAAP. Also includes restructuring related charges such as incremental costs incurred directly supporting business transformation initiatives.
(e)
Represents gain on the sale of certain non-vehicle capital assets sold in March 2023 in our Americas RAC segment.
(f)
Represents miscellaneous items, including certain IT-related costs, charges for certain storm-related vehicle damages and certain professional fees and charges related to the settlement of bankruptcy claims, partially offset by a loss recovery settlement.
In addition to the non-GAAP financial metric referenced above, we refer to Revenue Per Unit, or RPU, in this Proxy Statement. A definition of RPU follows.
Revenue Per Unit represents the amount of revenue generated per vehicle in the rental fleet each month, excluding the impact of foreign currency exchange rates so as not to affect the comparability of underlying trends.
| | | | | 74 | | | | |
![[MISSING IMAGE: px_24hertzproxy1pg1-bw.jpg]](https://capedge.com/proxy/DEF 14A/0001104659-24-044996/px_24hertzproxy1pg1-bw.jpg)
Signature [PLEASE SIGN WITHIN BOX] Date Signature (Joint Owners) DateTO VOTE, MARK BLOCKS BELOW IN BLUE OR BLACK INK AS FOLLOWS:KEEP THIS PORTION FOR YOUR RECORDSTHIS PROXY CARD IS VALID ONLY WHEN SIGNED AND DATED. DETACH AND RETURN THIS PORTION ONLYV45540-P07204For WithholdFor Against AbstainFor Against Abstain! !! !! !HERTZ GLOBAL HOLDINGS, INC.8501 WILLIAMS ROADESTERO, FLORIDA 339281b. Andrew ShannahanNominees:1a. Colin Farmer1c. Wayne "Gil" WestPlease sign exactly as your name(s) appear(s) hereon. When signing as attorney, executor, administrator, or other fiduciary, please give full title as such. Jointowners should each sign personally. All holders must sign. If a corporation or partnership, please sign in full corporate or partnership name by authorized officer.2. Ratification of the appointment of Ernst & Young LLP as our independent registered public accounting firm for the year 2024.3. Advisory approval of our named executive officers' compensation.The Board of Directors recommends a vote FOR Proposal 2.The Board of Directors recommends a vote FOR Proposal 3.1. Election of the three nominees identified in theCompany's proxy statement to serve as directors fora three-year term expiring at the Company's 2027annual meeting
of stockholders.HERTZ GLOBAL HOLDINGS, INC.The Board of Directors recommends a vote FOR all thenominees listed.NOTE: The shares will be voted as directed, or if no direction is indicated, as described on the reverse side of this proxy card.! ! !! ! !VOTE BY INTERNETBefore The Meeting - Go to www.proxyvote.com or scan the QR Barcode aboveUse the Internet to transmit your voting instructions and for electronic delivery ofinformation up until 11:59 p.m. Eastern Time the day before the meeting date. Haveyour proxy card in hand when you access the web site and follow the instructionsto obtain your records and to create an electronic voting instruction form.During The Meeting - Go to www.virtualshareholdermeeting.com/HTZ2024You may attend the meeting via the Internet and vote during the meeting. Havethe information that is printed in the box marked by the arrow available andfollow the instructions.VOTE BY PHONE - 1-800-690-6903Use any touch-tone telephone to transmit your voting instructions up until11:59 p.m. Eastern Time the day before the meeting date. Have your proxy cardin hand when you call and then follow the instructions.VOTE BY MAILMark, sign and date your proxy card and return it in the postage-paid envelope wehave provided or return it to Vote Processing, c/o Broadridge, 51 Mercedes Way,Edgewood, NY 11717.SCAN TOVIEW MATERIALS & VOTE w
![[MISSING IMAGE: px_24hertzproxy1pg2-bw.jpg]](https://capedge.com/proxy/DEF 14A/0001104659-24-044996/px_24hertzproxy1pg2-bw.jpg)
Hertz Global Holdings, Inc. 2024 Annual Meeting of StockholdersWednesday, May 22, 20241:00 p.m. EDTwww.virtualshareholdermeeting.com/HTZ2024Important Notice Regarding the Availability of Proxy Materials for the Annual Meeting to be held on May 22, 2024:The 2023 Annual Report and Notice and Proxy Statement are available at www.proxyvote.com.V45541-P07204PROXY – HERTZ GLOBAL HOLDINGS, INC.Please vote and sign on reverse sideThis proxy card is solicited by the Board of Directors for the Annual Meeting of StockholdersMay 22, 2024Wayne "Gil" West and Katherine Lee Martin (each, a "Proxy"), or either of them, each with the power of substitution, are hereby authorized to represent and vote the shares of the undersigned, with all the powers that the undersigned would possess if personally present, at the 2024 Annual Meeting of Stockholders of Hertz Global Holdings, Inc. to be held on May 22, 2024 or at any postponement or adjournment thereof.Shares represented by this proxy will be voted in accordance with direction of the stockholder set forth on the reverse side. If no such directions are indicated, the Proxies will have the authority to vote FOR Proposal 1, the election of Colin Farmer, Andrew Shannahan and Wayne "Gil" West; FOR Proposal 2, ratification of the appointment of Ernst & Young LLP as our independent registered public accounting firm for 2024; and FOR Proposal 3, advisory approval of the named executive officers' compensation.In their discretion, the Proxies are authorized to vote upon such other business as may properly come before the meeting.Please mark boxes accordingly, sign, date and return this proxy card promptly.Continued and to be signed on reverse side
0001657853 4 2023-01-01 2023-12-31