UNITED STATES
SECURITIES AND EXCHANGE COMMISSION
Washington, D.C. 20549
SCHEDULE 14A


PROXY STATEMENT
Filed by the Registrant ☒
Filed by a Party other than the Registrant ☐
Check the appropriate box:
☐ Preliminary Proxy Statement
☐ Confidential, for Use of the Commission Only (as Permitted by Rule 14a-6(e)(2))
☒ Definitive Proxy Statement
☐ Definitive Additional Materials
☐ Soliciting Material Under Rule 14a-12
TEXAS CAPITAL BANCSHARES, INC.
(Name of Registrant as Specified In Its Charter)
Payment of Filing Fee (Check the appropriate box):
☒ No fee required.
☐ Fee computed on table below per Exchange Act Rules 14a-6(i)(1) and 0-11.
(1) Title of each class of securities to which transaction applies:
(2) Aggregate number of securities to which transaction applies:
(3) Per unit price or other underlying value of transaction computed pursuant to Exchange Act Rule 0-11 (Set forth the amount on which the filing fee is calculated and state how it was determined):
(4) Proposed maximum aggregate value of transaction:
(5) Total fee paid:
☐ Fee paid previously with preliminary materials.
☐ Check box if any part of the fee is offset as provided by Exchange Act Rule 0-11(a)(2) and identify the filing for which the offsetting fee was paid previously. Identify the previous filing by registration statement number, or the Form or Schedule and the date of its filing.
(1) Amount Previously Paid:
(2) Form, Schedule or Registration Statement No:
(3) Filing Party:
(4) Date Filed:

| NOTICE OF ANNUAL MEETING AND PROXY STATEMENT | ||||||||||||||
| 2022 | | | |||||||||||||
 | Table of Contents | ||||||||||
| Table of Contents | |||||
| A LETTER FROM OUR CEO | |||||
| NOTICE OF ANNUAL MEETING OF STOCKHOLDERS | |||||
| VOTING INFORMATION | |||||
| PROXY STATEMENT SUMMARY | |||||
| PROXY STATEMENT | |||||
Information about Solicitation and Voting | |||||
| GOVERNANCE | |||||
PROPOSAL ONE–ELECTION OF DIRECTORS | |||||
| Board Qualifications and Experience Matrix | |||||
| Director Nominees | |||||
| Board Diversity | |||||
| Board and Committee Matters | |||||
| Board Leadership Structure | |||||
| Board and Corporate Governance: Strong Governance Practices | |||||
| Risk Oversight | |||||
| Environmental, Social and Governance (ESG) Highlights | |||||
| Stockholder Engagement | |||||
| Committees of the Board | |||||
| Additional Governance Matters | |||||
| DIRECTOR COMPENSATION | |||||
| STOCK OWNERSHIP INFORMATION | |||||
| Principal Stockholders and Beneficial Owners | |||||
| Delinquent Section 16(a) Reports | |||||
| AUDIT MATTERS | |||||
| Audit Committee Report | |||||
| Auditor Fees and Services | |||||
PROPOSAL TWO – RATIFICATION OF THE APPOINTMENT OF ERNST & YOUNG LLP AS THE COMPANY'S INDEPENDENT REGISTERED ACCOUNTING FIRM | |||||
| EXECUTIVE COMPENSATION* | |||||
PROPOSAL THREE– ADVISORY APPROVAL OF THE COMPANY'S EXECUTIVE COMPENSATION | |||||
| Compensation Discussion and Analysis | |||||
| Executive Officers | |||||
| Compensation Committee Report | |||||
| Compensation Tables | |||||
| CEO PAY RATIO | |||||
COMPENSATION COMMITTEE INTERLOCKS AND INSIDER PARTICIPATION | |||||
| INDEBTEDNESS OF MANAGEMENT AND RELATED PARTY TRANSACTIONS | |||||
| 2022 LONG-TERM INCENTIVE PLAN | |||||
PROPOSAL FOUR – APPROVAL OF THE 2022 LONG-TERM INCENTIVE PLAN | |||||
| Equity Compensation Plan Information | |||||
| ADDITIONAL INFORMATION | |||||
| Stockholder Nominees for Director | |||||
| Stockholder Proposals for 2023 | |||||
| Advance Notice Procedures | |||||
| ANNEX A | A-1 | ||||
* A detailed Table of Contents for Compensation topics appears on page 41. | |||||
Cautionary Note Regarding Forward-Looking Statements; Available Information
This Proxy Statement includes estimates, projections, and statements relating to our business plans, objectives, and expected operating results that are “forward-looking statements” within the meaning of the Private Securities Litigation Reform Act of 1995 and Section 21E of the Securities Exchange Act of 1934. These forward-looking statements are not historical in nature and may generally be identified by use of words such as “believe,” “expect,” “anticipate,” “estimate,” “intend,” “future,” “plan,” “may,” “should,” “will,” “could,” “would,” “will be,” “will continue,” “will likely result,” and similar expressions. Because forward-looking statements relate to future results and occurrences, they are subject to inherent and various uncertainties, risks, and changes in circumstances that are difficult to predict, may change over time, and are based on management's expectations and assumptions at the time the statements are made and are not guarantees of future results. We describe risks and uncertainties that could cause actual results and events to differ materially in our Annual Report on Form 10-K, Quarterly Reports on Form 10-Q and other filings we make with the Securities and Exchange Commission (“SEC”), including under “Risk Factors” and “Management’s Discussion and Analysis of Financial Condition and Results of Operations”. We undertake no obligation to update or revise publicly any forward-looking statements, whether because of new information, future events, or otherwise.
References to our website in this Proxy Statement are provided as a convenience, and the information on our website is not, and shall not be deemed to be, a part of this Proxy Statement or incorporated into any other filings we make with the SEC. The SEC maintains a website that contains reports, proxy and information statements, and other information regarding issuers, including Texas Capital Bancshares, Inc., that electronically file with the SEC at http://www.sec.gov.
TCBI 2022|Notice of Annual Meeting and Proxy Statement i
| A Letter from our CEO | ||||||||||
Texas Capital Bancshares, Inc.
2000 McKinney Avenue, 7th Floor
Dallas, Texas 75201
Dallas, Texas 75201
March 10, 2022
Dear Fellow Stockholders:
This past year was pivotal for Texas Capital Bancshares, Inc. We launched a transformative strategy with the goal of building Texas Capital Bank into the flagship financial services firm in Texas. We made tangible progress and have already begun delivering against our priorities and performance drivers: we welcomed key leaders to our organization, and we added products and services to serve our clients while strengthening our financial resilience. Critically, we continued investing in our people and empowering the communities we serve.
Our People
This year we invested in human capital through recruiting, training and diversity initiatives, including:
•Building out the senior management team, including 8 new Operating Committee members working alongside a significant portion of the Bank’s 1,900+ employees that have been recruited this past year;
•Materially increasing our number of client-facing bankers, many of them experienced veterans with expertise in specific industry verticals;
•Building a diverse team comprised of 66% diverse employees (~50% identifying as women and ~40% identify as members of racial minority groups);
•Establishing an analyst training program, unique to Texas Capital Bank, to develop and strengthen our pipeline of future leaders and transform our culture from the bottom up as well as from the top down; and
•Expanding our Diversity, Equity and Inclusion Council focusing on the development of goals that will be further ingrained in our business strategy as we move forward.
Our Communities
As we expand across Texas, we continue to grow our relationships and empower the communities we serve under three pillars: Live, Learn, and Lift. We know that, when our communities thrive, so does our firm.
•We invested $4.3 billion in impact lending, including $342 million in community development lending, $119 million in affordable housing lending, $2.4 billion in small business lending, and $1.5 billion in home mortgages, including 1,195 mortgages in low- and moderate-income communities.
•We continue to prioritize strategic investments in low- and moderate-income communities to help close the wealth gap, including a $51 million investment in community development.
•We supported the Texas business sector, funding over $206 million in loans through the second round of the Paycheck Protection Program as our state rebounded from the COVID-19 crisis of early 2020 AT 9:00 A.M.
TCBI 2022|Notice of Annual Meeting and Proxy Statement 1
| A Letter from our CEO | ||||||||||
Our Board and Governance
A balanced and experienced Board of Directors is a crucial part of our commitment. This year, we expanded our Board to eleven directors with the addition of Paola Arbour, who brings decades of experience leading and transforming IT organizations and who is an active participant in multiple forums promoting women in technology and diversity and inclusion. The Board of Directors is committed to providing strong governance for the Company adopting market-leading stockholder friendly policies such as our board leadership structure, which is currently led by an independent Chair, a lack of takeover protections, a director retirement age, limits for directors on other board service, and a low threshold of 10% for stockholders to call a special meeting.
I have had the pleasure of meeting many of our stockholders since joining the firm just a year ago and greatly value the conversations and insights you have shared with me as we continue to execute on our transformation. I look forward to continuing our engagement and thank you for your ongoing support of Texas Capital Bank as we continue to focus on driving sustainable growth and value creation.
Sincerely,

Rob C. Holmes
Chief Executive Officer and President
TCBI 2022|Notice of Annual Meeting and Proxy Statement 2
| Notice of Annual Meeting | ||||||||||
Texas Capital Bancshares, Inc.
2000 McKinney Avenue, 7th Floor
Dallas, Texas 75201
Dallas, Texas 75201
| NOTICE OF ANNUAL MEETING OF STOCKHOLDERS | ||
| Date and Time: | Tuesday, April 19, 2022, at 9:00 a.m. (central daylight time) | ||||
| Location: | 2000 McKinney Avenue, 7th Floor, Dallas, Texas 75201 | ||||
| Items of Business: | • To elect eleven (11) directors – Paola M. Arbour, Jonathan E. Baliff, James H. Browning, Larry L. Helm, Rob C. Holmes, David S. Huntley, Charles S. Hyle, Elysia Holt Ragusa, Steven P. Rosenberg, Robert W. Stallings, and Dale W. Tremblay, each to serve until the next annual meeting of stockholders or until their successors are elected and qualified; | ||||
| • To ratify the appointment of Ernst & Young LLP as the Company's independent registered public accounting firm for the year ending December 31, 2022; | |||||
| • To approve, on an advisory basis, the 2021 compensation of the Company’s named executive officers as described in the Proxy Statement; | |||||
| • To approve the Company's 2022 Long-Term Incentive Plan; and | |||||
| • To transact such other business as may properly come before the Annual Meeting or any postponements or adjournments thereof. | |||||
| Record Date: | Stockholders of record at the close of business on February 23, 2022 are the only stockholders entitled to notice of and to vote at the Annual Meeting. | ||||
Our Proxy Statement for the 2022 Annual Meeting of Stockholders (the “Annual Meeting”) of Texas Capital Bancshares, Inc. follows. Financial and other information about the Company are contained in our Annual Report to Stockholders for the fiscal year ended December 31, 2021 (the “2021 Annual Report”), which accompanies the Proxy Statement.
To ensure that your shares are represented at the meeting, we urge you to submit your voting instructions by proxy as promptly as possible. You may submit your proxy via the Internet or telephone, or, if you received paper copies of the proxy materials by mail, you can also submit a proxy via mail by following the instructions on the proxy card or voting instruction card. We encourage you to submit a proxy via the Internet. It is convenient and saves us significant postage and processing costs. You can revoke a proxy at any time prior to its exercise at the Annual Meeting by following the instructions in the Proxy Statement.
We are making the Proxy Statement and the form of proxy first available on or about March 10, 2022.
By order of the board of directors,

Anna M. Alvarado
EVP, Chief Legal Officer & Corporate Secretary
March 10, 2022
Dallas, Texas
| IMPORTANT NOTICE REGARDING THE AVAILABILITY OF PROXY MATERIALS FOR THE ANNUAL MEETING OF STOCKHOLDERS TO BE HELD ON April 19, 2022: | ||
The Texas Capital Bancshares, Inc. 2022 Notice of Annual Meeting and Proxy Statement, 2021 Annual Report (including the Company's Annual Report on Form 10-K) and other proxy materials are available at www.proxydocs.com/tcbi. | ||
TCBI 2022|Notice of Annual Meeting and Proxy Statement 3
| Notice of Annual Meeting | ||||||||||
VOTING INFORMATION
It is very important that you vote in order to play a part in the future of the Company. Please carefully review the proxy materials for the Annual Meeting and follow the instructions below to cast your vote on all of the voting matters.
Who is Eligible to Vote
You are entitled to one vote for each share of common stock you own. Only those stockholders that owned shares of the Company’s common stock on February 23, 2022, the record date established by the board of directors, will be entitled to vote at the Annual Meeting. At the close of business on the record date, there were 50,690,920 shares of common stock outstanding held by 157 identified holders.
We are furnishing our proxy materials to our stockholders primarily through the Internet in accordance with rules adopted by the Securities and Exchange Commission. Stockholders have been mailed a Notice of Internet Availability of Proxy Materials on or around March 10, 2022, which provides them with instructions on how to vote and how to access the proxy materials on the Internet. It also provides instructions on how to request paper copies of these materials. Stockholders who previously enrolled in a program to receive electronic versions of the proxy materials will receive an email notice with details on how to access those materials and how to vote.
How to Vote
Even if you plan to attend the Annual Meeting, please submit your voting instructions by proxy right away using one of the following methods for submitting a proxy (see Page 10 for additional information). Make sure to have your proxy card, voting instruction form (“VIF”) or Notice of Internet Availability (“Notice”) in hand and follow the instructions. If your shares are held in the name of a broker, bank or other nominee, please follow the voting instructions that you receive from the broker, bank or other nominee entitled to vote your shares, which may include requesting and bringing to the meeting a Legal Proxy.
| VOTE IN ADVANCE OF THE MEETING* | VOTE AT THE MEETING | ||||||||||||||||
| via the Internet | by phone | by mail | |||||||||||||||
 |  |  |  | ||||||||||||||
| Visit www.proxypush.com/tcbi to submit a proxy via your computer or mobile telephone | Call 1-866-390-5385 (toll-free) or the number on your proxy card or VIF | Sign, date and return your proxy card or VIF | Bring your proxy card, VIF or Notice or Legal Proxy | ||||||||||||||
| *You will need the 16-digit control number included on your proxy card, voting instruction form or Notice of Internet Availability of Proxy Materials. | |||||||||||||||||
If you have questions or require assistance with voting your shares, or if you need additional copies of the proxy materials, please contact Alliance Advisors, LLC, 200 Broadacres Drive, 3rd Floor, Bloomfield, New Jersey 07003. Stockholders may call toll free: (833) 501-4842.
Electronic Stockholder Document Delivery Instead of receiving future copies of annual meeting proxy materials by mail, stockholders of record and most beneficial owners can elect to receive an e-mail that will provide electronic links to these documents. Opting to receive your proxy materials online will save us the cost of producing and mailing documents and will also give you an electronic link to the proxy voting site. | ||
TCBI 2022|Notice of Annual Meeting and Proxy Statement 4
| Proxy Summary | ||||||||||
| PROXY STATEMENT SUMMARY | |||||||||||||||||||||||||||||
| This summary provides an overview of selected information in this year's Proxy Statement. We encourage you to read the entire Proxy Statement before voting. | |||||||||||||||||||||||||||||
Our Vision: To Be the Flagship Financial Services Firm in Texas Serving the Best Clients in our Markets | |||||||||||||||||||||||||||||
| Our Goals | |||||||||||||||||||||||||||||
▪Employer of choice in Texas for people interested in growing their career in financial services ▪Strong execution on the core set of financial products coupled with industry expertise and higher touch service that earns us the right to provide advice when it counts ▪Financially resilient bankthat is easy to do business with and is both proactive and responsive to client, employees and community needs ▪Build trusted relationships in our core markets in industries that leads us to being a "first call" from top clients and prospects | Building a Technology-Enabled Operating Model | ||||||||||||||||||||||||||||
| Our Core Values | |||||||||||||||||||||||||||||
| 1. Act with transparency, candor and discipline in all we do. 2. Be accountable to one another, clients, communities and stakeholders. 3. Commit to excellence every day. 4. Foster a culture of trust through collaboration, inclusion and respect. | |||||||||||||||||||||||||||||
| Annual Meeting of Stockholders | |||||||||||||||||||||||||||||
 Date & Time Date & Time |  Location Location |  Record Date Record Date | |||||||||||||||||||||||||||
April 19, 2022 9:00 a.m. CDT | 2000 McKinney Avenue, 7th Floor, Dallas, Texas 75201 | February 23, 2022 | |||||||||||||||||||||||||||
| Voting Matters | |||||||||||||||||||||||||||||
| Stockholders will be asked to vote on the following matters at the Annual Meeting. | |||||||||||||||||||||||||||||
| Board Recommendation | Page Reference | ||||||||||||||||||||||||||||
Proposal One - Election of Directors The Board believes that each of the 11 director nominees has the knowledge, experience, skills and background necessary to contribute to an effective and well-functioning Board. | ü Vote FOR each director nominee | ||||||||||||||||||||||||||||
Proposal Two - Ratification of the Appointment of Ernst & Young LLP as the Company's Independent Registered Public Accounting Firm The Audit Committee has appointed Ernst & Young LLP to serve as our independent registered public accounting firm for 2022 and this appointment is being submitted to our stockholders for ratification. The Audit Committee and the Board believe that the continued retention of Ernst & Young to serve as our independent auditor is in the best interests of the Company and its stockholders. | ü Vote FOR | ||||||||||||||||||||||||||||
Proposal Three - Advisory Approval of the Company's Executive Compensation The Company seeks a non-binding advisory vote from its stockholders to approve the compensation of the NEOs as disclosed in this Proxy Statement. The Board values the opinions of our stockholders and will take into consideration the outcome of the advisory vote when considering future executive compensation decisions. | ü Vote FOR | ||||||||||||||||||||||||||||
Proposal Four - Approval of our 2022 Long-Term Incentive Plan The Board recommends that stockholders approve the Company's 2022 Long-Term Incentive Plan, which would provide a vehicle for the Board to issue long-term incentive and other equity awards to management, employees and the Board. | ü Vote FOR | ||||||||||||||||||||||||||||
TCBI 2022|Notice of Annual Meeting and Proxy Statement 5
| Proxy Summary | ||||||||||
| Governance Highlights | ||||||||||||||||||||||||||
Board Composition (See page 13) | ||||||||||||||||||||||||||
| The Board has the appropriate diversity of thought, experience and expertise necessary to oversee our business. The Governance and Nominating Committee (the "Governance Committee") regularly reviews the overall composition of the Board and its Committees to assess whether it reflects the appropriate mix of skills, experience, backgrounds and qualifications that are relevant to our current and future business and strategy, and to introduce fresh perspectives and broaden and diversify the views and experience represented on the Board. | ||||||||||||||||||||||||||
Director Nominees (See page 16) The following table provides summary information about each director nominee. Each nominee is to be elected by a majority of the votes cast. | ||||||||||||||||||||||||||
| Committee Memberships | ||||||||||||||||||||||||||
| Nominee | Age1 | Primary Occupation | Indepen- dent | Director Since | Audit | Compen- sation | Gover- nance | Risk | ||||||||||||||||||
| Paola M. Arbour | 58 | CIO, Tenet Healthcare | ü | 2021 | X | |||||||||||||||||||||
| Jonathan E. Baliff | 58 | Operating Partner, Genesis Park | ü | 2017 | X | |||||||||||||||||||||
James H. BrowningÀ | 72 | Former Partner, KPMG LLP | ü | 2009 | CH | X | ||||||||||||||||||||
| Larry L. Helm ◊ | 74 | Chairman, Texas Capital Bancshares, Inc. | ü | 2006 | X | |||||||||||||||||||||
| Rob C. Holmes | 57 | CEO / President, Texas Capital Bancshares, Inc. | 2021 | |||||||||||||||||||||||
| David S. Huntley | 63 | Chief Compliance Officer, AT&T Inc. | ü | 2018 | X | X | ||||||||||||||||||||
Charles S. HyleÀ | 71 | Former Chief Risk Officer, Key Corp. | ü | 2013 | X | CH | ||||||||||||||||||||
| Elysia Holt Ragusa | 71 | Principal, RCubetti LLC | ü | 2010 | X | CH | ||||||||||||||||||||
| Steven P. Rosenberg | 63 | President, SPR Ventures, Inc. | ü | 2001 | X | |||||||||||||||||||||
| Robert W. Stallings | 72 | President / CEO, Stallings Capital Group, Inc. | ü | 2001 | X | X | ||||||||||||||||||||
| Dale W. Tremblay | 63 | Executive Chairman, C.H. Guenther & Son LLC | ü | 2011 | CH | |||||||||||||||||||||
À= Financial Expert | ◊ = Board Chair CH = Committee Chair | 1 Age as of Proxy Mailing Date. | ||||||||||||||||||||||||
| Board Tenure | 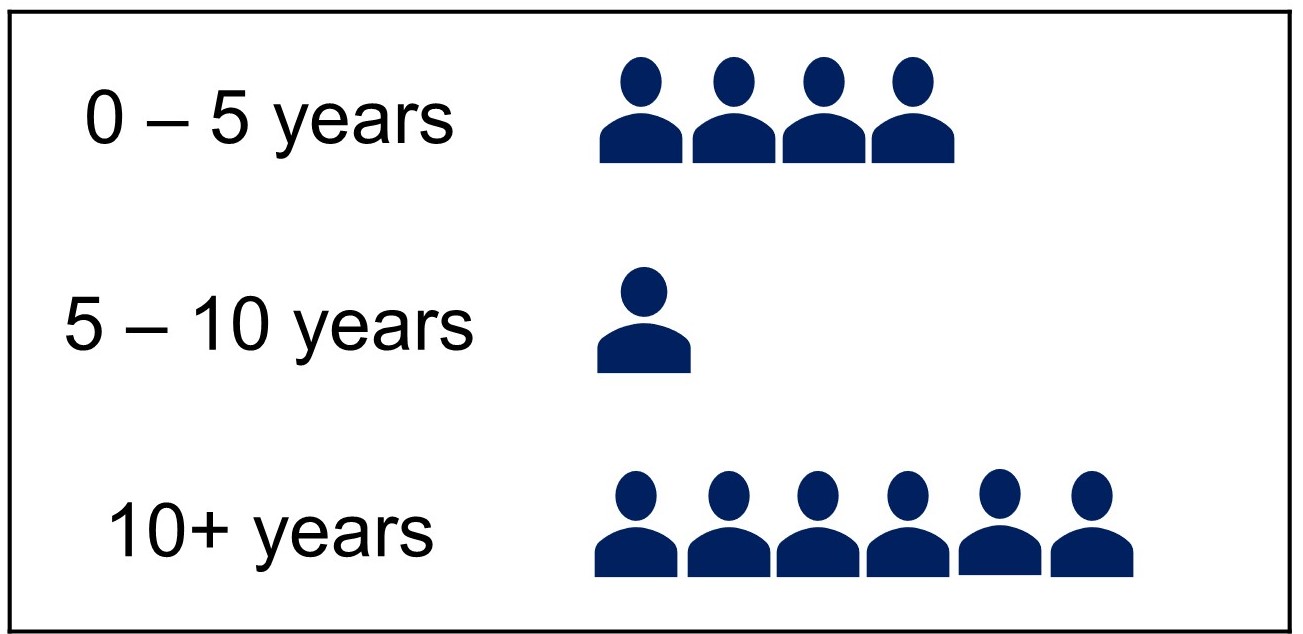 | |||||||||||||||||||||||||
| The Board considers length of tenure when reviewing nominees to maintain an overall balance of experience, continuity and fresh perspective. | ||||||||||||||||||||||||||
Each year the Board reviews and evaluates our Board leadership structure. The Board appointed Larry L. Helm as its Chairman for 2022. Rob C. Holmes is our CEO and President. All of our directors, other than our CEO, are independent (10 of 11 members). | ||||||||||||||||||||||||||
TCBI 2022|Notice of Annual Meeting and Proxy Statement 6
| Proxy Summary | ||||||||||
Governance Highlights (cont.) | |||||||||||||||||||||||||||||
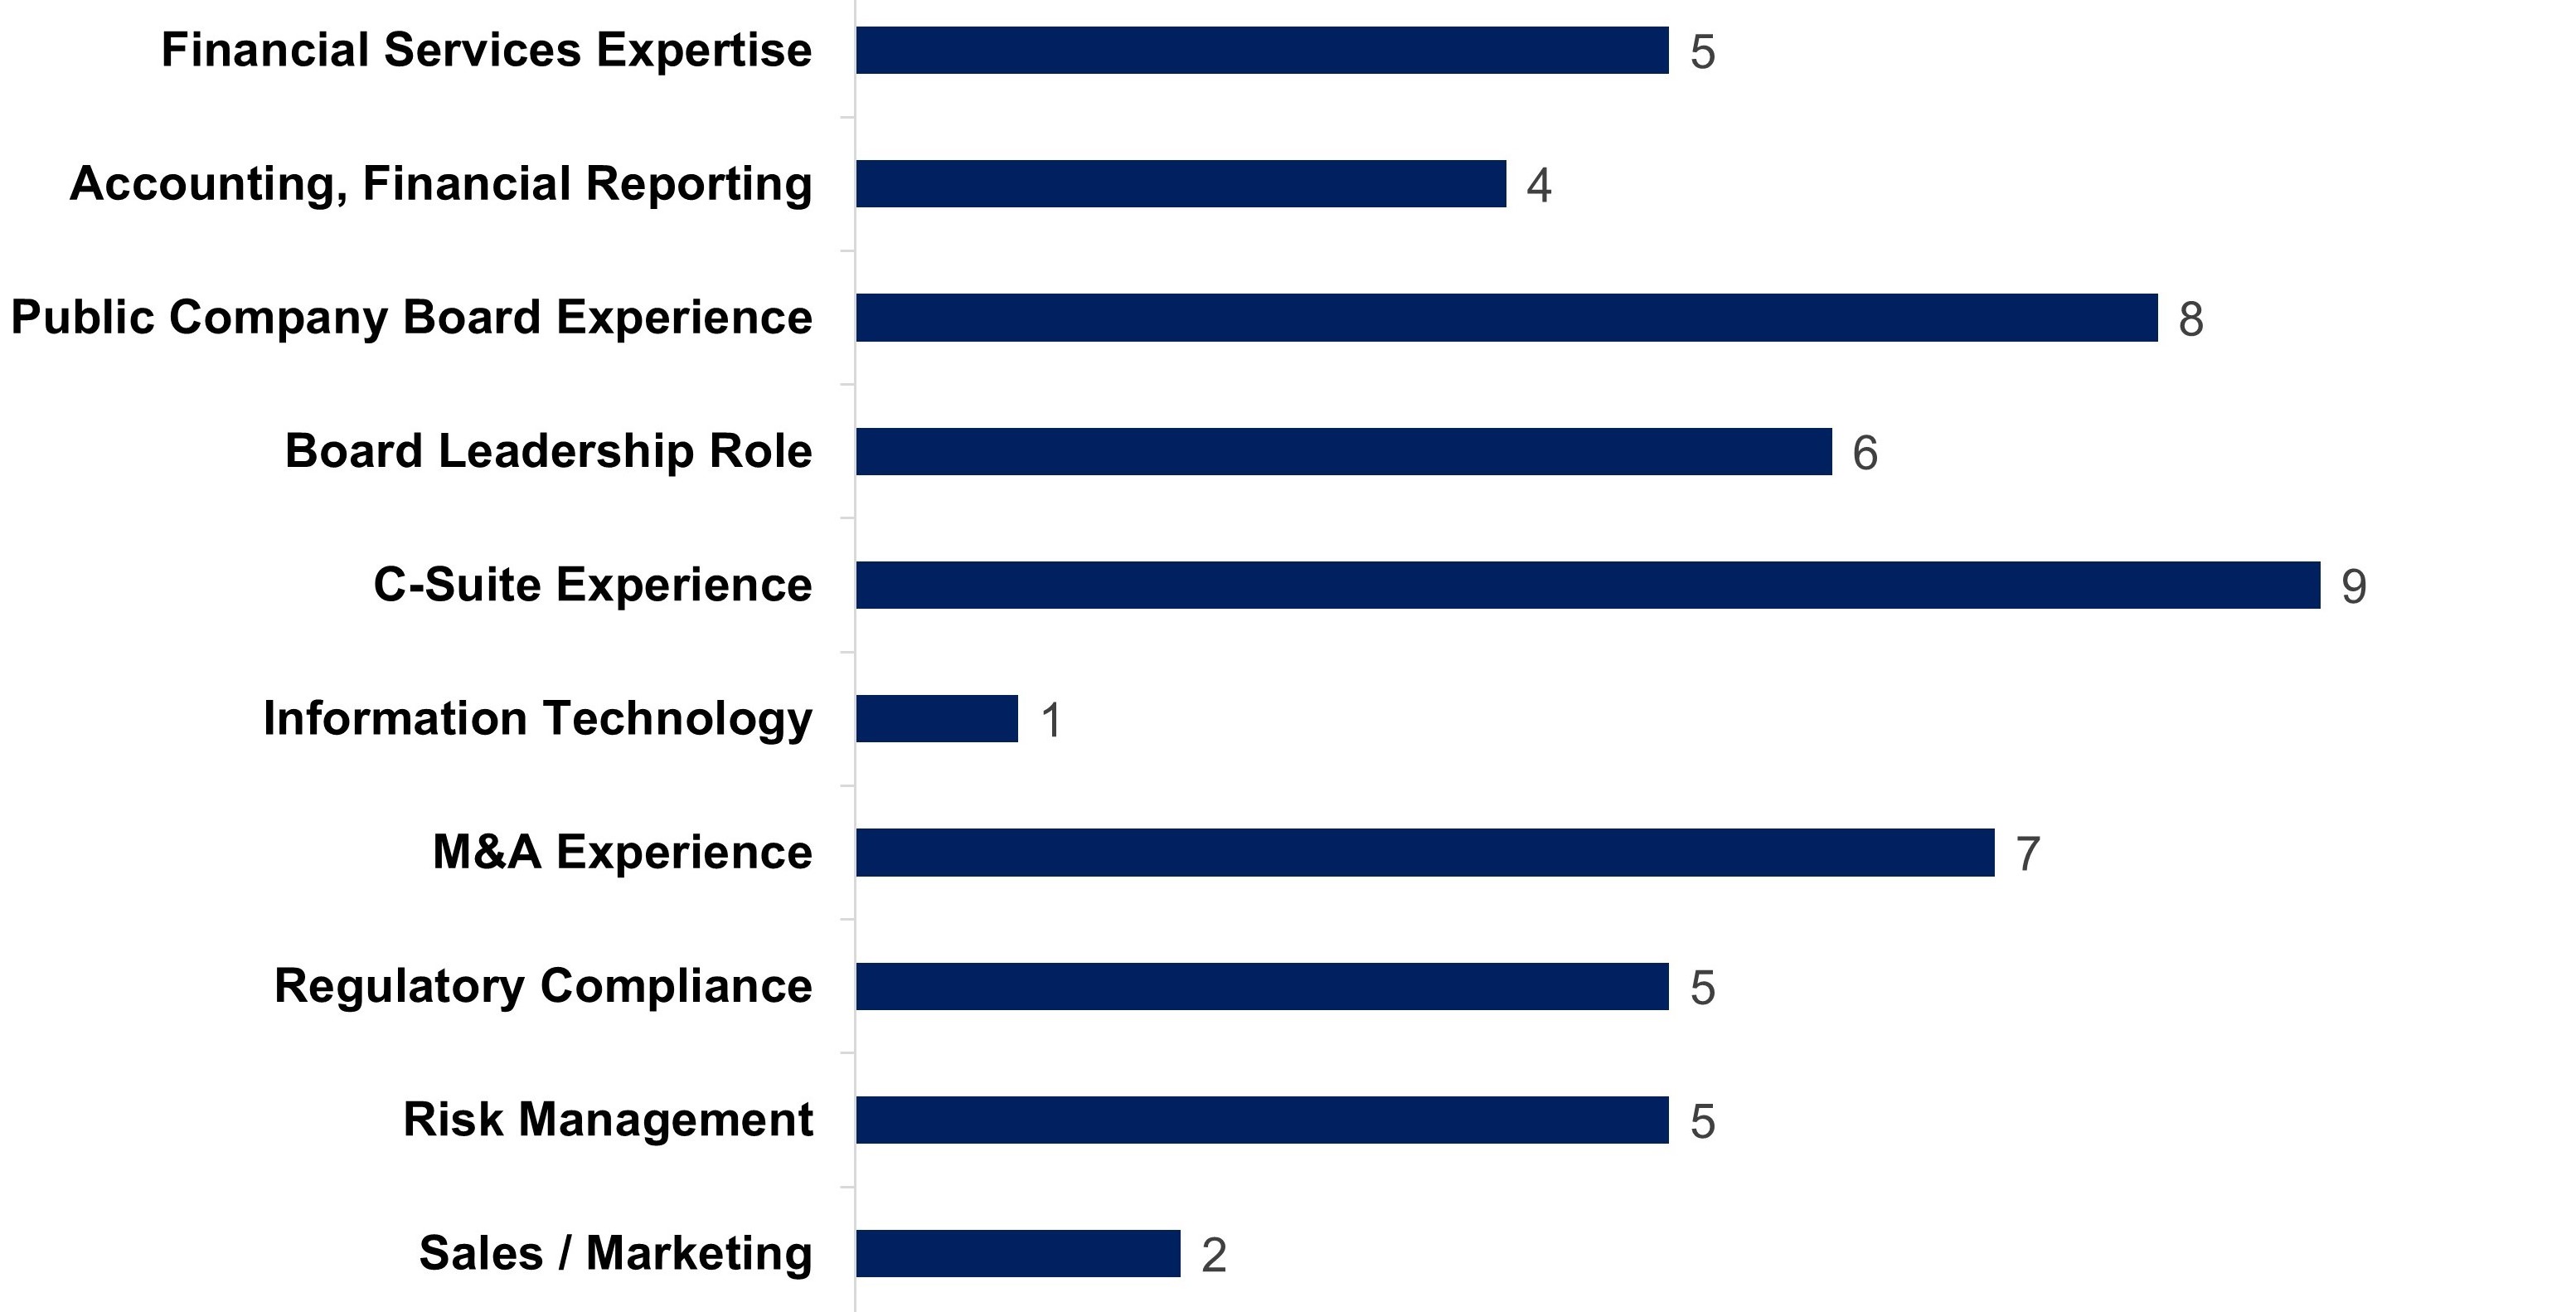
Board Profile(See page 14) The Board identified particular qualifications, attributes, skills and experience that are important to be represented on the Board as a whole, in light of the Company's current and future business needs. The following table indicates the number of directors that have the noted skill or experience. | |||||||||||||||||||||||||||||
 | |||||||||||||||||||||||||||||
Board Diversity(See page 22) The Company and the Board believe diversity in the boardroom is critical to the success of the Company and its ability to create long-term value for our stockholders. The diverse backgrounds of our individual directors help the Board better oversee the Company's management and operations from a variety of perspectives. | Women: 2Directors (18%) Racial / ethnic diversity: 2 Directors (18%) | ||||||||||||||||||||||||||||
| Our Governance Committee and our Board consider diversity in a broad sense, including diversity of viewpoints, background, work experience and other demographics, such as race, age, gender identity, ethnicity, nationality, disability, sexual orientation and cultural background. The Board will continue to make diversity a priority when considering director candidates. | |||||||||||||||||||||||||||||
| We routinely engage with various stakeholders of the Company, including stockholders, rating agencies, proxy advisory services, and customers on a variety of matters. This year we contacted many of our stockholders for the purpose of formally engaging with them about a variety of topics including our new corporate strategy, Board composition, including diversity and skills, Board oversight of risk, our executive compensation program and philosophy, and corporate responsibility, including human capital management. A number accepted our offer to engage, and we plan to continue this outreach on a regular basis. Some declined to engage noting that they did not have any issues with our programs. |  | ||||||||||||||||||||||||||||
TCBI 2022|Notice of Annual Meeting and Proxy Statement 7
| Proxy Summary | ||||||||||
Governance Highlights (cont.) | |||||||||||||||||||||||||||||
Environmental, Social and Governance (ESG) Update (See page 26) | |||||||||||||||||||||||||||||
| We established an ESG Council in 2021, which is overseen by the Board, consisting of executive leadership and senior management, to begin navigating and more proactively advancing ESG-related efforts. | |||||||||||||||||||||||||||||
 | •Focused on operating our business in a sustainable manner. Our headquarters is located in a leased building designated as a LEED (Gold level) facility •Proud to support clients who excel in sustainable business practices •During 2021 the Bank incorporated Environment, Social and Governance considerations into a policy statement. The statement sets forth expectations that as part of the Bank's “know your customer” program and due diligence efforts it will consider potential environmental, social or governance risk factors, including those related to the Bank's Enhanced Due Diligence industry list. | ||||||||||||||||||||||||||||
•Working diligently to assure the health, safety and well-being of our employees and customers, especially in response to the COVID-19 pandemic, with internal and external programs to assist •With the launch of the Diversity, Equity and Inclusion Council in 2020, co-Chaired by our CEO and CHRO, enhancements continue to be made to accelerate DEI efforts and outcomes. Hired a VP of Diversity, Equity and Inclusion. Formed numerous employee resource groups (ERGs) •Continued our record of strong community involvement through employee volunteerism (>7,600 hours), community lending ($4.3 billion in 2021) and philanthropic investment (>$2 million in 2021) |  | ||||||||||||||||||||||||||||
 | •Strong Board and corporate governance practices support our overall effectiveness and enable us to manage our business and maintain our integrity in the marketplace •During 2021 we met with stockholders holding 57% of our shares to communicate our progress on ESG matters and to better understand how ESG fits into their investment analysis and decision making | ||||||||||||||||||||||||||||
The Board is committed to good corporate governance, which promotes the long-term interests of stockholders, strengthens the Board and management accountability and helps build public trust in the Company. Highlights of our governance practices include: | |||||||||||||||||||||||||||||
•Annual election of directors •Majority voting for directors in uncontested elections •Independent Chair •All directors are independent, other than CEO •Director retirement policy •Director capacity, commitment and over boarding policy •Directors may be removed with or without cause •Action by written consent / right to call special meeting permitted •No poison pill •Executive sessions of independent directors •Annual Board and Committee evaluations | •Strong investor outreach program •Robust stock ownership guidelines for directors and executives •Prohibition on hedging and pledging •Comprehensive recoupment policy •Annual advisory vote on executive compensation •Risk oversight by Board and Committees •Human capital management oversight by Board and Compensation Committee •Board oversight of Company issues related to corporate social responsibility, public policy, philanthropy, and community participation | ||||||||||||||||||||||||||||
Stock Ownership Guidelines / Hold Requirement To ensure continued alignment of executive and stockholder interests, our stock ownership guidelines require the Company's executive officers and directors to own shares with a target value of: •5x base salary for the CEO; •3x base salary for the other Executive Officers; and •4x cash portion of the annual cash retainer for directors. In addition, a robust hold requirement assures that our executive officers and directors will continue to hold the shares they receive (after taxes) until the ownership guideline has been attained and maintained. | |||||||||||||||||||||||||||||
TCBI 2022|Notice of Annual Meeting and Proxy Statement 8
| Proxy Summary | ||||||||||
Proxy Summary (cont.)
2021 Company Performance (See page 47) | ||||||||||||||||||||||||||||||||||||||||||||||||||||||||
$235.2 Million Net Income1 up 316%2 | $4.60 Diluted EPS3 up 311%2 | 8.35% ROCE4 up 298%1 | ||||||||||||||||||||||||||||||||||||||||||||||||||||||
$3.2 Billion Stockholders' Equity up 12%2 | $28.1 Billion Total Deposits down 9%2 | $34.7 Billion Total Assets down 8%2 | ||||||||||||||||||||||||||||||||||||||||||||||||||||||
•Adopted and continue to implement updated strategic plan, including detailed reviews of each business line, the operating model, investment spend and overall strategy •Raised $625 million of capital, allowing the Bank to exceed “well-capitalized” regulatory ratios and leaving the Company well positioned to execute on new strategy •Deliberate unwinding of business lines and technology not aligned to our core strategy allowed for self-funding of necessary investment, reduced variability in earnings and more efficient use of capital •Continued focus on credit quality, and proactive resolution of legacy credit issues •Built-out senior management team; established ESG Council; and expanded DEI Council Notes: 1 Net income available to common stockholders. 2 Percentage change over the prior fiscal year. 3 Earnings per share. 4 Return on Common Equity. | ||||||||||||||||||||||||||||||||||||||||||||||||||||||||
| Compensation Elements | Compensation Decisions | |||||||||||||||||||||||||||||||||||||||||||||||||||||||
| Short- Term | Base Salary | •All NEO's received a base salary commensurate with their position after consideration of peer market data | ||||||||||||||||||||||||||||||||||||||||||||||||||||||
Annual Incentive Bonus: EPS (40%); ROCE (20%); Strategic Priorities (40%) | •Actual Company performance on EPS and ROCE metrics against targets produced a payout of 150% on each; payouts on assessment of individual performance on the Strategic Priorities ranged from 85% to 150% for the NEO's, with the CEO's payout at 150% •Ms. Alvarado (who joined late in the year) received a guaranteed incentive bonus for 2021 | |||||||||||||||||||||||||||||||||||||||||||||||||||||||
| Long- Term | Performance RSUs (50% of award): Vest at the end of a 3-year performance period based on: (i) EPS over three one-year performance periods (60%), and (ii) Relative TSR to Peer Group (40%) | •All NEO's received an award of performance RSUs for 2021 (except Ms. Alvarado who joined late in the year) •Only the Relative TSR and the 2021 EPS performance targets were established when the RSUs were granted in 2021, with the 2022 and 2023 EPS performance targets remaining to be established (which will show separate "grants" in 2022 and 2023 relating to the 2021 award) •Relative TSR was a new metric and weighting for 2021; replacing cumulative EPS relative to the peer group (50%) in 2020 | ||||||||||||||||||||||||||||||||||||||||||||||||||||||
Time RSUs (50% of award): Vest at the end of a 3-year vesting period, subject to continued employment | •All NEOs received an award of time RSUs for 2021 | |||||||||||||||||||||||||||||||||||||||||||||||||||||||
| New Hire / Other | Cash Awards | •All NEOs (other than Ms. Anderson) commenced employment with the Company in 2021 •Mr. Holmes and Mr. Storms received sign-in cash bonus awards of $2.5 million and $250,000, respectively | ||||||||||||||||||||||||||||||||||||||||||||||||||||||
| Time RSUs | •Mr. Holmes received an award of $14.5 million time RSUs in connection with joining the Company in 2021 •Ms. Alvarado received an award of $1.3 million time RSUs in connection with joining the Company in 2021 •Ms. Anderson received an award of $50,000 time RSUs for retention while onboarding the new CEO and new CIO | |||||||||||||||||||||||||||||||||||||||||||||||||||||||
TCBI 2022|Notice of Annual Meeting and Proxy Statement 9
| Proxy Statement | ||||||||||
PROXY STATEMENT
For the Annual Meeting of Stockholders to be held on April 19, 2022
This Proxy Statement is being furnished to the stockholders of Texas Capital Bancshares, Inc. (the(“we,” “us,” or the “Company”) on or about SeptemberMarch 10, 2020,2022, in connection with the solicitation of proxies by the board of directors to be voted at the 2022 annual meeting of stockholders (the “Annual Meeting”). The Annual Meeting will be held on October 20, 2020,April 19, 2022, at 9:00 a.m. at the offices of the Company located at 2000 McKinney Avenue, 7th Floor, Dallas, Texas 75201. The Company is the parent corporation of Texas Capital Bank N.A. (“Texas Capital Bank” or the “Bank”).
In accordance with rules and regulations adopted by the Securities and Exchange Commission (“SEC”), instead of mailing a printed copy of our proxy materials to each stockholder, we are furnishing proxy materials to our stockholders on the Internet. You will not receive a printed copy of the proxy materials, unless specifically requested. The Notice of Internet Availability of Proxy Materials will instruct you as to how you may access and review all of the important information contained in the proxy materials. The Notice of Internet Availability of Proxy Materials also instructs you as to how you may submit your proxy on the Internet.
INFORMATION ABOUT SOLICITATION AND VOTING
Record Date and vote upon the following matters:
You are entitled to one vote for each share of common stock you own. Only those stockholders that owned shares of the Company’s common stock on August 28, 2020,February 23, 2022, the record date established by the board of directors, will be entitled to vote at the Annual Meeting. At the close of business on the record date, there were 50,447,82550,690,920 shares of common stock outstanding held by 180157 identified holders. Outstanding shares of the Company's Series B Preferred Stock currently do not have voting rights.
At least a majority of the total number of issued and outstanding shares of common stock as of the record date must be present at the Annual Meeting in person or by proxy and entitled to vote in order to have a quorum to transact business. If there are not sufficient shares present and entitled to vote at the Annual Meeting for a quorum or to approve any proposal, the board of directors may postpone or adjourn the Annual Meeting in order to permit the further solicitation of proxies.
Directors are elected by a plurality of the votes cast at the Annual Meeting. The nine (9)eleven (11) nominees receiving the highest number of votes “for” will be elected. Votes may be cast “for” or may be “withheld” with respect to any or all nominees.For purposes of the election of directors, votes that are “withheld” and broker non-votes (described below) will be counted as “present” for purposes of establishing a quorum but will not be counted as votes cast and will have no effect on the result of the vote. Stockholders may not cumulate votes in the election of directors. In accordance with our Majority Voting Policy, any nominee for election as a director who receives a greater number of “withhold” votes than votes “for” election in an uncontested election must deliver his or her resignation to the board of directors. The board of directors will determine whether to accept the resignation based upon the recommendation of the Governance and Nominating Committee and consideration of the circumstances. See “BoardThe Company will disclose the Board’s decision and Committee Matters – Corporate Governance” for more information on the Majority Voting Policy.process by which it was reached.
The affirmative vote of a majority of the shares of the Company’s common stock present in person or by proxy at the Annual Meeting is required to approve Proposal Two (advisory vote on 2019 executive compensation), Proposal Three (ratification of the appointment of Ernst & Young LLP as the Company’s independent registered public accounting firm), Proposal Three (advisory vote on 2021 executive compensation) and Proposal Four (ratification of the special meeting 20% ownership requirement in the Company's Bylaws)(the 2022 Long-Term Incentive Plan). Votes on these proposals may be cast “for,” “against” or “abstain.” An abstention will have the effect of a vote against Proposals Two, Three and Four. Broker non-votes will have no effect on the outcome of ProposalProposals Two, orThree and Four. Abstentions, votes against and broker non-votes will be counted as “present” for purposes of establishing
TCBI 2022|Notice of Annual Meeting and Proxy Statement 10
| Proxy Statement | ||||||||||
a quorum. The results of voting on ProposalsProposals Two and Three are advisory only and will not be binding upon the Company or its board of directors.
The Company does not currently know of any other matters that may come before the Annual Meeting. However, if any other matters are properly presented at the Annual Meeting, the persons designated in the enclosed proxy will vote your proxy in their discretion on such matters.
A broker non-vote occurs when a bank, broker or other nominee holding shares for a beneficial owner submits an executed proxy to the Company but does not vote on a particular proposal because it does not have discretionary voting power with respect to that item and has not received voting instructions from the beneficial owner. If your shares are held in the name of a bank, broker or other nominee, they are not permitted to vote on your behalf on Proposals One, TwoThree or Four at the Annual Meeting unless you provide specific instructions to such bank, broker, or other nominee in accordance with their procedures. For your vote to be counted on Proposal One (election of directors), Proposal TwoThree (advisory vote on 20192021 executive compensation) and Proposal Four (ratification(approval of the special meeting 20% ownership requirement in the Company's Bylaws)2022 Long-Term Incentive Plan), you must communicate your voting decisions to your bank, broker or other nominee within the time period stated in their instructions to you. Your bank, broker or other nominee will be permitted to vote on Proposal ThreeTwo (ratification of the appointment of Ernst & Young LLP as the Company’s independent registered public accounting firm)without instructions from you.
The individuals named as proxies will vote properly completed proxies received prior to the Annual Meeting in the way you direct. If you send in a properly completed proxy but do not specify how the proxy is to be voted, the shares represented by your proxy will be voted to elect the nine (9)eleven (11) director nominees, to approve, on an advisory basis, the 2019 compensation of our named executive officers, to ratify the appointment of Ernst & Young LLP as the Company’s independent registered public accounting firm for 20202022, to approve, on an advisory basis, the 2021 compensation of our named executive officers, and to ratifyapprove the special meeting 20% ownership requirement in the Company's Bylaws.2022 Long-Term Incentive Plan. If your shares are held by a bank, broker or other nominee and you want to vote in person at the Annual Meeting, you must obtain a legal proxy from the record holder and present it at the Annual Meeting.
If you are a stockholder of record you may revoke a proxy at any time before the proxy is exercised by:
1.delivering written notice of revocation to Texas Capital Bancshares, Inc., Attn: Corporate Secretary – Annual Meeting, 2000 McKinney Avenue, 7th Floor, Dallas, Texas 75201; 2.submitting another properly completed proxy card that is later dated; 3.voting by telephone at a subsequent time; 4.voting through the Internet at a subsequent time; or 5.voting in person at the Annual Meeting. |
If your shares are held in the name of a broker, bank or other nominee, please follow the instructions that you receive from them in order to instruct them to revoke the voting of your shares.
Please review the proxy materials and follow the relevant instructions to vote your shares. We hope you will exercise your rights and fully participate as a stockholder.
It is important that you are represented by proxy or are present in person at the Annual Meeting. The Company requests that you vote your shares by following the instructions as set forth in the Notice of Internet Availability of Proxy Materials. Your proxy will be voted in accordance with the directions you provide.
The Company’s board of directors is making this solicitation and the Company will pay the costs and all expenses of this proxy solicitation. The directors, officers and employees of the Company and the Bank may also solicit proxies by telephone or in person but will not be paid additional compensation to do so. We have engaged Alliance Advisors, LLC to assist with the solicitation of proxies for a fee of $14,500. We have also agreed to reimburse Alliance Advisors, LLC for certain expenses and to indemnify Alliance Advisors, LLC against certain losses and expenses. We will reimburse brokers, fiduciaries and custodians for their costs in forwarding proxy materials to beneficial owners of common stock.
TCBI 2022|Notice of Annual Meeting and Proxy Statement 11
| Proxy Statement | ||||||||||
We are permitted to send a single Notice of Annual Meeting of Stockholders (“Notice”) and any other proxy materials we choose to mail to stockholders who share the same last name and address.address, unless the stockholders have notified the Company of their desire to receive multiple copies of the Notice or proxy materials. This procedure is called “householding” and is intended to reduce our printing and postage costs.
The Company will promptly deliver, upon written or oral request, a separate copy of the Notice or proxy materials to any stockholder residing at an address to which only one copy was mailed. If you would like to receive a separate copy of athe Notice or other proxy statement or annual report,materials, either now or in the future, please contact us in writing at the following address: Texas Capital Bancshares, Inc., Attn: Investor Relations, 2000 McKinney Avenue, 7th7th Floor, Dallas, Texas 75201. 75201, or via telephone at (214) 932-6600.
If you hold your shares through a bank, broker or other nominee and would like to receive additional copies of the Notice and any other proxy materials, or if multiple copies of the Notice or other proxy materials are being delivered to your address and you would like to request householding, please contact your bank, broker or nominee.
TCBI 2022|Notice of Annual Meeting and Proxy Statement 12
| Governance | ||||||||||
GOVERNANCE
The Company is committed to effective corporate governance, which promotes the long-term interests of stockholders, strengthens Board and management accountability and helps build public trust in the Company. See “Corporate Governance Highlights” for more information.
The Company's corporate governance guidelines, Board committee charters and other materials can be accessed on our website at https://investors.texascapitalbank.com/governance-responsibility/governance-documents/default.aspx. We will promptly deliver free of charge, upon request, a copy of the corporate governance guidelines, Board committee charters or Code of Business Conduct or our most recent Form 10-K or Annual Report to any stockholder requesting a copy. Requests should be directed to the Company’s Corporate Secretary, Texas Capital Bancshares, Inc. 2000 McKinney Avenue, 7th Floor, Dallas, Texas 75201. The Company's SEC filings, including Forms 3, 4 and 5 filed by the Company’s directors and executive officers, can be accessed on our website at https://investors.texascapitalbank.com/financials/sec-filings/default.aspx.
Based on the recommendation of theour independent Governance and Nominating Committee (the “Governance Committee”), our board of directors have been nominated for re-electioneleven directors – Paola M. Arbour, Jonathan E. Baliff, James H. Browning, Larry L. Helm, Rob C. Holmes, David S. Huntley, Charles S. Hyle, Elysia Holt Ragusa, Steven P. Rosenberg, Robert W. Stallings, and Dale W. Tremblay, to serve a one-year term expiring at the 2023 Annual Meeting. Directors serve for a term ending on the dateMeeting of the following year’s annual meeting of stockholdersStockholders, or until their successors are elected and qualified. All of the nominees below have indicated their willingness to continue to serve as a director if elected. Each of the nominees have previously been elected as directors of the Company by stockholders except for Ms. Arbour, who was elected by the Board in July 2021.
At the Annual Meeting, you will have the opportunity to elect these eleven nominees. Unless otherwise instructed, the proxy holders will vote the proxies received by them for these eleven nominees. However, if any of the nominees is unable or declines to serve for any reason, your proxy will be voted for the election of a substitute nominee selected by the board of directors.
The name of each of our nominees for election and certain information about them, as of the date of this Proxy Statement (except ages, which are as of the estimated proxy mailing date), is set forth below:below. Included in the information below is a description of the particular qualifications, attributes, skills and experience that led the Board to conclude that each person below should serve as a director of the Company.
There is no family relationship between or among any of our executive officers or directors. There are no arrangements or understandings between any of our executive officers or directors and any other person pursuant to which any of them are elected as a director or appointed as an officer.
TCBI 2022|Notice of Annual Meeting and Proxy Statement 13
| Governance | ||||||||||
| Board Composition and Refreshment | Board Refreshment | ||||||||||||||||
| Ensuring the Board is composed of directors who bring diverse viewpoints and perspectives, exhibit a variety of skills, professional experience and backgrounds, and effectively represent the long-term interests of our stockholders, is a principal priority of the Board and the Governance Committee. The Board and the Committee also understand the importance of Board refreshment, and strive to maintain an appropriate balance of tenure, turnover, diversity and skills on the Board. The Board believes that new perspectives and new ideas are critical to a forward-looking and strategic board, as is the ability to benefit from the valuable experience and familiarity that longer-serving directors bring. | Over the last seven years: ▪5 new directors elected ▪Rotation of Two Committee Chairs ▪Expanded qualifications and diversity represented on the Board | ||||||||||||||||
The Board and the Governance Committee require that each director be a recognized person of high integrity with a proven record of success in his or her field and have the ability to devote the time and effort necessary to fulfill his or her responsibilities to the Company. Each director must demonstrate innovative thinking, familiarity with and respect for corporate governance requirements and practices, a willingness to assume fiduciary responsibilities, an appreciation of diversity and a commitment to sustainability and to dealing responsibly with social issues. In addition, the Board conducts interviews of potential director candidates to assess integral qualities, including the individual’s ability to ask difficult questions and, simultaneously, to work collegially.
The Board considers diversity in a broad sense, including diversity of viewpoints, background, work experience and other demographics, such as Chief Executive Officer ("CEO")race, age, gender identity, ethnicity, nationality, disability, sexual orientation and Presidentcultural background, and professional experience and skills in evaluating candidates for Board membership and assesses the effectiveness of this policy through the Company since May 2020. He has served asGovernance Committee's annual review of director nominees. The Board believes that diversity results in a director since January 2006variety of points of view and, as chairmanconsequently, a more effective decision-making process.
A substantial majority of the board since May 2012. He previously servedmust qualify as a senior advisor for Accelerate Resources, LLC, a company engaged inindependent under the acquisitionrelevant listing standards of non-operated oilthe Nasdaq Stock Market and natural gas
Ms. Arbour joined the Board in July 2021. The Governance Committee and the full Board carefully reviewed her experience, skills and attributes, including her independence. The Governance Committee and the Board determined to elect her to the Board in July 2021 and to recommend her to stockholders for re-election at the 2022 Annual Meeting.
Qualifications, Attributes, Skills and Experience on the Board
The Board identified particular qualifications, attributes, skills and experience that are important to be represented on the Board as a memberwhole, in light of the Risk Committee.
TCBI 2022|Notice of Annual Meeting and comply with enhanced regulatory risk management requirements, which make him well qualified to serve as a directorProxy Statement 14
| Governance | ||||||||||
Qualifications, Attributes, Skills and Experience | Characteristics | ||||
| Financial Services Expertise | Experience in one or more of the Company's specific financial services areas | ||||
| Accounting, Financial Reporting | Experience as an accountant or auditor at an accounting firm, chief financial officer, or other relevant experience in accounting and financial reporting | ||||
| Public Company Board Experience | Experience as a board member of another public company | ||||
| Board Leadership Role | Experience in a leadership role on a board of directors, including Chair, Lead Director, or Committee Chair | ||||
| C-Suite Experience | Experience as a CEO, CFO, COO, CIO, CRO or other senior executive of a major organization or public company | ||||
| Information Technology | Experience understanding information systems and technology and implications for operating businesses | ||||
| M&A Experience | Experience with respect to banking, mergers and acquisitions, private equity, capital markets transactions, investment banking, and long-term strategic planning | ||||
| Regulatory Compliance | Experience in regulatory matters or affairs, including as part of a regulated financial services firm or other highly regulated industry | ||||
| Risk Management | Experience managing risks in a large organization, including specific types of risk (e.g., financial, cyber, privacy and data security) or risks facing large financial institutions | ||||
| Sales / Marketing | Experience building or supervising sales / marketing organizations, including for new markets or products / services | ||||
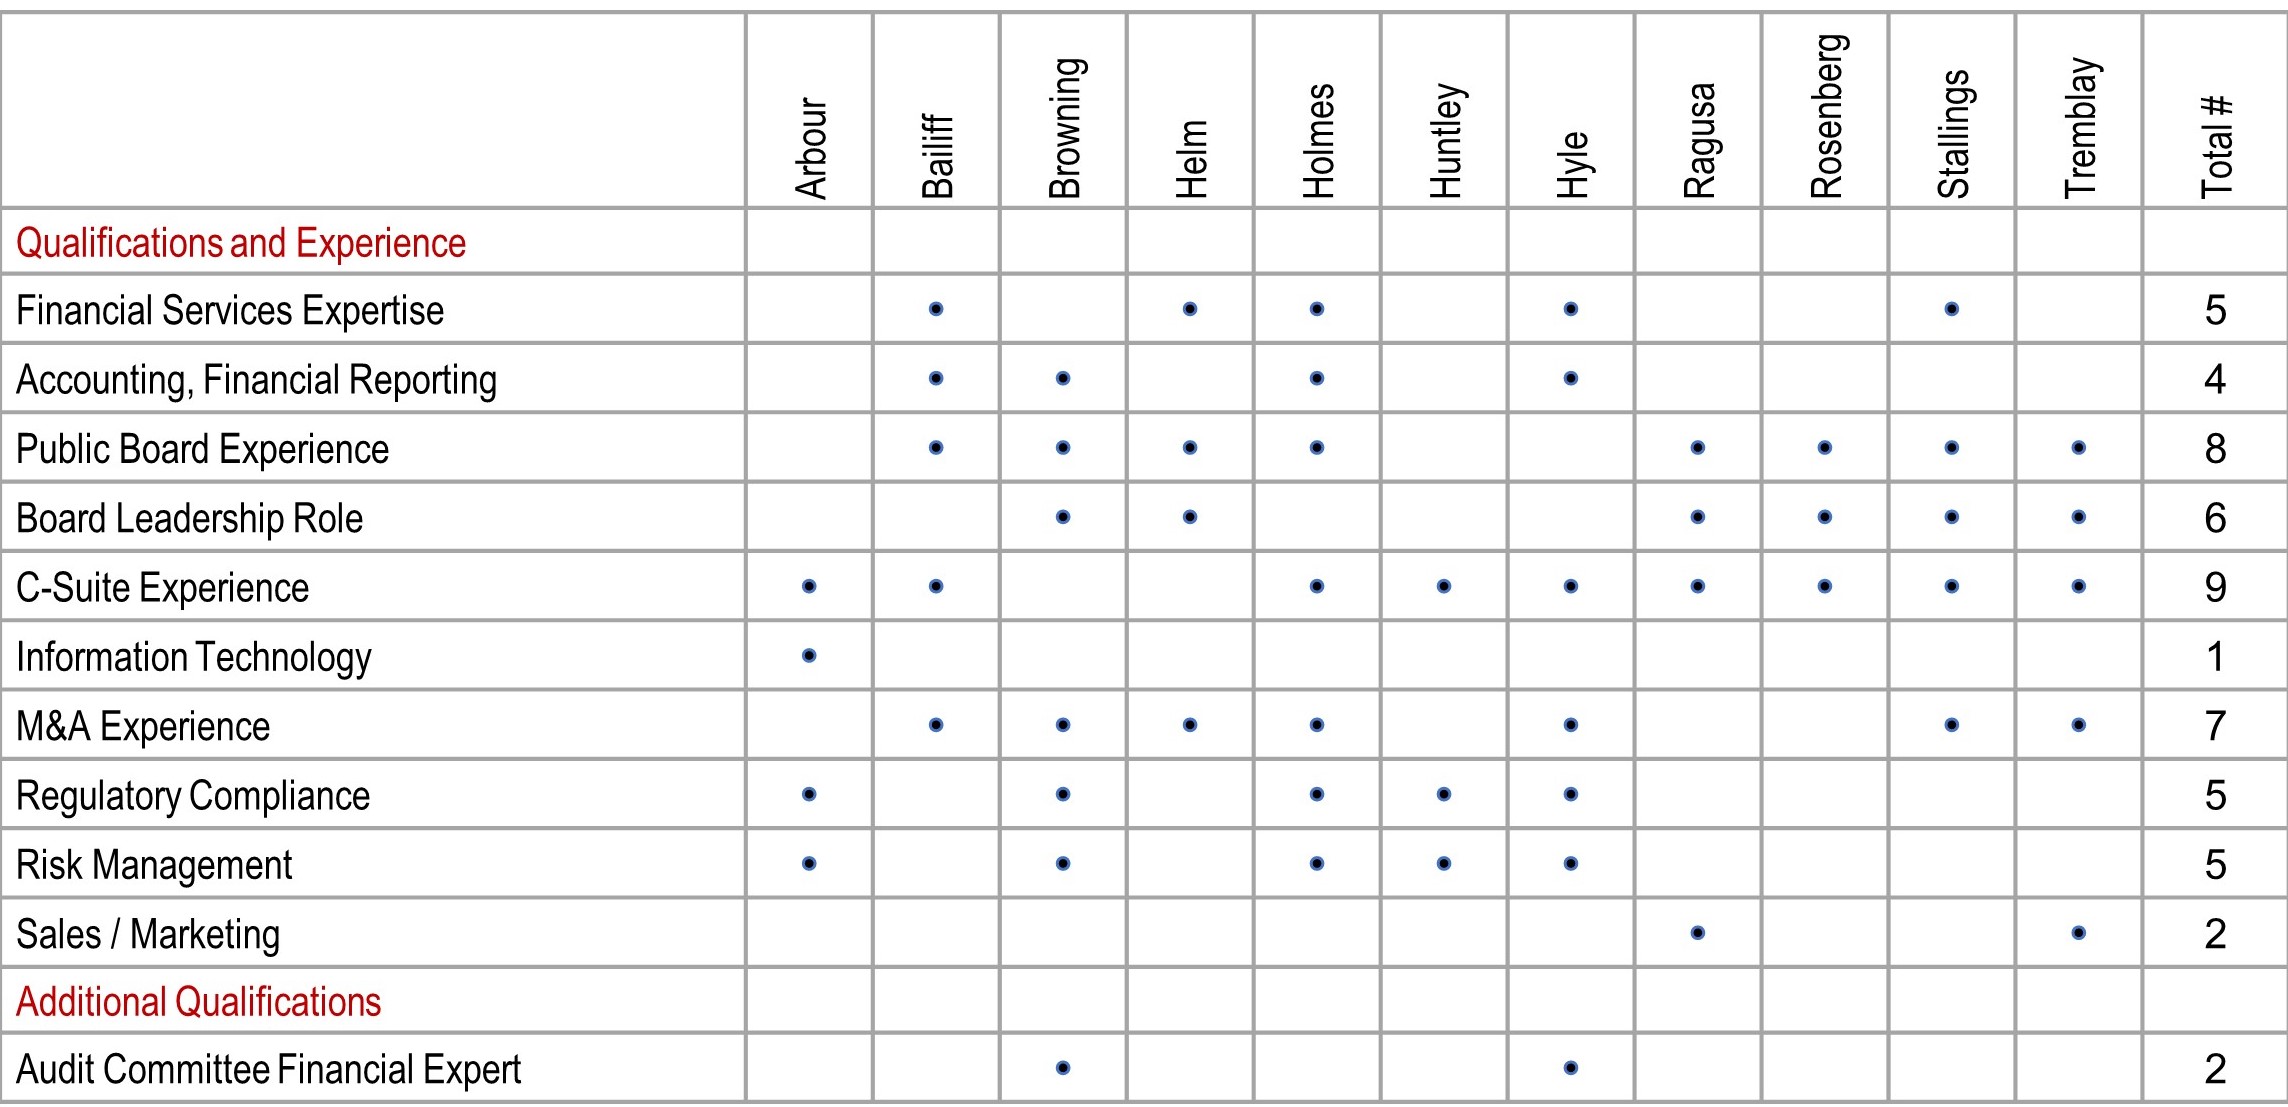
Board Qualifications and Experience Matrix
The following chart reflects the chairmanvarious qualifications and experience of our Risk Committee. Hedirector nominees. Each director also serves as a member of the Audit Committeecontributes other important skills, expertise, experience, viewpoints, and has been designated as a financial expert.
TCBI 2022|Notice of our Human Resources Committee.
| Governance | ||||||||||
Director Nominees
 | Career Highlights | |||||||||||||
▪Executive Vice President and Chief Information Officer, Tenet Healthcare Corporation (since 2018), oversees the leadership and strategic direction for Tenet’s information technology (IT) systems and identifies opportunities to support that company’s expansive care network through the application of digital technology, data analytics, automation and customer experience ▪Prior to joining Tenet, she served in Vice President and President roles at Service Now and ProV International ▪Earlier in her career, Arbour served as vice president of service delivery at Dell Services, where she was responsible for global service delivery and customer experience; and served as Vice President in services across Europe and the United States for EDS | ||||||||||||||
| Paola M. Arbour | Committee Membership(s) ▪Risk | |||||||||||||
| Chief Information Officer,Tenet Healthcare | Specific Qualifications, Experience, Skills and Expertise | Select Professional and Community Contributions | ||||||||||||
| Director since 2021 | ▪More than 35 years of experience leading and transforming IT organizations ▪Executive management experience ▪IT expertise | ▪Advisory board member, Dallas CIO Leadership Association ▪Board member, the Technology Business Management Council ▪Member, Evanta CIO Community for Gartner | ||||||||||||
| Independent | ||||||||||||||
| Age 58 | ||||||||||||||
Other Current Public Directorships ▪None | Public Directorships in the Past Five Years ▪None | |||||||||||||
 | Career Highlights | |||||||||||||
▪Operating Partner, Genesis Park, a private investment company ▪Director (since 2021), Chair Audit Committee, and member Nominating and Corporate Governance Committee, Redwire Corporation (NYSE:RDW) ▪Former President, Chief Financial Officer, and Director, Genesis Park Acquisition Corp. (NYSE:GNPK), a special purpose acquisition company (SPAC) (from 2020 until its merger with Redwire Corporation in 2021) ▪Former CEO/President (2014-2019), and Senior Vice President and Chief Financial Officer (2010-2014), Bristow Group, Inc. (NYSE:VTOL), an industrial aviation solutions provider offering helicopter transportation, and search and rescue and aircraft support services ▪Executive Vice President-Strategy (2008-2010), NRG Energy, leading development and implementation of corporate strategy and M&A ▪Managing Director, Credit Suisse’s Global Energy Group (1997-2008) | ||||||||||||||
| Jonathan E. Baliff | Committee Membership(s) ▪Risk | |||||||||||||
| Operating Partner, Genesis Park | Specific Qualifications, Experience, Skills and Expertise | Select Professional and Community Contributions | ||||||||||||
| Director since 2017 | ▪Extensive financial / leadership experience serving in executive roles with public companies ▪Focus on corporate strategy, coupled with banking experience earlier in his career | ▪U.S. Air Force (1985 until retirement in 1993 with the rank of Captain) ▪Board Member, Alley Theatre ▪Board of Advisors, Georgetown Graduate Schools of Foreign Service | ||||||||||||
| Independent | ||||||||||||||
| Age 58 | ||||||||||||||
Other Current Public Directorships ▪Redwire Corporation | Public Directorships in the Past Five Years ▪Genesis Park Acquisition Corp. | |||||||||||||
TCBI 2022|Notice of Stockholders.Annual Meeting and Proxy Statement 16
| Governance | ||||||||||
 | Career Highlights | |||||||||||||
▪Retired as partner (2009), KPMG LLP, an international accounting firm, after more than 38 years with the firm ▪Served as Chairman of the Board, director and member, Audit Committee, of RigNet Inc., a global technology company providing customized communications services, applications, real-time machine learning and cybersecurity solutions to enhance customer decision-making and business performance (from 2012 until acquired by Viasat Inc. in 2021) ▪Director (since 2016), and Chair, Audit Committee, Herc Holdings, Inc., a NYSE-listed full-service equipment rental company | ||||||||||||||
| James H. Browning | Committee Membership(s) ▪Audit (chair) ▪Governance & Nominating | |||||||||||||
| Former Partner, KPMG | Specific Qualifications, Experience, Skills and Expertise | Select Professional and Community Contributions | ||||||||||||
| Director since 2009 | ▪More than 38 years in public accounting ▪Expertise in financial / accounting / SEC matters ▪Vast experience dealing with public company boards ▪Financial Expert | ▪Member, AICPA ▪Member, NACD | ||||||||||||
| Independent | ||||||||||||||
| Age 72 | ||||||||||||||
Other Current Public Directorships ▪Herc Holdings Inc. | Public Directorships in the Past Five Years ▪RigNet, Inc. | |||||||||||||
 | Career Highlights ▪Chairman of the Board of the Company (since May 2012); served as interim CEO of the Company (May 2020 until Jan. 2021) ▪Former senior advisor, Accelerate Resources, LLC, engaged in the acquisition of non-operated oil and natural gas properties and mineral interests (Aug. 2017 until May 2020) ▪Former head of U.S. Middle Market Banking at Bank One (2001 - 2004) and CEO (1996 - 1998) of Bank One Dallas, N.A. | |||||||||||||
| Larry L. Helm | Committee Membership(s) ▪Risk | |||||||||||||
| Chairman of the Board; Former Chairman and CEO of Bank One Dallas | Specific Qualifications, Experience, Skills and Expertise | Select Professional and Community Contributions | ||||||||||||
| Director since 2006 | ▪Current and former banking executive, with extensive knowledge of our industry ▪Executive management expertise | ▪Immediate Past Chair, Goodwill Industries of Dallas ▪Former Board Member, Dallas Chapter of the American Red Cross, and Dallas Symphony Orchestra, among others | ||||||||||||
| Independent | ||||||||||||||
| Age 74 | ||||||||||||||
Other Current Public Directorships ▪ESGEN Acquisition Corporation | Public Directorships in the Past Five Years ▪None | |||||||||||||
TCBI 2022|Notice of Annual Meeting and Proxy Statement 17
| Governance | ||||||||||
 | Career Highlights | |||||||||||||
▪Chief Executive Officer and President of the Company, member of the board of directors (since Jan. 2021); CEO & President, Texas Capital Bank ▪Former senior executive JPMorgan Chase & Co. and predecessor firms (1989 until 2020), including as Global Head of Corporate Client Banking and Specialized Industries (2011 until 2020), co-head of JPMorgan’s North American Retail Industries Investment Banking practice (2005 - 2011), head of Investment Banking for the southern region of the U.S. (2010 - 2011), and had shared oversight of the Commercial Banking Credit Markets business, which provided Asset Based Lending and other credit solutions (2016 - 2020) | ||||||||||||||
Rob C. Holmes | Committee Membership(s) ▪None | |||||||||||||
| Chief Executive Officer, President and Director | Specific Qualifications, Experience, Skills and Expertise | Select Professional and Community Contributions | ||||||||||||
| Director since 2021 | ▪Extensive knowledge of all aspects of our business ▪More than 30 years of experience and leadership in the banking industry | ▪Advisory Board, University of Texas at Austin McCombs School of Business ▪Board Member, Baylor Health Care System Foundation ▪Member, University of Texas at Austin Development Board ▪Salesmanship Club | ||||||||||||
| Non-Independent | ||||||||||||||
| Age 57 | ||||||||||||||
Other Current Public Directorships ▪Dillard's Inc. | Public Directorships in the Past Five Years ▪None | |||||||||||||
 | Career Highlights | |||||||||||||
▪More than 27-year career with AT&T Inc. and subsidiaries, a global leader in telecommunications, media and technology ▪Senior Executive Vice President & Chief Compliance Officer (since 2014), responsible for developing privacy policies, legal and regulatory compliance, and ensuring adherence to internal compliance requirements, and protecting company assets ▪Former Senior Vice President & Assistant General Counsel, AT&T Services (2012-2014) ▪Former Senior Vice President & General Counsel, AT&T Advertising Solutions and AT&T Interactive (2010-2012) | ||||||||||||||
| David S. Huntley | Committee Membership(s) ▪Audit ▪Compensation & Human Capital | |||||||||||||
| Chief Compliance Officer, AT&T | Specific Qualifications, Experience, Skills and Expertise | Select Professional and Community Contributions | ||||||||||||
| Director since 2018 | ▪Compliance and legal expertise ▪Experience developing and implementing policies to safeguard the privacy of customer and employee information | ▪Director, AT LAST!, the Baylor Health Care System Foundation, the Dallas Citizens Council, and the National Urban League ▪Trustee, Southern Methodist University; Public Trustee, Dallas Medical Resources ▪Executive Committee, Texas Business Hall of Fame | ||||||||||||
| Independent | ||||||||||||||
| Age 63 | ||||||||||||||
Other Current Public Directorships ▪None | Public Directorships in the Past Five Years ▪None | |||||||||||||
TCBI 2022|Notice of Annual Meeting and Proxy Statement 18
| Governance | ||||||||||
 | Career Highlights | |||||||||||||
▪Retired Senior Executive Vice President & Chief Risk Officer, Key Corp. and Key Bank (holding company and regional bank based in Cleveland, Ohio)(from 2004 until his retirement in 2012) ▪Former executive Barclays Capital, working in the U.S. and London (from 1980 - 2003), most recently as Managing Director and Global Head of Credit Portfolio Management - London ▪Former banker, JP Morgan (1972 - 1980) | ||||||||||||||
| Charles S. Hyle | Committee Membership(s) ▪Risk (chair) ▪Audit | |||||||||||||
| Former Chief Risk Officer, Key Corp. | Specific Qualifications, Experience, Skills and Expertise | Select Professional and Community Contributions | ||||||||||||
| Director since 2013 | ▪Broad financial services experience ▪Managing bank credit and operational risk ▪Financial Expert | ▪An active impact investor in several startup social enterprises focused on educational technology through Learn Launch + Accelerator in Boston | ||||||||||||
| Independent | ||||||||||||||
| Age 71 | ||||||||||||||
Other Current Public Directorships ▪None | Public Directorships in the Past Five Years ▪None | |||||||||||||
 | Career Highlights | |||||||||||||
▪Former President / COO, The Staubach Company (2001 - 2008)(merged with Jones Lang LaSalle in 2008) ▪Retired International Director, Jones Lang LaSalle, a commercial real estate services company (2008 - 2017) ▪Former director (2007 - 2018), Lead Director, member, Compensation Committee, and Chair, Nominating and Corporate Governance Committee, Fossil Group, Inc. | ||||||||||||||
| Elysia Holt Ragusa | Committee Membership(s) ▪Governance & Nominating (chair) ▪Compensation & Human Capital | |||||||||||||
| Principal, RCubetti LLC | Specific Qualifications, Experience, Skills and Expertise | Select Professional and Community Contributions | ||||||||||||
| Director since 2010 | ▪C-Suite and Public Company Board Experience ▪Commercial Real Estate Expertise ▪Leadership Training Experience ▪Change Management Expertise | ▪Board of Directors, The Contemporary Austin ▪Advisory Board, University of Texas McCombs School of Business ▪United Way of Dallas Allocation Chair | ||||||||||||
| Independent | ||||||||||||||
| Age 71 | ||||||||||||||
Other Current Public Directorships ▪None | Public Directorships in the Past Five Years ▪Fossil Group, Inc. | |||||||||||||
TCBI 2022|Notice of Annual Meeting and Proxy Statement 19
| Governance | ||||||||||
 | Career Highlights | |||||||||||||
▪President, SPR Ventures, Inc., a private investment company (since 1997) ▪Former President, SPR Packaging LLC, a manufacturer of flexible packaging for the food industry (2007 until his retirement in 2018) ▪Director (since 2008), Chair, Nominating and Corporate Governance Committee, and member, Audit Committee, Cinemark Holdings, Inc., a leader in the motion picture exhibition industry with theatres and screens in the U.S. and Latin America ▪Former director (2007-2014), member Audit, Compensation and Nominating and Governance Committees, PRGX Global, Inc., a supplier of specialized data auditing services | ||||||||||||||
| Steven P. Rosenberg | Committee Membership(s) ▪Compensation & Human Capital | |||||||||||||
| President, SPR Ventures, Inc. | Specific Qualifications, Experience, Skills and Expertise | Select Professional and Community Contributions | ||||||||||||
| Director since 2001 | ▪Corporate leadership, private entrepreneurial investment and public company boards / management ▪Experience in accounting and financial management | ▪Member, Executive Board and Treasurer, Dallas Holocaust and Human Rights Museum ▪Trustee and Past President, AkibaYavneh Academy ▪Treasurer and Endowment Chair, American Friends of Bar Ilan University, Israel ▪Member, National Council, AIPAC | ||||||||||||
| Independent | ||||||||||||||
| Age 63 | ||||||||||||||
Other Current Public Directorships ▪Cinemark Holdings, Inc. | Public Directorships in the Past Five Years ▪None | |||||||||||||
 | Career Highlights | |||||||||||||
▪Chairman of the board of directors and CEO of Stallings Capital Group, Inc., an investment company (since March 2001) ▪Retired Executive Chairman of the Board of GAINSCO, Inc., a property and casualty insurance company (August 2001 - April 2021, when GAINSCO was acquired by State Farm) ▪Former CEO of an asset management company as well as a savings bank ▪Former director of Crescent Real Estate Equities Company and the Federal Home Loan Bank of Dallas | ||||||||||||||
| Robert W. Stallings | Committee Membership(s) ▪Governance & Nominating ▪Risk | |||||||||||||
| President & CEO, Stallings Capital Group, Inc. | Specific Qualifications, Experience, Skills and Expertise | Select Professional and Community Contributions | ||||||||||||
| Director since 2001 | ▪Banking, financial services and insurance expertise ▪Private entrepreneurial investment ▪Public Company Board Experience | ▪Chairman & Founder, The Stallings Foundation | ||||||||||||
| Independent | ||||||||||||||
| Age 72 | ||||||||||||||
Other Current Public Directorships ▪None | Public Directorships in the Past Five Years ▪None | |||||||||||||
TCBI 2022|Notice of Annual Meeting and Proxy Statement 20
| Governance | ||||||||||
 | Career Highlights | |||||||||||||
▪Executive Chairman (former President / CEO, since 2001), C.H. Guenther & Son LLC (dba Pioneer Flour Mills; a food manufacturer of high-quality products; one of the oldest privately held companies in the U.S.) ▪Prior to joining C.H. Guenther, senior officer, The Quaker Oats Company, responsible for all Worldwide Food Service Businesses ▪Former director (2005-2019), member, Audit Committee, and Chair, Compensation Committee, Clear Channel Outdoor Holdings, Inc., a large, public advertising company ▪Director, Nature Sweet Ltd., a privately-owned agricultural and distribution company; director, Monogram Foods, a privately-owned major co-packer and private label provider for strategic partners throughout the nation | ||||||||||||||
| Dale W. Tremblay | Committee Membership(s) ▪Compensation & Human Capital (chair) | |||||||||||||
| Executive Chairman, C.H. Guenther & Son LLC | Specific Qualifications, Experience, Skills and Expertise | Select Professional and Community Contributions | ||||||||||||
| Director since 2011 | ▪Public / private company management leadership ▪M&A and private equity experience ▪Sales & marketing experience ▪Public Company Board Experience | ▪Director, Haven for Hope ▪Director, San Antonio Opera ▪Former Founding Board Member, Texas Can Academy - San Antonio ▪Federal Reserve Bank of Dallas - former Consumer Advisory Committee Member ▪Former Finance Advisory Board Member, Michigan State University | ||||||||||||
| Independent | ||||||||||||||
| Age 63 | ||||||||||||||
Other Current Public Directorships ▪None | Public Directorships in the Past Five Years ▪Clear Channel Outdoor Holdings, Inc. | |||||||||||||
TCBI 2022|Notice of Annual Meeting and Proxy Statement 21
| Governance | ||||||||||
Board Diversity
We believe it is important that our executive compensation programs effectively align the interests of our named executive officers, or NEOs, with those of our stockholders by creating a combination of incentive compensation arrangements, in both cash and equity-based programs, which are directly tied to performance and creation of stockholder value, coupled with a competitive level of base compensation. Our objective is that the NEOs should have a substantial portion of total compensation derived from performance-based incentives. At our 2019 Annual Meeting of Stockholders, we received the affirmative support of 98% of votes cast in favor of our 2018 executive compensation.
| Board Diversity Matrix (As of February 23, 2022) | ||||||||||||||
| Board Size: | ||||||||||||||
| Total Number of Directors | 11 | |||||||||||||
| Did Not Disclose Gender | ||||||||||||||
| Female | Male | Non-Binary | ||||||||||||
| Part I: Gender Identity | ||||||||||||||
Directors1 | 2 | 9 | – | – | ||||||||||
Part II: Demographic Background2 | ||||||||||||||
| African American or Black | – | 1 | – | – | ||||||||||
| Alaskan Native or Native American | 1 | – | – | – | ||||||||||
| Asian | – | – | – | – | ||||||||||
| Hispanic or Latinx | – | – | – | – | ||||||||||
| Native Hawaiian or Pacific Islander | – | – | – | – | ||||||||||
| White | – | – | – | – | ||||||||||
| Two or More Races or Ethnicities | – | – | – | – | ||||||||||
| LGBTQ+ | – | |||||||||||||
| Demographic Background Undisclosed | – | |||||||||||||
1 Number of directors based on gender identity. | ||||||||||||||
2 Number of directors who identify in any of these categories. | ||||||||||||||
The boardGovernance Committee considers diversity in a broad sense, including diversity of directors believes that stockholders should have the ability to call special meetings of stockholdersviewpoints, background, work experience and other demographics, such as a matter of good corporate governance. However, there are significant costs associated with convening special meetings, including the preparation, printingrace, age, gender identity, ethnicity, nationality, disability, sexual orientation and distribution of disclosure documents, soliciting proxies, holding the meeting and tabulating votes. Organizing and preparing for a special meeting requires significant management attention, diverting their focus from managing the Company’s day-to-day business operations. The board of directors believes that a small minority of stockholders should not be able to call a special meeting for their own interests, which may not be widely shared by the Company’s other stockholders. Requiring a reasonably high percentage of stock ownership to support the calling of a special meeting balances the interests of all stockholders with the associated significant disruption and costs.
BOARD AND COMMITTEE MATTERS
Board of Directors
The board of directors oversees the business affairs of the Company are managed under the direction of the board of directors.Company. The board of directors meets on a regularly scheduled basis to review significant developments affecting the Company and to act on matters requiring approval by the board of directors. Special meetings of the board of directors are held as required from time to time when important matters arise that require action between scheduled meetings. The board of directors held sixfive regularly scheduled meetings and three special meetings during 2019.2021. Each of the Company’s directors participated in at least 75% of the meetings of the board of directors and the committees of the board of directors on which the director served during 2019.2021.
| Governance | ||||||||||
Board Leadership Structure
The Board’s leadership structure is designed to promote Board effectiveness and to appropriately allocate authority and responsibility between the Board and management. The Board believes it is important to retain flexibility to determine its leadership structure based on the particular composition of the Board, the individuals serving in leadership positions, the needs and opportunities of the Company as they change over time. Currently, the CEO and chairman positions are separated under the Company’s board leadership structure. Larry L. Helm acts as the non-executive Chair, and Rob C. Holmes serves as the CEO. The members of the Company’s board of directors also serve as directors of the Bank to provide effective oversight of the Bank.
A significant portion of our Board’s oversight responsibilities is carried out through its four independent, principal standing committees: Audit Committee, Risk Committee, Governance and Nominating Committee, and Compensation and Human Capital Committee. Allocating responsibilities among committees allows more in-depth attention devoted to the Board’s oversight of the business and affairs of the Company. See “Risk Oversight” below for more information. Committees meet regularly in conjunction with scheduled Board meetings and hold additional meetings as needed. Each committee reviews reports from senior management and reports its actions to, and discusses its recommendations with the full Board.
All committee chairs are appointed at least annually by our Board. Committee chairs are responsible for:
•Calling meetings of their committees
•Approving agendas for their committee meetings
•Presiding at meetings of their committees
•Serving as a liaison between committee members and the Board, and between committee members and senior management, including the CEO
•Working directly with the senior management responsible for committee mandates
Board members have direct access to management and regularly receive information from and engage with management during and outside of formal Board meetings. In addition, the Board and each committee has the authority and resources to seek legal or other expert advice from sources independent of management.
Board and Corporate Governance: Strong Governance Practices
The board of directors is committed to providing sound governance for the Company. The board of directors has adopted Corporate Governance Guidelines (the “Guidelines”) and charters for each committee of the board of directors to provide a flexible framework of policies relating to the governance of the Company. These documents are available in the “Governance Documents” section of the Company’s website at: http:at https://investors.texascapitalbank.com/govdocsgovernance-responsibility/governance-documents/default.aspx.
Our sound governance practices include: | ||
•Annual election of all directors | ||
•Majority voting for directors in uncontested elections | ||
•Independent Chair | ||
•All directors are independent, other than CEO; 100% principle standing committee member independence | ||
•Director retirement policy | ||
•Director capacity, commitment and over boarding policy | ||
•Directors may be removed with or without cause | ||
•Action by written consent / stockholder right to call special meeting permitted | ||
•Executive sessions of independent directors at each regular Board meeting | ||
•Annual Board and Committee evaluations | ||
TCBI 2022.|Notice of Annual Meeting and Proxy Statement 23
| Governance | ||||||||||
•Strong investor outreach program, including participation by our Chair and other Directors | ||
•Robust stock ownership guidelines for directors and executives | ||
•Prohibition on hedging and pledging | ||
•Comprehensive recoupment policy | ||
•Ongoing director education | ||
•Ongoing consideration of Board composition and refreshment, including diversity in director succession | ||
•Strong director attendance: each director attended 75% or more of total meetings of the Board and committees on which he or she served during 2021 | ||
•Board oversight of corporate responsibility and ESG matters | ||
•Board and Compensation Committee oversight of human capital management matters | ||
•Direct Board access to management and access to independent advisors | ||
•No poison pill | ||
Among the policies addressed in the Guidelines are the following:
Retirement policy. A director who reaches the age of 75 at or before the time of his or her re-electionelection will not be eligible for election to the board of directors, subject to waiver of this requirement on an annual basis by unanimous vote of
the remaining members of the board.
Limits on other board service. No director may serve on more than four public company boards (including the Company’s board of directors)., but the Chair may only serve on a maximum of two other public company boards. The Company's CEO and any other management director may serve on no more thanonly one other public company board, and the chairman of the board may serve on no more than two other public company boards (one if serving as chairman).board.
Review of significant responsibility changes. Any director who retires from his or her principal employment, or who materially changes the responsibilities of his or her principal employment, must tender a letter of resignation to the board of directors. The board of directors will determine whether to accept the resignation based on the recommendation of the Governance and Nominating Committee after its review of the circumstances.
•Director compensation. Director compensation includes a substantial equity component representing approximately half of each director’sdirector's annual compensation in order to align director interests with the long-term interests of stockholders. See “Director Compensation”.
•Director stock ownership. The board of directors has established stock ownership guidelines for directors in order to further align their interests with the long-term interests of stockholders. Directors are expected to own common stock having a value of at least threefour times the cash portion of the annual retainer paid to outside directors, and may not dispose of any shares of the Company’s common stock unless they own, and will continue to own, common stock with a value at or above that level.
•Executive pay governance and stock ownership.As discussed in more detail below at “Executive Compensation – Compensation Discussion and Analysis”, the Guidelines include policies addressing:
◦Executive stock ownership;
◦No “single trigger” payment or acceleration of benefits upon a change in control; and
| Governance | ||||||||||
Risk Oversight
Our board of directors is responsible for oversight of management and the business and affairs ifof the Company, including the management of risk. The board of directors oversees an enterprise-wide approach to risk management, intended to support the achievement of strategic objectives to optimize our organizational performance and enhance stockholder value while operating within the guidelines of our risk appetite statement. While the board of directors has the ultimate oversight responsibility for the risk management process, the board hasBoard authorized various committees to provide primary oversight of the Company’s enterprise risk management program.
In addition, management has established an Executive Risk Committee (“ERC”) comprised of executives responsible for all major categories of risk to provide management oversight and guidance related to the Company’s enterprise risk management, including the CEO the CFO, and the Chief Lending Officer.CFO. The ERC updates the Company'sCompany’s risk appetite statement and enterprise risk management policy on an annual basis and establishes various risk tolerances focused on quantitative and qualitative key risk indicators, which are ultimately approved by the board of directors.
The following graph shows the allocation of key risk topics to the various Board committees.
| Board of Directors | |||||||||||||||||||||||||||||
•Oversight of risk in ESG matters | |||||||||||||||||||||||||||||
| Risk Committee | Audit Committee | ||||||||||||||||||||||||||||
•Oversight of the Company’s management of credit, liquidity, strategic, market, operational (including information technology and cybersecurity), compliance, financial, and capital adequacy ("enterprise") risks •Annual review and approval of the Company’s risk management framework and review and recommendation to the board of directors of the Company’s risk appetite statement •Oversees the activities of the ERC, which is chaired by the Company’s Chief Risk Officer, who has a direct reporting relationship to the Risk Committee •Oversight of supervisory issues and enforcement actions and remediation efforts •Confirm that the Company's lending activities are withing the context of the Company's risk framework •Communicate with the other Board committees to assure the integrated oversight of the full range of enterprise risks | •Oversight of major financial risk exposures •Monitors the Company’s financial reporting risk, including the allowance for credit losses, and regulatory compliance risk •Review significant risk trends identified by internal audit | ||||||||||||||||||||||||||||
| Compensation and Human Capital Committee | |||||||||||||||||||||||||||||
•Review and oversight of compensation plan risk assessments •Oversight of risk related to human capital management, including talent management, executive succession planning and DEI | |||||||||||||||||||||||||||||
| Governance and Nominating Committee | |||||||||||||||||||||||||||||
•Oversight of risks related to corporate governance practice and procedure | |||||||||||||||||||||||||||||
TCBI 2022|Notice of Annual Meeting and Proxy Statement 25
| Governance | ||||||||||
Environmental, Social and Governance (ESG) Highlights
Overview
Our vision is, charged“To be the flagship financial services firm in Texas serving the best clients in our markets.” In order to make that happen, we need to ensure we have the appropriate level of focus in the management of our environment, social and governance (“ESG”) practices. We take a comprehensive approach to corporate social responsibility that includes investing in our communities, creating a culture of strong corporate governance, and continuing our focus on sustainable business practices. We believe that this approach enables us to more effectively serve our stockholders, clients, communities, and colleagues.
While our ESG programs continue to evolve, we are currently focusing on creating value through the following prioritized areas: governance, sustainable finance, diversity, equity and inclusion (“DEI”), engaging and empowering employees, our philanthropy, employee giving and volunteerism, and investment in affordable housing. We continue to improve and deepen our ESG initiatives by assessing our practices against industry best practices, incorporating stakeholder feedback and actively participating in and advocating for the causes that matter most to our various stakeholders.
We launched the ESG Council in 2021, lead by our Chief Legal Officer, which is responsible for oversight and proactively advancing our ESG efforts, including involvement of key internal executives and integration with oversightthe Bank’s strategy.
| Stockholders | |||||||||||||||||||||||
| Board of Director and Committee Oversight | |||||||||||||||||||||||
| é | é | é | é | ||||||||||||||||||||
| ESG Leadership Council | |||||||||||||||||||||||
1 Operating Committee-Level Leadership Integrating with Strategy 2 Subject Matter Experts from Across the Company to Drive Execution 3 Monthly Meeting Cadence to Maintain Momentum 4 Education and Baselining to Move Efficiently 5 Organized Sub-Teams to Coordinate Activities | |||||||||||||||||||||||
| Clear and Effective Communication to Both Internal and External Stakeholders | |||||||||||||||||||||||
Areas of 2021 Focus
The devastating effects of the Company’s managementCOVID-19 pandemic and failures to address systemic inequality in our society have highlighted the importance of credit, liquidity, strategic, market, operational (which includes information technologysharpening our focus on how our business impacts individuals, groups and cybersecurity), compliance, financial,communities around the world. As further described below, our key ESG accomplishments in 2021 included:
•Heightened focus on supporting our employees, clients and capital adequacy risk,communities through the COVID-19 pandemic, including the annual reviewby expanding employee benefits, implementing payment deferral and approvalother programs to assist our clients and providing support to local, regional and global COVID-19 relief efforts;
•Expanded efforts to advance our DEI initiatives, including
TCBI 2022|Notice of the Company's risk management frameworkAnnual Meeting and review and recommendation to the board of directors of the Company's risk appetite statement. The Risk Committee oversees the activities of the ERC, which is chaired by the Company's Chief Risk Officer ("CRO"), who has a direct reporting relationship to the Risk Committee. The Audit Committee assists the board of directors in monitoring the Company’sProxy Statement 26
| Governance | ||||||||||
◦hiring a VP of Diversity, Equity and Inclusion;
◦forming two employee resource groups (“ERGs”); and
◦purposeful DEI university hiring efforts;
•Incorporated environment, social and governance considerations into a Bank policy statement;
•Greater transparency through increased ESG reporting and disclosures; and
•Initiation of work to evaluate and address our climate risks and opportunities.
"As President and CEO, it is important to me that the company live up to its stated values. As we look forward, we are eager to accelerate our advancements in diversity, equity and inclusion efforts as well as environmental, social and corporate governance areas." ROB C. HOLMES | ||||||||
ESG Governance and Reporting
Our ESG program is under the Company’sprimary oversight of our Board, with our Compensation Committee focusing on human capital management (including talent management, executive succession planning, DEI and culture). We review and discuss our strategy, goals, practices and performance with the Board, which also receives management updates on our progress, ratings, disclosures and stakeholder engagement. At the executive management level, our ESG program is led by our Chief Legal Officer, in collaboration with the Company's ESG Council established in 2021, which ensures appropriate alignment and involvement from the Chief Executive Officer, other executive leaders and cross-functional management. In 2021, we published our Corporate Social Responsibility Report, which can be found at https://www.texascapitalbank.com/who-we-are/our-company/community-impact. This report includes details on many of our ESG initiatives and accomplishments. We will continue to enhance and evolve our disclosures, taking into consideration industry practices and stakeholder expectations.
| Environmental | ||||||||||||||
| ||||||||||||||
| We are focused on operating our business in a sustainable manner, as we believe it better serves our communities and also has a positive effect on operating expenses. | ||||||||||||||
• Operational Environmental Impact. Our corporate headquarters is located in a leased building that has been designated as a U.S. Green Building Council Leaders in Energy and Environmental Design (LEED) Gold level building. Additionally, our branch-light operating philosophy allows us to avoid the impact on the environment of operating a large number of facilities. |  | |||||||||||||
• Sustainable Finance. Our lending agreements require that energy industry and real estate construction clients comply with all applicable federal, state and local environmental regulatory requirements. The Company is proud to support clients who excel in sustainable business practices, including the following:
◦An energy client that provides a clean burning alternative to diesel and gasoline for municipalities and private transportation fleets.
◦A client that creates products from recycled plastic, agricultural waste and natural resources, while aiding in the fight against deforestation in the United States.
During 2021 the Bank incorporated Environment, Social and Governance considerations into a policy statement. The statement sets forth expectations that as part of the Bank's “know your customer” program
TCBI 2022|Notice of Annual Meeting and Proxy Statement 27
| Governance | ||||||||||
and due diligence efforts it will consider potential environmental, social or governance risk factors, including those related to the Bank's Enhanced Due Diligence industry list.
| Social and Human Capital Management | ||||||||||||||
| ||||||||||||||
| The health, safety and well-being of our employees and customers is of paramount importance. This includes financial and other support, encouragement of a culture of diversity, equity, and inclusion, through training and development, and both personal and financial involvement in the community. | ||||||||||||||
 | • Health & Safety / COVID-19 Response. Our policy is to provide a safe and healthy workplace. In 2021, we continued our response to the global COVID-19 pandemic by supporting our employees, clients and communities in a variety of ways. | |||||||
◦We focused on providing employee support to address work, life, financial and health-related issues. This included programs and benefits to ease work-from-home challenges and address the medical and other support needs of those directly impacted by COVID-19. Examples include mental health support, technology, equipment and a commitment to retain our incentive plans encourage participantscompensation packages.
◦We took significant measures to provide employees with a sense of safety, security, and certainty in response to the COVID-19 pandemic. To protect the health and safety of employees and customers, we established social distancing and hygiene and environmental safety protocols for on-site workers at our banking centers and offices. We also provided free COVID-19 testing for employees enrolled in our medical coverage. In addition, we developed tracking and reporting solutions to monitor employee circumstances related to the COVID-19 pandemic.
◦We enhanced our performance management process, and implemented a more defined process for succession planning deeper into the organization. We also enhanced parental bonding leave benefits.
◦We facilitated $206 million in Small Business Administration loans via the second round of the Paycheck Protection Program.
◦Under our Live, Learn, Lift philanthropic giving program, we donated more than $2 million to non-profit causes, many providing COVID-19 assistance.
• Diversity, Equity and Inclusion (“DEI”). We work to promote a culture of diversity, equity, and inclusion across everything we do, from how we serve our clients and develop products and services, to the ways we help communities and support our employees. As part of these efforts, we strive to build diverse and inclusive teams that will continue to attract and retain top talent. |  | |||||||||||||
When we launched our Diversity, Equity and Inclusion Council in 2020, it was to accelerate diversity, equity and inclusion efforts and outcomes. The Council exists as part of our commitment to address diversity, equity and inclusion, both within our company and in our communities. The DEI Council is Co-Chaired by our CEO and our CHRO, and is made up of colleagues from departments across our organization, and aims to steer our diversity and inclusion strategies. The Council is working to develop DEI goals and metrics that will be ingrained in our business strategy. Through routine strategy sessions and planning, the DEI Council continues to explore the evolution of diversity, equity and inclusion at the Company.
Our DEI program is led by our new VP of Diversity, Equity and Inclusion. We take risksa multi-pronged approach to creating a diverse and inclusive workplace that would be reasonably likelyincludes employee awareness programs and resource groups, training and educational opportunities, leadership development, mentoring and hiring outreach programs. We are continually investing in our workforce to have a material adverse impact on the Company,further emphasize diversity and inclusion and to foster our employees’ growth and career development.
TCBI 2022|Notice of Annual Meeting and Proxy Statement 28
| Governance | ||||||||||
DEI is important in all that we do and it starts with our recruiting efforts. In 2021, 40% of new hires were women and 42% were members of racial minority groups. In 2021, we adopted a marketing plan under which we will have more presence on social media highlighting our transformational work, insights into our culture and more awareness of the Company as a whole. To date, the plan has resulting in six times the number of viewers when compared to the prior social media presence for Texas Capital Bank. | “By fostering an inclusive, respectful and diverse workplace where all voices are heard and valued, together we will strengthen our position as a leading regional bank. As we look ahead, we understand the significant opportunity we have to further advance our DEI efforts.” ROB C. HOLMES, CEO & President | |||||||||||||
In 2021, two new employee resource groups (ERGs) were officially created: Women of Texas Capital Bank ERG and Veterans and Employees Together (VET) ERG. Both have been very active in engaging colleagues in a variety of activities and events, from Breast Cancer Awareness Month to Veteran’s Day observances, and town hall events with topics such as “Why Mentoring is Important” fireside chat. Additionally, three new ERGs officially launched in January 2022. Their unique missions are as follows:
◦Emerging Professionals Employee Resource Group – whose mission is to support the extent necessary, reviewsgrowth of emerging professionals by creating opportunities for these leaders to build meaningful relationships with our teams across all markets and discussesage groups. We aim to provide members with management any related risk mitigation features determinednetworking and community service events, career development activities, and have them engage with leaders at all levels across the firm.
◦Multiethnic Employee Resource Group (MERG) – whose mission is to be advisable.
◦Professionals Respecting Others' Unique Differences (PROUD) Employee Resource Group – whose mission is to cultivate an inclusive environment that supports and encourages LGBTQ+ and allies to advance their professional skills and leadership abilities through mentorship, dialogue, and bringing your authentic self to work. Our members are committed to empowering others in the community by sharing challenges and experiences and making meaningful connections.
We adopted a Human Rights Policy that, among other things, addresses the protection of women's and minority groups' rights, and it applies to our suppliers and partners, too. As of December 31, 2021, we had approximately 1,750 employees, nearly all of whom are full-time. Approximately 50% are female and approximately 40% are members of racial minority groups.
• Training and Development. We support and develop our employees through a variety of training and development programs that build and strengthen employees’ leadership and professional skills, including career development plans, in-house learning opportunities and an early career development program. |  | |||||||||||||
As part of our training and development program, during 2021, we:
◦Created and launched training targeted for people managers.
◦Packaged current online training courses to align with career paths.
◦Launched an analyst program that includes several weeks of training in preparation to move into frontline banking positions.
◦Created technical training focused on bank employees.
TCBI 2022|Notice of Annual Meeting and Proxy Statement 29
| Governance | ||||||||||
• Involvement in the Community / Affordable Housing. We established ourselves as a leader in the community by making strategic financial investments in community endeavors and by promoting a strong corporate culture of volunteerism. We serve our communities under three pillars: ◦Live (basic needs to support quality of life); ◦Learn (educational opportunities for lifetime success); and ◦Lift (supportive services for individuals, small businesses and veterans). |  | |||||||||||||
During 2021, we continued providing relief in response to the COVID-19 pandemic and made significant investments in non-profits and small businesses to ensure their continued survival and success.
Throughout 2021 we were able to provide a wide range of support to our communities, including Total Impact Lending of $4.3 billion, exclusively within our market assessment area of Texas and exclusively serving low- and moderate-income (“LMI”) / underserved communities and small businesses that fit the SBA definition of $1MM or less in annual revenues or loans less than $1MM to a business, comprised of:
◦$342 million in community lending, which includes loans in underserved communities or loans that benefit LMI individuals, including loans for affordable housing; loans to community service providers (e.g., medical facilities that serve indigent, uninsured); loans to businesses that create jobs in LMI areas; and loans for rebuilding and revitalizing these areas. These loans helped to create 477 single-family and 535 multi-family affordable housing units, medical facilities, 127 beds at homeless shelters and 1,014 permanent jobs in the communities that we serve.
◦$2.4 billion in the form of loans to 60,240 small businesses.
◦$119 million for homebuilders’ lines of credit / loans to build 477 single-family homes under $300,000 in low- and moderate-income communities.
◦$1.5 billion for home mortgages, including 1,195 mortgages in low- and moderate-income communities.
We also had Impact Investing during 2021 of $51 million. Texas Capital Community Development Corporation, a wholly-owned subsidiary of the Bank, made investments in ordervarious Community Reinvestment Act-qualified funds that provide equity and subordinated debt capital into small and growing businesses. These investments funds are Small Business Investment Corporations (SBIC); Community Development Corporations (CDFI); and real estate funds that invest in preserving affordable multi-family housing.
During 2021 we also made more than $2 million in various philanthropic investments. In addition, we and our employees helped restock food bank shelves, purchased holiday gifts for children in need and supported our front-line heroes.
Additional impactful activities included:
◦Our employees spent over 7,600 hours volunteering in Company-sponsored projects, teaching financial literacy and skills-based volunteering. Impact Teams are committees in each of our offices that coordinate volunteer projects to provide effective oversightserve their local community. These teams are completely voluntary and serve as the hands and feet of our volunteer program.
◦Our Mobile Banking Center was deployed for most of the Bank.
◦Maintenance of a virtual financial literacy curriculum to ensure that there is no disruption to the financial literacy programming we provide through our Mobile Banking Center or with partner non-profit agencies.
Our 2021 annual Corporate Social Responsibility Report highlights our commitment to underserved communities.
TCBI 2022|Notice of Annual Meeting and Proxy Statement 30
| Governance | ||||||||||
• Political Activities. Our corporate responsibility includes participation from time to time in the political and public policy process, specifically in areas that impact the banking industry, as well as our clients, stockholders, employees and communities. It is important that we engage with legislators and policymakers, where appropriate, and support initiatives to advocate constructively for the long-term interests of our business and our key constituents. Our political activities are subject to the oversight of our Governance Committee, which recognizes the importance of appropriate governance and risk management of our corporate political activities, and reviews our activities for alignment with our business, strategy and corporate values, as well as compliance with applicable laws and regulations. Political contributions are made primarily through a federal political action committee that is non-partisan and employee funded. Political contributions utilizing corporate funds are limited and subject to restrictions and disclosure pursuant to our policies.
| Governance | ||||||||||||||
| ||||||||||||||
• Corporate Governance. Strong corporate governance practices support our overall effectiveness and enable us to manage our business and maintain our integrity in the marketplace. We believe strong governance is essential and constructive at all levels, from the board of directors to executive management and throughout our Company. For more information about our governance practices, see “Board and Corporate Governance: Strong Governance Practices” and “Compensation Governance Best Practices”. During 2021 we met with stockholders to communicate our progress on ESG matters and to better understand how ESG fits into their investment analysis and decision making. See “Stockholder Engagement” below. | ||||||||||||||
The above summary reflects selected highlights of our various ESG efforts and is not an exhaustive list.
Stockholder Engagement
Our Board and management team greatly value the perspectives and feedback of our stockholders, which is why we have proactive, ongoing engagement with our stockholders throughout the year. Our Chairman, the Compensation and Human Capital Committee Chair, and executive management significantly expanded our engagement efforts in 2021, meeting with several of our investors to discuss our new strategic plan, changes in the senior management team and other topics outlined below. In addition, our Chief Executive Officer, our Chief Financial Officer and our Investors Relations team maintain ongoing dialogue among our stockholders on the Company's financial and strategic performance.
| We contacted | Representing over | ||||
| 19 of our Top 25 | 69% | ||||
| Stockholders | of our outstanding common stock | ||||
| We held in-person and telephonic meetings with | Representing approximately | ||||
| 10 | 31% | ||||
| Stockholders | of our outstanding common stock | ||||
Feedback from this year's investor meetings was positive with many investors expressing appreciation for the Company's strategy and new executive team. Topics covered during our discussions with investors included:
•board composition, including diversity and skills;
•board oversight of risk;
•our executive compensation program and philosophy; and
•corporate responsibility, including human capital management.
TCBI 2022|Notice of Annual Meeting and Proxy Statement 31
| Governance | ||||||||||
Several stockholders also expressed a preference for enhanced disclosure of Board member expertise and diversity. A summary of the Companyfeedback we received was discussed and the Bank since 2009 and as chair of the Audit Committee and as a member of the Governance and Nominating Committee since 2012, while also serving as an independent director, chairman of the board and committee chair for other public companies. In his role as lead director, Mr. Browning’s duties include, but are not limited to, the following:
•increased disclosure of ESG and human capital matters;
•more clarity on the independent directors;
•added director skills and diversity matrices.
TCBI 2022|Notice of such information;Annual Meeting and Proxy Statement 32
Committees of the Board of Directors and Meeting Attendance
The board of directors hadhas four standing committees:
•Audit Committee
•Governance and Nominating Committee
•Compensation and Human Capital Committee
•Risk Committee
The following table sets forth the current composition of our committees as of the date of this Proxy Statement and the number of meetings of each committee during 2019. 2021.
| Independent Director | Audit Committee | Governance and Nominating Committee | Compensation and Human Capital Committee | Risk Committee | |||||||||||||
| Paola M. Arbour | ü | = | |||||||||||||||
| Jonathan E. Baliff | ü | = | |||||||||||||||
James H. Browning À | ü | £ | = | ||||||||||||||
Larry L. Helm ◊ | ü | = | |||||||||||||||
| Rob C. Holmes | |||||||||||||||||
| David S. Huntley | ü | = | = | ||||||||||||||
Charles S. Hyle À | ü | = | £ | ||||||||||||||
| Elysia Holt Ragusa | ü | £ | = | ||||||||||||||
| Steven P. Rosenberg | ü | = | |||||||||||||||
| Robert W. Stallings | ü | = | = | ||||||||||||||
| Dale W. Tremblay | ü | £ | |||||||||||||||
| Meetings in 2021 | Board = 5 | 6 | 9 | 6 | 4 | ||||||||||||
◊ Chair of the Board £ Committee Chair = Committee Member À Financial Expert | |||||||||||||||||
A general description of the functions performed by each committee and committee membership as of the date of this Proxy Statement is set forth below.
” above beginning on page 25.
Audit Committee. The Audit Committee oversees the Company’s and the Bank’s processes related to financial and regulatory reporting, internal control, and regulatory and legal compliance. The Audit Committee also oversees the Company’s internal control over financial reporting, management’s preparation of the financial statements of the Company, the Company’s methodology for establishing the allowance for credit losses and the sufficiency of quarterly provisions for credit losses, and reviews and assesses the independence and qualifications of the Company’s independent registered public accounting firm. The board of directors has adopted a written charter for the Audit Committee, which is available on the Company’s website at https://investors.texascapitalbank.com/govdocs.governance-responsibility/governance-documents/default.aspx. The Audit Committee appoints the firm selected to be the Company’s independent registered public accounting firm and monitors the performance of such firm, reviews and approves the scope of the annual audit and quarterly reviews and reviews with
TCBI 2022|Notice of Annual Meeting and Proxy Statement 33
| Governance | ||||||||||
the independent registered public accounting firm the Company’s annual audit and annual consolidated financial statements. The Audit Committee also oversees the Company’s internal audit staff, which includes reviewing with management the status of internal accounting controls, and evaluates areas having a potential financial or regulatory impact on the Company that may be brought to the Audit Committee’s attention by management, the independent registered public accounting firm, the board of directors or by employees or other sources, including the Company’s confidential “hotline” maintained to allow employees to make confidential reports of matters requiring attention. The Audit Committee members are James H. Browning (chair), David S. Huntley, Charles S. Hyle and Patricia A. Watson. Ms. Watson is not standing for re-election at the Annual Meeting. The Audit Committee met five times during 2019.
The board of directors has determined that all of the Audit Committee’s members are able to read and understand fundamental financial statements and are independent of management as contemplated by the current listing standards of the Nasdaq Stock Market.Market and SEC regulations. The board of directors also determined that two members, Messrs. Browning and Hyle, qualify as “audit committee financial experts” as defined by the SEC and also satisfy the Nasdaq Stock Market’s financial sophistication requirements.
•Governance and Nominating Committee. The Governance and Nominating Committee (“Governance Committee”) oversees the corporate governance policies for the Company and identifies, screens, recruits and recommends to the board of directors candidates to serve as directors. The Governance Committee makes recommendations concerning the size and composition of the board of directors, considers any corporate governance issues that arise and develops appropriate recommendations, develops specific criteria for director independence, and assesses the effectiveness of the board of directors. The board of directors adopted a charter for the Governance Committee, which is available on the Company’s website at https://investors.texascapitalbank.com/governance-responsibility/governance-documents/default.aspx.
The Governance Committee considers industry knowledge and other business expertise, personal traits such as character, integrity and wisdom, and the candidate’s understanding of business operations, marketing, finance or other aspects relevant to the success of a large publicly traded corporation in today’s business environment, among other factors, when evaluating candidates for the Company’s board of directors.
The Governance Committee considers diversity when identifying nominees for director, looking primarily for diversity in professional experiences and skills, but also considering other dimensions of diversity, including gender identity and cultural background. Director searches in recent years have specified that candidates should provide diversity to the Board in addition to specific experience and skill sets being sought; the individuals considered by the Governance Committee in these searches have included diverse candidates, and it is expected that future director searches will continue this practice. Two of the three most recent additions to the board of directors enhanced its gender and racial diversity. These considerations ensure the board of directors is comprised of individuals who are able to contribute a variety of viewpoints, which the Governance Committee believes is an important component in ensuring that the Board exercises good judgment and diligence.
The Governance Committee regularly assesses the size of the board of directors, whether any vacancies are expected due to retirement or otherwise, and the need for particular expertise on the board of directors. Candidates may come to the attention of the Governance Committee from current directors, stockholders, professional search firms, officers or other persons. The Governance Committee reviews all candidates in the same manner regardless of the source of the recommendation.
•Compensation and Human ResourcesCapital Committee. The Compensation and Human ResourcesCapital Committee (“HRCompensation Committee”) advises management and makes recommendations to the board of directors with respect to the compensation and other employment benefits of the named executive officers and key employees of the Company. The HRCompensation Committee also administersoversees the
TCBI 2022|Notice of Annual Meeting and Proxy Statement 34
| Governance | ||||||||||
under SEC rules, including SEC Rule 16b-3. For more information regarding the HRCompensation Committee’s processes and procedures for the consideration and determination of executive compensation, see the “Compensation Discussion and Analysis” later in this Proxy Statement.
•Risk Committee. The Risk Committee oversees the Company’s policies and processes related to risk identification, assessment, monitoring and management, including the establishment of a comprehensive risk framework for the Company and setting and monitoring the risk appetite of the Company as described in more detail above at "“Risk Oversight"”. The Risk Committee’s Charter is available on the Company’s website at https://investors.texascapitalbank.com/govdocs. The Risk Committee members are Charles S. Hyle (chair), Jonathan E. Baliff, Larry L. Helm and Robert W. Stallings. The Risk Committee met four times during 2019.governance-responsibility/governance-documents/default.aspx.
Communications with the Board
Stockholders may communicate with the board of directors, including the non-management directors, by sending an e-mail to bod@texascapitalbank.com or by sending a letter to the board of directors, c/o Corporate Secretary, 2000 McKinney Avenue, 7th Floor, Dallas, Texas 75201. The Corporate Secretary has the authority to disregard any inappropriate communications or to take other appropriate actions with respect to any such inappropriate communications. If deemed an appropriate communication, the Corporate Secretary will submit stockholder correspondence to the chairman of the board or to any specific director to whom the correspondence is directed.
Code of Business Conduct and Ethics
The Company has adopted a Code of Business Conduct and Ethics ("(“Code of Conduct"Conduct”) that applies to all of its employees, including its CEO, CFO, and Chief Accounting Officer. The Company has made the Code of Conduct is available on itsthe Company's website at https://investors.texascapitalbank.com/govdocs.governance-responsibility/governance-documents/default.aspx. Any amendments to, or waivers from, our Code of Conduct applicable to our executive officers will be posted on our website within four days of such amendment or waiver.
Director Compensation
Director Compensation Process
Our director compensation program is intended to enhance our ability to attract, retain and motivate non-employee directors of exceptional ability and to promote the common interest of directors and stockholders in enhancing the value of our common stock. Our Board reviews director compensation at least annually based on recommendations by the Compensation Committee (in consultation with the Governance Committee). The Compensation Committee has the authority to engage a consulting firm to evaluate director compensation and since 2018 has engaged Pearl Meyer to assist in setting director compensation. The Compensation Committee reviews director compensation taking into account multiple factors, including pay practices at publicly traded companies, continued expansion of director, committee chair and lead director responsibilities, and the growing time commitment. The Committees and the Board base their determinations on director compensation on recommendations from Pearl Meyer and on market practices and reviewing trends at other S&P 500 companies and our compensation comparator companies (outlined below). The Compensation Committee is looking at the structure of Board compensation to more align with industry and peer groups.
2021 Director Compensation
For service on our board of directors in 2021, our non-employee directors were paid an annual retainer of $55,000 and a fee of $1,750 per meeting. Our non-executive, independent Chair received pro-rata shares of an additional $80,000 per year for the periods during which he served in that role. In addition, each member of a committee was paid a fee of $1,750 per committee meeting attended. Directors serving as chair of the Audit Committee and Risk Committee received an additional $30,000 per year for serving in those roles and the directors chairing the Compensation Committee and Governance Committee received an additional
TCBI 2022|Notice of Annual Meeting and Proxy Statement 35
| Governance | ||||||||||
$20,000 per year for serving in those roles. Members attending special meetings of the board and committees were paid $1,750 per meeting. In addition to cash retainer fees, each non-employee director received an annual grant of RSUs with an aggregate grant date fair value of approximately $65,000 at the April board meeting, which vest in full one year from the grant date on April 20, 2022. New non-employee directors receive a grant of RSUs with an aggregate grant date fair value of approximately $65,000 upon their appointment, which vest in full on the first anniversary of the grant date.
The following table contains information pertaining to the compensation of the Company’s board of directors for the 2021 fiscal year. Amounts below also include fees paid for service on subsidiary board committees.
2021 Director Compensation Table*
| Name | Fees Earned or Paid in Cash (A) | Stock Awards (B) | Total | ||||||||
| Paola M. Arbour | $ | 15,500 | $ | 65,040 | $ | 80,540 | |||||
| Jonathan E. Baliff | 81,250 | 65,041 | 146,291 | ||||||||
| James H. Browning | 187,417 | 65,041 | 252,458 | ||||||||
| Larry L. Helm (C) | 54,833 | 750,056 | 804,889 | ||||||||
| David S Huntley | 86,500 | 65,041 | 151,541 | ||||||||
| Charles S. Hyle | 114,750 | 65,041 | 179,791 | ||||||||
| Elysia Holt Ragusa | 127,250 | 65,041 | 192,291 | ||||||||
| Steven P. Rosenberg | 98,000 | 65,041 | 163,041 | ||||||||
| Robert W. Stallings | 109,000 | 65,041 | 174,041 | ||||||||
| Dale W. Tremblay | 103,000 | 65,041 | 168,041 | ||||||||
*Columns for which no amounts are reported have been deleted.
(B)Amounts represent the aggregate grant date fair value of RSUs, determined in accordance with Accounting Standard Codification (ASC) Topic 718. On April 20, 2021, Mr. Helm and all other currently serving directors received 11,705 and 1,015 RSUs, respectively, with a grant date fair value of $64.08 per share which will vest in full on April 20, 2022. On July 20, 2021, Ms. Arbour received 1,077 RSUs with a grant date fair value of $60.39 per share which will vest in full on July 20, 2022.
(C)Mr. Helm acted as our interim CEO from May 2020 until January 2021. In addition to his normal compensation as a director, he received a base salary and an award of time-based RSUs for acting as interim CEO. The RSUs are included in the table above, together with his other compensation as a director. His base salary is included in the “2021 Summary Compensation Table” below.
Director Stock Ownership Guidelines
The board of directors established stock ownership guidelines for directors to further align their interests with the long-term interests of stockholders. Directors are expected to own common stock having a value of at least four times the cash portion of the annual retainer paid to outside directors, and may not dispose of any shares of the Company’s common stock unless they own, and will continue to own, common stock with a value at or above that level. As of the computation date, December 31, 2021, all of our then current independent directors had attained the minimum stock ownership levels based on holdings, except for Ms. Arbour, who joined the Board in 2021.
TCBI 2022|Notice of Annual Meeting and Proxy Statement 36
| Stock Ownership Information | ||||||||||
STOCK OWNERSHIP OF CERTAIN BENEFICIAL OWNERS AND MANAGEMENTINFORMATION
Principal Stockholders and Beneficial Owners
The following tables set forth information as of August 28, 2020February 23, 2022, concerning the beneficial ownership of the Company’s common stock by: (a) each person the Company knows to beneficially own more than 5% of the issued and outstanding shares of a class of common stock,stock; (b) each director, director nominee, and NEO,NEO; and (c) all of the Company’s executive officers and directors as a group. The persons named in the table have sole voting and investment power with respect to all shares they owned, unless otherwise noted. In computing the number of shares beneficially owned by a person and the percentage of ownership held by that person, shares of common stock subject to options, restricted stock units ("RSUs"(“RSUs”) or stock appreciation rights ("SARs"(“SARs”) held by that person that are currently exercisable or will become exercisable or vest within 60 days of August 28, 2020February 23, 2022 are deemed exercised and outstanding.
| Persons Known to Company Who Own More Than 5% of Outstanding Shares of Company Common Stock | Number of Shares of Common Stock Beneficially Owned | Percent of Shares of Common Stock Outstanding* | |||||||||
| BlackRock, Inc. and certain affiliates | 5,658,482 | (1) | 11.16% | ||||||||
| The Vanguard Group and certain affiliates | 4,905,751 | (2) | 9.68% | ||||||||
| State Street Corporation and certain affiliates | 3,109,576 | (3) | 6.13% | ||||||||
| AllianceBernstein L.P. and certain affiliates | 2,674,935 | (4) | 5.28% | ||||||||
* Percentage is calculated on the basis of 50,690,920 shares, the total number of shares of common stock outstanding on February 23, 2022.
(1) As reported by BlackRock, Inc. on a Schedule 13G/A filed with the SEC on January 27, 2022, as of December 31, 2021, reporting sole voting power with respect to 5,562,027 shares and sole dispositive power with respect to 5,658,482 shares. Its address is 55 East 52nd St., New York, NY 10055.
(2) As reported by The Vanguard Group on a Form 13G//A filed with the SEC on February 10, 2022, as of December 31, 2021, reporting shared voting power with respect to 64,631 shares, sole dispositive power with respect to 4,796,560 shares and shared dispositive power with respect to 109,191 shares. Its address is 100 Vanguard Blvd., Malvern, PA 19355.
(3) As reported by State Street Corporation on a Form 13G/A filed with the SEC on February 14, 2022 as of December 31, 2021, reporting shared voting power with respect to 3,000,224 shares and shared dispositive power with respect to 3,109,576 shares. Its address is 1 Lincoln Street, Boston, MA 02111.
(4) As reported by AllianceBernstein L.P on a Form 13G filed with the SEC on February 14, 2022 as of December 31, 2021, reporting sole voting power with respect to 2,307,025 shares, sole dispositive power with respect to 2,623,063 shares and shared dispositive power with respect to 51,872 shares. Its address is1345 Avenue of the Americas, New York, NY 10105.
| Name (1) | Number of Shares of Common Stock Beneficially Owned | Percent of Shares of Common Stock Outstanding** | |||||||||
| Anna M. Alvarado | — | * | |||||||||
| Julie L. Anderson | 43,796 | * | |||||||||
| Paola M. Arbour | 251 | * | |||||||||
| Jonathan E. Baliff | 5,257 | (2) | * | ||||||||
| James H. Browning | 16,966 | (3) | * | ||||||||
| Larry L. Helm | 70,781 | (4) | * | ||||||||
| Rob C. Holmes | 8,308 | * | |||||||||
| David S. Huntley | 6,460 | (5) | * | ||||||||
| Charles S. Hyle | 10,012 | (6) | * | ||||||||
| Elysia Holt Ragusa | 10,787 | (7) | * | ||||||||
| Steven P. Rosenberg | 36,372 | (8) | * | ||||||||
| Robert W. Stallings | 101,085 | (9) | * | ||||||||
| Tim J. Storms | 4,173 | * | |||||||||
| Dale W. Tremblay | 11,987 | (10) | * | ||||||||
| All current executive officers and directors as a group (14 persons) | 283,501 | 0.56% | |||||||||
* Less than 1% of the issued and outstanding shares of the class.
TCBI 2022|Notice of Annual Meeting and Proxy Statement 37
Persons Known to Company Who Own More Than 5% of Outstanding Shares of Company Common Stock | Number of Shares of Common Stock Beneficially Owned | Percent of Shares of Common Stock Outstanding* | |
| BlackRock, Inc. and certain affiliates | 5,833,155 | (1) | 11.56% |
| The Vanguard Group and certain affiliates | 4,876,485 | (2) | 9.67% |
| Stock Ownership Information | ||||||||||
** Percentage is calculated on the basis of 50,690,920 shares, the total number of shares of common stock outstanding on February 23, 2022.
(1) Unless otherwise stated, the address for each person in this table is 2000 McKinney Avenue, 7th Floor, Dallas, Texas 75201.
(2) Includes 4,242 shares held by Mr. Baliff, as well as 1,015 RSUs that will vest within 60 days.
(3) Includes 15,951 shares held by Mr. Browning, as well as 1,015 RSUs that will vest within 60 days.
(4) Includes 59,076 shares held by Mr. Helm, as well as 11,705 RSUs that will vest within 60 days.
(5) Includes 5,445 shares held by Mr. Huntley, as well as 1,015 RSUs that will vest within 60 days.
(6) Includes 8,997 shares held by Mr. Hyle, as well as 1,015 RSUs that will vest within 60 days.
(7) Includes 9,772 shares held by Ms. Ragusa, as well as 1,015 RSUs that will vest within 60 days.
(8) Includes 2,242 shares held by Mr. Rosenberg, as well as 1,015 RSUs that will vest within 60 days. Also includes 33,115 shares held by EAD Investments, Ltd. Mr. Rosenberg and his spouse are the beneficiaries of the two trusts that have equal ownership of EAD Investments, Ltd.
(9) Includes 34,418 shares held by Mr. Stallings, as well as 1,015 RSUs that will vest within 60 days. Also includes 65,652 shares held by SCG Ventures, LP. Mr. Stallings and his spouse are the owners of Stallings Management LLC that is a general partner of SCG Ventures, LP.
(10) Includes 10,972 shares held by Mr. Tremblay, as well as 1,015 RSUs that will vest within 60 days.
Delinquent Section 16(a) Reports
Section 16(a) of the Exchange Act requires the Company's directors and executive officers, as well as persons who beneficially own more than 10% of a registered class of its equity securities, to file initial reports of beneficial ownership and reports of changes in beneficial ownership with the SEC. The Company, based solely on a review of its Section 16(a) reports filed during 2021, believes that the required Section 16(a) reports were filed on a timely basis by its directors and executive officers, except that a Form 3 reflecting initial beneficial ownership as of January 25, 2021 and a Form 4 reflecting the grant of 233,755 RSU's on February 1, 2021 were both filed for Rob C. Holmes on February 8, 2021.
TCBI 2022|Notice of Annual Meeting and Proxy Statement 38
| Audit Matters | ||||||||||
AUDIT MATTERS
Audit Committee Report
The Audit Committee’s general role is to assist the board of directors in overseeing the Company’s financial reporting process and related matters. The Audit Committee reviewedand discussed with the Company’s management and the Company’sindependent registered public accounting firm the audited financial statements of the Company for the year ended December 31, 2021.
The Audit Committee discussed with the Company’s independent registered public accounting firm the matters required to be discussed pursuant to the Public Company Accounting Oversight Board Auditing Standard, Communications with Audit Committees, and as required by the SEC. The Audit Committee received and reviewed the written disclosures and the letter from the Company’s independent registered public accounting firm under applicable requirements of the Public Company Accounting Oversight Board regarding communication with audit committees concerning independence, and discussed with the independent registered public accounting firm the firm’s independence. The Audit Committee also considered whether the provision of non-audit services to the Company by Ernst & Young LLP is compatible with maintaining their independence, and has determined that such independence has been maintained.
Based on the review and discussion referred to above, the Audit Committee recommended to the board of directors that the audited financial statements be included in the Company’s Annual Report on Form 10-K for the fiscal year ended December 31, 2021, to be filed with the SEC on February 9, 2022.
This report is submitted on behalf of the Audit Committee of the board of directors of Texas Capital Bancshares, Inc.
| David S. Huntley | ||||||||
| Charles S. Hyle | ||||||||
Auditor Fees and Services
The Audit Committee has appointed Ernst & Young LLP to continue as our independent registered public accounting firm for the 2022 fiscal year. Fees for professional services provided by the Company’s independent registered public accounting firm in each of the last two fiscal years, in each of the following categories, were:
| (in thousands) | 2021 | 2020 | ||||||
| Audit fees | $ | 2,366 | $ | 2,372 | ||||
| Tax fees | 458 | 398 | ||||||
| Total | $ | 2,824 | $ | 2,770 | ||||
Fees for audit services include fees associated with the audit of the Company’s annual consolidated financial statements and internal controls over financial reporting, the review of periodic reports and other documents filed with the SEC, including the consolidated financial statements included in the Company’s Form 10-Qs, comfort letters, accounting consultations billed as audit services and services that are normally provided in connection with statutory or regulatory filings or engagements. Tax fees included various federal, state and local tax compliance services, as well as tax consultations.
Pre-approval Policies and Procedures
The Audit Committee adopted a policy that requires advance approval of all audit, audit-related and tax services performed by the independent registered public accounting firm. The policy provides for pre-approval by the Audit Committee of specifically defined audit and non-audit services. Unless the specific service has been previously pre-approved with respect to that year, the Audit Committee must approve the permitted service before the independent registered public accounting firm is engaged to perform it. The Audit
TCBI 2022|Notice of Annual Meeting and Proxy Statement 39
| Name (1) | Number of Shares of Common Stock Beneficially Owned | Percent of Shares of Common Stock Outstanding | |
| Vince A. Ackerson | 31,071 | (2) | * |
| Julie L. Anderson | 32,777 | * | |
| Jonathan E. Baliff | 2,976 | * | |
| James H. Browning | 12,709 | * | |
| C. Keith Cargill | 94,159 | * | |
| Larry L. Helm | 51,834 | * | |
| David S. Huntley | 2,332 | (3) | * |
| Charles S. Hyle | 5,255 | * | |
| Elysia Holt Ragusa | 7,530 | * | |
| Steven P. Rosenberg | 33,115 | * | |
| Robert W. Stallings | 9,730 | * | |
| Dale W. Tremblay | 8,730 | * | |
| John G. Turpen | 3,864 | (4) | * |
| Ian J. Turpin | 25,227 | (5) | * |
| Patricia A. Watson | 5,282 | * | |
| All executive officers and directors as a group | 326,591 | 0.65% | |
| Audit Matters | ||||||||||
Committee delegated to the chairman of the Audit Committee authority to approve permitted services provided that the chairman reports any decisions to the Audit Committee at its next scheduled meeting.
PROPOSAL TWO – Ratification of the Appointment of Ernst & Young LLP as the Company’s Independent Registered Public Accounting Firm
The Audit Committee of the Company’s board of directors appointed Ernst & Young LLP as the independent registered public accounting firm of the Company for the year ending December 31, 2022. The Company is seeking stockholder ratification of the appointment of Ernst & Young LLP for fiscal year 2022. Stockholder ratification of the appointment of the Company’s independent registered public accounting firm is not required by the Company’s bylaws, state law or otherwise. However, the board of directors is submitting the appointment of Ernst & Young LLP to the Company’s stockholders for ratification as a matter of good corporate governance. If the stockholders fail to ratify the appointment of Ernst & Young LLP, the Audit Committee will consider this information when determining whether to retain Ernst & Young LLP for future services. Representatives of Ernst & Young LLP are expected to be present at the Annual Meeting, will have the opportunity to make a statement if they desire to do so and are expected to be available to respond to appropriate questions from the Company’s stockholders. See the discussion at “Auditor Fees and Services” above for information regarding the services provided to the Company by Ernst & Young LLP.
Proposal Two requires the affirmative vote of the holders of a majority of the outstanding shares of common stock present, in person or represented by proxy, and entitled to vote on the proposal at the Annual Meeting.
The board of directors unanimously recommends that you vote “FOR” the ratification of the appointment of Ernst & Young LLP as the Company’s independent registered
public accounting firm for fiscal year 2022.
TCBI 2022|Notice of Annual Meeting and Proxy Statement 40
| |||||||||||
| Executive Compensation | |||||
EXECUTIVE COMPENSATION
| Table of Contents for Executive Compensation | |||||
PROPOSAL THREE -- ADVISORY APPROVAL OF THE COMPANY'S EXECUTIVE COMPENSATION | |||||
| COMPENSATION DISCUSSION AND ANALYSIS | |||||
| Executive Summary | |||||
| Executive Officers | |||||
| Named Executive Officers | |||||
| 2021 Say on Pay Vote and Stockholder Engagement | |||||
| Executive Compensation Supports Business Transformation | |||||
| Enhancements to Our Compensation Program | |||||
| 1 Company Performance | |||||
2 Performance Assessment and Compensation Determination Framework | |||||
| Committee Oversight | |||||
| Compensation Philosophy and Objectives | |||||
| Performance Assessment | |||||
| Role of Compensation Consultant | |||||
| Compensation Peer Group | |||||
3 Named Executive Officer 2021 Compensation | |||||
| 2021 Target Pay Mix | |||||
| 2021 Incentive Plan Performance Summary | |||||
| Individual Performance Summaries | |||||
| 4 Pay Practices | |||||
| Elements of Our Compensation Plan | |||||
| 2021 Performance-Based Equity Awards | |||||
| Additional Performance Awards Outstanding | |||||
| New Hire Sign-On Bonuses and Buy-Out Equity Awards | |||||
| 5 Risk Management and Accountability | |||||
| Risk Balancing Features | |||||
| Compensation Risk Assessment | |||||
| Recoupment of Incentive Compensation | |||||
| Compensation Governance Best Practices | |||||
| Board's Role in Human Capital Management and Talent Management | |||||
| Additional Information Concerning Executive Compensation | |||||
| COMPENSATION COMMITTEE REPORT | |||||
| COMPENSATION TABLES | |||||
COMPENSATION COMMITTEE INTERLOCKS AND INSIDER PARTICIPATION | |||||
| INDEBTEDNESS OF MANAGEMENT AND RELATED PARTY TRANSACTIONS | |||||
TCBI 2022|Notice of Annual Meeting and Proxy Statement 41
| Executive Compensation | ||||||||||
PROPOSAL THREE – Advisory Approval of the Company's Executive OfficersCompensation
We believe that our executive compensation programs effectively align the interests of our named executive officers, or NEOs, with those of our stockholders by creating a combination of incentive compensation arrangements, in both cash and equity-based programs, which are directly tied to performance and creation of stockholder value, coupled with a competitive level of base compensation. Our objective is that the NEOs should have a substantial portion of total compensation derived from performance-based incentives. At our 2021 Annual Meeting of Stockholders, we received the affirmative support of 96% of votes cast in favor of our 2020 executive compensation.
The Board values stockholders’ opinions, and, as in prior years, the Board intends to evaluate the results of the 2022 vote when making future decisions regarding compensation of the NEOs. We encourage you to carefully review the “Executive Compensation” section of this Proxy Statement and particularly the “Compensation Discussion and Analysis” for a detailed discussion of the Company’s executive compensation programs.
This annual advisory vote is not intended to address any specific item of compensation, but rather the overall compensation of our NEOs and the positions held by them as ofpolicies and practices with respect to their compensation described in this Proxy Statement. Your vote on Proposal Three is advisory and, therefore, not binding on the date of this proxy statement, are:
We are asking our stockholders to May 2020. He served as Presidentindicate their approval, on an advisory basis, for the 2021 compensation paid to our NEOs by voting FOR the following resolution:
RESOLVED, that the stockholders approve, on an advisory basis, the 2021 compensation of the Bank from October 2008 to May 2020 and as Chief Lending Officer of the Bank since its inception in December 1998 through July 2013. Mr. Cargill has more than 30 years of banking experience in the North Texas area.
Proposal Three requires the affirmative vote of the Companyholders of a majority of the outstanding shares of common stock present, in person or represented by proxy, and entitled to vote on May 25, 2020, and so did not serve asthe proposal at the Annual Meeting.
An advisory vote at the Company’s 2017 Annual Meeting of Stockholders confirmed that stockholders overwhelmingly favored an NEO in 2019.annual advisory vote on executive compensation. Consistent with this preference, the Board implemented an annual advisory vote on executive compensation until the next required vote on the frequency of stockholder votes on executive compensation, which is scheduled to occur at the 2023 Annual Meeting of Stockholders.
Compensation Discussion and Analysis
Human Capital Committee (the “Compensation Committee”). In view of the Company’s competitive performance and historical earnings levels and earnings growth, in earnings, the HRCompensation Committee believes that the Company’s executive compensation philosophy and practices have been successful in attracting and retaining talented, dedicated executive officers and providing them with competitive compensation levels that are properly aligned with shareholderstockholder interests.
TCBI 2022|Notice of Annual Meeting and Proxy Statement 42
| Executive Compensation | ||||||||||
Executive Summary
| Stockholders Should Approve our NEO Compensation | ||||||||||||||||||||
| 1 | Company Performance | 2 | Performance Evaluation Framework | |||||||||||||||||
•Focused on evaluation and improvement of all aspects of the Company and the Bank, including roll-out of new strategic plan •Financial results in 2021 compared favorably with 2020 in many respects, but remained impacted by the effect of the pandemic on economic and market conditions and were affected by our efforts to begin implementation of our new strategic plan •Net income for common stockholders and diluted earnings per share were $235 million and $4.60, respectively, each up over 300% from the prior year •Return on average common equity was 8.35%, up nearly 300% from the prior year •Total deposits and total assets were down 9% and 8%, respectively, by design, while total stockholders' equity was up 12% •Maintained strong capital and liquidity •New broker-dealer / investment banking subsidiary formed and licensed in 2021 to facilitate broader client service offerings •Build out of the senior management team, including new CEO and 8 Operating Committee members in 2021 (2 more in early 2022) •New cultural expectations introduced to emphasize the importance of diversity, equity and inclusion, doing what's right for the customer, and executing effectively For more information, see “Company Performance” below. | •Total incentive compensation awarded for 2021 directly tied to overall performance •Overall performance evaluated through robust performance management program, including assessment of Company performance (EPS and ROCE) and individual performance •Strategic performance assessment considered contributions towards (i) creating a foundation for sustainable growth, (ii) strengthening Company fundamentals, (iii) advancing talent management, and (iv) promoting Company efficiency and transparency For more information, see “Performance Assessment and Compensation Determination Framework” below. | |||||||||||||||||||
| 3 | NEO 2021 Compensation | |||||||||||||||||||
•NEO incentive compensation for 2021 relative to target also reflects individual performance on individual management strategic objectives •NEO short-term incentive plan is based on financial (60%) and strategic transformation (40%), ensuring strong pay-for-performance alignment •In assessing and determining NEO performance and compensation, the Compensation Committee evaluated Company performance and set payouts at an aggregate of 150% of target on both EPS and ROCE metrics, which resulted in above target payout for the 2021 performance year | •For 2021 performance, the Compensation Committee awarded Mr. Holmes total direct compensation of $6,623,000, composed of the following: ◦$937,500 in base salary; and ◦$5,686,000 in variable compensation, comprised of ▪$3,000,000 cash performance bonus ▪$2,686,500 (est.) long-term incentive compensation (approx. 1/2 in performance RSUs; 1/2 in time RSUs) •In addition, in January 2021, Mr. Holmes, as new CEO, received sign-on and make-whole awards consisting of a $2,500,000 cash bonus and $14,500,000 of time-vesting RSUs For more information, see “NEO 2021 Compensation” below. | |||||||||||||||||||
| 4 | Pay Practices | 5 | Risk Management and Accountability | |||||||||||||||||
•Tied incentive compensation directly to NEO's overall performance (e.g., Company and individual) •Awarded majority of incentive compensation in long-term equity (for 2021 awards, evenly split between performance-based RSUs and time-based RSUs) •Replaced cumulative EPS relative to the peer group (50% weighting) in 2020 PRSU with Relative TSR (40% weighting) in 2021 PRSU •Refined long-term incentive plan for 2022 to recognize long-term profitable growth For more information, see “Pay Practices” below. | •Risk balancing features discourage excessive risk-taking, such as awarding a majority of variable compensation in long-term equity, and imposing caps on incentive compensation payouts •Enhanced Recoupment and Forfeiture Policy adopted in 2022 strengthens our ability to recover and/or cancel cash incentive compensation and/or long-term equity awards under appropriate circumstances, including certain financial restatements For more information, see “Risk Management and Accountability” below. | |||||||||||||||||||
TCBI 2022|Notice of Annual Meeting and Proxy Statement 43
| Executive Compensation | ||||||||||
Executive Officers
Our currently serving executive officers, and the positions held by them as wellof the date of this proxy statement, are:
Rob C. Holmes,CEO and President of the Company and Texas Capital Bank. Mr. Holmes, age 57, has served as management’s performance. The HR CommitteeCEO and President of the Company and Texas Capital Bank and as a member of the board of directors believesince January 2021. He worked for JPMorgan Chase & Co. and its predecessor firms from 1989 until 2020, where he served as Global Head of Corporate Client Banking and Specialized Industries from 2011 until 2020. During that time, he had end-to-end responsibility for the Company’s financial performancebusiness, providing global treasury management services, credit, and our management’s overall performanceinvestment banking solutions to clients in 2019 were outstanding.North America, as well as select countries in Europe and Asia. Prior to serving as head of JPMorgan’s Corporate Client Banking and Specialized Industries, he was the co-head of JPMorgan’s North American Retail Industries Investment Banking practice and the head of Investment Banking for the southern region of the U.S. He also shared oversight of the Commercial Banking Credit Markets business, which provided Asset Based Lending and other credit solutions, and of Business Transformation efforts for large, multinational corporations. Mr. Holmes was a member of JPMorgan’s Commercial Banking Operating Committee and served on the Board of Managers of J.P. Morgan Securities LLC.
J. Matthew Scurlock, CFO of the Company and Texas Capital Bank. Mr. Scurlock, age 40, has served as the Company’s CFO since January 2022, and served as Executive Vice President, Corporate Treasurer from May 2019 through December 2021, where he was most recently responsible for managing the Corporate Finance, Investor Relations, Corporate Treasury, and Corporate Strategy initiatives. He was Director of Finance from July 2017 through April 2019, and Capital Analytics & Stress Testing Manager from August 2013 to June 2017. Prior to joining the Company, Mr. Scurlock worked for Deloitte & Touche LLP, where he provided strategic consulting to financial services clients. Prior thereto, he served as a Vice President in the Corporate Finance group for Zions Bancorporation, leading financial modeling and balance sheet management efforts.
Tim J. Storms, CRO of the Company and Texas Capital Bank. Mr. Storms, age 63, assumed the role of CRO of the Company and Texas Capital Bank on February 22, 2021. Mr. Storms worked at JPMorgan Chase & Co. and its predecessor firms from 1981 until his retirement in 2019, where he served as Chief Risk Officer of Commercial Banking’s Real Estate businesses from 2015 to 2019. Prior to that position he held several key executive positions including Chief Credit Officer of Commercial Banking and head of Risk Management for corporate clients and real estate across North America for Investment Banking. Mr. Storms was also a member of a number of committees, including the Risk Operating Committee of Investment Banking and Commercial Banking.
TCBI 2022|Notice of Annual Meeting and Proxy Statement 44
| Executive Compensation | ||||||||||
Named Executive Officers
Our Named Executive Officers (NEOs) for 2021 are:
| Named Executive Officer | Title | |||||||
Rob C. Holmes1 | Chief Executive Officer, President2 and Director | |||||||
| Larry L. Helm | Chair3 | |||||||
Julie L. Anderson4 | Chief Financial Officer (CFO)2 | |||||||
| Tim J. Storms | Executive Vice President and Chief Risk Officer2 | |||||||
| Anna M. Alvarado | Executive Vice President, Chief Legal Officer and Corporate Secretary2 | |||||||
1 Since January 25, 2021. 2 Also serves in the same capacity for Texas Capital Bank. 3 Included here because he also acted as interim CEO and President from May 2020 to January 25, 2021. Following his resignation as CEO in January 2021 he continued to be employed by the Company as executive chairman of the board of directors until May 2021, at which point he resumed his status as non-executive chairman of the board of directors. 4 Ms. Anderson ceased serving as CFO and an executive officer of the Company on December 31, 2021. | ||||||||
2021 Say on Pay Vote and Stockholder Engagement
At our 2021 Annual Meeting of Stockholders, we received the affirmative support of 96% of votes cast in favor of our 2020 executive compensation, as disclosed in the 2021 Proxy Statement. The Board and the Compensation Committee value the perspectives of our stockholders on executive compensation. In considering the results of this advisory vote, the Compensation Committee concluded that the compensation paid to our NEOs and the Company’s overall pay practices enjoy strong stockholder support.
Our Board and management team greatly value the opinions and feedback of our stockholders, which is why we have proactive, ongoing engagement with a focus onour stockholders throughout the performance of eachyear that includes executive which we believe impactscompensation. For more information concerning our overall long-term profitability.outreach efforts, see “Governance – Stockholder Engagement” above. Feedback from this year's investor meetings was positive with many investors expressing appreciation for the Company's strategy and new executive team. The objectives ofCompany continually evaluates enhancements to our executive compensation programs are:
| Feedback We Heard | Our Perspective and Response | |||||||
| Preference for more disclosure, including discretion used by the Compensation Committee and one-time payments | Additional disclosure included in this Proxy Statement. See “Performance Assessment”, “Individual Performance Summaries”, and “New Hire Sign-On Bonuses and Buy-Out Equity Awards” below | |||||||
| Consider inclusion of ESG metrics in compensation plan design | Including ESG metrics in our incentive compensation plans is currently being reviewed as part of the overall transformation of the firm and will be assessed for future compensation plan design | |||||||
| Preference against one-time payments made to executives | See “New Hire Sign-On Bonuses and Buy-Out Equity Awards” for an explanation and the rationale for one-time payments made this year | |||||||
| Preference for enhanced disclosure of the incentive compensation metrics applied and the rationale behind these decisions | It is our policy to disclose the actual performance hurdles for the short- and long-term performance metrics after the performance period has concluded. For more information about the rationale for our performance metrics, see “Performance Assessment and Compensation Determination Framework”. | |||||||
Future advisory votes on executive compensation and continued dialogue with stockholders will continue to serve as an additional tool to guide the board and the Compensation Committee in evaluating the alignment of the Company’s executive compensation program with the Company’s business strategy and performance objectives;
its stockholders.
TCBI 2022|Notice of Annual Meeting and Proxy Statement 45
| Executive Compensation | ||||||||||
The Compensation Committee made significant changes to our executive compensation program to reflect the transformation of Executivethe Company and its long-term strategic goals. The Compensation Committee views executive compensation as instrumental in our ability to drive stockholder value through plans and programs that reinforce shared success, serve to attract the talent needed to effectively develop and execute on our strategic priorities, align the interests of executives with those of stockholders over the short-, medium-, and long-term, and discourage imprudent risk-taking and hold individuals accountable, as appropriate.
Enhancements to Our Compensation Program
To foster and reinforce alignment between the interests of named executives and those of stockholders, the Compensation Committee made a number of enhancements to our executive compensation program, specifically:
| Changed Cash Incentive Compensation Plan Design | For 2022, reduced the number of compensation plans overall and provided a structure that is directly linked to Company performance including individual performance – all of which reinforces our philosophy of pay for performance | |||||||
| Changed Long-Term Incentive Compensation Plan Design | For 2021, increased weighting of EPS (from 50% to 60%) and substituted Relative TSR (at 40%) as second performance measure (replacing cumulative peer ranking) For 2022: Expanded performance-based RSUs deeper in the organization to reinforce the importance of performance Expanded the pool of participants eligible to receive long-term incentive compensation | |||||||
| Adopted Enhanced Recoupment and Forfeiture Policy | Beginning 2022, policy covers both cash and equity awards made in the prior 4 years to designated classes of employees, including our NEOs, requiring return, reimbursement and/or cancellation of awards in case of (1) a financial restatement due (a) to the gross negligence, intentional misconduct or fraud by a current or former employee, or (b) to a material financial reporting violation under the federal securities laws, or (2) the Company suffers extraordinary financial loss, reputational damage or similar adverse impact resulting from the acts or omissions made by the employee | |||||||
TCBI 2022|Notice of Annual Meeting and Proxy Statement 46
| Executive Compensation | ||||||||||
| 1 | Company Performance | |||||||
Notable results for 2021 include:
| Financial Performance | ||||||||||||||||||||
$235.2 Million Net Income1 up 316%2 | $4.60 Diluted EPS3 up 311%2 | 8.35% ROCE4 up 298%1 | ||||||||||||||||||
$3.2 Billion Stockholders' Equity up 12%2 | $28.1 Billion Total Deposits down 9%2 | $34.7 Billion Total Assets down 8%2 | ||||||||||||||||||
| Company Achievements | ||||||||||||||||||||
•Adopted and continue to implement updated strategic plan, including detailed reviews of each business line, the operating model, investment spend and overall strategy ◦Raised $625 million of capital – the largest in the Company's history – facilitating future growth and retirement of more-costly debt, allowing the Bank to exceed “well-capitalized” regulatory ratios and leaving the Company well positioned to execute on our new strategy ▪CET 15, Tier 1 capital, total capital and leverage ratios were 11.1%, 12.6%, 15.3% and 9.0%, respectively, at December 31, 2021 ◦Deliberate unwinding of business lines and technology not aligned to our core strategy allowed for significant self-funding of necessary investment, reduced variability in earnings and more efficient use of capital ◦Continued focus on credit quality, proactive resolution of legacy credit issues and successful efforts to effectively navigate the global pandemic resulted in considerable declines in criticized loans and a negative provision for credit losses of $30.0 million in 2021 ◦Received broker-dealer license, enabling the Bank's new subsidiary, Texas Capital Securities, to expand service offerings to clients, such as mergers and acquisitions advisory and capital markets solutions, including underwriting, private placements, and related activities ◦Enhanced the focus on technology for a better client and employee experience ◦Continued foundational work necessary to allow us to implement our new strategy •Built-out our senior management team with 8 new Operating Committee members, including new Chief Legal Officer, CHRO, Chief Risk Officer, Chief Information Officer, Heads of Investment Banking, Corporate Banking and Treasury Solutions and, beginning in 2022, new CFO and Chief Administrative Officer •Reorganized compensation plans for many employees to increase focus on total-company performance and with plan for LTI to be awarded deeper into the organization (with nearly all employees who are equity eligible to receive both performance-based and time-based equity awards) •Established ESG Council, consisting of executive leadership and senior management to begin navigating and more proactively advancing ESG-related efforts •Remained steadfast in our commitment to diversity, equity and inclusion through enhancement of recently-created Diversity, Equity and Inclusion Council, the hiring of a VP of Diversity, Equity and Inclusion and the formation of various employee resource groups •Continued support of employees and the community through philanthropic activities and community lending | ||||||||||||||||||||
1 Net income available to common stockholders. 2 Percentage change over the prior fiscal year. 3 Earnings per share. 4 Return on Common Equity, also reported as ROE. 5 CET1 ratio is Common Equity Tier 1 capital divided by risk-weighted assets. | ||||||||||||||||||||
TCBI 2022|Notice of Annual Meeting and Proxy Statement 47
| Executive Compensation | ||||||||||
| 2 | Performance Assessment and Compensation Determination Framework | |||||||
To make compensation decisions that drive sustained stockholder value, the Compensation Committee provides strong oversight and relies on a sound set of compensation principles, a disciplined performance assessment framework and an independent advisor, and is informed by market data.
Committee Oversight
The HRCompensation Committee of our board of directors oversees our executive compensation programs. Each member of the HRCompensation Committee is an "independent director"“independent director” as defined by the Nasdaq Stock Market Listing and SEC Rules. With approval byof the board,Board, the HRCompensation Committee has developed and applied a compensation philosophy that focuses on a combination of competitive base salary and incentive compensation, including cash and equity-based programs, which are directly tied to performance and creation of stockholder value.
The HRCompensation Committee meets throughout the year, including formal meetings, informal conferences and discussions with management and consultants. The HRCompensation Committee works with executive management, primarily our CEO, to assess the compensation approach and compensation levels for our executive officers and key employees other than the CEO. The HRCompensation Committee makes recommendations to the board of directors with respect to the overall executive compensation and employment benefits,programs, philosophy and objectives of the Company. The HRCompensation Committee establishes objectives for the Company’s CEO and sets the CEO’s compensation based, in part, on the evaluation of market data provided by its independent consultant. The HRCompensation Committee also reviews and recommends to the boardBoard the Company'sCompany’s annual and long-term incentive plans for executive officers and key employees.officers. Additional Compensation Committee oversight responsibilities are included in its Committee charter.
The HRCompensation Committee regularly reviews the Company’s compensation programs to ensure that compensation levels and incentive opportunities are competitive and reflect performance.performance, and do not incentivize risk. Factors considered in assessing the compensation of individual officers may include the Company’s overall performance, the officer’s experience, performance and contribution to the Company, the achievement of strategic goals, external equity and market value, internal equity, fairness and retention. There are no material differences in compensation policies and approach among the NEOs, as all relate primarily to performance and contribution in achieving consolidated results. In the case of the NEOs other than the CEO, the CEO makes recommendations to the HRCompensation Committee regarding salary increases, annual incentive amounts and total compensation levels.
Compensation Risk OversightPhilosophy and Objectives
We provide a compensation package for our NEOs that is primarily driven by the overall economic performance of the Company, together with a focus on the performance of each executive, which we believe impacts our overall long-term profitability. The HRobjectives of our executive compensation programs are:
•to attract and retain highly qualified executive officers by providing total compensation opportunities that are competitive with those provided in the industry and commensurate with the Company’s business strategy and performance objectives;
•to provide incentive and motivation for our executive officers to enhance stockholder value by linking their compensation to the value of our common stock;
•to provide an appropriate mix of fixed and variable pay components to establish a “pay-for-performance” oriented compensation program; and
•to provide competitive compensation opportunities and financial incentives without imposing excessive risk to the Company, and to ensure that appropriate standards related to asset quality, capital management and expense management are maintained.
TCBI 2022|Notice of Annual Meeting and Proxy Statement 48
| Executive Compensation | ||||||||||
The Compensation Committee regularly reviews alltargets total compensation planspaid to identify whether anythe Company’s executive officers to be aligned with the 50th percentile of the Company’s orpeer group and market. Some executive officers may be below the Bank’s compensatory policies or practices incent behavior that creates excessive or unnecessary risk to the Company. In 2018, the HR Committee conducted a risk assessment with the assistance of Pearl Meyer & Partners, LLC ("Pearl Meyer"), its independent compensation advisor. In 2019, the HR Committee reviewed the 2018 risk assessment in light of the current status of the Company and its compensation policies and practices. Based50th percentile, while some may be above, depending on the resultsfacts and circumstances of this review, the HR Committee determined that our compensation program does not create risks that are reasonably likely to have a material adverse effect on the Company.
The HRCompensation Committee believes that the direct ownership of substantial amounts of common stock combined with stock-settled incentives combine to strongly align the interests of the Company’s senior executive officers with the interests of stockholders. The Company’s NEO compensation arrangements place a large amount of each individual’s future compensation “at risk” relative to the performance of the Company’s common stock. Our NEOs’ significant investments in our common stock, as required by our executive stock ownership guidelines, also make our executives sensitive to declines in our stock price.
The HRCompensation Committee generally considers the returns realized by stockholders through increases or decreases in the price of the Company’s common stock in the course of establishing NEO equity incentive compensation performance targets and in determining annual incentive compensation and vesting of long-term performance-based incentives, but has determined that it would be inappropriate to base specific incentive compensation award amounts or vesting determinations on stockholder return measures such as total stockholder return. This is primarily based upon concern that the Company’s NEO compensation measures not incent excessive risk-taking behavior in times when market perceptions of matters outside of our executives’ control, such as future commodity price risk, interest rate changes, earnings multiples applied to financial services companies generally, tax law changes or the expectation of future easing of regulatory compliance costs, introduce significant volatility into our stock price.
Our long-term performance-based incentives are earned based on achievement of performance measures such as EPS
Performance Assessment
The cornerstone of Most Recent Advisory Stockholder Voteour compensation program is the performance assessment, which is guided by our robust
performance assessment framework, supported by a process overseen by our Compensation Committee, and directly drives the outcome of incentive compensation awarded.
Performance Assessment Process
The Compensation Committee directly oversees the performance management of our named executive officers and approves their compensation after considering overall performance against their annual objectives. The Compensation Committee reviews and approves the annual financial and non-financial performance objectives set by the CEO. These objectives are aligned with the Company’s strategic plan, risk appetite, and risk and control framework. The objectives then flow through to each named executive, who establishes aligned goals that are reviewed by the Compensation Committee.
For the Company performance component, the Compensation Committee evaluates Company results after the end of the performance year, taking into account financial outcomes, consistency with the strategic plan and our risk appetite, prior year performance, and execution of key initiatives and other qualitative factors, which for 2021 included our response to the COVID-19 pandemic. The CEO and the Compensation Committee assess Company performance as a starting point for determining compensation for named executive officers. Additional details on Executive Compensationthe Company performance determination for 2021 are discussed under “Company Performance” above.
For the individual performance and risk accountability (risk overlay) components, at the end of a performance period, the CEO evaluates the performance of the other named executive officers against their objectives. The performance evaluation of each named executive officer includes performance related to risk accountability, group financial performance, and overall management effectiveness. For Mr. Holmes, a formal
TCBI 2022|Notice of Annual Meeting and Proxy Statement 49
| Executive Compensation | ||||||||||
performance assessment framework, including quantitative and qualitative objectives, was used to assess his performance and determine his compensation for the 2021 performance year.
The Compensation Committee has historically established threshold goals as a factor to be evaluated along with other financial and nonfinancial performance considerations for the funding and payment of Stockholders, we receivedcash bonuses under the affirmative supportannual incentive compensation (bonus) plan, the Company’s annual incentive plan that covers a broad population of 98% of votes cast in favoremployees (including for 2021 our named executive officers).
Performance Assessment Framework
Our performance assessment framework evaluates the performance of our 2018named executives on the basis of the following categories:
Company Performance | • Reflects a range of financial and non-financial metrics • Financial metrics can include, among others, revenue, earnings per share, returns, profitability, deposits, and capital returned to stockholders | |||||||
Strategic Performance | • Reflects execution against strategic deliverables and initiatives (Strategic Priorities), tailored for the executive’s role • Individual performance includes advancing talent management, including leadership, investment in employees, succession planning, and enhancements to our culture • In determining the final payout on the Strategic Priorities, the Compensation Committee also considers other performance metrics, such as Credit Quality, Asset Quality, etc. | |||||||
Within the performance assessment framework, named executive officers have actionable and measurable objectives that are used by the CEO in connection with his recommendations to the Compensation Committee for its consideration and to assess and provide ongoing feedback on performance. The Compensation Committee used progress on diversity as a potential modifier of variable compensation, as disclosedwith failure to meet expectations resulting in a reduction, meeting expectations having no impact, and exceeding expectations resulting in an increase.
Compensation Determination Framework
The determination of actual annual incentive compensation for 2021 was determined by the Compensation Committee based on a holistic assessment of Company performance, individual performance, and risk accountability. Each named executive officer has a base salary and total incentive compensation target (comprised of annual cash bonus and long-term equity targets), which are established by the Compensation Committee after careful consideration of market data from our Market Peer Group, the value and importance of the role to the organization, key differentiating factors, and input from the Compensation Committee’s independent compensation consultant.
Based on the factors set forth above, including overall performance assessment, the Compensation Committee determined each named executive’s total incentive compensation for 2021. The annual cash bonus and long-term equity compensation amounts were determined by multiplying the percentage of target total incentive awarded, by annual cash bonus and long-term equity targets, respectively. Consistent with the compensation principles of paying for performance and promoting effective risk management, the Compensation Committee weights target incentive compensation opportunities – and thus incentive compensation awards – more heavily toward compensation that vests over time, pays out based on performance that creates long-term value, and is subject to forfeiture or recovery (as appropriate). See “Pay Practices” for further detail.
Ms. Alvarado joined the Company in the 2019second half of the year (on October 15, 2021) and had a guaranteed minimum amount provided for her first year only, under the terms of her offer letter. Pay determinations and summaries of the Compensation Committee's determination of Company performance, individual
TCBI 2022|Notice of Annual Meeting and Proxy Statement. The board and the HR Committee value the perspectives of our stockholders on executive compensation. In considering the results of this advisory vote, the HR Committee concluded that the compensation paid to our NEOs and the Company’s overall pay practices enjoy strong stockholder support.Statement 50
| Executive Compensation | ||||||||||
performance, and responding to any questions or issues they may raise. Future advisory votes onrisk accountability for each named executive compensation will continue to serve as an additional tool to guide the board and the HR Committeeare provided in evaluating the alignment of the Company’s executive compensation program with the interests of the Company and its stockholders.“Named Executive Officer 2021 Compensation” below.
Role of the Compensation Consultant
The HRCompensation Committee engaged Pearl Meyer as its independent executive compensation consulting firm for 20192021 to provide:
•expertise on compensation strategy and program design;
•information relating to the selection of the Company’s peer group and compensation practices employed by the peer group and overall market;
•advice regarding structuring and establishing executive compensation plans or arrangements that are aligned with the objectives of the Company and the interests of stockholders; and
•recommendations to the HRCompensation Committee concerning the existing executive compensation programs and changes to such programs.programs; and
Pearl Meyer provided its executive compensation consulting services under the direction of the HRCompensation Committee and did not provide any additional services to the Company. Our management provides input to the compensation consultant but does not direct or oversee its activities with respect to our executive compensation programs. In order not to impair the independence of the compensation consultant, or create the appearance of an impairment, the Committee follows a policy that the compensation consulting firm may not provide other services to the Company. The HRCompensation Committee has evaluated Pearl Meyer’s independence, including the factors relating to independence specified in Nasdaq Stock Market Listing Rules, and determined Pearl Meyer to be independent.
Compensation Peer Company Compensation DataGroup
The HRCompensation Committee works with the independent compensation consultant to collect and review competitive market compensation practices. As one point of reference, the HRCompensation Committee reviews compensation practices for a peer group of publicly traded banks and bank holding companies of comparable size. The peer group used in evaluating and setting 20192021 NEO compensation included the following:
| Associated Banc-Corp | PacWest Bancorp | ||||
| BankUnited, Inc. | Pinnacle Financial Partners, Inc. | ||||
| BOK Financial Corporation | Prosperity Bancshares Inc. | ||||
| Cullen/Frost Bankers, Inc. | Signature Bank | ||||
| First Midwest Bancorp, Inc. | SVB Financial Group | ||||
| F.N.B. Corporation | Western Alliance Bancorporation | ||||
| Wintrust Financial Corporation | |||||
TCBI 2022|Notice of Annual Meeting and Proxy Statement 51
| Executive Compensation | ||||||||||
| 3 | Named Executive Officer 2021 Compensation | |||||||
2021 Target Pay Mix
The following is the 2021 target pay mix for our CEO and the average of the other NEOs (exclusive of sign-on and make-whole awards):
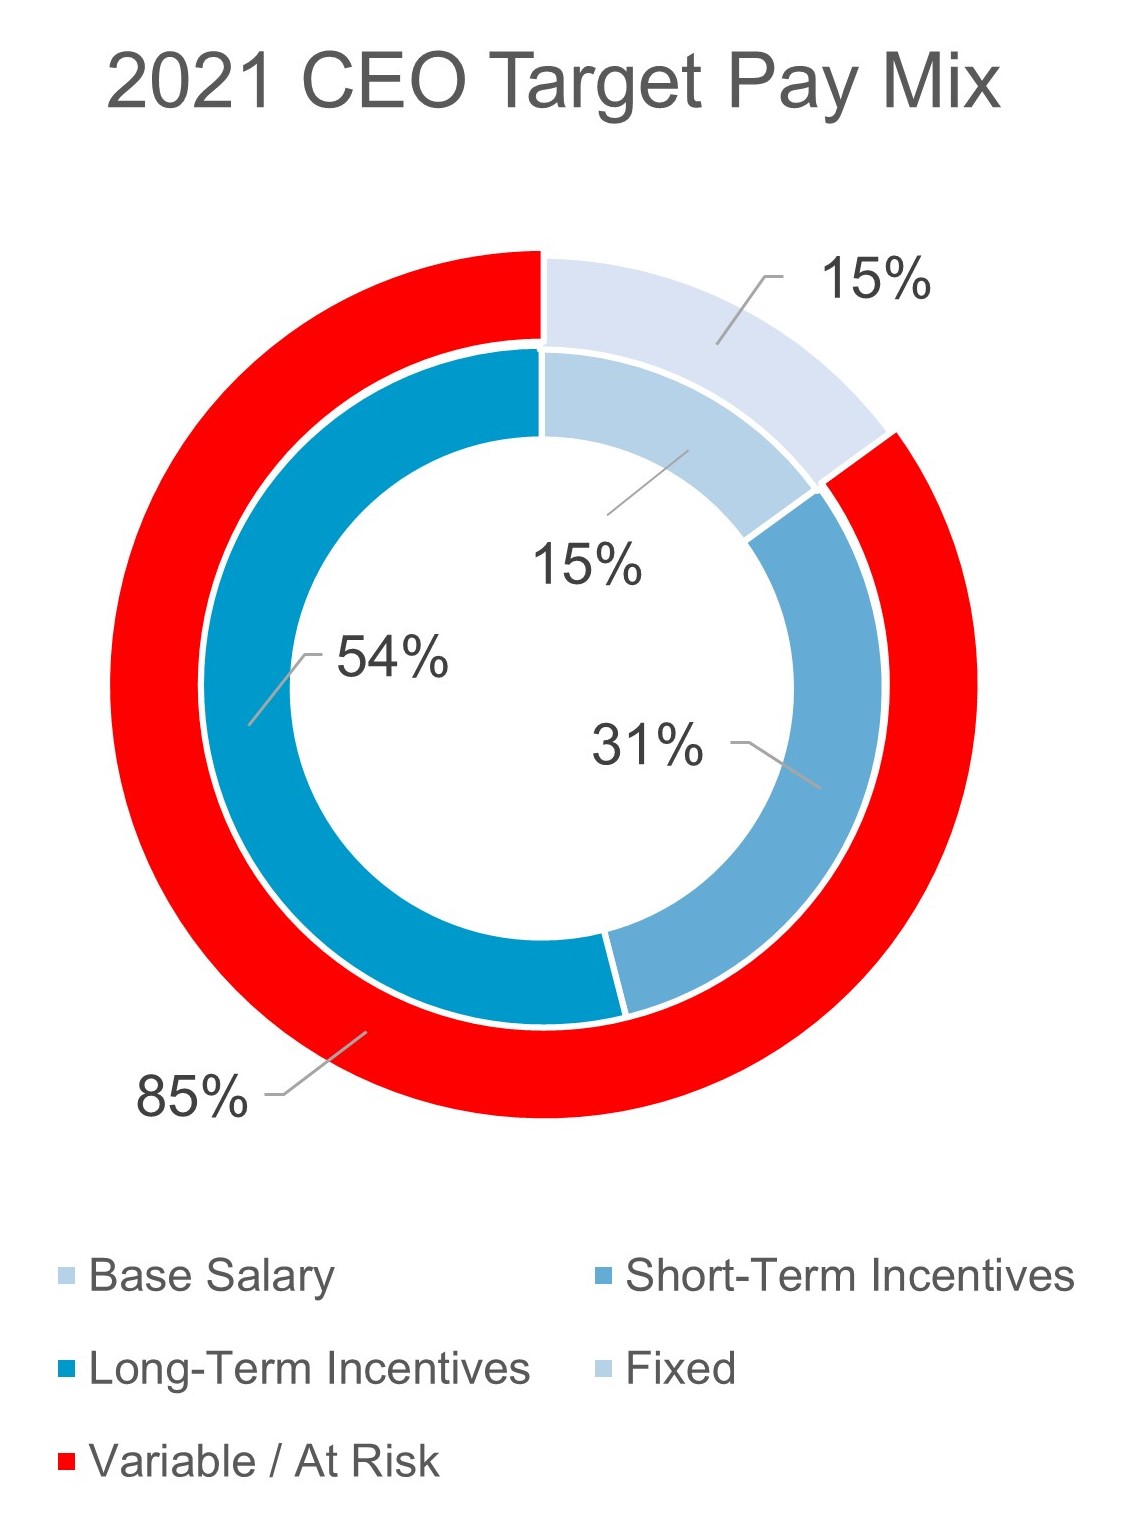
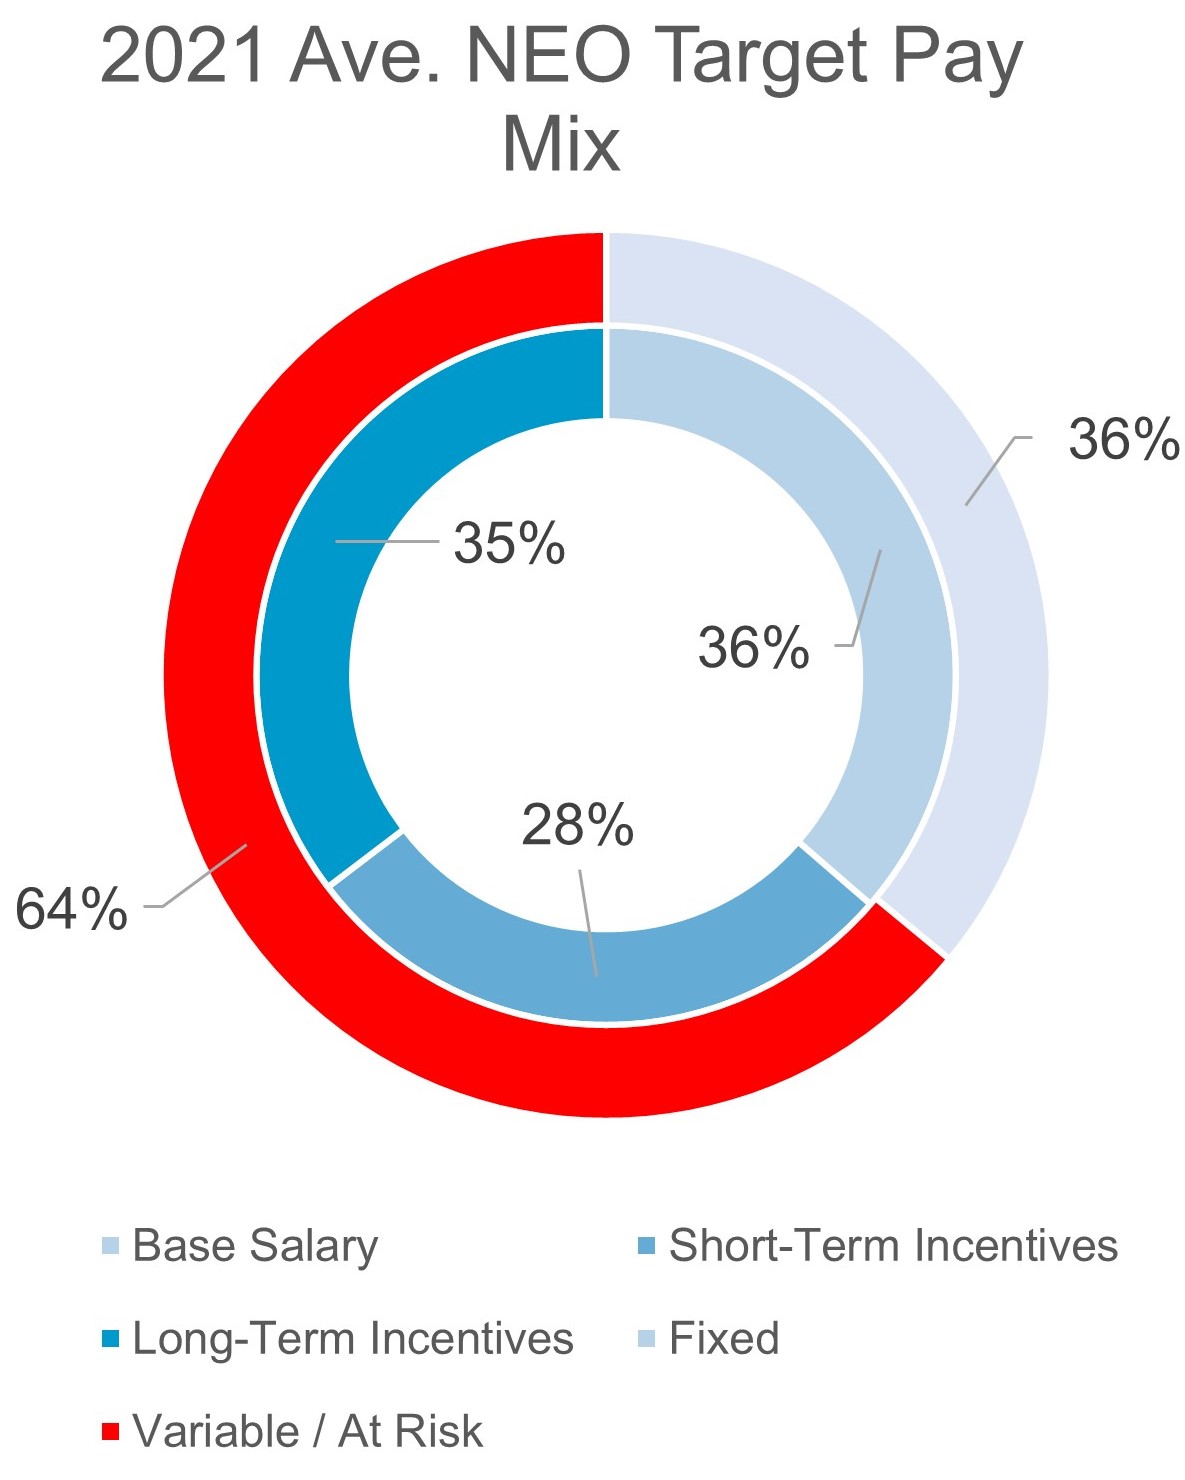
2021 Incentive Plan Performance Summary
The Compensation Committee assessed our Company's performance as a factor for determining incentive compensation award levels for the named executive officers may be belowofficers. For 2021, as discussed further above, the 50th percentile, while some may be above, dependingCompensation Committee assessed Company performance at 150% of target on the factsEPS metric, and circumstances150% of each executive including experience, timetarget on the ROCE metric, with target representing expected performance levels. The following table summarizes the metrics and weighting for the 2021 incentive compensation (bonus) plan.
| Measures | Weighting | Threshold (25% payout) | Target (100% payout) | Maximum (150% payout) | Actual | Achievement | ||||||||||||||
| Earnings Per Share | 40% | $2.75 | $3.25 | $4.00 | $4.60 | 150% | ||||||||||||||
| Return on Common Equity | 20% | 5.0% | 6.0% | 7.3% | 8.35% | 150% | ||||||||||||||
| Strategic Priorities: | See individual NEO performance information | See individual NEO performance information | ||||||||||||||||||
•Establish Foundation for Sustainable, High-Quality Growth | 10% | 50% of Goals Achieved | 85% of Goals Achieved | 100% of Goals Achieved | ||||||||||||||||
•Strengthen Fundamentals | 10% | |||||||||||||||||||
•Advance Talent Management | 10% | |||||||||||||||||||
•Promote Efficiency and Transparency | 10% | |||||||||||||||||||
TCBI 2022|Notice of Annual Meeting and Proxy Statement 52
| Executive Compensation | ||||||||||
Individual Performance Summaries
| Rob C. Holmes | Chief Executive Officer and President | ||||||||||||||||
| 2021 Performance | |||||||||||||||||
| Company Performance | •See “Company Performance” above for a detailed discussion of the Company's performance relative to the 2021 incentive plan metrics, which was assessed as above expectations and resulted in greater annual incentive compensation. | ||||||||||||||||
Individual Performance Achievement of Strategic Priorities: | In assessing individual performance for Mr. Holmes, the Compensation Committee considered, among other achievements, the following: •Oversaw capital-raising and de-risking transactions to stabilize balance sheet •Rolled out new strategic plan, de-emphasizing certain nonstrategic lines of business, adding or highlighting others, including adding broker/dealer/investment banking services, and identified and began implementing a series of actions to improve long-term financial performance •Built out the senior management team, including the addition of 8 new Operating Committee members in 2021, and emphasized a performance, accountability and execution-based culture •Increased focus on advancing diversity, equity and inclusion (DEI) •Oversaw formation of ESG council Based on the above assessment, Mr. Holmes achieved 100% of the Strategic Priorities which translates to a 150% payout. | ||||||||||||||||
| 2021 Compensation | |||||||||||||||||
| Pay Element | Objectives of Compensation Component | Amount | |||||||||||||||
| Base Salary | ▪Provides fixed compensation for executive to perform job functions | $937.5k | |||||||||||||||
| Sign-On Cash Bonus | ▪Assists in building out the senior management team and attracting and retaining top executive talent | $2.5m | |||||||||||||||
| Sign-On RSUs | ▪Provided as part of a new hire package to make newly hired executives whole from awards that have been forfeited | $14.5m | |||||||||||||||
Incentive Bonus | ▪Rewards key drivers of our annual operating and strategic plans ▪Provides tangible, achievable goals and reinforces key priorities of the organization | $3.0m | |||||||||||||||
| Annual Time RSUs | ▪Vesting period is consistent with market practice and assists with retention | $1.75m | |||||||||||||||
| Performance RSUs | ▪Focuses executives on achievement of our EPS goal, which is strongly tied to stockholder value creation ▪Provides tangible, achievable goal as senior leaders have the greatest ability to drive EPS ▪Vesting period is consistent with market | $936.5k1 | |||||||||||||||
1 For more information on the “grant date value” associated with the long-term equity awards in positionthe form of performance RSUs granted to Mr. Holmes, Ms. Anderson and performance.Mr. Storms in 2021 under SEC rules, see the “2021 Summary Compensation Table, the “2021 Grants of Plan Based Awards Table” and the footnotes thereto, below.
TCBI 2022|Notice of Annual Meeting and Proxy Statement 53
| Executive Compensation | ||||||||||
| Julie L. Anderson | Chief Financial Officer | ||||||||||||||||
| 2021 Performance | |||||||||||||||||
| Company Performance | •See “Company Performance” above for a detailed discussion of the Company's performance relative to the 2021 incentive plan metrics, which was assessed as above expectations and resulted in greater annual incentive compensation. | ||||||||||||||||
Individual Performance Achievement of Strategic Priorities: | In assessing individual performance for Ms. Anderson, the Compensation Committee considered, among other achievements, the following: •Executed largest two capital transactions in firm history •Hired new Chief Information Officer with financial services expertise and promoted internal candidate to run expanded Client Onboarding Service and Delivery role •Implemented business management office to facilitate operating routines •Oversaw development of financial strategic plan implemented in 2021 •Supervised wire platform upgrade to be completed in Q2-2022 Based on the above assessment, Ms. Anderson achieved 78% of the Strategic Priorities which translates to an 85% payout, with an aggregate 124% payout. | ||||||||||||||||
| 2021 Compensation | |||||||||||||||||
| Pay Element | Objectives of Compensation Component | Amount | |||||||||||||||
| Base Salary | ▪Provides fixed compensation for executive to perform job functions | $512.5k | |||||||||||||||
Incentive Bonus | ▪Rewards key drivers of our annual operating and strategic plans ▪Provides tangible, achievable goals and reinforces key priorities of the organization | $508.4k | |||||||||||||||
| Retention RSUs | ▪Provided to encourage CFO to assist in the on-boarding of new CEO and new CIO | $50k | |||||||||||||||
| Annual Time RSUs | ▪Vesting period is consistent with market practice and assists with retention | $294.7k | |||||||||||||||
| Performance RSUs | ▪Focuses executives on achievement of our EPS goal, which is strongly tied to stockholder value creation ▪Provides tangible, achievable goal as senior leaders have the greatest ability to drive EPS ▪Vesting period is consistent with market | $157.7k1 | |||||||||||||||
TCBI 2022|Notice of Annual Meeting and Proxy Statement 54
| Executive Compensation | ||||||||||
| Tim J. Storms | Chief Risk Officer | ||||||||||||||||
| 2021 Performance | |||||||||||||||||
| Company Performance | •See “Company Performance” above for a detailed discussion of the Company's performance relative to the 2021 incentive plan metrics, which was assessed as above expectations and resulted in greater annual incentive compensation. | ||||||||||||||||
Individual Performance Achievement of Strategic Priorities: | In assessing individual performance for Mr. Storms, the Board considered, among other achievements, the following: •Active role / contributor in Operating Committee, Balance Sheet Committee and development of Strategic Plan •Successfully drove Risk Appetite Statement process, oversaw Chief Credit Officer in completion of significant transactions and built-out Risk Organization •Improved credit quality Based on the above assessment, Mr. Storms achieved 100% of the Strategic Priorities which translates to a 150% payout. | ||||||||||||||||
| 2021 Compensation | |||||||||||||||||
| Pay Element | Objectives of Compensation Component | Amount | |||||||||||||||
| Base Salary | ▪Provides fixed compensation for executive to perform job functions | $423.8k | |||||||||||||||
| Sign-On Cash Bonus | ▪Assists in building out the senior management team and attracting and retaining top executive talent | $250k | |||||||||||||||
Incentive Bonus | ▪Rewards key drivers of our annual operating and strategic plans ▪Provides tangible, achievable goals and reinforces key priorities of the organization | $573.8k | |||||||||||||||
| Annual Time RSUs | ▪Vesting period is consistent with market practice and assists with retention | $270.1k | |||||||||||||||
| Performance RSUs | ▪Focuses executives on achievement of our EPS goal, which is strongly tied to stockholder value creation ▪Provides tangible, achievable goal as senior leaders have the greatest ability to drive EPS ▪Vesting period is consistent with market | $144.5k1 | |||||||||||||||
| Anna M. Alvarado | Chief Legal Officer and Secretary | |||||||||||||
2021 Performance Total annual incentive and equity compensation for Ms. Alvarado for 2021 was determined pursuant to her offer letter, which provides for a minimum incentive compensation (bonus) award level of $440,000 for her first year only, and a specified long-term equity award value in the form of time RSUs, to encourage Ms. Alvarado to join the Company. | ||||||||||||||
| 2021 Compensation | ||||||||||||||
Based on Ms. Alvarado's compensation arrangements, the Compensation Committee awarded her total direct compensation in 2021 of $1.86 million, which is composed of the following: •$120.9k in base salary, •$440k incentive compensation (bonus) award, and •$1.3 million in long-term equity | ||||||||||||||
TCBI 2022|Notice of Annual Meeting and Proxy Statement 55
| Executive Compensation | ||||||||||
| 4 | Pay Practices | |||||||
Elements of our Compensation Program
The following table sets forth a high-level summary of named executive officer direct pay elements and key design features for 2021 related compensation. Our variable compensation program foris composed of an annual incentive cash bonus and long-term equity, both of which are directly tied to Company and individual performance.
Compensation paid upon the vesting of performance-based restricted stock units is based on Company performance over a three-year performance period. For 2021, excluding make-whole new hire awards, Mr. Holmes and the other executive officers consistsreceived half of their long-term equity in the following elements:form of performance-based RSUs and the other half in time-based RSUs. The Compensation Committee believes a mix of performance-based and time-based awards is consistent with peer company compensation practices and appropriately balances driving long-term Company performance and retaining the senior leadership needed to advance the Company's transformation. The Compensation Committee will continue to evaluate the appropriate mix of long-term equity awarded to our senior leaders, including the CEO, and the performance metrics, for alignment with the Company's strategy priorities at the time.
| 2021 | Compensation Element | Description | Rationale | ||||||||
Short- Term | Base Salary | • Fixed component of pay targeted at the median of the market. | • Provides fixed compensation for executive to perform job functions. | ||||||||
| Annual Cash Incentive | • Delivered in cash annually. • Tied to achievement of financial and operational goals (EPS (40%), ROCE (20%), Strategic Priorities (40%)). • Executives can earn 0-150% of their target award based on achievement of pre-established targets. | • Rewards key drivers of our annual operating and strategic plans. • Provides tangible, achievable goals and reinforces key priorities of the organization. | |||||||||
Long- Term | Performance-Based Restricted Stock Units (50% of LTI) | • Vests at the end of the three-year period, if earned. • Executives can earn 0-200% of their target award based on achievement of pre-established targets: ◦EPS achieved over 3 consecutive one-year performance periods (60%) ◦Relative TSR to peer group achieved vs. target over a three-year performance period (40%) • No dividend equivalents are paid or accrued on these RSUs. | • Focuses executives on achievement of our EPS goal, which is strongly tied to stockholder value creation. • Provides tangible, achievable goal as senior leaders have the greatest ability to drive EPS. •Assures performance is aligned with stockholders and peers. • Vesting period is consistent with market practice and assists with retention. | ||||||||
Time-Based Restricted Stock Units (50% of LTI) | • Vests at the end of the three-year period, subject to continued employment on the vesting date. • No dividend equivalents are paid or accrued on these RSUs. | • Vesting period is consistent with market practice and assists with retention. • Time-based RSUs may also be provided as part of a new hire package, when appropriate to buy-out an executive's existing awards that would be forfeited. | |||||||||
NOTES: (1) All annual incentive compensation (bonus) and long-term equity awards are subject to recoupment and/or forfeiture under the terms of the Company's Recoupment and Forfeiture Policy. See “Recoupment of Incentive Compensation” below. (2) Long-term equity awards are subject to the Company's stock ownership guidelines and equity hold policy. See “Executive Stock Ownership Guidelines” below. | |||||||||||
TCBI 2022|Notice of Annual Meeting and Proxy Statement 56
| Executive Compensation | ||||||||||
Base Salary
Base salaries are designed to compensate executive officers for their roles and responsibilities and to provide competitive levels of fixed compensation that reflects their experience, duties and scope of responsibilities. We pay competitive base salaries in order to recruit and retain executives of the quality necessary to ensure the success of our Company. Base salaries for the NEOs are subject to annual review, but are not always adjusted on an annual basis. The HRCompensation Committee determines the appropriate level and timing of changes in base compensation for all of the NEOs, (otherand for NEOs other than the CEO)CEO, based on the recommendation of the CEO. In making determinations of salary levels for the NEOs, the HRCompensation Committee considers the entire compensation package for each NEO, including annual incentive compensation and equity-based compensation provided under our long-term compensation plan.
The HRCompensation Committee determines the level of periodic salary increases after reviewing:
•the qualifications, experience and performance of each executive officer;NEO;
•the compensation paid to persons having similar duties and responsibilities in our peer group companies; and
•the nature of the Bank’sCompany’s business, the complexity of its activities and the importance of the executive’s experience to the success of the business.
After considering these factors reviewing results of the Pearl Meyer 2018 Review and discussing proposed salaries for the other NEOs with the CEO, the HRCompensation Committee recommended, and the board approved, no change to annual salaries withfor the indicated percentage increases, effective March 1, 2019, as follows: Mr. Cargill $1,000,000 (4%), Ms. Anderson $500,000 (4%), Mr. Ackerson $540,500 (6%), and Mr. Turpen $455,000 (3%).then serving NEO's in February 2021.
Annual Incentive Compensation
We provide annual cash incentive opportunities to motivate and reward the NEOs for achievement of financial results as well as strategic and business objectives. A target bonus opportunity is set for each NEO as a percentage of base salary, with the percentage varying depending on their position. For 2019,2021, the annual incentive target amounts for the NEOs were as follows:
| Executive Officer | Target Incentive (% of Base Salary) | Target Incentive ($) | ||||||
| Rob C. Holmes | 200% | $2,000,000 | ||||||
| Julie L. Anderson | 80% | $410,000 | ||||||
| Tim J. Storms | 85% | $382,500 | ||||||
| Anna M. Alvarado | N/A | N/A | ||||||
| Executive Officer | Target Incentive (% of Base Salary) | Target Incentive ($) |
| C. Keith Cargill | 115% | $1,150,000 |
| Julie L. Anderson | 80% | $400,000 |
| Vince A. Ackerson | 85% | $459,425 |
| John G. Turpen | 75% | $341,250 |
Actual incentive amounts that could be earned by the NEOs for 20192021 were based on the level of achievement of performance goals relating to the following key metrics: net income (65%)EPS (40% weighting), credit quality (25%)ROCE (20% weighting), and MSOs (10%)Strategic Priorities (40% weighting).
In addition, in determining the amount of annual incentives earned, the HRCompensation Committee considers the performance of the Company relative to its peer group, and also considers the entire compensation package of each of the NEOs and the performance of that individual.individual and may make discretionary adjustments as are deemed necessary.
The HRCompensation Committee met in February 2020January 2022 to consider the Company’s performance against incentive goals and to determine the annual incentives to be paid to the NEOs. For 2019,2021, the following results were achieved and considered in determining NEO incentive compensation:
•ROCE of unanticipated declines in interest rates experienced in 2019 and was adjusted downward for gains related to the settlement of certain legal claims in 2019, both of8.35%, which were determined by the HR Committee not to be attributable to management’s performance.
TCBI 2022|Notice of Annual Meeting and Proxy Statement 57
| Executive Compensation | ||||||||||
•Achievement of individual MSOsStrategic Priorities were reviewed and determined by the HRBoard and the Compensation Committee to equal 100%a range of 85% - 150% of target for this metric for each NEO, resultingthe NEOs.
Resulting in an aggregate payout in a payoutrange of 10.0%124% - 150% of each NEO’s aggregate target amount. See “Individual Performance Summaries” above.
Based on the achievement of the financial, business and individual performance goals described above, the HRCompensation Committee awarded the following annual incentivesincentive (bonus) compensation to the NEOs for fiscal year 2019:2021:
| Executive Officer | Target Incentive ($) | Aggregate Incentive Earned (% of Target) | Incentive Earned ($) | ||||||||
| Rob C. Holmes | $2,000,000 | 150% | $3,000,000 | ||||||||
| Julie L. Anderson | $410,000 | 124% | $508,400 | ||||||||
| Tim J. Storms | $382,500 | 150% | $573,750 | ||||||||
| Anna M. Alvarado | N/A | N/A | $440,000 | ||||||||
| Executive Officer | Target Incentive ($) | Incentive Earned (% of Target) | Incentive Earned ($) |
| C. Keith Cargill | $1,150,000 | 132.5% | $1,523,750 |
| Julie L. Anderson | $400,000 | 132.5% | $530,000 |
| Vince A. Ackerson | $459,425 | 132.5% | $608,738 |
| John G. Turpen | $341,250 | 132.5% | $452,156 |
Long-term incentive awards for our NEOs include equity-based awards issued pursuant to our Amended and Restated 2015 Long-Term Incentive Plan (the "2015 Plan"“2015 Plan”) that are designed to directly align the interests of the NEOs with those of our stockholders and to motivate the NEOs to increase the value of the Company to stockholders over the long term.
When considering the 20192021 NEO equity awards, the HRCompensation Committee started with an intended target value for each NEO, which was based on a percentage of his or her base salary. For 2019, theThe target values for the 2021 NEO equity awards, to the NEOs, as a percentage of their respective base salaries, were as follow: Mr. Cargill, 230%;Holmes, 350%, Ms. Anderson, 115%; Mr. Ackerson, 120%; and Mr. Turpen, 100%Storms, 120%. The amounts of the grants were based on a variety of factors deemed relevant by the HRCompensation Committee, including the Company’s performance, the NEO’s level of responsibility, an assessment of individual performance made by the Committee, including discussion of the performance of the other NEOs with the CEO, and competitive market data. The number of time-based RSUs and the target number of performance-based RSUs (including the threshold and maximum number of performance-based RSUs that could be earned) granted to each NEO are set forth below in the “20192021 Grants of Plan-Based Awards Table”.
TCBI 2022|Notice of Annual Meeting and Proxy Statement 58
| Executive Compensation | ||||||||||
Mr. Helm declined to participate in the NEO’sCompany’s annual grant of NEO equity awards, and instead received a grant of time-based RSU’s in April 2021 with a grant date fair value of $750,000 that vest on the first anniversary of the grant date, as was determined by the Compensation Committee to be appropriate compensation for his service as interim CEO and President during the previous 11 months.
In addition to the 2021 NEO equity awards, Ms. Anderson received a supplemental grant of time-based RSUs in June 2021 with a grant date fair value totaling $50,000, that vest as to one-third of the shares on each of the first, second, and third anniversaries of the grant date, subject to the executive’s continued employment agreement) following a change in controlwith the Company.
Ms. Alvarado was not an employee of the Company regardlessat the time the 2021 NEO equity awards were granted, and instead received a grant of whethertime-based RSUs in November 2021, following the performance criteria have been achieved. If an NEO violates the provisionscommencement of any agreementher employment with the Company, with a grant date fair value totaling $1,300,000, that contains confidentiality, non-solicitation or other protective or restrictive covenant provisions, any unvestedvest as to one-fourth of the shares on each of the first, second, third and fourth anniversaries of the grant date, subject to Ms. Alvarado's continued employment with the Company. See “New Hire Sign-On Bonuses and Buy-Out Equity Awards” for more information.
All of the 2021 equity awards will cease to vest, any undelivered shares will be forfeited and any net shares deliveredare subject to the NEO with respectCompany's Recoupment and Forfeiture Policy, and the shares received upon vesting are subject to the awards must be immediately returned to the Company.Company' equity hold requirements for executives.
Additional Performance Awards Outstanding
2019 Grants of Performance-Based RSUs - Performance Results and Payouts
The Company made an annual grant of RSUs in March 2017.February 2019. The grants were structured in a manner consistent with the 20192021 grants described above, with awards consisting of 50% time-basedperformance-based RSUs and 50% performance-basedtime-based RSUs. The 20172019 performance-based RSUs could be earned in amounts ranging from 0% to 150% of the target award, based on the Company’s level of achievement of performance goals relating to EPS compound annualaverage growth rate ("CAGR") and average ROE over athe three-year performance period.
The following table sets forth the range of specific targets, relative weights and resulting payouts for the 20172019 performance-based RSUs for the three-year period ending December 31, 2019,2021, as established at the time the awards were granted:
Target EPS CAGR (25% weight) | Payout (as a % of weighted Target Award) | Target EPS CAGR Peer Rank (25% weight) | Payout (as a % of weighted Target Award) | Target Average ROE (25% weight) | Payout (as a % of weighted Target Award) | Target Average ROE Peer Rank (25% weight) | Payout (as a % of weighted Target Award) | |||||||||||||||||||||||||||||||||||
| 5% | 50% | Bottom quartile | 0% | 9.6% | 50% | Bottom quartile | 0% | |||||||||||||||||||||||||||||||||||
| Target EPS Average Growth (25% weight) | Target EPS Average Growth (25% weight) | Payout (as a % of weighted Target Award) | Target EPS Average Growth Peer Rank (25% weight) | Payout (as a % of weighted Target Award) | Target Average ROE (25% weight) | Payout (as a % of weighted Target Award) | Target Average ROE Peer Rank (25% weight) | Payout (as a % of weighted Target Award) | ||||||||||||||||||||||||||||||||||
| 10% | 75% | 25th to 39.9th% | 50% | 9.8% | 75% | 25th to 39.9th% | 50% | 10% | 50% | Bottom quartile | 0% | 10% | 50% | Bottom quartile | 0% | |||||||||||||||||||||||||||
| 12% | 12% | 75% | 25th to 39.9th% | 50% | 11% | 75% | 25th to 39.9th% | 50% | ||||||||||||||||||||||||||||||||||
| 15% | 100% | 40th to 59.9th% | 100% | 10.0% | 100% | 40th to 59.9th% | 100% | 15% | 100% | 40th to 59.9th% | 100% | 13% | 100% | 40th to 59.9th% | 100% | |||||||||||||||||||||||||||
| 18% | 125% | 60th to74.9th% | 125% | 10.2% | 125% | 60th to74.9th% | 125% | 18% | 125% | 60th to 74.9th% | 125% | 15% | 125% | 60th to 74.9th% | 125% | |||||||||||||||||||||||||||
| 20% | 150% | Top Quartile | 150% | 10.4% | 150% | Top Quartile | 150% | 20% | 150% | Top Quartile | 150% | 16% | 150% | Top Quartile | 150% | |||||||||||||||||||||||||||